Hume Coal Project and Berrima Rail Project
124
Hume Coal Project and Berrima Rail Project VOLUME 2C Response to Submissions Appendix 2 Prepared for Hume Coal Pty Limited June 2018
-
Upload
khangminh22 -
Category
Documents
-
view
0 -
download
0
Transcript of Hume Coal Project and Berrima Rail Project

Hume Coal Project andBerrima Rail Project
VOLUME 2C
Response to SubmissionsAppendix 2
Prepared for Hume Coal Pty LimitedJune 2018

www.humecoal.com.au
Hume Coal Project — Response to Submissions - VOLUME 2C
VOLUME 1 Main Report
VOLUME 2A Appendices 1 to 2Appendix 1 Register of submittersAppendix 2 Hume Coal Project Revised Water Assessment – Main report – Appendices A to C
VOLUME 2B Appendix 2Appendix 2 Hume Coal Project Revised Water Assessment – Appendix D – Part 1
VOLUME 2C Appendix 2Appendix 2 Hume Coal Project Revised Water Assessment – Appendix D – Part 2
VOLUME 2D Appendix 2Appendix 2 Hume Coal Project Revised Water Assessment – Appendices E to F
VOLUME 2E Appendix 2Appendix 2 Hume Coal Project Revised Water Assessment – Appendices G to M
VOLUME 3 Appendices 3 to 7Appendix 3 Aboriginal cultural heritage – additional informationAppendix 4 Biodiversity – additional informationAppendix 5 Hume Coal Project – Response to community concerns regarding impacts on tourism (Judith Stubbs & Associates 2017)Appendix 6 Hume Coal Project – Response to community concerns regarding impacts on land values (Judith Stubbs & Associates 2017)Appendix 7 Mine design additional information – 3D numerical modelling

www.emmconsulting.com.au
Hume Coal Project — Response to Submissions - VOLUME 2C
Hume Coal ProjectRevised Water Assessment– Appendix D – Part 2
Appendix 2

www.humecoal.com.au
Hume Coal Project — Response to Submissions - VOLUME 2C

APPENDIX CHUME COAL PROJECT EIS SURFACEWATER QUALITY ASSESSMENT

HUME COAL
Surface Water QualityAssessment
DECEMBER 2016

WSP | Parsons BrinckerhoffLevel 27, Ernst & Young Centre680 George StreetSydney NSW 2000GPO Box 5394Sydney NSW 2001
Tel: +61 2 9272 5100Fax: +61 2 9272 5101
www.wspgroup.comwww.pbworld.com
This document may contain confidential and legally privileged information, neither of which are intended to be waived, and mustbe used only for its intended purpose. Any unauthorised copying, dissemination or use in any form or by any means other thanby the addressee, is strictly prohibited. If you have received this document in error or by any means other than as authorisedaddressee, please notify us immediately and we will arrange for its return to us.
Project no: 2200540A-WAT-REP-004 RevE.docxDate: December 2016REV DATE DETAILS
E 19/12/2016 Final report
D 25/11/16 Final draft for submission
C 17/10/16 Final draft for EMM, HEC and Hume Coal review
B 04/10/16 Updated draft addressing HEC and EMM comments
A 22/09/16 First draft
AUTHOR, REVIEWER AND APPROVER DETAILS
Prepared by: L Rochford, K Neilson Date: 19/12/2016 Signature:
Reviewed by: Rob Leslie Date: 19/12/2016 Signature:
Approved by: Rob Leslie Date: 19/12/2016 Signature:
Surface Water QualityAssessmentHume Coal
i
Surface Water Quality AssessmentHume Coal
WSP | Parsons BrinckerhoffProject No 2200540A
TABLE OF CONTENTSGLOSSARY ..................................................................................................................V
ABBREVIATIONS ........................................................................................................VI
EXECUTIVE SUMMARY ............................................................................................VIII
1 INTRODUCTION ............................................................................................ 11.1 Project location .................................................................................................................. 11.2 Project description ............................................................................................................. 41.3 Study area .......................................................................................................................... 71.4 Environmental assessment requirements ........................................................................ 9
2 REGULATORY FRAMEWORK.................................................................... 142.1 Water Management Act 2000 ........................................................................................... 142.2 NSW State Rivers and Estuary Policy 1993 .................................................................... 14
2.3 State Environmental Planning Policy (Sydney Drinking WaterCatchment) 2011 .............................................................................................................. 16
2.4 Neutral or Beneficial Effect on Water Quality Assessment Guideline ........................... 162.5 Using MUSIC in Sydney’s Drinking Water Catchment .................................................... 162.6 National Water Quality Management Strategy ................................................................ 162.7 NSW Water Quality and River Flow Objectives ............................................................... 172.8 Healthy Rivers Commission Inquiry into the Hawkesbury-Nepean River ..................... 17
2.9 Australian and New Zealand Guidelines for Fresh and Marine WaterQuality .............................................................................................................................. 18
2.10 Australian Drinking Water Guidelines ............................................................................. 19
2.11 WaterNSW Principles for Managing Mining and Coal Seam Gas Impactsin Declared Catchment Areas .......................................................................................... 21
3 EXISTING ENVIRONMENT ......................................................................... 223.1 Catchment overview ........................................................................................................ 223.2 Climate data...................................................................................................................... 233.3 Streamflow ....................................................................................................................... 263.4 Baseline surface water quality ........................................................................................ 28
4 WATER-RELATED VALUES AND ASSETS ............................................... 404.1 Environmental values ...................................................................................................... 404.2 Surface water assets ........................................................................................................ 404.2.1 Storages used for town water supply .................................................................................. 414.2.2 Local water users ............................................................................................................... 43

ii
Surface Water Quality AssessmentHume Coal
WSP | Parsons BrinckerhoffProject No 2200540A
4.2.3 Instream and riparian ecosystems ...................................................................................... 44
5 IMPACT ASSESSMENT .............................................................................. 455.1 Project activities with potential to impact on surface water quality .............................. 455.1.1 Construction and rehabilitation ........................................................................................... 455.1.2 Operation ........................................................................................................................... 46
5.2 Impact assessment .......................................................................................................... 495.2.1 Assessment criteria ............................................................................................................ 495.2.2 Releases from stormwater basins to Oldbury Creek ........................................................... 495.2.3 Mine access roads ............................................................................................................. 595.2.4 Intercepted baseflow .......................................................................................................... 705.2.5 Cumulative impacts ............................................................................................................ 75
6 MITIGATION MEASURES AND MONITORING PROGRAM ....................... 766.1 Environmental management plans .................................................................................. 766.2 Construction and rehabilitation ....................................................................................... 766.2.1 Surface water management objective ................................................................................. 766.2.2 Soil and water management principles ............................................................................... 77
6.3 Operation .......................................................................................................................... 776.3.1 Mine water management system ........................................................................................ 776.3.2 SB03 and SB04 releases ................................................................................................... 786.3.3 Stormwater management measures ................................................................................... 78
6.4 Surface water quality monitoring program ..................................................................... 796.4.1 Monitoring locations ........................................................................................................... 796.4.2 Monitoring frequency .......................................................................................................... 796.4.3 Key parameters .................................................................................................................. 806.4.4 Water quality objectives...................................................................................................... 826.4.5 WQO exceedance response ............................................................................................... 84
7 CONCLUSIONS ........................................................................................... 85
8 REFERENCES ............................................................................................. 86
L I S T O F T A B L E STable 1.1 Surface water quality related SEARs .................................................................................. 9Table 1.2 Agency requirements ....................................................................................................... 10Table 1.3 Supplementary SEARs .................................................................................................... 13Table 2.1 HRC recommended WQOs for nutrients (µg/L) ................................................................ 18Table 2.2 ANZECC and ADWG water quality guidelines .................................................................. 19Table 3.1 Summary climate statistics for Hume Coal Project site — Data Drill (1889 to
2015) ............................................................................................................................... 23Table 3.2 Stream gauge locations ................................................................................................... 26Table 3.3 Surface water quality monitoring locations........................................................................ 28Table 3.4 Baseline surface water quality conditions in the project area ............................................ 31

iii
WSP | Parsons BrinckerhoffProject No 2200540A Surface Water Quality Assessment
Hume Coal
Table 4.1 Environmental values for surface water in the study area ................................................. 40Table 4.2 Numbers of diversion works and storages in the water management zones...................... 44Table 5.1 Construction and rehabilitation activities with potential to impact on water
quality .............................................................................................................................. 45Table 5.2 Project activities within the mine water management system ............................................ 47Table 5.3 Project activities outside mine water management system ............................................... 48Table 5.4 Operational land use within SB03 and SB04 catchments ...................................................... 50Table 5.5 Source node mean pollutant inputs into MUSIC for SB03 and SB04
assessment ..................................................................................................................... 55Table 5.6 Mean annual pollutant loads in Oldbury Creek due to runoff from SB01, SB02,
PWD, MWD08, SB03 and SB04 catchments .................................................................... 55Table 5.7 Comparison of surface water and leachate concentrations ............................................... 57Table 5.8 Target mean concentrations for other contaminants in releases from SB03
and SB04......................................................................................................................... 58Table 5.9 Source node mean pollutant inputs into MUSIC for mine access roads
assessment ..................................................................................................................... 60Table 5.10 Adopted swale parameters .............................................................................................. 61Table 5.11 Mean annual pollutant loads from access road catchments ................................................ 62Table 5.12 Required swale lengths for mine access roads to meet NorBE criteria ................................ 62Table 5.13 Comparison of groundwater and surface water quality ..................................................... 72Table 6.1 Preliminary discharge limits for SB03 and SB04 releases ................................................. 78Table 6.2 Parameters for surface water quality monitoring program ................................................. 80Table 6.3 Preliminary water quality objectives for Hume Coal Project .............................................. 82
L I S T O F F I G U R E SFigure 1.1 Project location .................................................................................................................. 2Figure 1.2 Project area ....................................................................................................................... 3Figure 1.3 Surface infrastructure layout .............................................................................................. 6Figure 1.4 Study area ......................................................................................................................... 8Figure 2.1 Surface water management zones ................................................................................... 15Figure 3.1 Climate data .................................................................................................................... 24Figure 3.2 Annual rainfall for Hume Coal Project site — Data Drill (1889 to 2015) ............................. 25Figure 3.3 Average daily evaporation data – Data Drill (1889 to 2015) .............................................. 25Figure 3.4 Stream gauge locations ................................................................................................... 27Figure 3.5 Surface water quality monitoring locations........................................................................ 29Figure 3.6 Baseline concentrations of total dissolved solids .............................................................. 35Figure 3.7 Baseline concentrations of total suspended solids ............................................................ 36Figure 3.8 Baseline concentrations of pH .......................................................................................... 37Figure 3.9 Baseline concentrations of Total Nitrogen ........................................................................ 38Figure 3.10 Baseline concentrations of Total Phosphorous ................................................................. 39Figure 4.1 Surface water users ......................................................................................................... 42Figure 4.2 Surface water diversion works and storages in the study area by purpose
(LPI 2016 ......................................................................................................................... 43
iv
Surface Water Quality AssessmentHume Coal
WSP | Parsons BrinckerhoffProject No 2200540A
Figure 5.1 Catchment areas used for MUSIC modelling of SB03 and SB04 discharges..................... 52Figure 5.2 WaterNSW climate zones ................................................................................................ 53Figure 5.3 Daily rainfall for zone 3 (1997 to 2001) used in MUSIC modelling ..................................... 54Figure 5.4 Total Phosphorus cumulative frequency graph for SB03 and SB04 discharge
assessment ..................................................................................................................... 56Figure 5.5 Total Nitrogen cumulative frequency graph for SB03 and SB04 discharge
assessment ..................................................................................................................... 56Figure 5.6 Total Phosphorus cumulative frequency graph for sealed road northern
catchment ........................................................................................................................ 63Figure 5.7 Total Nitrogen cumulative frequency graph for sealed road northern
catchment ........................................................................................................................ 64Figure 5.8 Total Phosphorus cumulative frequency graph for sealed road middle
catchment ........................................................................................................................ 65Figure 5.9 Total Nitrogen cumulative frequency graph for sealed road middle catchment .................. 66Figure 5.10 Total Phosphorus cumulative frequency graph for sealed road southern
catchment ........................................................................................................................ 67Figure 5.11 Total Nitrogen cumulative frequency graph for sealed road southern
catchment ........................................................................................................................ 68Figure 5.12 Total Phosphorus cumulative frequency graph for unsealed road catchment .................... 69Figure 5.13 Total Nitrogen cumulative frequency graph for unsealed road catchment ......................... 70Figure 5.14 Groundwater quality monitoring locations ......................................................................... 74Figure 6.1 Surface water quality monitoring locations........................................................................ 81
L I S T O F A P P E N D I C E SAppendix A Baseline surface water quality dataAppendix B Adjustment of background nutrient concentrations for swales
v
WSP | Parsons BrinckerhoffProject No 2200540A Surface Water Quality Assessment
Hume Coal
G L O S S A R Y
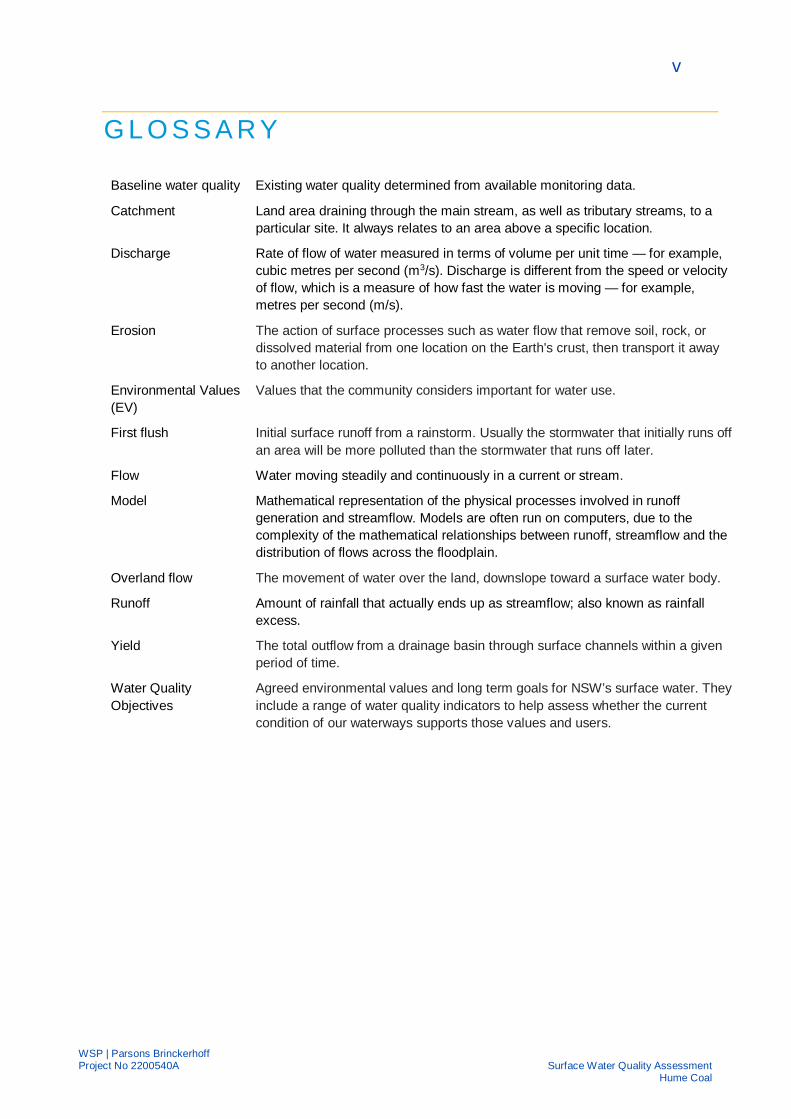
Baseline water quality Existing water quality determined from available monitoring data.
Catchment Land area draining through the main stream, as well as tributary streams, to aparticular site. It always relates to an area above a specific location.
Discharge Rate of flow of water measured in terms of volume per unit time — for example,cubic metres per second (m3/s). Discharge is different from the speed or velocityof flow, which is a measure of how fast the water is moving — for example,metres per second (m/s).
Erosion The action of surface processes such as water flow that remove soil, rock, ordissolved material from one location on the Earth's crust, then transport it awayto another location.
Environmental Values(EV)
Values that the community considers important for water use.
First flush Initial surface runoff from a rainstorm. Usually the stormwater that initially runs offan area will be more polluted than the stormwater that runs off later.
Flow Water moving steadily and continuously in a current or stream.
Model Mathematical representation of the physical processes involved in runoffgeneration and streamflow. Models are often run on computers, due to thecomplexity of the mathematical relationships between runoff, streamflow and thedistribution of flows across the floodplain.
Overland flow The movement of water over the land, downslope toward a surface water body.
Runoff Amount of rainfall that actually ends up as streamflow; also known as rainfallexcess.
Yield The total outflow from a drainage basin through surface channels within a givenperiod of time.
Water QualityObjectives
Agreed environmental values and long term goals for NSW’s surface water. Theyinclude a range of water quality indicators to help assess whether the currentcondition of our waterways supports those values and users.

vi
Surface Water Quality AssessmentHume Coal
WSP | Parsons BrinckerhoffProject No 2200540A
A B B R E V I AT I O N SADWG Australian Drinking Water Guidelines
ANZECC Australian and New Zealand Environment and Conservation Council
ARMCANZ Agriculture and Resources Management Council of Australia and NewZealand
CPP Coal preparation plant
DECC Department of Environment and Climate Change
DP&E NSW Department of Planning and Environment
DPI NSW Department of Primary Industries
EIS Environmental impact statement
EPA NSW Environment Protection Authority
EV Environmental value
ha Hectares
HRC Healthy Rivers Commission
Hume Coal Hume Coal Pty Limited
km Kilometres
LGA Local government area
LPI NSW Land and Property Information
MHRDC Maximum harvestable right dam capacity
ML Megalitres
mm/day Millimetres per day
Mt Million tonnes
Mtpa Million tonnes per annum
MUSIC Model for Urban Stormwater Improvement Conceptualisation
MWD Mine water dam
NorBE Neutral or Beneficial Effect
NOW NSW Office of Water
NSW New South Wales
NWQMS National Water Quality Management Strategy
PWD Primary water dam
ROM Run of mine
SB Stormwater basin
SCA Sydney Catchment Authority

vii
WSP | Parsons BrinckerhoffProject No 2200540A Surface Water Quality Assessment
Hume Coal
SEARs Secretary’s environmental assessment requirements
SEPP State Environmental Planning Policy
SWQ Surface Water Quality monitoring site
TDS Total dissolved solids
TN Total nitrogen
TP Total phosphorus
TSS Total suspended solids
WAL Water access licence
WQO Water quality objectives
WTP Water treatment plant
WM Act NSW Water Management Act 2000
WSC Wingecarribee Shire Council

viii
Surface Water Quality AssessmentHume Coal
WSP | Parsons BrinckerhoffProject No 2200540A
E X E C U T I V E S U M M A RYA surface water quality assessment was undertaken for the Hume Coal Project (or ‘the project’), aproposed underground coal mine in the Southern Coalfield, New South Wales.
The Hume Coal Project has been designed to avoid or minimise potential impacts on surface waterquality in receiving watercourses. Key aspects of the design that achieve these outcomes are asfollows:
à the project does not involve the take of water directly from streams;
à the project does not involve any stream diversions;
à the project will use low impact underground mining methods, which have negligible subsidenceimpacts;
à only minor instream works across Medway Rivulet and Oldbury Creek are proposed for the project;
à all water in direct contact with coal on the site will be contained and reused within the mine watermanagement system; and
à water that has a low risk of contact with coal, i.e. runoff from areas that do not contain coalstockpiles or processing plant but that could contain small amounts of coal due to mine vehicletraffic, will be managed by containing and reusing the first flush of runoff, after which the water willbe released to Oldbury Creek provided water quality criteria are met.
Construction and rehabilitation phase impacts of the project on surface water quality are expected to beneutral by implementing best practice erosion and sediment control management measures inaccordance with relevant legislation and guidelines.
The project activities that have the potential to impact on surface water quality during operation are asfollows:
à Releases from stormwater basins SB03 and SB04 (the runoff from which has a low risk of coalcontact) to Oldbury Creek following pumping of the first flush to the Primary Water Dam for reuse.
à Runoff from mine access roads that drain into the Medway Rivulet catchment.
à The interception of natural baseflow due to underground mining which may change the loading andconcentration of some water quality parameters in the surface waters.
The assessment has used water quality modelling to demonstrate that the release of water from SB03and SB04 to Oldbury Creek will meet criteria for total suspended solids (TSS) and nutrients set by therelevant legislation and guidelines. For other contaminants that may be present in the runoff to thesebasins, this assessment has established preliminary water quality targets to be used for ongoing waterquality monitoring in these basins.
For SB03 and SB04, the water quality discharge limits will be developed to protect the environmentalvalues in the Hawkesbury-Nepean Basin and to achieve a Neutral or Beneficial Effect (NorBE) on waterquality. The preliminary limits established in this report will be refined in consultation with the NSWEnvironment Protection Authority.
Water quality modelling has demonstrated that swales can be used to provide an effective treatmentsystem for runoff from the access roads to meet the NorBE criteria for TSS and nutrients.
Assessment of the impact of intercepted baseflow concluded that, while a small number of contaminantshave lower concentrations in the groundwater, any change in water quality due to loss of baseflow fromgroundwater is likely to be negligible.

ix
WSP | Parsons BrinckerhoffProject No 2200540A Surface Water Quality Assessment
Hume Coal
The assessment has established preliminary water quality objectives to set targets for monitoring theperformance of the project impact on Medway Rivulet and Oldbury Creek. Final water quality objectivesshould be developed using the additional surface water quality data collected prior to commencement ofconstruction of the project. Surface water quality monitoring should be undertaken throughoutconstruction, operation and rehabilitation at upstream and downstream sites on Medway Rivulet andOldbury Creek to monitor changes in surface water quality in the receiving environment associated withthe project and trigger the implementation of mitigation and remediation measures if required.

1
WSP | Parsons BrinckerhoffProject No 2200540A
Surface Water Quality AssessmentHume Coal
1 INTRODUCTIONWSP | Parsons Brinckerhoff was engaged by Hume Coal Pty Limited (Hume Coal) to undertake a surfacewater quality assessment for the Hume Coal Project (the project), a proposed underground coal mine in theSouthern Coalfield, New South Wales (NSW).
This report provides an assessment of the impacts of the project on surface water quality in local catchmentsand mitigation measures proposed to minimise potential impacts.
1.1 Project location
The project area is approximately 100 km south-west of Sydney and 4.5 km west of Moss Vale town centrein the Wingecarribee LGA (refer to Figure 1.1 and Figure 1.2). The nearest area of surface disturbance willbe associated with the surface infrastructure area, which will be 7.2 km north-west of Moss Vale town centre.It is in the Southern Highlands region of NSW and the Sydney Basin Biogeographic Region.
The project area is in a semi-rural setting, with the wider region characterised by grazing properties, small-scale farm businesses, natural areas, forestry, scattered rural residences, villages and towns, industrialactivities such as the Berrima Cement work and Berrima Feed Mill, and some extractive industry and majortransport infrastructure such as the Hume Highway.
Surface infrastructure is proposed to be developed on predominately cleared land owned by Hume Coal oraffiliated entities, or for which there are appropriate access agreements in place with the landowner. Overhalf of the remainder of the project area (principally land above the underground mining area) comprisescleared land that is, and will continue to be, used for livestock grazing and small-scale farm businesses.Belanglo State Forest covers the north-western portion of the project area and contains introduced pineforest plantations, areas of native vegetation and several creeks that flow through deep sandstone gorges.Native vegetation within the project area is largely restricted to parts of Belanglo State Forest and ripariancorridors along some watercourses.
The project area is traversed by several drainage lines including Oldbury Creek, Medway Rivulet, WellsCreek, Wells Creek Tributary, Belanglo Creek and Longacre Creek, all of which ultimately discharge to theWingecarribee River, at least 5 km downstream of the project area (Figure 1.2). The Wingecarribee River’scatchment forms part of the broader Warragamba Dam and Hawkesbury-Nepean catchments. Medway Damis also adjacent to the northern portion of the project area (Figure 1.2).
Most of the central and eastern parts of the project area have very low rolling hills with occasional elevatedridge lines. However, there are steeper slopes and deep gorges in the west in Belanglo State Forest.
Existing built features across the project area include scattered rural residences and farm improvementssuch as outbuildings, dams, access tracks, fences, yards and gardens, as well as infrastructure and utilitiesincluding roads, electricity lines, communications cables and water and gas pipelines. Key roads thattraverse the project area are the Hume Highway and Golden Vale Road. The Illawarra Highway borders thesouth-east section of the project area.
Industrial and manufacturing facilities adjacent to the project area include the Berrima Cement Works andBerrima Feed Mill on the fringe of New Berrima. Berrima Colliery’s mining lease (CCL 748) also adjoins theproject area’s northern boundary. Berrima colliery is currently not operating with production having ceased in2013 after almost 100 years of operation. The mine is currently undergoing closure.

!
!
!
!
!
COXS
RIVE
R
WARRAGAMBA DAM
BUNDANOON DAM
NEPEAN DAM
MEDWAY DAMWINGECARRIBEE
RESERVOIR
áá
CAMDEN
PICTON
BERRIMA
MOSS VALE
WOLLONGONG
NEPEAN RIVER
WO
LLONDILLY RIVER
TARLO RIVER
NATT
AI RIVER
WINGECARRIBEE RIVER
170000 180000 190000 200000 210000 220000 230000 240000 250000 260000 270000 280000 290000 300000 310000 32000061
6000
0
6160
000
6170
000
6170
000
6180
000
6180
000
6190
000
6190
000
6200
000
6200
000
6210
000
6210
000
6220
000
6220
000
6230
000
6230
000
6240
000
6240
000
6250
000
6250
000
Legend! Town
Main roadRail lineNatural drainage lineHume Coal Project areaSCA Special areasWaterbodyState ForestNPWS reserveWarragamba drinkingwater catchment
!(
NEW SOUTH WALES
VICTORIA
QUEENSLAND
ACT
SYDNEY
0 5,000 10,000
m
Approved by: LRDate: 21/10/2016
Map: 2200540A_GIS_059_A2 Author: RP
Hume Coal Surface Water Quality AssessmentFigure 1.1
Project location
1:400,000
Coordinate system: GDA 1994 MGA Zone 56
Scale ratio correct when printed at A3
°
\\APSYDFIL03\proj\H\HUME_COAL_PTY_LTD\2200540A_HUME_SURFACE_WATER_EIS\10_GIS\Projects\Maps2200540A_GIS_059_A2.mxd Hume Coal
© WSP l Parsons Brinckerhoff - Asia Pacific (WSP l PB) Copyright in the drawings, information and data recorded is the property of WSP l PB. This document and the information are solely for the use of the authorisedrecipient and this document may not be used, copied or reproduced in whole or part for any purpose other than that which it was supplied by WSP l PB. WSP l PB makes no representation, undertakes no duty and acceptsno responsibility to any third party who may use or rely upon this document or the information. NCSI Certified Quality System to ISO 9001. © APPROVED FOR AND ON BEHALF OF© WSP l Parsons Brinckerhoff - Asia Pacific.
Data source: , Hume Coal, Google Earth
www.wsp-pb.com

Undergroundmining area
Surfaceinfrastructure
area
M
E D WAY RIVULET
OLD
B UR Y CREEK
M EDWAY DAM
HUME HIGHWAY
OLDHUME HIGHWAY
OLDBURYROAD
OXLEYS HILL ROAD
DALYSROAD
ILLAWARRAHIG
HWAY
BERRIMAROAD
MEDWAY ROAD
EXET
ER RO
AD
BUNNIGALORE
ROAD
MEREWORTHROAD
KNAPSACK GULLY
BRETHREN GULL Y
NORR
ISCR
EEK
PIVET S CREEK
PAYNES CREEK
FIRE DAM CREEK
MERE
DITH
PARK
GULLY
MOR
RICE C
REEK
BLUEARMGULLY
BLACKSPRINGS
CREEK
COLYE
RSCR
EE
K
WIN
GECA
RRIB
EERI
VER
ROCK
Y CRE
EK
RED A
RMCR
EEK
BELANGLO CREEK
STONY
CREE
K
LONGACRE CREEK
WHITES CREEK
WELL
S CRE
EK
EMU CR E EK
WI NG EC ARRIBEE RIVER
WINGECA RRIBEERIVER
BLAC
KBO
BSCR EEK
NEW BERRIMA
MOSS VALE
BERRIMAMEDWAY
WELL
S CRE
EKTR
IBUT
ARY
240000 245000 250000 255000 26000061
7000
0
6170
000
6175
000
6175
000
6180
000
6180
000
LegendBerrima Rail projectUnderground workings
Rail lineRoad
Natural drainage lineHume Coal Project areaMain mine roadway(indicative)Mining domain (indicative)Surface infrastructurefootprintTemporary constructionaccommodation villageConstruction buffer zoneWaterbody
!(
!(
!(
!(
!(
!(
NOWRA
SYDNEYCAMDENPICTON
MOSS VALEWOLLONGONG
0 1,000 2,000
m
Approved by: LRDate: 14/11/2016
Map: 2200540A_GIS_060_A2 Author: RP Hume Coal ProjectSurface Water Flow and Geomorphology Assessment
Figure 1.2Project area
1:60,000
Coordinate system: GDA 1994 MGA Zone 56
Scale ratio correct when printed at A3
°© WSP l Parsons Brinckerhoff - Asia Pacific (WSP l PB) Copyright in the drawings, information and data recorded is the property of WSP l PB. This document and the information are solely for the use of the authorisedrecipient and this document may not be used, copied or reproduced in whole or part for any purpose other than that which it was supplied by WSP l PB. WSP l PB makes no representation, undertakes no duty and acceptsno responsibility to any third party who may use or rely upon this document or the information. NCSI Certified Quality System to ISO 9001. © APPROVED FOR AND ON BEHALF OF© WSP l Parsons Brinckerhoff - Asia Pacific.
Data source: © Land and Property Information 2015, Hume Coal
www.wsp-pb.com\\APSYDFIL03\proj\H\HUME_COAL_PTY_LTD\2200540A_HUME_SURFACE_WATER_EIS\10_GIS\Projects\Maps2200540A_GIS_060_A2.mxd Hume Coal
Hume Coal Surface Water Quality Assessment

4
Surface Water Quality AssessmentHume Coal
WSP | Parsons BrinckerhoffProject No 2200540A
1.2 Project description
The project involves developing and operating an underground coal mine and associated infrastructure overa total estimated project life of 23 years. Indicative mine and surface infrastructure plans are provided inFigure 1.2 and Figure 1.3. A full description of the project, as assessed in this report, is provided in Chapter 2of the main EIS (EMM 2016a).
In summary it involves:
à Ongoing resource definition activities, along with geotechnical and engineering testing, and other lowimpact fieldwork to facilitate detailed design.
à Establishment of a temporary construction accommodation village.
à Development and operation of an underground coal mine, comprising of approximately two years ofconstruction and 19 years of mining, followed by a closure and rehabilitation phase of up to two years,leading to a total project life of 23 years. Some coal extraction will commence during the second year ofconstruction during installation of the drifts, and hence there will be some overlap between theconstruction and operational phases.
à Extraction of approximately 50 million tonnes (Mt) of run-of-mine (ROM) coal from the Wongawilli Seam,at a rate of up to 3.5 million tonnes per annum (Mtpa). Low impact mining methods will be used, whichwill have negligible subsidence impacts.
à Following processing of ROM coal in the coal preparation plant (CPP), production of up to 3 Mtpa ofmetallurgical and thermal coal for sale to international and domestic markets.
à Construction and operation of associated mine infrastructure, mostly on cleared land, including:
§ one personnel and materials drift access and one conveyor drift access from the surface to the coalseam;
§ ventilation shafts, comprising one upcast ventilation shaft and fans, and up to two downcast shaftsinstalled over the life of the mine, depending on ventilation requirements as the mine progresses;
§ a surface infrastructure area, including administration, bathhouse, washdown and workshopfacilities, fuel and lubrication storage, warehouses, laydown areas, and other facilities. The surfaceinfrastructure area will also comprise the CPP and ROM coal, product coal and emergency rejectstockpiles;
§ surface and groundwater management and treatment facilities, including storages, pipelines,pumps and associated infrastructure;
§ overland conveyors;
§ rail load-out facilities;
§ explosives magazine;
§ ancillary facilities, including fences, access roads, car parking areas, helipad and communicationsinfrastructure; and
§ environmental management and monitoring equipment.
à Establishment of site access from Mereworth Road, and minor internal road modifications and relocationof some existing utilities.
à Coal reject emplacement underground, in the mined-out voids.
à Peak workforces of approximately 414 full-time equivalent employees during construction andapproximately 300 full-time equivalent employees during operations.
à Decommissioning of mine infrastructure and rehabilitating the area once mining is complete, so that itcan support land uses similar to current land uses.

5
WSP | Parsons BrinckerhoffProject No 2200540A
Surface Water Quality AssessmentHume Coal
The project area, shown in Figure 1.2, is approximately 5,051 hectares (ha). Surface disturbance will mainlybe restricted to the surface infrastructure areas shown indicatively on Figure 1.3, though will include someother areas above the underground mine, such as drill pads and access tracks. The project area generallycomprises direct surface disturbance areas of up to approximately 117 ha, and an underground mining areaof approximately 3,472 ha, where negligible subsidence impacts are anticipated.
A construction buffer zone will be provided around the direct disturbance areas. The buffer zone will providean area for construction vehicle and equipment movements, minor stockpiling and equipment laydown, aswell as allowing for minor realignments of surface infrastructure. Ground disturbance will generally be minorand associated with temporary vehicle tracks and sediment controls as well as minor works such asbackfilled trenches associated with realignment of existing services. Notwithstanding, environmental featuresidentified in the relevant technical assessments will be marked as avoidance zones so that activities in thisarea do not have an environmental impact.
Product coal will be transported by rail, primarily to Port Kembla terminal for the international market, andpossibly to the domestic market depending on market demand. Rail works and use are the subject of aseparate EIS and State significant development application for the Berrima Rail Project.

PrimaryWaterDam
Personnel andmaterials drift
Ventilationshaft pad
Conveyor drift
Laydown area
Explosivesmagazine
Laydown area
Site access pointfrom Mereworth Road
Watertreatmentplant
Main substationROM coalstockpile
Coal preparationplant
Coal loading facility
Temporary/emergencyrejects stockpiles
Product coalstockpiles
Temporary constructionaccommodation village
Administration buildingand bathhouse
Sewage treatmentplantDrift and shaftspoil and topsoil
SB01
SD01
SB03
SB04
MWD05
MWD06
MWD07
MWD08
SB02
O LDBURY C REEK
MEDW
AYRIVU LET
PLANTINGSPADE CREEK
BLACK SPRINGS CREEK
BELANGLO CREEK
WELLS CREEK
M ED WAY DA M
NEW BERRIMA
HUME HIGHWAY
OLD HUM
E HIGHWAY
HUME
MOTO
RWAY
O L DBURY STREET
248000 249000 250000 251000 252000 253000 254000 25500061
7600
0
6176
000
6177
000
6177
000
6178
000
6178
000
6179
000
6179
000
6180
000
6180
000
LegendHume Coal Projectarea
Indicative surfaceinfrastructure feature
Existing WSCeasementProposed powerlineand pipelineeasementPowerline route
Drift (underground)
Conveyor
Water pipeline
All-weather track
Berrima Rail project
Primary water damcatchmentStormwater basincatchmentMine water damcatchment
TemporaryconstructionaccommodationvillageAdministration/bathhouse/workshopTopsoil stockpiles
StormwatermanagementearthworksTop water level
Existing featureRail line
Main road
Local road
Natural drainage line
Waterbody
!(
!(
!(
!(
!(
!(
NOWRA
SYDNEYCAMDENPICTON
MOSS VALE
WOLLONGONG
0 250 500
m
Approved by: LRDate: 21/10/2016
Map: 2200540A_GIS_061_A3 Author: RP
Hume Coal Surface Water Quality AssessmentFigure 1.3
Surface infrastructure layout
1:20,000
Coordinate system: GDA 1994 MGA Zone 56
Scale ratio correct when printed at A3
°
\\APSYDFIL03\proj\H\HUME_COAL_PTY_LTD\2200540A_HUME_SURFACE_WATER_EIS\10_GIS\Projects\Maps2200540A_GIS_061_A3.mxd Hume Coal
© WSP l Parsons Brinckerhoff - Asia Pacific (WSP l PB) Copyright in the drawings, information and data recorded is the property of WSP l PB. This document and the information are solely for the use of the authorisedrecipient and this document may not be used, copied or reproduced in whole or part for any purpose other than that which it was supplied by WSP l PB. WSP l PB makes no representation, undertakes no duty and acceptsno responsibility to any third party who may use or rely upon this document or the information. NCSI Certified Quality System to ISO 9001. © APPROVED FOR AND ON BEHALF OF© WSP l Parsons Brinckerhoff - Asia Pacific.
Data source: © Land and Property Information 2015, Hume Coal, Google Earth
www.wsp-pb.com

7
WSP | Parsons BrinckerhoffProject No 2200540A
Surface Water Quality AssessmentHume Coal
1.3 Study area
The study area for surface water quality assessment comprises the streams with potential to be impacted bythe project. The project has the potential to impact on the water quality of local streams through:
à Controlled release of water from stormwater basins (SBs) SB03 and SB04 to Oldbury Creek followingpumping of the first flush to the primary water dam (PWD) for reuse on site;
à Interception of natural baseflow to streams associated with depressurisation of groundwater systemsduring underground mining. Numerical groundwater modelling has found that a reduction in baseflow tostreams will occur within the groundwater model boundary in the following streams:
§ Medway Rivulet and its tributaries, including Oldbury Creek, Wells Creek, Wells Creek Tributaryand Belanglo Creek;
§ Wingecarribee River and its tributaries;
§ Wollondilly River and its tributaries; and
§ Bundanoon Creek and its tributaries.
The study area for the surface water quality assessment is shown on Figure 1.4. The study area comprisesthe streams with potential to be impacted by the project within the groundwater model boundary.

WELL
SCRE
EKTR
IBUT
ARY
WINGEC ARR IBEE R IVE R
BOX G
ULLY
GLUT GULLY
SUSANS GULLY
STON
Y GUL
LY
PENANG GULLY
JACK
S CRE
EK
RITTERS CREEKBLUE ARM GULLY
GIBRALTAR CREEK
MANNINGS GULLY
YARRAWA CREEK
WALL
ABY G
ULLY
BOREHOLE CREEK
COAL
CREE
K
FLO
RAGULLY
GAPCREEK
BOWMANS CREE
K
HORSE CREEK
FOREST CREEK
MOORE CR
EEK
DEEP CREEK
DRY C
RE
E K
BURK
ESCR
EEK
ST PAULS CREEK
ROCK
YCRE
E K
DEADMANS CREEK
CUTAWAYCREEK
REED
Y CREE
K
PIPECLAYCREEK
SPRING CREE K
CROOKEDCR
EEK
MYRT L
E CRE
EK
SMALLCREEK
BASKETCREE K
KELLS CR E EK
WATT LE
CREE K
RED ARMCREEK
BULL
IOCR
EEK
KELPIE
CREEK
SCHO
OLCR
EEK
BRIDGE CREEK
DEEPCR
EEK
SANDY
CREEK
IND IGOCREE K
BELA NGLOCR
EEK
DIG GERS CREEK
DARK
CREE
K
BASIN CREEK
STONYCREEK
GUN ROCK CREEK
LONG CR EEK
REEDYCREEK
FITZR
OYCA
NAL
DTHAROWAL CREEK
ROPESEND CREEK
LONGCREEK
SHEEPWASH CREEK
SCHOTTS CR E EK
DRAPERS CREEK
STON
Y CREE
K
HANGING ROCK SW
AMP
STON
EQUA
RRYC
REEK
NEWFOUNDLAND CREEK
JACKEY JACKEYS CREEK
LITT
LEBR
IDGY CREEK
JOCKSCREEK
COLYERS CREEK
NANDI C REEK
IRON CREEK
CONNORS CRE EK
LO
NGACRECREEKBACK CR EEK
WOOD
HOUSEC REEK
TALLYGANG CREEK
WHITES CREEK
CAAL ANGCREEK
OLDBURY CREEKBA
RRAC
KSCR
EEK
LITT L
ERIVE
R
MIL L
ERS C
R EEK
JAOR
IMIN
CREE
K
ISLAND CREE
K
GERRINGONG CREEK
CORDEA UXCR EEK
PIVETSCREEK
YARRU NGAC
REEK
MAN
DEMAR CREEKHA
NWO
RTHC
REEK
WILS
ONSCR
EEK
URINGALLACREEK
BANGADIL LY CREEK
EXPLORERS CREEK
WA NGANDERRY CREE K
NA
TTAI CREEK
MARES FOREST CREEK
BRIDGY
CREE
K
JELLORECREEK
SANDY CREEK
WELL
SCRE
EK
DOUDLESFOLLY CREEK
AVON
RIVE
R
DUDEWA UGH CREEK
EMUCRE EK
MITTAGONG
C RE
EK
KANG
AROO
RIVER
ROCKY WATERHOL ES CR EEK
KELLYS CREEK
BARGO RIVER
LITTL
E BU R
KERI
VER
BARR
ENGA
RRYC
RE
EK
LONG S WAMP C REEK
JUNC
TIONC
REEK
BUNDANOON CREEK
J OADJACREEK
BURKE RIVER
BANNABY CREE
K
MEDWAY RI VULETBLACK
BOBS
CREEK
NATTAI R IVER
GUINEA CORCR
EEK
TARLO RIVER
PA DDYS RIVER
NEPE
ANRIV
ER
WOLLO
NDILL
YRIVER
MEDWAYDAM
220000 230000 240000 250000 260000 270000 28000061
6000
0
6160
000
6170
000
6170
000
6180
000
6180
000
6190
000
6190
000
6200
000
6200
000
LegendRail line
Main road
Natural drainage line
Hume Coal Project area
Groundwater modelboundaryWaterbody
Temporary constructionaccommodation villageSurface infrastructurefootprintConstruction buffer zone
0 2,500 5,000
m
Approved by: LRDate: 21/10/2016
Map: 2200540A_GIS_062_A2 Author: RP
Hume Coal Surface Water Quality AssessmentFigure 1.4Study area
1:175,000
Coordinate system: GDA 1994 MGA Zone 56
Scale ratio correct when printed at A3
°
\\APSYDFIL03\proj\H\HUME_COAL_PTY_LTD\2200540A_HUME_SURFACE_WATER_EIS\10_GIS\Projects\Maps2200540A_GIS_062_A2.mxd Hume Coal
© WSP l Parsons Brinckerhoff - Asia Pacific (WSP l PB) Copyright in the drawings, information and data recorded is the property of WSP l PB. This document and the information are solely for the use of the authorisedrecipient and this document may not be used, copied or reproduced in whole or part for any purpose other than that which it was supplied by WSP l PB. WSP l PB makes no representation, undertakes no duty and acceptsno responsibility to any third party who may use or rely upon this document or the information. NCSI Certified Quality System to ISO 9001. © APPROVED FOR AND ON BEHALF OF© WSP l Parsons Brinckerhoff - Asia Pacific.
Data source: NSW Property and Information 2015, Hume Coal, Google Earth
www.wsp-pb.com
!(
!(
!(
!(
!(
!(
NOWRA
SYDNEYCAMDENPICTON
MOSS VALEWOLLONGONG

9
WSP | Parsons BrinckerhoffProject No 2200540A
Surface Water Quality AssessmentHume Coal
1.4 Environmental assessment requirements
This assessment has been prepared in accordance with the relevant governmental assessmentrequirements, guidelines and policies, and in consultation with the relevant government agencies. Guidelinesand policies considered are as follows:
à State Environmental Planning Policy (Sydney Drinking Water Catchment) 2011;
à Neutral or Beneficial Effect on Water Quality Assessment Guideline 2015;
à Using MUSIC in Sydney’s Drinking Water Catchment 2012;
à National Water Quality Management Strategy 2016;
à NSW Government Water Quality and River Flow Objectives 1999;
à Healthy Rivers Commission Inquiry into the Hawkesbury-Nepean River 1998;
à Australian and New Zealand Guidelines for Fresh and Marine Water Quality 2000;
à Australian Drinking Water Guidelines 2011;
à WaterNSW Principles for Managing Mining and Coal Seam Gas Impacts in Declared Catchment Areas2014;
à Greater Metropolitan Region Unregulated Water Sources Water Sharing Plan 2011; and
à NSW State Rivers and Estuary Policy 1993
Further details of these guidelines and policies, and how they apply to this assessment, are provided inSection 2 of this report.
The Secretary’s Environmental Assessment Requirements (SEARs) related to surface water quality, and thesection of this report where the requirement is addressed, are provided in Table 1.1.
Table 1.1 Surface water quality related SEARs
REQUIREMENT SECTION ADDRESSED
An assessment of the likely impacts of the development on the water quality of theregion’s surface water resources, having regard for the EPA’s, DPI andWaterNSW’s requirements and recommendations
Section 5
An assessment of the likely water quality impacts of the development onwatercourses, riparian land, water-related infrastructure, and other water uses.
Section 5
To inform preparation of the SEARs, the NSW Department of Planning and Environment (DP&E) invitedother government agencies to recommend matters for address in the EIS. These matters were then takeninto account by the Secretary for DP&E when preparing the SEARs. Copies of the government agencies’advice to DP&E was attached to the SEARs. The matters are listed in Table 1.2 and have been taken intoaccount in preparing this report, as indicated.

10
Surface Water Quality AssessmentHume Coal
WSP | Parsons BrinckerhoffProject No 2200540A
Table 1.2 Agency requirements
REQUIREMENT SECTION ADDRESSED
DPI, FISHERIES NSW
Impacts on water quality during all surface and underground construction activities andfrom ongoing operation of the proposed mine, processing plant, and associatedinfrastructure of the proposed coal mine.
Section 5
Impacts on water quality and flow from subsidence and groundwater interactions resultingfrom surface and underground construction and ongoing operation of the coal mine.
Section 5
Analysis of any interactions of the proposed development with water quality and aquaticand riparian environments (including fish and aquatic and riparian vegetation) andpredictions of any impacts upon those environments.
Section 5
Safeguards to mitigate any impacts upon water quality, water flow and aquatic riparianenvironments within and downstream of all waterways within the proposal area duringconstruction and ongoing operation of the proposed coal mine. In particular, providedetails on proposal for erosion and sediment control (to be incorporated into aConstruction Environmental Management Plan (CEMP) and proposed stormwater andongoing drainage management measures. Water quality management for the projectshould be designed to achieve no nett increases in pollutant run-off to receiving waterswithin the proposal site.
Section 6
Details of ongoing monitoring programs to assess any impacts upon water quality withinand downstream of all waterways within the proposal area.
Section 6.4
Fisheries NSW recommend the use of best practice sediment and erosion control, andwater quality and stormwater management provisions to safeguard and mitigate impactson water quality at the site and downstream.
Section 6
DPI WATER
An assessment of impacts on surface water quality sources related infrastructure,adjacent licensed water users, basic landholder rights, watercourses, riparian land, andmeasures proposed to reduce and mitigate these impacts.
Section 5
Proposed surface water monitoring activities and methodologies. Section 6.4
Assessment of any potential cumulative impacts on water resources, and proposedoptions to manage the cumulative impacts.
Section 5.2.5
Demonstrate how the proposal is consistent with the relevant rules of the Water SharingPlan including rules for water quality.
Section 2 and Section 5
Assessment of predicted impacts on the flow of surface water (including floodwater),sediment movement, channel stability, and hydraulic regime, water quality, flood regime,dependent ecosystems, existing surface water users, and planned environmental waterand water sharing arrangements prescribed in the relevant water sharing plans.
Section 5

11
WSP | Parsons BrinckerhoffProject No 2200540A
Surface Water Quality AssessmentHume Coal
REQUIREMENT SECTION ADDRESSED
ENVIRONMENT PROTECTION AUTHORITY
EPA acknowledges the priority to be given to surface and ground water in the EIS. It isnoted that on page 63, the proposed water quality assessment includes evaluationagainst neutral and beneficial effect (NOBE) criteria in accordance with StateEnvironmental Planning Policy (Sydney Drinking Water Catchment) 2011. However,water management should also be assessed using approaches outline in the NationalWater Quality Management Strategy, ANZECC 2000. These are described in more detailin the standards SEARS but in summary the EIS should:
à Identify relevant Water Quality Objectives (WQO) for the surface water, includingindicators and associated trigger values or criteria, in accordance with National WaterQuality Management Strategy Guidelines. Reference the water quality objectives forthe Wingecarribee River catchment in the ‘NSW Healthy River Commission of Inquiryinto the Hawkesbury Nepean Catchment”. Identify any downstream users and uses ofthe discharged water classified in accordance with relevant ANZECC 2000.
à Estimate the chemical composition and load of chemical and physical stressors andtoxicants in any discharge of mine water. Compare the level of physical and chemicalstressors in any discharge with ANZECC 2000 trigger values for the variousenvironmental values for the waterway.
à Investigate options to reduce the levels of pollutants in the discharge of water toprotect the environment from harm as a result of that pollution. Identify all practicalmeasures to control or reduce pollutants in the surface water discharges. Identifypreferred measures and their justification.
à If WQO’s cannot be met for the project, demonstrate that all practical options to avoidwater discharge have been implemented and outline any measures taken to reducethe pollutant loads where a discharge is necessary. Where a discharge is proposedanalyse the expected discharge in terms on the receiving environment, includingconsideration of all pollutants that pose a risk of non-trivial harm.
Section 5 and Section 6
WATERNSW
The EIS will need to demonstrate that the proposed measures to capture and treat waterimpacted by the proposal will have no impact on water quality within the WingecarribeeRiver.
Section 6
The EIS must describe and justify how the development would have a neutral orbeneficial effect on water quality.
Section 5 and Section 6
The full description of the development should include those aspects which have thepotential to impact on the quality of surface waters at and adjacent to the site. Thisincludes:
à the mining proposal and mine layout
à the location, mapping and geomorphology of all creeks and water resources overlyingand adjacent to the proposed mining area
à the hydrogeological fluxes between surface water including the filling of pine feathervoids
à the location, management and storage of all hazardous materials
à the disposal of wastes from the treatment of the mine waters in the treatment plant
à the management of dirty water from the washing and preparation of coal for transport
à the location, sizing and description of all water quality management measures
à the location and description of all water monitoring points
à Onsite domestic (sewage) wastewater management.
Section 3.4, Section 5 andSection 6

12
Surface Water Quality AssessmentHume Coal
WSP | Parsons BrinckerhoffProject No 2200540A
REQUIREMENT SECTION ADDRESSED
The detailed assessment of the development on water resources should also consider thedesign, construction, operational and decommissioning phases and have regard foroperation during periods of wet weather and include:
à details of measured and predicted coal mine, preparation area and stockpile areaperformance with respect to water quality management.
à details of measures proposed to adopted to offset impacts associated withconstruction activities
à impacts of overlying and adjacent creeks and water resources within riskManagement Zone associated with subsidence
à impacts on the proposed onsite domestic (sewage) wastewater management andassociated effluent disposal area
à pre development and post development run off volumes and pollutant loads from thesite
à details of measures to manage site water associated with processing coal and coalreject, general stormwater runoff and any human activities like to affect water qualityat the site and how NorBE principals will be assessed and applied.
à assessment of the impacts of the development on receiving water quality andvolume, including from the filling of pine feather voids and associated impacts on theinteraction and base flows of surface water
à details of the structural stability, integrity, ongoing maintenance and monitoring of allsite water management measuring including dams over the life of the project
à details of proposed monitoring of surface water flows, and surface water quality alongwith information on as to how the proposed monitoring will be used to monitor and ifnecessary mitigate impacts on surface water resources
à the principles outlined in the ‘Managing Urban Stormwater – Soils and Construction –Mines and Quarries’ manual prepared by the Department of Environment andClimate Change (2008).
Section 5 and Section 6
OFFICE OF ENVIRONMENT AND HERITAGE
The EIS must describe background conditions for any water resource likely to be affectedby the development, including:
à Existing surface water.
à Hydrology, including volume, frequency and quality of discharges at proposed intakeand discharge locations.
à Water Quality Objectives (as endorsed by the NSW Governmenthttp://www.environment.nsw.gov.au/ieo/index.htm)
à Indicators and trigger values/criteria for the environmental values identified at (c) inaccordance with the ANZECC (2000) Guidelines for Fresh and Marine Water Qualityand/or local objectives, criteria or targets endorsed by the NSW Government.
Section 3 and Section 4
The EIS must assess the impacts of the development on water quality, including:
à The nature and degree of impact on receiving waters for surface water,demonstrating how the development protects the Water Quality Objectives wherethey are currently being achieved, and contributes towards achievement of the WaterQuality Objectives over time where they are currently not being achieved. This shouldinclude an assessment of the mitigating effects of proposed stormwater andwastewater management during and after construction.
à Identification of proposed monitoring of water quality.
Section 5 and Section 6
The Hume Coal Project was declared as a controlled action on 1 December 2015 by the thenCommonwealth Department of the Environment (now Department of Environment and Energy). The projectwill be assessed under the Bilateral Agreement between the NSW Government and the CommonwealthGovernment. Accordingly, the Commonwealth Department of the Environment and Energy has issued

13
WSP | Parsons BrinckerhoffProject No 2200540A
Surface Water Quality AssessmentHume Coal
supplementary SEARs to address matters of national environmental significance relevant to the project.These matters are provided in Table 1.3, and have been taken into account in preparing this report, asindicated in the table.
Table 1.3 Supplementary SEARs
REQUIREMENT SECTION ADDRESSED
The EIS should provide a description of the location, extent and ecologicalcharacteristics and values of the identified water resources potentially affected bythe project. The assessment of impacts should include information on:
à substantial and measurable change in the water quality of the water resourcefor example, a substantial change in the level of salinity, pollutants, ornutrients in the wetland; or water temperature that may adversely impact onbiodiversity, ecological integrity, social amenity or human health,
Section 3 and Section 5

14
Surface Water Quality AssessmentHume Coal
WSP | Parsons BrinckerhoffProject No 2200540A
2 REGULATORY FRAMEWORKThis section summarises the legislation, policies and guidelines that are relevant to the surface water qualityassessment.
2.1 Water Management Act 2000
The NSW Water Management Act 2000 (WM Act) recognises the need to allocate and provide water for theenvironmental health of our rivers and groundwater systems, while also providing licence holders withaccess to water. The main tool the WM Act provides for managing the state's water resources are watersharing plans. These are used to set out the rules for the sharing of water in a particular water sourcebetween water users and the environment and rules for the trading of water in a particular water source.
Surface water in the project area is managed under the Greater Metropolitan Region Unregulated WaterSources Water Sharing Plan 2011. The project area is located largely within the Upper Nepean andUpstream Warragamba Water Source, mostly within the Medway Rivulet Management Zone with smallsections located in the Lower Wingecarribee River Management Zone (Figure 2.1).
Surface water users (other than stock or domestic) must hold a water access licence (WAL) to take waterfrom streams in the study area. The WAL specifies the annual volume that may be taken and the conditionsunder which water may be taken. Water trading is not permitted between management zones. Water tradingwithin the management zones is allowed subject to assessment.
Water may be taken for stock or domestic purposes without a licence under basic water rights. Landholderscan take water from streams, or collect a proportion of the rainfall runoff on their property and store it in oneor more dams, up to a certain size. The total dam capacity allowed on a property under a harvestable right isdetermined by calculating the maximum harvestable right dam capacity (MHRDC) for a particular property.
2.2 NSW State Rivers and Estuary Policy 1993
The NSW State Rivers and Estuary Policy 1993 aims to encourage the sustainable management of theState's rivers, estuaries, wetlands and adjacent riverine plains. The overall objectives are to manage NSWrivers and estuaries in ways which:
à slow, halt or reverse the overall rate of degradation in their systems;
à ensure the long-term sustainability of their essential biophysical function; and
à maintain the beneficial use of these resources.
A set of component policies has been developed, identifying management needs and opportunities andproviding clear management principles and guidelines.

WELL
SC R
EEK
TRIBU
TARY
FITZR
OYCA
NAL
ROCK
YCR
EEK
BARONGACREEK
RED ARMCREEK
SCHO
OL
CR EEK
BELANG LO CREEK
GUNRO CK CREEK
REED YCREEK YARRUNGA
CREEK
URING
ALLA CREEK
STONY CREEK
JACKEY JACKEYSCR
EEK
COLYERSCREEK
NANDI CREEK
L ONGACRE CREE K
WHITESCREEK
CORDEAUXCR EEK
PIVETS CREE K
BANGA DILLY CREEK
WELLS CREEK
EMUCREEK
WOLLO
NDILL
YRIVE R
KE LLYS CREEK
LONGSWAMP CREEK BUNDANOON CREEK
PADDYSRIVER
MEDWAY RIVULET
BLACK BOBS CREEK
Upper WingecarribeeRiver Management Zone
Bundanoon CreekManagement Zone
Lower WingecarribeeRiver Management Zone
Fitzroy FallsManagement
Zone
Nattai RiverManagement Zone
Lower WollondillyRiver
Management Zone
Medway RivuletManagement Zone
MaguiresCrossing
Management Zone
YarrungaCreek
Management Zone
M EDWAY DAM
OLD BURY CREEK
240000 250000 260000 27000061
7000
0
6170
000
6180
000
6180
000
!(
!(
!(
!(
!(
!(
NOWRA
SYDNEYCAMDENPICTON
MOSS VALEWOLLONGONG
0 1,000 2,000
m
Approved by: LRDate: 20/10/2016
Map: 2200540A_GIS_063_A2 Author: RP
Hume Coal Surface Water Quality AssessmentFigure 2.1
Surface water management zones
1:100,000
Coordinate system: GDA 1994 MGA Zone 56
Scale ratio correct when printed at A3
°
\\APSYDFIL03\proj\H\HUME_COAL_PTY_LTD\2200540A_HUME_SURFACE_WATER_EIS\10_GIS\Projects\Maps2200540A_GIS_063_A2.mxd Hume Coal
© WSP l Parsons Brinckerhoff - Asia Pacific (WSP l PB) Copyright in the drawings, information and data recorded is the property of WSP l PB. This document and the information are solely for the use of the authorisedrecipient and this document may not be used, copied or reproduced in whole or part for any purpose other than that which it was supplied by WSP l PB. WSP l PB makes no representation, undertakes no duty and acceptsno responsibility to any third party who may use or rely upon this document or the information. NCSI Certified Quality System to ISO 9001. © APPROVED FOR AND ON BEHALF OF© WSP l Parsons Brinckerhoff - Asia Pacific.
Data source: NSW Property and Information 2015, Hume Coal, Google Earth
www.wsp-pb.com
LegendRail lineMain roadNatural drainage lineHume Coal Project areaWSP management zoneSCA special areaWaterbody
Surface water user data wasprovided by DPI Water and iscurrent as of 26 September 2016

16
Surface Water Quality AssessmentHume Coal
WSP | Parsons BrinckerhoffProject No 2200540A
2.3 State Environmental Planning Policy (Sydney Drinking Water Catchment)2011
Under section 34B of the Environment Protection and Assessment Act 1979, provision is to be made in aState Environmental Planning Policy (SEPP) requiring consent authorities to refuse consent to developmentapplications relating to any part of the Sydney drinking water catchment, unless the consent authority issatisfied that the proposed development would have a neutral or beneficial effect (NorBE) on water quality.
The resulting SEPP sets out the planning and assessment requirements for all new developments in theSydney drinking water catchment to prove a NorBE on water quality.
2.4 Neutral or Beneficial Effect on Water Quality Assessment Guideline
Guidelines for the assessment of a NorBE on water quality have been published by WaterNSW (2015). Asdefined in the guidelines, NorBE on water quality is satisfied if the development:
à has no identifiable potential impact on water quality; or
à will contain any water quality impact on the development site and prevent it from reaching anywatercourse, waterbody or drainage depression on the site; or
à will transfer any water quality impact outside the site where it is treated and disposed of to standardsapproved by the consent authority.
2.5 Using MUSIC in Sydney’s Drinking Water Catchment
Within the Sydney drinking water catchment, the Model for Urban Stormwater ImprovementConceptualisation (MUSIC) software must be used to assess the potential impacts of large and complexdevelopments on water quality. MUSIC is a water quality decision support system which estimatesstormwater pollutant generation and simulates the performance of stormwater management measures toassess whether water quality targets can be achieved.
WaterNSW released standards in 2012 to assist consultants in preparing MUSIC models to demonstrate aNorBE on water quality for proposed urban and rural land use developments. NorBE is assessed bycomparing the quality of runoff from the pre-development site with that from the post-development siteincluding proposed stormwater treatment measures that may be needed to mitigate pollutant loads andconcentrations resulting from the proposed land use change.
The standard shows practitioners how to set up a MUSIC model for pre-development and post-developmentsite layouts, considering the existing site characteristics, drainage configuration, the climatic region, and theconfiguration of post-development site layout and treatment measures in the context of NorBE. The manualalso provides conservative NorBE assessment criteria which account for uncertainty in MUSIC predictions.
MUSIC has been used to assess potential impacts of discharges from mine water dams SB03 and SB04 andrunoff from mine access roads on surface water quality in accordance with the WaterNSW standard (2012).
2.6 National Water Quality Management Strategy
The National Water Quality Management Strategy (NWQMS)
aims to protect the nation's water resources by improving water quality while supporting the businesses,industry, environment and communities that depend on water for their continued development. The mainpolicy objective of the NWQMS is to achieve sustainable use of water resources, by protecting andenhancing their quality, while maintaining economic and social development.
The NWQMS includes water quality guidelines that define desirable ranges and maximum levels for certainparameters that can be allowed (based on scientific evidence and judgement) for specific uses of waters orfor protection of specific values. They are generally set at a low level of contamination to offer long-term

17
WSP | Parsons BrinckerhoffProject No 2200540A
Surface Water Quality AssessmentHume Coal
protection of environmental values. The NWQMS water quality guidelines include the Australian and NewZealand Guidelines for Fresh and Marine Water Quality (ANZECC 2000) and the Australian Drinking WaterGuidelines (NHMRC 2011). The water quality objectives (WQOs) in the NWQMS guidelines have been usedalong with other data to set preliminary WQOs for the receiving environment of the project (refer Section6.4).
2.7 NSW Water Quality and River Flow Objectives
The NSW Water Quality and River Flow Objectives are the agreed environmental values and long-term goalsfor NSW's surface waters. They set out:
à the community's values and uses for our rivers, creeks, estuaries and lakes (i.e. healthy aquatic life,water suitable for recreational activities like swimming and boating, and drinking water); and
à a range of water quality indicators to help us assess whether the current condition of our waterwayssupports those values and uses.
At the time the water quality and river flow objectives were approved by the NSW government (September1999) the Healthy Rivers Commission (HRC) had completed public inquiries for the Hawkesbury-Nepeanriver catchment. The HRC recommended water quality objectives in its final report for the catchment.Government confirmed these objectives in its response to the reports in Statements of Intent.
2.8 Healthy Rivers Commission Inquiry into the Hawkesbury-Nepean River
The HRC was established in 1995 to make recommendations to government on:
à suitable objectives for water quality, flows and other goals central to achieving ecologically sustainabledevelopment in a realistic time frame;
à the known or likely views of stakeholder groups on the recommended objectives;
à the economic and environmental consequences of the recommended objectives; and
à strategies, instruments and changes in management practices needed to implement the recommendedobjectives.
The HRC conducted independent public inquiries for selected rivers, including for the Hawkesbury-NepeanRiver, to assist the community to consider the options that are available in terms of river health and the useof river resources for commercial and recreational purposes. The findings of the inquiries are provided in thereport Healthy Rivers Commission Inquiry into the Hawkesbury-Nepean River (HRC 1998).
The report details the environmental values of the catchment, which are the values that the communityconsiders important for water use (HRC 1998). The environmental values adopted by the HRC for theHawkesbury-Nepean River catchment are the environmental values that have been adopted for the HumeCoal Project. These are discussed in Section 4.
The report recommends that the ANZECC guidelines be adopted as suitable WQOs for the Hawkesbury-Nepean River catchment, with the exception of nutrients and chlorophyll-a. Catchment specific WQOs areprovided for total nitrogen (TN), total phosphorous (TP) and chlorophyll-a because these parameterspromote algal growth. Management of blue-green algae is one of the most important issues in the Sydneydrinking water catchment as blue-green algae can release toxins into the water.
The Hawkesbury-Nepean catchment specific WQOs for nutrients and chlorophyll-a are provided in Table 2.1.These WQOs, together with the WQOs for other parameters in the ANZECC guidelines and other data, havebeen used to set preliminary WQOs for the receiving environment of the project (refer Section 6).

18
Surface Water Quality AssessmentHume Coal
WSP | Parsons BrinckerhoffProject No 2200540A
Table 2.1 HRC recommended WQOs for nutrients (µg/L)
WATER QUALITYINDICATOR
FORESTEDAREAS ANDDRINKINGWATERCATCHMENT
MIXED USERURAL AREASANDSANDSTONEPLATEAU
URBAN AREAS –MAIN STREAM
URBAN AREAS –TRIBUTARYSTREAM
ESTUARINEAREAS
Total nitrogen 700 700 500 ~1000 400
Total phosphorous 50 35 30 ~50 30
Chlorophyll-a 7 7 10 - 15 ~20 7
Source: Adopted from HRC (1998)
2.9 Australian and New Zealand Guidelines for Fresh and Marine Water Quality
The Australian and New Zealand Guidelines for Fresh and Marine Water Quality (ANZECC 2000) have beenprepared as part of the NWQMS. The guidelines provide a process for developing WQOs required to sustaincurrent or likely future environmental values for natural and semi-natural water resources. The processinvolves the following:
1. Identify the environmental values that are to be protected in a particular water body. Environmentalvalues (sometimes referred to as beneficial uses) are particular values or uses of the environment thatare important for a healthy ecosystem or for public benefit, welfare, safety or health and which requireprotection from the effects of pollution, waste discharges and deposits. The following environmentalvalues are recognised in the ANZECC guidelines:
§ aquatic ecosystems
§ primary industries (irrigation and general water uses, stock drinking water, aquaculture and humanconsumption of aquatic foods)
§ recreation and aesthetics
§ drinking water
§ industrial water
§ cultural and spiritual values
2. Identify management goals and then select the relevant water quality guidelines for measuringperformance. A water quality guideline is a numerical concentration limit or narrative statementrecommended to support and maintain a designated water use. Based on these guidelines, set waterquality objectives that must be met to maintain the environmental values. Water quality objectives arethe specific water quality targets agreed between stakeholders, or set by local jurisdictions, that becomethe indicators of management performance.
3. Develop statistical performance criteria to evaluate the results of the monitoring programs (e.g.statistical decision criteria for determining whether the water quality objectives have been exceeded ornot).
4. Develop tactical monitoring programs focusing on the water quality objectives.
5. Initiate appropriate management responses to attain (or maintain if already achieved) the water qualityobjectives.
The environmental values adopted for the project are provided in Section 4. The water quality guidelines forthe environmental values are provided in Table 2.2. Bold values are the most conservative guideline valuefor the parameter. The guidelines for physical and chemical stressors are those for south-east Australianupland rivers and streams for slightly disturbed ecosystems. The guidelines for other parameters are thosefor freshwater with a 95% level of protection. The water quality guidelines in Table 2.2 have been used toestablish the WQOs for the project (refer to Section 6).

19
WSP | Parsons BrinckerhoffProject No 2200540A
Surface Water Quality AssessmentHume Coal
2.10 Australian Drinking Water Guidelines
The Australian Drinking Water Guidelines (ADWG) (NHMRC 2011) provide a framework for goodmanagement of drinking water supplies that, if implemented, will assure safety at point of use. The ADWGhave been developed after consideration of the best available scientific evidence and are designed toprovide an authoritative reference on what defines safe, good quality water, how it can be achieved and howit can be assured.
Drinking water is defined as water intended primarily for human consumption, either directly, as suppliedfrom the tap, or indirectly, in beverages, ice or foods prepared with water. Drinking water is also used forother domestic purposes such as bathing and showering.
The safety of drinking water in public health terms is determined by its microbial, physical, chemical andradiological quality; of these, microbial quality is usually the most important. As conventional water treatmentmethods are not designed to remove some of these compounds from raw water, it is preferable to avoidthem in the raw water supply through catchment and storage management practices.
The ADWG include two different types of guideline value:
à a health-related guideline value, which is the concentration or measure of a water quality characteristicthat, based on present knowledge, does not result in any significant risk to the health of the consumerover a lifetime of consumption
à an aesthetic guideline value, which is the concentration or measure of a water quality characteristic thatis associated with acceptability of water to the consumer; for example, appearance, taste and odour.
The ADWG guideline values are provided in Table 2.2. The water quality guidelines in Table 2.2 have beenused to establish the WQOs for the project (refer to Section 6).
Table 2.2 ANZECC and ADWG water quality guidelines
PARAMETER UNIT ADWG (2011)HEALTH
ADWG (2011)AESTHETIC
ANZECCIRRIGATION
ANZECCLIVESTOCKDRINKING
ANZECCAQUATICECOSYSTEM
ANZECCRECREATION
PHYSICAL PARAMETERS
Conductivity µS/cm - - - - 30 - 350 -
Temperature °C - - - - - -
Turbidity NTU - 5 - - 2 - 25 -
pH pH units - 6.5 – 8.5 6.0 - 9.0 - 6.5 - 8.0 6.5 - 8.5
Total dissolvedsolids (TDS)
mg/L - 600 2,000 - -
Totalsuspendedsolids (TSS)
mg/L - - - - - -
NUTRIENTS
Ammonia as N mg/L - 0.5 - - 0.9 -
Nitrate (as N) mg/L - - - 400 0.7 10
Nitrite (as N) mg/L - - - 30 - 1

20
Surface Water Quality AssessmentHume Coal
WSP | Parsons BrinckerhoffProject No 2200540A
PARAMETER UNIT ADWG (2011)HEALTH
ADWG (2011)AESTHETIC
ANZECCIRRIGATION
ANZECCLIVESTOCKDRINKING
ANZECCAQUATICECOSYSTEM
ANZECCRECREATION
Total nitrogenas N
mg/L - - 5 - 0.25 -
Phosphorus mg/L - - 0.05 - 0.02 -
MAJOR IONS
Calcium mg/L - - - 1,000 - -
Chloride mg/L - 250 175 - - 400
Magnesium mg/L - - - 2,000 - -
Sodium mg/L - 180 115 - - 300
Sulfate as SO4 mg/L - 250 - 1,000 - 400
TOTAL METALS
Aluminium mg/L - 0.2 5 5 0.055 -
Antimony mg/L 0.003 - - - - -
Arsenic mg/L 0.01 - 0.1 0.5 0.013 0.05
Barium mg/L 2 - - - - 1
Beryllium mg/L 0.06 - 0.1 - - -
Boron mg/L 4 - 0.5 5 0.37 -
Cadmium mg/L 0.002 - 0.01 0.01 0.0002 0.005
Chromium mg/L 0.05 - 0.1 1 0.001 0.05
Cobalt mg/L - - 0.05 1 - -
Copper mg/L 2 1 0.2 0.4 0.0014 1
Iron mg/L - 0.3 0.2 - - 0.3
Lead mg/L 0.01 - 2 0.1 0.0034 0.05
Manganese mg/L 0.5 0.1 0.2 - 1.9 0.1
Mercury mg/L 0.001 - 0.002 0.002 0.0006 0.001
Molybdenum mg/L 0.05 - 0.01 0.15 - -
Nickel mg/L 0.02 - 0.2 1 0.011 0.1
Selenium mg/L 0.01 - 0.02 0.02 - -
Silver mg/L 0.1 - - - 0.00005 -
Zinc mg/L - 3 2 20 0.008 5
HYDROCARBONS
Benzene µg/L 1 - - - 950 -

21
WSP | Parsons BrinckerhoffProject No 2200540A
Surface Water Quality AssessmentHume Coal
PARAMETER UNIT ADWG (2011)HEALTH
ADWG (2011)AESTHETIC
ANZECCIRRIGATION
ANZECCLIVESTOCKDRINKING
ANZECCAQUATICECOSYSTEM
ANZECCRECREATION
Toluene µg/L 800 25 - - - -
Ethylbenzene µg/L 300 3 - - - -
Xylene µg/L 600 20 - - - -
Naphthalene µg/L - - - - 16 -Source:ANZECC (2000) and ADWG (2011)Guidelines for physical and chemical stressors are those for south-east Australian upland rivers and for slightly disturbed ecosystems.Bold guideline values denote the most stringent guideline value
2.11 WaterNSW Principles for Managing Mining and Coal Seam Gas Impacts inDeclared Catchment Areas
WaterNSW has an obligation to protect water quality, quantity and its infrastructure within its land andSydney drinking water catchments. WaterNSW has established a comprehensive governance framework toprotect water supply infrastructure and access conditions for mining activities via development of the reportWaterNSW Principles for Managing Mining and Coal Seam Gas Impacts in Declared Catchment Areas 2014(ie the WaterNSW Principles). The project is located within the Wingecarribee River, which is a DeclaredCatchment Area.
In applying the WaterNSW Principles, the Hume Coal Project must provide for the protection of water quality.WaterNSW considers that all mining activities should have a NorBE on water quality in Declared CatchmentAreas during construction, operation and rehabilitation stages. The surface facilities associated with miningactivities must be managed to either contain any pollutants on the site or transfer them offsite for appropriatetreatment and disposal. Mining activities must not result in a reduction in the quality of surface water inflowsto storages. Predicted impacts to surface water quality are presented in Section 5 of this report andsafeguards to prevent or minimise impacts are discussed in Section 6.
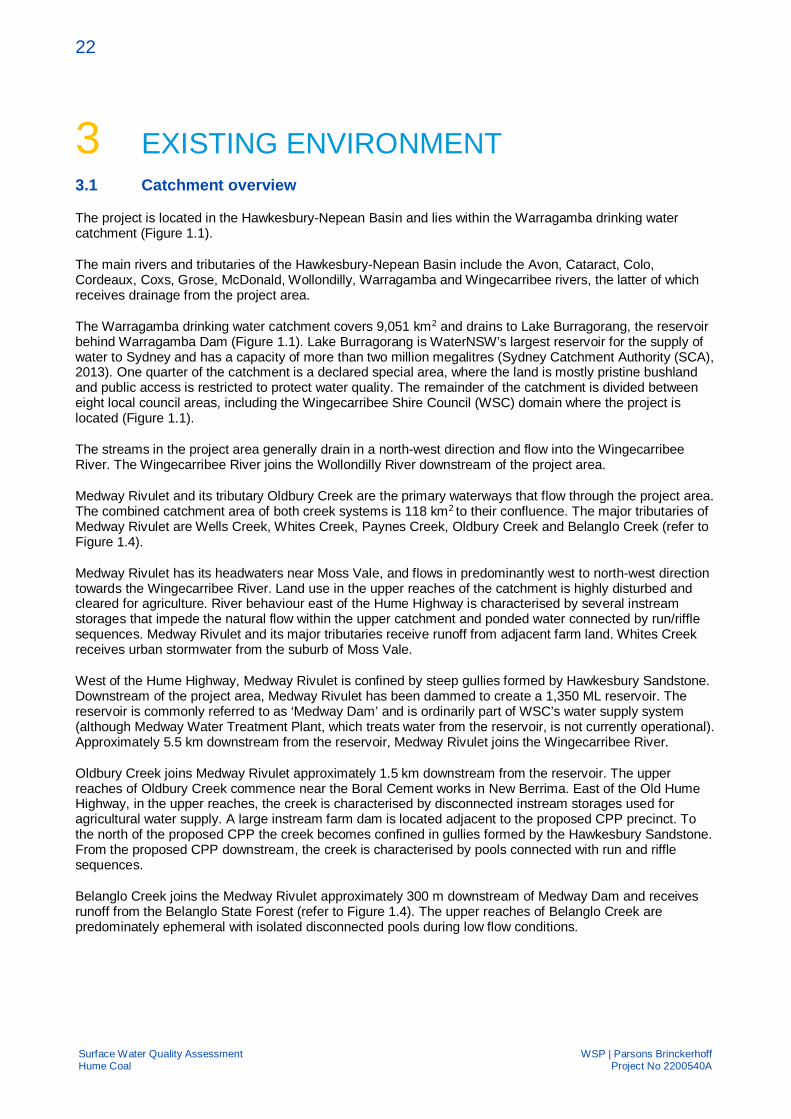
22
Surface Water Quality AssessmentHume Coal
WSP | Parsons BrinckerhoffProject No 2200540A
3 EXISTING ENVIRONMENT3.1 Catchment overview
The project is located in the Hawkesbury-Nepean Basin and lies within the Warragamba drinking watercatchment (Figure 1.1).
The main rivers and tributaries of the Hawkesbury-Nepean Basin include the Avon, Cataract, Colo,Cordeaux, Coxs, Grose, McDonald, Wollondilly, Warragamba and Wingecarribee rivers, the latter of whichreceives drainage from the project area.
The Warragamba drinking water catchment covers 9,051 km2 and drains to Lake Burragorang, the reservoirbehind Warragamba Dam (Figure 1.1). Lake Burragorang is WaterNSW’s largest reservoir for the supply ofwater to Sydney and has a capacity of more than two million megalitres (Sydney Catchment Authority (SCA),2013). One quarter of the catchment is a declared special area, where the land is mostly pristine bushlandand public access is restricted to protect water quality. The remainder of the catchment is divided betweeneight local council areas, including the Wingecarribee Shire Council (WSC) domain where the project islocated (Figure 1.1).
The streams in the project area generally drain in a north-west direction and flow into the WingecarribeeRiver. The Wingecarribee River joins the Wollondilly River downstream of the project area.
Medway Rivulet and its tributary Oldbury Creek are the primary waterways that flow through the project area.The combined catchment area of both creek systems is 118 km2 to their confluence. The major tributaries ofMedway Rivulet are Wells Creek, Whites Creek, Paynes Creek, Oldbury Creek and Belanglo Creek (refer toFigure 1.4).
Medway Rivulet has its headwaters near Moss Vale, and flows in predominantly west to north-west directiontowards the Wingecarribee River. Land use in the upper reaches of the catchment is highly disturbed andcleared for agriculture. River behaviour east of the Hume Highway is characterised by several instreamstorages that impede the natural flow within the upper catchment and ponded water connected by run/rifflesequences. Medway Rivulet and its major tributaries receive runoff from adjacent farm land. Whites Creekreceives urban stormwater from the suburb of Moss Vale.
West of the Hume Highway, Medway Rivulet is confined by steep gullies formed by Hawkesbury Sandstone.Downstream of the project area, Medway Rivulet has been dammed to create a 1,350 ML reservoir. Thereservoir is commonly referred to as ‘Medway Dam’ and is ordinarily part of WSC’s water supply system(although Medway Water Treatment Plant, which treats water from the reservoir, is not currently operational).Approximately 5.5 km downstream from the reservoir, Medway Rivulet joins the Wingecarribee River.
Oldbury Creek joins Medway Rivulet approximately 1.5 km downstream from the reservoir. The upperreaches of Oldbury Creek commence near the Boral Cement works in New Berrima. East of the Old HumeHighway, in the upper reaches, the creek is characterised by disconnected instream storages used foragricultural water supply. A large instream farm dam is located adjacent to the proposed CPP precinct. Tothe north of the proposed CPP the creek becomes confined in gullies formed by the Hawkesbury Sandstone.From the proposed CPP downstream, the creek is characterised by pools connected with run and rifflesequences.
Belanglo Creek joins the Medway Rivulet approximately 300 m downstream of Medway Dam and receivesrunoff from the Belanglo State Forest (refer to Figure 1.4). The upper reaches of Belanglo Creek arepredominately ephemeral with isolated disconnected pools during low flow conditions.

23
WSP | Parsons BrinckerhoffProject No 2200540A
Surface Water Quality AssessmentHume Coal
3.2 Climate data
The water quality assessment used outputs from the modelling undertaken for the water balanceassessment (Parsons Brinckerhoff 2016b) and flow and geomorphology assessment (Parsons Brinckerhoff2016a) to assess the potential impacts of the project on water quality. The climate data used for the waterbalance and flow modelling analyses was based on historical daily data sourced from the Data Drill database(DSITIA 2015).
Data Drill is a daily time series of data at a point location consisting entirely of interpolated estimates. Thedata are taken from the gridded datasets and are available at any grid point over the land area of Australia.Data Drill is considered superior to individual Bureau of Meteorology (BOM) station records and siteobservations for water balance modelling purposes because it draws on a greater dataset, both spatially andin time, and does not contain gaps.
The Data Drill for the water balance assessment was obtained for latitude -34.50 and longitude 150.30 (indecimal degrees), which is 0.5 km north of SB01 and SB02. Figure 3.1 shows the Data Drill location andBOM rain gauges located around the Medway Rivulet and Oldbury Creek catchments. The available data forthe Data Drill location is for a 127 year period from 1889 to 2015.
A plot of the Data Drill annual rainfall is provided in Figure 3.2. This plot also contains a 10-year movingaverage time series, which identifies the period from 1949 to1969 as the wettest period. Similarly the periodfrom 1999 to 2015 appears to be one of the sustained dry periods.
A plot of monthly distribution of average daily evaporation from the Data Drill for the site is provided inFigure 3.3. Lake evaporation data was used in the water balance assessment to estimate evaporation fromstorages and evapotranspiration data was used for other areas. In the project area, lake evaporation andevapotranspiration is lowest in winter months and highest in summer months.
Summary statistics for rainfall and evaporation are provided in Table 3.1. Further details of the climate dataused for the water balance assessment are provided in the water balance assessment report (ParsonsBrinckerhoff 2016b).
Table 3.1 Summary climate statistics for Hume Coal Project site — Data Drill (1889 to 2015)
STATISTIC ANNUAL RAINFALL(MM)
ANNUAL POTENTIALEVAPOTRANSPIRATION1
(MM)
ANNUAL LAKEEVAPORATION2
(MM)
Minimum 393 878 1,034
5th percentile (dry) 525 930 1,095
10th percentile 564 946 1,114
50th percentile (median) 800 1,016 1,190
90th percentile 1,120 1,109 1,264
95th percentile (wet) 1,256 1,122 1,275
Maximum 1,550 1,180 1,306
Average 824 1,021 1,187
Standard deviation 220 60 57

#*
#*
#*
#*#*
#*
#*
#*
#*#*
#*
#*
!(!(
BERRIMA WEST
BUNDANOON(BALLYMENA)
MOSS VALE(TOROKINA)
EXETER
SUTTON FOREST(ELING FOREST)
SUTTON FOREST(URALBA)
SUTTON FOREST(CHERRY TREE
HILL)
MOSS VALEBELANGLO
STATEFOREST
MOSS VALE AWS
BERRIMA WESTPOST OFFICE BERRIMA
(HILLVIEW)
NEW BERRIMA
EXETER
SUTTONFOREST
GLENQUARRY
AVOCA
BURRADOO
BOWRAL
BERRIMAMEDWAY
CANYONLEIGH
BUNDANOON
FITZROYFALLS
HUME HIGHWAY
MOSS
VALE
ROAD
SALLYS CORNER ROAD
TOURIST ROA D
KANGALOON ROAD
ILLAWARRAHIGHWAY
OLDSOUTH RO
AD
CENTENNIAL
ROAD
BERRIMAROA
D
BOWRAL ROAD
CANYONLEIGH ROAD
HUME MOTORWAY
EXET
ERRO
AD
RANGEROAD
OLD HUME HIGHWAY
NOWRA
ROAD
SHEE
PWAS
HRO
AD
BUNDANOON
ROAD
GREE
NHILLS
ROAD
NATT
AIRIV
ER
FITZR
OYCA
NAL
MAND
EMAR
CREEK
ROCK
YCRE
E K
BARONGACREEK
RED ARMCREEK
SCHO
OL
CR EEK
INDIGOCREEK YARRUNGACREEK
REEDY CREEK
HANGING ROCK SWA
MP
STONY CREE
K
STONE
QUAR
RYCR
EEK
JACKEY JACKEYSCREEK
COLY ERS CREEK
NANDI CREEK
LONGACRECREEK
WHITES CREE K
BANGADILLY CREEKCORDEAUX CREEK
PIVETS CREEK
WE LLS CREEK
WOLL
ON
DILLY RIVE
R
EMUCREEK
MITTA GONG CREEKKE LLYS CREEK
BUNDANOON CRE EK
LONG SWAMPCREEK
PADDYSRIVER
BLACKBOBSCREEK
WINGECARRIBEE RIVER
ME D WAYDA M
240000 250000 260000 27000061
7000
0
6170
000
6180
000
6180
000
Legend!( Data drill location
#* BOM rainfall station (open)
#* BOM rainfall station (closed)
Rail line
Main road
Natural drainage line
Hume Coal Project area
Waterbody
Temporary constructionaccommodation villageSurface infrastructure footprint
Construction buffer zone
Elevation (mAHD)866m
259m
!(
!(
!(
!(
!(
!(
NOWRA
SYDNEYCAMDENPICTON
MOSS VALE
0 2,000 4,000
m
Approved by: LRDate: 21/10/2016
Map: 2200540A_GIS_071_A1 Author: RP
Hume Coal Surface Water Quality AssessmentFigure 3.1
Climate data
1:100,000
Coordinate system: GDA 1994 MGA Zone 56
Scale ratio correct when printed at A3
°
\\APSYDFIL03\proj\H\HUME_COAL_PTY_LTD\2200540A_HUME_SURFACE_WATER_EIS\10_GIS\Projects\Maps2200540A_GIS_071_A1.mxd Hume Coal
© WSP l Parsons Brinckerhoff - Asia Pacific (WSP l PB) Copyright in the drawings, information and data recorded is the property of WSP l PB. This document and the information are solely for the use of the authorisedrecipient and this document may not be used, copied or reproduced in whole or part for any purpose other than that which it was supplied by WSP l PB. WSP l PB makes no representation, undertakes no duty and acceptsno responsibility to any third party who may use or rely upon this document or the information. NCSI Certified Quality System to ISO 9001. © APPROVED FOR AND ON BEHALF OF© WSP l Parsons Brinckerhoff - Asia Pacific.
Data source: , Hume Coal, Google Earth
www.wsp-pb.com

25
WSP | Parsons BrinckerhoffProject No 2200540A
Surface Water Quality AssessmentHume Coal
Figure 3.2 Annual rainfall for Hume Coal Project site — Data Drill (1889 to 2015)
Figure 3.3 Average daily evaporation data – Data Drill (1889 to 2015)

26
Surface Water Quality AssessmentHume Coal
WSP | Parsons BrinckerhoffProject No 2200540A
3.3 Streamflow
Medway Rivulet and its tributary Oldbury Creek are the primary waterways that flow through the project area.Stream gauging stations in the vicinity of the project area are operated by WaterNSW and Hume Coal. Thelocations of the stream gauges are shown on Figure 3.4 and listed in Table 3.2.
Table 3.2 Stream gauge locations
MANAGEMENT ZONE STREAM HUME COAL MONITORINGLOCATIONS
WATERNSW MONITORINGLOCATIONS
Medway Rivulet Medway Rivulet SW03, SW04
Oldbury Creek SW08
Wells Creek and WellsCreek Tributary
SW06, SW07, SW11, SW12
Planting Spade Creek SW10
Lower Wingecarribee River Wingecarribee River 212031, 212272, 212009
Black Bobs Creek SW01, SW02
Lower Wollondilly River Long Swamp Creek SW05
The natural flow regimes of streams in the project area are highly disturbed as the catchments have beenextensively cleared for agriculture and multiple instream storages, which impede the natural flow, have beenconstructed along the length of the streams. The flow characteristics are discussed in detail in the WaterBalance Assessment Report (Parsons Brinckerhoff 2016a).
The groundwater level in the project area is typically higher than the beds of streams, hence the streams inthe area receive baseflow from groundwater. During dry conditions this manifests as persistent unconnectedor connected pools.

#*
#*
#*
#
#
#
#
#
#
#
#
#
#
#
*
*
*
*
*
*
*
*
*
*
*
WINGEC A RRIB
EE RIVER
WELLS
CREE
KTR
IBUT
ARY Upper
WingecarribeeRiver Management Zone
BundanoonCreek Management
Zone
LowerWingecarribee RiverManagement Zone
Nattai RiverManagement
Zone
Lower WollondillyRiver Management
Zone
Medway RivuletManagement
Zone
MaguiresCrossing
Management Zone
INDIGO
CREEK
ST PAULS CREEK
ROCK
YCR E
EK
ISLAN
DCR
EEK
KELLS CREEK
RED ARMCREEK
GIBB
ERGUNYAH C R EE
K
BELANG LO CREEK
SCHOTTS C RE EK
STONY CR
EEK
BURGA NGLO CREEK
JACKEY JACKEYSCREEK
COLYE
RSCR
EEK
NANDI CREEK
LONGACRECREEK
WHITES CREEK
CORDEAUXCR EEK
PIVETS CREEK
OLDBURY CREEK
MAND
EMAR
CREEK
BAN GADILLY CREEK
PADD
YSRI
VER
NATTAI CREEK
BU
NDANOONCREEK
NATT
AIRIV
E R
WELL
SCR
EEK
EMUCREEK
KE LLYS CREEK
MITT
AG ONGC
REEK
LONG SWAMPCREEK
WOLL
ONDIL
LY
RIVER
MEDWAY RIVULET
BLACKBOBS CREEK
SW01
SW03
SW04
SW05
SW06
SW07
SW08
SW10
SW11
SW12
SW02
NEW BERRIMA
MOSSVALE
EXETER
SUTTON FOREST
BURRADOO
BOWRAL
MITTAGONG
BRAEMARWILLOW VALE
WELBY
BERRIMA
MEDWAY
CANYONLEIGHME D WA
YDA M
MOSS VALE UNANDERRA RAILWAY
RAILWAY
MAI
N S
OU
THE
RN
RA
ILW
AY
212031
212272
212009
230000 235000 240000 245000 250000 255000 260000 26500061
6500
0
6165
000
6170
000
6170
000
6175
000
6175
000
6180
000
6180
000
6185
000
6185
000
Legend#* WaterNSW stream gauge#* Hume Coal stream gauge
Rail lineRoadNatural drainage lineHume Coal Project areaWSP management zoneWaterbody
!(
!(
!(
!(
!(
!(
NOWRA
SYDNEYCAMDENPICTON
MOSS VALEWOLLONGONG
1:100,000
0 1,500 3,000
m°Coordinate system: GDA 1994 MGA Zone 56
Approved by: LRDate: 21/10/2016
Map: 2200540A_GIS_065_A2 Author: RP
www.wsp-pb.com
Scale ratio correct when printed at A3
© Parsons Brinckerhoff Australia Pty Ltd ("PB") Copyright in the drawings, information and data recorded ("the information") is the property of PB. This document and the information are solely for the use of the authorised recipient and thisdocument may not be used, copied or reproduced in whole or part for any purpose other than that which it was supplied by PB. PB makes no representation, undertakes no duty and accepts no responsibility to any third party who may useor rely upon this document or the information. NCSI Certified Quality System to ISO 9001. © APPROVED FOR AND ON BEHALF OF Parsons Brinckerhoff Australia Pty Ltd.
Hume Coal\\APSYDFIL03\proj\H\HUME_COAL_PTY_LTD\2200540A_HUME_SURFACE_WATER_EIS\10_GIS\Projects\Maps2200540A_GIS_065_A2.mxd
Data source: NSW Land and Property Information 2015, Hume Coal
Hume Coal Surface Water Quality AssessmentFigure 3.4
Stream gauge locations

28
Surface Water Quality AssessmentHume Coal
WSP | Parsons BrinckerhoffProject No 2200540A
3.4 Baseline surface water quality
Hume Coal has been undertaking surface water quality monitoring in the project area since April 2012. Themonitoring program is ongoing to establish baseline surface water quality conditions prior to mining.Monitoring is undertaken monthly at the locations shown on Figure 3.5 and listed in Table 3.3. Details of themonitoring program and locations are provided in the Water Fieldwork and Monitoring Report (ParsonsBrinckerhoff 2016c).
WaterNSW also undertakes surface water quality monitoring in the project area. Monitoring has beenundertaken at locations on the Wingecarribee River and Wollondilly River since April 2002. The locations areshown on Figure 3.5 and listed in Table 3.3.
Table 3.3 Surface water quality monitoring locations
MANAGEMENT ZONE STREAM HUME COAL MONITORINGLOCATIONS
WATERNSW MONITORINGLOCATIONS
Medway Rivulet Medway Rivulet SWQ03, SWQ04, SWQ15*
Oldbury Creek SWQ17, SWQ19, SWQ20^,SWQ21^, SWQ22^
Wells Creek and WellsCreek Tributary
SWQ05, SWQ12, SWQ24,SWQ25
Whites Creek SWQ14
Belanglo Creek and PlantingSpade Creek
SWQ06, SWQ23
Lower Wingecarribee River Wingecarribee River E332
Black Bobs Creek SWQ01, SW02, SWQ02,SWQ07
Longacre Creek SWQ11
Stony Creek SWQ16
Lower Wollondilly River Wollondilly River E450
Long Swamp Creek andHanging Rock Swamp Creek
SWQ08, SWQ10
Bundanoon Creek Indigo Creek SWQ13* Monitoring location at Medway Dam^ Monitoring locations on farm dams on Oldbury Creek

")
")!
!!
!
(
((
(
#
#
#
#
#
#
#
#
#
# #
##
###
#
##
*
*
*
*
*
*
*
*
*
* *
**
***
*
**
WINGEC A RRIB
EE RIVER
WELLS
CREE
KTR
IBUT
ARY Upper
WingecarribeeRiver Management Zone
BundanoonCreek Management
Zone
LowerWingecarribee RiverManagement Zone
Nattai RiverManagement
Zone
Lower WollondillyRiver Management
Zone
Medway RivuletManagement
Zone
MaguiresCrossing
Management Zone
INDIGO
CREEK
ST PAULS CREEK
ROCK
YCR E
EK
ISLAN
DCR
EEK
KELLS CREEK
RED ARMCREEK
GIBB
ERGUNYAH C R EE
K
BELANG LO CREEK
SCHOTTS C RE EK
STONY CR
EEK
BURGA NGLO CREEK
JACKEY JACKEYSCREEK
COLYE
RSCR
EEK
NANDI CREEK
LONGACRECREEK
WHITES CREEK
CORDEAUXCR EEK
PIVETS CREEK
OLDBURY CREEK
MAND
EMAR
CREEK
BAN GADILLY CREEK
PADD
YSRI
VER
NATTAI CREEK
BU
NDANOONCREEK
NATT
AIRIV
E R
WELL
SCR
EEK
EMUCREEK
KE LLYS CREEK
MITT
AG ONGC
REEK
LONG SWAMPCREEK
WOLL
ONDIL
LY
RIVER
MEDWAY RIVULET
BLACKBOBS CREEK
SWQ01
SWQ02
SWQ03
SWQ04
SWQ05SWQ06
SWQ11
SWQ12
SWQ14
SWQ15 SWQ16
SWQ17SWQ19
SWQ20
SWQ21SWQ22
SWQ23SWQ24
SWQ25
SW02
SWQ07SWQ08 SWQ13
NEW BERRIMA
MOSSVALE
EXETER
BURRADOO
BOWRAL
MITTAGONG
BRAEMARWILLOW VALE
WELBY
BERRIMA
MEDWAY
CANYONLEIGH
MOSS VALE UNANDERRA RAILWAY
RAILWAY
MAI
N S
OU
THE
RN
RA
ILW
AY
E332
E450
230000 235000 240000 245000 250000 255000 260000 26500061
6500
0
6165
000
6170
000
6170
000
6175
000
6175
000
6180
000
6180
000
6185
000
6185
000
Legend#*
Hume Coal surface water qualitymonitoring location
!(Former Hume Coal surface waterquality monitoring location
")WaterNSW surface water qualitymonitoring locationRail lineRoadNatural drainage line
WSP management zoneHume Coal Project areaWaterbody
!(
!(
!(
!(
!(
!(
NOWRA
SYDNEYCAMDENPICTON
MOSS VALEWOLLONGONG
1:100,000
0 1,500 3,000
m°Coordinate system: GDA 1994 MGA Zone 56
Approved by: LRDate: 14/11/2016
Map: 2200540A_GIS_066_A2 Author: RP
www.wsp-pb.com
Scale ratio correct when printed at A3
Hume Coal\\APSYDFIL03\proj\H\HUME_COAL_PTY_LTD\2200540A_HUME_SURFACE_WATER_EIS\10_GIS\Projects\Maps2200540A_GIS_066_A2.mxd
Data source: NSW Land and Property Information 2015, Hume Coal
© WSP l Parsons Brinckerhoff - Asia Pacific (WSP l PB) Copyright in the drawings, information and data recorded is the property of WSP l PB. This document and the information are solely for the use of the authorisedrecipient and this document may not be used, copied or reproduced in whole or part for any purpose other than that which it was supplied by WSP l PB. WSP l PB makes no representation, undertakes no duty and acceptsno responsibility to any third party who may use or rely upon this document or the information. NCSI Certified Quality System to ISO 9001. © APPROVED FOR AND ON BEHALF OF© WSP l Parsons Brinckerhoff - Asia Pacific.
Hume Coal Surface Water Quality AssessmentFigure 3.5
Surface water quality monitoring locations

30
Surface Water Quality AssessmentHume Coal
WSP | Parsons BrinckerhoffProject No 2200540A
A summary of baseline surface water quality conditions in Medway Rivulet and Oldbury Creek for the periodApril 2012 to September 2015 is provided in Table 3.4. Results have been presented as summary statisticsfor monitoring locations SWQ03, SWQ04 and SWQ15 on Medway Rivulet, and SWQ17, SWQ19, SWQ20,SWQ21 and SWQ22 on Oldbury Creek.
Summary statistics of baseline surface water quality conditions for the monitoring locations in Table 3.3 areprovided in Appendix A. Results presented for metals are dissolved concentrations.
The Medway Rivulet and Oldbury Creek results have been compared to the most conservative water qualityguideline values for the environmental values in the project area (Section 4.1), with the exception of nutrientswhich have been compared to the recommended WQOs in the report Healthy Rivers Commission Inquiryinto the Hawkesbury-Nepean River (HRC 1998). Median and 80th percentile concentrations that exceedguideline values are shaded in grey in Table 3.4. Where more than half or more than 80% of samplesreturned lower than the laboratory detection limit, then the below laboratory detection limit has been noted forthe median or 80th percentile values.
Baseline concentrations of key water quality parameters in Medway Rivulet and Oldbury Creek comply withguideline values with the exception of the following:
à Median and 80th percentile electrical conductivity values for Medway Rivulet and Oldbury Creek exceedthe ANZECC (2000) guideline for aquatic ecosystems
à Median and 80th percentile concentrations of nitrogen and phosphorous in Medway Rivulet and OldburyCreek exceed the WQOs recommended by the Healthy Rivers Commission (HRC 1998)
à 80th percentile concentrations of aluminium in Medway Rivulet and Oldbury Creek exceed the ANZECC(2000) guideline for aquatic ecosystems
à 80th percentile concentrations of copper in Medway Rivulet exceed the ANZECC (2000) guideline foraquatic ecosystems
à Median and 80th percentile concentrations of iron in Medway Rivulet and Oldbury Creek exceed theANZECC (2000) guideline for irrigation
à 80th percentile concentrations of manganese in Medway Rivulet and Oldbury Creek exceed theANZECC (2000) guideline for recreation
à Median and 80th percentile concentrations of silver in Oldbury Creek exceed the ANZECC (2000)guideline for aquatic ecosystems.
Site specific WQOs will be developed for these parameters. This is discussed in Section 6.4.4.

31
WSP | Parsons BrinckerhoffProject No 2200540A Surface Water Quality Assessment
Hume Coal
Table 3.4 Baseline surface water quality conditions in the project area
PARAMETER UNIT GUIDELINE MEDWAY RIVULET OLDBURY CREEK
NO. OFSAMPLES
MIN MEDIAN 80TH %ILE MAX NO. OFSAMPLES
MIN MEDIAN 80TH %ILE MAX
Physical parameters
Conductivity µS/cm 35 – 350 90 116 434 613 910 39 178 456 571 1060
Temperature °C - 87 7.1 15 20 27 37 8.8 12 19 26
Turbidity NTU 2 - 25 87 1.4 5.4 9.6 37 39 1.7 6.5 12 57
pH pHunits
6.5 - 8.0 90 5.7 7.2 6.8 (20th%ile)7.6 (80th %ile)
8.0 39 5.0 7.4 7.0 (20th%ile)7.8 (80th %ile)
9.2
TDS mg/L 600 88 75 292 396 502 39 116 287 366 480
TSS mg/L - 91 <5 5.0 9.0 51 39 2.0 5.0 9.0 34
Nutrients
Ammonia as N mg/L 0.5 91 <0.01 0.02 0.04 0.11 39 <0.01 0.04 0.12 0.42
Nitrate (as N) mg/L 0.7 91 <0.01 0.03 0.11 0.89 39 <0.01 0.09 0.66 2.6
Nitrite (as N) mg/L 1.0 91 <0.01 0.01 0.01 0.05 39 <0.01 <0.01 0.03 0.11
Total nitrogen asN
mg/L 0.5* 91 0.40 0.80 1.1 1.9 39 0.6 1.2 2.1 4.4
Phosphorus mg/L 0.03* 91 <0.01 0.04 0.08 0.26 39 <0.01 0.07 0.12 0.18
Major ions
Calcium mg/L 1,000 91 5 23 32 42 39 14 23 40 48
Chloride mg/L 175 91 22 62 96 137 39 35 55 66 112
Magnesium mg/L 2,000 91 4 14 23 38 39 7.0 9.0 13 21

32
Surface Water Quality AssessmentHume Coal
WSP | Parsons BrinckerhoffProject No 2200540A
PARAMETER UNIT GUIDELINE MEDWAY RIVULET OLDBURY CREEK
NO. OFSAMPLES
MIN MEDIAN 80TH %ILE MAX NO. OFSAMPLES
MIN MEDIAN 80TH %ILE MAX
Sodium mg/L 115 91 8 36 54 87 39 20 37 50 75
Sulfate as SO4 mg/L 250 91 <1 10 27 86 39 5.0 27 73 138
Dissolved metals
Aluminium mg/L 0.055 91 <0.01 0.02 0.12 0.66 39 <0.01 0.04 0.12 0.32
Antimony mg/L 0.003 45 <0.001 <0.001 <0.001 <0.001 39 <0.001 <0.001 <0.001 <0.001
Arsenic mg/L 0.01 91 <0.001 <0.001 0.001 0.002 39 <0.001 <0.001 <0.001 0.001
Barium mg/L 1.0 91 0.02 0.05 0.07 0.10 39 0.01 0.04 0.04 0.07
Beryllium mg/L 0.06 88 <0.001 <0.001 <0.001 <0.001 39 <0.001 <0.001 <0.001 <0.001
Boron mg/L 0.37 45 <0.05 <0.05 <0.05 <0.05 39 <0.05 <0.05 <0.05 0.05
Cadmium mg/L 0.0002 91 <0.0001 <0.0001 <0.0001 0.0001 39 <0.0001 <0.0001 <0.0001 <0.0001
Chromium mg/L 0.001 91 <0.001 <0.001 <0.001 0.001 39 <0.001 <0.001 <0.001 <0.001
Cobalt mg/L 0.05 91 <0.001 <0.001 <0.001 0.003 39 <0.001 <0.001 <0.001 0.003
Copper mg/L 0.0014 91 <0.001 <0.001 0.002 0.005 39 <0.001 0.001 0.001 0.002
Iron mg/L 0.2 91 <0.05 0.26 0.51 1.2 39 0.06 0.22 0.35 0.57
Lead mg/L 0.0034 91 <0.001 <0.001 <0.001 <0.001 39 <0.001 <0.001 <0.001 <0.001
Manganese mg/L 0.1 91 <0.001 0.04 0.14 2.5 39 0.007 0.06 0.13 2.2
Mercury mg/L 0.0006 50 <0.0001 <0.0001 <0.0001 <0.0001 1 <0.0001 N/A N/A <0.0001
Molybdenum mg/L 0.01 45 <0.001 <0.001 <0.001 <0.01 39 <0.001 <0.001 <0.001 0.001
Nickel mg/L 0.011 91 <0.001 0.002 0.003 0.005 39 <0.001 <0.001 0.002 0.002

33
WSP | Parsons BrinckerhoffProject No 2200540A Surface Water Quality Assessment
Hume Coal
PARAMETER UNIT GUIDELINE MEDWAY RIVULET OLDBURY CREEK
NO. OFSAMPLES
MIN MEDIAN 80TH %ILE MAX NO. OFSAMPLES
MIN MEDIAN 80TH %ILE MAX
Selenium mg/L 0.01 45 <0.01 <0.01 <0.01 <0.01 39 <0.01 <0.01 <0.01 0.01
Silver^ mg/L 0.00005 54 <0.001 <0.001 <0.01 0.02 7 <0.001 0.02 N/A 0.02
Zinc mg/L 0.008 91 <0.005 <0.005 <0.005 0.009 39 <0.005 0.005 0.01 0.03
Hydrocarbons
Benzene µg/L 1 91 <1 <1 <1 <20 39 <1 <1 <1 <1
Toluene µg/L 25 91 <2 <2 <2 <50 39 <2 <2 <2 <2
Ethylbenzene µg/L 3 91 <2 <2 <2 <100 39 <2 <2 <2 <2
Total xylene µg/L 20 91 <2 <2 <2 <20 39 <2 <2 <2 <2
Naphthalene µg/L 16 91 <5 <5 <5 <100 39 <5 <5 <5 <5*WQO recommended by Healthy Rivers Commission Inquiry into the Hawkesbury-Nepean River (HRC 1998).^ Standard and trace laboratory limits of reporting exceed the ANZECC guideline for aquatic ecosystems.Grey shaded cells indicate median and 80th percentile concentrations that exceed guideline values.Where results are less than laboratory limit of reporting (<LOR), the statistics have been calculated using the LOR value.

34
Surface Water Quality AssessmentHume Coal
WSP | Parsons BrinckerhoffProject No 2200540A
This section presents ‘box-and-whisker’ plots for key contaminants. Box-and-whisker plots are helpful ininterpreting the distribution of data. The first and third quartiles are at the ends of the box, the median isindicated with a vertical line in the interior of the box, and the maximum and minimum are at the ends of thewhiskers. The number in the middle of the box represents the number of data points used.
Box and whisker plots of TDS concentrations in streams in the project area are presented in Figure 3.6. Theresults show that all streams in the project area are fresh, with TDS less than 500 mg/L. Belanglo Creek,Planting Spade Creek, Longacre Creek, Long Swamp Creek and Hanging Rock Swamp Creek were fresherthan other streams in the project area with TDS generally less than 100 mg/L.
Box and whisker plots of TSS concentrations in streams in the project area are presented in Figure 3.7. TSSconcentrations were generally less than 20 mg/L. TSS was highest in Indigo Creek and lowest in BelangloCreek, Planting Spade Creek, Long Swamp Creek and Hanging Rock Swamp Creek.
Box and whisker plots of pH in streams in the project area are presented in Figure 3.8. pH was generallywithin the range 5.5 to 8.0. pH was higher in streams draining agricultural land (eg Medway Rivulet, OldburyCreek and Stony Creek) and lower in streams draining natural or forested catchments (eg Belanglo Creek,Planting Spade Creek, Longacre Creek, Long Swamp Creek and Hanging Rock Swamp Creek). pH wasbelow the lower guideline value for pH of 6.0 in some of the streams draining natural or forested catchments.
Box and whisker plots of TN concentrations in streams in the project area are presented in Figure 3.9. Totalnitrogen concentrations were generally higher in streams draining agricultural land (eg Whites Creek,Oldbury Creek and Stony Creek) and lower in streams draining natural or forested catchments (eg BelangloCreek, Planting Spade Creek, Long Swamp Creek and Hanging Rock Swamp Creek). TN concentrationsgenerally exceeded the HRC guideline value of 0.5 mg/L except in the streams draining natural or forestedcatchments (Belanglo Creek, Planting Spade Creek, Long Swamp Creek and Hanging Rock Swamp Creek).
Box and whisker plots of TP concentrations in streams in the project area are presented in Figure 3.10. TPconcentrations in Stony Creek and Indigo Creek were higher than in other streams in the project area. TPconcentrations were lowest in Belanglo Creek, Planting Spade Creek, Long Swamp Creek and HangingRock Swamp Creek. Total phosphorous concentrations generally exceeded the HRC guideline value of0.035 mg/L.

35
WSP | Parsons BrinckerhoffProject No 2200540A
Surface Water Quality AssessmentHume Coal
Figure 3.6 Baseline concentrations of total dissolved solids
Blac
kBo
bsC
reek
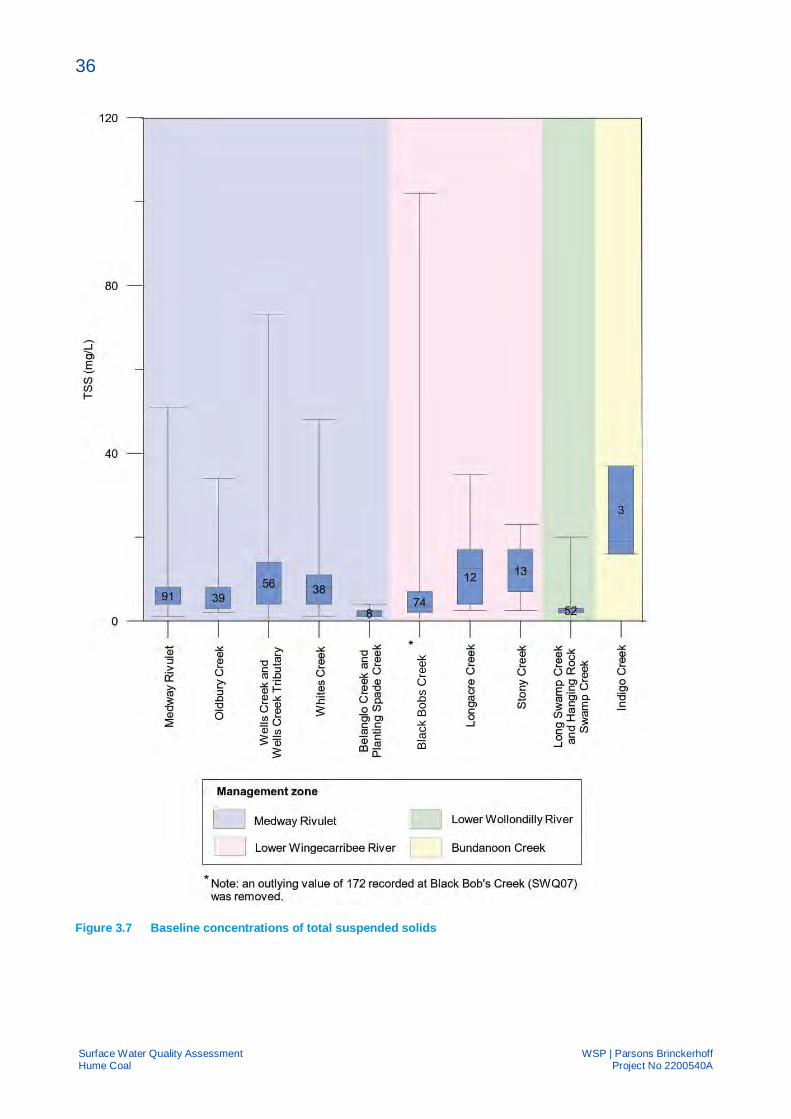
36
Surface Water Quality AssessmentHume Coal
WSP | Parsons BrinckerhoffProject No 2200540A
Figure 3.7 Baseline concentrations of total suspended solids
Blac
kBo
bsC
reek

37
WSP | Parsons BrinckerhoffProject No 2200540A
Surface Water Quality AssessmentHume Coal
Figure 3.8 Baseline concentrations of pH
Blac
kBo
bsC
reek
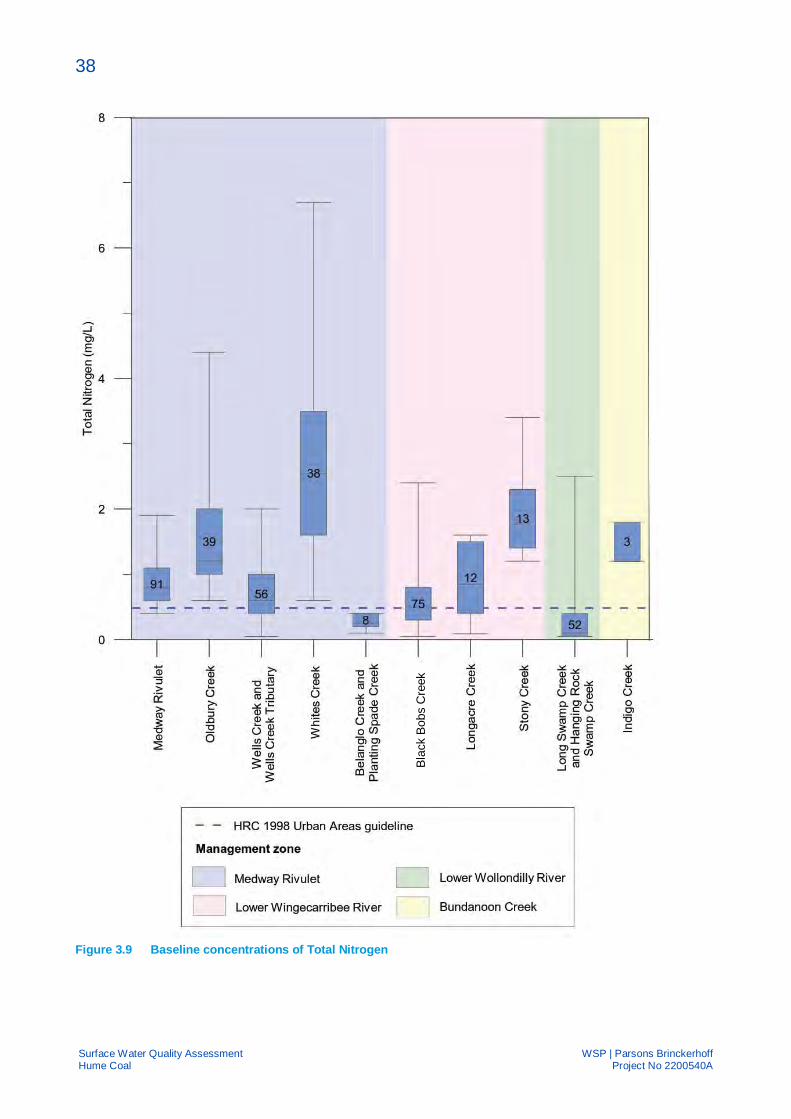
38
Surface Water Quality AssessmentHume Coal
WSP | Parsons BrinckerhoffProject No 2200540A
Figure 3.9 Baseline concentrations of Total Nitrogen
Blac
kBo
bsC
reek

39
WSP | Parsons BrinckerhoffProject No 2200540A
Surface Water Quality AssessmentHume Coal
Figure 3.10 Baseline concentrations of Total Phosphorous
Blac
kBo
bsC
reek

40
Surface Water Quality AssessmentHume Coal
WSP | Parsons BrinckerhoffProject No 2200540A
4 WATER-RELATED VALUES AND ASSETS4.1 Environmental values
Environmental values (EVs) are values that the community considers important for water use (HRC 1998).EVs for the Hawkesbury River Catchment are set out in the Healthy Rivers Commission Inquiry into theHawkesbury-Nepean River System (HRC 1998).
Regional EVs are assigned based on land use regions within the Hawkesbury-Nepean catchment. The landuse regions within the study area and applicable EVs are provided in Table 4.1.
Table 4.1 Environmental values for surface water in the study area
LAND USE REGIONS REGIONAL ENVIRONMENTAL VALUES
Predominately forested Aquatic ecosystems
Primary contact recreation
Secondary contact recreation
Visual amenity
Homestead water supply
Livestock water supply
Mixed-use Rural and Drinking Water with Clarification andDisinfection
Aquatic ecosystemsPrimary contact recreation
Secondary contact recreation
Visual amenity
Drinking water – clarification and disinfection
Irrigation water supply
Homestead water supply
Aquatic foods (cooked)
Source: Healthy Rivers Commission Inquiry into the Hawkesbury-Nepean River System (HRC 1998)
Downstream of the confluence of the Wollondilly and Wingecarribee Rivers, the land use region ispredominantly drinking water catchment where EVs include; aquatic ecosystems, visual amenity, drinkingwater – disinfection only, and drinking water - groundwater.
4.2 Surface water assets
The surface water-related assets in the study area with potential to be impacted by the project are located inthe Medway Rivulet, Lower Wingecarribee River, Lower Wollondilly River and Bundanoon Creekmanagement zones and include::
à Storages used for town water supply, including Medway Reservoir (Medway Dam), Lake Burragorang(Warragamba Dam) and Bundanoon Creek Reservoir;
à Diversion works (pumps) and instream storages used by local water users to extract surface water forwater supply;
à Landholders with basic water rights; and
à Ecosystems with potential to be impacted by changes in surface water quality including:

41
WSP | Parsons BrinckerhoffProject No 2200540A
Surface Water Quality AssessmentHume Coal
§ Instream ecosystems; and§ Riparian ecosystems exposed to overbank flows and flooding.
Further details of surface water-related assets in the study area are provided in Sections 4.2.1, 4.2.2 and4.2.3. Potential impacts to surface water-related assets associated with the project are assessed inSection 5.
4.2.1 Storages used for town water supply
4.2.1.1 MEDWAY RESERVOIR (MEDWAY DAM)
Medway Dam is located on Medway Rivulet and has a storage capacity of 1,350 ML. The dam wasconstructed in 1964 and is operated by WSC. Water from the reservoir is ordinarily treated at Medway WaterTreatment Plant which has a capacity of 8 ML/day, and supplies the village of Berrima and western parts ofBowral and Mittagong.
WSC hold a 900 ML WAL to take water for town water supply from Medway Dam. Available information fromWSC indicates that in the year 2012-2013, Medway Water Treatment Plant treated 414 ML of water from thedam; however the plant was shut down in June 2013. The shutdown, which lasted nearly two years, wasused to change the filter media and install a temporary Poly Aluminium Chloride plant to help reduce tasteand odour effects from released algal toxins (Beca 2010). Medway Dam is prone to algal blooms in summerdue to catchment runoff and nutrient loading, including from Moss Vale Sewage Treatment Plant (STP)upstream. Toxic cyanobacteria (blue-green algae) species have been demonstrated to be present and havebeen prevalent in historic blooms, resulting in the Medway discharge having to be shut down for prolongedperiods (Beca 2010). It is understood that WSC has plans to upgrade the plant over the next 3 years.
Medway Dam is located downstream of the administration and workshop area and receives runoff frompasture lands in the upper and lower reaches of the Medway Rivulet catchment, as well as from the MossVale urban area via the Whites Creek tributary.
The location of Medway Dam is shown on Figure 4.1.
4.2.1.2 LAKE BURRAGORANG (WARRAGAMBA DAM)
Lake Burragorang is located on the Wollondilly River downstream of the project. The lake is WaterNSW’slargest reservoir with a total capacity of more than two million megalitres (SCA 2013). It sits behindWarragamba Dam and has a catchment area of 9,051 km2 (Figure 1.1).
Lake Burragorang has the capacity to supply up to 80% of Sydney’s water. One quarter of the catchment is adeclared Special Area, where public access is restricted to protect water quality.
Since the 1970s, during times of drought, water from the Shoalhaven catchment to the south has beenpumped to Wingecarribee Reservoir and the Wingecarribee River channel has been used to transport bulkwater to Warragamba Dam.
4.2.1.3 BUNDANOON CREEK RESERVOIR (BUNDANOON CREEK DAM)
Bundanoon Creek Dam is located on Bundanoon Creek and has a storage capacity of approximately2,000 ML. The dam was constructed in the mid 1960s and is operated by WSC. Water from the reservoir istreated at Bundanoon Creek Water Treatment Plant which has a capacity of 10 ML/day, and provides supplyto Bundanoon, Moss Vale, Bowral and Mittagong.

© WSP l Parsons Brinckerhoff - Asia Pacific (WSP l PB) Copyright in the drawings, information and data recorded is the property of WSP l PB. This document and the information are solely for the use of the authorisedrecipient and this document may not be used, copied or reproduced in whole or part for any purpose other than that which it was supplied by WSP l PB. WSP l PB makes no representation, undertakes no duty and acceptsno responsibility to any third party who may use or rely upon this document or the information. NCSI Certified Quality System to ISO 9001. © APPROVED FOR AND ON BEHALF OF© WSP l Parsons Brinckerhoff - Asia Pacific.
!(
!(
!(
!(
!(
!(
!(
!(
!(
!(
!(!(
!(
!(
!(
!(
!(
!(
!(
!(
!(
!(
!(
!(
!(!(
!(
!(
!(!(
!(
!(
!(
!(
!(
!(
!(
!(
!(
!(
!(
!(
!(
!(
!(
!(
!(
!(
!(
!(
!(
!(
!(
!(
!(
!(
!(
!(
!(
!(
!(
!(
!(
#*
#*
#*
#*
#*
#*
#*
#*
#*
#*
#*
#*
#*
#*
#*
#*
#*
#*
#*
#*
#*
#*
#*
#*
#*
#*
#*
#*
#*
#*
#*
#*
#*
#*
#*
#*
#*
#*
#*
WEL
LSCR
EEK
TRIB
UTAR
Y
BU NAD
OON CRE E K RESER VOIR
WINGECARRIBEERESERVOIR
FITZR
OYFA
LLS RES
ERVO
IR
ROCK
Y CRE
EK
BARONGA CREEK
REDARMCREEK
SCHO
OLCREE
K
BELANGLOCREEK
GUNROCK CREEKREEDYC
REEK YARRUNGACREEKURING
ALLACREEK
STONYCREE
K
JACKEYJACKEYS
CREEK
COLYERSCREEK
NANDI CREEK
LONGACRECREE K
WHITESCREEK
CORDEAUXCREEK
PIVETSCREEK
BANGADILLYCREEK
WELLS CREEK
EMUCREEK
WOLLON
DILLYR
IVER
KELLYSCREEK
LONGSWAMP CREEK BUNDANOON CREEK
PADDYSRIVER
MEDWAYRIVULET
BLACKBOBS CREEK
Upper WingecarribeeRiver Management Zone
BundanoonCreek
Management Zone
Lower WingecarribeeRiver Management Zone
Fitzroy FallsManagement
Zone
Nattai RiverManagement Zone
Lower KangarooRiver
Management Zone
LowerWollondilly River
Management Zone
Medway RivuletManagement Zone
Barbers Creek ManagementZone
Maguires CrossingManagement Zone
YarrungaCreek
Management Zone
MED WAYDAM
230000 240000 250000 260000 27000061
6000
0
6160
000
6170
000
6170
000
6180
000
6180
000
LegendStorage#* Stock#* Irrigation#* Industrial
#* Recreation#* Unknown#* Town water supply#* Conservation of water
#*Works have an associatedWater Access Licence
Diversion works - pump!( Stock!( Irrigation!( Industrial
!( Recreation!( Unknown!( Town water supply
!Works have an associatedWater Access Licence
Rail lineMain roadNatural drainage lineWSP management zoneSCA special area
Hume Coal Project areaHume Coal owned propertySurface water user data wasprovided by DPI Water and iscurrent as of 26 September2016
!(
NEW SOUTH WALES
VICTORIA
QUEENSLAND
ACT
SYDNEY
Data source: © Land and Property Information 2015, Hume Coal, NSW Office of Water
0 1,000 2,000
m
Approved by: LRDate: 18/11/2016
Map: 2200540A_GIS_067_A2 Author: RP
Hume Coal Surface Water Quality AssessmentFigure 4.1
Surface water users
1:120,000
Coordinate system: GDA 1994 MGA Zone 56
Scale ratio correct when printed at A3
°
www.pbworld.com\\APSYDFIL03\proj\H\HUME_COAL_PTY_LTD\2200540A_HUME_SURFACE_WATER_EIS\10_GIS\Projects\Maps\2200540A_GIS_067_A2.mxd Hume Coal

43
WSP | Parsons BrinckerhoffProject No 2200540A
Surface Water Quality AssessmentHume Coal
WSC hold a 1,000 ML WAL to take water for town water supply from Bundanoon Creek Reservoir. Thelocation of Bundanoon Creek Reservoir is shown on Figure 4.1.
4.2.2 Local water users
Surface water users in the study area were identified using data obtained directly from the Land and PropertyInformation WAL Register and current as of 5 September 2016.
4.2.2.1 DIVERSION WORKS AND STORAGES
Figure 4.1 shows the location of surface water diversion works (pumps) and storages (dams) in the MedwayRivulet, Lower Wingecarribee River, Lower Wollondilly River and Bundanoon Creek Management Zonescurrent as at 26 September 2016.
There are 6 dams and 11 pumps in the Medway Rivulet management zone. Of these, only Medway Dam andits associated pumps are located downstream of the project area. An additional dam and 2 pumps arelocated on properties owned by Hume Coal or subsidiaries of Hume Coal.
There are numerous stock and domestic and harvestable rights dams in the study area. A large instreamstorage is located on Wells Creek Tributary near Belanglo Road (refer to Figure 4.1). Two instream storagesare located on Oldbury Creek on Hume Coal owned land to the west of the surface infrastructure area.Numerous other in stream storages are also located within the study area.
Figure 4.2 shows the number of pumps and dams in the study area by purpose. Most pumps and dams inthe study area are used for irrigation purposes or a combination of irrigation, stock and domestic purposes.
Figure 4.2 Surface water diversion works and storages in the study area by purpose (LPI 2016
4.2.2.2 WATER ACCESS LICENCES
Figure 4.1 shows the location of pumps and dams with associated WALs in the Medway Rivulet, LowerWingecarribee River, Lower Wollondilly and Bundanoon Creek Management Zones. A breakdown of theWAL volumes by water source and management zone is presented in Table 4.2.

44
Surface Water Quality AssessmentHume Coal
WSP | Parsons BrinckerhoffProject No 2200540A
Table 4.2 Numbers of diversion works and storages in the water management zones
WATER SOURCE AND MANAGEMENT ZONE NUMBER OFDIVERSIONWORKS (PUMPS)
NUMBER OFSTORAGES
TOTAL VOLUMEML/A
SHOALHAVEN WATER SOURCE
Bundanoon Creek Management Zone 5 4 1,007
UPPER NEPEAN AND WARRAGAMBA WATER SOURCE
Lower Wingecarribee River Management Zone 29 12 1,072
Lower Wollondilly River Management Zone 86 32 4,138
Medway Rivulet Management Zone 13 7 1,027
4.2.2.3 BASIC WATER RIGHTS
Basic water rights for landholders in the study area include:
à Domestic and stock rights - Owners or occupiers of land which has stream frontage can take waterwithout a licence. Water taken under a domestic and stock right may be used for normal householdpurposes and garden and/or for drinking water for stock.
à Native title rights - Anyone who holds native title with respect to water, as determined under theCommonwealth Native Title Act 1993, can take and use water for a range of personal, domestic and non-commercial purposes.
à Harvestable rights – Landholders are allowed to build dams on minor streams that capture 10% of theaverage regional rainfall-runoff on their property without a licence to take water. The MHRDC is the totaldam capacity allowed under the harvestable right for a property and takes into account rainfall andvariations in rainfall pattern.
The Greater Metropolitan Region Unregulated Water Sources Water Sharing Plan 2011, estimates the waterrequirements of persons entitled to domestic and stock rights to be:
à 13.6 ML/day in the Shoalhaven River Water Source
à 21 ML/day in the Upper Nepean and Warragamba Water Source.
There are no native title rights with respect to water in the study area.
4.2.3 Instream and riparian ecosystems
Ecosystems in the project area with potential to be impacted by changes in surface water quality include:
à Instream ecosystems; and
à Riparian ecosystems exposed to overbank flows and flooding.
Details of these ecosystems are provided in the Hume Coal Project Biodiversity Assessment Report (EMM2016b).

45
WSP | Parsons BrinckerhoffProject No 2200540A
Surface Water Quality AssessmentHume Coal
5 IMPACT ASSESSMENT5.1 Project activities with potential to impact on surface water quality
5.1.1 Construction and rehabilitation
Project activities with the potential to impact on water quality during construction and rehabilitation are listedin Table 5.1. The table provides the catchment where the activity will be located, the potential contaminants,the potential pathway for contamination of local streams and the likelihood of impact.
The construction and rehabilitation phases of the project will involve:
à earthworks activities, which have the potential to cause erosion and sedimentation of local waterways;
à use of vehicles and heavy machinery, storage of fuels, oils and lubricants and equipment maintenance,which have the potential to cause hydrocarbon contamination of local waterways; and
à a construction camp, which has the potential to contaminate local waterways with general waste andsewage.
The construction and rehabilitation phases of the project will be short term in duration and the potentialimpacts to surface water quality can be suitably managed through the preparation and implementation of siteenvironmental management plans. Details of the environmental management plans to be prepared andimplemented for the project are provided in Section 6.1.
Table 5.1 Construction and rehabilitation activities with potential to impact on water quality
PROJECT ACTIVITYWITH POTENTIAL TOIMPACT ON WATERQUALITY
CATCHMENT POTENTIALCONTAMINANTS
POTENTIALCONTAMINATIONPATHWAY
LIKELIHOOD OF IMPACT
Construction
Earthworks/grading Medway Rivuletand OldburyCreek
TSS, hydrocarbons Runoff from workingareas and areas wherespills have occurred tolocal waterways
Unlikely - short term potentialimpact that can be suitablymanagedConstruction of
infrastructure
Excavation of drifts andstockpiling of materials
Construction camp Medway Rivulet TN, TP, Pathogens,BOD
Runoff and discharge ofsewage from camp.
Unlikely - general waste will bemanaged to preventcontamination of waterways; greywater (eg from sinks andshowers) will be subject toprimary treatment and reused fordrip irrigation of landscaped areasand black water (raw sewage willbe subject to tertiary treatmentand reused in site operations
Rehabilitation
Decommissioning ofmine infrastructure
Medway Rivuletand OldburyCreek
TSS, TN, TP,hydrocarbons
Runoff from workingareas and areas wherespills have occurred tolocal waterways
Unlikely - short term potentialimpact that can be suitablymanaged
Earthworks/gradingand revegetation

46
Surface Water Quality AssessmentHume Coal
WSP | Parsons BrinckerhoffProject No 2200540A
5.1.2 Operation
Project activities with the potential to impact on water quality during operation are described in the followingsections. Section 5.1.2.1 discusses potential impacts associated with project activities located within themine water management system, which will be implemented during operation of the project to preventcontamination of local waterways. Section 5.1.2.2 discusses potential impacts associated with projectactivities located outside the mine water management system.
5.1.2.1 PROJECT ACTIVITIES WITHIN THE MINE WATER MANAGEMENT SYSTEM
Surface water runoff from areas of the site in direct contact with coal will be fully contained within the minewater management system to prevent discharge of this water to local waterways.
The water management system for the project is detailed in the Water Balance Assessment Report (ParsonsBrinckerhoff 2016b). The water management philosophy adopted for the project can be summarised asfollows:
à Runoff from undisturbed areas will be diverted around or away from the infrastructure into naturalwatercourses via clean water diversion drains as much as practical.
à Runoff from disturbed areas within the mine infrastructure footprint will be directed to the SBs, MWDsand the PWD for storage and reuse.
§ Runoff from areas where there is a low risk of coal contact (i.e. runoff from areas that do notcontain coal stockpiles or processing plant but that could contain small amounts of coal due tomine vehicle traffic) may be discharged to local creeks after the first flush provided water quality isacceptable. Details of the adopted first flush criteria are provided in Section 5.2.2.
§ Runoff from areas where there is a low risk of coal contact that does not meet the adopted firstflush criteria will be transferred to the PWD for storage.
à Sewage from the administration and workshop area will be treated and reused on site. Grey water willbe subject to primary treatment and used for drip irrigation of landscaped areas. Black water will besubject to tertiary treatment and harvested for reuse in the CPP.
Table 5.2 summarises the dams that comprise the mine water management system and the siteinfrastructure within the dam catchments. The table indicates that SB03 and SB04 capture runoff with a lowrisk of coal contact. Runoff from these dams may be discharged to Oldbury Creek after the first flushprovided water quality is acceptable (to be confirmed by in-line testing of TDS and pH – refer to Section 6.4for further discussion). MUSIC modelling has been undertaken to assess the potential impacts of dischargefrom SB03 and SB04 on surface water quality in Oldbury Creek and assess compliance with the NorBEcriteria. The methodology and results are presented in Section 5.2.1.
The table also indicates that water from the PWD may be treated in a WTP before a controlled release ofwater is made to Oldbury Creek. The WTP is a provision included in the project infrastructure to account forthe unlikely event of surplus water in the PWD requiring treatment and release to Oldbury Creek. The PWDhas been sized to meet the project demand requirements with the capacity to store all surplus watergenerated by surface and underground activities without the need to release excess water to the localcreeks. Runoff after the first flush from SB03 and SB04 will be released to Oldbury Creek provided waterquality targets are met. In the unlikely event that this runoff cannot be released from SB03 and SB04, thePWD has the capacity to store the total runoff volume from SB03 and SB04 also, if required. The mine waterbalance model (refer to the Water Balance Assessment Report, Parsons Brinckerhoff 2016b) demonstratesthat the PWD has adequate capacity to contain all surplus water and treatment and release of water from thePWD is not required for all climate sequences. The scenario of treating and releasing water from the PWD istherefore not assessed in this report.

47
WSP | Parsons BrinckerhoffProject No 2200540A
Surface Water Quality AssessmentHume Coal
Table 5.2 Project activities within the mine water management system
DAM / STORAGE SITE INFRASTRUCTURE CATCHMENT WATER INDIRECTCONTACT WITHCOAL
POTENTIALDISCHARGE TOLOCAL STREAMS
SB01 Product stockpiles Oldbury Creek Yes No
SB02 CPP, ROM and TLO Oldbury Creek Yes No
Train Load Out(TLO) sump
TLO facility Oldbury Creek Yes No (pumped toSB02)
SB03 Administration and workshoparea*
Medway Rivulet No (low risk ofcoal contact dueto mine vehicletraffic)
Yes, followingpumping of first flushto PWD
SB04 Mine road and conveyorembankment
Medway Rivulet No (low risk ofcoal contact dueto mine vehicletraffic)
Yes, followingpumping of first flushto PWD
MWD05 Overland conveyor Medway Rivulet Yes No
MWD06 Conveyor portal Medway Rivulet Yes No
MWD07 Ventilation shaft Medway Rivulet Yes No
MWD08 Stores water to be treated andreleased to Oldbury Creek, ifrequired**
Oldbury Creek Yes No, as demonstratedby mine waterbalance model**
PWD Dam storing water pumped fromMWDs and underground minesump dewatering
Oldbury Creek Yes No, as demonstratedby mine waterbalance model**
* Administration and workshop area includes administration, bathhouse, washdown and workshop facilities, fuel and lubricationstorage, warehouses, laydown areas, and other facilities.** The mine water balance model has demonstrated that the PWD has adequate capacity to store all water surpluses generatedthroughout the mining operation for all climate sequences without requiring releases to local streams.
5.1.2.2 PROJECT ACTIVITIES OUTSIDE THE MINE WATER MANAGEMENT SYSTEM
Project activities outside the water management system with the potential to impact on water quality duringoperation are listed in Table 5.3. The table provides the catchment where the activity will be located, thepotential contaminants, the potential pathway for contamination of local streams and the likelihood of impact.
Project activities outside the mine water management system include:
à vehicle and heavy machinery movements on access roads;
à operation of the WTP, if required (see previous section);
à ongoing resource definition activities, along with geotechnical and engineering testing and fieldwork tofacilitate detailed design; and
à depressurisation of groundwater systems during underground mining resulting in a reduction inbaseflow to streams.
Potential impacts to surface water quality associated with the first three activities above can be suitablymanaged through the preparation and implementation of site-specific environmental management plans.

48
Surface Water Quality AssessmentHume Coal
WSP | Parsons BrinckerhoffProject No 2200540A
Details of the environmental management plans to be prepared and implemented for the project are providedin Section 6.1.
Road vehicles exiting working areas of the site via the main mine access road will use the drive throughwheel wash which will be located at the administration and workshop area. This will prevent coal dust fromcontaminating surfaces outside the mine water management system. MUSIC modelling has also beenundertaken to assess the potential impacts of the access roads on surface water quality in the receivingenvironment and assess compliance with the NorBE criteria. The methodology and results are presented inSection 5.2.3.
A reduction in groundwater baseflow to streams will result in reduced loadings for all parameters. However,this may also result in an increase in concentrations of some contaminants in streams due to reducedstreamflow. A qualitative assessment of potential water quality impacts associated with intercepted baseflowis presented in Section 5.2.4.
Table 5.3 Project activities outside mine water management system
PROJECT ACTIVITYWITH POTENTIALTO IMPACT ONWATER QUALITY
CATCHMENT POTENTIALCONTAMINANTS
POTENTIALCONTAMINATIONPATHWAY
LIKELIHOOD OF IMPACT
Main access road On ridge linebetween MedwayRivulet and OldburyCreek catchments
TSS,hydrocarbons
Runoff to local waterways Possible – assessed in Section5.2.3
Access roads overMedway Rivulet andpersonnel andmaterials drift access
Medway Rivulet TSS,hydrocarbons
Runoff to local waterways Possible – assessed in Section5.2.
Coal conveyors overMedway Rivulet andOldbury Creek andconveyor drift access
Medway Rivuletand Oldbury Creek
Salinity, TSS,acidity, metals
Runoff to local waterways None - the conveyor will be fullycontained to prevent loss of coalfrom the system
Topsoil stockpiles Medway Rivulet TSS, TN, TP Runoff to local waterways None - the topsoil stockpiles willcomprise clean fill. The stockpileswill be stabilised with vegetationto avoid impacts to waterwaysand their construction will besubject to an erosion andsediment control plan
Water treatment plantincluding storages,pipelines, pumps andassociatedinfrastructure
Oldbury Creek Chemicalsused fortreatmentBy-products oftreatmentHydrocarbons
Spills / runoff to localwaterways
None - chemicals for watertreatment and by-products ofwater treatment will be managedand contained to preventcontamination of waterways.Note also that the mine waterbalance model has demonstratedthat the WTP is not required totreat and release surplus water forall climate sequences
Intercepted baseflowdue todepressurisation forunderground mining
Medway Rivulet,Oldbury Creek,Black Bobs Creek,Lower WollondillyRiver, LowerWingecarribeeRiver
Metals A reduction in waterdischarged from groundwatersystems to surface watersystems in the project areahas the potential to alter thequality of water in surfacewater systems
Possible – assessed in Section5.2.4

49
WSP | Parsons BrinckerhoffProject No 2200540A
Surface Water Quality AssessmentHume Coal
PROJECT ACTIVITYWITH POTENTIALTO IMPACT ONWATER QUALITY
CATCHMENT POTENTIALCONTAMINANTS
POTENTIALCONTAMINATIONPATHWAY
LIKELIHOOD OF IMPACT
Ongoing resourcedefinition activities,along withgeotechnical andengineering testingand fieldwork tofacilitate detaileddesign
Medway Rivulet,Oldbury Creek,Black Bobs Creek,Lower WollondillyRiver
TSS,hydrocarbons
Runoff from working areas tolocal waterways
Unlikely - short term potentialimpact that can be suitablymanaged
Note: The access road over Oldbury Creek is existing and has not been assessed
5.2 Impact assessment
5.2.1 Assessment criteria
To assess whether the project and its associated treatment measures will have a NorBE on water quality,existing conditions (pre-development) and operational phase (post-development) pollutant loads andconcentrations predicted by the MUSIC model have been assessed against the following criteria outlined inthe SCA standards (2012):
à The mean annual pollutant loads for the post-development case (including mitigation measures) mustbe 10% less than the pre-development case for TSS, TP and TN. For gross pollutants, the post-development load only needs to be equal to or less than pre-development load.
à Pollutant concentrations for TP and TN for the post-development case (including mitigation measures)must be equal to or better compared to the pre-development case for between the 50th and 98thpercentiles over the five-year modelling period when runoff occurs. Periods of zero flow are notaccounted for in the statistical analysis as there is no downstream water quality impact. To demonstratethis, comparative cumulative frequency graphs, which use the Flow-Based Sub-Sample Threshold forboth the pre- and post-development cases, must be provided. As meeting the pollutant percentileconcentrations for TP generally also meets the requirements for TSS, cumulative frequency analysis isnot required for TSS. Cumulative frequency is also not applied to gross pollutants.
A third criterion is provided in the WaterNSW standards (2012); however, only applies to developmentswhere the catchment is more than 70% impervious, which is not the case for the sub-catchments assessedfor this project. The criteria above are conservative to account for uncertainty in MUSIC predictions.
5.2.2 Releases from stormwater basins to Oldbury Creek
SB03 and SB04 drain relatively clean catchments, ie no proposed coal stockpiling areas or direct contactbetween runoff and coal will occur within their catchments. However, there is a low risk of some minor coalcontact to occur in these catchments from mine vehicle traffic. For this reason, water will only be dischargedfrom SB03 and SB04 to Oldbury Creek after the first flush to these dams is pumped to the PWD and waterquality discharge limit criteria are satisfied.
The first flush refers to the initial surface runoff of a rainstorm. Usually the stormwater that initially runs off anarea will be more polluted than the stormwater that runs off later. This is because pollutants deposited ontoexposed areas during dry periods are dislodged and entrained by the initial stages of the rainfall-runoffprocess.
The existence of this first flush of pollutants provides an opportunity for controlling stormwater pollution (EPA2016). The first flush collected in SB03 and SB04 will be pumped to the PWD and contained within the minewater management system to prevent pollution of local streams. Only once the first flush collected in SB03and SB04 has been pumped to the PWD will water be released to Oldbury Creek. The following first flushcriteria were developed for the project based on the NSW EPA guideline provided athttp://www.epa.nsw.gov.au/mao/stormwater.htm:

50
Surface Water Quality AssessmentHume Coal
WSP | Parsons BrinckerhoffProject No 2200540A
à The first flush is assumed to have occurred once the daily rainfall exceeds 20 mm. On such days, runoffcould be released from SB03 and SB04 to Oldbury Creek. This criterion assumes that the water qualityis acceptable for release.
à From the day of occurrence of the first flush, subsequent daily rainfall amounts less than 20 mm for thenext four days are assumed to produce clean runoff and releases are allowed to continue to OldburyCreek.
à If daily rainfall depth remains less than 10 mm after the fifth day, no runoff is released to Oldbury Creekuntil the next first flush event.
MUSIC modelling has been undertaken to assess the potential impacts of discharge from SB03 and SB04 onTSS and nutrient loads and concentrations in Oldbury Creek and assess compliance with the NorBE criteria.MUSIC modelling has also been undertaken to calculate the maximum concentrations of other contaminantsin SB03 and SB04 to achieve the NorBE criteria for mean annual pollutant loads. The methodology andresults for these assessments are presented below.
5.2.2.1 ASSESSMENT OF TSS AND NUTRIENTS
This section describes the MUSIC modelling undertaken to assess the releases from SB03 and SB04against the NorBE criteria. The MUSIC modelling was undertaken in accordance with the WaterNSWstandards (2012).
MUSIC MODEL SET UP
MUSIC model nodes were set up for SB03 and SB04 which will discharge to Oldbury Creek and SB01,SB02, PWD and MWD08 which are sub-catchments of Oldbury Creek that will be removed from itscatchment during mining operation (refer to Figure 5.1 for the catchment areas). Each model node was setup to represent the following:
à The existing conditions within the catchments: the catchments were assumed to be fully pervious withthe land use assumed to be ‘agricultural’.
à The proposed conditions within the catchments of SB03 and SB04 under operation: in this case thecatchments are a mix of pervious and impervious areas identified below in Table 5.4 (refer to the WaterBalance Assessment Report, Parsons Brinckerhoff 2016b). For these conditions the land use wasassumed to be ‘industrial’. For the operational phase, the sub-catchments of SB01, SB02, PWD andMWD08 will not contribute any runoff to Oldbury Creek, and therefore these nodes are not included inthe proposed conditions model.
Table 5.4 Operational land use within SB03 and SB04 catchments
LAND USE SB03 AREA(ha)
SB04 AREA(ha)
Impervious 0.71 0.00
Undisturbed 2.56 8.29
Active spoil area* 0.00 1.89
Hardstand or unsealed road 2.64 4.55
Total area 5.91 14.73
Total impervious 57% 44%
Total pervious 43% 56%
*Note: The Geochemistry Report (RGS 2016) identifies a low risk of acid mine drainage from the active spoil areas

51
WSP | Parsons BrinckerhoffProject No 2200540A
Surface Water Quality AssessmentHume Coal
Climate data
The WaterNSW standard (2012) provides meteorological templates that include the rainfall and potentialevapotranspiration data for various catchment areas and which form the basis for the hydrologic calculationsin MUSIC.
The appropriate climate zone for the meteorological template file was identified as zone 3 using theWaterNSW website (http://www.waternsw.com.au/water-quality/catchment/development/) (Figure 5.2). Thetemplate files were downloaded from the WaterNSW website. The rainfall files were at a 6 minute time stepover a period of 5 years from 1997 to 2001. This period includes a range of wet and dry years to ensureconditions simulated are realistic and representative of a range of rainfall patterns. A plot of the zone 3monthly rainfall is provided in Figure 5.3.

PrimaryWaterDam
Personnel andmaterials drift
Ventilationshaft pad
Conveyor drift
Laydown area
Explosivesmagazine
Laydown area
Site access pointfrom Mereworth Road
Watertreatmentplant
Main substationROM coalstockpile
Coal preparationplant
Coal loading facility
Temporary/emergencyrejects stockpiles
Product coalstockpiles
Temporary constructionaccommodation village
Administration buildingand bathhouse
Sewage treatmentplantDrift and shaftspoil and topsoil
SB01
SD01
SB03
SB04
MWD05
MWD06
MWD07
MWD08
SB02
O LDBURY C REEK
MEDW
AYRIVU LET
PLANTINGSPADE CREEK
BLACK SPRINGS CREEK
BELANGLO CREEK
WELLS CREEK
M ED WAY DA M
NEW BERRIMA
HUME HIGHWAY
OLD HUM
E HIGHWAY
HUME
MOTO
RWAY
O L DBURY STREET
248000 249000 250000 251000 252000 253000 254000 25500061
7600
0
6176
000
6177
000
6177
000
6178
000
6178
000
6179
000
6179
000
6180
000
6180
000
LegendHume Coal Projectarea
Indicative surfaceinfrastructure feature
Existing WSCeasementProposed powerlineand pipelineeasementPowerline routeDrift (underground)
ConveyorWater pipelineAll-weather track
Berrima Rail project
SB03 and SB04 sub-catchments that arewithin the MedwayRivulet catchment inexisting caseOther sub-catchmentsthat are within theMedway Rivuletcatchment in existingcaseSub-catchments thatare within the OldburyCreek catchment inexisting case
Existing featureRail line
Main roadLocal roadNatural drainage line
Waterbody
!(
!(
!(
!(
!(
!(
NOWRA
SYDNEYCAMDENPICTON
MOSS VALE
WOLLONGONG
0 250 500
m
Approved by: LRDate: 14/11/2016
Map: 2200540A_GIS_068_A4 Author: RP
Hume Coal Surface Water Quality AssessmentFigure 5.1
Catchment areas used for MUSIC modelling of SB03 and SB04 discharges
1:20,000
Coordinate system: GDA 1994 MGA Zone 56
Scale ratio correct when printed at A3
°
\\APSYDFIL03\proj\H\HUME_COAL_PTY_LTD\2200540A_HUME_SURFACE_WATER_EIS\10_GIS\Projects\Maps2200540A_GIS_068_A4.mxd Hume Coal
© WSP l Parsons Brinckerhoff - Asia Pacific (WSP l PB) Copyright in the drawings, information and data recorded is the property of WSP l PB. This document and the information are solely for the use of the authorisedrecipient and this document may not be used, copied or reproduced in whole or part for any purpose other than that which it was supplied by WSP l PB. WSP l PB makes no representation, undertakes no duty and acceptsno responsibility to any third party who may use or rely upon this document or the information. NCSI Certified Quality System to ISO 9001. © APPROVED FOR AND ON BEHALF OF© WSP l Parsons Brinckerhoff - Asia Pacific.
Data source: © Land and Property Information 2015, Hume Coal
www.wsp-pb.com

WELL
SCR
EEK T
RIBU
TARYMEDWAYD AM
GAP CREEK
COAL
CREE
K
SMALLCREEK
KELLS CRE EK
JELLORECREEK
WATT LE CREE K
KELPIE
CREEK
BRI DGE CR EEK
IND IGOCREE K
TRIMBLES CREEK
DIGGERSCREEKLONG CRE EK
REEDY CREEK
CRAN
KEYS
CREEK
FITZR
OYCA
NAL
SCHOTTSC R EEK
DRAPERS CREEK
STONY CR
EEK
LITTL
EBR
IDGY CREEK
COLYERS CREEK
NANDI C REEK
LONGACRECREEK
CONNORS CR EEK
BACK CREEK
WHITES CREEK
OLDBURY C REEK
ISLAND CREE
KCORDEAUX CREEK
PIVETS CREEK
MAN
DEMAR CREEK
BANGAD ILLY CREEK
MILL
ERSC
REE K
NAT TAI CREEK
BRIDGYCREEK
JAORIMINCREEK
SANDY CREEK
URINGALLACREEK
WELLSCREEK
DOUDLE S FOLLY CREEK
EMU CR
EEK
MITTAGONGC RE
EK
WILDES
MEADOW CREEK
KELLYS CREEK
YARRUNGA CREEK
NATTAI R IV ER
BARR
ENGAR
RY
CREEK
LONG SWA MP CREE K
TARLORIVER
BAN
NABY
CREEK
JOADJA CREEK
MEDWAY RIVULETBLACK
BOBS
CREEK
BUNDANOON CREEK
NEPE
ANRIV
ER
PA DDYS RIVER
WOL L ONDILLY RIVER
WINGECARRIBEE RIVER
ILLAWARRA HWY
OLD HUME HW YHUME HWY
HUME HWY
220000 230000 240000 250000 260000 27000061
6000
0
6160
000
6170
000
6170
000
6180
000
6180
000
6190
000
6190
000
!(
!(
!(
!(
!(
!(
NOWRA
SYDNEYCAMDENPICTON
MOSS VALEWOLLONGONG
0 2,500 5,000
m
Approved by: LRDate: 21/10/2016
Map: 2200540A_GIS_064_A2 Author: RP
Hume Coal Surface Water Quality AssessmentFigure 5.2
WaterNSW climate zones
1:150,000
Coordinate system: GDA 1994 MGA Zone 56
Scale ratio correct when printed at A3
°
\\APSYDFIL03\proj\H\HUME_COAL_PTY_LTD\2200540A_HUME_SURFACE_WATER_EIS\10_GIS\Projects\Maps2200540A_GIS_064_A2.mxd Hume Coal
© WSP l Parsons Brinckerhoff - Asia Pacific (WSP l PB) Copyright in the drawings, information and data recorded is the property of WSP l PB. This document and the information are solely for the use of the authorisedrecipient and this document may not be used, copied or reproduced in whole or part for any purpose other than that which it was supplied by WSP l PB. WSP l PB makes no representation, undertakes no duty and acceptsno responsibility to any third party who may use or rely upon this document or the information. NCSI Certified Quality System to ISO 9001. © APPROVED FOR AND ON BEHALF OF© WSP l Parsons Brinckerhoff - Asia Pacific.
Data source: NSW Property and Information 2015, Hume Coal
www.wsp-pb.com
LegendRail line
Main road
Natural drainage line
Hume Coal Project area
Temporary constructionaccommodation villageSurface infrastructurefootprintConstruction buffer zone
Waterbody
WaterNSW climate zones
Climate zone 1
Climate zone 3
Climate zone 4
Climate zone 7
Climate zone 8
Climate zone 9

54
Surface Water Quality AssessmentHume Coal
WSP | Parsons BrinckerhoffProject No 2200540A
Figure 5.3 Daily rainfall for zone 3 (1997 to 2001) used in MUSIC modelling
Discharge volumes
The meteorological data for the 5 year period was converted from a 6 minute time step to a daily time stepand input to the mine water balance model developed in the GoldSim software (refer to the Water BalanceAssessment Report, Parsons Brinckerhoff 2016b). The GoldSim model was used to generate outflow timeseries for the SB01, SB02, PWD and MWD08 catchments in their existing states, and for SB03 and SB04 intheir operational states. For the operational phase, the model simulated pumping of the first flush to the PWDas per the design criteria for these dams so that the outflow time series generated for the operational phaserepresented the volumes that would be released to Oldbury Creek after the first flush has been captured andpumped to the PWD.
Inflow data
MUSIC inflows are required to be separated into baseflow, pervious flow and impervious flow. The GoldSimnatural catchment output was input into MUSIC as pervious flow. No baseflow or impervious flow wasassumed for existing.
For operation the inflow was a mix of impervious and pervious flow as identified for the catchment areasgiven in Table 5.4, with no baseflow assumed.
MODELLED SCENARIOS
The existing conditions scenario was set up for the SB01, SB02, PWD, MWD08, SB03 and SB04catchments using the ‘agricultural’ MUSIC source node. The stormwater pollutant parameters used foragricultural land use are given in Table 5.5 and are in accordance with the WaterNSW standards (2012).The operational phase scenario was set up for the SB03 and SB04 catchments using the ‘industrial’ MUSIC

55
WSP | Parsons BrinckerhoffProject No 2200540A
Surface Water Quality AssessmentHume Coal
source node. The stormwater pollutant parameters used for industrial land use are given in Table 5.5 and arein accordance with the WaterNSW standards (2012).
Table 5.5 Source node mean pollutant inputs into MUSIC for SB03 and SB04 assessment
LAND USE TSS TP TN
Mean log(mg/L)
SD log (mg/L) Mean log (mg/L) SD log (mg/L) Mean log (mg/L) SD log (mg/L)
Storm flow
Agricultural 2.15 0.31 -0.22 0.3 0.48 0.26
Industrial 2.15 0.32 -0.60 0.25 0.3 0.19SD Standard deviation
RESULTS
Comparison of mean annual pollutant loads
Table 5.6 provides a summary of existing and operational scenario mean annual pollutant loads for TSS, TPand TN. The results show that mean annual pollutant loads for these parameters are reduced bysignificantly more than 10%, and therefore meet this NorBE criterion. This is achieved due to the significantreduction in agricultural catchment draining to Oldbury Creek during operation.
Table 5.6 Mean annual pollutant loads in Oldbury Creek due to runoff from SB01, SB02, PWD, MWD08, SB03 andSB04 catchments
PARAMETER MEAN ANNUAL LOAD
EXISTING(FROM SB01, SB02, MWD08 AND PWD)
OPERATION(FROM SB03 AND SB04)
% REDUCTION
TSS (kg/yr) 25,500 4,130 -84%
TP (kg/yr) 125 8 -93%
TN (kg/yr) 483 61 -87%
Flow (ML/yr) 149 20 -86%
Comparison of pollutant concentrations between the 50th and 98th percentiles
Cumulative frequency graphs of TN and TP concentrations in runoff to Oldbury Creek from SB01, SB02,PWD, MWD08, SB03 and SB04 for the existing and operational scenarios are provided in Figures 5.4 and5.5. The figures demonstrate that pollutant concentrations for the operational scenario are equal to or lowerthan the existing scenario between the 50th and 98th percentiles, and therefore compliance with this NorBEcriterion is achieved.
CONCLUSION
Operational phase releases from SB03 and SB04 to Oldbury Creek were simulated in GoldSim and MUSICand found to meet the NorBE criteria for TSS, TP and TN. These form the limited parameter set forassessment as stipulated by the WaterNSW standards (2012). However, the analysis does not assess theimpacts of other contaminants that may be present in the releases from SB03 and SB04, which is consideredin the next section.

56
Surface Water Quality AssessmentHume Coal
WSP | Parsons BrinckerhoffProject No 2200540A
Figure 5.4 Total Phosphorus cumulative frequency graph for SB03 and SB04 discharge assessment
Figure 5.5 Total Nitrogen cumulative frequency graph for SB03 and SB04 discharge assessment
Operational catchments (SB03 and SB04) Existing catchments (SB01, SB02, MWD08 and PWD)
Operational catchments (SB03 and SB04) Existing catchments (SB01, SB02, MWD08 and PWD)

57
WSP | Parsons BrinckerhoffProject No 2200540A
Surface Water Quality AssessmentHume Coal
5.2.2.2 OTHER CONTAMINANTS
IDENTIFICATION OF POTENTIAL CONTAMINANTS
Pumping of the first flush from SB03 and SB04 to the PWD is proposed to remove any material containingcoal dust or fragments that may be transported into the SB03 and SB04 catchments from mine vehicle traffic.Nevertheless, a conservative approach has been taken for this assessment and potential contaminants incoal dust (in addition to TSS and nutrients) have been considered.
The geochemical assessment of coal and mining waste materials undertaken by RGS (2016) involvedleachate testing of coal and coal reject materials. Average leachate concentrations from these tests arepresented in Table 5.7.
Comparison of average leachate concentrations with average baseline concentration in Oldbury Creek (atthe SW08 monitoring location) indicates that concentrations of some parameters are higher in the coalleachate than in the receiving environment. These parameters have been selected for further assessmentand are shown in bold in Table 5.7.
Table 5.7 Comparison of surface water and leachate concentrations
CONTAMINANTS UNITS MEAN BASELINECONCENTRATION(MEDWAY RIVULET)
MEAN LEACHATECONCENTRATION
Major ions
Calcium mg/L 27 31
Chloride mg/L 56 43
Magnesium mg/L 10 11
Sodium mg/L 38 3.7
Sulfate as SO4 mg/L 45 126
Dissolved metals
Aluminium mg/L 0.08 0.99
Antimony mg/L <0.001 no value reported
Arsenic mg/L <0.001 0.006
Barium mg/L 0.04 no value reported
Beryllium mg/L <0.001 no value reported
Boron mg/L <0.05 <0.05
Cadmium mg/L <0.0001 0.005
Chromium mg/L <0.001 0.001
Cobalt mg/L <0.001 0.55
Copper mg/L 0.001 0.26
Iron mg/L 0.25 5.9
Lead mg/L <0.001 0.11
Manganese mg/L 0.17 2.2
Mercury mg/L <0.0001 no value reported

58
Surface Water Quality AssessmentHume Coal
WSP | Parsons BrinckerhoffProject No 2200540A
CONTAMINANTS UNITS MEAN BASELINECONCENTRATION(MEDWAY RIVULET)
MEAN LEACHATECONCENTRATION
Molybdenum mg/L <0.001 0.002
Nickel mg/L <0.001 1.2
Selenium mg/L <0.01 0.04
Silver mg/L 0.01 no value reported
Zinc mg/L 0.01 2.8
Physical parameters
Electrical Conductivity µS/cm 476 402
pH pH units 7.4 3.7
Total Dissolved Solids mg/L 291 241
MUSIC MODELLING TO DETERMINE DISCHARGE CONCENTRATION TARGETS
MUSIC modelling was undertaken to assess the mean annual pollutant loads for the 17 contaminantshighlighted in bold in Table 5.7 from the SB03 and SB04 catchments under existing conditions. The loadswere calculated using the MUSIC model described in the previous section as a mass balance model with themean concentration for each contaminant specified as the mean baseline concentration measured at SW08.
The MUSIC model was then used to identify the mean concentration of each contaminant that would need tobe achieved in the releases under the operational scenario to meet the NorBE criterion of a 10% reduction inthe mean annual pollutant load.
The results are provided in Table 5.8, which identifies the target mean concentration in the releases fromSB03 and SB04 for each of the 17 contaminants. Contaminants that were below the laboratory limit ofdetection during the baseline monitoring would also need to remain at or below the laboratory limit ofdetection in the releases from SB03 and SB04.
Table 5.8 Target mean concentrations for other contaminants in releases from SB03 and SB04
CONTAMINANT OLDBURY CREEKBASELINE MEANCONCENTRATION(mg/L)
TARGET MEANCONCENTRATION INCOMBINED SB03 & SB04RELEASES(mg/L)
% LOADREDUCTION FROMEXISTING TOOPERATION
Calcium 27 175 -11%
Magnesium 10 65 -11%
Sulfate as SO4 45 290 -11%
Aluminium 0.08 0.48 -10%
Arsenic <0.001 0.001 N/A
Cadmium <0.0001 0.0001 N/A
Cobalt <0.001 0.001 N/A

59
WSP | Parsons BrinckerhoffProject No 2200540A
Surface Water Quality AssessmentHume Coal
CONTAMINANT OLDBURY CREEKBASELINE MEANCONCENTRATION(mg/L)
TARGET MEANCONCENTRATION INCOMBINED SB03 & SB04RELEASES(mg/L)
% LOADREDUCTION FROMEXISTING TOOPERATION
Copper 0.001 0.0065 -11%
Iron 0.25 1.6 -13%
Lead <0.001 0.001 N/A
Manganese 0.17 1.1 -11%
Molybdenum <0.001 0.001 N/A
Nickel <0.001 0.001 N/A
Selenium <0.01 0.01 N/A
Zinc 0.01 0.065 -11%
Concentrations of a number of key indicator parameters representing other contaminants will be monitored inthe basins as part of the routine monitoring program, to establish that the targets are met in releases. This isdiscussed in more detail in Section 6.4.
5.2.3 Mine access roads
There are two mine access roads located outside the water management system (see Figure 1.3):
à the main mine access road from Mereworth Road to the administration and workshop area, whichfollows existing sealed and unsealed roads for most of its length; and
à the access road between the personnel and materials portal, the conveyor portal and the ventilationshaft, which follows existing unsealed tracks.
Vehicles using the roads will not be transporting coal and vehicles exiting the site via the main mine accessroad will use the drive through wheel wash at the administration and workshop area to prevent coal dust fromcontaminating surfaces outside the water management system.
MUSIC modelling has been undertaken to assess the potential impacts of the runoff from these roads onsurface water quality in the receiving environment and assess compliance with the NorBE criteria.
5.2.3.1 MUSIC MODELLING METHODOLOGY
Existing and operational scenarios were modelled using MUSIC by representing the sub-catchments of theroad corridors in their existing conditions as a mix of existing sealed and unsealed roads and agriculturalland and proposed conditions as sealed / unsealed roads. The operational phase scenarios includedsimulation of stormwater quality treatment measures to achieve the NorBE criteria. Modelling has beenundertaken in accordance with the WaterNSW standards (2012).
MUSIC MODEL SET UP
Model nodes were established for the two access roads. The main mine access road follows a ridge linebetween Medway Rivulet and Oldbury Creek, and is a sealed road with a total road corridor area (includingembankments) of 5.02ha. The other access road is located within the Medway Rivulet catchment and is anunsealed road with a total area (not including embankments) of 1.32ha. The assessment of the sealed roadincluded the road embankments as it warranted a more detailed assessment and sub-catchment breakdowndue to the relatively higher impact of a sealed road on the local catchments. The unsealed road wasassessed more simplistically by modelling the impact of the area of the trafficked surface only.

60
Surface Water Quality AssessmentHume Coal
WSP | Parsons BrinckerhoffProject No 2200540A
The main mine access road was split into three sub catchments (northern, middle and southern) andrepresented in the MUSIC model as follows:
à The catchment taken up by the proposed road corridor including cut/fill embankments. Within thiscatchment there is an existing sealed road and unsealed road. Under existing conditions these areaswere represented as ‘sealed/unsealed roads’. The remaining land use under existing conditions withinthe footprint of the proposed road corridor is assumed to be ‘agricultural’.
à The catchment taken up by the proposed road corridor in the operational conditions is a mix of ‘sealedroads’ for the road surface and ‘revegetated land’ for the cut/fill embankments.
The other access road represented in the MUSIC model as follows:
à The part of the catchment taken up by the proposed road corridor (excluding cut/fill embankments whichare assumed to be vegetated) under existing conditions. The land use under existing conditions isassumed to be ‘agricultural’.
à The part of the catchment taken up by the proposed road corridor (excluding cut/fill embankments asnoted above) in the operational condition. The land use under the operational scenario is ‘unsealedroads’.
CLIMATE DATA
The climate data used in the MUSIC model was the zone 3 meteorological template file obtained from theWaterNSW website, as described in Section 5.2.2.
MODELLED SCENARIOS
The existing conditions scenario was set up for each of the sub-catchments using a combination of the‘agricultural’ and existing ‘sealed/unsealed roads’ MUSIC source nodes and assumed to be 100% perviousfor agricultural land, 100% impervious for sealed roads, and 50% pervious and 50% impervious for unsealedroads. The operational scenario was set up for each of the sub-catchments using the ‘sealed / unsealedroads’ and ‘revegetated land’ MUSIC source nodes and assumed to be 100% impervious for sealed roads,and 50% pervious and 50% impervious for unsealed roads. The stormwater pollutant parameters used forthe source nodes are given in Table 5.9 and are in accordance with the WaterNSW standards (2012).
Table 5.9 Source node mean pollutant inputs into MUSIC for mine access roads assessment
LAND USE TSS TP TNMEAN LOG(MG/L)
SD LOG(MG/L)
MEAN LOG(MG/L)
SD LOG(MG/L)
MEAN LOG(MG/L)
SD LOG(MG/L)
BaseflowAgricultural 1.3 0.13 -1.05 0.13 0.04 0.13Unsealed roads 1.2 0.17 -0.85 0.19 0.11 0.12Sealed roads 1.2 0.17 -0.85 0.19 0.11 0.12Revegetated Land 1.15 0.17 -1.22 0.19 -0.05 0.12Storm flowAgricultural 2.15 0.31 -0.22 0.3 0.48 0.26Unsealed roads 3 0.32 -0.3 0.25 0.34 0.19Sealed roads 2.43 0.32 -0.3 0.25 0.34 0.19Revegetated Land 1.95 0.32 -0.66 0.25 0.3 0.19
SD Standard deviation

61
WSP | Parsons BrinckerhoffProject No 2200540A
Surface Water Quality AssessmentHume Coal
For the operational scenario vegetated swales were included in the MUSIC model to treat the runoff from thesealed and unsealed roads. Vegetated swales are typically trapezoidal open channels that convey and filterstormwater runoff through vegetation to remove coarse sediment (i.e. reduce TSS). The performance ofswales is largely dependent on the vegetation height and the gradient and length of the swale. MUSIC hasdefault parameters for these, however, the following parameters were adjusted from the default settings:
à The exfiltration rate was changed from 0 mm/hr to 2 mm/hr, which is the mid-range value for ‘mediumclay’ recommended by MUSIC. This is a conservatively low value as the soils in the area have sandyclay characteristics which would justify a higher exfiltration rate.
à The background concentration (C* and C**) for a swale is defaulted to be relatively high. These valueswere adjusted in accordance with the approach detailed in Fletcher et al (2004) so that a more realisticreduction of pollutant load would be determined – refer to Appendix B for further details.
The adopted parameters for the swales are given below in Table 5.10.
Table 5.10 Adopted swale parameters
SWALE PROPERTIES ADOPTED VALUES
Length (m) Varied to meet NorBE criteria
Bed Slope (%) 3
Base width (m) 1
Top Width (m) 5
Depth (m) 0.6
Vegetation Height (m) 0.3
Exfiltration rate (mm/hr) 2
C* C** TN 0.89
C* C** TP 0.096
ASSESSMENT CRITERIA
The assessment criteria for the access roads were as set out in Section 5.2.1, ie:
à The mean annual pollutant loads for the operational scenario (including mitigation measures) must be10% less than the existing scenario for TSS, TP and TN.
à Pollutant concentrations for TP and TN for the operational scenario (including mitigation measures)must be equal to or better compared to the existing scenario for between the 50th and 98th percentilesover the five-year modelling period when runoff occurs.
RESULTS
Comparison of mean annual pollutant loads
Table 5.11 provides a summary of existing and operational scenario mean annual pollutant loads for TSS,TP and TN. The results show that mean annual pollutant loads for these parameters are reduced by morethan 10%, and therefore meet this NorBE criterion (note that achieving 10% reduction for TN, the mostonerous parameter, results in significantly greater than 10% reductions for TSS and TP when 10%). This isachieved through provision of swales to treat the road runoff. Table 5.12 provides the road corridor lengthsand swale lengths required to meet the NorBE criterion for mean annual pollutant load.

62
Surface Water Quality AssessmentHume Coal
WSP | Parsons BrinckerhoffProject No 2200540A
Table 5.11 Mean annual pollutant loads from access road catchments
PARAMETER EXISTING(KG/YR)
OPERATION(KG/YR)
DIFFERENCE TOEXISTING
OPERATIONWITH SWALETREATMENT(KG/YR)
DIFFERENCETO EXISTING
SEALED ROAD NORTHERN CATCHMENT (3.07 HA)
TSS 1,250 3,940 215% 410 -67%
TP 3.77 6.79 80% 1.55 -59%
TN 19.7 31.6 60% 17.5 -11%
SEALED ROAD CATCHMENT MIDDLE CATCHMENT (0.99 HA)
TSS 413 580 40% 176 -57%
TP 1.18 1.06 -10% 0.484 -59%
TN 5.9 31.6 2% 5.2 -10%
SEALED ROAD SOUTHERN CATCHMENT (0.56 HA)
TSS 357 413 16% 189 -47%
TP 0.846 0.735 -13% 0.442 -48%
TN 4.02 3.73 -7% 3.53 -12%
UNSEALED ROAD CATCHMENT (1.32 HA)
TSS 276 7,240 2,523% 79.1 -71%
TP 1.19 3.32 179% 0.454 -62%
TN 6.66 14 110% 5.79 -13%
Table 5.12 Required swale lengths for mine access roads to meet NorBE criteria
SUB-CATCHMENT ROAD CORRIDOR LENGTH(M)
SWALE LENGTH(M)
Sealed road catchment (5.02ha) 2,540 730
Unsealed road catchment(1.32 ha) 2,000 500
Comparison of pollutant concentrations between the 50th and 98th percentiles
Cumulative frequency graphs of TN and TP concentrations for the access roads for the existing andoperational scenarios are provided in Figures 5.6 to 5.13. The figures demonstrate that pollutant

63
WSP | Parsons BrinckerhoffProject No 2200540A
Surface Water Quality AssessmentHume Coal
concentrations for the operational scenario are equal to or better than the existing scenario between the 50 th
and 98th percentiles, and therefore compliance with this NorBE criterion is achieved.
CONCLUSION
Runoff from the mine access roads will achieve NorBE assuming treatment swales are provided along theroad corridors to receive and treat the road runoff before discharging into the Medway Rivulet catchment atthe low points in each road sub-catchment.
Figure 5.6 Total Phosphorus cumulative frequency graph for sealed road northern catchment
Operational catchment (sealed road) Existing catchment (mix of unsealed road and agricultural)

64
Surface Water Quality AssessmentHume Coal
WSP | Parsons BrinckerhoffProject No 2200540A
Figure 5.7 Total Nitrogen cumulative frequency graph for sealed road northern catchment
Operational catchment (sealed road) Existing catchment (mix of unsealed road and agricultural)

65
WSP | Parsons BrinckerhoffProject No 2200540A
Surface Water Quality AssessmentHume Coal
Figure 5.8 Total Phosphorus cumulative frequency graph for sealed road middle catchment
Operational catchment (sealed road) Existing catchment (mix of sealed road and agricultural)
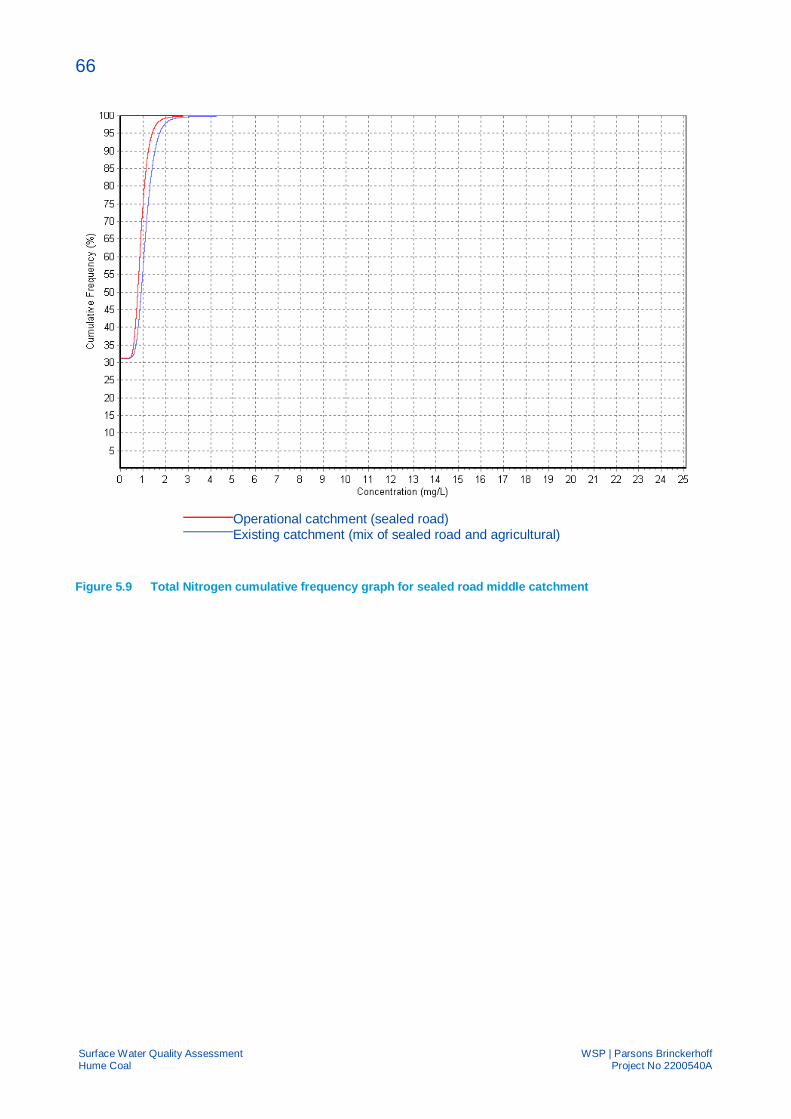
66
Surface Water Quality AssessmentHume Coal
WSP | Parsons BrinckerhoffProject No 2200540A
Figure 5.9 Total Nitrogen cumulative frequency graph for sealed road middle catchment
Operational catchment (sealed road) Existing catchment (mix of sealed road and agricultural)

67
WSP | Parsons BrinckerhoffProject No 2200540A
Surface Water Quality AssessmentHume Coal
Figure 5.10 Total Phosphorus cumulative frequency graph for sealed road southern catchment
Operational catchment (sealed road) Existing catchment (mix of sealed road and agricultural)

68
Surface Water Quality AssessmentHume Coal
WSP | Parsons BrinckerhoffProject No 2200540A
Figure 5.11 Total Nitrogen cumulative frequency graph for sealed road southern catchment
Operational catchment (sealed road) Existing catchment (mix of sealed road and agricultural)

69
WSP | Parsons BrinckerhoffProject No 2200540A
Surface Water Quality AssessmentHume Coal
Figure 5.12 Total Phosphorus cumulative frequency graph for unsealed road catchment
Operational catchment (unsealed road) Existing catchment (agricultural)

70
Surface Water Quality AssessmentHume Coal
WSP | Parsons BrinckerhoffProject No 2200540A
Figure 5.13 Total Nitrogen cumulative frequency graph for unsealed road catchment
5.2.4 Intercepted baseflow
Partial depressurisation of some parts of the groundwater system will occur during underground mining.Dewatering of an unconfined or semi confined groundwater system will result in water level drawdown of thewater table (ie lowering of piezometric pressures). In areas where there are overlying streams receivinggroundwater contributions to baseflow, this will mean some level of interception of natural baseflow resultingin reduced streamflow, particularly during low flows.
The interception of natural baseflow due to underground mining has been calculated for stream reaches inthe project area using the numerical groundwater flow model for the project (Coffey 2016). Numericalgroundwater modelling has found that a reduction in baseflow will occur in the following streams:
à Medway Rivulet and its tributaries, including Oldbury Creek, Wells Creek, Wells Creek Tributary andBelanglo Creek;
à Lower Wingecarribee River and its tributaries;
à Lower Wollondilly River and its tributaries; and
à Bundanoon Creek and its tributaries.
Operational catchment (unsealed road) Existing catchment (agricultural)

71
WSP | Parsons BrinckerhoffProject No 2200540A
Surface Water Quality AssessmentHume Coal
A reduction in baseflow will result in reduced loadings for all parameters. However, concentrations mayincrease due to reduced baseflow where groundwater concentrations are lower than surface waterconcentrations.
To identify parameters where the concentration may increase due to reduced baseflow, the water quality ofthe streams in the project area has been compared to groundwater quality in the project area. Wheregroundwater concentrations are higher than surface water concentrations, a reduction in baseflow is likely toimprove the quality of surface water. However, where groundwater concentrations are lower than surfacewater concentrations, a reduction in baseflow may reduce the dilution of contaminants and result in anincrease in contaminant concentrations in the surface water.
Table 5.13 presents a comparison of surface water and groundwater quality in the project area. Thegroundwater quality data is from groundwater monitoring bores in the project area that target theHawkesbury Sandstone. Bores targeting the Hawkesbury Sandstone were selected as this is the major waterbearing unit in the project area and is understood to be providing baseflow to streams. The locations of thegroundwater monitoring bores are shown on Figure 5.14.
The 80th percentile of baseline surface water and groundwater quality data was compared. The results showthat concentrations of contaminants were generally higher in groundwater than surface water, with theexception of the following parameters which were consistently higher in surface water:
à Nitrate;
à Calcium, sodium and sulfate; and
à Aluminium.
Comparison to the ANZECC and ADWG guidelines indicates:
à Nitrate – 80th percentile of groundwater and surface water results are within guideline values;
à Phosphorous – 80th percentile of surface water results exceed HRC guideline value;
à Calcium, sodium and sulfate – 80th percentile of groundwater and surface water results are well belowguideline values; and
à Aluminium - 80th percentile of surface water results exceed guideline values for aquatic ecosystems andin some cases the ADWG, but not guidelines for irrigation or livestock.
The results indicate that there is potential for an increase in aluminium concentrations in surface water due toa reduction in groundwater baseflow to streams. Comparison to guideline values for aquatic ecosystems,drinking water, irrigation or livestock suggest changes in surface water aluminium concentrations are unlikelyto affect the beneficial use of surface water in the project area for irrigation or livestock.
Phosphorous concentrations were generally higher in surface water than groundwater, however thedifference between the 80h percentile of surface water and groundwater concentrations is consideredminimal and unlikely to be of concern for surface water quality in the project area.

72
Surface Water Quality AssessmentHume Coal
WSP | Parsons BrinckerhoffProject No 2200540A
Table 5.13 Comparison of groundwater and surface water quality
PARAMETER UNIT GUIDELINE GROUNDWATER (HAWKESBURY SANDSTONE) MEDWAY RIVULET MZ LOWER WINGECARRIBEE RIVER MZ LOWER WOLLONDILLY MZ
NO. OFSAMPLES
MIN MEDIAN 80TH %ILE MAX
MED
WA
YR
IVU
LET
OLD
BU
RY
CR
EEK
WEL
LSC
REE
KA
ND
WEL
LSC
REE
KTR
IBU
TAR
Y
WH
ITES
CR
EEK
BEL
AN
GLO
CR
EEK
AN
DPL
AN
TIN
GSP
AD
EC
REE
K
WIN
GEC
AR
RIB
EER
IVER
BLA
CK
BO
BS
CR
EEK
LONG
AC
RE
CR
EEK
STO
NY
CR
EEK
WO
LLO
NDI
LLY
RIV
ER
LONG
SWAM
PC
REE
KA
ND
HA
NG
ING
RO
CK
SWA
MP
CR
EEK
Physical parameters
Conductivity µS/cm 35 – 350 131 41 241 609 4882 613 571 599 668 118 239 408 112 732 587 183
Temperature °C - 131 10 18 20 33 20 19 18 19 13 22 19 19 20 22 17
Turbidity NTU 2 - 25 2 3.5 8.4 ID 13 9.6 12 22 11 14 54 12 42 23 27 4.6
pH pH units 6.5 - 8.0 131 4.1 6.1 5.2 (20th %ile)6.4 (80th %ile)
8.0 6.8 (20th%ile)7.6 (80th%ile)
7.0 (20th%ile)7.8 (80th%ile)
6.9 (20th%ile)7.7 (80th%ile)
6.8 (20th%ile)7.4 (80th%ile)
5.1 (20th%ile)6.5 (80th%ile)
7.0 (20th%ile)8.4 (80th%ile)
6.5 (20th%ile)7.4 (80th%ile)
5.8 (20th%ile)6.7 (80th%ile)
6.7 (20th%ile)7.6 (80th%ile)
7.3 (20th%ile)8.2 (80th%ile)
5.7 (20th%ile)6.9 (80th%ile)
TDS mg/L 600 131 27 159 403 3172 396 366 381 432 79 ND 264 64 465 ND 116
TSS mg/L - 18 <5 <5 15 25 9.0 9.0 17 12 2.8 22 10 21 17 20 5.0
Nutrients
Ammonia as N mg/L 0.5 22 <0.01 0.04 0.13 0.78 0.12 0.12 0.06 0.06 0.02 ND 0.08 0.01 0.04 ND 0.02
Nitrate (as N) mg/L 0.7 30 <0.01 0.02 0.08 0.77 0.66 0.66 0.08 2.6 0.08 0.24 0.09 0.02 0.04 ND 0.04
Nitrite (as N) mg/L 1.0 30 <0.01 <0.01 <0.01 <0.1 0.03 0.03 <0.01 0.02 <0.01 ND <0.01 <0.01 <0.01 ND <0.01
Total nitrogen as N mg/L 0.5* ND ND ND ND ND 2.1 2.1 1.0 3.8 0.40 1.21 0.90 1.5 2.4 0.97 0.50
Phosphorus mg/L 0.03* 18 <0.01 0.03 0.09 0.19 0.12 0.12 0.07 0.10 0.02 0.10 0.07 0.07 0.47 0.06 0.02
Major ions
Calcium mg/L 1,000 132 <1 5 29 198 32 40 22 43 1.4 ND 16 3.4 48 ND 3.4
Chloride mg/L 175 132 5.0 37 123 1300 96 66 114 76 27 32 80 20 133121
42
Magnesium mg/L 2,000 132 <1 5.0 28 236 23 13 29 13 3.4 ND 17 3.0 20 ND 3.0
Sodium mg/L 115 132 2.0 21 43 406 54 50 48 66 17 ND 32 11 63 ND 22
Sulfate as SO4 mg/L 250 132 <1 5.0 8.0 159 27 73 6 96 2.4 28 51 <1 10 19 1.0
Dissolved metals
Aluminium mg/L 0.055 89 <0.01 <0.01 0.02 0.41** 0.12 0.12 0.19 0.07 0.66 ND 0.23 0.84 0.16 ND 0.09
Antimony mg/L 0.003 89 <0.001 <0.001 <0.001 0.002 <0.001 <0.001 <0.001 <0.001 <0.001 <0.001 <0.001 <0.001 <0.001 <0.001 <0.001
Arsenic mg/L 0.01 89 <0.001 <0.001 0.002 0.04 0.001 <0.001 <0.001 <0.001 <0.001 <0.001 <0.001 <0.001 0.002 <0.001 <0.001
Barium mg/L 1.0 39 0.003 0.05 0.26 0.83 0.07 0.04 0.06 0.04 0.01 0.04 0.04 0.02 0.06 0.05 0.01
Beryllium mg/L 0.06 30 <0.001 <0.001 <0.001 <0.001 <0.001 <0.001 <0.001 <0.001 <0.001 <0.001 <0.001 <0.001 <0.001 <0.001 <0.001
Boron mg/L 0.37 89 <0.05 <0.05 <0.05 <0.05 <0.05 <0.05 <0.05 0.08 <0.05 0.02 <0.05 <0.05 <0.05 0.02 <0.05

73
WSP | Parsons BrinckerhoffProject No 2200540A
Surface Water Quality AssessmentHume Coal
PARAMETER UNIT GUIDELINE GROUNDWATER (HAWKESBURY SANDSTONE) MEDWAY RIVULET MZ LOWER WINGECARRIBEE RIVER MZ LOWER WOLLONDILLY MZ
NO. OFSAMPLES
MIN MEDIAN 80TH %ILE MAX
MED
WA
YR
IVU
LET
OLD
BU
RY
CR
EEK
WEL
LSC
REE
KA
ND
WEL
LSC
REE
KTR
IBU
TAR
Y
WH
ITES
CR
EEK
BEL
AN
GLO
CR
EEK
AN
DPL
AN
TIN
GSP
AD
EC
REE
K
WIN
GEC
AR
RIB
EER
IVER
BLA
CK
BO
BS
CR
EEK
LONG
AC
RE
CR
EEK
STO
NY
CR
EEK
WO
LLO
NDI
LLY
RIV
ER
LONG
SWAM
PC
REE
KA
ND
HA
NG
ING
RO
CK
SWA
MP
CR
EEK
Cadmium mg/L 0.0002 89 <0.0001 <0.0001 <0.0001 0.0008 <0.0001 <0.0001 <0.0001 <0.0001 <0.0001 <0.0001 <0.0001 <0.0001 <0.0001 <0.0001 <0.0001
Chromium mg/L 0.001 89 <0.001 <0.001 <0.001 0.008 <0.001 <0.001 <0.001 <0.001 <0.001 <0.001 <0.001 0.001 <0.001 <0.001 <0.001
Cobalt mg/L 0.05 89 <0.001 0.003 0.009 0.27 <0.001 <0.001 <0.001 <0.001 <0.001 <0.001 0.01 <0.001 0.002 <0.001 <0.001
Copper mg/L 0.0014 89 <0.001 <0.001 0.006 0.26 0.002 0.001 0.002 0.002 <0.001 0.003 0.002 0.002 0.003 0.005 <0.001
Iron mg/L 0.2 132 <0.05 4.9 11 22 0.51 0.35 0.55 0.14 0.33 ND 1.3 1.1 0.54 ND 0.42
Lead mg/L 0.0034 89 <0.001 <0.001 <0.001 0.006 <0.001 <0.001 <0.001 <0.001 <0.001 <0.001 <0.001 <0.001 <0.001 <0.001 <0.001
Manganese mg/L 0.1 132 0.001 0.42 0.79 1.7 0.14 0.13 0.22 0.12 0.02 ND 0.26 0.06 0.84 ND 0.02
Mercury mg/L 0.0006 18 <0.0001 <0.0001 <0.0001 <0.0001
<0.0001 <0.0001 <0.0001 <0.0001 <0.0001 ND <0.0001 <0.0001 <0.0001 ND <0.0001
Molybdenum mg/L 0.01 89 <0.001 <0.001 0.001 0.011 <0.001 <0.001 <0.001 <0.001 <0.001 <0.001 <0.001 <0.001 0.002 <0.001 <0.001
Nickel mg/L 0.011 89 <0.001 0.008 0.02 0.63 0.003 0.002 0.002 0.002 <0.001 0.002 0.02 0.002 0.003 0.002 <0.001
Selenium mg/L 0.01 89 <0.01 <0.01 <0.01 0.16 <0.01 <0.01 <0.01 <0.01 <0.01 <0.01 <0.01 <0.01 0.01 <0.01 <0.01
Silver^ mg/L 0.00005 ND ND ND ND ND <0.01 0.02 <0.001 <0.01 <0.001 <0.001 <0.001 <0.001 0.01 ND <0.001
Zinc mg/L 0.008 89 <0.005 0.02 0.07 0.32 <0.005 0.005 <0.005 0.02 <0.005 0.007 0.05 0.01 <0.005 0.008 <0.005
Hydrocarbons
Benzene µg/L 1 20 <1 <1 <1 <1 <1 <1 <1 <1 <1 ND <1 <1 <1 ND <1
Toluene µg/L 25 20 <2 7.0 18 20 <2 <2 <2 <2 <2 ND <2 <2 <2 ND <2
Ethylbenzene µg/L 3 20 <2 <2 <2 <2 <2 <2 <2 <2 <2 ND <2 <2 <2 ND <2
Total xylene µg/L 20 20 <2 <2 <2 <2 <2 <2 <2 <2 <2 ND <2 <2 <2 ND <2
Naphthalene µg/L 16 20 <5 <5 <5 <5 <5 <5 <5 <5 <5 ND <5 <5 <5 ND <5ND No dataID Insufficient data to calculateMZ Management zone*WQO recommended by Healthy Rivers Commission Inquiry into the Hawkesbury-Nepean River (HRC 1998).^ Standard and trace laboratory limits of reporting exceed the ANZECC guideline for aquatic ecosystems.** Concentrations of most dissolved metals are low, as is characteristic for groundwater with circumneutral pH. Most aluminium measurements are below the detection limit (0.01 mg/L), although a maximum of 0.41 mg/L was recorded in one instance. Aluminium concentrations above 0.01 mg/L are notrepresentative of dissolved species and are believed to be outliers (Geosyntec 2016).Cells shaded grey indicate 80th percentile surface water concentrations exceed 80th percentile groundwater concentrationsValues in bold indicate lowest guideline value exceeded and 80th percentile surface water concentrations exceed 80th percentile groundwater concentrations

#*#*
#*#*
#*
#*
#*
#*
#*
#*#*
#*
#*
#*
#*
#*
#*
#*
#*#*
#*
BR ETHREN GULLY
WING E CARRI BEE RI VE
R
WELL
SCR
EEK
TRIB
UTAR
Y
PLANTING
S PADE C R EE K
BARO
NGA C
REEK
NORRI
S CRE
EK
PAYNES CR
EEK
FIRE DAM CREEK
MORR
ICECR
EEK
PI VETS CREEK
BLUEARM GULLY
LUTWYCHECREEK
INDIGO
CREEK
REEDY CREEK
ROCK
YCR
EEK
STONEQUARRY CREEK
RED ARM CREEK
S CHOOL
CREE
K
BELANGLO CREEK
STONY CREEK
COLYERS CREEKLONGACRECREEK
WHITES CREEK
OLDB URY
CREEK
BUNDANO ON CREEK
WE LLSCREEK
EMU CREEK
LONGSWAMPCREEK
MEDWAY RIVULET
BLACK B OBS CREEK
HU0023PZB/C
HU0133PZC
HU0136PZB
HU0018PZBHU0019PZB
HU0032LDB
HU0037PZB
HU0038PZC
HU0042PZC
HU0056XPZB
HU0072PZB/C
HU0073PZC
HU0088PZB
HU0096PZB
HU0118PZA
HU0129PZB
HU0142PZB/C
HU0143PZC
BELANGLOSTATE
FOREST
MERYLASTATE FOREST
NEW BERRIMA
MOSS VALE
EXETER
SUTTON FOREST
BURRADOO
BOWRAL
BERRIMAMEDWAY
CANYONLEIGHHU
ME HIGHWAY
MOSS
VALE
ROAD
ARGYLESTR
EET
OLD HUME HIGHWAY
ILLAWARRA HIGHWAY
HUME
MOT
ORWA
Y
BERRIMA
ROAD
EXET
ERRO
AD
CENTENNIA
L ROAD
ME
DWAYD AM
240000 250000 26000061
7000
0
6170
000
6180
000
6180
000
Legend#*
Hume Coal groundwater monitoringboreRail line
RoadNatural drainage line
Hume Coal Project areaState forest/National park
WaterbodyElevation (mAHD)
821
501
!(
!(
!(
!(
!(
!(
NOWRA
SYDNEYCAMDENPICTON
MOSS VALE
WOLLONGONG
0 1,000 2,000
m
Approved by: LRDate: 14/11/2016
Map: 2200540A_GIS_069_A2 Author: RP
Hume Coal Surface Water Quality AssessmentFigure 5.10
Groundwater quality monitoring locations
1:75,000
Coordinate system: GDA 1994 MGA Zone 56
Scale ratio correct when printed at A3
°
\\APSYDFIL03\proj\H\HUME_COAL_PTY_LTD\2200540A_HUME_SURFACE_WATER_EIS\10_GIS\Projects\Maps2200540A_GIS_069_A2.mxd Hume Coal
© WSP l Parsons Brinckerhoff - Asia Pacific (WSP l PB) Copyright in the drawings, information and data recorded is the property of WSP l PB. This document and the information are solely for the use of the authorisedrecipient and this document may not be used, copied or reproduced in whole or part for any purpose other than that which it was supplied by WSP l PB. WSP l PB makes no representation, undertakes no duty and acceptsno responsibility to any third party who may use or rely upon this document or the information. NCSI Certified Quality System to ISO 9001. © APPROVED FOR AND ON BEHALF OF© WSP l Parsons Brinckerhoff - Asia Pacific.
Data source: NSW Land and Property Information 2015, Hume Coal
www.wsp-pb.com
Figure 5.14

75
WSP | Parsons BrinckerhoffProject No 2200540A
Surface Water Quality AssessmentHume Coal
5.2.5 Cumulative impacts
The proposed Berrima Rail Project is located upstream of the Hume Coal Project in the Oldbury Creekcatchment (Figure 1.2).
The surface water quality assessment undertaken for the Berrima Rail Project indicates that with theimplementation of appropriate management plans and treatment measures in place (ie swales), the waterquality in Oldbury Creek will not be impacted by construction, operation or rehabilitation of the Berrima RailProject.
Cumulative impacts to surface water quality associated with the Hume Coal and Berrima Rail projects willtherefore be negligible. Refer to the Berrima Rail Project EIS (EMM 2016c) for details of the surface waterassessment.

76
Surface Water Quality AssessmentHume Coal
WSP | Parsons BrinckerhoffProject No 2200540A
6 MITIGATION MEASURES ANDMONITORING PROGRAM
This section presents recommended mitigation and management measures for the Hume Coal Projectto avoid impacts on surface water quality. Mitigation and management measures should beimplemented during construction and rehabilitation as well as during operation of the mine.
6.1 Environmental management plans
Most of the potential impacts to surface water quality during construction, operation and rehabilitationcan be prevented through the implementation of project-specific environmental management plans.Consistent mitigation and management measures should be applied during construction, operationand rehabilitation of the project to provide personnel with a common understanding of the measures tobe applied. The following environmental management plans should be developed and applied for theproject:
à An erosion and sediment control plan, which details the measures to control erosion andsedimentation with the project area and of local waterways during construction, operation andrehabilitation phases. Details of the plan are provided in Section 6.2.
à A hazardous materials plan, which details the approach to managing and storing hazardousmaterials, including fuels, oils, lubricants and chemicals for the WTP.
à A contingency plan for environmental incidents, which details the response actions during anenvironmental incident such as an oil spill.
à A waste management plan, which details the approach to the management of general waste,sewage and by-products of water treatment on site.
6.2 Construction and rehabilitation
The construction and rehabilitation phases of the project will involve earthworks activities which havethe potential to cause erosion and sedimentation of local waterways and water quality impacts in thewaterways due to increased TSS loads (and associated adsorbed phase contaminants) if notappropriately managed.
An erosion and sediment control plan should be prepared (as noted in Section 6.1). The erosion andsediment control plan should be part of a Water Cycle Management Plan for the project, which may berequired by Developments in Sydney’s Drinking Water Catchment – Water Quality InformationRequirements (WaterNSW 2015). The erosion and sediment control plan should be developed toachieve the surface water management objective below, and should incorporate the soil and watermanagement principles below.
6.2.1 Surface water management objective
According to Vol. 2 of Managing Urban Stormwater: Soils and Construction the goal for surface watermanagement is:

77
WSP | Parsons BrinckerhoffProject No 2200540A
Surface Water Quality AssessmentHume Coal
‘…to ensure that there is no pollution of surface or ground waters. Current best-practiceerosion and sediment control techniques are, however, unlikely to achieve this goal, due to thelimited effectiveness of most of these techniques. An appropriate management objective istherefore to take all reasonable measures (i.e. implement best-practice) to minimise water-quality impacts from erosion and sedimentation.
Given the limited effectiveness of techniques for retaining eroded sediment, a strongemphasis should be placed on pollution prevention through erosion control, rather than relyingon treatment techniques to capture these sediments.’
Therefore, with the paramount objective of not polluting surface waters in the first place, the strategyshould be to minimise the discharge of sediment-laden waters from the sites to the adjacentwaterways and drainage lines.
6.2.2 Soil and water management principles
The primary principle for surface water management at the site is to minimise erosion and sedimentgeneration at the source, and where this is not possible, to capture and treat any sediment generatedbefore discharge into receiving waterways. The following general principles provide a framework forthe development of site-specific options to achieve this:
à Minimise the volume of clean surface water running onto the site from off site.
à Minimise the extent of disturbed areas.
à Minimise surface water from running onto disturbed areas of the site by staging operations and,where necessary, utilising surface water diversion drains and bunds for disposal and processingareas.
à Implement erosion control strategies to minimise generation of sediment in the surface water.
à Implement sediment control strategies to reduce the release of sediment in surface water fromthe site.
à Minimising the amount of surface water runoff discharged from the site and maximising reuseonsite.
à Maintain all erosion and sediment controls properly by implementing an inspection schedule.
à Vegetate disturbed areas progressively.
à Adopt strategies for early identification of potential surface water issues.
6.3 Operation
The operational phase of the project will involve coal stockpiling and handling activities which have thepotential to cause contamination of local waterways if not appropriately managed. The followingsections detail the mitigation and management measures that should be implemented to avoid andmitigate potential impacts on surface water quality.
6.3.1 Mine water management system
A mine water management system will be implemented during operation of the project to preventcontamination of local waterways. Surface water runoff from disturbed areas of the site will be fullycontained within the mine water management system to prevent uncontrolled discharge of coal

78
Surface Water Quality AssessmentHume Coal
WSP | Parsons BrinckerhoffProject No 2200540A
contact water to local waterways. The water management system for the project is detailed in theWater Balance Assessment Report (Parsons Brinckerhoff, 2016b).
6.3.2 SB03 and SB04 releases
Water will only be released from SB03 and SB04 to Oldbury Creek after the first flush to these dams ispumped to the PWD and contained within the mine water management system. The first flush criteriaadopted for the project were developed based on the NSW EPA guideline provided at thehttp://www.epa.nsw.gov.au/mao/stormwater.htm (refer Section 5.2.1). Routine monitoring of waterquality in SB03 and SB04 will be undertaken and in-line monitoring of TDS and pH will be undertakenprior to release to Oldbury Creek to confirm the water in the dams complies with water qualitydischarge limits to be developed.
Water quality discharge limits will be developed in consultation with the Environment ProtectionAuthority to protect the environmental values in the Hawkesbury-Nepean Basin and achieve a NorBEeffect on water quality. Preliminary discharge limits for SB03 and SB04 are provided in Table 6.1.These preliminary limits are based on discharge limits in Environment Protection Licences for othersimilar operations in the Illawarra and Southern Highlands.
Table 6.1 Preliminary discharge limits for SB03 and SB04 releases
POLLUTANT UNIT OF MEASURE 100 PERCENTILECONCENTRATION LIMIT
pH pH units 6.5 – 8.5
Total dissolved solids (TDS) mg/L 1500
Total suspended solids (TSS) mg/L 50
Oil and grease mg/L 10
In the event that water quality in SB03 or SB04 does not meet the discharge limits, water will not bedischarged to Oldbury Creek and will be contained within the mine water management system. Themine water balance modelling (refer to the Water Balance Assessment Report, Parsons Brinckerhoff2016b) has demonstrated that the PWD has the capacity to store all runoff from SB03 and SB04 for allclimate sequences, if required.
The discharge limits will be checked using routine monitoring of the water in SB03 and SB04. Simplerin-line testing for TDS and pH will be undertaken at the day to day operational level to inform decisionson whether to release water. This is discussed further in Section 6.4.
6.3.3 Stormwater management measures
All activities within and outside the water management system should be managed in accordance witha Water Cycle Management Plan. The Water Cycle Management Plan should outline all surface watermanagement works following the relevant guidelines set out in the Blue Book, Volume 1 (Landcom,2004) and the Blue Book, Volume 2E (DECC, 2008). The following site-specific controls would befinalised in the Water Cycle Management Plan:
à Minimise land disturbance.
à Vegetate disturbed areas progressively.

79
WSP | Parsons BrinckerhoffProject No 2200540A
Surface Water Quality AssessmentHume Coal
à Stabilisation and drainage of site access roads.
à Control vehicular access to site.
à Dust control.
à Soil and stockpile management.
à Clean water diversion.
à Sediment basin systems for long-term work areas, if required.
à Vegetation establishment.
à Site induction and staff training and education.
à Inspection and monitoring.
à Maintenance of surface water management measures.
à Minimise surface water runoff discharged from the site and maximise reuse onsite.
à Properly maintain all erosion and sediment controls by implementing an inspection schedule.
à Adopt strategies for early identification of potential surface water issues.
6.4 Surface water quality monitoring program
A surface water quality monitoring program will be implemented for the receiving environment duringconstruction, operation and rehabilitation of the project. The program will involve surface water qualitymonitoring in Medway Rivulet and Oldbury Creek upstream and downstream of working areas duringconstruction and rehabilitation and upstream and downstream of surface infrastructure for the mineduring operation. Results of the surface water quality monitoring will be compared to site specificWQOs developed in accordance with the National Water Quality Management Strategy to assessimpacts to surface water quality in the receiving environment associated with the project and triggerthe implementation of mitigation and remediation measures if required.
6.4.1 Monitoring locations
Surface water quality monitoring will be undertaken in the receiving environment at existing monitoringlocations SWQ04 and SWQ15 on Medway Rivulet and SWQ17 and SWQ19 on Oldbury Creek.Monitoring at locations upstream and downstream of surface infrastructure areas and discharge pointswill allow the impacts of the project on water quality to be assessed. In addition, routine water qualitymonitoring will be undertaken at SB03 and SB04 and in-line testing of TDS and pH in the SB03 andSB04 discharges will be undertaken prior to release to Oldbury Creek. The surface water qualitymonitoring locations for the project are shown on Figure 6.1.
6.4.2 Monitoring frequency
Surface water quality monitoring should be undertaken on a monthly basis at the locations shown onFigure 6.1. Monitoring will be undertaken throughout the construction, operation and rehabilitationphases of the project.
In-line monitoring of TDS and pH should also be undertaken on a daily basis prior to and during therelease of water from SB03 and SB04 to check that the concentrations of these key parameters arewithin discharge limits.

80
Surface Water Quality AssessmentHume Coal
WSP | Parsons BrinckerhoffProject No 2200540A
Monthly surface water quality monitoring will continue at the locations shown on Figure 6.1 prior tocommencement of the project to continue development of the baseline dataset.
6.4.3 Key parameters
Surface water quality monitoring will be undertaken for the potential contaminants associated withproject activities during construction, operation and rehabilitation of the project. Key parameters ofconcern in the Hawkesbury-Nepean catchment, as identified in the report Healthy Rivers CommissionInquiry into the Hawkesbury-Nepean River (HRC 1998), will also be monitored (refer Section 2.6).
Provision should be made to review the monitoring program annually or every two years so thatredundancies and other improvements can be made based on the results of the monitoring program.
The key parameters for the surface water quality monitoring program are summarised in Table 6.2.
Table 6.2 Parameters for surface water quality monitoring program
CATEGORY SUITE OF ANALYTES
Physical parameters TDS, TSS, turbidity, pH
Major ions Calcium, magnesium, sodium, potassium, chloride, sulfate,alkalinity, reactive silica
Metals – dissolved and total Aluminium, antimony, arsenic, barium, beryllium, boron,cadmium, chromium, cobalt, copper, iron, lead, manganese,mercury, molybdenum, nickel, selenium, silver, zinc.
Nutrients Ammonia, nitrate, nitrite, TN, TP, phosphorous (reactive)
Hydrocarbons TRH/TPH, BTEX, naphthaleneTRH/TPH – Total Recoverable Hydrocarbons/Total Petroleum HydrocarbonsBTEX – Benzene, Toluene, Ethylbenzene, Xylene

#*
#*
#*
#*
")
")
!(
O LDBURY C REEK
MEDW
AYRIVU LET
IM1
PLANTINGSPADE CREEK
BLACK SPRINGS CREEK
BELANGLO CREEK
WELLS CREEK
M ED WAY DA M
NEW BERRIMA
HUME HIGHWAY
BELANGLO ROAD
COWLISHAWSFIRETRAIL
OLD HUM
E HIGHWAY
OLDBURY
ROAD
TAYLOR AVENUE
WINDEL
LARO
AD
TR EEC A
VE
FIRETRAIL
MEREWORTH ROAD
MEDWAY ROAD
HUME
MOT
ORWA
Y
O L DBURY STREET
SYDN
EY S
TREE
T
OL D PINEROAD
AUSTRALIA AVENUE
GINGENBULLEN LANE
GOLDEN VALE ROAD
B ELANGLOCREEK
RO
AD
ARGY
LEST
REET
SWQ04
SWQ15
SWQ17
SWQ19
SB03
SB04
248000 249000 250000 251000 252000 253000 254000 25500061
7600
0
6176
000
6177
000
6177
000
6178
000
6178
000
6179
000
6179
000
6180
000
6180
000
Legend!(
In-line monitoringlocation
#*
Receivingenvironment surfacewater qualitymonitoring location
")Routine dammonitoring locationProject area
Indicative surfaceinfrastructure feature
Existing WSCeasementProposed powerlineand pipelineeasementPowerline route
Drift (underground)
Conveyor
Water pipeline
All-weather track
Berrima Rail project
TemporaryconstructionaccommodationvillageAdministration/bathhouse/workshopTopsoil stockpiles
StormwatermanagementearthworksTop water level
Primary water damcatchmentStormwater basincatchmentMine water damcatchment
Existing featureRail line
Main road
Local road
Natural drainage line
Waterbody
!(
!(
!(
!(
!(
!(
NOWRA
SYDNEYCAMDENPICTON
MOSS VALE
WOLLONGONG
0 250 500
m
Approved by: LRDate: 21/10/2016
Map: 2200540A_GIS_070_A2 Author: RP
Hume Coal Surface Water Quality AssessmentFigure 6.1
Receiving environment surface water quality monitoring locations
1:20,000
Coordinate system: GDA 1994 MGA Zone 56
Scale ratio correct when printed at A3
°
\\APSYDFIL03\proj\H\HUME_COAL_PTY_LTD\2200540A_HUME_SURFACE_WATER_EIS\10_GIS\Projects\Maps2200540A_GIS_070_A2.mxd Hume Coal
© WSP l Parsons Brinckerhoff - Asia Pacific (WSP l PB) Copyright in the drawings, information and data recorded is the property of WSP l PB. This document and the information are solely for the use of the authorisedrecipient and this document may not be used, copied or reproduced in whole or part for any purpose other than that which it was supplied by WSP l PB. WSP l PB makes no representation, undertakes no duty and acceptsno responsibility to any third party who may use or rely upon this document or the information. NCSI Certified Quality System to ISO 9001. © APPROVED FOR AND ON BEHALF OF© WSP l Parsons Brinckerhoff - Asia Pacific.
Data source: © Land and Property Information 2015, Hume Coal, Google Earth
www.wsp-pb.com

82
Surface Water Quality AssessmentHume Coal
WSP | Parsons BrinckerhoffProject No 2200540A
6.4.4 Water quality objectives
WQOs are specific water quality targets that can be used as indicators of management performance.
The HRC (1998) report recommends that the ANZECC guidelines be adopted as suitable WQOs for theHawkesbury-Nepean River catchment, with the exception of nutrients and chlorophyll-a. The environmentalvalues in the project area are provided in Section 4.1 and guideline values for these provided in Table 2.2.For total nitrogen and total phosphorous, the WQOs will be adopted from the report Healthy RiversCommission Inquiry into the Hawkesbury-Nepean River (HRC 1998), which provides catchment specificWQOs for these nutrients.
In circumstances where the median or 80th percentile baseline concentration exceeds the guideline value inthe NWQMS guidelines or the WQO in the Healthy Rivers Commission report, site specific WQOs will bedeveloped in accordance with the referential approach in ANZECC (2000). The referential approach involvescalculating WQOs on the basis of maximum acceptable departure from reference condition. The acceptabledeparture suggested is that the WQO be based on the 20th and/or 80th percentile (whichever is mostappropriate for the indicator) of values at the reference site.
Ideally site specific WQOs should be based on 24 months of baseline or reference data. The surface waterquality results presented in this report are for the period July 2014 to September 2015, however monthlysurface water quality monitoring is ongoing and further data will be available in future. Preliminary WQOsand the relevant source basis are provided in Table 6.3. Final WQOs should be developed using theadditional surface water quality data collected prior to commencement of construction of the project.
Table 6.3 Preliminary water quality objectives for Hume Coal Project
PARAMETER UNIT MEDWAY RIVULET OLDBURY CREEKPRELIMINARYWQO
SOURCE PRELIMINARYWQO
SOURCE
Physical parametersConductivity µS/cm 613 Preliminary WQO
(80th percentile ofbaseline)
571 Preliminary WQO(80th percentile of
baseline)Turbidity NTU 25* ANZECC aquatic
ecosystems25* ANZECC aquatic
ecosystemspH pH units 6.5 - 8.0 ANZECC aquatic
ecosystems6.5 - 8.0 ANZECC aquatic
ecosystemsTotal dissolved solids(TDS)
mg/L 600 ADWG aesthetic 600 ADWG aesthetic
Total suspended solids(TSS)
mg/L 9 Preliminary WQO(80th percentile of
baseline)
9 Preliminary WQO(80th percentile of
baseline)NutrientsAmmonia as N mg/L 0.5 ADWG aesthetic 0.5 ADWG aestheticNitrate (as N) mg/L 0.7 ANZECC aquatic
ecosystems0.7 ANZECC aquatic
ecosystemsNitrite (as N) mg/L 1 ANZECC
recreational1 ANZECC
recreationalTotal nitrogen as N mg/L 1.1 Preliminary WQO
(80th percentile ofbaseline)
2.1 Preliminary WQO(80th percentile of
baseline)Phosphorus mg/L 0.08 Preliminary WQO
(80th percentile ofbaseline)
0.12 Preliminary WQO(80th percentile of
baseline)

83
WSP | Parsons BrinckerhoffProject No 2200540A
Surface Water Quality AssessmentHume Coal
PARAMETER UNIT MEDWAY RIVULET OLDBURY CREEKPRELIMINARYWQO
SOURCE PRELIMINARYWQO
SOURCE
Major ionsCalcium mg/L 1,000 ANZECC livestock 1,000 ANZECC livestockChloride mg/L 175 ANZECC irrigation 175 ANZECC irrigationMagnesium mg/L 2,000 ANZECC livestock 2,000 ANZECC livestockSodium mg/L 115 ANZECC irrigation 115 ANZECC irrigationSulfate as SO4 mg/L 250 ADWG aesthetic 250 ADWG aestheticDissolved metalsAluminium mg/L 0.12 Preliminary WQO
(80th percentile ofbaseline)
0.12 Preliminary WQO(80th percentile of
baseline)Antimony mg/L 0.003 ADWG health 0.003 ADWG healthArsenic mg/L 0.01 ADWG health 0.01 ADWG healthBarium mg/L 1 ANZECC
recreational1 ANZECC
recreationalBeryllium mg/L 0.06 ADWG health 0.06 ADWG healthBoron mg/L 0.37 ANZECC aquatic
ecosystems0.37 ANZECC aquatic
ecosystemsCadmium mg/L 0.0002 ANZECC aquatic
ecosystems0.0002 ANZECC aquatic
ecosystemsChromium mg/L 0.001 ANZECC aquatic
ecosystems0.001 ANZECC aquatic
ecosystemsCobalt mg/L 0.05 ANZECC irrigation 0.05 ANZECC irrigationCopper mg/L 0.002 Preliminary WQO
(80th percentile ofbaseline)
0.0014 ANZECC aquaticecosystems
Iron mg/L 0.51 Preliminary WQO(80th percentile of
baseline)
0.35 Preliminary WQO(80th percentile of
baseline)Lead mg/L 0.0034 ANZECC aquatic
ecosystems0.0034 ANZECC aquatic
ecosystemsManganese mg/L 0.14 Preliminary WQO
(80th percentile ofbaseline)
0.13 Preliminary WQO(80th percentile of
baseline)Mercury mg/L 0.0006 ANZECC aquatic
ecosystems0.0006 ANZECC aquatic
ecosystemsMolybdenum mg/L 0.01 ANZECC irrigation 0.01 ANZECC irrigationNickel mg/L 0.011 ANZECC aquatic
ecosystems0.011 ANZECC aquatic
ecosystemsSelenium mg/L 0.01 ADWG health 0.01 ADWG healthSilver mg/L 0.001 Laboratory limit of
reporting (higherthan lowestguideline)
0.02 Preliminary WQO(80th percentile of
baseline)
Zinc mg/L 0.008 ANZECC aquaticecosystems
0.01 Preliminary WQO(80th percentile of
baseline)HydrocarbonsBenzene µg/L 1 ADWG health 1 ADWG healthToluene µg/L 25 ADWG aesthetic 25 ADWG aesthetic

84
Surface Water Quality AssessmentHume Coal
WSP | Parsons BrinckerhoffProject No 2200540A
PARAMETER UNIT MEDWAY RIVULET OLDBURY CREEKPRELIMINARYWQO
SOURCE PRELIMINARYWQO
SOURCE
Ethylbenzene µg/L 3 ADWG aesthetic 3 ADWG aestheticXylene µg/L 20 ADWG aesthetic 20 ADWG aestheticNaphthalene µg/L 16 ANZECC aquatic
ecosystems16 ANZECC aquatic
ecosystemsNotes:*Upper limit used
6.4.5 WQO exceedance response
Exceedances of the WQOs at downstream monitoring locations SWQ15 on Medway Rivulet and SWQ19 onOldbury Creek should be investigated as follows:
à The concentration at the downstream monitoring location would be compared to the concentration at theupstream monitoring location and:
§ if the concentration at the upstream location exceeds or is equal to the concentration at thedownstream location, no further action is required; or
§ if the concentration at the upstream location is lower than the concentration at the downstreamlocation, then the next routine monitoring results are checked. If the monitoring data shows areoccurrence of the exceedance of the WQO at the downstream location and the lowerconcentrations at the upstream location, an investigation into the source of contamination and risksto environmental values would be undertaken.
à If the investigation confirms that the exceedance is a result of Hume Coal activities and indicatespotential for risks to environmental values, an action plan to mitigate potential harm would bedeveloped.

85
WSP | Parsons BrinckerhoffProject No 2200540A
Surface Water Quality AssessmentHume Coal
7 CONCLUSIONSConstruction and rehabilitation phase impacts of the project on surface water quality are expected to beneutral by implementing best practice erosion and sediment control management measures in accordancewith relevant legislation and guidelines.
The mine water management system has been designed to ensure that no coal contact water is released tothe receiving environment. The Water Balance Assessment (Parsons Brinckerhoff, 2016b) hasdemonstrated that all coal contact water will be contained and reused during operation.
The project activities that have the potential to impact on surface water quality during operation are asfollows:
à Releases from non-coal contact mine water dams SB03 and SB04 to Oldbury Creek following pumpingof the first flush to the PWD for reuse.
à Runoff from mine access roads that drain into the Medway Rivulet catchment.
à The interception of natural baseflow due to underground mining which may change the loading andconcentration of some water quality parameters in the surface waters.
MUSIC modelling has demonstrated that the release of water from SB03 and SB04 to Oldbury Creek willmeet the NorBE criteria for TSS, TP and TN due to the reduction in flow and associated reduction in loadingand concentration compared to the existing agricultural catchment for these contaminants. For othercontaminants that may be present in the runoff to these dams, water quality discharge limits will be set androutine and in-line monitoring of water quality in releases from SB03 and SB04 will be undertaken to checkthat the water in the basins complies with the discharge limits.
For SB03 and SB04, the water quality discharge limits will be developed to protect the environmental valuesin the Hawkesbury-Nepean Basin and to achieve a NorBE on water quality. Preliminary limits have beenestablished in this report which will be refined in consultation with the NSW Environment ProtectionAuthority.
MUSIC modelling has also demonstrated that swales can be used to provide an effective treatment systemfor the runoff from the access roads to meet the NorBE criteria.
Assessment of the impact of intercepted baseflow was based on a comparison of contaminantconcentrations in groundwater and surface water from the monitoring results. The results indicate that thereis potential for an increase in aluminium concentrations in surface water due to a reduction in groundwaterbaseflow to streams; however, comparison to guideline values for aquatic ecosystems, drinking water,irrigation or livestock suggest changes in surface water aluminium concentrations are unlikely to affect thebeneficial use of surface water in the project area for irrigation or livestock.
The Hume Coal Project and the Berrima Rail Project will not have cumulative impacts on surface waterquality as the rail project has been assessed to meet the NorBE criteria in its discharge to the Oldbury Creekcatchment upstream of the Hume Coal Project.
Preliminary WQOs for the receiving environment have been established in this report based on relevantlegislation and guidelines to set targets for monitoring the performance of the project impact on MedwayRivulet and Oldbury Creek. Final WQOs should be developed using the additional surface water quality datacollected prior to commencement of construction of the project. Surface water quality monitoring should beundertaken throughout construction, operation and rehabilitation at upstream and downstream sites onMedway Rivulet and Oldbury Creek to monitor changes in surface water quality in the receiving environmentassociated with the project and trigger the implementation of mitigation and remediation measures ifrequired.

86
Surface Water Quality AssessmentHume Coal
WSP | Parsons BrinckerhoffProject No 2200540A
8 REFERENCESAustralian and New Zealand Environment and Conservation Council (ANZECC) and Agriculture andResources Management Council of Australia and New Zealand (ARMCANZ) (2000) Australian and NewZealand Guidelines for Fresh and Marine Water Quality. National Water Quality Management Strategy.Paper No. 4. Volume 1. The Guidelines, Chapter 1-7.
Beca (2010) Medway Water Treatment Plant Viability Study, August 2010
Department of Agriculture and Water Resources 2016 National Water Quality Management Strategy(NWQMS) http://agriculture.gov.au/water/quality/nwqms. Page last reviewed 23 August 2016.
Department of Environment and Climate Change (NSW) 2008 Managing Urban Stormwater: Soils andConstruction. Volume 2. DECC Sydney (the ‘Blue Book’ Volume 2).
Department of Science, Information Technology, Innovation and the Arts (DSITIA) 2015. Data Drill LongPaddock website https://www.longpaddock.qld.gov.au/silo/about.html
EMM 2016a. Hume Coal Project Environmental Impact Statement. Prepared for Hume Coal Pty Limited.
EMM 2016b Hume Coal Project Biodiversity Assessment Report. Prepared for Hume Coal Pty Limited.
EMM 2016c. Berrima Rail Project Environmental Impact Statement. Prepared for Hume Coal Pty Limited.
Engineers Australia 1987 Australian Rainfall and Runoff, 3rd Edition - A Guide to Flood Estimation
Engineers Australia 2006 Australian Runoff Quality – a guide to water sensitive urban design, Wong, T. H. F.(Editor-in-Chief), Engineers Media, Crows Nest, New South Wales.
Fletcher, T; Duncan, H; Poelsma, P; Lloyd, S (2004). Stormwater flow and quality and the effectiveness ofnon-proprietary stormwater treatment measures – a review and gap analysis. Technical Report. CooperativeResearch Centre for Catchment Hydrology. Monash University.
Geosyntec 2016, Hydrogeochemical Assessment: Hume Coal Project, Report for Hume Coal.
Healthy Rivers Commission 1998 Healthy Rivers Commission Inquiry into the Hawkesbury-Nepean River.Final report. August 1998.
Hume Coal 2013 Light detection and ranging (LiDAR). Data obtained from aerial laser survey on 25 October2013.
Landcom 2004 Managing Urban Stormwater: Soils and Construction. Volume 1. 4th Edition. LandcomSydney (the ‘Blue Book’ Volume 1).
Manly Hydraulics Laboratory (MHL) 2016 Hume Coal Hydrometric Monitoring Report
National Health and Medical Research Council (2011) Australian Drinking Water Guidelines 6. NationalWater Quality Management Strategy. Version 3.2. Updated February 2016.
NSW DPI 2013 Fisheries NSW Policy and Guidelines for Fish Habitat Conservation and Management (2013update).
Office of Environment and Heritage (OEH) 2016 NSW Water Quality and River Flow Objectives.http://www.environment.nsw.gov.au/ieo/, page last updated 28 June 2006.

87
WSP | Parsons BrinckerhoffProject No 2200540A
Surface Water Quality AssessmentHume Coal
Parsons Brinckerhoff 2016a. Hume Coal Project Surface Water Flow and Geomorphology Assessment.Document reference 2172599B-SFW-REP-001 RevE. 30 September 2016.
Parsons Brinckerhoff 2016b. Hume Coal Project Water Balance Assessment. Document reference2200539A-WAT-REP-001 Rev5. 15 September 2016.
Parsons Brinckerhoff 2016c. Hume Coal Project Water Fieldwork and Monitoring Report. Documentreference 2200539A-RES-REP-7812 RevC. 7 July 2016.
RGS (2016) Geochemical assessment of coal and mining waste materials, Hume Coal Project, Second draftreport prepared for Hume Coal Pty Ltd, 31 March 2016.
Sydney Catchment Authority (SCA) (2012) Using MUSIC in Sydney’s Drinking Water Catchments. A SydneyCatchment Authority Standard. Sydney Catchment Authority, Sydney. December 2012.
Sydney Catchment Authority (SCA) 2015 Neutral or Beneficial Effect on Water Quality AssessmentGuideline. Sydney Catchment Authority, Sydney. February 2015.
WaterNSW 2015 Developments in Sydney’s Drinking Water Catchment – Water Quality InformationRequirements. TRIM Ref: CD2012/170[v2]. February 2015.

Appendix ABASELINE SURFACE WATER QUALITY DATA

MEDWAY RIVULET MANAGEMENT ZONEPARAMETER UNIT GUIDELINE WELLS CREEK AND WELLS CREEK TRIBUTARY WHITES CREEK
NO. OFSAMPLES
MIN MEDIAN 80TH %ILE MAX NO. OFSAMPLES
MIN MEDIAN 80TH %ILE MAX
Physical parameters
Conductivity µS/cm 35 – 350 56 209 409.5 599.2 865 38 214 556 668.4 732
Temperature °C - 54 7.1 11.6 18.4 25.6 37 7.4 15.1 19.3 21.3
Turbidity NTU 2 - 25 54 2 9.05 22 149 37 1.4 6.4 11.12 55.5
pH pHunits
6.5 - 8.0
56 6.3 7.25
6.9 (20th %ile)
7.7 (80th %ile) 8.3 38 6.1 7.1
6.8 (20th %ile)
7.4 (80th %ile) 7.9
TDS mg/L 600 54 136 261.5 381 510 37 139 364 431.8 476
TSS mg/L - 56 <1 8 16.6 73 38 <5 8 12 48
Nutrients
Ammonia as N mg/L 0.5 56 <0.01 0.02 0.062 0.19 38 0.01 0.04 0.064 2.3
Nitrate (as N) mg/L 0.7 56 <0.01 0.02 0.08 0.21 38 0.02 1.44 2.556 5.66
Nitrite (as N) mg/L 1.0 56 <0.01 <0.01 <0.01 0.06 38 <0.01 0.01 0.02 0.1
Total nitrogen asN
mg/L 0.5*56 <0.1 0.6 1 2 38 0.6 2.55 3.76 6.7
Phosphorus mg/L 0.03* 56 <0.01 0.02 0.066 0.21 38 <0.01 0.045 0.102 0.24
Major ions
Calcium mg/L 1,000 56 6 15.5 22 28 38 13 34.5 43.4 53

3
WSP | Parsons BrinckerhoffProject No 2200540A
Surface Water Quality AssessmentHume Coal
PARAMETER UNIT GUIDELINE WELLS CREEK AND WELLS CREEK TRIBUTARY WHITES CREEK
NO. OFSAMPLES
MIN MEDIAN 80TH %ILE MAX NO. OFSAMPLES
MIN MEDIAN 80TH %ILE MAX
Chloride mg/L 175 56 42 74.5 113.6 147 38 23 63.5 76 112
Magnesium mg/L 2,000 56 5 19 29 39 38 5 9 13.2 16
Sodium mg/L 115 56 17 37.5 48 62 38 15 56 66.2 77
Sulfate as SO4 mg/L 250 56 <1 <1 6 9 38 13 63 96 134
Dissolved metals
Aluminium mg/L 0.055 56 <0.01 0.04 0.186 0.89 38 <0.01 0.02 0.066 0.42
Antimony mg/L 0.003 32 <0.001 <0.001 <0.001 <0.001 15 <0.001 <0.001 <0.001 <0.001
Arsenic mg/L 0.01 56 <0.001 <0.001 <0.001 <0.001 38 <0.001 <0.001 <0.001 0.002
Barium mg/L 1.0 56 0.022 0.046 0.059 0.092 38 0.017 0.0365 0.042 0.051
Beryllium mg/L 0.06 55 <0.001 <0.001 <0.001 <0.001 37 <0.001 <0.001 <0.001 <0.001
Boron mg/L 0.37 32 <0.05 <0.05 <0.05 <0.05 15 <0.05 0.055 0.08 0.09
Cadmium mg/L 0.0002 56 <0.0001 <0.0001 <0.0001 0.0001 38 <0.0001 <0.0001 <0.0001 0.0002
Chromium mg/L 0.001 56 <0.001 <0.001 <0.001 <0.001 38 <0.001 <0.001 <0.001 0.001
Cobalt mg/L 0.05 56 <0.001 <0.001 <0.001 0.006 38 <0.001 <0.001 <0.001 0.003
Copper mg/L 0.0014 56 <0.001 <0.001 0.002 0.004 38 <0.001 0.001 0.002 0.008
Iron mg/L 0.2 56 <0.05 0.15 0.55 2.08 38 <0.05 0.07 0.142 0.39
Lead mg/L 0.0034 56 <0.001 <0.001 <0.001 <0.001 38 <0.001 <0.001 <0.001 0.001
Manganese mg/L 0.1 56 0.01 0.0585 0.2168 3.12 38 0.014 0.0505 0.117 0.369
Mercury mg/L 0.0006 26 <0.0001 <0.0001 <0.0001 <0.0001 24 <0.0001 <0.0001 <0.0001 <0.0001

4
Surface Water Quality AssessmentHume Coal
WSP | Parsons BrinckerhoffProject No 2200540A
PARAMETER UNIT GUIDELINE WELLS CREEK AND WELLS CREEK TRIBUTARY WHITES CREEK
NO. OFSAMPLES
MIN MEDIAN 80TH %ILE MAX NO. OFSAMPLES
MIN MEDIAN 80TH %ILE MAX
Molybdenum mg/L 0.01 32 <0.001 <0.001 <0.001 <0.001 15 <0.001 <0.001 <0.001 <0.001
Nickel mg/L 0.011 56 <0.001 0.002 0.002 0.004 38 <0.001 0.0015 0.002 0.005
Selenium mg/L 0.01 32 <0.01 <0.01 <0.01 <0.01 15 <0.01 <0.01 <0.01 <0.01
Silver^ mg/L 0.00005 26 <0.001 <0.001 <0.001 0.02 26 <0.01 <0.01 <0.01 0.06
Zinc mg/L 0.008 56 <0.005 <0.005 <0.005 0.009 38 <0.005 0.013 0.02 0.029
Hydrocarbons
Benzene µg/L 1 56 <1 <1 <1 <1 38 <1 <1 <1 <1
Toluene µg/L 25 56 <2 <2 <2 <2 38 <2 <2 <2 <2
Ethylbenzene µg/L 3 56 <2 <2 <2 <2 38 <2 <2 <2 <2
Total xylene µg/L 20 56 <2 <2 <2 <2 38 <2 <2 <2 <2
Naphthalene µg/L 16 56 <5 <5 <5 <5 38 <5 <5 <5 <5*WQO recommended by Healthy Rivers Commission Inquiry into the Hawkesbury-Nepean River (HRC 1998).^ Standard and trace laboratory limits of reporting exceed the ANZECC guideline for aquatic ecosystems.

5
WSP | Parsons BrinckerhoffProject No 2200540A
Surface Water Quality AssessmentHume Coal
PARAMETER UNIT GUIDELINE BELANGLO CREEK AND PLANTING SPADE CREEK
NO. OFSAMPLES
MIN MEDIAN 80TH %ILE MAX
Physical parameters
Conductivity µS/cm 35 – 350 7 12 77 117.8 125
Temperature °C - 7 7 9.8 12.96 17.4
Turbidity NTU 2 - 25 7 1.5 7.7 14.44 15.7
pH pHunits
6.5 - 8.0
7 4.7 6
5.1 (20th %ile)6.5 (80th %ile) 6.7
TDS mg/L 600 7 39 52 78.6 81
TSS mg/L - 7 <1 2 2.8 4
Nutrients
Ammonia as N mg/L 0.5 7 <0.01 <0.01 0.024 0.03
Nitrate (as N) mg/L 0.7 7 <0.01 0.02 0.084 0.15
Nitrite (as N) mg/L 1.0 7 <0.01 <0.01 <0.01 0.05
Total nitrogen asN
mg/L 0.5*7 0.1 0.2 0.4 0.4
Phosphorus mg/L 0.03* 7 <0.01 0.01 0.02 0.02
Major ions
Calcium mg/L 1,000 7 <1 1 1.4 2
Chloride mg/L 175 7 10 21 27.2 29
Magnesium mg/L 2,000 7 1 2 3.4 4
Sodium mg/L 115 7 8 11 17 17

6
Surface Water Quality AssessmentHume Coal
WSP | Parsons BrinckerhoffProject No 2200540A
PARAMETER UNIT GUIDELINE BELANGLO CREEK AND PLANTING SPADE CREEK
NO. OFSAMPLES
MIN MEDIAN 80TH %ILE MAX
Sulfate as SO4 mg/L 250 7 1 2 2.4 3
Dissolved metals
Aluminium mg/L 0.055 7 0.06 0.21 0.656 1.22
Antimony mg/L 0.003 6 <0.001 <0.001 <0.001 <0.001
Arsenic mg/L 0.01 7 <0.001 <0.001 <0.001 <0.001
Barium mg/L 1.0 7 0.007 0.01 0.011 0.011
Beryllium mg/L 0.06 7 <0.001 <0.001 <0.001 <0.001
Boron mg/L 0.37 6 <0.05 <0.05 <0.05 <0.05
Cadmium mg/L 0.0002 7 <0.0001 <0.0001 <0.0001 <0.0001
Chromium mg/L 0.001 7 <0.001 <0.001 <0.001 0.001
Cobalt mg/L 0.05 7 <0.001 <0.001 <0.001 <0.001
Copper mg/L 0.0014 7 <0.001 <0.001 <0.001 0.001
Iron mg/L 0.2 7 0.09 0.25 0.33 0.42
Lead mg/L 0.0034 7 <0.001 <0.001 <0.001 <0.001
Manganese mg/L 0.1 7 0.006 0.011 0.0208 0.034
Mercury mg/L 0.0006 1 <0.0001 <0.0001 <0.0001 <0.0001
Molybdenum mg/L 0.01 6 <0.001 <0.001 <0.001 <0.001
Nickel mg/L 0.011 7 <0.001 <0.001 <0.001 <0.001
Selenium mg/L 0.01 6 <0.01 <0.01 <0.01 <0.01

7
WSP | Parsons BrinckerhoffProject No 2200540A
Surface Water Quality AssessmentHume Coal
PARAMETER UNIT GUIDELINE BELANGLO CREEK AND PLANTING SPADE CREEK
NO. OFSAMPLES
MIN MEDIAN 80TH %ILE MAX
Silver^ mg/L 0.00005 1 <0.001 <0.001 <0.001 <0.001
Zinc mg/L 0.008 7 <0.005 <0.005 <0.005 0.016
Hydrocarbons
Benzene µg/L 1 7 <1 <1 <1 <1
Toluene µg/L 25 7 <2 <2 <2 <2
Ethylbenzene µg/L 3 7 <2 <2 <2 <2
Total xylene µg/L 20 7 <2 <2 <2 <2
Naphthalene µg/L 16 7 <5 <5 <5 <5*WQO recommended by Healthy Rivers Commission Inquiry into the Hawkesbury-Nepean River (HRC 1998).^ Standard and trace laboratory limits of reporting exceed the ANZECC guideline for aquatic ecosystems

LOWER WINGECARRIBEE RIVER MANAGEMENT ZONEPARAMETER UNIT GUIDELINE WINGECARRIBEE RIVER BLACK BOBS CREEK
NO. OFSAMPLES
MIN MEDIAN 80TH %ILE MAX NO. OFSAMPLES
MIN MEDIAN 80TH %ILE MAX
Physical parameters
Conductivity µS/cm 35 – 350 577 50 144 239.4 420 73 148 331 408.4 561
Temperature °C - 288 5.9 17 21.72 28 71 5.3 14.5 19.36 25.5
Turbidity NTU 2 - 25 741 1.2 19.2 53.9 401 65 0.5 5.9 12.1 94.4
pH pHunits
6.5 - 8.0
2786 7.4
7.0 (20th %ile)
8.4 (80th %ile)10.03
73 4.7 6.9
6.5 (20th %ile)
7.4 (80th %ile) 7.9
TDS mg/L 600 n/a n/a n/a n/a n/a 70 96 215 263.8 364
TSS mg/L - 675 <1 13 22 180 75 <1 5 10 172
Nutrients
Ammonia as N mg/L 0.5 n/a n/a n/a n/a n/a 75 <0.01 0.03 0.078 0.55
Nitrate (as N) mg/L 0.7 4 0.15 0.198 0.235 0.235 75 <0.01 0.04 0.088 0.28
Nitrite (as N) mg/L 1.0 1 0.038 n/a n/a 0.038 75 <0.01 <0.01 <0.01 0.06
Total nitrogen asN
mg/L 0.5*696 0.09 0.835 1.212 3.98 75 <0.1 0.5 0.9 2.4
Phosphorus mg/L 0.03* 719 <0.005 0.06 0.102 0.872 75 <0.01 0.02 0.068 0.56
Major ions
Calcium mg/L 1,000 n/a n/a n/a n/a n/a 75 5 13 16 130

9
WSP | Parsons BrinckerhoffProject No 2200540A
Surface Water Quality AssessmentHume Coal
PARAMETER UNIT GUIDELINE WINGECARRIBEE RIVER BLACK BOBS CREEK
NO. OFSAMPLES
MIN MEDIAN 80TH %ILE MAX NO. OFSAMPLES
MIN MEDIAN 80TH %ILE MAX
Chloride mg/L 175 141 1 20.9 31.836 63 75 19 61 80 95
Magnesium mg/L 2,000 n/a n/a n/a n/a n/a 75 2 14 17 26
Sodium mg/L 115 n/a n/a n/a n/a n/a 75 12 27 32 48
Sulfate as SO4 mg/L 250 55 3 12 27.6 45 75 1 10 50.8 350
Dissolved metals
Aluminium mg/L 0.055 n/a n/a n/a n/a n/a 75 <0.01 0.05 0.228 0.89
Antimony mg/L 0.003 107 <0.001 <0.001 <0.001 <0.001 23 <0.001 <0.001 <0.001 <0.001
Arsenic mg/L 0.01 107 <0.001 <0.001 <0.001 0.001 75 <0.001 <0.001 <0.001 0.002
Barium mg/L 1.0 107 0.014 0.032 0.037 0.042 75 0.019 0.033 0.0408 0.076
Beryllium mg/L 0.06 107 <0.001 <0.001 <0.001 <0.001 74 <0.001 <0.001 <0.001 <0.001
Boron mg/L 0.37 107 <0.01 0.02 0.02 0.06 23 <0.05 <0.05 <0.05 0.05
Cadmium mg/L 0.0002 107 <0.0001 <0.0001 <0.0001 0.0008 75 <0.0001 <0.0001 <0.0001 0.0003
Chromium mg/L 0.001 107 <0.001 <0.001 <0.001 <0.001 75 <0.001 <0.001 <0.001 0.002
Cobalt mg/L 0.05 107 <0.001 <0.001 <0.001 <0.001 75 <0.001 0.001 0.0138 0.045
Copper mg/L 0.0014 107 <0.001 0.002 0.003 0.006 75 <0.001 <0.001 0.002 0.008
Iron mg/L 0.2 n/a n/a n/a n/a n/a 75 <0.05 0.42 1.342 8.64
Lead mg/L 0.0034 107 <0.001 <0.001 <0.001 0.003 73 <0.001 <0.001 <0.001 0.008
Manganese mg/L 0.1 n/a n/a n/a n/a n/a 75 0.003 0.056 0.2576 0.568
Mercury mg/L 0.0006 n/a n/a n/a n/a n/a 55 <0.0001 <0.0001 <0.0001 <0.0001

10
Surface Water Quality AssessmentHume Coal
WSP | Parsons BrinckerhoffProject No 2200540A
PARAMETER UNIT GUIDELINE WINGECARRIBEE RIVER BLACK BOBS CREEK
NO. OFSAMPLES
MIN MEDIAN 80TH %ILE MAX NO. OFSAMPLES
MIN MEDIAN 80TH %ILE MAX
Molybdenum mg/L 0.01 107 <0.001 <0.001 <0.001 0.002 23 <0.001 <0.001 <0.001 <0.001
Nickel mg/L 0.011 107 <0.001 0.001 0.002 0.002 75 <0.001 0.003 0.0156 0.043
Selenium mg/L 0.01 107 <0.01 <0.01 <0.01 <0.01 23 <0.01 <0.01 <0.01 <0.01
Silver^ mg/L 0.00005 107 <0.001 <0.001 <0.001 0.001 55 <0.001 <0.001 <0.001 0.05
Zinc mg/L 0.008 107 <0.005 <0.005 0.007 0.047 75 <0.005 <0.005 0.0536 0.229
Hydrocarbons
Benzene µg/L 1 n/a n/a n/a n/a n/a 75 <1 <1 <1 <1
Toluene µg/L 25 n/a n/a n/a n/a n/a 75 <2 <2 <2 <2
Ethylbenzene µg/L 3 n/a n/a n/a n/a n/a 75 <2 <2 <2 <2
Total xylene µg/L 20 n/a n/a n/a n/a n/a 75 <2 <2 <2 <2
Naphthalene µg/L 16 n/a n/a n/a n/a n/a 75 <5 <5 <5 <5*WQO recommended by Healthy Rivers Commission Inquiry into the Hawkesbury-Nepean River (HRC 1998).^ Standard and trace laboratory limits of reporting exceed the ANZECC guideline for aquatic ecosystems.n/a not available

11
WSP | Parsons BrinckerhoffProject No 2200540A
Surface Water Quality AssessmentHume Coal
PARAMETER UNIT GUIDELINE LONGACRE CREEK STONY CREEK
NO. OFSAMPLES
MIN MEDIAN 80TH %ILE MAX NO. OFSAMPLES
MIN MEDIAN 80TH %ILE MAX
Physical parameters
Conductivity µS/cm 35 – 350 12 63 82 112.2 376 13 348 640 732 764
Temperature °C - 12 8.3 11.3 18.8 20.3 12 8.5 16 20 23
Turbidity NTU 2 - 25 11 8.3 19.1 42.34 57.5 13 5.8 13 23 25
pH pHunits
6.5 - 8.0
12 5 6.45
5.8 (20th %ile)
6.7 (80th %ile) 7 13 6.4 7.3
6.7 (20th %ile)
7.6 (80th %ile) 7.9
TDS mg/L 600 11 41 48 63.6 70 13 226 416 465 496
TSS mg/L - 12 <5 12.5 21.4 35 13 <5 12 17 23
Nutrients
Ammonia as N mg/L 0.5 12 <0.01 <0.01 0.01 0.04 13 <0.01 0.01 0.04 0.07
Nitrate (as N) mg/L 0.7 12 <0.01 0.01 0.024 0.07 13 <0.01 <0.01 0.04 0.17
Nitrite (as N) mg/L 1.0 12 <0.01 <0.01 <0.01 <0.01 13 <0.01 <0.01 <0.01 0.06
Total nitrogen asN
mg/L 0.5*12 0.09 0.85 1.5 1.6 13 1.2 1.8 2.4 3.4
Phosphorus mg/L 0.03* 12 0.01 0.045 0.074 0.08 13 0.08 0.30 0.47 1.8
Major ions
Calcium mg/L 1,000 12 2 2 3.4 5 13 17 38 48 56
Chloride mg/L 175 12 9 14 20.4 24 13 62 106 133 147
Magnesium mg/L 2,000 12 1 1.5 3 3 13 8 18 20 20

12
Surface Water Quality AssessmentHume Coal
WSP | Parsons BrinckerhoffProject No 2200540A
PARAMETER UNIT GUIDELINE LONGACRE CREEK STONY CREEK
NO. OFSAMPLES
MIN MEDIAN 80TH %ILE MAX NO. OFSAMPLES
MIN MEDIAN 80TH %ILE MAX
Sodium mg/L 115 12 5 9 11 12 13 31 53 63 72
Sulfate as SO4 mg/L 250 12 <1 <1 <1 1 13 <1 5.0 10 29
Dissolved metals
Aluminium mg/L 0.055 12 0.14 0.4 0.836 1.06 13 <0.01 0.06 0.16 0.30
Antimony mg/L 0.003 7 <0.001 <0.001 <0.001 <0.001 13 <0.001 <0.001 <0.001 <0.001
Arsenic mg/L 0.01 12 <0.001 <0.001 <0.001 0.001 13 <0.001 0.002 0.002 0.003
Barium mg/L 1.0 12 0.014 0.017 0.0228 0.034 13 0.004 0.04 0.06 0.08
Beryllium mg/L 0.06 12 <0.001 <0.001 <0.001 <0.001 12 <0.001 <0.001 <0.001 <0.001
Boron mg/L 0.37 7 <0.05 <0.05 <0.05 <0.05 13 <0.05 <0.05 <0.05 <0.05
Cadmium mg/L 0.0002 12 <0.0001 <0.0001 <0.0001 <0.0001 13 <0.0001 <0.0001 <0.0001 <0.0001
Chromium mg/L 0.001 12 <0.001 <0.001 0.001 0.002 13 <0.001 <0.001 <0.001 <0.001
Cobalt mg/L 0.05 12 <0.001 <0.001 <0.001 0.001 13 <0.001 <0.001 0.002 0.006
Copper mg/L 0.0014 12 <0.001 0.001 0.002 0.005 13 <0.001 0.002 0.003 0.008
Iron mg/L 0.2 12 0.37 0.57 1.09 1.51 13 0.10 0.35 0.54 2.4
Lead mg/L 0.0034 12 <0.001 <0.001 <0.001 0.002 13 <0.001 <0.001 <0.001 <0.001
Manganese mg/L 0.1 12 0.009 0.0215 0.0556 0.087 13 0.006 0.08 0.84 3.4
Mercury mg/L 0.0006 5 <0.0001 <0.0001 <0.0001 <0.0001 13 <0.0001 <0.0001 <0.0001 <0.0001
Molybdenum mg/L 0.01 7 <0.001 <0.001 <0.001 <0.001 13 <0.001 <0.001 0.002 0.002
Nickel mg/L 0.011 12 <0.001 <0.001 0.002 0.004 13 <0.001 0.002 0.003 0.004

13
WSP | Parsons BrinckerhoffProject No 2200540A
Surface Water Quality AssessmentHume Coal
PARAMETER UNIT GUIDELINE LONGACRE CREEK STONY CREEK
NO. OFSAMPLES
MIN MEDIAN 80TH %ILE MAX NO. OFSAMPLES
MIN MEDIAN 80TH %ILE MAX
Selenium mg/L 0.01 7 <0.01 <0.01 <0.01 <0.01 13 <0.01 <0.01 0.01 0.01
Silver^ mg/L 0.00005 6 <0.001 <0.001 <0.001 0.42 3 <0.001^ <0.01 0.01 0.01
Zinc mg/L 0.008 12 <0.005 0.006 0.012 0.014 13 <0.005 <0.005 <0.005 0.01
Hydrocarbons
Benzene µg/L 1 12 <1 <1 <1 <1 13 <1 <1 <1 <1
Toluene µg/L 25 12 <2 <2 <2 <2 13 <2 <2 <2 <2
Ethylbenzene µg/L 3 12 <2 <2 <2 <2 13 <2 <2 <2 <2
Total xylene µg/L 20 12 <2 <2 <2 <2 13 <2 <2 <2 <2
Naphthalene µg/L 16 12 <5 <5 <5 <5 13 <5 <5 <5 <5*WQO recommended by Healthy Rivers Commission Inquiry into the Hawkesbury-Nepean River (HRC 1998).^ Standard and trace laboratory limits of reporting exceed the ANZECC guideline for aquatic ecosystems.
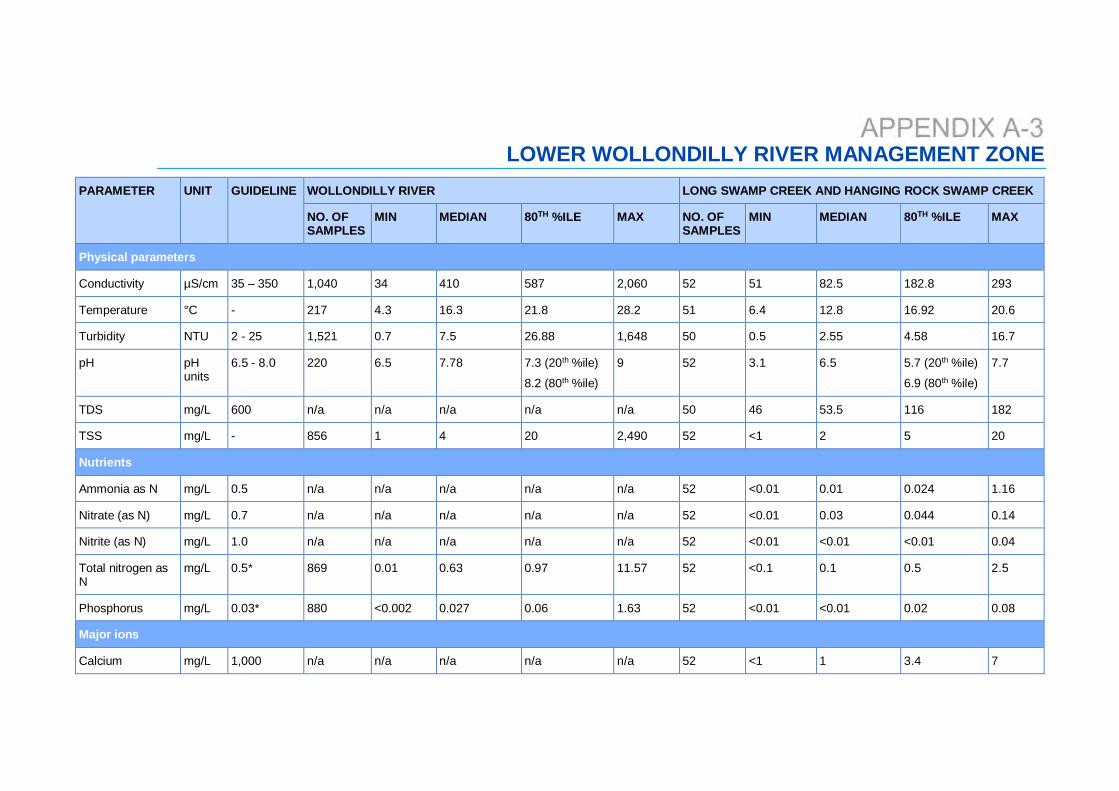
LOWER WOLLONDILLY RIVER MANAGEMENT ZONEPARAMETER UNIT GUIDELINE WOLLONDILLY RIVER LONG SWAMP CREEK AND HANGING ROCK SWAMP CREEK
NO. OFSAMPLES
MIN MEDIAN 80TH %ILE MAX NO. OFSAMPLES
MIN MEDIAN 80TH %ILE MAX
Physical parameters
Conductivity µS/cm 35 – 350 1,040 34 410 587 2,060 52 51 82.5 182.8 293
Temperature °C - 217 4.3 16.3 21.8 28.2 51 6.4 12.8 16.92 20.6
Turbidity NTU 2 - 25 1,521 0.7 7.5 26.88 1,648 50 0.5 2.55 4.58 16.7
pH pHunits
6.5 - 8.0 220 6.5 7.78 7.3 (20th %ile)
8.2 (80th %ile)
9 52 3.1 6.5 5.7 (20th %ile)
6.9 (80th %ile)
7.7
TDS mg/L 600 n/a n/a n/a n/a n/a 50 46 53.5 116 182
TSS mg/L - 856 1 4 20 2,490 52 <1 2 5 20
Nutrients
Ammonia as N mg/L 0.5 n/a n/a n/a n/a n/a 52 <0.01 0.01 0.024 1.16
Nitrate (as N) mg/L 0.7 n/a n/a n/a n/a n/a 52 <0.01 0.03 0.044 0.14
Nitrite (as N) mg/L 1.0 n/a n/a n/a n/a n/a 52 <0.01 <0.01 <0.01 0.04
Total nitrogen asN
mg/L 0.5* 869 0.01 0.63 0.97 11.57 52 <0.1 0.1 0.5 2.5
Phosphorus mg/L 0.03* 880 <0.002 0.027 0.06 1.63 52 <0.01 <0.01 0.02 0.08
Major ions
Calcium mg/L 1,000 n/a n/a n/a n/a n/a 52 <1 1 3.4 7
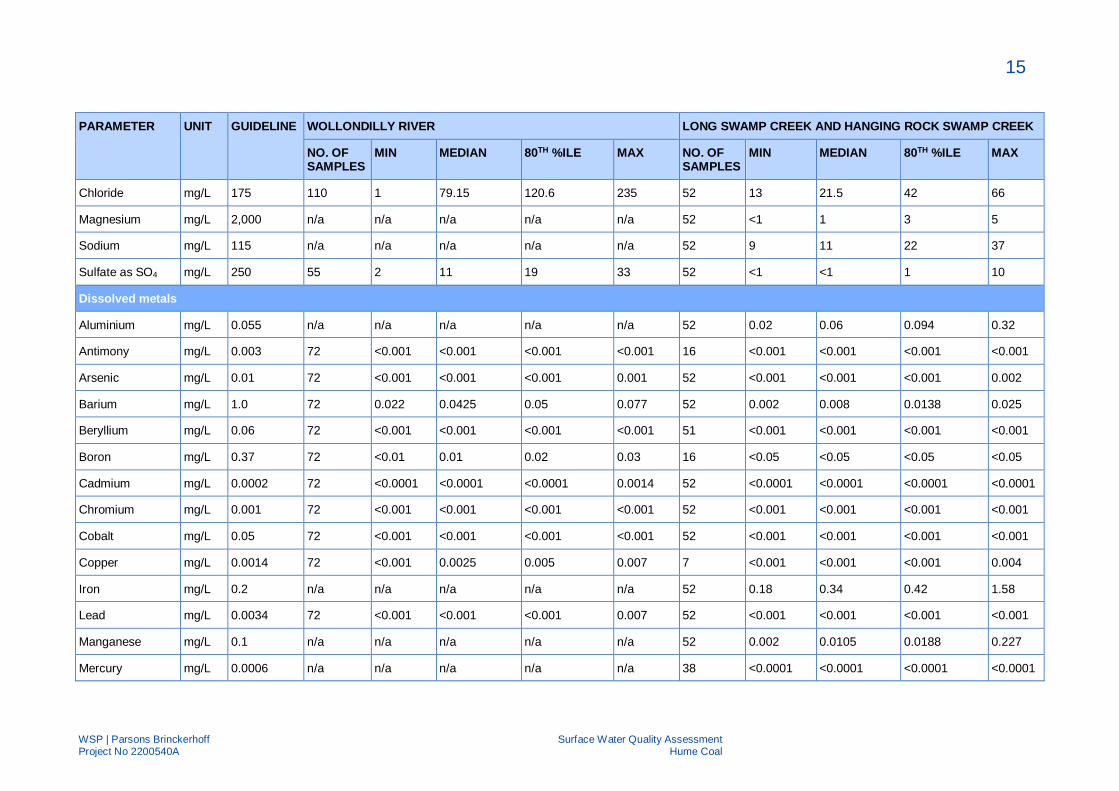
15
WSP | Parsons BrinckerhoffProject No 2200540A
Surface Water Quality AssessmentHume Coal
PARAMETER UNIT GUIDELINE WOLLONDILLY RIVER LONG SWAMP CREEK AND HANGING ROCK SWAMP CREEK
NO. OFSAMPLES
MIN MEDIAN 80TH %ILE MAX NO. OFSAMPLES
MIN MEDIAN 80TH %ILE MAX
Chloride mg/L 175 110 1 79.15 120.6 235 52 13 21.5 42 66
Magnesium mg/L 2,000 n/a n/a n/a n/a n/a 52 <1 1 3 5
Sodium mg/L 115 n/a n/a n/a n/a n/a 52 9 11 22 37
Sulfate as SO4 mg/L 250 55 2 11 19 33 52 <1 <1 1 10
Dissolved metals
Aluminium mg/L 0.055 n/a n/a n/a n/a n/a 52 0.02 0.06 0.094 0.32
Antimony mg/L 0.003 72 <0.001 <0.001 <0.001 <0.001 16 <0.001 <0.001 <0.001 <0.001
Arsenic mg/L 0.01 72 <0.001 <0.001 <0.001 0.001 52 <0.001 <0.001 <0.001 0.002
Barium mg/L 1.0 72 0.022 0.0425 0.05 0.077 52 0.002 0.008 0.0138 0.025
Beryllium mg/L 0.06 72 <0.001 <0.001 <0.001 <0.001 51 <0.001 <0.001 <0.001 <0.001
Boron mg/L 0.37 72 <0.01 0.01 0.02 0.03 16 <0.05 <0.05 <0.05 <0.05
Cadmium mg/L 0.0002 72 <0.0001 <0.0001 <0.0001 0.0014 52 <0.0001 <0.0001 <0.0001 <0.0001
Chromium mg/L 0.001 72 <0.001 <0.001 <0.001 <0.001 52 <0.001 <0.001 <0.001 <0.001
Cobalt mg/L 0.05 72 <0.001 <0.001 <0.001 <0.001 52 <0.001 <0.001 <0.001 <0.001
Copper mg/L 0.0014 72 <0.001 0.0025 0.005 0.007 7 <0.001 <0.001 <0.001 0.004
Iron mg/L 0.2 n/a n/a n/a n/a n/a 52 0.18 0.34 0.42 1.58
Lead mg/L 0.0034 72 <0.001 <0.001 <0.001 0.007 52 <0.001 <0.001 <0.001 <0.001
Manganese mg/L 0.1 n/a n/a n/a n/a n/a 52 0.002 0.0105 0.0188 0.227
Mercury mg/L 0.0006 n/a n/a n/a n/a n/a 38 <0.0001 <0.0001 <0.0001 <0.0001

16
Surface Water Quality AssessmentHume Coal
WSP | Parsons BrinckerhoffProject No 2200540A
PARAMETER UNIT GUIDELINE WOLLONDILLY RIVER LONG SWAMP CREEK AND HANGING ROCK SWAMP CREEK
NO. OFSAMPLES
MIN MEDIAN 80TH %ILE MAX NO. OFSAMPLES
MIN MEDIAN 80TH %ILE MAX
Molybdenum mg/L 0.01 72 <0.001 <0.001 <0.001 0.002 16 <0.001 <0.001 <0.001 <0.001
Nickel mg/L 0.011 72 <0.001 0.001 0.002 0.003 52 <0.001 <0.001 <0.001 0.002
Selenium mg/L 0.01 72 <0.01 <0.01 <0.01 0.01 16 <0.01 <0.01 <0.01 <0.01
Silver^ mg/L 0.00005 n/a n/a n/a n/a n/a 40 <0.001 <0.001 <0.001 0.06
Zinc mg/L 0.008 72 <0.005 0.005 0.008 0.035 52 <0.005 <0.005 <0.005 0.033
Hydrocarbons
Benzene µg/L 1 n/a n/a n/a n/a n/a 52 <1 <1 <1 <1
Toluene µg/L 25 n/a n/a n/a n/a n/a 52 <2 <2 <2 <2
Ethylbenzene µg/L 3 n/a n/a n/a n/a n/a 52 <2 <2 <2 <2
Total xylene µg/L 20 n/a n/a n/a n/a n/a 52 <2 <2 <2 <2
Naphthalene µg/L 16 n/a n/a n/a n/a n/a 52 <5 <5 <5 <5*WQO recommended by Healthy Rivers Commission Inquiry into the Hawkesbury-Nepean River (HRC 1998).^ Standard and trace laboratory limits of reporting exceed the ANZECC guideline for aquatic ecosystems.n/a not available

BUNDANOON CREEK MANAGEMENT ZONEPARAMETER UNIT GUIDELINE INDIGO CREEK
NO. OFSAMPLES
MIN MEDIAN 80TH %ILE MAX
Physical parameters
Conductivity µS/cm 35 – 350 3 167 178 n/a 178
Temperature °C - 3 8 12.9 n/a 19.4
Turbidity NTU 2 - 25 3 37.6 38 n/a 72.6
pH pHunits
6.5 - 8.03 7 7.1 n/a 7.6
TDS mg/L 600 2 115 n/a n/a 116
TSS mg/L - 3 16 19 n/a 37
Nutrients
Ammonia as N mg/L 0.5 3 <0.01 0.02 n/a 0.02
Nitrate (as N) mg/L 0.7 3 0.21 0.21 n/a 0.53
Nitrite (as N) mg/L 1.0 3 <0.01 <0.01 n/a <0.01
Total nitrogen asN
mg/L 0.5*3 1.2 1.2 n/a 1.8
Phosphorus mg/L 0.03* 3 0.14 0.18 n/a 0.42
Major ions
Calcium mg/L 1,000 3 5 10 n/a 15
Chloride mg/L 175 3 4 6 n/a 7
Magnesium mg/L 2,000 3 3 4 n/a 6

A-2
Surface Water Quality AssessmentHume Coal
WSP | Parsons BrinckerhoffProject No 2200540A
PARAMETER UNIT GUIDELINE INDIGO CREEK
NO. OFSAMPLES
MIN MEDIAN 80TH %ILE MAX
Sodium mg/L 115 3 6 7 n/a 7
Sulfate as SO4 mg/L 250 3 <1 <1 n/a 5
Dissolved metals
Aluminium mg/L 0.055 3 0.41 1.2 n/a 1.33
Antimony mg/L 0.003 1 <0.001 n/a n/a <0.001
Arsenic mg/L 0.01 3 <0.001 <0.001 n/a <0.001
Barium mg/L 1.0 3 0.015 0.016 n/a 0.017
Beryllium mg/L 0.06 3 <0.001 <0.001 n/a <0.001
Boron mg/L 0.37 1 <0.05 n/a n/a <0.05
Cadmium mg/L 0.0002 3 <0.0001 <0.0001 n/a <0.0001
Chromium mg/L 0.001 3 <0.001 0.002 n/a 0.002
Cobalt mg/L 0.05 3 <0.001 <0.001 n/a <0.001
Copper mg/L 0.0014 3 0.003 0.004 n/a 0.006
Iron mg/L 0.2 3 0.36 0.77 n/a 1.16
Lead mg/L 0.0034 3 <0.001 <0.001 n/a <0.001
Manganese mg/L 0.1 3 0.005 0.006 n/a 0.016
Mercury mg/L 0.0006 3 <0.0001 <0.0001 n/a <0.0001
Molybdenum mg/L 0.01 1 <0.001 n/a n/a <0.001
Nickel mg/L 0.011 3 0.003 0.006 n/a 0.008
Selenium mg/L 0.01 1 <0.01 n/a n/a <0.01

A-3
WSP | Parsons BrinckerhoffProject No 2200540A
Surface Water Quality AssessmentHume Coal
PARAMETER UNIT GUIDELINE INDIGO CREEK
NO. OFSAMPLES
MIN MEDIAN 80TH %ILE MAX
Silver^ mg/L 0.00005 3 <0.001 <0.001 n/a <0.001
Zinc mg/L 0.008 3 <0.005 <0.005 n/a 0.012
Hydrocarbons
Benzene µg/L 1 3 <1 <1 n/a <1
Toluene µg/L 25 3 <2 <2 n/a <2
Ethylbenzene µg/L 3 3 <2 <2 n/a <2
Total xylene µg/L 20 3 <2 <2 n/a <2
Naphthalene µg/L 16 3 <5 <5 n/a <5*WQO recommended by Healthy Rivers Commission Inquiry into the Hawkesbury-Nepean River (HRC 1998).^ Standard and trace laboratory limits of reporting exceed the ANZECC guideline for aquatic ecosystems.

Appendix BADJUSTMENT OF BACKGROUND NUTRIENT CONCENTRATIONSFOR SWALES

B-1
WSP | Parsons BrinckerhoffProject No 2200540A
Surface Water Quality AssessmentHume Coal
Adjustment of C* and C** values for swales
A key input parameter in MUSIC treatment nodes is the background pollutant levels, C*(stormflowbackground pollutant concentration) and C** (baseflow background pollutant levels) values. Thedefault MUSIC background concentrations for TP and TN in swales are set high and are requiredto be revised to simulate more realistic values.
The C* estimate for total suspended solids (TSS) is obtained by Fletcher (2004) from the particlesize at which only 20% removal is achieved. The method and particle distribution figures areprovided in Fletcher (2004).
Applying the Fletcher (2004) methodology for TP results in a C* value of 0.18mg/L and an EMC of0.26mg/L. This is significantly higher than the TP EMC recorded in the Hume Coal project baselinewater quality data at 0.14mg/L. Therefore, it was considered reasonable to adjust the C* and C**values to reflect the lower recorded TP concentrations in the watercourses in the project area.
The C* was adjusted by identifying the ratio between the C* and the EMC identified in Fletcher(2004) and the EMC from the project area in the equation below.
∗ = ∗ ∗
MUSIC applies the same value for both C* and C** for swales. Therefore, the C*new value wasapplied for both C* and C**.
The same method was applied for TN and the revised C* and C** for swales for both TP and TNare shown in the table below.
Table B1: Revised C* and C** values for swales
k C* C**
TSS 8000 20 14
TP 6000 0.096^ 0.096^
TN 500 0.89^ 0.89^^C* and C** values that were revised
By adjusting the C* it is assumed that the background concentration of the swales will not increasebecause the swales will be properly maintained.