Humans and Chimpanzees Display Opposite Patterns of ...
26
INVESTIGATION Humans and Chimpanzees Display Opposite Patterns of Diversity in Arylamine N-Acetyltransferase Genes Christelle Vangenot,* Pascal Gagneux, † Natasja G. de Groot, ‡ Adrian Baumeyer, § Médéric Mouterde,* Brigitte Crouau-Roy,** Pierre Darlu, †† Alicia Sanchez-Mazas,* ,‡‡ Audrey Sabbagh, §§ and Estella S. Poloni* ,‡‡,1 *Department of Genetics and Evolution, Anthropology Unit, University of Geneva, Switzerland, † Departments of Pathology and Anthropology, CARTA (Center for Academic Research and Training in Anthropogeny), University of California San Diego, La Jolla, ‡ Department of Comparative Genetics and Refinement, Biomedical Primate Research Centre, the Netherlands, § Zoologischer Garten Basel AG, Basel, Switzerland, **CNRS, Université Toulouse 3 UPS, ENFA, UMR 5174, Toulouse, France, †† CNRS/Muséum National d’Histoire Naturelle, UMR 7206 Paris, France, ‡‡ Institute of Genetics and Genomics in Geneva (IGE3), Switzerland, and §§ UMR 216 MERIT, IRD, Université Paris Descartes, Sorbonne Paris Cité, Paris, France ORCID IDs: 0000-0003-4006-9902 (C.V.); 0000-0001-9599-9838 (P.G.); 0000-0003-0272-4945 (B.C.-R.); 0000-0002-7714-2432 (A.S.-M.); 0000-0003-0283-8803 (A.S.); 0000-0002-8465-003X (E.S.P.) ABSTRACT Among the many genes involved in the metabolism of therapeutic drugs, human arylamine N-acetyltransferases (NATs) genes have been extensively studied, due to their medical importance both in pharmacogenetics and disease epidemiology. One member of this small gene family, NAT2, is established as the locus of the classic human acetylation polymorphism in drug metabolism. Current hypotheses hold that selective processes favoring haplotypes conferring lower NAT2 activity have been operating in modern humans’ recent history as an adaptation to local chemical and dietary environments. To shed new light on such hypotheses, we investigated the genetic diversity of the three members of the NAT gene family in seven hominid species, including modern humans, Neanderthals and Denisovans. Little polymorphism sharing was found among hominids, yet all species displayed high NAT diversity, but dis- tributed in an opposite fashion in chimpanzees and bonobos (Pan genus) compared to modern humans, with higher diversity in Pan species at NAT1 and lower at NAT2, while the reverse is observed in humans. This pattern was also reflected in the results returned by selective neutrality tests, which suggest, in agreement with the predicted functional impact of mutations detected in non-human primates, stronger directional selection, presumably purifying selection, at NAT1 in modern humans, and at NAT2 in chimpanzees. Over- all, the results point to the evolution of divergent functions of these highly homologous genes in the different primate species, possibly related to their specific chemical/dietary environment (exposome) and we hypothesize that this is likely linked to the emergence of controlled fire use in the human lineage. KEYWORDS Arylamine N-acetyltransferases multigenic family drug metabolism great apes natural selection Hominid species, the so-called “great apes”, share a recent common history that makes the genomic diversity of our closest relatives highly informative in evolutionary studies on our own species and more broadly on all great apes. This potential to answer evolutionary ques- tions regarding all hominid species, including our own, is extensively exploited, and notably so in the last half decade thanks to the accelera- ted pace at which whole genome sequences are generated (Kuhlwilm et al. 2016). As foreseen by Olson and Varki (2003), analyzing genetic and genomic diversity in the great apes is also providing novel in- sights of medical interest (e.g., (Enard et al. 2002; Bergfeld et al. 2017; Solis-Moruno et al. 2017). Indeed, physiological differences between species, whether they emerged through demographic processes or as adaptive responses might offer insights into present-day ques- tions regarding human health and disease (Olson and Varki 2003; O’Bleness et al. 2012). Arylamine N-acetyltransferases (NATs) genes are members of a small multigene family coding for enzymes that biotransform numer- ous compounds. In humans, its two functional members, NAT1 and NAT2, show differences in expression patterns and substrate speci- ficity, while the third member (NATP) is a pseudogene. While the Volume 9 | July 2019 | 2199 Downloaded from https://academic.oup.com/g3journal/article/9/7/2199/6026812 by guest on 19 July 2022
-
Upload
khangminh22 -
Category
Documents
-
view
2 -
download
0
Transcript of Humans and Chimpanzees Display Opposite Patterns of ...
INVESTIGATION
Humans and Chimpanzees Display OppositePatterns of Diversity in ArylamineN-Acetyltransferase GenesChristelle Vangenot,* Pascal Gagneux,† Natasja G. de Groot,‡ Adrian Baumeyer,§ Médéric Mouterde,*Brigitte Crouau-Roy,** Pierre Darlu,†† Alicia Sanchez-Mazas,*,‡‡ Audrey Sabbagh,§§ andEstella S. Poloni*,‡‡,1
*Department of Genetics and Evolution, Anthropology Unit, University of Geneva, Switzerland, †Departments ofPathology and Anthropology, CARTA (Center for Academic Research and Training in Anthropogeny), University ofCalifornia San Diego, La Jolla, ‡Department of Comparative Genetics and Refinement, Biomedical Primate ResearchCentre, the Netherlands, §Zoologischer Garten Basel AG, Basel, Switzerland, **CNRS, Université Toulouse 3 UPS, ENFA,UMR 5174, Toulouse, France, ††CNRS/Muséum National d’Histoire Naturelle, UMR 7206 Paris, France, ‡‡Institute ofGenetics and Genomics in Geneva (IGE3), Switzerland, and §§UMR 216 MERIT, IRD, Université Paris Descartes, SorbonneParis Cité, Paris, France
ORCID IDs: 0000-0003-4006-9902 (C.V.); 0000-0001-9599-9838 (P.G.); 0000-0003-0272-4945 (B.C.-R.); 0000-0002-7714-2432 (A.S.-M.);0000-0003-0283-8803 (A.S.); 0000-0002-8465-003X (E.S.P.)
ABSTRACT Among the many genes involved in the metabolism of therapeutic drugs, human arylamineN-acetyltransferases (NATs) genes have been extensively studied, due to their medical importanceboth in pharmacogenetics and disease epidemiology. One member of this small gene family, NAT2,is established as the locus of the classic human acetylation polymorphism in drug metabolism. Currenthypotheses hold that selective processes favoring haplotypes conferring lower NAT2 activity have beenoperating in modern humans’ recent history as an adaptation to local chemical and dietary environments.To shed new light on such hypotheses, we investigated the genetic diversity of the three members of theNAT gene family in seven hominid species, including modern humans, Neanderthals and Denisovans. Littlepolymorphism sharing was found among hominids, yet all species displayed high NAT diversity, but dis-tributed in an opposite fashion in chimpanzees and bonobos (Pan genus) compared to modern humans, withhigher diversity in Pan species at NAT1 and lower at NAT2, while the reverse is observed in humans. Thispattern was also reflected in the results returned by selective neutrality tests, which suggest, in agreementwith the predicted functional impact of mutations detected in non-human primates, stronger directionalselection, presumably purifying selection, at NAT1 in modern humans, and at NAT2 in chimpanzees. Over-all, the results point to the evolution of divergent functions of these highly homologous genes in thedifferent primate species, possibly related to their specific chemical/dietary environment (exposome) andwe hypothesize that this is likely linked to the emergence of controlled fire use in the human lineage.
KEYWORDS
ArylamineN-acetyltransferasesmultigenic familydrug metabolismgreat apesnatural selection
Hominid species, the so-called “great apes”, share a recent commonhistory that makes the genomic diversity of our closest relatives highlyinformative in evolutionary studies on our own species and morebroadly on all great apes. This potential to answer evolutionary ques-tions regarding all hominid species, including our own, is extensivelyexploited, and notably so in the last half decade thanks to the accelera-ted pace at which whole genome sequences are generated (Kuhlwilmet al. 2016). As foreseen by Olson and Varki (2003), analyzing geneticand genomic diversity in the great apes is also providing novel in-sights of medical interest (e.g., (Enard et al. 2002; Bergfeld et al. 2017;
Solis-Moruno et al. 2017). Indeed, physiological differences betweenspecies, whether they emerged through demographic processes oras adaptive responses might offer insights into present-day ques-tions regarding human health and disease (Olson and Varki 2003;O’Bleness et al. 2012).
Arylamine N-acetyltransferases (NATs) genes are members of asmall multigene family coding for enzymes that biotransform numer-ous compounds. In humans, its two functional members, NAT1 andNAT2, show differences in expression patterns and substrate speci-ficity, while the third member (NATP) is a pseudogene. While the
Volume 9 | July 2019 | 2199
Dow
nloaded from https://academ
ic.oup.com/g3journal/article/9/7/2199/6026812 by guest on 19 July 2022

NAT2 isoenzyme has a major role in the metabolism of xenobiotics,including therapeutic drugs and carcinogens, growing evidence sup-ports an additional role for NAT1 in physiological processes (notablyfolate and methionine metabolism) and cancer cell biology. The threeNAT genes reside in a 200 Kb region on the short arm of chromosome8, and each of the two functional genes has a single, uninterrupted,870 bp-long coding exon that produces a protein of 290 amino acids(Blömeke and Lichter 2018; Sim and Laurieri 2018). Phylogeneticanalyses of NAT sequences point to multiple episodes of NAT geneduplication or gene loss during vertebrate evolution (Sabbagh et al.2013). However, in Simiiformes (monkeys and apes, includinghumans) the evidence suggests the occurrence of a single duplica-tion event prior to their divergence, leading to the NAT1 and NAT2paralogs, whereas a subsequent duplication of NAT2, which probablyoccurred in the common ancestor to Catarrhini (African and Eurasianmonkeys and apes, including humans), gave rise to the NATP pseu-dogene. Nucleotide sequence identity between the three NAT paral-ogs in humans is high: there is 81% homology between NAT1 andNAT2 coding exons, and 79% with the NATP pseudogene, whileprotein sequence identity between the two NAT enzymes is at 87%(Sabbagh et al. 2013). Homology between orthologous nucleotidesequences of humans, chimpanzees and gorillas is also high, about98–99% for NAT1 and NAT2, and 96–97% forNATP, according to thehuman (GRCh37/hg19, (Lander et al. 2001)), chimpanzee (panTro4,(The Chimpanzee Sequencing and Analysis Consortium 2005)) andgorilla (gorGor4, (Scally et al. 2012)) reference genomes, with no cleardistinction between these three great ape species. Indeed, identity atNAT1 between the human and chimpanzee reference sequencesis 98.5%, compared to 99% between human and gorilla, and 98.5%between chimpanzee and gorilla; at NAT2 it is 98.6% between humanand chimpanzee, 98.8% between human and gorilla, and 98.9%between chimpanzee and gorilla; and at NATP it is 96.8% betweenhuman and chimpanzee, 95.8% between human and gorilla, and 96.1%between chimpanzee and gorilla. These occurrences of apparent in-complete lineage sorting (although based on very slight differences)are not surprising since it is estimated that about a third of the gorillagenome is more similar to that of humans or chimpanzees than thehuman and chimpanzee genomes are to each other (Scally et al. 2012;Kronenberg et al. 2018). It highlights the complex speciation historyof great apes, which possibly included several admixture events, suchas those recently evidenced between bonobos and the ancestors ofCentral and Eastern chimpanzees (de Manuel et al. 2016).
Due to their involvement in inter-individual variation in response totherapeutic treatments, the molecular diversity ofNAT genes in humanpopulations has been intensively studied (Sabbagh et al. 2018). In par-ticular, the NAT2 encoded enzyme, mainly expressed in the liver, smallintestine and colon, is involved in the metabolic breakdown of severalclinically relevant compounds (Hein 2002), including isoniazid, a first-line antibiotic included in anti-tuberculosis therapies since the 1950s
(Zumla et al. 2013). Yet, it is safe to assume that none of these com-pounds have had any evolutionary impact on human NAT2 evolution.The single coding exon of NAT2 is highly polymorphic in humans,and it has been shown that the efficacy and/or toxicity of severalclinically important drugs are associated with variation in enzymaticactivity conferred by different NAT2 variants (Meyer 2004; Agundez2008a; McDonagh et al. 2014). This, together with the involvement ofthe enzyme in the detoxification (N, O or N,O-acetylation) of numer-ous carcinogens, motivated numerous studies on the evolution of thediversity ofNAT2 in human populations. Current hypotheses hold thatgeographically- or culturally-restricted selective processes favoring oneor several haplotypes conferring lower NAT2 activity (as adaptations tospecific chemical environments or dietary habits) have been operatingin the recent history of human populations (Patin et al. 2006a; Patinet al. 2006b; Fuselli et al. 2007; Luca et al. 2008; Magalon et al. 2008;Sabbagh et al. 2008; Mortensen et al. 2011; Sabbagh et al. 2011; Patillonet al. 2014; Podgorná et al. 2015; Valente et al. 2015; Bisso-Machadoet al. 2016); see also (Sabbagh et al. 2018) for a review). Interestingly,the discovery of a strong association of decreased insulin sensitivitywith a non-synonymous polymorphism inNAT2 (Knowles et al. 2016)brings indirect support to the hypothesis of dietary-linked selectivepressures exerted on the evolution of this gene. NAT1 is also involvedin N-acetylation reactions of numerous compounds, and it is mainlyexpressed in the liver. Moreover, as shown in the AceView browser(Thierry-Mieg and Thierry-Mieg 2006), it is also expressed in kidneys,lung, and blood cells, particularly in humans, and less so in chimpan-zees. However, in contrast to NAT2, NAT1 is substantially less poly-morphic in humans, and it is currently held that the accumulation ofmolecular variation in the NAT1 coding exon, in particular non-synonymous variation, has been hampered by relatively strong pu-rifying selection acting on the gene (Patin et al. 2006a; Mortensenet al. 2011; Sabbagh et al. 2018). NATP, the third identified memberof this family of genes in the human genome bears several loss-of-function mutations and transcriptome studies indicate that it is barelyif ever transcribed (as shown in the EBI Gene Expression Atlas, entryENSG00000253937 at www.ebi.ac.uk/gxa/home).
One approach to examine hypotheses of recent adaptation inacetylation activity in humans is to investigate the diversity of NATgenes in humans’ closest relatives. To this aim, we Sanger sequencedthe three members of the NAT gene family in 84 great ape DNA sam-ples, including 68 chimpanzees of the Pan troglodytes verus sub-species(Western chimpanzees). We completed this dataset with 231 NATsequence genotypes produced with NextGen technology by the GreatApe Genome Project (GAGP) (Prado-Martinez et al. 2013). We alsoexamined NAT sequence variation in reference genomes of ancienthominins (i.e., Homo sapiens from Ust’-Ishim, Neanderthal andDenisova). Similarly to humans, we found high levels of nucleotideand haplotype diversity in non-human primates, but distributed dif-ferently in Pan, such that diversity is higher at NAT1 and lower atNAT2, whereas the opposite is observed in humans. Hence we hy-pothesize that the highly homologousNAT1 andNAT2 genes evolvedsome divergence in functionality between species in the course ofhominid history, and we discuss this hypothesis in relation to changesin the chemical or dietary environment, i.e., the exposome (Wild2012) in which humans and chimpanzees have evolved.
MATERIALS AND METHODS
Great ape DNA samplesEighty-fourDNAsamples of great apeswere analyzed in this study. Thesecomprised DNA from 68 Pan troglodytes verus (Western chimpanzee)
Copyright © 2019 Vangenot et al.doi: https://doi.org/10.1534/g3.119.400223Manuscript received October 16, 2018; accepted for publication May 4, 2019;published Early Online May 8, 2019.This is an open-access article distributed under the terms of the CreativeCommons Attribution 4.0 International License (http://creativecommons.org/licenses/by/4.0/), which permits unrestricted use, distribution, and reproductionin any medium, provided the original work is properly cited.Supplemental material available at FigShare: https://doi.org/10.25387/g3.7928192.1Corresponding authors: Department of Genetics and Evolution, AnthropologyUnit, University of Geneva, Quai Ernest-Ansermet, 1205 Genève, Switzerland,E-mail [email protected]; E-mail [email protected]
2200 | C. Vangenot et al.
Dow
nloaded from https://academ
ic.oup.com/g3journal/article/9/7/2199/6026812 by guest on 19 July 2022

individuals, one P. t. troglodytes (Central chimpanzee) female, oneP. t. schweinfurthii (Eastern chimpanzee) female, one P. paniscus(bonobo) male, five Gorilla gorilla and eight Pongo abelii (Sumatranorangutan) individuals. Among the 68 P. t. verus samples, 40 werefrom members of the Biomedical Primate Research Centre (BPRC)colony, 26 from the Center for Academic Research and Training inAnthropogeny (CARTA) and two from the Basel zoo (SupplementaryFigure S1). These samples and their corresponding collections aredescribed in Supplementary File S1.
Sanger sequencing of NAT genesWe sequenced the three segments in the NAT region that include thesingle coding exons of NAT1 and NAT2 and the homologous DNAstretch of NATP in the 84 DNA samples of great apes available for thisstudy. Supplementary Table S1 lists the primers used in this study bothfor PCR amplification and forward and reverse sequencing of eachof the three NAT loci in great apes. PCR conditions are provided inSupplementary File S1. Sanger sequencing was outsourced to Retrogen(San Diego, California, USA) and Macrogen (Seoul, South Korea).Supplementary Table S2 lists the available information on all non-human samples considered in this study, including those retrievedfrom the GAGP (see below).
Alignment of NAT sequencesAll NAT sequences obtained were aligned on the homologs from thereference or draft reference assemblies of Homo sapiens (GRCh37/hg19,February 2009), Pan troglodytes verus (panTro4, February 2011), Panpaniscus (panPan1, May 2012), Gorilla gorilla gorilla (gorGor4,December 2014, as well as gorGor3 for verification, since these tworeference sequences are not identical) and Pongo pygmaeus abelii(ponAbe2, July 2007), respectively, all downloaded from the UCSCGenome Browser (Kent et al. 2002, genome.ucsc.edu). Alignment wasperformed blind of the known relationships between individuals.
Retrieval of NAT sequences or polymorphic positionsfrom public repositoriesFor comparison purposes, we retrieved NAT genotypes from the pub-lished unphased genomes of 79 great apes generated in the GAGP byNGS (Prado-Martinez et al. 2013), namely from 25 chimpanzees (includ-ing a hybrid P. t. verus/troglodytes individual), 13 bonobos, 31 gorillasand 10 orangutans. Two individuals, Harriet (P. t. schweinfurthii) andBoscoe (P. t. verus, Supplementary Figure S1), were in common in theGAGP andCARTA datasets, thus allowing a control of Sanger andNGSsequencing results. We extracted the relevant part of the available VCFfiles. Further details are provided in Supplementary File S1. All detectedpolymorphic positions in the Sanger sequenced samples of this studyand retrieved from the GAGP VCF files are detailed in SupplementaryTables S3, S4 and S5, for NAT1, NAT2 and NATP, respectively.
To allow comparison of segregating sites at the NAT genes amongall hominids (i.e., all great apes, including humans), we recorded all humanpolymorphisms reported by the consensus gene nomenclature of humanNAT alleles (http://nat.mbg.duth.gr/, accessed in August 2015), com-plemented with haplotype data from 1000 Genomes Phase 1 (TheGenomes Project Consortium 2012) and published data (Patin et al.2006a; Sabbagh et al. 2008; Mortensen et al. 2011; Podgorná et al.2015). These are also reported in Supplementary Tables S3, S4 and S5.
Inference of NAT haplotypes in the genus PanDiploid haplotypes were inferred for all Pan individuals (but not forthe other great ape samples, see Supplementary File S1) using PHASE
version 2.1.1 (Stephens et al. 2001; Stephens and Scheet 2005). Theprogram uses a Bayesian statistical method based on an approximatecoalescent model for reconstructing haplotypes from genotype data.PHASE implements a recombination method (the –MR option), whichallows specifying the relative physical location of each SNP andaccounts for the decay in linkage disequilibrium with distance.
Constitution of two samples of Pan troglodytes verusunrelated individualsWe considered separately two samples of unrelated individuals fromthe Western (P. t. verus) chimpanzee sub-species, BPRC and SanDiego (Supplementary File S1), notably due to significant differenti-ation between these two samples at the NATP pseudogene (Supple-mentary Table S6, see results).
NAT haplotypes in humansA dataset of NAT haplotypes’ frequency distributions in humanpopulation samples was assembled with published NAT sequencesof same length as those of Pan, obtained through a comprehensiveliterature search at the time of the study. Only populations repre-sented by samples including at least 15 individuals (30 chromosomes)were considered. We thus used published data samples fromMortensenet al. (2011) and from Sabbagh et al. (2008). We also extracted NAT1,NAT2 and NATP phased genotypes from the 1000 Genomes Phase1 dataset (The Genomes Project Consortium 2012), see SupplementaryFile S1. In total, the human dataset consists of 20, 18 and 18 samplesof unrelated individuals, from human populations distributed on fourcontinents (Sub-Saharan Africa, Europe, East Asia and America), forNAT1, NAT2 and NATP, respectively (Supplementary Table S7).
NAT polymorphisms in ancient genomes of homininsVariant calls in the homologous NAT sequences of ancient genomesof the genus Homo, namely Neanderthal, Altai and the compositegenome of three individuals from Vindija, (Green et al. 2010; Prüferet al. 2014), Denisova (Meyer et al. 2012), and those from the mostancient modern human sequenced genome, Ust’-Ishim (Fu et al.2014), were examined in both the UCSC Genome Browser (https://genome.ucsc.edu/) and the ancient genome browser at the Max PlanckInstitute for Evolutionary Anthropology (http://www.eva.mpg.de/neandertal/index.html), the latter including the recently publishedhigh-coverage Vindija Neanderthal genome (Prüfer et al. 2017). Foreach of the two functional genes, we screened 2 Kb of the referencehuman genome sequence (Hg19/GRCh37) encompassing the codingexon (positions 18’079’000 to 18’081’000 forNAT1, and 18’257’000 to18’259’000 for NAT2). For the NATP pseudogene, we screened 2 Kbof homologous sequence (18’227’600 to 18’229’600).
Analysis of diversity of NAT genes in the genus Pan andcomparison with humans and other great apes
Frequency distributions of NAT haplotypes in the Pan and humanpopulation samples were used to test for possible deviations fromHardyWeinberg equilibrium, to estimate expected heterozygosity, (h, equiva-lent to Nei’s gene diversity, (Nei 1987)) and nucleotide diversity (p), toestimate levels of population differentiation (FST statistics), and to testfor possible departure from selective neutrality and demographic equi-librium (Ewens-Watterson homozygosity test, Tajima’sD test and Fu’sFStest,), with the program Arlequin ver. 3.5 (Excoffier and Lischer 2010).Each of these three latter tests relies on different summaries of diversity(homozygosity for the Ewens-Watterson test, number of polymorphicsites and nucleotide diversity for Tajima’s D, and number of different
Volume 9 July 2019 | Diversity in Hominid NAT genes | 2201
Dow
nloaded from https://academ
ic.oup.com/g3journal/article/9/7/2199/6026812 by guest on 19 July 2022

haplotypes and nucleotide diversity for Fu’s Fs), and only Tajima’s Dand Fu’s Fs tests explicitly account for the mutational events distin-guishing haplotypes. Statistical significance was assessed by generating100’000 random samples under the null conditions of no selection andconstant population size. For all tests that revealed at least one signif-icant departure from the null hypothesis in one population (species,sub-species, or collection in the case of P. t. verus), the Holm correctionmethod implemented in R (R Core Team 2013) was applied to controlfor type I error rate (Holm 1979), so as to obtain adjusted P-values.Arlequin was also used to infer population pairwiseFST values (betweenspecies, sub-species, or collections) under the AMOVA framework, andtheir statistical significance was assessed with 100’000 permutations.The parameters used to estimateFST values were obtained withMEGAver. 7 (Kumar et al. 2016). These parameters are: the molecular model(Tamura’s distance for all three NAT loci), the gamma parameter (nogamma correction forNAT1 and NAT2, gamma = 0.05 for NATP) andthe transition to transversion ratio (2.67, 2.0 and 2.5 for NAT1, NAT2and NATP, respectively). The program Network ver. 5.0 (Bandeltet al. 1999) was used to construct median-joining networks of NAThaplotypes in Pan.
Prediction of functional impact of specific mutations inPan haplotypes at the NAT1 and NAT2 lociPhenotypic predictions of the functional impact of specific mutationsin Pan NAT1 and NAT2 haplotypes were performed with three onlinesoftware tools (analysis done in May 2017): PolyPhen (Adzhubei et al.2010), SIFT (Sim et al. 2012) and the PANTHER cSNP Scoring tool(Tang and Thomas 2016). These three tools are able to predict the effectof a single nonsynonymous substitution on a protein sequence (Sup-plementary File S1). To investigate and compare the results returnedby these methods, we first applied the three tools on human haplo-types of known phenotypes (Supplementary File S1). For the analysisof Pan haplotypes, we ran all three prediction tools with the defaultoptions, searching the UniProtKB/TrEMBL protein database (release2010_09) with SIFT, and specifying Pan troglodytes as referenceorganism in PANTHER cSNP Scoring.
Data availabilityFile S1 contains detailed descriptions of the protocols used for DNAamplification, PCR product purification and sequencing of great apesamples, retrieval of unphased NAT polymorphic positions from theGreat Ape Genome Project (GAGP), inference of Pan NAT haplotypes,and retrieval of phased humanNAT haplotypes from the 1000 GenomesProject. Table S1 lists the PCR and sequencing primers used for Sangersequencing of NAT genes in non-human great ape DNA samples, andavailable information on these samples is provided in Table S2. Hominidpolymorphic positions detected inNAT1,NAT2, andNATP are listed inTables S3, S4, and S5, respectively. Table S6 reports estimates of differ-entiation levels between Pan (sub-)species. Table S7 lists the humanpopulation samples included in the modern human dataset, withassociated diversity estimates and results of Hardy-Weinberg equi-librium tests. Supplementary information on results is also providedin File S1. All supplementary material has been uploaded to figshare.The 247 NAT sequenced genotypes obtained in this study are avail-able in GenBank with accession numbers MK244999-MK245288 andMK245291-MK245459. Supplemental material available at FigShare:https://doi.org/10.25387/g3.7928192.
RESULTSIn this study, we Sanger sequenced approximately 1 Kb of homol-ogous sequence in each of the three members of the arylamine
N-acetyltransferase (NAT) gene family, NAT1, NAT2 and the NATPpseudogene, in 84 great ape samples, of which 68 are chimpanzees ofthe Pan troglodytes verus sub-species. Out of the 84 DNA samples ofgreat apes available, we obtained 248 NAT genotypes (83, 81 and83 NAT1, NAT2 and NATP genotypes, respectively, SupplementaryFile S1). We extended our dataset with 231 NAT genotypes from79 individuals belonging to six great ape (sub-)species retrievedfrom the GAGP (Prado-Martinez et al. 2013). As reported in Tables 1and 2, the total dataset assembled for analysis thus included 93 geno-types from four Pan troglodytes (common chimpanzee) sub-species forNAT1 and NAT2 (96 for NATP), 14 genotypes from Pan paniscus(bonobo) for each of the 3 NAT genes, 35 genotypes from two Gorillaspecies for NAT2 and NATP (36 for NAT1), and 17 genotypes fromtwo Pongo (orangutan) species for NAT1 and NAT2 (18 for NATP).For comparative analysis purposes, we also assembled a human NATdataset totalizing 1’159 to 1’240 unrelated individuals from 18 to20 populations distributed on four continents.
In spite of the high level of known homology between the threeNAT genes, approximately 8% nucleotide positions in NAT1 (76 outof 903 bp), 10% in NAT2 (117 out of 1’115 bp), and 15% in NATP(151 out of 1’002 bp) are segregating positions in hominids, that werefound to either be divergent between species, polymorphic within aspecies, or both (Supplementary Tables S3, S4, and S5). Among them,21 (28%) substitutions in NAT1, 38 (32%) in NAT2, and 77 (51%) inNATP correspond to inter-species divergence.
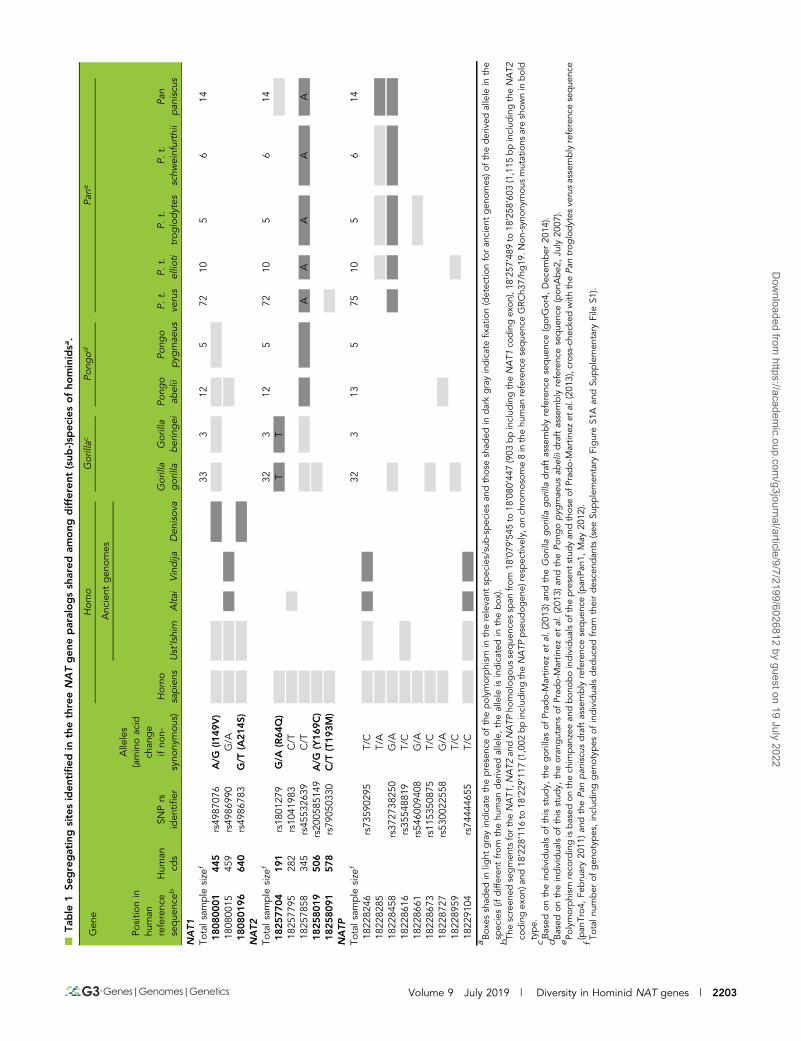
NAT polymorphisms in hominids and polymorphismsharing among speciesDespite the high numbers of segregating sites detected at the threeNAT genes in hominids, little polymorphism was found to be sharedbetween humans, gorillas, orangutans and Pan: two SNPs at NAT1,four at NAT2 and six at the NATP pseudogene (Table 1).
No polymorphic position was found shared between the genus Panand the other great ape species at the NAT1 gene (Table 1 and Supple-mentary Table S3). Nonetheless, the proportion of non-synonymousSNPs in Pan (60%) is similar to that observed in humans (59%) andorangutans (56%), while it is lower in gorillas (25%).
Humans and orangutans were found to share two NAT1 SNPs,i.e., non-synonymous A/G at human cds position 445 (rs4987076)and synonymous G/A at 459 (rs4986990), the former being also ob-served in gorillas. These two polymorphisms, found at low frequen-cies in humans today, along with a third one not observed in gorillasor orangutans (non-synonymous 640 G/T, rs4986783), were never-theless detected in the ancient genome of 45’000 years old Homosapiens from Ust’-Ishim, and were found to diverge between Nean-derthals and Denisova (Table 1 and Supplementary Table S8). Inter-estingly, ancient Neanderthal genomes apparently carry the same allele(A) as Pan at rs4987076 whereas the alternative allele (G) was foundfor Denisova, and the opposite pattern is observed at rs4986990 (bothPan and Denisova carry G, while ancient Neanderthal genomes carryA). Thus, both the 445 A/G (rs4987076) and the 459 G/A (rs4986990)polymorphisms could potentially either pre-date the divergence amonghominids or represent a case of independent parallel mutation(s) inhominins and in other great ape lineages. In turn, at position 640 G/T(rs4986783), all great apes and Neanderthals were found to carry G,whereas the alternative allele (T) was only observed in Denisova. Inhumans today, the derived alleles (respectively A, A and G) at thesethree SNPs (respectively, rs4987076, rs4986990 and rs4986783) char-acterize human haplotypes NAT1�11A and NAT1�11B. A previousstudy estimated that the coalescence of NAT1�11A with other majorhuman NAT1 haplotypes (NAT1�3, NAT1�4, and NAT1�10) dates
2202 | C. Vangenot et al.
Dow
nloaded from https://academ
ic.oup.com/g3journal/article/9/7/2199/6026812 by guest on 19 July 2022
nTa
ble
1Se
gregatingsitesiden
tified
inthethreeNATgen
eparalogssh
ared
among
different
(sub
-)sp
eciesofho
minidsa.
Gen
eHom
oGorillac
Pong
odPa
ne
Anc
ient
gen
omes
Positio
nin
human
referenc
eseque
nceb
Hum
ancd
sSN
Prs
iden
tifier
Alle
les
(aminoacid
chan
ge
ifno
n-syno
nymou
s)Hom
osapiens
Ust’Ishim
Alta
iVindija
Den
isov
aGorilla
gorilla
Gorilla
beringei
Pong
oab
elii
Pong
opyg
mae
usP.
t.ve
rus
P.t.
ellio
tiP.
t.trog
lodytes
P.t.
schw
einfurthii
Pan
pan
iscu
s
NAT1
Totalsam
ple
size
f33
312
572
105
614
1808
0001
445
rs49
8707
6A/G
(I149
V)
1808
0015
459
rs49
8699
0G/A
1808
0196
640
rs49
8678
3G/T
(A21
4S)
NAT2
Totalsam
ple
size
f32
312
572
105
614
1825
7704
191
rs18
0127
9G/A
(R64
Q)
TT
1825
7795
282
rs10
4198
3C/T
1825
7858
345
rs45
5326
39C/T
AA
AA
A18
2580
1950
6rs20
0585
149
A/G
(Y16
9C)
1825
8091
578
rs79
0503
30C/T
(T19
3M)
NATP
Totalsam
ple
size
f32
313
575
105
614
1822
8246
rs73
5902
95T/C
1822
8285
T/A
1822
8458
rs37
2738
250
G/A
1822
8616
rs35
5488
19T/C
1822
8661
rs54
6009
408
G/A
1822
8673
rs11
5350
875
T/C
1822
8727
rs53
0022
558
G/A
1822
8959
T/C
1822
9104
rs74
4446
55T/C
aBox
esshad
edin
light
grayindicatethepresenc
eof
thepolym
orphism
intherelevant
spec
ies/sub-spec
iesan
dthoseshad
edin
darkgrayindicatefixatio
n(detec
tionforan
cien
tgen
omes)o
fthe
derived
allele
inthe
spec
ies(if
differen
tfrom
thehu
man
derived
allele,theallele
isindicated
inthebox
).bTh
escreen
edsegmen
tsforthe
NAT1
,NAT2
andNATP
homolog
ousseque
nces
span
from
18’079
’545
to18
’080
’447
(903
bpinclud
ingtheNAT1
codingex
on),18
’257
’489
to18
’258
’603
(1,115
bpinclud
ingtheNAT2
codingex
on)a
nd18
’228
’116
to18
’229
’117
(1,002
bpinclud
ingtheNATP
pseud
ogen
e)resp
ectiv
ely,on
chromosom
e8in
thehu
man
referenc
eseque
nceGRC
h37/hg
19.N
on-syn
onym
ousmutations
areshow
nin
bold
type.
cBased
ontheindividua
lsof
thisstud
y,thegorillas
ofPrad
o-Martin
ezet
al.(201
3)an
dtheGorillagorillagorilladraftassembly
referenc
eseque
nce(gorGor4,
Dec
ember
2014
).dBased
ontheindividua
lsof
thisstud
y,theoran
gutan
sof
Prad
o-Martin
ezet
al.(201
3)an
dthePo
ngopyg
mae
usab
eliidraftassembly
referenc
eseque
nce(pon
Abe2
,Ju
ly20
07).
ePo
lymorphism
reco
rdingisbased
onthech
impan
zeean
dbon
oboindividua
lsof
thepresent
stud
yan
dthoseof
Prad
o-Martin
ezet
al.(20
13),cross-ch
ecke
dwith
thePa
ntrog
lodytes
verusassemblyreferenc
eseque
nce
(pan
Tro4
,Fe
bruary20
11)a
ndthePa
npan
iscu
sdraftassembly
referenc
eseque
nce(pan
Pan1
,May
2012
).fTo
taln
umber
ofgen
otyp
es,includ
inggen
otyp
esof
individua
lsded
uced
from
theirdesce
ndan
ts(see
Supplemen
tary
FigureS1
Aan
dSu
pplemen
tary
File
S1).
Volume 9 July 2019 | Diversity in Hominid NAT genes | 2203
Dow
nloaded from https://academ
ic.oup.com/g3journal/article/9/7/2199/6026812 by guest on 19 July 2022

back to 2 million years ago, leading the authors to suggest that someNAT1 diversity in the genome of modern humans may have persistedfrom a structured ancestral population (Patin et al. 2006a). SinceSNPs 445 A/G and 459 G/A are shared between humans and orang-utans (SNP 445 A/G being also shared with gorillas), their coalescencetimes could be even older and likely pre-date the divergence amonghominids. When considered together, the three SNPs define threemajor combinations in hominids, GGT, AGG, and AAG. The mostfrequent combination in humans, GGT, which characterizes mosthuman haplotypes (except those of the NAT1�11 series and NAT1�30),was not observed in the other great apes. Instead, all haplotypes inchimpanzees and bonobos carry the AGG combination, which has anestimated frequency of 70% in gorillas, and at least 55% in orangu-tans, but has not been reported so far in human populations. Suchobservations could suggest that the AGG haplotype was present in theancestors of hominids (the reference sequences of rhesus (Macacamulatta) and cynomolgus (M. fascicularis) macaques, rheMac8 andmacFas5, also carry the AGG combination), and was lost at somepoint in the human lineage, possibly after the divergence from Deni-sova and Neanderthal. Indeed, Denisova’s ancient genome is definedas GGT, while the Altai and Vindija Neanderthal genomes are re-ported with the AAG combination, and the genome of 45’000 yearsold Homo sapiens from Ust’-Ishim is heterozygous at the threepositions (Supplementary Table S8). Nowadays, the human referencehaplotype NAT1�4, together with other haplotypes carrying GGT atthe three SNPs (e.g., human NAT1�3 and NAT1�10), have an averagecumulated frequency of 95% in all human populations studied sofar, whereas haplotypes with AAG (the human NAT1�11 series) areobserved at very low frequencies in populations from Africa, Asia,Europe and New Guinea (Patin et al. 2006a; Mortensen et al. 2011).
NAT2 stands in sharp contrast with NAT1, mainly because of thehigh levels of NAT2 polymorphism in humans (Supplementary TableS4, 55 polymorphic positions recorded for humans at NAT2, whichrepresents twice asmany compared toNAT1). The proportion ofNAT2non-synonymous SNPs in humans (75%) seems higher than that foundin Pan (56%), orangutans (58%), and gorillas (38%).
It is noticeable that among the four NAT2 polymorphisms sharedbetween hominid species (or five if considering modern humans andNeanderthals as distinct species), all are shared with humans. Two ofthese are non-synonymous polymorphisms in humans shared withthe Pan genus: G/A at human cds position 191 (rs1801279) observedin bonobos, and C/T at 578 (rs79050330) observed in Western chim-panzees (Table 1). Humans were also found to share two SNPs withgorillas: synonymous C/T at 345 (rs45532639) and non-synonymousA/G at 506 (rs200585149). These shared SNPs are rare polymorphismsin humans (Sabbagh et al. 2008; The Genomes Project Consortium2012), with the exception of 191 G/A (rs1801279), the signaturemutation of human haplotypes of the NAT2�14 series (NAT2�14A/B/E/H/L), observed mostly among African populations (Patin et al.2006a; Mortensen et al. 2011; Podgorná et al. 2015). None of thepolymorphisms detected in orangutans are shared with other greatapes. Remarkably, the common human synonymous C/T SNP at282 (rs1041983) was found polymorphic in one Neanderthal an-cient genome (Altai, Supplementary Table S8). This SNP is, up tonow, the sole NAT exonic position recorded as polymorphic in anon-anatomically modern human ancient genome. Note that dueto an apparent inconsistency between the ancient genome browserat the Max Planck Institute for Evolutionary Anthropology andthe UCSC genome browser, we could not conclude whether theNAT2 SNP 803 A/G (rs1208) differentiates the Denisova genomefrom Neanderthals and all other hominids (Supplementary Table S8).
This mutation is common in most modern human populations exceptin East Asia, and despite being non-synonymous it does not alter theenzyme’s activity (Zang et al. 2007).
Sequence diversity at the NATP pseudogene in hominids differsfrom that of its functional paralogs by the presence of several inser-tions and deletions (InDels) that could be evidenced in the Sangersequenced samples of this study, and most of which mark divergencebetween species (Supplementary Table S5). In addition to InDels, highlevels of single nucleotide polymorphisms also characterize this pseu-dogene in hominids (45 SNPs detected in humans, 13 in gorillas, 19 inorangutans, and 17 at least in the genus Pan), but similarly to thefunctional NAT1 and NAT2 genes, little sharing between species wasfound (Table 1). Ancient Homo genomes also reflect the high level ofhominid polymorphism at NATP (Supplementary Table S8). Besidesthree modern human SNPs that were also found heterozygous inthe ancient Ust’-Ishim Homo sapiens sample, three positions at leastapparently differ between Neanderthals and Denisova, a proportionsimilar to that of NAT1. We also note that an A/G polymorphism isreported in Denisova (at position 18’228’182) which, according toour dataset, has not been detected in any other hominid species.
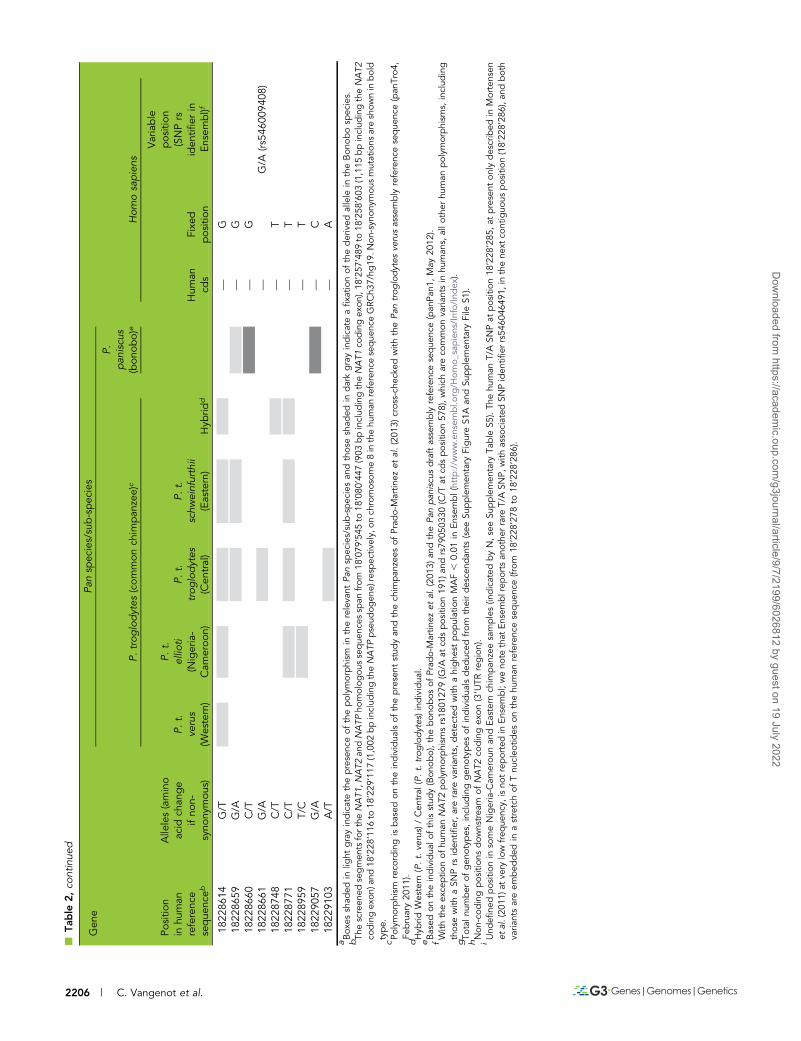
Within the Pan genus, the largest group of genotyped samples inthis study (and in particular the Western chimpanzee sub-species,Pan troglodytes verus), 40 segregating sites were observed in total forthe three NAT genes. Among these 40 sites, only 15 were found inWestern chimpanzees (Table 2; see also Supplementary File S1, andSupplementary Tables S3, S4 and S5). We detected 32 polymorphicpositions in common chimpanzees (P. troglodytes), but only five areshared by all Pan troglodytes sub-species (Table 2).
None of the polymorphic positions shared between all commonchimpanzees is observed in bonobos (P. paniscus). In this latter species,only five polymorphic sites were identified in the three NAT genes, oneof which (at 18’079’925 in NAT1) is shared withWestern chimpanzeesand the other (at 18’228’659 in NATP) with Central and Eastern chim-panzees. Six positions were apparently fixed on the derived allele inbonobos, one of them (at 18’228’285 in NATP) being polymorphic incommon chimpanzees.
NAT haplotypes in PanThe Arylamine N-acetyltransferase gene nomenclature committee(Hein et al. 2008) currently lists 28 human NAT1 haplotypes encod-ing a dozen variant NAT1 proteins, some of which are associated withlower enzymatic activity than the reference human NAT1�4 haplo-type, while the number of documented human NAT2 haplotypeslisted is 108 and the number of encoded variant NAT2 proteinscomes close to 70, about 15 of which are involved in a “slow” acety-lation phenotype (http://nat.mbg.duth.gr). In humans, as reviewed in(Sabbagh et al. 2018), frequency distributions of haplotypes encodingNAT2 proteins are highly variable among populations (see forinstance Figure 2 in (Sabbagh et al. 2018)), whereas for NAT1,frequency distributions inmost human populations are dominated byonly two major haplotypes (with cumulated frequencies varying be-tween 85% and 100%), that differ by two SNPs in the 39UTR regionand whose relative phenotypic effect is considered as moderate (hap-lotype NAT1�10 probably enhancing protein expression relative tothe most common haplotype, NAT1�4, (Hein et al. 2018)).
Knowledge of NAT diversity within other great ape species is atpresent lacking. We thus inferred haplotypes at the three homolo-gous NAT genes for individuals belonging to the genus Pan (due tothe small size of available samples, such inference was not possiblefor gorillas and orangutans), so as to characterize Pan NAT diversity,and predict the functional consequences of non-synonymousmutations.
2204 | C. Vangenot et al.
Dow
nloaded from https://academ
ic.oup.com/g3journal/article/9/7/2199/6026812 by guest on 19 July 2022

nTa
ble
2Se
gregatingsitesiden
tified
inthethreeNATgen
eparalogsin
thedifferent
(sub
-)sp
eciesofthegen
usPan,withparalogous
positions
inhu
man
ssh
ownin
thethreelast
columns
a.
Gen
ePa
nsp
ecies/sub-spec
ies
Positio
nin
human
referenc
eseque
nceb
Alle
les(amino
acid
chan
geifno
n-syno
nymou
s)
P.trog
lody
tes(com
mon
chim
panzee
)c
P.pan
iscu
s(bon
obo)
eHom
osapien
s
P.t.
verus
(Western)
P.t.
ellio
ti(N
igeria-
Cam
eroo
n)
P.t.
trog
lodytes
(Cen
tral)
P.t.
schw
einfurthii
(Eastern)
Hyb
ridd
Hum
ancd
sFixe
dposition
Variable
position
(SNPrs
iden
tifier
inEn
sembl)f
NAT1
Pantotalsam
ple
size
g72
105
61
1418
0796
32G/A
(D26
N)
76G
1807
9703
C/T
147
C18
0798
59C/T
303
C18
0798
97T/C(I1
14T)
341
T/A/C
(rs1
4597
5713
)18
0799
25T/C
369
T18
0800
14C/T
458
C/T
(rs37
4226
986)
1808
0074
A/C
(E17
3A)
518
A18
0801
53T/G
(I199
M)
597
T18
0803
16G/C
(E25
4Q)
760
G18
0803
45A/G
(I263
M)
789
ANAT2
Pantotalsam
ple
size
g72
105
61
1418
2575
49T/C
36T
1825
7585
A/C
(L24
F)72
A18
2576
58G/A
(E49
K)
145
G18
2577
04G/A
(R64
Q)
191
G/A
(rs1
8012
79)
1825
8027
A/G
(N17
2D)
514
A18
2580
91C/T
(T19
3M)
578
C/T
(rs7
9050
330)
1825
8302
G/T
789
T18
2584
47G/A
934h
G18
2584
62C/G
949h
CNATP
Pantotalsam
ple
size
g75
105
61
1418
2281
46G/T
—G
1822
8189
C/T
—C
1822
8238
A/G
—A
1822
8242
A/G
—A
1822
8285
iT/A
NN
—T/A
1822
8304
C/T
—C
1822
8368
T/C
—T
1822
8404
C/T
—C
1822
8501
C/T
—C
1822
8543
A/G
—A
1822
8560
C/A
—C
1822
8582
G/T
—G
(con
tinue
d)
Volume 9 July 2019 | Diversity in Hominid NAT genes | 2205
Dow
nloaded from https://academ
ic.oup.com/g3journal/article/9/7/2199/6026812 by guest on 19 July 2022
nTa
ble
2,co
ntinue
d
Gen
ePa
nsp
ecies/sub-spec
ies
Positio
nin
human
referenc
eseque
nceb
Alle
les(amino
acid
chan
geifno
n-syno
nymou
s)
P.trog
lody
tes(com
mon
chim
panzee
)c
P.pan
iscu
s(bon
obo)
eHom
osapien
s
P.t.
verus
(Western)
P.t.
ellio
ti(N
igeria-
Cam
eroo
n)
P.t.
trog
lodytes
(Cen
tral)
P.t.
schw
einfurthii
(Eastern)
Hyb
ridd
Hum
ancd
sFixe
dposition
Variable
position
(SNPrs
iden
tifier
inEn
sembl)f
1822
8614
G/T
—G
1822
8659
G/A
—G
1822
8660
C/T
—G
1822
8661
G/A
—G/A
(rs54
6009
408)
1822
8748
C/T
—T
1822
8771
C/T
—T
1822
8959
T/C
—T
1822
9057
G/A
—C
1822
9103
A/T
—A
aBox
esshad
edin
light
grayindicatethepresenc
eof
thepolym
orphism
intherelevant
Pansp
ecies/sub-spec
iesan
dthoseshad
edin
darkgrayindicateafixatio
nof
thederived
allele
intheBon
obosp
ecies.
bTh
escreen
edsegmen
tsforthe
NAT1
,NAT2
andNATP
homolog
ousseque
nces
span
from
18’079
’545
to18
’080
’447
(903
bpinclud
ingtheNAT1
codingex
on),18
’257
’489
to18
’258
’603
(1,115
bpinclud
ingtheNAT2
codingex
on)a
nd18
’228
’116
to18
’229
’117
(1,002
bpinclud
ingtheNATP
pseud
ogen
e)resp
ectiv
ely,on
chromosom
e8in
thehu
man
referenc
eseque
nceGRC
h37/hg
19.N
on-syn
onym
ousmutations
areshow
nin
bold
type.
cPo
lymorphism
reco
rdingisbased
ontheindividua
lsof
thepresent
stud
yan
dthech
impan
zees
ofPrad
o-Martin
ezet
al.(201
3)cross-ch
ecke
dwith
thePa
ntrog
lodytes
verusassembly
referenc
eseque
nce(pan
Tro4
,Fe
bruary20
11).
dHyb
ridWestern
(P.t.ve
rus)/Cen
tral
(P.t.trog
lodytes)ind
ividua
l.eBased
ontheindividua
lofthisstud
y(Bon
obo),thebon
obos
ofPrad
o-Martin
ezet
al.(201
3)an
dthePa
npan
iscu
sdraftassembly
referenc
eseque
nce(pan
Pan1
,May
2012
).fWith
theex
ceptio
nof
human
NAT2
polym
orphism
srs18
0127
9(G
/Aat
cdsposition
191)
andrs79
0503
30(C/T
atcd
sposition
578),w
hich
areco
mmon
varia
ntsin
human
s,allo
ther
human
polym
orphism
s,includ
ing
thosewith
aSN
Prs
iden
tifier,a
rerare
varia
nts,
detec
tedwith
ahighe
stpop
ulationMAF,
0.01
inEn
sembl(http://w
ww.ensem
bl.o
rg/H
omo_
sapiens/Info/Index
).gTo
taln
umber
ofgen
otyp
es,includ
inggen
otyp
esof
individua
lsded
uced
from
theirdesce
ndan
ts(see
Supplemen
tary
FigureS1
Aan
dSu
pplemen
tary
File
S1).
hNon
-cod
ingposition
sdow
nstrea
mof
NAT2
codingex
on(39U
TRregion).
iUnd
efine
dposition
insomeNigeria-C
amerou
nan
dEa
sternch
impan
zeesamples(in
dicated
byN,see
Supplemen
tary
Table
S5).Th
ehu
man
T/ASN
Pat
position
18’228
’285
,atpresent
only
described
inMortensen
etal.(20
11)a
tve
rylowfreq
uenc
y,isno
treportedin
Ensembl;weno
tethat
Ensemblrep
orts
anothe
rrare
T/ASN
P,with
associated
SNPiden
tifier
rs54
6046
491,
inthene
xtco
ntiguo
usposition
(18’22
8’28
6),a
ndboth
varia
ntsareem
bed
ded
inastretchof
Tnu
cleo
tides
onthehu
man
referenc
eseque
nce(from
18’228
’278
to18
’228
’286
).
2206 | C. Vangenot et al.
Dow
nloaded from https://academ
ic.oup.com/g3journal/article/9/7/2199/6026812 by guest on 19 July 2022
The PHASE analysis of the 108 Pan genotypes (94 chimpanzees and14 bonobos) led to the inference of 12 Pan haplotypes for NAT1,10 for NAT2, and 19 for NATP (Table 3).
We found dissimilar frequency distributions between the threeNATgenes in all Pan species (Table 4 and Figure 1; haplotype counts in thetotal samples including related individuals are provided in Supplemen-tary Table S9). As reported in Table 4, none of these frequency distri-butions were found to deviate fromHardy-Weinberg equilibrium, aftercorrection for multiple testing.
AtNAT1, haplotype frequency distributions in all chimpanzee sub-species are characterized by a single major haplotype (NAT1�1 occur-ring at frequencies between 65% and 80%) along with three to fourother haplotypes at lower frequencies (Table 4 and Figure 1). Bycontrast, NAT1�6 is the more frequent haplotype in bonobos (54%),followed byNAT1�1 andNAT1�12 (25% and 21%, respectively). Whenmeasured by FST fixation indices, which take into consideration themolecular diversity of haplotypes, significant differentiation was onlyfound between bonobos and the other Pan (Supplementary Table S6).On the other hand, it is noteworthy that in bonobos, the two haplo-types NAT1�6 and NAT1�12 observed besides NAT1�1 differ from itonly by a single synonymous mutation (Table 3 and SupplementaryFigure S2). In other words, 100% of proteins expressed by NAT1 inbonobos are identical to the product of the NAT1�1 haplotype pre-dominant in all chimpanzee sub-species. In turn, most of the otherNAT1 haplotypes detected in these sub-species differ from NAT1�1by one non-synonymous change, resulting in the existence of sevendistinct NAT1 proteins: at least four in each of theWestern (P. t. verus),Central (P. t. troglodytes), and Eastern (P. t. schweinfurthii) sub-species,and three in the Nigeria-Cameroon (P. t. ellioti) chimpanzees, accordingto our observations (Supplementary Table S10).
AtNAT2, a single frequent haplotype is observed in all Pan species,along with one to three less frequent haplotypes (Table 4 and Figure 1).In contrast to NAT1, the frequency of the most prevalent NAT2haplotype is higher (80–92.5%), and it differs between species andsub-species: it is NAT2�1 in the Western (P. t. verus), NAT2�4 inthe Central (P. t. troglodytes) and Eastern (P. t. schweinfurthii), andNAT2�6 in the Nigeria-Cameroon (P. t. ellioti) chimpanzee sub-species,and NAT2�7 in the bonobos (P. paniscus). Also in contrast to NAT1,no NAT2 haplotype was found shared between chimpanzees andbonobos. Thus, unsurprisingly, significant differentiation was foundnot only between bonobos and the other Pan, but also between allchimpanzee sub-species, except between Central (P. t. troglodytes) andEastern (P. t. schweinfurthii) chimpanzees (Supplementary Table S6).On the other hand, although haplotype NAT2�4 is the predominanthaplotype in Central and Eastern chimpanzees, it only differs by onesynonymous mutation from the most prevalent NAT2�1 haplotypein Western (P. t. verus) chimpanzees (Table 3 and SupplementaryFigure S3). This suggests little differentiation between these threeWestern, Central, and Eastern sub-species at the level of NAT2 geneproducts. Indeed, the 10 NAT2 haplotypes detected in Pan translateinto six distinct NAT2 proteins, of which we observed two in each ofthe chimpanzee subspecies, and three in bonobos (SupplementaryTable S10). In fact, both the commonest haplotype in Nigeria-Cameroonchimpanzees (NAT2�6 in P. t. ellioti) and all haplotypes in bonobosdiffer from most other Pan NAT2 haplotypes by at least one non-synonymous change.
Finally, the NATP pseudogene haplotypes are more evenly distrib-uted than those of the two functional genes in all the chimpanzeesub-species, with two or more frequent NATP haplotypes (Table 4and Figure 1). By contrast, in bonobos, only two haplotypes werefound, one of which with a frequency of 96% (NATP�18), and none is
shared with chimpanzees. However, substantial haplotype sharingis observed between chimpanzee sub-species, notably for haplotypesNATP�2 and NATP�8. Analyses of molecular variance detected asignificant level of genetic differentiation only between bonobosand all chimpanzees, and among the latter, betweenWestern chim-panzees (P. t. verus) and the other sub-species (SupplementaryTable S6). A high level of sequence diversity at NATP may explainthese complex results. Indeed, the median-joining network of NATPhaplotypes (Supplementary Figure S4) displays two reticulations anda few rather divergent haplotypes (e.g., NATP�14, NATP�15, andNATP�16), which raises the possibility that some Pan haplotypes wereunsampled.
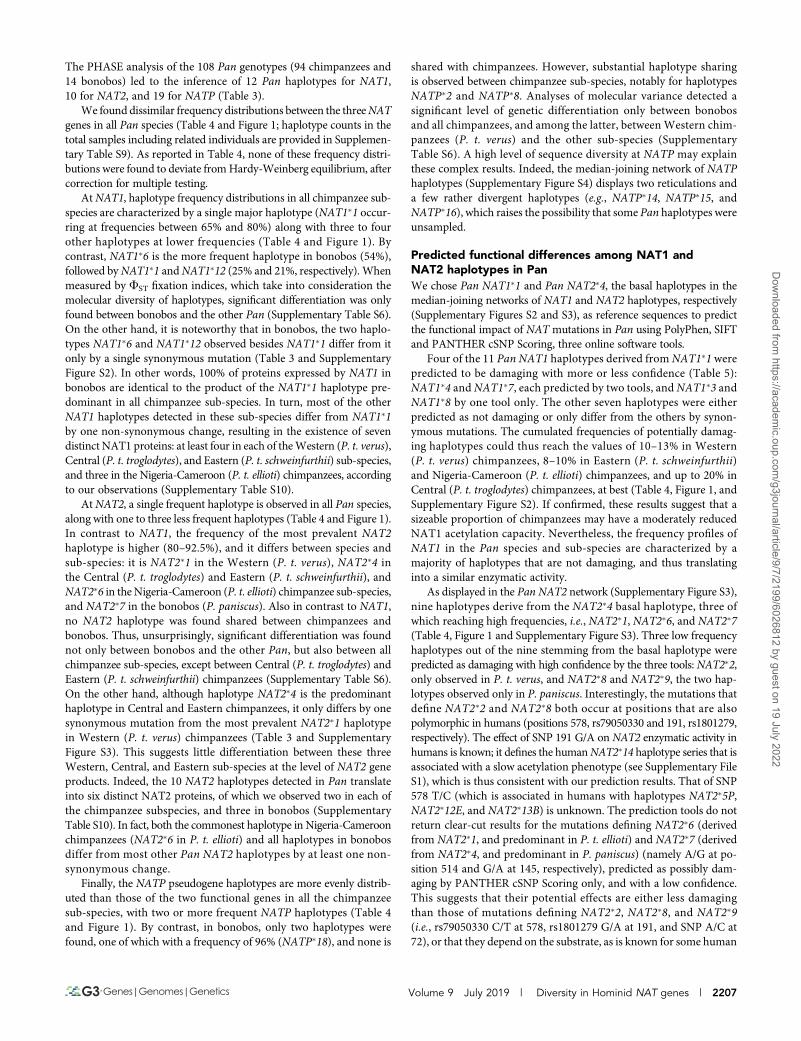
Predicted functional differences among NAT1 andNAT2 haplotypes in PanWe chose Pan NAT1�1 and Pan NAT2�4, the basal haplotypes in themedian-joining networks of NAT1 and NAT2 haplotypes, respectively(Supplementary Figures S2 and S3), as reference sequences to predictthe functional impact of NAT mutations in Pan using PolyPhen, SIFTand PANTHER cSNP Scoring, three online software tools.
Four of the 11 Pan NAT1 haplotypes derived from NAT1�1 werepredicted to be damaging with more or less confidence (Table 5):NAT1�4 and NAT1�7, each predicted by two tools, and NAT1�3 andNAT1�8 by one tool only. The other seven haplotypes were eitherpredicted as not damaging or only differ from the others by synon-ymous mutations. The cumulated frequencies of potentially damag-ing haplotypes could thus reach the values of 10–13% in Western(P. t. verus) chimpanzees, 8–10% in Eastern (P. t. schweinfurthii)and Nigeria-Cameroon (P. t. ellioti) chimpanzees, and up to 20% inCentral (P. t. troglodytes) chimpanzees, at best (Table 4, Figure 1, andSupplementary Figure S2). If confirmed, these results suggest that asizeable proportion of chimpanzees may have a moderately reducedNAT1 acetylation capacity. Nevertheless, the frequency profiles ofNAT1 in the Pan species and sub-species are characterized by amajority of haplotypes that are not damaging, and thus translatinginto a similar enzymatic activity.
As displayed in the Pan NAT2 network (Supplementary Figure S3),nine haplotypes derive from the NAT2�4 basal haplotype, three ofwhich reaching high frequencies, i.e., NAT2�1, NAT2�6, and NAT2�7(Table 4, Figure 1 and Supplementary Figure S3). Three low frequencyhaplotypes out of the nine stemming from the basal haplotype werepredicted as damaging with high confidence by the three tools: NAT2�2,only observed in P. t. verus, and NAT2�8 and NAT2�9, the two hap-lotypes observed only in P. paniscus. Interestingly, the mutations thatdefine NAT2�2 and NAT2�8 both occur at positions that are alsopolymorphic in humans (positions 578, rs79050330 and 191, rs1801279,respectively). The effect of SNP 191 G/A on NAT2 enzymatic activity inhumans is known; it defines the humanNAT2�14 haplotype series that isassociated with a slow acetylation phenotype (see Supplementary FileS1), which is thus consistent with our prediction results. That of SNP578 T/C (which is associated in humans with haplotypes NAT2�5P,NAT2�12E, and NAT2�13B) is unknown. The prediction tools do notreturn clear-cut results for the mutations defining NAT2�6 (derivedfrom NAT2�1, and predominant in P. t. ellioti) and NAT2�7 (derivedfrom NAT2�4, and predominant in P. paniscus) (namely A/G at po-sition 514 and G/A at 145, respectively), predicted as possibly dam-aging by PANTHER cSNP Scoring only, and with a low confidence.This suggests that their potential effects are either less damagingthan those of mutations defining NAT2�2, NAT2�8, and NAT2�9(i.e., rs79050330 C/T at 578, rs1801279 G/A at 191, and SNP A/C at72), or that they depend on the substrate, as is known for some human
Volume 9 July 2019 | Diversity in Hominid NAT genes | 2207
Dow
nloaded from https://academ
ic.oup.com/g3journal/article/9/7/2199/6026812 by guest on 19 July 2022

nTa
ble
3Hap
lotypes
ofthethreeNATgen
eparalogsin
thegen
usPan
NAT1
Positio
na79
’632
79’703
79’859
79’897
79’925
80’014
80’074
80’153
80’316
80’345
SNPb
G76
AC14
7TC30
3TT3
41C
T369
CC45
8TA51
8CT5
97G
G76
0CA78
9GAminoacid
chan
ge
D26
NI114
TE1
73A
I199
ME2
54Q
I263
M
Hap
lotypes
NAT1
� 1G
CC
TT
CA
TG
ANAT1
� 2.
T.
..
..
..
.NAT1
� 3.
..
..
..
..
GNAT1
� 4.
T.
..
..
G.
.NAT1
� 5A
..
..
..
..
.NAT1
� 6.
..
.C
..
..
.NAT1
� 7.
..
..
..
.C
.NAT1
� 8.
..
C.
..
..
.NAT1
� 9.
..
..
TC
..
.NAT1
� 10
AT
..
..
..
..
NAT1
� 11
..
..
..
C.
..
NAT1
� 12
..
T.
..
..
..
NAT2
Positio
nc57
’549
57’585
57’658
57’704
58’027
58’091
58’302
58’447
58’462
SNPb
T36C
A72
CG14
5AG19
1AA51
4GC57
8TT7
89G
A93
4GC94
9GAminoacid
chan
ge
L24F
E49K
R64Q
N17
2DT1
93M
Hap
lotypes
NAT2
� 1T
AG
GA
CT
AC
NAT2
� 2.
..
..
T.
..
NAT2
� 3.
..
..
.G
..
NAT2
� 4.
..
..
..
G.
NAT2
� 5.
..
..
..
.G
NAT2
� 6.
..
.G
..
..
NAT2
� 7.
.A
..
..
G.
NAT2
� 8.
.A
A.
..
G.
NAT2
� 9.
CA
..
..
G.
NAT2
� 10
C.
..
G.
..
.
NATP
Positio
nc28
’146
28’189
28’238
28’242
28’279
28’285
28’304
28’368
28’404
28’501
SNPb
3174
123
127
164
170
189
253
289
386
Hap
lotypes
NATP
� 1G
CA
AT
TC
CC
TNATP
� 2.
..
..
..
T.
.NATP
� 3.
..
..
..
T.
.NATP
� 4.
..
..
..
T.
.NATP
� 5.
..
..
..
T.
.NATP
� 6.
..
..
..
T.
CNATP
� 7.
.G
..
..
T.
.NATP
� 8.
..
..
..
T.
CNATP
� 9.
..
..
..
T.
CNATP
� 10
..
..
..
.T
.C
(con
tinue
d)
2208 | C. Vangenot et al.
Dow
nloaded from https://academ
ic.oup.com/g3journal/article/9/7/2199/6026812 by guest on 19 July 2022

Table
3,co
ntinue
d
NATP
Positio
nc28
’146
28’189
28’238
28’242
28’279
28’285
28’304
28’368
28’404
28’501
SNPb
3174
123
127
164
170
189
253
289
386
Hap
lotypes
NATP
� 11
..
..
.A
.T
.C
NATP
� 12
..
..
.A
.T
.C
NATP
� 13
..
..
.A
.T
TC
NATP
� 14
..
..
.A
.T
TC
NATP
� 15
..
..
.A
.T
TC
NATP
� 16
.T
..
.A
.T
.C
NATP
� 17
T.
..
.A
.T
.C
NATP
� 18
..
.G
CA
TT
.C
NATP
� 19
..
.G
CA
TT
.C
NATP
(con
tinue
d)
Positio
nc28
’543
28’560
28’575
28’576
28’582
28’614
28’659
28’660
28’661
28’748
SNPb
428
445
460
461
467
499
544
545
546
633
Hap
lotypes
NATP
� 1A
CA
GG
TG
CG
TNATP
� 2.
..
..
..
..
.NATP
� 3.
..
..
..
.A
.NATP
� 4.
..
.T
..
..
.NATP
� 5.
A.
..
..
..
.NATP
� 6.
..
..
..
..
.NATP
� 7.
..
..
..
..
.NATP
� 8.
..
..
G.
..
.NATP
� 9.
..
..
G.
..
.NATP
� 10
..
..
.G
A.
..
NATP
� 11
..
..
..
..
..
NATP
� 12
..
..
..
..
..
NATP
� 13
..
..
.G
..
.C
NATP
� 14
G.
..
..
..
..
NATP
� 15
G.
..
.G
..
..
NATP
� 16
..
..
.G
..
..
NATP
� 17
..
..
..
..
..
NATP
� 18
..
GA
.G
.T
..
NATP
� 19
..
GA
.G
AT
.
NATP
(con
tinue
d)
Positio
nc28
’771
28’959
29’057
29’103
SNPb
656
844
942
988
Hap
lotypes
NATP
� 1C
TG
ANATP
� 2.
..
.NATP
� 3.
..
.NATP
� 4.
..
.NATP
� 5.
..
.NATP
� 6.
..
.
(con
tinue
d)
Volume 9 July 2019 | Diversity in Hominid NAT genes | 2209
Dow
nloaded from https://academ
ic.oup.com/g3journal/article/9/7/2199/6026812 by guest on 19 July 2022

polymorphisms (Hein et al. 2006) (see Supplementary File S1). Incontrast to Western (P. t. verus) chimpanzees, where the cumulatedfrequencies of NAT2�2, NAT2�8 and NAT2�9 are lower than 5%,they reach 10% in bonobos (Table 4 and Figure 1). If confirmed, ourprediction results could thus indicate that a significant proportionof bonobos (but a smaller proportion of Western chimpanzees) couldhave a slow NAT2 acetylation phenotype.
NAT genetic diversity and tests of selective neutralityin PanWe found that theWestern (P. t. verus) chimpanzee sub-species has thelowest diversity among the Pan genus forNAT1 (Table 6 and Figure 2).Indeed, expected heterozygosity (h) ranges from 0.34 inWestern chim-panzees (BPRC sample) to 0.63 in bonobos (P. paniscus), and nucleo-tide diversity (reported asp x 1023) from 0.58 inWestern chimpanzeesto 1.08 in Eastern (P. t. schweinfurthii) chimpanzees. A significant de-viation from selective neutrality and demographic equilibrium due tohomozygosity excess was found for the Central (P. t. troglodytes) andEastern (P. t. schweinfurthii) chimpanzee sub-species with one test ofselective neutrality, i.e., the Ewens-Watterson test. However, althoughhighly significant, these results must be considered with caution asthey may represent artifacts due to the low sample sizes for thesetwo sub-species (only five and six individuals, respectively, Table 6).No other neutrality or demographic equilibrium test returned anysignificant result.
Similarly to NAT1, Western (P. t. verus) chimpanzees also have thelowest diversity among the Pan genus for NAT2, with h varying from0.15 inWestern (San Diego sample) to 0.38 in Central (P. t. troglodytes)chimpanzees, and p from 0.13 inWestern to 0.50 in Central chimpan-zees (Table 6 and Figure 2). However, in contrast toNAT1, a significantdeparture from the expected diversity under selective neutrality anddemographic equilibrium was found with at least one test in all speciesand sub-species before adjustment for multiple testing, with the excep-tion of Nigeria-Cameroon (P. t. ellioti). All observed deviations wereeither due to an excess of homozygosity (Western-verus, Central-troglodytes and Eastern-schweinfurthii sub-species), and/or to an ex-cess of rare (recent) haplotypes, yielding negative values of Tajima’sD(BPRC sample ofWestern-verus chimpanzees, andEastern-schweinfurthiichimpanzees) or Fu’s FS (Western chimpanzees and bonobos). ForWestern chimpanzees, all three tests were significant in the BPRCsample and Fu’s FS test remained so after correction for multipletesting. The results were less clear-cut in the 122 sub-samples of theSan Diego sample, as deviations from neutrality were mainly observedwith Fu’s FS test (16%, 0% and 87% significant deviations with theEwens-Watterson, Tajima’s D and Fu’s FS tests, respectively). Sim-ilarly to NAT1, due to small sample size, we consider with cautionthe Ewens-Watterson tests results for Central (P. t. troglodytes) andEastern (P. t. schweinfurthii) chimpanzees (and the Tajima’s D testresult for the latter), although they were still significant after account-ing for type I error rate. Nevertheless, taken all together, these resultssuggest a possible action of directional (positive or purifying) selectionat NAT2, at least in Western (P. t. verus) chimpanzees.
At NATP, bonobos (P. paniscus) have a particularly low diversityandWestern (P. t. verus) chimpanzees have the second lowest diversityamong the Pan genus. Indeed, expected heterozygosity ranges from0.07 in bonobos, and 0.64 inWestern chimpanzees, to 0.89 in Central(P. t. troglodytes) chimpanzees, and nucleotide diversity from 0.07 inbonobos, and 0.77 in Western chimpanzees, to 2.75 in Central chim-panzees (Table 6 and Figure 2). While the null hypothesis of selectiveneutrality and demographic equilibrium was not rejected for any ofthe Pan troglodytes sub-species, deviations due to a significant excessTa
ble
3,co
ntinue
d
NATP
(con
tinue
d)
Positio
nc28
’771
28’959
29’057
29’103
SNPb
656
844
942
988
Hap
lotypes
NATP
� 7.
..
.NATP
� 8.
..
.NATP
� 9T
..
.NATP
� 10
T.
..
NATP
� 11
..
..
NATP
� 12
.C
..
NATP
� 13
T.
..
NATP
� 14
T.
..
NATP
� 15
T.
..
NATP
� 16
T.
.T
NATP
� 17
..
..
NATP
� 18
..
A.
NATP
� 19
..
A.
aPo
sitio
n(+18
’000
’000
)onGRC
h37/hg
19.
bSN
Pposition
relativ
eto
theco
dingex
onof
NAT1
,NAT2
,or
itsparalog
seque
nceon
NATP
(startsat
position
1).
cPo
sitio
n(+18
’200
’000
)onGRC
h37/hg
19.
2210 | C. Vangenot et al.
Dow
nloaded from https://academ
ic.oup.com/g3journal/article/9/7/2199/6026812 by guest on 19 July 2022

n Table 4 NAT haplotype frequencies (%) estimated in the different species and sub-species of the genus Pan and results of Hardy-Weinberg equilibrium tests.
Pan species and sub-species
P. t. verus (Western chimpanzee)
San Diegosamplea
BPRCsample
P. t. ellioti(Nigeria-Cameroonchimpanzee)
P. t.troglodytes(Central
chimpanzee)
P. t.schweinfurthii
(Easternchimpanzee)
P. paniscus(Bonobo)
Pan NAT1 haplotypesNAT1 �1 79.33 (1.71) 80.43 65.00 70.00 66.70 25.00NAT1 �2 7.97 (0.94) 4.35 5.00 0 0 0NAT1 �3 1.59 (1.38) 0 0 10.00 8.33 0NAT1 �4 8.33 (0) 13.04 0 0 0 0NAT1 �5 2.78 (0) 0 0 0 0 0NAT1 �6 0 2.17 0 0 0 53.60NAT1 �7 0 0 10.00 0 0 0NAT1 �8 0 0 0 10.00 0 0NAT1 �9 0 0 0 0 8.33 0NAT1 �10 0 0 20.00 10.00 8.33 0NAT1 �11 0 0 0 0 8.33 0NAT1 �12 0 0 0 0 0 21.40
Total (2n chromosomes) 36 46 20 10 12 28Hardy-Weinberg testb:
Ho 0.36 (0.03) 0.26 0.50 0.60 0.50 0.71He 0.37 (0.03) 0.34 0.55 0.53 0.58 0.63
P-value 2 [0.39 ; 0.64] 0.20 0.35 . 0.99 0.51 0.45Pan NAT2 haplotypes
NAT2 �1 92.49 (1.27) 91.30 5.00 10.00 0 0NAT2 �2 2.41 (0.94) 4.35 0 0 0 0NAT2 �3 0 2.17 0 0 0 0NAT2 �4 5.10 (1.03) 0 10.00 80.00 91.70 0NAT2 �5 0 2.17 0 0 0 0NAT2 �6 0 0 85.00 10.00 0 0NAT2 �7 0 0 0 0 0 89.3NAT2 �8 0 0 0 0 0 3.57NAT2 �9 0 0 0 0 0 7.14NAT2 �10 0 0 0 0 8.33 0
Total (2n chromosomes) 36 46 20 10 12 28Hardy-Weinberg testb:
Ho 0.15 (0.03) 0.17 0.30 0.20 0.17 0.21He 0.15 (0.02) 0.17 0.28 0.38 0.17 0.20
P-value 2 [0.08 ; . 0.99 ] . 0.99 . 0.99 0.11 . 0.99 . 0.99Pan NATP haplotypes
NATP �1 24.61 (2.46) 44.00 0 10.00 0 0NATP �2 52.14 (1.7) 42.00 40.00 10.00 58.30 0NATP �3 0 0 0 20.00 0 0NATP �4 0 6.00 0 0 0 0NATP �5 0 2.00 0 0 0 0NATP �6 2.32 (1.03) 0 0 0 0 0NATP �7 19.33 (2.21) 6.00 0 0 0 0NATP �8 1.59 (1.38) 0 25.00 20.00 8.33 0NATP �9 0 0 0 30.00 0 0NATP �10 0 0 0 0 8.33 0NATP �11 0 0 10.00 0 16.67 0NATP �12 0 0 5.00 0 0 0NATP �13 c 0 0 0 0 0 0NATP �14 0 0 5.00 0 0 0NATP �15 0 0 15.00 0 0 0NATP �16 0 0 0 10.00 0 0NATP �17 0 0 0 0 8.33 0NATP �18 0 0 0 0 0 96.43NATP �19 0 0 0 0 0 3.57
Total (2n chromosomes) 36 50 20 10 12 28
(continued)
Volume 9 July 2019 | Diversity in Hominid NAT genes | 2211
Dow
nloaded from https://academ
ic.oup.com/g3journal/article/9/7/2199/6026812 by guest on 19 July 2022

of homozygotes (Ewens-Watterson test) and of rare alleles (Fu’s FS test)were found for bonobos (P. paniscus), that remained even after correc-tion for multiple testing. Considering that the locus is a pseudogene,its extremely low diversity in bonobos (only two NATP haplotypesobserved, one of which with a frequency over 96%, Table 4 and Figure 1)and the associated significant results returned by the neutrality testsare surprising and call for further investigation.
Figure 2 highlights a marked difference in diversity levels betweenthe threeNAT genes, particularly betweenNAT1 andNAT2. We foundonly a marginally significant difference in Pan expected heterozygosity(h) between the two functional genes,NAT1 andNAT2, after correctingfor multiple testing (P = 0.039), whereas nucleotide diversity (p) issignificantly higher at NAT1 than at NAT2 (P = 0. 0065). Since thecomparisons of the two functional paralogs with the pseudogene areinfluenced by the very low diversity ofNATP in bonobos (P. paniscus),we compared again diversity levels between genes considering onlychimpanzee sub-species. In Pan troglodytes indeed, nucleotide diver-sity at NATP is significantly higher than at each of the two functionalgenes (P = 0.018 for NAT1 vs. NATP, and P = 0.018 for NAT2 vs.NATP, respectively), and expected heterozygosity at NATP is signif-icantly higher than at NAT2 (P = 0.012).
Comparison of NAT genetic diversity between Panand humansThe total number of human haplotypes represented in the datasetof human populations analyzed here (Supplementary Table S7) is21 for NAT1 (3.5 per sample, on average), 44 for NAT2 (10.7), and58 for NATP (10.6). No deviation from Hardy-Weinberg equilib-rium was found for any of the human samples at any of the NATgenes, after correction for multiple testing (Supplementary Table S7).
When compared to chimpanzees and bonobos, humans appear tohave about five times less diversity than Pan at the homologous NAT1gene, while four to nine times more diversity than Pan atNAT2 (Figure2, Table 6 and Supplementary Table S7). In Figure 2, the documentedhigh level of diversity of human NAT2 is clearly illustrated by its sim-ilarity to NATP (Sabbagh et al. 2018). Both the Mann-Whitney U andStudent t-tests, adjusted for multiple testing, confirm that expectedheterozygosity and nucleotide diversity are significantly higher in Panspecies and sub-species than in human populations at NAT1, and sig-nificantly lower at NAT2 (Supplementary Table S11). By contrast, bothexpected heterozygosity and nucleotide diversity of human populationsat the NATP pseudogene fall within the range of those observed in
chimpanzees (P. troglodytes), whereas both estimates were foundto be, as expected, extremely low in bonobos. However, differencesin NATP diversity levels between humans and the Pan species andsub-species were not significant, even before multiple testing ad-justment, and despite the extremely low estimates of bonobos (allP-values . 0.05).
At NAT1, while no significant rejection was observed in Pan, selec-tive neutrality and demographic equilibrium are rejected in many hu-man samples (Table 6 and Supplementary Table S12). Indeed, each ofthe three tests of selective neutrality used rejected the null hypothesisat NAT1 in at least one population, even after correction for multipletesting. In the Ewens-Watterson homozygosity test, the observed ho-mozygosity (Fo) was found always higher than the expected (Fe), andsignificantly so in nine of the 19 tested population samples (eight aftercorrection for multiple testing). Similarly, Tajima’s D and FS values aresignificantly negative in 11 (one after correction) and eight (three aftercorrection) population samples, respectively. Conversely, while severaltests rejected the null neutral equilibrium model at NAT2 in Pan, norejection was observed for this gene in human populations with any ofthe three tests, after correction for multiple testing. At NATP, a singlerejection in humans was observed with Fu’s FS test after correction (inthe Dinka of Sudan, Supplementary Table S12). Thus, rejection of theneutral equilibrium model is more consistent at NAT2 in Pan than inhumans, whereas it is more consistent atNAT1 in humans than in Pan.
Comparison with NAT genetic diversity inother hominidsHaplotype inference for gorillas and orangutans could not be achievedwith high enough confidence, because several unknown positions inthe genotypes retrieved from GAGP overlapped with variants detectedin the sequenced samples of this study (Supplementary Tables S3, S4and S5). Thus, only nucleotide diversity was estimated for gorillas andorangutans (Supplementary Table S13). As shown in SupplementaryFigure S5, the relative levels of diversity at the three NAT genes differmarkedly between the two gorilla species available for this study (Westernand Eastern gorillas, G. gorilla and G. beringei, respectively), and betweenthe two orangutan species (Sumatran and Bornean orangutans, P. abeliiand P. pygmaeus, respectively). The results indicate a level of diversityat NAT1 similar to that of Pan for both species of gorillas, thus alsohigher than in humans, whereas the highest values among all great apeswere observed in orangutans, albeit differingmarkedly between the twoorangutan species (Supplementary File S1). At NAT2, Western gorillas
n Table 4, continued
Pan species and sub-species
P. t. verus (Western chimpanzee)
San Diegosamplea
BPRCsample
P. t. ellioti(Nigeria-Cameroonchimpanzee)
P. t.troglodytes(Central
chimpanzee)
P. t.schweinfurthii
(Easternchimpanzee)
P. paniscus(Bonobo)
Hardy-Weinberg testb:Ho 0.64 (0.04) 0.60 0.90 0.60 0.67 0.07He 0.65 (0.01) 0.64 0.78 0.89 0.67 0.07
P-value 2 [0.09 ; . 0.99 ] 0.06 0.03 d 0.15 0.76 . 0.99aAverage over the 122 sub-samples (see text), standard deviation in brackets.
bTest for departure from Hardy-Weinberg equilibrium; Ho: observed heterozygosity, He: expected heterozygosity (equivalent to gene diversity). The only significantdeviation from equilibrium (heterozygote excess at NATP in P. t. ellioti) is shown in bold.
cHaplotype NATP �13, which combines SNPs at 170, 253, 289, 386, 499, 633, and 656 (Table 3), was inferred only for the genotype of the hybrid P. t. verus/troglodytes individual.
dP-value . 0.05 after correction for multiple testing.
2212 | C. Vangenot et al.
Dow
nloaded from https://academ
ic.oup.com/g3journal/article/9/7/2199/6026812 by guest on 19 July 2022

and both species of orangutans display a diversity level comparable tothat of humans, thus higher than Pan, whereas the diversity level ofEastern gorillas is comparable to that of Pan. Finally, the highest valuesof diversity among all great apes, including humans, were observed forthe two orangutan and one of the gorilla (G. gorilla) species at NATP,while no diversity was detected in the sample of the other gorilla species(G. beringei). These contrasting results between both the two gorilla andthe two orangutan species should however be considered with cautionin view of the extremely small sample sizes of Eastern gorillas (n = 3)and Bornean orangutans (n = 6).
DISCUSSIONThe human acetylation polymorphism, discovered in the early 1950sand shown to be responsible for inter-individual variation in drugbiotransformation, is considered as the best-known example of apharmacogenetic trait (Meyer 2004; Agundez 2008a; McDonaghet al. 2014). As reviewed in Sabbagh et al. (2018), most of its inter-individual variation, further reflected in inter-population variation,is due to a high number of non-synonymous polymorphisms in thecoding region of the NAT2 gene, which ranks among the most poly-morphic human drug metabolizing genes. By contrast, human NAT1,
Figure 1 Haplotype frequency dis-tributions at the threeNAT genes inPan species and sub-species.
Volume 9 July 2019 | Diversity in Hominid NAT genes | 2213
Dow
nloaded from https://academ
ic.oup.com/g3journal/article/9/7/2199/6026812 by guest on 19 July 2022
its functional paralog located some 200 Kb upstream, displays up to13 times less diversity than NAT2 in its coding region. Several obser-vations suggest that NAT1 and NAT2 evolved under distinct selectiveregimes in humans. For human NAT1, it is generally held that itsproduct is functionally constrained, and thus subjected to purifyingselection, probably because of the expression of the NAT1 enzyme inmany tissues early during development (including reproductivetissues), and its implication in the metabolism of folates (Patin et al.2006a; Butcher and Minchin 2012). For human NAT2 however, dueto the role of its product in the detoxification of exogenous substances,it is proposed that the mode of subsistence and/or the chemical envi-ronment in which past populations have been living induced positivepopulation-specific selective pressures on the gene, thereby explainingthe documented differential distribution of acetylation prevalenceamong subsistence strategies and exploited biomes (Patin et al.2006a; Luca et al. 2008; Magalon et al. 2008; Sabbagh et al. 2008;Mortensen et al. 2011; Podgorná et al. 2015). To gain further insightson these evolutionary hypotheses, we performed here a comprehensiveanalysis of the diversity ofNAT genes in hominids (i.e., in chimpanzees,gorillas, orangutans, and hominins – humans, including Neanderthaland Denisova). To the best of our knowledge, this is the first studyinvestigating NAT intra-species polymorphism in hominids.
Levels and patterns of diversity of the functionalarylamine N-acetyltransferase genes in the Pan genuspoint to different selective pressures acting on NAT1and NAT2Several linesof evidence have led to the current view that, in humans, thediversity of the NATP pseudogene can be largely ascribed to our de-mographic history, but that ofNAT2was further shaped by population-specific selective pressures, whereas that of NAT1 was constrained by
relatively strong purifying selection (Sabbagh et al. 2018). Indeed, amarked geographic structure characterizes human NATP diversity,with less diversity in populations from Europe, Asia and the Americasthan in African populations (as illustrated in Supplementary Figure S6for the human dataset assembled in this study). For NAT2, the obser-vations are of an excess of non-synonymous relative to synonymousSNPs, a lack of correlation of genetic and geographic distances at theworldwide scale, and an unusual pattern of population structure thatdifferentiates Asian populations from Africans and Europeans morethan expected on neutral grounds. Finally, NAT1 is much less poly-morphic in humans, and is associated with a significant excess ofhomozygotes in many populations.
In Pan, the frequency distributions of inferred haplotypes suggestthat NAT genes have evolved under different selective regimes in thesespecies too. Similarly to humans, these distributions are character-ized by marked differences between the three NAT genes (Figure 1and Table 4). At the NATP pseudogene, we found extensive variationbetween Pan species and sub-species, and the shapes of these frequencydistributions resemble an expected L-shaped neutral distribution (i.e.,a haplotype at intermediate to high frequency, other haplotypes at in-creasingly low frequencies), except in bonobos (P. paniscus). At NAT1,the commonest haplotype in each subspecies is more frequent thanthose at NATP. The pattern is even more skewed toward a singlehaplotype at very high frequency at NAT2. Moreover, while the sameNAT1 haplotype (Pan NAT1�1) is predominant in each chimpanzeesub-species, at the NAT2 gene instead different haplotypes are prev-alent in each sub-species, except for Eastern (P. t. schweinfurthii) andCentral (P. t. troglodytes) chimpanzees, which is not surprisingknowing the related demographic history of these two sub-species(Gagneux et al. 1999; Hey 2010; Bjork et al. 2011; Prado-Martinez et al.2013; Fünfstück et al. 2015; de Manuel et al. 2016; Lobon et al. 2016).
n Table 5 Predictions of the effect of mutations between Pan NAT1 and NAT2 coding sequences according to PolyPhen, SIFT andPANTHER cSNP Scoring.
PolyPhen SIFT PANTHER cSNP Scoring
Haplotypes cDNA protein Scorea Predictionb Scorec Predictiond PSEPe Predictionf
Pan NAT1 (reference NAT1 �1)g
NAT1 �3 A789G I263M 0.279 (0.91-0.88) B 0.08 (3.08, 80) T 220 PODNAT1 �4 T597G I199M 0.369 (0.9-0.89) B 0.01 (3.07, 81) A 220 PODNAT1 �5 G76A D26N 0.377 (0.9-0.89) B 0.1 (3.08, 76) T 91 BNAT1 �7 G760C E254Q 0.892 (0.82-0.94) POD 0.07 (3.08, 80) T 455 PRDNAT1 �8 T341C I114T 0.099 (0.93-0.85) B 0.06 (3.07, 81) T 220 PODNAT1 �11 A518C E173A 0.013 (0.96-0.78) B 0.17 (3.07, 81) T 30 B
Pan NAT2 (reference NAT2 �4)h
NAT2 �2 C578T T193M 1 (0.00-1.00) PRD 0 (3.07, 51) A 456 PRDNAT2 �6 A514G N172D 0.001 (0.99-0.15) B 0.26 (3.07, 51) T 220 PODNAT2 �7 G145A E49K 0.002 (0.99-0.3) B 0.5 (3.07, 50) T 324 PODNAT2 �8i G191A R64Q 1.00 (0.00-1) PRD 0 (3.07, 50) A 4200 PRDNAT2 �9i A72C L24F 1 (0.00-1) PRD 0 (3.07, 50) A 4200 PRD
aPolyPhen score: probability that a substitution is damaging; sensibility and specificity in brackets.
bPolyPhen prediction: “benign” (B), “possibly damaging” (POD), “probably damaging” (PRD).
cSIFT score: probability that a substitution is tolerated; median sequence information and number of sequences used for the prediction in brackets.
dSIFT prediction: T: “tolerated” (T), A: “affect protein function” (A).
ePANTHER cSNP Scoring PSEP (position-specific evolutionary preservation): length of time (in millions of years) of preservation of a position.
fPANTHER cSNP Scoring prediction: “probably damaging” (PRD), “possibly damaging” (POD), “probably benign” (B).
gThe reference Pan NAT1 haplotype used is the basal haplotype in the network of NAT1 sequences (Supplementary Figure S2).
hThe reference Pan NAT2 haplotype used is the basal haplotype in the network of NAT2 sequences (Supplementary Figure S3). Since NAT2 �1 differs from NAT2 �4 ata single position located 61 bp downstream the coding exon relative to the stop codon (A934G, Table 3), the two haplotypes likely translate into a similar geneproduct, so that haplotypes deriving from NAT2 �1 could be predicted using NAT2 �4 as a reference. Instead, both haplotypes NAT2 �8 and NAT2 �9 derive fromNAT2 �7, which differs from the basal haplotype at SNP G145A (E49K, Table 3). Thus, for the non-synonymous mutations defining NAT2 �8 and NAT2 �9, predictionswere performed using NAT2 �7 as a reference.
iHaplotypes NAT2 �8 and NAT2 �9 both bear the G145A mutation defining haplotype NAT2 �7. Since the prediction tools do not allow the simultaneous specificationof two substitutions, we ran the prediction tools for G191A and A72C against NAT2 �7 as a reference, instead of NAT2 �4.
2214 | C. Vangenot et al.
Dow
nloaded from https://academ
ic.oup.com/g3journal/article/9/7/2199/6026812 by guest on 19 July 2022

nTa
ble
6Gen
etic
diversity
and
resu
ltsofse
lectivene
utralitytestsforthethreeNATgen
eparalogsin
thedifferent
spec
iesan
dsu
b-spec
iesofthegen
usPan,witheq
uiva
lent
estimates
inhu
man
populations
shownin
thelast
column.
Pansp
eciesan
dsub-sp
ecies
P.t.ve
rus(W
estern
chim
pan
zee)
Hom
osapiens
SanDiego
sample
aBPR
Csample
P.t.ellio
ti(N
igeria-
Cam
eroo
n)
P.t.
trog
lody
tes
(Cen
tral)
P.t.
schw
einfurthii
(Eastern)
P.pan
iscu
s(Bon
obo)
(hum
anpop
ulations
averag
e)b
PanNAT1
Total(2N
chromosom
es)
3646
2010
1228
119.7
Num
ber
ofusab
leposition
s90
390
389
889
889
889
890
3Num
ber
ofsegregatingsites(S)
3.57
(0.5)
33
45
23.75
Num
ber
ofha
plotyp
es(k)
4.57
(0.5)
44
45
33.5
Expec
tedhe
terozygosity
(h)
0.37
(0.03)
0.34
0.55
0.53
0.58
0.63
0.09
5Nuc
leotidediversity
(p)x
1023
0.58
(0.03)
0.63
1.02
0.89
1.08
0.96
0.18
7Ew
ens-Watterson
testc :
Fo0.64
(0.026
)0.67
0.48
0.52
0.47
0.40
0.90
2Fe
0.45
(0.041
)0.52
0.44
0.37
0.30
0.59
0.61
8P-value
2[0.84;0
.95]
0.82
(0.18)
0.70
(0.10)
.0.99
(.0.99
).
0.99
(.0.99
)0.09
(0.25)
9(8)/19
Tajim
a’sD
testd:
D20.91
(0.17)
20.35
0.24
21.67
21.53
1.43
21.47
5P-value
2[0.112
;0.28
2]0.39
8(0.642
)0.64
2(0.099
)0.03
1(0.061
)0.05
6(0.056
)0.91
7(0.752
)11
(1)/
18Fu
’sF S
teste:
F S21.64
(0.47)
20.59
20.20
21.35
21.98
1.19
22.84
9P-value
2[0.038
;0.19
7]0.32
1(0.642
)0.39
9(0.901
)0.04
3(0.061
)0.02
4(0.048
)0.74
2(0.742
)8(3)/
18PanNAT2
Total(2N
chromosom
es)
3646
2010
1228
137.8
Num
ber
ofusab
leposition
s1’11
51’11
51’09
11’09
11’09
11’11
21’11
5Num
ber
ofsegregatingsites(S)
1.87
(0.34)
32
23
29.78
Num
ber
ofha
plotyp
es(k)
2.87
(0.34)
43
32
310
.7Ex
pec
tedhe
terozygosity
(h)
0.15
(0.02)
0.17
0.28
0.38
0.17
0.20
0.76
1Nuc
leotidediversity
(p)x
1023
0.13
(0.02)
0.15
0.41
0.50
0.45
0.19
2.04
1Ew
ens-Watterson
testc :
Fo0.86
(0.02)
0.84
0.74
0.66
0.85
0.80
0.24
9Fe
0.63
(0.05)
0.52
0.56
0.49
0.70
0.59
0.29
1P-value
2[0.75;.
0.99
]f0.98
(0.96)
0.90
(0.69)
.0.99
(.0.99
).
0.99
(.0.99
)0.92
(0.92)
0/18
Tajim
a’sD
testd:
D21.26
(0.19)
21.58
20.44
20.69
21.63
21.24
0.63
9P-value
2[0.034
;0.15
8]0.02
0(0.040
)0.33
7(0.521
)0.23
7(0.246
)0.01
9(0.039
)0.07
6(0.076
)2(0)/
18Fu
’sF S
teste:
F S21.84
(0.55)
23.43
20.37
720.59
1.05
421.59
20.76
5P-value
2[0.004
;0.129
]g0.00
1(0.003
)0.26
0(0.521
)0.12
3(0.246
)0.59
5(0.595
)0.01
5(0.015
)2(0)/
18PanNATP
Total(2N
chromosom
es)
3650
2010
1228
128.8
Num
ber
ofusab
leposition
s1’00
01’00
093
693
793
697
51’00
2.61
Num
ber
ofsegregatingsites(S)
3.51
(0.62)
47
86
19.22
Num
ber
ofha
plotyp
es(k)
4.41
(0.61)
56
65
210
.6Ex
pec
tedhe
terozygosity
(h)
0.65
(0.01)
0.64
0.78
0.89
0.67
0.07
0.75
5 (con
tinue
d)
Volume 9 July 2019 | Diversity in Hominid NAT genes | 2215
Dow
nloaded from https://academ
ic.oup.com/g3journal/article/9/7/2199/6026812 by guest on 19 July 2022

nTa
ble
6,co
ntinue
d
Pansp
eciesan
dsub-sp
ecies
P.t.ve
rus(W
estern
chim
pan
zee)
Hom
osapiens
SanDiego
sample
aBPR
Csample
P.t.ellio
ti(N
igeria-
Cam
eroo
n)
P.t.
trog
lody
tes
(Cen
tral)
P.t.
schw
einfurthii
(Eastern)
P.pan
iscu
s(Bon
obo)
(hum
anpop
ulations
averag
e)b
Nuc
leotidediversity
(p)x
1023
0.81
(0.05)
0.77
2.60
2.75
1.74
0.07
1.80
4Ew
ens-Watterson
testc :
Fo0.37
(0.01)
0.38
0.26
0.20
0.39
0.93
0.25
5Fe
0.46
(0.06)
0.44
0.29
0.22
0.30
0.75
0.26
9P-value
2[0.07;0
.51]
0.40
(0.93)
0.43
(0.86)
0.48
(0.95)
0.95
(0.83)
.0.99
(.0.99
)1(0)/
18Ta
jima’sD
testd:
D20.06
(0.36)
20.30
1.04
20.11
20.47
21.15
0.01
8P-value
2[0.383
;0.84
9]0.42
4(0.935
)0.86
5(0.594
)0.48
3(0.947
)0.33
8(0.637
)0.13
8(0.138
)0/18
Fu’sF S
teste:
F S20.37
(0.55)
20.81
0.48
21.02
20.55
21.15
21.77
1P-value
2[0.245
;0.70
6]0.31
2(0.935
)0.62
3(0.863
)0.22
2(0.667
)0.31
8(0.637
)0.00
5(0.010
)3(1)/
18aAve
rageov
erthe12
2samples,
stan
darddev
iatio
nin
brackets.
bAve
ragevalues
for18
to20
human
pop
ulations
from
four
continen
ts;sing
lepop
ulationvalues
arereportedin
Supplemen
tary
TablesS7
andS1
2.cEw
ens-Watterson
test
fordep
arture
from
selectivene
utralityan
ddem
ographiceq
uilib
rium;Fo
:ob
served
homozyg
osity
,Fe
:ex
pec
tedho
mozyg
osity
;theP-valueis
given
astheproportio
nof
rand
omFe
values
gen
erated
under
thene
utrale
quilib
rium
mod
elthat
aresm
allertha
n,or
equa
ltotheob
served
Fovalue.
Significant
dev
iatio
ns(P-value
,0.02
5or
.0.97
5)areshow
nin
bold,a
ndafterc
orrectionform
ultip
letestingin
brackets;forhu
man
s,wereportthenu
mber
ofpop
ulationsamplesassociated
with
asignificant
dev
iatio
n(beforeslash,
andsignificant
afterco
rrec
tionformultip
letestingin
boldan
dbrackets)on
thetotaln
umber
ofpop
ulationsamplestested
(after
slash,
seeSu
pplemen
tary
Table
S12).
dTa
jima’sD
test
fordep
arture
from
selectivene
utralityan
ddem
ographiceq
uilib
rium;the
P-valueisgiven
astheproportio
nof
rand
omD
values
gen
erated
under
thene
utrale
quilib
rium
mod
elthat
aresm
allerthan
,or
equa
ltotheob
served
Dvalue.
Significant
dev
iatio
ns(P-value
,0.02
5or
.0.97
5)areshow
nin
bold,an
dafterco
rrec
tionformultip
letestingin
brackets;
forhu
man
s,wereportthenu
mber
ofpop
ulationsamples
associated
with
asignificant
dev
iatio
n(beforeslash,
andsignificant
afterco
rrec
tionformultip
letestingin
boldan
dbrackets)on
thetotaln
umber
ofpop
ulationsamplestested
(after
slash,
seeSu
pplemen
tary
Table
S12).
eFu
’sF S
testford
eparture
from
selectivene
utralityan
ddem
ographiceq
uilib
rium;the
P-valueisgiven
astheproportio
nof
rand
omF S
values
gen
erated
under
thene
utrale
quilib
rium
mod
elthat
aresm
allertha
n,or
equa
lto
theob
served
F Svalue.
Significant
dev
iatio
ns(P-value
,0.02
)are
show
nin
bold,an
dafterco
rrec
tionformultip
letestingin
brackets;
forhu
man
s,wereportthenu
mber
ofpop
ulationsamplesassociated
with
asignificant
dev
iatio
n(beforeslash,
andsignificant
afterco
rrec
tionformultip
letestingin
boldan
dbrackets)on
thetotaln
umber
ofpop
ulationsamplestested
(after
slash,
seeSu
pplemen
tary
Table
S12).
fTw
enty
testsou
tof
122(16%
)ind
icated
significant
homozyg
osity
exce
ss(P-value
.0.97
5),thus
exce
edingby13
teststheex
pec
tedproportio
nof
5%(6.1
outof
122)
falsepositive
s.gOne
hund
redan
dsixtestsou
tof
122(87%
)ind
icated
significant
dev
iatio
nfrom
neutrale
xpec
tatio
n(P-value
,0.02
),thus
exce
edingby10
3teststheex
pec
tedproportio
nof
2%(2.44ou
tof
122)
falsepositive
s.
2216 | C. Vangenot et al.
Dow
nloaded from https://academ
ic.oup.com/g3journal/article/9/7/2199/6026812 by guest on 19 July 2022

In line with these observations, our analyses failed to reveal any sig-nificant level of genetic differentiation between chimpanzee sub-speciesat NAT1, while we do find significant differentiation at NAT2, exceptbetween Eastern and Central chimpanzees (Supplementary Table S6).
At the NATP pseudogene, Western (P. t. verus) chimpanzees are sig-nificantly differentiated from all the other P. troglodytes sub-species(and even between the two verus samples), while no genetic differen-tiation was found among any of the latter. Given the high levels of
Figure 2 Expected heterozygosity (h) and nucleotide diversity (p x 1023) at the three NAT genes in Pan species and sub-species (left panes) andin human populations (right panes). The variation of values among the 122 San Diego P. t. verus sub-samples (left panes) and among humanpopulations samples (right panes) are shown by boxplots. The dotted lines were added to the graphs to highlight inter-locus variation. For Pan,P-values of Wilcoxon rank-sum tests after adjustment for multiple testing (and using only the average value for the San Diego sample) were of0.039 for NAT1 vs. NAT2, 0.065 for NAT1 vs. NATP, and 0.065 for NAT2 vs. NATP, respectively, for differences in expected heterozygosity (h),and of 0.0065 for NAT1 vs. NAT2, 0.5887 for NAT1 vs. NATP, and 0.0974 for NAT2 vs. NATP, respectively, for differences in nucleotidediversity (p). When restricting the tests to the chimpanzee (P. troglodytes) data only, P-values were of 0.012 for NAT1 vs. NAT2, 0.222 for NAT1vs. NATP, and 0.012 for NAT2 vs. NATP, respectively, for expected heterozygosity, and of 0.036 for NAT1 vs. NAT2, 0.018 for NAT1 vs. NATP, and0.018 for NAT2 vs. NATP, respectively for nucleotide diversity. For human populations, adjusted Wilcoxon rank-sum tests P-values for differences inboth expected heterozygosity and nucleotide diversity were all, 0.0001 in the comparisons ofNAT1 vs. NAT2, andNAT1 vs. NATP, and of 0.58 and0.048 for expected heterozygosity and nucleotide diversity, respectively, in the NAT2 vs. NATP comparison.
Volume 9 July 2019 | Diversity in Hominid NAT genes | 2217
Dow
nloaded from https://academ
ic.oup.com/g3journal/article/9/7/2199/6026812 by guest on 19 July 2022

NATP polymorphism in chimpanzees (Figure 1 and Tables 3 and 5)and the significant differentiation between the two verus samples,we believe that this lack of genetic differentiation could result froma lack of power due to the small sample sizes available for Central(P. t. troglodytes), Eastern (P. t. schweinfurthii) and Nigeria-Cameroon(P. t. ellioti) chimpanzees. In turn, significant differentiation levelswere estimated between bonobos and all other Pan at all three NATgenes.
In terms of gene and molecular diversity, the different Pan speciesand sub-species display a similar NAT1 - NAT2 pattern of variation,i.e., high diversity at NAT1 and lower at NAT2, in spite of differencesin diversity levels (Figure 2). In humans instead, the NAT1 - NAT2diversity pattern is reversed, with less diversity than Pan atNAT1 andmore at NAT2, and these differences between humans and apes aresignificant (Figure 2 and Supplementary Table S11). Conversely, di-versity was not found significantly different between humans and Panat NATP. A reversed pattern betweenHomo sapiens and Pan was alsohighlighted by the results of the tests of selective neutrality and de-mographic equilibrium. While at NAT1, only two rejections of thenull hypothesis (with one test only) were observed in chimpanzeesand bonobos (Table 6), deviations from expectations were found withthe three tests in several human populations (Supplementary TableS12). At NAT2 instead, rejections were observed at least with one testin all chimpanzees and bonobos, except in the P. t. ellioti sub-species,while very few rejections were observed in humans (none after correc-tion for multiple testing). Altogether, these results suggest that diversityat NAT1 in humans could have been influenced by selective pressures(either purifying or recent directional selection), but not in chimpan-zees or bonobos, whereas similar selective pressures could have influ-enced the diversity of the NAT2 gene in bonobos and at least somechimpanzee sub-species, but not in humans.
However, it is important to consider the possible confounding effectsof population demographic history when interpreting any significantdeparture of nucleotide polymorphism from equilibrium-neutral pre-dictions. Demographic and selective events tend to leave very similartraces over sequences. For example, a selective sweep, i.e., an episode ofrecent directional selection, and a population bottleneck followed byexpansion are both expected to generate a frequency spectrum skewedtoward rare alleles. Indeed, genomic comparisons across large numbersof individual hominids has revealed that modern humans are genet-ically less variable than most other great apes, notably gorillas andorangutans, and most chimpanzee subspecies, although the differenceis less pronounced when compared to Western chimpanzees, Easternlowland gorillas and bonobos (Gagneux et al. 1999; Kaessmann et al.2001; Prado-Martinez et al. 2013; Xue et al. 2015). This pattern isascribed to the evolutionary history of our species, which is markedby a series of recent demographic expansions, such as the one follow-ing the founder event driving modern humans out of Africa (Li et al.2008; Barbujani and Colonna 2010; Veeramah and Hammer 2014).However, human and non-human hominids do not seem to differ inthe genome-wide accumulation of loss-of-function mutations andpseudogenes, suggesting that neither human demographic expan-sions nor the potential buffering role of human culture apparentlyled to human genomes tolerating a higher mutational load (Prado-Martinez et al. 2013). Additionally, according to (Prado-Martinezet al. 2013), all chimpanzees and bonobos experienced a populationbottleneckmore than 2million years ago, whileWestern chimpanzeesexperienced a second, more recent bottleneck some 500,000 years ago,followed by re-expansion. Moreover, studies on the major histo-compatibility complex (MHC) region of chimpanzees suggest thata strong selective sweep within this region, owing to the action of a
particular viral pathogen, was likely coupled to the first bottleneck(de Groot et al. 2002; de Groot et al. 2008), and a comparative studyof the MHC region in humans and Western chimpanzees suggeststhat this first bottleneck accounts for observed differences of MHCdiversity between the two species. The lower diversity observed inWestern chimpanzees compared to the other P. troglodytes sub-species(Figure 2 and Table 6) could indeed reflect footprints of the second,more recent bottleneck event, thus implying that the P. t. verus sub-species (Western chimpanzees) experienced greater genetic drift thanthe others. Indeed, it is in Western chimpanzees, among all sub-speciesof chimpanzees, that the lowest or one of the lowest estimations ofdiversity was found, including at theNATP pseudogene, in agreementwith a well-known result at the genome level, i.e., with Central chim-panzees being generally the more diverse and Western chimpanzeesthe least (Prado-Martinez et al. 2013; Bataillon et al. 2015; de Manuelet al. 2016). Despite these complex demographic histories, the neu-trality tests used are known to have no statistical power to detect suchancient demographic events (Tajima 1989b; Tajima 1989a; Simonsenet al. 1995; Ramírez-Soriano et al. 2008). Consequently, the chimpanzeeand bonobo populations investigated can be reasonably assumed tobe at demographic equilibrium and null values of Tajima’sD and Fu’sFs are expected at putatively neutral genomic regions (e.g., non-genicand intronic regions, or pseudogenes). Previous studies investigatingsuch regions have consistently produced null D values for Westernchimpanzees (Deinard and Kidd 1999; Kaessmann et al. 1999; Fischeret al. 2004; Fischer et al. 2006; Fischer et al. 2011; Sugawara et al.2011). Therefore, the significant deviations from the standard, neutralequilibriummodel at NAT2 in chimpanzees and bonobos can be inter-preted, in our view, as evidence for some kind of selection, most likelypurifying selection, which is how such patterns are interpreted forNAT1 in humans (Sabbagh et al. 2018).
On the other hand, the few rejections of the null hypothesis atNAT1 in Pan rather support a lack of selective pressure at this gene,but this conclusion fails to explain the lack of NAT1 genetic differ-entiation among chimpanzees, with the same predominant haplo-type in all P. troglodytes (i.e., NAT1�1), as opposed to the patternscharacterizing NAT2 and NATP. In view of the observed similarlevel of diversity between humans and chimpanzees at the NATPpseudogene, the differences found between the two functional NATparalogs, both among Pan, and between Pan and humans ratherargue for some contribution of selective pressures acting on boththese genes. Neither the diversity indices that we estimated nor theselective neutrality tests that we performed account for differencesin the functional impact of mutations. Considering such functionaleffects could help to identify the kind of selective pressures at work,and their likely magnitude.
At the NAT1 gene, haplotype NAT1�1 is the most frequent in allchimpanzee sub-species, whereas it is NAT1�6 in bonobos (Figure 1).These two haplotypes are nevertheless likely to confer a similar enzy-matic profile since they only differ by a synonymous SNP (T369C,Table 3). Therefore, it is expected that a majority of chimpanzees andbonobos have a similar NAT1 acetylation capacity. Moreover, at eachof the NAT1 positions that are polymorphic in Pan, all other greatapes, including humans are apparently fixed on the nucleotides ofthe major Pan haplotype NAT1�1. Thus, the maintenance of NAT1�1for approximately half a million years (TMRCA of Pan troglodytes)and of a likely similar acetylation capacity (NAT1�6 differs fromNAT1�1 by a single synonymous substitution) for about 2 millionyears (TMRCA of Pan) points to the effect of purifying selection actingon this gene to preserve such acetylation capacity. At NAT2, asalready stated, frequency distributions in Pan were found to differ
2218 | C. Vangenot et al.
Dow
nloaded from https://academ
ic.oup.com/g3journal/article/9/7/2199/6026812 by guest on 19 July 2022
markedly from those atNAT1, not only because they are more skewedtoward a high frequency of the major haplotype, but also becausethis prevalent haplotype is different between sub-species. Pan NAT2is also characterized by a low level of diversity compared to NAT1and NATP, and to human NAT2 as well (Figure 2). Theoretically,such pattern could be due either to rapid genetic drift in populationsof chimpanzees and bonobos, or to directional selection, possibly pu-rifying selection, acting to preserve specific haplotypes, depending onthe sub-species. Both hypotheses are supported by the tests of selectiveneutrality and demographic equilibrium, which revealed several rejec-tions in favor of directional selection or a population expansion after abottleneck. Moreover, if only polymorphic positions within the Pancoding exon are considered (Table 3 and Supplementary Figure S2),only three mainNAT2 haplotypes are observed, i.e.,NAT2�1/NAT2�4(most frequent in P. t. verus, P. t. troglodytes and P. t. schweinfurthii),NAT2�6 (P. t. ellioti), and NAT2�7 (P. paniscus). Thus, although hap-lotype variation between chimpanzee sub-species is apparently higherat NAT2 than at NAT1, it is likely that the evolution of NAT2 in Panis nevertheless functionally constrained. This idea finds support in thecomparison of NAT2 with the highly variable NATP pseudogene. Inspite of this, similarly to observations in humans (Patin et al. 2006a;Mortensen et al. 2011), significant linkage disequilibrium among thethree NAT gene family members is mainly detected between NAT2and NATP (Supplementary Table S14, tested only in Western chim-panzees). It is thus reasonable to assume that the pseudogene hasbeen more free to accumulate recent mutations, while selection actsto remove harmful mutations in NAT2. In this context, the extremelylow NATP diversity in bonobos is intriguing, the more so as theirdiversity pattern at NAT1 and NAT2 is similar to that of chimpanzees(Figure 2). We verified that this depleted polymorphism in the pseu-dogene could not be ascribed to a lower quality of the SNP callingprocess or lower coverage for bonobos in the GAGP data. Note thatin the GAGP whole genome study, bonobos and also Eastern gorillas(G. beringei) showed the lowest genetic diversity among all great apes,and displayed distributions of homozygosity tracts similar to thoseof human populations having experienced strong genetic bottlenecks(Prado-Martinez et al. 2013; Xue et al. 2015).
Prediction of the existence of different profiles ofacetylation in chimpanzees and bonobosIn humans, polymorphisms identified in NAT1 and NAT2 led to thedefinition of haplotypes with a known acetylation profile when anassociation between a mutation and the functionality of the proteinwas observed in vivo or in vitro (Walraven et al. 2008; Zhu and Hein2008; Zhu et al. 2011). In other primates, for the time being, func-tional knowledge only exists for the rhesus macaque NAT2 gene.Indeed, a recent study (Tsirka et al. 2014) demonstrated that thefunction of the NAT2 enzyme in the human and rhesus macaquespecies diverges in substrate selectivity, shifting substrate affinity ofthe enzyme between bulkier NAT2 substrates and smaller NAT1substrates, and that this shift is due to a single substitution, that doesnot otherwise alter the stability and the overall activity of the protein.Such knowledge does not exist yet for chimpanzees, and we thus usedthree in silico tools to predict the potential consequence of a substitu-tion on the function of Pan NAT proteins (Table 5).
We therefore suggest that, compared to the Pan basal haplotypeNAT1�1, nine derived haplotypes might translate into an equivalentphenotype, whereas two might have a moderate damaging effect.Indeed, none of the SNPs detected in NAT1 have been predicted asdamaging by the three tools concomitantly, but the comparison ofour results for Pan haplotypes with the outcomes of predictions for
human haplotypes with known effects raises the possibility thattwo Pan NAT1 haplotypes, NAT1�4 and NAT1�7, could have amoderate “slowing” effect on enzymatic activity (similar to that ofhuman haplotype NAT1�14B, when considering the similarity of theresults outputted by the prediction tools).
At the NAT2 gene, non-synonymous mutations defining three Panderived haplotypes, NAT2�2, NAT2�8, and NAT2�9, were predicted asdamaging, with good confidence by the three tools. A slower enzymaticactivity associatedwith these haplotypes could thus be expected. Two ofthese three haplotypes are rather uncommon, each being observed at afrequency below 5% in one species only:NAT2�2 inWestern chimpan-zees (P. t. verus) and NAT2�8 in bonobos (P. paniscus) (Table 4, Figure1, Supplementary Table S4, and Supplementary Figure S3). HaplotypeNAT2�9 was also detected in bonobos only, but it has an estimatedfrequency over 7%. Hence the cumulated frequencies of NAT2 hap-lotypes potentially conferring slower NAT2 enzymatic activity inP. paniscus could reach 10%. This translates into an expected fre-quency of carriers of two potentially slow haplotypes of 1%, vs. 18%of heterozygous slow/rapid carriers (observed frequencies were of0% and 21.4%, respectively). By comparison, the lowest frequen-cies of NAT2 slow acetylators in human populations (either directlydocumented by phenotypic studies, or indirectly estimated by theproportion of carriers of two slow haplotypes) vary by around 10%(Sabbagh et al. 2011). Such low frequencies are encountered bothin hunter-gatherer populations around the world (with the lowestvalues among some hunter-gatherer populations of the Americancontinent (Fuselli et al. 2007), and in some North East Asian popu-lations (in China, Korea and Japan). For the Pan species, we tenta-tively speculate that two additional haplotypes (NAT2�6 andNAT2�7)could be associated with a substrate-dependent reduction in acetyla-tion activity, given the similarity of results returned by the predictiontools with those of human haplotypes for which such substrate-dependent activity has been proposed (i.e., humanNAT2�7A,NAT2�7B,and NAT2�10, Supplementary File S1 and Supplementary Table S15).Although we acknowledge that such assertion is based on very lim-ited evidence, it nevertheless opens up the possibility that, comparedto chimpanzees, NAT2 activity in bonobos could be globally reducedgiven that NAT2�7 is the most prevalent haplotype in this species(Figure 1 and Supplementary Figure S3).
In summary, in the present state of knowledge, our results sug-gest the existence among chimpanzees and bonobos, as in humans, ofdiversified acetylation profiles for bothNAT1 andNAT2 genes. Whilefor NAT1 only two infrequent Pan haplotypes might confer a slowerenzymatic activity than the reference, for NAT2, two of the threehaplotypes observed in bonobos are predicted to do so, as well asone in chimpanzees. In terms of frequencies, however, the majorityof NAT2 haplotypes observed in chimpanzees are likely associatedwith a “normal” acetylation capacity that would be the Pan equivalentcorresponding to human rapid acetylation (Supplementary File S1and Supplementary Table S16). It is thus likely that, in chimpanzees,mutations modifying the functionality of the NAT1 and NAT2 en-zymes in a fashion that slows acetylation could be subject to purifyingselection. Purifying selection acting on the chimpanzee NAT2 gene isconsistent with its low diversity within sub-species as compared toNATP, and its high molecular differentiation among Pan sub-species.However, the greater molecular diversity found at NAT1 withinsub-species is more compatible with a mechanism of (weak) positivedirectional selection favoring the prevalent P. troglodytes NAT1�1haplotype in all sub-species. Although constrained by the samplesizes available, our results raise the possibility that in bonobos, how-ever, functional constraints at NAT2 against slower acetylation could
Volume 9 July 2019 | Diversity in Hominid NAT genes | 2219
Dow
nloaded from https://academ
ic.oup.com/g3journal/article/9/7/2199/6026812 by guest on 19 July 2022

be less stringent than in chimpanzees, allowing a predicted frequencyof NAT2 slow acetylation haplotypes of 10% in this species.
These evolutionary hypotheses need to be tested with functionalstudies of the in vitro and/or in vivo activities of NAT1 and NAT2enzymes in Pan species. Moreover, such hypotheses will also need toaddress further complexities, such as the NAT2 metabolic adapta-tions (i.e., shifts in NAT2 enzymatic activity) recently reported in astudy comparing a local human population with a population offirst-generation emigrants (Aklillu et al. 2018). Finally, we acknowl-edge that our analyses are based on only a few segregating sites, whichis expected given the short length of the NATs open-reading frames.Hence larger sample sizes than the ones available in this study arerequired to make robust assertions on the prevalence of distinct ace-tylator profiles, and to confirm the patterns of molecular diversity ofNAT genes found in chimpanzees and bonobos.
Divergent selective pressures acting on the evolution ofNAT genes in humans and chimpanzeesThe results of the three tests of selective neutrality used on the humandataset analyzed here support the current view that human NAT1 di-versity is constrained by purifying selection (Table 6 and Supplemen-tary Table S12). On the other hand, the finding of higher frequenciesof human NAT2 slow acetylator phenotypes in food-producing pop-ulations compared to hunter-gatherers supports the idea that the genewas impacted by selective pressures induced by the modes of subsis-tence adopted by past populations, and in particular their diets (Patinet al. 2006a; Luca et al. 2008; Magalon et al. 2008; Sabbagh et al. 2008;Mortensen et al. 2011; Podgorná et al. 2015). However, this selectivehypothesis fails to be consistently supported, with tests of selectiveneutrality on human NAT2 variation producing very few significantresults (including those from this study, although see (Patillon et al.2014)). Several explanations for the observed weak and inconstantsignals of selection have been suggested, such as the action of adap-tive mechanisms difficult to detect through the standard frequencyspectrum tests that we and others have used (i.e., selection on standingvariation, selection favoring heterozygotes carrying a slow and a rapidhaplotype, ancient balancing selection masked by directional selectionon specific haplotypes, or recent relaxation of functional constraints).Moreover, consistent evidence for genetic and genomic signaturesof demographic expansions in humans in the past (Li et al. 2008;Barbujani and Colonna 2010; Veeramah and Hammer 2014) couldhave mitigated molecular signals of selective mechanisms such asbalancing selection and/or selection on standing variation. Interest-ingly, in human populations from the African Sahel and surround-ing regions, higher proportions of NAT2 rapid acetylators were foundnot only among hunter-gatherers, as opposed to food-producers,but also among populations living in humid tropical environments,as opposed to those living in more arid zones, independently of theirmode of subsistence. It thus raises the possibility that selective pres-sures on NAT2 could be exerted not only by shifts to new dietaryhabits, but by the natural chemical environment as well (Podgornáet al. 2015).
Our results suggest that the diversity of NAT genes in chimpanzeescould result from evolutionary forces that differ from those operatingin humans. Today, chimpanzees live mainly in humid tropical envi-ronments (according to the classification of the United Nations Envi-ronment Program) even if the limits of their habitat are also located inmore arid zones (such as in Senegal, Guinea,Mali, Ivory Coast, Uganda,Tanzania and the Republic of Congo). Besides the differences in theoverall efficiency of purifying and positive selection acting on thegenomes of great ape species, which was shown to be correlated with
their long-term population sizes (Cagan et al. 2016), differences inintensity of selective pressures exerted by the environment could alsobe invoked. Chimpanzees and bonobos are raw food “hunter-gatherers”that feed mainly on plant matter, but also eat uncooked insects, birds,eggs and small- to middle-sized mammals. Moreover, it is generallyassumed that chimpanzee and bonobo diets have not substantiallychanged over time, in contrast to humans, whose diets have done so,probably several times, over the last 200 thousand years.
In humans, besides their influence on the effectiveness of prescribedmedications, polymorphisms at NAT2, and also at NAT1, have beenassociated with differential susceptibility to various cancers linked toarylamine exposure (Hein 2002; Agundez 2008b; Ladero 2008; Selinskiet al. 2015; Hein 2018; Laurieri et al. 2018). Such exposures occur withcigarette smoke, gases and pollutants produced by various chemicalindustries, as well as diets including meat or fish cooked (or fried) athigh temperatures (Weisburger 2002; Chung 2015; Fahrer 2016). Patinet al. (2006a) stressed the idea that changes in exposure to xenobioticswith carcinogenic risk or other toxicities associated with the new dietsintroduced by the transition to food-producing life-styles, as opposedto hunter-gatherer subsistence modes, might have led to changes in theselective pressures acting on drug-metabolizing enzymes such as theNAT enzymes. Here we speculate that the entire phenomenon of foodprocessing, which is intimately linked to the handling of fire, and thusrepresents a major distinctive human feature common to all modes ofsubsistence, may have exposed our species to new, food-borne carcin-ogens and other toxic molecules seldom encountered in the diets ofother primate species. Human biological adaptation stemming fromthe controlled use of fire is an idea that runs back at least to CharlesDarwin (Wrangham and Carmody 2010). It is supported, notably, bystudies on the influences of a cooked diet on gene expression in the liver(Carmody et al. 2016), and the hypothesis of a specific genetic adapta-tion to fire use is advocated to explain the fixation, in modern humans,of a single nucleotide substitution in the aryl hydrocarbon receptor(AHR) gene, which results in a lowered sensitivity of the receptor totoxic exogenous AHR-ligands, such as polycyclic aromatic hydrocar-bons (PAHs) that are contained in fire smoke and cooked and smokedfoods (Hubbard et al. 2016).
Turning back to chimpanzees, we could thus speculate that livingin a more limited environment and having experienced little changesin diet, selective pressures such as those affecting humans have beenless intense or even non-existent. Instead, the hypothesis of purifyingselection acting tomaintain an acetylation activity sufficiently adaptedto the chimpanzees’ environment and diet is consistent with their lowdiversity atNAT2, the significant rejections of neutrality for this gene,at least for Western chimpanzees, and the low frequencies of thosemutations that were predicted to be damaging. While NAT2 muta-tions leading to a slower acetylation phenotype are hypothesized tohave recently become advantageous in many human populations asthey settled in new environments and/or adopted new subsistencestrategies, including the consumption of cooked and roasted foods,such mutations are likely to have been deleterious in chimpanzees,and thus negatively selected.
Although it is likely that chimpanzees and bonobos did notexperience similar shifts in diets as humans did, the hypothesis ofa less stable chemical environment for humans than for other greatapes is challenged by major climatic changes, such as the drier condi-tions developing in the Last Glacial Maximum which have been pro-posed to be associated with the speciation process leading to EasternandWestern gorillas, and the demographic decline of the latter species(Roy et al. 2014; Xue et al. 2015). Moreover, our analyses did not pro-duce systematically matching results between Western chimpanzees
2220 | C. Vangenot et al.
Dow
nloaded from https://academ
ic.oup.com/g3journal/article/9/7/2199/6026812 by guest on 19 July 2022
and the other sub-species, in particular with regards to the selectiveneutrality tests. A priori, these discrepancies could result from thesmaller sample sizes of Central, Eastern and Nigeria-Cameroonchimpanzees, making miss-estimation of haplotype frequencies apossible issue. Note that the sample sizes of Western chimpanzees(18 and 23 individuals for San Diego and BPRC, respectively, Table 4)are smaller than the average those of the human populations samplesanalyzed here (between 60 and 70 individuals, Supplementary Table S7),although several human samples from African populations are rep-resented by less than 20 individuals. Moreover, one cannot excludethe possibility of sequencing errors, particularly for those haplotypesdefined by singleton SNPs and observed only once (e.g., Easternchimpanzee Andromeda, whose data were retrieved from the GAGP,is the only carrier of NAT2�10). Finally, sub-species determination,very often exclusively based on mitochondrial DNA, could be erro-neous, especially so in the presence of hybrids (Becquet et al. 2007);see also Supplementary File S1).
Sample sizes at least comparable to those ofWestern chimpanzees inthe present study are thus needed to confirm the apparent differencesbetween sub-species that we detected. The recent publication of newgenomes for these sub-species (de Manuel et al. 2016) is likely to allowan evaluation of our findings in the near future. These findings also callfor studies on chimpanzees living in different environments and underdifferent chemical exposure. For instance, numerous Eastern chimpan-zees of the Sebitoli community present congenital anomalies as wellas palate clefts (Krief et al. 2014; Krief et al. 2015; Krief et al. 2017). Inhumans, deficiency in folates, in which NAT1 is implicated, is oftenassociated with many congenital malformations including palate clefts(Wahl et al. 2015), and some mutations in both NAT1 and NAT2 havebeen associated with this condition (Song et al. 2013; Santos et al. 2015).
A hypothetical shift in function between NAT1 andNAT2 during hominid evolutionThe differences in diversity levels between NAT1 and NAT2 amonggreat ape species suggest that, as in humans, a differentiated functionfor the two enzymes exists also in other hominid species. In humans,the NAT1 and NAT2 isoenzymes have a different expression profileand acetylate different substrates (Jensen et al. 2006; Wakefield et al.2007; Butcher and Minchin 2012; Laurieri et al. 2014; Sim et al. 2014).Human NAT1 is expressed in most tissues from very early duringdevelopment and is assumed to play a role in the metabolism offolates, while NAT2 is mostly expressed in the liver and intestinesand its substrates are not supposed to influence its regulation, con-trarily to NAT1. As reviewed by (Butcher and Minchin 2012), thetranscriptional and post-transcriptional regulation of the NAT1 en-zyme could also have a higher effect on NAT1 activity than the ge-notype, contrarily to what is known for NAT2. Notably, it is suggestedthat epigenetic regulation depending on the concentration of somesubstrates could affect the activity of NAT1 in cells (Wakefield et al.2010). If differences in diversity levels between the two genes arelinked to differences in factors contributing to the inter-individualvariation in enzymatic activity between NAT1 (high variation in ex-pression regulation) and NAT2 (high variation in protein sequence)is an open question. It would be tempting to assume that the functionof the two enzymes is different in chimpanzees, compared to humans,in view of the reversed NAT1-NAT2 diversity pattern of chimpanzeesand other great ape species (bonobos and Sumatran orangutans).For instance, one could consider the possibility of a shift in sub-strate affinity between the two isoenzymes during hominid evo-lution, as suggested by the expression study of the rhesus macaqueNAT2 gene (Tsirka et al. 2014), leading to a divergence in function
between Pan and Homo. At present, however, neither temporal (i.e.,early or later in development), nor spatial (e.g., ubiquitous vs. tissue-specific) differences in expression of the two NAT isoenzymesare known in other great ape species besides humans, so we canonly speculate on possible environmental factors that could exert aselective pressure on NAT genes in our closer relatives.
In conclusion, we have found high levels of diversity of NAT genesin chimpanzees and bonobos, which is similar to humans. Howeverthe diversity is reversely distributed in chimpanzees and bonobos, suchthat there is higher diversity in Pan NAT1 and lower diversity in PanNAT2, whereas the opposite is observed in humans. A reversed patternbetween Pan and humans was also returned by the tests of selec-tive neutrality and demographic equilibrium. Rejections of the modelin chimpanzees were found mostly associated with NAT2, and likelydue to directional selection, whereas in human populations this ap-pears to be the case for NAT1, thus suggesting distinct selective pres-sures acting on Pan NAT1 and NAT2 compared to humans. Ouranalyses of the predicted functional impact of mutations detectedin non-human primates suggest that a non-negligible proportionof chimpanzees could have a moderately reduced NAT1 acetylationcapacity, in sharp contrast with most human populations. In turn,reduced NAT2 acetylation capacity is known to be frequent in manyhuman populations, and our analyses predicted that this could alsobe the case for a significant proportion of bonobos, but less so ofchimpanzees. Altogether, our results raise the possibility that humansand chimpanzees evolved some divergence in functionality at the NATgenes in the course of hominid history, such as divergence in substrateaffinity/specificity/selectivity for each of the two enzymes. Such hypo-thetical shift in function could be due to fixed substitutions betweenhumans and Pan NAT genes, as has been shown for macaques com-pared to humans. On the basis of the known role of NAT2 in themetabolism of smoke-contained aromatic amines, we postulate that afunctional divergence of NATs between Pan and humans could havebeen driven by the development of fire handling and food processing inhumans, a hypothesis that could be addressed in the future by func-tional studies of NAT1 and NAT2 enzymatic activities in great apes.
ACKNOWLEDGMENTSThe authors wish to thank Lydie Brunet, Eli�ska Podgorná, IlhamBahechar and Juan Montoya, for technical assistance, Ronald Bontropand Gaby Doxiadis for help with the BPRC samples, and GabyDoxiadis, José Manuel Nunes, and André Langaney for helpfuldiscussions. We are also very grateful to the anonymous reviewerfor providing constructive comments and suggestions on a formerversion of the manuscript. Supported by Swiss National ScienceFoundation grant no. 320030 to ESP.
LITERATURE CITEDAdzhubei, I. A., S. Schmidt, L. Peshkin, V. E. Ramensky, A. Gerasimova
et al., 2010 A method and server for predicting damagingmissense mutations. Nat. Methods 7: 248–249. https://doi.org/10.1038/nmeth0410-248
Agundez, J. A., 2008a N-acetyltransferases: lessons learned from eightyyears of research. Curr. Drug Metab. 9: 463–464. https://doi.org/10.2174/138920008784892146
Agundez, J. A., 2008b Polymorphisms of human N-acetyltransferases andcancer risk. Curr. Drug Metab. 9: 520–531. https://doi.org/10.2174/138920008784892083
Aklillu, E., J. A. Carrillo, E. Makonnen, L. Bertilsson, and N. Djordjevic,2018 N-Acetyltransferase-2 (NAT2) phenotype is influenced by geno-type-environment interaction in Ethiopians. Eur. J. Clin. Pharmacol. 74:903–911. https://doi.org/10.1007/s00228-018-2448-y
Volume 9 July 2019 | Diversity in Hominid NAT genes | 2221
Dow
nloaded from https://academ
ic.oup.com/g3journal/article/9/7/2199/6026812 by guest on 19 July 2022

Bandelt, H. J., P. Forster, and A. Rohl, 1999 Median-joining networks forinferring intraspecific phylogenies. Mol. Biol. Evol. 16: 37–48. https://doi.org/10.1093/oxfordjournals.molbev.a026036
Barbujani, G., and V. Colonna, 2010 Human genome diversity: frequentlyasked questions. Trends Genet. 26: 285–295. https://doi.org/10.1016/j.tig.2010.04.002
Bataillon, T., J. Duan, C. Hvilsom, X. Jin, Y. Li et al., 2015 Inference ofpurifying and positive selection in three subspecies of chimpanzees (Pantroglodytes) from exome sequencing. Genome Biol. Evol. 7: 1122–1132.https://doi.org/10.1093/gbe/evv058
Becquet, C., N. Patterson, A. C. Stone, M. Przeworski, and D. Reich,2007 Genetic structure of chimpanzee populations. PLoS Genet. 3: e66.https://doi.org/10.1371/journal.pgen.0030066
Bergfeld, A. K., R. Lawrence, S. L. Diaz, O. M. T. Pearce, D. Ghaderi et al.,2017 N-glycolyl groups of nonhuman chondroitin sulfates survive inancient fossils. Proc. Natl. Acad. Sci. USA 114: E8155–E8164. https://doi.org/10.1073/pnas.1706306114
Bisso-Machado, R., V. Ramallo, V. R. Paixao-Cortes, V. Acuna-Alonzo,D. A. Demarchi et al., 2016 NAT2 gene diversity and its evolutionarytrajectory in the Americas. Pharmacogenomics J. 16: 559–565. https://doi.org/10.1038/tpj.2015.72
Bjork, A., W. Liu, J. O. Wertheim, B. H. Hahn, and M. Worobey,2011 Evolutionary history of chimpanzees inferred from complete mi-tochondrial genomes. Mol. Biol. Evol. 28: 615–623. https://doi.org/10.1093/molbev/msq227
Blömeke, B., and J. Lichter, 2018 Expression and Activity of ArylamineN-Acetyltransferases in Organs: Implications on Aromatic AmineToxicity, pp. 133–164 in Arylamine N-Acetyltransferases in Health andDisease, edited by Laurieri, N., and E. Sim. World Scientific Publishing.https://doi.org/10.1142/9789813232013_0006
Butcher, N. J., and R. F. Minchin, 2012 Arylamine N-acetyltransferase 1: anovel drug target in cancer development. Pharmacol. Rev. 64: 147–165.https://doi.org/10.1124/pr.110.004275
Cagan, A., C. Theunert, H. Laayouni, G. Santpere, M. Pybus et al.,2016 Natural Selection in the Great Apes. Mol. Biol. Evol. 33:3268–3283. https://doi.org/10.1093/molbev/msw215
Carmody, R. N., M. Dannemann, A. W. Briggs, B. Nickel, E. E. Groopmanet al., 2016 Genetic Evidence of Human Adaptation to a CookedDiet. Genome Biol. Evol. 8: 1091–1103. https://doi.org/10.1093/gbe/evw059
Chung, K. T., 2015 Occurrence, uses, and carcinogenicity of arylamines.Front. Biosci. (Elite Ed.) 7: 322–345.
de Groot, N. G., C. M. C. Heijmans, N. De Groot, N. Otting, A. J. M. DeVos-Rouweler et al., 2008 Pinpointing a selective sweep to thechimpanzee MHC class I region by comparative genomics. Mol. Ecol.17: 2074–2088. https://doi.org/10.1111/j.1365-294X.2008.03716.x
de Groot, N. G., N. Otting, G. M. Doxiadis, S. Balla-Jhagjhoorsingh,J. L. Heeney et al., 2002 Evidence for an ancient selective sweep in theMHC class I gene repertoire of chimpanzees. Proc. Natl. Acad. Sci. USA99: 11748–11753. https://doi.org/10.1073/pnas.182420799
de Manuel, M., M. Kuhlwilm, P. Frandsen, V. C. Sousa, T. Desai et al.,2016 Chimpanzee genomic diversity reveals ancient admixturewith bonobos. Science 354: 477–481. https://doi.org/10.1126/science.aag2602
Deinard, A., and K. Kidd, 1999 Evolution of a HOXB6 intergenic regionwithin the great apes and humans. J. Hum. Evol. 36: 687–703. https://doi.org/10.1006/jhev.1999.0298
Enard, W., P. Khaitovich, J. Klose, S. Zollner, F. Heissig et al., 2002 Intra-and interspecific variation in primate gene expression patterns. Science296: 340–343. https://doi.org/10.1126/science.1068996
Excoffier, L., and H. E. Lischer, 2010 Arlequin suite ver 3.5: a new series ofprograms to perform population genetics analyses under Linux andWindows. Mol. Ecol. Resour. 10: 564–567. https://doi.org/10.1111/j.1755-0998.2010.02847.x
Fahrer, J., 2016 Food-Borne Carcinogens, pp. 1–5 in Encyclopedia ofCancer, edited by Schwab, M. Springer, Berlin, Heidelberg., .https://doi.org/10.1007/978–3-642–27841–9_7235–1
Fischer, A., J. Pollack, O. Thalmann, B. Nickel, and S. Paabo,2006 Demographic history and genetic differentiation in apes. Curr.Biol. 16: 1133–1138. https://doi.org/10.1016/j.cub.2006.04.033
Fischer, A., K. Prufer, J. M. Good, M. Halbwax, V. Wiebe et al.,2011 Bonobos fall within the genomic variation of chimpanzees. PLoSOne 6: e21605. https://doi.org/10.1371/journal.pone.0021605
Fischer, A., V. Wiebe, S. Paabo, and M. Przeworski, 2004 Evidence for acomplex demographic history of chimpanzees. Mol. Biol. Evol. 21: 799–808. https://doi.org/10.1093/molbev/msh083
Fu, Q., H. Li, P. Moorjani, F. Jay, S. M. Slepchenko et al., 2014 Genomesequence of a 45,000-year-old modern human from western Siberia.Nature 514: 445–449. https://doi.org/10.1038/nature13810
Fünfstück, T., M. Arandjelovic, D. B. Morgan, C. Sanz, P. Reed et al.,2015 The sampling scheme matters: Pan troglodytes troglodytes andP. t. schweinfurthii are characterized by clinal genetic variation ratherthan a strong subspecies break. Am. J. Phys. Anthropol. 156: 181–191.https://doi.org/10.1002/ajpa.22638
Fuselli, S., R. H. Gilman, S. J. Chanock, S. L. Bonatto, G. De Stefano et al.,2007 Analysis of nucleotide diversity of NAT2 coding region revealshomogeneity across Native American populations and high intra-population diversity. Pharmacogenomics J. 7: 144–152. https://doi.org/10.1038/sj.tpj.6500407
Gagneux, P., C. Wills, U. Gerloff, D. Tautz, P. A. Morin et al.,1999 Mitochondrial sequences show diverse evolutionary histories ofAfrican hominoids. Proc. Natl. Acad. Sci. USA 96: 5077–5082. https://doi.org/10.1073/pnas.96.9.5077
Green, R. E., J. Krause, A. W. Briggs, T. Maricic, U. Stenzel et al., 2010 Adraft sequence of the Neandertal genome. Science 328: 710–722. https://doi.org/10.1126/science.1188021
Hein, D. W., 2002 Molecular genetics and function of NAT1 and NAT2:role in aromatic amine metabolism and carcinogenesis. Mutat. Res.506–507: 65–77. https://doi.org/10.1016/S0027-5107(02)00153-7
Hein, D. W., 2018 Arylamine N-Acetyltransferase Type 2 Polymorphismand Human Urinary Bladder and Breast Cancer Risks, pp. 327–349 inArylamine N-Acetyltransferases in Health and Disease, edited by Laurieri,N., and E. Sim. World Scientific Publishing. https://doi.org/10.1142/9789813232013_0013
Hein, D. W., S. Boukouvala, D. M. Grant, R. F. Minchin, and E. Sim,2008 Changes in consensus arylamine N-acetyltransferase gene no-menclature. Pharmacogenet. Genomics 18: 367–368. https://doi.org/10.1097/FPC.0b013e3282f60db0
Hein, D. W., G. Fakis, and S. Boukouvala, 2018 Functional expression ofhuman arylamine N-acetyltransferase NAT1�10 and NAT1�11 alleles:a mini review. Pharmacogenet. Genomics 28: 238–244. https://doi.org/10.1097/fpc.0000000000000350
Hein, D. W., A. J. Fretland, and M. A. Doll, 2006 Effects of single nucleotidepolymorphisms in human N-acetyltransferase 2 on metabolic activation(O-acetylation) of heterocyclic amine carcinogens. Int. J. Cancer 119:1208–1211. https://doi.org/10.1002/ijc.21957
Hey, J., 2010 The divergence of chimpanzee species and subspecies as re-vealed in multipopulation isolation-with-migration analyses. Mol. Biol.Evol. 27: 921–933. https://doi.org/10.1093/molbev/msp298
Holm, S., 1979 A simple sequentially rejective multiple test procedure.Scand. J. Stat. 6: 65–70.
Hubbard, T. D., I. A. Murray, W. H. Bisson, A. P. Sullivan, A. Sebastian et al.,2016 Divergent Ah Receptor Ligand Selectivity during Hominin Evo-lution. Mol. Biol. Evol. 33: 2648–2658. https://doi.org/10.1093/molbev/msw143
Jensen, L. E., K. Hoess, L. E. Mitchell, and A. S. Whitehead, 2006 Loss offunction polymorphisms in NAT1 protect against spina bifida. Hum.Genet. 120: 52–57. https://doi.org/10.1007/s00439-006-0181-6
Kaessmann, H., V. Wiebe, and S. Paabo, 1999 Extensive nuclear DNAsequence diversity among chimpanzees. Science 286: 1159–1162. https://doi.org/10.1126/science.286.5442.1159
Kaessmann, H., V. Wiebe, G. Weiss, and S. Paabo, 2001 Great ape DNAsequences reveal a reduced diversity and an expansion in humans. Nat.Genet. 27: 155–156. https://doi.org/10.1038/84773
2222 | C. Vangenot et al.
Dow
nloaded from https://academ
ic.oup.com/g3journal/article/9/7/2199/6026812 by guest on 19 July 2022

Kent, W. J., C. W. Sugnet, T. S. Furey, K. M. Roskin, T. H. Pringle et al.,2002 The human genome browser at UCSC. Genome Res. 12: 996–1006. https://doi.org/10.1101/gr.229102
Knowles, J. W., W. Xie, Z. Zhang, I. Chennamsetty, T. L. Assimes et al.,2016 Identification and validation of N-acetyltransferase 2 as an insulinsensitivity gene. J. Clin. Invest. 126: 403. https://doi.org/10.1172/JCI85921
Krief, S., P. Berny, F. Gumisiriza, R. Gross, B. Demeneix et al.,2017 Agricultural expansion as risk to endangered wildlife: Pesticideexposure in wild chimpanzees and baboons displaying facial dysplasia.Sci. Total Environ. 598: 647–656. https://doi.org/10.1016/j.scitotenv.2017.04.113
Krief, S., J. M. Krief, A. Seguya, G. Couly, and G. Levi, 2014 Facial dysplasiain wild chimpanzees. J. Med. Primatol. 43: 280–283. https://doi.org/10.1111/jmp.12129
Krief, S., D. P. Watts, J. C. Mitani, J. M. Krief, M. Cibot et al., 2015 TwoCases of Cleft Lip and Other Congenital Anomalies in Wild ChimpanzeesLiving in Kibale National Park, Uganda. Cleft Palate Craniofac. J. 52:743–750. https://doi.org/10.1597/14-188
Kronenberg, Z. N., I. T. Fiddes, D. Gordon, S. Murali, S. Cantsilieris et al.,2018 High-resolution comparative analysis of great ape genomes.Science 360: eaar6343. https://doi.org/10.1126/science.aar6343
Kuhlwilm, M., M. de Manuel, A. Nater, M. P. Greminger, M. Krützenet al., 2016 Evolution and demography of the great apes. Curr.Opin. Genet. Dev. 41: 124–129. https://doi.org/10.1016/j.gde.2016.09.005
Kumar, S., G. Stecher, and K. Tamura, 2016 MEGA7: Molecular Evolu-tionary Genetics Analysis Version 7.0 for Bigger Datasets. Mol. Biol. Evol.33: 1870–1874. https://doi.org/10.1093/molbev/msw054
Ladero, J. M., 2008 Influence of polymorphic N-acetyltransferases onnon-malignant spontaneous disorders and on response to drugs.Curr. Drug Metab. 9: 532–537. https://doi.org/10.2174/138920008784892038
Lander, E. S., L. M. Linton, B. Birren, C. Nusbaum, M. C. Zody et al.,2001 Initial sequencing and analysis of the human genome. Nature 409:860–921. https://doi.org/10.1038/35057062. Erratum: 411: 720–720.https://doi.org/10.1038/35079657. Erratum: 412: 565–566. https://doi.org/10.1038/35087627
Laurieri, N., J. Dairou, J. E. Egleton, L. A. Stanley, A. J. Russell et al.,2014 From arylamine N-acetyltransferase to folate-dependent acetylCoA hydrolase: impact of folic acid on the activity of (HUMAN)NAT1and its homologue (MOUSE)NAT2. PLoS One 9: e96370. https://doi.org/10.1371/journal.pone.0096370
Laurieri, N., J. E. Egleton, and A. J. Russell, 2018 Human ArylamineN-Acetyltransferase Type 1 and Breast Cancer, pp. 351–384 in ArylamineN-Acetyltransferases in Health and Disease, edited by Laurieri, N., andE. Sim. World Scientific Publishing, .https://doi.org/10.1142/9789813232013_0014
Li, J. Z., D. M. Absher, H. Tang, A. M. Southwick, A. M. Casto et al.,2008 Worldwide human relationships inferred from genome-widepatterns of variation. Science 319: 1100–1104. https://doi.org/10.1126/science.1153717
Lobon, I., S. Tucci, M. de Manuel, S. Ghirotto, A. Benazzo et al.,2016 Demographic History of the Genus Pan Inferred from WholeMitochondrial Genome Reconstructions. Genome Biol. Evol. 8: 2020–2030. https://doi.org/10.1093/gbe/evw124
Luca, F., G. Bubba, M. Basile, R. Brdicka, E. Michalodimitrakis et al.,2008 Multiple advantageous amino acid variants in the NAT2 gene inhuman populations. PLoS One 3: e3136. https://doi.org/10.1371/journal.pone.0003136
Magalon, H., E. Patin, F. Austerlitz, T. Hegay, A. Aldashev et al.,2008 Population genetic diversity of the NAT2 gene supports a roleof acetylation in human adaptation to farming in Central Asia.Eur. J. Hum. Genet. 16: 243–251. https://doi.org/10.1038/sj.ejhg.5201963
McDonagh, E. M., S. Boukouvala, E. Aklillu, D. W. Hein, R. B. Altman et al.,2014 PharmGKB summary: very important pharmacogeneinformation for N-acetyltransferase 2. Pharmacogenet. Genomics 24:409–425. https://doi.org/10.1097/fpc.0000000000000062
Meyer, M., M. Kircher, M. T. Gansauge, H. Li, F. Racimo et al., 2012 Ahigh-coverage genome sequence from an archaic Denisovan individual.Science 338: 222–226. https://doi.org/10.1126/science.1224344
Meyer, U. A., 2004 Pharmacogenetics - five decades of therapeutic lessonsfrom genetic diversity. Nat. Rev. Genet. 5: 669–676. https://doi.org/10.1038/nrg1428
Mortensen, H. M., A. Froment, G. Lema, J. M. Bodo, M. Ibrahim et al.,2011 Characterization of genetic variation and natural selection atthe arylamine N-acetyltransferase genes in global human populations.Pharmacogenomics 12: 1545–1558. https://doi.org/10.2217/pgs.11.88
Nei, M., 1987 Molecular Evolutionary Genetics, Columbia University Press.https://doi.org/10.7312/nei-92038
O’Bleness, M., V. B. Searles, A. Varki, P. Gagneux, and J. M. Sikela,2012 Evolution of genetic and genomic features unique to the humanlineage. Nat. Rev. Genet. 13: 853–866. https://doi.org/10.1038/nrg3336
Olson, M. V., and A. Varki, 2003 Sequencing the chimpanzee genome:insights into human evolution and disease. Nat. Rev. Genet. 4: 20–28.https://doi.org/10.1038/nrg981
Patillon, B., P. Luisi, E. S. Poloni, S. Boukouvala, P. Darlu et al., 2014 Ahomogenizing process of selection has maintained an “ultra-slow”acetylation NAT2 variant in humans. Hum. Biol. 86: 185–214. https://doi.org/10.13110/humanbiology.86.3.0185
Patin, E., L. B. Barreiro, P. C. Sabeti, F. Austerlitz, F. Luca et al.,2006a Deciphering the ancient and complex evolutionary history ofhuman arylamine N-acetyltransferase genes. Am. J. Hum. Genet. 78:423–436. https://doi.org/10.1086/500614
Patin, E., C. Harmant, K. K. Kidd, J. Kidd, A. Froment et al., 2006b Sub-Saharan African coding sequence variation and haplotype diversity at theNAT2 gene. Hum. Mutat. 27: 720. https://doi.org/10.1002/humu.9438
Podgorná, E., I. Diallo, C. Vangenot, A. Sanchez-Mazas, A. Sabbagh et al.,2015 Variation in NAT2 acetylation phenotypes is associated withdifferences in food-producing subsistence modes and ecoregionsin Africa. BMC Evol. Biol. 15: 263. https://doi.org/10.1186/s12862-015-0543-6
Prado-Martinez, J., P. H. Sudmant, J. M. Kidd, H. Li, J. L. Kelley et al.,2013 Great ape genetic diversity and population history. Nature 499:471–475. https://doi.org/10.1038/nature12228
Prüfer, K., C. de Filippo, S. Grote, F. Mafessoni, P. Korlevic et al., 2017 Ahigh-coverage Neandertal genome from Vindija Cave in Croatia. Science358: 655–658. https://doi.org/10.1126/science.aao1887
Prüfer, K., F. Racimo, N. Patterson, F. Jay, S. Sankararaman et al., 2014 Thecomplete genome sequence of a Neanderthal from the Altai Mountains.Nature 505: 43–49. https://doi.org/10.1038/nature12886
R Core Team, 2013 R: a language and environment for statistical computing,R Foundation for Statistical Computing, Vienna, Austria.
Ramírez-Soriano, A., S. E. Ramos-Onsins, J. Rozas, F. Calafell, andA. Navarro, 2008 Statistical power analysis of neutrality tests underdemographic expansions, contractions and bottlenecks with recombina-tion. Genetics 179: 555–567. https://doi.org/10.1534/genetics.107.083006
Roy, J., M. Arandjelovic, B. J. Bradley, K. Guschanski, C. R. Stephens et al.,2014 Recent divergences and size decreases of eastern gorilla popula-tions. Biol. Lett. 10: 20140811. https://doi.org/10.1098/rsbl.2014.0811
Sabbagh, A., P. Darlu, B. Crouau-Roy, and E. S. Poloni, 2011 ArylamineN-acetyltransferase 2 (NAT2) genetic diversity and traditional subsis-tence: a worldwide population survey. PLoS One 6: e18507. https://doi.org/10.1371/journal.pone.0018507
Sabbagh, A., P. Darlu, C. Vangenot, and E. S. Poloni, 2018 ArylamineN-Acetyltransferases in Anthropology, pp. 165–193 in ArylamineN-Acetyltransferases in Health and Disease, edited by Laurieri, N., andE. Sim. World Scientific Publishing, .https://doi.org/10.1142/9789813232013_0007
Sabbagh, A., A. Langaney, P. Darlu, N. Gerard, R. Krishnamoorthy et al.,2008 Worldwide distribution of NAT2 diversity: implications forNAT2 evolutionary history. BMC Genet. 9: 21. https://doi.org/10.1186/1471-2156-9-21
Sabbagh, A., J. Marin, C. Veyssiere, E. Lecompte, S. Boukouvala et al.,2013 Rapid birth-and-death evolution of the xenobiotic metabolizing
Volume 9 July 2019 | Diversity in Hominid NAT genes | 2223
Dow
nloaded from https://academ
ic.oup.com/g3journal/article/9/7/2199/6026812 by guest on 19 July 2022

NAT gene family in vertebrates with evidence of adaptive selection. BMCEvol. Biol. 13: 62. https://doi.org/10.1186/1471-2148-13-62
Santos, M. R., V. Ramallo, M. Muzzio, J. S. Camelo, and G. Bailliet,2015 Association between NAT2 polymorphisms with non-syndromiccleft lip with or without cleft palate in Argentina. Rev. Med. Chil. 143:444–450. https://doi.org/10.4067/S0034-98872015000400005
Scally, A., J. Y. Dutheil, L. W. Hillier, G. E. Jordan, I. Goodhead et al.,2012 Insights into hominid evolution from the gorilla genome se-quence. Nature 483: 169–175. https://doi.org/10.1038/nature10842
Selinski, S., M. Blaszkewicz, S. Getzmann, and K. Golka, 2015 N-Acetyltransferase 2: ultra-slow acetylators enter the stage. Arch.Toxicol. 89: 2445–2447. https://doi.org/10.1007/s00204-015-1650-2
Sim, E., A. Abuhammad, and A. Ryan, 2014 ArylamineN-acetyltransferases: from drug metabolism and pharmacogenetics todrug discovery. Br. J. Pharmacol. 171: 2705–2725. https://doi.org/10.1111/bph.12598
Sim, E., and N. Laurieri, 2018 Drug Metabolism and PharmacogeneticsThen and Now, pp. 3–41 in Arylamine N-Acetyltransferases in Health andDisease, edited by Laurieri, N., and E. Sim. World Scientific Publishing,.https://doi.org/10.1142/9789813232013_0001
Sim, N.-L., P. Kumar, J. Hu, S. Henikoff, G. Schneider et al., 2012 SIFT webserver: predicting effects of amino acid substitutions on proteins. NucleicAcids Res. 40: W452–W457. https://doi.org/10.1093/nar/gks539
Simonsen, K. L., G. A. Churchill, and C. F. Aquadro, 1995 Properties ofstatistical tests of neutrality for DNA polymorphism data. Genetics 141:413–429.
Solis-Moruno, M., M. de Manuel, J. Hernandez-Rodriguez, C. Fontsere,A. Gomara-Castano et al., 2017 Potential damaging mutation in LRP5from genome sequencing of the first reported chimpanzee with theChiari malformation. Sci. Rep. 7: 15224. https://doi.org/10.1038/s41598-017-15544-w
Solis-Moruno, M., M. de Manuel, J. Hernandez-Rodriguez, C. Fontsere,A. Gomara-Castaño et al., 2018 Author Correction: Potential damagingmutation in LRP5 from genome sequencing of the first reported chim-panzee with the Chiari malformation. Sci. Rep. 8: 7437. https://doi.org/10.1038/s41598-018-24993-w
Song, T., D. Wu, Y. Wang, H. Li, N. Yin et al., 2013 Association of NAT1and NAT2 genes with nonsyndromic cleft lip and palate. Mol. Med. Rep.8: 211–216. https://doi.org/10.3892/mmr.2013.1467
Stephens, M., and P. Scheet, 2005 Accounting for decay of linkage dis-equilibrium in haplotype inference and missing-data imputation. Am.J. Hum. Genet. 76: 449–462. https://doi.org/10.1086/428594
Stephens, M., N. J. Smith, and P. Donnelly, 2001 A new statistical methodfor haplotype reconstruction from population data. Am. J. Hum. Genet.68: 978–989. https://doi.org/10.1086/319501
Sugawara, T., Y. Go, T. Udono, N. Morimura, M. Tomonaga et al.,2011 Diversification of bitter taste receptor gene family in westernchimpanzees. Mol. Biol. Evol. 28: 921–931. https://doi.org/10.1093/molbev/msq279
Tajima, F., 1989a The effect of change in population size on DNApolymorphism. Genetics 123: 597–601.
Tajima, F., 1989b Statistical method for testing the neutral mutationhypothesis by DNA polymorphism. Genetics 123: 585–595.
Tang, H., and P. D. Thomas, 2016 PANTHER-PSEP: predicting disease-causing genetic variants using position-specific evolutionary preservation.Bioinformatics 32: 2230–2232. https://doi.org/10.1093/bioinformatics/btw222
The Chimpanzee Sequencing and Analysis Consortium, 2005 Initial se-quence of the chimpanzee genome and comparison with the humangenome. Nature 437: 69–87. https://doi.org/10.1038/nature04072
The Genomes Project Consortium, 2012 An integrated map of geneticvariation from 1,092 human genomes. Nature 491: 56–65. https://doi.org/10.1038/nature11632
Thierry-Mieg D., and Thierry-Mieg J., 2006 AceView: a comprehensivecDNA-supported gene and transcripts annotation. Genome biology.7 Suppl 1: S12.11–14. https://doi.org/10.1186/gb-2006–7-s1-s12
Tsirka, T., S. Boukouvala, B. Agianian, and G. Fakis, 2014 Polymorphismp.Val231Ile alters substrate selectivity of drug-metabolizing arylamineN-acetyltransferase 2 (NAT2) isoenzyme of rhesus macaque and human.Gene 536: 65–73. https://doi.org/10.1016/j.gene.2013.11.085
Valente, C., L. Alvarez, S. J. Marks, A. M. Lopez-Parra, W. Parson et al.,2015 Exploring the relationship between lifestyles, diets and geneticadaptations in humans. BMC Genet. 16: 55. https://doi.org/10.1186/s12863-015-0212-1
Veeramah, K. R., and M. F. Hammer, 2014 The impact of whole-genomesequencing on the reconstruction of human population history. Nat. Rev.Genet. 15: 149–162. https://doi.org/10.1038/nrg3625
Wahl, S. E., A. E. Kennedy, B. H. Wyatt, A. D. Moore, D. E. Pridgen et al.,2015 The role of folate metabolism in orofacial development and clefting.Dev. Biol. 405: 108–122. https://doi.org/10.1016/j.ydbio.2015.07.001
Wakefield, L., S. Boukouvala, and E. Sim, 2010 Characterisation of CpGmethylation in the upstream control region of mouse Nat2: evidence fora gene-environment interaction in a polymorphic gene implicatedin folate metabolism. Gene 452: 16–21. https://doi.org/10.1016/j.gene.2009.12.002
Wakefield L., Cornish V., Long H., Griffiths W. J., and Sim E., 2007 Deletionof a xenobiotic metabolizing gene in mice affects folate metabolism.Biochemical and Biophysical Research Communications. 364: 556–560.https://doi.org/10.1016/j.bbrc.2007.10.026
Walraven, J. M., Y. Zang, J. O. Trent, and D. W. Hein, 2008 Structure/function evaluations of single nucleotide polymorphisms in humanN-acetyltransferase 2. Curr. Drug Metab. 9: 471–486. https://doi.org/10.2174/138920008784892065
Weisburger, J. H., 2002 Comments on the history and importance ofaromatic and heterocyclic amines in public health. Mutat. Res. 506–507:9–20. https://doi.org/10.1016/S0027-5107(02)00147-1
Wild, C. P., 2012 The exposome: from concept to utility. Int. J. Epidemiol.41: 24–32. https://doi.org/10.1093/ije/dyr236
Wrangham, R., and R. Carmody, 2010 Human adaptation to the control offire. Evol. Anthropol. 19: 187–199. https://doi.org/10.1002/evan.20275
Xue, Y., J. Prado-Martinez, P. H. Sudmant, V. Narasimhan, Q. Ayub et al.,2015 Mountain gorilla genomes reveal the impact of long-termpopulation decline and inbreeding. Science 348: 242–245. https://doi.org/10.1126/science.aaa3952
Zang, Y., M. A. Doll, S. Zhao, J. C. States, and D. W. Hein, 2007 Functionalcharacterization of single-nucleotide polymorphisms and haplotypes ofhuman N-acetyltransferase 2. Carcinogenesis 28: 1665–1671. https://doi.org/10.1093/carcin/bgm085
Zhu, Y., and D. W. Hein, 2008 Functional effects of single nucleotidepolymorphisms in the coding region of human N-acetyltransferase 1.Pharmacogenomics J. 8: 339–348. https://doi.org/10.1038/sj.tpj.6500483
Zhu, Y., J. C. States, Y. Wang, and D. W. Hein, 2011 Functional effects ofgenetic polymorphisms in the N-acetyltransferase 1 coding and 39untranslated regions. Birth Defects Res. A Clin. Mol. Teratol. 91: 77–84.https://doi.org/10.1002/bdra.20763
Zumla, A., P. Nahid, and S. T. Cole, 2013 Advances in the developmentof new tuberculosis drugs and treatment regimens. Nat. Rev. DrugDiscov. 12: 388–404. https://doi.org/10.1038/nrd4001
Communicating editor: R. Hernandez
2224 | C. Vangenot et al.
Dow
nloaded from https://academ
ic.oup.com/g3journal/article/9/7/2199/6026812 by guest on 19 July 2022