Display of 3-D Digital Images: Computational Foundations and Medical Applications
Upload
khangminh22Category
view
1download
0
Display of Fused Images: Methods, Interpretation,and Diagnostic Improvements
Rik Stokking, I. George Zubal, and Max A. Viergever
The use of integrated visualization for medical images
aims at assisting clinicians in the difficult task of men-
tally translating and integrating medical image data
from multiple sources into a three-dimensional (3D)
representation of the patient. This interpretation of the
enormous amount and complexity of contemporary,
multiparameter, and multimodal image data demands
efficient methods for integrated presentation. This arti-
cle reviews methods for fused display with the main
focus on integration of functional with anatomical im-
ages. First, an overview of integrated two-dimensional
(2D) and 3D medical image display techniques is pre-
sented, and topics related to the interpretation of the
integrated images are discussed. Then we address the
key issue for clinical acceptance, ie, whether these novel
visualization techniques lead to diagnostic improve-
ments. Methods for fused display appear to be powerful
tools to assist the clinician in the retrieval of relevant
information from multivariate medical image data. Eval-
uation of the different methods for fused display indi-
cates that the diagnostic process improves, notably as
concerns the anatomical localization (typically of func-
tional processes), the registration procedure, enhance-
ment of signal, and efficiency of information presenta-
tion (which increases speed of interpretation and
comprehension). Consequently, fused display improves
communication with referring specialists, increases con-
fidence in the observations, and facilitates the intra- and
intersubject comparison of a large part of the data from
the different sources, thereby simplifying the extraction
of additional, valuable information. In most diagnostic
tasks the clinician is served best by providing several
(interactive and flexible) 2D and 3D methods for fused
display for a thorough assessment of the wealth of
image information from multiple sources.
© 2003 Elsevier Inc. All rights reserved.
CLINICIANS ARE FACED with an enormous in-crease of information caused by the rapid devel-
opments in three-dimensional (3D) imaging techniques,such as magnetic resonance imaging (MRI), computedtomography (CT), single photon emission computedtomography (SPECT), and positron emission tomogra-phy (PET). It is to be expected that the amount andcomplexity of the data will continue to rise at a steadypace because of the increase in spatial and temporalresolution of current scanners, but also by the advent ofnew (and more complex) imaging modalities. The men-tal integration of all these data into a 3D representationis very difficult, and the clinician will need more andmore assistance in interpreting and integrating informa-tion from the different sources.
Computer-aided techniques are required to assist theclinician in integrating the image data. Clinical applicationsthat profit from integration are the display of CT and MRimages with electromagnetic dipole data for neurosurgery,1
presentation of CT/ MRI data combined with dose distri-butions for radiotherapy planning,2 and integrated visual-ization of SPECT and MR brain image data to investigatetumor related perfusion changes.3 Integration involves twofundamental stages, ie, the registration or matching of thedata from the different sources and the visualization ordisplay of the registered data. In this article we mainlyfocus on visualization methods to combine functional(SPECT, PET, functional MRI [fMRI]) with anatomicalimages (CT, MRI). Functional images are inherently ham-pered by their low spatial resolution,4,5 and integration withanatomical data may aid in the analysis of the functionalinformation.6-8
Another important emphasis of this review is on thestructure being imaged. So far, most of the research in
the area of integrated visualization has been devoted tothe brain. The reason is that high registration accuracycan be achieved because the brain is enclosed by a rigidstructure, ie, the skull. Registration in other parts of thebody is much more difficult because of problems causedby motion (respiration, bowel, cardiac, etc.). This reviewconsists of two major sections: (1) a description ofmethods for integrated 2D and 3D visualization and adiscussion of issues related to interpretation of theresulting fused images and (2) an overview of thepossible diagnostic improvements obtained when apply-ing these methods.
METHODS FOR INTEGRATED VISUALIZATIONAND INTERPRETATION OF THE FUSED
IMAGES
Integrated 2D Visualization
Adjacent display of 2D images from different sourceson a light-box or computer screen can be considered the
From the Departments of Radiology and Medical Informat-ics, Erasmus MC, University Medical Center Rotterdam, Rot-terdam, The Netherlands; Diagnostic Radiology Yale Univer-sity Medical School, New Haven, CT; and Image SciencesInstitute, University Medical Center Utrecht, Utrecht, TheNetherlands.
Address reprint requests to Dr. R. Stokking, Medical Infor-matics and Radiology, Ee2167, Dr. Molewaterplein 50, Eras-mus MC, University Medical Center Rotterdam, 3015 GERotterdam, The Netherlands.
This research was funded in part by the National Institutes ofHealth, Grant No. R01-S35674.
© 2003 Elsevier Inc. All rights reserved.0001-2998/03/3303-0015$30.00/0doi:10.1053/snuc.2003.127311
219Seminars in Nuclear Medicine, Vol XXXIII, No 3 (July), 2003: pp 219–227
most elementary form of fused display. A valuableextension is the addition of a linked cursor to markanalogous positions in a number of images.9-21 However,these methods of integrated display still leave the ob-server with the mental integration of the information,because, technically, the information from the differ-ent sources is not combined into one (or more) image(s).
True integrated display of multiparameter or multi-modal information is when the image information fromthe different sources is combined into one (or more)image(s). Two categories can be distinguished for thiscombined display of information:3,7,9,22,23
Nonselective Integration
Information from different images can be inte-grated using simple methods, such as multiplication,addition, or color combination, thereby combining allinformation into one image. Although these tech-niques are easy to use and enable quick presentation,they are usually not very effective. The danger withmost of these techniques can be that relevant infor-mation is camouflaged by irrelevant data, therebydegrading the diagnostic quality of the integrateddisplay (see also Rehm et al24 and Quarantelli et al25).This may not be a problem when assessing registra-tion accuracy for research purposes, but may wellhamper clinical observation tasks. An exception is theuse of color models 11-14,17,21,26-42 because the humanvisual system employs color more effectively than itdoes gray levels.26,43 One of the main problems withcolor fusion used to be the limited color displaycapabilities of monitors,28,29 but nowadays 24-bit (or
true color) monitors are widely available, and this hasconsiderably alleviated the application of color fusionfor integrated display. Several options for color fusioncan be applied, eg, independent use of the red-green-blue (RGB) or hue-saturation-value (HSV) compo-nents, or averaging or multiplication of the colorcomponents when combining two or more images. Forexample, the so-called colorwash technique44 can beused whereby a pseudocolor image is added to agreyscale image. Others have applied the HSV modelto keep the sources of information separate, eg, for thecombined visualization of MR images (encoded in thevalue component) and SPECT information (encodedin the hue and/or the saturation component).3,45 Thisclear separation makes HSV a highly suitable colormodel to allow easy, rapid, and intuitive retrospectivemanipulation of the color encoding of an integrateddisplay.
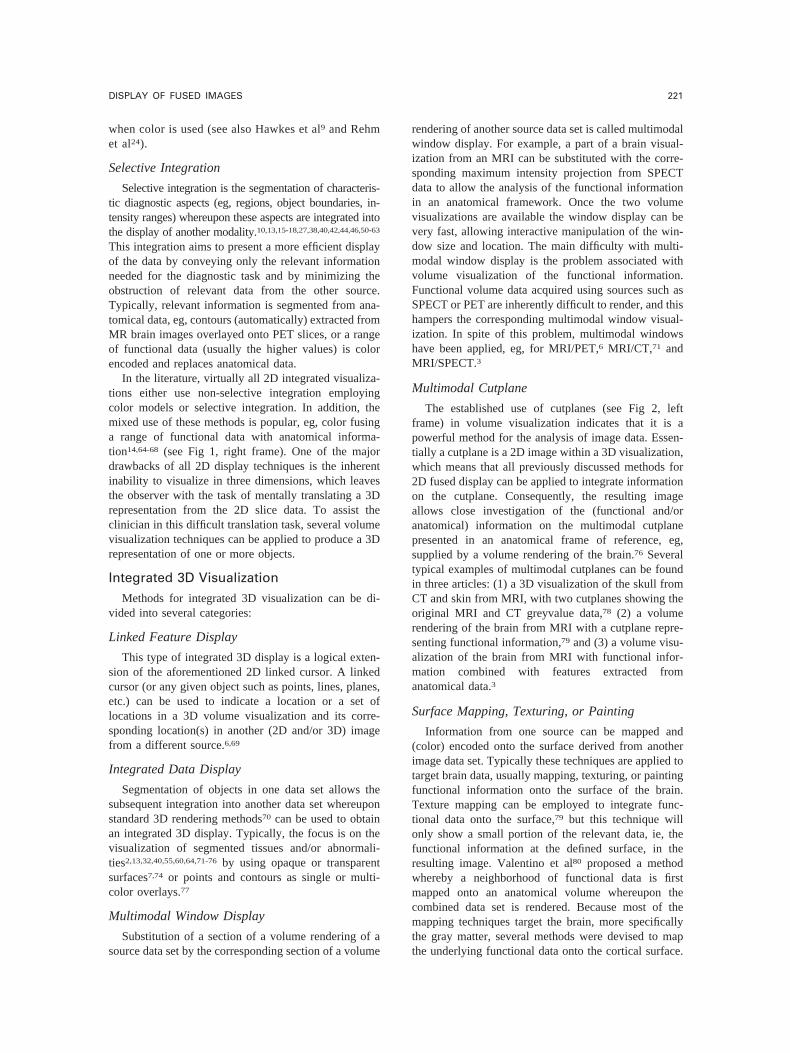
The so-called checkerboard display13,16,19,24,34,46-49
(see Fig 1, left frame) may also be considered a typeof non-selective fused display. The technique is pri-marily used to simulate some sort of transparencyeffect or to present and to verify registration results intechnical research articles. The effectiveness of thisdisplay for verification of registration accuracy in aclinical setting is probably limited because typicallyhalf of all the information, whether relevant or not, isremoved, and interpretation is mainly limited to theborders of the checkers. Furthermore, perceptualproblems have been reported most notably when thesize of the checkers is small (eg, size of 1 pixel) and
Fig 1. 2D fused display. (Left) Checkerboard display of an MR and a SPECT image. The size of the checkers goes from large (left
top) to small (right bottom). (Right) Color fusion display of SPECT perfusion increases during a seizure combined with the
corresponding MR images for an epileptic patient with a focus in the left temporal lobe.
220 STOKKING, ZUBAL, AND VIERGEVER
when color is used (see also Hawkes et al9 and Rehmet al24).
Selective Integration
Selective integration is the segmentation of characteris-tic diagnostic aspects (eg, regions, object boundaries, in-tensity ranges) whereupon these aspects are integrated intothe display of another modality.10,13,15-18,27,38,40,42,44,46,50-63
This integration aims to present a more efficient displayof the data by conveying only the relevant informationneeded for the diagnostic task and by minimizing theobstruction of relevant data from the other source.Typically, relevant information is segmented from ana-tomical data, eg, contours (automatically) extracted fromMR brain images overlayed onto PET slices, or a rangeof functional data (usually the higher values) is colorencoded and replaces anatomical data.
In the literature, virtually all 2D integrated visualiza-tions either use non-selective integration employingcolor models or selective integration. In addition, themixed use of these methods is popular, eg, color fusinga range of functional data with anatomical informa-tion14,64-68 (see Fig 1, right frame). One of the majordrawbacks of all 2D display techniques is the inherentinability to visualize in three dimensions, which leavesthe observer with the task of mentally translating a 3Drepresentation from the 2D slice data. To assist theclinician in this difficult translation task, several volumevisualization techniques can be applied to produce a 3Drepresentation of one or more objects.
Integrated 3D Visualization
Methods for integrated 3D visualization can be di-vided into several categories:
Linked Feature Display
This type of integrated 3D display is a logical exten-sion of the aforementioned 2D linked cursor. A linkedcursor (or any given object such as points, lines, planes,etc.) can be used to indicate a location or a set oflocations in a 3D volume visualization and its corre-sponding location(s) in another (2D and/or 3D) imagefrom a different source.6,69
Integrated Data Display
Segmentation of objects in one data set allows thesubsequent integration into another data set whereuponstandard 3D rendering methods70 can be used to obtainan integrated 3D display. Typically, the focus is on thevisualization of segmented tissues and/or abnormali-ties2,13,32,40,55,60,64,71-76 by using opaque or transparentsurfaces7,74 or points and contours as single or multi-color overlays.77
Multimodal Window Display
Substitution of a section of a volume rendering of asource data set by the corresponding section of a volume
rendering of another source data set is called multimodalwindow display. For example, a part of a brain visual-ization from an MRI can be substituted with the corre-sponding maximum intensity projection from SPECTdata to allow the analysis of the functional informationin an anatomical framework. Once the two volumevisualizations are available the window display can bevery fast, allowing interactive manipulation of the win-dow size and location. The main difficulty with multi-modal window display is the problem associated withvolume visualization of the functional information.Functional volume data acquired using sources such asSPECT or PET are inherently difficult to render, and thishampers the corresponding multimodal window visual-ization. In spite of this problem, multimodal windowshave been applied, eg, for MRI/PET,6 MRI/CT,71 andMRI/SPECT.3
Multimodal Cutplane
The established use of cutplanes (see Fig 2, leftframe) in volume visualization indicates that it is apowerful method for the analysis of image data. Essen-tially a cutplane is a 2D image within a 3D visualization,which means that all previously discussed methods for2D fused display can be applied to integrate informationon the cutplane. Consequently, the resulting imageallows close investigation of the (functional and/oranatomical) information on the multimodal cutplanepresented in an anatomical frame of reference, eg,supplied by a volume rendering of the brain.76 Severaltypical examples of multimodal cutplanes can be foundin three articles: (1) a 3D visualization of the skull fromCT and skin from MRI, with two cutplanes showing theoriginal MRI and CT greyvalue data,78 (2) a volumerendering of the brain from MRI with a cutplane repre-senting functional information,79 and (3) a volume visu-alization of the brain from MRI with functional infor-mation combined with features extracted fromanatomical data.3
Surface Mapping, Texturing, or Painting
Information from one source can be mapped and(color) encoded onto the surface derived from anotherimage data set. Typically these techniques are applied totarget brain data, usually mapping, texturing, or paintingfunctional information onto the surface of the brain.Texture mapping can be employed to integrate func-tional data onto the surface,79 but this technique willonly show a small portion of the relevant data, ie, thefunctional information at the defined surface, in theresulting image. Valentino et al80 proposed a methodwhereby a neighborhood of functional data is firstmapped onto an anatomical volume whereupon thecombined data set is rendered. Because most of themapping techniques target the brain, more specificallythe gray matter, several methods were devised to mapthe underlying functional data onto the cortical surface.
221DISPLAY OF FUSED IMAGES
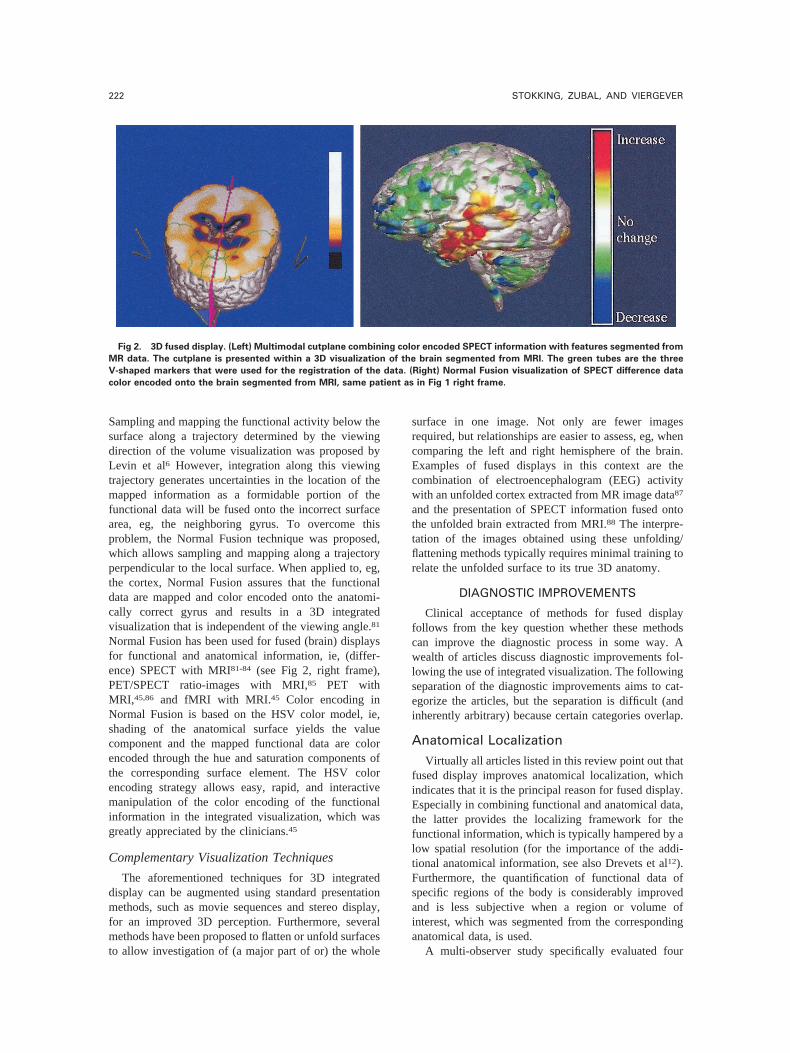
Sampling and mapping the functional activity below thesurface along a trajectory determined by the viewingdirection of the volume visualization was proposed byLevin et al6 However, integration along this viewingtrajectory generates uncertainties in the location of themapped information as a formidable portion of thefunctional data will be fused onto the incorrect surfacearea, eg, the neighboring gyrus. To overcome thisproblem, the Normal Fusion technique was proposed,which allows sampling and mapping along a trajectoryperpendicular to the local surface. When applied to, eg,the cortex, Normal Fusion assures that the functionaldata are mapped and color encoded onto the anatomi-cally correct gyrus and results in a 3D integratedvisualization that is independent of the viewing angle.81
Normal Fusion has been used for fused (brain) displaysfor functional and anatomical information, ie, (differ-ence) SPECT with MRI81-84 (see Fig 2, right frame),PET/SPECT ratio-images with MRI,85 PET withMRI,45,86 and fMRI with MRI.45 Color encoding inNormal Fusion is based on the HSV color model, ie,shading of the anatomical surface yields the valuecomponent and the mapped functional data are colorencoded through the hue and saturation components ofthe corresponding surface element. The HSV colorencoding strategy allows easy, rapid, and interactivemanipulation of the color encoding of the functionalinformation in the integrated visualization, which wasgreatly appreciated by the clinicians.45
Complementary Visualization Techniques
The aforementioned techniques for 3D integrateddisplay can be augmented using standard presentationmethods, such as movie sequences and stereo display,for an improved 3D perception. Furthermore, severalmethods have been proposed to flatten or unfold surfacesto allow investigation of (a major part of or) the whole
surface in one image. Not only are fewer imagesrequired, but relationships are easier to assess, eg, whencomparing the left and right hemisphere of the brain.Examples of fused displays in this context are thecombination of electroencephalogram (EEG) activitywith an unfolded cortex extracted from MR image data87
and the presentation of SPECT information fused ontothe unfolded brain extracted from MRI.88 The interpre-tation of the images obtained using these unfolding/flattening methods typically requires minimal training torelate the unfolded surface to its true 3D anatomy.
DIAGNOSTIC IMPROVEMENTS
Clinical acceptance of methods for fused displayfollows from the key question whether these methodscan improve the diagnostic process in some way. Awealth of articles discuss diagnostic improvements fol-lowing the use of integrated visualization. The followingseparation of the diagnostic improvements aims to cat-egorize the articles, but the separation is difficult (andinherently arbitrary) because certain categories overlap.
Anatomical Localization
Virtually all articles listed in this review point out thatfused display improves anatomical localization, whichindicates that it is the principal reason for fused display.Especially in combining functional and anatomical data,the latter provides the localizing framework for thefunctional information, which is typically hampered by alow spatial resolution (for the importance of the addi-tional anatomical information, see also Drevets et al12).Furthermore, the quantification of functional data ofspecific regions of the body is considerably improvedand is less subjective when a region or volume ofinterest, which was segmented from the correspondinganatomical data, is used.
A multi-observer study specifically evaluated four
Fig 2. 3D fused display. (Left) Multimodal cutplane combining color encoded SPECT information with features segmented from
MR data. The cutplane is presented within a 3D visualization of the brain segmented from MRI. The green tubes are the three
V-shaped markers that were used for the registration of the data. (Right) Normal Fusion visualization of SPECT difference data
color encoded onto the brain segmented from MRI, same patient as in Fig 1 right frame.
222 STOKKING, ZUBAL, AND VIERGEVER
types of fused display for anatomical localization offunctional brain data.89 The task was to localize cold andhot-spots in the peripheral cortex of the brain withrespect to lobes and gyri. SPECT and MRI data of 30patients were presented using either (1) 2D SPECTdisplay, (2) adjacent display of (2D) SPECT images withcorresponding MRI slices, (3) integrated 2D display ofSPECT images with superimposed contours from MRI,and (4) integrated 3D display (Normal Fusion images).The integrated 2D display modes (2 and 3) resulted in anincrease of the agreement among raters in their localiza-tions compared with the 2D SPECT display (1). Afurther increase was obtained when using integrated 3Ddisplay (4).
Registration
Fused Display for Interactive Registration
Several methods have been presented where inte-grated visualizations are part of a tool to register datasets from different sources by interactive manipulationof the data. The so-called hat-head method of Pelizzari etal22 is an automatic technique to find the best matchbetween (segmented) surfaces from different sources ofinformation. During this process the user is continuouslypresented with updated contours and points indicatingthe surfaces and allowed to interrupt and modify param-eters to speed convergence to the optimal surface match.Pietrzyk et al90,91 used fused displays (contours fromMR overlayed onto PET slices and color wash to fuse2D MR and PET images) so that the user could translateand rotate the data to find the best visual match.Kapouleas et al51 discussed a method where the user isfirst required to identify landmarks in two data sets toalign the interhemispheric fissure. Then the user ispresented with automatically extracted contours fromMR overlayed onto PET slices and allowed to interac-tively rotate and translate the contours to calculate thebest match. Soltys et al38 presented an interactive regis-tration method and provided the user with an array offused displays to choose from. The authors of thesestudies found that gross misregistration is best handledby 3D views of the data, whereas arbitrary cutplanes arethe most useful for fine registration. Habboush et al46
allowed interactive manipulation of images with real-time visual feedback to achieve accurate alignmentbetween SPECT and MR brain data. Three types offused 2D display were used, viz. color fusion and twoforms of specific integration of features (masking andedge extraction). Hamilton et al67 found that the autoreg-istration provided by the head-hat matching method22
did not yield acceptable results for vascular registrationof SPECT and CT images for the pelvic region. They,therefore, devised a completely manual tool for interac-tive registration by presenting fused displays of 3Dwireframes and 2D color fusion images. Pfluger et
al68 compared automatic and interactive methods forMR-SPECT brain image registration and found that aninteractive approach using 2D color fusion images hadthe lowest registration error. In addition, the influence ofsubjectivity was shown to be negligible.
Fused Display to Verify Registration Results
All methods discussed in the previous section oninteractive registration were also used to verify registra-tion results. In addition, others have applied fuseddisplays to verify registration results where the emphasisis on methods for 2D integrated display. Adjacentdisplay13,20,37,44 and linked cursor/features13,16,17,20 arethe easiest forms. Some have used checkerboard dis-plays,13,16,34,49 but the usefulness appears limited to aresearch setting and presentation in articles. Evaluationof the registration accuracy in a clinical setting is muchmore critical, and the usefulness of the checkerboard isdebatable as already mentioned earlier (see section onintegrated 2D visualization). In the literature, the mostprominently discussed—and therefore probably mostuseful—visualization techniques to assess registrationaccuracy are 2D color fusion13,17,33,34,37,39,40,44,59,65,66
and 2D specific integration.13,16,40,44,52,57,58
Fused Display for Signal Enhancement
Combination of information from multiple sourcescan be applied to enhance conspicuity of relevant datawith respect to irrelevant information. This area has beencompletely dominated by 2D color fusion methods forthe assessment of multiparameter MR images or func-tional-anatomical data. The hybrid color MR imagingdisplay of Weiss et al26 combined corresponding MR T1and T2 images into one single image based on thehue-luminance-saturation color model. They assignedthe T1 data to the hue component and the T2 informationto the luminance component of the corresponding pixelto enhance both data conspicuity and the efficiency ofinterpretation. Kamman et al28 combined MRI T1 andT2 data into one directly interpretable image by uniquelymixing colors based on the RGB model. Although theirmonitor was limited to 8-bit color display, they foundthis color combination method a very suitable means ofrepresentation for the MR image data. Brown et al29
integrated two or three parameter MR images into oneimage based on combination of RGB values wherebyspecific red, green, and blue color values were assignedto each of the MR parameters. They found that theincreased tissue conspicuity potentially allowed the de-tection of subtleties that otherwise could have beenmissed by the observer. In addition, the limitationsimposed by the 8-bit display caused information loss, butthey considered this minimal. Alfano et al37,43 describeda method called “quantitative magnetic color imaging”(QMCI) to uniquely mix multiparameter MR imagesbased on the RGB model. Whenever three MR param-eter images had to be integrated each of the parameters
223DISPLAY OF FUSED IMAGES

was represented by using one of the RGB monochro-matic scales. In the case when two MR parameter imageshad to be integrated a combination of monochromaticscales could be used as long as different pairs of MRparameters yielded two different composite colors. Theauthors found that QMCI maintained the diagnosticinformation from the original image data, with potentialadvantages in the assessment of brain abnormalities,such as tumors and white matter lesions. Several authorshave applied 2D color fusion methods whenever thespecificity of CT or MR by itself was not high enough todifferentiate certain pathologies from normal variations.Color fusion of CT/MRI data with SPECT informationfor non-brain areas was used by a number of groups toincrease specificity and thereby allowed improved dif-ferentiation of abnormalities.31,35,65,66,67 Juengling et al21
applied a method called SMART-PET for HSV colorfused display of MRI T2 and PET data and found thatsignal hyperintensity in the MRI data correlated wellwith decreased PET accumulation in patients with whitematter lesions.
Efficiency of Information Presentation toFacilitate and Improve Interpretation andComprehension
Well chosen techniques for fused display are meant toincrease the efficiency of information presentation andthereby to facilitate and to improve interpretation andcomprehension of the data. Vera et al59 qualitatively eval-uated facility of interpretation for localizing seizure foci insubtraction SPECT and MRI data. Interpretation was foundto be significantly higher when using overlay imagescompared with stand-alone analysis of ictal and interictalSPECT images (even when registered). Quarantelli et al25
compared their frequency encoding (FE) method (summingthe low frequencies of PET data with the high frequenciesof MR T1 data) with two other techniques for fused (2D)display, viz. image averaging and color wash. Evaluatorswere asked to rate conspicuity of anatomical features fromMR as well as PET abnormalities and PET activity distri-bution in images from seven patients and a computer-simulated phantom. The results suggested that evaluationof PET and MRI data can be improved by using FE. Thisdiagnostic improvement has a considerable overlap withthe previously mentioned items, most notably anatomicallocalization. Several associated diagnostic improvementscan be distinguished:
Communication with Referring SpecialistsImproves
In our own work we found that the Normal Fusionimages of SPECT difference data and MR imagesprovided a summary of a large part of the data ofepilepsy patients thereby not only facilitating the reportof the results at the weekly neurosurgery meeting, butalso linking the results with information from other
sources, such as EEG, fMRI, and neuropsychiatric test-ing.14,81,92
Increased Confidence in Observations
Gandhe et al55 obtained promising results when theytried to quantify the confidence of surgeons in theirability to interpret multimodal images. Stokking et al89
asked nuclear medicine physicians to rate their confi-dence in localizing functional information with respectto the anatomy of the brain (see also the section onanatomical localization). 2D fused display based onadjacent display and linked characteristics increased theconfidence of the observers compared with stand-aloneSPECT display. 3D Normal Fusion images gave afurther boost to their confidence in their ability tolocalize functional data.
Comparison Facilitated, Enhanced Intra- andInterobserver Reproducibility
The aforementioned study by Vera et al59 found thatthe intra- and interobserver reproducibility was signifi-cantly higher when using fused display compared withstand-alone presentation. Stokking et al92 found thatNormal Fusion images of SPECT difference and MRIdata made it easier to assess patterns of epilepsy relatedperfusion changes and thereby to facilitate the interpa-tient comparison.
DISCUSSION
Fused display of data from different sources is apowerful tool to retrieve relevant information containedwithin the original images. Evaluation of the differentmethods for fused display indicates that the diagnosticprocess improves, notably as concerns the anatomicallocalization (typically of functional processes), the reg-istration procedure, the enhancement of signal, and theefficiency of information presentation (which increasesspeed of interpretation and comprehension). Conse-quently, fused display improves communication withreferring specialists, increases confidence in the obser-vations, and facilitates the intra- and intersubject com-parison of a large part of the data from the differentsources, thereby simplifying the extraction of additional,valuable information.
It is difficult to propose a standard method for fuseddisplay for a given diagnostic setting because the appli-cation of the visualization methods is not only taskdependent (a diagnostic analysis typically involves sev-eral highly specific tasks and questions, each possiblydemanding another visualization method), but also op-erator dependent. In most diagnostic settings the clini-cian is served best by providing several (interactive andflexible) 2D and 3D methods for fused display for athorough assessment of the wealth of multiparameterand multimodal image information (see also Soltys etal38).
224 STOKKING, ZUBAL, AND VIERGEVER
REFERENCES
1. Van den Elsen PA: Multimodality matching of brainimages. Doctoral thesis, Utrecht University, the Netherlands,1993
2. Levoy M: A hybrid ray tracer for rendering polygon andvolume data. IEEE Comput Graph 10:33-40, 1990
3. Stokking R, Zuiderveld KJ, Hulshoff Pol HE, et al:.Integrated visualization of SPECT and MR images for frontallobe damaged regions, in Robb RA (ed): Visualization inBiomedical Computing (Vol 2359). Bellingham WA: SPIEPress, 1994, pp 282-290
4. Evans AC, Marrett TS, Torrescorzo J, et al: MRI-PETcorrelation in three dimensions using a volume-of-interest(VOI) atlas. J Cerebr Blood F Met, 11:A69-A78, 1991(suppl1)
5. Zubal IG, Spencer SS, Imam K, et al: Difference imagescalculated from ictal and interictal technetium-99mHMPAOSPECT scans of epilepsy. J Nucl Med 36:684-689, 1995
6. Levin DN, Hu X, Tan KK, et al: The brain: Integratedthree-dimensional display of MR and PET images. Radiology172:783-789, 1989
7. Viergever MA, van den Elsen PA, Stokking R: Integratedpresentation of multimodal brain images. Brain Topogr 5:135-145, 1992
8. Britton K: Highlights of the annual meeting of theEuropean Association of Nuclear Medicine, Lausanne 1994.Eur J Nucl Med, 21:159-169, 1994
9. Hawkes DJ, Hill DLG, Lehmann ED, et al: Preliminarywork on the interpretation of SPECT images with the aid ofregistered MR images and an MR derived 3D neuroanatomicalatlas, in Hohne KH, Fuchs H, Pizer S (eds): 3D Imaging inMedicine. Berlin, Springer-Verlag, 1990, pp 242-251
10. Hill DLG, Hawkes DJ, Crossman JE, et al: Registrationof MR and CT images for skull base surgery using point-likeanatomical features. Brit J Radiol 64:1030-1035, 1991
11. Holman BL, Zimmerman RE, Johnson KA, et al: Com-puter-assisted superimposition of magnetic resonance and high-resolution technetium-99mHMPAO and thallium-201 SPECTimages of the brain. J Nucl Med 32:1478-1485, 1991
12. Drevets W, Videen T, MacLeod A, et al: PET images ofblood flow changes during anxiety: Correction. Science 256:1696, 1992
13. Hill DLG, Hawkes DJ, Hussain Z, et al: Accuratecombination of CT and MR data of the head: validation andapplications in surgical and therapy planning. Comput MedImaging Graph 17:357-363, 1993
14. Chisin R, Pietrzyk U, Sichel J-Y, et al: Registration anddisplay of multimodal images: Applications in the extracranialhead and neck region. J Otolaryngol 22:214-219, 1993
15. Heiss W-D, Herholz K: Assessment of pathophysiologyof stroke by positron emission tomography. Eur J Nucl Med,21:455-465, 1994
16. Hemler P, Napel S, Sumanaweera TS, et al: Registrationerror quantification of a surface based multimodality imagefusion system. Med Phys 22:1049-1056, 1995
17. Pietrzyk U, Herholz K, Schuster A, et al: Clinicalapplications of registration and fusion of multimodality brainimages from PET, SPECT, CT, and MRI. Eur J Radiol21:174-182, 1996
18. Vansteenkiste JF, Stroobants SG, Dupont PJ, et al:FDG-PET scan in potentially operable non-small cell lungcancer: Do anatometabolic PET-CT fusion images improve the
localisation of regional lymph node metastases? Eur J NuclMed 25:1495-1501, 1998
19. Beyer T, Townsend DW, Brun T, et al: A combinedPET/CT scanner for clinical oncology. J Nucl Med 41:1369-1379, 2000
20. Barnden L, Kwiatek R, Lau Y, et al: Validation of fullyautomatic brain SPET to MR co-registration. Eur J Nucl Med27:147-154, 2000
21. Juengling FD, Kassubek J, Hogerle S, et al: SMART-PET: Multimodality white matter imaging and display withoutloss of quantitative information. J Magn Reson Imaging 15:456-461, 2002
22. Pelizzari CA, Chen GTY, Spelbring DR, et al: Accuratethree-dimensional registration of CT, PET, and/or MR imagesof the brain. J Comput Assist Tomo 13:20-26, 1989
23. Viergever MA, Maintz JBA, Stokking R: Integration offunctional and anatomical brain images. Biophys Chem 68:207-219, 1997
24. Rehm K, Strother SC, Anderson JR, et al: Display ofmerged multimodality brain images using interleaved pixelswith independent color scales. J Nucl Med 35:1815-1821, 1994
25. Quarantelli M, Alfano B, Larobina M, et al: Frequencyencoding for simultaneous display of multimodality images.J Nucl Med 40:442-447, 1999
26. Weiss KL, Stiving SO, Herderick EE, et al: Hybrid colorMR imaging display. Am J Roentgenol 149:825-829, 1987
27. Levin DN, Pelizzari CA, Chen GTY, et al: Retrospectivegeometric correlation of MR, CT, and PET images. Radiology169:817-823, 1988
28. Kamman RL, Stomp GP, Berendsen HJC: Unified mul-tiple-feature color display for MR images. Magn Reson Med9:240-253, 1989
29. Brown HK, Hazelton TR, Silbiger ML: Generation ofcolor composites for enhanced tissue differentiation in Mag-netic Resonance Imaging of the brain. Am J Anat 192:23-34,1991
30. Lang TF, Hasegawa BH, Liew SC, et al: Description ofa prototype emission-transmission Computer Tomography im-aging system. J Nucl Med 33:1881-1887, 1992
31. Ricard M, Tenenbaum F, Schlumberger M, et al: Intra-operative detection of pheochromocytoma with iodine-125labelled meta-iodobenzylguanidine: A feasibility study. EurJ Nucl Med 20:426-430, 1993
32. Sgouros G, Chiu S, Pentlow KS, et al:. Three-dimen-sional dosimetry for radioimmunotherapy treatment planning.J Nucl Med 34:1595-1601, 1993
33. Wahl RL, Quint LE, Cieslak RD, et al: “Anatometa-bolic” tumor imaging: Fusion of FDG PET with CT or MRI tolocalize foci of increased activity. J Nucl Med 34:1190-1197,1993
34. Van Herk M, Kooy HM: Automatic three-dimensionalcorrelation of CT-CT, CT-MRI, and CT-SPECT using chamfermatching. Med Phys 7:1163-1178, 1994
35. Scott AM, Macapinlac HA, Divgi CR, et al: Clinicalvalidation of SPECT and CT/MRI image registration in radio-labeled monoclonal antibody studies of colorectal carcinoma.J Nucl Med 35:1976-1984, 1994
36. Tjuvajev JG, Macapinlac HA, Daghighian F, et al:Imaging of brain tumor proliferative activity with iodine131-iododeoxyuridine. J Nucl Med 35:1407-1417, 1994
225DISPLAY OF FUSED IMAGES
37. Alfano B, Brunetti A, Arpaia M, et al: Multiparametricdisplay of spin-echo data from MR studies of brain. J MagnReson Imaging 5:217-225, 1995
38. Soltys M, Beard DV, Carrasco V, et al: FUSION: A toolfor registration and visualization of multiple modality 3Dmedical data, in Loew MH (ed): Medical Imaging: ImageProcessing (vol 2434). Bellingham, WA, SPIE Press 1995, pp74-80
39. Wong JC, Studholme C, Hawkes DJ, et al: Evaluation ofthe limits of visual detection of image misregistration in a brainfluorine-18 fluorodeoxyglucose PET-MRI study. Eur J NuclMed 24:642-650, 1997
40. Hawkes DJ: Algorithms for radiological image registra-tion and their clinical application. J Anat 193:347-361, 1998
41. Patton JA, Delbeke D, Sandler MP: Image fusion usingan integrated, dualhead coincidence camera with X-ray tube-based attenuation maps. J Nucl Med 41:1364-1368, 2000
42. Callen DJ, Black SE, Caldwell CB: Limbic systemperfusion in Alzheimer’s disease measured by MRI-coregis-tered HMPAO SPECT. Eur J Nucl Med 29:899-906, 2002
43. Alfano B, Brunetti A, Ciarmiello A, et al: Simultaneousdisplay of multiple MR parameters with quantitative magneticcolor imaging. J Comput Assist Tomo 16:634-640, 1992
44. Chen C-T, Pelizzari CA, Chen GTY, et al: Imageanalysis of PET data with the aid of CT and MR images, in deGraaf CN, Viergever MA (eds): Information Processing inMedical Imaging. Planum Press: 1987, pp 601-611
45. Stokking R, Zuiderveld KJ, Viergever MA: Integratedvolume visualization of functional image data and anatomicalsurfaces using Normal Fusion. Hum Brain Map 12:203-218,2001
46. Habboush IH, Mitchell KD, Mulkern RV, et al: Regis-tration and alignment of three-dimensional images: An interac-tive visual approach. Radiology 199:573-578, 1996
47. Zifko GA, Slomka PJ, Young GB, et al: Brain mappingof median nerve somatosensory evoked potentials with com-bined 99mTcECD single-photon emission tomography andmagnetic resonance imaging. Eur J Nucl Med 23:579-582, 1996
48. Roolker W, van Buul MT, Broekhuizen A, et al: Im-proved wrist fracture localization with digital overlay of bonescintigrams and radiographs. J Nucl Med 38:1600-1603, 1997
49. Skalski J, Wahl RL, Meyer CR: Comparison of mutualinformation based warping accuracy for fusing body CT andPET by 2 methods: CT mapped onto PET emission scan versusCT mapped onto PET transmission scan. J Nucl Med 43:1184-1187, 2002
50. Zhang J, Levesque MF, Wilson CL, et al: Multimodalityimaging of brain structures for stereotactic surgery. Radiology175:435-441, 1990
51. Kapouleas I, Alavi A, Alves WM, et al: Registration ofthree-dimensional MR and PET images of the human brainwithout markers. Radiology 181:731-739, 1991
52. Maguire GQ, Noz M, Rusinek H, et al: Graphics appliedto medical image registration. IEEE Comp Graph Appl 11:20-28, 1991
53. Evans AC: Correlative imaging, in Wagner HJ, Szabo Z,Buchanan JW (eds): Principles of Nuclear Medicine. Philadel-phia, WB Saunders Co, 1995, pp 405-421
54. Matsuda H, Tsuji S, Shuke N, et al: Noninvasivemeasurements of regional cerebral blood flow using techne-tium-99m hexamethylprophylene amine oxime. Eur J Nucl Med20:391-401, 1993
55. Gandhe AJ, Hill DL, Studholme C, et al: Combined andthree-dimensional rendered multimodal data for planning cra-nial base surgery: A prospective evaluation. Neurosurgery35:463-471, 1994
56. Koral KF, Zasadny KR, Kessler ML, et al: CT-SPECTfusion plus conjugate views for determining dosimetry iniodine-131-monoclonal antibody therapy of lymphoma patients.J Nucl Med 35:1714-1720, 1994
57. Mangin J-F, Frouin V, Bloch I, et al: Fast nonsupervised3D registration of PET and MR images of the brain. J CerebrBlood F Met 14:749-762, 1994
58. Andersson JLR, Thurfjell LA: Multivariate approach toregistration of dissimilar tomographic images. Eur J Nucl Med26:718-733, 1999
59. Vera P, Kaminska A, Cieuta C, et al: Use of subtractionictal SPECT coregistered to MRI for optimizing the localizationof seizure foci in children. J Nucl Med 40:786-792, 1999
60. Jannin P, Fleig O, Seigneuret E, et al: A data fusionenvironment for multimodal and multi-informational neu-ronavigation. Comp Aided Surg 5:1-10, 2000
61. Lewis PJ, Siegel A, Siegel AM, et al: Does performingimage registration and subtraction in ictal brain SPECT helplocalize neocortical seizures. J Nucl Med 41:1619-1626, 2000
62. Graham MM, Muzi M, Spence AM, et al: The FDGlumped constant in normal human brain. J Nucl Med 43:1157-1166, 2002
63. Lee DS, Lee SK, Kim YK, et al: The usefulness ofrepeated ictal SPET for the localization of epileptogenic zonesin intractable epilepsy. Eur J Nucl Med 29:607-614, 2002
64. Faber TL, McColl RW, Opperman RM, et al: Spatial andtemporal registration of cardiac SPECT and MR images:Methods and evaluation. Radiology 179:857-861, 1991
65. Liehn J-C, Loboguerrero A, Perault C, et al: Superim-position of computed tomography and single photon emissiontomography immunoscintigraphic images in the pelvis: Valida-tion in patients with colorectal or ovarian carcinoma recurrence.Eur J Nucl Med 19:186-194, 1992
66. Perault C, Schvartz C, Wampach H, et al: Thoracic andabdominal SPECT-CT image fusion without external markersin endocrine carcinomas. J Nucl Med 38:1234-1242, 1997
67. Hamilton RJ, Blend MJ, Pelizzari CA, et al: Usingvascular structure for CT-SPECT registration in the pelvis.J Nucl Med 40:347-351, 1999
68. Pfluger T, Vollmar C, Wismuler A, et al: Quantitativecomparison of automatic and interactive methods for MRI-SPECT image registration of the brain based on 3- dimensionalcalculation of error. J Nucl Med 41:1823-1829, 2000
69. Hu X, Tan KK, Levin DN, et al: A volume renderingtechnique for integrated three-dimensional display of MR andPET data, in Hohne KH, Fuchs H, Pizer SM, (eds): 3D Imagingin Medicine. Berlin, Springer-Verlag, 1990, pp 379-397
70. Wallis JW: Three-dimensional display in SPECT imag-ing: Principles and applications, in Reiber JHC, van der WallEE (eds): Cardiovascular Nuclear Medicine and MRI, 89-100.Dordrecht, the Netherlands: Kluwer Academic Publishers,1992, pp 89-100
71. Stimac GK, Sundsten JW, Prothero JS, et al: Threedimensional contour surfacing of the skull, face, and brain fromCT and MR images and from anatomic sections. Am J Roent-genol 151:807-810, 1988
72. Wowra B, Schad L, Schlegel W, et al: Scopes ofcomputer application in stereotactic neurosurgery, in Lemke
226 STOKKING, ZUBAL, AND VIERGEVER
HU, Rhodes M, Jaffe C, et al (eds): Computer AssistedRadiology. Berlin, Springer-Verlag, 1989, pp 296-301
73. Ehricke H-H, Laub G: Combined 3D-display of cerebralvasculature and neuroanatomic structures in MRI, in HohneKH, Fuchs H, Pizer SM, (eds): 3D Imaging in Medicine. Berlin,Springer-Verlag, 1990, pp 229-239
74. Evans AC, Collins DL, Neelin P, et al: Computer-integrated surgery, in Taylor RH, Lavallee S, Burdea GC, et al(eds): Correlative Analysis of Three-Dimensional Brain Im-ages. Cambridge, MIT Press, 1996, pp 99-114
75. Parsai EI, Ayyanger KM, Dobelbower RR, et al: Clinicalfusion of three-dimensional images using BremsstrahlungSPECT and CT. J Nucl Med 38:319-324, 1997
76. Gering DT, Nabavi A, Kikinis R, et al: An integratedvisualization system for surgical planning and guidance usingimage fusion and an open MR. J Magn Reson Imaging13:967-975, 2001
77. Van den Elsen PA, Viergever MA, van Huffelen AC, etal: Accurate matching of electromagnetic dipole data with CTand MR images. Brain Topogr 3:425-432, 1991
78. Schiers C, Tiede U, Hohne KH: Interactive 3D registra-tion of image volumes from different sources, in Lemke HU,Rhodes M, Jaffe C, et al (eds): Computer Assisted Radiology.Berlin, Springer-Verlag, 1989, pp 666-670
79. Payne BA, Toga AW: Surface mapping brain functionon 3D models. IEEE Comput Graph 10:33-41, 1990
80. Valentino DJ, Mazziotta JC, Huang H: Volume render-ing of multimodal images: Application to MRI and PETimaging of the human brain. IEEE T Med Imaging 10:554-562,1991
81. Stokking R, Zuiderveld KJ, Hulshoff Pol HE, et al:Normal Fusion for three-dimensional integrated visualization ofSPECT and magnetic resonance brain images. J Nucl Med38:624-629, 1997
82. von Stockhausen H-M: 3D-visualisierung der Funktionund der Morphologie des menslichen Gehirns aus tomographis-
chen Daten. Doctoral thesis, University of Cologne, Germany,1998
83. Avery RA, Spencer SS, Studholme CS, et al: Reproduc-ibility of serial peri-ictal single-photon emission tomographydifference images in epilepsy patients undergoing surgicalresection. Eur J Nucl Med 27:50-55, 2000
84. Stokking R, Studholme CS, Spencer SS, et al: Epilepsyrelated perfusion changes in the peripheral cortex. J Nucl Med41:65P-66P, 2000 (abstr)
85. Zubal IG, Avery RA, Stokking R, et al: Ratio-imagescalculated from interictal positron emission tomography andsingle-photon emission computed tomography for quantifica-tion of the uncoupling of brain metabolism and perfusion inepilepsy. Epilepsia 41:1560-1566, 2000
86. Muzik O, da Silva EA, Juhasz C, et al: Intracranial EEGversus flumazenil and glucose PET in children with extratem-poral lobe epilepsy. Neurology 54:171-178, 2000
87. Hollander I: Mapping the brain cortex using an analyticalmodel of the head, in Yongmin K (ed): Medical Imaging: Imagedisplay. Proc SPIE 2431:478-489, 1995
88. Stokking R: Integrated visualization of functional andanatomical brain images. Doctoral thesis, Utrecht University,the Netherlands, 1998
89. Stokking R, van Isselt JW, van Rijk PP, et al: Integratedvisualization of functional and anatomic brain data: A valida-tion study. J Nucl Med 40:311-316, 1999
90. Pietrzyk U, Herholz K, Heiss W-D: Three-dimensionalalignment of functional and morphological tomograms. J Com-put Assist Tomogr 14:51-59, 1990
91. Pietrzyk U, Herholz K, Fink G, et al: An interactivetechnique for three-dimensional image registration: Validationfor PET, SPECT, MRI and CT brain studies. J Nucl Med35:2011-2018, 1994
92. Stokking R, Zubal IG, Viergever MA: Integrated visu-alization of functional and anatomical brain images. PhysicaMedica 17:259-265, 2001
227DISPLAY OF FUSED IMAGES
Copyright © 2022 FDOKUMEN