HUMAN PERFORMANCE IN AIR TRAFFIC CONTROL
347
HUMAN PERFORMANCE IN AIR TRAFFIC CONTROL TAMSYN EDWARDS, MSc. BSc. (hons.) Thesis submitted to the University of Nottingham for the degree of Doctor of Philosophy JANUARY 2013
-
Upload
khangminh22 -
Category
Documents
-
view
0 -
download
0
Transcript of HUMAN PERFORMANCE IN AIR TRAFFIC CONTROL
HUMAN PERFORMANCE IN AIR
TRAFFIC CONTROL
TAMSYN EDWARDS, MSc. BSc. (hons.)
Thesis submitted to the University of Nottingham for
the degree of Doctor of Philosophy
JANUARY 2013
Abstract
Air Traffic Controllers (ATCOs) are responsible for the safety and efficiency
of all air traffic. It is essential that controllers maintain a consistently high
standard of human performance in order to maintain flight safety.
Knowledge of human factor influences on controller performance is critical
to understand and mitigate threats to performance.
Previous research has largely focused on the association between
single factors and performance, which has resulted in a comprehensive
understanding of single factor influences. In current control environments
however, the residual threats for incidents often result from the interaction
of multiple human factors and the resulting cumulative impact on
performance. This thesis describes a set of studies that investigate the
relationship between multiple, co-occurring factors, and the association
with human performance. Findings contribute further understanding of
multifactor combinations and associations with human performance, and
provide novel and practical recommendations for the mitigation of
multifactor influences on controller performance.
A literature review, incident report analysis and survey of air traffic
professionals confirmed that a majority of research approaches were
fundamentally single-factor in nature, which is out of step with real air
traffic management (ATM) contexts. In addition, findings confirmed that
multiple factors co-occur in an air traffic control (ATC) environment, and
are associated with controller performance. An off-line experiment using
students as participants investigated the relationship between a set of
human factors and the association with performance. Results indicate that
several factors known to be associated with controller performance do co
vary and factors may interact to produce a cumulative Influence on
performance. An interview study with en-route controllers contributed to
an understanding of mitigation strategies of multifactor influences.
The research presented in this thesis has contributed findings that
have both theoretical and practical implications. This research has
addressed long-standing gaps within human performance literature and
contributed new understanding to the complex field of human performance
In air traffic control. Findings suggest that factors do co-occur in ATC, and
interact to negatively influence performance, pushing controllers to the
edge of performance. This research argues for a more ecologically valid
I
investigation of real-world systems using multiple factors rather than the
traditional one or two-factor paradigms. In addition, this research
investigation has contributed novel understanding of mechanisms which
may mitigate multifactor influences and has developed practical
recommendations for aviation personnel that may be used to support
performance, thereby preventing performance decline, with important
implications for maintaining and improving safety within the ATe domain.
II
Publications
Journal papers and conference proceeding papers by the author of this
thesis have been completed through the period of this PhD research.
These are listed below:
Journal papers
Edwards, T., Sharples, S., Wilson, J. R., and Kirwan, B. (2012). Factor
interaction influences on human performance in air traffic control: The
need for a multifactorial model. Work: A Journal of Prevention, Assessment
and Rehabilitation, 41(1), 159-166.
Millen, L., Edwards, T., Golightly, D., Sharples, S., Wilson, J. R., and
Kirwan, B. (2011). Systems change in transport control: applications of
cognitive work analysis. The International Journal of Aviation Psychology,
21(1), 62-84.
Conference proceedings
Edwards, T., Sharples, S., Wilson, J. R., and Kirwan, B. (2012). The need
for a multi-factorial approach to safe human performance in air traffic
control. Proceedings of the 4th AHFE International Conference, 21-2Sth July,
San Francisco: USA.
Edwards, T., Sharples, S., Wilson, J. R., and Kirwan, B. (2010). The need
for a multifactorial human performance envelope model in air traffic control.
Presented at the HCI-Aero 2010 conference, 3rd_Sth November, Cape
Canaveral: USA
Edwards, T., Sharples, S., Wilson, J. R., Kirwan, B., and Shorrock, S.T.
(2010). Towards a multifactorial human performance envelope model in air
traffic control. Presented at the Eurocontrol/FAA research and development
conference, 19th_20th October, Bretigny-sur-Orge: France
Sharples, S., Edwards, T., and Balfe, N. (2012). Inferring cognitive state
from observed interaction. Proceedings of the 4th AHFE International
Conference, 21-25th July, San Francisco: USA.
III
Acknowledgements
My thanks go to many people for the support that I have received
throughout this PhD. I wish to thank Dr. Barry Kirwan for his constant
support throughout this project. I am very grateful for his generosity with
his time, and for the invaluable guidance and feedback that he provided.
Thank you to Professor Sarah Sharples for her guidance at each stage of
the research, and also for her support during the more demanding phases!
Thank you to Professor John Wilson for providing me with the opportunity
of this PhD, and the help and guidance that he has offered throughout.
Thanks also go to EUROCONTROL for sponsoring this work.
A number of controllers and air navigation service providers (ANSPs)
have contributed to this research. Thanks go to the many controllers who
have taken the time to help me learn about this domain and contribute to
the research. In particular, I wish to thank Nigel Makins, Anna Wennerberg
and Ray Dowdall for their invaluable contributions and guidance
throughout and Anthony Smoker for his time and support. Thank you also
to NATS and Belgocontrol for supporting participation in research studies. I
am also exceptionally grateful to Maastricht Upper Area Control Centre for
supporting the final stage of this research. In particular, my thanks go to
Flemming Nyrup, Ellen Beckers and Luc Staudt for their significant
contribution to this research. I am extremely grateful to the controllers
who took part in the interview studies for their contribution and positive
feedback.
I also want to thank everyone in the University of Nottingham
Human Factors Research Group. It was a fantastic opportunity to work with,
and learn from, such knowledgeable and friendly people. Thank you for the
generosity with your time and for the numerous contributions to this PhD.
Thank you also for the numerous cups of tea and support!
I wish to thank my family and friends. In particular, I want to thank
Andrew for his complete support and encouragement and for his interest
when I talk about my research! Thanks also go to Nastaran, Kate, Shasta,
Alex and Victoria for their support. Finally, thank you to my family, and in
particular my parents, David and Maureen, for their limitless understanding,
support and encouragement.
IV
Table of contents "
Abstract ...................................................................................................................................................... I
Publications ............................................................................................................................................. III
Journal papers ................................................................................................................................... III
Conference proceedings ................................................... ~ ................................................................ III
Acknowledgements ................................................................................................................................. IV
Table of contents ...................................................................................................................................... V
List of figures ......................................................................................................................................... XII
List of tables ........................................................................................................................................... XV
A ppendices .......................................................................................................................................... XVII
Glossary ............................................................................................................................................ XVIII
Chapter 1. Introduction ........................................................................................................ 1
1.1 Research background ................................................................................................................ 1
1.2 Motivation for this thesis ........................................................................................................... 3
1.3 Thesis research question and aims ........................................................................................... 4
1.4 Initial selection of factors for investigation .............................................................................. 6
1.5 Overview of thesis ...................................................................................................................... 7
Chapter 2. Literature review of human factors in relation to performance and human
factor relationships in air traffic control ............................................................................................... 11
2.1 Chapter overview ..................................................................................................................... 11
2.2 Single factors and associations with performance ................................................................ 12
2.2.1 Factors resulting from Interactions between individual and environment ................ 12
2.2.2 Factors referring to cognitive processes ....................................................................... 26
2.2.3 Factors resUlting from individuals acting within a team environment ...................... 38
2.2.4 Implications of literature review findings relating to human factor associations with performance ................................................................................................................................. 50
2.3 Human factor interactions: A review of human factor relationships and associations with performance .•......•............................•................•..••..•.......................................•.•....•.•........••...•...•...... 51
2.3.1 Factors resulting from interactions between individual and environment ................ Sl
2.3.2 Factors referring to cognitive processes ....................................................................... 60
2.3.3 Factors resulting from individuals acting within a team environment ...................... 66
2.3.4 Implications of literature review findings relating to multifactor Influences ............ 71
2.3.5 Summary of working definitions of factors .................................................................. 72
v
2.4 Conclusion ................................................................................................................................ 72
2.S Chapter summary .................................................................................................................... 73
Chapter 3. Understanding air traffic control .................................................................... 75
3.1 Chapter overview ..................................................................................................................... 75
3.2 Air traffic control in context ................................................................................................... 75
3.3 Air traffic management (A TM) system .................................................................................. 75
3.4 Air traffic control ..................................................................................................................... 77
3.4.1 Air traffic control and airspace design ......................................................................... 77
3.4.2 Types of air traffic control ............................................................................................. 78
3.5 En-route control task ............................................................................................................... 80
3.5.1 Standardised/regulated tasks ......................................................................................... 80
3.5.2 Cognitive elements of an en-route control task ............................................................ 80
3.5.3 Orchestration of traffic: personal control styles conducted within strict regulations •• ................................................................................................................................. 81
3.6 Selection and training of en-route controllers ....................................................................... 82
3.7 En-route control operations environment ............................................................................. 82
3.7.1 Teams and coordination within air traffic control ...................................................... 82
3.7.2 Intra-cooperation between controllers .......................................................................... 83
3.7.3 Inter-cooperation between controllers .......................................................................... 84
3.8 Communication as an essential element of the air traffic control system ........................... 84
3.9 Physical systems used in the air traffic control task ............................................................. 85
3.10 Familiarisation with the air traffic control domain .............................................................. 87
3.10.1 The need for familiarisation with the ATC domain ..................................................... 87
3.10.2 Generation of visits to control centres .......................................................................... 87
3.10.3 Summary of ATC-related Information pertinent to future research ......................... 88
3.11 Chapter summary .................................................................................................................... 93
Chapter 4. Methodological approach and research framework ...................................... 94
4.1 Chapter overview ...................................................................................................................... 94
4.2 Overall research approach ...................................................................................................... 94
4.2.1 Research studies built upon previous findings ............................................................. 94
4.2.2 Multiple sources of data addressed research aims ....................................................... 94
4.3 Research framework ............................................................................................................... 95
4.4 Overview of the methods used in this thesis .......................................................................... 97
VI
4.4.1 Research phase 1: Background and context ................................................................. 97
4.4.2 Research phase 2: Factor confirmation and selection ................................................. 98
4.4.3 Research phase 3: Experimental investigation of factor relationships in association with performance and the edges of performance ....................................................................... 99
4.4.4 Research phase 4: Investigation of indicators of potential performance decline .... 100
4.4.5 Discussion, conclusions and recommendations .......................................................... 100
4.5 Chapter summary .................................................................................................................. 101
ChapterS. Literature metrics and incident report analysis: Confirmation of key human
factors and human factor relationships ............................................................................................... 102
5.1 Chapter overview ................................................................................................................... 102
5.2 Literature analysis ................................................................................................................. 102
5.2.1 Literature analysis: Aims ............................................................................................. 102
5.2.2 Literature analysis: Differentiation between attention, vigilance and SA ............... 103
5.2.3 Literature analysis: Method ........................................................................................ 103
5.2.4 Literature analysis: Results ......................................................................................... 106
5.2.5 Discussion ...................................................................................................................... 109
5.2.6 Conclusions and next steps .......................................................................................... 111
5.3 A viation incident reports analysis ........................................................................................ 112
5.3.1 Incident report analysis: Background ........................................................................ 112
5.3.2 Incident report analysis: Boundaries of focus ............................................................ 113
5.3.3 Incident report analysis: Aims .................................................................................... 113
5.3.4 Incident report analysis: Description of database and task ...................................... 113
5.3.5 Incident report analysis: Method ................................................................................ 114
5.3.6 Incident report analysis: Results ................................................................................. 118
5.3.7 Discussion ...................................................................................................................... 123
5.4 Concluding remarks .............................................................................................................. 125
S.S Chapter summary ..............................................•................................................................... 126
Chapter 6. Expert knowledge elicitation of human factors in relation to performance ....
. ......................................................................................................................... 127
6.1 Chapter overview ................................................................................................................... 127
6.2 Expert knowledge elicitation: Aims ..................................................................................... 128
6.3 Selection of knowledge elicitation methodology .................................................................. 128
6.4 Selection of knowledge elicitation exercise .......................................................................... 129
VII
6.4.1 Exercise selection for aim 1: Factors that most negatively influence controller performance ............................................................................................................................... 129
6.4.2 Exercise selection for aim 2: Most frequent factor dyads which negatively influence controller performance .............................................................................................................. 130
6.5 Pilot study ............................................................................................................................... 131
6.5.1 Pilot study: Methodology ............................................................................................. 131
6.5.2 Pilot study: Results and discussion ............................................................................. 132
6.5.3 Conclusions ................................................................................................................... 133
6.5.4 Retinement of factors included for investigation based on pilot study tindings ...... 133
6.5.5 Summary of tindings from the pilot study pertinent to the next research study ..... 134
6.6 Survey questionnaire: Knowledge elicitation ...................................................................... 135
6.6.1 Questionnaire: Method ................................................................................................ 135
6.6.2 Results: Survey questionnaire section 1 ...................................................................... 139
6.6.3 Results: Survey questionnaire section 2 ...................................................................... 143
6.6.4 Questionnaire: Discussion ............................................................................................ 146
6.7 Chapter summary .................................................................................................................. 147
Chapter 7. Selection of experimental factors ................................................................... 149
7.1 Chapter overview ................................................................................................................... 149
7.2 Summary of previous studies and associated tindings ........................................................ 149
7.3 Comparison of results from a literature analysis, incident report analysis and survey-questionnaire .................................................................................................................................... 150
7.3.1 Comparison of results: Single factors most frequently reported, and most frequently reported to have a negative association with performance ..................................................... 150
7.3.2 Comparison of results: Frequency of factor dyads identified to co-occur, and the association with performance .................................................................................................... 151
7.4 Selection of subgroup of factors for inclusion in the next research phase ......................... 153
7.5 Next research phase: Experimental study ........................................................................... 155
7.6 Chapter summary .................................................................................................................. 155
ChapterS. Experiment method ........................................................................................ 156
8.1 Chapter overview ................................................................................................................... 156
S.2 Experiment: Aim and experimental questions .................................................................... 156
8.3 Pre-experimental considerations .......................................................................................... lS7
8.3.1 Experiment task design considerations ...................................................................... 157
8.3.2 Experiment: Measures ................................................................................................. 158
8.3.3 Experiment: Application of measures ........................................................................ 160
VIII
8.3.4 Experiment task .....................................................................................................•...... 161
8.4 Pilot experiment ..................................................................................................................... 164
8.4.1 Aims of pilot experiment .............................................................................................. 164
8.4.2 Pilot experiment: Method ............................................................................................ 164
8.4.3 Pilot experiment: Results and discussion .................................................................... 165
8.4.4 Conclusions ................................................................................................................... 166
8.5 Training for participants on the experimental task computer program ........................... 167
8.6 Experiment method ............................................................................................................... 168
8.6.1 Design ............................................................................................................................ 168
8.6.2 Participant details ........................................................................................................ 170
8.6.3 Measures and materials ............................................................................................... 170
8.6.4 Experiment study: Measures ....................................................................................... 171
8.6.5 Materials ....................................................................................................................... 172
8.6.6 Equipment ..............•...................................................................................................... 173
8.6.7 Pr()Cedure ...................................................................................................................... 17 S
8.6.8 Experimental hypotheses ............................................................................................. 176
8.6.9 Experiment study: measurement periodicity and implications for analysis ............ 177
8.7 Chapter summary .................................................................................................................. 178
Chapter 9.
performance
Experiment results: Multiple factor relationships and associations with
. ......................................................................................................................... 179
9.1 Chapter overview ....................................................................................•.............................. 179
9.2 Overview of experimental results ......................................................................................... 179
9.2.1 Taskload variation and manipulation check .............................................................. 179
9.2.2 Single factor variations with taskload ......................................................................... 180
9.2.3 Discussion of taskload manipulation and measured factor variations across the study task .............................•..........................•...................................................................... 184
9.2.4 Performance across the study task .............................................................................. 184
9.2.5 Discussion of performance measures across the study task ...................................... 186
9.3 Single factor associations with performance ....................................................................... 187
9.3.1 Presentation of results .................................................................................................. 187
9.3.2 The relationship between workload and performance measures ............................. 187
9.3.3 The relationship between fatigue and performance measures .................................. 189
9.3.4 The relationship between stress and performance measures .................................... 190
9.3.5 The relationship between arousal and performance measures ................................. 191
IX
9.3.6 The relationship between situation awareness and performance measures ............ 192
9.3.7 Discussion of the relationship between single factors and performance measures .194
9.4 Does covariance between factors exist? ............................................................................... 195
9.4.1 Presentation of results .................................................................................................. 195
9.4.2 The relationship between workload and other factors (fatigue, stress, arousal, SA195
9.4.3 The relationship between fatigue and other factors (stress, arousal, SA) ................ 196
9.4.4 The relationship between stress and arousal. ............................................................. 197
9.4.5 The relationship between arousal and SA .................................................................. 198
9.4.6 Discussion of the relationship between factor dyads ................................................. 198
9.5 The relationship between multiple factors and performance ............................................. 199
9.5.1 Review of potentially relevant statistical approaches ................................................ 199
9.5.2 Procedure of applying median splits ........................................................................... 201
9.5.3 Presentation of results .................................................................................................. 202
9.5.4 Multifactor associations with performance - a cumulative effect? .......................... 203
9.5.5 Discussion of the association between multiple factors and performance ............... 209
9.6 The shape of the edge of performance associated with multi factor co-occurrences ......... 212
9.6.1 Presentation of results .................................................................................................. 212
9.6.2 The shape of performance and the performance edge .............................................. 212
9.6.3 Safety-related performance and efficiency-related performance may be prioritised differently ............................................................................................................................... 216
9.6.4 Discussion of the shape of performance decline in association with multiple factors ... ............................................................................................................................... 217
9.7 The association between posture and measured factors ..................................................... 218
9.7.1 Discussion of the association between posture and measured factors ...................... 220
9.8 Overall discussion of findings in association with research aims and hypotheses ............ 220
9.9 Chapter summary .................................................................................................................. 221
Chapter 10. Indicators of potential performance decline: Findings from an experiment
study and interview study ..................................................................................................................... 222
10.1 Chapter Overview .................................................................................................................. 222
10.2 Continuation of experimental study findings: Observed participant behaviours ............ 222
10.2.1 Observed participant behaviours: Method ................................................................ 222
10.2.2 Observed participant behaviours: Process to refine observed behaviours as indicators of potential performance decline ............................................................................. 222
10.2.3 Refined set of behavioural indicators ......................................................................... 224
10.2.4 Observed participant behaviours: Statistical analysis approach ............................. 225
X
10.2.S Observed participant behaviours: Results and discussion ........................................ 226
10.3 Interview study with en-route air traffic controllers .......................................................... 229
10.3.1 Interview study: Aims .................................................................................................. 229
10.3.2 Pilot study: Focus groups ............................................................................................. 229
10.3.3 Semi-structured Interviews ......................................................................................... 233
10.4 Chapter summary .................................................................................................................. 258
Chapter 11. Discussion ....................................................................................................... 259
11.1 Chapter overview, .................................................................................................................. 259
11.2 The changing landscape of human factors included for consideration In different research stages •........................................................•.............................................................................. 259
11.3 Reflections on research aims ................................................................................................. 260
11.3.1 Identify a set of human factors that Influence air traffic controller (A TCO) performance .......................................................................................................................... 260
11.3.2 Select a sub-group of factors that may be Included In further studies ..................... 263
11.3.3 Investigate the relationships and potential interactions between multiple, selected human factors .......................................................................................................................... 265
11.3.4 Investigate the association of multiple factor relationships with human performance ..............................................................................................................•........... 267
11.3.S Inform fundamental understanding of A TCO behaviour at the edge of performance • •••.•••••••••••..••.•...•.••.••.•••..•••••••••••••••••••.••.••••••.••••••.•.•••••••••.•••••••.•••••..•.•..•••••.•••••.•••• 269
11.3.6 Identify indicators of potential performance decline ................................................. 270
11.4 Other findings pertinent to this thesis: Similarities and differences between factors ...... 272
11.5 Progression 01 validation ....................................................................................................... 274
11.6 Reflections on approach and methods ................................................................................. 274
11.7 Contributions resulting from this thesis .............................................................................. 276
11.8 Limitations of the research ................................................................................................... 277
11.9 Suggestions for future research ............................................................................................ 278
11.10 Recommendations .................................................................................................................. 281
11.11 Concluding statement ............................................................................................................ 282
References .............................................................................................................................................. 283
A ppendices .....................................................................................•....................................................... 303
XI
List of figures
Figure 1.1. Initial representation ofa the 'edge of performance' ............................................... .4 Figure 1.2. Thesis structure and research framework ................................................................. 8 Figure 2.1. Categorisation of factors based on data trends identified in the literature review .. 12 Figure 3.1. The hierarhcial structure of air traffic management elements, including air traffic control ....................................................................................................................................... 76 Figure 3.2. Process of aircraft flight phases .............................................................................. 79 Figure 3.3. High level en-route ATC tasks for each aircraft ..................................................... 80 Figure 3.4. En-route control room ............................................................................................. 85 Figure 3.5. An abstraction hierarchy of the ATC domain ......................................................... 86 Figure 4.1. Research framework ............................................................................................... 96 Figure 4.2. Methods used to elicit and confirm, refine and select factors that influence A TCO performance .............................................................................................................................. 98 Figure 5.1. Industrial contexts of 58 papers ............................................................................ 105 Figure 5.2. Methodological approach of 83 papers ................................................................. 105 Figure 5.3. Frequencies of research papers relating to factor interactions .............................. 108 Figure 5.4. Percentage of incidents classified by reported cause ............................................ 119 Figure 6.1. Example of forced ranking exercise question with lead factor ............................. 130 Figure 6.2. A rating scale exercise for the most frequent factor dyads to negatively influence ATCO performance ................................................................................................................ 137 Figure 6.3. A ranking exercise of the factors dyads that are perceived to most negatively influence controller performance ............................................................................................ 138 Figure 8.1. Airspace sector used in the study task .................................................................. 161 Figure 8.2. Correct process in the simulation and possibilities for error occurrences ............. 163 Figure 8.3. High level en-route ATC tasks for each aircraft ................................................... 163 Figure 8.4. Diagram presenting design of study, in terms of IVs, DVs and covariates .......... 168 Figure 8.5. Number of aircraft in sector and number of aircraft in sector requiring vertical movement by minute ............................................................................................................... 169 Figure 8.6. Measure periodicity per 4 minute interval ............................................................ 171 Figure 8.7. Pictures of experimental set up: Researcher's view .............................................. 174 Figure 8.8. Pictures of experimental set up: Participant'S view .............................................. 174 Figure 8.9. Hypothesised performance shape using hypothetical data - gradual performance decline ..................................................................................................................................... 177 Figure 8.10. Hypothesised performance shape using hypothetical data - maintained performance followed by a sudden decline ............................................................................. 177 Figure 8.11. Hypothesised performance shape using hypothetical data - maintained performance, gradual decline followed by a steep decline ..................................................... 177 Figure 9.1. Taskload across the study task by minute, represented by number of aircraft in sector and number of aircraft in sector requiring vertical movement.. .................................... 180 Figure 9.2. Self reported workload throughout simulation every four minutes ...................... 180 Figure 9.3. Self reported fatigue throughout experiment measured alternately every 11th or 13th minute ............................................................................................................................. 180 Figure 9.4. Self reported stress throughout experiment measured alternately every 11th or 12th minute ..................................................................................................................................... 181 Figure 9.5. Self reported arousal throughout experiment measured alternately every 11 th or 12th minute ............................................................................................................................. 181 Figure 9.6. SA: Time in seconds to respond accurately to SPAM questions averaged over 4 minute periods ......................................................................................................................... 181 Figure 9.7. Posture averaged over 4 minute periods ............................................................... 181 Figure 9.8. Heart rate averaged overall 4 minute periods ....................................................... 182 Figure 9.9. Frequency of STCAs averaged over 4 minute periods ......................................... 185 Figure 9.10. Frequency of route directs averaged over 4 minute periods ............................... 185 Figure 9.11. Time to assume aircraft in seconds, averaged over 4 minute periods ................. 185 Figure 9.12. Response time to offered aircraft in seconds, averaged over 4 minute periods .. 185 Figure 9.13. Time to assume aircraft and respond to offered aircraft ..................................... 185 Figure 9.14. Scatterplot of STCA frequency against workload .............................................. 188
XII
Figure 9.15. Scatterplot of route direct frequency against workload ...................................... 188 Figure 9.16. Scatterplot oftime to assume aircraft against workload ..................................... 188 Figure 9.17. Scatterplot oftime to respond to offered aircraft against workload .................... 188 Figure 9.18. Scatterplot of STCA frequency against fatigue .................................................. 189 Figure 9.19. Scatterplot of route direct frequency against fatigue .......................................... 189 Figure 9.20. Scatterplot of time to assume aircraft against fatigue ......................................... 189 Figure 9.21. Scatterplot of time to respond to offered aircraft against fatigue ........................ 189 Figure 9.22. Scatterplot ofSTCA frequency against stress .................................................... 190 Figure 9.23. Scatterplot of route direct frequency against stress ............................................ 190 Figure 9.24. Scatterplot of time to assume aircraft against stress ........................................... 190 Figure 9.25. Scatterplot of time to respond to offered aircraft against stress .......................... 190 Figure 9.26. Scatterplot of STCA frequency against arousal .................................................. 191 Figure 9.27. Scatterplot of route direct frequency against arousaL ........................................ 191 Figure 9.28. Scatterplot of time to assume aircraft against arousal.. ....................................... 192 Figure 9.29. Scatterplot oftime to respond to offered aircraft against arousal ....................... 192 Figure 9.30. Scatterplot of STCA frequency against SA ........................................................ 193 Figure 9.31. Scatterplot of route direct frequency against SA ................................................ 193 Figure 9.32. Scatterplot of time to assume aircraft against SA ............................................... 193 Figure 9.33. Scatterplot of time to respond to offered aircraft against SA .............................. 193 Figure 9.34. Scatterplot of fatigue against workload .............................................................. 195 Figure 9.35. Scatter plot of stress against workload ................................................................ 195 Figure 9.36. Scatterplot of arousal against workload .............................................................. 196 Figure 9.37. Scatterplot of stress against fatigue .................................................................... 196 Figure 9.38.Scatterplot of arousal against fatigue ................................................................... 196 Figure 9.39. Scatterplot of SA against fatigue ........................................................................ 197 Figure 9.40. Scatterplot of arousal against stress .................................................................... 197 Figure 9.41. Scatterplot of SA against arousal ........................................................................ 198 Figure 9.42. Scatterplot of SA against workload and the association with frequency of STCAs, per participant across high taskload 1 ..................................................................................... 204 Figure 9.43. Median split application to scatterplot data: bar chart showing the average performance (frequency of STCAs) under different levels of workload and SA in high taskload 1 .............................................................................................................................................. 205 Figure 9.44. Scatterplot of arousal against stress and the associated performance of time to assume aircraft, per participant across the full simulation ...................................................... 206 Figure 9.45: Median split application to scatterplot data: bar chart showing the average performance (time taken to assume aircraft) under different levels of stress and arousal in high taskload 1 ................................................................................................................................ 206 Figure 9.46. Bar chart showing average performance (frequency of route directs) under different levels of fatigue, arousal and SA in high taskload 2 ................................................ 207 Figure 9.47. Bar chart showing the average performance (time to assume aircraft) under different levels of stress and SA, high taskload 1 ................................................................... 208 Figure 9.48. Bar chart showing the average performance (time to assume aircraft) under different levels of fatigue, stress and SA on reaction time to assume aircraft, high taskload 1 ................................................................................................................................................ 209 Figure 9.49. Hypothesised performance shape using hypothetical data - gradual performance decline ..................................................................................................................................... 212 Figure 9.50. Hypothesised performance shape using hypothetical data - maintained performance followed by a sudden decline ............................................................................. 212 Figure 9.51. Hypothesised performance shape using hypothetical data - maintained performance, gradual decline followed by a steep decline ..................................................... 212 Figure 9.52. Average performance (frequency of route directs) under different levels of workload, arousal and SA, high taskload ................................................................................ 213 Figure 9.53. Average performance (time to respond to offered aircraft) under different levels of fatigue, stress and arousal in high taskload 1 .......................................................................... 214 Figure 9.54. Average performance (frequency of STCAs) under different levels of stress, arousal and SA in high taskload 1 ........................................................................................... 215 Figure 9.55. Average performance (frequency of STCAs) under different levels of workload, stress and SA on frequency of STCAs, high taskload 1 .......................................................... 216
XIII
Figure 9.56. Average performance (frequency of STCAs, frequency of route directs) under different levels of workload, stress and SA on frequency of STCAs and route directs, high taskload 2 ................................................................................................................................ 217 Figure 9.57. Scatterplot of posture against workload .............................................................. 219 Figure 9.58. Scatterplot of posture against stress .................................................................... 219 Figure 9.59. Impact of stress and arousal on posture, high taskload 1 .................................... 219 Figure 1 O.l.Categorisation of indicators produced from qualitative data ............................... 238 Figure 10.2. Diagram of performance and demand with associated indicators and controllers' subjective experience .............................................................................................................. 253 Figure 10.3. Representation of a barrier model of performance protection in association with marker awareness and compensation strategy ........................................................................ 254 Figure 11.1. A representation of the findings from the literature review and incident report analysis relating to relative factor frequencies ........................................................................ 264
XIV
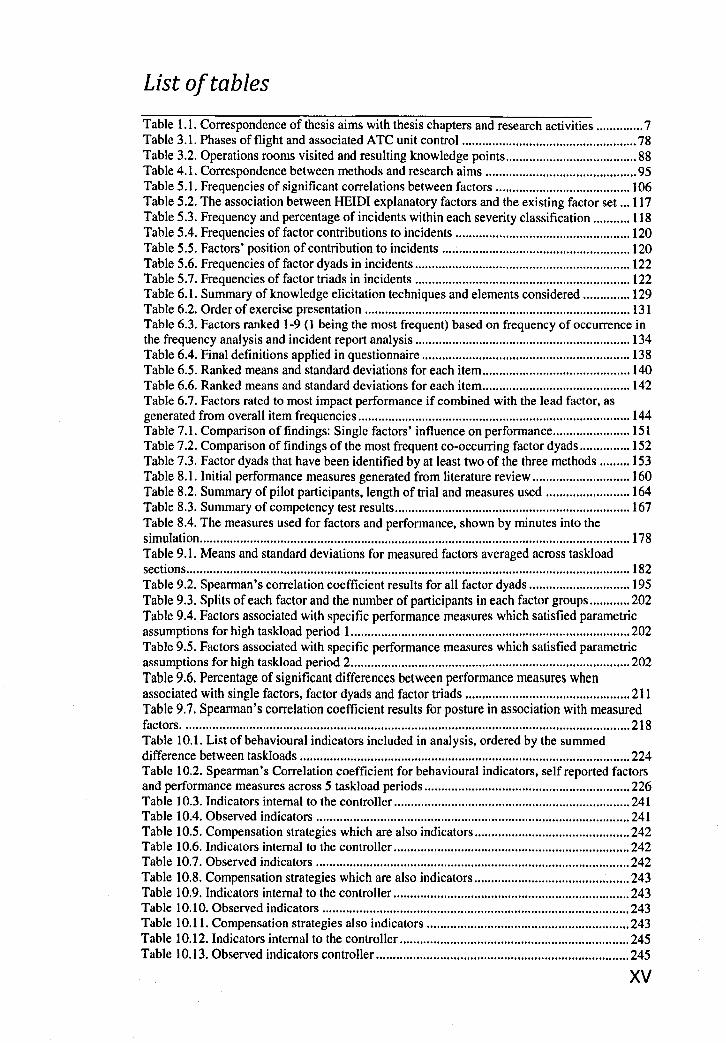
List of tables
Table 1.1. Correspondence of thesis aims with thesis chapters and research activities .............. 7 Table 3.1. Phases of flight and associated ATC unit control .................................................... 78 Table 3.2. Operations rooms visited and resulting knowledge points ....................................... 88 Table 4.1. Correspondence between methods and research aims ............................................. 95 Table 5.1. Frequencies of significant correlations between factors ........................................ 106 Table 5.2. The association between HEIDI explanatory factors and the existing factor set ... 117 Table 5.3. Frequency and percentage of incidents within each severity classification ........... 118 Table 5.4. Frequencies of factor contributions to incidents .................................................... 120 Table 5.5. Factors' position of contribution to incidents ........................................................ 120 Table 5.6. Frequencies of factor dyads in incidents ................................................................ 122 Table 5.7. Frequencies of factor triads in incidents ................................................................ 122 Table 6.1. Summary of knowledge elicitation techniques and elements considered .............. 129 Table 6.2. Order of exercise presentation ............................................................................... 131 Table 6.3. Factors ranked 1-9 (1 being the most frequent) based on frequency of occurrence in the frequency analysis and incident report analysis ................................................................ 134 Table 6.4. Final definitions applied in questionnaire .............................................................. 138 Table 6.5. Ranked means and standard deviations for each item ............................................ 140 Table 6.6. Ranked means and standard deviations for each item ............................................ 142 Table 6.7. Factors rated to most impact performance if combined with the lead factor, as generated from overall item frequencies ................................................................................. 144 Table 7.l. Comparison of findings: Single factors' influence on performance ....................... 151 Table 7.2. Comparison of findings of the most frequent co-occurring factor dyads ............... 152 Table 7.3. Factor dyads that have been identified by at least two of the three methods ......... 153 Table 8.1. Initial performance measures generated from literature review ............................. 160 Table 8.2. Summary of pilot participants, length oftrial and measures used ......................... 164 Table 8.3. Summary of competency test results ...................................................................... 167 Table 8.4. The measures used for factors and performance, shown by minutes into the simulation ................................................................................................................................ 178 Table 9.1. Means and standard deviations for measured factors averaged across taskload sections .................................................................................................................................... 182 Table 9.2. Spearman's correlation coefficient results for all factor dyads .............................. 195 Table 9.3. Splits of each factor and the number of participants in each factor groups ............ 202 Table 9.4. Factors associated with specific performance measures which satisfied parametric assumptions for high taskload period 1 ................................................................................... 202 Table 9.5. Factors associated with specific performance measures which satisfied parametric assumptions for high taskload period 2 ................................................................................... 202 Table 9.6. Percentage of significant differences between performance measures when associated with single factors, factor dyads and factor triads ................................................. 211 Table 9.7. Spearman's correlation coefficient results for posture in association with measured factors ..................................................................................................................................... 218 Table 10.1. List of behavioural indicators included in analysis, ordered by the summed difference between taskloads .................................................................................................. 224 Table 10.2. Spearman's Correlation coefficient for behavioural indicators, self reported factors and performance measures across 5 taskload periods ............................................................. 226 Table 10.3. Indicators internal to the controller ...................................................................... 241 Table 10.4. Observed indicators ............................................................................................. 241 Table 10.5. Compensation strategies which are also indicators .............................................. 242 Table 10.6. Indicators internal to the controller ...................................................................... 242 Table 10.7. Observed indicators ............................................................................................. 242 Table 10.8. Compensation strategies which are also indicators .............................................. 243 Table 10.9. Indicators internal to the controller ...................................................................... 243 Table 10.10. Observed indicators ........................................................................................... 243 Table 10.11. Compensation strategies also indicators ............................................................ 243 Table 10.12. Indicators internal to the controller .................................................................... 245 Table 10.13. Observed indicators controller ........................................................................... 245
XV
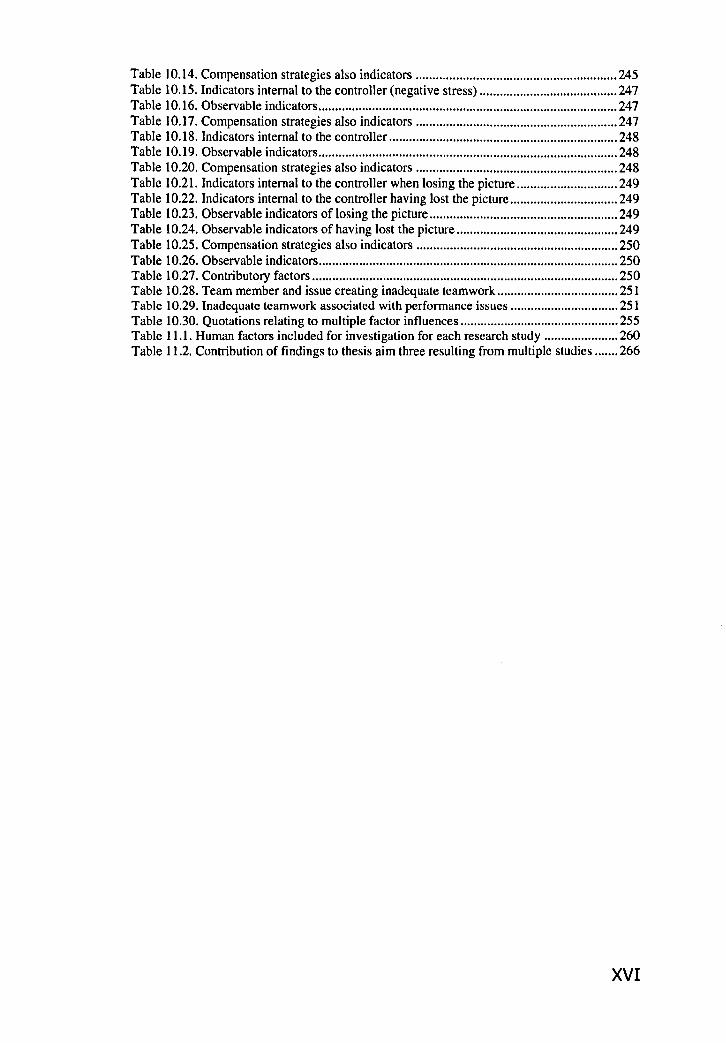
Table 10.14. Compensation strategies also indicators ............................................................ 245 Table 10.15. Indicators internal to the controIIer (negative stress) ......................................... 247 Table 10.16. Observable indicators ......................................................................................... 247 Table 10.17. Compensation strategies also indicators ............................................................ 247 Table 10.18. Indicators internal to the controIIer .................................................................... 248 Table 10.19. Observable indicators ......................................................................................... 248 Table 10.20. Compensation strategies also indicators ............................................................ 248 Table 10.21. Indicators internal to the controIIer when losing the picture .............................. 249 Table 10.22. Indicators internal to the controIIer having lost the picture ................................ 249 Table 10.23. Observable indicators of losing the picture ........................................................ 249 Table 10.24. Observable indicators of having lost the picture ................................................ 249 Table 10.25. Compensation strategies also indicators ............................................................ 250 Table 10.26. Observable indicators ......................................................................................... 250 Table 10.27. Contributory factors ........................................................................................... 250 Table 10.28. Team member and issue creating inadequate teamwork .................................... 251 Table 10.29. Inadequate teamwork associated with performance issues ................................ 251 Table 10.30. Quotations relating to multiple factor influences ............................................... 255 Table 11.1. Human factors included for investigation for each research study ...................... 260 Table 11.2. Contribution of findings to thesis aim three resulting from multiple studies ....... 266
XVI
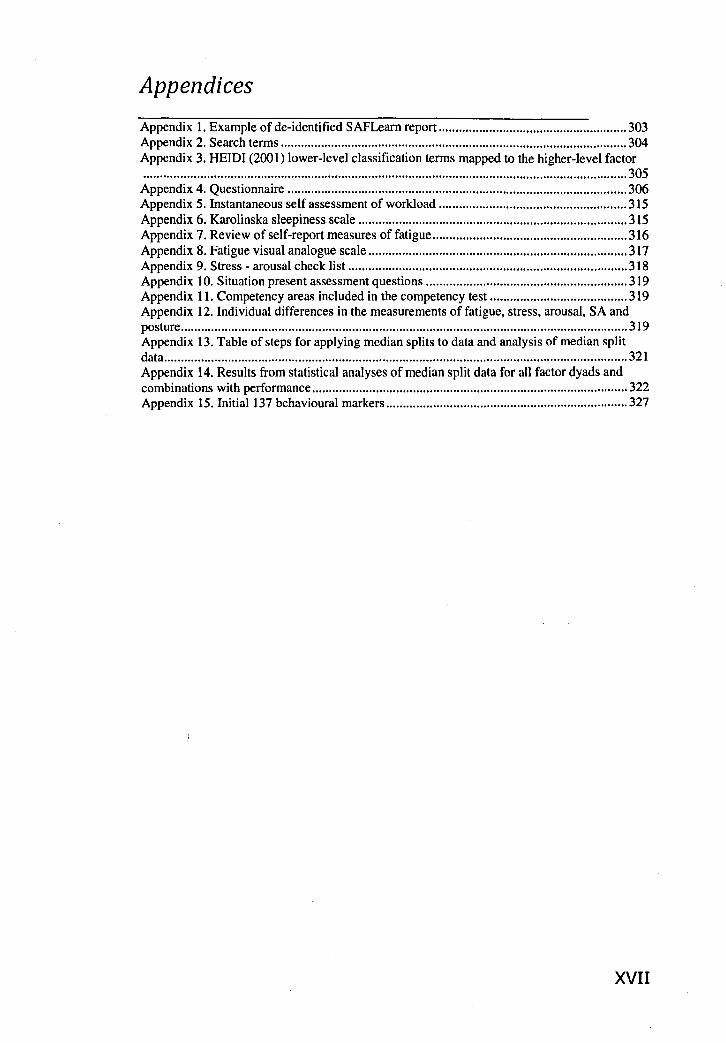
Appendices
Appendix 1. Example of de-identified SAFLearn report ........................................................ 303 Appendix 2. Search terms ....................................................................................................... 304 Appendix 3. HEIDI (2001) lower-level classification terms mapped to the higher-level factor ................................................................................................................................................ 305 Appendix 4. Questionnaire ..................................................................................................... 306 Appendix 5. Instantaneous self assessment of workload ........................................................ 315 Appendix 6. Karolinska sleepiness scale ................................................................................ 315 Appendix 7. Review of self-report measures of fatigue .......................................................... 316 Appendix 8. Fatigue visual analogue scale ............................................................................. 317 Appendix 9. Stress - arousal check list ................................................................................... 318 Appendix 10. Situation present assessment questions ............................................................ 319 Appendix 11. Competency areas included in the competency test ......................................... 319 Appendix 12. Individual differences in the measurements of fatigue. stress. arousal. SA and posture ..................................................................................................................................... 319 Appendix 13. Table of steps for applying median splits to data and analysis of median split data .......................................................................................................................................... 321 Appendix 14. Results from statistical analyses of median split data for all factor dyads and combinations with performance .............................................................................................. 322 Appendix 15. Initial 137 behavioural markers ........................................................................ 327
XVII
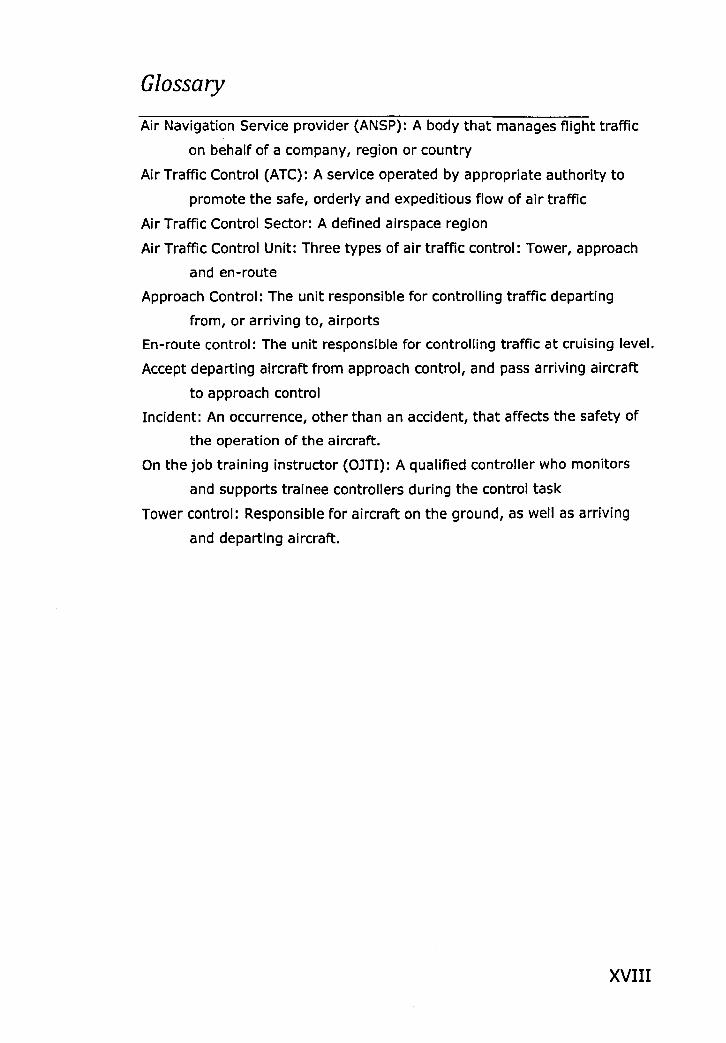
Glossary
Air Navigation Service provider (ANSP): A body that manages flight traffic
on behalf of a company, region or country
Air Traffic Control (ATC): A service operated by appropriate authority to
promote the safe, orderly and expeditious flow of air traffic
Air Traffic Control Sector: A defined airspace region
Air Traffic Control Unit: Three types of air traffic control: Tower, approach
and en-route
Approach Control: The unit responsible for controlling traffic departing
from, or arriving to, airports
En-route control: The unit responsible for controlling traffic at cruising level.
Accept departing aircraft from approach control, and pass arriving aircraft
to approach control
Incident: An occurrence, other than an accident, that affects the safety of
the operation of the aircraft.
On the job training instructor (OJTI): A qualified controller who monitors
and supports trainee controllers during the control task
Tower control: Responsible for aircraft on the ground, as well as arriving
and departing aircraft.
XVIII
Chapter 1. Introduction
Chapter 1. Introduction
1.1 Research background
Air traffic control (ATC) is a safety critical environment (Chang & Yeh,
2010). Air Traffic Controllers (ATCOs) are responsible for the safety and
efficiency of all air traffic. Unlike other safety critical industries, there are
no physical barriers or defence that protect aircraft in flight. It is therefore
essential that controllers maintain a consistently high standard of human
performance in order to maintain flight safety. Threats to human
performance must be understood and mitigated to maintain flight safety
and efficiency in an environment of growing traffic and performance
demands.
With a large potential for incidents, Kirwan (2011) suggests that Air
Traffic Management (ATM) is remarkably reliable. However, when aircraft
have breached standard regulated minima, termed an 'incident', human
error has been attributed as a primary or secondary cause in 75-90% of
cases (Mackieh & Cilingir, 1998). Human factors (such as workload, fatigue,
inadequate communications) are "major determiners of a human error"
(Park & lung, 1996, p330) and have been repeatedly shown to negatively
affect human performance (Chang & Yeh, 2010; Park & lung, 1996). A
comprehensive and context-specific knowledge of the association between
human factors and human performance is therefore critical in addressing
safety incidents in air traffic control.
for more than three decades, human performance and error
research has investigated the influence of single human factors (such as
fatigue or mental workload) on human performance in a wide variety of
settings (Loft, Sanderson, Neal & Mooij, 2007; Svensson, Angelborg
Thanderz, Sjoberg, & Olsson, 1997). For example, Schroeder, Rosa and
Witt (1998) investigated the effects of fatigue on performance In air traffic
controllers. Results showed that individual performance measures declined
in association with increased self-reported fatigue as controllers progressed
through the four day schedule. Such focused research has resulted in a
body of literature and comprehensive understanding of the association
between single human factors and performance. As a result of this
knowledge, within the ATC context, single factor issues such as fatigue,
vigilance, and situation awareness problems have now largely been
1
Chapter 1. Introduction
designed out or sufficiently mitigated by design, operational and Human
Factors and Safety expertise.
However, in current control environments factors do not occur in
isolation. It is colloquially recognised that multiple human factors may be
present at anyone time. For example, a high workload may be
experienced by a controller who is fatigued or stressed, and co-occurs with
inadequate communication (e.g. incorrect phraseology) or teamwork (e.g.
unexpected handovers). These co-occurring factors may interact to
negatively influence controller performance differently to that of single
factors alone. This is supported by the recognition that ATC incidents are
often reported as being multi-causal in nature, or are seen as having no
direct causes but many contributors, as highlighted by so-called 'Swiss
Cheese' and Resilience Engineering models (e.g. Hollnagel, Woods &
Leveson, 2006; Reason, 1990). The residual threats for incidents therefore
frequently result from the interaction of multiple human factors and the
resulting cumulative impact on performance.
However, relationships and interactions between co-occurring
human factors, and the resulting association with human performance,
have received scant attention in the literature (Glaser et aI., 1999,
Wilkinson 1969). In the late sixties, Wilkinson (1969) recognised this lack
of focus on multiple factors, and suggested "this cannot be through
ignorance of the fact that stresses do occur in combination ... [there is the]
impression that the combined effect of two or more can be assessed by
adding their single effects. This is not so." (p266, 276). However, to date,
research that has investigated human factor relationships is sporadic and
findings are controversial. Even less research has been conducted that is
specific to the ATC context. There is therefore a gap in understanding of
the relationships and potential interaction of multiple human factors and
the subsequent association with human performance.
There is a growing realization within the literature that this research
gap may have limited an ecologically valid understanding of the occurrence
of human factors and the association with human performance in an air
traffic setting (Cox-Fuenzalida, 2007). In addition, limited knowledge of
the association of multiple human factors and human performance and
error has limited the study of performance decline and human error to a
reactive, retrospective analysis of likely causes (Hollnagel, Kaarstad & Lee,
1999) as opposed to proactive strategies for prevention of performance
2
Chapter 1. Introduction
decline. In turn, this affects the reliability and effectiveness of
compensation strategies to protect controller performance and prevent
performance decline.
It is therefore critical that the current research focus is
extended from single factors to multiple factors, and contribute to
this gap in understanding. Several calls for research on the
interrelations between human factors that influence performance highlight
the necessity and importance of addressing this research gap (Chang &
Yeh, 2010; Murray, Baber, & South, 1996). Research in this thesis into
multifactor relationships and associations with performance will provide
value by addressing the current gap between literature and real-world
concerns and furthering understanding of the occurrence of human factors
in an ATC setting. In addition, understanding of the nature of human factor
influences in association with performance decline will be extended, which
may facilitate the development of recommendations for reducing negative
influences.
This thesis is specific to en-route ATC and the focus of research is
human performance.
1.2 Motivation for this thesis
This PhD was sponsored by European Organisation for the Safety of Air
Navigation (EUROCONTROL). The research described in this thesis was
motivated by EUROCONTROL's requirement to gain further understanding
of the co-occurrence of multiple factors in an ATC environment and the
association of multifactor combinations with controller performance. The
need for this research arose after EUROCONTROL identified that recent
performance-related aviation incidents in Europe were frequently
associated with multiple, co-occurring human factors. Informal discussions
between aviation experts at EUROCONTROL and incident Investigators
revealed a colloquial belief among many aviation experts that
performance-related incidents did not generally occur as a result of a
single factor; instead a combination of factors were believed to most
frequently influence performance-related incidents. EUROCONTROL
attempted to gain information on multifactor combinations and the
association with controller performance, but it was recognised that
previous research was sparse In relation to these specific areas of interest.
3
Chapter 1. Introduction
In addition, EUROCONTROL found little relating to recommendations for
mitigating multifactor influences on performance.
EUROCONTROL therefore funded this PhD research to improve
understanding of the relationships that existed between co-occurring
multiple factors, as well as the association between multifactor influences
and performance. EUROCONTROL identified an initial set of factors to
indicate the expected scope of this research. EUROCONTROL were also
interested in the association between multiple factor influences and the
conceptual notion of the 'edge of performance'. The 'edge of performance'
is a notion that performance may reach a specific limit or boundary, after
which a decline in performance may occur. The initial conceptualization of
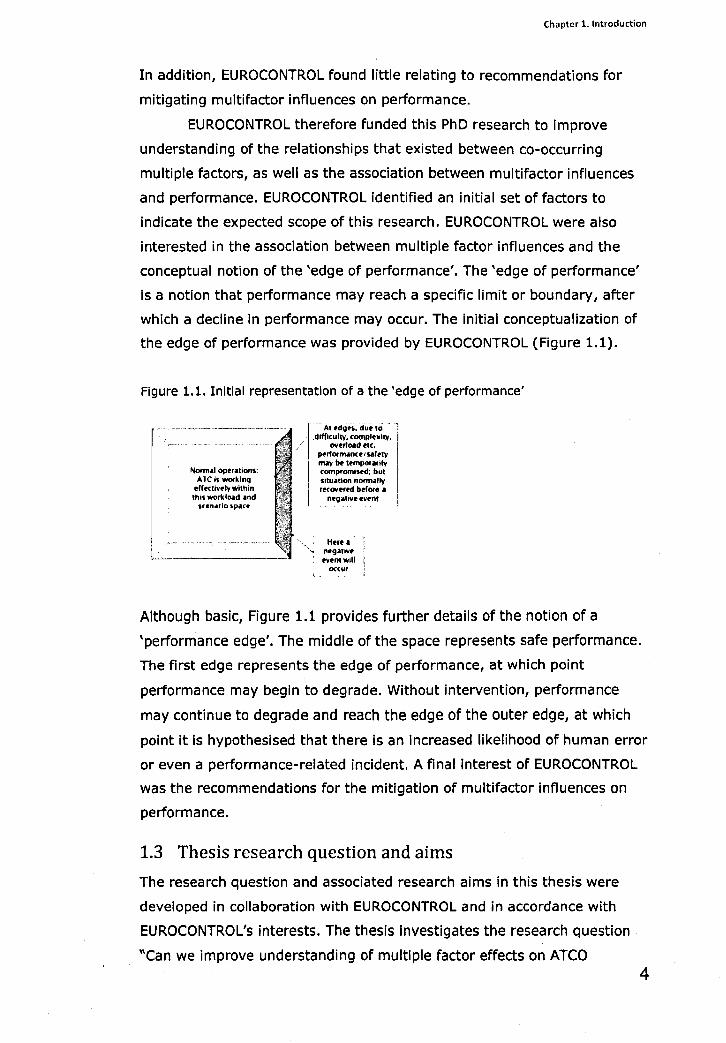
the edge of performance was provided by EUROCONTROL (Figure 1.1).
Figure 1.1. Initial representation of a the 'edge of performance'
Normal oper alions: A TC I, working
ell..:tl •• ", within this worl<l~d and
scenario ~p.1Ce
j".- At .dg".due to ...
"" "difficulty. CO(T\pl~"itv. / "".rI .... d etc. , perf Ofmance I sal.",
may 110 t.mporarily compromls.d; but "tuition normilty ,..:overed bolot ••
n.gatlVe event
Her.. i nt!g.ttv~ I ••• ntwllI I
occur ;
Although basic, Figure 1.1 provides further details of the notion of a
'performance edge'. The middle of the space represents safe performance.
The first edge represents the edge of performance, at which point
performance may begin to degrade. Without intervention, performance
may continue to degrade and reach the edge of the outer edge, at which
point it is hypothesised that there is an increased likelihood of human error
or even a performance-related incident. A final interest of EUROCONTROL
was the recommendations for the mitigation of multifactor influences on
performance.
1.3 Thesis research question and aims
The research question and associated research aims in this thesis were
developed in collaboration with EUROCONTROL and in accordance with
EUROCONTROL's interests. The thesis investigates the research question
"Can we improve understanding of multiple factor effects on ATCO 4
Chapter 1. Introduction
performance and provide recommendations for mitigating these
influences?" To address this question, six research aims were developed:
1. Identify a set of human factors that influence air traffic
controller (ATCO) performance
To begin the project, it was necessary to identify a set of human factors
that were present in an ATC environment, and confirm the factors that
were associated with controller performance. This aim was initially
informed by a suggested set of nine human factors from human factors
experts within EUROCONTROL. A literature review, analysis of 272 incident
reports and subject matter expert opinion was used to confirm the
presence of these factors within ATC settings, and the association with
performance. From the results of the literature review and incident reports,
nine primary factors were identified and reported to significantly affect
ATCO performance.
2. Select a sub-group of factors that may be included In further
studies
It was considered impractical to include all nine human factors in future
studies of the relationships and interactions between factors. A smaller
sub-group of factors were identified for inclusion in future research. The
selection was based on the frequency and negative association with
controller performance (the more frequently negatively Influencing factors
were selected), in addition to pragmatic considerations such as resources
and measurement of the factors.
3. Investigate the relationships and potential interactions between
multiple, selected human factors
The thesis aimed to investigate the relationships and potential interactions
between the selected sub-group of human factors. Incident report analysis
findings, findings from a survey-questionnaire with air traffic professionals
and findings from an experimental study contributed to addressing this aim.
4. Investigate the association of multiple factor relationships with
human performance
This thesis aims to investigate the link between multiple factor
relationships and performance. The investigation used an experimental
study in a laboratory setting to facilitate adequate control of variables and
appropriate methodological design.
5
Chapter 1. Introduction
5. Inform fundamental understanding of ATCO behaviour at the
edge of performance
The research aimed to describe the manifestation of the association
between multiple factors and performance by investigating behaviour at
the limits of performance, as it is understood by EUROCONTROL. Findings
improved knowledge of behaviour at the edge of performance as well as
the performance decline process, and therefore further understanding of
the possibilities of protecting and supporting performance prior to a decline.
6. Identify indicators of potential performance decline
A final aim of the research was to identify indicators that may indicate
when a controller was reaching their personal limits of performance.
Indicators may be either internal, subjective experiences or overt,
observable indicators. Research findings may have a practical relevance to
the identification of controllers' reaching the limits of performance and the
application of supportive strategies as prevention to performance decline.
1.4 Initial selection of factors for investigation
It was recognised that the focus on multiple human factor combinations In
ATC could be a wide area of research. To narrow the scope of the research,
EUROCONTROL provided a set of nine factors that were required to be
included for consideration in the initial stages of research. These factors
were: attention, communications, fatigue, mental workload (referred to
throughout this thesis as 'workload') situation awareness (SA), stress,
teamwork, trust and vigilance. The researcher was confident that
EUROCONTROL aviation experts were familiar with the dominant factors
that occurred within an ATC setting to negatively influence performance
and had selected the appropriate factors for inclusion. The factor set
proposed by EUROCONTROL was later refined based on study findings.
It is worth noting that attention, vigilance and SA are interrelated
constructs. However, these are also noted in the literature to be distinct
(e.g. Endsley, 1988; Eysenck, 2001; Mackworth, 1957) and so are initially
treated as separate factors. The differentiation between these related
concepts is explained further in section 2.2.2.
6
Chdpter t Introduction
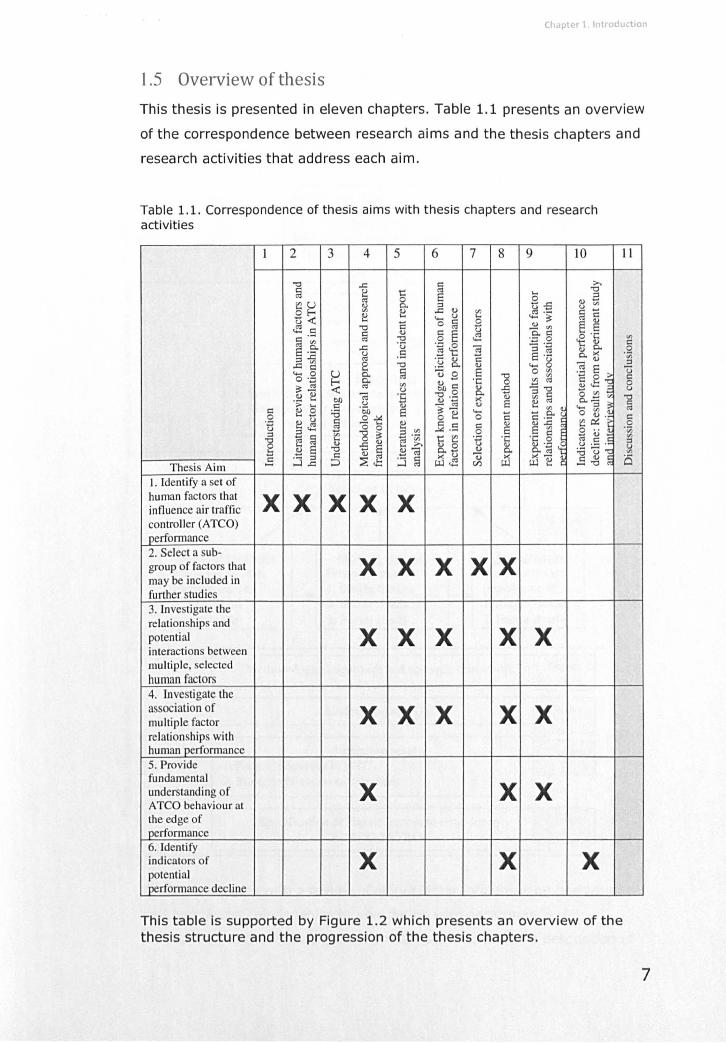
1.5 Overview of thesis
This thesis is presented in eleven chapters. Table 1.1 presents an overview
of the correspondence between research aims and the thesis chapters and
research activities that address each aim.
Table 1.1. Correspondence of thesis aims with thesis chapters and research activities
1 2 3 4 5 6 7 8 9 10
"0 .c
~ >.
to: ~ t:: ... "0
'" '" &. 0 d) a s~ d) '" u.s u '"
'" ~ .e d) Vl '" .- ~ 'i: ~ ..... U ... ..... ~ u<: ~ ,9 E e ~ c "0 C 0 .!:! '"
~ d) § E u o..c c::: 0;;; "0 ~ ';:l 0
o .t:
'" 0.. 'u .~ .g - '0 't & .c "§ ::I '" E .- u .5 E .- &~ ::I.e '" :g & c ..... g .e l:l e "0 d)
]]1 ~ ~9 E o '" ..... 0 U 0.. "0 ~ ~ o .;:: f-; 0.. til d) C
.t: 0 ~~ <: '" u bOO & .s -"0 d) d) ~ 'E 13 ';:l d) ~ ~ o Vl .- ... bO X 0..'::: > ... c u d) - '" d) E ..... '" C ~ 9 :a 'b'o E ~- ..... ... '" o Vl c: ... 0..
0 0';': o ~ 0 to: .- d) .
'5 d) U § - ... d) to: C C d) o.c ~o:: ... ~ o 0 E .~ .;.: .- S E l:l o . . '" a ~ ~ "8 ~ 0 ... d)
g '" Vl t:: ~ ';:l .t: .t: 0 ~ ;§ . ~ S
.s 0 ... >. &,9 ~ & &'~ ~ "0
~] £~ :0 ~ ~ c x U '0 x x-.5
.- ::I ::> :J ~ u.l~ u.l ~ .5"0 Thesis Aim ....l.c CIl u.l
1. Identify a set of human factors that X X X X X influence ai r traffic controller (ATCO) performance 2. Select a sub-group of factors that X X may be included in
X X X further studies 3. Investigate the relationships and
X X X X X potential interactions between multiple. selected human factors 4. Investigate the association of X X X X X multiple factor relationships with human performance 5. Provide fundamental understanding of ATCO behaviour at
X X X the edge of performance 6. Identify
X X X indicators of potential performance decline
This table is supported by Figure 1.2 which presents an overview of the thesis structure and the progression of the thesis chapters.
11
'" c 0 . iii ::I '0 C 0 u
"0 c
'" c 0
'iii til ::I ~ is
7
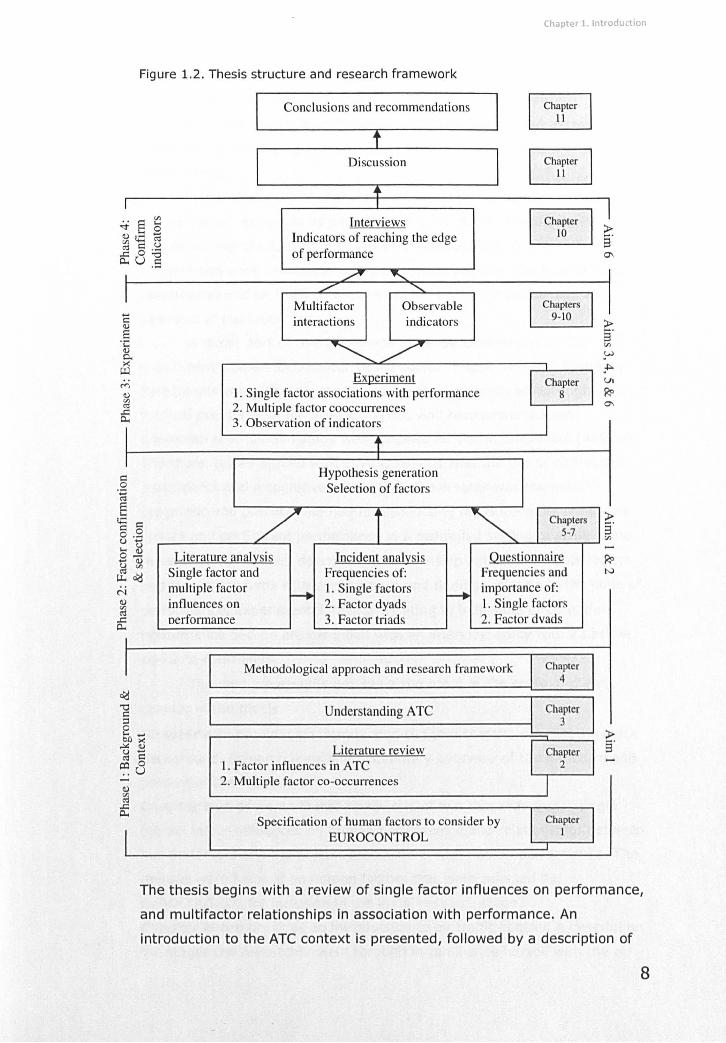
Chapter 1. Introduction
Figure 1.2. Thesis structure and resea rch framework
I
.. § ~ <l) Ie C<i '" t: u '" 0 .-u] I
I ... t: <l)
E t: <l) 0.. >< .. <l) ell
'"
t: 0 .;:; u <l)
Q) C/O
c(!
I
I Conclusions and recommendations
I I Chapter 11
t
I Discussion I I Chapter
11
• Interviews I Chapter
Indicators of reaching the edge 10
of performance
~ ,
~ ..........
MuItifactor Observable I Chapters 9-10 interactions indicators
~~ Experiment
I Chapter 1. Single factor associations with performance 8 2. Multiple factor cooccurrences
I 3. Observation of indicators
t Hypothesis generation
Selection of factors
/ f ~ r Chapters 5-7
Literature analysis Incident analysis Questionnaire Single factor and Frequencies of: Frequencies and multiple factor
f-+ 1. Single factors -+
importance of: influences on 2. Factor dyads 1. Single factors oerformance 3. Factor triads 2. Factor dvads
Methodological approach and research framework
Understanding ATC
Literature review 1. Factor influences in ATC 2. MUltiple factor co-occurrences
Specification of human factors to consider by EUROCONTROL
Chapter 3
I
I I
1 l S 0\
I :> 3' CIl
~
."" I VI
Ro 0\
li -Ro N
-
The thesis begi ns with a review of single factor inf luences on performance,
and multifactor relationships in association with performance. An
introduction to the ATe context is presented, fo llowed by a description of
8
Chapter 1. Introduction
the stages the researcher went through to become familiar with the ATC
domain. The research approach and framework for the thesis are
presented. Information from this research stage contributed to the first
thesis aim of identifying human factors that were associated with human
performance.
A literature review analysis and context-specific incident report
analysis were conducted as part of the second stage of research. Findings
supported that the factors provided by EUROCONTROL occurred in ATC
settings and were associated with performance decline. Findings from a
questionnaire of air traffic professionals facilitated the refinement and
selection of the factor set.
A major part of this thesis was the experimental study. The
experiment utilised a computer-based cognitive task with ATe elements.
Participants were 29 male students from the University of Nottingham.
Political pressures within EUROCONTROL and resource limitations
prevented a simulation study with qualified air traffic controllers (ATCOs).
Therefore, it was agreed with EUROCONTROL that the use of non-expert
participants and a cognitive task with ATC elements was the most
pragmatic and practical method for conducting measurements of human
factors and participant performance in a controlled setting to achieve the
research aims. Results describe the relationship between multiple factors
and the associations with performance and findings relating to the edge of
performance. Experimental findings relating to indicators of potential
performance decline are extended with an interview study with 22 active
en-route controllers.
The next paragraphs provide a summary of the context of each
chapter in the thesis.
Chapter one provides an introduction to the research, including research
background, research aims and a summary overview of the structure and
content of the thesis.
Chapter two presents literature reviews of two research areas: single
human factor influences on human performance and relationships between
human factors and multifactor associations with human performance. The
reviews were focused on human factors that were selected by
EUROCONTROL for inclusion in the initial research stage.
Chapter three provides an introduction to air traffic control. A description
the stages the researcher went through to familiarise herself with the air
9

Chapter 1. Introduction
traffic control domain is described, and features of the ATC domain that
are pertinent to the design of future studies are highlighted.
Chapter four presents the research approach and framework of the thesis.
Together, these four chapters provide comprehensive information on the
research background and context.
Chapter five provides a detailed description of a literature review analysis
and analysis of European ATC incident reports.
Chapter six presents an expert knowledge elicitation study that utilised a
survey questionnaire of air traffic professionals. A refinement of the factor
set is described based on study findings.
Chapter seven summarises the findings from the previous three research
studies (literature analysis, incident report analysis and survey
questionnaire). A sub-set of human factors is selected.
Together, chapters five, six and seven document the progression of the
confirmation, refinement and selection of a set of human factors that is
negatively associated with controller performance, to be used in the next
research phase. The first two thesis aims are achieved.
Chapter eight describes the methodological development and design of
an experiment study. A cognitive task with en-route air traffic control
elements was utilised with students from the University of Nottingham as
participants.
Chapter nine presents the results of the experimental study relating to
multifactor relationships and associations with performance, as well as
findings of ATCO behaviour at the edge of performance. These chapters
address the third, fourth and fifth aims of the thesis.
Chapter ten presents experimental results relating to the association
between observed participant behaviours as indicators of potential
performance decline. The chapter then describes an interview study
conducted with 22 active en-route controllers from Maastricht upper area
control centre that investigates controllers' use of indicators of potential
performance decline. The results address the sixth aim of the thesis.
Chapter eleven provides a discussion of the research presented in this
thesis. The chapter considers findings from the relevant studies in relation
to each thesis aim. Limitations of the research are described, and areas of
further research are recommended. Recommendations resulting from . research findings are provided. The thesis finishes with a concluding
statement.
10
Chapter 2. Literature review of human factors in relation to performance and human factor relationships in air tr affic control
Chapter 2. Literature review of human
factors in relation to performance and
human factor relationships in air traffic
control
2.1 Chapter overview
This chapter summarises the literature reviewed on nine human factors
(workload, fatigue, stress, attention, vigilance, SA, communication,
teamwork, trust) that are proposed to occur in ATC environments. The
chapter is divided into two main sections. Section 2.2 provides a review of
the critical human factors within the ATC domain, and research findings
relating to the association between each factor and controller performance.
Research gaps are highlighted and where appropriate, suggestions of the
potential contributions of future research are outlined. For each factor, the
construct is presented, followed by a discussion of the role of the factor
within the ATC domain. Finally, literature that has examined the
relationship between the factor and controller performance within the ATC
domain are considered. Section 2.3 presents a literature review of findings
of the relationships between human factors and, when pOSSible, the
subsequent multifactor association with performance. A comprehensive
review of human factor relationships, to the current author's knowledge,
has not been previously completed; the review therefore has the benefit of
identifying recurring findings as well as controversies and gaps in the
literature. The review concludes that the nine pre-selected factors have
been reported to be negatively associated with human performance. In
addition, relationships between factors were reported, although
controversy between some research findings was identified.
Each factor is defined according to an accepted, peer-reviewed
definition. Although these definitions may be open to argument (e.g.
Dekker & Hollnagel, 2004; Matthews, 2002), previous research is noted to
have been hampered by a lack of agreement on factor definitions (Costa,
Roe, & Taillieu, 2001). In order to avoid these debates, working definitions
of each factor have been generated from a consideration of the theory of
the factor construct, definitions in the literature, and practical application 11
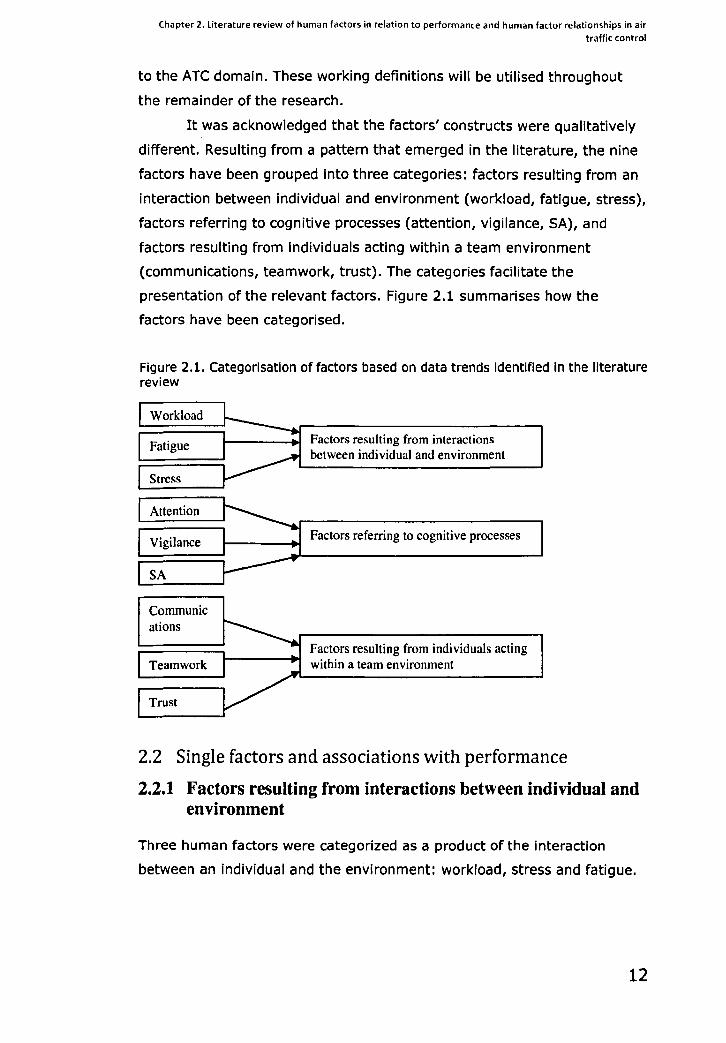
Chapter 2. literature review of human factors in relation to performance and human factor relationships in air
traffic control
to the ATC domain. These working definitions will be utilised throughout
the remainder of the research.
It was acknowledged that the factors' constructs were qualitatively
different. Resulting from a pattern that emerged in the literature, the nine
factors have been grouped into three categories: factors resulting from an
interaction between individual and environment (workload, fatigue, stress),
factors referring to cognitive processes (attention, vigilance, SA), and
factors resulting from individuals acting within a team environment
(communications, teamwork, trust). The categories facilitate the
presentation of the relevant factors. Figure 2.1 summarises how the
factors have been categorised.
Figure 2.1. Categorisation of factors based on data trends identified In the literature review
Workload
Fatigue
Stress
Attention
Vigilance
SA
Communic ations
Teamwork
Trust
Factors resulting from interactions between individual and environment
Factors referring to cognitive processes
Factors resulting from individuals acting within a team environment
2.2 Single factors and associations with performance
2.2.1 Factors resulting from interactions between individual and environment
Three human factors were categorized as a product of the interaction
between an individual and the environment: workload, stress and fatigue.
12
Chapter 2. literature review of human factors in relation to performance and human factor relationships in air traffic control
2.2.1.1 Workload
Mental workload (referred to throughout this thesis as 'workload') is a
multifaceted construct (Athenes, Averty, Puechmorel, Delahaye, & Collet,
2002), dominant within human factors literature (i.e. Wickens, Mavor, &
McGee, 1997). An initial distinction can be made between physical
workload, associated with the physical strain placed on the human and
mental workload, associated with cognitive and affective processes of the
human operator (Wickens et al. 1997). As the task of an ATCO is primarily
cognitive (Bonini, 2005), this review will only focus on mental workload.
Although there is no universally accepted definition, mental workload is
commonly described as is "an intervening construct" (Wickens et aI., 1997,
p114) that is a product of the interaction between objective task demands
and spare cognitive resources available to an individual (Parasuraman,
Sheridan & Wickens, 2008; Lamoureux, 1999). A distinction is therefore
made between taskload and experienced load (Glaser et aI., 1999).
Taskload, refers to the actual demands of a specific task or situation.
Experienced load refers to an individual's perception of the demands
imposed by the objective work and the capability of the individual to meet
those demands. The relationship between taskload and subjectively
experienced workload is complex and can be linear or non-linear (Djokic,
Lorenz, & Fricke, 2010). The relationship can also be mediated through
variables including individual differences and active task management
strategies (Djokic et aI., 2010; Wickens et aI., 1997).
Resources theories explain workload through the concepts of
attentional capacity and cognitive resources (Wickens 1984; Young &
Stanton, 2002). Resources theories assume that each individual has
limited cognitive resources. Resources are required to be allocated to tasks
in order for the operator to perform the task (Smit et aI., 2004; Wickens,
1984; Wickens et aI., 1997). Resource allocation is dependent on task
demands; the higher complexity of the task the more resources will be
required (Wickens, 1984). The allocation of resources, In relation to the
resources available, contributes to the perception of subjective workload.
Wickens' (1984) suggests that when tasks require less resources than the
operator has available, a region of spare capacity exists - the operator has
resources spare that are not being engaged by the task. A subjective
perception of low workload may be experienced when a task requires few
13
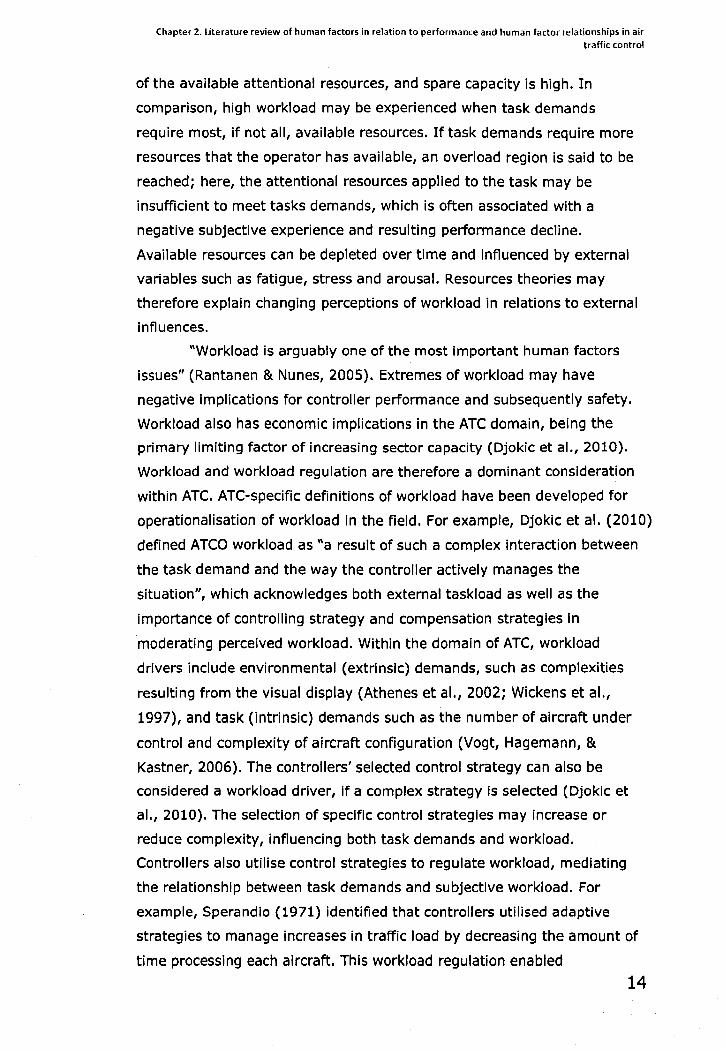
Chapter 2. literature review of human factors in relation to performance and human factor relationships in air traffic control
of the available attentional resources, and spare capacity is high. In
comparison, high workload may be experienced when task demands
require most, if not all, available resources. If task demands require more
resources that the operator has available, an overload region is said to be
reached; here, the attentional resources applied to the task may be
insufficient to meet tasks demands, which is often associated with a
negative subjective experience and resulting performance decline.
Available resources can be depleted over time and influenced by external
variables such as fatigue, stress and arousal. Resources theories may
therefore explain changing perceptions of workload in relations to external
influences.
"Workload is arguably one of the most important human factors
issues" (Rantanen & Nunes, 2005). Extremes of workload may have
negative implications for controller performance and subsequently safety.
Workload also has economic implications in the ATC domain, being the
primary limiting factor of increasing sector capacity (Djokic et aI., 2010).
Workload and workload regulation are therefore a dominant consideration
within ATC. ATC-specific definitions of workload have been developed for
operationalisation of workload in the field. For example, Djokic et al. (2010)
defined ATCO workload as "a result of such a complex interaction between
the task demand and the way the controller actively manages the
situation", which acknowledges both external taskload as well as the
importance of controlling strategy and compensation strategies In
moderating perceived workload. Within the domain of ATC, workload
drivers include environmental (extrinsic) demands, such as complexities
resulting from the visual display (Athenes et al., 2002; Wickens et aI.,
1997), and task (intrinsic) demands such as the number of aircraft under
control and complexity of aircraft configuration (Vogt, Hagemann, &
Kastner, 2006). The controllers' selected control strategy can also be
considered a workload driver, if a complex strategy is selected (Djokic et
aI., 2010). The selection of specific control strategies may increase or
reduce complexity, influencing both task demands and workload.
Controllers also utilise control strategies to regulate workload, mediating
the relationship between task demands and subjective workload. For
example, Sperandio (1971) identified that controllers utilised adaptive
strategies to manage Increases In traffic load by decreasing the amount of
time processing each aircraft. This workload regulation enabled
14
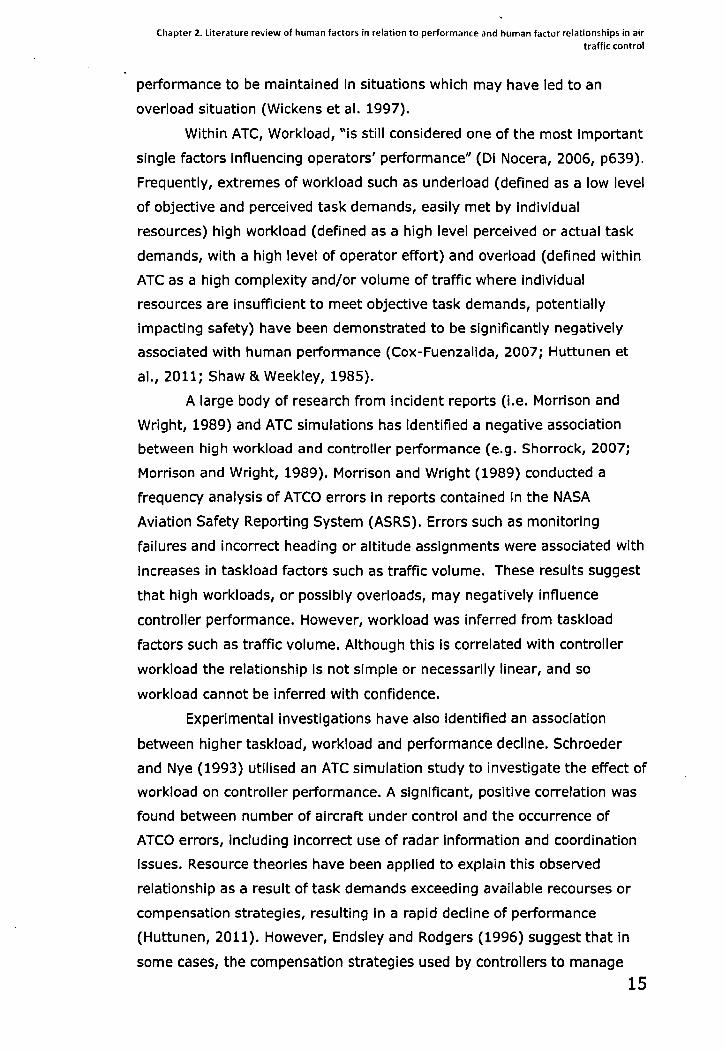
Chapter Z. literature review of human factors in relation to performance and human factor relationships in air traffic control
performance to be maintained in situations which may have led to an
overload situation (Wickens et al. 1997).
Within ATC, Workload, "is still considered one of the most important
single factors influencing operators' performance" (Di Nocera, 2006, p639).
Frequently, extremes of workload such as underload (defined as a low level
of objective and perceived task demands, easily met by individual
resources) high workload (defined as a high level perceived or actual task
demands, with a high level of operator effort) and overload (defined within
ATC as a high complexity and/or volume of traffic where individual
resources are insufficient to meet objective task demands, potentially
impacting safety) have been demonstrated to be significantly negatively
associated with human performance (Cox-Fuenzalida, 2007; Huttunen et
aI., 2011; Shaw & Weekley, 1985).
A large body of research from incident reports (Le. Morrison and
Wright, 1989) and ATC simulations has identified a negative association
between high workload and controller performance (e.g. Shorrock, 2007;
Morrison and Wright, 1989). Morrison and Wright (1989) conducted a
frequency analysis of ATca errors in reports contained in the NASA
Aviation Safety Reporting System (ASRS). Errors such as monitoring
failures and incorrect heading or altitude assignments were associated with
increases in taskload factors such as traffic volume. These results suggest
that high workloads, or possibly overloads, may negatively influence
controller performance. However, workload was inferred from taskload
factors such as traffic volume. Although this is correlated with controller
workload the relationship Is not simple or necessarily linear, and so
workload cannot be inferred with confidence.
Experimental investigations have also Identified an association
between higher taskload, workload and performance decline. Schroeder
and Nye (1993) utilised an ATC simulation study to investigate the effect of
workload on controller performance. A Significant, positive correlation was
found between number of aircraft under control and the occurrence of
ATca errors, including incorrect use of radar information and coordination
issues. Resource theories have been applied to explain this observed
relationship as a result of task demands exceeding available recourses or
compensation strategies, resulting in a rapid decline of performance
(Huttunen, 2011). However, Endsley and Rodgers (1996) suggest that in
some cases, the compensation strategies used by controllers to manage
15
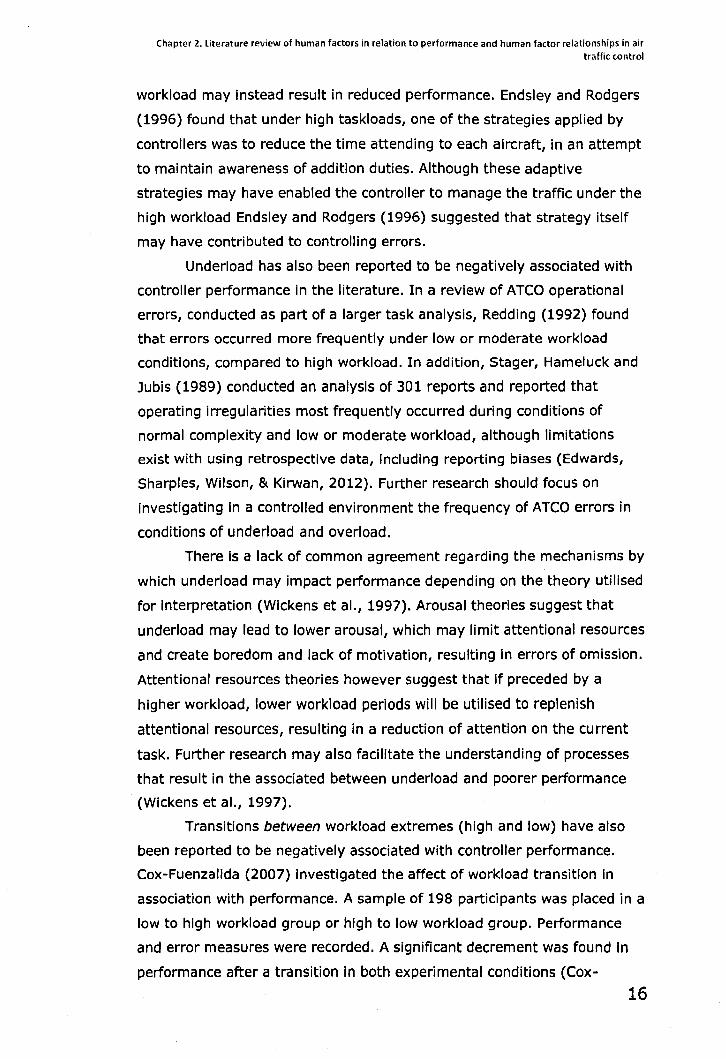
Chapter 2. literature review of human factors in relation to performance and human factor relationships in air traffic control
workload may instead result in reduced performance. Endsley and Rodgers
(1996) found that under high taskloads, one of the strategies applied by
controllers was to reduce the time attending to each aircraft, in an attempt
to maintain awareness of addition duties. Although these adaptive
strategies may have enabled the controller to manage the traffic under the
high workload Endsley and Rodgers (1996) suggested that strategy itself
may have contributed to controlling errors.
Underload has also been reported to be negatively associated with
controller performance in the literature. In a review of ATCa operational
errors, conducted as part of a larger task analYSiS, Redding (1992) found
that errors occurred more frequently under low or moderate workload
conditions, compared to high workload. In addition, Stager, Hameluck and
Jubis (1989) conducted an analysis of 301 reports and reported that
operating irregularities most frequently occurred during conditions of
normal complexity and low or moderate workload, although limitations
exist with using retrospective data, including reporting biases (Edwards,
Sharples, Wilson, & Kirwan, 2012). Further research should focus on
investigating in a controlled environment the frequency of ATCa errors in
conditions of underload and overload.
There is a lack of common agreement regarding the mechanisms by
which underload may impact performance depending on the theory utilised
for interpretation (Wickens et aI., 1997). Arousal theories suggest that
underload may lead to lower arousal, which may limit attentional resources
and create boredom and lack of motivation, resulting in errors of omission.
Attentional resources theories however suggest that if preceded by a
higher workload, lower workload periods will be utilised to replenish
attentional resources, resulting in a reduction of attention on the current
task. Further research may also facilitate the understanding of processes
that result in the associated between underload and poorer performance
(Wickens et aI., 1997).
Transitions between workload extremes (high and low) have also
been reported to be negatively associated with controller performance.
Cox-Fuenzalida (2007) investigated the affect of workload transition in
association with performance. A sample of 198 participants was placed in a
low to high workload group or high to low workload group. Performance
and error measures were recorded. A significant decrement was found in
performance after a transition in both experimental conditions (Cox-
16
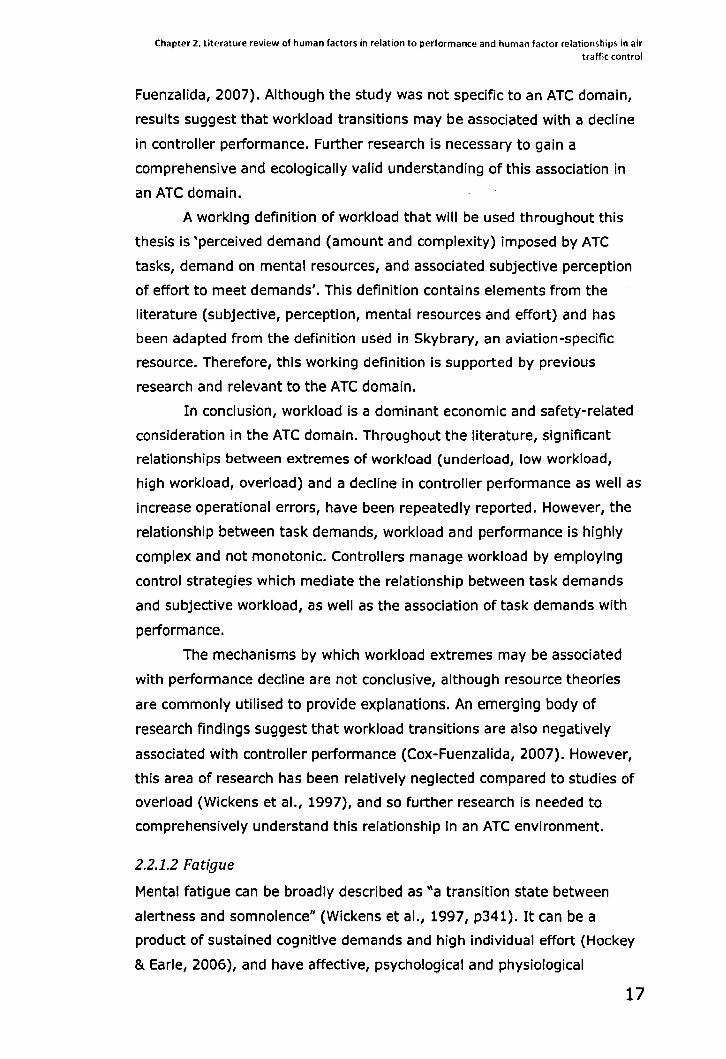
Chapter 2. literature review of human factors in relation to performance and human factor relationships in air traffic control
Fuenzalida, 2007). Although the study was not specific to an ATC domain,
results suggest that workload transitions may be associated with a decline
in controller performance. Further research Is necessary to gain a
comprehensive and ecologically valid understanding of this association in
an ATC domain.
A working definition of workload that will be used throughout this
thesis is 'perceived demand (amount and complexity) imposed by ATC
tasks, demand on mental resources, and associated subjective perception
of effort to meet demands'. This definition contains elements from the
literature (subjective, perception, mental resources and effort) and has
been adapted from the definition used in Skybrary, an aviation-specific
resource. Therefore, this working definition is supported by previous
research and relevant to the ATC domain.
In conclusion, workload is a dominant economic and safety-related
consideration in the ATC domain. Throughout the literature, Significant
relationships between extremes of workload (underload, low workload,
high workload, overload) and a decline in controller performance as well as
increase operational errors, have been repeatedly reported. However, the
relationship between task demands, workload and performance is highly
complex and not monotonic. Controllers manage workload by employing
control strategies which mediate the relationship between task demands
and subjective workload, as well as the association of task demands with
performance.
The mechanisms by which workload extremes may be associated
with performance decline are not conclusive, although resource theories
are commonly utilised to provide explanations. An emerging body of
research findings suggest that workload transitions are also negatively
associated with controller performance (Cox-Fuenzalida, 2007). However,
this area of research has been relatively neglected compared to studies of
overload (Wickens et aI., 1997), and so further research is needed to
comprehensively understand this relationship in an ATC environment.
2.2.1.2 Fatigue
Mental fatigue can be broadly described as "a transition state between
alertness and somnolence" (Wickens et aI., 1997, p341). It can be a
product of sustained cognitive demands and high individual effort (Hockey
& Earle, 2006), and have affective, psychological and physiological
17

Chapter 2. literature review of human factors in relation to performance and human factor relationships in air traffic control
implications (Avers & Johnson, 2011). Fatigue has also been viewed as a
hypothetical construct which is inferred by linking factors presumed to
cause fatigue with measureable outcomes (Williamson et aI., 2011). There
is not one universally accepted definition. Rather, various definitions have
been developed which describe specific elements or dimensions of fatigue,
including the causes of fatigue (biological, task specific) (Williamson et aI.,
2011), the affective dimension (subjective experience and symptoms) and
consequences of fatigue (physiological, performance-related) (Avers &
Johnson, 2011).
Fatigue is multidimensional, and several distinctions between forms
of fatigue have been identified. The focus of this review is mental fatigue.
A broad distinction may be made between generalised fatigue (also termed
cumulative fatigue) and task-specific fatigue (also termed transitory
fatigue). A generalised fatigue state is believed to occur after prolonged
mental effort or sleep disturbance (Isaac & RUitenberg, 1999). Recovery
can only be made through quality sleep (Caldwell, 2001). In contrast, task
specific fatigue results speCifically from task characteristics or demands,
and may be alleviated by doing a different activity (Matthews et aI., 2000).
Focusing on mental fatigue, a common distinction is made in the
literature between subjective fatigue and cognitive or performance-related
fatigue. Subjective fatigue refers to the personal experience of fatigue and
incorporates feelings of tiredness, distress, or difficulty In performing.
Although subjective fatigue may be experienced, a reflection may not be
seen in performance. Cognitive fatigue however, can be perceived In
performance decrements on a task Fatigue then has both a subjective
experience element and an objective element which Is reflected in task
performance (Mathews et al., 2000).
Caldwell (2001) suggests that there are three primary sources of
fatigue frequently acknowledged in the literature: sleep disruption,
homeostatic mechanisms including Circadian rhythms, and time on task
effects. Due to space limitations, only these three commonly Identified
sources have been selected for review.
Sleep disruption, typically referred to as receiving less than 7 hours
sleep a night (Wickens et aI., 2004) Is a specific Issue of concern within the
air traffic control domain (Della Rocco, 1999). Air traffic controllers are
required to work a rotating shift system which can result In poorer sleep,
and over time, a cumulative build up of fatigue (Isaac & RUitenberg, 1999).
18
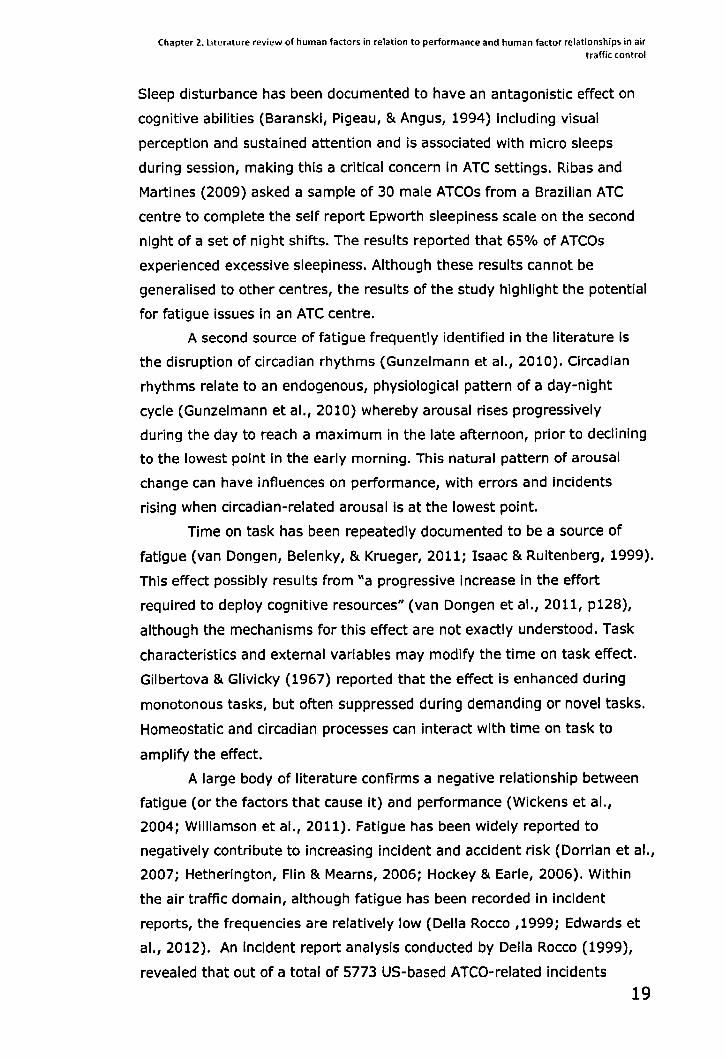
Chapter 2. literature review of human factors in relation to performance and human factor relationships in air traffic control
Sleep disturbance has been documented to have an antagonistic effect on
cognitive abilities (Baranski, Pigeau, & Angus, 1994) including visual
perception and sustained attention and is associated with micro sleeps
during seSSion, making this a critical concern in ATC settings. Ribas and
Martines (2009) asked a sample of 30 male ATCOs from a Brazilian ATC
centre to complete the self report Epworth sleepiness scale on the second
night of a set of night shifts. The results reported that 65% of ATCOs
experienced excessive sleepiness. Although these results cannot be
generalised to other centres, the results of the study highlight the potential
for fatigue issues in an ATC centre.
A second source of fatigue frequently identified in the literature is
the disruption of circadian rhythms (Gunzelmann et aI., 2010). Circadian
rhythms relate to an endogenous, physiological pattern of a day-night
cycle (Gunzelmann et aI., 2010) whereby arousal rises progressively
during the day to reach a maximum in the late afternoon, prior to declining
to the lowest point in the early morning. This natural pattern of arousal
change can have influences on performance, with errors and incidents
rising when circadian-related arousal is at the lowest point.
Time on task has been repeatedly documented to be a source of
fatigue (van Dongen, Belenky, & Krueger, 2011; Isaac & Ruitenberg, 1999).
This effect possibly results from "a progressive increase in the effort
required to deploy cognitive resources" (van Dongen et aI., 2011, p128),
although the mechanisms for this effect are not exactly understood. Task
characteristics and external variables may modify the time on task effect.
Gilbertova & Glivicky (1967) reported that the effect is enhanced during
monotonous tasks, but often suppressed during demanding or novel tasks.
Homeostatic and circadian processes can interact with time on task to
amplify the effect.
A large body of literature confirms a negative relationship between
fatigue (or the factors that cause it) and performance (Wickens et aI.,
2004; Williamson et aI., 2011). Fatigue has been widely reported to
negatively contribute to increasing incident and accident risk (Dorrian et aI.,
2007; Hetherington, Flin & Mearns, 2006; Hockey & Earle, 2006). Within
the air traffic domain, although fatigue has been recorded in incident
reports, the frequencies are relatively low (Della Rocco ,1999; Edwards et
aI., 2012). An incident report analysis conducted by Della Rocco (1999),
revealed that out of a total of 5773 US-based ATCO-related incidents
19
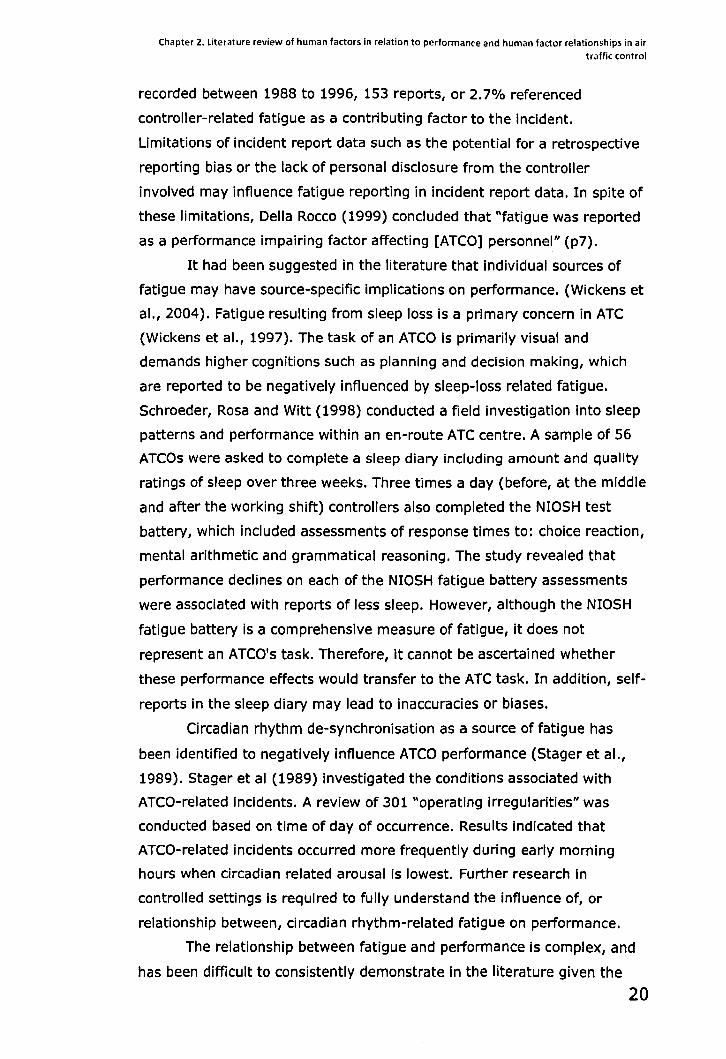
Chapter 2. Literature review of human factors In relation to performance and human factor relationships in air
traffic control
recorded between 1988 to 1996, 153 reports, or 2.7% referenced
controller-related fatigue as a contributing factor to the incident.
Limitations of incident report data such as the potential for a retrospective
reporting bias or the lack of personal disclosure from the controller
involved may influence fatigue reporting in incident report data. In spite of
these limitations, Della Rocco (1999) concluded that "fatigue was reported
as a performance impairing factor affecting [ATCO] personnel" (p7).
It had been suggested in the literature that individual sources of
fatigue may have source-specific implications on performance. (Wickens et
aL, 2004). Fatigue resulting from sleep loss is a primary concern in ATC
(Wickens et aL, 1997). The task of an ATCO is primarily visual and
demands higher cognitions such as planning and decision making, which
are reported to be negatively influenced by sleep-loss related fatigue.
Schroeder, Rosa and Witt (1998) conducted a field investigation into sleep
patterns and performance within an en-route ATC centre. A sample of 56
ATCOs were asked to complete a sleep diary including amount and quality
ratings of sleep over three weeks. Three times a day (before, at the middle
and after the working shift) controllers also completed the NIOSH test
battery, which included assessments of response times to: choice reaction,
mental arithmetic and grammatical reasoning. The study revealed that
performance declines on each of the NIOSH fatigue battery assessments
were associated with reports of less sleep. However, although the NIOSH
fatigue battery is a comprehensive measure of fatigue, it does not
represent an ATCO's task. Therefore, it cannot be ascertained whether
these performance effects would transfer to the ATC task. In addition, self
reports in the sleep diary may lead to inaccuracies or biases.
Circadian rhythm de-synchronisation as a source of fatigue has
been identified to negatively influence ATCO performance (Stager et aL,
1989). Stager et al (1989) investigated the conditions associated with
ATCO-related Incidents. A review of 301 "operating irregularities" was
conducted based on time of day of occurrence. Results indicated that
ATCO-related incidents occurred more frequently during early morning
hours when circadian related arousal is lowest. Further research In
controlled settings Is required to fully understand the influence of, or
relationship between, circadian rhythm-related fatigue on performance.
The relationship between fatigue and performance is complex, and
has been difficult to conSistently demonstrate in the literature given the
20
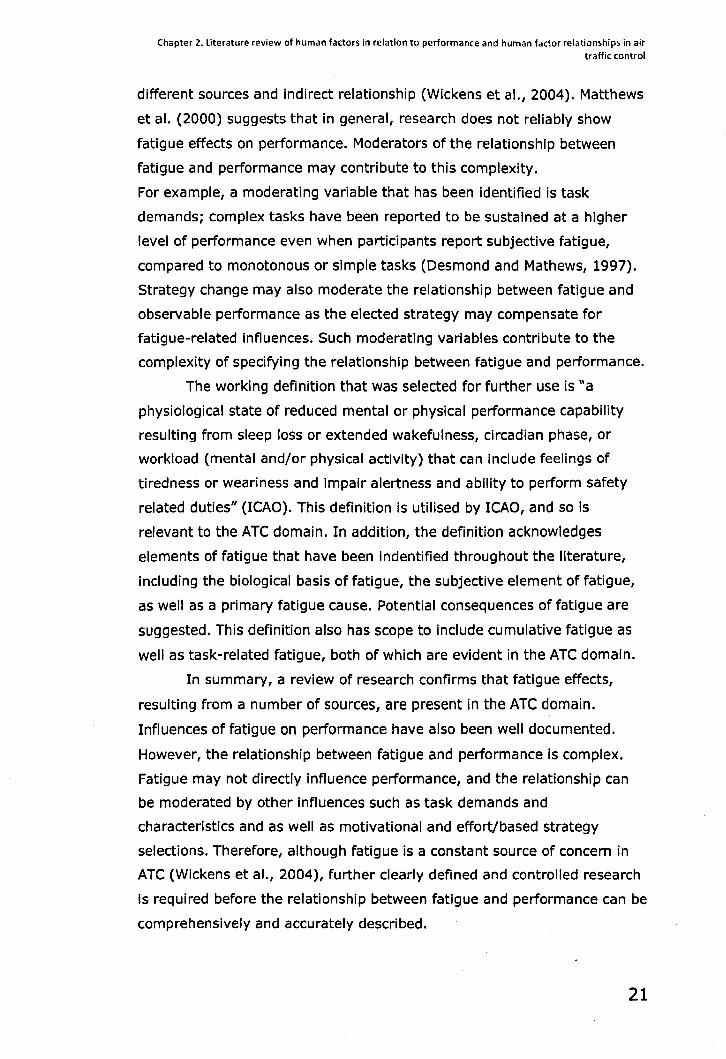
Chapter 2. literature review of human factors in relation to performance and human factor relationships in air traffic control
different sources and indirect relationship (Wickens et aI., 2004). Matthews
et al. (2000) suggests that in general, research does not reliably show
fatigue effects on performance. Moderators of the relationship between
fatigue and performance may contribute to this complexity.
For example, a moderating variable that has been identified is task
demands; complex tasks have been reported to be sustained at a higher
level of performance even when participants report subjective fatigue,
compared to monotonous or simple tasks (Desmond and Mathews, 1997).
Strategy change may also moderate the relationship between fatigue and
observable performance as the elected strategy may compensate for
fatigue-related influences. Such moderating variables contribute to the
complexity of specifying the relationship between fatigue and performance.
The working definition that was selected for further use is "a
physiological state of reduced mental or physical performance capability
resulting from sleep loss or extended wakefulness, circadian phase, or
workload (mental and/or physical activity) that can include feelings of
tiredness or weariness and impair alertness and ability to perform safety
related duties" (ICAO). This definition is utilised by ICAO, and so is
relevant to the ATC domain. In addition, the definition acknowledges
elements of fatigue that have been Indentified throughout the literature,
including the biological basis of fatigue, the subjective element of fatigue,
as well as a primary fatigue cause. Potential consequences of fatigue are
suggested. This definition also has scope to include cumulative fatigue as
well as task-related fatigue, both of which are evident in the ATC domain.
In summary, a review of research confirms that fatigue effects,
resulting from a number of sources, are present in the ATC domain.
Influences of fatigue on performance have also been well documented.
However, the relationship between fatigue and performance is complex.
Fatigue may not directly influence performance, and the relationship can
be moderated by other influences such as task demands and
characteristics and as well as motivational and effort/based strategy
selections. Therefore, although fatigue is a constant source of concern in
ATC (Wickens et aI., 2004), further clearly defined and controlled research
is required before the relationship between fatigue and performance can be
comprehensively and accurately described.
21
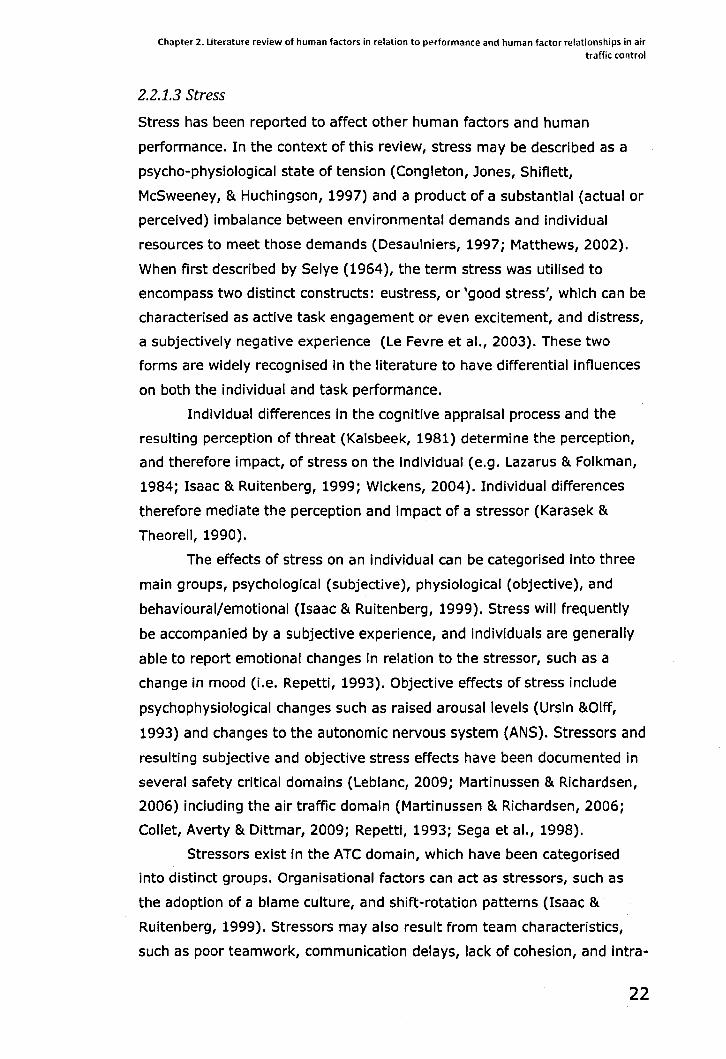
Chapter 2. literature review of human factors in relation to performance and human factor relationships in air tr affic control
2.2.1.3 Stress
Stress has been reported to affect other human factors and human
performance. In the context of this review, stress may be described as a
psycho-physiological state of tension (Congleton, Jones, Shiflett,
McSweeney, & Huchingson, 1997) and a product of a substantial (actual or
perceived) imbalance between environmental demands and individual
resources to meet those demands (Desaulniers, 1997; Matthews, 2002).
When first described by Selye (1964), the term stress was utilised to
encompass two distinct constructs: eustress, or 'good stress', which can be
characterised as active task engagement or even excitement, and distress,
a subjectively negative experience (Le Fevre et aL, 2003). These two
forms are widely recognised in the literature to have differential influences
on both the individual and task performance.
Individual differences in the cognitive appraisal process and the
resulting perception of threat (Kalsbeek, 1981) determine the perception,
and therefore impact, of stress on the Individual (e.g. Lazarus & Folkman,
1984; Isaac & Ruitenberg, 1999; Wickens, 2004). Individual differences
therefore mediate the perception and impact of a stressor (Karasek &
Theorell, 1990).
The effects of stress on an individual can be categorised into three
main groups, psychological (subjective), physiological (objective), and
behavioural/emotional (Isaac & RUitenberg, 1999). Stress will frequently
be accompanied by a subjective experience, and Individuals are generally
able to report emotional changes in relation to the stressor, such as a
change in mood (i.e. Repetti, 1993). Objective effects of stress include
psychophysiological changes such as raised arousal levels (Ursin &Olff,
1993) and changes to the autonomic nervous system (ANS). Stressors and
resulting subjective and objective stress effects have been documented in
several safety critical domains (Leblanc, 2009; Martinussen & Richardsen,
2006) including the air traffic domain (Martinussen & Richardsen, 2006;
Collet, Averty & Dittmar, 2009; Repetti, 1993; Sega et aI., 1998).
Stressors exist in the ATC domain, which have been categorised
into distinct groups. Organisational factors can act as stressors, such as
the adoption of a blame culture, and shift-rotation patterns (Isaac &
Ruitenberg, 1999). Stressors may also result from team characteristics,
such as poor teamwork, communication delays, lack of cohesion, and Intra-
22
Chapter 2. literature review of human factors in relation to performance and human factor relationships in air traffic control
group conflict (Kontogiannis and Kossiavelou, 1999). Environmental
stressors have also been identified in ATC. Kontogiannis and Kossiavelou
(1999) list environmental stressors including inadequate and inconsistent
temperatures (heat/cold), noise and inadequate lighting. Stressors can
result from task characteristics, and have been reported to have "received
more attention by researchers than any other" (Kontogiannis, 1999, p8).
As the air traffic controller's task involves stressors such as high workloads,
time pressure and high risk, "stress [is] inherent to the job" (Sega et al.,
1998, p208).
Stressors may influence subjective and objective stress. Repetti
(1993) investigated the association between work stressors and subjective
experience of stress in a sample of 52 US controllers. Controllers
completed a battery of measures of 'daily occupational stressors' and an
ll-item checklist that measured both physical and mental well-being.
Controllers completed each measure once a day for a total of three days.
Results indicated that occupational stressors were significantly negatively
related to reports of positive mood and physical well-being.
Objective effects of stress have also been identified within the ATC
domain (Cobb & Rose, 1973; Costa, 1993). Melton et al. (1973) measured
heart rate and epinephrine as psychophysiological indicators of stress In a
sample of 16 US ATCOs. Findings showed that increases in both heart rate
and epinephrine were associated with periods of higher task demands.
Unfortunately, the variable of time of day was not controlled. As task
demands tend to be higher during the day, it cannot be stated conclusively
if the associated changes were Influenced by time of day. Findings of
objective effects of stress in the ATC domain are mixed, however. Sega et
al. (1998) utilised a sample of 80 male ATCOs working at an airport in
Milan and recorded heart rate and blood pressure (objective indices of the
stress reaction) continuously for three days. Results were compared to an
aged-matched male sample considered representative of the population.
Results revealed that systoliC blood pressure was Significantly greater in
the ATCO sample. However, changes in heart rate and diastolic blood
pressure were not Significant, in contrast to Melton et al. (1973). The
authors concluded that on a day to day basiS, controllers may be able to
adapt to job stressors, due to careful selection and training, although a
cumulative effect of stressors may Increase the likelihood of hypertension
In the ATCO population. A potential contribution to these controversial
23
Chapter 2. Literature review of human factors in relation to performance and human factor relationships in air
traffic control
findings in the literature of the objective effects of stress on controllers is
the variance in the employed psychophysiological measures (Sega et ai,
1998). Without consistent measures and indices, it is not possible to
comprehensively characterise the influence of stressors on
psychophysiological indices in ATCOs. An additional potential reason for the
controversial findings within the literature is the relative lack of
differentiation between participants' experience of eustress or distress
during the experimental period (e.g. Zeier, Brauchli, & Joller-Jemelka,
1996).
A relationship between stress and performance has been repeatedly
identified in the literature (Lazarus, Deese, & Osler, 1952; Hockey, 1997;
Wetzel et aL, 2006). The relationship between stress and performance may
be explained with the application of the Yerkes-Dodson law (Yerkes &
Dodson, 1908). Stress and the related concept of arousal, influenced by
stressors, may alter on a continuum from high to low depending on the
situation. The Yerkes-Dodson law (Yerkes & Dodson, 1908) suggests that
there is an inverted U relationship between arousal/stress and task
performance. An optimum level of arousal is assumed to be required for
successful task completion. Optimum arousal for task performance differs
between individuals based on experience, adaption and task characteristics
(I.e. simple tasks will generally have a higher level of optimum arousal
than complex tasks.) If arousal is too low task performance may also be
low. Performance is said to increase with arousal level until the optimum
point is reached, hypothesised to be due to the threat of the psychological
stressor providing motivation to invest further cognitive effort in the task
(Wickens et aI., 2004). Stress may therefore facilitate performance until
this optimum, after which if arousal keeps increasing, over-arousal causes
performance to decline. Here, participants may interpret task demands to
be outside individual abilities (Wickens et aL, 2004).
Negative influences of stress and over-arousal on task performance
have been widely reported. Information processing characteristics and
cognitive function, such as divided attention, working memory, retrieval of
information from memory and decision making, have been reported to be
negatively influenced in several high-risk domains, (LeBlanc, 2009;
Delahaij et aL 2011) including aviation (Shorrock, 2007) resulting in a .
negative impact on task performance. Applying these results to the air
traffic environment, stress may have negative influences on the ATCOs'
24
Chapter 2. literature review of human factors in relation to performance and human factor relationships in air traffic control
primary cognitive task. Higher cognitive functions such as working memory
and decision making are all required for a high performance, and may be
affected negatively by stress (Isaac & Ruitenberg, 1999). Relatively few
studies have examined the influence of stress on controller performance.
Research has found several moderators between the relationship
between stress and performance. Moderation effects may explain the
finding that frequently, performance declines are not observed in the
presence of particular stressors (LeBlanc, 2009). One of the most
frequently reported moderators of the stress-performance relationship Is
the active control of performance by individuals under stress by applying
compensation strategies in order to maintain performance (Hockey, 1997;
Matthews et al., 2000). for example, Hockey (1997) suggests that
increased resource allocation may be utilised as a compensatory control
mechanism to protect performance against stress affects, "but only at the
expense of increased subjective effort and behavioural and physiological
costs" (Hockey 1997, p73). Through this process, performance can be
maintained even In the presence of stressors, until a point at which
resources are not suffiCient to compensate for stress effects. The stress
performance relationship may also be moderated through applying coping
strategies. In a seminal Investigation, Sperandio (1971) demonstrated that
in an air traffic domain, controllers switch strategy to maintain
performance under increasing task demands, therefore moderating the
effects of a potential stressor on performance.
A working definition of stress was developed from frequently
utilised definitions in the literature, and a consideration of the subjective
experience and influences on the actual controller experiencing stress. In
addition, two controllers were contacted for their Input on the colloquial
understanding of stress in ATe. The definition that will be used for stress is
"pressures imposed by the situation which challenge the controller's ability
to cope", This definition alludes to important elements of stress considered
in the literature, including external influences, the controllers' perception of
the pressures, individual ability, and the controllers' use of coping or
adaptive strategies, which may protect performance.
In summary, stress may be stated to be a product of the interaction
between external demands, or stressors, and an individual's perceived
ability to cope with those demands. Individual differences are therefore
instrumental In the perception of stressors and subjective stress
25
Chapter 2. literature review of human factors in relation to performance and human factor relationships in air traffic control
experienced. Stress is documented to have both psychophysiological
(objective) effects on an individual, as well and psychological (subjective)
effects. These effects may be positive as well as negative, although most
concerning for safety-critical environments is the negative consequences of
the stress-performance relationship. Stress has been repeatedly
demonstrated to negatively influence performance in several safety-critical
settings, including aviation. However, relatively few studies have reported
the association between stress and ATCO performance; potentially due to a
variety of moderators reducing the observable influences of stress in
performance. Further research should examine in a controlled setting the
relationship between controller performance and subjective and objective
stress to further understanding of this relationship in the ATC environment.
2.2.2 Factors referring to cognitive processes
2.2.2.1 Attention
Within the context of the human processing system attention is often
referred to as the ability to attend to information in the environment
(Eysenck, 2001). It is a critical element in the human processing system;
attentional capture is necessary for perception and further central
processing, ultimately resulting in a response to environmental Information
(Wickens et aI., 2004). It is beyond the scope of this review to describe the
full human processing system and the critical elements for information
processing (please see Eysenck, 2001 for a full review). This section of the
review will therefore focus on the attention construct itself, a description of
the different forms of attention and a brief review of the underlying
attentional process theories. The relevance of attentional mechanisms
specifically within the ATe domain and implications for controllers'
performance will then be summarised. Three main forms of attention have
been identified in the literature (Brown & Boltz, 2002; Eysenck, 2001):
1. Focused attention, defined as a cognitive mechanism that facilitates
an individual to selectively attend to a specific target from a range of
stimuli (Behrmann and Tipper, 1999)
2. Divided attention, defined as a person's ability to attend to two or
more stimuli at once (Eysenck, 2001)
26
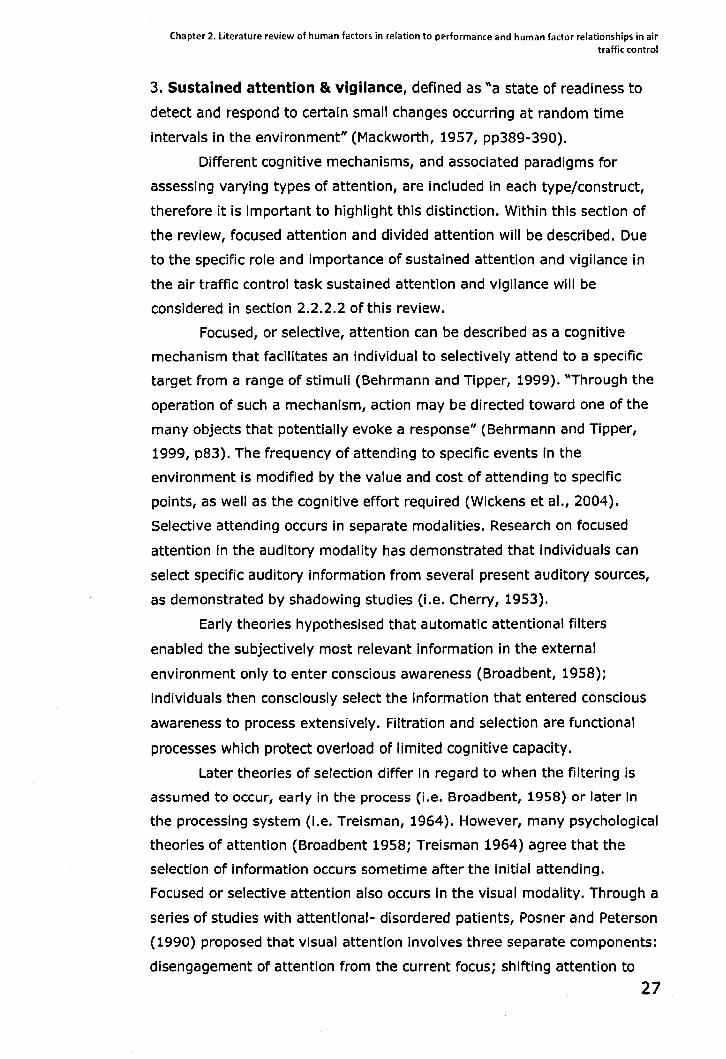
Chapter 2. literature review of human factors in relation to performance and human factor relationships in air traffic control
3. Sustained attention &. vigilance, defined as "a state of readiness to
detect and respond to certain small changes occurring at random time
intervals in the environment" (Mackworth, 1957, pp389-390).
Different cognitive mechanisms, and associated paradigms for
assessing varying types of attention, are included in each type/construct,
therefore it is important to highlight this distinction. Within this section of
the review, focused attention and divided attention will be described. Due
to the specific role and importance of sustained attention and vigilance in
the air traffic control task sustained attention and vigilance will be
considered in section 2.2.2.2 of this review.
Focused, or selective, attention can be described as a cognitive
mechanism that facilitates an individual to selectively attend to a specific
target from a range of stimuli (Behrmann and Tipper, 1999). "Through the
operation of such a mechanism, action may be directed toward one of the
many objects that potentially evoke a response" (Behrmann and Tipper,
1999, p83). The frequency of attending to speCific events in the
environment is modified by the value and cost of attending to specific
points, as well as the cognitive effort required (Wickens et aL, 2004).
Selective attending occurs in separate modalities. Research on focused
attention in the auditory modality has demonstrated that individuals can
select specific auditory information from several present auditory sources,
as demonstrated by shadowing studies (i.e. Cherry, 1953).
Early theories hypotheSised that automatic attentional filters
enabled the subjectively most relevant information in the external
environment only to enter conscious awareness (Broadbent, 1958);
individuals then consciously select the information that entered conscious
awareness to process extensively. Filtration and selection are functional
processes which protect overload of limited cognitive capacity.
Later theories of selection differ in regard to when the filtering is
assumed to occur, early in the process (i.e. Broadbent, 1958) or later in
the processing system (i.e. Treisman, 1964). However, many psychological
theories of attention (Broadbent 1958; Treisman 1964) agree that the
selection of information occurs sometime after the initial attending.
Focused or selective attention also occurs In the visual modality. Through a
series of studies with attentional- disordered patients, Posner and Peterson
(1990) proposed that visual attention involves three separate components:
disengagement of attention from the current focus; shifting attention to
27
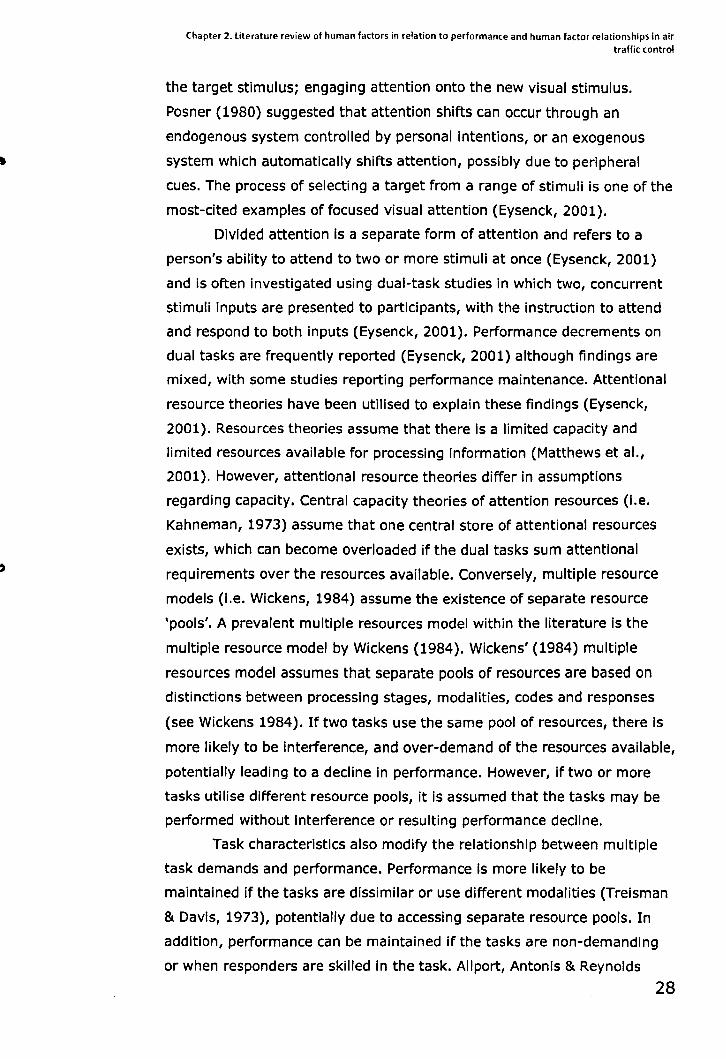
Chapter 2. literature review of human factors in relation to performance and human factor relationships in air traffic (ontrol
the target stimulus; engaging attention onto the new visual stimulus.
Posner (1980) suggested that attention shifts can occur through an
endogenous system controlled by personal intentions, or an exogenous
system which automatically shifts attention, possibly due to peripheral
cues. The process of selecting a target from a range of stimuli is one of the
most-cited examples of focused visual attention (Eysenck, 2001).
Divided attention is a separate form of attention and refers to a
person's ability to attend to two or more stimuli at once (Eysenck, 2001)
and is often investigated using dual-task studies in which two, concurrent
stimuli inputs are presented to participants, with the instruction to attend
and respond to both inputs (Eysenck, 2001). Performance decrements on
dual tasks are frequently reported (Eysenck, 2001) although findings are
mixed, with some studies reporting performance maintenance. Attentional
resource theories have been utilised to explain these findings (Eysenck,
2001). Resources theories assume that there is a limited capacity and
limited resources available for processing information (Matthews et aI.,
2001). However, attentional resource theories differ in assumptions
regarding capacity. Central capacity theories of attention resources (I.e.
Kahneman, 1973) assume that one central store of attentional resources
exists, which can become overloaded if the dual tasks sum attentional
requirements over the resources available. Conversely, multiple resource
models (I.e. Wickens, 1984) assume the existence of separate resource
'pools'. A prevalent multiple resources model within the literature is the
multiple resource model by Wickens (1984). Wickens' (1984) multiple
resources model assumes that separate pools of resources are based on
distinctions between processing stages, modalities, codes and responses
(see Wickens 1984). If two tasks use the same pool of resources, there is
more likely to be interference, and over-demand of the resources available,
potentially leading to a decline in performance. However, if two or more
tasks utilise different resource pools, it is assumed that the tasks may be
performed without Interference or resulting performance decline.
Task characteristics also modify the relationship between multiple
task demands and performance. Performance is more likely to be
maintained if the tasks are diSSimilar or use different modalities (Treisman
& Davis, 1973), potentially due to accessing separate resource pools. In
addition, performance can be maintained if the tasks are non-demanding
or when responders are skilled in the task. Allport, Antonis & Reynolds
28
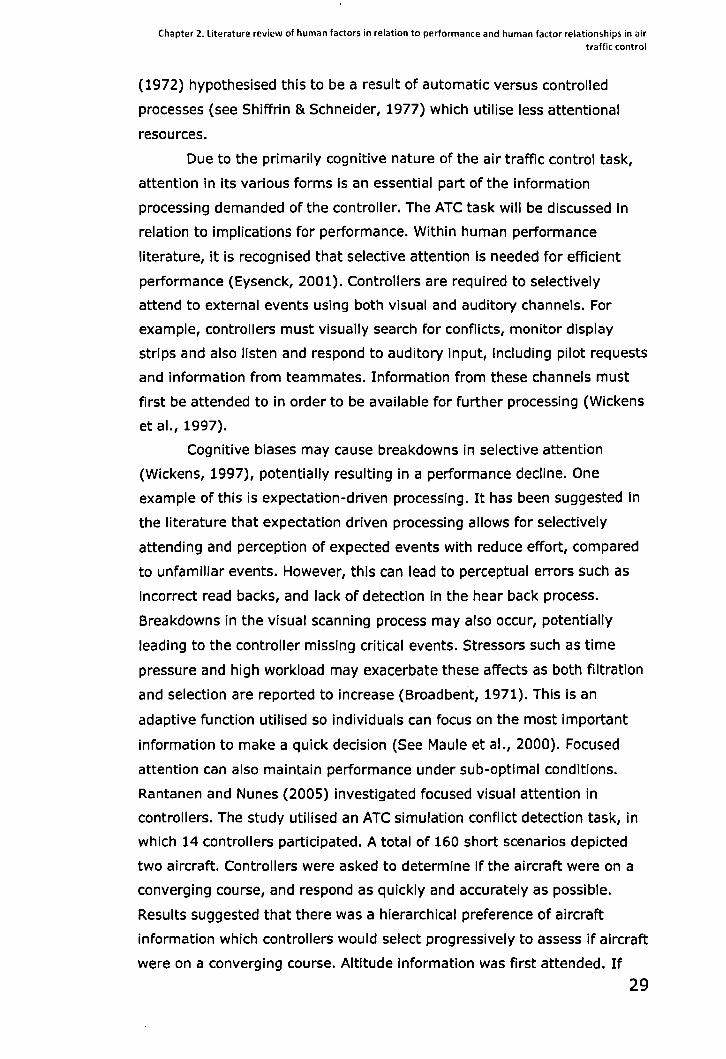
Chapter 2. literature review of human factors in relation to performance and human factor relationships in air traffic control
(1972) hypothesised this to be a result of automatic versus controlled
processes (see Shiffrin & Schneider, 1977) which utilise less attentional
resources.
Due to the primarily cognitive nature of the air traffic control task,
attention in its various forms is an essential part of the information
processing demanded of the controller. The ATC task will be discussed in
relation to implications for performance. Within human performance
literature, it is recognised that selective attention is needed for efficient
performance (Eysenck, 2001). Controllers are required to selectively
attend to external events using both visual and auditory channels. For
example, controllers must visually search for conflicts, monitor display
strips and also listen and respond to auditory input, including pilot requests
and information from teammates. Information from these channels must
first be attended to in order to be available for further processing (Wickens
et aI., 1997).
Cognitive biases may cause breakdowns in selective attention
(Wickens, 1997), potentially resulting in a performance decline. One
example of this is expectation-driven processing. It has been suggested in
the literature that expectation driven processing allows for selectively
attending and perception of expected events with reduce effort, compared
to unfamiliar events. However, this can lead to perceptual errors such as
incorrect read backs, and lack of detection in the hear back process.
Breakdowns in the visual scanning process may also occur, potentially
leading to the controller missing critical events. Stressors such as time
pressure and high workload may exacerbate these affects as both filtration
and selection are reported to increase (Broadbent, 1971). This is an
adaptive function utilised so individuals can focus on the most important
information to make a quick decision (See Maule et aI., 2000). Focused
attention can also maintain performance under sub-optimal conditions.
Rantanen and Nunes (200S) investigated focused visual attention in
controllers. The study utilised an ATC simulation conflict detection task, in
which 14 controllers partiCipated. A total of 160 short scenarios depicted
two aircraft. Controllers were asked to determine If the aircraft were on a
converging course, and respond as quickly and accurately as possible.
Results suggested that there was a hierarchical preference of aircraft
information which controllers would select progressively to assess if aircraft
were on a converging course. Altitude information was first attended. If
29
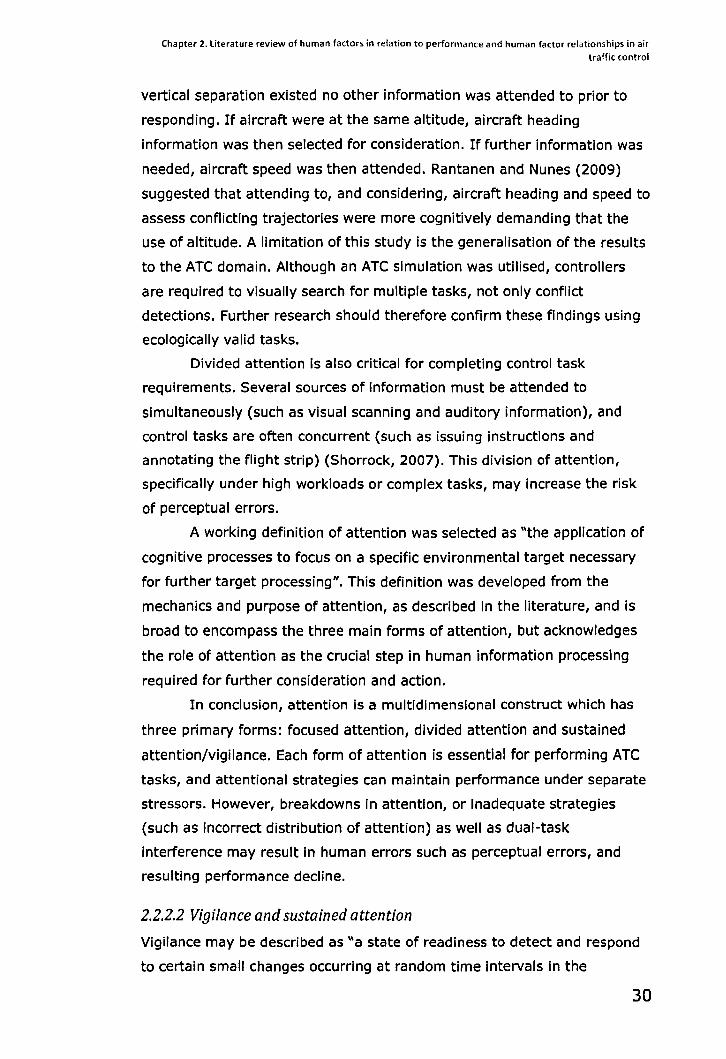
Chapter 2. literature review of human factors in relation to performance and human factor relationships in air traffic control
vertical separation existed no other information was attended to prior to
responding. If aircraft were at the same altitude, aircraft heading
information was then selected for consideration. If further information was
needed, aircraft speed was then attended. Rantanen and Nunes (2009)
suggested that attending to, and considering, aircraft heading and speed to
assess conflicting trajectories were more cognitively demanding that the
use of altitude. A limitation of this study is the generalisation of the results
to the ATC domain. Although an ATC simulation was utilised, controllers
are required to visually search for multiple tasks, not only conflict
detections. Further research should therefore confirm these findings using
ecologically valid tasks.
Divided attention Is also critical for completing control task
requirements. Several sources of information must be attended to
simultaneously (such as visual scanning and auditory information), and
control tasks are often concurrent (such as issuing instructions and
annotating the flight strip) (Shorrock, 2007). This division of attention,
specifically under high workloads or complex tasks, may increase the risk
of perceptual errors.
A working definition of attention was selected as "the application of
cognitive processes to focus on a specific environmental target necessary
for further target processing". This definition was developed from the
mechanics and purpose of attention, as described In the literature, and is
broad to encompass the three main forms of attention, but acknowledges
the role of attention as the crucial step in human information processing
required for further consideration and action.
In concluSion, attention Is a multidimensional construct which has
three primary forms: focused attention, divided attention and sustained
attention/vigilance. Each form of attention is essential for performing ATe
tasks, and attentional strategies can maintain performance under separate
stressors. However, breakdowns in attention, or inadequate strategies
(such as Incorrect distribution of attention) as well as dual-task
interference may result In human errors such as perceptual errors, and
resulting performance decline.
2.2.2.2 Vigilance and sustained attention
Vigilance may be described as "a state of readiness to detect and respond
to certain small changes occurring at random time Intervals in the
30
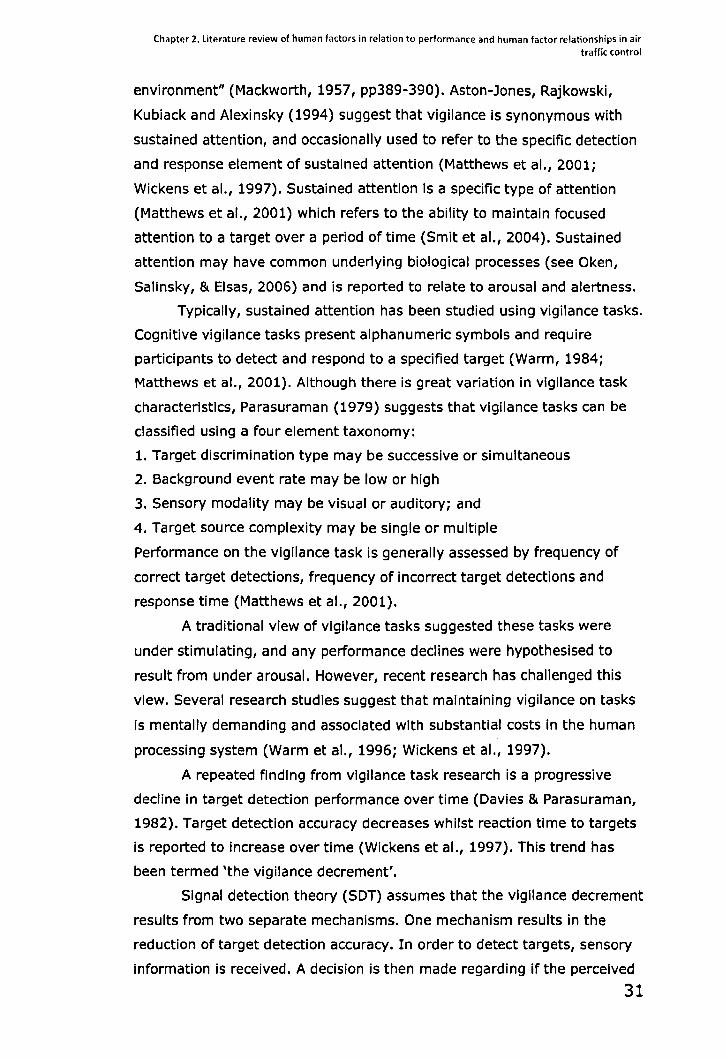
Chapter 2. literature review of human factors in relation to performance and human factor relationships in air traffic control
environment" (Mackworth, 1957, pp389-390). Aston-Jones, Rajkowski,
Kubiack and Alexinsky (1994) suggest that vigilance is synonymous with
sustained attention, and occasionally used to refer to the specific detection
and response element of sustained attention (Matthews et al., 2001;
Wickens et aI., 1997). Sustained attention is a specific type of attention
(Matthews et aL, 2001) which refers to the ability to maintain focused
attention to a target over a period of time (Smit et aI., 2004). Sustained
attention may have common underlying biological processes (see Oken,
Salinsky, & Elsas, 2006) and is reported to relate to arousal and alertness.
Typically, sustained attention has been studied using vigilance tasks.
Cognitive vigilance tasks present alphanumeric symbols and require
participants to detect and respond to a specified target (Warm, 1984;
Matthews et aI., 2001). Although there is great variation in vigilance task
characteristics, Parasuraman (1979) suggests that vigilance tasks can be
classified using a four element taxonomy:
1. Target discrimination type may be successive or simultaneous
2. Background event rate may be low or high
3. Sensory modality may be visual or auditory; and
4. Target source complexity may be single or multiple
Performance on the vigilance task is generally assessed by frequency of
correct target detections, frequency of incorrect target detections and
response time (Matthews et aL, 2001).
A traditional view of vigilance tasks suggested these tasks were
under stimulating, and any performance declines were hypothesised to
result from under arousal. However, recent research has challenged this
view. Several research studies suggest that maintaining vigilance on tasks
is mentally demanding and aSSOCiated with substantial costs in the human
processing system (Warm et aI., 1996; Wickens et aI., 1997).
A repeated finding from vigilance task research is a progressive
decline in target detection performance over time (Davies & Parasuraman,
1982). Target detection accuracy decreases whilst reaction time to targets
is reported to increase over time (Wickens et aL, 1997). This trend has
been termed 'the vigilance decrement'.
Signal detection theory (SOT) assumes that the vigilance decrement
results from two separate mechanisms. One mechanism results in the
reduction of target detection accuracy. In order to detect targets, sensory
information is received. A decision is then made regarding if the perceived
31
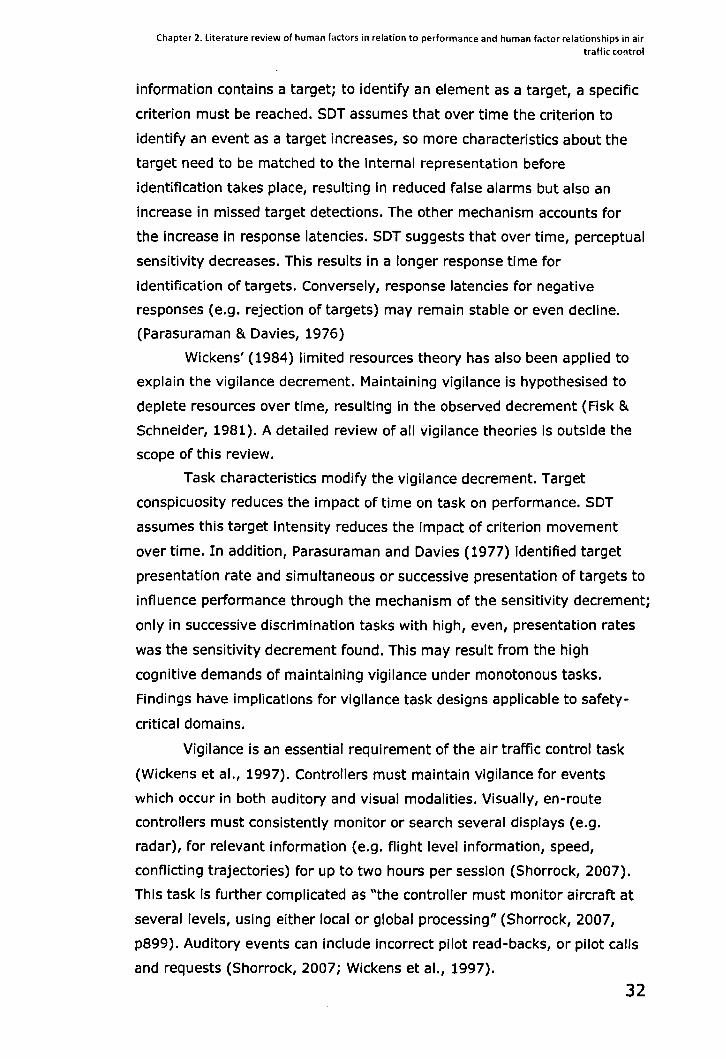
Chapter 2. literature review of human factors in relation to performance and human factor relationships in air traffic control
information contains a target; to identify an element as a target, a specific
criterion must be reached. SDT assumes that over time the criterion to
identify an event as a target increases, so more characteristics about the
target need to be matched to the internal representation before
identification takes place, resulting In reduced false alarms but also an
increase in missed target detections. The other mechanism accounts for
the increase in response latencies. SDT suggests that over time, perceptual
sensitivity decreases. This results in a longer response time for
identification of targets. Conversely, response latencies for negative
responses (e.g. rejection of targets) may remain stable or even decline.
(Parasuraman & Davies, 1976)
Wickens' (1984) limited resources theory has also been applied to
explain the vigilance decrement. Maintaining vigilance is hypothesised to
deplete resources over time, resulting in the observed decrement (Fisk &
Schneider, 1981). A detailed review of all vigilance theories Is outside the
scope of this review.
Task characteristics modify the vigilance decrement. Target
conspicuosity reduces the Impact of time on task on performance. SDT
assumes this target intensity reduces the impact of criterion movement
over time. In addition, Parasuraman and Davies (1977) identified target
presentation rate and simultaneous or successive presentation of targets to
influence performance through the mechanism of the sensitivity decrement;
only in successive discrimination tasks with high, even, presentation rates
was the sensitivity decrement found. This may result from the high
cognitive demands of maintaining vigilance under monotonous tasks.
Findings have implications for vigilance task designs applicable to safety
critical domains.
Vigilance is an essential requirement of the air traffic control task
(Wickens et aI., 1997). Controllers must maintain vigilance for events
which occur in both auditory and visual modalities. Visually, en-route
controllers must conSistently monitor or search several displays (e.g.
radar), for relevant information (e.g. flight level Information, speed,
conflicting trajectories) for up to two hours per session (Shorrock, 2007).
This task is further complicated as "the controller must monitor aircraft at
several levels, using either local or global processing" (Shorrock, 2007,
p899). Auditory events can Include Incorrect pilot read-backs, or pilot calls
and requests (Shorrock, 2007; Wickens et aI., 1997).
32
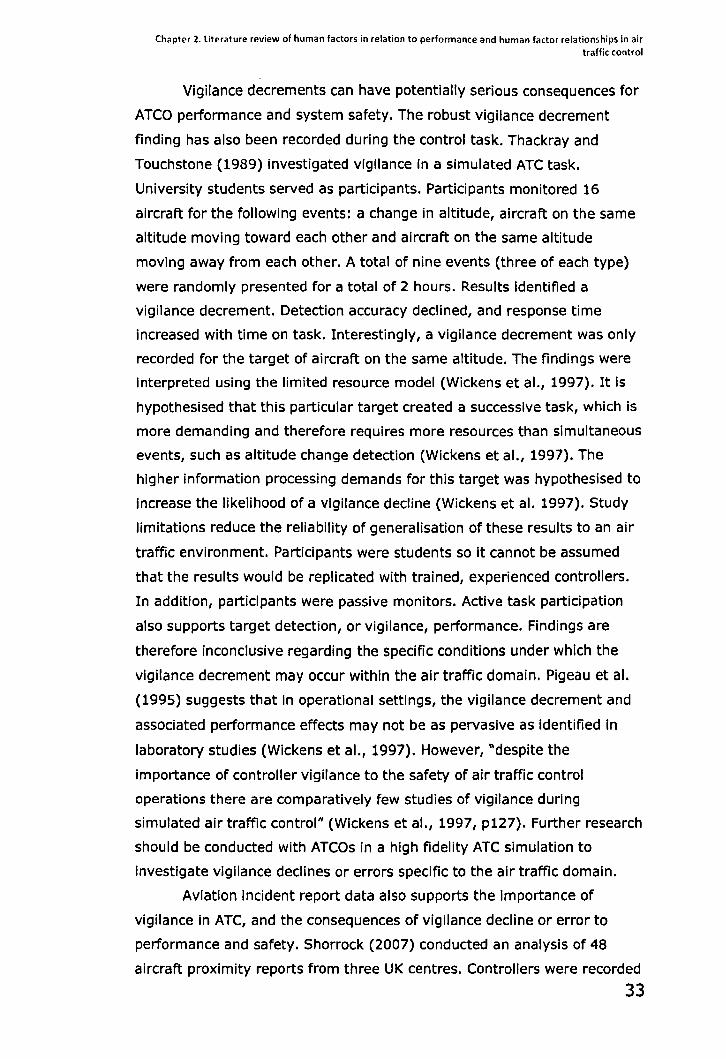
Chapter 2. Literature review of human factors in relation to performance and human factor relationships in air traffic control
Vigilance decrements can have potentially serious consequences for
ATCO performance and system safety. The robust vigilance decrement
finding has also been recorded during the control task. Thackray and
Touchstone (1989) investigated vigilance in a simulated ATC task.
University students served as participants. Participants monitored 16
aircraft for the following events: a change in altitude, aircraft on the same
altitude moving toward each other and aircraft on the same altitude
moving away from each other. A total of nine events (three of each type)
were randomly presented for a total of 2 hours. Results identified a
vigilance decrement. Detection accuracy declined, and response time
increased with time on task. Interestingly, a vigilance decrement was only
recorded for the target of aircraft on the same altitude. The findings were
Interpreted using the limited resource model (Wickens et aL, 1997). It is
hypothesised that this particular target created a successive task, which is
more demanding and therefore requires more resources than simultaneous
events, such as altitude change detection (Wickens et aL, 1997). The
higher information processing demands for this target was hypothesised to
increase the likelihood of a vigilance decline (Wickens et al. 1997). Study
limitations reduce the reliability of generalisation of these results to an air
traffic environment. PartiCipants were students so it cannot be assumed
that the results would be replicated with trained, experienced controllers.
In addition, partiCipants were passive monitors. Active task participation
also supports target detection, or vigilance, performance. Findings are
therefore inconclusive regarding the specific conditions under which the
vigilance decrement may occur within the air traffic domain. Pigeau et al.
(1995) suggests that in operational settings, the vigilance decrement and
aSSOCiated performance effects may not be as pervasive as identified in
laboratory studies (Wickens et aL, 1997). However, "despite the
importance of controller vigilance to the safety of air traffic control
operations there are comparatively few studies of vigilance during
simulated air traffic control" (Wickens et aL, 1997, p127). Further research
should be conducted with ATCOs in a high fidelity ATC simulation to
investigate vigilance declines or errors specific to the air traffic domain.
Aviation incident report data also supports the importance of
vigilance in ATC, and the consequences of vigilance decline or error to
performance and safety. Shorrock (2007) conducted an analysis of 48
aircraft proximity reports from three UK centres. Controllers were recorded
33
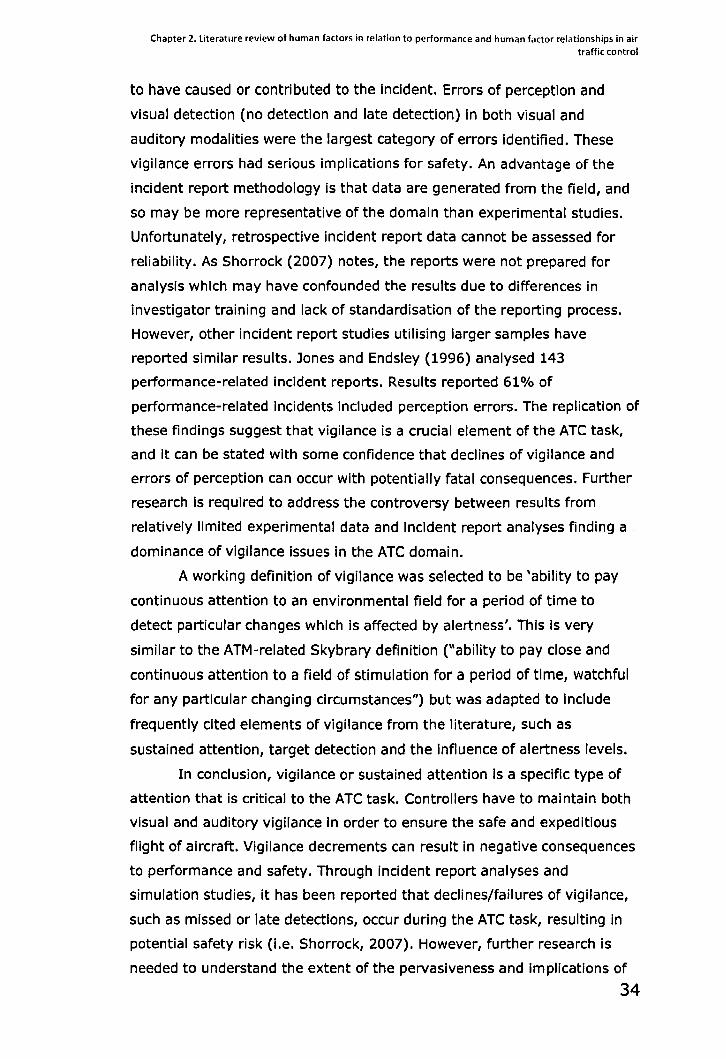
Chapter 2. literature review of human factors in relation to performance and human factor relationships in air traffic control
to have caused or contributed to the incident. Errors of perception and
visual detection (no detection and late detection) in both visual and
auditory modalities were the largest category of errors identified. These
vigilance errors had serious implications for safety. An advantage of the
incident report methodology is that data are generated from the field, and
so may be more representative of the domain than experimental studies.
Unfortunately, retrospective incident report data cannot be assessed for
reliability. As Shorrock (2007) notes, the reports were not prepared for
analysis which may have confounded the results due to differences in
investigator training and lack of standardisation of the reporting process.
However, other incident report studies utilising larger samples have
reported similar results. Jones and Endsley (1996) analysed 143
performance-related incident reports. Results reported 61 % of
performance-related incidents included perception errors. The replication of
these findings suggest that vigilance is a crucial element of the ATC task,
and it can be stated with some confidence that declines of vigilance and
errors of perception can occur with potentially fatal consequences. Further
research is required to address the controversy between results from
relatively limited experimental data and Incident report analyses finding a
dominance of vigilance issues in the ATC domain.
A working definition of vigilance was selected to be 'ability to pay
continuous attention to an environmental field for a period of time to
detect particular changes which Is affected by alertness'. This is very
similar to the ATM-related Skybrary definition ("ability to pay close and
continuous attention to a field of stimulation for a period of time, watchful
for any particular changing circumstances") but was adapted to include
frequently cited elements of vigilance from the literature, such as
sustained attention, target detection and the influence of alertness levels.
In conclUSion, vigilance or sustained attention is a specific type of
attention that is critical to the ATC task. Controllers have to maintain both
visual and auditory vigilance In order to ensure the safe and expeditious
flight of aircraft. Vigilance decrements can result in negative consequences
to performance and safety. Through Incident report analyses and
simulation studies, it has been reported that declines/failures of Vigilance,
such as missed or late detections, occur during the ATe task, resulting in
potential safety risk (i.e. Shorrock, 2007). However, further research Is
needed to understand the extent of the pervasiveness and implications of
34
Chapter 2. literature review of human factors in relation to performance and human factor relationships in air tr affic control
vigilance decline within the specialised population of air traffic controllers
and the ATe domain.
2.2.2.3 Situation awareness
Despite an extensive debate in the literature concerning the definition and
meaning of situation awareness (SA) (e.g. Dekker & Hollnagel, 2004;
Dekker & Woods, 2002; Parasuraman et aL, 2008; Sarter and Woods,
1991). Parasuraman et aL, (2008) argue that a substantial body of
research now supports the utility of the construct of SA. It is beyond the
scope of this review to consider this debate, except to emphaSise the lack
of a universally accepted definition or conceptualization of SA (Salas,
Prince, Baker & Shrestha, 1995). SA is recognised to be both a process
and a product of that process (Dominguez, 1994; Salas et aL, 1995).
Endsley (1988) proposes that the process of SA is "the perception of the
elements in the environment within a volume of time and space, the
comprehension of their meaning, and the projection of their status in the
near future" (p97). Inherent in Endsley's (1988) commonly cited definition
is the assumption that situation awareness (SA) is categorized into three
distinct levels. Levell SA begins with a situation assessment, and
incorporates attending to and perceiving the surrounding environment and
the techniques needed to complete this such as visual scanning. Level 2
involves understanding of the current surroundings/situation. Finally, level
3 includes the prediction of the situation or surroundings in the near future
(Endsley, 1995). SA is dynamic and the repetition of the process
continuously updates understanding of the environment (Parasuraman et
aL, 2008). SA can also describe the product of the process. SA as a
product is defined as "the knowledge that results when attention is
allocated to a zone of interest" (Fracker, 1988, pl02). The process of
developing and maintaining SA, and the resulting SA product may have a
bi-directional relationship. Sarter and Woods (1991) suggest that situation
assessments result in perception which informs the SA product. This
mental representation subsequently primes the individual to attend to
specific information in the environment.
A distinction can be made between the concepts of individual SA
and team SA. Team SA refers to a shared or distributed awareness or
mental representation of the environment between team members (Salas
et aI., 1995). However, as this research focuses on individuals' human
35
Chapter 2. literature review of human factors in relation to performance and human factor relationships in air traffic control
performance, individual SA only will be reviewed in this section and for the
remainder of the research.
Within ATC, ATCOs must continually assess dynamic information
sources to develop a mental representation of aircraft in 3D space and
prOjected future aircraft locations. Simultaneously, other relevant
information such as speed, destination, and size are assessed and
integrated into the representation. Controllers call this 'the picture'
(Endsley & Rodgers, 1994). Whitfield (1979) investigated the concept of
'the picture' through verbal data from controllers. Results suggested that
controllers reported the picture to be a geographical representation.
Whitfield (1979) concluded that the picture supplies information to the
controller, from which to plan and project situations. Both static (e.g.
knowledge about airspace structure) and dynamic (e.g. aircraft information)
data were represented in the picture. Both controllers (Mogford, 1997) and
researchers (Endsley & Rodgers, 1994) have stated that the picture Is
essential for effective air traffic control.
Endsley (199Sa) suggests that a number of task and system factors
influence an operator's achievement of SA, including task complexity,
workload, and active control vs. passive monitoring. It is therefore
important to consider the development of SA in the context of the situation.
Situation awareness (SA) is important for successful performance in
ATC (Endsley & Rodgers, 1994). A large body of research has found that
adequate SA supports correct decision making (Mogford, 1997) and SA has
therefore been recognised to be necessary for the controller to select
appropriate action (Rognin & Blanquart, 2001). It is Important to note that
although SA supports selection of an appropriate response, additional
processes mediate this relationship. Inadequate or complete loss of SA
may negatively influence performance. 'Losing the picture' is a colloquial
term for the controllers' temporary loss of the 3-dimensional mental
representation. This loss makes it hard to control traffic safely. Simulation
studies have reported findings of a relationship between SA and controller
performance. Mogford (1997) Investigated the relationship between SA and
performance in an ATC simulation study with 37 ATeO students as
partiCipants. The simulation was frozen after 20 minutes; eight aircraft
were active on screen. Participants were not aware when the simulation
would be frozen. PartiCipants were given a paper map of the sector, and
asked to write aircraft positions and relevant aircraft data of the aircraft
36
Chapter 2. literature review of human factors in relation to performance and human factor relationships in air traffic control
under control at the time the simulation was frozen. Results indicated that
students prioritised aircraft information. On average, aircraft position
(86%), heading (82%) and altitude (73%) were recalled most frequently.
Only 55% of students accurately recalled 2 or more figures from the
aircraft identifier, and 53% accurately recalled speed. However, trainees
who had recalled aircraft altitude as well as heading were found to be
scored higher overall on performance. Mogford (1997) hypothesised that
these were salient components of SA. Trainees could retain a minimum but
adequate set of data to assist in the comprehension and projection of
aircraft, therefore contributing to identification of conflicting trajectories.
Mogford (1997) concluded that "insufficient work has been done to
demonstrate the importance of SA for successful task performance" (p331).
Unfortunately, due to the study design, levels of SA could not be linked
with separate performance elements. Further research is therefore
required to link SA levels with task performance.
Data from incident report analyses have also documented
associations between Inadequate SA and performance decline or
performance-related incidents (Rodgers & Nye, 1993). Rodgers and Nye
(1993) conducted an analysis of ATCO operational errors. SA was reported
to be a key contributor, with 57% directly attributed to problems Involving
the radar display. Findings therefore suggest that inadequate SA may be
negatively associated with ATCO performance. It was speculated that
different levels of SA may lead to different errors and severities of
consequences; further research may Investigate this hypothesis in a
controlled, experimental environment.
Controllers may lose part of the picture, such as a single aircraft,
which is negatively aSSOCiated with performance. Kirwan (2011) reports an
investigation into a series of similar ATCO-related loss of separation
incidents. After a full investigation, Kirwan (2011) suggested that the
incidents were occurring through a form of mental filtration, via 'layered
situation awareness'. This concept relates to the demands on the controller;
to facilitate performance, controllers may selectively focus on particular
aircraft of immediate importance. Therefore, other aircraft not demanding
action may become filtered out (Kirwan, 2011). Although this is an
adaptive strategy to manage task demands, the strategy itself resulted in a
partial loss of SA.
37
Chapter 2. Literature review of human factors in relation to performance and human factor relationships in air traffic control
Other hypotheses suggest the decline of SA may result from higher
workloads placing competing demands on spatial working memory,
required for level 3 SA (Wickens et aI., 1997). However, causes for
inadequate SA are likely to be different depending on the level of SA that is
affected. Separate levels of SA and associations with human performance
and error should therefore receive further attention in the literature.
The working definition of SA "maintenance of a coherent mental
picture for current and future events based on continuous extraction of
environmental information, which includes controller performance" was
adapted from the ATC-specific Skybrary definition. This definition
acknowledges the three levels of SA as defined by Endsley (1998), as well
as the continuous and cyclical SA process. The inclusion of a mental picture
recognises SA as a product as well as a process, and the importance of this
mental picture in the controllers' performance. As controllers colloquially
refer to SA as 'the picture' this definitions also incorporates natural
language of an ATC environment.
In conclusion, SA has been repeatedly shown to be essential for the
work of the ATca. Both systems and task factors can contribute to the
operator's ability to achieve SA (Endsley, 1995a), with a dominant
research finding of a negative relationship between taskload or workload
and SA. Adequate SA can support performance, whereas both simulation
studies and incident report analyses have revealed that inadequate, or loss
of SA, can result in declines in performance and safety-related
consequences.
2.2.3 Factors resulting from individuals acting within a team environment
2.2.3.1 Communications
Communication has commonly been Investigated in relation to team
environments (Kankl, Folk, & Irwin, 1991; McKinney, Barker, Smith, &
Davies, 2004). Specific to the ATC domain, most research on ATC
communications has focused "less on the interpersonal component of
communications than on its content and form" (Wickens et aI., 1997,
p140). Therefore, this review will consider the communications construct
and its application to the ATC domain. Teamwork will be reviewed
separately in section 2.2.3.2.
38
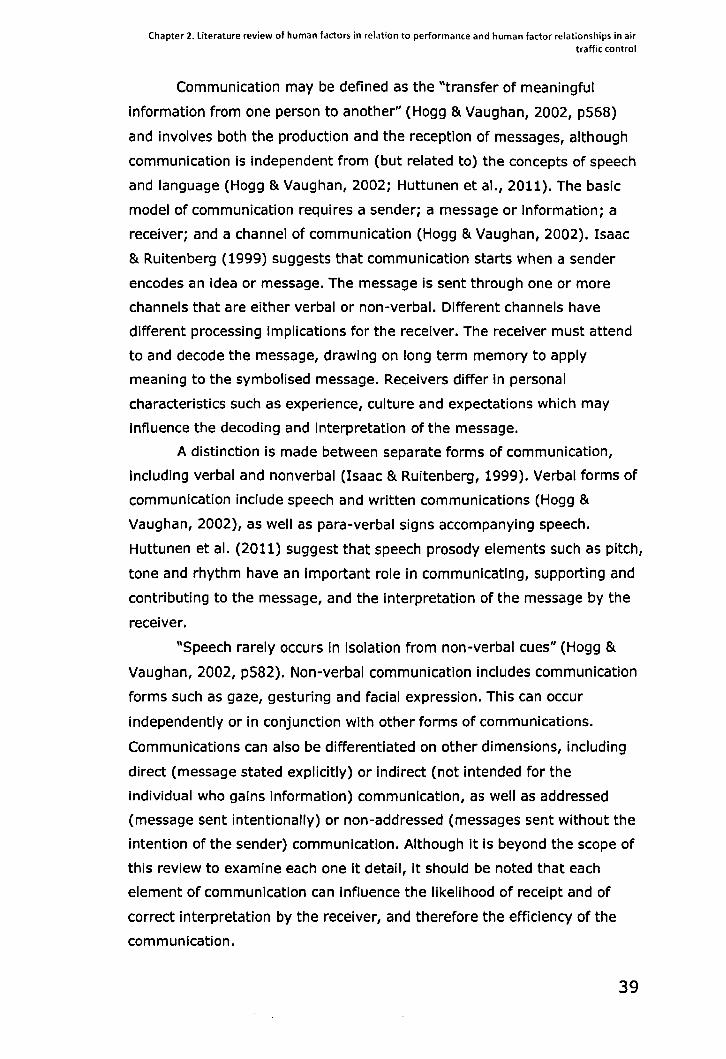
Chapter 2. literature review of human factors in relation to performance and human factor relationships in air traffic control
Communication may be defined as the "transfer of meaningful
information from one person to another" (Hogg & Vaughan, 2002, p568)
and involves both the production and the reception of messages, although
communication is independent from (but related to) the concepts of speech
and language (Hogg & Vaughan, 2002; Huttunen et aI., 2011). The basic
model of communication requires a sender; a message or information; a
receiver; and a channel of communication (Hogg & Vaughan, 2002). Isaac
& Ruitenberg (1999) suggests that communication starts when a sender
encodes an idea or message. The message is sent through one or more
channels that are either verbal or non-verbal. Different channels have
different processing implications for the receiver. The receiver must attend
to and decode the message, drawing on long term memory to apply
meaning to the symbolised message. Receivers differ in personal
characteristics such as experience, culture and expectations which may
influence the decoding and interpretation of the message.
A distinction is made between separate forms of communication,
including verbal and nonverbal (Isaac & Ruitenberg, 1999). Verbal forms of
communication include speech and written communications (Hogg &
Vaughan, 2002), as well as para-verbal signs accompanying speech.
Huttunen et al. (2011) suggest that speech prosody elements such as pitch,
tone and rhythm have an important role in communicating, supporting and
contributing to the message, and the interpretation of the message by the
receiver.
"Speech rarely occurs in isolation from non-verbal cues" (Hogg &
Vaughan, 2002, pS82). Non-verbal communication includes communication
forms such as gaze, gesturing and facial expression. This can occur
independently or in conjunction with other forms of communications.
Communications can also be differentiated on other dimensions, including
direct (message stated explicitly) or indirect (not intended for the
individual who gains information) communication, as well as addressed
(message sent intentionally) or non-addressed (messages sent without the
Intention of the sender) communication. Although it is beyond the scope of
this review to examine each one it detail, it should be noted that each
element of communication can influence the likelihood of receipt and of
correct interpretation by the receiver, and therefore the efficiency of the
communication.
39
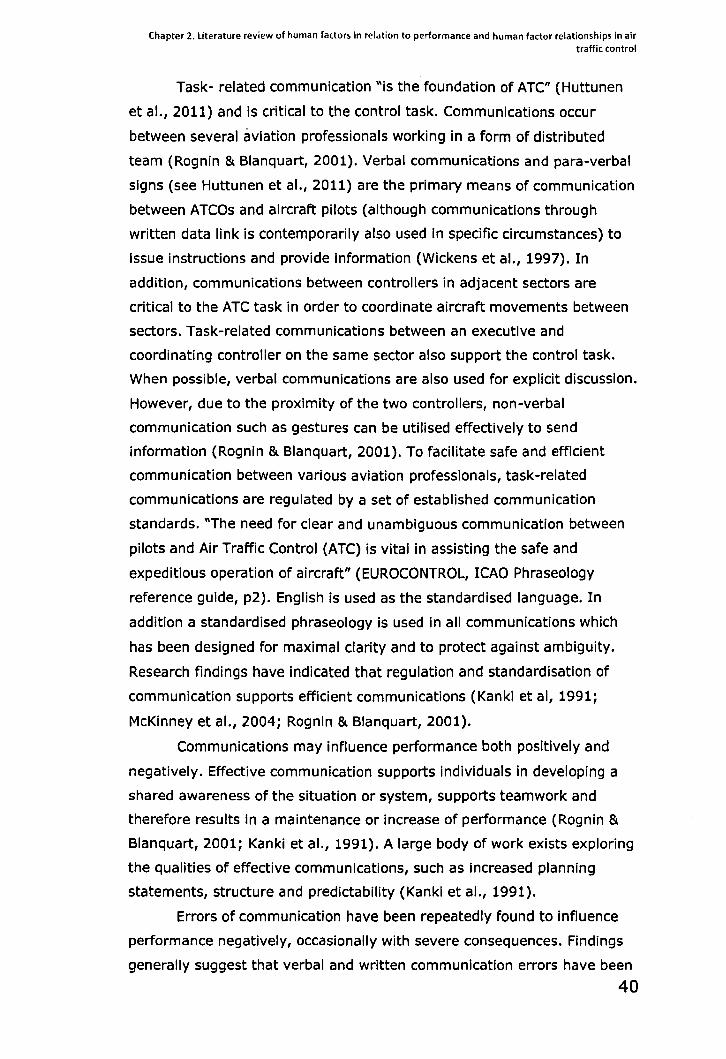
Chapter 2. literature review of human factors in relation to performance and human factor relationships in air traffic control
Task- related communication "is the foundation of ATC" (Huttunen
et aI., 2011) and is critical to the control task. Communications occur
between several aviation professionals working in a form of distributed
team (Rognin & Blanquart, 2001). Verbal communications and para-verbal
signs (see Huttunen et aI., 2011) are the primary means of communication
between ATCOs and aircraft pilots (although communications through
written data link is contemporarily also used in specific Circumstances) to
issue instructions and provide information (Wickens et aI., 1997). In
addition, communications between controllers in adjacent sectors are
critical to the ATC task in order to coordinate aircraft movements between
sectors. Task-related communications between an executive and
coordinating controller on the same sector also support the control task.
When possible, verbal communications are also used for explicit discussion.
However, due to the proximity of the two controllers, non-verbal
communication such as gestures can be utilised effectively to send
information (Rognin & Blanquart, 2001). To facilitate safe and efficient
communication between various aviation professionals, task-related
communications are regulated by a set of established communication
standards. "The need for clear and unambiguous communication between
pilots and Air Traffic Control (ATC) is vital in assisting the safe and
expeditious operation of aircraft" (EUROCONTROL, ICAO Phraseology
reference guide, p2). English is used as the standardised language. In
addition a standardised phraseology is used in all communications which
has been designed for maximal clarity and to protect against ambiguity.
Research findings have indicated that regulation and standardisation of
communication supports efficient communications (Kanki et ai, 1991;
McKinney et aI., 2004; Rognin & Blanquart, 2001).
Communications may influence performance both positively and
negatively. Effective communication supports individuals in developing a
shared awareness of the situation or system, supports teamwork and
therefore results in a maintenance or increase of performance (Rognin &
Blanquart, 2001; Kanki et aI., 1991). A large body of work exists exploring
the qualities of effective communications, such as Increased planning
statements, structure and predictability (Kankl et aI., 1991).
Errors of communication have been repeatedly found to influence
performance negatively, occasionally with severe consequences. Findings
generally suggest that verbal and written communication errors have been
40
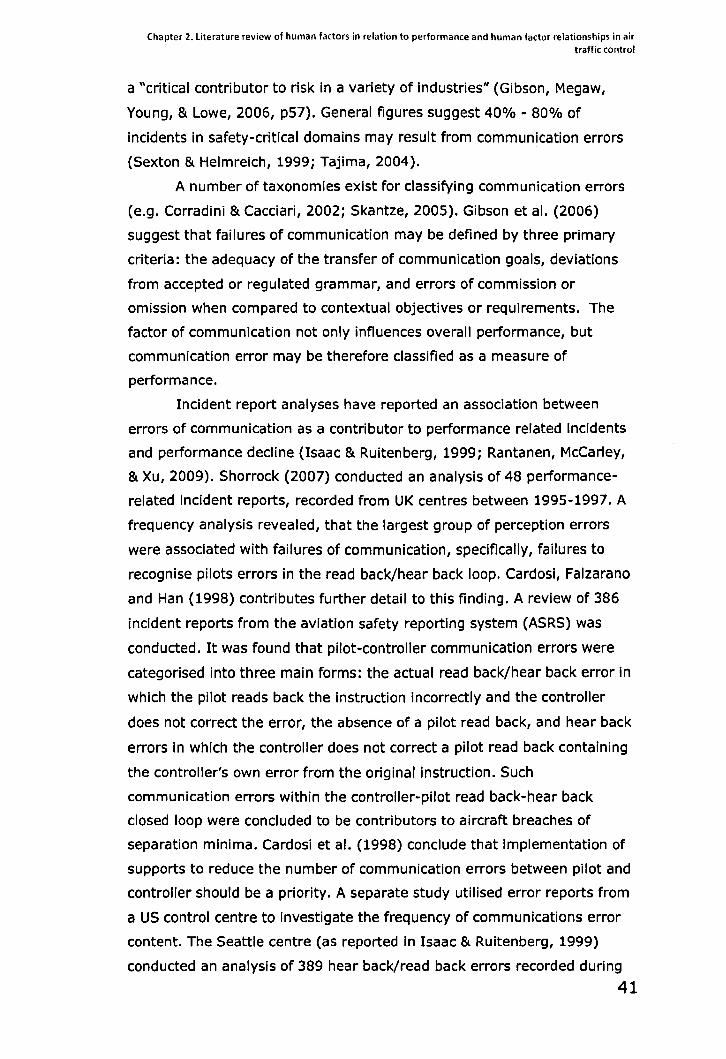
Chapter 2. literature review of human factors in relation to performance and human factor relationships in air traffic control
a "critical contributor to risk in a variety of industries" (Gibson, Megaw,
Young, & Lowe, 2006, p57). General figures suggest 40% - 80% of
incidents in safety-critical domains may result from communication errors
(Sexton & Helmreich, 1999; Tajima, 2004).
A number of taxonomies exist for classifying communication errors
(e.g. Corradini & Cacciari, 2002; Skantze, 2005). Gibson et al. (2006)
suggest that failures of communication may be defined by three primary
criteria: the adequacy of the transfer of communication goals, deviations
from accepted or regulated grammar, and errors of commission or
omission when compared to contextual objectives or requirements. The
factor of communication not only influences overall performance, but
communication error may be therefore classified as a measure of
performance.
Incident report analyses have reported an association between
errors of communication as a contributor to performance related incidents
and performance decline (Isaac & Ruitenberg, 1999; Rantanen, McCarley,
& Xu, 2009). Shorrock (2007) conducted an analysis of 48 performance
related incident reports, recorded from UK centres between 1995-1997. A
frequency analysis revealed, that the largest group of perception errors
were associated with failures of communication, specifically, failures to
recognise pilots errors in the read back/hear back loop. Cardosi, Falzarano
and Han (1998) contributes further detail to this finding. A review of 386
incident reports from the aviation safety reporting system (ASRS) was
conducted. It was found that pilot-controller communication errors were
categorised into three main forms: the actual read back/hear back error in
which the pilot reads back the instruction incorrectly and the controller
does not correct the error, the absence of a pilot read back, and hear back
errors in which the controller does not correct a pilot read back containing
the controller's own error from the original instruction. Such
communication errors within the controller-pilot read back-hear back
closed loop were concluded to be contributors to aircraft breaches of
separation minima. Cardosi et al. (1998) conclude that Implementation of
supports to reduce the number of communication errors between pilot and
controller should be a priority. A separate study utilised error reports from
a US control centre to investigate the frequency of communications error
content. The Seattle centre (as reported In Isaac & Ruitenberg, 1999)
conducted an analysiS of 389 hear back/read back errors recorded during
41
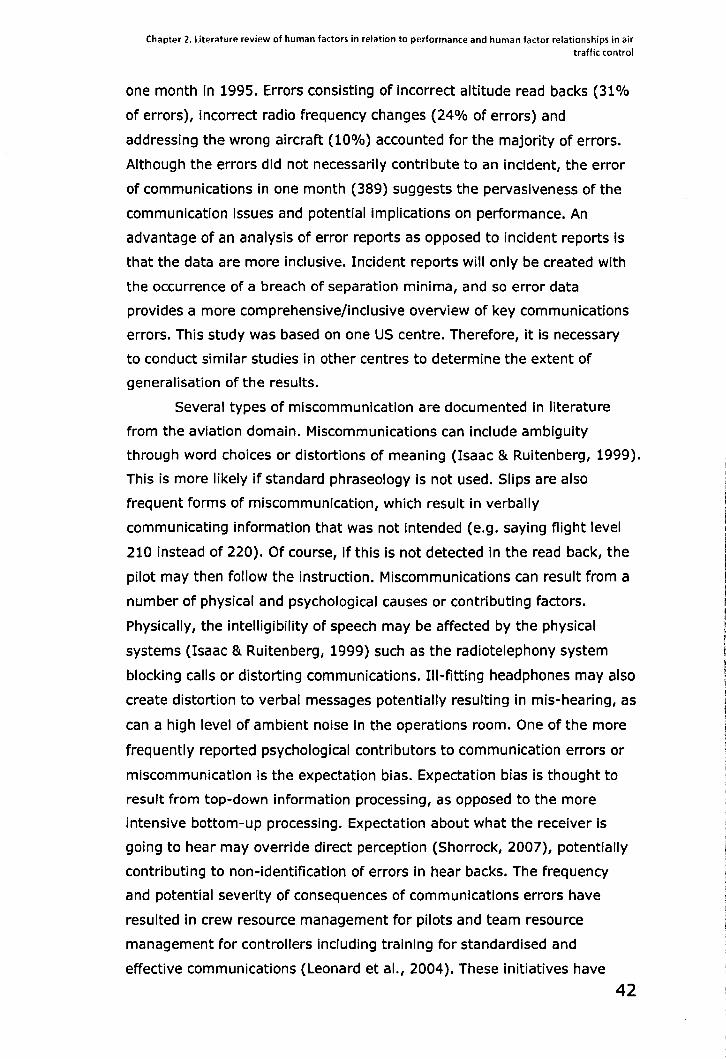
Chapter 2. literature review of human factors in relation to performance and human factor relationships in air traffic control
one month in 1995. Errors consisting of incorrect altitude read backs (31%
of errors), incorrect radio frequency changes (24% of errors) and
addressing the wrong aircraft (10%) accounted for the majority of errors.
Although the errors did not necessarily contribute to an incident, the error
of communications in one month (389) suggests the pervasiveness of the
communication issues and potential implications on performance. An
advantage of an analysis of error reports as opposed to incident reports is
that the data are more inclusive. Incident reports will only be created with
the occurrence of a breach of separation minima, and so error data
provides a more comprehensive/inclusive overview of key communications
errors. This study was based on one US centre. Therefore, it is necessary
to conduct similar studies in other centres to determine the extent of
generalisation of the results.
Several types of miscommunication are documented In literature
from the aviation domain. Miscommunications can include ambiguity
through word choices or distortions of meaning (Isaac & Ruitenberg, 1999).
This is more likely if standard phraseology is not used. Slips are also
frequent forms of miscommunication, which result in verbally
communicating information that was not intended (e.g. saying flight level
210 instead of 220). Of course, if this is not detected in the read back, the
pilot may then follow the instruction. Miscommunications can result from a
number of physical and psychological causes or contributing factors.
Physically, the intelligibility of speech may be affected by the physical
systems (Isaac & RUitenberg, 1999) such as the radiotelephony system
blocking calls or distorting communications. III-fitting headphones may also
create distortion to verbal messages potentially resulting in mis-hearing, as
can a high level of ambient nOise In the operations room. One of the more
frequently reported psychological contributors to communication errors or
miscommunication is the expectation bias. Expectation bias is thought to
result from top-down information processing, as opposed to the more
intensive bottom-up processing. Expectation about what the receiver is
going to hear may override direct perception (Shorrock, 2007), potentially
contributing to non-identification of errors in hear backs. The frequency
and potential severity of consequences of communications errors have
resulted in crew resource management for pilots and team resource
management for controllers including training for standardised and
effective communications (Leonard et aI., 2004). These initiatives have
42
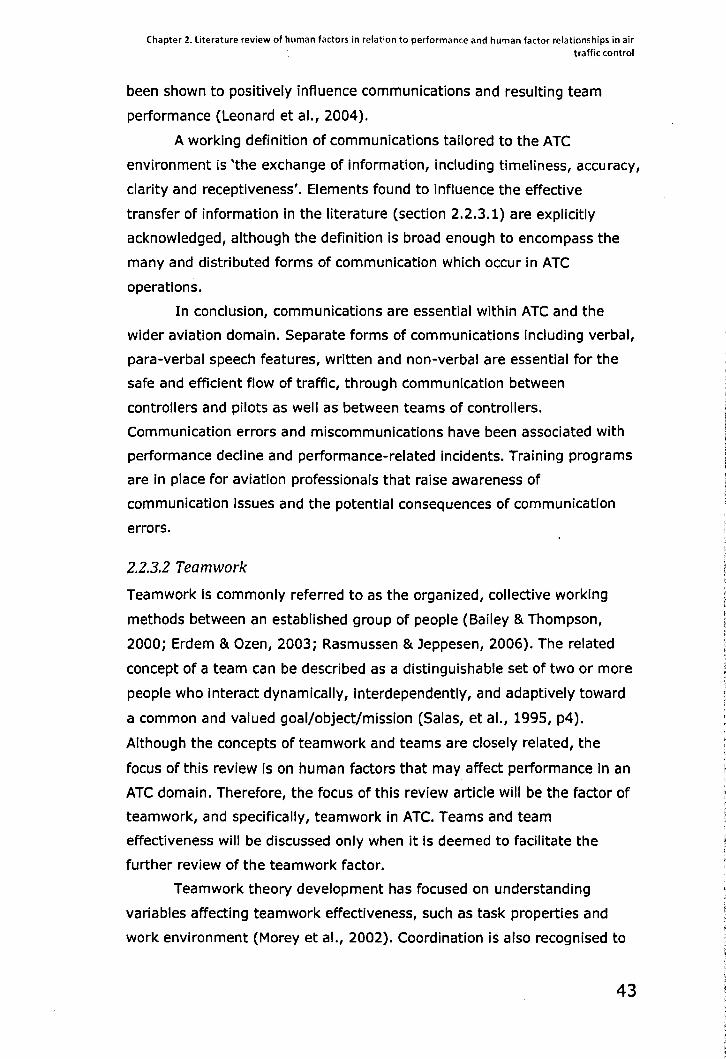
Chapter 2. literature review of human factors in relation to performan(e and human factor relationships in air traffic control
been shown to positively influence communications and resulting team
performance (Leonard et aI., 2004).
A working definition of communications tailored to the ATC
environment is 'the exchange of information, including timeliness, accuracy,
clarity and receptiveness'. Elements found to influence the effective
transfer of information in the literature (section 2.2.3.1) are explicitly
acknowledged, although the definition is broad enough to encompass the
many and distributed forms of communication which occur in ATC
operations.
In conclusion, communications are essential within ATC and the
wider aviation domain. Separate forms of communications including verbal,
para-verbal speech features, written and non-verbal are essential for the
safe and efficient flow of traffic, through Communication between
controllers and pilots as well as between teams of controllers.
Communication errors and miscommunications have been associated with
performance decline and performance-related incidents. Training programs
are in place for aviation professionals that raise awareness of
communication Issues and the potential consequences of communication
errors.
2.2.3.2 Teamwork
Teamwork is commonly referred to as the organized, collective working
methods between an established group of people (Bailey & Thompson,
2000; Erdem & Ozen, 2003; Rasmussen & Jeppesen, 2006). The related
concept of a team can be described as a distinguishable set of two or more
people who interact dynamically, interdependently, and adaptively toward
a common and valued goal/object/mission (Salas, et aI., 1995, p4).
Although the concepts of teamwork and teams are closely related, the
focus of this review is on human factors that may affect performance in an
ATC domain. Therefore, the focus of this review article will be the factor of
teamwork, and specifically, teamwork in ATC. Teams and team
effectiveness will be discussed only when it Is deemed to facilitate the
further review of the teamwork factor.
Teamwork theory development has focused on understanding
variables affecting teamwork effectiveness, such as task properties and
work environment (Morey et aI., 2002). Coordination Is also recognised to
43
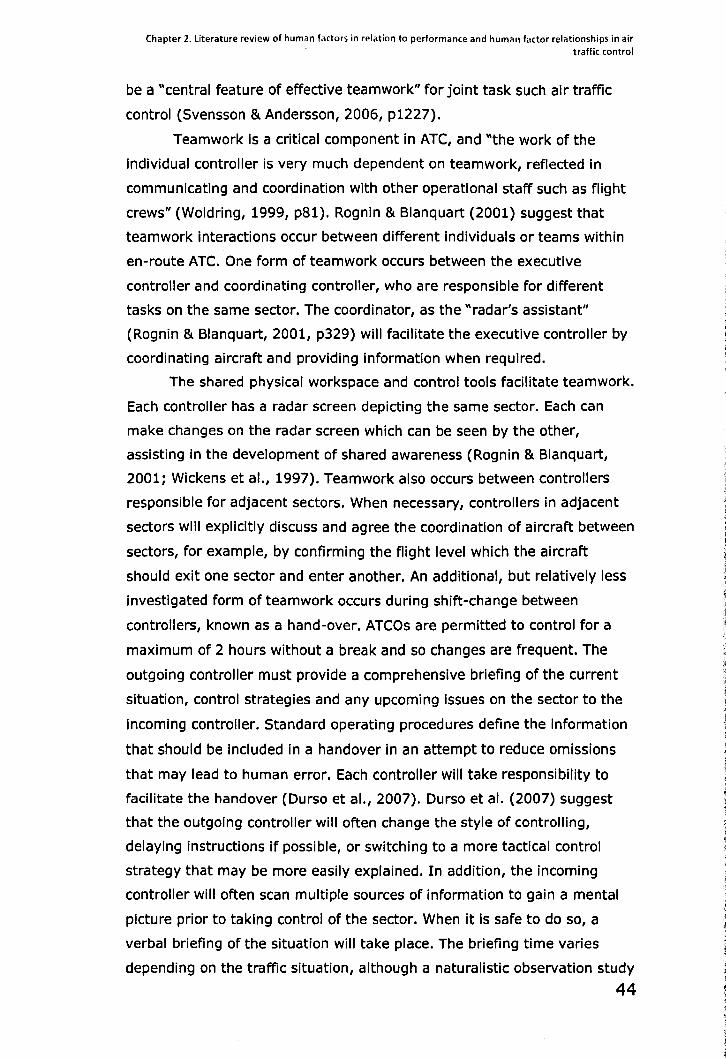
Chapter 2. literature review of human factors in relation to performance and human factor relationships in air traffic control
be a "central feature of effective teamwork" for joint task such air traffic
control (Svensson & Andersson, 2006, p1227).
Teamwork is a critical component in ATC, and "the work of the
Individual controller is very much dependent on teamwork, reflected in
communicating and coordination with other operational staff such as flight
crews" (Woldring, 1999, pBl). Rognin & Blanquart (2001) suggest that
teamwork interactions occur between different individuals or teams within
en-route ATC. One form of teamwork occurs between the executive
controller and coordinating controller, who are responsible for different
tasks on the same sector. The coordinator, as the "radar's assistant"
(Rognin & Blanquart, 2001, p329) will facilitate the executive controller by
coordinating aircraft and providing information when required.
The shared physical workspace and control tools facilitate teamwork.
Each controller has a radar screen depicting the same sector. Each can
make changes on the radar screen which can be seen by the other,
assisting in the development of shared awareness (Rognin & Blanquart,
2001; Wickens et aL, 1997). Teamwork also occurs between controllers
responsible for adjacent sectors. When necessary, controllers in adjacent
sectors will explicitly discuss and agree the coordination of aircraft between
sectors, for example, by confirming the flight level which the aircraft
should exit one sector and enter another. An additional, but relatively less
investigated form of teamwork occurs during shift-change between
controllers, known as a hand-over. ATCOs are permitted to control for a
maximum of 2 hours without a break and so changes are frequent. The
outgoing controller must provide a comprehensive briefing of the current
Situation, control strategies and any upcoming issues on the sector to the
incoming controller. Standard operating procedures define the information
that should be included in a handover in an attempt to reduce omissions
that may lead to human error. Each controller will take responsibility to
facilitate the handover (Durso et aL, 2007). Durso et aL (2007) suggest
that the outgoing controller will often change the style of controlling,
delaying instructions if possible, or switching to a more tactical control
strategy that may be more easily explained. In addition, the incoming
controller will often scan multiple sources of information to gain a mental
picture prior to taking control of the sector. When it Is safe to do so, a
verbal briefing of the situation will take place. The briefing time varies
depending on the traffic Situation, although a naturalistic observation study
44
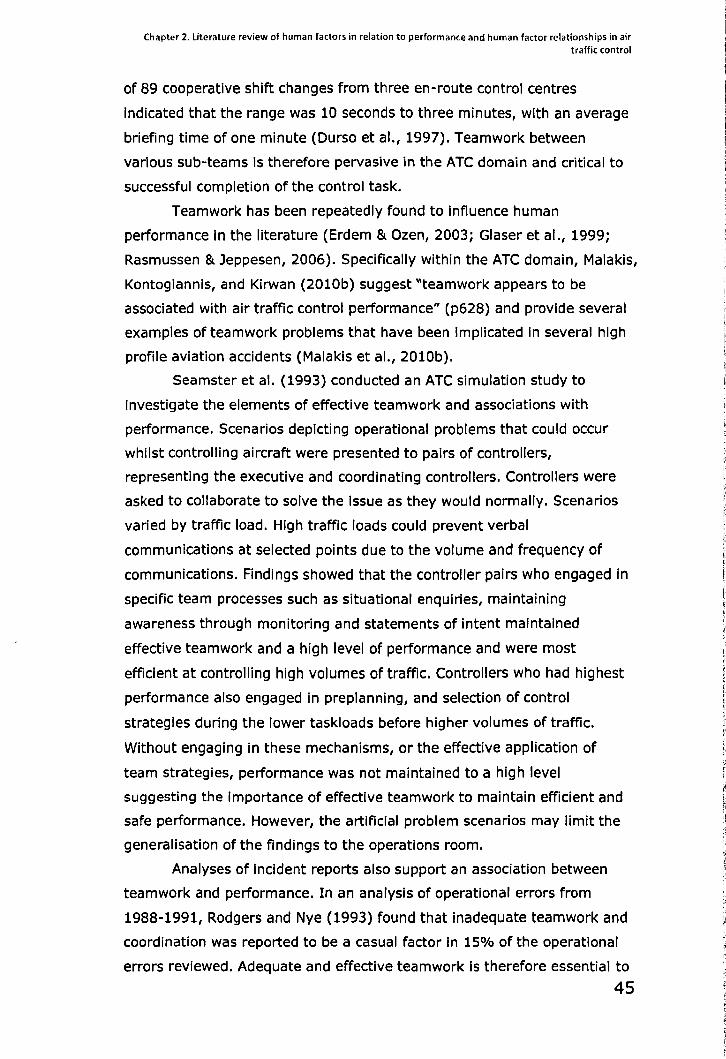
Chapter 2. literature review of human factors in relation to performance and human factor relationships in air traffic control
of 89 cooperative shift changes from three en-route control centres
indicated that the range was 10 seconds to three minutes, with an average
briefing time of one minute (Durso et aI., 1997). Teamwork between
various SUb-teams Is therefore pervasive in the ATC domain and critical to
successful completion of the control task.
Teamwork has been repeatedly found to Influence human
performance in the literature (Erdem & Ozen, 2003; Glaser et aI., 1999;
Rasmussen & Jeppesen, 2006). Specifically within the ATC domain, Malakis,
Kontogiannis, and Kirwan (2010b) suggest "teamwork appears to be
associated with air traffic control performance" (p628) and provide several
examples of teamwork problems that have been implicated in several high
profile aviation accidents (Malakis et aI., 2010b).
Seamster et al. (1993) conducted an ATC simulation study to
investigate the elements of effective teamwork and associations with
performance. Scenarios depicting operational problems that could occur
whilst controlling aircraft were presented to pairs of controllers,
representing the executive and coordinating controllers. Controllers were
asked to collaborate to solve the Issue as they would normally. Scenarios
varied by traffic load. High traffiC loads could prevent verbal
communications at selected points due to the volume and frequency of
communications. Findings showed that the controller pairs who engaged In
specific team processes such as situational enquiries, maintaining
awareness through monitoring and statements of intent maintained
effective teamwork and a high level of performance and were most
efficient at controlling high volumes of traffic. Controllers who had highest
performance also engaged in preplanning, and selection of control
strategies during the lower taskloads before higher volumes of traffic.
Without engaging in these mechanisms, or the effective application of
team strategies, performance was not maintained to a high level
suggesting the importance of effective teamwork to maintain efficient and
safe performance. However, the artificial problem scenarios may limit the
generalisation of the findings to the operations room.
Analyses of Incident reports also support an aSSOCiation between
teamwork and performance. In an analysis of operational errors from
1988-1991, Rodgers and Nye (1993) found that inadequate teamwork and
coordination was reported to be a casual factor In 15% of the operational
errors reviewed. Adequate and effective teamwork Is therefore essential to
45
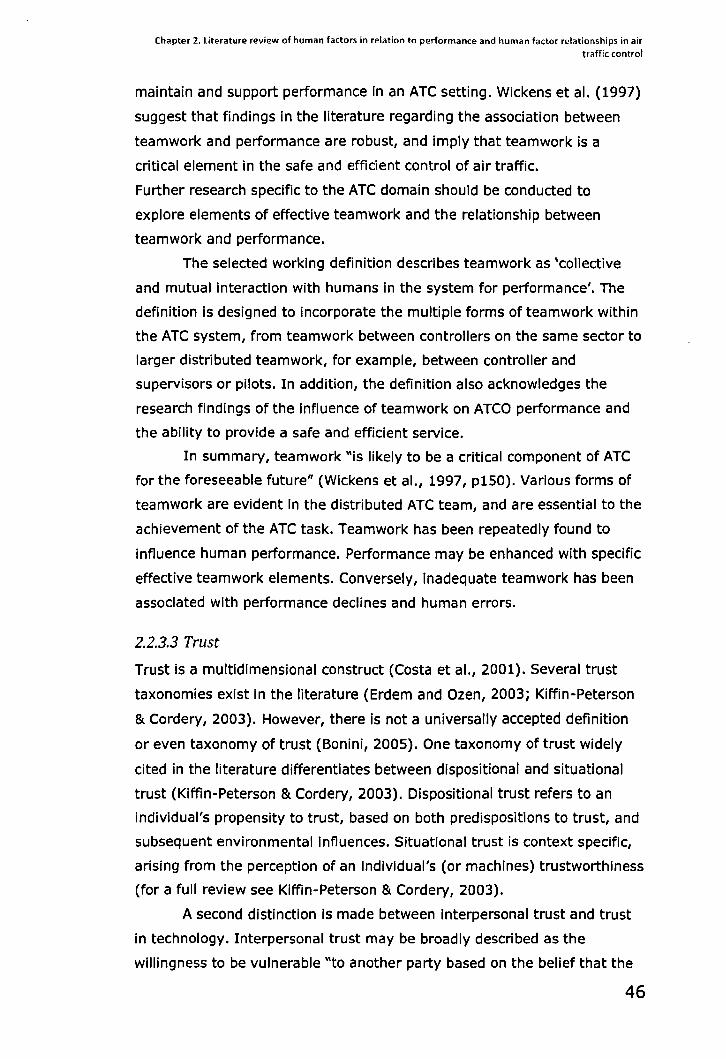
Chapter 2. literature review of human factors in relation to performance and human factor relationships in air traffic control
maintain and support performance in an ATC setting. Wickens et aL (1997)
suggest that findings in the literature regarding the association between
teamwork and performance are robust, and imply that teamwork is a
critical element in the safe and efficient control of air traffic.
Further research specific to the ATC domain should be conducted to
explore elements of effective teamwork and the relationship between
teamwork and performance.
The selected working definition describes teamwork as 'collective
and mutual interaction with humans in the system for performance'. The
definition is designed to incorporate the multiple forms of teamwork within
the ATC system, from teamwork between controllers on the same sector to
larger distributed teamwork, for example, between controller and
supervisors or pilots. In addition, the definition also acknowledges the
research findings of the influence of teamwork on ATCO performance and
the ability to provide a safe and efficient service.
In summary, teamwork "is likely to be a critical component of ATC
for the foreseeable future" (Wickens et aL, 1997, plS0). Various forms of
teamwork are evident in the distributed ATC team, and are essential to the
achievement of the ATC task. Teamwork has been repeatedly found to
influence human performance. Performance may be enhanced with specific
effective teamwork elements. Conversely, inadequate teamwork has been
associated with performance declines and human errors.
2.2.3.3 Trust
Trust is a multidimensional construct (Costa et aL, 2001). Several trust
taxonomies exist in the literature (Erdem and Ozen, 2003; Kiffin-Peterson
& Cordery, 2003). However, there is not a universally accepted definition
or even taxonomy of trust (Bonini, 2005). One taxonomy of trust widely
cited in the literature differentiates between dispositional and situational
trust (Kiffin-Peterson & Cordery, 2003). Dispositional trust refers to an
individual's propensity to trust, based on both predispositions to trust, and
subsequent environmental influences. Situational trust is context specific,
arising from the perception of an individual's (or machines) trustworthiness
(for a full review see Kiffin-Peterson & Cordery, 2003).
A second distinction Is made between interpersonal trust and trust
in technology. Interpersonal trust may be broadly described as the
willingness to be vulnerable "to another party based on the belief that the
46
Chapter 2. literature review of human factors in relation to performance and human factor relationships in air traffic control
latter party is competent, open, concerned and reliable" (Mishra, 1996,
p265). A distinction can be made between cognitive trust, defined as a
logical belief that an individual is trustworthy, and affective trust, defined
as a product of an emotion or feeling that an individual is trustworthy
(Erdem and Ozen, 2003). Erdem and Ozen (2003) suggest that cognitive
trust is most important at the beginning of an interpersonal relationship,
whereas affective trust becomes increasingly important for the
development of a long-term relationship. Trust in technology has been
defined as an intervening variable that mediates between the system and
an operator's interaction strategy with the system (Muir, 1994). Research
findings suggest that if an operator does not trust the system, it will not be
used (Muir & Moray, 1996). Lee & Moray (1992) and Muir and Moray (1996)
developed a dynamic model of human-machine trust. The model assumes
that trust is continuously updated based on previous levels of trust and
current experience of the system. The development of trust in systems
may therefore be an interactive process and can be considered as both an
effect and a cause.
In the air traffic domain, both interpersonal trust and trust in
technology are essential for the system to function correctly (Bonini,
Jackson & McDonald, 2001). ATCOs have been recorded to consider trust
"as important in their work in terms of their relations with colleagues,
pilots and management; as well as with regard to their attitude towards
technology" (Bonini, 2001, p450). Specific to the ATC context, trust has
therefore been defined as belief in others' ability and confidence in the
system (Bonini et aI., 2001). Interpersonal trust is recognised to have an
important role in ATC. Controllers must rely on other controllers, pilots and
other aviation professionals to effectively achieve the control task. For
example, controllers trust that pilots will respond to instructions;
controllers are also dependent on relevant Information provided by
colleagues. Throughout these multiple relationships, trust in the individual
is critical to cooperation, and ultimately, adequate teamwork (Bonini 2005).
Colleagues' characteristics have been found to influence the development
of interpersonal trust (Bonini et aI., 2001). Bonini et al. (2001) conducted
a questionnaire study with 52 en-route ATCOs. Questions related to
interpersonal trust, as well as related concepts such as belief and mistrust.
Findings revealed that colleagues who appeared confident were more likely
to be trusted. In addition, perception of competence influenced the
47
Chapter 2. literature review of human factors in relation to performance and human factor relationships in air traffic control
development of trust. Experience was found to moderate trust. Controllers
reported that experience enabled them to know when to trust and when to
distrust. Overall, "competence and personality were the variables that
were considered t influence most whether they trusted fellow controllers or
not" (Bonini et aI., 2001, p107). An advantage of a questionnaire study is
that the data is generated from experts in the field and so has ecological
validity. However, the actual relationship between these influences and the
development of trust cannot be further explored. Further research in
controlled experimental settings would enable tighter control over the
documented influences of trust development, and could extend findings
through examining this relationship.
Trust in technology is essential to system performance in ATC
(Bonini, 2001). In this context, trust refers to confidence in the equipment
and the dependability of information. Rising air traffic has resulted in
frequent system modifications and additions within control centres. In
order to be effective, it is essential that new technology and tools are
accepted and used by controllers. Both acceptance and use of technology
have been repeatedly found to be related to trust in the technology
(Eidelkind & Papantonopoulos, 1997; Muir, 1988). Trust is therefore critical
to facilitate the use of technology. Factors influencing the development of
trust in technology have been reported to include ease of use as well as
proof of reliability and usefulness (Bonini et al., 2001). The Influence of the
proof of reliability is believed to influence the development of trust in
systems over time, with controllers reporting more trust in the technology
that has been in use for longer, such as radar (Bonini, 2001; Lee 1992).
Trust (both interpersonal and trust in technology) has been
frequently reported to influence human performance (Bonini, 2005, p13;
Costa et aI., 2001). More specifically, the decision of whether to trust an
individual or system, and the appropriateness of that decision in the given
context, influences the resulting influence on performance. Research is
limited regarding the association between trust and performance (Costa et
aI., 2001), especially research within the ATC domain. This section will
therefore review trust and performance related to the ATC domain but will
supplement findings where appropriate with research from other safety
critical domains. Findings from the psychological literature on Interpersonal
trust record a robust positive correlation between interpersonal trust and
team working. As an extension of this, trust and teamwork Influence
48

Chapter 2. literature review of human factors in relation to performance and human factor relationships in air traffic control
overall performance. The relationship between these two factors is
discussed in detail in 2.3.3.3. Research findings suggest that interpersonal
trust may also lead to a reduction in human error (e.g. Erdem and Ozen,
2003). Trust in technology is believed to influence performance through
'miscalibration' (Wickens, 2002; Wickens et aI., 1997). When an unfamiliar
technology is used, calibration is said to occur between operators and the
system. This process incorporates the operator understanding when it is
appropriate to trust or not trust the technology (Bonini et aI., 2001;
Wickens et aI., 1997). A miscalibration between the operator and
technology can result in mistrust or over-trust (leading to complacency),
each with specific implications for performance. Inappropriate mistrust
may result in an inappropriate lack of technology use, potentially resulting
in reduced efficiency or even a reduction in safe performance (Wickens et
aI., 1997).
The concept of over-trust in aviation has been more frequently
investigated, dominantly in relation to automation. Over-trust of
technology can result in complacency or overreliance on the technology
which has been shown to be negatively related to vigilance and monitoring
behaviour (Muir & Moray, 1996). Muir and Moray (1996) investigated
operators' perception of trust in the technology, and the performance of
the operator when using the system. A strong negative correlation was
reported between trust in the machine and monitoring. Muir and Moray
(1996) concluded that over-trust had influenced the control strategy
selected by the operator, which minimised monitoring. Overreliance on
technology may be used as a heuristic replacement for vigilance
information seeking and processing. Data from incident reports also
suggest an association between over-trust and overreliance in technology
and performance decline or performance-related incidents. In an analysis
of ASRS incident reports, monitoring failures were associated with
overreliance on automation (MOSier, Skitka, & Korte, 1994). Although a
direct relationship cannot be determined from incident report data, the
pattern of over-trust and performance decline is consistently reported In
the literature (Wickens et al., 1997). The relationship between trust and
performance outcome appears to be indirect. Inappropriate trust (mistrust
or over-trust) in colleagues may result in a lack of checking behaviour or
insufficient teamwork. This reduction of monitoring may then result in
performance decline. Similarly, inappropriate mistrust In systems may
49
Chapter 2. literature review of human factors in relation to performance and human factor relationships in air traffic control
result in a lack of facilitation of performance, whereas over-trust in
technologies may result in a reduction in monitoring, leading to a vigilance
decline. These outcomes may then negatively influence controller
performance.
A working definition of trust specific to ATC is suggested to be 'the
level of confidence In events, people, equipment or circumstances'. This
definition is based on the definition of trust developed for Skybrary, and so
is relevant to the ATC domain. In addition, the definition focuses on the
confidence element of trust, shown to be accepted by controllers (Bonini,
2005), and encompasses a broad range of elements that controllers are
required to trust in ATC.
In summary, trust influences interactions with colleagues and
technology use (Bonini, 2005). Operators experience a period of a
calibration of trust when interacting with an unfamiliar colleague or
technology (i.e. learning when it is appropriate to trust or not trust). An
incorrect calibration can create mismatches between trust and competence,
resulting in potential negative influences on performance effects.
Unfortunately, research which investigates trust and the association with
performance specifically within an ATC environment Is limited (Wickens et
al. 1997). Further research within safety critical domains, and in particular,
ATC, Is needed to further inform the relationship between interpersonal
trust, trust In technology and performance.
2.2.4 Implications of literature review findings relating to human factor associations with performance
A review of literature supported that the nine human factors occur in an
ATC environment. In addition, the review supports that each factor is
associated, positively and/or negatively, with controller performance.
Incident data was frequently utilised to support the association between
the human factors and performance. However, due to the nature of the
data no causal relationship can be confirmed. Further field studies or
controlled experimental studies are required to further Inform the
occurrence of these factors in ATC and any direct or indirect influences on
ATCO performance.
so
Chapter 2. literature review of human factors in relation to performance and human factor relationships in air traffic control
2.3 Human factor interactions: A review of human factor
relationships and associations with performance
The following sections present a review of the literature of the relationships
between the selected nine human factors (workload, fatigue, stress,
attention, vigilance, SA, communications, teamwork, trust). For
consistency, the review is again organised according to the three novel
categories applied in section 2.2. In addition, the factors are considered in
the same order as the previous review. For each factor, the relationship
with other human factors is discussed, and the association of combined,
multiple factors with performance is explored where possible.
Controversies are reviewed, and gaps in research are highlighted.
2.3.1 Factors resulting from interactions between individual and environment
2.3.1.1 Mental workload
The relationship between workload and fatigue is a common area of
research. Bystrom, Hanse and Kjellberg (2004) Investigated the affects of
workload on musculoskeletal symptoms and fatigue. Employees in an
assembly plant completed questionnaires measuring subjective workload,
fatigue and musculo-skeletal complaints. Results revealed that workload
positively related to musculo-skeletal complaints, and significantly,
positively correlated to subjective fatigue (Bystrom et aI., 2004).
Unfortunately, this study did not examine the impact of the workload -
fatigue relationship on human performance. Corrandini and Cacciari (2002)
extended these results by addressing this limitation. Workload, fatigue and
communication errors were investigated in a field study of air traffic
controllers. Radio communications were recorded throughout the
investigation period. Subjective workload measures and objective vigilance
measures were also utilised. Communications were analysed in relation to
vigilance performance, workload, and shift position (morning, afternoon,
night). Results revealed that performance decrements, operationally
defined by increased errors In communication and decreased vigilance,
were observed during periods of lowest workload and highest fatigue.
Workload may therefore impact vigilance. Corrandini and Cacciarl (2002)
concluded that the interaction of these factors potentially affected
performance to a greater extent that the presence of one factor.
51
Chapter 2. literature review of human factors in relation to performance and human factor relationships in air traffic (ontrol
Unfortunately, it is not possible from this study to determine causality of
the relationship between workload and fatigue. A complex interaction
between workload, fatigue and communications, impacting vigilance and
performance was found, although not further explored. Further research
should therefore aim to establish a causal path for these factor interactions.
Smit et al. (2004) isolated the impact of workload on vigilance.
Participants were asked to complete either a low workload or a high
workload vigilance task. The low workload task consisted of a simple target
detection lasting forty minutes. When the letter 'a' was seen, participants
were required to push a button. In the high workload condition, the
stimulus presentation was identical to the low workload condition, but in
this case, participants were told only to push a button on seeing the letter
'a' when preceded by an 'x'. Results revealed a greater decline in vigilance
performance during the high workload task than in the low workload task.
The authors concluded that vigilance decreases as a function of mental
workload (Smit et aI., 2004). The authors explained the results in terms of
attentional resource theory (Wickens, 1984). Attentional resource theory
suggests that each individual has limited cognitive resources that are
depleted by information processing demands. Smit et al. (2004) suggested
that cognitive resources were depleted faster in the high workload
condition, resulting in a more significant negative impact on performance
than the low workload condition.
The effect of workload on situation awareness (SA) is less
researched. Wickens (2002) reviewed the "intertwining of situation
awareness and workload" (p129), and concluded that Individuals who
experience high workload engage in one of many cognitive strategies to
reduce workload, such as task shedding. Consequently, SA cannot be
maintained. It is interesting to note that the engaged cognitive strategies
may therefore act as a moderator of the Impact of workload on SA.
However, Wickens (2002) does not cite empirical research to support this
view, or further expand this hypotheSiS, resulting in little empirical support
for this proposition. The relationship between these factors Is not well
understood in the literature. This is an important gap in current research;
SA is argued to be a contributor to human error-based incidents across
several domains including driving (Matthews, 2002) and aviation (Wickens,
2002). The impact of workload on SA, and subsequently human
performance, is therefore an Important area of further study.
52
Chapter 2. literature review of human factors in relation to performance and human factor relationships in air
traffic control
The relationship between workload and stress has received more
attention in the literature. Psychological stress does not have a universally
accepted definition. However, it may generally be described as an
individual response to the perception of environmental demands and the
perceived and actual ability to of the individual to meet those demands
(Biers, 1984). Glaser et al. (1999) investigated the impact of workload on
stress and performance. Participants were placed in a high or low workload
condition to complete a work simulation task. Participants completed tasks
of a data entry operator, such as reviewing paperwork and entering data
into a computer system. Causal Path analysis results revealed a significant
affect of workload on stress - increased subjective workload resulted in
increases in self-reported stress. An interesting finding was that workload
did not have a direct effect on performance. Glaser et al. (1999) concluded
that stress mediated the workload-performance relationship. A significant
strength of this study was the application of path analysis. This analysis
enabled inferences of causality, which is very limited In the literature
(Glaser et aI., 1999). Further research should examine the relationships
between factors utilising such methods (Glaser et aI., 1999).
Mental workload (referred to as 'workload' throughout this thesis) is
often studied in relation to communications. Two primary lines of research
are evident throughout the literature: affects of workload on
communication errors, and affects of workload on speech characteristics
(pitch, loudness, rate). Prinzo (1998) examined workload and
communication accuracy in an air traffic control (ATC) simulation study.
PartiCipants were placed in a high workload or low workload condition.
Workload was generated by traffic density. Communications were recorded
and analysed in terms of deviations from ATC regulation phrases. The
results showed that in high workload Situations, irregular and abbreviated
communications increased. Prinzo (1998) concluded the increase in
irregularities and abbreviations may result from employed cognitive
strategies that reduced workload by decreasing phrase length. The study
did not investigate these results in relation to error. However,
communication irregularities have been found to contribute to error
(Gibson et aI., 2006), and so it may be hypothesized that the
communication changes may Increase error likelihood.
The second strand of workload-communication research focuses on
the impact of workload on speech characteristics. Brenner, Doherty and
53
Chapter 2. literature review of human factors in relation to performance and human factor relationships in air traffic control
Shipp (1994) utilised a visual tracking task to investigate speech
characteristics under conditions of high and low workload. Brenner et al.
(1994) observed that frequency, rate, and vocal intensity of speech all
increased with workload demands. It was concluded that workload
significantly affected speech characteristics. Rantanen, Maynard and Ozhan
(2005) suggested that speech characteristics may therefore be used as an
online measure of workload. However, research in this area is limited.
Further research should examine the reliability of this measure and assess
the potential for online measurement of workload.
The relationship between workload and communications Is not uni
directional. Casali and Wierwille (1983) used a simulated air traffic control
task to investigate the impact of communications on workload. Casali and
Wierwille (1983) found that as the number of communication phrases rose,
both subjective and objective measures of workload increased. Therefore,
a two-way relationship between communications and workload was
Identified: communications are drivers of workload, and workload is a
driver of communication errors and speech characteristic changes. There
may therefore be the potential for more errors as workload and
communication frequency raises.
In summary, mental workload does significantly interact with other
human factors to produce performance decrements. However, although
many investigations explore factor relationships, there is a general lack of
research establishing the causal directions of those interactions, and
impact of factor interactions on human performance. This knowledge is
important for the potential future prediction of human performance and
error, compared to the current focus on retrospective analysis of error.
Additionally, few studies focus on more than two-factor relationships. This
inhibits the exploration of potential moderator/mediator relationships.
Future research should focus on these elements and address these
research gaps.
2.3.1.2 Fatigue
The interaction of fatigue on vigilance has received attention in the
literature. Matthews (2002) investigated the Interaction of fatigue,
vigilance and workload in a simulated driving task. Participants were
required to complete a driving task and concurrently respond to
Intermittently presented stimuli representing pedestrians. Participants were
54
Chapter 2. literature review of human factors in relation to performance and human factor relationships in air traffic control
allocated to one of two conditions - a control condition in which
participants were required to complete the driving task as normal, or a
fatigue condition. Fatigue was induced by participants engaging in a
cognitively demanding secondary task whilst driving. Driving performance
was recorded and compared between conditions. Results showed that
participants in the control condition responded to more target stimuli than
fatigued participants. Matthews (2002) inferred that fatigue negatively
impacted vigilance. Interestingly, fatigue affects were only observed when
drivers were on straight roads rather than curved roads. It was concluded
that fatigued drivers experienced a loss of motivation to engage sufficient
effort to maintain performance (Matthews, 2002). It may be possible to
explain these results using the attentional resource theory (Wickens, 1984).
This theory suggests that when environmental demands are perceived to
be low, cognitions will be limited so that depleted cognitive resources will
replenish with rest. It may be that at times of low workload, the automatiC
recovery of cognitive resources resulted in impaired performance. Further
research is required to examine this hypothesis. Future research is
additionally required to confirm and extend the results of this study. It
cannot be ascertained from this investigation if fatigue directly impacted
vigilance. Fatigue was created artifiCially, and influencing factors such as
workload and stress which may have Impacted on the relationship between
fatigue and vigilance were not controlled. Controlled, empirical
investigation is needed to confirm the inferred relationship between fatigue
and vigilance.
The possibility of a bi-directional relationship between fatigue and
vigilance has been proposed. Galinsky, Rosa, Warm and Dember (1993)
researched the effects of fatigue and stress on vigilance. A vigilance task
required participants to detect auditory and visual targets. Participants
provided subjective ratings of fatigue and stress pre- and post- vigilance
task. Fatigue and stress ratings rose after vigilance task completion. The
authors concluded that maintaining vigilance induced both fatigue and
stress (Galinsky et al., 1993). As measures were used concurrently, it is
not clear from these results whether increases in fatigue and stress were
independent products of the vigilance task, or if, for example, stress was a
product of fatigue alone. Additionally, factor interaction effects on
performance were not explored. It is therefore not possible from this study
to infer if performance was differentially impacted by an interaction of the
55
Chapter 2. literature review of human factors in relation to performance and human factor relationships in air traffic control
three factors of fatigue, stress and vigilance, compared to a single factor.
Future research should expand these results through empirical
investigation of the causal nature of these factors, and the resulting impact
on human performance.
A relationship between fatigue and stress has been identified in the
literature. Shiftwork investigations have repeatedly found an association
between increases in fatigue and stress increases (Park, Ha, Yi & Kim,
2006). Park et al. (2006) used an applied field study to investigate the
relationship between subjective fatigue and stress hormone levels of
employees in a manufacturing plant. Most employees worked a backward,
rapidly rotating 3-shift (morning, afternoon, evening) pattern. PartiCipants
were required to complete a demographic questionnaire prior to the study.
Fatigue questionnaires were completed on the second or third day of each
shift, and urine samples were collected for stress hormone analysis.
Results found that a positive correlation between stress hormone secretion
and subjective fatigue existed only for employees with less than 5 years
shiftwork experience. No relationship was found between subjective fatigue
and stress hormone secretion for employees with more than 5 years
shiftwork experience. Park et al. (2006) concluded there was a mediating
affect of experience between fatigue and stress (Park et aI., 2006). The
correlational design of this study unfortunately prevents an elaboration of
any causal relationship between these factors. Therefore, it may not be
established if fatigue did generate stress, or if these factors simply covary.
Additionally, the impact of fatigue and stress affects on performance was
not measured. Future research should attempt to define the relationship
between fatigue and stress, and extend Park et al.'s (2006) findings by
investigating the impact of the factor interaction on performance.
In summary, the interaction between fatigue and other human
factors appears to have received limited attention in the literature in
comparison to the factors of workload and stress. Very few studies, to the
current author's knowledge, have Investigated a causal relationship
between fatigue and other human factors, and subsequent effects of factor
Interactions on performance and error. In industrial settings, it may not be
possible to remove employee fatigue and the effects of fatigue on
performance. This has resulted in a complex issue for human performance
research. However, if knowledge of the interrelations between fatigue and
other human factors, and the subsequent effect on performance was
56
Chapter 2. literature review of human factors in relation to performance and human factor relationships in air traffic control
enhanced by future research, the effects of fatigue on performance may
not necessarily need to be removed, but instead predicted and mitigated,
potentially preventing human error.
2.3.1.3 Stress
Stress has been repeatedly reported to affect the human factor of attention
through selection and filtration of information processing. Mann and Tan
(1993) investigated the consequences of selection and filtration in a
decision making task. Mann and Tan (1993) presented participants with
dilemmas concerning employment and selection procedures, decisions that
are frequently presented to managers in natural settings. Participants were
then given a list of eight writing tasks regarding the dilemmas, and
participants' selection decision was recorded. Participants either had
unlimited time or worked to a time-pressured deadline (Mann & Tan, 1993).
The results demonstrated that participants making decisions under time
pressure considered fewer alternatives and evaluated fewer consequences
relative to the control group. Mann and Tan (1993) concluded that filtration
and selection increases were evident when making decisions under time
pressured conditions. This study did not discuss the impact of this
interaction on the quality of the decisions, however, and so it may not be
inferred how these changes affected performance. Further research should
review these interaction affects and the precise impact on performance in
more applied settings.
Stress may also significantly impact Vigilance. Ozel (2001) notes
that vigilance is determined by the degree of stress currently experienced
by an individual. Although this interaction has been colloquially highlighted,
few investigations have comprehensively studied this relationship (Hancock
& Warm, 1989). Research that has explored the Interaction between stress
and vigilance has primarily focused on the impact of environmental
stressors (Hancock & Warm, 1989). For example, Wyon, Wyon and Norin
(1996) investigated the effect of a thermal stressor on driver Vigilance.
Participants drove four laps of a predetermined circuit on public roads with
varying traffic regulations and speed limits, and were asked to respond to
computer initiated Signals by pressing a foot switch and verbal reporting.
Participants were randomly assigned to one of two thermal conditions - an
acceptable 21°C or warm 27°C. Results showed a negative effect of heat
stress on vigilance. In the thermal stressor condition, the numbers of
57
Chapter 2. literature review of human factors in relation to performance and human factor relationships in air traffic control
missed signals were 50% higher than in the 21°C condition. Response
times were also significantly longer in the thermal condition. Wyon et al.
(1996) concluded that the thermal stressor may have increased arousal,
therefore resulting in a narrowing of attention and consequently an
increase in error. This study demonstrates the affect of stress on vigilance
and attention, resulting in a significant performance decrement. However,
this affect on performance may also have been due to fatigue, which heat
may induce (Gonzalez-Alonso et aI., 1999). Therefore, future research
should examine the isolated impact of psychological stress on vigilance if
the interaction between stress, vigilance and performance is to be
comprehensively understood.
The interaction between stress and vigilance may be bi-directional.
Lundberg and Frankenhaeuser (1980) monitored physiological stress
responses during a vigilance task. Catecholamine and cortisol increased
throughout the vigil. It was concluded that vigilance tasks elicit a stress
response. Gluckman et al. (1988) extended Lundberg and
Frankenhaeuser's (1980) study by investigating subjective stress
responses pre and post completion of a vigilance task. Results found that
participant stress ratings increased after completion of the task, supporting
Lundberg and Frankenhaeuser's (1980) previous findings. The association
between vigilance and objective and subjective measures of stress has
been repeatedly reported in the literature. However, again, most studies
are correlational in design. Although the wealth of evidence suggests a
significant causal impact of vigilance on stress, further research should
empirically Investigate a causal link between the factors. Additionally, the
impact of the combined association of vigilance and stress on performance
has received comparatively less attention. It is therefore difficult to
determine if the association of stress and vigilance affects performance to
a greater extent than a single factor. Finally, the previously discussed
association between workload and stress may suggest that stress arises
from workload of the vigilance task. To the author's knowledge, research
has not generally considered the interaction of more than two factors.
Primarily, dyadic relationships are reported within the literature. If such
factor Interactions were addressed In future research, a more
comprehensive understanding of the interaction of vigilance, stress and
human performance would be achieved (Nickerson, 1992).
58
Chapter 2. literature review of human factors in relation to performance and human factor relationships in air traffic control
A note may be made here regarding the relationship between
stress and situation awareness (SA). Endsley (1995a) hypothesized that
stress would impact SA, due to attention narrowing and decreases in
working memory capacity. Endsley (1995a) postulated that the resultant
decrease in SA would negatively impact performance. No empirical
investigation was conducted to support these colloquial hypotheses, and
this area has been largely under-researched (Perry, Sheik-Nainar, Segall,
Ma & Kaber, 2008). Further empirical research is needed to explore this
interaction between stress and SA, and the resulting impact on
performance.
The relationship between stress and communication has been
examined primarily through two primary streams of research. One
research stream focuses on the impact of stress on communication error.
Bellorini (1996) examined this relationship in a field study in an air traffic
control (ATe) centre. Communications were recorded and controllers
completed self-report stress measures. It was found that communication
omissions were more frequent when controllers were experiencing high
stress. Results also revealed that a high density of communications
resulted in stress increases. This may indicate a bi-directional relationship
between stress and communications, or workload and stress effects.
Workload was not reviewed, so it is not possible to infer if a three way
interaction was evident in these findings. As the relationship between
stress and communication may be bi-directional In nature, it Is important
for future studies to examine this relationship In controlled experimental
settings to confirm the causal directions of the relationship. Additionally,
future research should examine the triadic interaction between workload,
communication and stress. These gaps in knowledge must be addressed
for progression in error prediction and prevention.
The second strand of research focuses on the impact of stress on
speech characteristics. Changes in speech characteristics have been
attributed to the physiological Impact of stress on the vocal tract and
surrounding muscles (Womack & Hansen, 1996). Ruiz, Absil, Harmegnies,
Legros and Poch (1996) explored the effects of stress on communications
in both laboratory and field settings. Within the laboratory study,
participants were asked to engage in a stroop task. Participants named the
colour of a word which was congruent to the actual word (for example, the
word 'red' was presented in the colour red). Participants then named words
59
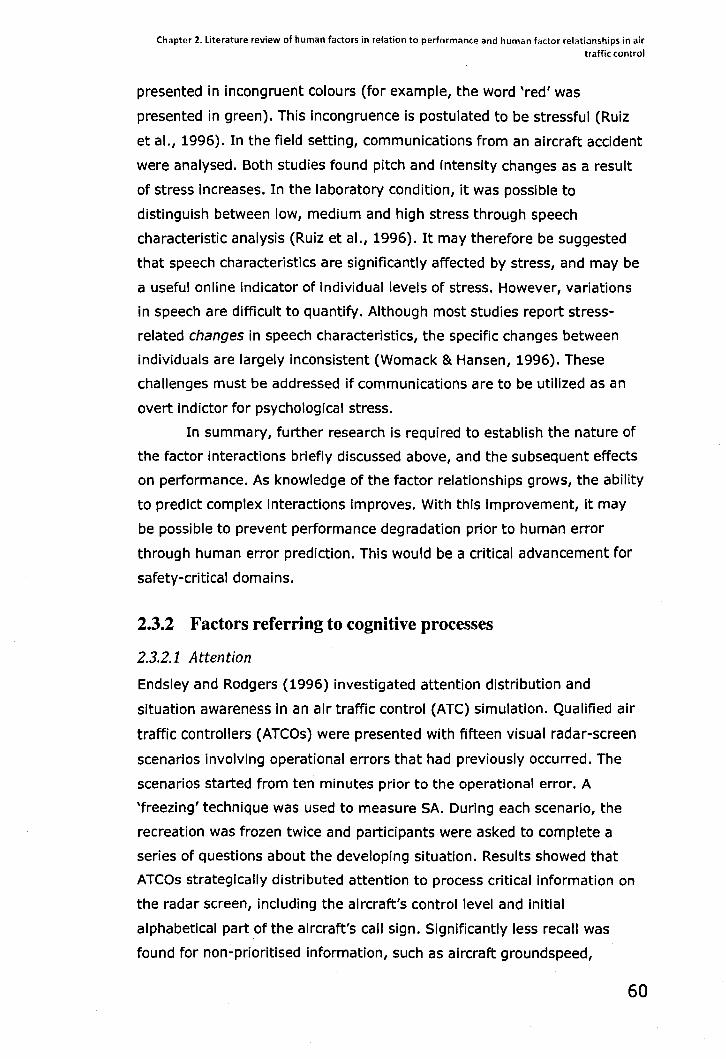
Chapter 2. Literature review of human factors in relation to performance and human factor relationships in air
traffic control
presented in incongruent colours (for example, the word 'red' was
presented in green). This incongruence is postulated to be stressful (Ruiz
et aI., 1996). In the field setting, communications from an aircraft accident
were analysed. Both studies found pitch and intensity changes as a result
of stress increases. In the laboratory condition, it was possible to
distinguish between low, medium and high stress through speech
characteristic analysiS (Ruiz et aI., 1996). It may therefore be suggested
that speech characteristics are significantly affected by stress, and may be
a useful online indicator of individual levels of stress. However, variations
in speech are difficult to quantify. Although most studies report stress
related changes in speech characteristics, the specific changes between
individuals are largely inconsistent (Womack & Hansen, 1996). These
challenges must be addressed if communications are to be utilized as an
overt indictor for psychological stress.
In summary, further research is required to establish the nature of
the factor interactions briefly discussed above, and the subsequent effects
on performance. As knowledge of the factor relationships grows, the ability
to predict complex interactions improves. With this improvement, it may
be possible to prevent performance degradation prior to human error
through human error prediction. This would be a critical advancement for
safety-critical domains.
2.3.2 Factors referring to cognitive processes
2.3.2.1 Attention
Endsley and Rodgers (1996) investigated attention distribution and
situation awareness in an air traffic control (ATe) simulation. Qualified air
traffic controllers (ATCOs) were presented with fifteen visual radar-screen
scenarios involving operational errors that had previously occurred. The
scenarios started from ten minutes prior to the operational error. A
'freezing' technique was used to measure SA. During each scenariO, the
recreation was frozen twice and participants were asked to complete a
series of questions about the developing situation. Results showed that
ATCOs strategically distributed attention to process critical information on
the radar screen, including the aircraft's control level and initial
alphabetical part of the aircraft's call sign. Significantly less recall was
found for non-prioritised information, such as aircraft groundspeed,
60
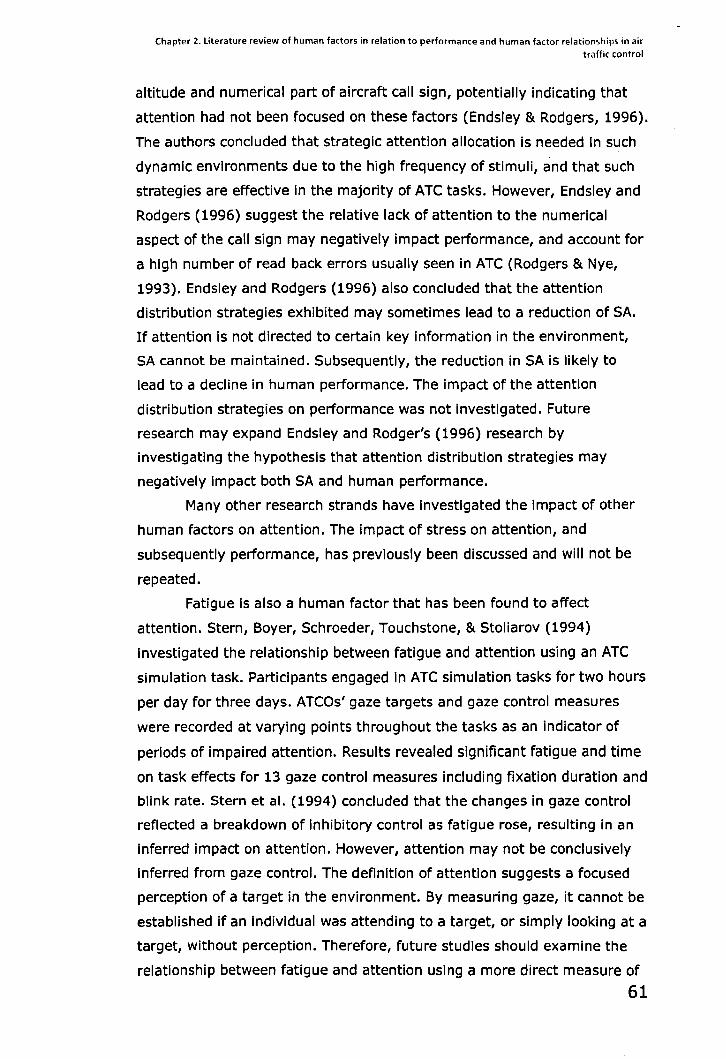
Chapter 2. literature review of human factors in relation to performance and human factor relationships in air traffic control
altitude and numerical part of aircraft call sign, potentially indicating that
attention had not been focused on these factors (Endsley & Rodgers, 1996).
The authors concluded that strategic attention allocation is needed in such
dynamic environments due to the high frequency of stimuli, and that such
strategies are effective in the majority of ATC tasks. However, Endsley and
Rodgers (1996) suggest the relative lack of attention to the numerical
aspect of the call sign may negatively impact performance, and account for
a high number of read back errors usually seen in ATC (Rodgers & Nye,
1993). Endsley and Rodgers (1996) also concluded that the attention
distribution strategies exhibited may sometimes lead to a reduction of SA.
If attention Is not directed to certain key information in the environment,
SA cannot be maintained. Subsequently, the reduction In SA is likely to
lead to a decline in human performance. The impact of the attention
distribution strategies on performance was not investigated. Future
research may expand Endsley and Rodger's (1996) research by
investigating the hypothesis that attention distribution strategies may
negatively impact both SA and human performance.
Many other research strands have investigated the Impact of other
human factors on attention. The impact of stress on attention, and
subsequently performance, has previously been discussed and will not be
repeated.
Fatigue is also a human factor that has been found to affect
attention. Stern, Boyer, Schroeder, Touchstone, & Stoliarov (1994)
investigated the relationship between fatigue and attention using an ATC
simulation task. Participants engaged in ATC simulation tasks for two hours
per day for three days. ATCOs' gaze targets and gaze control measures
were recorded at varying points throughout the tasks as an indicator of
periods of impaired attention. Results revealed significant fatigue and time
on task effects for 13 gaze control measures including fixation duration and
blink rate. Stern et al. (1994) concluded that the changes in gaze control
reflected a breakdown of Inhibitory control as fatigue rose, resulting in an
inferred impact on attention. However, attention may not be conclusively
Inferred from gaze control. The definition of attention suggests a focused
perception of a target in the environment. By measuring gaze, it cannot be
established if an individual was attending to a target, or simply looking at a
target, without perception. Therefore, future studies should examine the
relationship between fatigue and attention using a more direct measure of
61
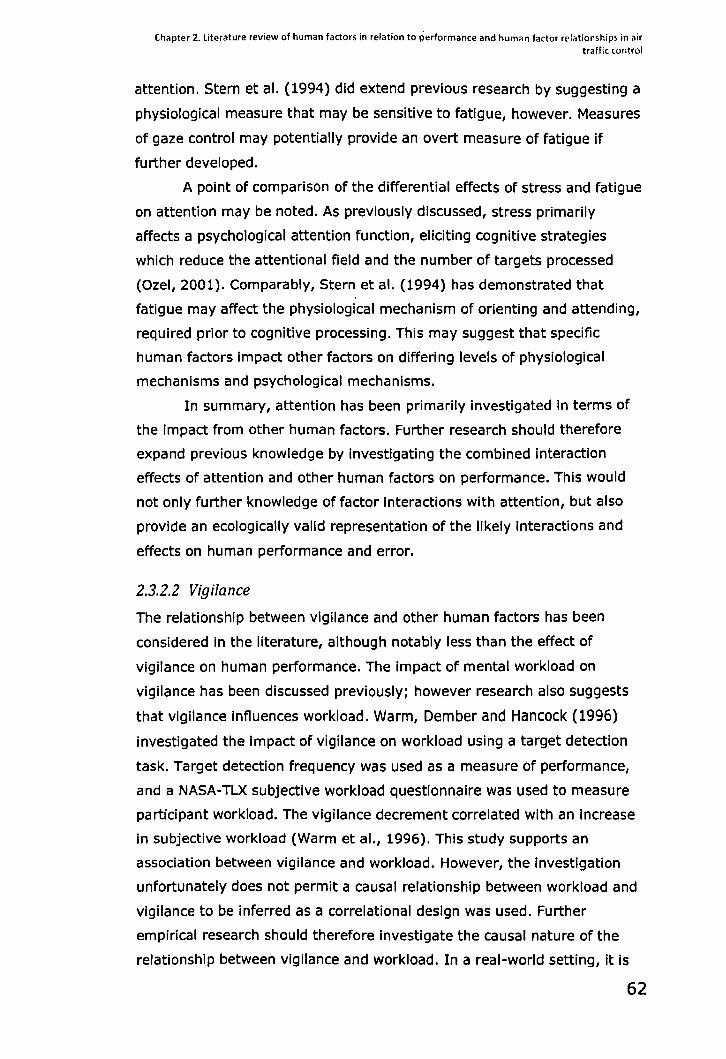
Chapter 2. literature review of human factors in relation to performance and human factor relationships in air traffic control
attention. Stern et al. (1994) did extend previous research by suggesting a
physiological measure that may be sensitive to fatigue, however. Measures
of gaze control may potentially provide an overt measure of fatigue if
further developed.
A point of comparison of the differential effects of stress and fatigue
on attention may be noted. As previously discussed, stress primarily
affects a psychological attention function, eliciting cognitive strategies
which reduce the attentional field and the number of targets processed
(Ozel, 2001). Comparably, Stern et al. (1994) has demonstrated that
fatigue may affect the physiological mechanism of orienting and attending,
required prior to cognitive processing. This may suggest that specific
human factors impact other factors on differing levels of physiological
mechanisms and psychological mechanisms.
In summary, attention has been primarily investigated in terms of
the impact from other human factors. Further research should therefore
expand previous knowledge by investigating the combined interaction
effects of attention and other human factors on performance. This would
not only further knowledge of factor Interactions with attention, but also
provide an ecologically valid representation of the likely Interactions and
effects on human performance and error.
2.3.2.2 Vigilance
The relationship between vigilance and other human factors has been
considered in the literature, although notably less than the effect of
vigilance on human performance. The impact of mental workload on
vigilance has been discussed previously; however research also suggests
that vigilance influences workload. Warm, Dember and Hancock (1996)
investigated the impact of vigilance on workload using a target detection
task. Target detection frequency was used as a measure of performance,
and a NASA-TLX subjective workload questionnaire was used to measure
participant workload. The vigilance decrement correlated with an Increase
in subjective workload (Warm et aI., 1996). This study supports an
association between vigilance and workload. However, the Investigation
unfortunately does not permit a causal relationship between workload and
vigilance to be inferred as a correlational design was used. Further
empirical research should therefore investigate the causal nature of the
relationship between vigilance and workload. In a real-world setting, it is
62
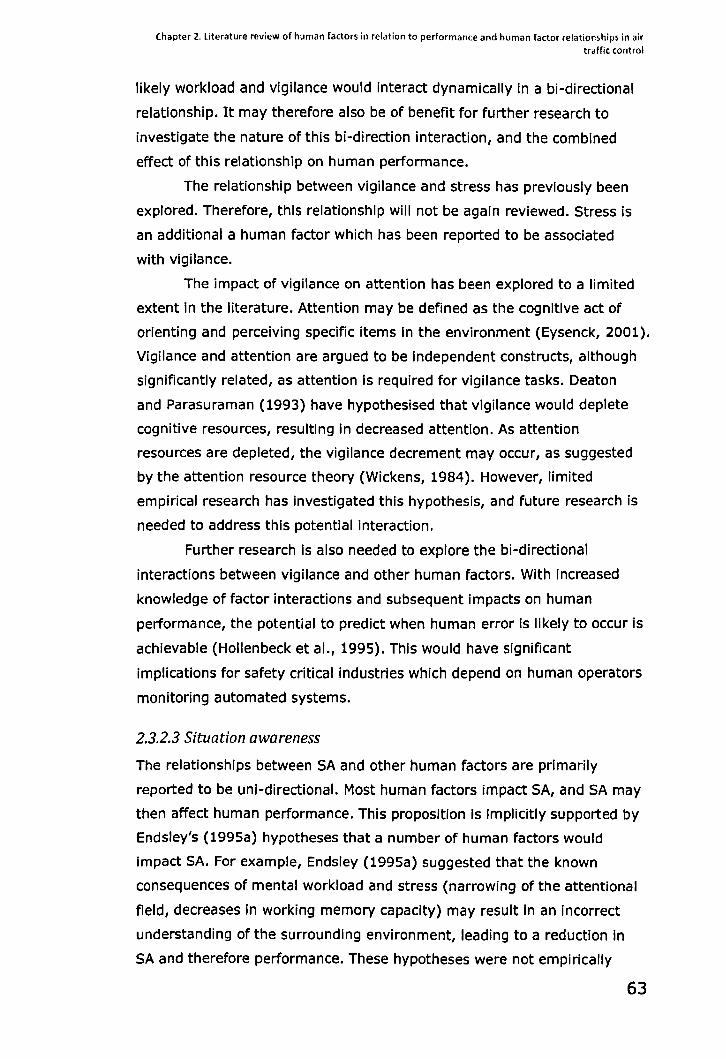
Chapter 2. literature review of human factors in relation to performance and human factor relationships in air traffic control
likely workload and vigilance would interact dynamically in a bi-directional
relationship. It may therefore also be of benefit for further research to
investigate the nature of this bi-direction interaction, and the combined
effect of this relationship on human performance.
The relationship between vigilance and stress has previously been
explored. Therefore, this relationship will not be again reviewed. Stress is
an additional a human factor which has been reported to be associated
with vigilance.
The impact of vigilance on attention has been explored to a limited
extent in the literature. Attention may be defined as the cognitive act of
orienting and perceiving specific items in the environment (Eysenck, 2001).
Vigilance and attention are argued to be independent constructs, although
significantly related, as attention is required for vigilance tasks. Deaton
and Parasuraman (1993) have hypothesised that vigilance would deplete
cognitive resources, resulting in decreased attention. As attention
resources are depleted, the vigilance decrement may occur, as suggested
by the attention resource theory (Wickens, 1984). However, limited
empirical research has investigated this hypothesis, and future research is
needed to address this potential interaction.
Further research is also needed to explore the bi-directional
interactions between vigilance and other human factors. With increased
knowledge of factor interactions and subsequent impacts on human
performance, the potential to predict when human error is likely to occur is
achievable (Hollenbeck et al., 1995). This would have significant
implications for safety critical industries which depend on human operators
monitoring automated systems.
2.3.2.3 Situation awareness
The relationships between SA and other human factors are primarily
reported to be uni-directional. Most human factors impact SA, and SA may
then affect human performance. This proposition is implicitly supported by
Endsley's (1995a) hypotheses that a number of human factors would
impact SA. For example, Endsley (1995a) suggested that the known
consequences of mental workload and stress (narrowing of the attentional
field, decreases in working memory capacity) may result in an incorrect
understanding of the surrounding environment, leading to a reduction in
SA and therefore performance. These hypotheses were not empirically
63
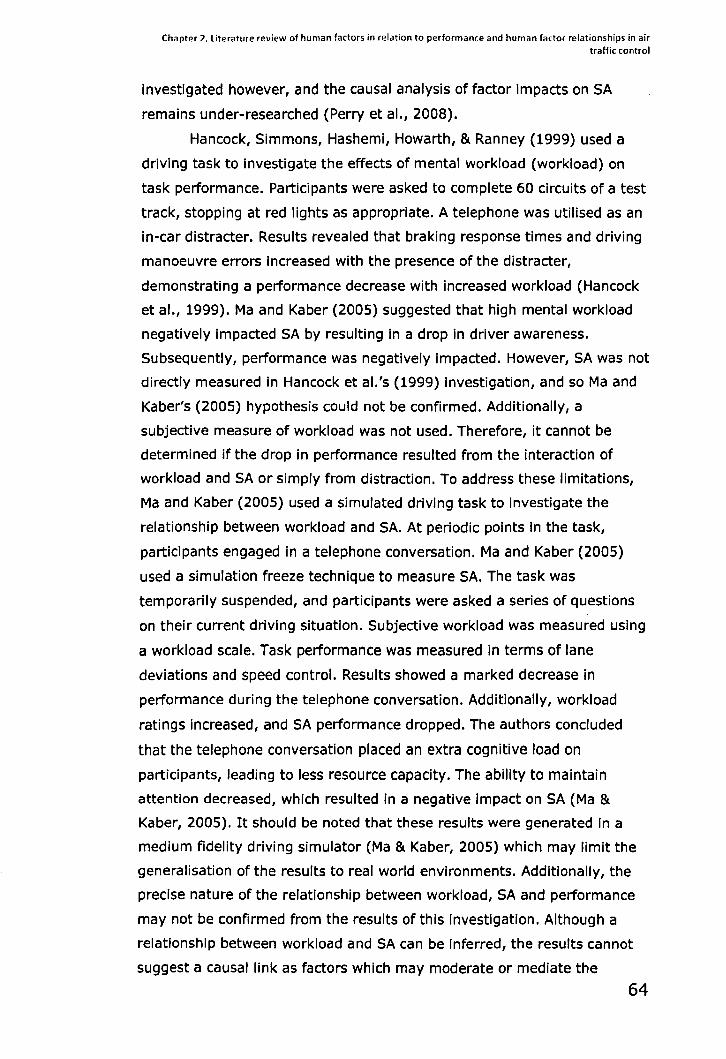
Chapter 2. literature review of human factors in relation to performance and human factor relationships in air traffic control
investigated however, and the causal analysis of factor impacts on SA
remains under-researched (Perry et al., 2008).
Hancock, Simmons, Hashemi, Howarth, & Ranney (1999) used a
driving task to Investigate the effects of mental workload (workload) on
task performance. PartiCipants were asked to complete 60 circuits of a test
track, stopping at red lights as appropriate. A telephone was utilised as an
in-car distracter. Results revealed that braking response times and driving
manoeuvre errors increased with the presence of the distracter,
demonstrating a performance decrease with increased workload (Hancock
et aI., 1999). Ma and Kaber (200S) suggested that high mental workload
negatively impacted SA by resulting in a drop in driver awareness.
Subsequently, performance was negatively impacted. However, SA was not
directly measured in Hancock et al.'s (1999) investigation, and so Ma and
Kaber's (2005) hypothesis could not be confirmed. Additionally, a
subjective measure of workload was not used. Therefore, it cannot be
determined if the drop in performance resulted from the interaction of
workload and SA or simply from distraction. To address these limitations,
Ma and Kaber (2005) used a simulated driving task to investigate the
relationship between workload and SA. At periodic pOints in the task,
participants engaged in a telephone conversation. Ma and Kaber (2005)
used a simulation freeze technique to measure SA. The task was
temporarily suspended, and partiCipants were asked a series of questions
on their current driving situation. Subjective workload was measured using
a workload scale. Task performance was measured in terms of lane
deviations and speed control. Results showed a marked decrease in
performance during the telephone conversation. Additionally, workload
ratings increased, and SA performance dropped. The authors concluded
that the telephone conversation placed an extra cognitive load on
participants, leading to less resource capacity. The ability to maintain
attention decreased, which resulted in a negative Impact on SA (Ma &
Kaber, 200S). It should be noted that these results were generated in a
medium fidelity driving Simulator (Ma & Kaber, 2005) which may limit the
generalisation of the results to real world environments. Additionally, the
precise nature of the relationship between workload, SA and performance
may not be confirmed from the results of this investigation. Although a
relationship between workload and SA can be inferred, the results cannot
suggest a causal link as factors which may moderate or mediate the
64
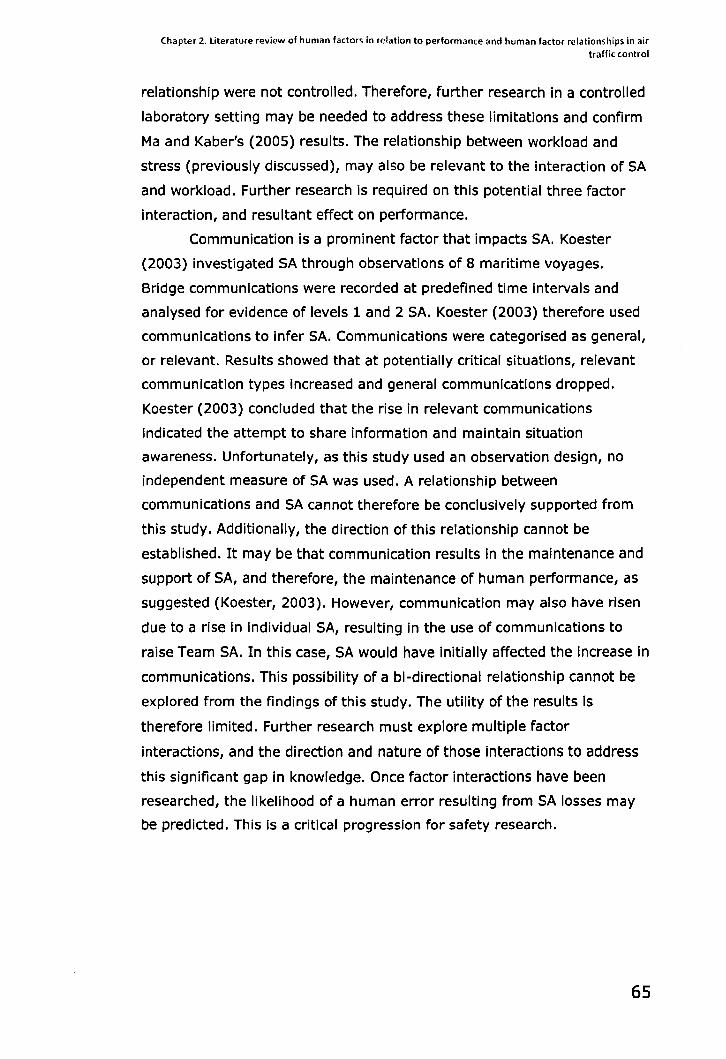
Chapter 2. Literature review of human factors in relation to performance and human factor relationships in air
traffic control
relationship were not controlled. Therefore, further research in a controlled
laboratory setting may be needed to address these limitations and confirm
Ma and Kaber's (2005) results. The relationship between workload and
stress (previously discussed), may also be relevant to the interaction of SA
and workload. Further research is required on this potential three factor
interaction, and resultant effect on performance.
Communication is a prominent factor that impacts SA. Koester
(2003) investigated SA through observations of 8 maritime voyages.
Bridge communications were recorded at predefined time intervals and
analysed for evidence of levels 1 and 2 SA. Koester (2003) therefore used
communications to infer SA. Communications were categorised as general,
or relevant. Results showed that at potentially critical situations, relevant
communication types increased and general communications dropped.
Koester (2003) concluded that the rise in relevant communications
indicated the attempt to share information and maintain situation
awareness. Unfortunately, as this study used an observation design, no
independent measure of SA was used. A relationship between
communications and SA cannot therefore be conclusively supported from
this study. Additionally, the direction of this relationship cannot be
established. It may be that communication results in the maintenance and
support of SA, and therefore, the maintenance of human performance, as
suggested (Koester, 2003). However, communication may also have risen
due to a rise in individual SA, resulting in the use of communications to
raise Team SA. In this case, SA would have initially affected the increase in
communications. This possibility of a bi-directional relationship cannot be
explored from the findings of this study. The utility of the results is
therefore limited. Further research must explore multiple factor
interactions, and the direction and nature of those interactions to address
this significant gap in knowledge. Once factor interactions have been
researched, the likelihood of a human error resulting from SA losses may
be predicted. This Is a critical progression for safety research.
65

Chapter 2. Literature review of human factors in relation to performance and human factor relationships in air
traffic control
2.3.3 Factors resulting from individuals acting within a team environment
2.3.3.1 Communications
The relationships between communication and mental workload,
communications and stress and communication and situation awareness
(SA) have all been previously discussed, and so a review of these areas is
not again necessary.
The intuitive relationship between communications and teamwork is
experimentally supported (Sexton & Helmreich, 1999). Ruffell-Smith (1979)
investigated the impact of communications on teamwork in an aviation
simulator study. Pilot crews were asked to work together as they would in
real life. Communications were recorded and analysed in terms of quality
and quantity. Team performance was assessed by effectiveness in fulfilling
objectives, and human errors were recorded throughout the study.
Findings showed that the quality of crew communication was more closely
associated with crew performance than the technical proficiency of
individual pilots, inferring a significant impact of communications on
teamwork. A comparison of teams rated as 'effective' and 'ineffective' did
not reveal any significant differences between the frequency or severity of
errors. However, Ruffell-Smith (1979) concluded that effective teams had
higher quality and more effective communications. Communication was
therefore inferred to Increase team working effectiveness, and to moderate
the impact of error on team performance. Further research is needed to
determine if a causal relationship exists between communications and
teamwork. The interaction between teamwork and communication has
been comparatively under-researched, although often the relationship
between communications and teamwork is colloquially recognized (Sexton
& Helmreich, 1999). Communications and teamwork are critical constructs
in most industries, and a comprehensive understanding of this relationship,
and its impact on performance, would have significant implications for
education and training in safety critical environments.
Communication has also been colloquially recognised to impact
trust (Willemyns, Gallois & Callan, 2003) as communications are the main
channel of social interaction (Hogg & Vaughan, 2002). Willemyns et al.
(2003) empirically investigated the impact of communication on
perceptions of trust. Employees working in a variety of organizational
66
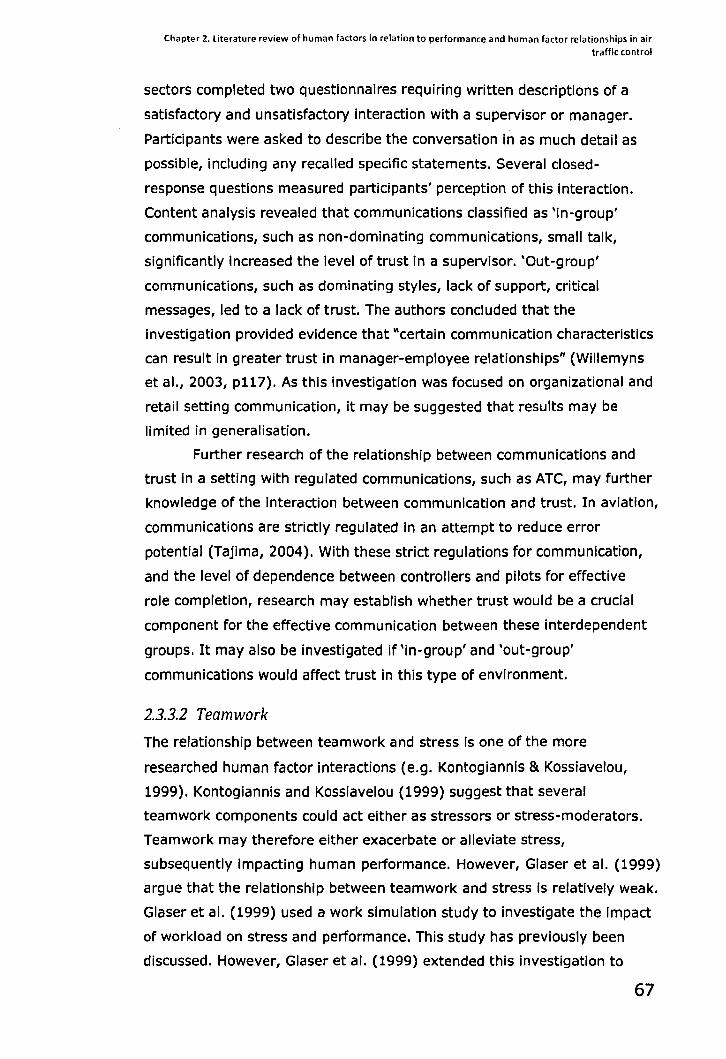
Chapter 2. literature review of human factors in relation to performance and human factor relationships in air traffic control
sectors completed two questionnaires requiring written descriptions of a
satisfactory and unsatisfactory interaction with a supervisor or manager.
Participants were asked to describe the conversation in as much detail as
possible, including any recalled specific statements. Several c1osed
response questions measured participants' perception of this interaction.
Content analysis revealed that communications classified as 'in-group'
communications, such as non-dominating communications, small talk,
significantly increased the level of trust in a supervisor. 'Out-group'
communications, such as dominating styles, lack of support, critical
messages, led to a lack of trust. The authors concluded that the
investigation provided evidence that "certain communication characteristics
can result in greater trust in manager-employee relationships" (Willemyns
et aJ., 2003, p117). As this investigation was focused on organizational and
retail setting communication, it may be suggested that results may be
limited in generalisation.
Further research of the relationship between communications and
trust in a setting with regulated communications, such as ATC, may further
knowledge of the interaction between communication and trust. In aviation,
communications are strictly regulated in an attempt to reduce error
potential (Tajima, 2004). With these strict regulations for communication,
and the level of dependence between controllers and pilots for effective
role completion, research may establish whether trust would be a crucial
component for the effective communication between these interdependent
groups. It may also be investigated if 'In-group' and 'out-group'
communications would affect trust in this type of environment.
2.3.3.2 Teamwork
The relationship between teamwork and stress is one of the more
researched human factor interactions (e.g. Kontogiannis & Kossiavelou,
1999). Kontogiannis and Kossiavelou (1999) suggest that several
teamwork components could act either as stressors or stress-moderators.
Teamwork may therefore either exacerbate or alleviate stress,
subsequently impacting human performance. However, Glaser et aJ. (1999)
argue that the relationship between teamwork and stress is relatively weak.
Glaser et aJ. (1999) used a work simulation study to investigate the Impact
of workload on stress and performance. This study has previously been
discussed. However, Glaser et aJ. (1999) extended this investigation to
67
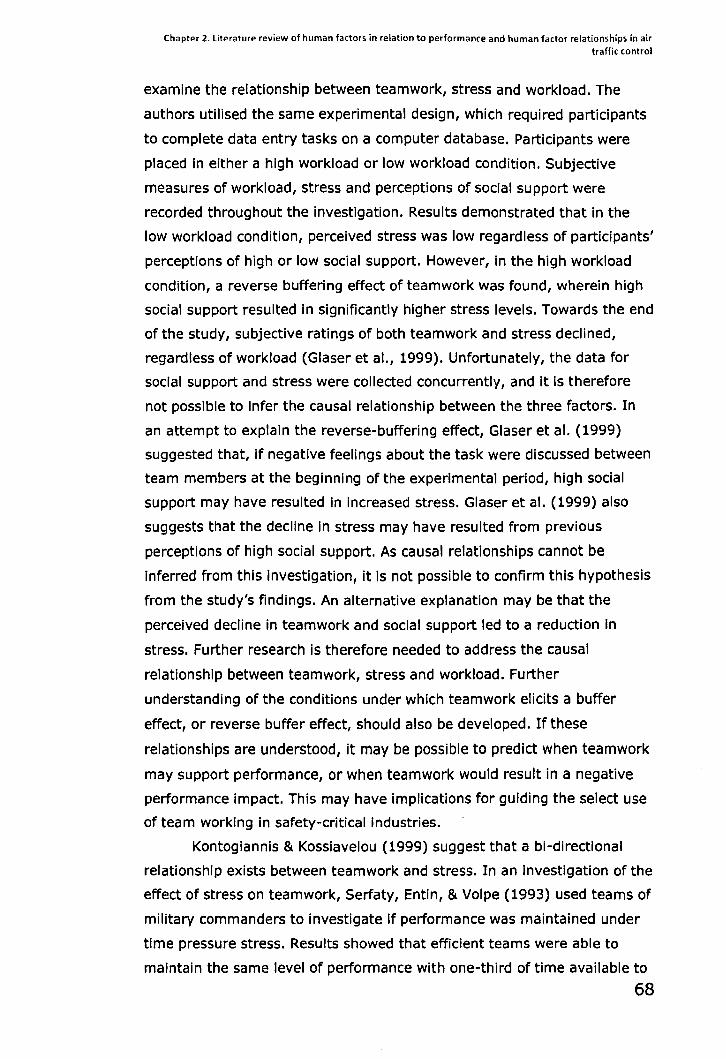
Chapter 2. Literature review of human factors in relation to performance and human factor relationships in air traffic control
examine the relationship between teamwork, stress and workload. The
authors utilised the same experimental design, which required participants
to complete data entry tasks on a computer database. Participants were
placed in either a high workload or low workload condition. Subjective
measures of workload, stress and perceptions of social support were
recorded throughout the investigation. Results demonstrated that in the
low workload condition, perceived stress was low regardless of participants'
perceptions of high or low social support. However, in the high workload
condition, a reverse buffering effect of teamwork was found, wherein high
social support resulted in significantly higher stress levels. Towards the end
of the study, subjective ratings of both teamwork and stress declined,
regardless of workload (Glaser et aI., 1999). Unfortunately, the data for
social support and stress were collected concurrently, and it is therefore
not possible to infer the causal relationship between the three factors. In
an attempt to explain the reverse-buffering effect, Glaser et al. (1999)
suggested that, if negative feelings about the task were discussed between
team members at the beginning of the experimental period, high social
support may have resulted in increased stress. Glaser et al. (1999) also
suggests that the decline in stress may have resulted from previous
perceptions of high social support. As causal relationships cannot be
inferred from this investigation, it is not possible to confirm this hypothesis
from the study's findings. An alternative explanation may be that the
perceived decline in teamwork and social support led to a reduction in
stress. Further research is therefore needed to address the causal
relationship between teamwork, stress and workload. Further
understanding of the conditions under which teamwork elicits a buffer
effect, or reverse buffer effect, should also be developed. If these
relationships are understood, it may be possible to predict when teamwork
may support performance, or when teamwork would result in a negative
performance impact. This may have implications for guiding the select use
of team working in safety-critical Industries.
Kontogiannis & Kosslavelou {1999} suggest that a bi-directional
relationship exists between teamwork and stress. In an investigation of the
effect of stress on teamwork, Serfaty, Entin, & Volpe (1993) used teams of
military commanders to investigate if performance was maintained under
time pressure stress. Results showed that efficient teams were able to
maintain the same level of performance with one-third of time available to
68

Chapter 2. literature review of human factors in relation to performance and human factor relationships in air traffic control
make decisions. Serfaty et al. (1993) suggested that under high time
pressure, subordinates changed communication strategies towards their
commander. Instead of waiting to report based on commander requests,
information was provided to commanders on what the subordinates
considered would be useful. The authors concluded high stress had
impacted on team working strategy, and an adaptive shift In
communication patterns maintained team performance (Serfaty et aI.,
1993). The specificity of the environment may limit the generalisation of
these findings. Strict hierarchical regulations regarding team working and
communication are not necessarily existent in less safety critical
environments, such as business organizations, and the effects of teamwork
on stress produce differing results. Further research may therefore attempt
to replicate these findings in different domains.
The affect of teamwork on communications has been explored in
the literature. This review has previously explored the impact of
communication on teamwork, but there is evidence to suggest a possible
bi-direction relationship. Cannon-Bowers, Salas, and Converse (1993)
reviewed the cognitive process of 'shared mental models' aSSOCiated with
teamwork. Such models may be defined as "organized bodies of knowledge
that are shared across team members (Salas et al., 1995, p127). Cannon
Bowers et al. (1993) hypothesized that shared models Improve
performance by enhancing team coordination, and enables a greater
understanding of other team members. As a result, communication may
fall. A review of the literature within this area has revealed limited
experimental support for this concept, however. Future research Is needed
to investigate this relationship.
Limited research on the interactions between teamwork and other
human factors has previously been noted (Rasmussen & Jeppesen, 2006).
Many safety critical environments involve teamwork, and so further
research in this area Is critical to develop an understanding of the
relationships between teamwork and other human factors. This
understanding may result in the ability to predict declines in team or
individual performance, which may then be prevented or mitigated before
the occurrence of human error. These developments in knowledge are
critical for focus to shift to error prediction and prevention, rather than the
current retrospective approach to human error.
69
Chapter 2. literature review of human factors in relation to performance and human factor relationships in air traffic control
2.3.3.3 Trust
AJthough research of the relationships between trust and other human
factors is limited, the interaction of trust and teamwork is most often
investigated. Three decades prior, Golembiewski and McConkie, (1975,
p131) suggested "there is no single variable which so thoroughly influences
interpersonal and group behaviour as does trust". The impact of trust on
teamwork has also been noted in more recent years, with the
acknowledgement that trust is needed for effective teamwork (Costa et aI.,
2001; Erdem and Ozen, 2003). Kiffin-Peterson and Cordery (2003)
investigated the relationship between trust and attitudes towards
teamwork. Over two hundred employees from forty work teams were
surveyed on trust and teamwork related concepts, such as attitudes
towards teamwork, trust in colleagues and trust in managers. The results
indicated that two forms of situational trust (trust in co-workers and trust
in managers) were stronger predictors of preference and positive attitudes
to teamwork than dispositional trust. Additionally, situational trust was
found to partially mediate the relationships between disposition or trait
related trust and preference for teamwork (Kiffin-Peterson & Cordery,
2003). Unfortunately, this study did not investigate the impact of these
attitudes on team or individual performance, instead simply affirming the
impact of trust on teamwork preference.
Erdem and Ozen (2003) addressed this limitation, and extended
Kiffin-Peterson and Cordery's (2003) study by investigating the
relationship between trust and team performance. Fifty work teams from
ten organizations completed a questionnaire which incorporated questions
of cognitive and affective trust of team members, and self rated team
performance. Results demonstrated that team members who rated their
teams highly on both affective and cognitive dimensions of trust also
reported more signs of effective performance, such as planning, solving
problems and continuous Improvement (Erdem & Ozen, 2003). Additionally,
a negative correlation between both dimensions of trust and error was
identified. As team performance was self-rated, the results may be
influenced by response bias. Therefore, further research which uses
objective measures of performance should confirm these findings. In
summary, these findings have important Implications for many domains,
including team-focused, safety critical domains such as ATC. Erdem and
70
Chapter 2. literature review of human factors in relation to performance and human factor relationships in air traffic control
Ozen (2003) conclude that behaviour promoting trust in teams should be
encouraged by organizations to support high performance, and potentially
reduce error.
The impact of trust on the factor of stress has also been reviewed in
the literature. Costa et al. (2001) developed a model of trust, stress and
perceived task performance using structural equation modeling (SEM).
Initially, data was collected from 144 teams in three social care Institutions.
Employees were asked to complete questionnaires consisting of Likert
scale measurements of perceptions of team trust, perceived task
performance and stress. SEM was used to analyse and structure the data.
Results suggested that trust is positively related with perceived task
performance, and negatively related with stress. Unfortunately the
potential dyadic and triadiC factor interactions were not examined. The
reliability of the findings may be also be questioned. SEM, although a
detailed and accepted analysis methodology, represents a theoretical
model that best fits the data. Therefore, empirical validation of this model
should be conducted to confirm these results. Additionally, the authors
themselves note that it is not possible from the findings of this study to
assess the actual contribution of trust in positively impacting performance
and reducing stress (Costa et aI., 2001). Further research should therefore
validate and extend this model, and Investigate these factors In controlled
experimental studies In which causality between trust, stress and
performance can be separated and Identified. This research would further
develop understanding of the interaction between trust, stress and human
performance.
2.3.4 Implications of literature review findings relating to multifactor influences
To date, research that investigates multifactor associations with
performance, particularly within ATC settings, are Infrequent. By moving
attention to investigating factor Interactions and performance Impacts,
investigation of the error likelihood resulting from such relationships would
be possible. This presents the possibility of preventative or supportive
measures being implemented when error is known to be likely, potentially
preventing human error which may have resulted in an Incident. This goal
71
Chapter 2. literature review of human factors in relation to performance and human factor relationships in air
traffic control
is especially relevant to safety critical environments such as air traffic
control, in which human error could result in injuries or lives lost.
2.3.5 Summary of working definitions of factors
The definitions of each factor are as follows:
1. Workload: Perceived demand (amount and complexity) imposed by
ATC tasks, demand on mental resources, and associated subjective
perception of effort to meet demands.
2. Fatigue: A physiological state of reduced mental or physical
performance capability resulting from sleep loss or extended
wakefulness, circadian phase, or workload (mental and/or physical
activity) that can include feelings of tiredness or weariness and
impair alertness and ability to perform safety related duties
3. Stress: Pressures imposed by the situation which challenge the
controller's ability to cope
4. Attention: The application of cognitive processes to focus on a
specific environmental target necessary for further target
processing
5. Vigilance: The ability to pay continuous attention to an
environmental field for a period of time to detect particular changes
which is affected by alertness
6. SA: Maintenance of a coherent mental picture for current and future
events based on continuous extraction of environmental Information,
which includes controller performance
7. Communications: The exchange of information, Including timeliness,
accuracy, clarity and receptiveness
8. Teamwork: Collective and mutual Interaction with humans in the
system for performance
9. Trust: The level of confidence in events, people, equipment or
circumstances
2.4 Conclusion
This review of human factor relationships and factor associations with
human performance, spanning the past three decades, has presented and
discussed nine of the primary human factors known to have a significant
impact on performance and error. Complex, often bi-directional and
72
Chapter 2. Literature review of human factors in relation to performance and human factor relationships in air traffic control
sometimes controversial, relationships were found in the literature. This
review suggests that investigations have primarily focused on relationships
between factor dyads only, limiting knowledge of ecologically valid factor
co-occurrences and relationships. In addition, few studies continue to
investigate the association between multiple factors and performance.
Finally, as most studies investigating factor relationships apply a
correlation design, resulting in limited research on the causal relationships
between human factors. Future research should address the significant
gaps in literature, including developing understanding of human factor
interactions, and the combined effect of these interactions on human
performance and error. Future research can address a research gap by
establish an understanding of the causal relationships between factors.
2.5 Chapter summary
The literature presented in Chapter 2 summarised research spanning
several decades on relating to a speCific set of nine human factors
(workload, fatigue, stress, attention, vigilance, SA, communications,
teamwork, trust) and performance. The chapter was divided Into two
sections. Within each section the nine human factors were grouped into
three novel categories for consideration: factors resulting from an
interaction between individual and environment, factors referring to of
cognitive processes, and factors resulting from individuals acting within a
team environment. Categorisation resulted from recurrent patterns In the
literature of the consideration of factors.
The first section presented an overview of each of the nine factors
and considered the association between each factor and human
performance. The review supported that each human factor had been
reported to influence human performance, and specifically, human
performance within an ATC setting. This information contributed
background Information to the thesis and to the project aim of identifying a
set of factors that have been found to influence controller performance.
The second section reviewed research Investigating relationships between
the nine human factors and the association between combined multiple
factors and performance. The review provided support for the occurrence
of relationships between factors, although some controversies and
conflicting findings were Identified. Gaps in research were Identified. Few
studies investigated the relationships between three or more factors, or
73
Chapter 2. Literature review of human factors in relation to performance and human factor relationships in air traffic control
associated multiple related factors with performance. In addition,
correlation research designs were primarily utilised to investigate factor
relationships and so causality was not established. It is subsequently
suggested that further research is conducted to address these research
gaps. This section of the review contributed to the current research by
providing background information regarding previous findings, and
provided initial information for later hypothesis generation of the
relationships between factors.
The review concludes with a suggestion that, in order to progress in
the area of human performance, and human error prediction, it Is
necessary to focus future work on exploring the relationships between
human factors, and the combined, subsequent association on human
performance and error, In both laboratory and applied settings. This may
serve to reduce the current controversies in this field, and lead to further
understanding and progression in the area of human performance.
74
Chapter 3. Understanding air traffic control
Chapter 3.
control
Understanding air traffic
3.1 Chapter overview
This chapter describes the stages the researcher went through to become
familiar with the air traffic control (ATC) domain. Background information
on the air traffic management (ATM) and ATC systems is first described,
followed by a description of the further insight gained from the
researcher's visits to air navigation service providers (ANSPs) and ATC
operations rooms. Experiences and insights into the ATC domain that are
pertinent to future research considerations are presented.
3.2 Air traffic control in context
Air traffic control is a safety critical domain that relies on air traffic
controllers to maintain a safe distance between aircraft. Unlike other high
risk industries (e.g. nuclear industry) controllers orchestrate the traffic live,
and there are few safety mechanisms and no physical barriers to defend
against accidents. Air traffic control Is therefore highly dependent on the
maintenance of exceptional human performance. In a context of growing
demands for air travel, it Is essential that human performance Is supported
and maintained.
3.3 Air traffic management (ATM) system
Air traffic control is a ground based service provided as part of the air
traffic management (ATM) system (Figure 3.1). Air traffic management
(ATM) is made up of several systems and incorporates the planning,
organisation and control of all air traffic movements (IeAO, 2007). ATM
provides a service to airspace users (pilots, airlines), with the objective to
ensure the safe, orderly and expeditious flow of air traffic (lCAO, 2005).
ATM follows consistent and internationally agreed procedures and
regulations, as set out by ICAO legislation. This standardisation facilitates
effiCient transitions between airspace regions, or sectors, both nationally
and internationally, for aircraft. Figure 3.1 (adapted from Malakis, 2008)
presents the structure of the ATM system.
75
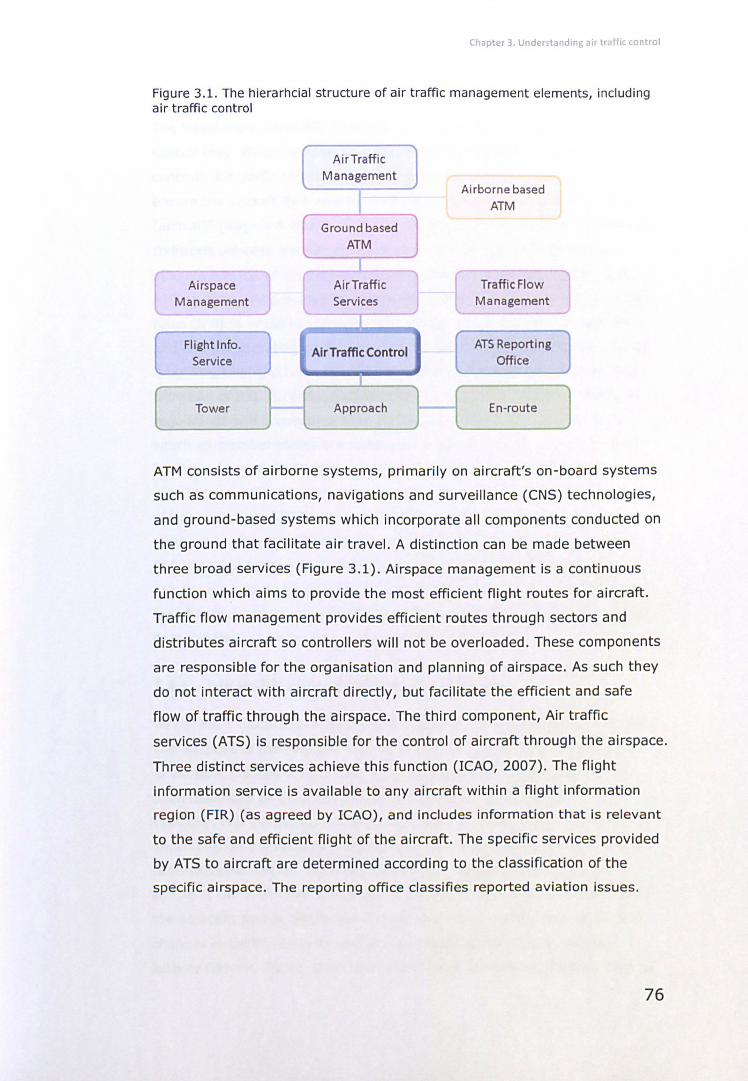
Chapter 3. Understanding air traffic control
Figure 3.1. The hierarhcial structure of air traffic management elements, including air traffic control
Airspace Management
Flight Info. Service
AirTraffic Management
Ground based ATM
Air Traffic Services
Air Traffic Control
Airborne based ATM
Traffic Flow Management
ATS Reporting Office
[ ____ li_o_w_e_r _____ H"" ~o:-]-[ En.,o".] ATM consists of airborne systems, primarily on aircraft's on-board systems
such as communications, navigations and surveillance (eNS) technologies,
and ground-based systems which incorporate all components conducted on
the ground that facilitate air travel. A distinction can be made between
three broad services (Figure 3.1). Airspace management is a continuous
function which aims to provide the most efficient flight routes for aircraft .
Traffic flow management provides efficient routes through sectors and
distributes aircraft so controllers will not be overloaded. These components
are responsible for the organisation and planning of airspace. As such they
do not interact with aircraft directly, but facilitate the efficient and safe
flow of traffic through the airspace. The third component, Air traffic
services (ATS) is responsible for the control of aircraft through the airspace.
Three distinct services achieve this function (leAD, 2007) . The flight
information service is available to any aircraft within a flight information
region (FIR) (as agreed by IeAO), and includes information that is relevant
to the safe and efficient flight of the aircraft. The specific services provided
by ATS to aircraft are determined according to the classification of the
specific airspace. The reporting office classifies reported aviation issues.
76
Chapter 3. Understanding air traffic control
3.4 Air traffic control
The foundation of the ATS function is the air traffic control service. Civilian
control only will be referred to in this thesis (as opposed to military
control). Air traffic control (ATC) is a service provided to airspace users "to
ensure the aircraft fly safely from one place (departure) to another one
(arrival)" (Rognin & Blanquart, 2001, p329). ATC objectives are to prevent
collisions between aircraft and aircraft and obstacles, and provide an
efficient service whilst maintaining an orderly flow of traffic (ICAO, 2007).
ATe services are provided to all aircraft operating under instrumental flight
rules (IFR) in which instruments are primarily used for flight by the pilot,
and aircraft operating under visual flight rules where pilots fly the aircraft
according to visual cues, in selected sections of controlled airspace. The
provision of ATC services is standardised across ICAO member states by
regulations and procedures from ICAO (I.e. ICAO, 2007, doc 4444), to
which all member states are expected to adhere. The service is provided
by ground based air traffic controllers (ATCOs) who instruct aircraft
movements, primarily through verbal communication, for efficiency or
safety purposes. ATCOs are responsible for aircraft safety, and are
required to maintain the legal minimum separation between aircraft of
1000 vertical feet and 3-5 nautical miles, depending on the airspace.
Aircraft operate 24 hours a day. As such, ATC services are required 24
hours a day. ATCOs work shifts to meet this demand (Della Rocco, 1999).
Shift schedules and lengths vary by ATC centre.
3.4.1 Air traffic control and airspace design
Within each country, controllers guide aircraft through regulated airspace.
The airspace is theoretically divided into distinct, adjacent regions known
as sectors. Sectors vary in size, both laterally and vertically, and have
been described as creating a three-dimensional jigsaw (Bonini, 2005).
Typically, two controllers will be in control of one sector at anyone time;
depending on the country and airspace, this varies between one - three
controllers per sector. Once the aircraft has reached the edge of the
airspace, the controller Is required to hand off the aircraft to a controller In
the adjacent sector. Sector dimensions can be changed to accommodate
changes in traffic levels as well as other constraints such as military
activity (Bonini, 2005). Each sector has a pre-determined capacity limit to
77
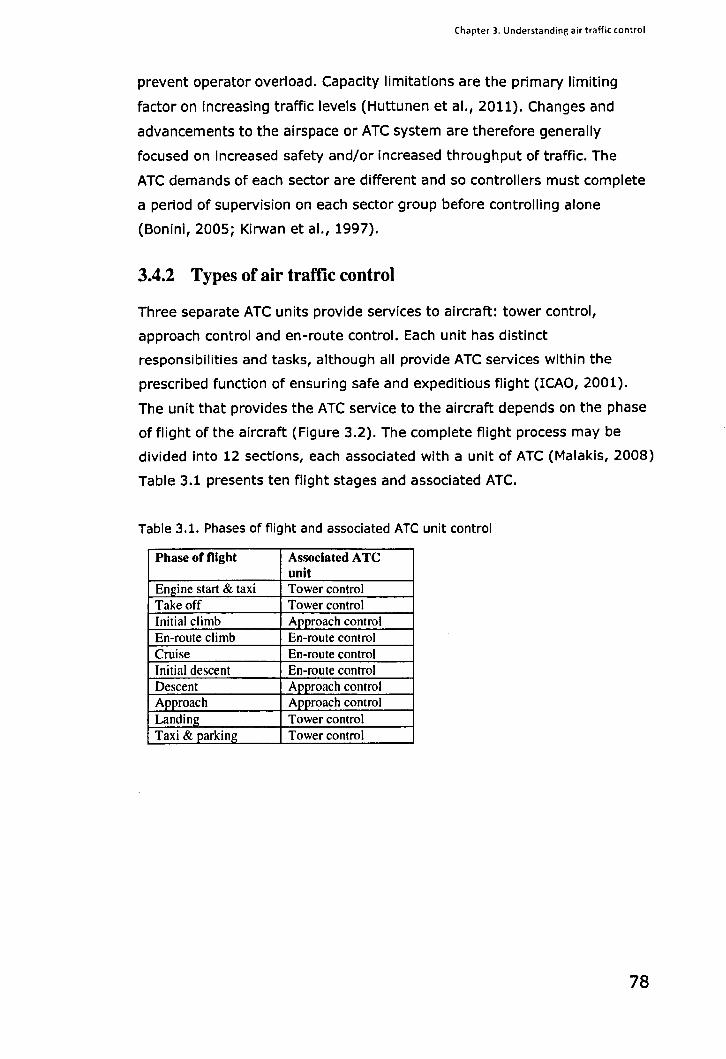
Chapter 3. Understanding air traffic control
prevent operator overload. Capacity limitations are the primary limiting
factor on increasing traffic levels (Huttunen et aI., 2011). Changes and
advancements to the airspace or ATC system are therefore generally
focused on increased safety and/or increased throughput of traffic. The
ATC demands of each sector are different and so controllers must complete
a period of supervision on each sector group before controlling alone
(Bonini, 2005; Kirwan et aI., 1997).
3.4.2 Types of air traffic control
Three separate ATC units provide services to aircraft: tower control,
approach control and en-route control. Each unit has distinct
responsibilities and tasks, although all provide ATC services within the
prescribed function of ensuring safe and expeditious flight (ICAO, 2001).
The unit that provides the ATC service to the aircraft depends on the phase
of flight of the aircraft (Figure 3.2). The complete flight process may be
divided into 12 sections, each associated with a unit of ATC (Malakis, 2008)
Table 3.1 presents ten flight stages and associated ATC.
Table 3.1. Phases of flight and associated ATe unit control
Phase of flight Associated A TC unit
Enj(ine start & taxi Tower control Take off Tower control Initial climb Approach control En-route climb En-route control Cruise En-route control Initial descent En-route control Descent Approach control Approach Approach control Landinj( Tower control Taxi & parking Tower control
78
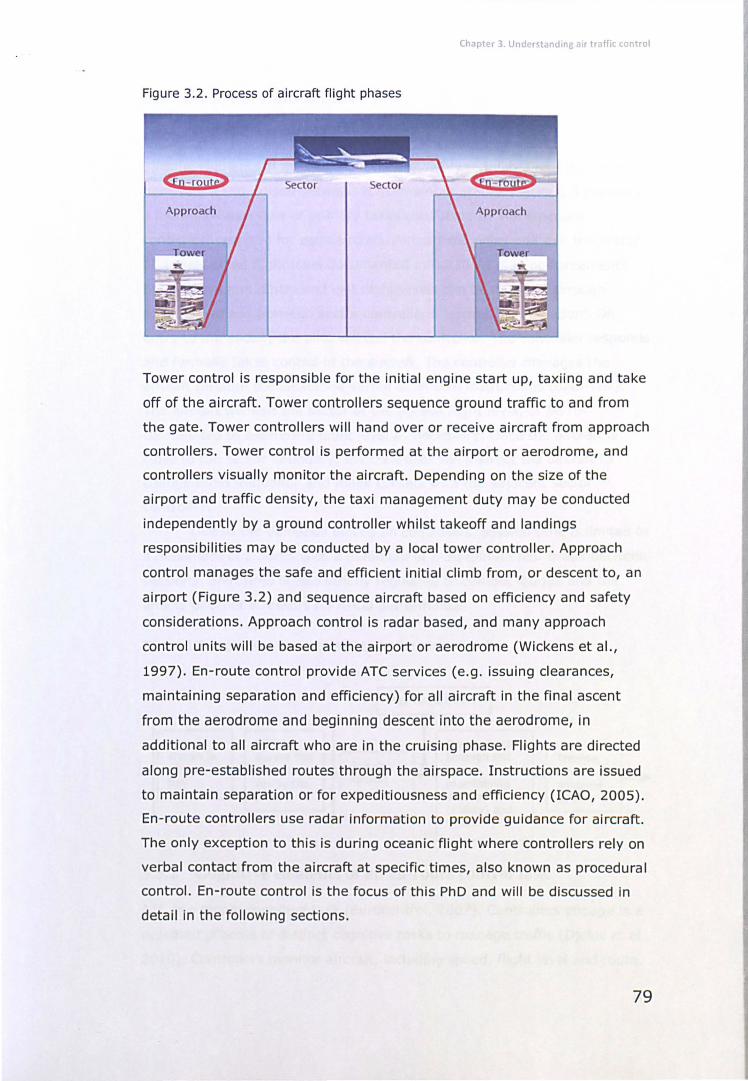
Chapter 3. Understanding air traffic control
Figure 3.2. Process of aircraft flight phases
<£i - rou te> ector ector
Approach
Tower control is responsible for the initial engine start up, taxiing and take
off of the aircraft. Tower controllers sequence ground traffic to and from
the gate. Tower controllers will hand over or receive aircraft from approach
controllers. Tower control is performed at the airport or aerodrome, and
controllers visually monitor the aircraft. Depending on the size of the
airport and traffic denSity, the taxi management duty may be conducted
independently by a ground controller whilst takeoff and landings
responsibilities may be conducted by a local tower controller. Approach
control manages the safe and efficient initial climb from, or descent to, an
airport (Figure 3.2) and sequence aircraft based on efficiency and safety
considerations. Approach control is radar based, and many approach
control units will be based at the airport or aerodrome (Wickens et aI.,
1997). En-route control provide ATC services (e.g. issuing clearances,
maintaining separation and efficiency) for all aircraft in the final ascent
from the aerodrome and beginning descent into the aerodrome, in
additional to all aircraft who are in the cruising phase. Flights are directed
along pre-established routes through the airspace. Instructions are issued
to maintain separation or for expeditiousness and efficiency (ICAO, 2005).
En-route controllers use radar information to provide guidance for aircraft.
The only exception to this is during oceanic flight where controllers rely on
verbal contact from the aircraft at specific times, also known as procedural
control. En-route control is the focus of this PhD and will be discussed in
detail in the following sections.
79
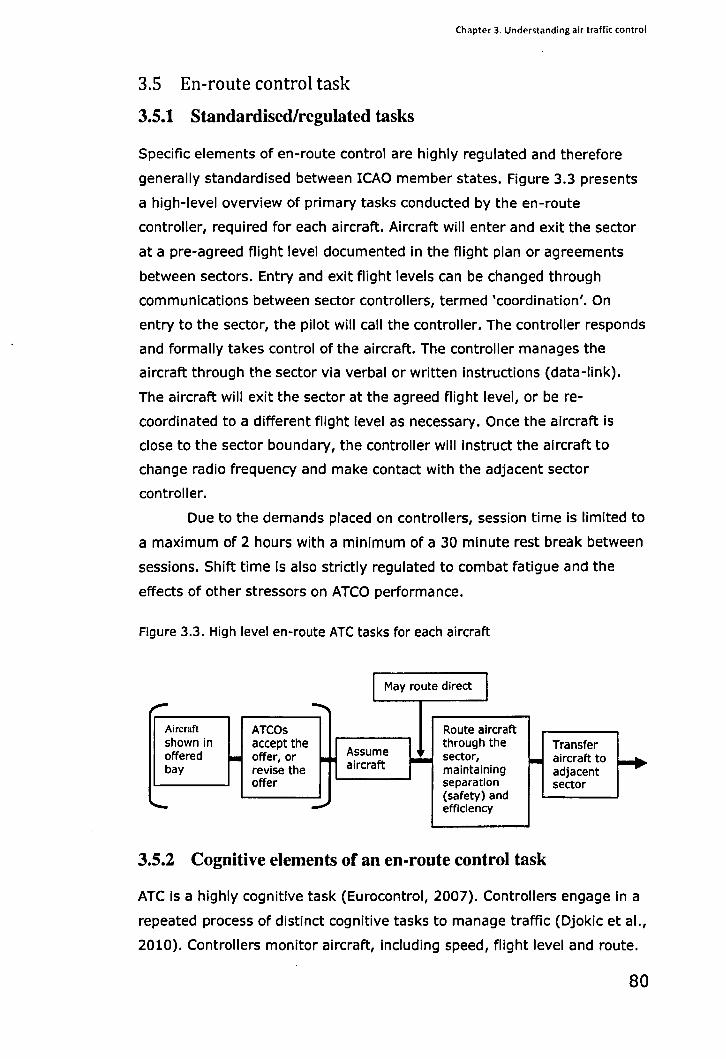
Chapter 3. Understanding air traffic control
3.5 En-route control task
3.5.1 Standardised/regulated tasks
Specific elements of en-route control are highly regulated and therefore
generally standardised between ICAO member states. Figure 3.3 presents
a high-level overview of primary tasks conducted by the en-route
controller, required for each aircraft. Aircraft will enter and exit the sector
at a pre-agreed flight level documented in the flight plan or agreements
between sectors. Entry and exit flight levels can be changed through
communications between sector controllers, termed 'coordination'. On
entry to the sector, the pilot will call the controller. The controller responds
and formally takes control of the aircraft. The controller manages the
aircraft through the sector via verbal or written instructions (data-link).
The aircraft will exit the sector at the agreed flight level, or be re
coordinated to a different flight level as necessary. Once the aircraft is
close to the sector boundary, the controller will instruct the aircraft to
change radio frequency and make contact with the adjacent sector
controller.
Due to the demands placed on controllers, session time Is limited to
a maximum of 2 hours with a minimum of a 30 minute rest break between
sessions. Shift time is also strictly regulated to combat fatigue and the
effects of other stressors on ATCO performance.
Figure 3.3. High level en-route ATe tasks for each aircraft
I May route direct I ,- ......
Aircraft ATCOs Route aircraft shown in accept the through the Transfer offered I- offer, or • Assume
~-sector, aircraft to -+ aircraft I-bay revise the maintaining adjacent
offer separation sector (safety) and ..... ..,. efficiency
3.5.2 Cognitive elements of an en-route control task
ATC is a highly cognitive task (Eurocontrol, 2007). Controllers engage in a
repeated process of distinct cognitive tasks to manage traffic (Djokic et aI.,
2010). Controllers monitor aircraft, Including speed, flight level and route.
80

Chapter 3. Understanding air traffic control
Vigilance is therefore a critical element of the control task. Controllers then
evaluate the information to identify any potential conflicts or opportunities
to improve efficiency. Decision making is integral to the control task
(Bonini, 2005). Controllers then make a plan and prioritise actions for the
efficient and/or safe management of the traffic. To plan efficiently,
controllers must be able to anticipate future events, such as aircraft
trajectories and pilot intentions, which is an essential cognitive skill
(Niessen et aI., 1999). Anecdotally, en-route controllers report developing
plans for the projected situation two or three minutes ahead of the present
time. Controllers usually develop several backup plans which can be
applied if the situation changes. This flexibility is critical to control traffic in
a dynamic environment. Controllers therefore assess and prioritise plans
(Lenorovitz & Phillipp, 1987) to determine the most appropriate strategy
for the situation at the present time. Controllers implement the preferred
plan through verbal instructions to pilots. The plan must be executed at
the correct time and in an appropriate sequence. Controllers have to divide
attention between multiple tasks and aircraft.
Situation awareness is a critical element in controlling aircraft and
anticipating future events. Controllers maintain SA through a mental
representation. The mental representation is updated by conSistently
rescanning radar. Degradation of picture, and therefore situation
awareness, can have severe negative consequences. Controllers may not
be aware of all aircraft, or know the Intentions of the perceived aircraft,
and so cannot plan or prioritise actions.
3.5.3 Orchestration of tramc: personal control styles conducted within strict regulations
The orchestration of the traffic through the sector is dependent on the
controller's choice of management strategy, conducted within strict
regulations and procedures. Controlling aircraft Is a creative process, and
controllers differ on styles of control strategy. Learning to control has
therefore been associated with learning a craft, with skills and strategies
passed from instructor to trainee. Controllers actively interact with the
traffic and by applying specific strategies, controllers regulate and manage
their own workload (Sperandio, 1971).
81
Chapter 3. Understanding air traffic control
3.6 Selection and training of en-route controllers
The selection and training of controllers is rigorous. Selection may
incorporate a battery of cognitive ability tests and occasionally personality
and biographical assessments (Wickens et aI., 1997). Over 114 weeks,
training progresses through lectures, simulations and on the job training
with an increasing emphasis on independent control of aircraft in Europe.
Controllers initially qualify on one sector group. Qualification on other
sectors groups is possible after a period of supervised on the job training.
3.7 En-route control operations environment
ATCOs provide ATC services under dynamic and often challenging
conditions (Huttunen et aI., 2011). Numerous variables can influence the
control situation, such as weather conditions or military activity, which will
affect the management of traffic through the sector. Unexpected or
emergency situations contribute to the complexity. Time pressure is an
inherent characteristic of ATe (Rantanen & Nunes, 2005), which may act
as a stressor (Wickens et aI., 1997). Extremes of traffic frequency and
complexity, resulting in high or low taskload, are each associated with
separate challenges for the controller. It may be challenging to remain
vigilant during periods of very low traffic. In periods of high traffic,
controllers must divide attention between aircraft and complete multiple
tasks, whilst making decisions and under time pressure and high taskloads.
Controllers also frequently transition between taskloads, and must
rapidly transition state to the associated traffic demands contributing
further to challenging conditions. Control systems and tools can also
change relatively frequently. Controllers must therefore also adapt to
frequent changes in the operations room.
3.7.1 Teams and coordination within air traffic control
The ATe service is achieved through the coordination and interaction of
teams. In its broadest sense, each aviation professional contributing to the
ATe service may be considered as part of the same team. Controllers'
cooperation with other teams can be divided into intra-cooperation and
inter-cooperation.
82
Chapter 3. Understanding air traffic control
3.7.2 Intra-cooperation between controllers
3.7.2.1 Cooperation between controllers working on the same sector
"The control of aircraft is considered a combined team effort" (Rognin &
Blanquart, 2001, p329). Each en-route sector, in general, will be controlled
by two ATCOs working jointly on the same airspace, an executive
controller (EC) and a coordinating controller (CC). All controllers can be an
EC or CC during each session, planned via a roster. To facilitate
cooperation, controllers are co-located on operational work stations. The
EC and CC work as a team to provide a safe and efficient ATC service
although each controller has separate responsibilities. The EC controls the
aircraft and is responsible for managing aircraft through the sector and
issuing clearances. The CC is often described as the EC's assistant (Rognin
& Blanquart, 2001). Tasks Include coordinating aircraft sector entries and
exits with CC's on adjacent sectors, as well as supporting the EC as
appropriate by highlighting conflicts, discussing plans or managing the
number of aircraft in the sector to prevent overload. The supporting role of
the CC reduces the EC's workload (Stager & Hameluck, 1990) and provides
redundancy in the system by providing an additional pair of eyes and ears
for monitoring traffic. The EC and CC must maintain a shared awareness of
the traffic situation (Rognin & Blanquart, 2001) to work together by
maintaining their own Internal representation. In addition, the CC will
observe non-verbal cues such as controller-pilot communications, speed of
instructions, traffic situations on the radar (Rognin & Blanquart, 2001), to
appropriately support the EC.
3.7.2.2 Cooperation between controllers during handovers
Cooperation between controllers on the same sector also occurs
during hand-over of the control session. Once the ATCO (EC or CC) has
worked the 90 or 120 minutes on session, control will be handed over to
another ATCa. Frequently, an incoming ATCa will observe the traffic
situation to build a mental picture. At an appropriate time, the outgoing
ATCa will provide a verbal summary of relevant traffic information. ance
the incoming ATca feels comfortable, control will be handed over.
83
Chapter 3. Understanding air traffic control
3.7.3 Inter-cooperation between controllers
Inter-cooperation occurs between controllers on adjacent sectors to
maintain a smooth and integrated service. Aircraft will pass through
several sectors from take-off to landing. Each aircraft must be coordinated
to fly through each sector at specific entry and exit flight levels.
Coordination is frequently implicit and potentially automatic depending on
available systems. Coordination can be explicit through verbal
communications if a change to entry or exit flight levels or routes is
required.
3.8 Communication as an essential element of the air traffic
control system
Both verbal and non-verbal communications are essential in the ATC
system. ATCOs control aircraft by issuing verbal instructions to pilots using
radio telephony (R/T), or written instructions using a data-link system.
Verbal communications between controller and pilot also permit the
exchange of relevant Information such as location of weather and
associated turbulence and position of other aircraft (Wickens et aI., 1997).
Air-ground communications, including phraseology, language and
procedures are highly regulated and standardised which ensures
comprehension between individuals (controllers, pilots) of different
nationalities and native languages, and reduces errors in the
communication process.
The readback-hearback process is an example of a communication
procedure which reduces error. Once a controller communicates an
instruction to the pilot, the pilot must 'read back' the message to the
controller. The controller actively listens to this read back (known as the
'hear back') for inaccuracies. This creates redundancy In the system, and
an opportunity for controllers to Identify and correct errors.
Communication between the EC and CC on the same sector Is
essential for the transfer of information. As the ATCOs are co-located,
communications may be verbal or non-verbal (Rognin & Blanquart, 2001).
For example, a controller could point at the radar screen to inform the
other of a particular situation. Verbal communication is still used, when
possible, to transfer information, including reminders and discussing
strategies and priorities. Verbal communications are also necessary for
84
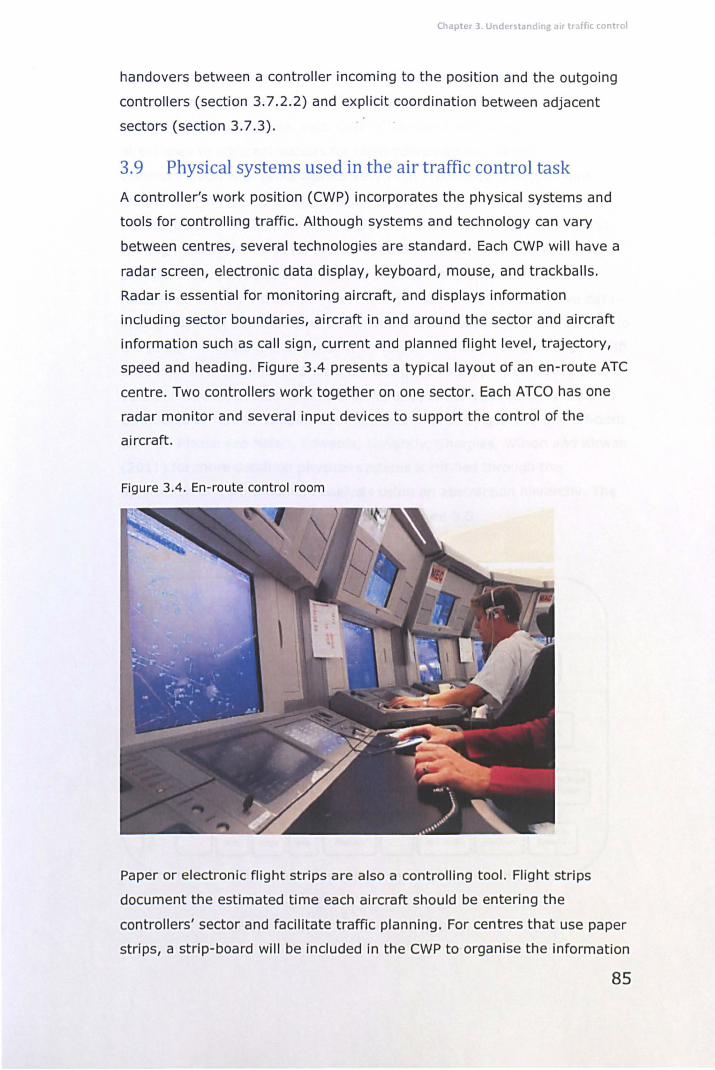
Chapter 3. Understanding air traffic control
handovers between a controller incoming to the position and the outgoing
controllers (section 3.7.2.2) and explicit coordination between adjacent
sectors (section 3.7.3).
3.9 Physical systems used in the air traffic control task
A controller's work position (CWP) incorporates the physical systems and
tools for controlling traffic. Although systems and technology can vary
between centres, several technologies are standard. Each CWP will have a
radar screen, electronic data display, keyboard, mouse, and trackballs.
Radar is essential for monitoring aircraft, and displays information
including sector boundaries, aircraft in and around the sector and aircraft
information such as call sign, current and planned flight level, trajectory,
speed and heading. Figure 3.4 presents a typical layout of an en-route ATC
centre. Two controllers work together on one sector. Each ATCO has one
radar monitor and several input devices to support the control of the
aircraft.
Figure 3.4. En-route control room
Paper or electronic flight strips are also a controlling tool. Flight strips
document the estimated time each aircraft should be entering the
controllers' sector and facilitate traffic planning. For centres that use paper
strips, a strip-board will be included in the CWP to organise the information
85
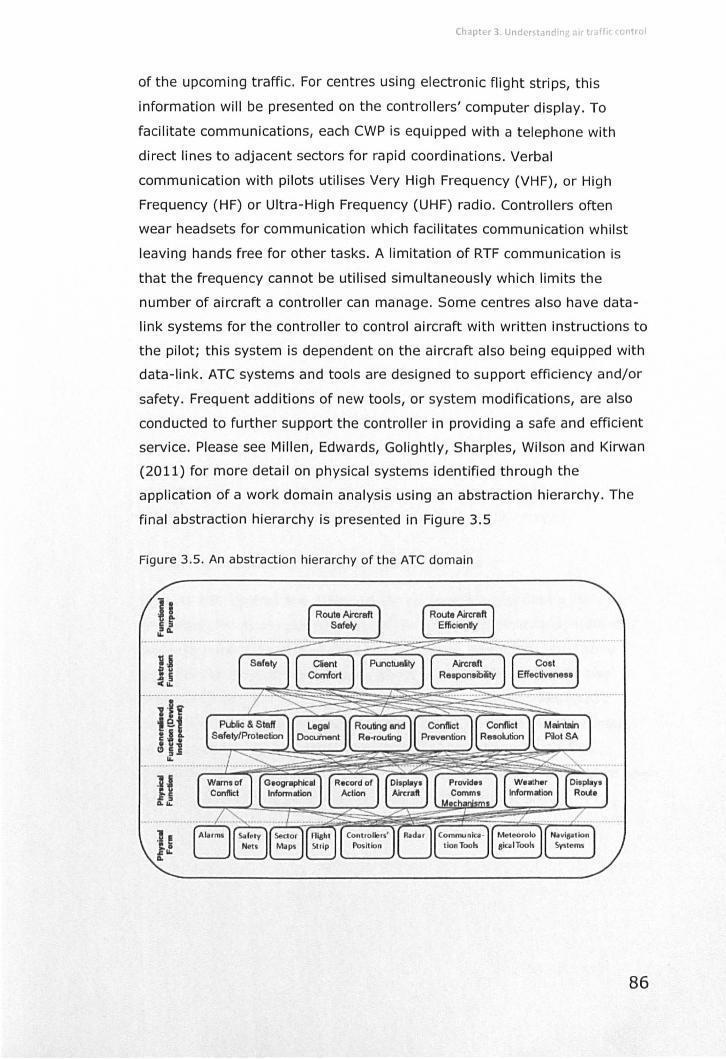
Chapter 3. Understanding Jir traffic tOntrol
of the upcoming traffic. For centres using electronic flight strips, this
information will be presented on the controllers' computer display. To
facilitate communications, each CWP is equipped with a telephone with
direct lines to adjacent sectors for rapid coordinations. Verbal
communication with pilots utilises Very High Frequency (VHF), or High
Frequency (HF) or Ultra-High Frequency (UHF) radio. Controllers often
wear headsets for communication which facilitates communication whilst
leaving hands free for other tasks. A limitation of RTF communication is
that the frequency cannot be utilised simultaneously which limits the
number of aircraft a controller can manage. Some centres also have data
link systems for the controller to control aircraft with written instructions to
the pilot; this system is dependent on the aircraft also being equipped with
data-link. ATC systems and tools are designed to support efficiency and/or
safety. Frequent additions of new tools, or system modifications, are also
conducted to further support the controller in providing a safe and efficient
service. Please see Millen, Edwards, Golightly, Sharples, Wilson and Kirwan
(2011) for more detail on physical systems identified through the
application of a work domain analysis using an abstraction hierarchy. The
final abstraction hierarchy is presented in Figure 3.5
Figure 3.5. An abstraction hierarchy of the ATe domain
1~ CI.
86
Chapter 3. Understanding air traffic control
3.10 Familiarisation with the air traffic control domain
3.10.1 The need for familiarisation with the A TC domain
Air traffic control is a unique safety critical industry which is highly
dependent on human performance. Several other safety critical industries,
such as the nuclear industry, have highly regulated procedures for each
task element. In addition, many task analyses are available which
comprehensively summarise the operator task and environment. In
contrast, controllers orchestrate traffic according to several variables,
including the airspace design, current situation and own controlling style.
Many more degrees of freedom exist in ATC. To comprehensively
understand the domain and how to conduct research In the domain,
familiarity with the ATC environment was needed (Kirwan, Kaarstad,
Hauland, & Follesoe, 1995). A series of visits to ATC centres allowed the
researcher to become involved in the ATC environment, and learn about
the domain from aviation professionals and through Informal observations.
The experience informed the study approach and design of future
investigations to ensure information was captured using the appropriate
methods and analysis approach within this unique environment.
3.10.2 Generation of visits to control centres
Visits to ATC centres and meetings with air traffic professionals were
organised. Practical considerations of visiting a high security environment
(such as availability of host, security clearance) meant that visits were
organised on an opportunity basis. Visits were generated through two
avenues. EUROCONTROL, as the project client, arranged visits to ATC
centres on the researchers' behalf. The researcher continued the contact
with personnel and arranged future visits or meetings with aviation
professionals as necessary. Table 3.2 summarises visits to ATC centres and
aviation professional groups and the associated learning points.
87
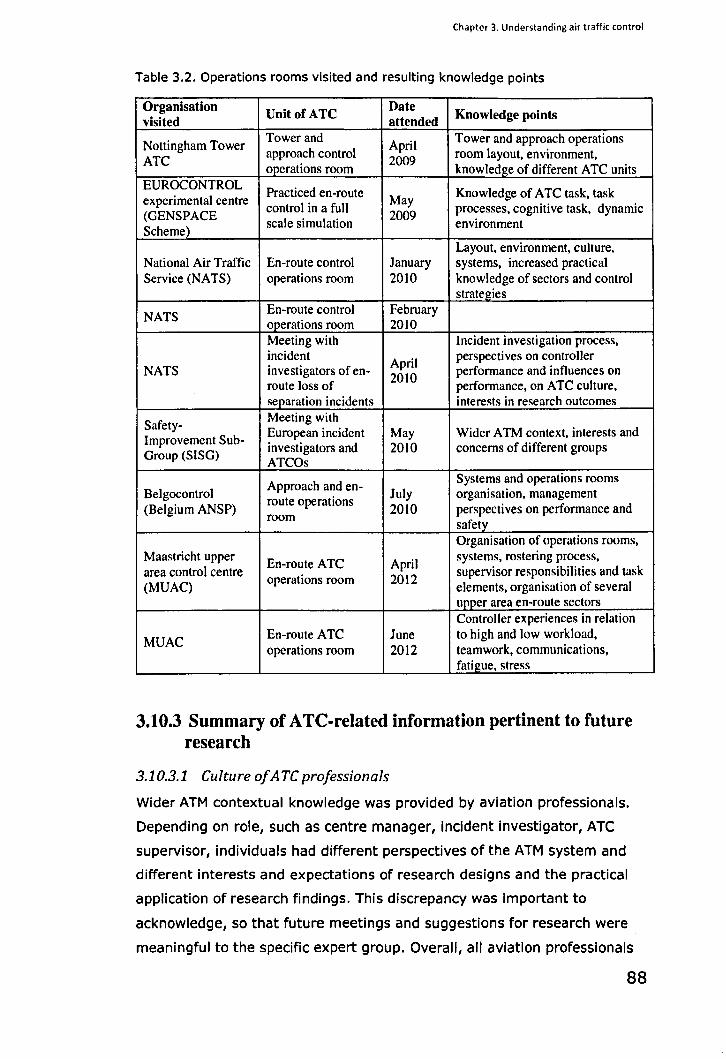
Chapter 3. Understanding air traffic control
Table 3.2. Operations rooms visited and resulting knowledge points
Organisation Unit of ATe
Date Knowledge points
visited attended
Nottingham Tower Tower and
April Tower and approach operations
approach control room layout, environment, ATC
operations room 2009
knowledge of different ATC units EUROCONTROL
Practiced en-route Knowledge of ATC task, task experimental centre May (GENS PACE
control in a full 2009
processes, cognitive task, dynamic
Scheme) scale simulation environment
Layout, environment, culture, National Air Traffic En-route control January systems, increased practical Service (NATS) operations room 2010 knowledge of sectors and control
strategies
NATS En-route control February operations room 2010 Meeting with Incident investigation process, incident
April perspectives on controller
NATS investigators of en- performance and influences on route loss of
2010 performance, on A TC culture,
separation incidents interests in research outcomes
Safety-Meeting with European incident May Wider A TM context, interests and
Improvement Sub-investigators and 2010 concerns of different groups
Group (SIS G) ATCOs
Approach and en-Systems and operations rooms
Belgocontrol July organisation, management (Belgium ANSP)
route operations 2010 perspectives on performance and
room safety Organisation of operations rooms,
Maastricht upper En-route A TC April
systems, rostering process, area control centre supervisor responsibilities and task (MUAC)
operations room 2012 elements, organisation of several upper area en-route sectors Controller experiences in relation
MUAC En-route A TC June to high and low workload, operations room 2012 teamwork, communications,
fatigue, stress
3.10.3 Summary of A TC-related information pertinent to future research
3.10.3.1 Culture of ATe professionals
Wider ATM contextual knowledge was provided by aviation professionals.
Depending on role, such as centre manager, Incident Investigator, ATC
supervisor, individuals had different perspectives of the ATM system and
different interests and expectations of research designs and the practical
application of research findings. This discrepancy was important to
acknowledge, so that future meetings and suggestions for research were
meaningful to the specific expert group. Overall, all aviation professionals
88
Chapter 3. Understanding air traffic control
were positive towards supporting research investigations, provided that
research outcomes were relevant to the ATC environment, and could be
practically applied to achieve a positive influence on safety and/or
efficiency.
3.10.3.2 Experience o/the different types of air traffic control
Experience of tower, approach and en-route operations rooms enabled an
appreciation of the range of ATC tasks and contexts. Controllers in all units
had similar skills (e.g. representation of the picture, planning and
orchestrating traffic) although the tasks were disparate. Differences were
especially apparent between tower control and en-route control in terms of
systems, tools and task requirements. Approach control and en-route
control were both conducted through the use of radar, but the sectors
managed by approach control resulted in much more vertical orchestration
of traffic compared to en-route control. These differences suggested that
research findings specific to en-route control may not be automatically
directly generalised to other ATC units.
3.10.3.3 Experience o/the en-route air traffic control operations room
Physical qualities of en-route operations rooms
Physical layouts of operations rooms differed between centres. Common
elements included an open room with a supervisor position, usually located
centrally, with views around the control centre, and Controllers' Working
Positions (CWPs) which were co-located depending on sector. There were
two CWPs per sector. Systems and tools described in section 3.10 were
observed in use. It became apparent how each tool facilitated or supported
the control task. The open space meant that controllers were able to see
and communicate with colleagues across the room, and listen to
colleagues' discussions and clearances. The open layout also meant that
visitors walking around the room needed to be cognizant not to distract
controllers. Visitors sat with controllers with permission, and spare seats
and headsets were made available. When pOSSible, controllers provided
information about airspace characteristics, systems and tools as well as the
traffic situation.
89
Chapter 3. Understanding air traffic control
Environment and culture of en-route operations rooms
The en-route operations room provided an insight into the less tangible
atmosphere of operations rooms, and culture between controllers, as well
as environmental influences under which the control task is performed. The
atmosphere in the operations room was variable depending on traffic flow.
During peak traffic, the room was busy and loud, with supervisors moving
around the room and controllers conSistently talking on radios and phones.
When traffic was considered low, the operations room had a relatively
relaxed atmosphere, with controllers sitting back in chairs and chatting to
colleagues in between periods of traffic. During these times, controllers
spoke to visitors at length and provided information about the traffic
situation. When traffic was building from low to high, it became apparent
that controllers had to change state and would change controlling style in
preparation for the traffic. Taskload variations appeared to be integral to
the task.
It was observed that several simultaneous demands are placed on
controllers, including simultaneous task demands as well as demands by
colleagues. ECs will often be approached by supervisors or teammates for
discussion, especially when traffic is building. In addition, frequent visitors
to the operations room may result in distraction to controllers. The
environment was therefore demanding, especially during high traffic
periods, and it was essential that controllers were not interrupted. It was
identified that research could not be conducted in an operations room,
unless a method such as a non-intrusive observation was applied with
sensitivity.
On initial visits, occasionally controllers voiced concerns that
information they shared may be repeated to teammates, supervisors or
even centre management. It became apparent that in order to gain open
and honest responses from controllers, even during Informal visits, that
anonymity and confidentiality must be explicitly stated during any
conversations or future studies.
Controllers used language and terms which were speCific to the ATC
domain. Phraseology, such as 'the picture' for SA and understanding of
factors such as fatigue and workload, will be necessary to take into
account in future research in order to communicate effectively with
controllers.
90
Chapter 3. Understanding air traffic control
It was apparent through observations that there was a team culture
in the operations room. Teamwork was observed between EC and CC who
would work together to deliver services to the same sector, through
discussions, the CC facilitating the task of the EC and acting as a second
monitor of the traffic situation. Especially in high traffic, the coordinator
appeared to change control strategy to support the executive without
verbal discussion. It was also frequently observed that supervisors would
offer extra support to controllers if it was necessary, usually in unexpected
or emergency situations, and consult with the controllers before collapsing
or separating sectors. It appeared necessary for controllers to trust one
another to make the appropriate decisions and control traffic with a
consistently high performance. Controllers also needed to trust colleagues
to provide support if needed, such as swapping positions if the EC had
been controlling busy traffic for a length of time and felt fatigued. Although
this was not observed, controllers spoke of this as a critical option for
managing their own performance.
3.10.3.4 Developing understanding o/the En-route task
The ATC task was experienced first-hand by the researcher during a two
day high fidelity simulation event hosted by EUROCONTROL. Basics of ATC
were taught and then practiced under varying air traffic conditions (such as
sector size, traffic density, traffic complexity and unexpected situations).
The physical systems and ATC tools were used, which provided Insight Into
the functions and the way In which it supported the ATC task. Regulated
procedures, such as phraseology, airspace characteristics and basic
required control processes were experienced. Aviation phraseology was
learned so that the 'pilot' could be spoken to during the simulation. As
control of aircraft is primarily verbal, It was Identified if future studies were
conducting when ATCOs were on position, measures requiring verbal
responses could not be utilised.
In addition, the cognitive nature of the task became apparent.
Remaining vigilant was essential. A large number of variables needed to be
assessed in order to select the most appropriate traffic management
strategy. Rescanning was also Integral to maintaining the mental
representation in order to monitor that the selected strategy was still
appropriate to the changing situation. Occasionally, unexpected Issues
would occur, such as non-response from a pilot, unexpected aircraft in the
91
Chapter 3. Understanding air traffic control
sector, an aircraft coming into the sector at an unexpected flight level or
even a breakdown of communication technologies. Controllers need to be
flexible enough to be able to incorporate these issues Into the traffic
management strategy and still maintain safe control of traffic. This
suggests that it is necessary in future studies to utilise measures of
subjectively experienced variables. Performance level was based on
efficiency and safety. If the situation was safe, strategies which were more·
efficient were expected.
Controllers perform simultaneous tasks, whilst maintaining
performance in a demanding environment. It is important to note that it
was not only periods of high traffic that were found to be challenging.
During extended periods of low traffic, occasionally vigilance and scanning
periodicity may fall which can influence performance. It is therefore
essential to consider both extremes of taskload and workload if considering
workload in future investigations. Controllers had regular rest intervals to
use as they saw fit, including taking a nap, reading a magazine or eating
and drinking.
Visits to three European centres showed that there were differences
in the systems and tools utilised by controllers. It is Important for future
studies to include controllers from different centres to gain representative
results. If this is not pOSSible, caution will be suggested regarding
generalisation of results.
3.10.3.5 Implications of an understanding of the ATC domain for future
phases ofresearch
Experience of the ATC task and operations room, in addition to information
captured in books and journal papers, provided insights into the ATC
domain as well as information that facilitates the design and method
selection for future studies. The learning points that will be acknowledged
in future studies include:
1. Tailoring of different information to meet the interests of different
aviation groups
2. Any research outputs should be practical and relevant to the ATC
domain
3. Caution with generalisation of results between different forms of
control
92
Chapter 3. Understanding air traffic control
4. Distraction of controlling on position could have severe negative
consequences. Investigations are therefore not recommended to
take place in the operations room
5. Anonymity and confidentiality concepts will be explicitly stated to
future aviation professional participants to encourage open and
honest feedback.
6. Controllers use specific terms that relate to ATC elements. To
communicate effectively, this natural language can be incorporated
into future studies with ATCOs as participants
7. Subjective measures or methods may be prioritised due to the
cognitive nature of the control task
3.11 Chapter summary
A review of the key features of ATM and ATC was provided. The separate
forms of ATC were described, and the task elements of ATC were
presented. It was emphasised that the task was primarily cognitive and
research study designs and measures must acknowledge this task feature.
The ATC working environment was described, and the importance of
teamwork, intra and inter cooperation and communications is emphasised.
The researchers' familiarisation with the ATC field is subsequently justified
and described. The generation of visits is described, and visits to control
centres are documented. Topics pertinent to considerations of future
research are presented, including physical layout of the ATe operations
rooms, environment and culture of the ATC operations room and the en
route task. The chapter concludes with a summary list of information topics, .
established from the visits and naturalistic observations of the operation
room, which must be acknowledged in the design of future research in
order to be relevant and appropriate to the ATC setting.
93
Chapter 4. Methodological approach and research framework
Chapter 4. Methodological approach and
research framework
4.1 Chapter overview
This chapter describes the research approach and research framework of
the thesis. The research approach incorporates elements of the action
research approach, and the strategic combination of multiple methods and
sources of data. The framework presents an overview of the integration of
methods used to address the thesis aims. Each method is then described in
order of application and linked to the research aims.
4.2 Overall research approach
4.2.1 Research studies built upon previous findings
Research studies built upon previous findings, incorporating some
properties of the action research approach (see Reason & Bradbury, 2006).
Findings from previous studies contributed to the method selection and
research questions of the subsequent study that were most appropriate to
address the overall aims of the thesis. The aims of the thesis remained the
same throughout the project, although the research progression was
flexible.
4.2.2 Multiple sources of data addressed research aims
A strategic combination of methods was applied to address the aims of the
thesis. Table 4.1 summarises the methods used to address the thesis aims.
The strength of this approach is that a comprehensive understanding of the
data from varying perspectives, is generated.
Research took place in both field and experimental settings. Data
specific to the ATe environment (incident reports, questionnaire of air
traffic professionals) was used to gain a representation of human factors
occurring in the field. An experimental study then facilitated the
measurement of factor relationships and associations with performance In
a controlled setting. Finally, a return to the field facilitated the confirmation
and extension of specific findings from the experiment, through an
94
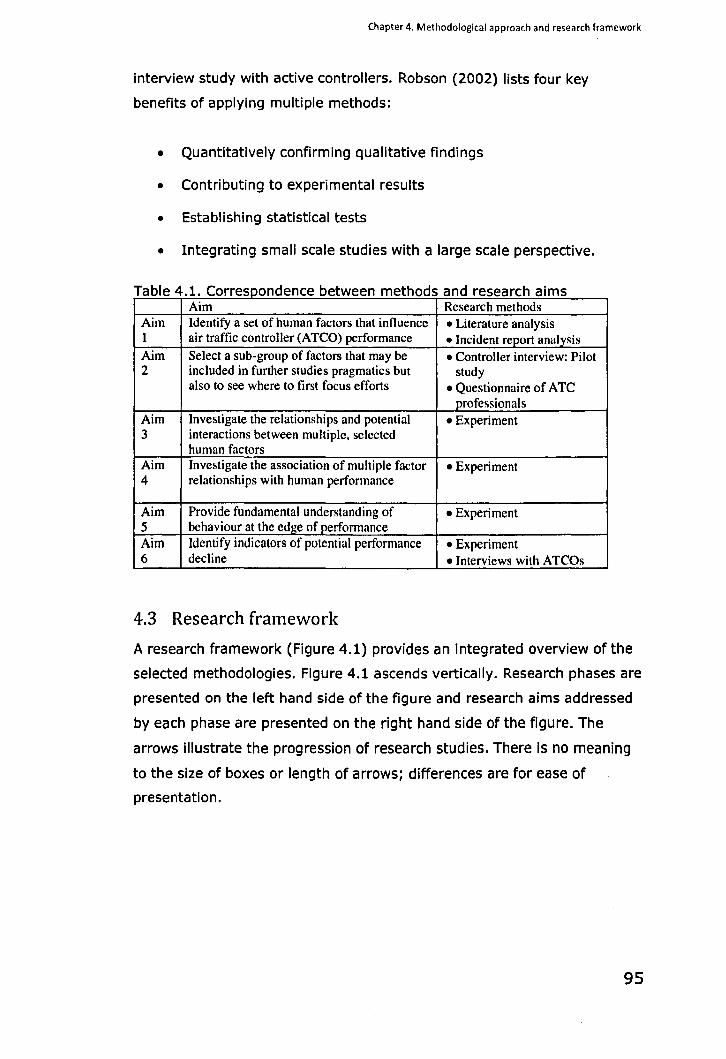
Chapter 4. Methodological approach and research framework
interview study with active controllers. Robson (2002) lists four key
benefits of applying multiple methods:
• Quantitatively confirming qualitative findings
• Contributing to experimental results
• Establishing statistical tests
• Integrating small scale studies with a large scale perspective.
Ta bl 41 C e orrespon d ence b etween me th d o san d researc h . alms Aim Research methods
Aim Identify a set of human factors that influence • Literature analysis 1 air traffic controller (ATCO) performance • Incident report analysis Aim Select a sub-group of factors that may be • Controller interview: Pilot 2 included in further studies pragmatics but study
also to see where to first focus efforts • Questionnaire of A TC professionals
Aim Investigate the relationships and potential • Experiment 3 interactions between multiple. selected
human factors Aim Investigate the association of multiple factor • Experiment 4 relationships with human performance
Aim Provide fundamental understanding of • Experiment 5 behaviour at the edge of performance Aim Identify indicators of potential performance • Experiment 6 decline • Interviews with ATCOs
4.3 Research framework
A research framework (Figure 4.1) provides an integrated overview of the
selected methodologies. Figure 4.1 ascends vertically. Research phases are
presented on the left hand side of the figure and research aims addressed
by each phase are presented on the right hand side of the figure. The
arrows illustrate the progression of research studies. There Is no meaning
to the size of boxes or length of arrows; differences are for ease of
presentation.
95
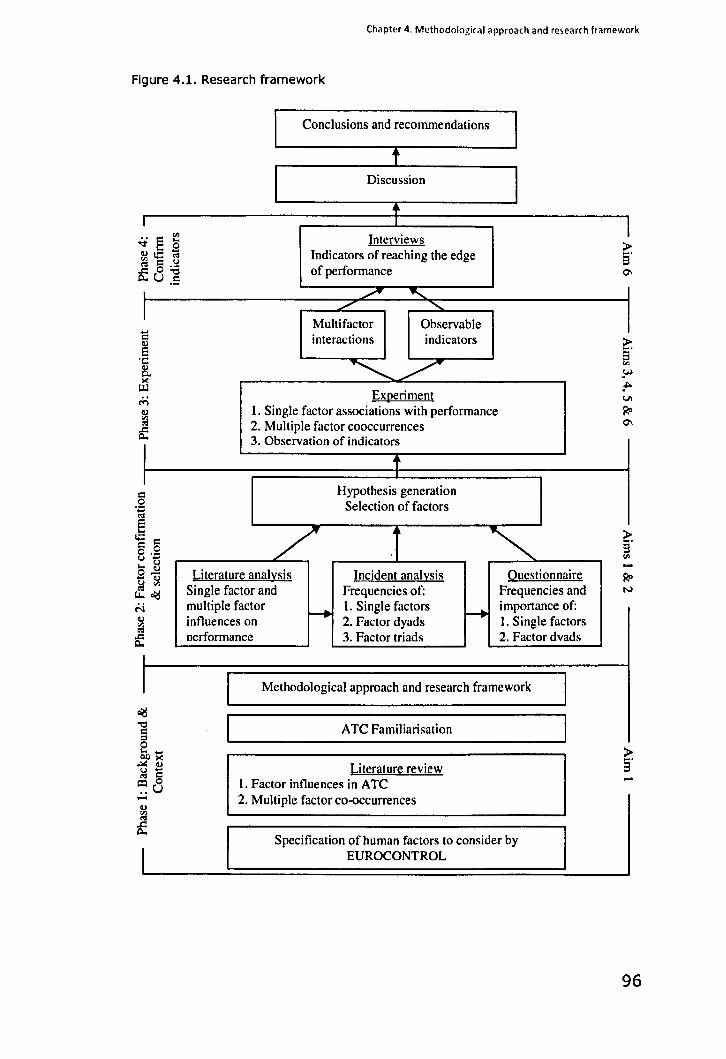
Chapter 4. Methodological approach and research framework
Figure 4.1. Research framework
I
.. E ~ II) !C 'o:i ~ c:: .S!
0", U .5
I
I .... = II) a t: 8-)0(
.. II)
~
c:: 0
"E II)
4) Vl
ad
I
I Conclusions and recommendations I t
I Discussion I +
Interviews Indicators of reaching the edge of performance
~ ...... /' "
Multifactor Observable interactions indicators
~~ Experiment
1. Single factor associations with performance 2. Multiple factor cooccurrences 3. Observation of indicators
t Hypothesis generation
Selection of factors
/ .f " Literature analysis Incident analysis Questionnaire Single factor and Frequencies of: Frequencies and multiple factor
-+ 1. Single factors ~
importance of: influences on 2. Factor dyads 1. Single factors oerformance 3. Factor triads 2. Factor dvads
Methodological approach and research framework
ATC Familiarisation
Literature review 1. Factor influences in ATe 2. Multiple factor co-occurrences
Specification of human factors to consider by EUROCONTROL
I > S· 01
> s· '" ~ .... VI
Ro 01
~ 3 '" -Ro N
-
96
Chapter 4. Methodological approach and research framework
4.4 Overview of the methods used in this thesis
4.4.1 Research phase 1: Background and context
EUROCONTROL provided an initial set of nine factors (workload, fatigue,
stress, attention, vigilance, SA, communications, teamwork, and trust) to
be included in the research. The researcher was confident that the
experienced professionals in EUROCONTROL understood the human factors
that occur in ATC settings and affect controller performance and so the
nine factors were used at the start of the research.
4.4.1.1 Literature review
A literature review was completed on previous research of human factor
associations with controller performance and relationships between
multiple factors (Chapter 2). The review was restricted to the nine factors
provided by EUROCONTROL. The review facilitated future hypothesis
generation as well as ensuring research was not unnecessarily repeated.
Research gaps were Identified. Few research studies considered the
association of factor dyads with performance and no research studies that
were reviewed investigated factor interactions In association with
performance.
4.4.1.2 Familiarisation with the air traffic control domain
Visits to ATe operations rooms provided detailed information about the
operators' task and working environment (Chapter 3) which was pertinent
to the design of research studies. In addition, the operations room
atmosphere and considered factors (such as workload, teamwork,
communications) were experienced as they naturally occurred. The
information facilitated the selection of methods that were appropriate to
achieving the research aims within the specific domain.
4.4.1.3 Methodological approach and research framework
The methodological approach supported the development of research
studies and Informed the progression of the research. For example, due to
the progressive approach of the researching, findings from one study were
used to contribute the aims and design of subsequent studies.
97
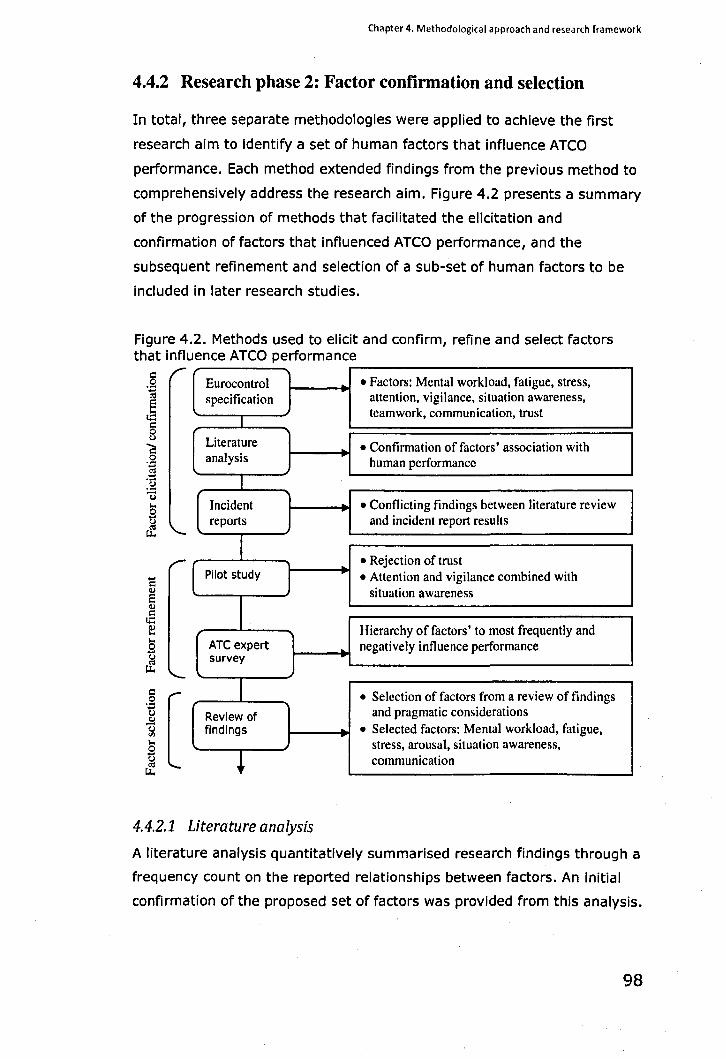
Chapter 4. Methodological approach and research framework
4.4.2 Research phase 2: Factor confirmation and selection
In total, three separate methodologies were applied to achieve the first
research aim to identify a set of human factors that influence ATCO
performance. Each method extended findings from the previous method to
comprehensively address the research aim. Figure 4.2 presents a summary
of the progression of methods that facilitated the elicitation and
confirmation of factors that influenced ATCO performance, and the
subsequent refinement and selection of a sub-set of human factors to be
included in later research studies.
Figure 4.2. Methods used to elicit and confirm, refine and select factors that influence ATCO performance
c .2 ..-~
E to::: c
Eurocontrol • Factors: Mental workload, fatigue, stress, specification attention, vigilance, situation awareness,
I teamwork, communication, trust
0 (.)
I: 0 .;;l
Z3 :9
Literature • Confirmation of factors' association with analysis human performance
I ~ ... S al
Incident --'" • Conflicting findings between literature review reports and incident report results
tJ..
I • Rejection of trust , ..-c
Pilot study • Attention and vigilance combined with Il) e Il) c
to::: ~ I
situation awareness
Hierarchy of factors' to most frequently and ... S ATC expert negatively influence performance
~ survey
c
[ 0
.;;l u
..2 U ... S al
tJ.
I • Selection of factors from a review of findings
Review of and pragmatic considerations
findings • Selected factors: Mental workload, fatigue, stress, arousal, situation awareness,
+ communication
4.4.2.1 Literature analysis
A literature analysis quantitatively summarised research findings through a
frequency count on the reported relationships between factors. An Initial
confirmation of the proposed set of factors was provided from this analysis.
98
Chapter 4. Methodological approach and research framework
Limitations to the data (expanded on in Chapter 11) meant that it was
necessary to confirm and extend the findings with data specific to an ATC
setting to achieve the first research aim.
4.4.2.2 Incident report analysis
An analysis of European aviation incident reports was conducted to extend
the findings from the literature review analysis. A quantitative frequency
analysis identified single factors, factor dyads and factor triads that were
most frequently recorded to contribute to ATCO performance-related
incidents. Findings confirmed the factors identified in the literature analysis.
However, the relative frequencies of consideration of factors differed
between literature analysis and incident report analysis. Therefore, a
questionnaire study was conducted to support the previous findings.
4.4.2.3 Survey-questionnaire of aviation experts
An online survey questionnaire was conducted with aviation professionals.
Findings provided a hierarchy of factors and factor dyads which were
considered to most frequently negatively influence controller performance.
A review of findings from the three methodologies confirmed the
original factor set provided by EUROCONTROL, and a sub-set of factors
which most frequently and negatively influenced performance were
selected for inclusion in future studies. This addressed research aim one
and two. The data generated regarding factor relationships contributed to
hypothesis generation for future studies.
4.4.3 Research phase 3: Experimental investigation of factor relationships in association with performance and the edges of performance
An experiment was conducted to investigate in a controlled setting:
• The relationships between the selected subset of factors
• The association of single factors and multiple, combined factors with
performance
• The edges of performance, and
• Indicators of the performance edge
Participants were 29 male students from the University of Nottingham. For
pragmatic reasons, including limited resources and the political situation
within EUROCONTROL, a full scale ATC simulation was not conducted. A
99
Chapter 4. Methodological approach and research framework
computer-based task with en-route ATC elements was utilised. Using this
form of task was the best way of ensuring the appropriate elements in the
ATC task were included for investigation. This is discussed further in
Chapter 8 (experimental method) and Chapter 11 (discussion). Participants
received four hours training on the experiment task and were required to
achieve a minimum of 18/22 on a task-related competency test.
Taskload was manipulated as the independent variable. Self-report
scales were used to measure factors. Performance was the dependent
variable. In addition, participants' behaviour was observed and specific
behaviours recorded. The experiment study was a major part of this thesis
and contributed to thesis aims 3, 4, 5, 6. The results focused on four
primary areas: factor associations with performance, factor relationships in
association with performance, and the nature of performance at the edge
and indicators of the edge of performance.
4.4.4 Research phase 4: Investigation of indicators of potential performance decline
4.4.4.1 Experiment study findings
Participant behaviours were observed and recorded throughout the
experimental trial. Findings contributed to Identifying the behavioural
indicators of potential performance decline.
4.4.4.2 Interview study
It was necessary to return to the field to confirm and validate the
experimental study findings of the indicators of the edge of performance
within an ATC setting. A total of 22 Individual face-to-face interviews were
conducted with active en-route controllers and supervisors and Internal
and external indicators of reaching the edge of performance were Identified.
4.4.5 Discussion, conclusions and recommendations
The discussion chapter (Chapter 11) provides an opportunity to present
results of particular interest or value that were generated throughout the
course of this thesis. The contribution of the research findings to the thesis
aims as well as wider research are discussed. In addition, the potential
practical applications of research findings to safety critical domains are
described. Findings from this research contributed to the development of a
100
Chapter 4. Methodological approach and research framework
set of recommendations intended for both researchers and aviation
industry experts.
4.5 Chapter summary
This chapter described the research approach used in this thesis and
provided an overview of the research framework. Research studies built
upon findings from previous studies. A combination of methods and data
sources was applied to address specific study aims. A mix of settings,
including field and laboratory settings, were also utilised as appropriate to
address the research aims. The research framework provided an integrated
overview of the development of the research. The chapter concluded with a
summary description of each method used in the thesis, and where
appropriate, a description of methods building upon previous research
findings.
101
Chapter 5. literature metrics and incident report analysis: Confirmation of key human factors and human factor relationships
Chapter 5. Literature metrics and
incident report analysis: Confirmation of
key human factors and human factor
relationships
5.1 Chapter overview
The following chapter describes two studies, a literature review analysis
and an incident report analysis, which investigate the association between
human factors (workload, fatigue, stress, attention, vigilance, SA,
communications, teamwork, trust) in association with performance.
The chapter first describes an analysis of peer-reviewed papers that
investigated the relationship between at least two of the previously
identified human factors. The aims of the study are presented, followed by
the method and a summary of findings. Diagrams are utilised to concisely
summarise identified relationships between factors (section 5.2.4). Results
identified the basis for a second study using a different data set (incident
report analysis).
An incident report analysis study is described (section 5.3). The
aims and research questions are outlined, followed by the methodology
utilised to achieve these aims. Section 5.3.6 reviews the results of the
analysis, followed by a discussion and Interpretation of the results
associated with both the aims of the study and the overall project aims.
Finally, section 5.3.7 concludes that an additional study will consolidate,
and extend the findings to date to comprehensively address the first two
aims of the thesis.
5.2 Literature analysis
5.2.1 Literature analysis: Aims
The aim of the study was to investigate the frequency with which each
factor was selected for inclusion In a defined literature sample of
multifactor research. Findings summarise previous research trends, and
provide an indication of the factors that may be considered as most
102
Chapter 5. literature metrics and incident report analysis: Confirmation of key human factors and human factor relationships
important to include in multifactor research. An additional aim was to
investigate the frequency and type of relationship found between factors.
Findings provide a summary of research to date investigating relationships
between factors, and therefore prevent unnecessary replications. Findings
also provided a basis for future hypotheSiS generation of specific factor
relationships.
5.2.2 Literature analysis: Differentiation between attention, vigilance and SA
The concepts of attention, vigilance and SA have been comprehensively
reviewed in section 2.1.2. However, it is important to clarify how these
interrelated constructs differentiate and why each factor has been included
for consideration. Attention refers to a more general ability to attend to
information in the environment (Eysenck, 2001). Vigilance is identified as a
specific form of attention, and has been suggested to be synonymous with
sustained attention (Aston-Jones, et aI., 1994). The concept of vigilance
therefore overlaps with attention but is also used to describe specific
elements such as detection and response elements during a vigilance task.
Vigilance is essential to the air traffic control (ATC) task as en-route
controllers consistently monitor the radar to ensure the safety of aircraft.
It is worthy of note that SA also overlaps with attention and
vigilance. SA encompasses the vigilance and attention constructs, but also
incorporates several other elements. This concept therefore goes beyond
attention and vigilance alone. All three factors were included for
consideration at the start of the research to gain a comprehensive
understanding of multifactor associations with each factor.
5.2.3 Literature analysis: Method
5.2.3.1 Design and procedure
The literature search was focused on papers that investigated the
relationship between at least two of the following nine human factors:
workload; stress; fatigue; attention; vigilance; SA; communications;
teamwork and trust. These nine factors had been previously identified by
subject matter experts as factors important In ATCa tasks and factors that
could have a critical negative impact on ATCa performance.
Papers were selected according to the following criteria:
103
Chapter S. literature metrics and incident report analysis: Confirmation of key human factors and human factor relationships
• All papers had been published in peer-reviewed journals or
conference proceedings, or were reports from relevant
organisations such as EUROCONTROL and ICAO. The quality of the
studies was therefore independently evaluated by subject experts.
• Following Rasmussen and Jeppesen's (2006) methodology each
article provided a definition of each included factor which was in
line with the pre-established working definitions (chapter 2). This
ensured that the included studies had investigated the relationship
between each factor and did not simply mention them.
• Papers were only included in the review if the relationship between
at least two of the nine factors were considered.
The abstract of each paper was read prior to inclusion to ensure that the
article adhered to the selection criteria and was relevant to the study. The
selected papers were not restricted to a specific domain. Although papers
relating to factors within the aviation domain were actively sought, papers
that examined the relationship between at least two of the identified
factors from any domain were included In analysis. Due to the relative lack
of research Investigating human factor relationships within the ATe domain,
this decision was necessary in order to provide a comprehensive and
informed review of research on multifactor relationships.
The papers selected for review were also not restricted by date of
publication, measure or method differences. This decision was made so
that a larger number of relevant papers that Investigated the relationship
between specific human factors could be included in the review, generating
a wide review of this research area.
Papers were identified from a key-word based search of electronic
databases (Ergonomics Abstracts, PsychINFO, Science Direct, Scopus and
Web of Science) and a search engine (Google Scholar). The procedure
followed is similar to the search procedure methods used In other
literature-based analyses, such as Hetherington, Flin and Mearns (2006)
and Rasmussen and Jeppesen (2006). Only papers which Investigated the
relationship between at least two of the identified factors were required for
analysis, and so papers were searched for using combined search terms,
Including systematically pairing the name of two of the nine factors and the
possible alternatives (e.g. concentration, distracted overlooked,
phraseology, tiredness, mental fatigue, overload, underload, cognitive load,
104
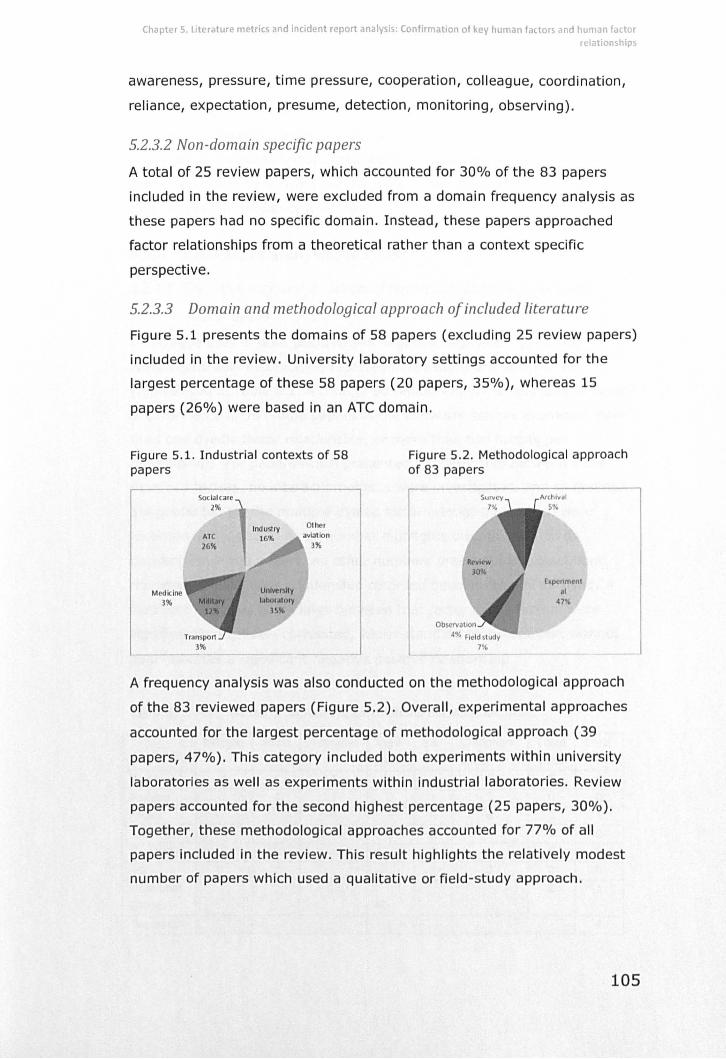
Chapter 5. Literature metrics and incident report analysis: Confirmation of key human fattors and human factor relationships
awareness, pressure, time pressure, cooperation, colleague, coordination,
reliance, expectation, presume, detection, monitoring, observing).
5.2.3.2 Non-domain specific papers
A total of 25 review papers, which accounted for 30% of the 83 papers
included in the review, were excluded from a domain frequency analysis as
these papers had no specific domain. Instead, these papers approached
factor relationships from a theoretical rather than a context specific
perspective.
5.2.3.3 Domain and methodological approach o/included literature
Figure 5.1 presents the domains of 58 papers (excluding 25 review papers)
included in the review. University laboratory settings accounted for the
largest percentage of these 58 papers (20 papers, 35%), whereas 15
papers (26%) were based in an ATe domain.
Figure 5.1. Industrial contexts of 58 papers
Medicine 3%
SodalcClfe 2%
ATe
26%
Other avi;ltion
3%
Figure 5.2. Methodological approach of 83 papers
rxp ,Iment al
47"
A frequency ana lysis was also conducted on the methodological approach
of the 83 reviewed papers (Figure 5.2). Overall, experimental approaches
accounted for the largest percentage of methodological approach (39
papers, 47%). This category included both experiments within university
laboratories as well as experiments within industrial laboratories. Review
papers accounted for the second highest percentage (25 papers, 30%).
Together, these methodological approaches accounted for 77% of all
papers included in the review. This result highlights the relatively modest
number of papers which used a qualitative or field-study approach .
105
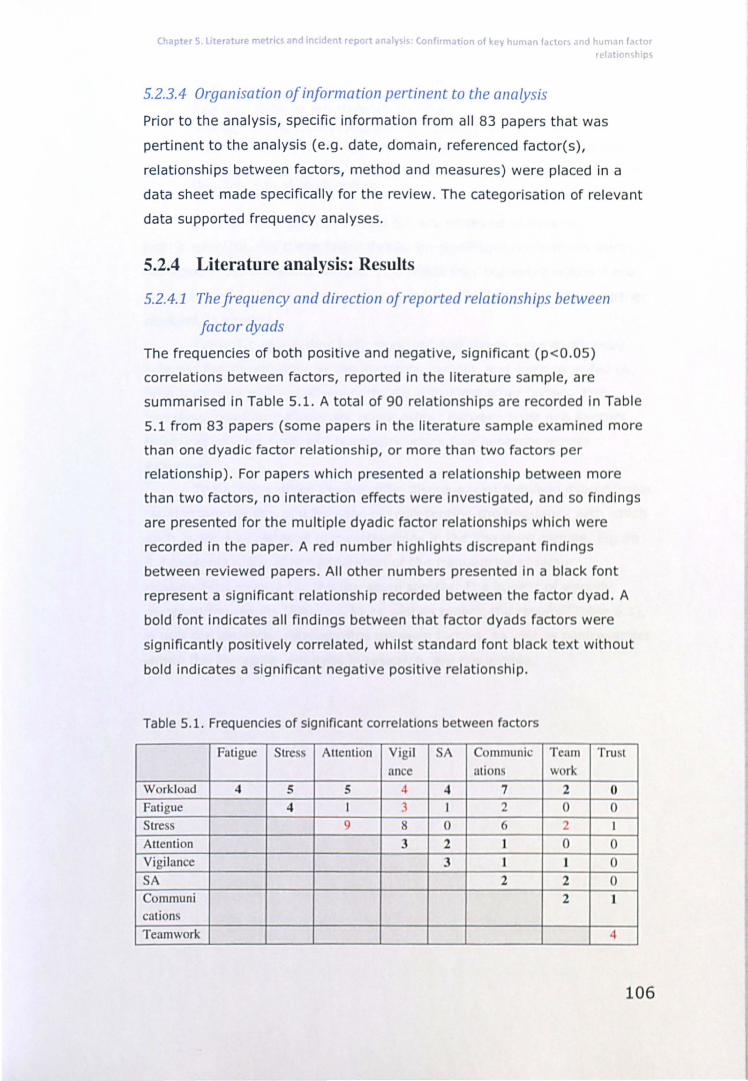
Chapter ... Literature metrlcs and inc dent report ana ys 5 Conflrmat on of key human factor\ • I'd ,"umal" factor relatlOn~hlps
5.2.3.4 Organisation olin/ormation pertinent to the analysis
Prior to the analysis, specific information from all 83 papers that was
pertinent to the analysis (e.g. date, domain, referenced factor(s),
relationships between factors, method and measures) were placed in a
data sheet made specifically for the revi ew. The categorisation of relevant
data supported frequency analyses.
5.2.4 Literature analysis: Re ults
5.2.4.1 The frequency and direction o/reported relationships between
factor dyads
The frequencies of both positive and negative, signifi cant (p <0.05)
correlations between factors, reported In the literature sample, are
summarised in Table 5.1. A total of 90 relat ionships are recorded In Table
5.1 from 83 papers (some papers In the literature sample examined more
than one dyadic factor relationship, or more th an two factors per
relationship) . For papers which presented a relationship between more
than two factors, no interaction effects were Invest igated, and so findings
are presented for the multiple dyadic factor relat ionships which were
recorded in the paper. A red number highlights discrepant find ings
between reviewed papers. All other numbers presented In a black font
represent a significant relationship recorded between the factor dyad. A
bold font indicates all findings between that factor dyads factors were
significantly positively correlated, whil st standard font black t xt without
bold indicates a significant negat ive posi t ive relat ionship.
Table 5. 1. Frequencies of significant correlations between factors
Fatigue SIre s Allenli n Vigi l SA Communic T,um TruM
an ulions ~ r Workload 4 5 5 4 4 7 2 0 Fatigue 4 I 3 I 2 0 0 Stress 9 8 0 6 2 I
Attention 3 2 J 0 0 Vigi lance 3 I I 0 SA 2 2 0 Communi 2 1 calions Teamwork 4
106
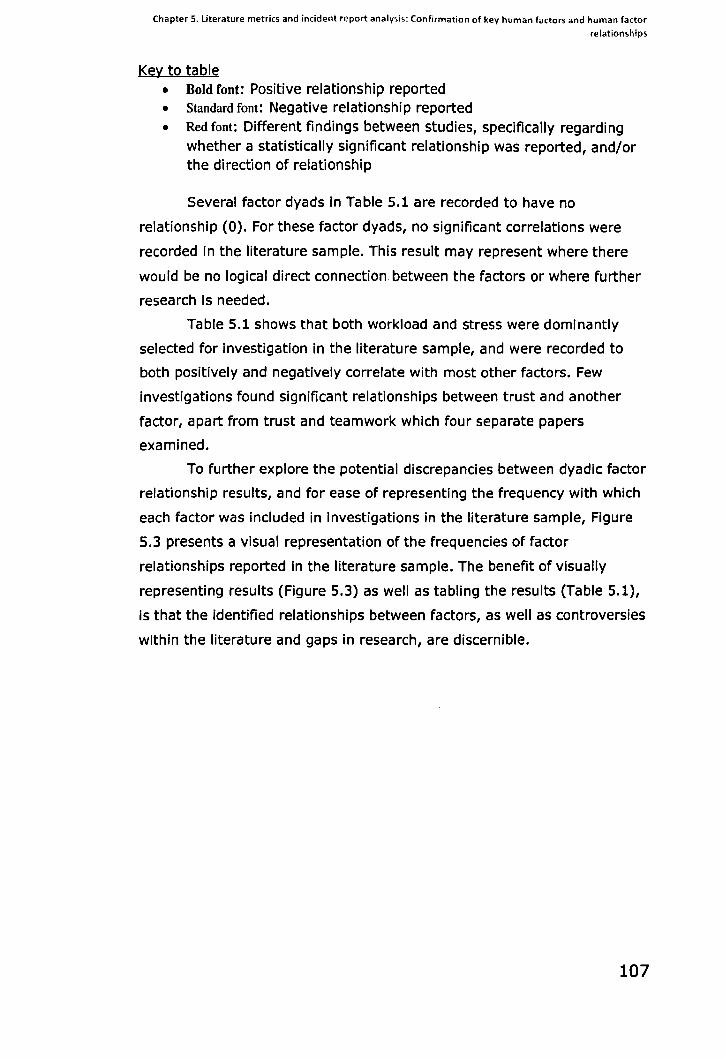
Chapter 5. literature metrics and incident report analysis: Confirmation of key human factors and human factor
relationships
Key to table • Bold font: Positive relationship reported • Standard font: Negative relationship reported • Red font: Different findings between studies, specifically regarding
whether a statistically significant relationship was reported, and/or the direction of relationship
Several factor dyads in Table 5.1 are recorded to have no
relationship (0). For these factor dyads, no significant correlations were
recorded in the literature sample. This result may represent where there
would be no logical direct connection between the factors or where further
research is needed.
Table 5.1 shows that both workload and stress were dominantly
selected for investigation in the literature sample, and were recorded to
both positively and negatively correlate with most other factors. Few
investigations found significant relationships between trust and another
factor, apart from trust and teamwork which four separate papers
examined.
To further explore the potential discrepancies between dyadic factor
relationship results, and for ease of representing the frequency with which
each factor was included in Investigations in the literature sample, Figure
5.3 presents a visual representation of the frequencies of factor
relationships reported in the literature sample. The benefit of visually
representing results (Figure 5.3) as well as tabling the results (Table 5.1),
is that the Identified relationships between factors, as well as controversies
within the literature and gaps In research, are discernible.
107
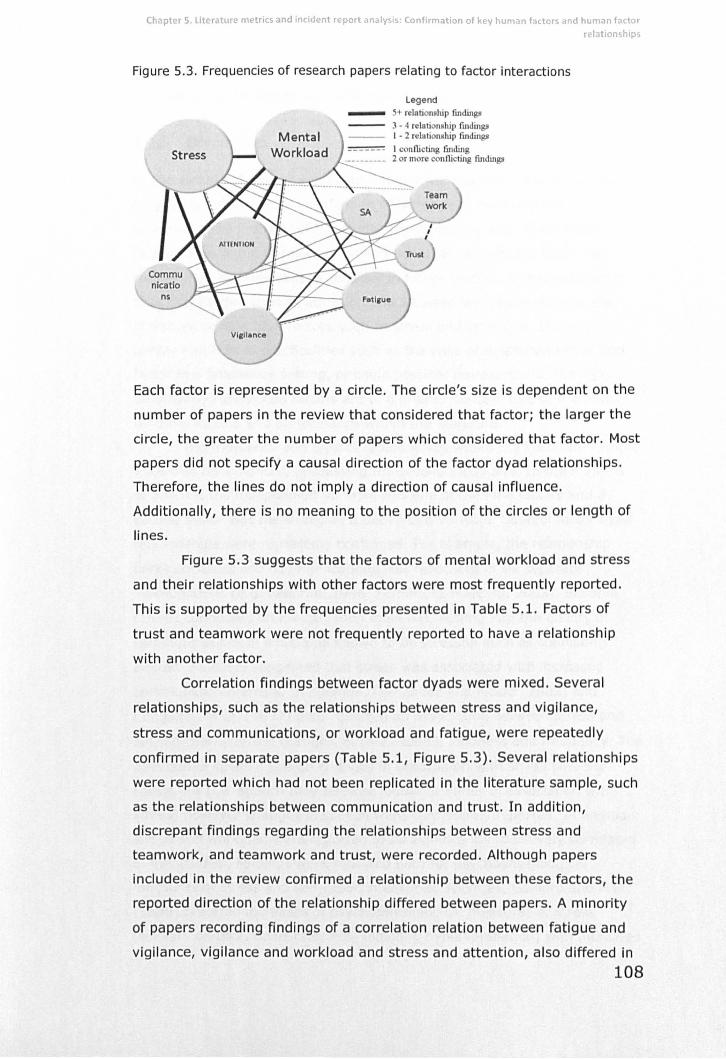
Chapter 5 literature metrics and incident report analysis Confirmation of key human factors and human factor
relationships
Figure 5.3. Frequencies of research papers relating to factor interactions
Legend _ 5+ relation.hip fmdings
-- 3 - 4 relationship fUldings __ I - 2 relation. hip findings
= I conflicting fUlmng ._________ 2 or more conflicting findings
Each factor is represented by a circle. The circle's size is dependent on the
number of papers in the review that considered that factor; the larger the
circle, the greater the number of papers which considered that factor. Most
papers did not specify a causal direction of the factor dyad relationships.
Therefore, the lines do not imply a direction of causa l influence.
Additionally, there is no meaning to the position of the circles or length of
lines.
Figure 5.3 suggests that the factors of mental workload and stress
and their relationships with other factors were most frequent ly reported.
This is supported by the frequencies presented in Table 5.1. Factors of
trust and teamwork were not frequently reported to have a relationship
with another factor.
Correlation findings between factor dyads were mixed. Severa l
relationships, such as the relationships between stress and vigilance,
stress and communications, or workload and fatigue, were repeatedly
confirmed in separate papers (Table 5.1, Figure 5.3). Several relationships
were reported which had not been replicated in the literature sample, such
as the relationships between communication and trust. In addition,
discrepant findings regarding the relationships between stress and
teamwork, and teamwork and trust, were recorded. Although papers
included in the review confirmed a relationship between these factors, the
reported direction of the relationship differed between papers. A minority
of papers recording findings of a correlation relation between fatigue and
vigilance, vigilance and workload and stress and attention, also differed in
108
Chapter 5. literature metrics and incident report analysis: Confirmation of key human factors and human factor relationships
the direction of the relationship that was reported, but with most papers
replicating the finding of a specific relationship direction.
5.2.5 Discussion
In the sample of papers examined, mental workload and stress were most
frequently selected for investigation of factor dyad relationships,
addressing the first aim of the study. The frequency with which these
factors were found to relate to an additional factor suggests that these
factors may be important to consider in future studies. It is Interesting to
note that factors such as attention and SA were less represented in the
literature sample than factors such as stress and workload. This may
simply result from practicalities such as the ease of measurement of each
factor in a laboratory setting, or could possibly represent that the more
dominantly researched factors are of a greater concern due to the effects
on other factors and performance within the literature.
The frequency and type of relationships within the literature sample
were also documented, addressing the second study aim. In the majority
of articles, the independent variable was one of the nine factors and a
second factor was measured as a dependant variable. Several factor dyad
relationships were repeatedly confirmed. For example, the relationship
between stress and communications was replicated In six separate
investigations (e.g. Bellorinl, 1996; Fernandez & Picard, 2003). Bellorlnl
(1996) conducted an investigation in an ATe setting into the quality of
communications in situations known to be stressful such as conflicting
aircraft. Findings suggested that stress was associated with increased
communication errors. In addition, Fernandez and Picard (2003) and
Congleton et al. (1997) both reported an association between stress and
speech characteristic changes, such as speed, loudness and frequency. The
direction of specific speech changes In association with stress was not
consistent (Le. speech may become louder or softer in association with
stress) however changes in speech were consistently reported. In addition,
stress and workload were reported to be significantly, positively correlated
in five studies. Findings were reported both for psychophysiological
measures of stress and self-report measures. Wientjes, Gaillard and Maat
(1996) reported Increases I n psychophysiological measures of stress
(salivary cortisol, heart rate, PC02 indicting hyperventilation) with Increases
109
Chapter 5. Literature metrics and incident report analysis: Confirmation of key human factors and human factor
relationships
in ATC taskload, measured by number of aircraft under control, and self
reported workload (Zeier et aI., 1996). In addition, Bellorini (1996)
reported increases in self-report stress with increases In ATC taskload,
measured by number of aircraft under control and traffic complexity. These
results suggest a robust relationship between workload and stress for both
psychophysiological and self-report measures. Workload and
communications, stress and vigilance were also replicated in 5 or more
papers, indicating particularly robust relationships between these factor
pairs.
However, controversies were evident regarding the co-variation of
factor relationships. A particular example is the discrepant findings of the
relationship between fatigue and vigilance. Matthews (2002) Investigated
the effects of fatigue on vigilance-related performance in a simulated
driving task. Results showed that non-fatigued participants responded to
more target stimuli than fatigued participants. Matthews (2002) inferred
that fatigue negatively Impacted vigilance resulting in a negative
relationship. However, Galinsky, Rosa, Warm and Dember (1993)
researched the association between vigilance and fatigue. Participants
were asked to provide subjective ratings of fatigue pre- and post- vigilance
task. Fatigue ratings rose after vigilance task completion, suggesting a
possible positive relationship between high vigilance and fatigue. Both
papers found a relationship between fatigue and vigilance. However the
direction of the relationship depended on the selected independent variable
and methodological design. Therefore, discrepant results in the literature
regarding the direction of factor dyad relationships may be primarily due to
differences In study aims and resulting methodological design.
Every paper that was identified during the comprehensive literature
search as meeting the selection criteria (83 in total) was included in this
analysis. There is a relative lack of research investigating the relationships
between multiple factors. Even less research in the literature sample
considered the association between multifactor combinations and
performance. Reasons for the lack of research may be surmised. It may
reflect the preference in research to focus on exploring one factor at a time.
However, an additional reason may be that It was necessary to first
develop a comprehensive understanding of single factors and associations
with performance, prior to extending research to multifactor relationships
and associations with performance.
110
Chapter S. literature metrics and incident report analysis: Confirmation of key human factors and human factor relationships
5.2.6 Conclusions and next steps
A general finding resulting from this study is that each of the nine factors
selected have been shown to relate to other factors, providing support for
further investigation of these factors. In addition, the factors of workload
and stress are dominantly selected for investigation in the literature
sample reviewed, suggesting that these may be of particular Importance in
future studies examining multifactor relationships. Factor dyads have been
shown to be associated, sometimes with bi-directional relationships. The
extent to which the relationship is replicated in the literature sample is
dependent on the particular dyad. Further research was necessary to
confirm that these factors are associated with controller performance in an
ATC environment. An association between each factor and performance is
suggested from the literature review (Chapter 2), although additional ATC
specific data will be relevant to extend previous findings.
Methodologies that were appropriate to Investigating factor
associations with performance In an ATC setting were reviewed. It was
identified that an analysis of aviation incident reports, that were specific to
ATCC performance-related incidents, will generate ATC-specific data and
support and extend findings from the literature review. This form of
retrospective study "allows for the Identification of factors more likely to
precipitate air traffic control errors" (Rodgers, Mogford & Strauch, 2000,
p94). Implicit In this is the assumption that errors are representative of a
performance decline. The analysis permits the investigation of the
frequency of single factor associations with performance decline in addition
to multiple co-occurring factor associations with performance decline,
extending the results of the literature analysis. A comparison of results
between the literature analysis and findings from an ATC environment will
inform the next research steps that are required to achieve the second
thesis aim of selecting a sub-set of human factors that influence controller
performance. These conclusions therefore led to a study of incident reports.
111
Chapter 5. literature metrics and incident report analysis: Confirmation of key human factors and human factor
relationships
5.3 Aviation incident reports analysis
5.3.1 Incident report analysis: Background
Incident and accident reports are often used as valuable sources of
information. When an incident or accident occurs, a full investigation
process is carried out. Retrospective analyses are applied to understand
the causes and contributory factors. A report is created documenting
findings. Reports are utilised to prevent similar future occurrences.
Incident and accident reports also provide valuable field-specific
information for contributing to related research.
Within the aviation domain, the collective term of 'safety
occurrence' is used to refer to both accidents and incidents. However, each
type of safety occurrence has an Independent, specific meaning. AcCidents
refer to an event with 'physical consequences', such as an occurrence in
which a person is fatally or seriously injured as a direct result of being in
an aircraft, an aircraft sustains damage or structural failure, or the aircraft
is missing or completely inaccessible (ICAO, Annex 13, 2001). An Incident
is defined as a situation In which "aircraft have violated prescribed
separation minima and approached in close proximity" (Rodgers & Mogford,
2000, p77). Legal separation minima requirements exist, as specified by
ICAO document 444 (2007). On the vertical dimension, aircraft must be
separated by a minimum of 1000 feet at an altitude under 29000 feet, or
by 2000 feet when flying at an a altitude of over 29000 feet. Horizontally,
aircraft are required to be separated by a minimum of 3 or 5 nautical miles,
depending on the location of the aircraft in relation to the radar antenna. If
separation minima are breached, it is deemed an inCident. All incidents are
followed by an incident investigation and subsequently, an incident report.
An incident report is therefore a product of an investigation into an
aviation-related incident.
As part of the investigation, all incidents receive a severity
classification. For example, the ICAO airprox classification system
categorises incidents from A (risk of collision) to C (no risk of colliSion).
EUROCONTROL have also developed a severity classification scheme
resulting of a mapping of EUROCONTROL Severity Classification Scheme
and ICAO AIRPROX Severity Scheme (EUROCONTROL, 2002), developed
for harmonising occurrence reporting (EUROCONTROL, 2002). An incident
analysiS scheme is applied to assist in identifying the factors that
112
Chapter 5. Literature metrics and incident report analysis: Confirmation of key human factors and human factor
relationships
contributed to the incident, and a full textual report, with
recommendations, is completed. Therefore, a lot of detailed information
can be gained regarding the incident occurrence, and the factors
contributing to the incident, from an incident report.
Fortunately, accidents are rare, and as such, more can be learned
from an analysis of the relatively more frequent incidents. An advantage of
conducting an analysis of incident reports is that it enables a quantitative
analysis of a large body of data, which may identify the factors which most
frequently contribute to performance-related incidents In ATC.
5.3.2 Incident report analysis: Boundaries of focus
The incident report analysis was conducted to contribute to the first and
second overall research aims. First, an assumption was made that an
incident related to a decline in ATCO performance. The very occurrence of
a performance-related incident suggests that safety was compromised, and
therefore, performance did decline. Therefore, any factors highlighted as
contributing to an incident were assumed to also viably contribute to a
decline in performance.
5.3.3 Incident report analysis: Aims
The aims of the incident report analysis were three fold. One aim was to
confirm if the factors identified in the literature review were present in an
ATC environment. An additional aim of the study was to further previous
findings by establishing the frequency with which each factor contributed
to incidents. This was important in understanding which factors may
negatively influence controller performance, for factor selection for use in
later studies. The final aim was to determine if multifactor occurrences are
reported in an ATC environment. It was necessary to determine if factors
do co-occur in an ATC environment prior to any further investigation of this
event.
5.3.4 Incident report analysis: Description of database and task
Incident reports were accessed from EUROCONTROL's SAFLearn database.
The SAFlearn database contained a total of 420 incident reports submitted
to EUROCONTROL by European air navigation service providers (ANSPs)
113
---------- ------
Chapter Sliter t " "" " nd human factor . a ure metnc5 and tnc,dent report analysis: Confirmation of key human factors a . h" relatIons IPS
between 2003-2005. Reports were hand-typed into the database
individually. All incident reports were de-identified prior to entry into the
database. HEIDI (European Incident Definition Initiative for ATM)
(EUROCONTROL, 2001) factors were added to each report which served as
a standardised taxonomy for identification of causal and contributory
factors. A reclassification of some reports to the HEIDI taxonomy, based
on the identified factors, therefore took place prior to being entered into
the database. Each report contained:
1) Unique report identifier
2) Error classification
3) ICAO severity category
4) Incident overview
5) Full textual description of Incident and resulting recommendations
6) Classification of factors and errors identified as part of the incident
An example of one de-identified SAFLearn report is presented in Appendix
1 and the information categories listed above (1-6) are highlighted.
5.3.5 Incident report analysis: Method
Strict inclusion criteria determined whether incident reports were Included
for analysis. As the aim of the study focused on the factors that influenced
controller performance, only those incidents which were caused or
contributed to by air traffic controllers were included. Consequently,
incident reports in which the ATCO had no responsibility, control or
contribution, for example pilot error, technical/maintenance error and
unavoidable weather conditions, were excluded from analysis.
Incidents involving trainees were also excluded from analysis. If the
supervising on the job training instructor (OJTI) had explicitly committed
an error, the incident report was included for analysis based on the error of
the OJT!. Incidents resulting from trainee error in which the OJTI acted
appropriately were omitted from analysis. The rationale for this decision
was to control for the potential confound of expert/novice differences (I.e.
Malakis, Kontogiannis & Kirwan, 2010a), which may have Influenced the
factors documented in the incident.
Incidents occurred in a range of airspaces and a range of different
flight control phases (Tower, Approach, En-route). Although this
investigation is concerned primarily with en-route controllers, at this stage
114
Chapter 5. literature metrics and incident report analysis: Confirmation of key human factors and human factor
relationships
in the investigation it was important to gain larger amounts of data on
general trends of factor associations with performance decline and error in
all air traffic environments. Therefore, in order to gain a larger sample of
data, all control phases were analysed.
Incidents also ranged in severity, from EUROCONTROL's severity
categorisation of 'A - serious incident' to 'E- no safety effect' (respectively
mapped to the ICAO categorisation of 'risk of collision' to 'no risk of
collision') to generate more data.
Based on the above criteria, 272 out of a total of 420 reports
incident reports were included for analysis.
5.3.5.1 Data collection
Identification of relevant incident reports began with specific word searches
for incident reports within the database. This procedure allowed an efficient
selection of only those incident reports that were relevant to the aims of
the study. Therefore, a list of search terms was compiled for each of the
nine factors previously identified as important influences on human
performance (attention, communications, fatigue, mental workload, SA,
stress, teamwork, trust, vigilance).
Search terms (Appendix 2) were compiled by noting separate
definitions or synonyms surrounding each factor in the literature and
gathering synonyms from an Oxford English Thesaurus. Search terms were
also taken from HEIDI (2001) explanatory factor classification categories.
Each term was typed into a text field and lists of relevant reports were
generated. It was assumed that the reports which had not been returned
during the search did not relate to any of the considered factors. However,
consideration was given to Johnson's (2002) argument that frequent
coding issues have been reported with classified InCidents, namely that
coding schemes may be non-standardised or dependent on contextual
knowledge. Therefore, for completeness, the reports not generated from
the search terms were also examined. Therefore, ultimately, all Incident
reports were included for review.
A total of 272 incident reports met the selection criteria, and the
following information from each report was captured in a spreadsheet:
1. Report identifier
2. EUROCONTROljlCAO Risk category
3. OJTI or standard controlling
115

Chapter 5. literature metrics and incident report analysis: Confirmation of key human fattors and human factor
relationships
4. Workload level (if reported)
5. Complexity level (if reported)
6. Classification of error (main cause of the incident)
7. Other notable factors (from textual incident description).
Information relating to factor contribution to the incident was also captured
from each report:
1. Classification of each factor identified In the Incident
2. Presence or absence of each of the previously-identified factors in
each incident
3. Reported type of contribution to the incident: Within the HEIDI
(2001) classification system, each factors' contribution to the
incident is separated Into four categories - Main cause, Causal,
Contributory and Possible factor. These groupings represent the
position of the classified factor, as reported by the incident
investigator. In summary, the categories can be described as
follows:
• Main Cause: An event or item that was judged to be the actual
cause of the accident or incident. Without this event, it is
considered that the occurrence would not have happened.
• Causal: An event or item that was judged to be in the causal chain
of events leading to an accident or incident.
• Contributory: The event potentially Increased the level of risk or
played a role In the emergence of the occurrence.
• Possible Factor: An event or item that may have contributed to the
causal chain or increased risk in the occurrence.
This resulted in a comprehensive data sheet which captured relevant and
critical information from each incident report.
5.3.5.2 Preparation of data for analysis
Prior to analysis, the lower-level classification terms specific to HEIDI
(2001) were mapped to the higher-level factor (Appendix 3). HEIDI (2001)
classification taxonomy uses different levels of to characterise the incident,
from high-level event types (for example, 'near collision, air-air'), to more
detailed explanatory factors (for example, fatigue) and finally descriptive
factors (for example, 'sleep loss'). This means that separate classifications
116
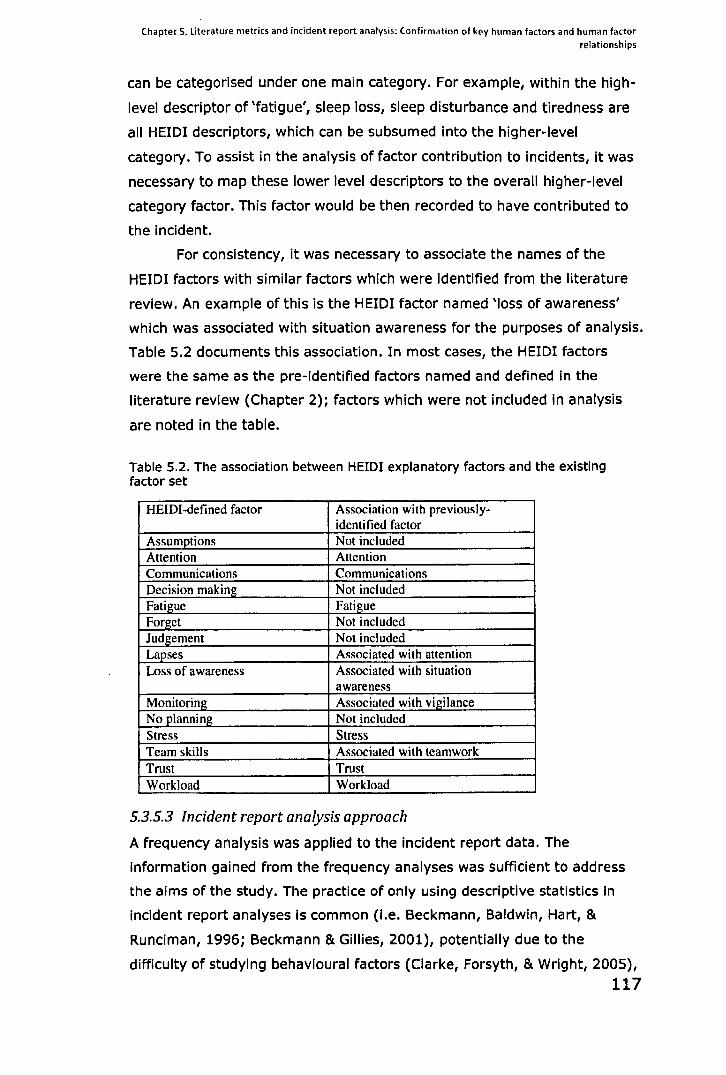
Chapter 5. Literature metrics and incident report analysis: Confirmation of key human factors and human factor relationships
can be categorised under one main category. For example, within the high
level descriptor of 'fatigue', sleep loss, sleep disturbance and tiredness are
all HEIDI descriptors, which can be subsumed into the higher-level
category. To assist in the analysis of factor contribution to incidents, it was
necessary to map these lower level descriptors to the overall higher-level
category factor. This factor would be then recorded to have contributed to
the incident.
For consistency, it was necessary to associate the names of the
HEIDI factors with similar factors which were Identified from the literature
review. An example of this is the HEIDI factor named 'loss of awareness'
which was associated with situation awareness for the purposes of analysis.
Table 5.2 documents this association. In most cases, the HEIDI factors
were the same as the pre-identified factors named and defined In the
literature review (Chapter 2); factors which were not included In analysis
are noted in the table.
Table 5.2. The association between HEIDI explanatory factors and the existing factor set
HEIDI-defined factor Association with previously-identified factor
Assumptions Not included Attention Attention Communications Communications Decision making Not included Fatigue Fatigue Forget Not included Judgement Not included Lapses Associated with attention Loss of awareness Associated with situation
awareness Monitoring Associated with vigilance No planning Not included Stress Stress Team skills Associated with teamwork Trust Trust Workload Workload
5.3.5.3 Incident report analysis approach
A frequency analysis was applied to the incident report data. The
information gained from the frequency analyses was sufficient to address
the aims of the study. The practice of only using descriptive statistics In
incident report analyses Is common (I.e. Beckmann, Baldwin, Hart, &
Runciman, 1996; Beckmann & Gillies, 2001), potentially due to the
difficulty of studying behavioural factors (Clarke, Forsyth, & Wright, 2005),
117
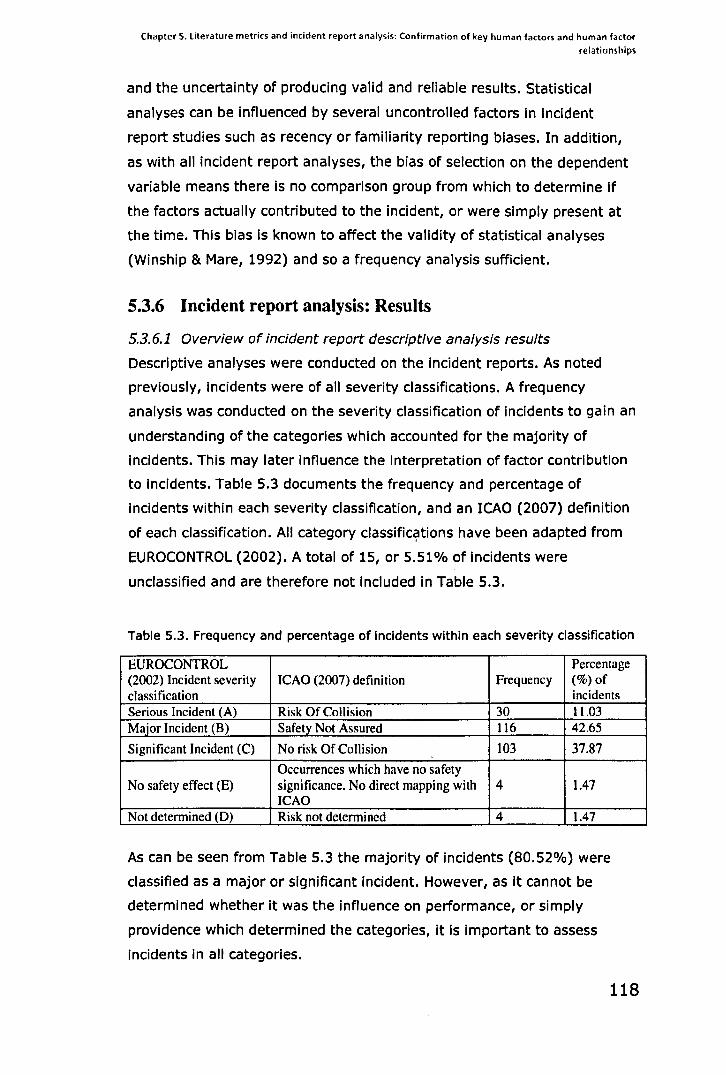
Chapter 5. literature metrics and incident report analysis: Confirmation of key human factors and human factor
relationships
and the uncertainty of producing valid and reliable results. Statistical
analyses can be influenced by several uncontrolled factors in incident
report studies such as recency or familiarity reporting biases. In addition,
as with all incident report analyses, the bias of selection on the dependent
variable means there is no comparison group from which to determine if
the factors actually contributed to the incident, or were simply present at
the time. This bias is known to affect the validity of statistical analyses
(Winship & Mare, 1992) and so a frequency analysis sufficient.
5.3.6 Incident report analysis: Results
5.3.6.1 Overview of incident report descriptive analysis results
Descriptive analyses were conducted on the Incident reports. As noted
previously, incidents were of all severity classifications. A frequency
analysis was conducted on the severity classification of incidents to gain an
understanding of the categories which accounted for the majority of
incidents. This may later influence the Interpretation of factor contribution
to incidents. Table 5.3 documents the frequency and percentage of
incidents within each severity claSSification, and an ICAO (2007) definition
of each classification. All category classific~tions have been adapted from
EUROCONTROL (2002). A total of 15, or 5.51 % of incidents were
unclassified and are therefore not included in Table 5.3.
Table 5.3. Frequency and percentage of Incidents within each severity classification
EUROCONTROL Percentage (2002) Incident severity ICAO (2007) definition Frequency (%) of classification incidents Serious Incident (A) Risk Of Collision 30 11.03 Major Incident (8) Safety Not Assured 116 42.65
Significant Incident (C) No risk Of Collision 103 37.87
Occurrences which have no safety No safety effect (E) significance. No direct mapping with 4 1.47
ICAO Not determined (D) Risk not determined 4 1.47
As can be seen from Table 5.3 the majority of incidents (80.52%) were
classified as a major or significant incident. However, as it cannot be
determined whether it was the influence on performance, or simply
providence which determined the categories, it is Important to assess
Incidents in all categories.
118
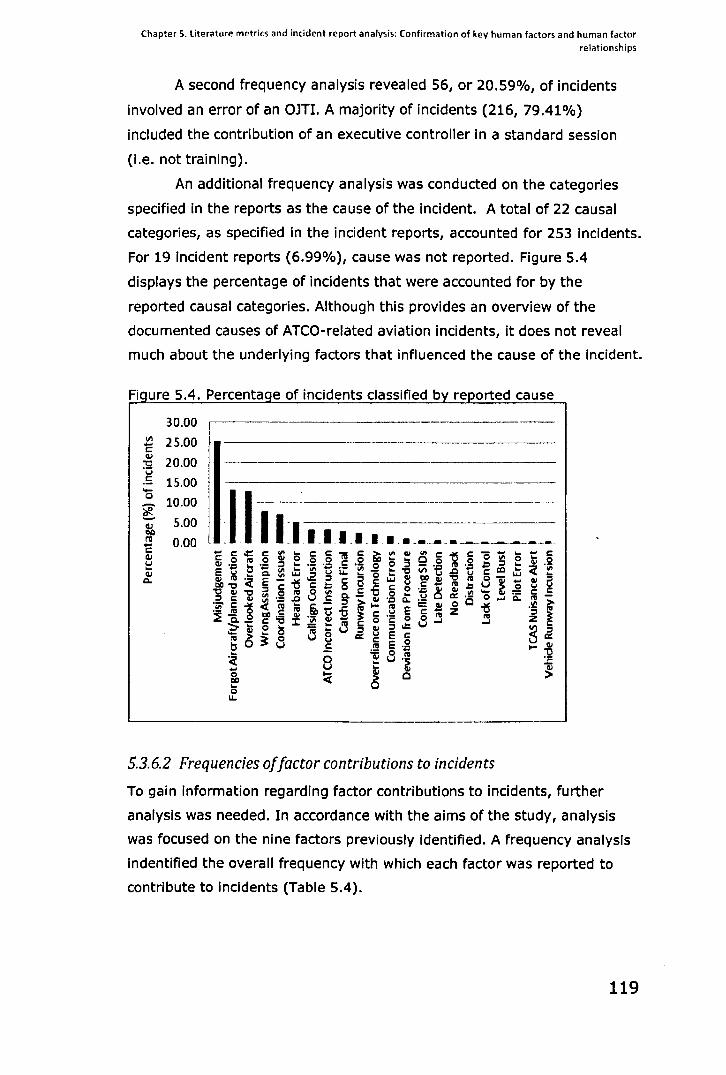
Chapter 5. Literature metrics and incident report analysis: Confirmation of key human factors and human factor
relationships
A second frequency analysis revealed 56, or 20.59%, of incidents
involved an error of an OJTI. A majority of incidents (216, 79.41%)
included the contribution of an executive controller in a standard session
(i.e. not training).
An additional frequency analysiS was conducted on the categories
specified in the reports as the cause of the incident. A total of 22 causal
categories, as specified in the incident reports, accounted for 253 incidents.
For 19 incident reports (6.99%), cause was not reported. Figure 5.4
displays the percentage of incidents that were accounted for by the
reported causal categories. Although this provides an overview of the
documented causes of ATeO-related aviation incidents, It does not reveal
much about the underlying factors that influenced the cause of the incident.
Figure 5.4. Percentage of incidents claSSified by reported cause
30.00 CI\ 25.00 .... c: cu
20.00 "0 .i:j
£ 15.00 -0 10.00
~ ~
5.00 ra 0.00 1: cu 1.1 ... cu
Q..
5.3.6.2 Frequencies offactor contributions to incidents
To gain information regarding factor contributions to Incidents, further
analysis was needed. In accordance with the aims of the study, analysis
was focused on the nine factors previously Identified. A frequency analysis
indentified the overall frequency with which each factor was reported to
contribute to incidents (Table 5.4).
119
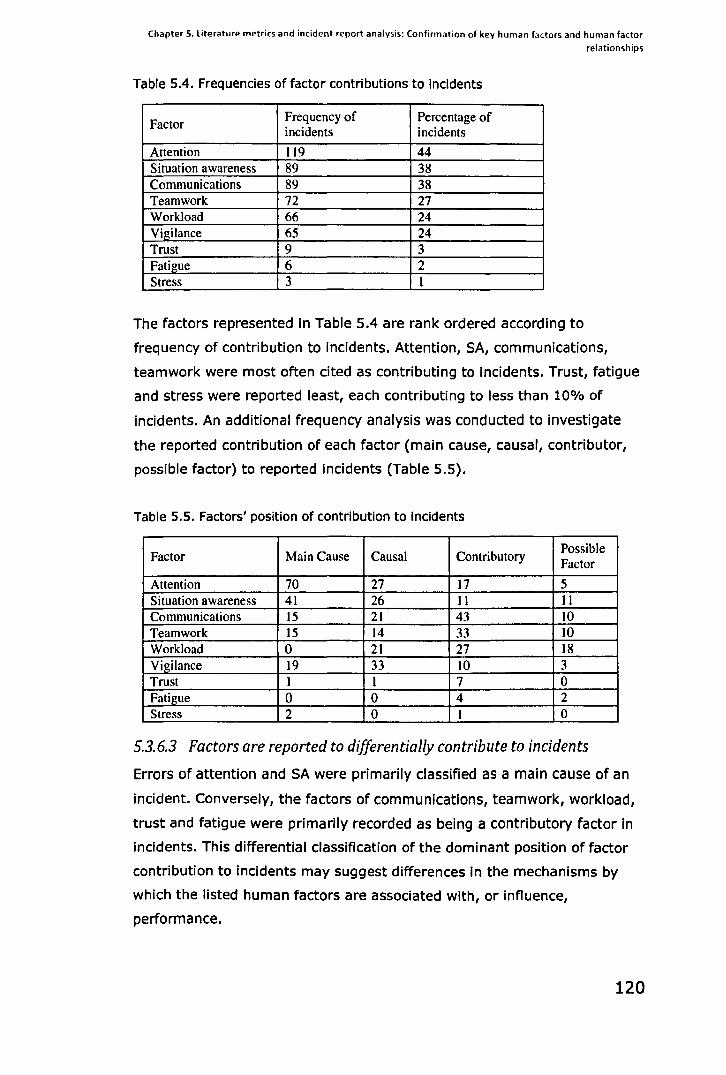
Chapter S. literature metrics and incident report analysis: Confirmation of key human factors and human factor
relationships
Table 5.4. Frequencies of factor contributions to incidents
Factor Frequency of Percentage of incidents incidents
Attention 119 44 Situation awareness 89 38 Communications 89 38 Teamwork 72 27 Workload 66 24 Vigilance 65 24 Trust 9 3 Fatigue 6 2 Stress 3 I
The factors represented in Table 5.4 are rank ordered according to
frequency of contribution to incidents. Attention, SA, communications,
teamwork were most often cited as contributing to Incidents. Trust, fatigue
and stress were reported least, each contributing to less than 10% of
incidents. An additional frequency analysis was conducted to investigate
the reported contribution of each factor (main cause, causal, contributor,
possible factor) to reported incidents (Table 5.5).
Table 5.5. Factors' position of contribution to incidents
Factor Main Cause Causal Contributory Possible Factor
Attention 70 27 17 5 Situation awareness 41 26 II II Communications IS 21 43 10 Teamwork IS 14 33 10 Workload 0 21 27 18 Vigilance 19 33 10 3 Trust I I 7 0 Fatigue 0 0 4 2 Stress 2 0 I 0
5.3.6.3 Factors are reported to differentially contribute to incidents
Errors of attention and SA were primarily classified as a main cause of an
Incident. Conversely, the factors of communications, teamwork, workload,
trust and fatigue were primarily recorded as being a contributory factor in
incidents. This differential classification of the dominant position of factor
contribution to incidents may suggest differences in the mechanisms by
which the listed human factors are associated with, or Influence,
performance.
120
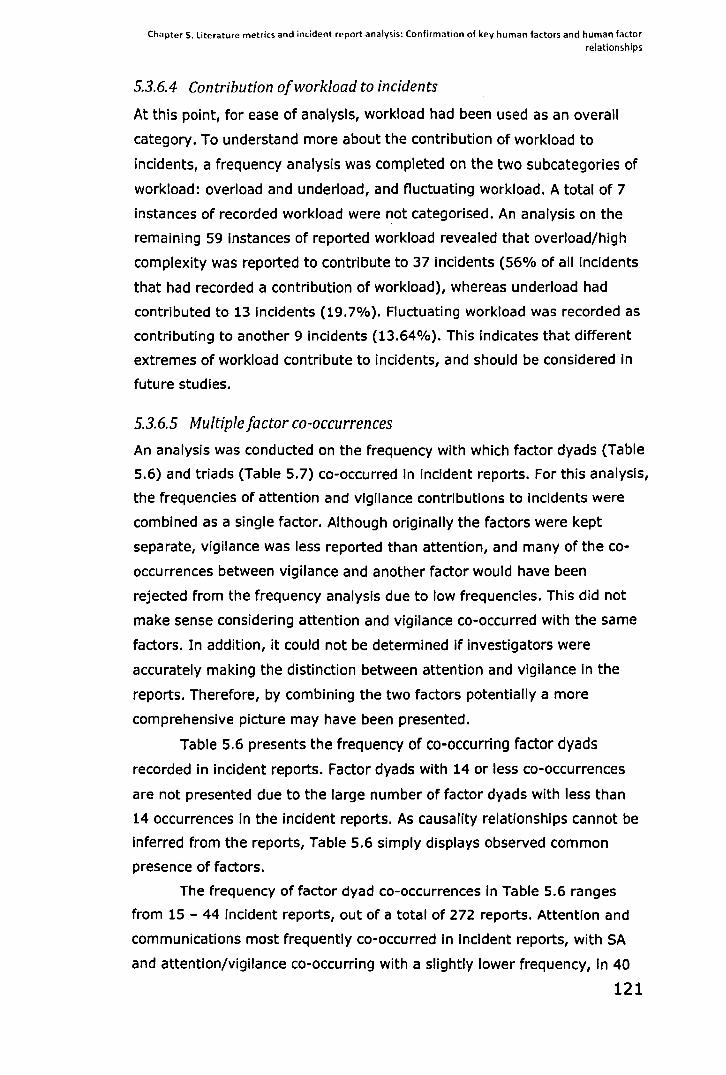
Chapter S. literature metrics and incident report analy,is: Confirmation of key human factors and human factor relationships
5.3.6.4 Contribution of workload to incidents
At this point, for ease of analysis, workload had been used as an overall
category. To understand more about the contribution of workload to
incidents, a frequency analysis was completed on the two subcategories of
workload: overload and underload, and fluctuating workload. A total of 7
instances of recorded workload were not categorised. An analysis on the
remaining 59 instances of reported workload revealed that overload/high
complexity was reported to contribute to 37 incidents (56% of all incidents
that had recorded a contribution of workload), whereas underload had
contributed to 13 incidents (19.7%). Fluctuating workload was recorded as
contributing to another 9 incidents (13.64%). This Indicates that different
extremes of workload contribute to incidents, and should be considered In
future studies.
5.3.6.5 Multiple factor co-occurrences
An analYSis was conducted on the frequency with which factor dyads (Table
5.6) and triads (Table 5.7) co-occurred In incident reports. For this analysis,
the frequencies of attention and vigilance contributions to incidents were
combined as a single factor. Although originally the factors were kept
separate, vigilance was less reported than attention, and many of the co
occurrences between vigilance and another factor would have been
rejected from the frequency analysis due to low frequencies. This did not
make sense considering attention and vigilance co-occurred with the same
factors. In addition, it could not be determined If investigators were
accurately making the distinction between attention and vigilance in the
reports. Therefore, by combining the two factors potentially a more
comprehensive picture may have been presented.
Table 5.6 presents the frequency of co-occurring factor dyads
recorded in incident reports. Factor dyads with 14 or less co-occurrences
are not presented due to the large number of factor dyads with less than
14 occurrences in the incident reports. As causality relationships cannot be
Inferred from the reports, Table 5.6 simply displays observed common
presence of factors.
The frequency of factor dyad co-occurrences in Table 5.6 ranges
from 15 - 44 incident reports, out of a total of 272 reports. Attention and
communications most frequently co-occurred in Incident reports, with SA
and attention/vigllance co-occurring with a slightly lower frequency, in 40
121
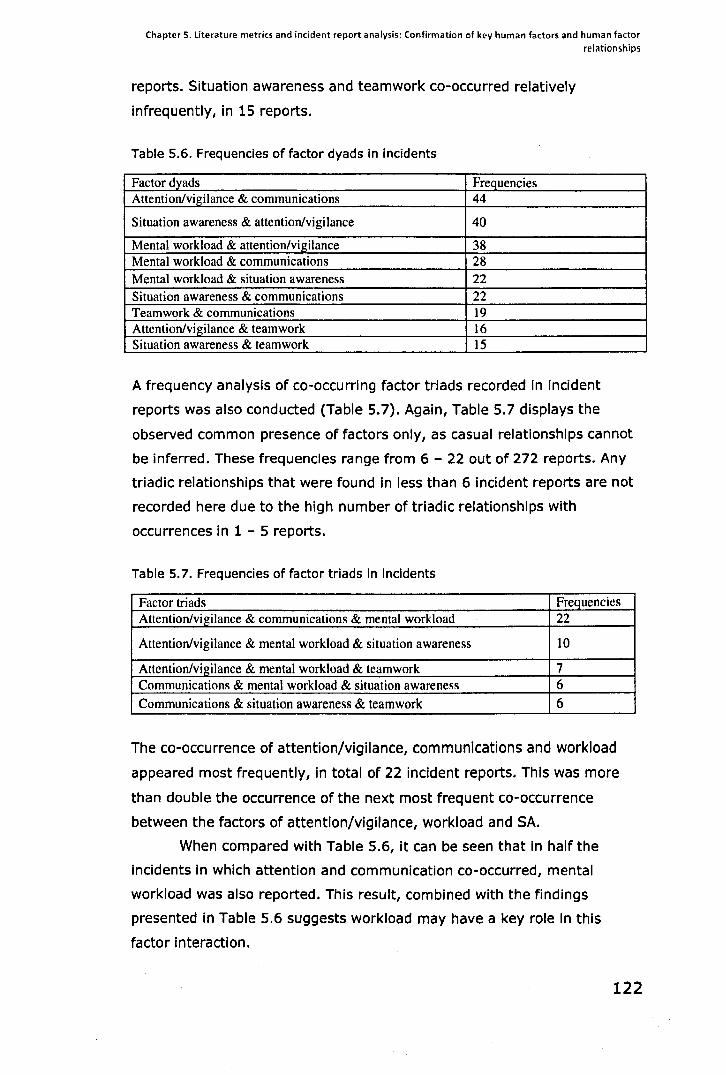
Chapter 5. Literature metrics and incident report analysis: Confirmation of key human factors and human factor relationships
reports. Situation awareness and teamwork co-occurred relatively
infrequently, in 15 reports.
Table 5.6. Frequencies of factor dyads in incidents
Factor dyads Frequencies Attention/vigilance & communications 44
Situation awareness & attention/vigilance 40
Mental workload & attention/vigilance 38 Mental workload & communications 28 Mental workload & situation awareness 22 Situation awareness & communications 22 Teamwork & communications 19 Attention/vigilance & teamwork 16 Situation awareness & teamwork 15
A frequency analysis of co-occurring factor triads recorded In incident
reports was also conducted (Table 5.7). Again, Table 5.7 displays the
observed common presence of factors only, as casual relationships cannot
be inferred. These frequencies range from 6 - 22 out of 272 reports. Any
triadic relationships that were found in less than 6 incident reports are not
recorded here due to the high number of triadic relationships with
occurrences in 1 - 5 reports.
Table 5.7. Frequencies of factor triads in incidents
Factor triads Frequencies Attention/vigilance & communications & mental workload 22
Attention/vigilance & mental workload & situation awareness 10
Attention/vigilance & mental workload & teamwork 7 Communications & mental workload & situation awareness 6 Communications & situation awareness & teamwork 6
The co-occurrence of attention/vigilance, communications and workload
appeared most frequently, in total of 22 incident reports. This was more
than double the occurrence of the next most frequent co-occurrence
between the factors of attention/vigilance, workload and SA.
When compared with Table 5.6, it can be seen that in half the
incidents in which attention and communication co-occurred, mental
workload was also reported. This result, combined with the findings
presented in Table 5.6 suggests workload may have a key role in this
factor interaction.
122
Chapter S. Literature metrics and incident report analysis: Confirmation of key human factors and human factor
relationships
Finally, it can be seen from Table 5.7 that workload is present in 4
out of 5 of the most frequent triadic factor co-occurrences, suggesting a
key role of workload in incidents, but potentially only when an additional
factor which also has a negative association with performance also occurs.
Attention/vigilance and communications were present in 3 out of the 5
most frequently occurring factor triads, also suggesting the important
effects of these factors.
5.3.7 Discussion
The distinction between performance decline and performance-related
incidents is an important one in the current research. A performance
decline suggests an ATCO's efficiency or safety-related performance is
below what is reasonably expected. However, this may not result in an
incident, as the controller may recover performance, assistance may be
provided, or providence itself may result in no incident occurring. However,
a performance-related incident Implies that an incident has occurred due to
the contribution of an actor in the system, such as an ATCO, resulting from
a decline in performance. For this research which focuses on human
performance and influences on human performance, both performance
declines and performance-related incidents are included in the research.
The aims of the incident report analysis were three fold:
1. Confirm if factors identified in the literature review were present In
an ATC environment;
2. Further previous findings by establishing the frequency with which
each factor contributed to inCidents;
3. Determine if multifactor occurrences are reported in an ATC
envi ron ment.
The discussion is structured according to these aims. The factor set
(workload, stress, fatigue, SA, attention, vigilance, communications,
teamwork, trust) provides confirmation that the identified nine factors are
associated with human performance within an ATC setting. The reported
contribution of factors to incidents (e.g. main cause, causal, contributory)
suggests that factors are differentially associated with performance (see
Table 5.5). For example, SA was most frequently reported as a causal
factor in inCidents, supporting the suggestion from the literature that this
factor may often be affected by other factors, but has a direct effect on
123
Chapter 5. literature metrics and incident report analysis: Confirmation of key human factors and human factor
relationships
performance. In contrast, factors such as fatigue and workload were
primarily recorded as contributory factors in incidents. These factors affect
other factors directly, but appear to have a more indirect effect on
performance. This supports the categorisation of factors as suggested from
the literature review (Chapter 2).
The frequency with which each factor contributed to incidents was
reported, contributing to the second study aim. Although the factors
recorded in the incident reports corresponded to factors in the literature,
the relative importance of each factor differed. In the literature, workload,
fatigue and stress are repeatedly noted to be associated with human
performance. This is not reflected in the incident reports. Workload was
only observed to contribute to 24% of incidents, whereas fatigue was
recorded to contribute to 2% of incidents and stress 1% of Incidents.
Although the results are not directly comparable, as the literature review
examined all domains as opposed to only the ATC domain, these results
represent a considerable discrepancy between literature and aviation
incident reports regarding the relative Impact of each factor on human
performance decrements, and provides mixed data to the second overall
PhD aim to select a sub-set of the factors to most negatively influence
performance. One explanation for this result Is the findings from the
literature review. As it was found that the majority (77%) of articles
reviewed took either an experimental or review approach, the discrepancy
between results may be partly caused by findings from experimental
studies potentially not providing ecologically valid data. An additional
explanation focuses on a reporting bias (Johnson, 2001). For example,
Kirwan, Scaife and Kennedy (2001) found that certain factors which are
seen as 'static' I.e. normally present, tend to be under-reported, since they
are always there. Nevertheless, the incident report results suggest that
interaction effects between factors do exist in the field, and so the third
study aim is supported. This is an Important finding as it suggests that
anecdotal evidence of complex Incidents arising from multiple factors can
be supported and encourages further investigation of relationships
between multiple factors, and the association of multifactor occurrences
with performance. In addition, the factors found to most frequently co
occur may contribute to the overall research aim of selecting a sub-set of
factors to Investigate in future studies.
124
Chapter 5. literature metrics and incident report analysis: Confirmation of key human factors and human factor relationships
Causal relationships between factors cannot be inferred from this
data, but it is possible to infer relationships between each of the factor
dyads and triads from previous research, some of which were described in
the literature review (Chapter 2), and utilise this information to provide a
foundation for hypothesis generation of potential factor relationships which
could be explored in future studies.
5.4 Concluding remarks
Findings from the literature analysis confirm the frequency and direction
with which the identified human performance factors (attention,
communications, fatigue, mental workload, situation awareness, stress,
teamwork, trust, vigilance) have been found to co-vary, and provide an
initial indication of the factors that may be most important to include in the
next research phase. The incident report analysis confirmed that the
factors are associated with performance-related incidents In an ATC setting.
Multifactor co-occurrences are frequently reported and associated with
performance-related incidents. Findings also suggest an initial hierarchy of
the factors and factors relationships that may most negatively influence
controller performance. This first thesis aim, to 'Identify a set of human
factors that influence air traffic controller (ATCa) performance' Is achieved
by these findings. These results also provide a strong starting point in
identifying the key factors that most negatively affect ATCa performance,
which is the second aim of this thesis.
However, a discrepancy between the results of the literature review
and the incident report analysis was found regarding the relative
importance of each factor and its influence on performance. As the findings
are in conflict, a selection of 3-4 factors that most negatively influence
ATCa performance, which is the second aim of the project, cannot be
completed with confidence. This Is compounded by the potential reporting
biases which are suspected to affect the reliability and validity of the
findings from the incident report analysis. The selected factors will be used
in the next research phases with the assumption that these factors are
(negatively) associated with ATCa performance. Therefore, it is highly
important that the refinement and ultimate selection of the factors is
guided by consistent and reliable findings which are appropriate to the air
traffic domain.
125
Chapter 5. literature metrics and incident report analysis: Confirmation of key human factors and human factor
relationships
It is concluded that further research is necessary to resolve the
discrepancy between findings from the literature review and incident report
analysis and provide further data to inform the refinement and selection of
factors that most frequently negatively influence controller performance,
achieving aim two of the thesis. In addition, research is needed to identify
the factor relationships that most frequently negatively influence controller
performance, whilst minimising the retrospective bias inherent in Incident
report data. It is suggested that a questionnaire of air traffic professionals
would achieve these aims. Air traffic professionals would be able provide
detailed information regarding the factors and factors relationships that
most negatively influence ATCO performance in current operations rooms,
without a retrospective bias. These conclusions therefore led to a study of
factors and factor relationships' influence on performance in current
operations rooms, from the air traffic professionals' experience.
5.5 Chapter summary
This chapter presented two research studies which investigated human
factor relationships and associations with performance. A quantitative
frequency analysis of 83 articles, that investigated a total of 90 dyadic
factor relationships, was presented. The aims of the study were to
investigate the frequency with which specific factors were selected for
research within a literature sample of research investigating multifactor
relationships and to investigate the frequency and direction of relationships
between factors. Findings support that relationships between factors dyads
are reported although discrepant results between studies exist. In addition,
factors are selected for investigation with different proportions; workload
and stress are most frequently selected for investigation in the reviewed
literature sample. An analysis of inCident reports was conducted to confirm
and extend the literature analysis findings and contribute to thesis aims
one and two. Results were described and interpreted in-line with the study
aims. Key findings included that the set of nine factors were recorded In
incident reports, supporting the association between factors and ATCO
performance, and that factors were reported to co-occur in incidents. In
addition, a discrepancy was identified between the two studies regarding
the relative frequency of factors in association with human performance.
126
Chapter 6. Expert knowledge elicitation of human factors in relation to performance
Chapter 6. Expert knowledge elicitation
of human factors in relation to
performance
6.1 Chapter overview
As concluded from the previous chapter, the data elicited from the
literature review and incident report analysis differed in the degree to
which factors were reported to contribute to performance decline or
performance related incidents. An air traffic professional knowledge
elicitation exercise was used to resolve the discrepancy between previous
research findings. One advantage of capturing subject matter expert (SME)
responses was that data in the research study would be informed by
experts, air traffic professionals who experience and observe such
influences daily. Data would provide comprehensive and up-to-date
information regarding the factor influences which are associated with ATCO
performance.
The chapter begins with the aims of the knowledge elicitation study.
The selection process of the knowledge elicitation method and exercises is
described. A pilot study of the knowledge elicitation exercise, a survey
questionnaire, using aviation professionals as participants, is presented.
The pilot study aimed to gain credibility for the exercise selection and
highlight modifications to meet the needs of the participant population, and
the resulting modifications to the knowledge elicitation exercise are
summarised. The chapter then presents the knowledge elicitation exercise
in terms of method, results and discussion. The chapter concludes that the
survey-questionnaire generated data which contributed to the second
research aim. It is proposed that a summary and comparison of the data
from the three methodologies of literature analysis, incident report analysis
and knowledge elicitation exercise is required next to Identify the factors
that will be used in future studies, in addition to the proposal of a
controlled lab-based experiment as the next research step.
127
Chapter 6. Expert knowledge elicitation of human factors in relation to performance
6.2 Expert knowledge elicitation: Aims
The knowledge elicitation exercise had two aims. The first aim was to
identify the factors that aviation professionals believed to most negatively
influence controller performance. Results contributed to the later selection
of factors that were most important to include in future investigations. The
second aim of the study was to identify the most frequently occurring
dyadic factor relationships which negatively influenced controller
performance.
6.3 Selection of knowledge elicitation methodology
A review of knowledge elicitation methods was conducted. Methods were
selected that had been documented in research literature to be appropriate
for subjective data collection. The following options were considered:
questionnaires, focus groups, interviews, influence diagram and analytical
hierarchy process. The first three methods are all forms of survey method,
defined as a self-report measurement administered through verbal or
written techniques (Stangor, 2004). Table 6.1 presents a summary of the
method options and relevant pragmatic elements. The survey
questionnaire was selected as the knowledge elicitation technique. The
questionnaire would be distributed on line to facilitate a large number of
responses, and reduce experimenter bias. The selection was made based
on the aims of the study and pragmatics for implementing the method.
One of the challenges to questionnaire data suggests that experimenter
effects may bias results (Bonini, 2005). However, "in comparison to
interviews, questionnaires are also likely to be less Influenced by the
characteristics of the experimenter" (Stangor, 2004, p106). In addition,
questionnaires generate more participant responses compared to the other
methods, Increasing the likelihood of a representative sample (Stangor,
2004). In addition, distribution Is flexible and requires minimal resources.
128
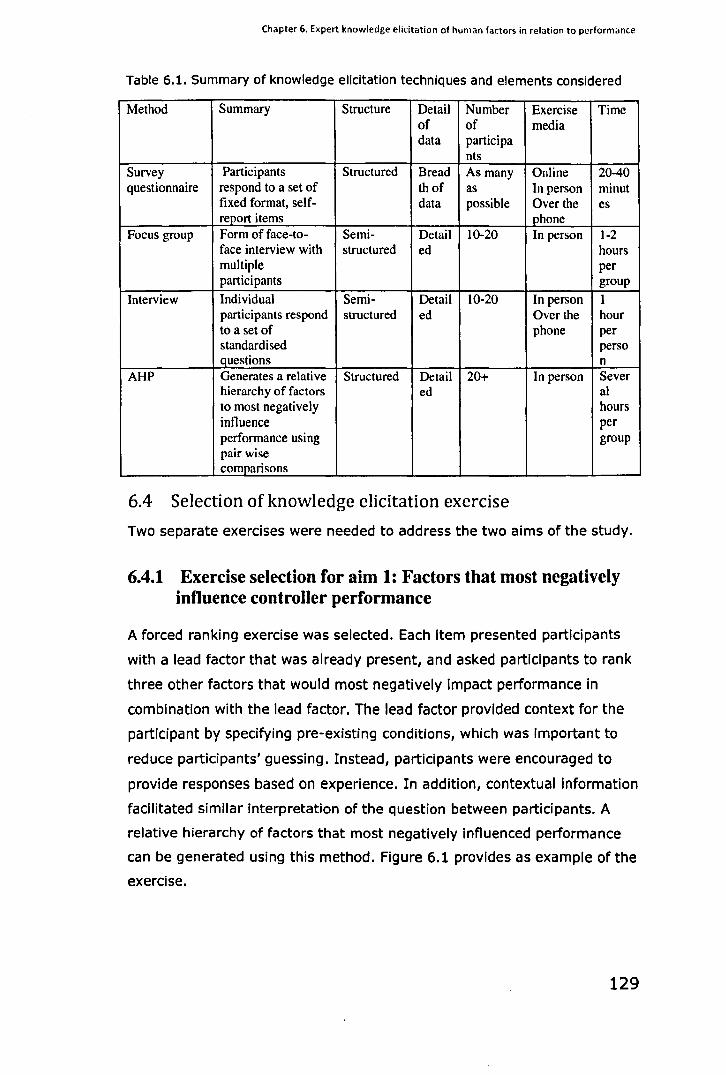
Chapter 6. Expert knowledge elicitation of human factors in relation to performance
Table 6.1. Summary of knowledge elicitation techniques and elements considered
Method Summary Structure Detail Number Exercise Time of of media data participa
nts Survey Participants Structured Bread As many Online 20-40 questionnaire respond to a set of th of as In person minut
fixed format, self- data possible Over the es report items phone
Focus group Form of face-to- Semi- Detail 10-20 In person 1-2 face interview with structured ed hours multiple per participants group
Interview Individual Semi- Detail 10-20 In person 1 participants respond structured ed Over the hour to a set of phone per standardised perso questions n
AHP Generates a relative Structured Detail 20+ In person Sever hierarchy of factors ed al to most negatively hours influence per performance using group pair wise comparisons
6.4 Selection of knowledge elicitation exercise
Two separate exercises were needed to address the two aims of the study.
6.4.1 Exercise selection for aim 1: Factors that most negatively influence controller performance
A forced ranking exercise was selected. Each item presented participants
with a lead factor that was already present, and asked participants to rank
three other factors that would most negatively impact performance in
combination with the lead factor. The lead factor provided context for the
participant by specifying pre-existing conditions, which was important to
reduce participants' guessing. Instead, participants were encouraged to
provide responses based on experience. In addition, contextual information
facilitated similar Interpretation of the question between participants. A
relative hierarchy of factors that most negatively influenced performance
can be generated using this method. Figure 6.1 provides as example of the
exercise.
129
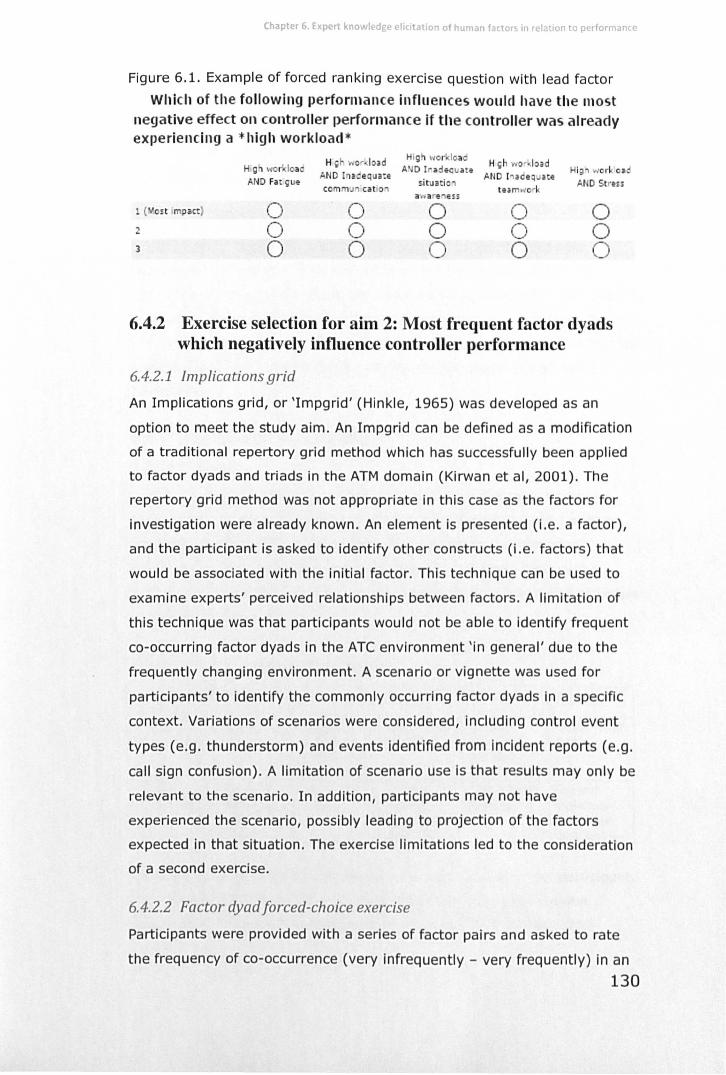
Chapter 6. Expert knowledge elicitation of human factors in relation to perforMance
Figure 6.1. Example of forced ranking exercise question with lead factor
Which of the following performance influences would have the most negative effect on controller performance if the controller was already experiencing a *h igh workload *
H \;r .... c' l o~d Hig ,.;or 101
H gh '0'10 " 'load High '';01' loao A D lra:laquat e Hi; work cae AND Fat que
AND [nacequa:e situatlc
Io ND 1 ,~ ae(l Jlte AN D Str.u comm J'1 catio tum ,,,crk
a .. . re .... ess
1 (Yost impact) 0 0 0 0 0 2 0 0 0 0 0 3 0 0 0 0 0
6.4.2 Exercise selection for aim 2: Most frequent factor dyads which negatively influence controller performance
6.4.2.1 Implications grid
An Implications grid, or 'Impgrid' (Hinkle, 1965) was developed as an
option to meet the study aim. An Impgrid can be defined as a modification
of a traditional repertory grid method which has successfu lly been applied
to factor dyads and triads in the ATM domain (Kirwan et ai, 2001). The
repertory grid method was not appropriate in this case as the factors for
investigation were already known. An element is presented (i.e. a factor),
and the participant is asked to identify other constructs (i .e. factors) that
would be associated with the initial factor. This technique can be used to
examine experts' perceived relationships between factors. A limitation of
this technique was that participants would not be able to identify frequent
co-occurring factor dyads in the ATe environment 'in general' due to the
frequently changing environment. A scenario or vignette was used for
participants'to identify the commonly occurring factor dyads in a specific
context. Variations of scenarios were considered, including contro l event
types (e.g. thunderstorm) and events identified from incident reports (e.g.
call sign confusion). A limitation of scenario use is that results may only be
relevant to the scenario . In addition, participants may not have
experienced the scenariO, possibly leading to projection of the factors
expected in that situation. The exercise limitations led to the consideration
of a second exercise.
6.4.2.2 Factor dyad forced-choice exercise
Participants were provided with a series of factor pairs and asked to rate
the frequency of co-occurrence (very infrequently - very frequently) in an
130
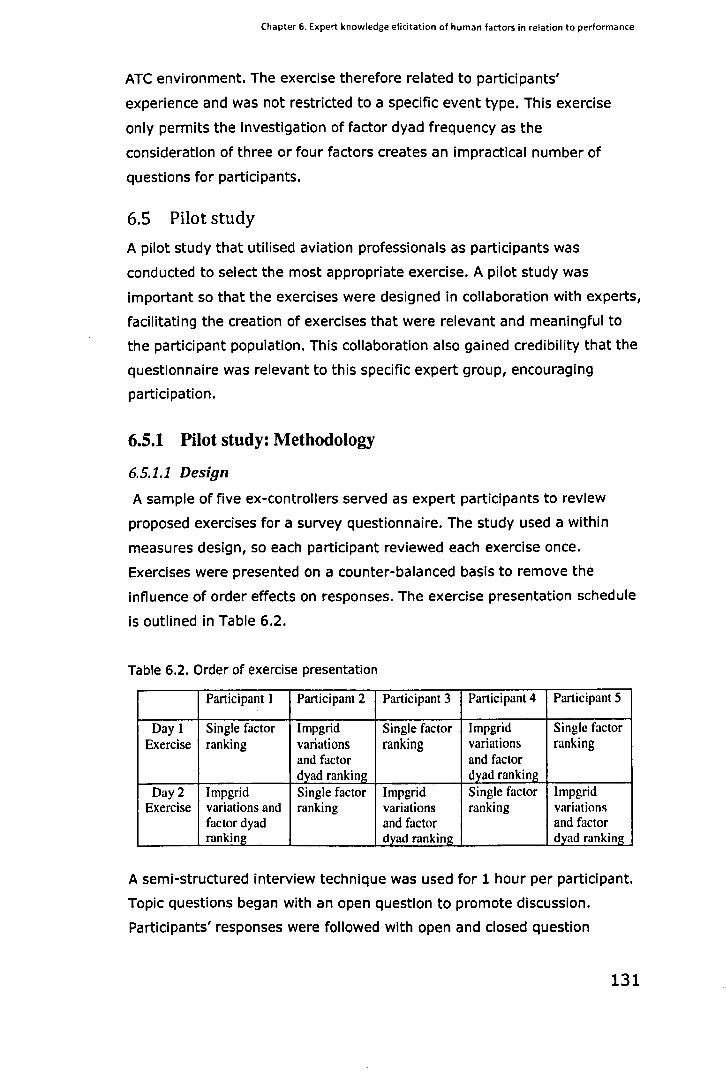
Chapter 6. Expert knowledge elicitation of human factors in relation to performance
ATe environment. The exercise therefore related to participants'
experience and was not restricted to a specific event type. This exercise
only permits the investigation of factor dyad frequency as the
consideration of three or four factors creates an impractical number of
questions for participants.
6.5 Pilot study
A pilot study that utilised aviation professionals as participants was
conducted to select the most appropriate exercise. A pilot study was
important so that the exercises were designed in collaboration with experts,
faCilitating the creation of exercises that were relevant and meaningful to
the participant population. This collaboration also gained credibility that the
questionnaire was relevant to this specific expert group, encouraging
participation.
6.5.1 Pilot study: Methodology
6.5.1.1 Design
A sample of five ex-controllers served as expert participants to review
proposed exercises for a survey questionnaire. The study used a within
measures design, so each participant reviewed each exercise once.
Exercises were presented on a counter-balanced basis to remove the
influence of order effects on responses. The exercise presentation schedule
is outlined in Table 6.2.
Table 6.2. Order of exercise presentation
Participant I Participant 2 Participant 3 Participant 4 Participant 5
Day I Single factor Impgrid Single factor Impgrid Single factor Exercise ranking variations ranking variations ranking
and factor and factor dyad ranking dyad ranking
Day 2 Impgrid Single factor Impgrid Single factor Impgrid Exercise variations and ranking variations ranking variations
factor dyad and factor and factor ranking dyad ranking dyad ranking
A semi-structured interview technique was used for 1 hour per participant.
Topic questions began with an open question to promote discussion.
Participants' responses were followed with open and closed question
131
Chapter 6. Expert knowledge elicitation of human factors in relation to performance
probes. There was no fixed format for participant responses. All verbal
responses were recorded via dictaphone and written notes.
6.5.1.2 Participants
Participants were five ex-controllers; four males and one female. There
was no standardisation of age, years of experience, or number of years
since retirement from controlling.
6.5.1.3 Pilot study Procedure
Participants were contacted prior to the study to arrange two, one hour
meetings on consecutive days. In the first meeting, the participant was
asked to read a study overview and instructions and asked for permission
to be recorded. The stimulus material was presented and the researcher
completed the interview schedule. The participant was subsequently given
the opportunity to provide any other feedback they wished to discuss.
6.5.2 Pilot study: Results and discussion
6.5.2.1 Selection of exercise
In total, four of five participants preferred the dyad factor rating exercise
as opposed to the Impgrid. The Impgrid was reported to be too complex
and the scenarios were misleading. Participants suggested presenting a
brief factor definition that was accompanied by meaningful examples with
the factor dyad rating exercise.
6.5.2.2 Factor definitions and natural language
Participants reported that factor definitions needed to be modified to be
meaningful and incorporate natural language that was familiar to aviation
professionals.
6.5.2.3 Factors
A majority of four participants suggested modifications to the factors under
investigation.
1. Trust: Trust was not meaningful due to the many forms and
varieties in ATe. Trust in systems was perceived as binary; either
the system would be fully trusted or would not be used. Therefore,
three participants suggested removing the factor of 'trust'.
2. Attention, vigilance & situation awareness: Participants could
not differentiate between these factors on a practical level, or
132
Chapter 6. Expert knowledge elicitation of human factors in relation to performance
differentially apply each to the ATC environment. It was
recommended that only one of these factors was included in the
questionnaire.
3. Mental workload: Participants recommended dividing workload
into 'high workload' and 'low workload' as both workload extremes
were perceived to differentially influence performance.
6.5.3 Conclusions
Controllers approved of the single factor ranking exercise that contributed
to the first study aim. Based on expert feedback, a factor ranking exercise
was selected to contribute to the second aim. Factors will be refined in
accordance with expert feedback and factor definitions will be created In
collaboration with aviation experts.
6.5.4 Refinement of factors included for investigation based on pilot study findings
Factors were refined in line with aviation professionals' feedback from the
pilot study so that all factors were meaningful. Factor refinement was also
of practical benefit to reduce the number of questions in the survey
questionnaire. However, it was not appropriate to base the revision of
factors solely on expert feedback. In order to achieve the aims of the study
it was important that the factors of interest were still included in the study,
and any modifications were appropriate to the research context. Therefore,
qualitative expert feedback was considered in combination with data from
the previous studies of the literature analysis (section 5.2) and incident
report analysis (section 5.3). Factors selected for investigation Identified in
the literature review sample and the incident report analysis were ranked
based on the frequency of the factor's occurrence from 1-9 (1 being the
most frequent). The ranks were then combined to create a single ranking
for each factor based on findings from both the literature analysis and
Incident report analysis. Factors with the lowest rank were most frequently
included in both studies (Table 6.3). Expert opinions generated from
interviews were then considered.
133
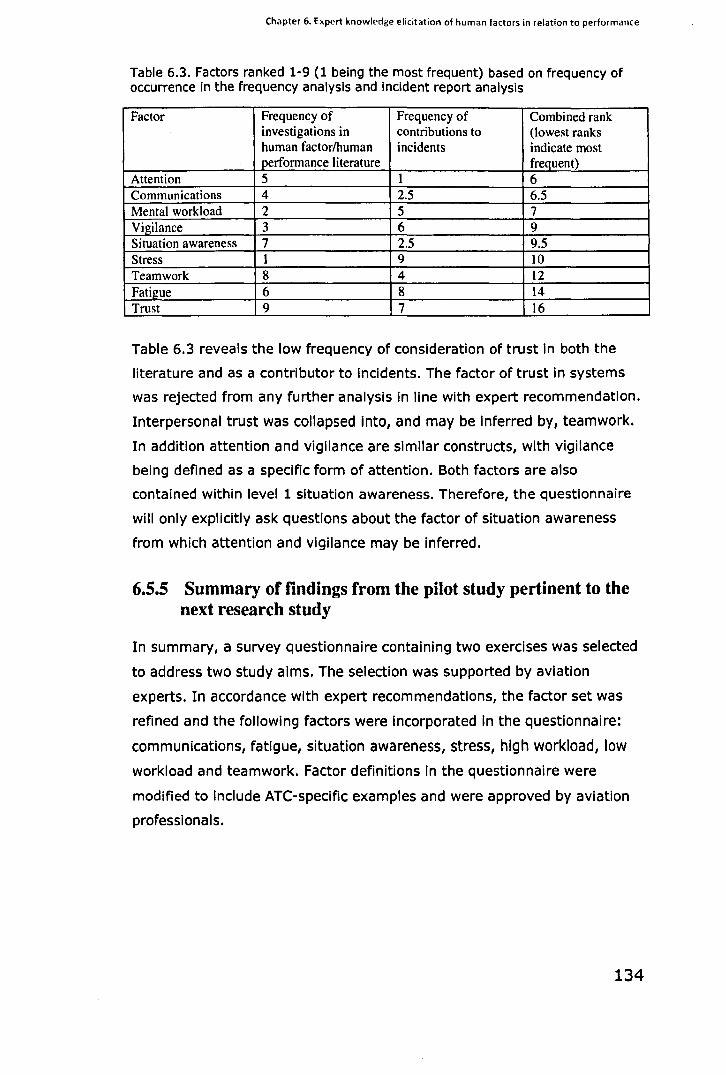
Chapter 6. Expert knowledge elicitation of human factors in relation to performance
Table 6.3. Factors ranked 1-9 (1 being the most frequent) based on frequency of occurrence in the frequency analysis and incident report analysis
Factor Frequency of Frequency of Combined rank investigations in contributions to (lowest ranks human factor/human incidents indicate most performance literature frequent)
Attention 5 1 6 Communications 4 2.5 6.5 Mental workload 2 5 7 Vigilance 3 6 9 Situation awareness 7 2.5 9.5 Stress 1 9 10 Teamwork 8 4 12 Fatigue 6 8 14 Trust 9 7 16
Table 6.3 reveals the low frequency of consideration of trust in both the
literature and as a contributor to incidents. The factor of trust in systems
was rejected from any further analysis in line with expert recommendation.
Interpersonal trust was collapsed Into, and may be inferred by, teamwork.
In addition attention and vigilance are similar constructs, with vigilance
being defined as a specific form of attention. Both factors are also
contained within level 1 situation awareness. Therefore, the questionnaire
will only explicitly ask questions about the factor of Situation awareness
from which attention and vigilance may be inferred.
6.5.5 Summary of findings from the pilot study pertinent to the next research study
In summary, a survey questionnaire containing two exercises was selected
to address two study aims. The selection was supported by aviation
experts. In accordance with expert recommendations, the factor set was
refined and the following factors were Incorporated In the questionnaire:
communications, fatigue, situation awareness, stress, high workload, low
workload and teamwork. Factor definitions in the questionnaire were
modified to include ATe-specific examples and were approved by aviation
professionals.
134
Chapter 6. Expert knowledge elicitation of human factors in relation to performance
6.6 Survey questionnaire: Knowledge elicitation
6.6.1 Questionnaire: Method
6.6.1.1 Design
Expert opinion of the single factors and most frequent factor dyads to most
negatively influence controller performance were investigated. The study
used an independent measures design with a fixed format self-report
survey questionnaire that was online (Appendix 4). The online
questionnaire consisted of a total of 28 items separated into two sections.
Section 1 aimed to investigate the frequency of the co-occurrence of
dyadic factors in performance related loss of separation incidents and
controller performance decrements. Participants were required to indicate
the frequency with which that factor pair influenced controller performance
using a Likert scale. The scale utilised a continuum ranging from 1 (Very
Rarely) to 5 (Very Often).
The second section of the questionnaire aimed to investigate the
impact of each factor, when combined with another factor, on performance.
Each item utilised a forced ranking response method. Participants were
presented with the remaining six factors and ranked the top 3 factors (1
being most impact of the 3, 3 being the least impact). Once the
questionnaire had been developed, two controllers and one incident
investigator from the National Air Traffic Service (NATS), in addition to two
human factors professionals, reviewed and approved the questionnaire
prior to distribution.
6.6.1.1 Participants
The target population for the questionnaire was ATCOs and incident
investigators. These populations were selected to capture perspectives
from individual with different experiences. ATCOs are familiar with factors
that influence their performance, whilst Incident Investigators have
experience in the factors that most frequently contribute to Incidents.
Snowball sampling was used to generate a high number of responses.
Although this form of non-probability sampling may lead to sampling bias
(Stangor, 2004) a larger sample may control for this potential bias by
being more representative.
135
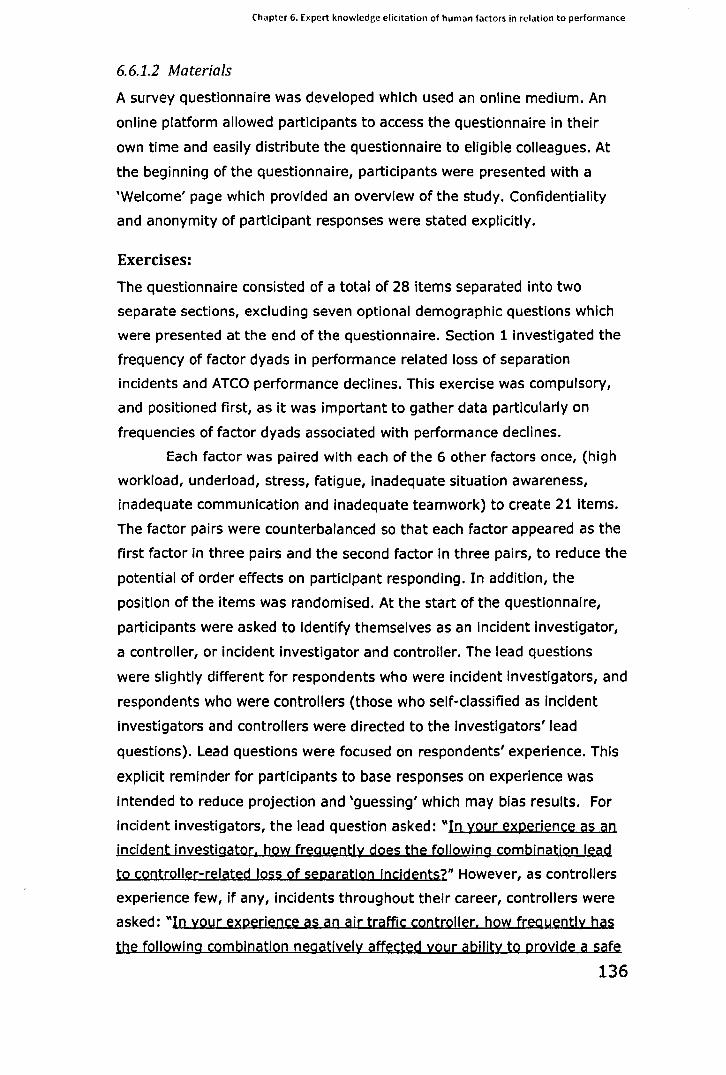
Chapter 6. Expert knowledge elicitation of human factors in relation to performance
6.6.1.2 Materials
A survey questionnaire was developed which used an online medium. An
online platform allowed participants to access the questionnaire in their
own time and easily distribute the questionnaire to eligible colleagues. At
the beginning of the questionnaire, participants were presented with a
'Welcome' page which provided an overview of the study. Confidentiality
and anonymity of participant responses were stated explicitly.
Exercises:
The questionnaire consisted of a total of 28 items separated Into two
separate sections, excluding seven optional demographic questions which
were presented at the end of the questionnaire. Section 1 investigated the
frequency of factor dyads in performance related loss of separation
incidents and ATCO performance declines. This exercise was compulsory,
and positioned first, as it was important to gather data particularly on
frequencies of factor dyads associated with performance declines.
Each factor was paired with each of the 6 other factors once, (high
workload, underload, stress, fatigue, Inadequate situation awareness,
inadequate communication and Inadequate teamwork) to create 21 Items.
The factor pairs were counterbalanced so that each factor appeared as the
first factor in three pairs and the second factor In three pairs, to reduce the
potential of order effects on participant responding. In addition, the
position of the items was randomised. At the start of the questionnaire,
participants were asked to Identify themselves as an Incident Investigator,
a controller, or incident Investigator and controller. The lead questions
were slightly different for respondents who were Incident Investigators, and
respondents who were controllers (those who self-classified as Incident
investigators and controllers were directed to the investigators' lead
questions). Lead questions were focused on respondents' experience. This
explicit reminder for participants to base responses on experience was
intended to reduce projection and 'guessing' which may bias results. For
Incident investigators, the lead question asked: "In your experience as an
jncident investigator. how freQyently does the following combination lead
to controller-related loss of separation Incidents?" However, as controllers
experience few, if any, Incidents throughout their career, controllers were
asked: "In your experience as an air traffic controller. how frequently has
the following combination negatively affected your ability to provide a safe
136
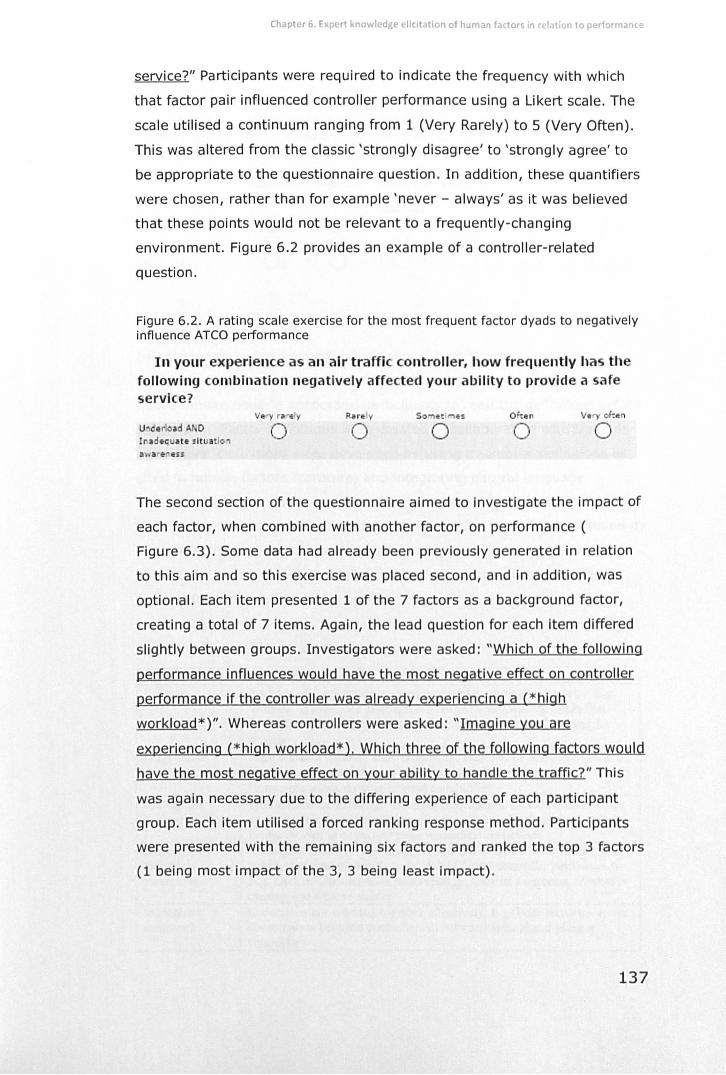
Chapter 6. Expert knowledge elicitation of human factors in relation to performance
service?" Participants were required to indicate the frequency with which
that factor pair influenced controller performance using a Likert scale. The
scale utilised a continuum ranging from 1 (Very Rarely) to 5 (Very Often).
This was altered from the classic 'strongly disagree' to 'strongly agree' to
be appropriate to the questionnaire question. In addition, these quantifiers
were chosen, rather than for example 'never - always' as it was believed
that these pOints would not be relevant to a frequently-changing
environment. Figure 6.2 provides an example of a contro ller-re lated
question.
Figure 6.2. A rating scale exercise for the most frequent factor dyads to negatively influence ATCO performance
In your experience as an air traffic controller, how frequently has the following combi nation negatively affected your ability to provide a safe service?
Ve rll rel 5o",et Mes o fte n v. often
U derload A 0 o o o o o a ','il r er8SS
The second section of the questionnaire aimed to investigate the impact of
each factor, when combined with another factor, on performance (
Figure 6.3). Some data had already been previously generated in relation
to this aim and so this exercise was placed second, and in addition, was
optional. Each item presented 1 of the 7 factors as a background factor,
creating a total of 7 items. Again, the lead question for each item differed
slightly between groups. Investigators were asked: "Which of the following
performance influences would have the most negative effect on controller
performance if the controller was already experiencing a ( * high
workload * )". Whereas controllers were asked: "Imagine you are
experiencing (* high workload* ). Which three of the following factors would
have the most negative effect on your ability to handle the traffic?" This
was again necessary due to the differing experience of each participant
group. Each item utilised a forced ranking response method. Participants
were presented with the remaining six factors and ranked the top 3 factors
(1 being most impact of the 3, 3 being least impact) .
137
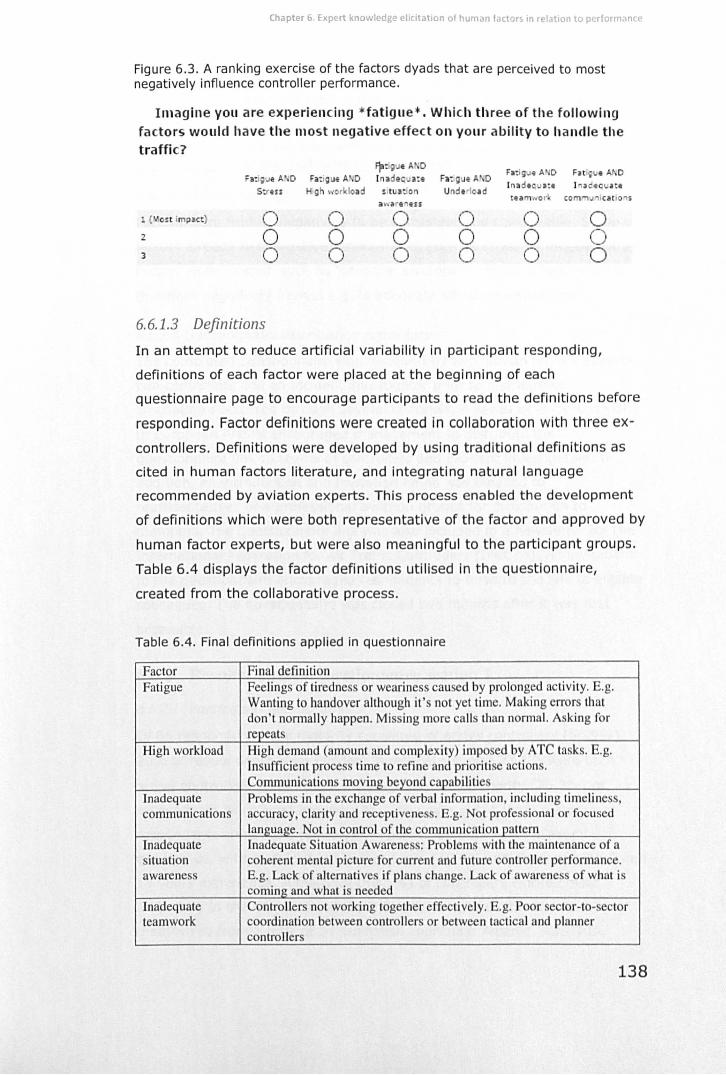
Chapter 6. Expert knowledge elicitation of human factors In relation to performance
Figure 6.3. A ranking exercise of the factors dyads that are perceived to most negatively influence controller performance.
Imagine you are experienc.ing * fatigue* . Which three of the following factors would have the most negative effect on your ability to handle the traffic?
f!a:igJI A 0 Fa:igJI A 0 Fni9uI A 0
i'a:igue A 0 Fa : gut A' 0 (nade I:. Fa:igue A' 0 s· us H gh \~ork lolld s itu l:ion Undl -Ioad
[nadeC! I: e ) "a C::~quat.
t •• m·,., or com"'J j c~ t io ·u a . tar • • u:
1 ( VOH impact) 0 0 0 0 0 0 2 0 0 0 0 0 0 3 0 0 0 0 0 0
6.6.1.3 Definitions
In an attempt to reduce artificial variability in participant responding,
definitions of each factor were placed at the beginning of each
questionnaire page to encourage participants to read the definitions before
responding. Factor definitions were created in collaboration with three ex
controllers. Definitions were developed by using traditional definitions as
cited in human factors literature, and integrating natural language
recommended by aviation experts. This process enabled the development
of definitions which were both representative of the factor and approved by
human factor experts, but were also meaningful to the participant groups.
Table 6.4 displays the factor definitions utilised In the questionnaire,
created from the collaborative process.
Table 6.4. Final definitions applied in questionnaire
Factor Final definition Fatigue Feelings of tirednes or weariness cau ed by prolonged activity. E.g.
Wanting to handover although it 's not yet time. Making error that don't normally happen. Miss ing more calls than normal. A king for repeats
High workload High demand (amount and complexity) impo ed by ATC tasks. E.g. Insufficient process time to refine and priori li se actions. Communications moving beyond capabilities
Inadequate Problems in the exchange of verbal information, including timeliness, communications accuracy, clarity and receptiveness. E.g. Not profe sional or focused
language. Not in control of the communication pattern Inadequate Inadequate Situation Awarene : Problems with the maintenance of a situation coherent mental picture for current and future controller performance. awareness E.g. Lack of alternatives if plans change. Lack of awarene of what is
coming and what is needed Inadequate Controller not working together effectively. E.g. Poor sector-to- ector teamwork coordination between controllers or between tactical and planner
controllers
138
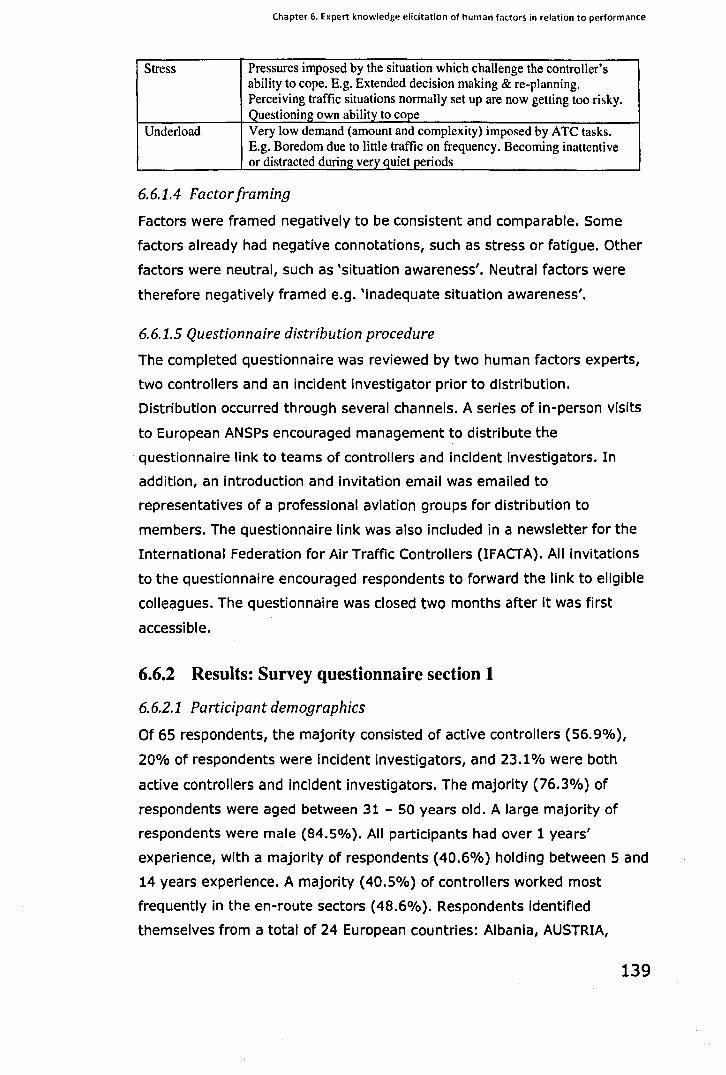
Chapter 6. Expert knowledge elicitation of human factors in relation to performance
Stress Pressures imposed by the situation which challenge the controller's ability to cope. E.g. Extended decision making & re-planning. Perceiving traffic situations normally set up are now getting too risky. Questioningown ability to cope
Underload Very low demand (amount and complexity) imposed by ATe tasks. E.g. Boredom due to little traffic on frequency. Becoming inattentive or distracted during very_quiet periods
6.6.1.4 Factor framing
Factors were framed negatively to be consistent and comparable. Some
factors already had negative connotations, such as stress or fatigue. Other
factors were neutral, such as 'situation awareness'. Neutral factors were
therefore negatively framed e.g. 'inadequate situation awareness'.
6.6.1.5 Questionnaire distribution procedure
The completed questionnaire was reviewed by two human factors experts,
two controllers and an incident investigator prior to distribution.
Distribution occurred through several channels. A series of In-person visits
to European ANSPs encouraged management to distribute the
questionnaire link to teams of controllers and incident Investigators. In
addition, an introduction and Invitation email was emailed to
representatives of a professional aviation groups for distribution to
members. The questionnaire link was also included in a newsletter for the
International Federation for Air Traffic Controllers (IFACTA). All Invitations
to the questionnaire encouraged respondents to forward the link to eligible
colleagues. The questionnaire was closed two months after it was first
accessible.
6.6.2 Results: Survey questionnaire section 1
6.6.2.1 Participant demographics
Of 65 respondents, the majority consisted of active controllers (56.9%),
20% of respondents were incident investigators, and 23.1 % were both
active controllers and incident investigators. The majority (76.3%) of
respondents were aged between 31 - SO years old. A large majority of
respondents were male (84.5%). All participants had over 1 years'
experience, with a majority of respondents (40.6%) holding between 5 and
14 years experience. A majority (40.5%) of controllers worked most
frequently in the en-route sectors (48.6%). Respondents Identified
themselves from a total of 24 European countries: Albania, AUSTRIA,
139
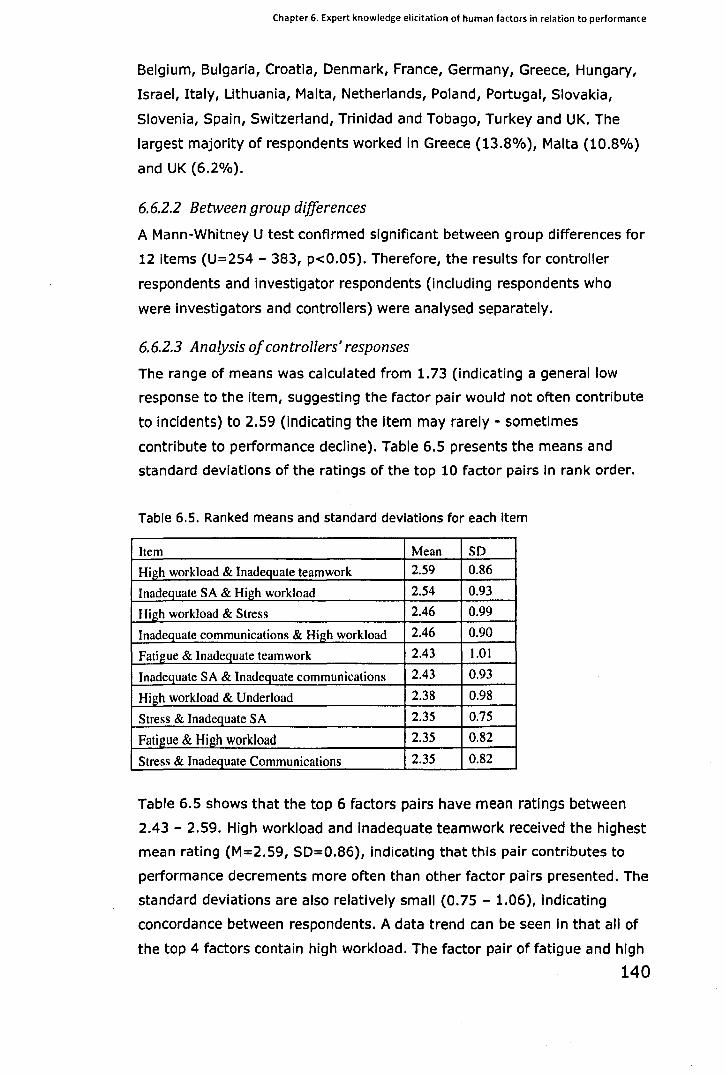
Chapter 6. Expert knowledge elicitation of human factors in relation to performance
Belgium, Bulgaria, Croatia, Denmark, France, Germany, Greece, Hungary,
Israel, Italy, Lithuania, Malta, Netherlands, Poland, Portugal, Slovakia,
Slovenia, Spain, Switzerland, Trinidad and Tobago, Turkey and UK. The
largest majority of respondents worked in Greece (13.8%), Malta (10.8%)
and UK (6.2%).
6.6.2.2 Between group differences
A Mann-Whitney U test confirmed significant between group differences for
12 items (U=254 - 383, p<0.05). Therefore, the results for controller
respondents and investigator respondents (including respondents who
were investigators and controllers) were analysed separately.
6.6.2.3 Analysis of controllers' responses
The range of means was calculated from 1.73 (indicating a general low
response to the item, suggesting the factor pair would not often contribute
to incidents) to 2.59 (indicating the item may rarely - sometimes
contribute to performance decline). Table 6.5 presents the means and
standard deviations of the ratings of the top 10 factor pairs in rank order.
Table 6.S. Ranked means and standard deviations for each Item
Item Mean SD
High workload & Inadequate teamwork 2.59 0.86
Inadequate SA & High workload 2.54 0.93
High workload & Stress 2.46 0.99
Inadequate communications & High workload 2.46 0.90
Fatigue & Inadequate teamwork 2.43 1.01
Inadequate SA & Inadequate communications 2.43 0.93
High workload & Underload 2.38 0.98
Stress & Inadequate SA 2.35 0.75
Fati~ue & High workload 2.35 0.82
Stress & Inadequate Communications 2.35 0.82
Table 6.5 shows that the top 6 factors pairs have mean ratings between
2.43 - 2.59. High workload and inadequate teamwork received the highest
mean rating (M=2.59, 50=0.86), indicating that this pair contributes to
performance decrements more often than other factor pairs presented. The
standard deviations are also relatively small (0.75 - 1.06), indicating
concordance between respondents. A data trend can be seen in that all of
the top 4 factors contain high workload. The factor pair of fatigue and high
140
Chapter 6. Expert knowledge elicitation of human factors in relation to performance
workload was rated 9th most frequent factor pair overall, and is the only
time high workload appears outside of the top five rated factor pairs. The
means of the S factor pairs that were rated as most infrequently negatively
impacting performance ranged from 1.73-1.97, with standard deviations
ranging from 0.84-1.01. All factor pairs Included underload.
Data were further analysed with non-parametric statistics. A
Levene's test revealed the homogeneity of variance assumption was
violated for 6 factor pairs (p<O.OS), and a Kolmogorov-Smirnov analysis
revealed that 18 out of 21 results did not have a normal distribution
(p<O.OS). A Friedman's ANOVA identified significant differences between
item ratings (X2(20) = 77.2, p<O.OOOS. Wilcoxon analyses expanded on
this finding. A bonferroni correction was applied and so all effects are
reported at a 0.001 level of significance. Differences most relevant to the
questionnaire aims are discussed.
6.6.2.3.1 High workload vs. underload
High workload and inadequate teamwork was rated to contribute to a
reduction in a safe service significantly more frequently than the four
factor pairs that were rated as least frequently occurring. Interestingly, all
of these factor pairs included underload: underload and fatigue (T=30, Z=-
3.S9, p<O.OOOS), underload and Inadequate situation awareness (T=44,
z=-3.29, p=O.OOl), stress and underload (T=3S, z=-3.8, p<O.OOOS) and
inadequate teamwork and underload (T=39, z=-3.S6, p<O.OOOS). In
addition, inadequate situation awareness and high workload was rated
significantly more frequently as contributing to a reduction In safe service
than four factor pairs containing underload, including stress and underload
(T=37.S, z=-3.6, p<O.OOOS)and underload and Inadequate situation
awareness (T=34, z=-3.4S, p=O.OOl).
6.6.2.3.2 Fatigue
Ratings of factor pairs including fatigue were significantly different.
Reponses to the frequency of fatigue and underload suggest that this
factor pair contributes significantly less frequently to controllers' ability to
provide a safe service than high workload and Inadequate teamwork (T=30,
z=-3.S9, p<O.OOOS), inadequate situation awareness and Inadequate
communication (T=27, z=-3.29, p=O.OOl). However, fatigue and
inadequate teamwork was rated by controllers as significantly more
141
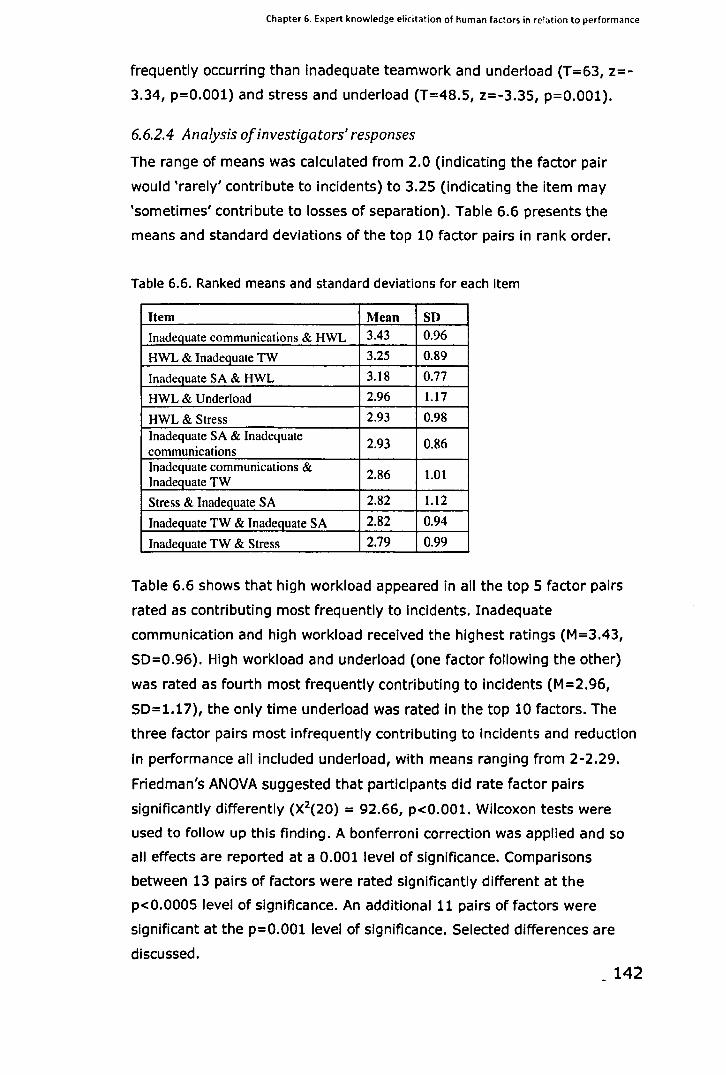
Chapter 6. Expert knowledge elicitation of human factors in relation to performance
frequently occurring than inadequate teamwork and underload (T=63, Z=-
3.34, p=O.OOl) and stress and underload (T=48.5, z=-3.35, p=O.OOl).
6.6.2.4 Analysis of in vestiga tors' responses
The range of means was calculated from 2.0 (indicating the factor pair
would 'rarely' contribute to incidents) to 3.25 (indicating the item may
'sometimes' contribute to losses of separation). Table 6.6 presents the
means and standard deviations of the top 10 factor pairs in rank order.
Table 6.6. Ranked means and standard deviations for each item
Item Mean SD
Inadequate communications & HWL 3.43 0.96
HWL & Inadequate TW 3.25 0.89
Inadequate SA & HWL 3.18 0.77
HWL & Underload 2.96 1.17
HWL & Stress 2.93 0.98
Inadequate SA & Inadequate 2.93 0.86
communications Inadequate communications &
2.86 1.01 Inadequate TW
Stress & Inadequate SA 2.82 1.12
Inadequate TW & Inadequate SA 2.82 0.94
Inadequate TW & Stress 2.79 0.99
Table 6.6 shows that high workload appeared in all the top 5 factor pairs
rated as contributing most frequently to incidents. Inadequate
communication and high workload received the highest ratings (M=3.43,
50=0.96). High workload and underload (one factor following the other)
was rated as fourth most frequently contributing to incidents (M=2.96,
50=1.17), the only time underload was rated In the top 10 factors. The
three factor pairs most infrequently contributing to incidents and reduction
in performance all included underload, with means ranging from 2-2.29.
Friedman's ANOVA suggested that participants did rate factor pairs
significantly differently (X2(20) = 92.66, p<O.OO1. Wilcoxon tests were
used to follow up this finding. A bonferronl correction was applied and so
all effects are reported at a 0.001 level of Significance. Comparisons
between 13 pairs of factors were rated Significantly different at the
p<O.OOOS level of significance. An additional 11 pairs of factors were
significant at the p=O.OOl level of Significance. Selected differences are
discussed. 142
Chapter 6. Expert knowledge elicitation of human factors in relation to performance
6.6.2.4.1 High workload vs. underload
Wilcoxon statistical analyses revealed each of the top rated factors
containing high workload were rated as significantly more frequently
contributing to incidents than those factor pairs containing underload. For
example, inadequate communication and high workload was rated
significantly more frequently contributing to incidents than factor pairs
containing underload, including inadequate teamwork and underload (T=21,
z=-3.77, p<0.0005) and stress and underload (T=21, z=-4.11, p<0.0005).
In addition, high workload and inadequate teamwork was rated
significantly more frequently as contributing to loss of separation incidents
than underload and fatigue (T=12, z=-3.55, p<0.0005) and stress and
underload (T= 16, z=-4.05, p<0.0005).
6.6.2.4.2 Fatigue
Factor pairs including the factor of fatigue received a wide distribution of
ratings (M= 2.25-2.75). Fatigue and Inadequate teamwork (T=21, z=-3.38,
p=O.OOl), fatigue and Inadequate communications (T=15, z=-3.51,
p<0.0005) and fatigue and stress (T= 17, z=-3.62, p<O.0005) were all
rated as significantly less frequently contributing to Incidents than
inadequate communications and high workload. This suggests investigators
do not rate fatigue as frequently contributing to incidents.
6.6.3 Results: Survey questionnaire section 2
A Mann-Whitney U analysis revealed no significant between group
differences. Therefore, results were collapsed into one data set.
6.6.3.1 Participant demographics
Of 48 respondents, the majority consisted of active controllers (58.3%),
while 18.8% of respondents were Incident Investigators, and 22.9% were
both active controllers and incident investigators. The majority of
respondents (73%) were aged between 31 - SO years old. A large majority
of respondents were male (80.9%), with 41.7% holding between 10 - 19
years experience. Respondents were from a total of 21 European countries.
The largest majority of respondents worked in Greece (16.7%), Malta
(14.6%) and UK (6.2%). A majority of controllers worked most frequently
in the en-route sectors (42.9%).
143
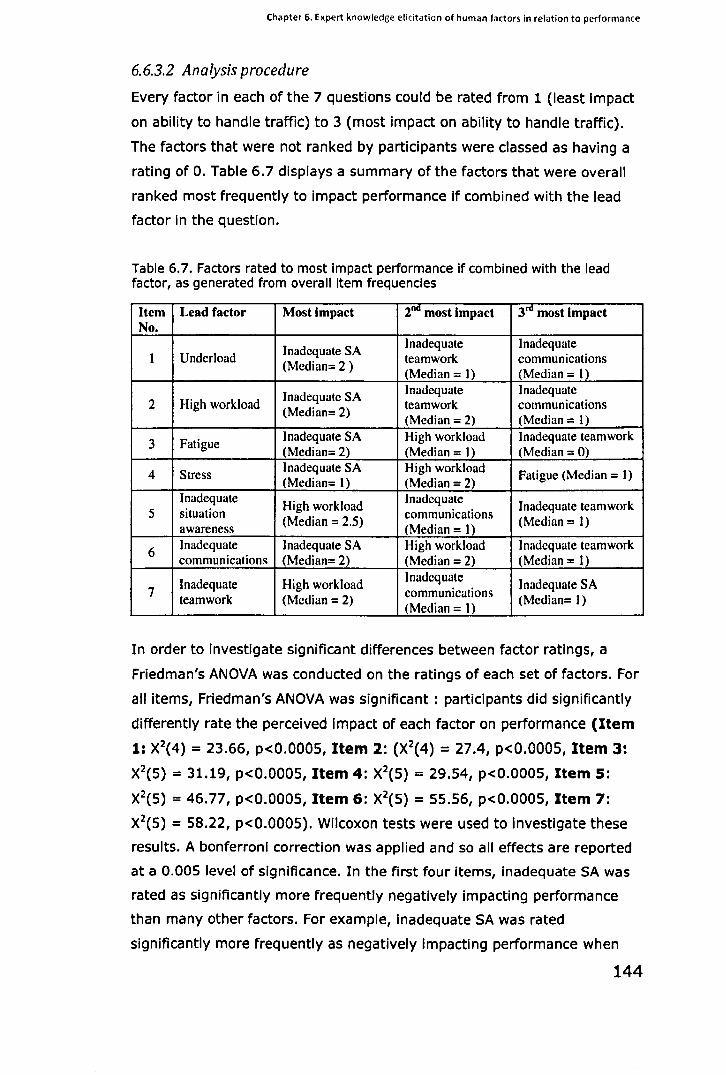
Chapter 6. Expert knowledge elicitation of human factors in relation to performance
6.6.3.2 Analysis procedure
Every factor in each of the 7 questions could be rated from 1 (least Impact
on ability to handle traffic) to 3 (most impact on ability to handle traffiC).
The factors that were not ranked by participants were classed as having a
rating of O. Table 6.7 displays a summary of the factors that were overall
ranked most frequently to impact performance if combined with the lead
factor in the question.
Table 6.7. Factors rated to most impact performance if combined with the lead factor, as generated from overall item frequencies
Item Lead factor Most impact 2114 most impact 3111 most impact No.
Inadequate SA Inadequate Inadequate 1 Underload teamwork communications
(Median= 2) (Median = I) (Median = I)
Inadequate SA Inadequate Inadequate 2 High workload
(Median= 2) teamwork communications (Median = 2) (Median = I)
3 Fatigue Inadequate SA High workload Inadequate teamwork (Median= 2) (Median = I) (Median = 0)
4 Stress Inadequate SA High workload Fatigue (Median = I) (Median= I) (Median = 2)
Inadequate High workload
Inadequate Inadequate teamwork 5 situation communications
awareness (Median = 2.5) (Median = 1)
(Median = I)
6 Inadequate Inadequate SA High workload Inadequate teamwork communications (Median= 2) (Median = 2) (Median = I)
Inadequate High workload Inadequate
Inadequate SA 7 communications teamwork (Median = 2)
(Median = 1) (Median= I)
In order to investigate significant differences between factor ratings, a
Friedman's ANOVA was conducted on the ratings of each set of factors. For
all items, Friedman's ANOVA was significant: participants did significantly
differently rate the perceived impact of each factor on performance (Item
1: X2(4) = 23.66, p<O.0005, Item 2: (X2(4) = 27.4, p<O.0005, Item 3:
X2(5) = 31.19, p<O.0005, Item 4: X2(5) = 29.54, p<0.0005, Item 5:
X2(5) = 46.77, p<O.0005, Item 6: X2(5) = 55.56, p<O.0005, Item 7:
X2(5) = 58.22, p<O.0005). Wilcoxon tests were used to Investigate these
results. A bonferroni correction was applied and so all effects are reported
at a 0.005 level of significance. In the first four items, inadequate SA was
rated as significantly more frequently negatively Impacting performance
than many other factors. For example, inadequate SA was rated
significantly more frequently as negatively Impacting performance when
144
Chapter 6. Expert knowledge elicitation of human factors in relation to performance
combined with underload than stress (T=88, z=-4.19, p<0.0005).
Analyses on item 2 revealed inadequate SA was again rated significantly
more frequently to negatively impact performance when combined with
high workload than fatigue (T=155, z=-3.9, p<0.0005) and stress (T=159,
z=-3.71, p<0.0005). Inadequate SA was rated significantly more
frequently to impact performance when combined with fatigue than factors
including inadequate teamwork (T=211, z=-3.07, p<0.005) and
inadequate communications (T=136, z=-3.89, p<0.0005). Finally,
inadequate SA was found to have been rated significantly higher as having
the most negative impact on performance when combined with inadequate
communication when compared to fatigue (T=135, z=-3.75, p<O.0005),
stress (T=241.5, z=-3.16, p<0.005) and underload (T=29.50, z=-4.93,
p<O.0005).
High workload was also a highly rated factor. In Item 4, high
workload was ranked as having a negative impact on performance when
combined with stress significantly more than underload (T=13.50, z=-4.49,
p<O.0005). High workload was also rated overall as the factor that would
most impact performance if combined with inadequate SA. This ranking
was significantly higher than the overall ratings received for factors
including underload (T=71, z=-4.67, p<O.0005) and stress (T=163.5, Z=-
3.8, p<0.0005). This suggests the importance of this factor in impacting
the ability to handle aircraft when combined with inadequate SA. High
workload was again rated significantly more frequently to impact
performance when combined with inadequate communications than fatigue
(T=161, z=-3.4, p<0.005), stress (T=173, z=-3.24, p<0.005), and
underload (T=66, z=-4.37, p<0.0005). Finally, high workload was rated
significantly more frequently as having a negative impact on performance
when combined with Inadequate teamwork than fatigue (T=115, z=-4.15,
p<O.0005), stress (T=135, z=-4.02, p<0.0005) and underload (T=22, Z=-
5.08, p<O.OOOS). For this item, underload was also rated significantly less
frequently than three other factors - inadequate communications (T=55,
z=-4.09, p<O.0005), inadequate situation awareness (T=64.5, z=-3.94,
p<O.0005), and stress (T=34.5, z=-3.07, p<0.005).
145
Chapter 6. Expert knowledge elicitation of human factors in relation to performance
6.6.4 Questionnaire: Discussion
6.6.4.1 Survey questionnaire section 1
General, significant, data trends were found In the first questionnaire
section.
6.6.4.1.1 High workload vs. underload
The top four factor pairs as rated by controllers, and the top five factor
pairs as rated by investigators, all contain high workload. This may indicate
that high mental workload is perceived by ATM experts to be one of the
main contributors to performance decline and loss of separation Incidents.
Controllers, however, are highly trained to effectively manage high
workload, adopting various strategies to maintain a high standard of
performance (e.g. Sperandio, 1971). Therefore, the results suggest that In
order for performance to be maintained under high workload, other factors
within the social technical system must be operating adequately. If a
component is less than adequate when a high workload Is present, the risk
of a performance decrement or loss of separation Incident may Increase.
Both controllers and investigators rated factor pairs containing
underload as very Infrequently influence performance. The factors paired
with underload were the same factors that appeared In the top four factor
pairs with high workload, suggesting the level of workload Is the
determiner of the Impact of a factor pairs on performance. For example,
under a high workload, inadequate teamwork could enhance the
complexity and risk of a situation. However, with few aircraft on frequency,
a controller may have the spare capacity to support the deficit arising from
inadequate teamwork.
6.6.4.1.2 High workload and underload
Both controllers and investigators highlighted the transition between
workload extremes as frequently contributing to loss of separation
incidents and performance decrements. These workload transition effects
are well-known colloquially (e.g. Cox-Fuenzalida, 2007; Kirwan, 2011).
However, very little research has Investigated this effect. Future research
should investigate the relationship between workload extremes, and the
impact of the transition effects on performance. The only time underload
was ranked highly in the questionnaire was when it was combined with
high workload (one would follow the other). This relationship may suggest
146
Chapter 6. Expert knowledge elicitation of human factors in relation to performance
that the so called gear shift, or workload transition, effect impacts
performance negatively (Cox-Fuenzalida, 2007). Further research should
consider this relationship in more experimental settings to further
understand the interactions between these factors and the impact on
performance.
6.6.4.1.3 Fatigue
Factor pairs containing fatigue received a wide dispersion of overall ratings.
Only fatigue and inadequate teamwork was rated by controllers as 5th most
frequent to impact performance. Investigators rated all factor pairs
containing fatigue infrequently occurring. The results suggest fatigue may
be dependent on the associated factor to determine its impact on
performance. This is an interesting result as fatigue has been widely
reported in literature to be a primary cause of human error and resulting
performance decrements and incidents (e.g. Dorrian, Roach, Fletcher, &
Dawson, 2007). These results suggest that this view may not be reflected
in the wider ATM professional population.
6.6.4.2 Survey questionnaire section 2
The results of section 2 of the questionnaire support findings from section
1. Table 6.7 suggests that inadequate SA was rated as the factor that
would have the most Impact on performance, followed by high workload,
then inadequate teamwork, and finally inadequate communications. These
factors have been reported by aviation experts to associate negatively with
performance and may be considered for Inclusion in future research. The
factors that were considered to have the most negative Influence on
performance were inadequate SA and high workload. These findings may
therefore be particularly important for inclusion in future research.
Interestingly, fatigue, stress and underload were not perceived to
most negatively influence performance. This finding reflects the incident
report findings.
6.7 Chapter summary
A knowledge elicitation study was required to resolve the discrepancy In
results from the literature analysis and incident report analysis. The
knowledge elicitation study aimed to identify the single factors that
aviation professionals believed to most negatively Influence controller
147
Chapter 6. Expert knowledge elicitation of human factors in relation to performance
performance and identify the most frequently occurring factor dyads that
negatively influenced controller performance. Results contributed to the
second overall research aim. An online survey questionnaire was selected
as the knowledge elicitation method. The questionnaire incorporated two
exercises. A pilot study with five ex-controllers as partiCipants was
conducted and the questionnaire was modified in accordance with expert
recommendations. The questionnaire was distributed through European
ANSPs and professional aviation societies. Results suggest that the factor
combination of a high workload with factors such as inadequate teamwork
and inadequate SA most frequently negatively Influence controller
performance. Controllers are trained to maintain a high performance with a
high workload. Therefore, the combination of a high workload with an
additional factor may influence performance decline. In addition,
inadequate SA was reported to most negatively influence performance,
followed by high workload, inadequate teamwork, and Inadequate
communications. These results will be considered in combination with
previous data to select the factors for inclusion In future Investigations.
148
Chapter 7. Selection of experimental factors
Chapter 7.
factors
Sele~tion of experimental
7.1 Chapter overview
Chapters 5 and 6 have described a literature analysis, incident report
analysis and knowledge elicitation study that generated data towards two
overall research aims: identification of a set of human factors that
influence ATCO performance, and the selection of sub-group of factors for
inclusion in the next research phase. At this stage, a comparison of
research findings from the three methods is needed to inform the selection
of a sub-group of factors. The selection will be based on the single factors
that most negatively influence controller performance, and the factors that
most frequently co-occur in an ATC domain.
The chapter begins with a summary of the three studies and a
comparison of the single factors and factor dyads that were most
frequently recorded to negatively influence controller performance. The
results of this comparison are combined with pragmatic considerations. Six
factors are selected for inclusion in future studies.
7.2 Summary of previous studies and associated findings
A literature analYSiS, incident report analysiS and survey questionnaire
investigated the frequency of factors and factors relationships that were
associated with controller performance. Each study built on the previous
method to provide confirmation of, and extend, research findings. The
literature review provided confirmation of an initial factor set of nine
factors (workload, stress, fatigue, SA, attention, vigilance, communications,
teamwork, trust) that were provided by EUROCONTROL, and identified
previous research that indicated factors did co-vary. It was important to
investigate factor co-occurrence, and association with performance, within
the ATC domain. An incident report analysis confirmed that the factors
identified in the literature were associated with ATCO performance-related
incidents, and provided an initial hierarchy of the most frequent factors,
and co-occurring factor dyads and triads, reported to contribute to ATCO
performance related incidents.
149
Chapter 7. Selection of experimental factors
A discrepancy was identified between the results of the literature
analysis and incident report analysis regarding the frequency that factors
were selected for investigation in the sample of peer-reviewed literature,
and the factors that were reported to contribute to performance-related
incidents. It was therefore necessary to resolve the discrepancy. An
aviation-expert knowledge elicitation method was selected to generate
current data that was specific to the ATe domain. A survey-questionnaire
investigated human factors in relation to performance. Results confirmed
that the factor set was perceived by experts to negatively Influence
controller performance. In addition, results indicated a hierarchical ranking
of the factors that most negatively influenced performance, and the factor
dyads that were perceived to most frequently co-occur to negatively
influence controller performance. The data generated from these three
consecutive studies were compared.
7.3 Comparison of results from a literature analysis, incident
report analysis and survey-questionnaire
A set of nine factors (workload, fatigue, stress, attention, vigilance, SA,
communications, teamwork and trust) were included in the literature
analysis and incident report analysis. However, the factors were refined
prior to the knowledge elicitation study; the factor set now consisted of
workload, fatigue, stress, SA, communications and teamwork. Two
comparisons are presented. Section 7.3.1 compares findings relating to the
single factors that most frequently, negatively Influence ATCO performance.
Section 7.3.2 presents a comparison of findings relating to the factor dyads
that most frequently co-occurred in association with ATCO performance.
7.3.1 Comparison of results: Single factors most frequently reported, and most frequently reported to have a negative association with performance
Table 7.1 presents a hierarchy of the single factors that were recorded to
influence performance, from most frequent to least frequent, reported for
three methodologies. Factors which are common between methodologies
are presented in bold. Factors which are not Included in the questionnaire
have been presented in red. In all methodologies, the factors of workload,
communication, teamwork and SA are reported tq influence controller
150

Chapter 7. Selection of experimental factors
performance. Stress and fatigue are documented to influence controller
performance in the literature analysis and incident report analysis. The
frequencies of the reported results differ, potentially due to the different
focuses of the methodologies. The hierarchy of factors reported in the
incident report analysis and questionnaire, similar in focus and specific to
the ATe domain, are similar. Excluding the factors that were not included
in the questionnaire, SA, workload teamwork and communication appear in
the top four positions for both methodologies. Interestingly, fatigue and
stress were not rated in the top factors. The concordance between results
from three separate methodologies suggests that the original nine factors
considered did negatively influence controller performance. The
comparison of results also highlights the factors that may most frequently
negatively influence performance and may be considered for inclusion in
future investigations. The selection of factors was further informed with a
comparison of the most frequent factor dyads to negatively influence
controller performance, as reported from three methods.
Table 7.1. Comparison of findings: Single factors' influence on performance
Factor Literature Incident Analysis Survey que tionnaire position - controller &
(Most - least investigators frequent)
I Stress Attention SA 2 Workload SA High workload 3 Vigilance Communication Inadequate teamwork
4 Communications
Teamwork Inadequate communications
5 Attention Workload 6 Fatigue Vigilance 7 SA Trust 8 Teamwork Fatigue 9 Trust Stress
7.3.2 Comparison of results: Frequency of factor dyads identified to co-occur, and the association with performance
Table 7.2 presents a comparison of the factor dyads which were most
frequently reported. For brevity, a maximum of ten most frequently
recorded dyads are presented. A key to the table is presented under the
table itself. The same four factors highlighted in the single factor hierarchy
(Table 7.1) specifically workload, SA, communications and teamwork, are
also reported as co-occurring most frequently to negatively influence
151
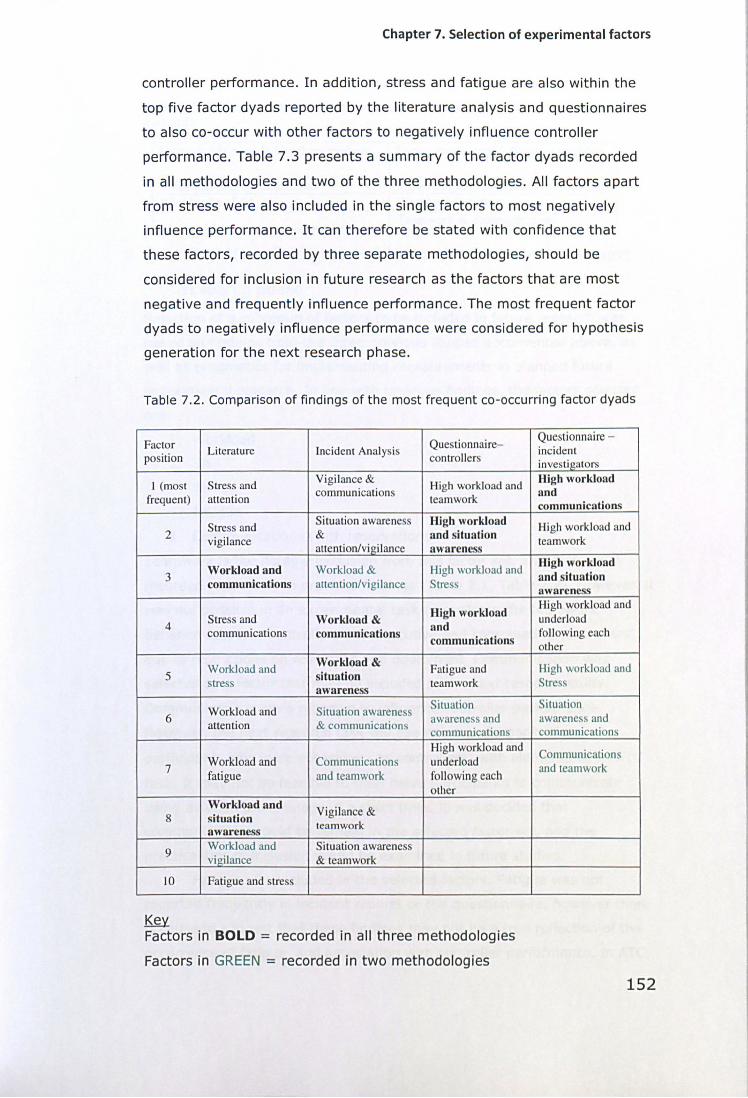
Chapter 7. Selection of experimental factors
controller performance. In addition, stress and fatigue are also within the
top five factor dyads reported by the literature analysis and questionnaires
to also co-occur with other factors to negatively influence controller
performance. Table 7.3 presents a summary of the factor dyads recorded
in all methodologies and two of the three methodologies. All factors apart
from stress were also included in the single factors to most negatively
influence performance. It can therefore be stated with confidence that
these factors, recorded by three separate methodologies, should be
considered for inclusion in future research as the factors that are most
negative and frequently influence performance. The most frequent factor
dyads to negatively influence performance were considered for hypothesis
generation for the next research phase.
Table 7 .2. Comparison of findings of the most frequent co-occurring factor dyads
Factor Que tionnaire-Questionnaire -
Literature Incident Analysis incident position controllers investigators
I (most Stress and Vigilance &
High workload and High workload
communications and frequent) attention teamwork
communications
Stress and Situation awareness High workload High work load and
2 vigi lance
& and situation teamwork attention/vigi lance awareness
Workload and Workload & High workload and High workload
3 and situation communications attention/vigilance Stress awareness
High workload High workload and
Stress and Workload & underload 4
communications communications and following each communications other
Workload and Workload &
Fati gue and High workload and 5
stress situation
teamwork Stre awareness
Workload and Simation awarene Situation Situation
6 atten tion & communications awareness and awarenes and communications communications
High workload and Communications
7 Workload and Communications underload and teamwork fatigue and teamwork followin g each
other Workload and
Vigilance & 8 situation
tea mwork awareness
9 Workl oad and Situation awarene vigilance & teamwork
10 Fatigue and stress
Key Factors in BOLD = recorded in all three methodologies
Factors in GREEN = recorded in two methodologies
152
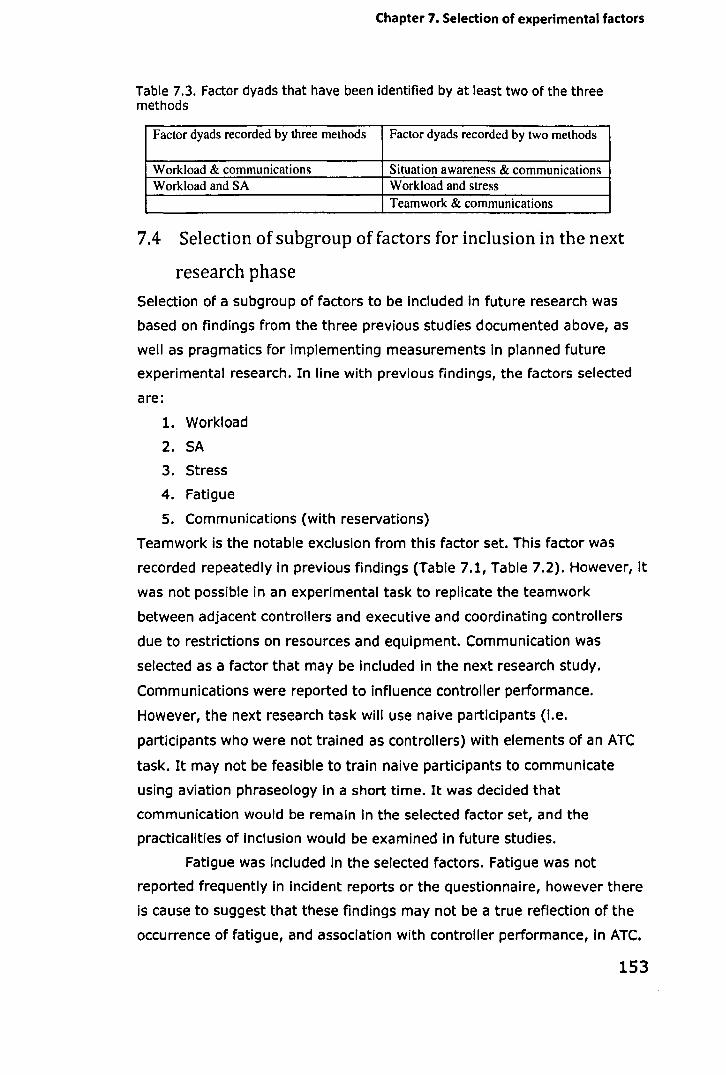
Chapter 7. Selection of experimental factors
Table 7.3. Factor dyads that have been identified by at least two of the three methods
Factor dyads recorded by three methods Factor dyads recorded by two methods
Workload & communications Situation awareness & communications Workload and SA Workload and stress
Teamwork & communications
7.4 Selection of subgroup of factors for inclusion in the next
research phase
Selection of a subgroup of factors to be Included in future research was
based on findings from the three previous studies documented above, as
well as pragmatics for implementing measurements in planned future
experimental research. In line with previous findings, the factors selected
are:
1. Workload
2. SA
3. Stress
4. Fatigue
5. Communications (with reservations)
Teamwork is the notable exclusion from this factor set. This factor was
recorded repeatedly In previous findings (Table 7.1, Table 7.2). However, it
was not possible in an experimental task to replicate the teamwork
between adjacent controllers and executive and coordinating controllers
due to restrictions on resources and equipment. Communication was
selected as a factor that may be included in the next research study.
Communications were reported to influence controller performance.
However, the next research task will use naive participants (I.e.
participants who were not trained as controllers) with elements of an ATC
task. It may not be feasible to train naive participants to communicate
using aviation phraseology in a short time. It was decided that
communication would be remain in the selected factor set, and the
practicalities of inclusion would be examined in future studies.
Fatigue was included in the selected factors. Fatigue was not
reported frequently In incident reports or the questionnaire, however there
Is cause to suggest that these findings may not be a true reflection of the
occurrence of fatigue, and association with controller performance, in ATC.
153
Chapter 7. Selection of experimental factors
As outlined in Chapter 2, section 2.2.1.2, the relationship between fatigue
and performance is complex, and problematic to reliably document
(Wickens et aI., 2004; Matthews et aI., 2000). The indirect relationship of
fatigue and performance means that fatigue may manifest differently
depending on the context; for example fatigue may contribute to a
controller overlooking an aircraft. Although fatigue may be an underlying,
or at least contributory, influence, the factor reported to contribute to an
incident may be associated with 'vigilance'. In addition, as discussed in
Chapter 5, section 5.3.7, reporting biases may have influenced the
presence of fatigue in incident reports. Johnson (2001) and Kirwan, Scaife
and Kennedy (2001) both report the occurrence of biases in incident
reporting, including a retrospective bias in which specific factors such as
fatigue are problematic to identify retrospectively, and under-reporting of
factors that are normally present.
Recent developments in the aviation domain confirm the
significance of fatigue within ATC. Currently, there is significant focus
within the aviation domain on fatigue and the association with performance,
both within the Federal Aviation Authority and Europe, with the European
Aviation Safety Agency deciding to make fatigue risk management systems
(defined as "a data-driven means of continuously monitoring and
managing fatigue-related safety risks" ICAO, 2012, pl-l) mandatory In the
near future. Therefore, in addition to the recognition that fatigue may be
underreported within the aviation domain, there is an Industrial recognition
of the importance of fatigue in association with human performance. For
these reasons, It was decided that fatigue will be included in the sub-set of
factors.
A decision was made to include the measurement of arousal within
the next research stage. Cox and Mackay (198S) suggest that whilst stress
Is related to subjective experiences of unpleasantness/pleasantness,
arousal is related to wakefulness/drowsiness, which the measurement of
stress alone may not capture effectively. Stress and arousal are closely
related concepts (Mackay et aI., 1978) which are reported to covary (Cox &
Mackay (1985). Cox and Mackay (1985) argue that "it has now become
obvious that feelings of unpleasantness/pleasantness (stress) may partly
reflect how appropriate the level of arousal is for a given situation" (p183).
As with stress, the relationship between arousal and performance Is
curvilinear and so 'inappropriate' levels of sustained arousal level may
154
Chapter 7. Selection of experimental factors
influence the experience of stress, whilst 'appropriate' levels of arousal are
generally reported to be beneficial to task performance (e.g. Matthews &
Davies, 2001). Stress and arousal were therefore both selected for
measurement in the next research stage to generate a more
comprehensive understanding of participants' response to the task (in
terms of arousal and stress) and the associated relationship with
performance.
7.5 Next research phase: Experimental study
The first two research aims have been addressed. The next research phase
will contribute to the third, fourth, fifth and sixth research aims. The most
appropriate methodology to generate data to contribute to these aims and
investigate the selected factors is an experimental method. A controlled,
laboratory environment is required for Investigation of factor relationships
and the association between factors and performance and performance
decline, in order to maintain control over the environment/variables. The
subset of factors selected in section 7.4 will be Included In analysis. An
experimental task that replicates a number of ATC elements will be utilised
with naive participants. A high fidelity ATC simulation was not feasible due
to resource restrictions.
7.6 Chapter summary
This chapter compared findings from three separate methodologies
regarding the single factors and factor dyads that most frequently
negatively influenced ATCO performance. The comparisons facilitated the
Identification of the factors and factor dyads that most frequently,
negatively influenced ATCO performance and were prioritised for Inclusion
an investigation in future studies. Factors were selected based on the
findings from the previous studies and the pragmatic considerations of
implementing measurements of these factors In an experimental context. A
subset of six factors was selected: workload, fatigue, arousal, stress, SA,
communications. The chapter continued to review the overall research
aims. An experiment method was selected as the next research phase that
would achieve the remaining third, fourth and fifth research aims.
iSS
Chapter 8. Experiment method
Chapter 8. Experiment method
8.1 Chapter overview
This chapter describes the methodological development and design of the
off-line experimental study using students as participants. The chapter
opens with the aims of the experimental study and continues to describe
pre-study considerations. A pilot study is then described, and further
changes to the design are documented. The chapter provides a summary
of the participant training process and selection to take part In the
experiment. Experimental hypotheses are subsequently listed. The chapter
finishes on a summary of analysis considerations.
8.2 Experiment: Aim and experimental questions
The aims of the experiment were to explore the relationships between
identified factors and the association with performance, and Investigate
performance at the edge of performance. Research questions were
developed to address this aim:
1. Does a relationship exist between factor dyads?
2. Do interactions between multiple factors occur?
3. What is the association between factor Interactions and
performance?
4. How does performance change at the edge of performance?
5. Are observable participant behaviours Indicators of potential
performance decline?
The experiment utilised a cognitive task with ATe elements. Due to
resource and political pressures, a full scale simulation with qualified
ATCOs was not feasible. Male students from the University of Nottingham
served as participants. The use of a student sample was a pragmatic
option that permitted an experimental study, which was essential In order
to measure In a controlled environment the relationship between multiple
factors and associations with performance. In addition, a student sample of
participants allowed for a more homogenous group, which may reduce
variability and confounding factors Introduced into the experiment,
therefore potentially positively influencing the reliability of results.
156
8.3 Pre-experimental considerations
8.3.1 Experiment task design considerations
8.3.1.1 Design
Chapter 8. Experiment method
The study used taskload variation as the only independent variable and
had one condition. Taskload was varied to create a total offive separate
taskload periods, separated into three low taskload periods, two high
taskload periods, and four taskload transition periods (two low-high
taskload transitions and two high-low taskload transitions). The length of
each taskload period was 20 minutes. This period of time was informed by
previous research, and took into consideration that the taskload period
needed to be long enough to permit the collection of several measures per
factor, but not so long as to create participant boredom. The transition
between taskload periods was four minutes long. Participants received a 20
minute break after 60 minutes on task. The length of break reflected the
period of time that ATCOs are permitted between sessions.
8.3.1.2 Manipulation o/taskload
Taskload was manipulated through the frequency of aircraft under control
(Tenney & Spector, 2001) and complexity of traffic demands, created by
the number of aircraft requiring vertical movements and the number of
aircraft on conflicting paths (Brookings, Wilson, & Swain, 1996). This
design improved on the methods of both Tenney and Spector (2001) and
Brookings et al. (1996) who had utilised only one of the two taskload
drivers to manipulate taskload, potentially creating greater variability In
taskload. Tenney and Spector (2001) presented 20 aircraft per 10 minutes
in the low taskload condition and 40 aircraft per 10 minutes In the high
taskload condition. Taskload conditions were associated with self-reported
workload. Findings were used to Inform the design of taskload in the
current study.
In the current experimental design, an average of 30 aircraft per 10
minutes was presented in low taskload periods and an average of 103
aircraft per 10 minutes was presented in high taskload periods. High
taskload periods also contained higher frequencies of aircraft requiring
vertical movements and aircraft on conflicting paths compared to low
taskload periods. Each similar taskload phase (I.e. low taskload periods 1,
2, and 3 and high taskload periods 1, 2) was created to generate similar
157

Chapter 8. Experiment method
levels of taskload, however, the phases did not use the same pattern of
traffic in order to control for practice effects.
8.3.2 Experiment: Measures
8.3.2.1 Measurement offactors
Measurement options were reviewed for each factor included in the
experiment (workload, fatigue, stress/arousal, SA, communications).
Measures were assessed on pragmatic considerations, including the level of
intrusiveness and distraction of the participant, time for administration, as
well as available resources, ease of application and analysis time.
The instantaneous self-assessment (ISA) scale (Appendix 5) was
selected to measure workload. The measure was brief and less Intrusive
than other measures and could be applied without stopping the experiment.
In addition, the psychophysiological measure of heart rate (HR) was used
to support self-reported workload. The Karolinska sleepiness scale
(Appendix 6) measured participant sleepiness at the beginning of the
experiment. Several scales of self-reported fatigue were reviewed
(Appendix 7) but a fatigue measure was not Identified with consistently
documented reliability and validity. A fatigue visual analogue scale (VAS)
(Appendix 8) was selected to measure fatigue throughout the experiment.
A fatigue VAS measure is quick, non-intrusive, and has been reported to
have "good validity [and] excellent reliability" (De Boer, Lanschot,
Stalmeier, Van Sandick, Hilscher, De Haes, Sprangers, 2004, p3U). The
stress-arousal check list (SACL) (Appendix 9) was selected to measure
stress and arousal. The measure can be applied during short breaks in the
experiment. The situation present assessment method (SPAM) (Durso et
aI., 1995) was selected to measure situation awareness (SA). The measure
could be used without stopping the experiment. In addition, SPAM Is
reported not to be confounded by a reliance on memory for which other
measures have been criticised (e.g. situation awareness and global
assessment technique, SAGAT) (Durso et aI., 1995). To minimise
distraction, only non-directive SA questions were utilised (Appendix 10).
Posture and HR were recorded continuously using a monitor for
psychophysiological data. Participants' overt behaviours were observed and
recorded throughout the study task by the researcher. Frequencies of
observed behaviour for each participant were calculated.
158
Chapter 8. Experiment method
8.3.2.2 Measures ofperformance
A literature review was conducted to identify peer-reviewed experimental
designs and previous performance measures utilised in ATe-related studies.
An initial list of performance measures were generated from the review
(Table 8.1). Multiple aspects of performance will be measured
independently (Buckley, 1976; Griffin, Neal & Neale, 2000) rather than
creating a general cumulative performance score (e.g. Yeo & Neal, 2008).
A combined score will prevent Investigation of factors in association with
different aspects of performance. Frequency of short term conflict alerts
was included to provide an indication of safety-related performance. Short
term conflict alerts (STCAs) indicate that aircraft will lose separation If
action is not taken. More frequent STCAs therefore Indicate that
participants' are not identifying or resolving conflicts in time, considered to
be a poorer performance. Time to respond to offered aircraft was included
as an efficiency-related measure of performance. Participants were
instructed to respond to aircraft as soon as they Identified the offer. Slower
reaction times may indicate slower detection times of the offered aircraft,
or reduced priority on this task element. Time to assume aircraft was also
included as an efficiency-related measure. However, as In actual control
tasks, assuming aircraft was treated as an essential task that should be
performed quickly. Participants were instructed to assume aircraft as
quickly as possible. Finally, frequency of route directs was also used as a
measure of efficiency-related performance. Routing an aircraft direct refers
to the instruction to an aircraft to change the route to a more direct path.
Participants were told that this action should be completed when they felt
they had they time to do so, but without putting safety at risk. Higher
route direct frequencies may therefore Indicate that participants felt
comfortable with the taskload, whereas low frequencies of route directs
may indicate that a participant felt that task demand required prioritisation
of tasks.
159
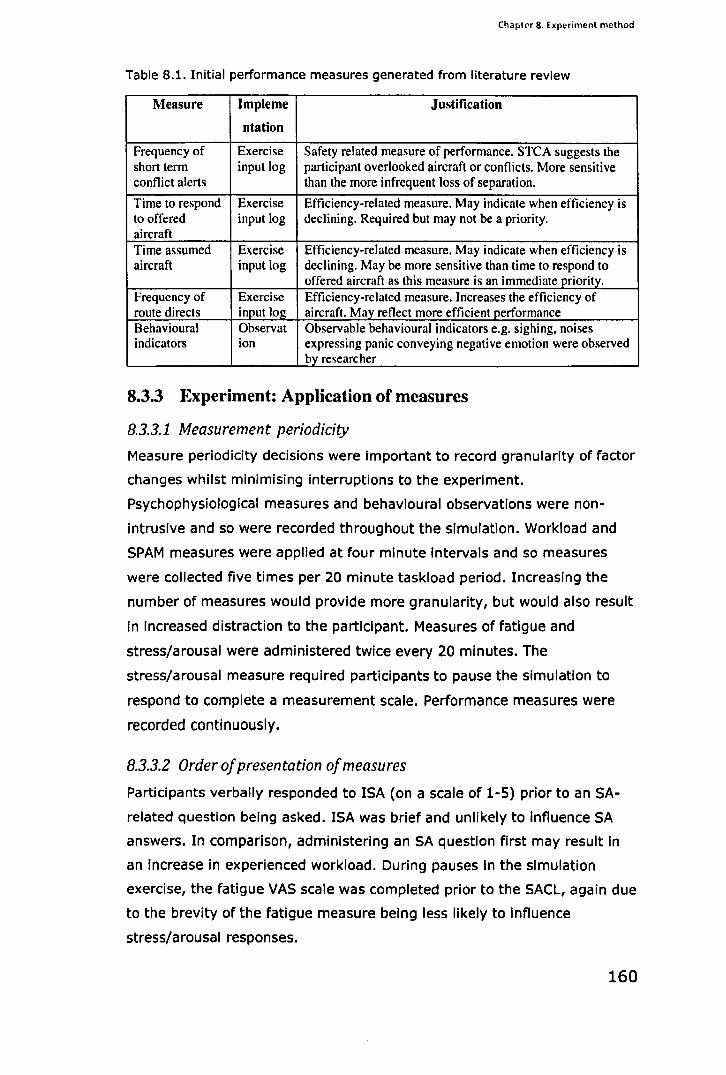
Chapter 8. Experiment method
Table 8.1. Initial performance measures generated from literature review
Measure Impleme Justification
ntation
Frequency of Exercise Safety related measure of performance. STCA suggests the short term input log participant overlooked aircraft or conflicts. More sensitive conflict alerts than the more infrequent loss of separation.
Time to respond Exercise Efficiency-related measure. May indicate when efficiency is to offered input log declining. Required but may not be a priority. aircraft Time assumed Exercise Efficiency-related measure. May indicate when efficiency is aircraft input log declining. May be more sensitive than time to respond to
offered aircraft as this measure is an immediate priority. Frequency of Exercise Efficiency-related measure. Increases the efficiency of route directs input log aircraft. May reflect more efficient performance Behavioural Observat Observable behavioural indicators e.g. sighing. noises indicators ion expressing panic conveying negative emotion were observed
by researcher
8.3.3 Experiment: Application of measures
8.3.3.1 Measurement periodicity
Measure periodicity decisions were Important to record granularity of factor
changes whilst minimising Interruptions to the experiment.
Psychophysiological measures and behavioural observations were non
intrusive and so were recorded throughout the simulation. Workload and
SPAM measures were applied at four minute intervals and so measures
were collected five times per 20 minute taskload period. Increasing the
number of measures would provide more granularity, but would also result
in increased distraction to the participant. Measures of fatigue and
stress/arousal were administered twice every 20 minutes. The
stress/arousal measure required participants to pause the simulation to
respond to complete a measurement scale. Performance measures were
recorded continuously.
8.3.3.2 Order o/presentation o/measures
Participants verbally responded to ISA (on a scale of 1-5) prior to an SA
related question being asked. ISA was brief and unlikely to Influence SA
answers. In comparison, administering an SA question first may result In
an Increase In experienced workload. During pauses In the simulation
exercise, the fatigue VAS scale was completed prior to the SACL, again due
to the brevity of the fatigue measure being less likely to Influence
stress/arousal responses.
160
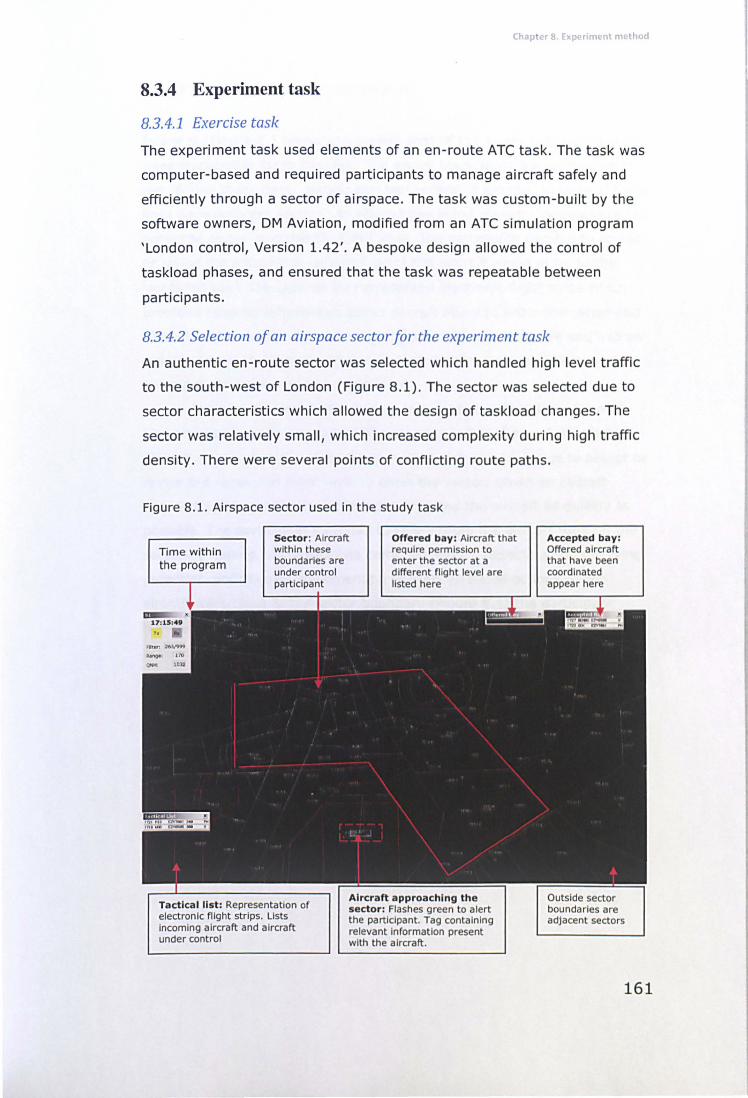
Chapter 8 . Experiment method
8.3.4 Experiment task
8.3.4.1 Exercise task
The experiment task used elements of an en-route ATC task. The task was
computer-based and required participants to manage aircraft safely and
efficiently through a sector of airspace. The task was custom-built by the
software owners, DM Aviation, modified from an ATC simulation program
'London control, Version 1.42'. A bespoke design allowed the control of
taskload phases, and ensured that the task was repeatable between
participants.
8.3.4.2 Selection of an airspace sector for the experiment task
An authentic en-route sector was selected which handled high level traffic
to the south-west of London (Figure 8.1). The sector was selected due to
sector characteristics which allowed the design of taskload changes. The
sector was relatively small, which increased complexity during high traffic
density. There were several pOints of conflicting route paths.
Figure 8.1. Airspace sector used in the study task
Time within the program
Sector : Aircraft within these bou nda ries are
Offered bay: Aircraft that require permission to enter the sector at a different flight level are listed here
Tactical list: Representation of electronic flight strips. Lists incoming aircraft and aircraft under control
Aircraft approaching the sector: Flashes green to alert the participant. Tag containing relevant information present with the aircraft.
Accepted bay: Offered aircraft that have been coordinated appear here
161
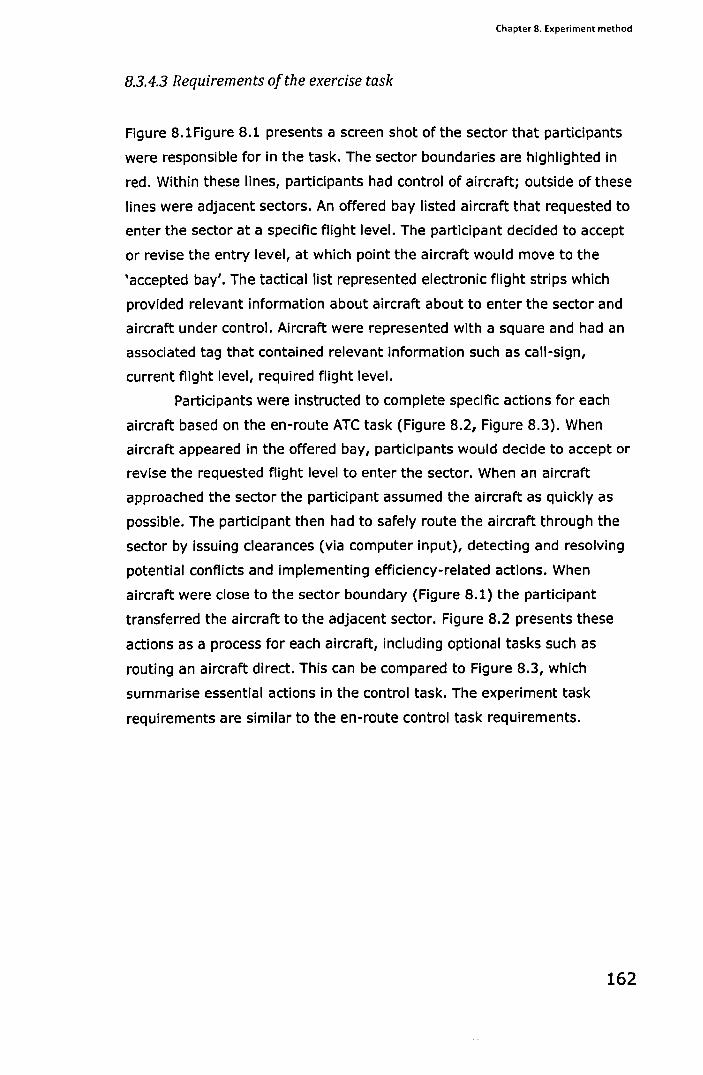
Chapter 8. Experiment method
8.3.4.3 Requirements o/the exercise task
Figure 8.1Figure 8.1 presents a screen shot of the sector that participants
were responsible for in the task. The sector boundaries are highlighted in
red. Within these lines, participants had control of aircraft; outside of these
lines were adjacent sectors. An offered bay listed aircraft that requested to
enter the sector at a specific flight level. The participant decided to accept
or revise the entry level, at which point the aircraft would move to the
'accepted bay'. The tactical list represented electronic flight strips which
provided relevant information about aircraft about to enter the sector and
aircraft under control. Aircraft were represented with a square and had an
associated tag that contained relevant information such as call-sign,
current flight level, required flight level.
Participants were instructed to complete specific actions for each
aircraft based on the en-route ATe task (Figure 8.2, Figure 8.3). When
aircraft appeared in the offered bay, partiCipants would decide to accept or
revise the requested flight level to enter the sector. When an aircraft
approached the sector the participant assumed the aircraft as quickly as
possible. The participant then had to safely route the aircraft through the
sector by issuing clearances (via computer Input), detecting and resolving
potential conflicts and implementing efficiency-related actions. When
aircraft were close to the sector boundary (Figure 8.1) the participant
transferred the aircraft to the adjacent sector. Figure 8.2 presents these
actions as a process for each aircraft, including optional tasks such as
routing an aircraft direct. This can be compared to Figure 8.3, which
summarise essential actions in the control task. The experiment task
requirements are similar to the en-route control task requirements.
162
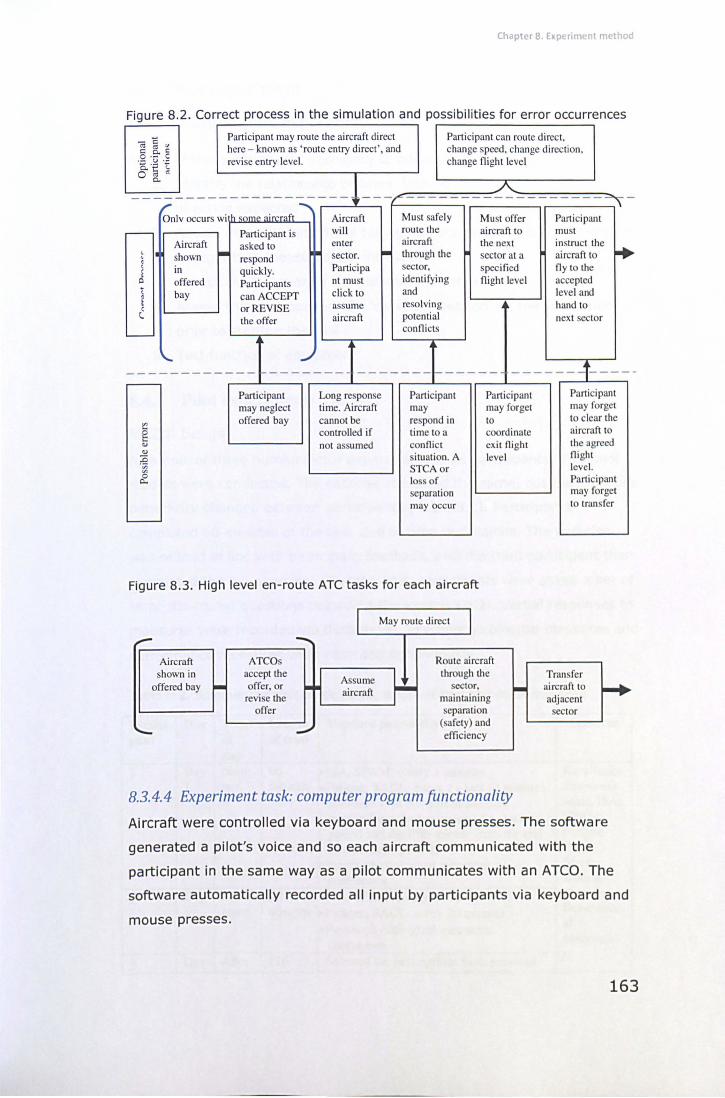
Chapter 8. Expe riment method
Figure 8.2. Correct process in the simulation and possibi li ties for error occurrences
- <= Participant may route the aircraft direct Participant can route direct.
co co v here - known as ' route entry direct', and change speed, change direction, <= 0.. c: 0· - c 8- '~ .~ revise entry level. change flight level
0..
A ----- ----------~--- - --,;c ~-
Onlv occurs wi <om" aircraft Aircraft Must safely Must offer Parti cipant
r- Participant is wi ll route the aircraft to must Aircraft asked to enter aircraft the next in truct the
1+ , shown
'"" respond sector. ""
through the sector at a aircraft to , • ,
in quickly. Participa sector, specified fl y to the I
0 offered Participants nt must identifying flight level accepted , bay can ACCEPT click to and level and
1 , or REVISE assume resolving hand to l the offer ai rcraft potential next sector
conflicts '---
'---- -- ------- ------- ------- 1- ----- ------4----,---
Part i ci pan t Long response Participant Participant may neglect time. Aircraft may may forget offered bay cannot be respond in to
~ g controlled if time toa coordinate ., not as umed connict ex it night ., situation. A level :0 .;;; STCAor
~ loss of separation may occur
L.-
Figure 8.3 . High level en -route ATC tasks for each aircraft
Aircraft shown in
offered bay
ATCOs accept the offer, or revise the
offer
May route direct
Route aircraft through the
sector, maintaining separation
(safety) and effi ciency
8.3.4.4 Experiment task: computer program functionality
Participant may forget to clear the aircraft to the agreed night level. Participant may forget to transfer
Transfer ai rcraft to adjacent
sector
Aircraft were controlled via keyboard and mouse presses. The software
generated a pilot's voice and so each aircraft communicated with the
participant in the same way as a pilot communicates with an ATCO. The
software automatically recorded all input by participants via keyboard and
mouse presses.
163
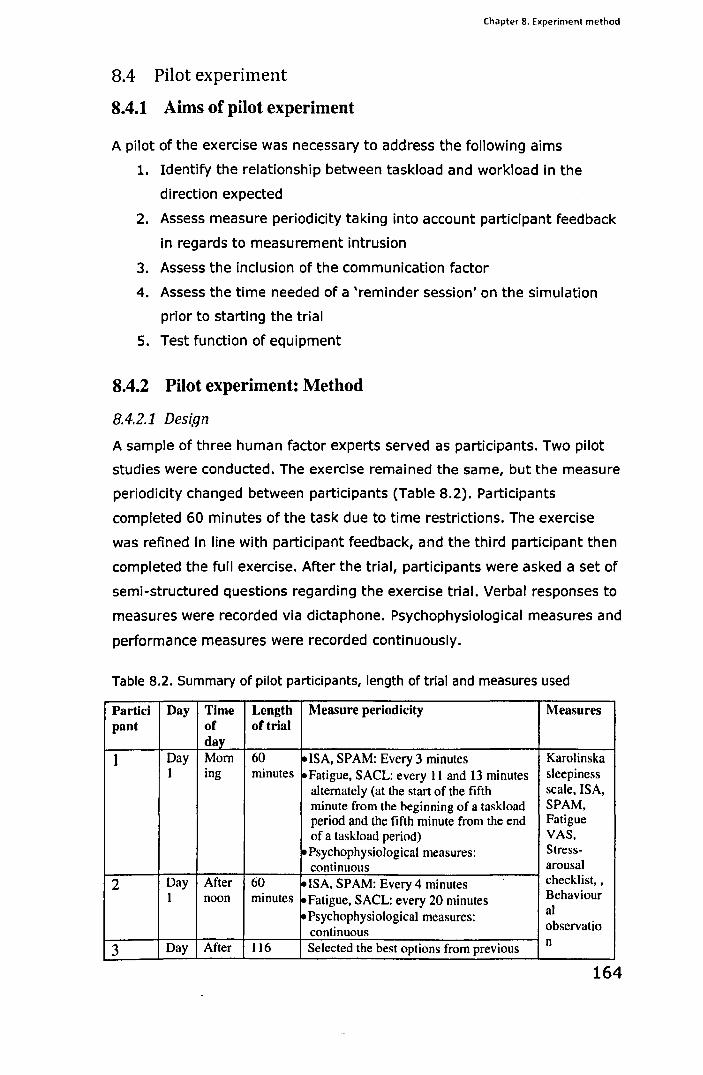
Chapter 8. Experiment method
8.4 Pilot experiment
8.4.1 Aims of pilot experiment
A pilot of the exercise was necessary to address the following aims
1. Identify the relationship between taskload and workload in the
direction expected
2. Assess measure periodicity taking into account participant feedback
in regards to measurement intrusion
3. Assess the inclusion of the communication factor
4. Assess the time needed of a 'reminder session' on the simulation
prior to starting the trial
5. Test function of equipment
8.4.2 Pilot experiment: Method
8.4.2.1 Design
A sample of three human factor experts served as participants. Two pilot
studies were conducted. The exercise remained the same, but the measure
periodicity changed between participants (Table 8.2). Participants
completed 60 minutes of the task due to time restrictions. The exercise
was refined in line with participant feedback, and the third participant then
completed the full exercise. After the trial, participants were asked a set of
semi-structured questions regarding the exercise trial. Verbal responses to
measures were recorded via dictaphone. Psychophysiological measures and
performance measures were recorded continuously.
Table 8.2. Summary of pilot participants, length of trial and measures used
Partid Day Time Length Measure periodicity Measures pant of of trial
day
1 Day Morn 60 .ISA, SP AM: Every 3 minutes Karolinska 1 ing minutes .Fatigue, SACL: every 11 and 13 minutes sleepiness
alternately (at the start of the fifth scale, ISA, minute from the beginning of a taskload SPAM, period and the fifth minute from the end Fatigue of a taskload period) VAS,
• Psychophysiological measures: Stress-continuous arousal
2 Day After 60 ~ ISA, SPAM: Every 4 minutes checklist, ,
1 noon minutes ~Fatigue, SACL: every 20 minutes Behaviour
~ Psychophysiological measures: al
continuous observatio
3 Day After 116 Selected the best options from previous n
164
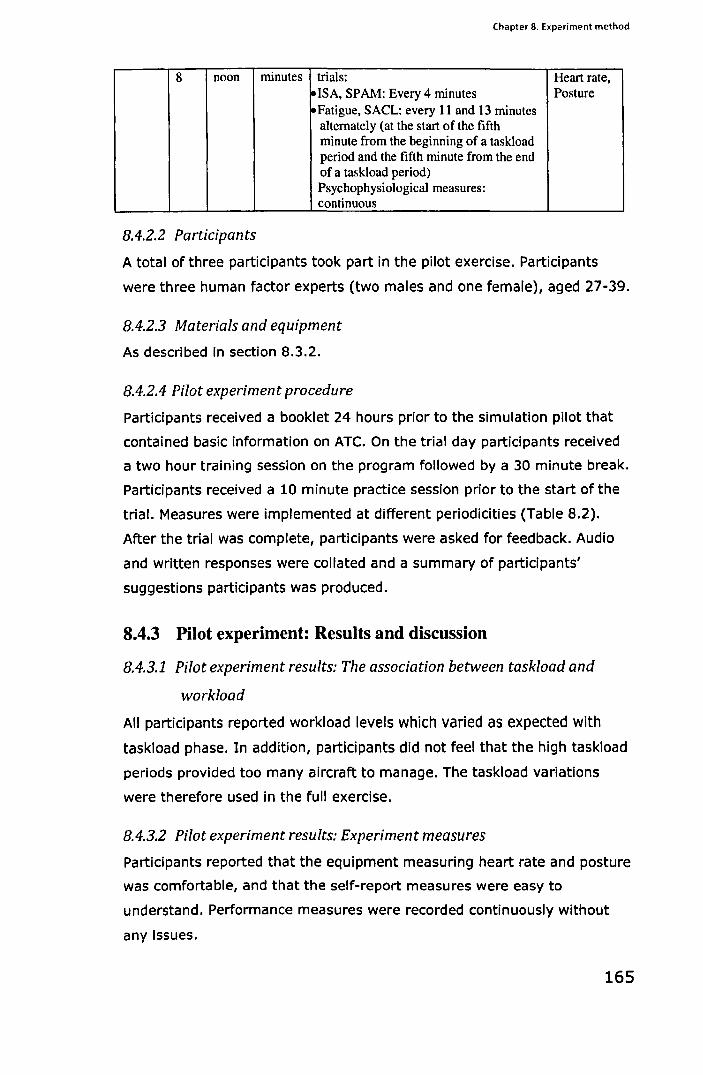
Chapter 8. Experiment method
8 noon minutes trials: Heart rate, -ISA, SPAM: Every 4 minutes Posture -Fatigue, SACL: every 11 and 13 minutes
alternately (at the start of the fifth minute from the beginning of a taskload period and the fifth minute from the end of a taskload period) Psychophysiological measures: continuous
8.4.2.2 Participants
A total of three participants took part in the pilot exercise. Participants
were three human factor experts (two males and one female), aged 27-39.
8.4.2.3 Materials and equipment
As described in section 8.3.2.
8.4.2.4 Pilot experiment procedure
Participants received a booklet 24 hours prior to the simulation pilot that
contained basic information on ATe. On the trial day participants received
a two hour training session on the program followed by a 30 minute break.
Participants received a 10 minute practice session prior to the start of the
trial. Measures were implemented at different periodicities (Table 8.2).
After the trial was complete, participants were asked for feedback. Audio
and written responses were collated and a summary of participants'
suggestions participants was produced.
8.4.3 Pilot experiment: Results and discussion
8.4.3.1 Pilot experiment results: The association between taskload and
workload
All participants reported workload levels which varied as expected with
taskload phase. In addition, participants did not feel that the high taskload
periods provided too many aircraft to manage. The taskload variations
were therefore used in the full exercise.
8.4.3.2 Pilot experiment results: Experiment measures
Participants reported that the equipment measuring heart rate and posture
was comfortable, and that the self-report measures were easy to
understand. Performance measures were recorded continuously without
any issues.
165
Chapter 8. Experiment method
8.4.3.3 Pilot experiment results: Measurement periodicity
The first participant felt that asking for ISA and SPAM measures every 3
minutes disrupted concentration, and reported that it was difficult to re
engage with the exercise due to an expectation of the next question. The
participant felt that the periodicity of fatigue and SACL was appropriate.
The second participant reported that the ISA and SPAM measures every 4
minutes were acceptable. The participant stated that although it was a
slight distraction, the period between the questions provided time to
reengage with the exercise. Regarding the frequency of fatigue and SACL
measures, the participant reported that it would be feasible to increase the
periodicity without creating a distraction. Based on this feedback, the third
participant was issued with the ISA and SPAM measures every 4 minutes
and the fatigue and SACL measures every 11 and 13 minutes alternately.
The participant reported that they did not feel distracted by the measures
and recommended that the periodicity be applied in future trials.
8.4.3.4 Pilot experiment results: Verbal communications
All participants reported that when using verbal communications with
'pilots' as well as inputting instructions via computer, they found
themselves focusing on the verbal Instructions and phraseology rather the
actual task. One participant stated that s/he felt that performance was
suffering because s/he had to concentrate on remembering the correct
phraseology. It was a concern that the added demand of communication
would reduce performance measures. Relationships between performance
and associated factors could not then be determined. Therefore, verbal
communications were not considered in the full experimental trial and were
not measured.
8.4.4 Conclusions
The pilot trials indicated that manipulated taskload was associated with
self-reported workload in the expected direction. High taskload periods,
although demanding, were manageable. Self-report measures were
acceptable to participants and easy to use. However, feedback also
influenced exercise design changes. The measure periodicity was selected
to be every 4 minutes for ISA and SPAM and the 5th minute Into the
taskload period and 5 minutes before the end of the taskload period for
166
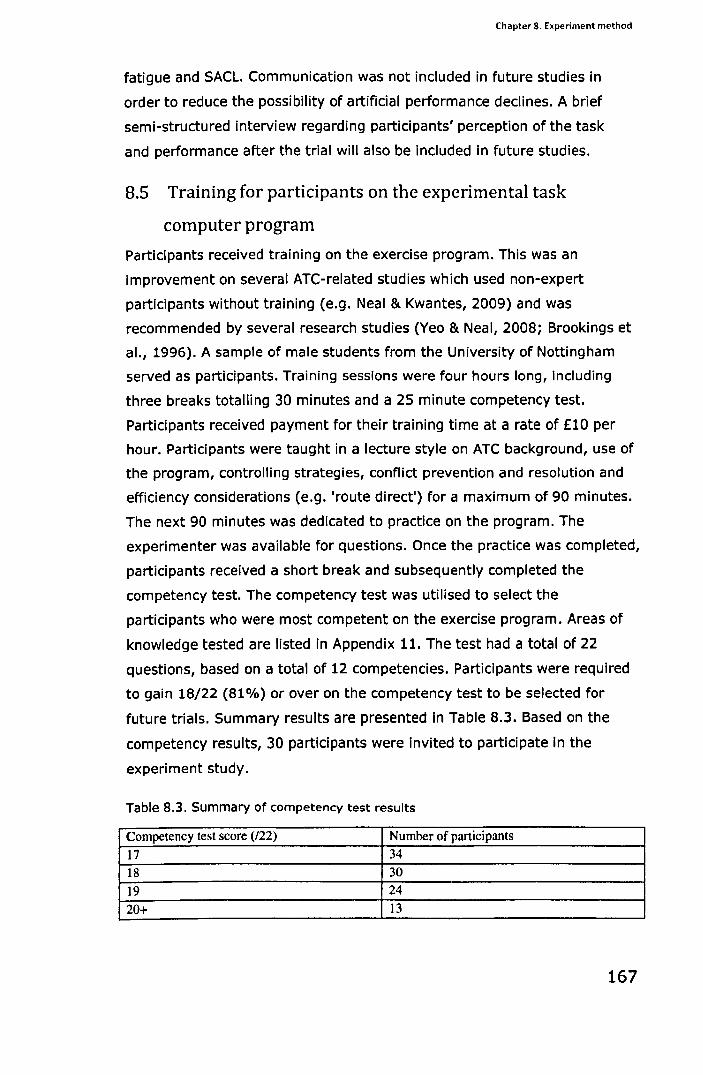
Chapter 8. E~periment method
fatigue and SACL. Communication was not included in future studies in
order to reduce the possibility of artificial performance declines. A brief
semi-structured interview regarding participants' perception of the task
and performance after the trial will also be included in future studies.
8.S Training for participants on the experimental task
computer program
Participants received training on the exercise program. This was an
improvement on several ATe-related studies which used non-expert
participants without training (e.g. Neal & Kwantes, 2009) and was
recommended by several research studies (Yeo & Neal, 2008; Brookings et
al., 1996). A sample of male students from the University of Nottingham
served as partiCipants. Training sessions were four hours long, including
three breaks totalling 30 minutes and a 25 minute competency test.
Participants received payment for their training time at a rate of £10 per
hour. PartiCipants were taught in a lecture style on ATC background, use of
the program, controlling strategies, conflict prevention and resolution and
efficiency considerations (e.g. 'route direct') for a maximum of 90 minutes.
The next 90 minutes was dedicated to practice on the program. The
experimenter was available for questions. Once the practice was completed,
participants received a short break and subsequently completed the
competency test. The competency test was utilised to select the
participants who were most competent on the exercise program. Areas of
knowledge tested are listed In Appendix 11. The test had a total of 22
questions, based on a total of 12 competencies. Participants were required
to gain 18/22 (81 %) or over on the competency test to be selected for
future trials. Summary results are presented In Table 8.3. Based on the
competency results, 30 participants were invited to partiCipate in the
experiment study.
Table 8.3. Summary of competency test results
Competency test score (/22) Number of participants
17 34
18 30
19 24
20+ 13
167
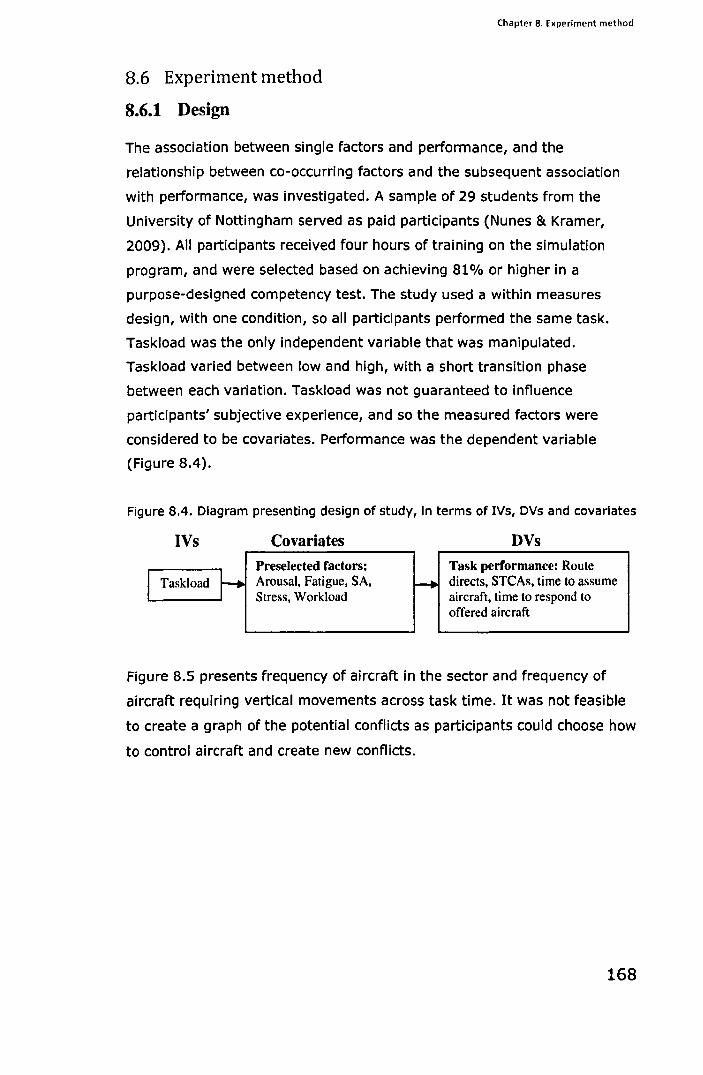
8.6 Experiment method
8.6.1 Design
Chapter 8. Experiment method
The association between single factors and performance, and the
relationship between co-occurring factors and the subsequent association
with performance, was investigated. A sample of 29 students from the
University of Nottingham served as paid participants (Nunes & Kramer,
2009). All participants received four hours of training on the simulation
program, and were selected based on achieving 81% or higher in a
purpose-designed competency test. The study used a within measures
design, with one condition, so all participants performed the same task.
Taskload was the only independent variable that was manipulated.
Taskload varied between low and high, with a short transition phase
between each variation. Taskload was not guaranteed to influence
participants' subjective experience, and so the measured factors were
considered to be covariates. Performance was the dependent variable
(Figure 8.4).
Figure 8.4. Diagram presenting design of study, in terms of IVs, DVs and covariates
IVs Covariates DVs Preselected factors: Task performance: Route I Taskload r-.. Arousal, Fatigue, SA, r-+ directs, STCAs, time to assume Stress, Workload aircraft, time to respond to
offered aircraft
Figure 8.5 presents frequency of aircraft in the sector and frequency of
aircraft requiring vertical movements across task time. It was not feasible
to create a graph of the potential conflicts as participants could choose how
to control aircraft and create new conflicts.
168
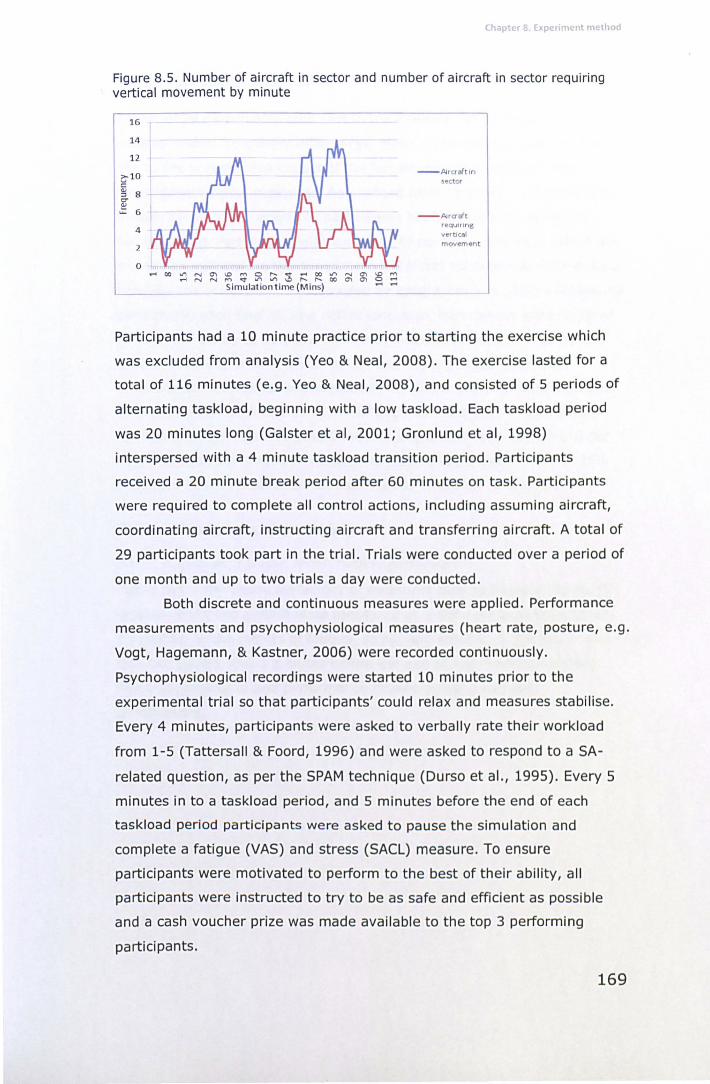
Chapter II. Experiment method
Figure 8.5. Number of aircraft in sector and number of aircraft in sector requiring vertical movement by minute
16
14
12
(;" 10 c: ~ 8 g-~ 6
4
2
o , rl ~ ~ ~ ~ ~ ~ ~ ~ ~ ~ ~ ~ ~ ~ ~ ~
Simul<lt iont ime (M ins) ........
- Aircraft In sector
- Aircraft requiring vertical movement
Participants had a 10 minute practice prior to starting the exercise which
was excluded from analysis (Yeo & Neal, 2008). The exercise lasted for a
total of 116 minutes (e.g. Yeo & Neal, 2008), and consisted of 5 periods of
alternating taskload, beginning with a low taskload. Each taskload period
was 20 minutes long (Galster et ai, 2001; Gronlund et ai, 1998)
interspersed with a 4 minute taskload transition period. Participants
received a 20 minute break period after 60 minutes on task. Participants
were required to complete all control actions, including assuming aircraft,
coordinating aircraft, instructing aircraft and transferring aircraft. A total of
29 participants took part in the trial. Trials were conducted over a period of
one month and up to two trials a day were conducted.
Both discrete and continuous measures were applied. Performance
measurements and psychophysiological measures (heart rate, posture, e.g.
Vogt, Hagemann, & Kastner, 2006) were recorded continuously.
Psychophysiological recordings were started 10 minutes prior to the
experimental trial so that participants' could relax and measures stabilise.
Every 4 minutes, participants were asked to verbally rate their workload
from 1-5 (Tattersall & Foord, 1996) and were asked to respond to a SA
related question, as per the SPAM technique (Durso et aI., 1995). Every 5
minutes in to a taskload period, and 5 minutes before the end of each
taskload period participants were asked to pause the simulation and
complete a fatigue (VAS) and stress (SACL) measure. To ensure
participants were motivated to perform to the best of their ability, all
participants were instructed to try to be as safe and efficient as possible
and a cash voucher prize was made available to the top 3 performing
participants.
169
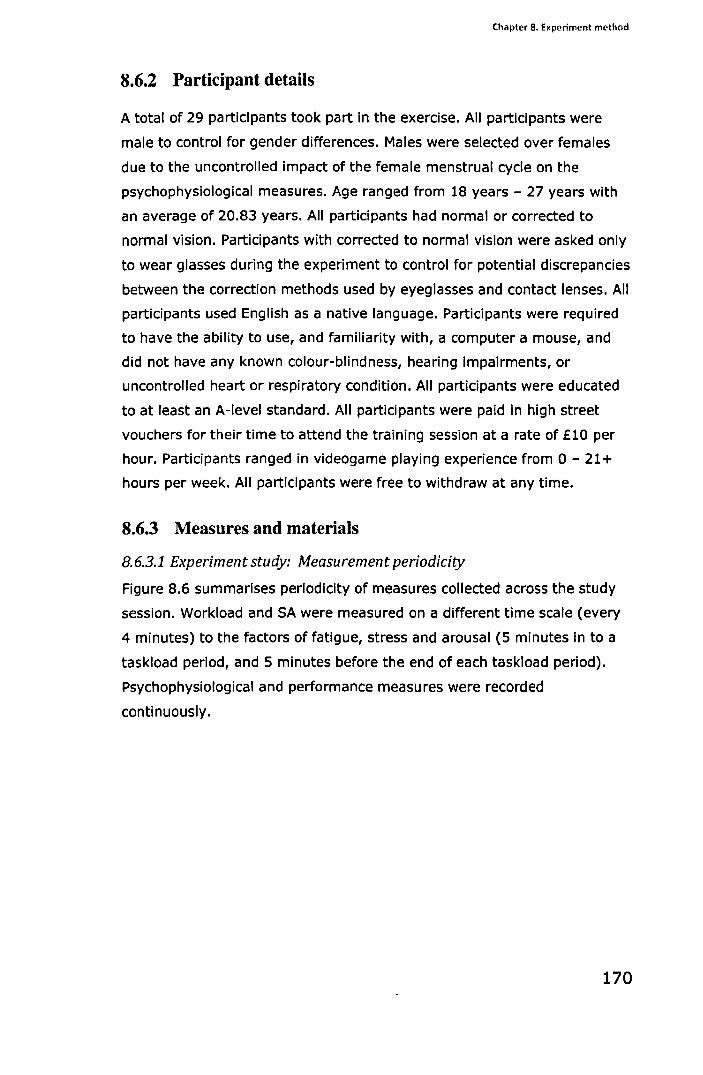
Chapter 8. Experiment method
8.6.2 Participant details
A total of 29 participants took part in the exercise. All participants were
male to control for gender differences. Males were selected over females
due to the uncontrolled impact of the female menstrual cycle on the
psychophysiological measures. Age ranged from 18 years - 27 years with
an average of 20.83 years. All participants had normal or corrected to
normal vision. Participants with corrected to normal vision were asked only
to wear glasses during the experiment to control for potential discrepancies
between the correction methods used by eyeglasses and contact lenses. All
participants used English as a native language. Participants were required
to have the ability to use, and familiarity with, a computer a mouse, and
did not have any known colour-blindness, hearing impairments, or
uncontrolled heart or respiratory condition. All participants were educated
to at least an A-level standard. All participants were paid in high street
vouchers for their time to attend the training session at a rate of £10 per
hour. Participants ranged in videogame playing experience from 0 - 21+
hours per week. All participants were free to withdraw at any time.
8.6.3 Measures and materials
8.6.3.1 Experiment study: Measurement periodicity
Figure 8.6 summarises periodicity of measures collected across the study
session. Workload and SA were measured on a different time scale (every
4 minutes) to the factors of fatigue, stress and arousal (5 minutes in to a
taskload period, and 5 minutes before the end of each taskload period).
Psychophysiological and performance measures were recorded
continuously.
170
Figure 8.6. Measure periodicity per 4 minute interval
Fatig Fatig Fatig Fatig ue ue ue ue VAS VAS VAS VAS SAC SAC SAC SAC
4 12 20 28 36 44 --Stan of trial: Karolinska scale
Continuous measures:
Fatig ue VAS SAC
,,?
HR Posture
Fatig ue VAS SAC
60 68
----v--ISA and SPAM every 4 minllrrco
Fatig ue VAS SAC
76
8.6.4 Experiment study: Measures
Chapter 8. Experiment method
Fatig Fatig Fatig ue ue ue VAS VAS VAS SAC SAC SAC
II
84 92 100 104 L
8.6.4.1 Instantaneous self assessment (lSA) of workload
The instantaneous self assessment (ISA) of workload is a quick and
efficient measure, initially developed for use in an ATC context
(Eurocontrol, 2002). The participant is required to provide a verbal rating
of perceived workload from 1 (very low) to 5 (very high). To increase the
sensitivity of the measure, participants were permitted to respond in
increments of 0.5. Each whole number was anchored with a description: 1.
Under-utilised, 2. Relaxed, 3. Comfortable, 4. High,S. Excessive.
8.6.4.2 Karolinska sleepiness scale
The Karolinska sleepiness scale consists of a 7 point scale, with descriptive
anchors at associated with alternate numbers, from 'extremely alert' to
'extremely sleepy'. The scale assessed self-reported sleepiness prior to
beginning the exercise.
8.6.4.3 Fatigue visual analogue scale
The measure used a 100mm horizontal line (Lee, Hicks, Nino-MurCia 1990)
with one anchor at each end, from 'not at all fatigued' to 'extremely
fatigued'.
171
Chapter 8. Experiment method
8.6.4.4 Stress Arousal Checklist (Mackay et al., 1978).
The stress-arousal checklist (SACL) consists of 30 adjectives, 18 relating to
stress and 12 relating to arousal. Of the 18 stress adjectives, 10 items are
phrased positively (i.e. bothered) and 8 negatively (I.e. peaceful). Of the
12 arousal-related adjectives, 7 are phrased positively (i.e. alert) and 5 are
phrased negatively (i.e. idle). All negatively phrased adjectives are
reversed-scored. Participants respond on a four-point Likert scale.
8.6.4.5 Situation present assessment method (SPAM) (Durso et al., 1995)
SPAM is a non-intrusive measure of SA, which is "a query technique that
[does] not have a memory component" (Durso et aI., 1998, p1). Seven
questions relevant to the exercise were constructed around the present
and future of the traffic situation. The questions were not randomly picked,
but instead pre-selected to be relevant to specific points in the exercise.
The traditional workload measure included within SPAM (by asking
participants to say when they are ready for the question) was not used, as
ISA was used to gain granularity of measurement. All participants had a
time limit of 20 seconds to answer the question, after which a non
response was recorded.
8.6.4.6 Performance measures
Performance measures of STCA frequency, route direct frequency, time to
respond to offered aircraft and time to assume aircraft were calculated
from an automatically generated program log.
8.6.5 Materials
A standardized brief, screening questionnaire, consent form and
demographic questionnaire were used prior to the start of the experimental
trial. At the end of the trial, participants received a debrief which contained
the researchers' contact information in case of any further questions. An
observation checklist recorded frequencies of participants' observable
behaviour. Participants were not aware of the checklist.
172
Chapter 8. Experiment method
8.6.6 Equipment
The following equipment was used in the experiment trial:
A London Control simulation program and bespoke exercise program both
by DM Aviation (2008).
A 'Stone' desktop computer and monitor running the exercise program.
Inputs and outputs were a keyboard, mouse and Logitech wired speakers.
A second 'Stone' desktop monitor, connected with the participants' screen,
for the researcher to monitor participants' actions on the simulation
program.
Three Sony Handy Cams to record participants' performance and
behaviours from different angles
A Logitech webcam to record participants' facial expressions
A Sony Viao laptop with Microsoft Excel 2007 program which recorded
participants' verbal responses to measures
A Samsung laptop used to record wireless physiological data
A BIOPAC Bio Harness™ Physiology Monitoring System (Bio systems),
including a bio harness chest strap (part number RXCHESTSTRAP) wireless
transmitter and AcqKnowledge for Bio Harness (Application Software)
version 3.9
A stopwatch for accurate timing of measure administration
Figure 8.7 and Figure 8.8 present the experimental set-up and position of
equipment, from the researcher's view (Figure 8.7) and the participants'
view (Figure 8.8).
173
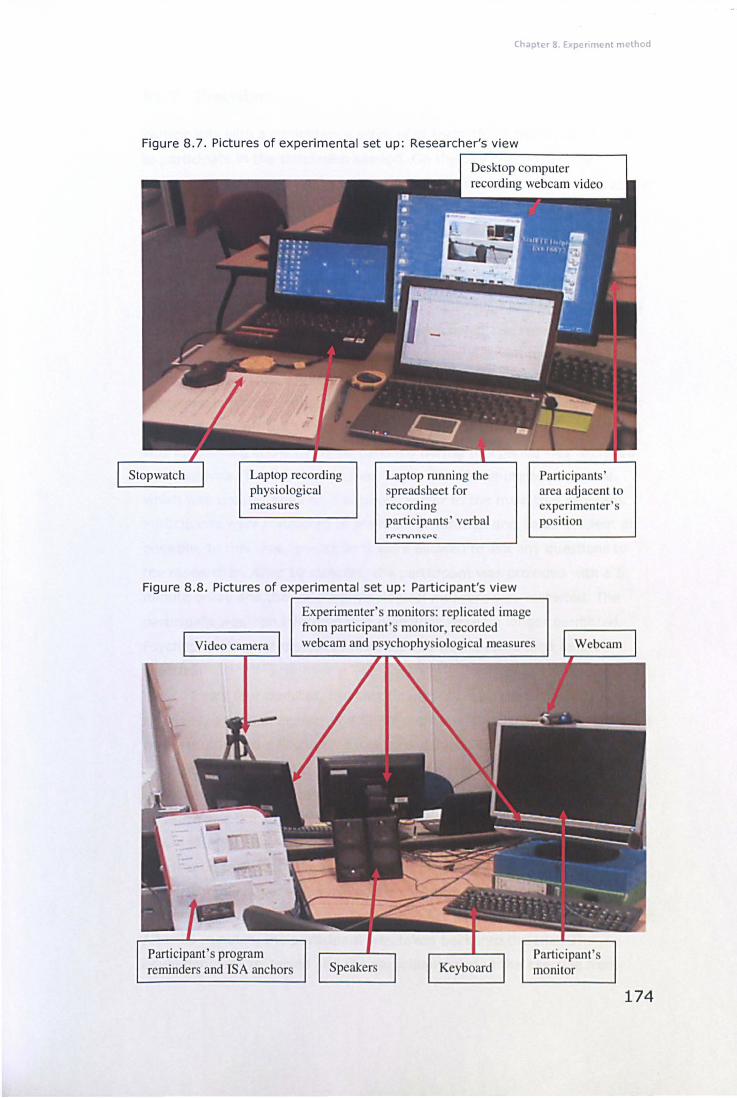
Chapter 8 . bperiment method
Figure 8.7. Pictures of experimental set up: Researcher's view r--------------------,
Desktop computer recording webcam video
measures
Laptop running the preadsheet for
recording participants'verbal
Figure 8.8. Pictures of experimental set up: Participant's view
Experimenter' monitor : replicated image from participant's monitor, recorded
Video camera webcam and psychophysiological mea ures
Participant's program
Participant' area adjacent 10
experimenter's position
reminders and TSA anchors monitor
174
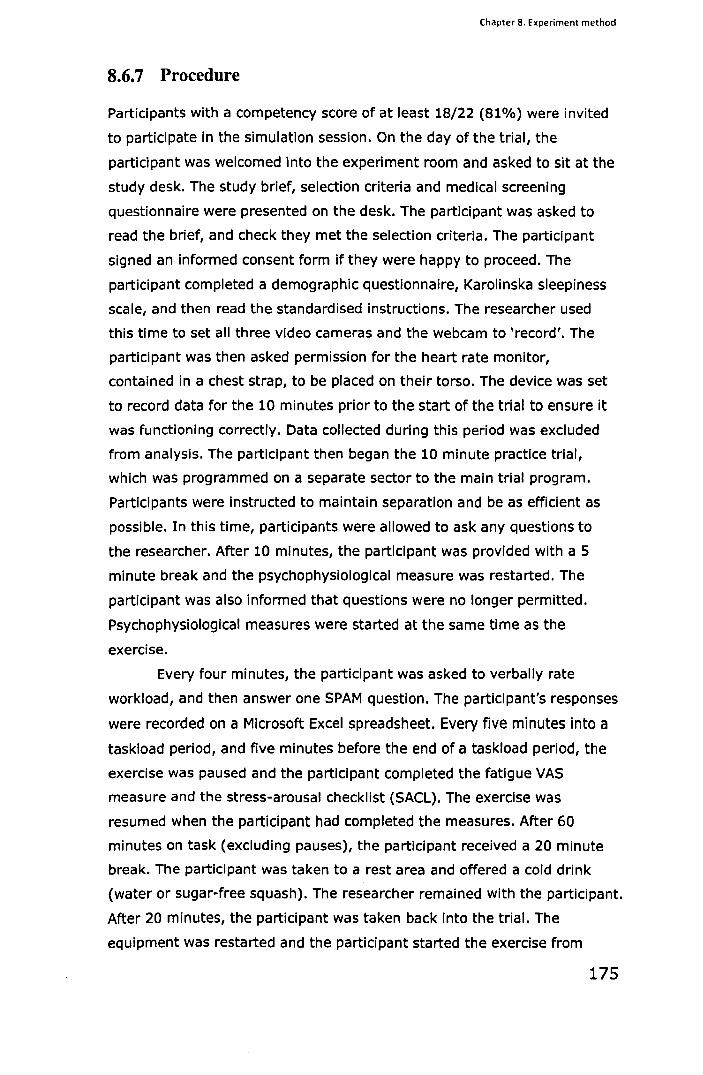
Chapter 8. Experiment method
8.6.7 Procedure
Participants with a competency score of at least 18/22 (81%) were invited
to participate in the simulation session. On the day of the trial, the
participant was welcomed into the experiment room and asked to sit at the
study desk. The study brief, selection criteria and medical screening
questionnaire were presented on the desk. The participant was asked to
read the brief, and check they met the selection criteria. The participant
signed an informed consent form if they were happy to proceed. The
participant completed a demographic questionnaire, Karolinska sleepiness
scale, and then read the standardised instructions. The researcher used
this time to set all three video cameras and the webcam to 'record'. The
participant was then asked permission for the heart rate monitor,
contained in a chest strap, to be placed on their torso. The device was set
to record data for the 10 minutes prior to the start of the trial to ensure it
was functioning correctly. Data collected during this period was excluded
from analysis. The participant then began the 10 minute practice trial,
which was programmed on a separate sector to the main trial program.
Participants were instructed to maintain separation and be as efficient as
possible. In this time, participants were allowed to ask any questions to
the researcher. After 10 minutes, the participant was provided with a 5
minute break and the psychophysiological measure was restarted. The
participant was also informed that questions were no longer permitted.
Psychophysiological measures were started at the same time as the
exercise.
Every four minutes, the participant was asked to verbally rate
workload, and then answer one SPAM question. The participant's responses
were recorded on a Microsoft Excel spreadsheet. Every five minutes Into a
taskload period, and five minutes before the end of a taskload period, the
exercise was paused and the participant completed the fatigue VAS
measure and the stress-arousal checklist (SACL). The exercise was
resumed when the participant had completed the measures. After 60
minutes on task (excluding pauses), the participant received a 20 minute
break. The participant was taken to a rest area and offered a cold drink
(water or sugar-free squash). The researcher remained with the participant.
After 20 minutes, the participant was taken back into the trial. The
equipment was restarted and the participant started the exercise from
175
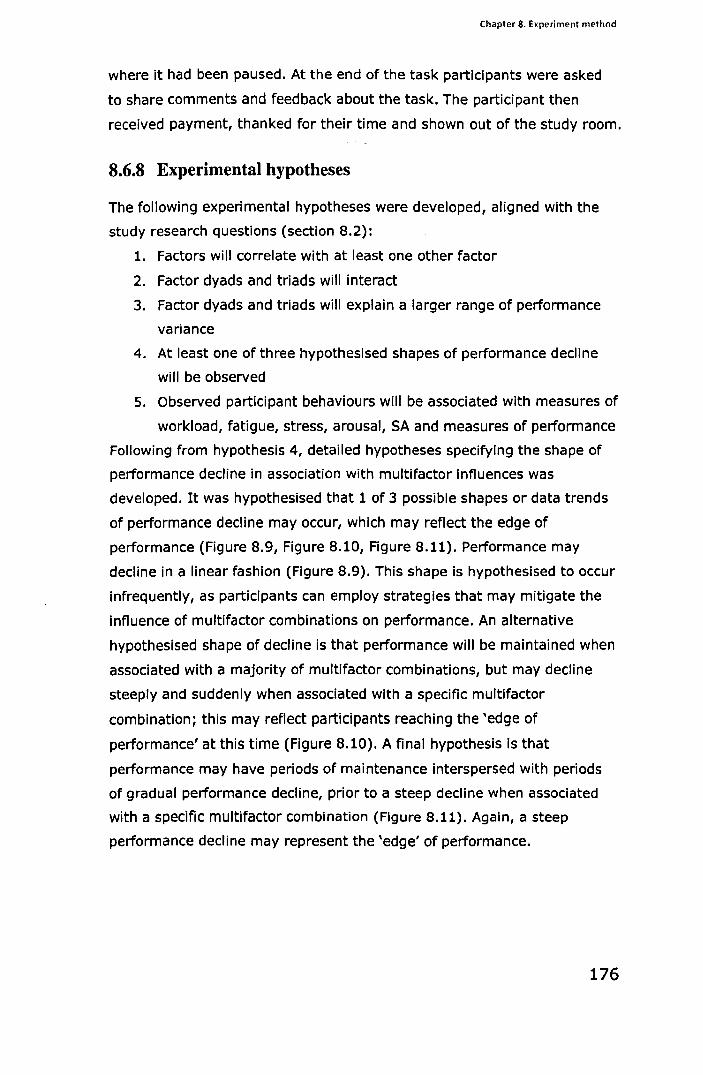
Chapter 8. Experiment method
where it had been paused. At the end of the task participants were asked
to share comments and feedback about the task. The participant then
received payment, thanked for their time and shown out of the study room.
8.6.8 Experimental hypotheses
The following experimental hypotheses were developed, aligned with the
study research questions (section 8.2):
1. Factors will correlate with at least one other factor
2. Factor dyads and triads will interact
3. Factor dyads and triads will explain a larger range of performance
variance
4. At least one of three hypothesised shapes of performance decline
will be observed
S. Observed participant behaviours will be associated with measures of
workload, fatigue, stress, arousal, SA and measures of performance
Following from hypothesis 4, detailed hypotheses specifying the shape of
performance decline in association with multifactor Influences was
developed. It was hypothesised that 1 of 3 possible shapes or data trends
of performance decline may occur, which may reflect the edge of
performance (Figure 8.9, Figure 8.10, Figure 8.11). Performance may
decline in a linear fashion (Figure 8.9). This shape is hypothesised to occur
infrequently, as participants can employ strategies that may mitigate the
influence of multifactor combinations on performance. An alternative
hypothesised shape of decline is that performance will be maintained when
associated with a majority of multifactor combinations, but may decline
steeply and suddenly when associated with a specific multifactor
combination; this may reflect participants reaching the 'edge of
performance' at this time (Figure 8.10). A final hypothesis Is that
performance may have periods of maintenance interspersed with periods
of gradual performance decline, prior to a steep decline when associated
with a speCific multifactor combination (Figure 8.11). Again, a steep
performance decline may represent the 'edge' of performance.
176
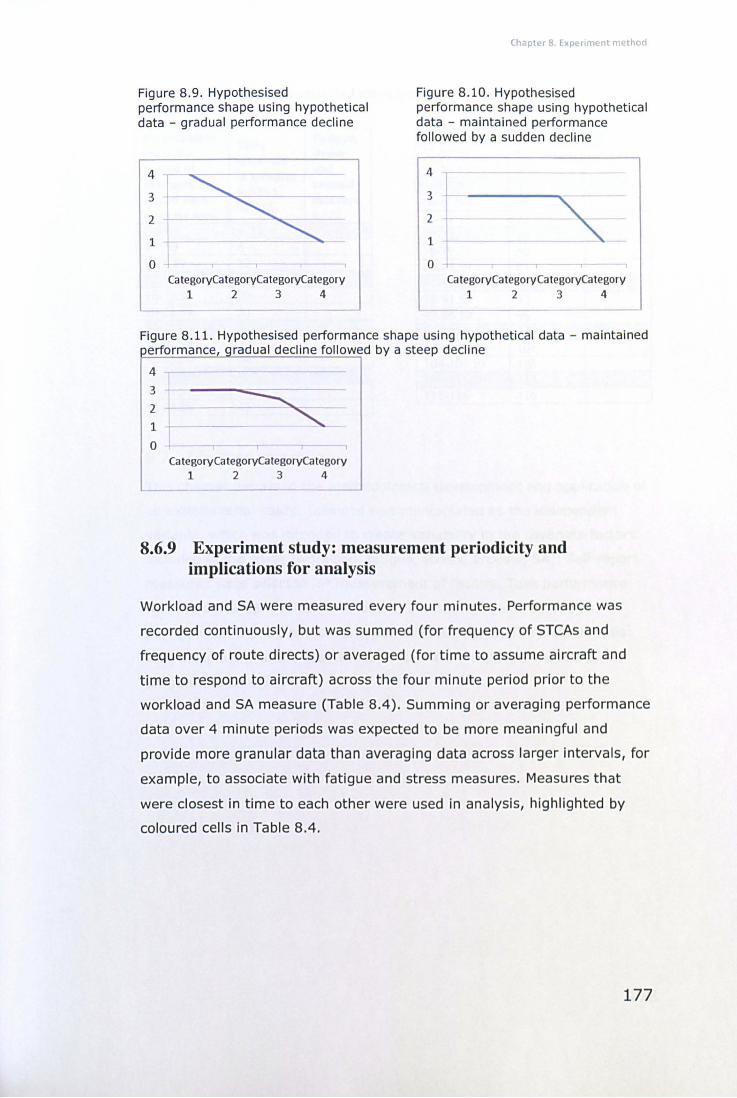
Figure 8.9. Hypothesised performance shape using hypothetical data - gradual performance decline
4
3
2
1
o T
categoryCa tegoryCategoryCategory 1 23 4
Chapter 8. Experiment method
Figure 8.10. Hypothesised performance shape using hypothetical data - maintained performance followed by a sudden decline
4
3
2
1
o Ca tegoryCategoryca tegorycategory
1 2 3 4
Figure 8.11. Hypothesised performance shape using hypothetical data - maintained erformance radual decline followed by a steep decline
4
o ca tegoryCategoryCategoryca tegory
1 23 4
8.6.9 Experiment study: measurement periodicity and implications for analysis
Workload and SA were measured every four minutes. Performance was
recorded continuously, but was summed (for frequency of STCAs and
frequency of route directs) or averaged (for time to assume aircraft and
time to respond to aircraft) across the four minute period prior to the
workload and SA measure (Table 8.4). Summing or averaging performance
data over 4 minute periods was expected to be more meaningful and
provide more granular data than averaging data across larger intervals, for
example, to associate with fatigue and stress measures. Measures that
were closest in time to each other were used in analysis, highlighted by
coloured cells in Table 8.4.
177
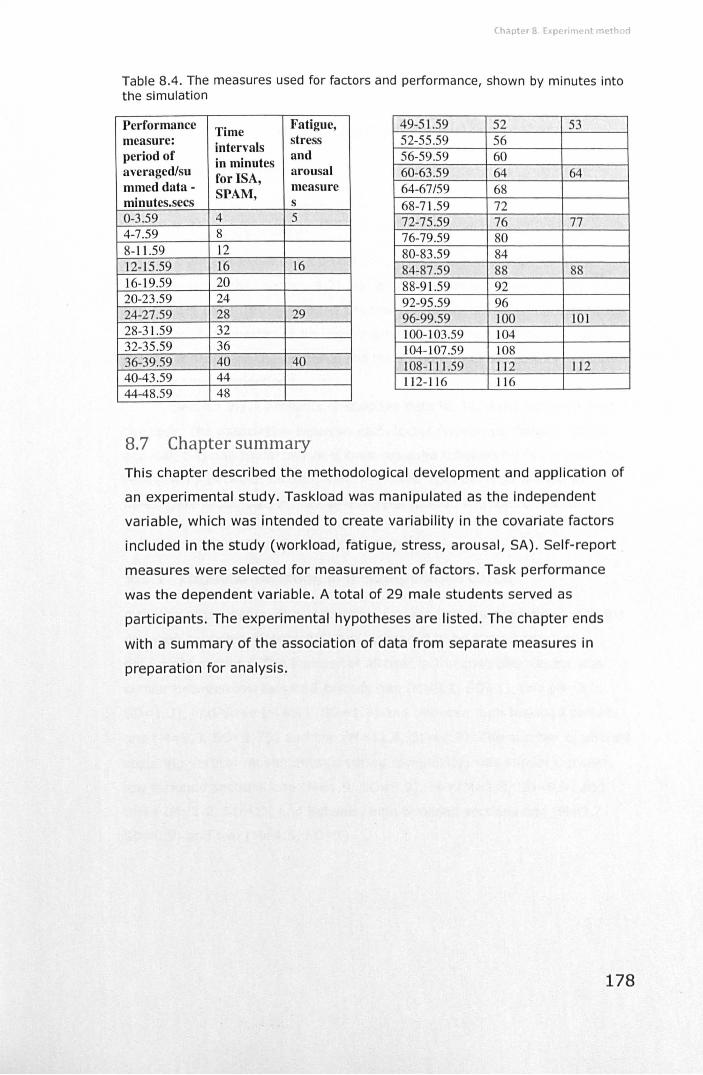
Chapter 8 Experiml'nt method
Table 8.4. The measures used for factors and performance, shown by minutes into the simulation
Performance Time Fatigue,
measure: intervals stress
period of in minutes and
averaged/su for ISA, arousal
mmed data- SPAM, measure
minutes.sees s
49-51.59 52 53 52-55 .59 56 56-59.59 60 60-63.59 64 64 64-67/59 68 68-71.59 72
0-3.59 4 5 72-75 .59 76 77 4-7.59 8 76-79.59 80 8-11.59 12 80-83.59 84 12-15 .59 16 16 84-87 .59 88 88 16-19.59 20 88-91.59 92 20-23.59 24 92-95 .59 96 24-27.59 28 29 96-99.59 100 101 28-31 .59 32 100-103.59 104 32-35.59 36 104-107.59 108 36-39.59 40 40 108- L I ] .59 11 2 11 2 40-43.59 44 1 ]2- 116 116 44-48.59 48
8.7 Chapter summary
This chapter described the methodological development and application of
an experimenta l study. Taskload was manipulated as the independent
variable, which was intended to create variability in the covariate factors
included in the study (workload, fatigue, stress, arousal, SA). Self-report
measures were selected for measurement of factors. Task performance
was the dependent variable. A total of 29 male students served as
participants. The experimental hypotheses are listed. The chapter ends
with a summary of the association of data from separate measures in
preparation for analysis.
178
Chapter 9. Experiment results: Multiple factor relationships and associations with performance
Chapter 9. Experiment results: Multiple
factor relationships and associations with
performance
9.1 Chapter overview
Results from the experiment study are presented in the order of the
research questions (section 8.2) and associated hypotheses (section 8.6.8).
Figures are used throughout the chapter to provide a visual representation
of results. A discussion of findings is presented at the end of each results
section to facilitate the reader in the interpretation of the results in relation
to the research questions.
Section 9.2.1 presents descriptive data for taskload variance across
the task. The association between each factor (workload, fatigue, stress,
arousal, SA) and performance is then reported followed by findings of the
relationship between factor dyads. A median split analysis Is used to
investigate factor interactions and the association with performance.
9.2 Overview of experimental results
9.2.1 Taskload variation and manipulation check
A review of the descriptive statistics suggests that taskload did vary In the
direction expected (Figure 9.1) and appeared to be similar between
equivalent sections. The number of aircraft in the controlled sector was
similar between low taskload periods one (M=3.1, 50=1), two (M=3.2,
50=1.3), and three (M=3.1, 50=1.9) and between high taskload periods
one (M=9.3, 50=1.75) and two (M=l1.4, 50=1.9). The number of aircraft
requiring vertical movements (creating complexity) was similar between
low taskload sections one (M=1.9, 50=0.9), two (M=1.8, 50=0.9) and
three (M=1.2, 50=1), and between high taskload sections one (M=5.2,
50=0.9) and two (M=4.5, 50=1).
179
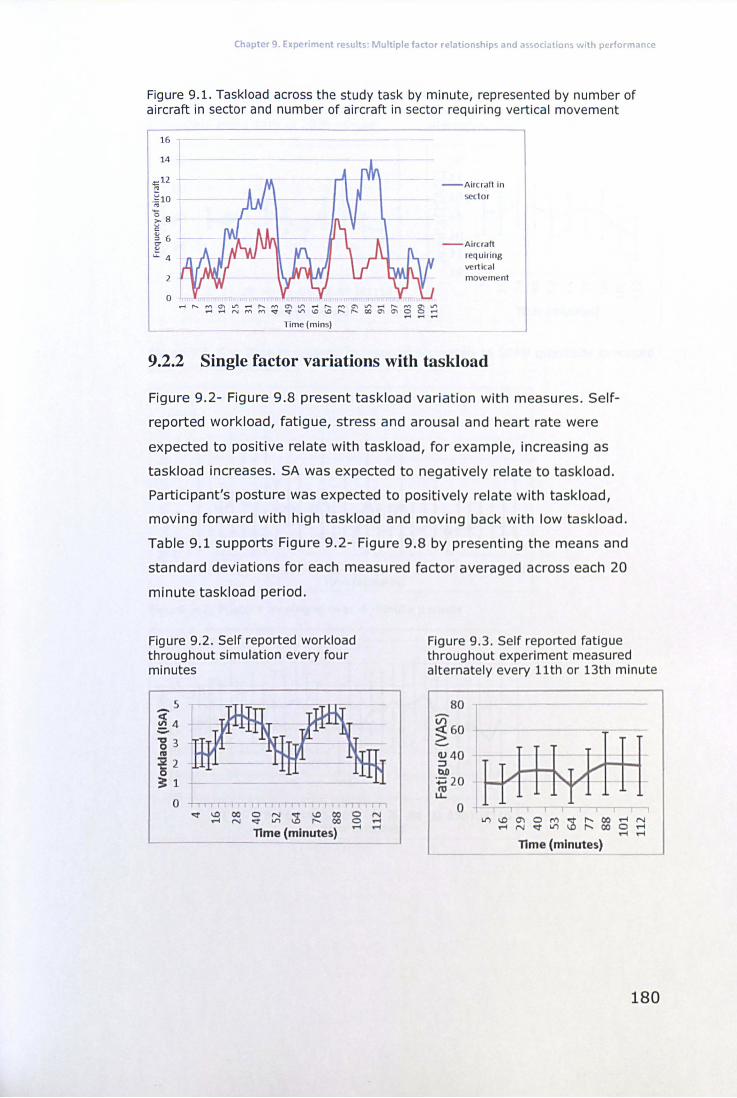
Chapter 9. Experiment results: Multiple factor relationships and associations with performance
Figure 9.1. Taskload across the study task by minute, represented by number of aircraft in sector and number of aircraft in sector requiring vertical movement
16
14
2
o
Time (mins)
- Airc rait in seclo r
- Aircraft req uir ing vertica l movem nt
9.2.2 Single factor variations with taskload
Figure 9.2- Figure 9 .8 present taskload variation with measures. Self
reported workload, fatigue, stress and arousal and heart rate were
expected to positive relate with taskload, for example, increasing as
taskload increases. SA was expected to negatively relate to taskload.
Participant's posture was expected to positively relate with taskload,
moving forward with high taskload and moving back with low taskload.
Table 9.1 supports Figure 9.2- Figure 9 .8 by presenting the means and
standard deviations for each measured factor averaged across each 20
minute taskload period.
Figure 9.2. Self reported workload throughout simulation every four minutes
Figure 9.3 . Self reported fatigue throughout experiment measured alternately every 11th or 13th minute
5
~ 4 .;.
"'8 3 "' ~ 2 ~ 1
o -t
~ ~ ~ ~ ~ ~ ~ ~ g ~ llme (minutes)
........
80
~60 (JJ 40 ::::J ~ ~20 .f!.
o
llme (minutes)
180
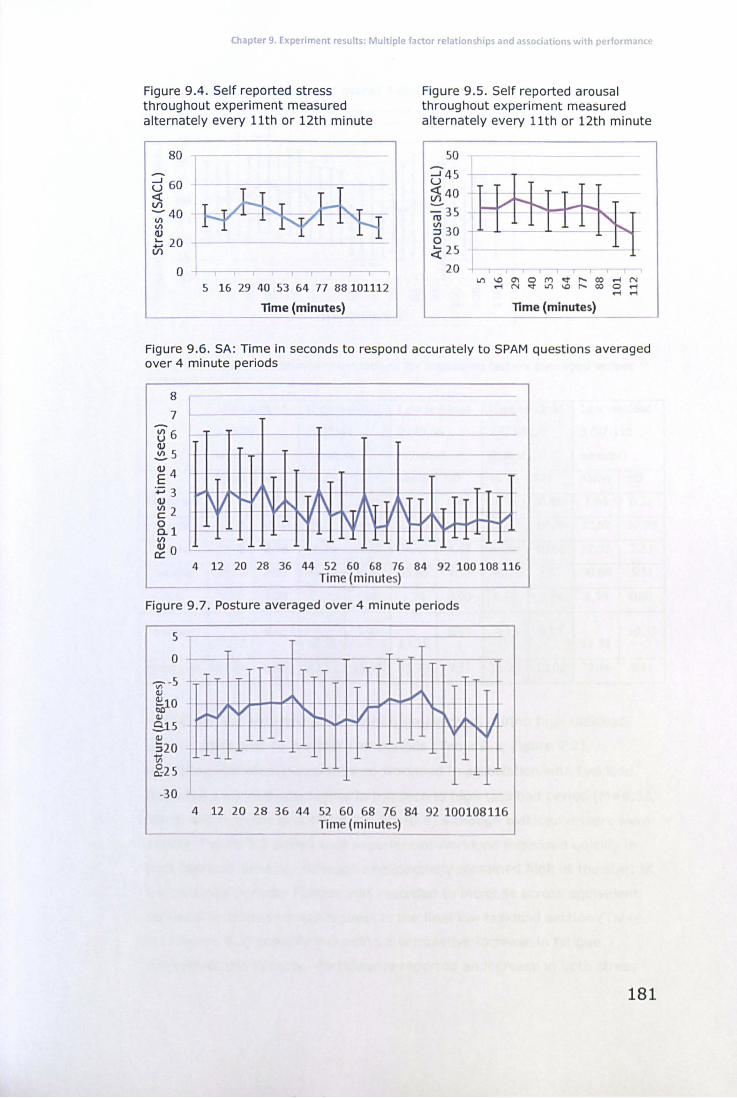
Chapter 9. Experiment results; Multiple factor relationships and associations with performance
Figure 9.4. Self reported stress throughout experiment measured alternately every 11th or 12th minute
Figure 9.5. Self reported arousal throughout experiment measured alternately every 11th or 12th minute
80 1-d 60 ;7i -; 40
<II QJ
L.. 20 I
Vi 0 1 5 16 29 40 53 64 77 88 101112
Time (minutes) L-________ _ ___ ~
50
::J 45 u ;7i 40
ro 35 ~ 30 o ~25
20
Time (minutes)
Figure 9.6. SA: Time in seconds to respond accurately to SPAM questions averaged over 4 minute periods
IH ------:;:;3 QJ
~2 8.1 (/)
~o 4 12 20 28 36 44 52 60 68 76 84 92 100 108 116
Time (minutes)
Figure 9.7. Posture averaged over 4 minute periods
-30 4 12 20 28 36 44 52 60 68 76 84 92 100108116
Time (minutes)
181
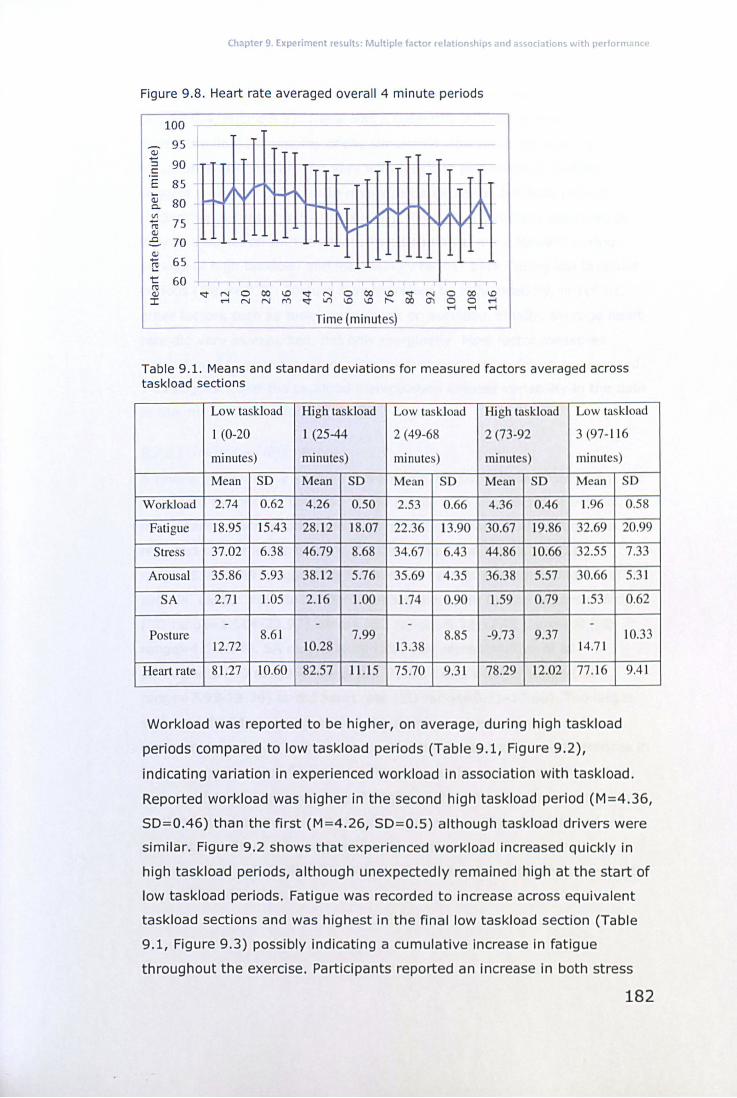
Chapter 9. Experiment results: Multiple factor relationships and associations with performance
Figure 9.B. Heart rate averaged overall 4 minute periods
Q) ..-:J c:: E '-Q) Co Vl ..-ro Q) .D
Q) ..-~ t ro Q)
:c
100
95
90
85
80
75
70
65
60 000\.0 \.0 \.0 ,....
Time (minutes)
Table 9.1. Means and standard deviations for measured factors averaged across taskload sections
Low taskload High task load Low task load High taskload Low taskload
I (0-20 I (25-44 2 (49-68 2 (73-92 3 (97- 116
minutes) minutes) minute) minutes) minute)
Mean SD Mean SO Mean SO Mean SD Mean SO
Workload 2.74 0.62 4.26 0.50 2.53 0.66 4.36 0.46 1.96 0.58
Fatigue 18.95 15.43 28.12 18.07 22.36 13.90 30.67 19.86 32.69 20.99
Stress 37.02 6.38 46.79 8.68 34.67 6.43 44.86 10.66 32.55 7.33
Arousal 35.86 5.93 38.12 5.76 35.69 4.35 36.38 5.57 30.66 5.3 1
SA 2.71 1.05 2.16 1.00 1.74 0.90 1.59 0.79 1.53 0.62
- - - -Po ture 8.61 7.99 8.85 -9.73 9.37 10.33
12.72 10.28 13.38 14.71
Heart rate 8 L.27 10.60 82.57 11.15 75 .70 9.31 78.29 12.02 77.16 9.41
Workload was reported to be higher, on average, during high taskload
periods compared to low taskload periods (Table 9.1, Figure 9.2),
indicating variation in experienced workload in association with taskload.
Reported workload was higher in the second high taskload period (M=4.36,
5D=0.46) than the first (M=4.26, 5D= 0.5) although taskload drivers were
similar. Figure 9.2 shows that experienced workload increased quickly in
high taskload periods, although unexpectedly remained high at the start of
low taskload periods. Fatigue was recorded to increase across equivalent
taskload sections and was highest in the final low taskload section (Table
9.1, Figure 9.3) possibly indicating a cumulative increase in fatigue
throughout the exercise. Participants reported an increase in both stress
182
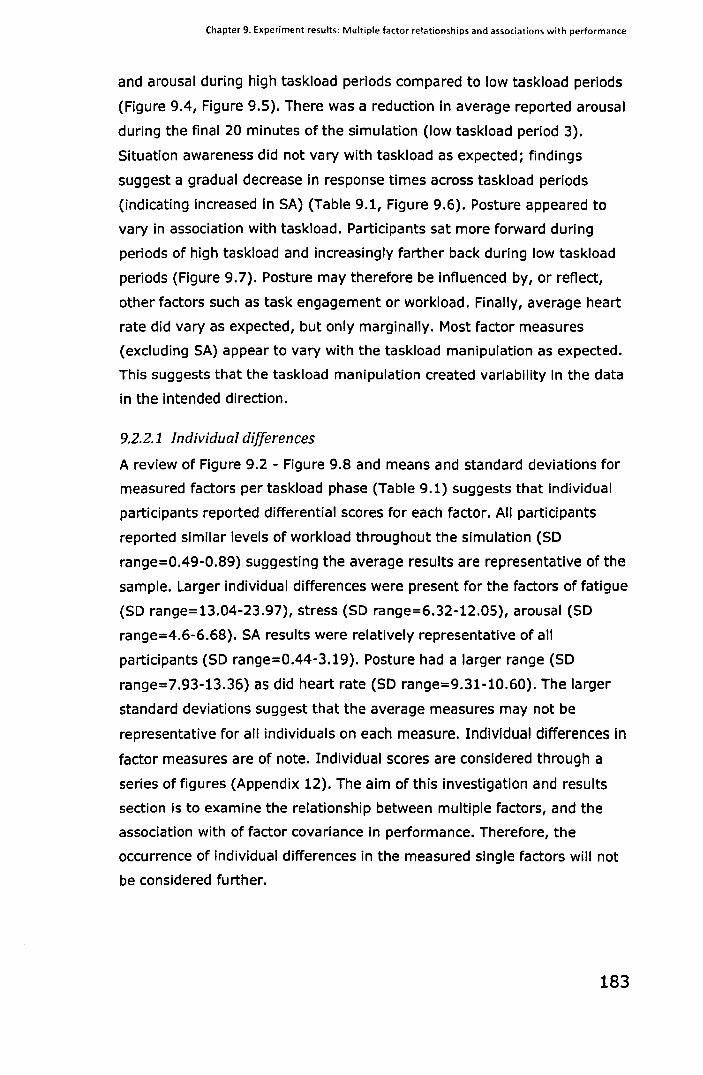
Chapter 9. Experiment results: Multiple factor relationships and associations with performance
and arousal during high taskload periods compared to low taskload periods
(Figure 9.4, Figure 9.5). There was a reduction in average reported arousal
during the final 20 minutes of the simulation (low taskload period 3).
Situation awareness did not vary with taskload as expected; findings
suggest a gradual decrease in response times across taskload periods
(indicating increased in SA) (Table 9.1, Figure 9.6). Posture appeared to
vary in association with taskload. Participants sat more forward during
periods of high taskload and increasingly farther back during low taskload
periods (Figure 9.7). Posture may therefore be influenced by, or reflect,
other factors such as task engagement or workload. Finally, average heart
rate did vary as expected, but only marginally. Most factor measures
(excluding SA) appear to vary with the taskload manipulation as expected.
This suggests that the taskload manipulation created variability In the data
in the intended direction.
9.2.2.1 Individual differences
A review of Figure 9.2 - Figure 9.8 and means and standard deviations for
measured factors per taskload phase (Table 9.1) suggests that Individual
participants reported differential scores for each factor. All participants
reported similar levels of workload throughout the simulation (SO
range=0.49-0.89) suggesting the average results are representative of the
sample. Larger individual differences were present for the factors of fatigue
(SO range=13.04-23.97), stress (SO range=6.32-12.0S), arousal (SO
range=4.6-6.68). SA results were relatively representative of all
participants (SO range=0.44-3.19). Posture had a larger range (SO
range=7.93-13.36) as did heart rate (SO range=9.31-10.60). The larger
standard deviations suggest that the average measures may not be
representative for all individuals on each measure. Individual differences In
factor measures are of note. Individual scores are considered through a
series of figures (Appendix 12). The aim of this investigation and results
section is to examine the relationship between multiple factors, and the
association with of factor covariance In performance. Therefore, the
occurrence of Individual differences in the measured single factors will not
be considered further.
183
Chapter 9. Experiment results: Multiple factor relationships and associations with performance
9.2.3 Discussion of taskload manipulation and measured factor variations across the study task
Findings show that taskload was manipulated as intended, with more
aircraft and higher complexity (more aircraft requiring vertical movements)
in the high taskload periods as compared to low taskload. Findings also
indicate that the self-reported factors of workload, fatigue, stress and
arousal also varied with taskload in the direction expected, suggesting that
the taskload manipulation did create variability in the data, and in the
intended direction. Posture and heart rate (HR) also varied with taskload in
the direction expected. Findings for the SA measure were unexpected;
response times to SA questions (indicating increased SA) decreased over
the study task. One interpretation of this finding is that SA may increase
with time on task. Alternatively, practice effects may have artificially
affected the measure. HR did not differ between taskload phases as much
as expected. Heart rate variability may have provided a more accurate
reflection of the data although this detailed analysis technique was outSide
the scope of this study. Heart rate will be discounted from further analyses
due to the limited variation in the data.
Reported workload rapidly increased between the first low taskload
and first high taskload periods (Figure 9.2). However, workload remained
relatively high even when taskload began to decline between minutes 28-
32. Workload after-effects generated from the high taskload period may
influence experienced workload even when taskload begins to decrease.
9.2.4 Performance across the study task
Figure 9.9 - Figure 9.12 present measures of performance averaged over 4
minutes across the period of the cognitive task. Short term conflict alerts
(STCAs), were expected to increase during the high taskload periods.
Conversely, route directs were expected to increase during periods of low
taskload when participants may not be preoccupied with safety concerns,
and decline In high taskload. Time to assume aircraft and time to respond
to offered aircraft were both expected to increase during periods of high
taskload due to the increase number of aircraft to control during these
periods.
184
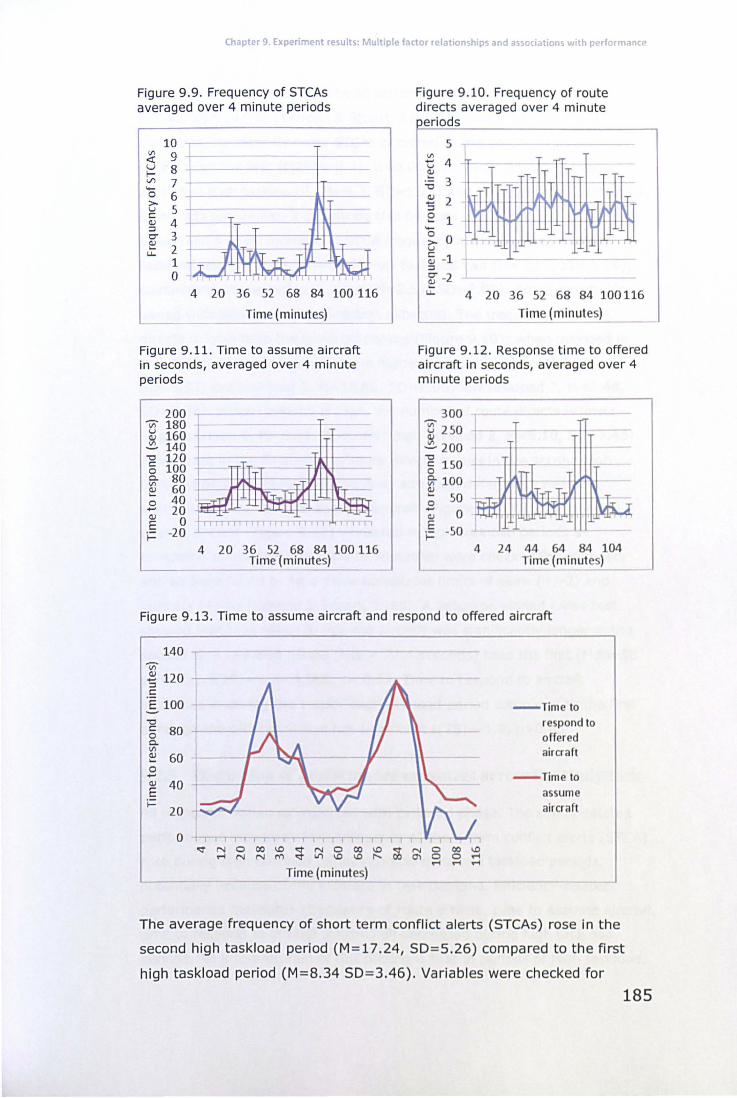
Chapter 9. Experiment results: Multiple factor relationships and associations with performance
Figure 9.9. Frequency of STCAs averaged over 4 minute periods
V)
<l: u f-V'l .... 0 >-u c: Q) ~ 0-~ u.
10 t-9 8 7 r 6 5 J-4 3 r 2 1 -' 0
4 20 36 52 68 84 100116
Time (minutes) ---
Figure 9.11. Time to assume aircraft in seconds, averaged over 4 minute periods
200 L v;- 180 -----u 160 Q)
~ 140 L "C 120 c: 100 0 Co 80 V)
60 ~ 0 40
+"' 20 Q) 0 E
t= -20 4 20 36 52 68 84 100116
Time (minutes)
Figure 9.10. Frequency of route directs averaged over 4 minute
eriods
5 V)
tJ 4 ~
"C 3
~ 2 ~
e 1 .... ~ a u ~ -1 :::l
g -2
r
... u. 4 20 36 52 68 84 100 116
Time (minutes)
Figure 9.12. Response time to offered aircraft in seconds, averaged over 4 minute periods
300 '5" 250 .! 200 "C
g 150 I ~ 100 ~ 50 o ~ 0 E t= -50
4 24 44 64 84 104 Time (minute )
Figure 9.13. Time to assume aircraft and respond to offered aircraft
140
1 v;-~ 120 :::l c: 'E 100 - Time to "C respond to c: 80 0 offered Co V) aircraft Q) 60 ... 0
- Time to +"' Q) 40 r E assume i=
20 aircraft
0 <:t N 0 00 1.0 <:t N 0 00 1.0 Cii N 0 00 1.0
.-t N N rf) <:t LI"l 1.0 1.0 I"- 0'1 0 0 .-t rl rl rl
Time (minutes)
The average frequency of short term conflict alerts (STCAs) rose in the
second high taskload period (M =17.24, SD=5.26) compared to the first
high taskload period (M=8.34 50= 3.46). Variables were checked for
185
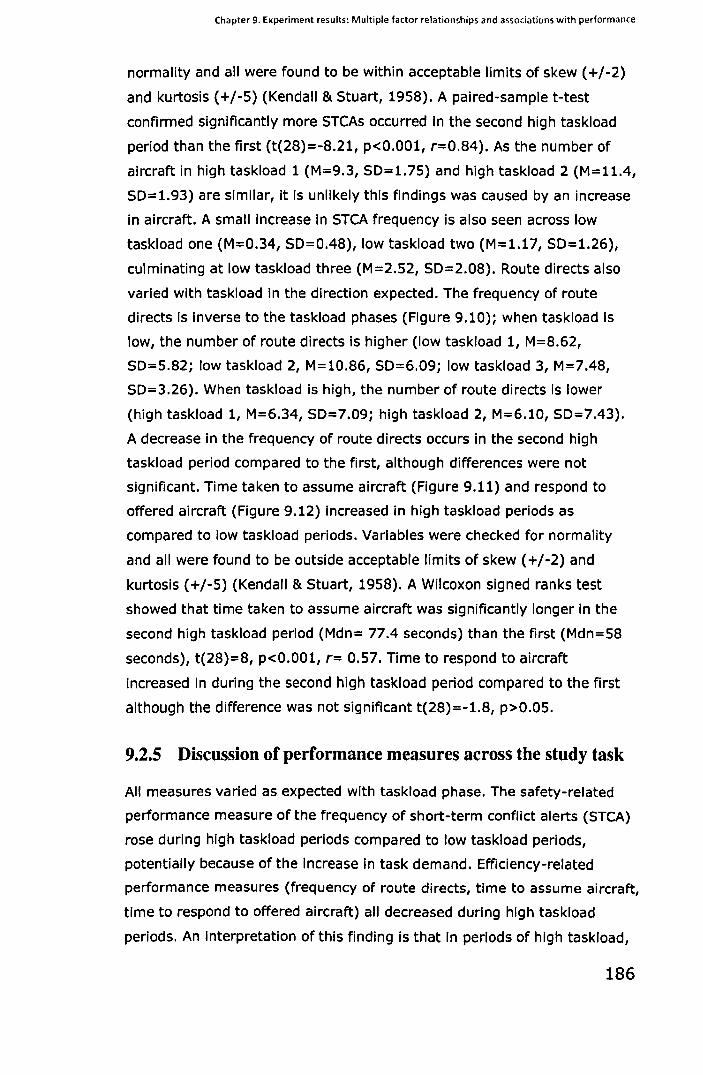
Chapter 9. Experiment results: Multiple factor relationships and associations with performance
normality and all were found to be within acceptable limits of skew (+/-2)
and kurtosis (+/-5) (Kendall & Stuart, 1958). A paired-sample t-test
confirmed significantly more 5TCAs occurred in the second high taskload
period than the first (t(28)=-8.21, p<O.OOl, r=0.84). As the number of
aircraft in high taskload 1 (M=9.3, 50=1.75) and high taskload 2 (M=11.4,
50=1.93) are similar, it is unlikely this findings was caused by an increase
in aircraft. A small increase in 5TCA frequency is also seen across low
taskload one (M=0.34, 50=0.48), low taskload two (M=1.17, 50=1.26),
culminating at low taskload three (M=2.52, 50=2.08). Route directs also
varied with taskload in the direction expected. The frequency of route
directs is inverse to the taskload phases (Figure 9.10); when taskload is
low, the number of route directs is higher (low taskload 1, M=8.62,
50=5.82; low taskload 2, M=10.86, 50=6.09; low taskload 3, M=7.48,
50=3.26). When taskload is high, the number of route directs is lower
(high taskload 1, M=6.34, 50=7.09; high taskload 2, M=6.10, 50=7.43).
A decrease in the frequency of route directs occurs in the second high
taskload period compared to the first, although differences were not
significant. Time taken to assume aircraft (Figure 9.11) and respond to
offered aircraft (Figure 9.12) increased in high taskload periods as
compared to low taskload periods. Variables were checked for normality
and all were found to be outside acceptable limits of skew (+/-2) and
kurtosis (+/-5) (Kendall & Stuart, 1958). A Wilcoxon signed ranks test
showed that time taken to assume aircraft was significantly longer in the
second high taskload period (Mdn= 77.4 seconds) than the first (Mdn=58
seconds), t(28)=8, p<O.OOl, r= 0.57. Time to respond to aircraft
increased in during the second high taskload period compared to the first
although the difference was not significant t(28)=-1.8, p>0.05.
9.2.5 Discussion of performance measures across the study task
All measures varied as expected with taskload phase. The safety-related
performance measure of the frequency of short-term conflict alerts (5TeA)
rose during high taskload periods compared to low taskload periods,
potentially because of the increase in task demand. Efficiency-related
performance measures (frequency of route directs, time to assume aircraft,
time to respond to offered aircraft) all decreased during high taskload
periods. An interpretation of this finding is that in periods of high taskload,
186
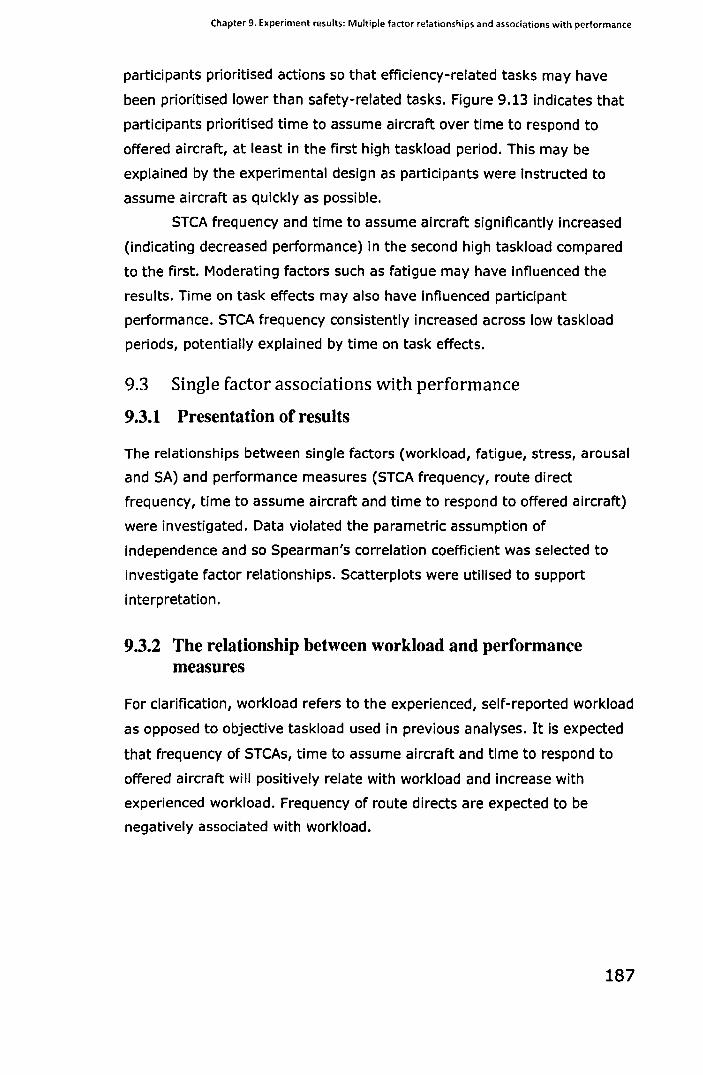
Chapter 9. Experiment results: Multiple factor relationships and associations with performance
participants prioritised actions so that efficiency-related tasks may have
been prioritised lower than safety-related tasks. Figure 9.13 indicates that
participants prioritised time to assume aircraft over time to respond to
offered aircraft, at least in the first high taskload period. This may be
explained by the experimental design as participants were Instructed to
assume aircraft as quickly as possible.
STCA frequency and time to assume aircraft significantly increased
(indicating decreased performance) in the second high taskload compared
to the first. Moderating factors such as fatigue may have influenced the
results. Time on task effects may also have influenced participant
performance. STCA frequency consistently increased across low taskload
periods, potentially explained by time on task effects.
9.3 Single factor associations with performance
9.3.1 Presentation of results
The relationships between single factors (workload, fatigue, stress, arousal
and SA) and performance measures (STCA frequency, route direct
frequency, time to assume aircraft and time to respond to offered aircraft)
were investigated. Data violated the parametric assumption of
independence and so Spearman's correlation coefficient was selected to
investigate factor relationships. Scatterplots were utilised to support
interpretation.
9.3.2 The relationship between workload and performance measures
For clarification, workload refers to the experienced, self-reported workload
as opposed to objective taskload used in previous analyses. It is expected
that frequency of STCAs, time to assume aircraft and time to respond to
offered aircraft will positively relate with workload and increase with
experienced workload. Frequency of route directs are expected to be
negatively associated with workload.
187
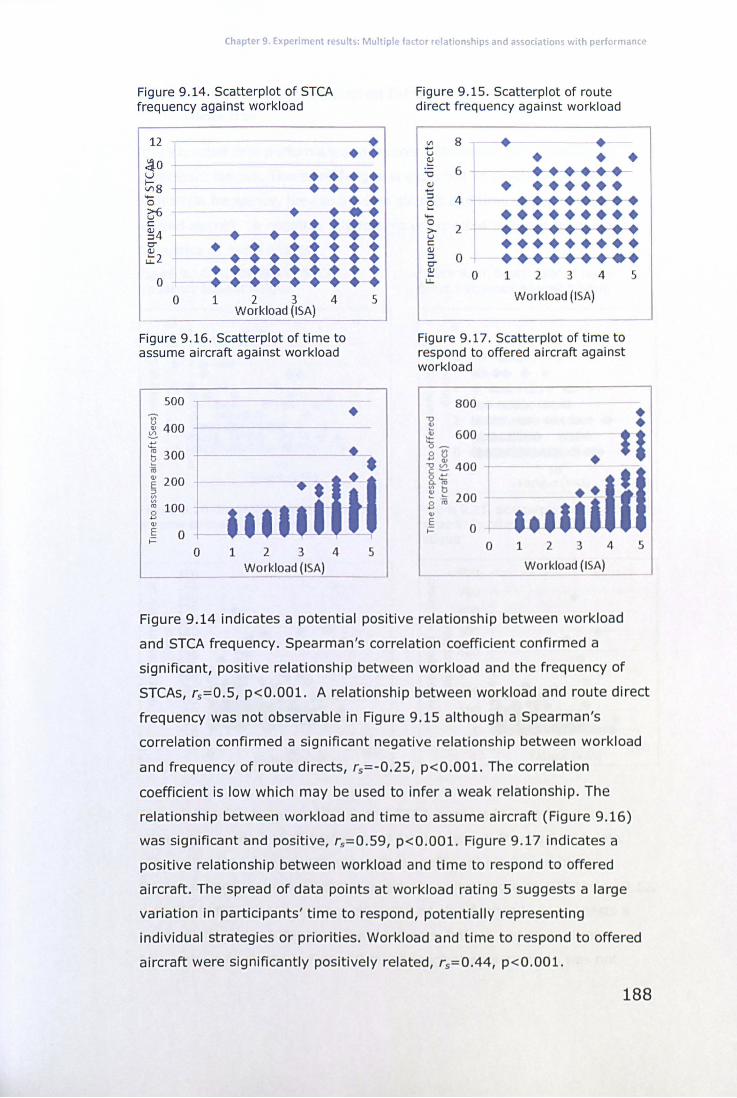
Chapter 9. Experiment results: Multiple factor relationships and associations with performance
Figure 9.14. Scatterplot of STCA frequency against workload
12 -+ + +
~o u + + + + tns -+-+ + .... + + 0
~ -+- + ... + c:: + + + + ~4 +-+ + +-+-+ C" + + + + + + + (1)
~2 1 + + •• -+-+ + + +++++++++
0 +-+-+- +-+-+-+- -+ + 0 1 2 3 4 5
Workload (ISA)
Figure 9.16. Scatterplot of time to assume aircraft against workload
500
]' 400 +
~ ..., ] 300 +-(ij • E 200
illl,iTil ~ '" '" 100 0 ..., ., E 0 i=
0 1 2 3 4 5 Workload (ISA)
Figure 9.15. Scatterplot of route direct frequency against workload
'" 8 • • .... u + + • ~ '0 6 +.+ •• + (1) + .+++++ .... ::l 4 ++++++++ 0 .....
++ ••••••• .... 0
2 •••• ++ •• + >-u ++ ••• + •• + c:: (1) ::l 0 ••••••••• C" (1)
0 1 2 3 4 5 ..... u.
Workload (ISA)
Figure 9.17. Scatterplot of time to respond to offered aircraft against workload
800
"U 1 ~ ~ 600
+ +
+ 11 o~
o tJ ..., ., ~ ~ 400 8.'i ~ b ;; ~ 200 .., ., E .= 0 .... ulil
o 1 23 4 5
Workload (ISA)
Figure 9 .14 indicates a potential positive relationship between workload
and STCA frequency. Spearman's correlation coefficient confirmed a
significant, positive relationship between workload and the frequency of
STCAs, rs=0.5, p<O.OO1. A relationship between workload and route direct
frequency was not observable in Figure 9.15 although a Spearman's
correlation confirmed a significant negative relationship between workload
and frequency of route directs, rs=-0.25, p<O.OO1. The correlation
coefficient is low which may be used to infer a weak relationship. The
relationship between workload and time to assume aircraft (Figure 9.16)
was significant and positive, r5 =0.59, p<O .OO1. Figure 9.17 indicates a
positive relationship between workload and time to respond to offered
aircraft. The spread of data pOints at workload rating 5 suggests a large
variation in participants' time to respond, potentially representing
individual strategies or priorities. Workload and time to respond to offered
aircraft were significantly positively related, r5 =0.44, p<O.OO1.
188
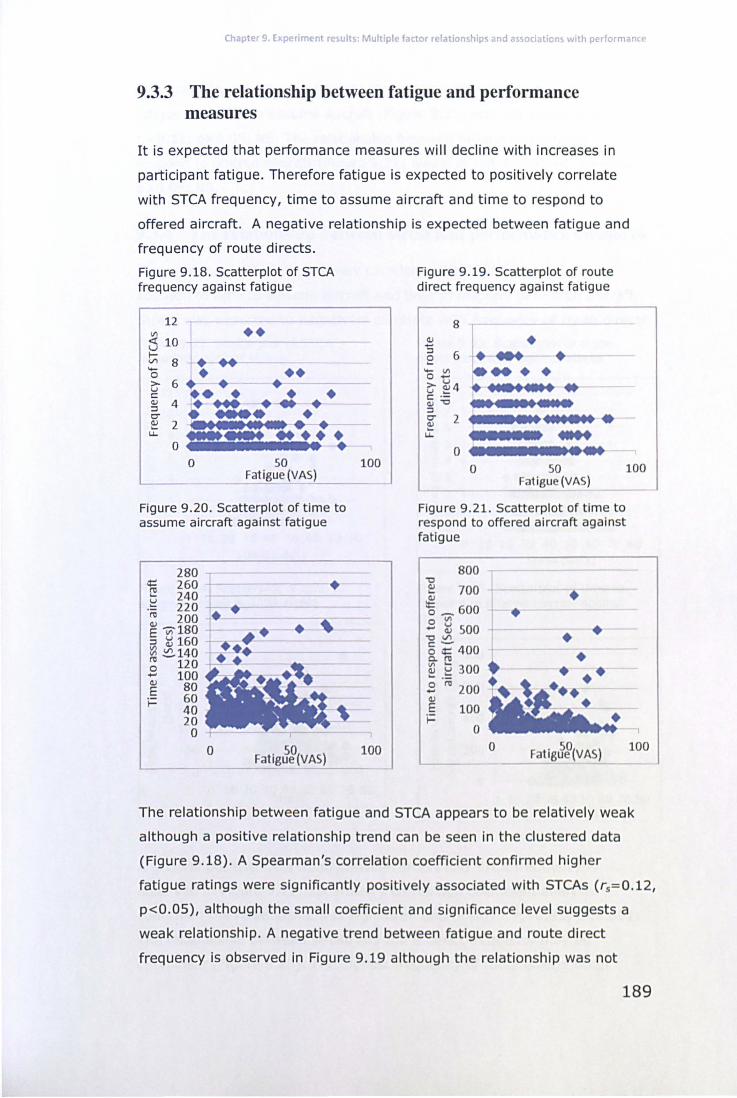
Chapter 9. EKperiment results' Multiple factor relationships and associations with performance
9.3.3 The relationship between fatigue and performance measures
It is expected that performance measures will decline with increases in
participant fatigue . Therefore fatigue is expected to positively correlate
with STCA frequency, time to assume aircraft and time to respond to
offered aircraft. A negative relationship is expected between fatigue and
frequency of route directs.
Figure 9.18. Scatterplot of STCA frequency against fatigue
12 (f)
~ 10 t;; 8 -o (J 6 c: ~ 4 t:T
•• .. -
~ ~
••• •• t ... . ~ .. ..... 2 ~'IIII"~ •• .......... a 'I 111111 • •
Figure 9.19. Scatterplot of route direct frequency against fatigue
8 Q) • "5 e 6 ..... • '0 ~ .... . (J ~4 ......... .. c: .-Q)"O ::J t:T 2 ~ ~
•. I.' ..... . 'I I •• ' ...... . ........ o • II I II. II' •••
a 50 100 Fat igue (VAS) a 50
atigue (VAS) 100
Figure 9.20. Scatterplot of time to assume aircraft against fatigue
280 .:t: 260 [!! 240 ~ 220 ~ 200 E v;-180 ::J ~ 160 ~ ~140 o 120 ..... 100 Q) 80 _~~
~ 60 40 20 o
o
--~ ..
100
Figure 9.21. Scatterplot of time to respond to offered aircraft against fatigue
800 -0 Q) 700 ~ 0_600
£ ~ 500 -oVl
g :t 400
~ Q 300 .... . -£ ~ 200 Q)
E 100 i=
a
• • • ..
• 100
The relationship between fatigue and STCA appears to be relatively weak
although a positive relationship trend can be seen in the clustered data
(Figure 9.18). A Spearman's correlation coefficient confirmed higher
fatigue ratings were significantly positively associated with STCAs (rs= O.12,
p<O.OS), although the small coefficient and significance level suggests a
weak relationship. A negative trend between fatigue and route direct
frequency is observed in Figure 9.19 although the relationship was not
189
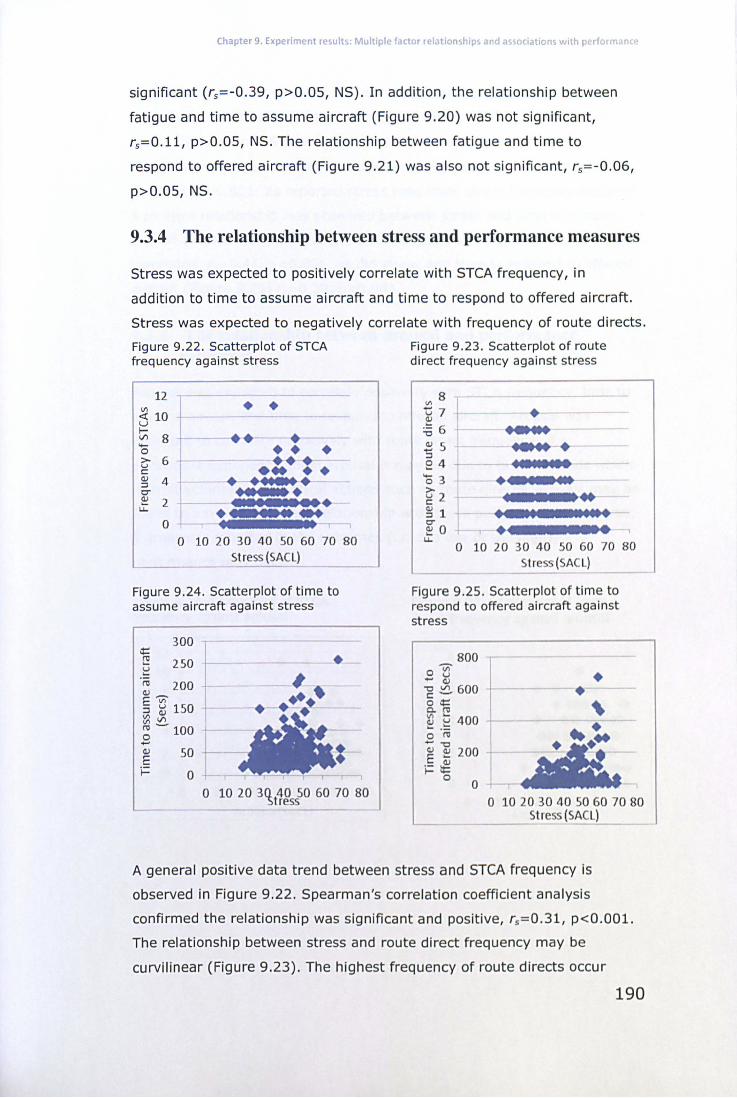
Chapter 9. Experiment results' Multiple facto r relationships and associations with performance
significant (rs= -0.39, p>0.05, NS). In addition, the relationship between
fatigue and time to assume aircraft (Figure 9.20) was not significant,
rs=O.l1, p>0.05, NS. The relationship between fatigue and time to
respond to offered aircraft (Figure 9.21) was also not significant, rs=-0.06,
p>0.05, NS.
9.3.4 The relationship between stress and performance measures
Stress was expected to positively correlate with STCA frequency, in
addition to time to assume aircraft and time to respond to offered aircraft.
Stress was expected to negatively correlate with frequency of route directs.
Figure 9.22. Scatterplot of STCA frequency against stress
12 til
;) 10
t;; 8 -o ~ 6 c: ~ 4 0-
~ ~ J
• • ----1 .. .---+-••• .-.----... .. .......
••• 111.
o 10 20 30 40 50 60 70 80 Stress (SACL)
Figure 9.24. Scatterplot of time to assume aircraft against stress
300 ¢::
~ 250 u ... ';:0 200 (1)_
§ ~ 150 ~V'l rc - 100 o ...-(1) 50 E i= 0
# •••• • •
•
o 10 20 3Qt40 50 60 70 80 "S ress
Figure 9.23. Scatterplot of route direct frequency against stress
---+ .... .... --- .....•. .• 1_-
I • I_ • 1111,._11 ••• • L11 ••••
o 10 20 30 40 50 60 70 80 Stre (SA L)
Figure 9.25. Scatterplot of time to respond to offered aircraft against stress
800 o ~
.... (1)
-g ~ 600 o¢::
~ ~ 400 ... .-o rc
•
-~
E ~ 200 I i=:e
o 0
o 10 20 30 40 50 60 70 80 Stress (SACL)
A general positive data trend between stress and STCA frequency is
observed in Figure 9.22. Spearman's correlation coefficient analysis
confirmed the relationship was significant and positive, rs= 0.31, p< O.OO1.
The relationship between stress and route direct frequency may be
curvilinear (Figure 9.23). The highest frequency of route directs occur
190
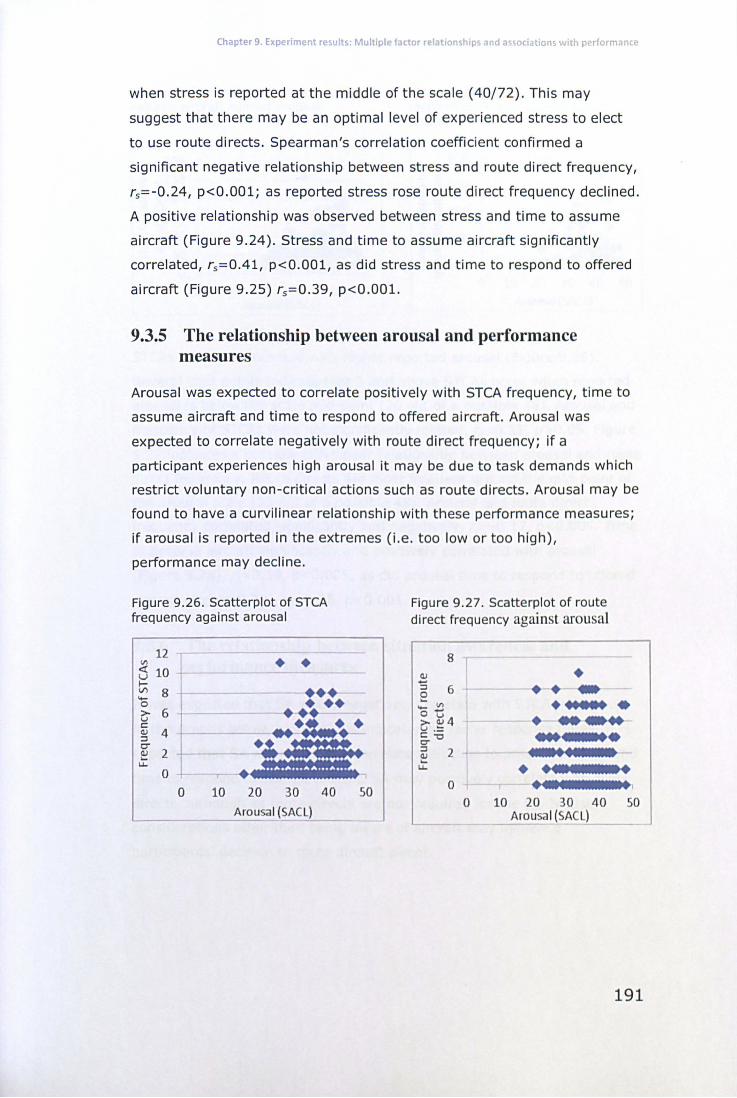
Chapter 9. Experiment results: Multiple factor relationships and associations with performance
when stress is reported at the middle of the scale (40/72). This may
suggest that there may be an optimal level of experienced stress to elect
to use route directs . Spearman's correlation coefficient confirmed a
significant negative relationship between stress and route direct frequency,
rs= -0 .24, p<O.OOl; as reported stress rose route direct frequency declined.
A positive relationship was observed between stress and time to assume
aircraft (Figure 9.24) . Stress and time to assume aircraft significantly
correlated, rs=0.41, p<O .OOl, as did stress and time to respond to offered
aircraft (Figure 9 .25) rs= 0.39, p<O.OOl.
9.3.5 The relationship between arousal and performance measures
Arousal was expected to correlate positively with STCA frequency, time to
assume aircraft and time to respond to offered aircraft. Arousal was
expected to correlate negatively with route direct frequency; if a
participant experiences high arousal it may be due to task demands which
restrict voluntary non-critical actions such as route directs. Arousal may be
found to have a curvilinear relationship with these performance measures;
if arousal is reported in the extremes (i.e. too low or too high),
performance may decline.
Figure 9.26. Scatterplot of STCA frequency against arousal
12 VI <l: 10 u • • f-VI 8 ..... 0 >- 6 u c:: OJ 4 ::l fJ
2 OJ .... u..
0 0 10 20 30 40
Arousal (SACL)
SO
Figure 9.27. Scatterplot of route direct frequency again t arou al
8 OJ • ..... .. ::l 6 • • 0 .... . ..... • ..... VI Ow • ...... >- OJ 4 u .: c::oo c:r ... I III •• ::l 2 1111111 •• 111 1111 OJ .... u.. • •• 1111111 •
0 •• I I 1111 .,
0 10 20 30 40 50 Arou al (SACL)
191
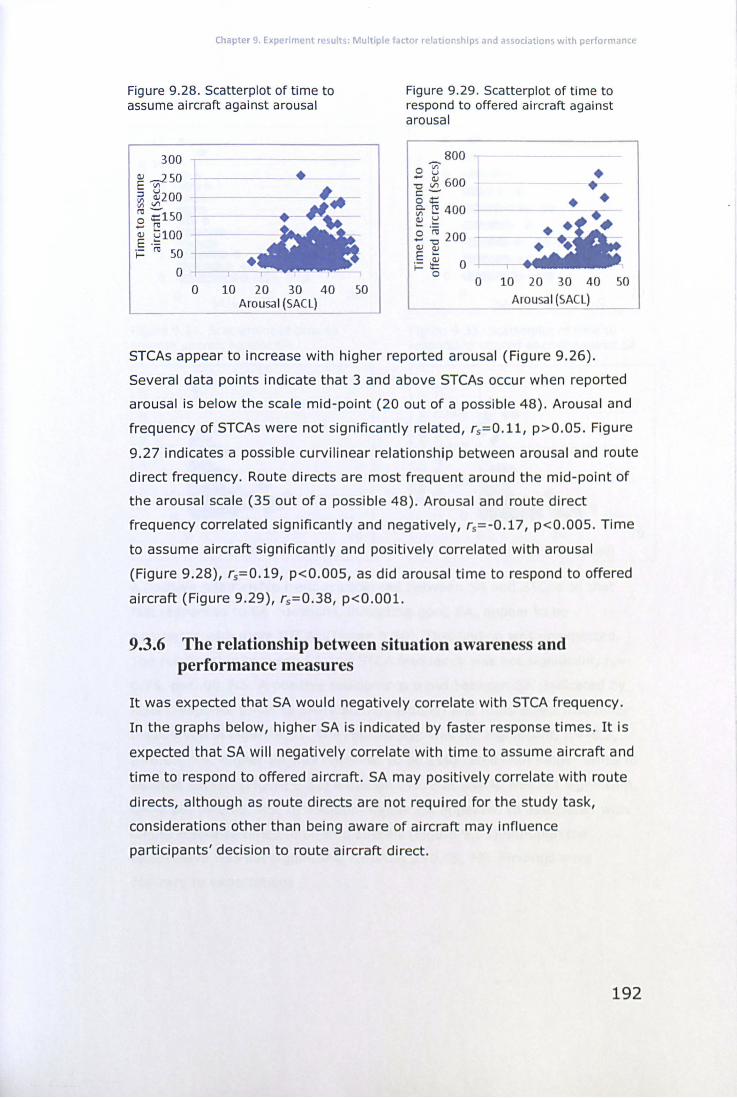
Chapter 9. Experiment results: Multiple factor relationships and associations with performance
Figure 9.28. Scatterplot of time to assume aircraft against arousal
300
~ v;250 • 5l ~200 ", VI
~ ~150 - ~ ~ .~100 r==; i= (1) 50
o ~ o 10 20 30 40
ArouSdI (SACL) --- --so
Figure 9.29 . Scatterplot of time to respond to offered aircraft against arousal
800 o ~ ; ~ 600 c:-o¢:: ~ ~ 400 ~ .~ .8 ~ 200 Q) Q)
E 4i i= 15 0
o
• • • • :; .. :a 10 20 30 40 50
Arousa l (SACL)
STCAs appear to increase with higher reported arousal (Figure 9.26).
Several data pOints indicate that 3 and above STCAs occur when reported
arousal is below the scale mid-point (20 out of a possible 48). Arousal and
frequency of STCAs were not significantly related, rs= O.l1, p>0.05. Figure
9.27 indicates a possible curvilinear relationship between arousal and route
direct frequency. Route directs are most frequent around the mid-point of
the arousal scale (35 out of a possible 48). Arousal and route direct
frequency correlated Significantly and negatively, rs=-0.17, p<0.005. Time
to assume aircraft significantly and positively correlated with arousal
(Figure 9.28), rs=0.19, p<0.005, as did arousal time to respond to offered
aircraft (Figure 9.29), rs=0.38, p<O.OO1.
9.3.6 The relationship between situation awareness and performance measures
It was expected that SA would negatively correlate with STCA frequency.
In the graphs below, higher SA is indicated by faster response times. It is
expected that SA will negatively correlate with time to assume aircraft and
time to respond to offered aircraft. SA may positively correlate with route
directs, although as route directs are not required for the study task,
considerations other than being aware of aircraft may influence
participants' decision to route aircraft direct.
192
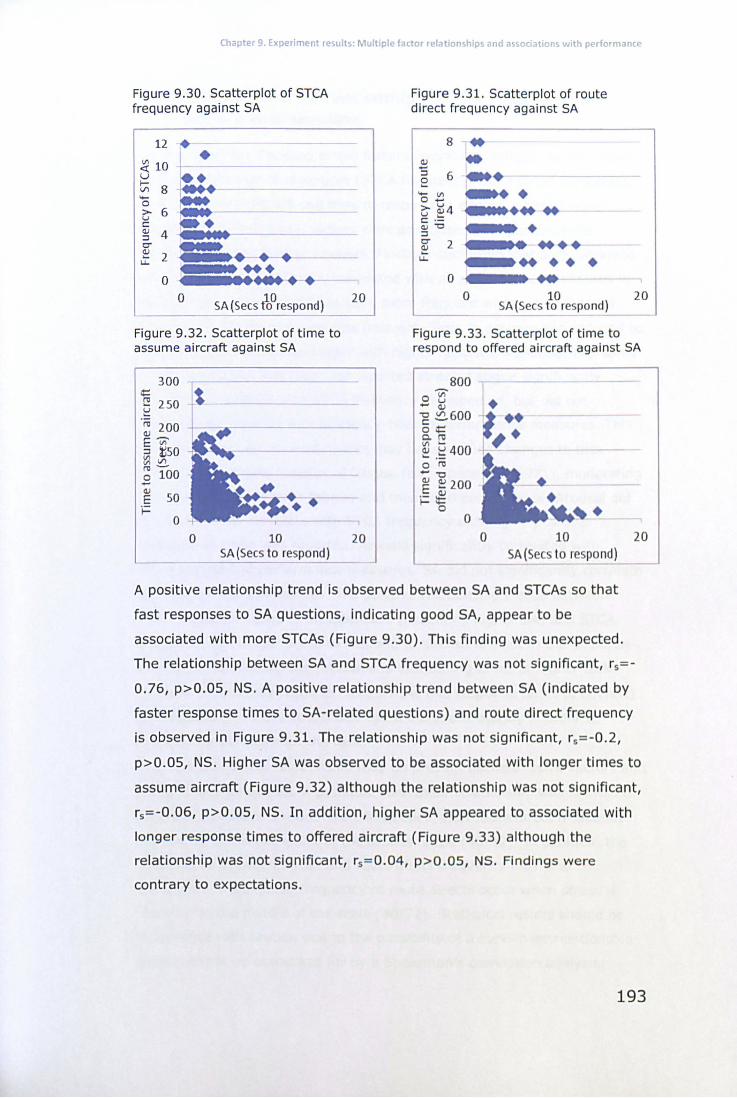
Chapter 9. Experiment results: Multiple factor relationships and associations with pE'rformance
Figure 9.30 . Scatterplot of STCA frequency against SA
12 .-~ 10 +- • -u •• f-Vl 8 I:J,· ..... 0 >- 6 u •• c: Q) ::J 4 ----C" Q)
2 ... u-
0 o 10
SA (Sees to respond)
Figure 9.32. Scatterplot of time to assume aircraft against SA
300 ¢::
~ 250 ~
~ 200 EV>' ::J tso ~ Vl
~ 100 .... Q)
E so o
20
o 10 20 SA (Sees to respond)
Figure 9.31. Scatterplot of route direct frequency against SA
8 ..-Q) -.... ::J 6 ... 0 ...
..... VI I • • ~ t4 _1111 ...... u ~ c: .-Q) "O I. • ::J C" 2 . e .... Q) ... u- .. •• •
0 .. 0 10
SA(Sees to respond) 20
Figure 9.33. Scatterplot of time to respond to offered aircraft against SA
800 0 '5" .... Q)
-g ~600 04= c..~
~ .~ 400 o ro -"0 E ~ 200 .- ~ f- 0
o
r --• 1,~
o 10 20 SA (Sec to respond)
A positive relationship trend is observed between SA and STCAs so that
fast responses to SA questions, indicating good SA, appear to be
associated with more STCAs (Figure 9.30). This finding was unexpected.
The relationship between SA and STCA frequency was not significant, rs= -
0.76, p>O.OS, NS. A positive relationship trend between SA (indicated by
faster response times to SA-related questions) and route direct frequency
is observed in Figure 9.31. The relationship was not Significant, rs=-0.2,
p>O.OS, NS. Higher SA was observed to be associated with longer times to
assume aircraft (Figure 9.32) although the relationship was not Significant,
rs=-0.06, p>O.OS, NS. In addition, higher SA appeared to associated with
longer response times to offered aircraft (Figure 9 .33) although the
relationship was not significant, rs=0.04, p>O .OS, NS. Findings were
contrary to expectations.
193

Chapter 9. Experiment results: Multiple factor relationships and associations with performance
9.3.7 Discussion of the relationship between single factors and performance measures
The relationships between single factors (workload, fatigue, stress, arousal,
SA) and performance measures (STCA frequency, route direct frequency,
time to assume aircraft and time to respond to offered aircraft) were
analysed to investigate if factors were associated with performance
measures prior to further analysis. Findings confirmed that both workload
and stress were significantly correlated with all performance measures in
the direction expected. STCAs were more frequent when workload was
high, and route directs were less frequent. Time to assume and respond to
offered aircraft were also longer with higher reported workload. The same
pattern of results was found for reported stress. Fatigue significantly
positively correlated with STCA frequency as expected, but did not
correlate significantly with efficiency-related performance measures. This
finding is unexpected. Participants may have applied changes to task
strategy to mitigate feelings of fatigue (e.g. Sperandio, 1971), moderating
the relationship between fatigue and measured performance. Arousal did
not significantly correlate with STCA frequency although a positive
relationship trend was reported. Arousal significantly correlated with
effiCiency-related performance measures. SA did not significantly correlate
with performance measures. The positive relationship trends between
faster response times to SA questions (indicating higher SA) and STCA
frequency and longer times to respond to aircraft are not in the direction
expected. A potential interpretation is that during times of higher task
demand (which may result in more STCAs and response times to aircraft)
participants may have responded to SA questions quickly in order to
minimise disturbance on the task.
A curvilinear relationship may be present between some factors and
performance measures. A potential curvilinear relationship was identified
between arousal and route direct frequency, with route direct frequency
increasing at the mid-point of the arousal scale (40/72). In addition, the
relationship between stress and route direct frequency may also be
curvilinear. The highest frequency of route directs occur when stress is
reported at the middle of the scale (40/72). Statistical results should be
interpreted with caution due to the possibility of a curvilinear relationship
which will not be accounted for by a Spearman's correlation analysis.
194
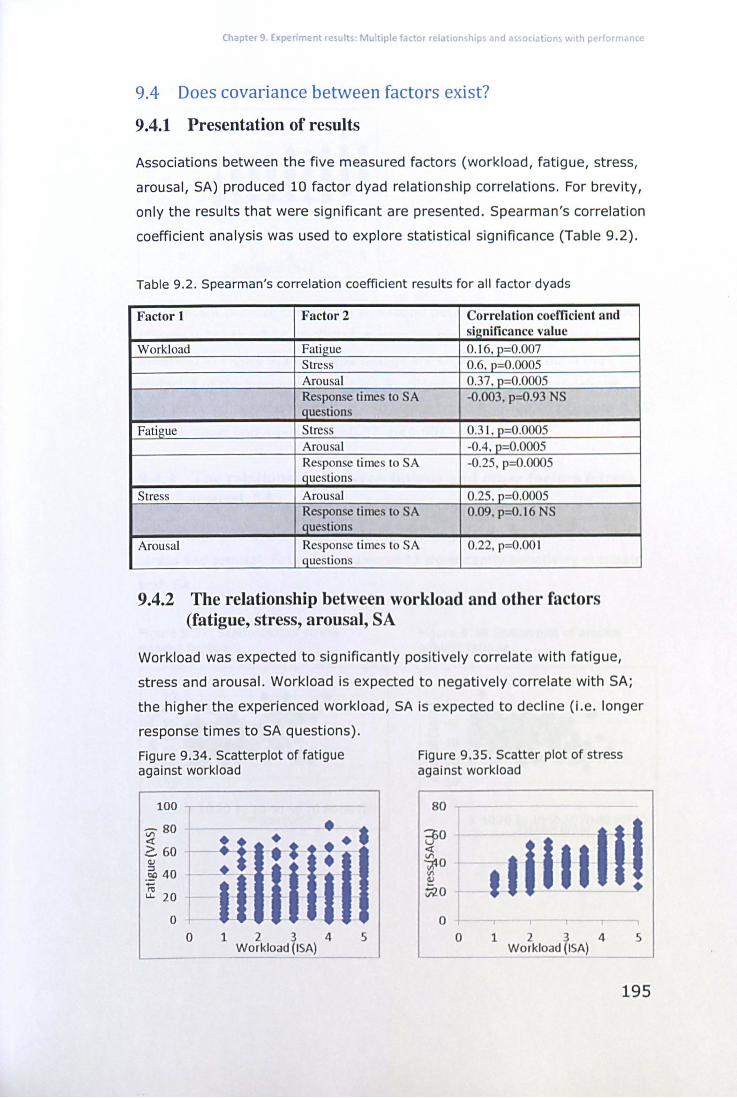
Chapter 9. Experiment results: Multiple factor relationships and associations w th performance
9.4 Does covariance between factors exist?
9.4.1 Presentation of results
Associations between the five measured factors (workload, fatigue, stress,
arousal, SA) produced 10 factor dyad relationship correlations. For brevity,
only the results that were significant are presented. Spearman's correlation
coefficient analysis was used to explore statistical significance (Table 9.2) .
Table 9.2. Spearman's correlation coefficient results for all factor dyads
Factor 1 Factor 2 Correlation coefficient and sienificance value
WorkJoad Fatigue 0.16, p=0.007 Stress 0.6, p=O.OOOS Arousal 0.37, p=O.OOOS Response times to SA -0.003, p=O.93 NS questions
Fatigue Stress 0.3 1, p=O.OOOS Arousal -0.4, p=O.OOOS Re pon e time to SA -0.2S, p=O.OOOS questions
Stress Arousal 0.2S, p=0.0005 Response times to SA 0.09, p=O.16 NS questions
Arousal Respon e times to SA 0.22, p=O.OO I questions
9.4.2 The relationship between workload and other factors (fatigue, stress, arousal, SA
Workload was expected to significantly positively correlate with fatigue,
stress and arousal. Workload is expected to negatively correlate with SA;
the higher the experienced workload, SA is expected to decline (i.e. longer
response times to SA questions) .
Figure 9.34. Scatterplot of fatigue against workload
100
o 1 2 3 4 Workload (ISA)
5
Figure 9.35. Scatter plot of stress against workload
80
o o 1 2 3 4
Workload (ISA) 5
195
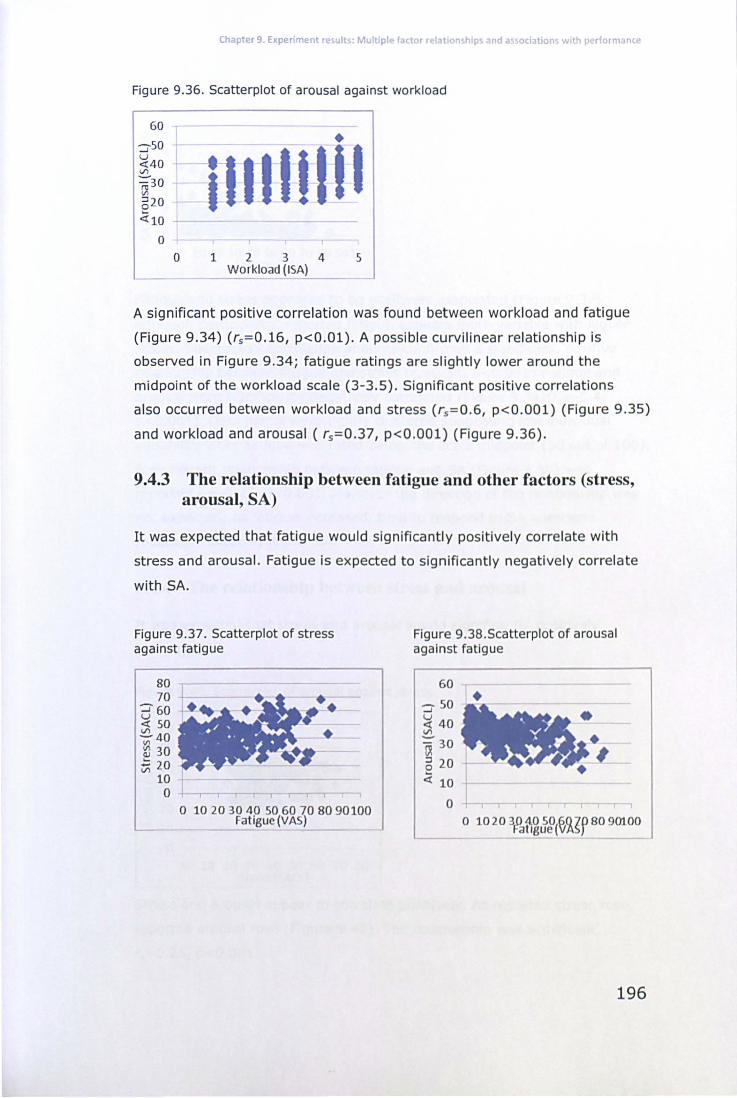
Chapter 9. Experiment results: Multiple factor relationships and associations with performance
Figure 9.36. Scatterplot of arousal against workload
60
::J50 ~40 Vl
i 30
:J20 e <t: 10
o o
•
iJlllln I 1 2 3 4
Workload (ISA) ---5
A significant positive correlation was found between workload and fatigue
(Figure 9.34) (rs= 0.16, p<O.Ol). A possible curvilinear relationship is
observed in Figure 9.34; fatigue ratings are slightly lower around the
midpoint of the workload scale (3-3.5). Significant positive correlations
also occurred between workload and stress (rs= O.6, p<O.OOl) (Figure 9.35)
and workload and arousal ( rs= O.37, p<O.OOl) (Figure 9.36).
9.4.3 The relationship between fatigue and other factors (stress, arousal, SA)
It was expected that fatigue would significantly positively correlate with
stress and arousal. Fatigue is expected to significantly negatively correlate
with SA.
Figure 9.37. Scatterplot of stress against fatigue
80 70
:::J 60 ~ 50 ~40 ~ 30 ~ 20
10 o
o 10203040 SO 60708090100 Fatigue (VAS)
Figure 9.38.Scatterplot of arousal against fatigue
60
:::J SO • ~ 40 Vl
~30 • ~ ~ 5 20 ... <t: 10
0
196
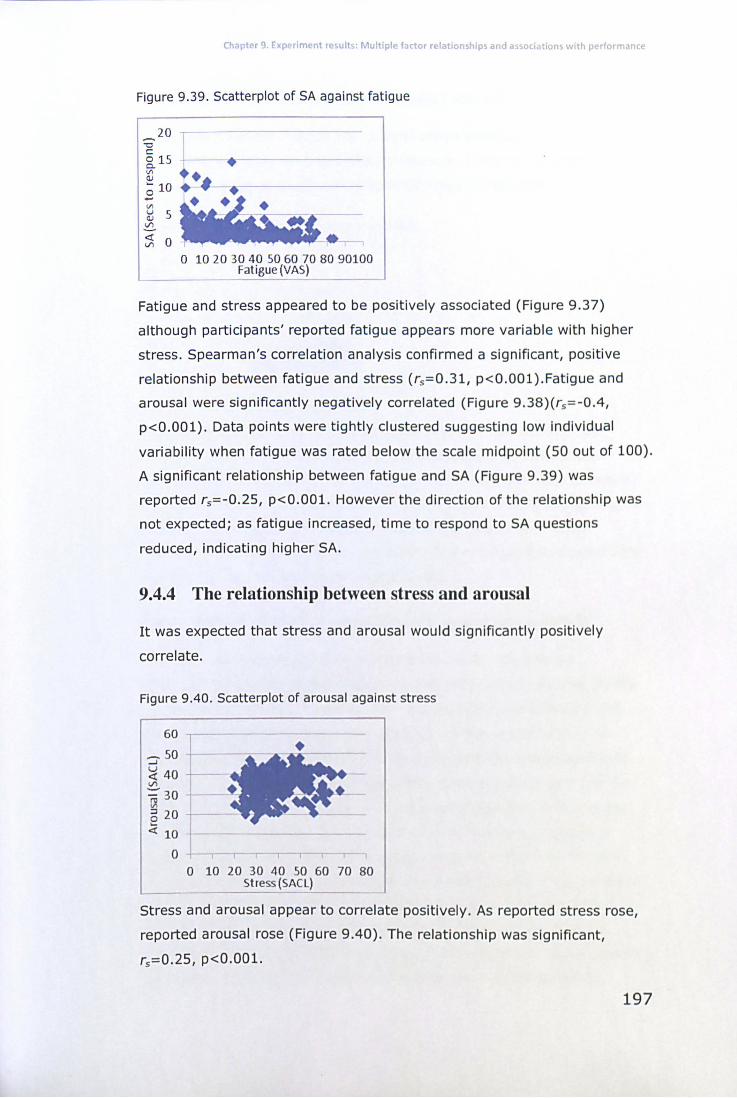
Chapter 9. Experiment results: Multiple factor relationships and associations with performance
Figure 9.39. Scatterplot of SA against fatigue
20 -"0 c
~15 . -------~ . ~ 10 , - . --
:;; ~~. ~: __ aati'~
o 10 20 30 40 50 60 70 80 90100 Fatigue (VAS)
Fatigue and stress appeared to be positively associated (Figure 9.37)
although participants' reported fatigue appears more variable with higher
stress. Spearman's correlation analysis confirmed a significant, positive
relationship between fatigue and stress (r5= 0.31, p<O.OOl).Fatigue and
arousal were significantly negatively correlated (Figure 9.38)(r5 =-0.4,
p<O.OOl). Data points were tightly clustered suggesting low individual
variability when fatigue was rated below the scale midpoint (50 out of 100).
A significant relationship between fatigue and SA (Figure 9.39) was
reported r5 =-0.25, p<O.OO1. However the direction of the relationship was
not expected; as fatigue increased, time to respond to SA questions
reduced, indicating higher SA.
9.4.4 The relationship between stress and arousal
It was expected that stress and arousal would significantly positively
correlate.
Figure 9.40. Scatterplot of arousal against stress
:? ~~ r -=--~ 40 +--V>
i30 1-5 20 -
~ 1~ L
•
o 10 20 30 40 50 60 70 80 Stress (SACL)
Stress and arousal appear to correlate positively. As reported stress rose,
reported arousal rose (Figure 9.40). The relationship was significant,
r5 =0.25, p<O.OO1.
197
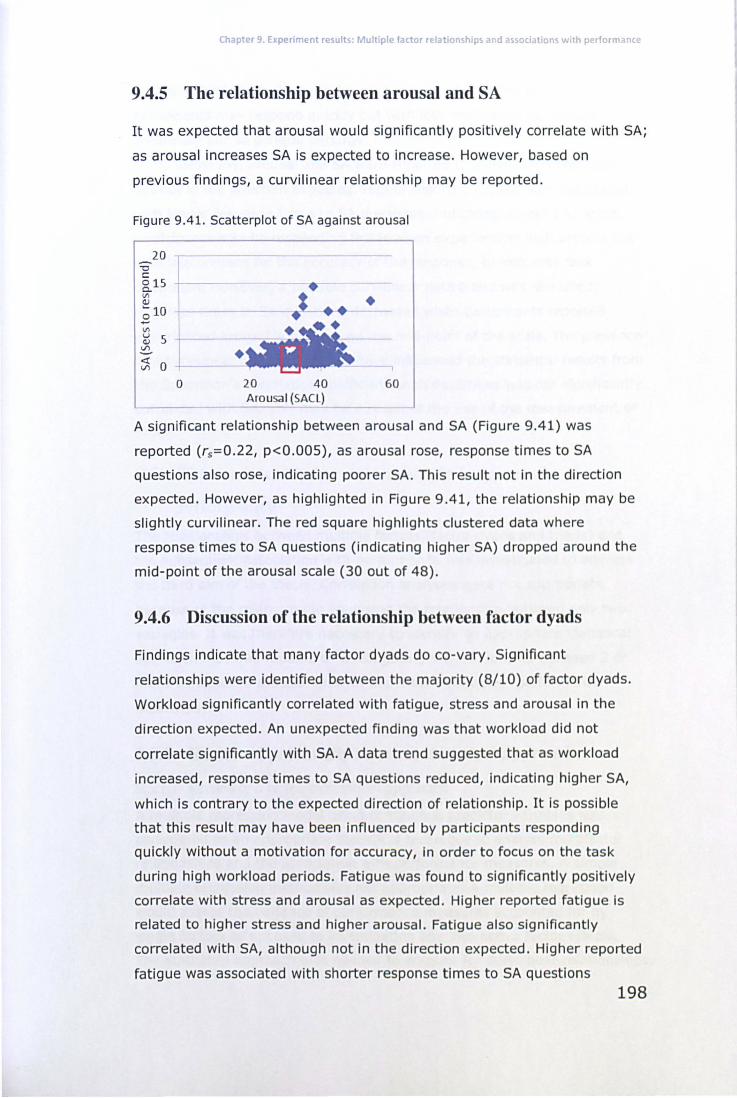
Chapter 9. Experiment results: Multiple factor relationships and associations with performance
9.4.5 The relationship between arousal and SA
It was expected that arousal would significantly positively correlate with SA;
as arousal increases SA is expected to increase. However, based on
previous findings, a curvilinear relationship may be reported.
Figure 9.41. Scatterplot of SA against arousal
20 "0 t:: 2,.15 • Vl
~: • (I)
;10 J
•• ...-Vl
~ 5 ~ • ~ 0
0 20 40 60 Arousal (SACL)
A significant relationship between arousal and SA (Figure 9.41) was
reported (r5=0.22, p<0.005), as arousal rose, response times to SA
questions also rose, indicating poorer SA. This result not in the direction
expected. However, as highlighted in Figure 9.41, the relationship may be
slightly curvilinear. The red square highlights clustered data where
response times to SA questions (indicating higher SA) dropped around the
mid-point of the arousal scale (30 out of 4S).
9.4.6 Discussion of the relationship between factor dyads
Findings indicate that many factor dyads do co-vary. Significant
relationships were identified between the majority (S/10) of factor dyads.
Workload Significantly correlated with fatigue, stress and arousal in the
direction expected. An unexpected finding was that workload did not
correlate significantly with SA. A data trend suggested that as workload
increased, response times to SA questions reduced, indicating higher SA,
which is contrary to the expected direction of relationship. It is possible
that this result may have been influenced by participants responding
quickly without a motivation for accuracy, in order to focus on the task
during high workload periods. Fatigue was found to significantly positively
correlate with stress and arousal as expected. Higher reported fatigue is
related to higher stress and higher arousal. Fatigue also Significantly
correlated with SA, although not in the direction expected. Higher reported
fatigue was associated with shorter response times to SA questions
198
Chapter 9. Experiment results: Multiple factor relationships and associations with performance
indicating higher SA. Again, this result may be due to the SPAM measure;
participants may respond quickly but with less motivation to respond
accurately due to general lethargy.
Similarly, arousal and SA were reported to significantly correlate
but not in the direction expected. Higher reported arousal was associated
with longer response times to SA questions, indicating poorer SA. Again,
participants may be responding faster when experiencing high arousal but
with less concern for the accuracy of the response, to minimise task
disruption. However, a possible curvilinear data trend was identified;
response times to SA questions decreased when participants reported
experienced arousal levels around the mid-point of the scale. The presence
of a curvilinear relationship may have Influenced the statistical results from
the Spearman's correlation coefficient analysis. Stress was not significantly
correlated with SA. This may be a result of the use of the measurement of
SPAM.
9.5 The relationship between multiple factors and
performance
The relationships between multiple factors (factor dyads and triads) and
the subsequent association with performance was investigated to address
the third aim of the thesis. Correlation analyses were not appropriate
because of the restriction to analysing the relationship between only two
variables. It was therefore necessary to Identify an appropriate statistical
approach that was capable of investigating the relationship between 2 or
more variables in association with dependent variables (performance
measures).
9.5.1 Review of potentially relevant statistical approaches
9.5.1.1 Review of a regression model approach
A multiple regression model using continuous predictor variables was
considered as an appropriate statistical technique to analyse multifactor
relationships and the association with performance measures. A simple
multiple regression method was not appropriate. A multiple regreSSion
would assess the variance of performance measures accounted for by
single factors as opposed to investigating any Interactive factor effects.
The statistical approach also needed to account for curvilinear relationships;
199
Chapter 9. Experiment results: Multiple factor relationships and associations with performance
the possibility of curvilinear relationships between single factors and
performance measures, as well as factor dyads, was previously reported
(sections 9.3, 9.4). Therefore, a non-linear, multiple regression, with
mediator and moderator variables would be the appropriate statistical
analysis approach. A power analysis suggested that for a simple regression,
with a significance level of 0.05, assuming a medium effect size and a
power of 0.8, 76 partiCipants would be needed. Many more would be
needed for the appropriate regression. The study generated data from 29
partiCipants and so statistically significant results were considered to be
extremely unlikely if this analysis was applied. In addition there may not
have been enough control in the exercise for regression findings to allow
an inference of strength. Participants were permitted to use their own
control strategies. A regression model approach was therefore concluded
not to be appropriate to analyse multiple factor relationships and
associations with performance.
9.5.1.2 Review o/median split analysis approach
The measures of each factor and performance measures generated
continuous data, which restricted statistical approaches to the analysis of
relationships between variables. Miles and Shevlin (2001) recommend that
"one of the simplest ways [to explore continuous data for interactions] is
to create a dichotomous variable from the continuous predictor variables
(categorising high or low around the mean or median)" (p180). In
accordance with Miles and Shevlin's (2001) recommendation, a median
split analysis method was selected to investigate potential interactions
between multiple factors and the association with performance measures.
The median split analysis method requires a transformation to
covariate factors through the median split method by splitting continuous
data into two groups around the median. The data is transformed from
continuous data into categorical data. The factors are now treated
effectively as independent variables with two levels - high and low. Tests
of difference can be used to analyse the transformed variables.
The method of applying median splits to continuous variables to
allow tests of difference has been widely applied in previous research (e.g.
Denollet et aI., 1996). However, the method has been criticised on the
basis that splitting the data around the median and subsequently grouping
the data Into 'high' and 'low' categories, results in a loss of information and
200
Chapter 9. Experiment results: Multiple factor relationships and associations with performance
variance in the data, therefore reducing the power of applied statistical
tests (Maccallum, Zhang, Preacher & Rucker, 2002). A risk of type II error
is therefore increased. However, the median splits approach was the most
practical method of analysing multiple factor relationships, including
multifactor interactions, and the association of multifactor relationships
with performance measures, which were necessary to achieve the third
and fourth thesis aims.
9.5.2 Procedure of applying median splits
Median splits were applied to the results generated from the measured
factors (workload, fatigue, stress, arousal, SA). There was a potential for a
large number of results. To make the analysis manageable, the median
split method was only applied to data collected during the two high
taskload periods. Data collected during high taskload periods were selected
for analysis because the high task demands create the potential for
participants to reach the edge of performance, which was one of the aims
for investigation. In addition, high workloads may create more variability in
performance measures, reducing the likelihood of ceiling effects (perfect
performance) which may inhibit the investigation of the aSSOCiation of
factors with performance.
The median split approach was applied to the data. First, means
were calculated of each participant's score for each factor, per 20 minute
high taskload period. Means for each factor were rank ordered. The factor
was then split into two groups (high and low) based on the median number
of participants in each group. PartiCipants rating a factor above the median
were placed in the 'high' factor grouping, and participants with ratings
below the median were categorised into the 'low' factor group. A step-by
step summary of the procedure of applying the median split approach to
the data is documented In Appendix 13.
Table 9.3 presents the median of each factor at which the measure
was split, and the number of partiCipants in each group.
201
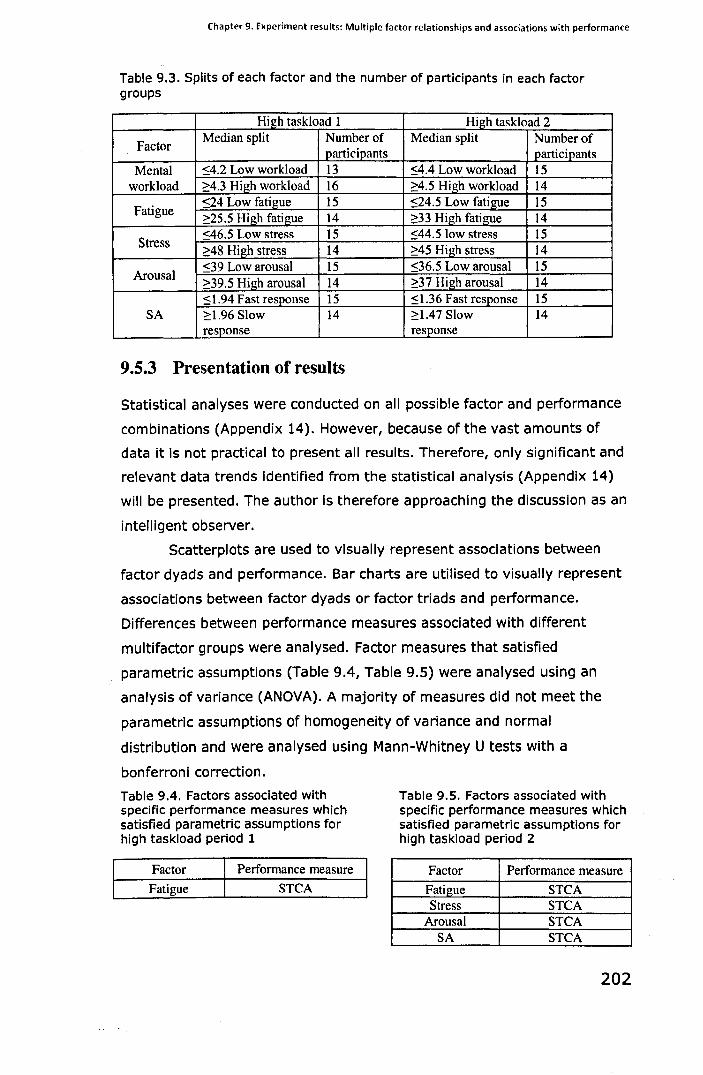
Chapter 9. Experiment results: MUltiple factor relationships and associations with performance
Table 9.3. Splits of each factor and the number of participants in each factor groups
High taskload 1 High task load 2
Factor Median split Number of Median split Number of
Participants participants Mental <4.2 Low workload 13 <4.4 Low workload 15
workload >4.3 High workload 16 >4.5 High workload 14
Fatigue <24 Low fatigue 15 <24.5 Low fatigue 15 >25.5 High fatigue 14 >33 High fatigue 14
Stress <46.5 Low stress 15 <44.5 low stress 15 >48 High stress 14 >45 High stress 14
Arousal <39 Low arousal 15 <36.5 Low arousal 15 >39.5 High arousal 14 >37 High arousal 14 <1.94 Fast response 15 <1.36 Fast response 15
SA ~1.96 Slow 14 ~1.47 Slow 14 response response
9.5.3 Presentation of results
Statistical analyses were conducted on all possible factor and performance
combinations (Appendix 14). However, because of the vast amounts of
data it is not practical to present all results. Therefore, only Significant and
relevant data trends Identified from the statistical analysis (Appendix 14)
will be presented. The author is therefore approaching the discussion as an
intelligent observer.
Scatterplots are used to visually represent associations between
factor dyads and performance. Bar charts are utilised to visually represent
associations between factor dyads or factor triads and performance.
Differences between performance measures associated with different
multifactor groups were analysed. Factor measures that satisfied
parametric assumptions (Table 9.4, Table 9.5) were analysed using an
analysis of variance (ANOVA). A majority of measures did not meet the
parametric assumptions of homogeneity of variance and normal
distribution and were analysed using Mann-Whitney U tests with a
bonferroni correction.
Table 9.4. Factors associated with speCific performance measures which satisfied parametric assumptions for high taskload period 1
Factor Performance measure
Fatigue STCA
Table 9.S. Factors associated with specific performance measures which satisfied parametric assumptions for high taskload period 2
Factor Performance measure
Fatigue STCA Stress STCA
Arousal STCA SA STCA
202
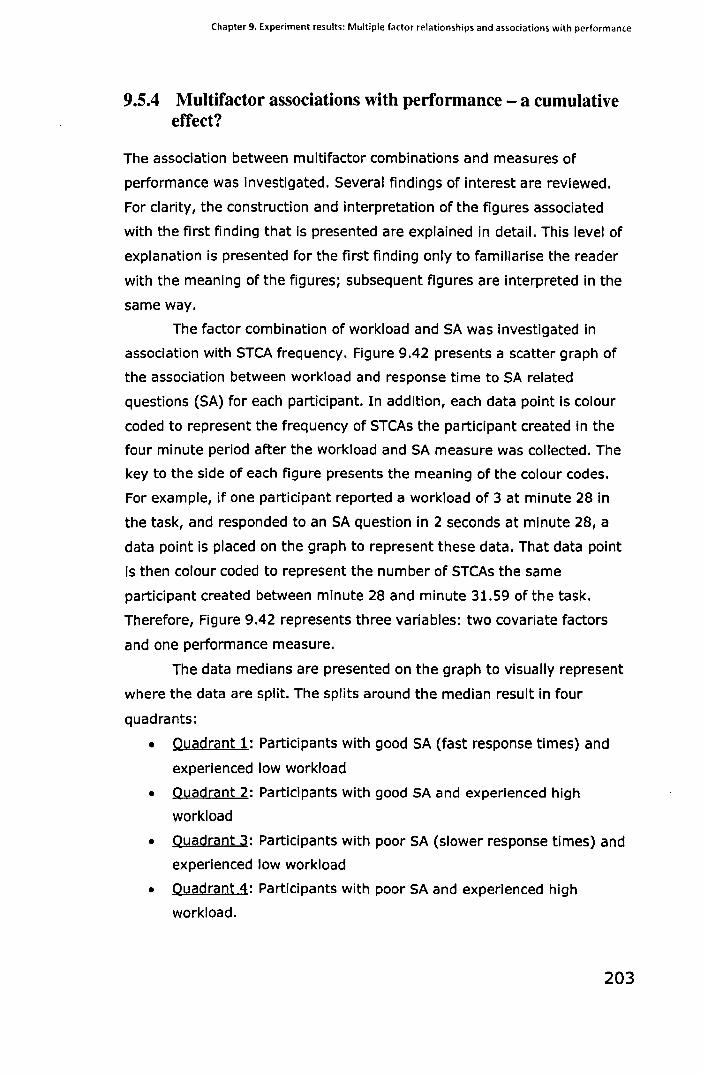
Chapter 9. Experiment results: Multiple factor relationships and associations with performance
9.5.4 Multifactor associations with performance - a cumulative effect?
The association between multifactor combinations and measures of
performance was investigated. Several findings of interest are reviewed.
For clarity, the construction and interpretation of the figures associated
with the first finding that is presented are explained in detail. This level of
explanation is presented for the first finding only to familiarise the reader
with the meaning of the figures; subsequent figures are Interpreted in the
same way.
The factor combination of workload and SA was investigated in
association with STCA frequency. Figure 9.42 presents a scatter graph of
the association between workload and response time to SA related
questions (SA) for each participant. In addition, each data point is colour
coded to represent the frequency of STCAs the participant created in the
four minute period after the workload and SA measure was collected. The
key to the side of each figure presents the meaning of the colour codes.
For example, if one participant reported a workload of 3 at minute 28 in
the task, and responded to an SA question in 2 seconds at minute 28, a
data point is placed on the graph to represent these data. That data point
is then colour coded to represent the number of STCAs the same
participant created between minute 28 and minute 31.59 of the task.
Therefore, Figure 9.42 represents three variables: two covariate factors
and one performance measure.
The data medians are presented on the graph to visually represent
where the data are split. The splits around the median result in four
quadrants:
• Quadrant 1: Participants with good SA (fast response times) and
experienced low workload
• Quadrant 2: Participants with good SA and experienced high
workload
• Quadrant 3: Participants with poor SA (slower response times) and
experienced low workload
• Quadrant 4: Participants with poor SA and experienced high
workload.
203
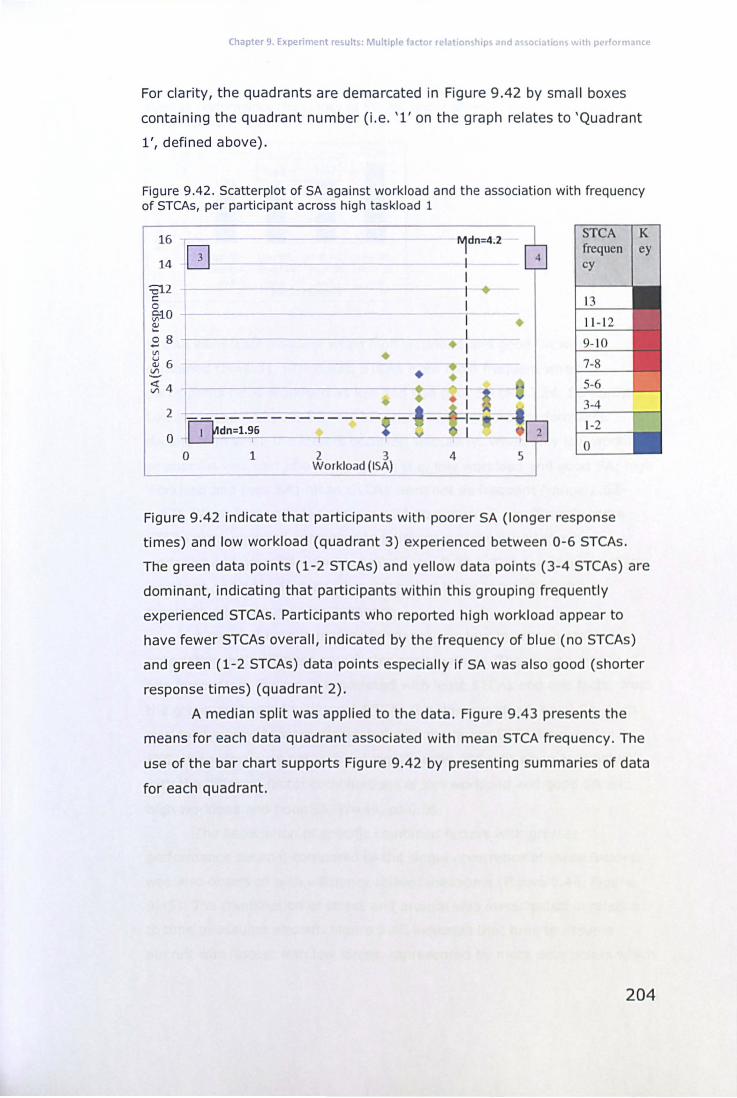
Chapter 9. Experiment results: Multiple factor relationships and associations wIth p£'rformance
For clarity, the quadrants are demarcated in Figure 9.42 by small boxes
containing the quadrant number (Le. '1' on the graph relates to 'Quadrant
1', defined above).
Figure 9.42. Scatterplot of SA against workload and the association with frequency of STCAs, per participant across high taskload 1
16 ~dn=4.2 STCA K
G frequen ey 14 I cy
I :el2
J I c: I 13 0
~10 - -- ---QJ
I I • 11-12 ... I o 8 9- 10 - I If) • al 6 I 7-8
~ • • I ~4 1- 5-6
2 I ,.. 3-4
I I ~n=1.96--------- 1-2 0
0 0 1 2 3 4
Workload (ISA)
Figure 9.42 indicate that participants with poorer SA (longer response
times) and low workload (quadrant 3) experienced between 0-6 STCAs.
The green data pOints (1-2 STCAs) and yellow data pOints (3-4 STCAs) are
dominant, indicating that participants within this grouping frequently
experienced STCAs. Participants who reported high workload appear to
have fewer STCAs overall, indicated by the frequency of blue (no STCAs)
and green (1-2 STCAs) data pOints especially if SA was also good (shorter
response times) (quadrant 2).
A median split was applied to the data. Figure 9.43 presents the
means for each data quadrant associated with mean STCA frequency. The
use of the bar chart supports Figure 9.42 by presenting summaries of data
for each quadrant.
204
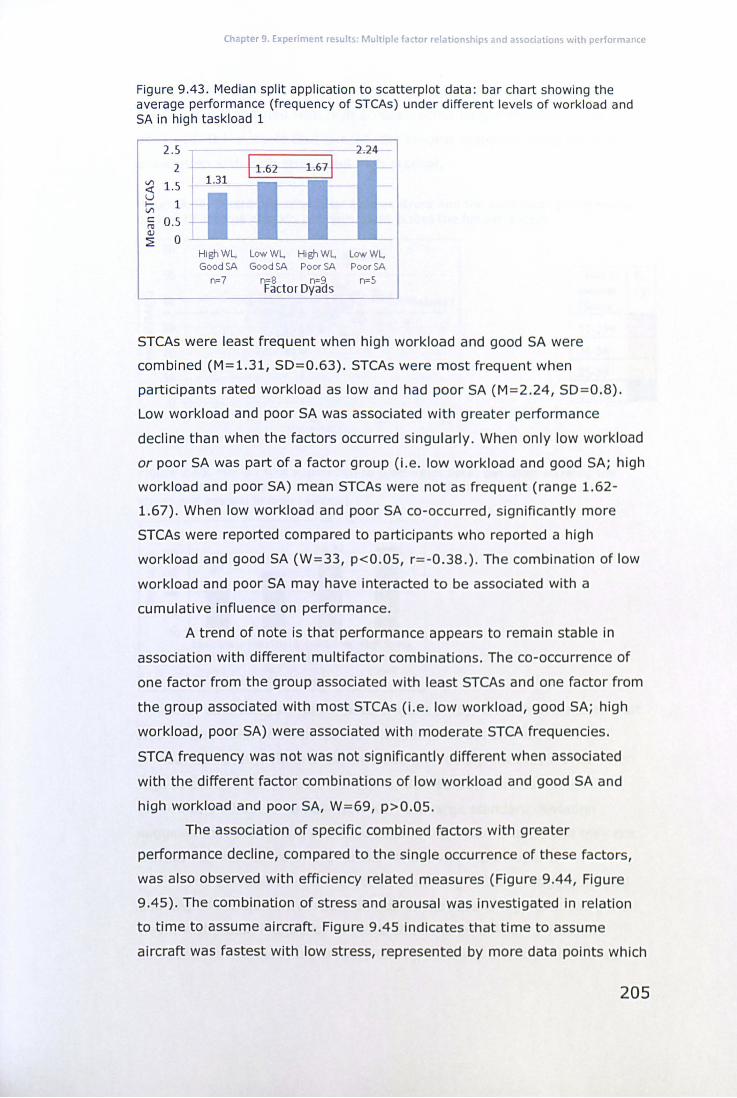
Chapter 9. Experiment results: Multiple factor relationships and associations with performance
Figure 9.43. Median split application to scatterplot data: bar chart showing the average performance (frequency of STCAs) under different levels of workload and SA in high taskload 1
2 .5 2.24-
2 -I-V) 1.5 <l: u 1 ~
V)
c: 0.5 ro (1)
0 ~ HlghWL, LowWL, HighWL LowWL, Good SA Good SA Poor SA Poor SA
n=7 n=8 n=9 Factor Dya(Js
n=5
STCAs were least frequent when high workload and good SA were
combined (M=1.31, SD=O.63). STCAs were most frequent when
participants rated workload as low and had poor SA (M = 2.24, SD =O.8).
Low workload and poor SA was associated with greater performance
decline than when the factors occurred singularly. When only low workload
or poor SA was part of a factor group (i.e. low workload and good SA; high
workload and poor SA) mean STCAs were not as frequent (range 1.62-
1.67). When low workload and poor SA co-occurred, significantly more
STCAs were reported compared to participants who reported a high
workload and good SA (W=33, p<O.OS, r= -O.38.). The combination of low
workload and poor SA may have interacted to be associated with a
cumulative influence on performance.
A trend of note is that performance appears to remain stable in
association with different multifactor combinations. The co-occurrence of
one factor from the group associated with least STCAs and one factor from
the group associated with most STCAs (i.e. low workload, good SA; high
workload, poor SA) were associated with moderate STCA frequencies.
STCA frequency was not was not significantly different when associated
with the different factor combinations of low workload and good SA and
high workload and poor SA, W=69, p>O.OS.
The association of specific combined factors with greater
performance decline, compared to the single occurrence of these factors,
was also observed with efficiency related measures (Figure 9.44, Figure
9.45). The combination of stress and arousal was investigated in relation
to time to assume aircraft. Figure 9.45 indicates that time to assume
aircraft was fastest with low stress, represented by more data pOints which
205
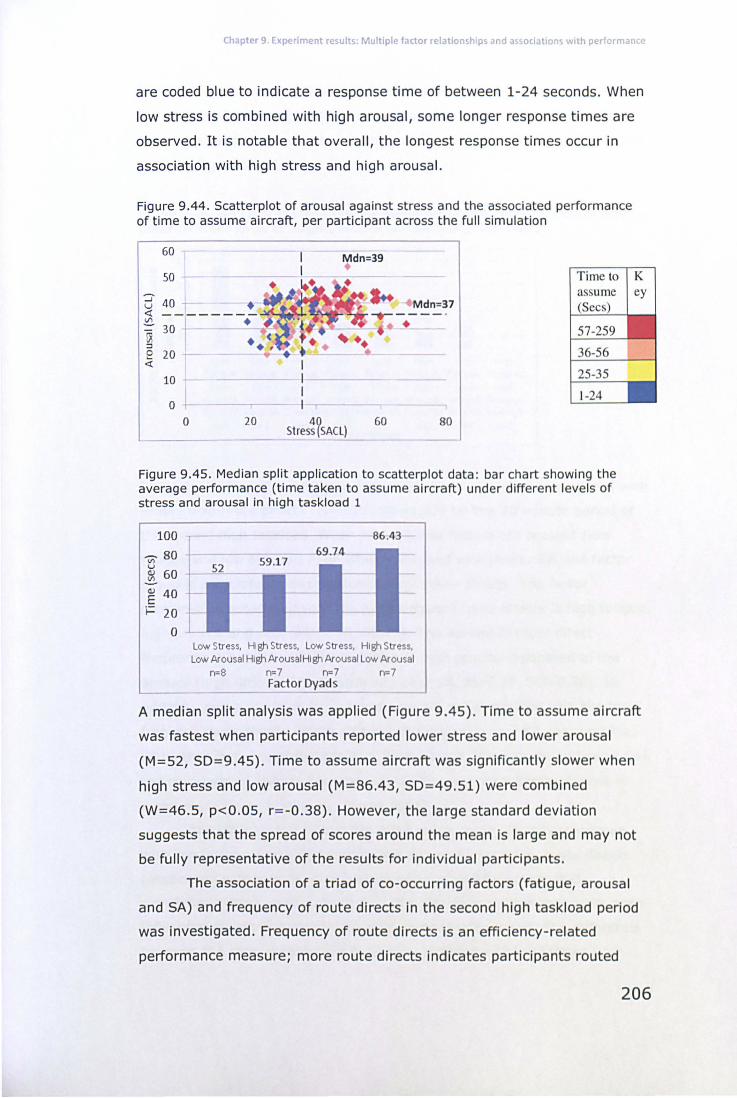
Chapter 9. Experiment results: Multiple factor relationships and associations with performanc
are coded blue to indicate a response time of between 1-24 seconds. When
low stress is combined with high arousal, some longer response times are
observed . It is notable that overall, the longest response times occur in
association with high stress and high arousal.
Figure 9.44. Scatterplot of arousal against stress and the associated performance of time to assume aircraft, per participant across the full simulation
Time to K
o 20 Stres~~SACL) 60 80
Figure 9.45. Median split application to scatterplot data : bar chart showing the average performance (time taken to assume aircraft) under different levels of stress and arousal in high taskload 1
100 86.43
<n 80 .! 60 1 52
4) 40 I ~ 2~ r -=---Low Stress, High Stress, Low Stress, High Stress, Low Arousal High ArousalHlgh Arousal Low Arousal
n=8 n=7 n=7 n=7 Factor Dyads
A median split analysis was applied (Figure 9.45). Time to assume aircraft
was fastest when participants reported lower stress and lower arousal
(M=52, 5D=9.45). Time to assume aircraft was significantly slower when
high stress and low arousal (M = 86.43, 5D=49.51) were combined
(W=46.5, p<O.OS, r= -O.38). However, the large standard deviation
suggests that the spread of scores around the mean is large and may not
be fully representative of the results for individual participants.
The association of a triad of co-occurring factors (fatigue, arousal
and 5A) and frequency of route directs in the second high taskload period
was investigated. Frequency of route directs is an effiCiency- related
performance measure; more route directs indicates participants routed
206
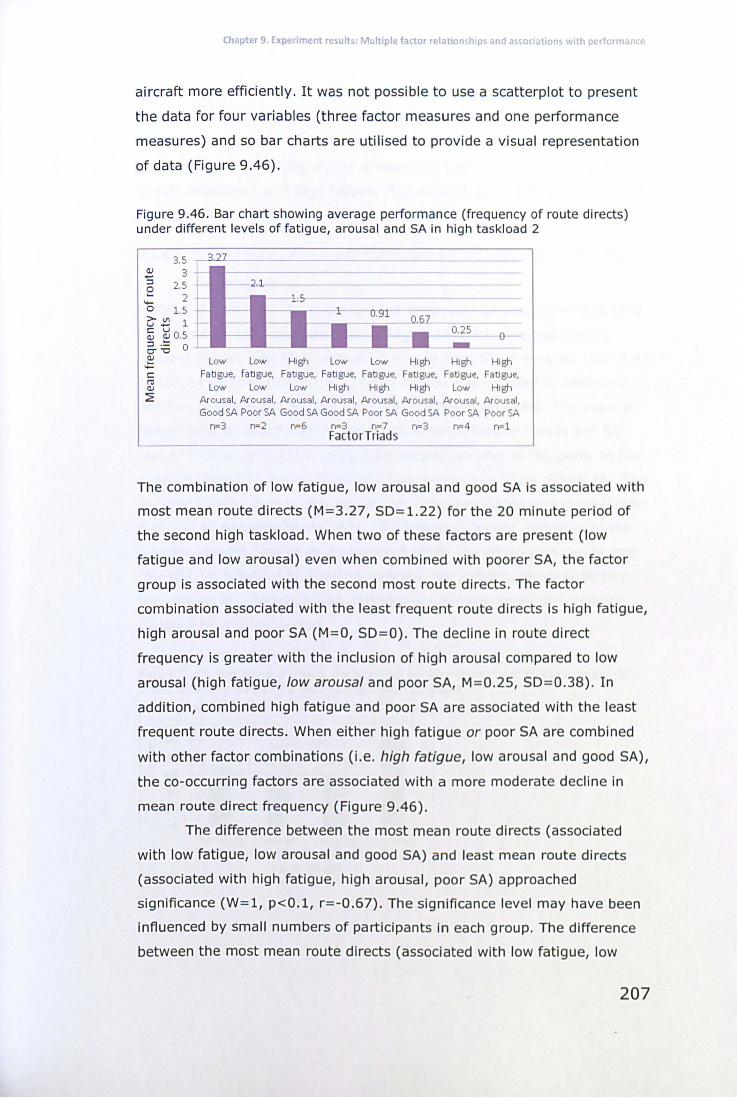
Chapter 9. Experiment results: Multiple factor relationships and associations with performa'lce
aircraft more efficiently. It was not possible to use a scatterplot to present
the data for four variables (three factor measures and one performance
measures) and so bar charts are utilised to provide a visual representation
of data (Figure 9.46) .
Figure 9.46 . Bar chart showing average performance (frequency of route directs) under different levels of fatigue, arousal and SA in high taskload 2
3.5 or--"<..LL
! 3 5 2.5 .;: 2 o 1.5 ~~ 1 c: u (I) ~ 0.5 5-:0 0 (I)
.;: c: I"Il (I)
~
.-O.ll
• 0.25 - o
Low Low High Low Low High High High Fati gue, fati gue, Fatigue, Fatigue, Fatigue, Fatigue, Fatigue, Fatigue,
Low Low Low High High High Low High Arousal, Arousal, Arousal, Arousal, Arousal, Arousal, Arousal, Arousal, Good SA Poor SA Good SA Good SA Poor SA Good SA Poor SA Poor SA
n=3 n=2 n=6 n=3 n=7 n=3 n=4 n=l FactorTriads
The combination of low fatigue, low arousal and good SA is associated with
most mean route directs (M = 3.27, SD= 1.22) for the 20 minute period of
the second high taskload. When two of these factors are present (low
fatigue and low arousal) even when combined with poorer SA, the factor
group is associated with the second most route directs. The factor
combination associated with the least frequent route directs is high fatigue,
high arousal and poor SA (M=O, SD = O). The decline in route direct
frequency is greater with the inclusion of high arousal compared to low
arousal (high fatigue, low arousal and poor SA, M= 0.2S, SD= 0.38). In
addition, combined high fatigue and poor SA are associated with the least
frequent route directs. When either high fatigue or poor SA are combined
with other factor combinations (I.e. high fatigue, low arousal and good SA),
the co-occurring factors are associated with a more moderate decline in
mean route direct frequency (Figure 9.46).
The difference between the most mean route directs (associated
with low fatigue, low arousal and good SA) and least mean route directs
(associated with high fatigue, high arousal, poor SA) approached
significance (W=l, p<O.l, r=-0.67). The significance level may have been
influenced by small numbers of partiCipants in each group. The difference
between the most mean route directs (associated with low fatigue, low
207
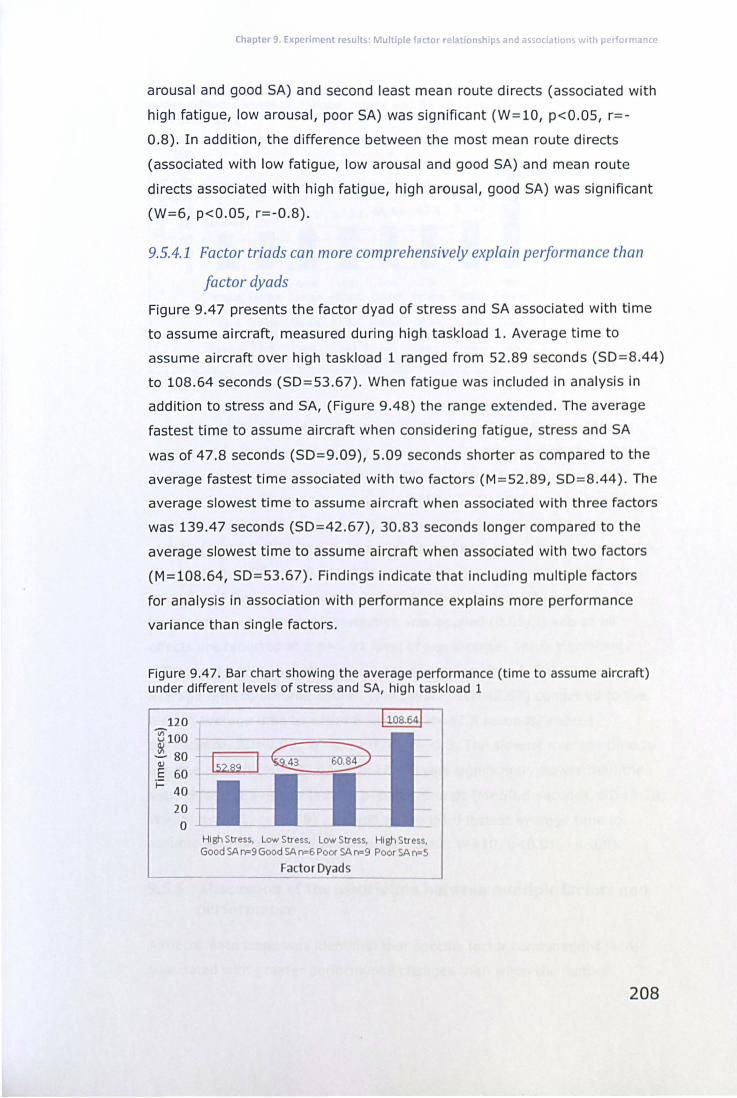
Chapter 9. Experiment results: Multiple factor relationships and associations with performance
arousal and good SA) and second least mean route directs (associated with
high fatigue, low arousal, poor SA) was significant (W= 10, p<0.05, r=
O.S). In addition, the difference between the most mean route directs
(associated with low fatigue, low arousal and good SA) and mean route
directs associated with high fatigue, high arousal, good SA) was significant
(W=6, p<0 .05, r=-O.S).
9.5.4.1 Factor triads can more comprehensively explain performance than
factor dyads
Figure 9.47 presents the factor dyad of stress and SA associated with time
to assume aircraft, measured during high taskload 1. Average time to
assume aircraft over high taskload 1 ranged from 52.S9 seconds (5D=S.44)
to 10S.64 seconds (5D=53.67). When fatigue was included in analysis in
addition to stress and SA, (Figure 9.4S) the range extended. The average
fastest time to assume aircraft when considering fatigue, stress and SA
was of 47 .S seconds (50=9.09), 5.09 seconds shorter as compared to the
average fastest time associated with two factors (M = 52.S9, 50= S.44). The
average slowest time to assume aircraft when associated with three factors
was 139.47 seconds (50=42.67), 30.S3 seconds longer compared to the
average slowest time to assume aircraft when associated with two factors
(M=10S.64, 50=53.67). Findings indicate that including multiple factors
for analysis in association with performance explains more performance
variance than single factors.
Figure 9.47. Bar chart showing the average performance (time to assume aircraft) under different levels of stress and SA, high taskload 1
120 'ff100
OJ ~ 80
(1)
E 60 i= 40
20 o
High Stress, Low Stress. Low Stress, High Stress, Good SA n=9 Good SA n=6 Poor SA n=9 Poor SA n=5
Factor Dyads
208
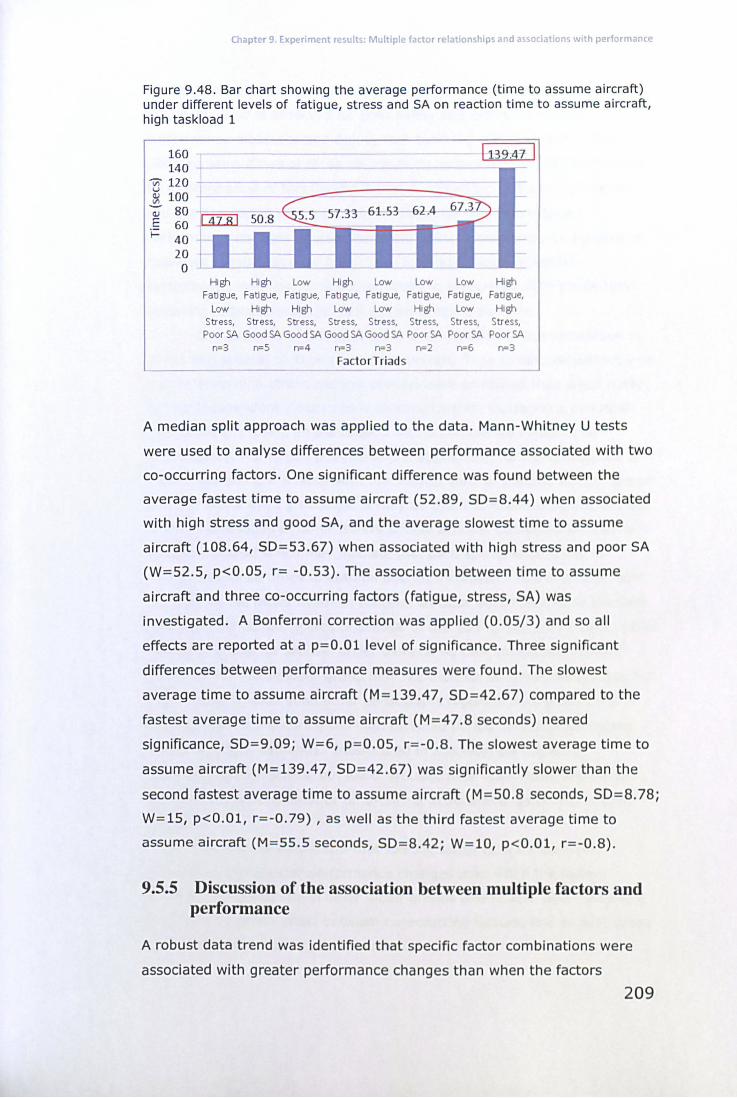
Chapter 9. Experiment results: Multiple factor relationships and associations with performance
Figure 9.48. Bar chart showing the average performance (time to assume aircraft) under different levels of fatigue, stress and SA on reaction time to assume aircraft, high taskload 1
160 140 -r --------- -------
Vi" 120 u e; 100
I ~~ ti-i-l 57.33 6153 62 .'
High High Low High Low Low Low High Fatigue, Fatigue, Fatigue, Fati gue, Fatigue, Fatigue, Fatigue, Fatigue,
Low High High Low Low High Low High Stress, Stress, Stress, Stress, Stress, Stress, Stress, Stress,
Poor SA Good SA Good SA Good SA Good SA Poor SA Poor SA Poor SA n=3 n=5 n=4 n=3 n=3 n=2 n=6 n=3
FactorTriad s
A median split approach was applied to the data. Mann-Whitney U tests
were used to analyse differences between performance associated with two
co-occurring factors. One Significant difference was found between the
average fastest time to assume aircraft (S2.S9, SD= S.44) when associated
with high stress and good SA, and the average slowest time to assume
aircraft (10S.64, SD=53.67) when associated with high stress and poor SA
(W=S2.S, p<O.OS, r= -0.53). The association between time to assume
aircraft and three co-occurring factors (fatigue, stress, SA) was
investigated. A Bonferroni correction was applied (0.05/3) and so all
effects are reported at a p=O.Ol level of significance. Three significant
differences between performance measures were found. The slowest
average time to assume aircraft (M = 139.47, SD=42.67) compared to the
fastest average time to assume aircraft (M =47.S seconds) neared
significance, SD=9.09; W=6, p=O.OS, r= -O.S. The slowest average time to
assume aircraft (M=139.47, SD= 42.67) was significantly slower than the
second fastest average time to assume aircraft (M = SO .S seconds, SD= S.78;
W= 15, p<O.Ol, r= -0.79) , as well as the third fastest average time to
assume aircraft (M=5S.S seconds, SD= 8.42; W= 10, p<O.Ol, r= -O.S).
9.5.5 Discussion of the association between multiple factors and performance
A robust data trend was identified that specific factor combinations were
associated with greater performance changes than when the factors
209
Chapter 9. Experiment results: Multiple factor relationships and associations with performance
occurred independently in other factor groups. This result was reported
repeatedly, and is observed for both safety and efficiency re.lated
performance measures and during high taskload periods 1 and 2. The
effect remains if two or three co-occurring factors are included in analysis.
An interpretation of this finding is that co-occurring factors may interact
and are associated with a cumulative influence on performance.
Performance changes in association with factor groups may be positive or
negative; combinations of factors are associated with increased
performance, over performance achieved in association with the factors
occurring independently, as well as performance declines.
One example of this data trend was identified in the assodation of
stress and arousal on time to assume aircraft. Time to assume aircraft was
slower when high stress and low arousal were combined than when these
factors independently occurred with other factors, indicating a potential
interactive effect and an association with a cumulative influence on
performance. Numerous possible explanations exist for the association of
high stress and low arousal with the slowest time to assume aircraft out of
the four factor dyad groupings. It may be that experienced high stress led
to the prioritisation of other, safety critical actions. Combined with lower
reported arousal which may indicate that participants were lower in
energy, response times to assume aircraft increased. It is also important
to interpret the factor dyads in context; as data were collected in the first
high taskload period, scores of arousal in the 'low' group are relative to the
spread of scores for arousal under demanding task conditions. Arousal
scores in the 'low arousal' group may not indicate absolute low arousal, but
that arousal is lower than other participants reported during this time. A
lower arousal score during the high taskload period may indicate coping
with a high task demands. Interpreted in this way, participants
experiencing high stress, but lower arousal, may again have decided to
prioritise the most safety, or time-critical actions over assuming aircraft
quickly.
Overall, the data trend that specific factor combinations are
associated with greater performance changes than when the factors
occurred independently in other factor groups was robust, and indicates a
possible interaction effect between co-occurring factors, and an associated
cumulative influence on performance.
210
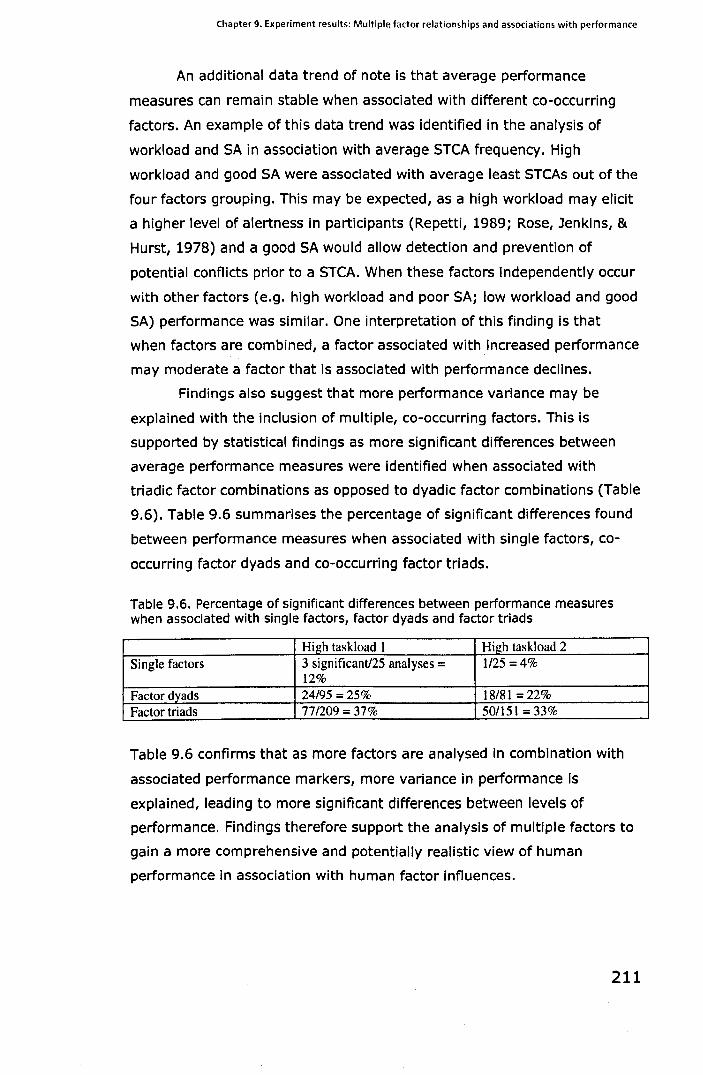
Chapter 9. Experiment results: Multiple factor relationships and associations with performance
An additional data trend of note is that average performance
measures can remain stable when associated with different co-occurring
factors. An example of this data trend was identified in the analysis of
workload and SA in association with average STCA frequency. High
workload and good SA were associated with average least STCAs out of the
four factors grouping. This may be expected, as a high workload may elicit
a higher level of alertness in participants (Repetti, 1989; Rose, Jenkins, &
Hurst, 1978) and a good SA would allow detection and prevention of
potential conflicts prior to a STCA. When these factors independently occur
with other factors (e.g. high workload and poor SA; low workload and good
SA) performance was similar. One interpretation of this finding is that
when factors are combined, a factor associated with increased performance
may moderate a factor that is associated with performance declines.
Findings also suggest that more performance variance may be
explained with the inclusion of multiple, co-occurring factors. This is
supported by statistical findings as more significant differences between
average performance measures were identified when associated with
triadic factor combinations as opposed to dyadic factor combinations (Table
9.6). Table 9.6 summarises the percentage of significant differences found
between performance measures when associated with single factors, co
occurring factor dyads and co-occurring factor triads.
Table 9.6. Percentage of significant differences between performance measures when associated with single factors, factor dyads and factor triads
High taskload 1 High taskload 2 Single factors 3 significantJ25 analyses = 1125 =4%
12%
Factor dyads 24/95 =25% 18/81 = 22% Factor triads 77/209 = 37% 50/151=33%
Table 9.6 confirms that as more factors are analysed in combination with
associated performance markers, more variance in performance is
explained, leading to more significant differences between levels of
performance. Findings therefore support the analysis of multiple factors to
gain a more comprehensive and potentially realistic view of human
performance in association with human factor influences.
211
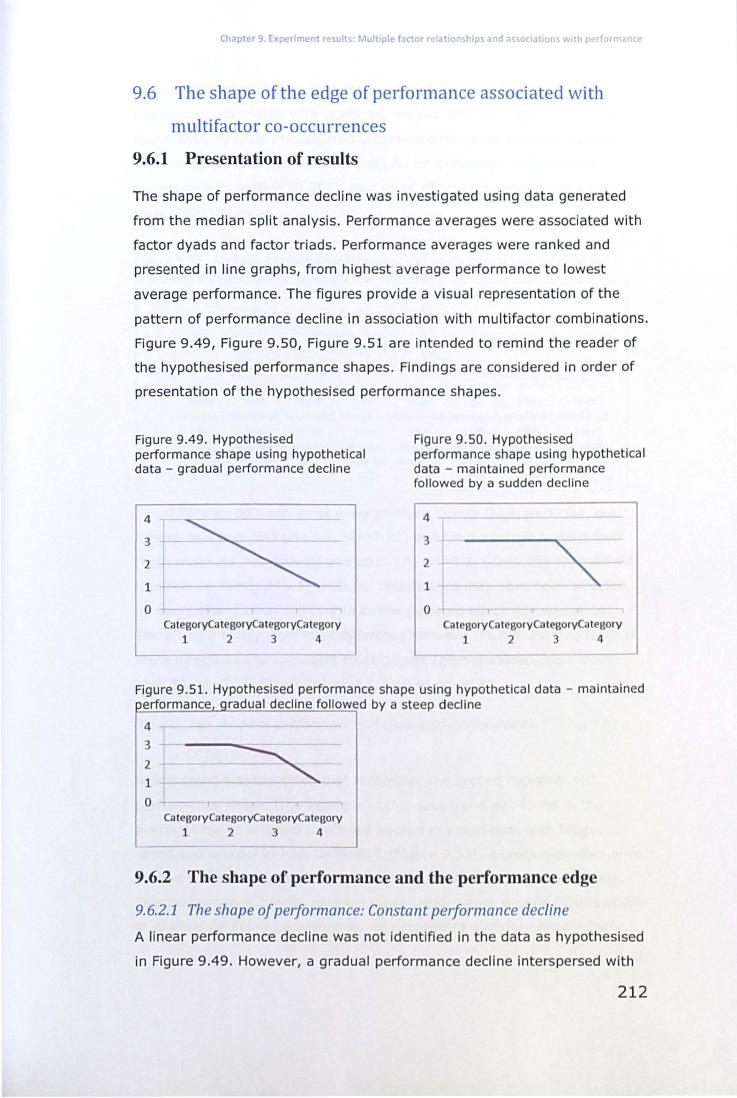
Chapter 9. Experiment results: Multiple factor relationships and associatlon~ with performance
9.6 The shape of the edge of performance associated with
multifactor co-occurrences
9.6.1 Presentation of results
The shape of performance decline was investigated using data generated
from the median split analysis. Performance averages were associated with
factor dyads and factor triads. Performance averages were ranked and
presented in line graphs, from highest average performance to lowest
average performance. The figures provide a visual representation of the
pattern of performance decline in association with multifactor combinations.
Figure 9.49, Figure 9.50, Figure 9.51 are intended to remind the reader of
the hypothesised performance shapes. Findings are considered in order of
presentation of the hypothesised performance shapes.
Figure 9,49. Hypothesised performance shape using hypothetical data - gradual performance decline
4
3
2
1
o CategoryCategoryCategoryCategory
1 23 4
Figure 9.50. Hypothesised performance shape using hypothetical data - maintained performance followed by a sudden decline
4
3
2
1
o tegoryCa tegoryCa t gory tegory
1 2 3 4
Figure 9.51. Hypothesised performance shape using hypothetical data - maintained erformance radual decline followed by a steep decline
4
3
2
1
o CategoryCategoryCategoryCategory 123 4
9.6.2 The shape of performance and the performance edge
9.6.2.1 The shape o/performance: Constant performance decline
A linear performance decline was not identified in the data as hypothesised
in Figure 9.49. However, a gradual performance decline interspersed with
212
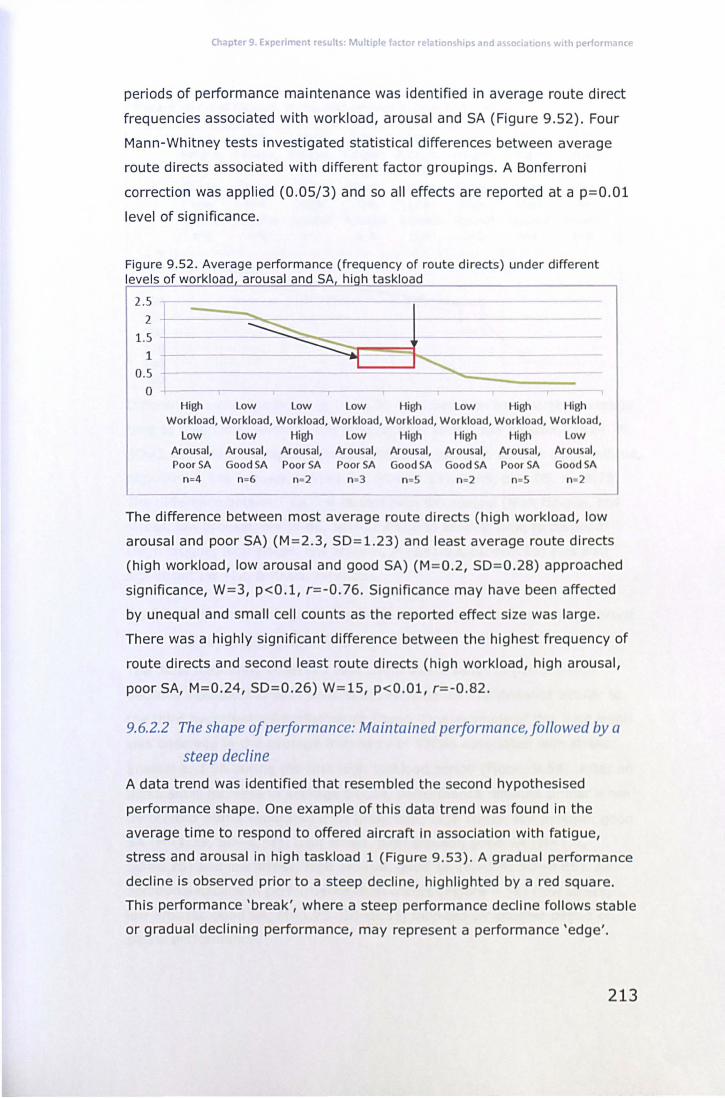
Chapter 9 Experiment results: MultIple factor relatIonshIps and associations wIth performance
periods of performance maintenance was identified in average route direct
frequencies associated with workload, arousal and SA (Figure 9.52). Four
Mann-Whitney tests investigated statistical differences between average
route directs associated with different factor groupings. A Bonferroni
correction was applied (0.05/3) and so all effects are reported at a p=O.Ol
level of significance.
Figure 9.52. Average performance (frequency of route directs) under different levels of workload arousal and SA hi h taskload
2.5 2 ---
1.5 1
0.5 o
High Low Low Low High Low High High Workload, Workload, Workload, Workload, Workload, Workload, Workload, Workload,
Low Low High Low High High High ow Arousal, Arousal, Arousal, Arousal, Arousal, Arou ai, Arousal, Arou ai, Poor SA Good SA Poor SA Poor SA Good SA Good SA Poor SA Good SA
n=4 n=6 n=2 n=3 n=2 n=S
The difference between most average route directs (high workload, low
arousal and poor SA) (M=2.3, 50=1.23) and least average route directs
(high workload, low arousal and good SA) (M= 0.2, 50= 0.28) approached
Significance, W=3, p<O.l, r=-0.76. Significance may have been affected
by unequal and small cell counts as the reported effect size was large.
There was a highly Significant difference between the highest frequency of
route directs and second least route directs (high workload, high arousal,
poor SA, M=0.24, 50=0.26) W= 15, p<O.Ol, r=-0.82.
9.6.2.2 The shape of performance: Maintained performance, followed by a
steep decline
A data trend was identified that resembled the second hypothesised
performance shape. One example of this data trend was found in the
average time to respond to offered aircraft in association with fatigue,
stress and arousal in high taskload 1 (Figure 9.S3). A gradual performance
decline is observed prior to a steep decline, highlighted by a red square.
This performance 'break', where a steep performance decline follows stable
or gradual declining performance, may represent a performance 'edge'.
213
Chapter 9. Experiment results' Multiple factor relationships and associations with performance
Figure 9.53. Average performance (time to respond to offered aircraft) under different levels of fatigue, stress and arousal in high taskload 1
Low High High Low Low Low High High Fatigue, Fatigue, Fatigue, Fatigue, Fatigue, Fatigue, Fatigue, Fatigue,
High Low Low High Low Low High High Stress, Stress, Stress, Stress, Stress, Stress, Stress, Stress,
Low Low High High Low High High Low Arousa l Arousal Arousal Arousa l Arousa l Arousa l Arousa l Arousa l
n=2 n=4 n=2 n=4 n=4 n=5 n=3 n=5 0 r 20
40 60 :!E) 80
I 100 120 --140 160
Differences were significant at the 0.05 level between the shortest average
time to respond to aircraft (low fatigue, high stress, low arousal, M= 24.76,
50=3.41) and the longest average time to respond to aircraft (high fatigue,
high stress, low arousal, M= 141.32, 50= 86.13), W= 3, p<0.05, r= -0.73.
The difference between second fastest time to respond (high fatigue, low
stress, low arousal, M=39.86, SO= 22.64) and slowest time to respond
(high fatigue, high stress, low arousal, M= 141.32, SO= 86.13) was also
significant (W=12, p<0.05, r= -0.65).
9.6.2.3 Performance shape 3: Gradually declining performance interspersed
with periods of maintenance
The most frequently observed data trend was a series of performance
declines interspersed with periods of performance maintenance similar to
the third hypothesised performance shape. One example of this data trend
was observed in the average frequency of STCAs associated with stress,
arousal and SA during the first high taskload period (Figure 9.54). After an
initial small increase in average 5TCAs, performance remains similar when
associated with 3 separate factor groupings, high stress, low arousal, good
SA (M = 1.35, 50= 0.57), high stress, high arousal, good SA (M = l.4,
50=0.75) and low stress, high arousal, good SA (M = 1.4, 50= 0.85). An
additional decline in performance then occurs (Figure 9.54) (low stress,
low arousal, good SA, M=1.75, SO= 0.53) followed by another period of
stable performance.
214
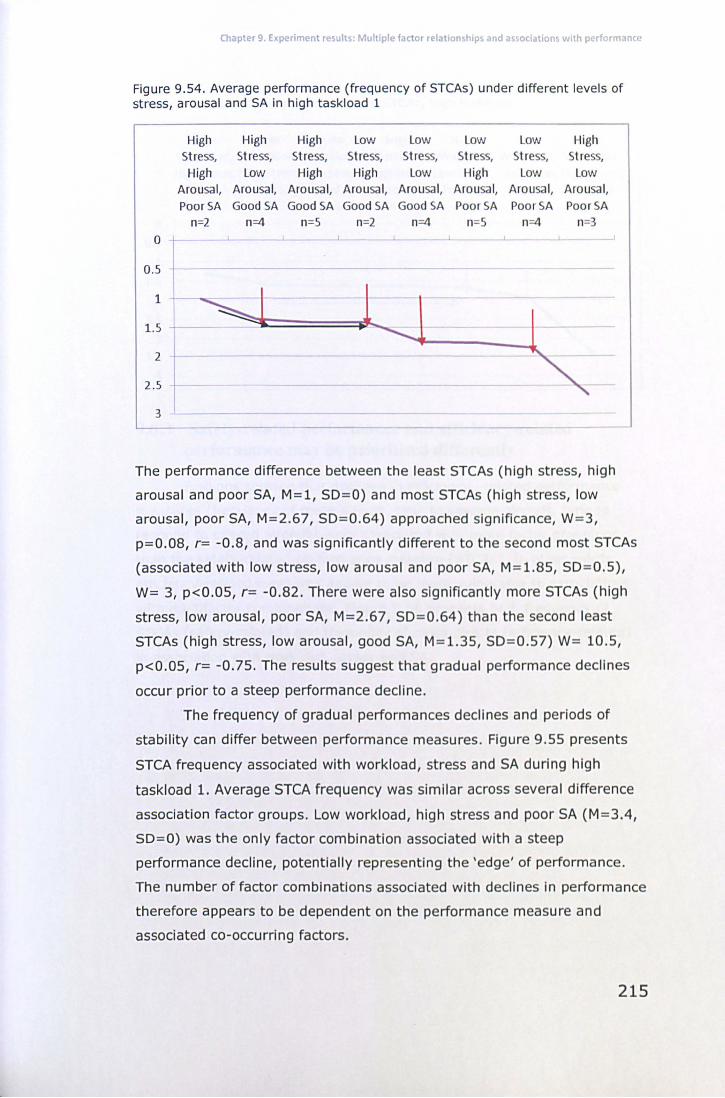
Chapter 9. Experiment results: Multiple factor relationships and associations with performance
Figure 9.54. Average performance (frequency of STCAs) under different levels of stress, arousal and SA in high taskload 1
High High High Low Low Low Low High Stress, Stress, Stress, Stress, Stress, Stress, Stress, Stress, High Low High High Low High Low Low
Arousa l, Arousal, Arousal, Arousa l, Arousa l, Arousa l, Arousa l, Arousa l, PoorSA Good SA Good SA Good SA Good SA Poor SA Poor SA Poor SA
n=2 n=4 n=5 n=2 n=4 n=5 n=4 n=3 0
0.5 1 1 J ~---
1.5
2
2 .5
3
The performance difference between the least STCAs (high stress, high
arousal and poor SA, M=l, 50= 0) and most STCAs (high stress, low
arousal, poor SA, M= 2.67, 50= 0.64) approached significance, W= 3,
p=O.OS, r= -O.S, and was significantly different to the second most STCAs
(associated with low stress, low arousal and poor SA, M= 1.S5, 50= 0.5),
W= 3, p<0.05, r= -0.S2. There were also significantly more STCAs (high
stress, low arousal, poor SA, M= 2.67, 50= 0.64) than the second least
STCAs (high stress, low arousal, good SA, M= 1.35, 50= 0.57) W= 10.5,
p<0.05, r= -0.75. The results suggest that gradual performance declines
occur prior to a steep performance decline.
The frequency of gradual performances declines and periods of
stability can differ between performance measures . Figure 9 .55 presents
STCA frequency associated with workload, stress and SA during high
taskload 1. Average STCA frequency was similar across several difference
association factor groups. Low workload, high stress and poor SA (M = 3.4,
50=0) was the only factor combination associated with a steep
performance decline, potentially representing the 'edge' of performance.
The number of factor combinations associated with declines in performance
therefore appears to be dependent on the performance measure and
associated co-occurring factors.
215
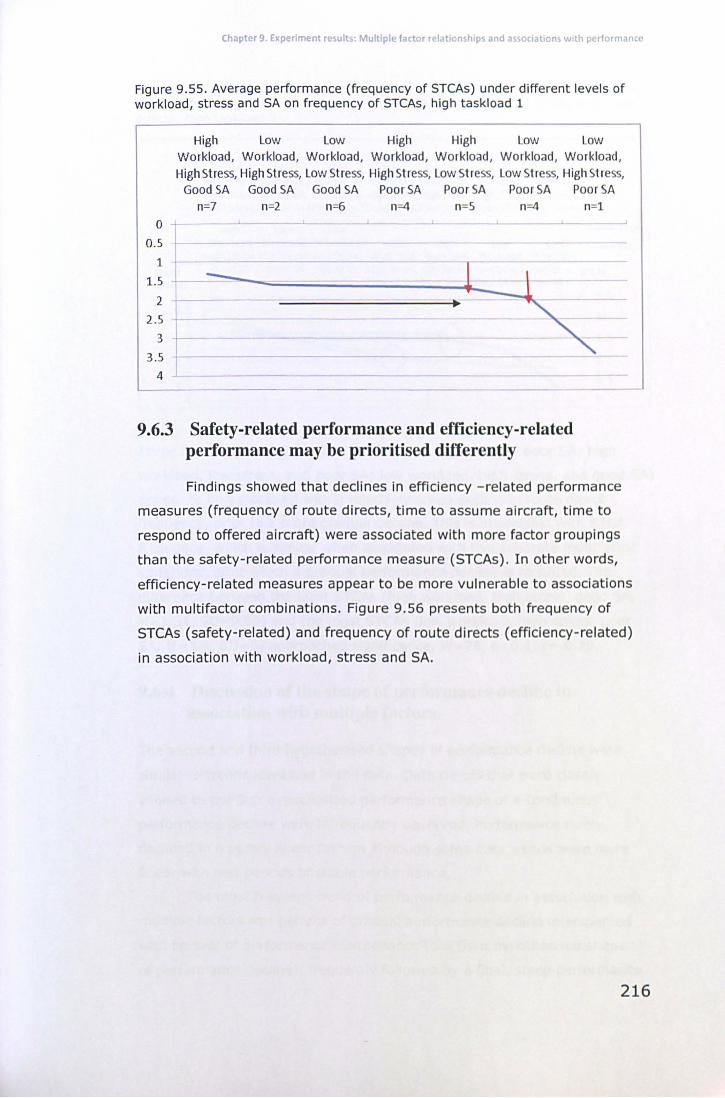
Chapter 9. Experiment results: Multiple factor relationships and associations with performance
Figure 9.55. Average performance (frequency of STCAs) under different levels of workload, stress and SA on frequency of STCAs, high taskload 1
1.5
2
2.5
3
3.5
4
High Low Low High High Low Low Workload, Workload , Workload, Workload, Workload, Workload, Workload, High Stress, High Stress, Low Stress, High Stress, Low Stress, Low Stress, High Stress,
Good SA Good SA Good SA Poor SA Poor SA Poor SA Poor SA n=7 n=2 n=6 n=4 n=5 n=4 n=l
1. 1. 1.
1_ ~
L::= 9.6.3 Safety-related performance and efficiency-related
performance may be prioritised differently
Findings showed that declines in efficiency -related performance
measures (frequency of route directs, time to assume aircraft, time to
respond to offered aircraft) were associated with more factor groupings
than the safety-related performance measure (STCAs) . In other words,
efficiency-related measures appear to be more vulnerable to associations
with multifactor combinations. Figure 9.56 presents both frequency of
STCAs (safety-related) and frequency of route directs (efficiency-related)
in association with workload, stress and SA.
216
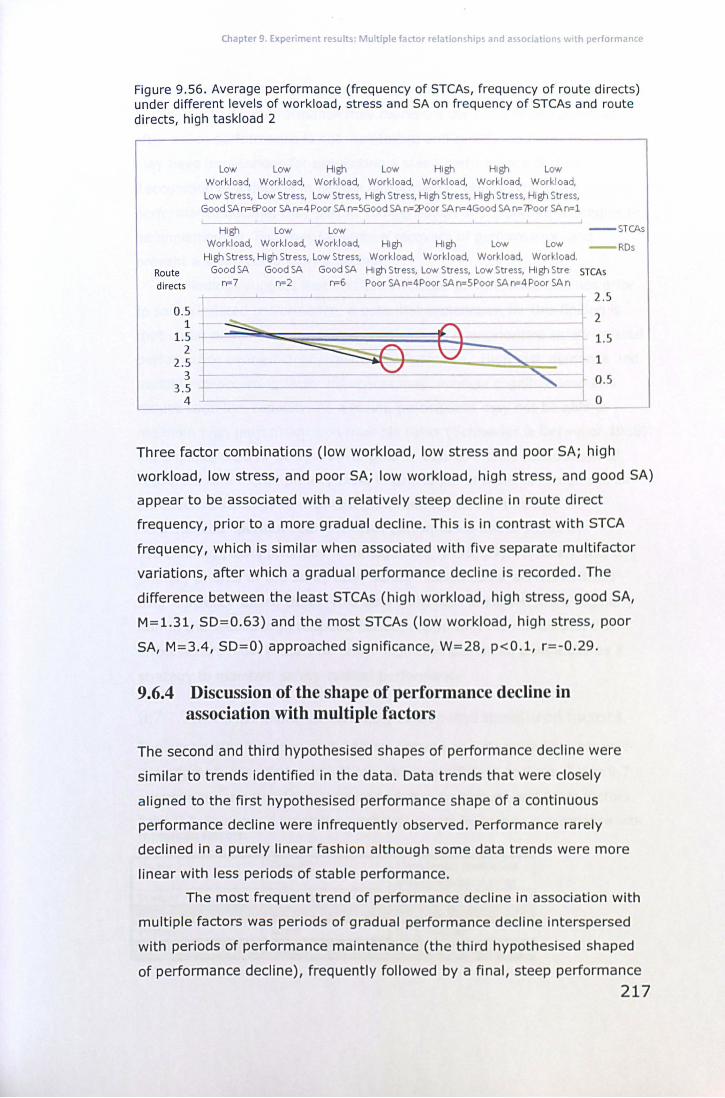
Chapter 9. Experiment results: Multiple factor relationships and associations with performance
Figure 9.56. Average performance (frequency of STCAs, frequency of route directs) under different levels of workload, stress and SA on frequency of STCAs and route directs, high taskload 2
Low Low High Low High High Low Workload, Workload, Workload, Workload, Workload, Workload, Workload, Low Stress, Low Stress, Low Stress, High Stress, High Stress, High Stress, High Stress,
Good SA n=EPoor SA n=4 Poor SA n=SGood SA n=b'oor SA n=4Good SA n= 7Poor SA n=1
High Low Low Workload, Workload, Workload, High High Low Low
High Stress, High Stress, Low Stress, Workload, Workload, Workload, Workload.
- STCAs
RDs
Route Good SA Good SA Good SA High Stress, Low Stress, Low Stress, High Stre STCAs directs n=7 n=2 n=6 Poor SAn=4Poor SAn=5Poor SAn=4Poor SAn
2.5
2
1.5
J 1
0.5
0
Three factor combinations (low workload, low stress and poor SA; high
workload, low stress, and poor SA; low workload, high stress, and good SA)
appear to be associated with a relatively steep decline in route direct
frequency, prior to a more gradual decline. This is in contrast with STCA
frequency, which is similar when associated with five separate multifactor
variations, after which a gradual performance decline is recorded. The
difference between the least STCAs (high workload, high stress, good SA,
M=1.31, 50=0.63) and the most STCAs (low workload, high stress, poor
SA, M=3.4, 50=0) approached significance, W= 28, p<O.l, r= -0.29.
9.6.4 Discussion of the shape of performance decline in association with multiple factors
The second and third hypothesised shapes of performance decline were
similar to trends identified in the data. Data trends that were closely
aligned to the first hypothesised performance shape of a continuous
performance decline were infrequently observed. Performance rarely
declined in a purely linear fashion although some data trends were more
linear with less periods of stable performance.
The most frequent trend of performance decline in association with
multiple factors was periods of gradual performance decline interspersed
with periods of performance maintenance (the third hypothesised shaped
of performance decline), frequently followed by a final, steep performance
217
Chapter 9. Experiment results: Multiple factor relationships and associations with performance
decline in association with change to a specific multifactor group. This
sudden decline in performance may represent the edge of performance,
after which performance is not maintained and rapidly declines. Findings
may have implications for preventing a steep performance decline.
Recognition of a decline in human performance, prior to the steep
performance decline, may permit compensation or supportive strategies to
be implemented. This may faCilitate a recovery of performance, and
prevent a steep performance decline.
Findings suggest that efficiency-related performance declines prior
to safety-related performance. A potential explanation for this finding is
that under demanding conditions, participants may prioritise safety- related
performance over efficiency-related performance. High task demands and
multiple co-occurring factor influences may increase cognitive load and
reduce cognitive capacity. As a result, participants may not be able to
maintain high performance on multiple tasks (Schneider & Detweiler 1988).
Participants shed or delay a lower priority task to enable reallocation of
resources to a higher priority task. Prioritisation of tasks is recognised as
an effective strategy to maintain performance, and in this way
"experienced operators can maintain performance under stress by
establishing [task] priorities" (Kontogiannis, 1999, p9). As safety was the
primary priority of the study task, safety-related tasks were prioritised
over efficiency-based tasks. This data trend was identified more regularly
during the second high taskload period, supporting the notion that this
effect occurs most frequently under high task demands, potentially as a
strategy to maintain safety-related performance.
9.7 The association between posture and measured factors
The association between participants' posture and measured factors was
investigated using Spearman's' correlation coefficient analysis. Table 9.7
summarises results of the association between posture and other factors.
Table 9.7. Spearman's correlation coefficient results for posture in association with measured factors.
Factor 1 Factor 2 Correlation coefficient and significance value
Posture Workload 0.17, p=0.0005 Posture Fatigue 0.1, p=O.16 NS
Posture Stress 0.2 1, p=0.OO3
Posture Arousal 0.14. p=0.059 NS
218
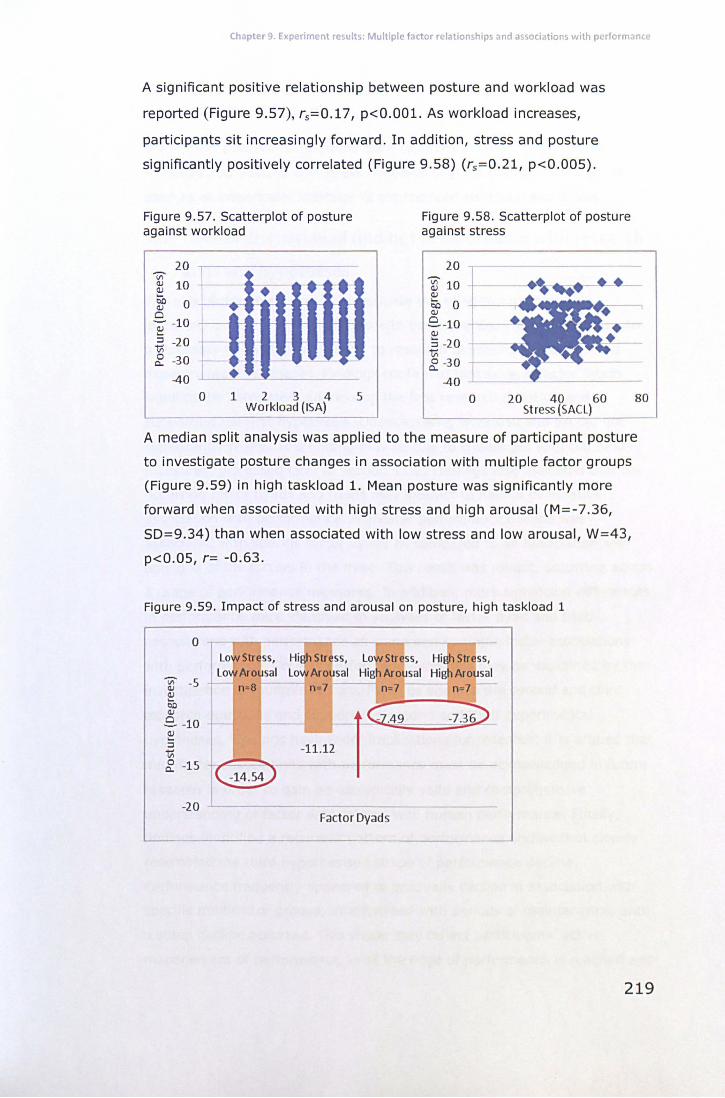
Chapter 9. Experiment results: Multiple factor relationships and associations with performance
A significant positive relationship between posture and workload was
reported (Figure 9.57), rs=0.17, p<O.OO1. As workload increases,
participants sit increasingly forward. In addition, stress and posture
significantly positively correlated (Figure 9.58) (rs= 0.21, p<0.005).
Figure 9.57. Scatterplot of posture against workload
20 Vi'
(IJ 10 ~ ~ 0 o 'a)' -10 .... ~ -20 ~ -3 0
-40
..... -- '. • • • - -
. ~ .
~
o 1 2 3 4 W orkload (ISA)
5
Figure 9.58. Scatterplot of posture against stress
20 ..,.--
~ 10 (IJ
~ 0 (IJ
e.. -10 -f----"'''W (IJ
::i -20 t; ~ -30
-40 o 20 40 60 80
St ress (SAC L) -'-------'
A median split analysis was applied to the measure of participant posture
to investigate posture changes in association with multiple factor groups
(Figure 9.59) in high taskload 1. Mean posture was significantly more
forward when associated with high stress and high arousal (M =-7.36,
SD= 9.34) than when associated with low stress and low arousal, W= 43,
p<0.05, r= -0.63.
Figure 9.59. Impact of stress and arousal on posture, high taskload 1
o
~ -5 ~ 0.0 (1)
e.. -10 ~ ::l t; ~ -15
-20
Lo Str ss, Hi Stress, Lo Aro sal Lo Arousal
n=8 n=7
-11.12
Fact o r Dyads
219
Chapter 9. Experiment results: Multiple factor relationships and associations with performance
9.7.1 Discussion of the association between posture and measured factors
Significant, positive correlations were reported between posture and
workload and posture and stress. Findings suggest that posture may be
used as an observable indicator of experienced workload and stress.
9.8 Overall discussion of findings in association with research
aims and hypotheses
The aim of this study was to investigate the relationships between
identified factors and associations with performance. This section provides
a summary of findings in relation to research questions and associated
experimental hypotheses. Findings confirmed that several factor dyads
significantly correlated, addressing the first research question and
supporting the first hypothesis. Unexpectedly, workload and SA did not
significantly relate. This finding may be due to challenges with the SPAM
measures, discussed later in section 11.S. Findings also indicated that co
occurring factor dyads and triads may interact to have a cumulative
association with performance. A greater performance decline was
associated with specific factor dyads as compared to an association with
only one of the factors in the dyad. This result was robust, occurring across
a range of performance measures. In addition, more significant differences
in performance were identified in analyses of factor dyad and triad
associations with performance as compared to single factor associations
with performance. Greater performance variance may be explained by the
investigation of multiple factors. Findings address the second and third
research questions and support the second and third experimental
hypotheses. Findings have wider implications for research; it Is argued that
multifactor associations with performance must be acknowledged in future
research in order to gain an ecologically valid and comprehensive
understanding of factor associations with human performance. Finally,
findings identified a recurrent pattern of performance decline that closely
resembled the third hypothesised shape of performance decline.
Performance frequently appeared to gradually decline in association with
specific multifactor groups, interspersed with periods of maintenance, until
a steep decline occurred. This shape may reflect participants' active
management of performance, until the edge of performance is reached and
220
Chapter 9. Experiment results: Multiple factor relationships and associations with performance
performance rapidly declines. Implications of this finding are important for
operational centres; if gradual performance decline are identified,
supportive strategies may be able to be implemented to prevent a steep
performance decline. Findings supported the fourth research aim and
experimental hypothesis.
9.9 Chapter summary
This chapter presented results from an experimental study, outlined in the
previous chapter (chapter eight). Naive partiCipants took part in a computer
based cognitive task with en-route ATC elements. Taskload was manipulated as
the independent variable to create variability in the data. The selected subgroup
of factors (workload, fatigue, stress, arousal and SA) was measured through
self-report scales. Performance was the dependent variable and measured in
terms of safety and efficiency. Safety performance was measured by the
frequency of short-term conflict alerts (STCAs) and efficiency was measured by
the frequency of route directs, time to assume aircraft and time to respond to
offered aircraft. Results are presented in accordance with research questions.
Descriptive data is first presented which provides an overview of measures
across the simulation. Findings on associations between each factor and
performance, using correlation analyses, are subsequently presented. Findings of
the covariance between multiple factors, and interactions with performance are
then presented. Research findings of the nature of performance decline around
the edge of performance are described. Differences in safety and efficiency
related performance are presented. The chapter concludes by stating that each
research question was addressed. In spite of some experiment and statistical
analyses limitations, results suggest interactions between factors may occur to
have a greater negative association with performance. The next chapter
(Chapter 10) continues the presentation of experimental results by presenting
findings of participant behaviours in association with performance.
221
Chapter 10. Indicators of potential performance decline: Findings from an experiment study and interview study
Chapter 10. Indicators ofpotential
performance decline: Findings from an
experiment study and interview study
10.1 Chapter Overview
This chapter presents findings collected during the previous experiment
(Chapter 8) and an interview study with en-route air traffic controllers that
investigate indicators of potential performance decline. Findings from the
experiment study are presented first. Findings support an association
between specific partiCipant behaviours and the potential for participant
performance decline. Findings were extended with an interview study
conducted with en-route ATCOs, which is subsequently presented in
section 10.3. The study aimed to investigate the use of indicators in ATC,
and identify specific indicators of performance decline. Findings confirmed
that controllers use both internal, subjective indicators and overt, objective
indicators as markers of potential performance decline, for their own
performance and for colleagues' performance.
10.2 Continuation of experimental study findings: Observed
participant behaviours
10.2.1 Observed participant behaviours: Method
Data was recorded as part of the experiment trial as previously described
in Chapter 8.
10.2.2 Observed participant behaviours: Process to refine observed behaviours as indicators of potential performance decline
Behaviours were observed throughout the experiment trial. For analysis,
the observed behaviours were summed for each 20 minute taskload period
(excluding transitions). A total of 137 participant behaviours were recorded
(Appendix 15). It was not practical to investigate the association between
137 behaviours and five single factors (workload, fatigue, stress, arousal,
SA) and four performance measures (frequency of STCAs, frequency of
222
Chapter 10. Indicators of potential performance decline: Findings from an experiment study and interview study
route directs, time to assume aircraft, time to respond to offered aircraft).
The behaviour set was therefore reduced through a refinement process,
documented in sections 10.2.2.1. and 10.2.2.2.
10.2.2.1 Refinement consideration 1: Sensitivity to changes in the
experienced level of each factor and changes in performance
Previous findings indicated that an association existed between taskload
and self-reported factors (section 9.2.2). Therefore if participant
behaviours were indicative of experienced factors, it was expected that the
frequency of the observed behaviours will also vary in association with
taskload periods. The discrepancy in behaviour frequency between high
and low taskloads was calculated. The range of frequency differences was
suggested to reflect the sensitivity of the marker - a larger difference may
indicate a large association between the behaviour and factor.
Any marker that had a total difference of 10 points or less between
taskloads was removed. This low score suggested that indicators did not
vary with the taskloads, and were therefore not sensitive to subjective
experience. This cut score was arbitrary in that the number 10 only
represented a low variation in behaviour frequency. However, the cut score
was supported by a visual examination of the data. Frequency patterns of
behaviours with a total discrepancy between taskloads of 11 or more were
more consistent and observable.
A total of 82 behaviours were removed, leaving 55 behaviours. The
number of participants that demonstrated the removed behaviours ranged
from 1-16 although the majority of behaviours (89%) were demonstrated
by less than six participants. Behaviours that were less sensitive also
appeared to be less common between participants. Behaviours recorded
for 6 or more participants (14 Indicators, 17%) were reviewed in case the
arbitrary cut point had excluded factors incorrectly. However, behaviour
frequencies did not vary in association with taskload, and so were excluded
from further analysis.
10.2.2.2 Refinement consideration 2: Commonality of indicators between
participants
Data were examined for the frequency of participants exhibiting observed
behaviours. Only indicators that were common between individuals, and
not idiosyncratic, were of interest. Indicators that were exhibited by three
223
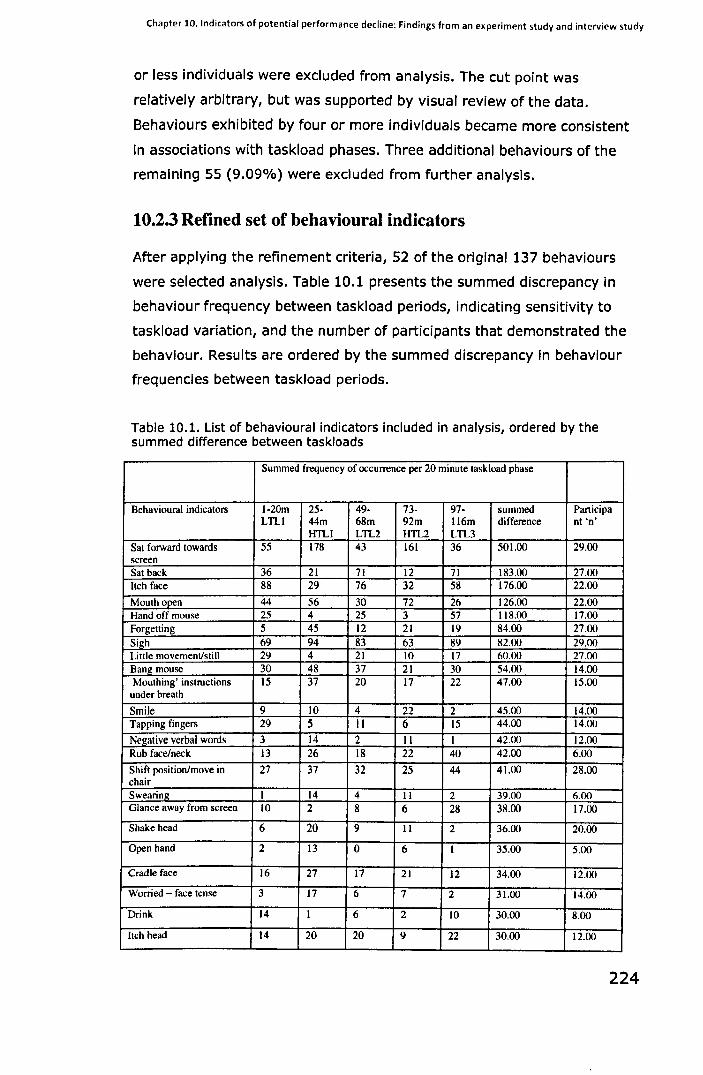
Chapter 10. Indicators of potential performance decline: Findings from an experiment study and interview study
or less individuals were excluded from analysis. The cut point was
relatively arbitrary, but was supported by visual review of the data.
Behaviours exhibited by four or more individuals became more consistent
in associations with taskload phases. Three additional behaviours of the
remaining 55 (9.09%) were excluded from further analysis.
10.2.3 Refined set of behavioural indicators
After applying the refinement criteria, 52 of the original 137 behaviours
were selected analysis. Table 10.1 presents the summed discrepancy in
behaviour frequency between taskload periods, indicating sensitivity to
taskload variation, and the number of participants that demonstrated the
behaviour. Results are ordered by the summed discrepancy in behaviour
frequencies between taskload periods.
Table 10.1. List of behavioural indicators included in analysis, ordered by the summed difference between taskloads
Summed frequency of occurrence per 20 minute task load phase
Behavioural indicators I-20m 25- 49- 73- 97- summed Panicipa LTI..1 44m 68m 92m 116m difference nt 'n'
HTI..I LTI..2 HTI..2 LTI..3 Sat forward towards 55 178 43 161 36 501.00 29.00 screen Sat back 36 21 71 12 71 183.00 27.00 Itch face 88 29 76 32 58 176.00 22.00
Mouth open 44 56 30 72 26 126.00 22.00 Hand off mouse 25 4 25 3 57 118.00 17.00 Forgetting 5 45 12 21 19 84.00 27.00 Sigh 69 94 83 63 89 82.00 29.00 Little movement/still 29 4 21 10 17 60.00 27.00 Bang mouse 30 48 37 21 30 54.00 14.00 Mouthing' instructions 15 37 20 17 22 47.00 15.00 under breath
Smile 9 10 4 22 2 45.00 14.00 Tapping fingers 29 5 11 6 15 44.00 14.00
Nel(ative verbal words 3 14 2 II I 42.00 12.00 Rub face/neck \3 26 18 22 40 42.00 6.00
Shift position/move in 27 37 32 25 44 41.00 28.00 chair Swearing I 14 4 II 2 39.00 6.00 Glance away from screen IO 2 8 6 28 38.00 17.00
Shake head 6 20 9 II 2 36.00 20.00
Open hand 2 \3 0 6 I 35.00 5.00
Cradle face 16 27 17 21 12 34.00 12.00
Worried face tense 3 17 6 7 2 31.00 14.00
Drink 14 I 6 2 IO 30.00 8.00
Itch head 14 20 20 9 22 30.00 12.00
224
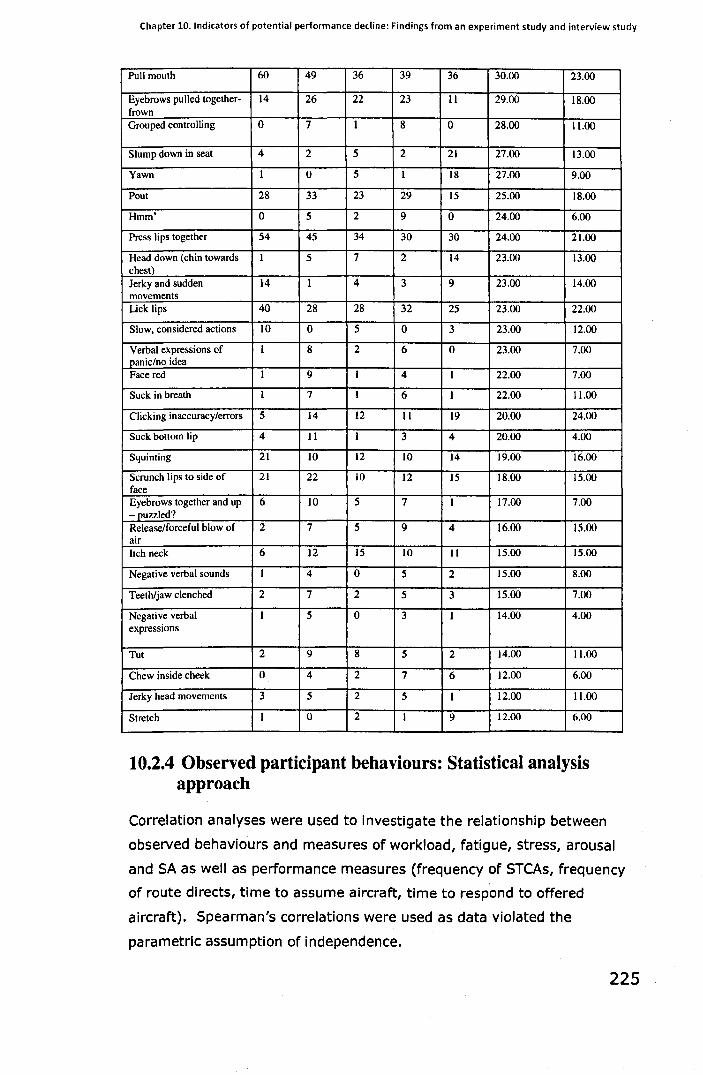
Chapter 10. Indicators of potential performance dedine: Findings from an experiment study and interview study
Pull mouth 60 49 36 39 36 30.00 23.00
Eyebrows pulled together- 14 26 22 23 11 29.00 18.00 frown Grouped controlling 0 7 1 8 0 28.00 11.00
Slump down in seat 4 2 5 2 21 27.00 13.00
Yawn 1 0 5 1 18 27.00 9.00
Pout 28 33 23 29 15 25.00 18.00
Hmm' 0 5 2 9 0 24.00 6.00
Press Ii ps together 54 45 34 30 30 24.00 21.00
Head down (chin towards 1 5 7 2 14 23.00 13.00 chest) Jerky and sudden 14 1 4 3 9 23.00 14.00 movements Lick lips 40 28 28 32 25 23.00 22.00
Slow, considered actions 10 0 5 0 3 23.00 12.00
Verbal expressions of 1 8 2 6 0 23.00 7.00 panic/no idea Face red 1 9 1 4 1 22.00 7.00
Suck in breath 1 7 1 6 1 22.00 11.00
Clicking inaccuracy/errors 5 14 12 11 19 20.00 24.00
Suck bottom lip 4 11 1 3 4 20.00 4.00
Squinting 21 10 12 10 14 19.00 16.00
Scrunch lips to side of 21 22 10 12 15 18.00 15.00 face Eyebrows together and up 6 10 5 7 1 17.00 7.00 -puzzled? Release/forceful blow of 2 7 5 9 4 16.00 15.00 air Itch neck 6 12 15 10 11 15.00 15.00
Negative verbal sounds 1 4 0 5 2 15.00 8.00
Teeth/jaw clenched 2 7 2 5 3 15.00 7.00
Negative verbal 1 5 0 3 1 14.00 4.00 expressions
Tut 2 9 8 5 2 14.00 11.00
Chew inside cheek 0 4 2 7 6 12.00 6.00
Jerky head movements 3 5 2 5 1 12.00 11.00
Stretch 1 0 2 1 9 12.00 6.00
10.2.4 Observed participant behaviours: Statistical analysis approach
Correlation analyses were used to investigate the relationship between
observed behaviours and measures of workload, fatigue, stress, arousal
and SA as well as performance measures (frequency of STCAs, frequency
of route directs, time to assume aircraft, time to respond to offered
aircraft). Spearman's correlations were used as data violated the
parametric assumption of independence.
225
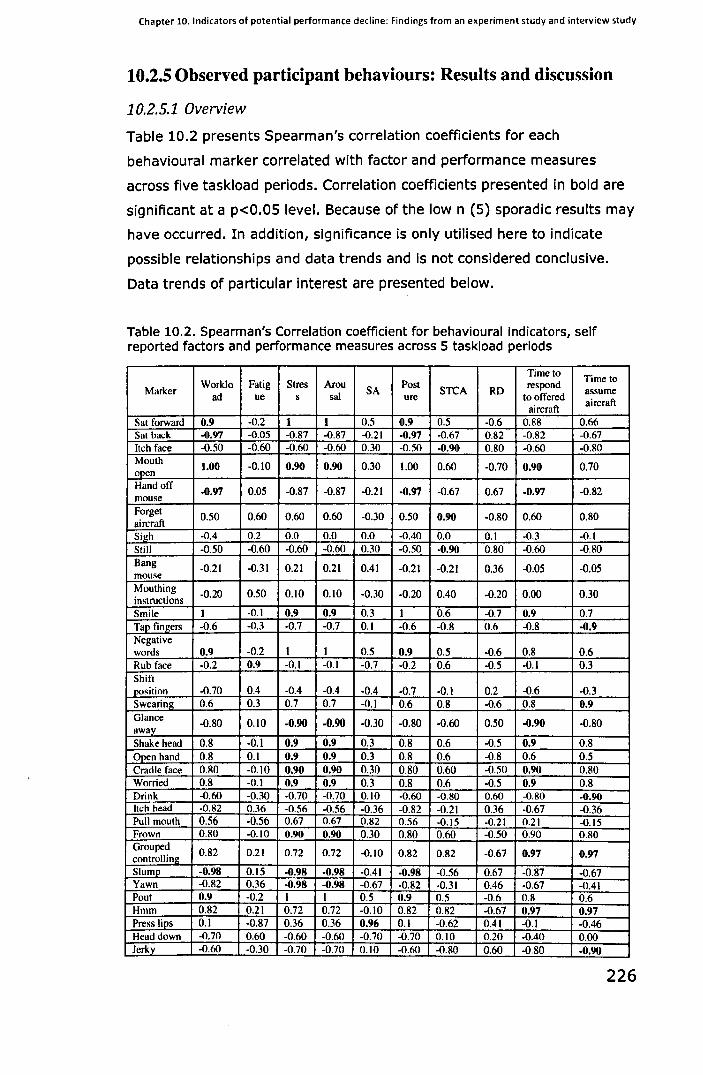
Chapter 10. Indicators of potential performance decline: Findings from an experiment study and interview study
10.2.5 Observed participant behaviours: Results and discussion
10.2.5.1 Overview
Table 10.2 presents Spearman's correlation coefficients for each
behavioural marker correlated with factor and performance measures
across five taskload periods. Correlation coefficients presented in bold are
significant at a p<0.05 level. Because of the low n (5) sporadic results may
have occurred. In addition, significance is only utilised here to indicate
possible relationships and data trends and is not considered conclusive.
Data trends of particular interest are presented below.
Table 10.2. Spearman's Correlation coefficient for behavioural indicators, self reported factors and performance measures across 5 taskload periods
Time to Time to
Marker Worklo Fatig Stres Arou
SA Post
STCA RD respond
ad sal to offered assume
ue s ure aircraft
aircraft Sat forward 0.9 -0.2 1 1 0.5 0.9 0.5 -0.6 0.88 0.66 Sat back -0.97 -0.05 -0.87 -0.87 -0.21 -0.97 -0.67 0.82 -0.82 -0.67 Itch face -0.50 -0.60 -0.60 -0.60 0.30 -0.50 ·0.90 0.80 -0.60 -0.80 Mouth
1.00 -0.10 0.90 0.90 open
0.30 1.00 0.60 -0.70 0.90 0.70
Hand off ·0.97 0.05 -0.87 -0.87 -0.21 -0.97 -0.67 0.67 -0.97 -0.82
mouse Forget
0.50 0.60 0.60 0.60 -0.30 0.50 0.90 -0.80 0.60 0.80 aircraft Sigh -0.4 0.2 0.0 0.0 0.0 -0.40 0.0 0.1 -0.3 -0.1 Still -0.50 -0.60 -0.60 -0.60 0.30 -0.50 -0.90 0.80 -0.60 -0.80 Bang -0.21 -0.31 0.21 0.21 0.41 -0.21 ·0.21 0.36 -0.05 -0.05 mouse Mouthing
-0.20 0.50 0.10 0.10 -0.30 -0.20 0.40 -0.20 0.00 0.30 instructions Smile 1 -0.1 0.9 0.9 0.3 I 0.6 ·0.7 0.9 0.7 Tap fingers -0.6 -0.3 -0.7 -0.7 0.1 -0.6 -0.8 0.6 -0.8 -0.9 Negative words 0.9 -0.2 1 1 0.5 0.9 0.5 -0.6 0.8 0.6 Rub face -0.2 0.9 -0.1 -0.1 -0.7 ·0.2 0.6 -0.5 -0.1 OJ Shift position -0.70 0.4 -0.4 -0.4 -0.4 -0.7 -0.1 0.2 -0.6 -OJ Swearing 0.6 0.3 0.7 0.7 -0.1 0.6 0.8 -0.6 0.8 0.9 Glance
-0.80 0.10 -0.90 -0.90 -0.30 -0.80 -0.60 0.50 -0.90 -0.80 away Shake head 0.8 -0.1 0.9 0.9 0.3 0.8 0.6 -0.5 0.9 0.8 Open hand 0.8 0.1 0.9 0.9 0.3 0.8 0.6 -0.8 0.6 0.5 Cradle face 0.80 -0.10 0.90 0.90 0.30 0.80 0.60 -0.50 0.90 O.RO Worried 0.8 -0.1 0.9 0.9 0.3 0.8 0.6 -0.5 0.9 0.8 Drink -0.60 -0.30 -0.70 -0.70 0.\0 -0.60 -0.80 0.60 -0.80 ·0.90 Itch head -0.82 0.36 -0.56 -0.56 -0.36 -0.82 -0.21 0.36 -0.67 -0.36 Pull mouth 0.56 -0.56 0.67 0.67 0.82 0.56 -0.15 -0.21 0.21 -0.15 Frown 0.80 -0.\0 0.90 0.90 0.30 0.80 0.60 -0.50 0.90 0.80 Grouped 0.82 0.21 0.72 0.72 -0.\0 0.82 0.82 -0.67 0.97 0.97 controlling Slump -0.98 0.15 -0.98 -0.98 -0.41 ·0.98 -0.56 0.67 -0.87 -0.67 Yawn -0.82 0.36 -0.98 -0.98 -0.67 -0.82 -0.31 0.46 -0.67 -0.41 Pout 0.9 -0.2 1 I 0.5 0.9 0.5 -0.6 0.8 0.6 Hmm 0.82 0.21 0.72 0.72 -0.10 0.82 0.82 -0.67 0.97 0.97 Press lips 0.1 -0.87 0.36 0.36 0.96 0.1 -0.62 0.41 -0.1 -0.46 Head down -0.70 0.60 -0.60 -0.60 -0.70 -0.70 0.\0 0.20 -0.40 0.00 Jerky -0.60 -0.30 -0.70 -0.70 0.\0 -0.60 -O.RO 0.60 -0.80 -0.90
226

Chapter 10. Indicators of potential performance decline: Findings from an experiment study and interview study
movements Lick lips 0.62 -0.67 0.46 0.46 0.67 0.62 -0.21 -0.05 0.36 -0.05 Slow actions -0.56 -0.67 -0.56 -0.56 0.41 -0.56 -0.98 0.87 -0.67 -0.87 Verbal panic 0.8 -0.1 0.9 0.9 0.3 0.8 0.6 -0.5 0.9 0.8 Face red 0.78 0.22 0.89 0.89 0.11 0.78 0.78 -0.78 0.78 0.78 Suck in breath 0.78 0.22 0.89 0.89 0.11 0.78 0.78 -0.78 0.78 0.78 Clicking -0.50 0.70 -0.30 -0.30 -0.60 -O.SO 0.30 -0.\0 -0.30 0.\0 inaccurate Suck lip 0.1 0.1 0.41 0.41 0.31 0.1 0.1 -0.36 -0.15 -O.IS Squint -0.67 -0.36 -0.67 -0.67 0.21 -0.67 -0.87 0.67 -0.87 -0.98 Scrunch lips 0.2 -0.1 0.5 0.5 0.5 0.2 0.0 -0.3 -0.1 -0.2 Puzzled 0.90 -0.20 1.00 1.00 0.50 0.90 0.50 -0.60 0.80 0.60 Release air 0.7 0.4 0.6 0.6 -0.3 0.7 0.9 -0.7 0.9 1 Itch neck -0.30 0.10 -0.\0 -0.10 -0.20 -0.30 0.10 0.30 0.10 0.30 Negative verbal sounds 0.7 0.6 0.6 0.6 -0.3 0.7 0.9 -1 0.6 0.7 Jaw clenched 0.56 0.56 0.67 0.67 -0.21 0.S6 0.87 -0.87 0.S6 0.72 Negative verbal expressions 0.72 0.31 0.82 0.82 0.1 0.72 0.72 -0.87 0.S6 0.S6 Tut 0.41 -0.1 0.62 0.62 0.21 0.41 0.41 -O.IS 0.67 0.67 Chew inside 0.30 0.90 0.10 0.10 -0.80 0.30 0.90 -0.80 0.40 0.70 cheek Jerky head 0.97 movements
-0.15 0.97 0.97 0.41 0.97 0.S6 -0.67 0.87 0.67
Stretch -0.82 0.36 -0.98 -0.98 -0.67 -0.82 -0.31 0.46 -0.67 -0.41
10.2.5.2 The relationship between observed participant behaviours and self-
reported factors
Jerky and rapid head movements are significantly correlated with workload,
possibly because participants need to scan faster with the presence of
more aircraft. Negative verbal statements are also Significantly positively
correlated with workload. Fatigue is Significantly related to only two
indicators. There is no clear indication of why these relationships have
occurred and they may be spurious. Unexpectedly, fatigue did not
significantly correlate with yawning. The relationship was in the expected
direction, although weak. This may be a result of low n(5) affecting
statistical power. The findings for stress and arousal are identical. This was
not expected and the reasons are unclear. It may be that the reduction of
the data created the same pattern of variation occurred between stress
and arousal. When measures were averaged across 20 minute taskload
periods, correlation findings may have co-varied to a similar extent.
Alternatively, it may be that observable behaviours may not be sensitive
enough to differentiate between the related concepts of stress and arousal.
227
Chapter 10. Indicators of potential performance decline: Findings from an experiment study and interview study
Stress and arousal significantly positively correlated with several indicators,
again in the direction expected. For example, glancing away from the
screen is significantly negatively correlated with stress, suggesting that if
stress is high participants are more focused on the screen. If
stress/arousal is low, participants may glance from the screen more often.
Finally, yawning was significantly negatively associated with stress and
arousal.
10.2.5.3 Relationships between participant behavioural indicators and
measures of performance
STCAs are significantly positively correlated with observed instances of
forgetting aircraft. In addition, STCAs are also Significantly positively
correlated with negative verbal sounds which may be expected. Frequency
of route directs do not Significantly relate with any marker. This may be
because this efficiency-related action is a lower priority and may correlate
more with workload than behavioural indicators or underlying cognitive
state. Time to respond to offered aircraft is related to several Indicators.
Some relationships appear counter-intuitive. For example, glancing away
from screen and frequency of participant taking their hand off of the
mouse are both significantly negatively associated with time to respond to
offered aircraft. If participants have a lower workload, which is also
Significantly associated with glancing away from the screen, partiCipants
may also have the capacity to respond to aircraft faster. It is suggested
that higher demands on the partiCipant may lead to negative expressions
such as swearing, and efficiency tasks such as time to respond to offered
aircraft are not prioritised.
The investigation of indicators of performance decline had both
theoretical and practical motivations. Identification of behavioural
indicators that may be associated with performance will contribute to the
relatively sparse literature on behavioural indicators of performance
(Sharples et al., 2012). A practical application of the findings is a
contribution to identification of indicators of potential performance decline.
228
Chapter 10. Indicators of potential performance decline: Findings from an experiment study and interview study
10.3 Interview study with en-route air traffic controllers
10.3.1 Interview study: Aims
The aim of this study was to generate expert opinion regarding the
indicators of potential performance decline in an ATC setting. An additional
aim was to identify indicators that were commonly associated with specific
factor influences on performance.
10.3.2 Pilot study: Focus groups
A focus group study was conducted to investigate if indicators of potential
performance decline were used in an ATC setting. It was necessary to gain
support for this concept from a sample of ATC professionals prior to
investing additional time and resources into a detailed investigation. In
addition, the focus group served as a pilot study.
10.3.2.1 Pilot study: Aim and research questions of the focus group study
The aim of the pilot study was to investigate the concept of indicators of
performance decline within an ATC setting.
10.3.2.2 Pilot study: Method of focus groups
10.3.2.2.1 Design
One semi-structured focus group interview, lasting a total of 160 minutes,
including a 20 minute refreshment break, was conducted as a pilot study
to investigate expert opinion on the use of indicators of potential
performance decline in ATC settings. The focus group interview, defined as
an Interactive, discussion-based interview with a small group of
partiCipants (Millward, 2006) was selected as the expert knowledge
elicitation method for the pilot study as it "stimulates memories, discussion,
debate and disclosure in a way that is less likely in a one-to-one Interview"
(Millward, 2006, p279). Participants were three ex-controllers. The focus
group took place in a large meeting room at the EUROCONTROL
Experimental Centre. PartiCipants were fully informed about the research
aims. To facilitate disclosure, confidentiality was emphasised. An interview
schedule guided the progression of discussion topics. Participants were
asked a total of 15 lead, open-ended questions (e.g. "What is your
understanding of indicators of potential performance decline?"). The
229
Chapter 10. Indicators of potential performance decline: Findings from an experiment study and interview study
interview schedule was reviewed independently by two human factors'
professionals prior to use. Probing questions were used to follow up
participant responses. The focus group was recorded via two dictaphones,
and the moderator made written notes. The recordings were transcribed
and a thematic analysis was conducted. The focus group used an
essentialist position approach and focused on the intensity and frequency
of themes as opposed to the "processes of social interaction" (Millward,
2006, p279) which is a priority in the social constructivist approach.
10.3.2.2.2 Selection of factors for inclusion
Participants were asked to specify indicators of potential performance
decline in relation to a selection of human factors: Workload, fatigue,
stress, SA, communications, teamwork. This factor set was identified for
inclusion in studies during the second research stage (Chapters 5-7). There
are some differences to this factor set compared to the factors included in
the experimental study. Teamwork and communications were reintroduced
in this interview study as it was feasible to do so. Arousal is no longer
included. Arousal was specifically included in the experimental study only
as Cox and Mackay (1985) recommend to measure stress and arousal
concurrently.
10.3.2.2.3 Participants
Participants were three ex-ATCOs based at EUROCONTROL experimental
centre (one female and two males). An opportunity sample was used to
select participants. Participants were required to have previous experience
as an en-route controller. Participants' age ranged from 51-60. Participants
responded to grouped age ranges and so an average cannot be determined.
Experience in en-route ATC ranged from 14 years - 27 years, with an
average of 20.33 years. Participants controlled In different countries:
Ireland, Sweden and the UK. Participants knew each other from the same
work place, and were role-homogenous.
10.3.2.2.4 Materials
The focus group was conducted using a question schedule. Topics were
selected to address the research questions and In addition, explore related
topics to gain a wider understanding of the concept and use of indicators of
performance in an ATC setting. The question categories were designed to
begin with general questions relating to experience of performance limits
230
Chapter 10. Indicators of potential performance decline: Finding~ from an experiment study and interview study
and indicators, and narrowing focus to specific indicators and the meanings
of those indicators. The focus group was semi-structured and participant
responses to lead questions were followed with appropriate probes;
participants were also encouraged to discuss other topics which they felt
were related but had not been addressed in the lead questions.
Other materials included an introduction to the focus group, an
informed consent form, a demographic questionnaire and a debrief. The
session was recorded using two Olympus DSS Standard digital recorders.
10.3.2.2.5 Procedure
Ex-controllers based at the EUROCONTROL Experimental Centre (EEC)
were identified by the industrial sponsor and were invited to take part in
the study. On the day of the session, as per Breen's (2006)
recommendations, participants were welcomed into the room and offered
refreshments. Participants were asked to read the Introduction to the
Session document and sign the informed consent form if they were happy
to continue. Participants then completed the demographic questionnaire.
The session was then structured according to the Interview schedule. A
process-facilitation style of moderation was selected which advocates low
control over what is discussed, but control over the process and
interactions between participants. This moderator style ensured that all
topics of interest were discussed, and maximised involvement from each
participant. After 80 minutes participants had a 20 minute refreshment
break. The session was reopened with a recap of discussion pOints. The
focus group lasted for a total of 160 minutes. Once the question schedule
was complete participants were asked if they had any further comments.
The session was then closed. Participants received a debrief and were then
thanked for their time. The session was recorded with a digital recorder
and was transcribed for analysis.
10.3.2.3 Pilot study: Strategy of analysis
The session recording was transcribed orthographically. A thematic
analysis was selected to Identify meaningful themes.
10.3.2.4 Pilot study: Focus group results and discussion
All participants agreed with the concept of a performance 'edge' or 'limits'
and suggested that controllers instinctually sense when they have the
potential for performance decline. A distinction was made between 231
Chapter 10. Indicators of potential performance decline: Findings from an experiment study and interview study
indicators that were internal to the controller (e.g. feeling nervous or
uncomfortable with the traffic situation) and indicators that were overt (e.g.
changing voice pitch and speed). All participants agreed that both internal
and external indicators are used by controllers to determine when they or
colleagues are susceptible to potential performance decline. All participants
agreed that some indicators were specific to experienced factor influences.
For example, participants identified that if a colleague was fatigued,
indicators of a potential performance decline may be slower reactions or
falling behind traffic. Agreement with these concepts provides support for
further investigation of the use of indicators of potential performance
decline in ATe.
Participants agreed that the factor set included for discussion was
meaningful. However, all participants recommended a separate category
for vigilance. It was expressed that different indicators were associated
with vigilance issues as compared to SA issues. Therefore, SA and vigilance
will be included as separate categories in the next study. Vigilance was
combined with attention and presented to participants as one category, for
completeness. Participants had the option of responding to vigilance and
attention separately, although based on previous findings (see Chapter 6)
many controllers do not colloquially differentiate between attention and
Vigilance.
Overall, participants agreed that the questions were meaningful and
presented in a logical order. However it was identified that participants
found it difficult to respond to direct requests to specify indicators. Asking
participants to share their experience of specific situations which included
indicators elicited more Information. This will influence the creation of the
design of future questions. It is possible that this effect arose from the use
of Indicators becoming 'instinctual' with experience and therefore used
automatically with less conscious awareness.
The group dynamic may have Influenced participant responses. One
participant forcefully emphasised that indicators, although used in ATM
settings, cannot be indicative of specific issues; "Looking for handy
indicators is kind of like taking the easy way out". Other participants
initially disagreed, and gave several examples of indicators having clear
meanings. For example, one participant stated "When you get to the
'err ... err ... ' then you really are in a problem". However, after several
discussions partiCipants began to moderate personal views to suggest that
232
Chapter 10. Indicators of potential performance decline: Findings from an experiment study and interview study
indicators mayor may not be indicative of specific issues. A motivation
bias to not be associated with reaching performance limits when working
as a controller may have influenced participant responses. To control for
this, an interview method will be used in the subsequent study.
10.3.3 Semi-structured Interviews
10.3.3.1 Semi-structured interviews: Method
10.3.3.1.1 Semi-structured interviews: Design
A total of 22, one hour semi-structured interviews were conducted with en
route ATCOs using a face-to-face medium to gain an understanding of the
use of indicators of reaching performance limits in ATC. The semi
structured interview enabled topics of interest to be investigated whilst
providing the flexibility to investigate relevant topics raised by the
participant. The sample was purposive, and the number of interviews was
based on pragmatic considerations such as time and the number of ATCOs
for which shift cover could be arranged. Participants were selected based
on group characteristics including age, experience and nationality. The
interviews took place in the Maastricht Upper Area control centre (MUAC)
in an office opposite the operations room. The location was familiar and
convenient to participants. An interview schedule was developed to guide
the semi-structured interview; participants were asked pre-designed lead
questions which were then followed by probes. A protocol was used to
standardise the interview method procedure. Interviews were recorded
with two dictaphones, with the prior informed consent of participants, and
the researcher took written notes. The interviews were then
orthographically transcribed and thematic analysis was applied as the
analysis strategy.
10.3.3.1.2 Semi-structured interviews: Factors -specific
indicators of performance decline
Participants were asked to list indicators of potential performance decline
that were perceived to be the associated with a specific factor (e.g. "What
indicators of potential performance decline are associated with the
influence of fatigue on performance?"). The factors Included in the
interview study were: workload, fatigue, stress, attention/vigilance,
communications, and teamwork.
233
Chapter 10. Indicators of potential performance decline: Findings from an experiment study and interview study
10.3.3.1.3 Participants
In total 22 en-route controllers were interviewed. The majority of
partiCipants were male (17, or 77.27%), compared to female partiCipants
(5, or 22.73%). All participants worked as en-route controllers in the
Maastricht Upper Airspace control (MUAC) centre. Participants' ages ranged
from 21-60. Participants responded to grouped age ranges and so an
average age cannot be calculated. A total of five partiCipants (22.72%)
were in the 21-30 ages range, a majority of nine partiCipants (40.9%)
were in the 31-40 age range. A total of seven participants (31.81%)
responded to the 41-50 age range and one participant was in the 51-60
age range (0.05%). All partiCipants were qualified ATCOs who had
completed training. Years of experience as an ATCO (excluding training)
ranged from 1.5-31 (M=14.55, 50=8.68). A total of 15 partiCipants had
worked as an on the job training instructor (OlTI). Years of experience as
an OJTI ranged from 2-25 years (M=10.93, 50=7.11). In total six
participants were also supervisors. Experience as a supervisor ranged from
1.5 to 11 (M=6.08 years, 50=3.56). Participants were of eight nationalities:
Austrian (two partiCipants, 9.09%), Belgian (four participants, 18.18%),
Bulgarian (one partiCipant, 4.55%) English (five partiCipants, 22.73%),
Denmark (one partiCipant, 4.55%), Dutch (three participants, 13.64%),
German (four participants, 18.18), Irish (two participants, 9.09%).
Participants were recruited by MUAC centre managers and were selected to
represent several sub-groups of controllers, based on age, sex, experience,
role and nationality. The sample was therefore a non-probability purposive
sample.
10.3.3.1.4 Semi-structured interviews: Materials and equipment
An interview schedule was designed to structure the interview. The
interview comprised of 11 lead, open-ended questions which related to five
areas of interest:
1. Current use of indicators in ATC settings
2. Internal and external Indicators of performance limits
3. Indicators associated with specific factors
4. Levels of awareness of own indicators and colleagues' indicators
5. Generalisation of indicators between controllers
The interview schedule was reviewed and approved by two human factors
experts and two ex-controllers. The interview began with an open question
234
Chapter 10. Indicators of potential performance decline: Findings from.an experiment study and interview study
which asked the participant to talk about a time when they experienced
themselves or a colleague reaching the edge of their performance. This
was designed to enable the participant to share their own experience easily
and permit further follow-up questions regarding the indicators that told
them they were reaching the edge of performance. The lead questions
were arranged from general topics (e.g. "Could you please tell me about a
time in the recent past when you identified that either yourself or a
colleague was nearing the edge of your performance?") to more specific
questions (e.g. "To what extent are the indicators you've specified common
between controllers"). This format was selected to lead participants
through the topics in a logical progression, without unnecessary 'jumps'
between topics (Millward, 2006). The question wordings were similar to the
pilot study based on the previous positive feedback. Examples of indicators
were use in the lead question to facilitate participants' understanding. The
same indicators were used in examples for all participants (Millward,
2006).The interview was recorded on two Olympus DSS Standard digital
recorders.
10.3.3.1.5 Semi-structured interviews: Procedure
All interviews were conducted in a quiet office next to the MUAC operations
room, which was convenient for participants. Interviews lasted for one
hour. This period of time was allocated by the centre managers, although
was sufficient to discuss the topics of interest.
A standardised protocol was followed for each interview. The
participant was welcomed and offered refreshments. The participant read
the standardised introduction and was then asked to sign an informed
consent form if she/he was happy to continue with the interview. The
participant then completed a demographic questionnaire. The participant
was asked for permission to record the interview session and the digital
recorders were started. The Interview schedule was then followed. After
the questions had been completed, the participant was asked if she/he had
any other comments. The participant was then given a paper copy of the
standardised debrief which contained the researcher's contact details. The
audio recording was subsequently transcribed for analysis.
235
Chapter 10. Indicators of potential performance decline: Findings from an experiment study and interview study
10.3.3.2 Semi-structured interviews: Strategy of analysis
Interviews were transcribed orthographically. A thematic analysis was
selected as the analysis strategy. A quantitative content analysis was not
considered appropriate due to the implicit assumption that more frequent
themes are more important than others, which may not be applicable to
the current data. Indicators may not have been raised for several reasons,
including motivation biases. No identifying information is stored in the
transcription, and any data used in analysis was anonymous. Where it is
necessary to use quotations from the seSSion, participants will remain
anonymous.
10.3.3.3 Semi-structured interviews: Results
A total of 22 one-hour interviews were orthographically transcribed and
analysed using thematic analysis. Recurrent and relevant themes are
presented below with illustrative quotes from participants. The
presentation of results is organised by the order of research aims and
topics of interest included in the question schedule. Other relevant themes
that emerged are subsequently presented.
10.3.3.3.1 Controllers' understanding of indicators of potential
performance decline
All participants (22/22) were familiar with the concept of Indicators and
agreed that they occurred in the ATe operations room. In general,
participants characterised indicators as indicators that a controller was not
feeling comfortable with the control task, and Indicated when a controller
was moving towards the edge of performance: "The indicators are part of
losing the control or going towards the limits or crossing the limits [of
performance]. So it's not like the limit is here and you see the Indicators,
and then suddenly bang, you run over. The Indicators are part of it on the
way down to losing control" (PartiCipant 21). Indicators cannot be
conceptualised strictly as indicators of performance. Performance may not
change in the presence of negative influences or controller discomfort due
to adaptive mechanisms that protect performance. Rather, indicators
indicate that the controller may not be controlling comfortably, and may be
experiencing negative influences from factors.
236
Chapter 10. Indicators of potential performance decline: Findings from an experiment study and interview study
10.3.3.3.2 Use of indicators of potential performance decline in
air traffic control
All controllers stated indicators are commonly used in ATC to provide
information regarding when a controller may not be controlling optimally,
or a factor (such as fatigue, stress) is negatively influencing performance.
All controllers monitor their own personal indicators as well as colleagues'
indicators: " ... We work close together, we monitor each other you would be
very aware of the person sitting beside you whether they're on the ball or
whether they're slightly less, whether they're tired, whether they're
distracted by whatever or something, it's part of the job and you do, you
make allowances" (Participant 2). This was perceived as a natural process
that "you don't think about. .. 1 just do it like it's a brain process that isn't
conscious" (Participant 2). Another controller stated "l think it's a natural
thing to look for signs" (Participant 11). Controllers used indicators for the
primary functions of gaining information which subsequently led to
supporting performance.
After identification of a marker, controllers interpreted the meaning
based on previous experience and frequently applied a supportive
mechanism such as a change in control strategy to mitigate the Issue that
was negatively influencing the controller: " ... it's that point [of recognising
something is wrong] where you have to, well in my opinion you have to
change the way that you're controlling the traffic" (Participant 10). This
process occurs both for controllers to support their own performance, and
controllers who apply adaptive strategies to support their colleagues'
performance: "1f someone's getting stressed they can get louder or sit
closer to the screen or something so if you see these things then you pay
more attention yourself." (Participant 20). The perception and use of
indicators in ATC is a critical element in maintaining a consistently high
task performance.
The application of the compensation strategy can result In the
maintenance of performance even when associated with negative factor
influences. The experienced negative influence may therefore not be
reflected in the controllers' performance even though the influence is
present. Therefore, some indicators will not strictly associate with ATCO
performance, but rather the ATCO's subjective state.
237
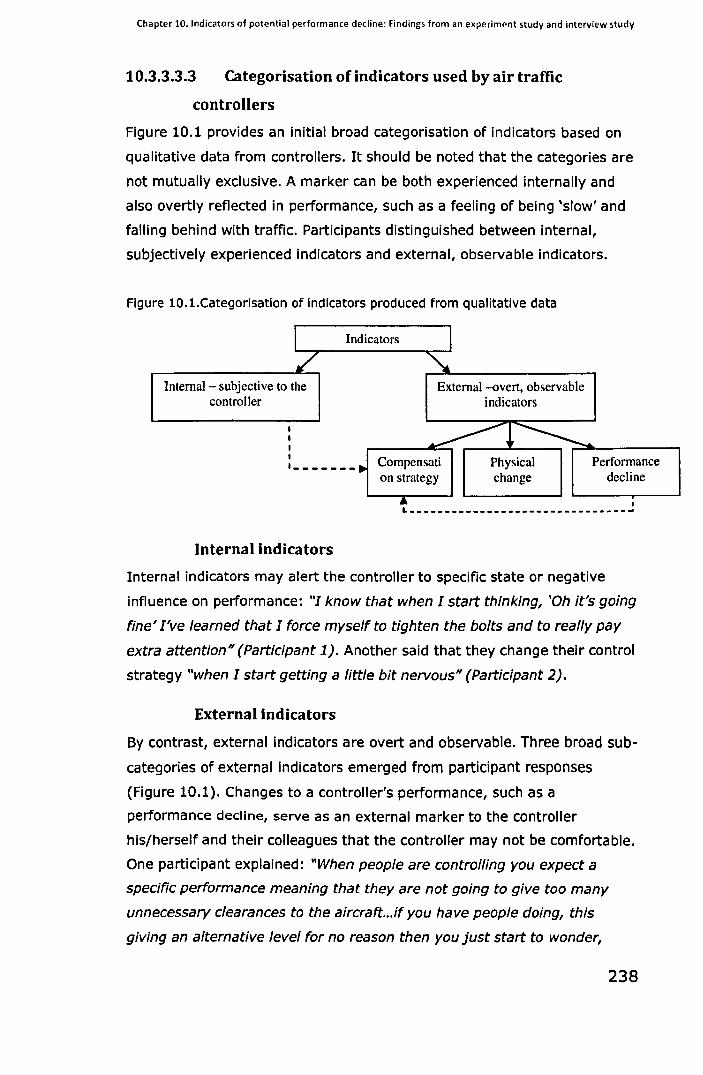
Chapter 10. Indicators of potential performance decline: Findings from an experiment study and interview study
10.3.3.3.3 Categorisation of indicators used by air traffic
controllers
Figure 10.1 provides an initial broad categorisation of indicators based on
qualitative data from controllers. It should be noted that the categories are
not mutually exclusive. A marker can be both experienced internally and
also overtly reflected in performance, such as a feeling of being 'slow' and
falling behind with traffic. Participants distinguished between internal,
subjectively experienced indicators and external, observable indicators.
Figure lO.1.Categorisation of indicators produced from qualitative data
Indicators
Internal- subjective to the controller
, , , I
,-------
External -overt, observable indicators
Compensati on strategy
Physical change
Performance decline
I L _______________________________ ~
Internal indicators
Internal indicators may alert the controller to specific state or negative
influence on performance: "1 know that when I start thinking, 'Oh it's going
fine' I've learned that I force myself to tighten the bolts and to really pay
extra attention" (Participant 1). Another said that they change their control
strategy "when I start getting a little bit nervous" (Participant 2).
External indicators
By contrast, external indicators are overt and observable. Three broad sub
categories of external indicators emerged from participant responses
(Figure 10.1). Changes to a controller's performance, such as a
performance decline, serve as an external marker to the controller
his/herself and their colleagues that the controller may not be comfortable.
One participant explained: "When people are controlling you expect a
specific performance meaning that they are not going to give too many
unnecessary clearances to the aircraft .. .if you have people dOing, this
giving an alternative level for no reason then you just start to wonder,
238
Chapter 10. Indicators of potential performance decline: Findings from an experiment study and interview study
'Why is he doing this?' Okay, he does it once. He was not paying attention
on this one. He does it twice and then you start wondering, 'Well it's not
his day'" (Participant 1). Another sub-category of external indicators is
behavioural and physical changes in a controller. Examples include a face
becoming red, or fidgeting, which provide information to other controllers:
"You see it coming, you see them getting nervous, you see them talking
faster" (PartiCipant 2).
Adaptive changes to the control strategy to mitigate negative
influences on performance are a sub-category of external indicators.
Compensation strategies as indicators indicate that a controller is feeling
uncomfortable, but is aware of the potentially negative influence, and Is
attempting to protect and maintain performance. As one controller
summarised "When somebody is just extra careful, I suppose that it's
because they feel that they have to be extra careful" (PartiCipant 1). If a
controller is aware of internal indicators, a compensation strategy may be
selected and applied. This is represented in Figure 10.1 by an arrow with a
dashed line connecting the internal marker to the compensation strategy.
This is then observable in the method of controlling. Alternatively, a
decline in performance may alert the controller that a compensation
strategy is required to protect performance. This is represented by an
arrow with a dashed line connecting performance decline and
compensation strategy. In addition, colleagues may observe the
controller's performance decline and apply their own compensation
strategy to support the controller's performance.
10.3.3.3.4 Sub-categories of external indicators may provide
distinct information
Performance declines or errors may provide a more serious Indication that
a controller is experiencing difficulties with the task. Controllers appear to
place weight on this category of indicator and provide support in response
to these indicators: "If I see that someone is correcting themselves very
often then I would pay a lot of attention to what he's actually doing or a lot
more let's say ... ! start looking out for things where! really follow every
single clearance. I will try to focus more on what my controller Is doing and
try to support as well like giving hints" (PartiCipant 11).
A physical change (e.g. red face, yawning, laid back posture) may
indicate a change in controllers' cognitive state (Sharples, Edwards, Balfe,
239
Chapter 10. Indicators of potential performance decline: Findings from an experiment study and interview study
Wilson & Kirwan, 2012), although may not be related to feelings of
discomfort. Controllers suggest that the meanings of indicators are
dependent on the context.
Adaptive changes in control strategy inform colleagues that the
executive controller (EC) is experiencing discomfort with the control task
(the reason for discomfort may not be observable), although the EC is
aware of this and is attempting to protect and maintain performance with
the application of a compensation strategy.
10.3.3.3.5 External indicators may mean different things
depending on context
Indicators may mean different things depending on the control context.
Participant 1 suggested: "As a coordinator controller you follow what the
executive is doing and there is a variety of complexity levels for situations
and if it's an easy situation, a very crystal clear solution to a problem and
then you see that the person is not applying it straightaway it triggers
maybe a little alarm in your head". This may have been Interpreted
differently during a high taskload. Controllers use experience and
knowledge of the control situation to interpret the meaning of the indicator.
10.3.3.3.6 Indicators of specific factor influences
Participants were presented with a list of factors [workload, fatigue, stress,
vigilance, SA, teamwork] accompanied by standardised definitions, the
same as those that were used in the expert knowledge elicitation study
(Chapter 6). Participants were asked to identify internal or external
indicators that they believed to be associated with a specific influencing
factor. Although not contained In the study questions, all participants
naturally reported adaptive compensation strategies that were applied In
response to the detection of potential performance decline. These
strategies can also serve as observable indicators. Therefore compensation
strategies that controllers use in response to factor influences are also
. listed.
10.3.3.3.7 Workload
Controllers differentiated between high workload, low workload, and
transitions between workload extremes. Each form of workload was
reported to be associated with different indicators.
240
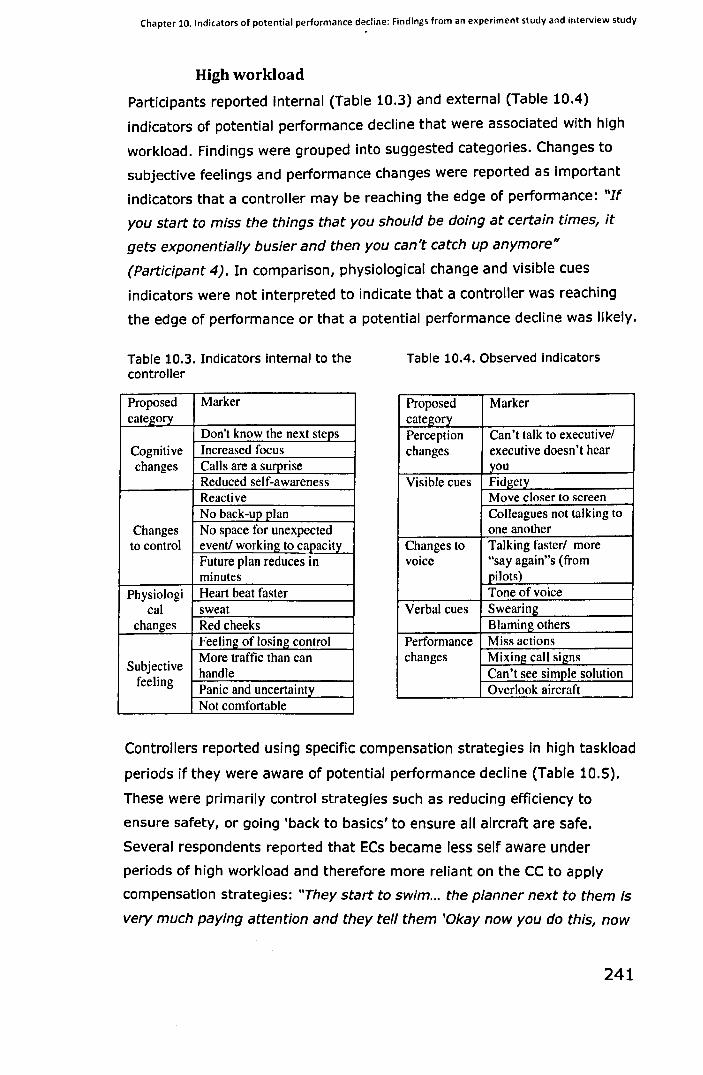
Chapter 10. Indicators of potential performance decline: Findings from an experiment study and interview study
High workload
Participants reported internal (Table 10.3) and external (Table 1004)
indicators of potential performance decline that were associated with high
workload. Findings were grouped into suggested categories. Changes to
subjective feelings and performance changes were reported as important
indicators that a controller may be reaching the edge of performance: "If
you start to miss the things that you should be doing at certain times, it
gets exponentially busier and then you can't catch up anymore"
(PartiCipant 4). In comparison, physiological change and visible cues
indicators were not interpreted to indicate that a controller was reaching
the edge of performance or that a potential performance decline was likely.
Table 10.3. Indicators Internal to the controller
Proposed Marker category
Don't know the next steps Cognitive Increased focus changes Calls are a surorise
Reduced self-awareness Reactive No back-up plan
Changes No space for unexpected to control event! working to capacity
Future plan reduces in minutes
Physiologi Heart beat faster cal sweat
changes Red cheeks Feeling of losing control
Subjective More traffic than can handle
feeling Panic and uncertainty Not comfortable
Table 10.4. Observed Indicators
Proposed Marker category Perception Can'\ talk to executive/ changes executive doesn't hear
you Visible cues Fidgety
Move closer to screen Colleagues not talking to one another
Changes to Talking faster/ more voice "say again"s (from
pilots) Tone of voice
Verbal cues Swearing Blaming others
Performance Miss actions changes Mixing call signs
Can't see simple solution Overlook aircraft
Controllers reported using specific compensation strategies in high taskload
periods if they were aware of potential performance decline (Table 10.S).
These were primarily control strategies such as reducing efficiency to
ensure safety, or going 'back to basics' to ensure all aircraft are safe.
Several respondents reported that ECs became less self aware under
periods of high workload and therefore more reliant on the CC to apply
compensation strategies: "They start to swim ... the planner next to them is
very much paying attention and they tell them 'Okay now you do this, now
241
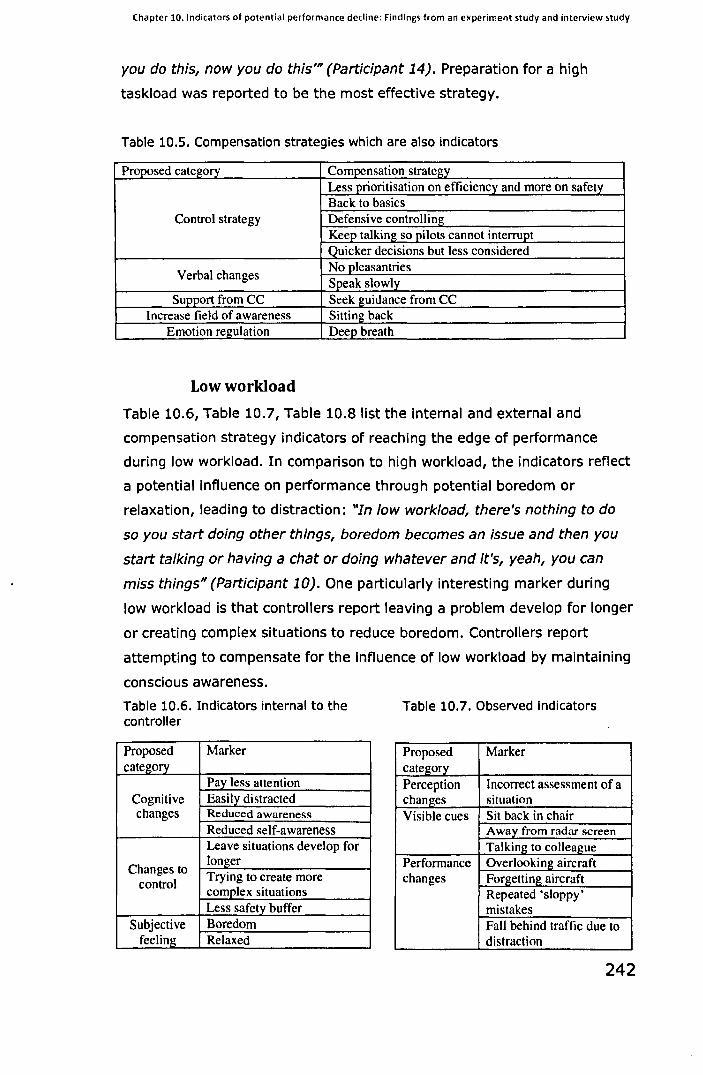
Chapter 10. Indicators of potential performance decline: Findings from an e~periment study and interview study
you do this, now you do this'" (Participant 14). Preparation for a high
taskload was reported to be the most effective strategy.
Table 10.5. Compensation strategies which are also indicators
Proposed category Compensation strategy Less prioritisation on efficiency and more on safety Back to basics
Control strategy Defensive controlling Keep talking so pilots cannot interrupt Quicker decisions but less considered
Verbal changes No pleasantries Speak slowly
Support from CC Seek guidance from CC Increase field of awareness Sitting back
Emotion regulation Deep breath
Low workload
Table 10.6, Table 10.7, Table 10.8 list the internal and external and
compensation strategy indicators of reaching the edge of performance
during low workload. In comparison to high workload, the indicators reflect
a potential influence on performance through potential boredom or
relaxation, leading to distraction: "In low workload, there's nothing to do
so you start doing other things, boredom becomes an Issue and then you
start talking or having a chat or doing whatever and it's, yeah, you can
miss things" (Participant 10). One particularly interesting marker during
low workload is that controllers report leaving a problem develop for longer
or creating complex situations to reduce boredom. Controllers report
attempting to compensate for the influence of low workload by maintaining
conscious awareness.
Table 10.6. Indicators internal to the controller
Proposed Marker category
Pay less attention Cognitive Easily distracted changes Reduced awareness
Reduced self-awareness Leave situations develop for
Changes to longer Trying to create more
control complex situations Less safety buffer
Subjective Boredom feeling Relaxed
Table 10.7. Observed indicators
Proposed Marker category Perception Incorrect assessment of a changes situation Visible cues Sit back in chair
Away from radar screen Talking to colleague
Performance Overlooking aircraft changes Forgettingaircraft
Repeated 'sloppy' mistakes Fall behind traffic due to distraction
242
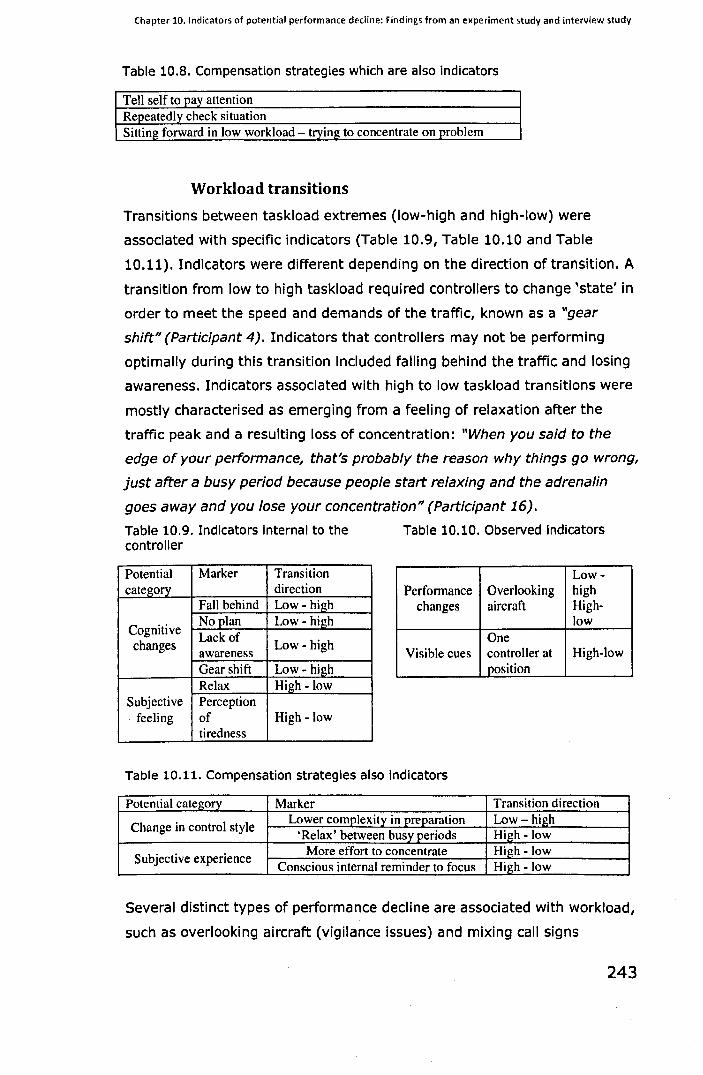
Chapter 10. Indicators of potential performance decline: Findings from an experiment study and interview study
Table 10.B. Compensation strategies which are also indicators
Tell self to pay attention Repeatedly check situation Sitting forward in low workload - trying to concentrate on problem
Workload transitions
Transitions between taskload extremes (low-high and high-low) were
associated with specific indicators (Table 10.9, Table 10.10 and Table
10.11). Indicators were different depending on the direction of transition. A
transition from low to high taskload required controllers to change 'state' In
order to meet the speed and demands of the traffic, known as a "gear
shift" (PartiCipant 4). Indicators that controllers may not be performing
optimally during this transition included falling behind the traffic and losing
awareness. Indicators associated with high to low taskload transitions were
mostly characterised as emerging from a feeling of relaxation after the
traffic peak and a resulting loss of concentration: "When you said to the
edge of your performance, that's probably the reason why things go wrong,
just after a busy period because people start relaxing and the adrenalin
goes away and you lose your concentration" (PartiCipant 16).
Table 10.9. Indicators internal to the controller
Table 10.10. Observed Indicators
Potential Marker Transition Low-category direction Performance Overlooking high
Fall behind Low - high changes aircraft High-
Cognitive No plan Low - high Lack of
changes awareness Low - high
low One
Visible cues controller at High-low Gear shift Low - high position Relax High -low
Subjective Perception feeling of High -low
tiredness
Table 10.11. Compensation strategies also indicators
Potential category Marker Transition direction
Change in control style Lower complexity in preparation Low-high
'Relax' between busy periods High -low
Subjective experience More effort to concentrate High -low
Conscious internal reminder to focus High -low
Several distinct types of performance decline are associated with workload,
such as overlooking aircraft (vigilance issues) and mixing call signs
243
Chapter 10. Indicators of potential performance decline: Findings from an experiment study and interview study
(communications issues). Workload may therefore negatively influence
other factors such as vigilance, fatigue, and awareness which are then
observed to be a causal factor of performance decline. This is important for
understanding underlying causes of performance decline that may manifest
as a different factor.
10.3.3.3.8 Fatigue
Several sub-categories of internal (Table 10.12) and external (Table 10.13)
indicators of fatigue were reported, as well as indicators that arose from
applications of compensation strategy (Table 10.14). Most indicators were
identified as specific to fatigue. However, some participants reported that
performance changes, such as overlooking aircraft, as indicators were not
specifically associated with fatigue and needed to be interpreted in context.
For example: "If there is a busy situation with high traffic if you overlook
something there then it doesn't necessarily need to be because you are too
tired ... If it is quiet I've overlooked some traffic know it is because I'm tired
probably" (Participant 11). Therefore, the influence of fatigue may be
represented in performance indirectly. Most controllers felt that consciously
maintaining attention is an effective compensation strategy for feeling
fatigued. In addition, several controllers reported control changes, such as
increasing safety buffers, to mitigate the influence of fatigue and protect
performance: "You can be very tired and work very correct because you
know you have to perform better because you feel tired" (Participant 13).
244

Chapter 10. Indicators of potential performance decline: Findings from an eMperiment study and interview study
Table 10.12. Indicators internal to the controller
Table 10.13. Observed indicators
Potential Marker Potential Marker category cate~oIY
Slower Yawnin~ Not as sharp 'Mild confusion'
Visible cues Laid back Eyes closed
Extra time thinking FalliJ!&. asle~ about task Verbal Slower speech
Cognitive Reduced awareness changes Concentration issues:
Teamwork More discussion with CC
Not paying as much Physical 'Looks tired' attention appearance Colour of face Increased Less active assumptions Demeanour Quieter Distracted Not as confident
Physiological Feeling cold Multiple small changes mistakes, 'sIOQIJY'
Not controlling as expected
Check fr~uency OverlookiJ!&. aircraft
Feel tired Mixing up call signs Not looking forward to shift
Internal Not on top of things
Performance Don't hear read back
changes Incorrect plan without realisation
perception, Not comfortable feeling More effort to control
Inappropriate reactions
Have to push self 'Running behind Don't want to work traffic' busy traffic Fo!Xetti~ Surprise Forcing to pay attention Less flexible Don't see, or longer to see, a solution
Changes to Lower motivation to control efficiently
control Slow reactions Slower to solve problems Reactive control
Table 10.14. Compensation strategies also indicators
Potential categor~ Compensation mechanisms Pay attention during session that are known to be prone to fatigue
'Force' conscious issues i.e. early morning shift attention Consciously think about controlling
Be alert and focused Ask to start or sit on the j)lanningposition next session
Role change Ask to swap with the planner Iplanner offers during the current session Conservative control
EC - change control Simple controlling, Ea~ solutions Defensive control
strategy Simple instructions Increase safety buffer
245
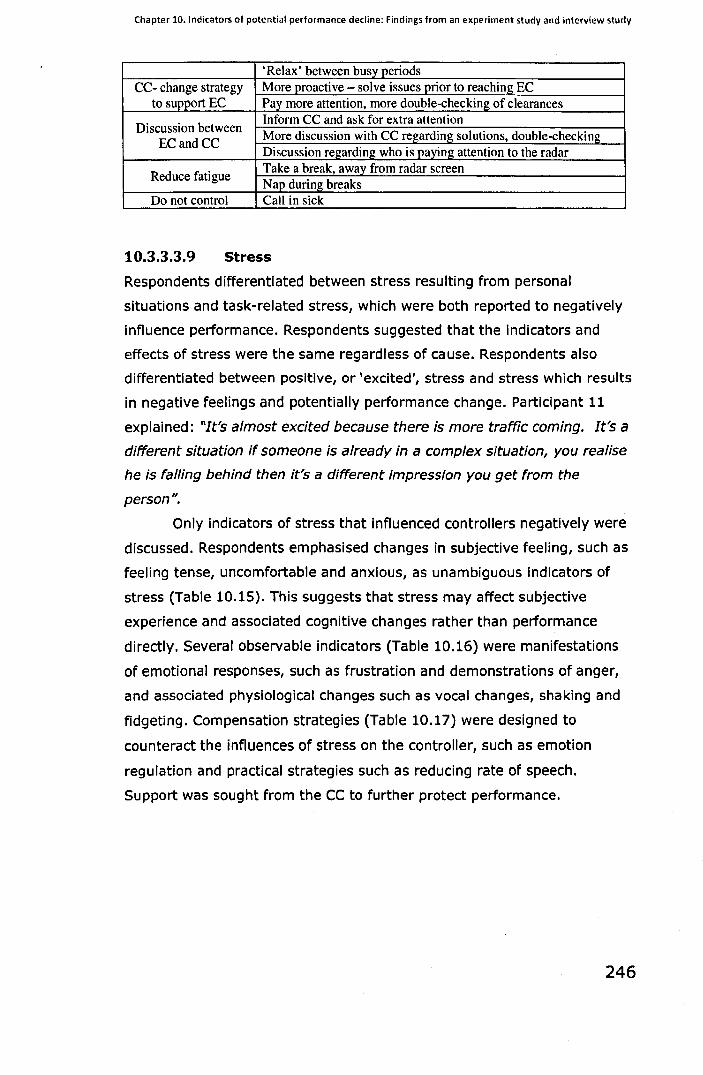
Chapter 10. Indicators of potential performance decline: Findings from an experiment study and interview study
'Relax' between busy periods CC- change strategy More proactive - solve issues prior to reaching EC
to support EC Pay more attention, more double-checking of clearances
Discussion between Inform CC and ask for extra attention More discussion with CC regarding solutions, double-checking
ECandCC Discussion regarding who is paying attention to the radar
Reduce fatigue Take a break, away from radar screen Nap during breaks
Do not control Call in sick
10.3.3.3.9 Stress
Respondents differentiated between stress resulting from personal
situations and task-related stress, which were both reported to negatively
influence performance. Respondents suggested that the indicators and
effects of stress were the same regardless of cause. Respondents also
differentiated between positive, or 'excited', stress and stress which results
in negative feelings and potentially performance change. Participant 11
explained: "It's almost excited because there is more traffic coming. It's a
different situation if someone is already in a complex situation, you realise
he is falling behind then it's a different impression you get from the
person".
Only indicators of stress that influenced controllers negatively were
discussed. Respondents emphasised changes in subjective feeling, such as
feeling tense, uncomfortable and anxious, as unambiguous indicators of
stress (Table 10.15). This suggests that stress may affect subjective
experience and associated cognitive changes rather than performance
directly. Several observable indicators (Table 10.16) were manifestations
of emotional responses, such as frustration and demonstrations of anger,
and associated physiological changes such as vocal changes, shaking and
fidgeting. Compensation strategies (Table 10.17) were designed to
counteract the influences of stress on the controller, such as emotion
regulation and practical strategies such as reducing rate of speech.
Support was sought from the CC to further protect performance.
246
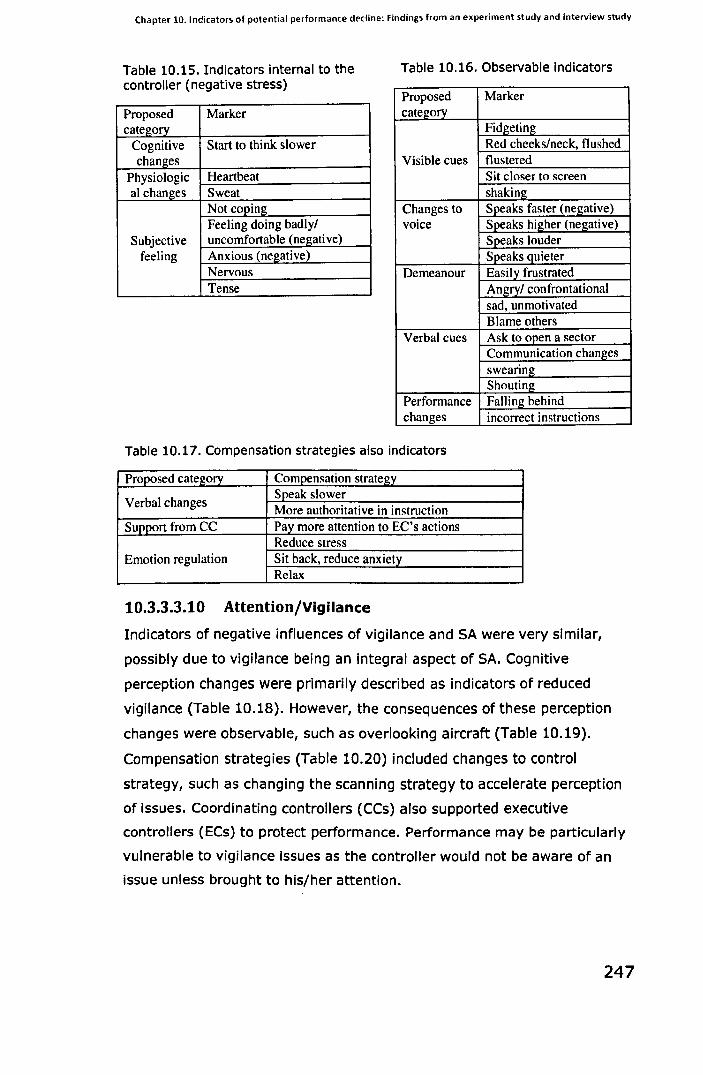
Chapter 10. Indicators of potential performance decline: Findings from an experiment study and interview study
Table 10.15. Indicators internal to the controller (negative stress)
Table 10.16. Observable indicators
Proposed Marker
Proposed Marker category category Fidgeting
Cognitive Start to think slower Red cheeks!neck, flushed changes Visible cues flustered
Physiologic Heartbeat Sit closer to screen al changes Sweat shaking
Not coping Changes to Speaks faster (negative) Feeling doing badly! voice Speaks higher (negative)
Subjective uncomfortable (negative) Speaks louder feeling Anxious (negative) Speaks quieter
Nervous Demeanour Easily frustrated Tense Angry! confrontational
sad, unmotivated Blame others
Verbal cues Ask to open a sector Communication changes swearing Shouting
Performance Falling behind changes incorrect instructions
Table 10.17. Compensation strategies also indicators
Proposed category Compensation strategy
Verbal changes Speak slower More authoritative in instruction
Support from CC Pay more attention to EC's actions Reduce stress
Emotion regulation Sit back, reduce anxiety Relax
10.3.3.3.10 Attention/Vigilance
Indicators of negative influences of vigilance and SA were very similar,
possibly due to vigilance being an integral aspect of SA. Cognitive
perception changes were primarily described as indicators of reduced
vigilance (Table 10.18). However, the consequences of these perception
changes were observable, such as overlooking aircraft (Table 10.19).
Compensation strategies (Table 10.20) included changes to control
strategy, such as changing the scanning strategy to accelerate perception
of Issues. Coordinating controllers (CCs) also supported executive
controllers (ECs) to protect performance. Performance may be particularly
vulnerable to vigilance Issues as the controller would not be aware of an
issue unless brought to his/her attention.
247
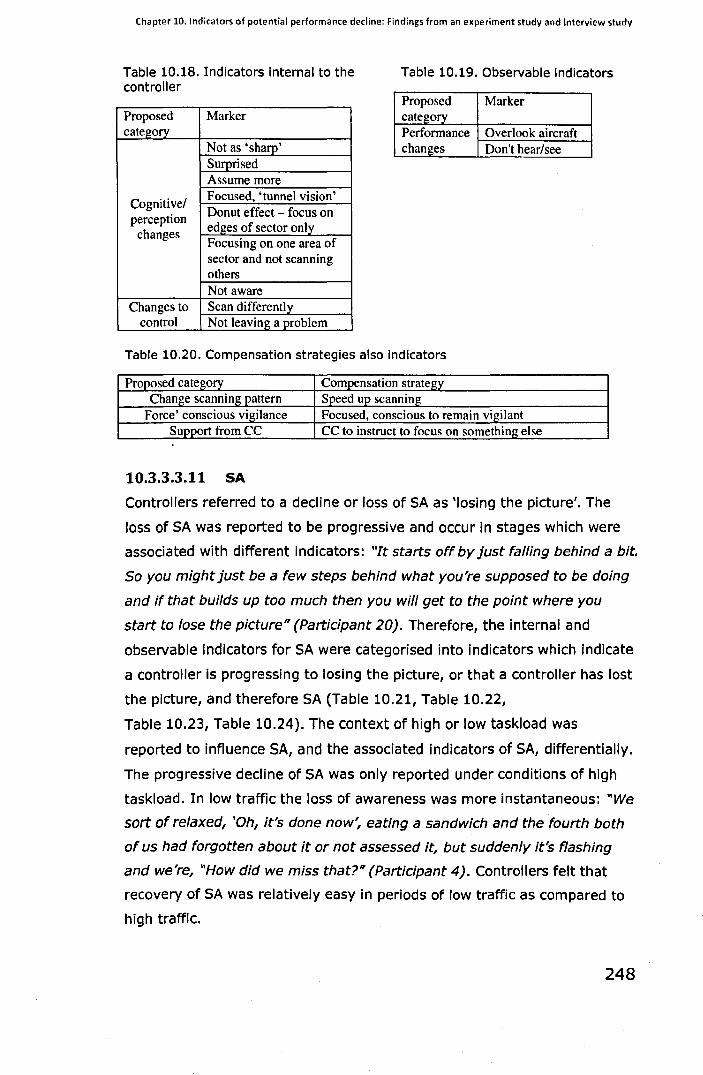
Chapter 10. Indicators of potential performance decline: Findings from an experiment study and interview study
Table 10.18. Indicators internal to the controller
Table 10.19. Observable indicators
Proposed Marker Proposed Marker category category Performance Overlook aircraft
Not as 'sharp' changes Don't hear/see Surprised Assume more
Cognitive/ Focused, 'tunnel vision' Donut effect - focus on perception edges of sector only changes Focusing on one area of sector and not scanning others Not aware
Changes to Scan differently control Not leaving a problem
Table 10.20. Compensation strategies also indicators
Proposed category Compensation strategy Change scanning pattern Speed up scanning
Force' conscious vigilance Focused, conscious to remain vigilant Support from CC CC to instruct to focus on something else
10.3.3.3.11 SA
Controllers referred to a decline or loss of SA as 'losing the picture'. The
loss of SA was reported to be progressive and occur in stages which were
associated with different indicators: "It starts off by just falling behind a bit.
So you might just be a few steps behind what you're supposed to be doing
and if that builds up too much then you will get to the point where you
start to lose the picture" (Participant 20). Therefore, the internal and
observable indicators for SA were categorised into indicators which indicate
a controller is progressing to losing the picture, or that a controller has lost
the picture, and therefore SA (Table 10.21, Table 10.22,
Table 10.23, Table 10.24). The context of high or low taskload was
reported to influence SA, and the associated indicators of SA, differentially.
The progressive decline of SA was only reported under conditions of high
taskload. In low traffic the loss of awareness was more instantaneous: "We
sort of relaxed, 'Oh, it's done now~ eating a sandwich and the fourth both
of us had forgotten about it or not assessed it, but suddenly it's flashing
and we're, "How did we miss that?" (Participant 4). Controllers felt that
recovery of SA was relatively easy in periods of low traffic as compared to
high traffiC.
248

Chapter 10. Indicators of potential performance decline: Findings from an experiment study and interview study
Compensation strategies (Table 10.25) protect performance when a
controller is losing the picture. It was reported to be difficult to rebuild
awareness after losing the picture. The compensation strategies from the
EC attempt to make the situation safe when awareness is degraded.
Conversely, compensation strategies by the CC are tactical and appear to
facilitate the EC in rebuilding the picture. For example, CCs will change
control strategy to reduce complexity and/or traffic frequency to allow the
EC to catch up and rebuild the picture. In addition, CCs will monitor the
EC's instructions and step in if necessary until the EC has recovered the
picture "They [CC1 tell them 'Okay now you do this, now you do this, now
you do this'" (PartiCipant 14). The more degraded awareness is, the more
reliant the EC may be on the CC to protect performance and rebuild the
picture.
Table 10.21. Indicators internal to the controller when losing the picture
Proposed Marker category
Difficulty selecting priorities Cognitive Thinking whilst giving the changes clearance
Tunnel vision/hearing Subjective Under confident
feeling
Table 10.23. Observable indicators of losing the picture
Proposed Marker category Visible cues Slow at task Performance Running behind changes Time working ahead
degrades - less awareness? Missing calls
Table 10.22. Indicators Internal to the controller having lost the picture
Proposed Marker cate!(orv
Lose awareness Cognitive Everything a surprise changes No plan
Cannot see a solution Changes to
Reactive control control
Subjective Panic feeling
Table 10.24. Observable indicators of having lost the picture
Proposed Marker category Visible Zig-zagging head cues movement of where to
look 'Blacked out'/ silent
Verbal Asking for confirmation cues Performan Unsafe clearance ce changes Unexpected decisions
Jumping from one aircraft to another Don't know who's calling Don't react correctly
249
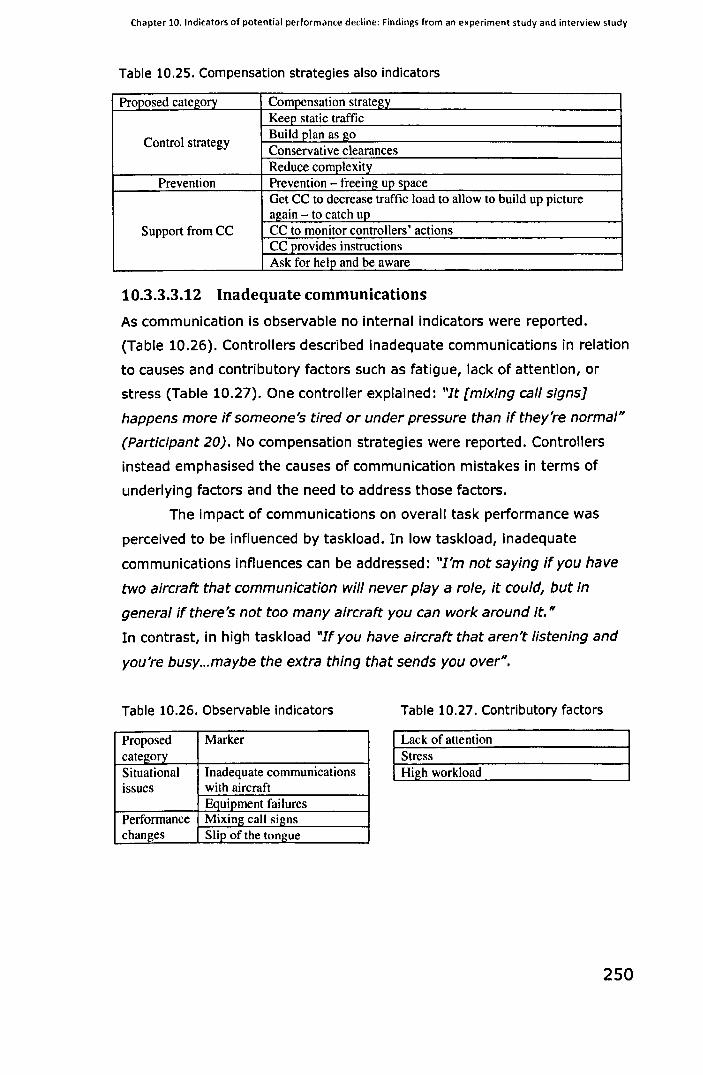
Chapter 10. Indicators of potential performance decline: Findings from an experiment study and interview study
Table 10.25. Compensation strategies also indicators
Proposed category Compensation strategy Keep static traffic
Control strategy Build plan as go Conservative clearances Reduce complexity
Prevention Prevention - freeing up space Get CC to decrease traffic load to allow to build up picture again - to catch UP
Support from CC CC to monitor controlIers' actions CC provides instructions Ask for help and be aware
10.3.3.3.12 Inadequate communications
As communication is observable no internal indicators were reported.
(Table 10.26). Controllers described inadequate communications in relation
to causes and contributory factors such as fatigue, lack of attention, or
stress (Table 10.27). One controller explained: "It [mixing call signs]
happens more if someone's tired or under pressure than if they're normal"
(Participant 20). No compensation strategies were reported. Controllers
instead emphasised the causes of communication mistakes in terms of
underlying factors and the need to address those factors.
The impact of communications on overall task performance was
perceived to be influenced by taskload. In low taskload, Inadequate
communications influences can be addressed: "J'm not saying if you have
two aircraft that communication will never playa role, it could, but in
general if there's not too many aircraft you can work around it. "
In contrast, in high taskload "If you have aircraft that aren't listening and
you're busy ... maybe the extra thing that sends you over".
Table 10.26. Observable indicators Table 10.27. Contributory factors
Proposed Marker Lack of attention category Stress Situational Inadequate communications High workload issues with aircraft
Equipment failures Performance Mixing call signs changes Slip of the tongue
250
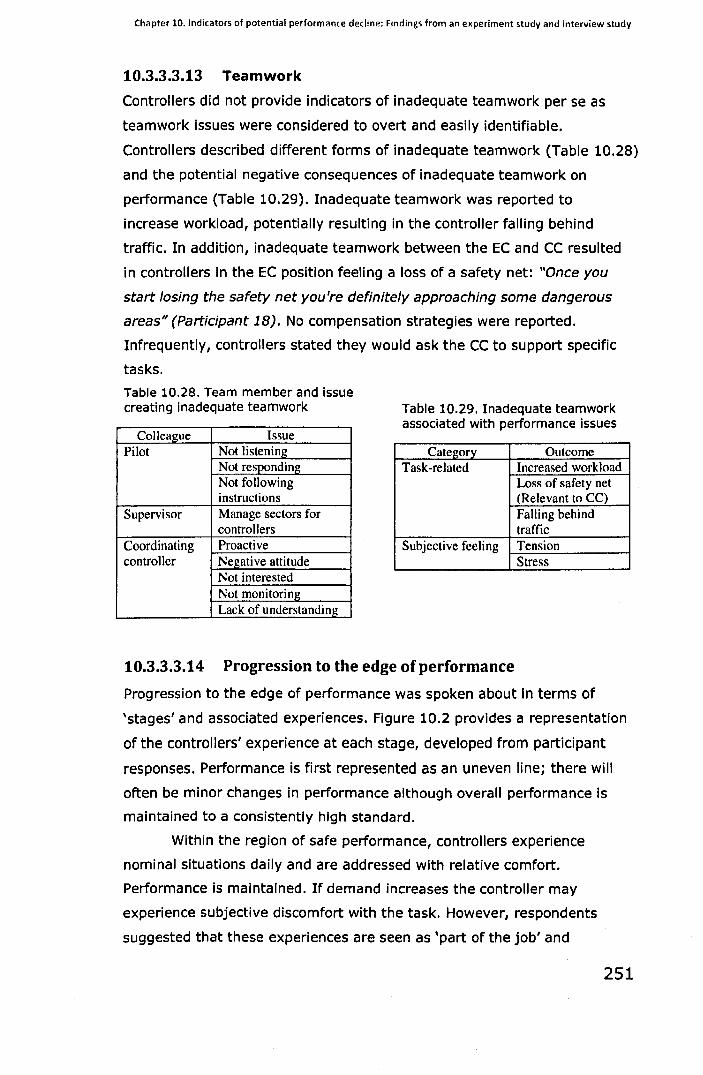
Chapter 10. Indicators of potential performance decline: Findings from an experiment study and interview study
10.3.3.3.13 Teamwork
Controllers did not provide indicators of inadequate teamwork per se as
teamwork issues were considered to overt and easily identifiable.
Controllers described different forms of inadequate teamwork (Table 10.28)
and the potential negative consequences of inadequate teamwork on
performance (Table 10.29). Inadequate teamwork was reported to
increase workload, potentially resulting in the controller falling behind
traffic. In addition, inadequate teamwork between the EC and CC resulted
in controllers in the EC position feeling a loss of a safety net: "Once you
start losing the safety net you're definitely approaching some dangerous
areas" (Participant 18). No compensation strategies were reported.
Infrequently, controllers stated they would ask the CC to support specific
tasks.
Table 10.28. Team member and issue creating inadequate teamwork
Issue
Table 10.29. Inadequate teamwork associated with performance issues
Colleague Pilot Not listening Category Outcome
Not responding Task-related Increased workload Not following Loss of safety net instructions (Relevant to CC)
Supervisor Manage sectors for Falling behind controllers traffic
Coordinating Proactive Subjective feeling Tension controller Negative attitude Stress
Not interested Not monitorin~ Lack of understanding
10.3.3.3.14 Progression to the edge of performance
Progression to the edge of performance was spoken about In terms of
'stages' and associated experiences. Figure 10.2 provides a representation
of the controllers' experience at each stage, developed from participant
responses. Performance is first represented as an uneven line; there will
often be minor changes in performance although overall performance is
maintained to a consistently high standard.
Within the region of safe performance, controllers experience
nominal situations daily and are addressed with relative comfort.
Performance is maintained. If demand increases the controller may
experience subjective discomfort with the task. However, respondents
suggested that these experiences are seen as 'part of the job' and
251
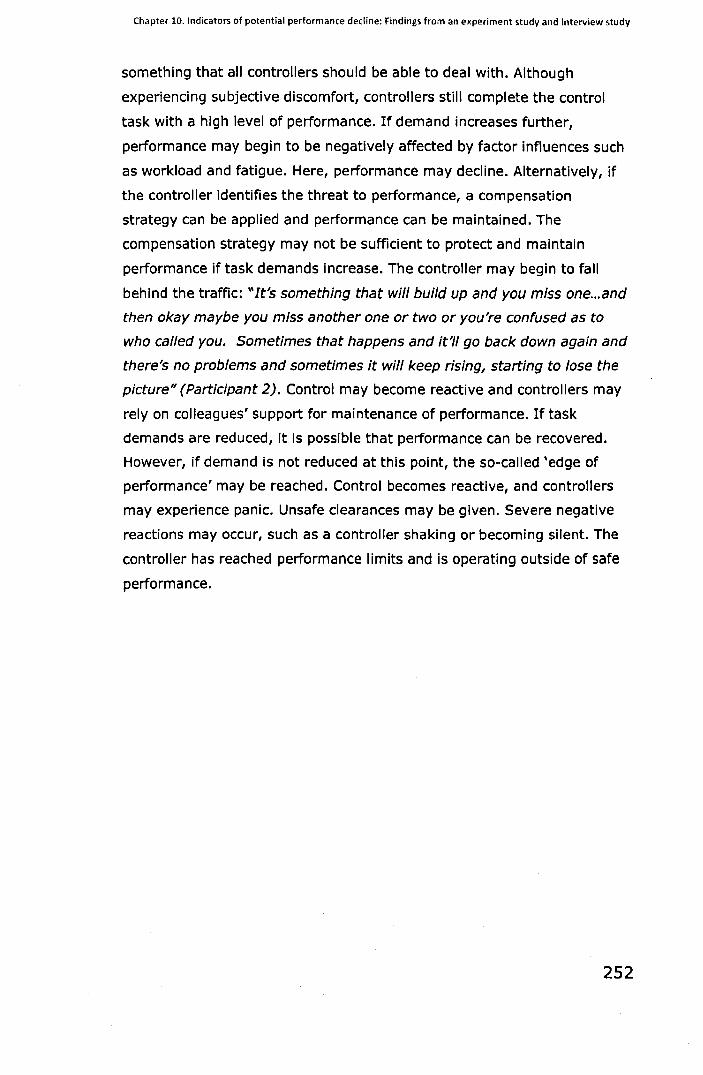
Chapter 10. Indicators of potential performance decline: Findings from an experiment study and interlliew study
something that all controllers should be able to deal with. Although
experiencing subjective discomfort, controllers still complete the control
task with a high level of performance. If demand increases further,
performance may begin to be negatively affected by factor influences such
as workload and fatigue. Here, performance may decline. Alternatively, if
the controller identifies the threat to performance, a compensation
strategy can be applied and performance can be maintained. The
compensation strategy may not be sufficient to protect and maintain
performance if task demands increase. The controller may begin to fall
behind the traffic: "It's something that will build up and you miss one ... and
then okay maybe you miss another one or two or you're confused as to
who called you. Sometimes that happens and it'll go back down again and
there's no problems and sometimes it will keep rising, starting to lose the
picture" (Participant 2). Control may become reactive and controllers may
rely on colleagues' support for maintenance of performance. If task
demands are reduced, it is possible that performance can be recovered.
However, if demand is not reduced at this point, the so-called 'edge of
performance' may be reached. Control becomes reactive, and controllers
may experience panic. Unsafe clearances may be given. Severe negative
reactions may occur, such as a controller shaking or becoming silent. The
controller has reached performance limits and is operating outside of safe
performa nce.
252

Chapter 10. Indicators of potential performance decline: Findings from an experiment study and interview study
Figure 10.2. Diagram of performance and demand with associated indicators and controllers' subjective experience
Experiencing discomfort but 'goes with the job'
Influence on controllercompensation strategy to protect performance. If not applied. performance may decline
FaIling behind, uncomfor table.CC applies strategies
...a:.. '1.1-..:--- -.....
No plan. panic. reliant on colleagues' support. blanking others
.. --•• ..... •• ••
Demand
10.3.3.3.15 Awareness of indicators
•••• • • • • • • • • • • • • • . • • • • • • • • ·
" , ,
Purely reactive, unsafe clearance, Silence • 'blacked out', shaking ,L..-__ .... , \
\ \ \ •
Compensation strategies are dependent on awareness
Controllers emphasised that awareness of indicators was critical to
employing a compensation strategy. One participant summarised: "I'd say
300%, if you know that you're not being top performing today then that's
fine, just adapt your working style and you'll get through the day. It
doesn't really matter but if you don't know It and you're still trying to do
the same then it might end in tears" (Participant 12).
When an influencing factor is present, performance may be
protected by several 'barriers' (created from awareness and compensation
strategies) before becoming vulnerable to factor Influences. Figure 10.3
represents the interplay between awareness and compensation strategy. If
an influencing factor occurs (e.g. fatigue) internal indicators such as
feelings of discomfort may alert the EC and trigger the application of a
compensation strategy. Performance may then be maintained. If an
internal marker did not occur or was not detected, another opportunity to
detect the issue may occur through observable indicators. For example:
"It's getting busy ... you start speaking fast and then somebody says "Say
again" and then that's it, you have a hint. 'Okay good, I have to slow down
253
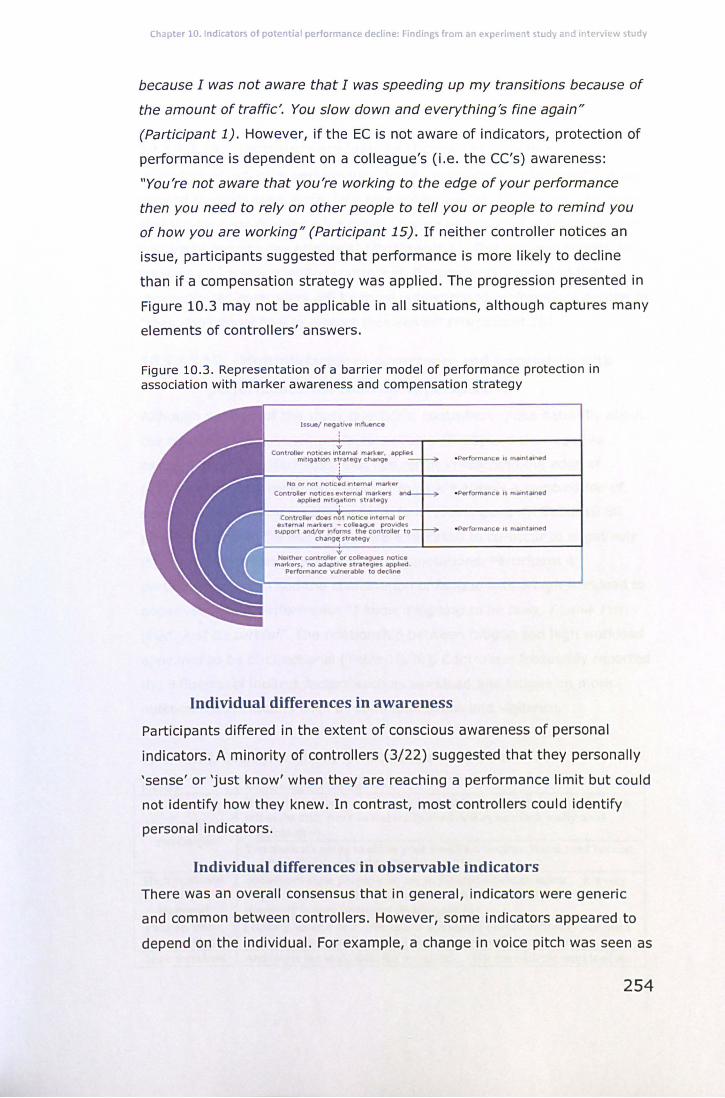
Chapter 10. Indicators of potential performance decline: Findings from an experiment study ard interview study
because I was not aware that I was speeding up my transitions because of
the amount of traffic'. You slow down and everything's fine again"
(Participant 1). However, if the EC is not aware of indicators, protection of
performance is dependent on a colleague's (i.e. the CC's) awareness:
"You're not aware that you're working to the edge of your performance
then you need to rely on other people to tell you or people to remind you
of how you are working" (Participant 15). If neither controller notices an
issue, participants suggested that performance is more likely to decline
than if a compensation strategy was applied. The progression presented in
Figure 10.3 may not be applicable in all situations, although captures many
elements of controllers' answers.
Figure 10.3. Representation of a barrier model of performance protection in association with marker awareness and compensation strategy
Individual differences in awareness
Participants differed in the extent of conscious awareness of personal
indicators. A minority of controllers (3/22) suggested that they personally
'sense' or 'just know' when they are reaching a performance limit but could
not identify how they knew. In contrast, most controllers could identify
personal indicators.
Individual differences in observable indicators
There was an overall consensus that in general, indicators were generic
and common between controllers. However, some indicators appeared to
depend on the individual. For example, a change in voice pitch was seen as
254
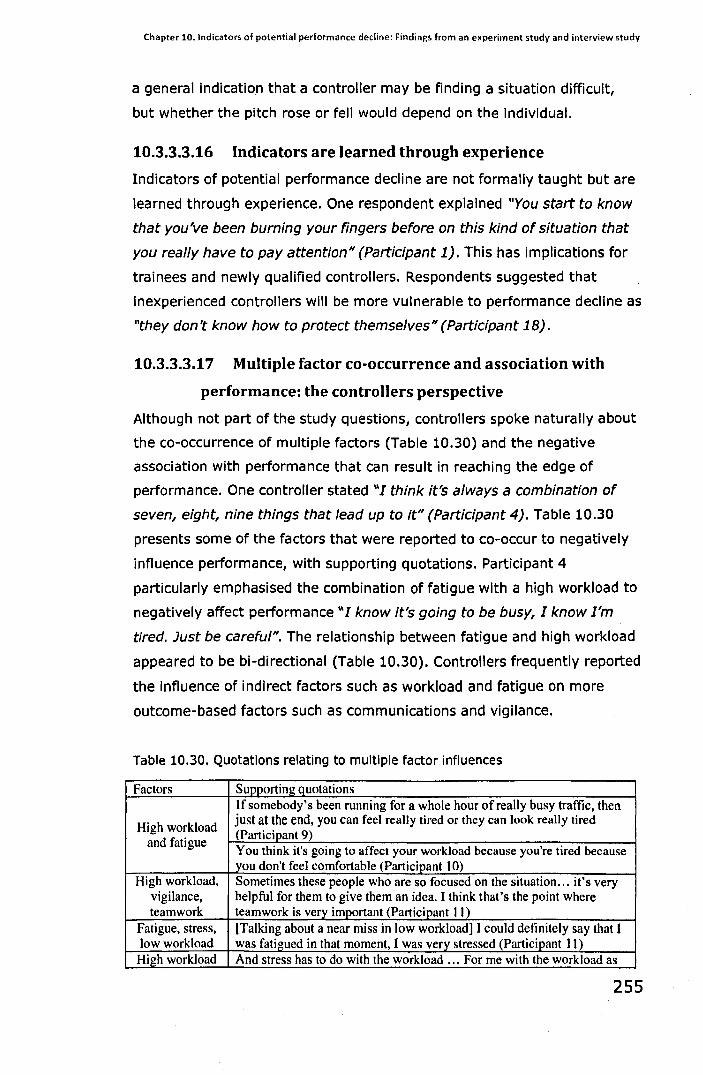
Chapter 10. Indicators of potential performance decline: Findings from an e~periment study and interview study
a general indication that a controller may be finding a situation difficult,
but whether the pitch rose or fell would depend on the individual.
10.3.3.3.16 Indicators are learned through experience
Indicators of potential performance decline are not formally taught but are
learned through experience. One respondent explained "You start to know
that you've been burning your fingers before on this kind of situation that
you really have to pay attention" (Participant 1). This has implications for
trainees and newly qualified controllers. Respondents suggested that
inexperienced controllers will be more vulnerable to performance decline as
"they don't know how to protect themselves" (PartiCipant 18).
10.3.3.3.17 Multiple factor co-occurrence and association with
performance: the controllers perspective
Although not part of the study questions, controllers spoke naturally about
the co-occurrence of multiple factors (Table 10.30) and the negative
association with performance that can result in reaching the edge of
performance. One controller stated "[ think it's always a combination of
seven, eight, nine things that lead up to it" (PartiCipant 4). Table 10.30
presents some of the factors that were reported to co-occur to negatively
influence performance, with supporting quotations. Participant 4
particularly emphasised the combination of fatigue with a high workload to
negatively affect performance "[ know it's going to be busy, 1 know I'm
tired. Just be careful". The relationship between fatigue and high workload
appeared to be bi-directional (Table 10.30). Controllers frequently reported
the influence of indirect factors such as workload and fatigue on more
outcome-based factors such as communications and vigilance.
Table 10.30. Quotations relating to multiple factor influences
Factors Supporting quotations Ifsomebody's been running for a whole hour of really busy traffic, then
High workload just at the end, you can feel really tired or they can look really tired (Participant 9)
and fatigue You think it's going to affect your workload because you're tired because you don't feel comfortable (Participant 10)
High workload, Sometimes these people who are so focused on the situation ... it's very vigilance, helpful for them to give them an idea. I think that's the point where teamwork teamwork is very important (Participant 11)
Fatigue, stress, [Talking about a near miss in low workload] I could definitely say that I low workload was fatigued in that moment, I was very stressed (Participant 11) High workload And stress has to do with the workload ... For me with the workload as
255
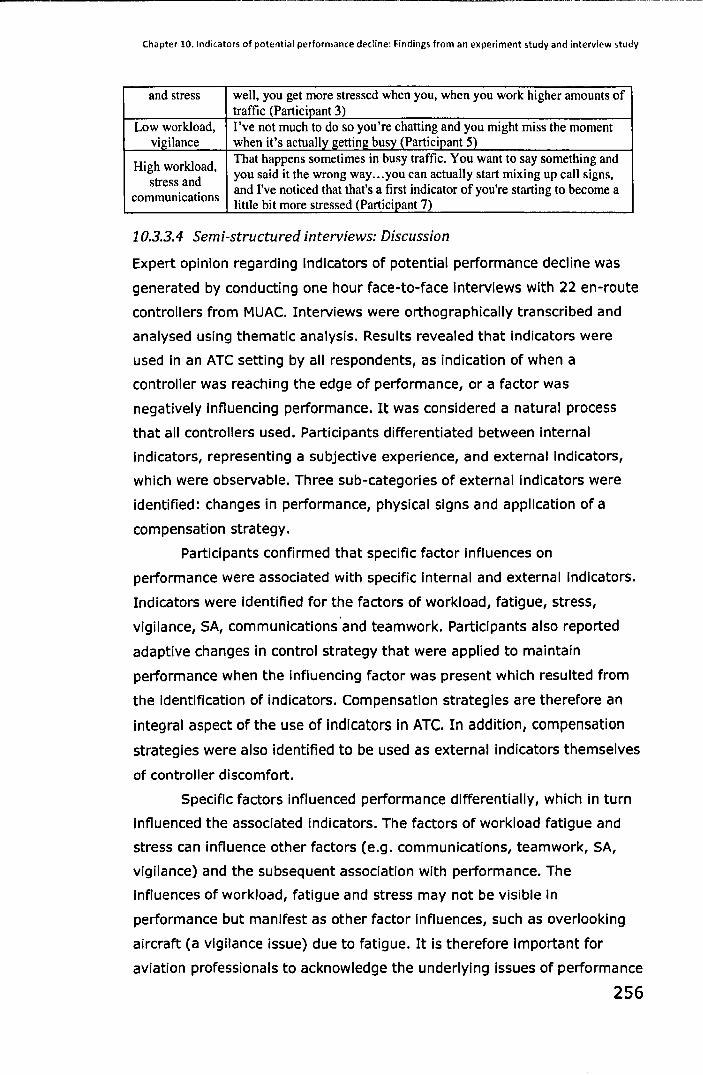
Chapter 10. Indicators of potential performance decline: Findings from an experiment study and interview study
and stress well, you get more stressed when you, when you work higher amounts of traffic (Participant 3)
Low workload, I've not much to do so you're chatting and you might miss the moment vigilance when it's actually getting busy (Participant 5)
High workload, That happens sometimes in busy traffic. You want to say something and
stress and you said it the wrong way ... you can actually start mixing up call signs,
communications and I've noticed that that's a first indicator of you're starting to become a little bit more stressed (Participant 7)
10.3.3.4 Semi-structured interviews: Discussion
Expert opinion regarding indicators of potential performance decline was
generated by conducting one hour face-to-face interviews with 22 en-route
controllers from MUAC. Interviews were orthographically transcribed and
analysed using thematic analysis. Results revealed that indicators were
used in an ATC setting by all respondents, as indication of when a
controller was reaching the edge of performance, or a factor was
negatively influencing performance. It was considered a natural process
that all controllers used. Participants differentiated between internal
indicators, representing a subjective experience, and external Indicators,
which were observable. Three sub-categories of external indicators were
identified: changes in performance, physical signs and application of a
compensation strategy.
Participants confirmed that specific factor influences on
performance were associated with specific Internal and external indicators.
Indicators were identified for the factors of workload, fatigue, stress,
vigilance, SA, communications 'and teamwork. Participants also reported
adaptive changes in control strategy that were applied to maintain
performance when the influencing factor was present which resulted from
the identification of indicators. Compensation strategies are therefore an
integral aspect of the use of indicators in ATe. In addition, compensation
strategies were also identified to be used as external indicators themselves
of controller discomfort.
Specific factors influenced performance differentially, which in turn
influenced the associated indicators. The factors of workload fatigue and
stress can influence other factors (e.g. communications, teamwork, SA,
vigilance) and the subsequent association with performance. The
influences of workload, fatigue and stress may not be visible In
performance but manifest as other factor Influences, such as overlooking
aircraft (a vigilance issue) due to fatigue. It is therefore Important for
aviation professionals to acknowledge the underlying issues of performance
256
Chapter 10. Indicators of potential performance decline: Findings from an experiment study and interview study
declines to gain a valid and comprehensive understanding about factor
influences and to understand how to best protect performance. Factors
such as communications, vigilance, teamwork and SA influence
performance directly.
A progression to the edge of performance was developed based on
participant responses. The representation describes the subjective
experience of controllers at each stage, and the Indicators associated with
the edge, and moving over the edge of performance. Although this may
not be applicable in all control situations, the representation of a move to
the edge of performance may provide a standardised understanding of the
indicators and control situations to monitor and contributes understanding
to the wider human performance field.
Awareness emerged as an integral element in the use of Indicators;
controllers needed to be aware of their own or colleagues' Indicators In
order to apply a compensation strategy. It was suggested that there were
individual differences in overall levels of awareness. In addition, controllers
suggested that it was harder to be self-aware than aware of colleagues'
indicators. This was especially true for Inexperienced controllers who were
perceived to not have the experience in order to Identify Indicators and
apply adaptive strategies. Awareness is critical In the identification of
indicators and subsequent application of adaptive strategies to protect
performance. Supervisors and CCs may benefit from a more standardised
list of generiC indicators, and in addition, possibly learn different indicators
to monitor from each other. Workshops that provide standardised
indicators for which to monitor, and support development of awareness of
indicators for the self and colleagues', may support controllers in protecting
and maintaining performance in the presence of negative influences. This
may also support trainees in protecting performance whilst developing the
required experience to identify their own indicators.
Although not in the study aims, it was interesting to note that
controllers naturally raised the issue of multiple factor occurrences and the
influence on performance. One controller suggested that it Is often a
combination of seven or more things that add up to result in a performance
decline. To gain a comprehensive understanding of factor Influences on
performance and the progression to the safe edge of performance, multiple
factor combinations must be acknowledge both in research and in practical
applications such as near-miss and incident investigations.
257
Chapter 10. Indicators of potential performance decline: Findings from an experiment study and interview study
The advantage of the interview study is that rich, qualitative data
was generated from ATC experts to provide comprehensive information in
the investigation of indicators in an ATC setting. The broad ranges on
participants in role, age, experience, and control sector ensured that views
were representative across several subgroups in the control centre. Further
research may confirm the stages of progression towards the edge of
performance and investigate validity and reliability in generalisation to
other control centres. In addition, further research may investigate the use
of standardised indicators in facilitating supervisors and controllers in
identifying potential performance decline and subsequently applying
compensation strategies to prevent performance decline.
10.4 Chapter summary
This chapter presented findings from an experiment study and an Interview
study that investigated the concept of indicators of potential performance
decline. Findings from the experimental study confirmed that associations
between participant behaviours and factors were in the direction expected
and supported the potential association between participant behaviours
and performance.
An interview study was then described, which aimed to Investigate
the use of indicators of performance decline by en-route ATCOs, and
identify specific Indicators. A total of 22 en-route ATCOs from MUAC
participated in one hour face-to-face semi-structured Interviews. Results
supported that indicators are used by ATCOs to Inform potential
performance decline. Indicators that were associated with specific factor
influences were identified. Finally, a visual representation of the
progression to the edge of performance was developed from partiCipant
responses. It was concluded that the use of indicators in ATC facilitate the
protection and maintenance of performance.
258
Chapter 11. Discussion
Chapter 11. Discussion
11.1 Chapter overview
This final chapter demonstrates how each research aim was achieved by
the work presented in this thesis, and discusses the significant
contributions and implications of this research to understanding human
performance in air traffic control. The thesis was concerned with
investigating the existence of human factor interactions and the
subsequent association with human performance in air traffic control. For
the study to have practical relevance, the thesis investigated the use of
internal and external indicators to facilitate the implementation of
supportive strategies to prevent controllers experiencing reduced
performance due to an interaction of multiple factors. This research was
essential to address previous research gaps in human factors literature,
and develop a comprehensive understanding of the occurrences of factors
in an ATC setting and the associated influences on controller performance.
In addition, it was important to investigate potential strategies that may
mitigate factor influences and prevent performance decline. This chapter
discusses the main research findings in relation to each study aim.
Different research studies contributed to different aims. The contributions
of this thesis to understanding human performance in air traffic control are
emphasised and discussed. An acknowledgement of research limitations,
and attempts to control for the limitations, is outlined, followed by
suggestions for future research. The thesis concludes with practical
recommendations and a summary of the main findings and contributions of
the thesis.
11.2 The changing landscape of human factors included for
consideration in different research stages
An initial set of nine factors (workload, fatigue, stress, attention, Vigilance,
SA, communications, teamwork, trust) that were provided by
EUROCONTROL provided the scope for this research. Throughout the
development of the thesis, the factors included for investigation in
individual research studies were adjusted as necessary, informed by
aviation-expert recommendations and pragmatic considerations.
259
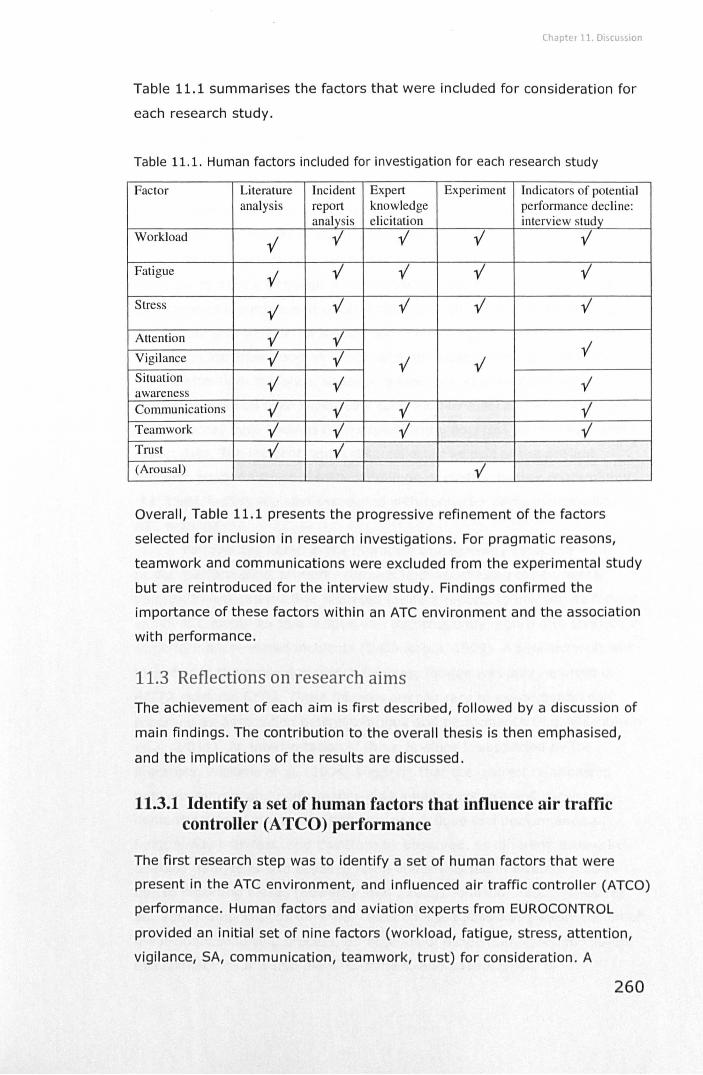
Chapter 11. Discussion
Table 11.1 summarises the factors that were included for consideration for
each research study.
Table 11.1. Human factors included for investigation for each research study
Factor Literature Incident Expert Experiment Indicators of potential analysis report knowledge performance decline:
analysis elicitation interview study Workload y' y' y' y' y'
Fatigue y' y' y' y' y'
Stress y' y' y' y' y'
Attention y' y' y'
Vigilance y' y' y' y' Situation y' y' y' awareness Communications y' y' y' y' Teamwork y' y' y' y' Trust y' y' (Arousal) y'
Overall, Table 11.1 presents the progressive refinement of the factors
selected for inclusion in research investigations. For pragmatic reasons,
teamwork and communications were excluded from the experimental study
but are reintroduced for the interview study. Findings confirmed the
importance of these factors within an ATC environment and the association
with performance.
11.3 Reflections on research aims
The achievement of each aim is first described, followed by a discussion of
main findings. The contribution to the overall thesis is then emphasised,
and the implications of the resu lts are discussed.
11.3.1 Identify a set of human factors that influence air traffic controller (A TeO) performance
The first research step was to identify a set of human factors that were
present in the ATe environment, and influenced air traffic controller (ATCO)
performance. Human factors and aviation experts from EUROCONTROL
provided an initial set of nine factors (workload, fatigue, stress, attention,
vigilance, SA, communication, teamwork, trust) for consideration. A
260
Chapter 11. Discussion
literature review of peer-reviewed conference and journal papers
confirmed that each factor was reported to be present in the control
environment, or part of the control task, and was found to be associated
with controller performance. An analysis of European aviation
performance-related incident reports in which ATCOs were reported to
have caused or contributed to the incident confirmed the occurrence of
each of the nine factors in an ATC environment.
All nine factors were supported in the literature to associate with
ATCO performance although the relationship between some factors and
performance are more well-documented that others. Within the literature,
the relationship between workload and controller performance had been
frequently identified, both in expert and non-expert samples. Similarly,
stress, attention, vigilance, situation awareness, communications and
teamwork have all been repeatedly confirmed to associate with controller
performance, from findings from experimental analyses as well as Incident
report data. The Incident report data collected as part of the present
research supports these literature findings, providing further confirmation
that these factors are also associated with controller performance within
ATC settings.
Fatigue was noted in the literature to negatively associate with
human performance, primarily through findings utilising experimental
studies. Investigations that analysed incident reports to Investigate fatigue
within ATC identified that fatigue was not frequently reported to contribute
to performance-related incidents (Della Rocca, 1999). A similar result was
identified in the present research findings; fatigue was only reported in
6/272 incidents (2%). These findings are contrary to experimental data
reporting an association between fatigue and performance (e.g. Williamson
et aI., 2011). An interpretation of these findings Is supported by the
literature. Wickens et al. (2004) suggests that the indirect relationship
between fatigue and performance may Inhibit a reliable and consistent
demonstration of the association between fatigue and performance as
fatigue may manifest, and therefore be observed, as different Issues. In
addition, fatigue is also believed to be underreported in incident reports
due to reporting biases (Edwards et aI., 2011; Johnson, 2001; Kirwan et
aI., 2001). Implications for wider research are a possible re-examination of
the incident reporting process, or methods of incident analysiS, to capture
this complex data within the ATC domain, and advancement of
261
Chapter 11. Discussion
methodologies to support the assessment of fatigue in association with
controller performance during offline simulations.
Similarly, stress is repeatedly documented to associate with ATCO
performance within the reviewed literature. Incident report findings
identified that stress was only reported to contribute to 3/272 incidents
(1%). This result is surprising, but may result from the same biases that
are suggested to influence the reporting of fatigue. Stress has an indirect
relationship with performance and so may manifest as different,
observable issues. In addition, it is hard to retrospectively confirm, without
assumption, that stress contributed to an incident.
Finally, the findings related to the factor of trust require some
discussion. Literature findings report an association between trust
(interpersonal and trust in machines) and performance (e.g. Erdem and
Ozen, 2003; Muir & Moray, 1996). In addition, Mosier et al. (1994)
reported that over-trust in technology was reported as a contributor in
aviation incident reports. This finding is in contrast to the incident report
findings generated as part of this PhD research; trust was only reported in
nine/272 incidents (3%). It is important to note that several studies report
an indirect association between trust and performance. For example, Muir
and Moray (1996) reported that over-trust in technology negatively
correlated to monitoring behaViours, whilst MOSier et al. (1994) reported
that over-trust in technology was associated in monitoring failures in the
sample of incident reports reviewed. Therefore, as with fatigue and stress,
the indirect relationship between trust and performance may have
influenced the identification of trust in performance-related incidents. This
finding has wider implications. It is suggested that if trust is associated
with performance, and is therefore a factor of concern in ATC, methods of
capturing this data are required in order to comprehensively generate a
valid understanding of the influence of trust in association with ATCO
performance.
The incident report data extends previous incident report analyses
reported in the literature sample. Several studies used Incident report data
to investigate the association between factors and controller performance,
although the majority of studies restricted the focus of analysis to data
from the US (e.g. Della Rocca, 1999, Mosier et aI., 1994) or the UK (e.g.
Shorrock, 2007). Findings from the current research therefore provide
confirmation that the considered set of nine factors Is also reported to be
262
Chapter 11. Discussion
associated with performance decline throughout European ANSP centres.
In addition the similarity between international incident report data
suggests that these factor associations with ATCO performance may not be
specific to individual cultures, but pervasive human factor Issues that are a
significant concern within the ATC domain. Research must continue to
advance in order to mitigate the association of these speCific factors with
controller performance.
In summary, findings confirmed that the set of nine human factors
occur in an ATC setting and are associated with controller performance.
Findings suggest that these factors are appropriate to be included in future
research, providing the initial foundations of the research.
Findings have implications for wider research. Literature reporting
factor influences In association with controller performance was sporadic
for certain factors, (e.g. Matthews & Davies, 2001) and often resulted from
experimental studies (Wickens at aI., 1997) which were potentially not
transferable to an ATC setting. Findings support previous research by
providing confirmation of the factors that are reported to occur speCifically
within ATC settings and are associated with controller performance. One
practical implication of the findings Is that it may be useful for ATC
supervisors to be aware of the factors that are negatively associated with
controller performance to facilitate monitoring and supporting controllers.
11.3.2 Select a sub-group of factors that may be included in further studies
It was impractical to include all nine factors In further research. It was
therefore necessary to select a subset of factors. It was Intended that the
factors most frequently negatively associated with controller performance,
as well as the most frequently considered factors In previous multifactor
investigations, were selected so that the most critical factors In relation to
ATCO performance were included in the next research stage.
Three separate studies contributed to achieving the second study
aim: a literature review analysis of the frequency of factors included in
peer-reviewed papers that investigated the relationship between at least
two human factors, a performance-related incident report analysis and a
questionnaire of air traffic professionals. Each methodology resulted In a
ranked hierarchy of the recorded frequency of the nine factors that
263
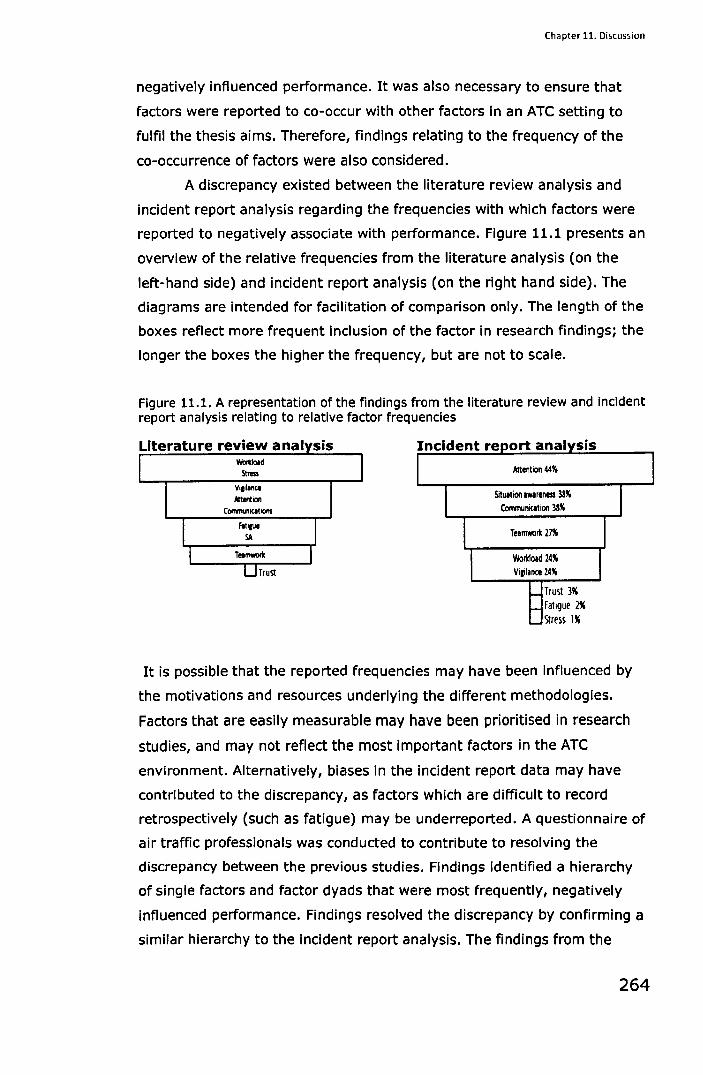
Chapter 11. Discussion
negatively influenced performance. It was also necessary to ensure that
factors were reported to co-occur with other factors in an ATC setting to
fulfil the thesis aims. Therefore, findings relating to the frequency of the
co-occurrence of factors were also considered.
A discrepancy existed between the literature review analysis and
incident report analysis regarding the frequencies with which factors were
reported to negatively associate with performance. Figure 11.1 presents an
overview of the relative frequencies from the literature analysis (on the
left-hand side) and incident report analysis (on the right hand side). The
diagrams are intended for facilitation of comparison only. The length of the
boxes reflect more frequent inclusion of the factor in research findings; the
longer the boxes the higher the frequency, but are not to scale.
Figure 11.1. A representation of the findings from the literature review and Incident report analysis relating to relative factor frequencies
Attention 44~
Situation IWirenm 38~ ComrIlIIniCItion 38\
Telmwork 27\
WorklOid 24% Vigillnee 24\
sis
Trust 3" Fatigue 2" Slrm 1"
It is possible that the reported frequencies may have been Influenced by
the motivations and resources underlying the different methodologies.
Factors that are easily measurable may have been prioritised in research
studies, and may not reflect the most Important factors in the ATC
environment. Alternatively, biases in the incident report data may have
contributed to the discrepancy, as factors which are difficult to record
retrospectively (such as fatigue) may be underreported. A questionnaire of
air traffic professionals was conducted to contribute to resolving the
discrepancy between the previous studies. Findings Identified a hierarchy
of single factors and factor dyads that were most frequently, negatively
influenced performance. Findings resolved the discrepancy by confirming a
similar hierarchy to the incident report analysis. The findings from the
264
Chapter 11. Discussion
three studies were compared and informed the selection of a subgroup of
factors, achieving the second study aim.
The contribution of these findings to the thesis is the selection of a
sub-group of factors for use in future research, facilitating progression to
the next research stage. Selected factors are supported by three
methodologies to be most frequently and negatively associated with
controller performance. The reasons for the discrepancy may be similar to
the interpretation outlined above for the discrepancy between the literature
analysis and incident report analysis. Further research should be
considered to Investigate and address this discrepancy.
Findings also have implications for the wider ATC domain. Both
incident report data and aviation expert opinion confirmed the co
occurrence of human factors In ATC. This Is an important finding. There is
a relative lack of research on multifactor influences on ATCO performance.
It is therefore suggested that literature findings are out of step with real
ATM domains. In order to gain an ecologically valid and comprehensive
understanding of the current 'threats' to performance in the ATC domain,
research needs to acknowledge and develop further understand of
multifactor influences In ATC and the associated influence on controller
performance. Findings also contribute to a more detailed understanding of
the factors that most frequently are negatively associated with controller
performance.
11.3.3 Investigate the relationships and potential interactions between multiple, selected human factors
An important expectation of the thesis was to investigate the relationship
and possible interactions between multiple factors; previous research of
these topics was sparse, especially speCific to the ATC domain. Both
experimental and field-based studies contributed to achieving this research
aim, summarised in Table 11.2.
265
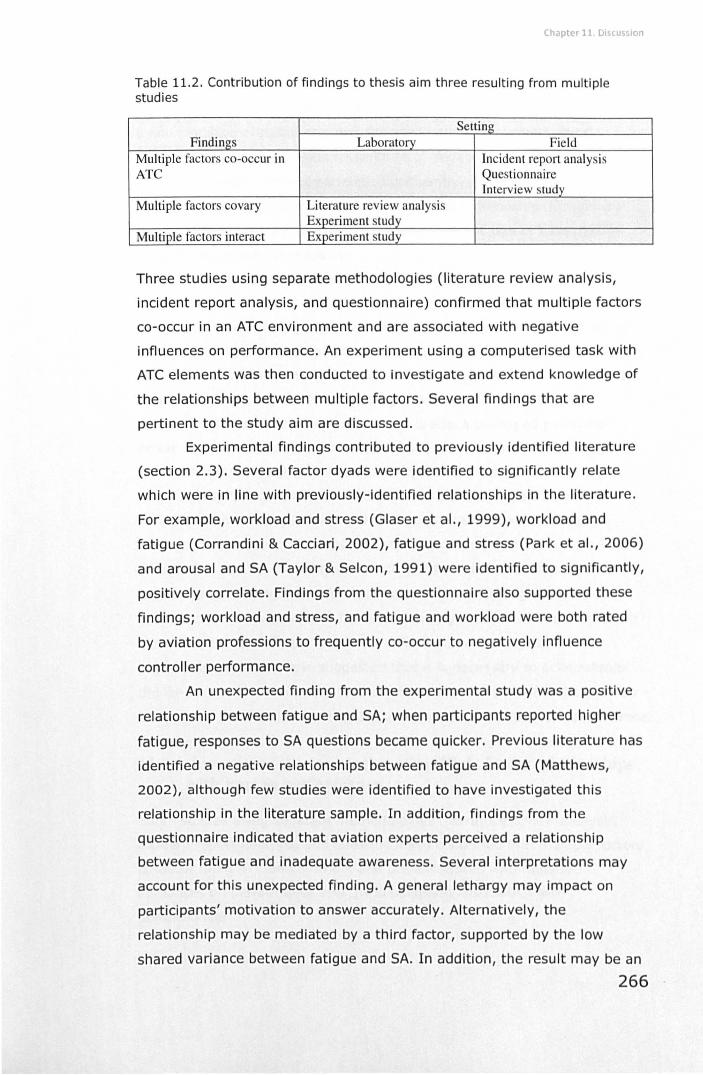
Chapter 11. Discussion
Table 11.2. Contribution of findings to thesis aim three resulting from multiple studies
Setting Findings Laboratory Field
Multiple factors co-occur in Incident report analysis ATe Questionnai re
Interview study Multiple factors covary Literature review analysis
Experiment study Multiple factors interact Experiment study
Three studies using separate methodologies (literature review analysis,
incident report analysis, and questionnaire) confirmed that multiple factors
co-occur in an ATC environment and are associated with negative
influences on performance. An experiment using a computerised task with
ATC elements was then conducted to investigate and extend knowledge of
the relationships between multiple factors. Several findings that are
pertinent to the study aim are discussed.
Experimental findings contributed to previously identified literature
(section 2.3). Several factor dyads were identified to significantly relate
which were in line with previously-identified relationships in the literature.
For example, workload and stress (Glaser et al., 1999), workload and
fatigue (Corrandini & Cacciari, 2002), fatigue and stress (Park et aI., 2006)
and arousal and SA (Taylor & Selcon, 1991) were identified to significantly,
positively correlate. Findings from the questionnaire also supported these
findings; workload and stress, and fatigue and workload were both rated
by aviation professions to frequently co-occur to negatively influence
controller performance.
An unexpected finding from the experimental study was a positive
relationship between fatigue and SA; when participants reported higher
fatigue, responses to SA questions became quicker. Previous literature has
identified a negative relationships between fatigue and SA (Matthews,
2002), although few studies were identified to have investigated this
relationship in the literature sample. In addition, findings from the
questionnaire indicated that aviation experts perceived a relationship
between fatigue and inadequate awareness. Several interpretations may
account for this unexpected finding. A general lethargy may impact on
participants' motivation to answer accurately. Alternatively, the
relationship may be mediated by a third factor, supported by the low
shared variance between fatigue and SA. In addition, the result may be an
266
Chapter 11. Di~cussion
artefact of the limitations of the SA measure. Further research should be
completed to gain a further understanding of this relationship. In addition,
a non-significant relationship was reported between workload and SA
which conflicts with previous research (e.g. Wickens, 2002). In addition,
stress and SA also did not correlate significantly. Again, this is contrary to
expectations (e.g. Endsley, 1995) although this relationship is in general
underreported (Perry et aI., 2008). Findings may be due to the potential
inaccuracies of the SA measure.
The relationship between arousal and SA was observed to be
potentially curvilinear. Arousal is a U-shaped performance driver (I.e. not
monotonic) and may be negatively associated with performance at either
extreme of under-arousal and over-arousal. A scatter graph appeared to
show that response times to SA questions became faster with experienced
arousal reported to be in the mid-range. U shaped factors may have
influenced the statistical analysis. Stress is also a U-shaped performance
driver. A potential curvilinear relationship was identified between stress
and workload although this was not analysed further.
Overall, findings therefore supported the covariance between
multiple factors, and partially confirmed previous research findings.
Findings contribute to previous research by confirming that multiple factors
do co-occur in ATC. Experimental findings confirm relationships between
factor dyads. Findings therefore add to the understanding of the co
occurrence and covariance of factors, both to general human performance
literature, and specifically within the ATC domain. Findings also have
practical implications; it is suggested that it is necessary to acknowledge
the co-occurrence of multiple factors within the ATC domain to achieve an
ecologically valid understanding of the influences on controller performance.
11.3.4 Investigate the association of multiple factor relationships with human performance
Three studies using separate methodologies (literature review analYSiS,
incident report analYSiS, and questionnaire) confirmed that multiple factors
co-occur in an ATC environment and are associated with negative
influences on performance and the subsequent association with
performance.
267
Chapter 11. Discussion
The association between covarying factors and performance was
investigated using a median split approach. An important finding is that
factor dyad groupings appear to cumulatively associate with both safety
related and efficiency-related performance measures; performance decline
was greater when associated with two or more negatively influencing
factors than when associated with a single negatively influencing factor.
For example, a low workload and poor SA were associated with a higher
frequency of STCAs than either of these factors that appeared alone (for
example, low workload and good SA, or poor SA and high workload). This
analysis extended previous research and addressed a gap in previous
research of the investigation of multifactor combinations in association with
performance. In addition, the use of a median split technique contributes
to an additional research gap in which the majority of studies investigating
factor relationships used correlation analyses only. Findings contribute
further understanding to the research domain.
Importantly, greater performance variance was explained by factor
triads as opposed to single factors or factor dyads. This result may be
interpreted in the context of 'Limited Resources' (Wickens, 1984). An
accumulation of negatively-influencing factors may demand more
resources to support performance. When a task is cognitively demanding,
control strategies are utilised to support performance (Sperandio, 1971).
However, if factor co-occurrences continue to negatively Influence
performance, and/or resources become substantially depleted, the
remaining cognitive resources and control strategies may not be sufficient
to meet the demands of the task, resulting in reduced performance.
Therefore, it may be hypothesized that under some circumstances, It Is not
necessarily the extent of a single factors' influence on performance (unless
in an extreme form, such as overload), but the number of Interacting
factors which when combined have a negative Influence on performance,
that determines the overall association with performance.
Results from an interview study with active en-route controllers
further confirmed the co-occurrence of multiple factors In ATC and an
association with performance decline, based on their own experience.
Participants naturally spoke of multiple factor occurrences, and suggested
that performance declines do not often result from the Influence of a single
factor in current operations environments. ATCO opinion therefore
supports experimental findings.
268
Chapter 11. Discu~sion
The achievement of this aim contributed to the thesis by
investigating the relationship between multiple factors and the subsequent
association with performance. The implication of this finding Is the
importance of considering multiple factors when Investigating human
performance in safety critical situations. Findings also have Implications for
ATC. It may be suggested that incident investigations are facilitated by
encouraging a focus on the co-occurrence of multiple factors.
11.3.5 Inform fundamental understanding of ATCO behaviour at the edge of performance
This thesis aim was necessary to extend understanding of the nature of
behaviour at the edge of performance. It was Important to understand the
association of multiple factors with controllers reaching the edge of
performance, and the progression from a safe to an unsafe region of
performance.
Experimental results specific to periods of high taskload were
analysed to investigate participants' reaching the edge of performance. The
most frequently identified performance shape consisted of several periods
of small performance declines occurring In association with multifactor
influences interspersed with periods of maintenance. It was only when
negative performance-influencing factors combined (I.e. high stress In
combination with poor situation awareness) that performance declined
steeply, indicating that the combined Influence may push participants to
the edge of performance.
Findings from an interview study with qualified en-route ATCOs
expanded on experimental findings by providing an ATC-speclfic
perspective of controller behaviour around the edge of performance.
Participant responses were used to develop of a representation of the
progression from safe performance to the edge of performance. Findings
suggested that when controllers experienced negative factor Influences
(such as feelings of fatigue or discomfort during a high taskload),
strategies are applied to mitigate the Influence of the factor; this may be
sufficient to maintain performance. Controllers may also use observable,
small declines in performance, such as communications mistakes,
overlooking an aircraft, or falling behind traffic, to Indicate that a change In
control strategy is required. The application of a compensation strategy
269
Chapter 11. Discussion
may maintain performance until factor influences change or task demands
increase, at which point performance may again decline. This finding
therefore indicates that the shape of performance most frequently
identified in the experimental results may result from small performance
declines interspersed with changes in control strategy to support
performance. The research aim was therefore achieved with a combination
of experiment data which was supported and further informed by
qualitative data from en-route ATCOs.
The contribution of these findings to the thesis is a more detailed
understanding of the manifestation of multifactor influences on
performance. Findings confirmed that the concept of an edge of
performance is applicable to human performance in ATC. In addition,
findings indicated that performance can be protected and maintained by
the application of supportive strategies prior to reaching the edge of
performance.
Findings also contribute to wider research, providing further
understanding of the edge of performance and a foundation for future
research to build upon, and further develop the understanding of the
progression of performance decline and behaviour at the edge of
performance. Findings also have important practical implications for ATC.
Findings extended knowledge of the compensation strategies used to
protect and maintain performance. If indicators can be Identified to
highlight when a supportive strategy is needed, one of the potential
outcomes of this finding is that it may be possible that performance can be
maintained and steep performance declines may be prevented.
11.3.6 Identify indicators of potential performance decline
Previous findings confirmed the nature of performance around the edge of
safe performance. It was essential to build on these findings and
investigate if indicators may indicate when a controller was reaching the
edge of performance so that supportive strategies may be implemented to
support controllers' performance when influenced by multifactor
combinations, and therefore prevent performance decline.
Participant behaviours were observed throughout experiment trials.
Correlation analyses were applied to investigate the association between
behaviours and self-reported factors and performance measures. Findings
270
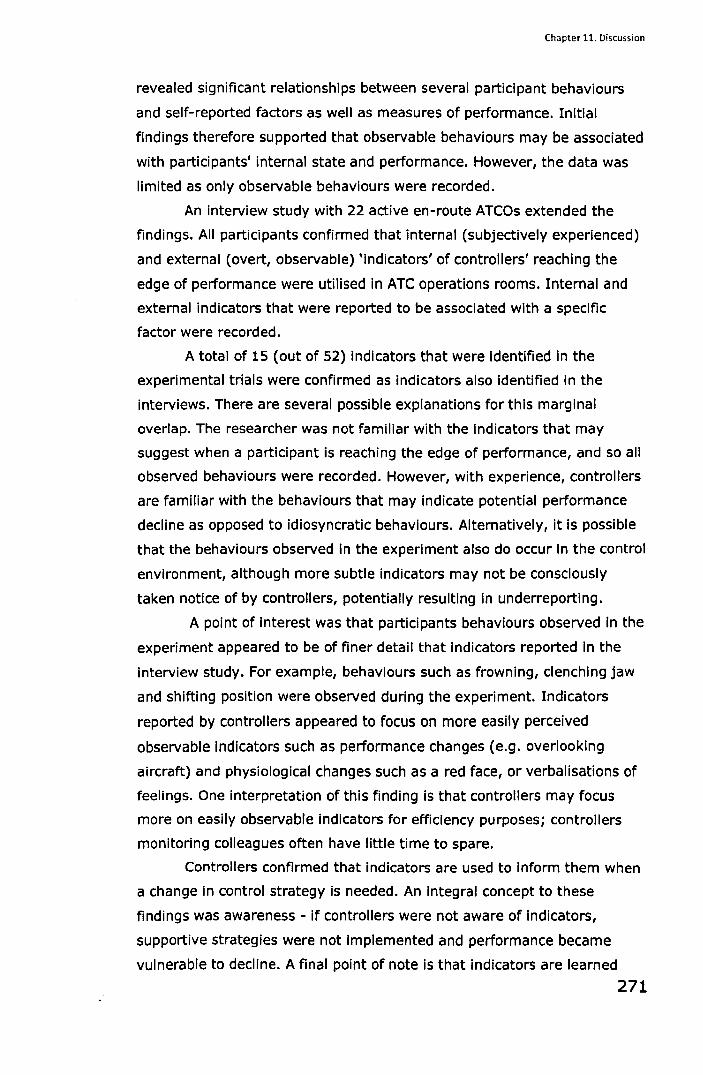
Chapter 11. Discussion
revealed significant relationships between several participant behaviours
and self-reported factors as well as measures of performance. Initial
findings therefore supported that observable behaviours may be associated
with participants' internal state and performance. However, the data was
limited as only observable behaviours were recorded.
An interview study with 22 active en-route ATCOs extended the
findings. All participants confirmed that internal (subjectively experienced)
and external (overt, observable) 'indicators' of controllers' reaching the
edge of performance were utilised in ATC operations rooms. Internal and
external indicators that were reported to be associated with a specific
factor were recorded.
A total of 15 (out of 52) indicators that were identified in the
experimental trials were confirmed as indicators also Identified In the
interviews. There are several possible explanations for this marginal
overlap. The researcher was not familiar with the Indicators that may
suggest when a participant Is reaching the edge of performance, and so all
observed behaviours were recorded. However, with experience, controllers
are familiar with the behaviours that may Indicate potential performance
decline as opposed to idiosyncratic behaviours. Alternatively, it Is possible
that the behaviours observed in the experiment also do occur In the control
environment, although more subtle indicators may not be consciously
taken notice of by controllers, potentially resulting in underreporting.
A point of interest was that participants behaviours observed in the
experiment appeared to be of finer detail that indicators reported in the
interview study. For example, behaviours such as frowning, clenching jaw
and shifting position were observed during the experiment. Indicators
reported by controllers appeared to focus on more easily perceived
observable indicators such as performance changes (e.g. overlooking
aircraft) and physiological changes such as a red face, or verbalisations of
feelings. One interpretation of this finding is that controllers may focus
more on easily observable indicators for efficiency purposes; controllers
monitoring colleagues often have little time to spare.
Controllers confirmed that Indicators are used to Inform them when
a change in control strategy is needed. An integral concept to these
findings was awareness - if controllers were not aware of indicators,
supportive strategies were not implemented and performance became
vulnerable to decline. A final point of note is that indicators are learned
271
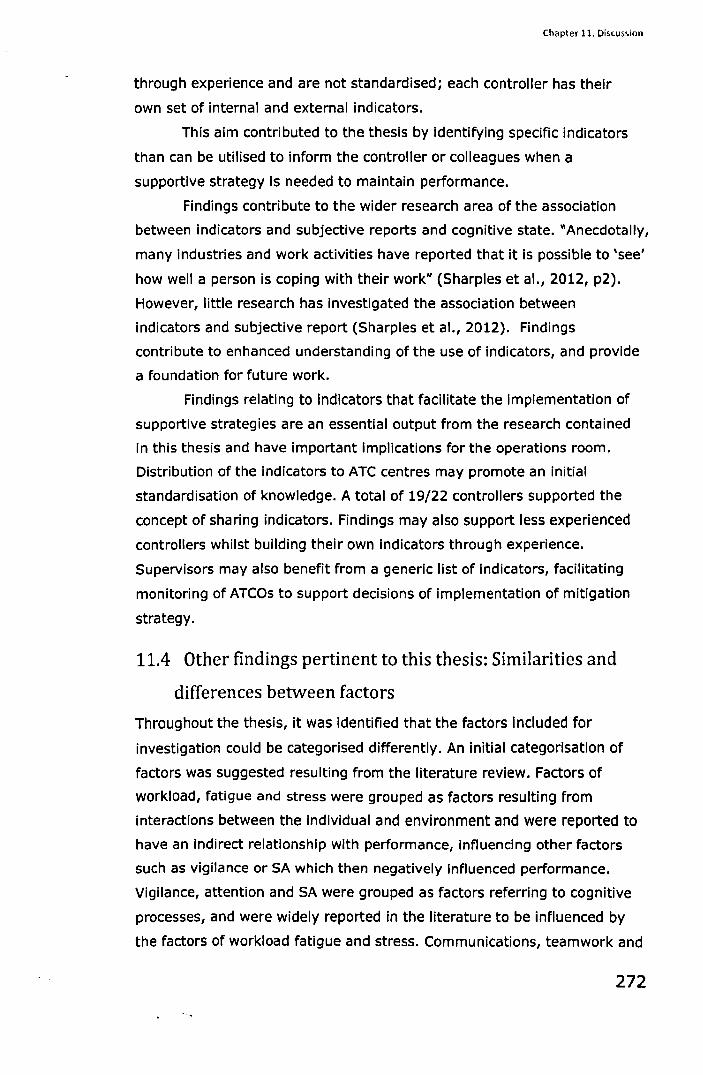
Chapter 11. Discus~ion
through experience and are not standardised; each controller has their
own set of internal and external indicators.
This aim contributed to the thesis by Identifying specific indicators
than can be utilised to inform the controller or colleagues when a
supportive strategy is needed to maintain performance.
Findings contribute to the wider research area of the association
between indicators and subjective reports and cognitive state. "Anecdotally,
many industries and work activities have reported that it is possible to 'see'
how well a person is coping with their work" (Sharples et aI., 2012, p2).
However, little research has investigated the association between
indicators and subjective report (Sharples et aL, 2012). Findings
contribute to enhanced understanding of the use of Indicators, and provide
a foundation for future work.
Findings relating to indicators that facilitate the Implementation of
supportive strategies are an essential output from the research contained
in this thesis and have important Implications for the operations room.
Distribution of the indicators to ATC centres may promote an initial
standardisation of knowledge. A total of 19/22 controllers supported the
concept of sharing indicators. Findings may also support less experienced
controllers whilst building their own indicators through experience.
Supervisors may also benefit from a generic list of indicators, facilitating
monitoring of ATCOs to support decisions of Implementation of mitigation
strategy.
11.4 Other findings pertinent to this thesis: Similarities and
differences between factors
Throughout the thesis, it was identified that the factors included for
investigation could be categorised differently. An initial categorisation of
factors was suggested resulting from the literature review. Factors of
workload, fatigue and stress were grouped as factors resulting from
Interactions between the individual and environment and were reported to
have an indirect relationship with performance, influencing other factors
such as vigilance or SA which then negatively Influenced performance.
Vigilance, attention and SA were grouped as factors referring to cognitive
processes, and were widely reported in the literature to be influenced by
the factors of workload fatigue and stress. Communications, teamwork and
272
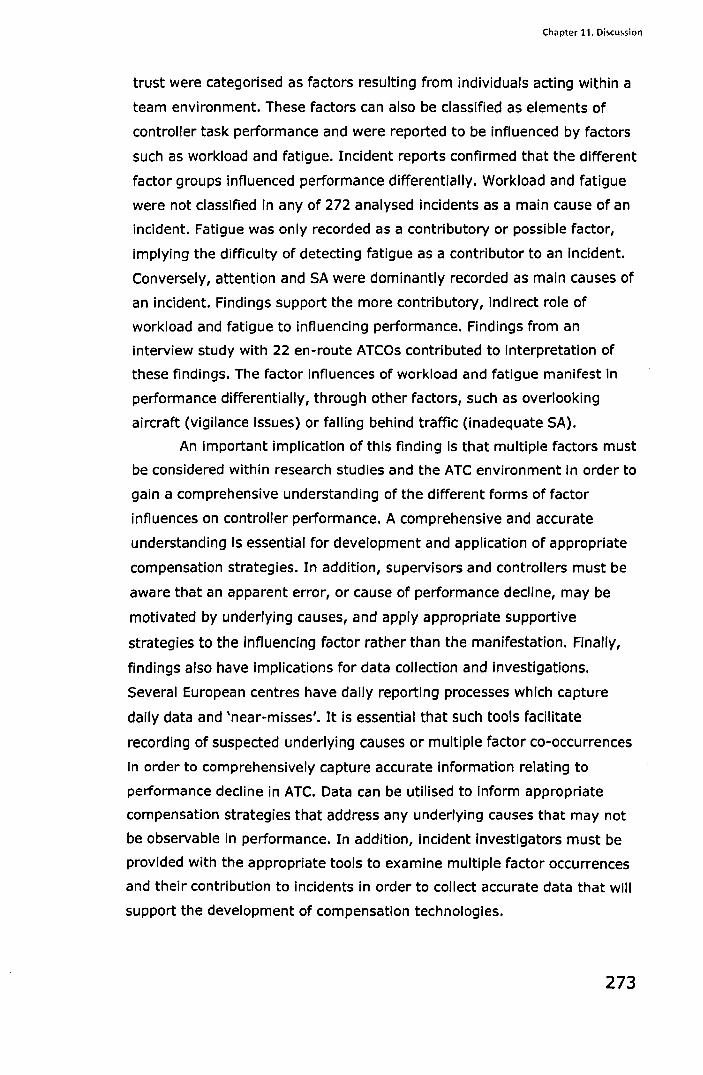
Chapter 11. Discu~sion
trust were categorised as factors resulting from individuals acting within a
team environment. These factors can also be classified as elements of
controller task performance and were reported to be influenced by factors
such as workload and fatigue. Incident reports confirmed that the different
factor groups influenced performance differentially. Workload and fatigue
were not classified in any of 272 analysed incidents as a main cause of an
incident. Fatigue was only recorded as a contributory or possible factor,
implying the difficulty of detecting fatigue as a contributor to an incident.
Conversely, attention and SA were dominantly recorded as main causes of
an incident. Findings support the more contributory, indirect role of
workload and fatigue to influencing performance. Findings from an
interview study with 22 en-route ATCOs contributed to interpretation of
these findings. The factor influences of workload and fatigue manifest in
performance differentially, through other factors, such as overlooking
aircraft (vigilance issues) or falling behind traffic (inadequate SA).
An important implication of this finding Is that multiple factors must
be considered within research studies and the ATC environment in order to
gain a comprehensive understanding of the different forms of factor
influences on controller performance. A comprehensive and accurate
understanding is essential for development and application of appropriate
compensation strategies. In addition, supervisors and controllers must be
aware that an apparent error, or cause of performance decline, may be
motivated by underlying causes, and apply appropriate supportive
strategies to the influencing factor rather than the manifestation. Finally,
findings also have implications for data collection and investigations.
Several European centres have daily reporting processes which capture
daily data and 'near-misses'. It is essential that such tools facilitate
recording of suspected underlying causes or multiple factor co-occurrences
in order to comprehensively capture accurate information relating to
performance decline in ATC. Data can be utilised to inform appropriate
compensation strategies that address any underlying causes that may not
be observable in performance. In addition, incident investigators must be
provided with the appropriate tools to examine multiple factor occurrences
and their contribution to Incidents in order to collect accurate data that will
support the development of compensation technologies.
273
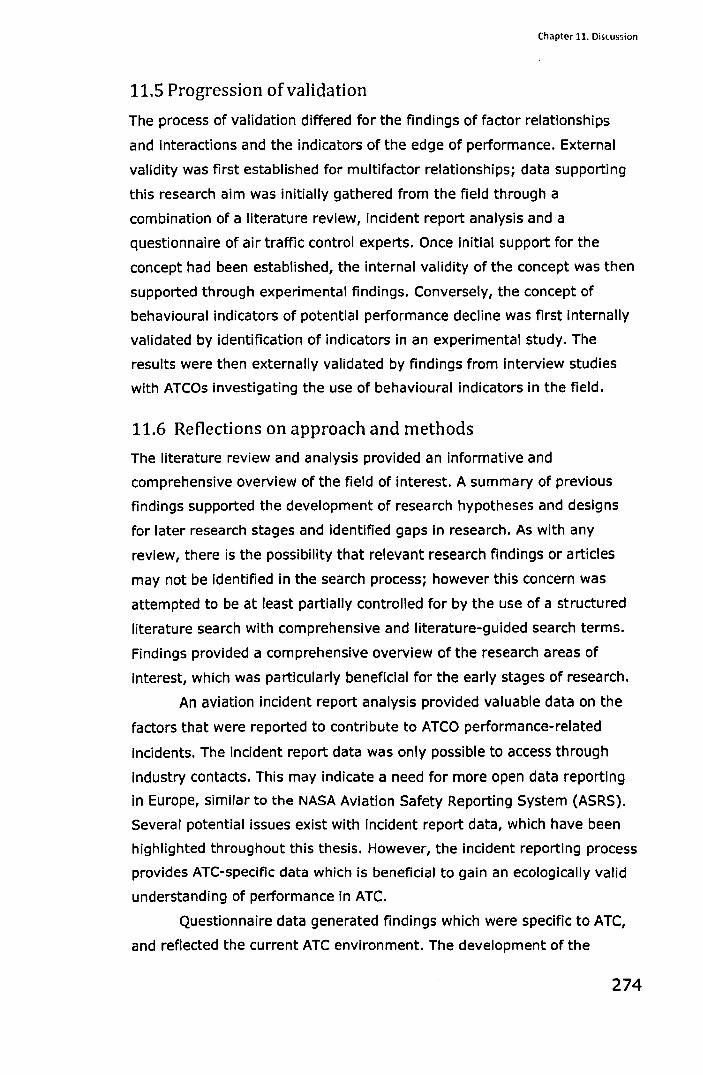
Chapter 11. Discus<,ion
11.5 Progression of validation
The process of validation differed for the findings of factor relationships
and interactions and the indicators of the edge of performance. External
validity was first established for multifactor relationships; data supporting
this research aim was initially gathered from the field through a
combination of a literature review, incident report analysis and a
questionnaire of air traffic control experts. Once initial support for the
concept had been established, the internal validity of the concept was then
supported through experimental findings. Conversely, the concept of
behavioural indicators of potential performance decline was first internally
validated by identification of indicators in an experimental study. The
results were then externally validated by findings from interview studies
with ATCOs investigating the use of behavioural indicators in the field.
11.6 Reflections on approach and methods
The literature review and analysiS provided an informative and
comprehensive overview of the field of interest. A summary of previous
findings supported the development of research hypotheses and designs
for later research stages and identified gaps in research. As with any
review, there is the possibility that relevant research findings or articles
may not be identified in the search process; however this concern was
attempted to be at least partially controlled for by the use of a structured
literature search with comprehensive and literature-guided search terms.
Findings provided a comprehensive overview of the research areas of
interest, which was particularly beneficial for the early stages of research.
An aviation incident report analysis provided valuable data on the
factors that were reported to contribute to ATCO performance-related
incidents. The incident report data was only possible to access through
industry contacts. This may indicate a need for more open data reporting
in Europe, similar to the NASA Aviation Safety Reporting System (ASRS).
Several potential issues exist with Incident report data, which have been
highlighted throughout this thesis. However, the incident reporting process
provides ATe-specific data which is beneficial to gain an ecologically valid
understanding of performance in ATC.
Questionnaire data generated findings which were specific to ATC,
and reflected the current ATC environment. The development of the
274
Chapter 11. Discussion
questionnaire demanded a great deal of time; for example, exercises were
required that were meaningful to aviation professionals but that could be
distributed via an online medium without the presence of the researcher.
In addition, natural language had to be used in the questionnaire so that
the questionnaire was meaningful and had face validity.
The experimental method was complex and required several pilot
studies for the integration of several measures and decisions of measure
periodicity. However the data that was generated was detailed, and
permitted an exploration of multifactor covariances and associations with
performance. An experiment with numerous concurrent measures in a
controlled setting was the only pragmatic way to investigate multifactor co
occurrences and associations with performance. The experimental design
that was selected (Iow-high-Iow-high-Iow taskload) was used to create
variability in the data. Each taskload section lasted 20 minutes in total.
However, it is probable that some of the results (for example, fatigue) may
differ compared to a design using longer sections, for example low
taskload, high taskload and low taskload. With only one high workload
peak, stress and fatigue, as well as perception of workload may differ.
Performance may also be expected to differ with less STCA errors.
Therefore, it is important for future research to Investigate multifactor
associations with performance in ATC with different experimental designs.
It is suggested that although the factor rating and performance measures
may change, the association between the factors and performance will be
similar to those identified in the current study; It is the association
between factors and performance that was the focus of the experimental
findings and so the results may be transferrable to different situations (I.e.
only one high workload period).
Experimental measures included both self-report measures (such as
ISA) and a psychophysiological measure of heart rate. Heart rate was
found to vary with taskload in the expected direction, although average HR
across participants was only marginally different between taskload periods.
Heart rate variability may have resulted In more sensitive data. However,
the calculation and analysis of HR variability was outside the scope of this
research. It is feasible to conduct this analysis to target other objectives
outside of this research. However, currently, due to the low rate of
variation with taskload, HR data was excluded from further analysis.
275

Chapter 11. Di~cussion
Finally, the focus group and interview study generated rich data of
ATCa experiences regarding the mitigation of factor influences on
performance. A pilot study consisting of a focus group with ex-controllers
enabled the refinement of meaningful language to be included in the
interview study, therefore potentially increasing face validity. Access to run
interviews with controllers was complex. Analysis was also lengthy.
However, the contribution of the data may have significant implications for
the maintenance and improvement of safety in ATC.
11. 7 Contributions resulting from this thesis
This thesis provides several contributions to the existing literature. A
triangulation of methods confirmed a set of f~ctors that influence controller
performance specifically within an ATC setting, and proposed an Initial
hierarchy of factors that were reported to most frequently, negatively
influence controller performance. In addition, data from several sources
(incident reports, expert knowledge elicitation questionnaire) confirmed the
co-occurrence of multiple factors in an ATC setting, and provided a
suggested hierarchy of the most frequently occurring multifactor
relationships to negatively influence controller performance. Findings
provide an initial foundation, to be developed by future studies.
The thesis also contributed findings that addressed several
previously identified research gaps In the literature. This Included the
investigation of factor relationships In both experimental and ATC field
settings, an interaction analysis which extended findings beyond
correlation designs, analysis of the relationship between more than two
factors, and an Investigation of the association of multiple factors with
performance. The number of factors included for measurement In the
experimental trials was novel, and so findings extend existing knowledge.
An additional contribution of this thesis was the novel investigation
of multifactor interactions and the subsequent association with
performance. Results suggest that co-occurring factors interact to create a
cumulative negative association with performance, although findings need
further research for validation within an ATC environment.
The investigation of the nature of performance at tlie edge of
performance is a novel contribution resulting from this thesis. A
representation of the progression of controllers' performance from safe
performance to the edge of performance was developed. Findings
276
Chapter 11. Discussion
contribute to understanding the manifestation of controller performance
when associated with multiple factor influences.
This thesis also extends existing research by confirming the use of
internal and external indicators in ATe operations rooms to inform
controllers when supportive strategies are required to prevent performance
decline. Indicators that are reported to be associated with specific factor
influences were identified. Findings provide the contribution of a potential
method of protecting performance from multiple factor influences and
potentially preventing a performance decline. The recorded indicators are
an outcome of the thesis which may facilitate a standardisation of
knowledge between operational personnel.
11.8 Limitations of the research
Limitations to the research described in this thesis are acknowledged. It
was necessary to restrict the number of factors that influenced controller
performance to an initial set of nine factors. It Is therefore possible that
other factors also occur in ATe settings which were not Included for
consideration in this research. However, this was attempted to be
controlled by using multiple methods, including aviation expert opinion, to
confirm that the factor set included the factors that most frequently
negatively influenced controller performance. For pragmatiC reasons, the
factor set was further refined to a set of six factors. Findings will therefore
not reflect any other factors that may be important within an ATe setting.
This was again attempted to be controlled by selecting the most frequent
factors to negatively influence performance.
Several challenges were encountered during the experimental trials.
Self-report measures are vulnerable to biases or participant deception
(Dane, 1990). This was attempted to be controlled by emphasising
confidentiality and anonymity of results. The situation-present assessment
method (SPAM) was selected to measure SA for its low intrusion qualities
and the potential to generate data frequently. The SPAM method ass~sses
time of participant response to the SA question to infer the level of SA.
However, during high taskload periods, participants were responding faster
to SA questions with lower levels of accuracy. A post-trial Interview
revealed that participants were answering as quickly as possible without
considering accuracy in order to get back to the task, even though
participants were explicitly asked to answer as quickly and accurately as
277
Chapter 11. Discussion
possible. The measure of SA was therefore limited in reliability. In addition,
findings from the experimental trials may not be able to be generalised to
ATC settings due to the use of naive participants and a low-fidelity task.
However, working within these constraints, several experimental findings
(co-occurrences of factors, performance at the edge of performance and
indicators of the edge of performance) were supported through the
qualitative data generated in an interview study with active en-route
controllers. The median split analysis that was utilised to investigate
interactions between factors reduced statistical power and did not
acknowledge individual differences. Although this is a controversial method,
it was the most practical option available to investigate the Interaction of
factors and the association with performance.
Observation of participants' behaviours during the experimental trial
was challenging. It was difficult to record all behaviours accurately. Only
one researcher identified and coded behaviours, increasing the risk of
reporting errors. However, findings may be supported by similar findings
generated from an interview study with en-route controllers.
Incident reports, questionnaire and interview studies were
vulnerable to various biases. This research attempted to control for
limitations by using multiple methods. Each research aim was Informed by
at least two studies that provided data to address the same research aim,
although from differing perspectives. For example, although there were
biases associated with incident reports, similar data was also found using a
literature review analysiS and questionnaire data, increasing confidence In
the accuracy of the findings.
It was outside of the scope of this thesis to investigate if the
representation of the progression to the edge of performance extends to
other domains. Further research is required to investigate the validity of
the generalisation of the findings in this research to other safety-critical
domains.
11.9 Suggestions for future research
Future research may investigate the association between other factors that
may be present in an ATC environment that were not included in this
research, and the subsequent association with performance. Future
research may also extend findings by including the factors of
communications and teamwork in experimental investigations of
278
Chapter 11. Discussion
multifactor relationships. By building on the findings in this thesis, a more
comprehensive understanding of the factors that influence controller
performance, and the association with performance, can be developed.
Due to time and resource limitations, multifactor interactions and
the resulting cumulative influence on performance were not validated in an
ATC simulation. It is proposed that future research use high fidelity
simulations to confirm and extend findings. In addition, future research can
extend the current findings by including both male and female ATCOs as
participants. A larger number of participants will be beneficial to increase
statistical power, and additional analyses may be then appropriately
applied to the data.
It is suggested that future research examine the relationship and
association with performance of more than three factors. The present
research identified that more performance variance Is explained with the
association of more factors and so it is important to investigate the
performance variance accounted for by different numbers of factors In
typical and non-typical control situations. Future research may also
establish if a point of saturation exists over which more performance
variance would not be explained by considering the co-occurrence of more
factors.
Another potential avenue of future research is to Investigate the
causal relationship between factors and performance. This remains a gap
in the literature and may further inform the process by which controller
performance is negatively influenced by multiple factors.
The design of the taskload manipulation (Iow-high-Iow-high-Iow)
may have influenced results as discussed in section 11.S. It is therefore
suggested that further research conduct a similar experiment, but with
variations in the taskload manipulation, for example longer periods of
taskload or beginning with a high taskload. Results may contribute to
understanding the association with workload and performance under
difference circumstances. This research would build on current findings and
have a practical application to control rooms, to further inform likely
associations with performance under speCific circumstances.
Future research will also examine the heart rate variability In
association with self-reported measures collected throughout this task.
Heart rate variability information may further support self-reported
workload.
279
Chapter 11. Discussion
In order to comprehensively investigate potential interaction
relationships between factors, and cumulative associations with
performance, it is essential that future research develop more appropriate
research methods and statistical analyses to facilitate the investigation of
multiple factors. The statistical analyses available are not sufficient to
reliably, statistically analyse factor interactions. Analyses require an
impractical number of participants or have severe limitations (Maccallum et
aI., 2002). In order to fully support multifactor interaction research, more
suitable of analysis must be developed.
Future research may build on the findings of indicators of potential
performance decline, and develop further methods to protect performance
from multifactor influences and prevent performance decline. This may
encourage increased focus on research regarding the proactive prevention
of performance decline as opposed only retrospective guidance.
Future research may investigate the application of the findings of
the present research, and validate the generalisation of findings, to other
safety-critical domains. The present research focuses on human factor
influences on human performance. Therefore, It may be hypothesised that
the results of the present research may be transferable to other safety
critical domains that rely on human performance, such as transport,
manufacturing, nuclear and oil and gas. The representation of the
progression to the edge of performance (section 10.3.3.3.14) and the
associated indicators, as well as the representation of the awareness of
indicators (section 10.3.3.3.15) may inform performance decline in these
safety critical domains, and in addition, provide initial mitigation strategies,
and a foundation for further research in the mitigation of performance
decline.
The present research suggests that multifactor associations occur
and possibly cumulatively, negatively influence performance. It is noted
that the present research was carried out in the context of ATe, a domain
in which a large amount of research has already been conducted relating to
the compensation of single factor Influences on performance. Other safety
critical domains may first need to establish a body of research on these
single factor influences on performance prior to researching multifactor
influences. However, it is reasonable to assume that multiple factors co
occur in other safety-critical domains, and so future research may use the
present research findings as a foundation from which to Investigate the
280
Chapter 11. Discussion
occurrence of multiple factors and cumulative, negative, associations with
performance. In addition, further research may subsequently investigate
strategies to mitigate negative influences on human performance, which
may be domain-specific. Methods and analyses outlined in the present
research may be replicated and adapted as appropriate to the specific
domain. It is therefore strongly encouraged that other safety-critical
domains investigate multifactor associations with performance In order to
identify proactive strategies to prevent performance decline, and ultimately,
support human performance and enhance safety.
11.10 Recommendations
Recommendations may be made as a result of the research findings of this
thesis:
• Future research in the human performance domain should consider
multifactor interactions and the resulting Impact on performance to
produce a more ecologically valid and comprehensive picture of
factor influences and human performance in air traffic controllers.
• Future research should conduct experimental studies with qualified
ATCOs in a high-fidelity simulation; findings may build on and
extend the research findings in this thesis.
• Knowledge of the particular factors or indicators to monitor should
be provided to operational staff, in particular, supervisors. An
awareness of the interactions of these factors and subsequent
effects on performance may help support performance prior to
decline.
• Operational staff should receive an opportunity to discuss and share
indicators that indicate when a controller is reaching the edge of
performance and when a supportive strategy is required.
• Trainees may be supported by faCilitating learning of standardised
internal and external Indicators in order to make performance less
vulnerable to factor influences whilst developing personal Indicators
from experience.
• Awareness of self and others' indicators should be emphasised and
discussed. Awareness training relating to topics such as: the
interaction of multiple factors, the cumulative impact on
performance and indicators that highlight the need for supportive
281
Chapter 11. Discussion
strategies may further contribute to preventing performance
declines.
• Day-to-day reporting procedures, or near-miss reporting, may
incorporate space for users to discuss or record the occurrence of
multiple factors, or perceived underlying factors leading to the
situation of concern.
• Incident investigations may Include the opportunity to explore the
contribution of interacting factors, as well as underlying factors such
as fatigue and workload, to incidents via interviews with personnel.
11.11 Concluding statement
The research presented in this thesis has addressed long-standing research
gaps within human performance literature, and reported findings which
support a move towards consideration of multiple-factor interactions and
the associated influence on performance in ATC settings. Findings suggest
that factors do co-occur in ATC, and interact to negatively Influence
performance, pushing controllers to the edge of performance. This
research therefore provides a foundation from which to develop an
ecologically valid and comprehensive understanding of multifactor
occurrences and associated implications for controller performance In
current ATC environments. In addition, findings will contribute to a greater
understanding of the edge of performance In association with multiple
factors.
Finally, the current research has contributed critical knowledge to
the initial understanding of strategies to prevent performance declines In a
safety critical industry. This thesis has also achieved a novel and important
practical outcome by identifying indicators that indicate when a supportive
strategy must be implemented to protect and maintain performance. It Is
now essential that future research contribute to further understanding of
multiple factor interactions and the association with performance within
ATC and other safety critical domains. By developing a comprehensive and
ecologically valid understanding of multifactor interactions and the
cumulative association with controller performance, active compensation
strategies can be developed and a move from retrospective techniques to
proactive prevention of performance decline can be achieved with
important implications for the improvement of safety within air traffic
control.
282
References
References
Allport, D. A., Antonis, B., & Reynolds, P. (1972). On the division of
attention: A disproof of the single channel hypothesis. The
Quarterly Journal of Experimental Psychology, 24(2), 225-235.
Aston-Jones, G., Rajkowski, J., Kubiak, P., & Alexinsky, T. (1994). Locus
coeruleus neurons in monkey are selectively activated by attended
cues in a vigilance task. The Journal of Neuroscience, 14(7), 4467-
4480.
Avers, K., & Johnson, W. B. (2011). A review of Federal Aviation
Administration fatigue research: Transitioning scientific results to t
he aviation industry. Aviation Psychology and Applied Human
Factors, 1(2), 87
Bailey, L. L. & Thompson, R. C. (2000). The effects of performance
feedback on air traffic control team coordination: A simulation study.
final report, No. A218283. Civil Aeromedical Institute. Oklahoma
City: Oklahoma.
Baranski, J. V., Pigeau, R. A., & Angus, R. G. (1994). On the ability to
self-monitor cognitive performance during sleep deprivation: a
calibration study. Journal of sleep research, 3(1), 36-44.
Beckmann, U., Baldwin, I., Hart, G. K., & Runciman, W. B. (1996). The
Australian Incident Monitoring Study In Intensive Care: AIMS-leU.
An analysis of the first year of reporting. Anaesthesia and Intensive
Care, 24(3), 320-329.
Beckmann, U., & Gillies, D. M. (2001). Factors associated with relntubatlon
in intensive care: An analysis of causes and outcomes. CHEST
Journal, 120(2), 538-542.
Behrmann, M., & Tipper, S. P. (1999). Attention accesses multiple
reference frames: evidence from visual neglect. Journal of
Experimental Psychology: Human Perception and Performance,
25(1), 83-101.
Bellorini, A. (1996). Task-related factors of stress: The analysis of conflict
resolution In air traffic control. 1st International Conference on
Applied Ergonomics. Istanbul: Turkey.
Berns, S. D. (2002). Error reduction and performance Improvement In the
emergency department through formal teamwork training:
283
References
Evaluation results of the MedTeams project. Health Services
Research, 37(6), 1553-1581.
Biers, D. W. (1984). Voice stress as a workload measure: Review of the
literature and recommendations for further study. Final Report
(Contract N00421-83-D-0027). Patuxent River, MD: Naval Air Test
Center.
Bonini, D. (2001). ATC do I trust thee?: Referents of trust In air traffic
control. In CHI'Ol Extended Abstracts On Human Factors In
Computing Systems (pp. 449-450). ACM.
Bonini, D. (2005). A model of trust In the work of an Air Traffic Controller.
Unpublished doctoral dissertation. University of Dublin, Trinity
College at Dublin, Ireland.
Bonini, D., Jackson, A., & McDonald, N. (2001). Do I trust thee? An
approach to understanding trust In the domain of air traffic control.
In Human Interfaces in Control Rooms, Cockpits and Command
Centres, 2001. People in Control. The Second International
Conference on (IEE Conf. Publ. No. 481) (pp. 104-109).
Breen, R. L. (2006). A practical guide to focus-group research. Journal of
Geography in Higher Education, 30(3), 463-475.
Brenner, M., Doherty, E. T., & Shipp, T. (1994). Speech measures
indicating workload demand. Aviation, Space, and Environmental
Medicine, 65(1), 21-26.
Broadbent, D. E. (1958). Perception and Communication.
Oxford: Pergamon.
Broadbent, D. E. (1971). Decision and stress. London: Academic Press.
Brookings, J. B., Wilson, G. F., & Swain, C. R. (1996). Psychophysiological
responses to changes in workload during simulated air traffic
contro\. Biological Psychology, 42, 361-377.
Brown, S. W., & Boltz, M. G. (2002). Attentional processes in time
perception: Effects of mental workload and event structure. Journal
of Experimental Psychology: Human Perception and Performance,
28(3), 600-615.
Buckley, E. (1976). Development of a performance criterion for en-route
air traffic control personnel research through air traffic control
simulation: Experiment 1 - parallel form development. Interim
report prepared for FAA. Report No. FAA-RD-75-186.
284
References
Bystrom, P., Hanse, J. J., & Kjellberg, A. (2004). Appraised psychological
workload, musculoskeletal symptoms, and the mediating effect of
fatigue: A structural equation modeling approach. Scandinavian
Journal of Psychology, 45, 331-341.
Caldwell, J. A. (2001). The impact of fatigue in air medical and other types
of operations: A review of fatigue facts and potential
countermeasures. Air Medical Journal, 20(1), 25-32.
Cannon-Bowers, J. A., Salas, E., & Converse, S. A. (1993). Shared mental
models in expert team decision making. In N. J. Castellan, Jr. (Ed.),
Current Issues in Individual and Group Decision Making (pp. 221-
246). Hillsdale, NJ: Erlbaum.
Casali, J. G. & Wierwille, W. W. (1983). A comparison of rating scale,
secondary-task, physiological, and primary-task workload
estimation techniques in a simulated flight task emphasizing
communications load. Human Factors, 25(6), 623-641.
Cardosi, K., Falzarano, P., & Han, S. (1998). Pilot-Controller
Communication Errors: An Analysis of Aviation Safety Reporting
System (ASRS) Reports (No. DOT-VNTSC-FAA-98-4). Volpe national
transportation systems center: Cambridge, Ma.
Chang, Y. & Yeh, C. (2010). Human performance interfaces in air traffic
control. Applied Ergonomics, 41, 123-129.
Cherry, E. C. (1953). Some experiments on the recognition of speech with
one and two ears. Journal of the Acoustical Society of America, 25,
975-979.
Clarke, D. D., Forsyth, R., & Wright, R. (2005). A statistical profile of road
accidents during cross-flow turns. Accident Analysis & Prevention,
37(4), 721-730.
Cobb, S., Rose, R. M. (1973). Hypertension, peptic ulcer and diabetes in
air traffic controllers. Journal of the American Medical Association,
224, 489-492.
Collet, C., Averty, P., & Dittmar, A. (2009). Autonomic nervous system and
subjective ratings of strain in air traffic control. Applied Ergonomics,
40,23-32.
Congleton, J. J., Jones, W. A., Shiflett, S. G., McSweeney, K. P., &
Huchingson, R. D. (1997). An evaluation of voice stress analysis
techniques in a simulated AWACS environment. International
Journal of Speech Technology, 2(1), 61-69.
285
References
Corrandini, P. & Cacciari, C. (2002). The effect of workload and work shift
on air traffic control: A taxonomy of communicative problems.
Cognition, Technology & Work, 4, 229-239.
Costa, G. (1993). Evaluation of workload In air traffic controllers.
Ergonomics, 36, 1111-1120.
Costa, A. C., Roe, R. A., Taillieu, T., (2001). Trust within teams: The
relation with performance effectiveness. European Journal of Work
and Organizational Psychology, 10(3), 225-244.
Cox, T., & Mackay, C. (1985). The measurement of self-reported stress and
arousal. British Journal of Psychology, 76(2), 183-186.
Cox-Fuenzalida, L. E. (2007). Effect of workload history on task
performance. Human Factors, 49(2), 277-291.
Dane, F.e. (1990). Research Methods. Brooks/Cole Publishing Company.
Davies, D. R., & Parasuraman, R. (1982). The Psychology of Vigilance.
London: Academic Press.
De Boer, A. G. E. M., Van Lanschot, J. J. B., Stalmeier, P. F. M., Van
Sandick, J. W., Hulscher, J. B. F., De Haes, J. C. J. M., & Sprangers,
M. A. G. (2004). Is a single-item visual analogue scale as valid,
reliable and responsive as multi-item scales In measuring quality of
life? Quality of Life Research, 13(2), 311-320.
Deaton, J. E. & Parasuraman, R. (1993). Sensory and cognitive vigilance:
Effects of age on performance and subjective workload. Human
Performance, 6(1), 71-97.
Della Rocco, P. S. (1999). The role of shift work and fatigue In air traffic
control operational errors and incidents. Federal aviation
administration (DOT/FAA/AM-99/2).
Dekker,S. W. A. & Hollnagel, E. (2004). Human factors and folk models.
Cognition, Technology, and Work, 6, 79-86.
Dekker, S. W. A. & Woods, D. D. (2002). MABA-MABA or abracadabra?
Progress on human-automation coordination. Cognition, Technology,
and Work, 4, 240-244.
Delahaij, R., van Dam, K., Gaillard, W. K., & Soeters, J. (2011). Predicting
performance under acute stress: The role of Individual
characteristics. International Journal of Stress Management, 18(1),
49-66.
Denollet, J., Rombouts, H., Gillebert, T. C., Brutsaert, D. L., Sys, S. U., &
Stroobant, N. (1996). Personality as Independent predictor of long-
286
References
term mortality in patients with coronary heart disease. The Lancet,
347(8999),417-421.
Desaulniers, D. R. (1997). Stress in the control room: Effects and solutions.
IEEE Sixth Annual Human Factors Meeting. Orlando: Florida.
Desmond, P.A. & Matthews, G. (1997). Implications of task-induced fatigue
effects for in-vehicle countermeasures to driver fatigue. AccIdent
Analysis and Prevention, 29(4), 515-523.
Di Nocera, F., Fabrozo, R., Terenzl, M., & Ferlazzo, F. (2006). Procedural
errors in air traffic control.: Effects of traffic density, expertise, and
automation. Aviation, Space, and Environmental Medicine, 77(6),
639-643.
Djokic, J., Lorenz, B., & Fricke, H. (2010). Air traffic control complexity as
workload driver. Transportation Research Part C, 18 (6), 930-936.
Dominguez, C. (1994). Can SA be defined? In M. Vidulich, C. Dominguez,
E. Vogl, & G. McMillan (Eds.), Situation Awareness: Papers and Annotated
Bibliography (pp. 5-15). AljCF-TR-1994-0085.
Dorrian, J., Roach, G. D., Fletcher, A., & Dawson, D. (2007). Simulated
train driving: Fatigue, self-awareness and cognitive disengagement.
Applied Ergonomics, 38, 155-166.
Durso, F. T., Crutchfield, J. M., & Harvey, C. M. (2007). The cooperative
shift change: an illustration using air traffic control. Theoretical
Issues in Ergonomics Science, 8(3), 213-232.
Durso. F. T. Truitt, T. R., Hackworth. C, Crutchfield. J., Nikolic. D., Moertl.
P., et al. (1995). Expertise and chess: A pilot study comparing
situation awareness methodologies. In D. J. Garland & M. R.
Endsley (Eds.), Experimental analysis and measurement of situation
awareness (pp. 295-304). Daytona Beach. FL: Embry-Riddle
Aeronautical University Press,
Edwards, T., Sharples, S., Wilson, J. R., and Kirwan, B. (2012). Factor
interaction influences on human performance In air traffic control:
The need for a multifactorial model. Work: A Journal of Prevention,
Assessment and Rehabilitation, 41(1), 159-166.
Eideikind, M., & Papantonopoulos, S. (1997). Operator trust and task
delegation: Strategies In semi-autonomous agent systems. Human
Automation Interaction: Research and Practice. Erlbaum Associates.
E"enbogen, M. A., Schwartzman, A. E., Stewart, J., & Walker, C. D. (2003).
Stress and selective attention: The interplay of mood, cortisol levels,
287
References
and emotional information processing. Psychophysiology, 39(6},
723-732.
Endsley, M. R. (1988). Design and evaluation for situation awareness
enhancement. In Proceedings of the Human Factors Society 32nd
Annual Meeting, 97-101. Santa Monica, CA: Human Factors and
Ergonomics Society.
Endsley, M. R. (1995a). Toward a theory of situation awareness In dynamic
systems. Human Factors, 37(1), 32-64.
Endsley, M. R. (1995b). Measurement of situation awareness In dynamic
systems. Human Factors, 37(1), 65-84.
Endsley, M. R., & Rodgers, M. D. (1994). Situation awareness Information
requirements analysis for en route air traffic control. In Proceedings
of the Human Factors and Ergonomics Society Annual Meeting (Vol.
38, No.1, pp. 71-75). Santa Monica, Ca: Human Factors and
Ergonomics Society.
Endsley, M. & Rodgers, M. D. (1996). Attention distribution and situation
awareness in air traffic control. In Proceedings OF the 40th Annual
Meeting of the Human Factors Society.
Erdem, F. & Ozen, J. (2003). Cognitive and affective dimensions of trust In
developing team performance. Team Performance Management: An
International Journal, 9(5/6), 131-135.
EUROCONTROL (2002). Mapping between the EUROCONTROL Severity
Classification Scheme & the lCAO AIRPROX Severity Scheme. EAM 2
/ GUI 3
EUROCONTROL: ICAO Standard Phraseology: A Quick Reference Guide for
Commercial Air Transport Pilots. Available at:
http://www . skybra ry .aero/bookshelf /boo ks/ 115. pdf
Eysenck, M. W. (2001). Principles of Cognitive Psychology (2nd Ed.). Hove,
UK: Psychology Press.
Fernandez, R., & Picard, R. W. (2003). Modeling drivers' speech under
stress. Speech Communication, 40(1), 145-159.
Fisk, A. D., & Schneider, W. (1981). Control and automatic processing
during tasks requiring sustained attention: A new approach to
vigilance. Human Factors: The Journal of the Human Factors and
Ergonomics Society, 23(6), 737-750.
Fracker, M. L. (1988). A theory of situation assessment: Implications for
measuring situation awareness. In Proceedings of the Human
288

References
Factors Society 32nd Annual Meeting (pp. 102-106). Santa Monica,
Ca: Human Factors Society.
Galinsky, T. L., Rosa, R. R., Warm, J. S., & Dember, W. N. (1993).
Psychophysical determinants of stress in sustained attention.
Human Factors, 35(4), 603-614.
Galster, S. M., Duley, J. A., Masalonis, A. J., & Parasuraman, R. (2001). Air
traffic controller performance and workload under mature free flight:
Conflict detection and resolution of aircraft self-separation.
International Journal of A viation Psychology, 11 (1), 71-93.
Glaser, D. N., Tatum, B. C., Nebeker, D. M., Sorenson, R. C., & Aiello, J. R.
(1999). Workload and social support: Effects on performance and
stress. Human Performance, 12(2), 155-176.
Gilbertova, S. & Glivicky, V. (1967). Monotony at work. Studia
Psychologica, 9, 232-240.
Gibson, W. H., Megaw, E. D., Young, M. S., & Lowe, E. (2006). A taxonomy
of human communication errors and application to railway track
maintenance. Cognition, Technology & Work, 8(1), 57-66.
Gluckman, J. P., Warm, J. S., Dember, W. N., Thlelmann, J. A., & Hancock,
P. A. (1988). Subjective workload response to simultaneous and
successive vigilance tasks. Paper presented at the Annual Meeting of the
Psychonomic SOCiety, Chicago, IL.
Golembiewski, R. T. & McConkie, M. (1975). The centrality of Interpersonal
trust in group processes. G. L. Cooper, (Ed). Theories of Group
Processes (pp131-185). London, U.K.: John Wiley & Sons.
Griffin, M. A., Neal, A., & Neale, M. (2000). The contribution of task
performance and contextual performance to effectiveness:
Investigating the role of Situational constraints. Applied Psychology:
An International Review, 49(3), 517-533.
Gronlund, S. D., Ohrt, D. D., Dougherty, M. R. P., Perry, J. L., & Manning,
C. A. (1998). Role of memory In air traffic control. Journal of
Experimental Psychology: Applied, 4(3), 263-280.
Gonzalez-Alonso, J., Teller, C., Andersen, S. L., Jensen, F. B., Hyldlg, T.,
Perry, C. M., Sheik-Nainar, M. A., Segall, N., Ma, R., & Kaber, D. B.
(2008). Effects of physical workload on cognitive task performance
and situation awareness. Theoretical Issues In Ergonomics SCience,
9(2), 95-113.
289
References
Gunzelmann, G., Moore, L. R., Gluck, K. A., Van Dongen, H. P. A., &
Dinges, D. F. (2010). Fatigue in sustained attention: Generalizing
mechanisms for time awake to time on task. Cognitive Fatigue:
Multidisciplinary Perspectives on Current Research and Future
Applications. Washington, DC: American Psychological Association
Hancock, P. A., Simmons, L., Hashemi, L., Howarth, H., & Ranney, T.
(1999). The effects of in-vehicle distraction on driver response
during a critical driving manoeuvre. Transportation Human Factors,
1(4), 295-309.
Hancock, P. A. & Warm, J. S. (1989). A dynamic model of stress and
sustained attention. Human Factors, 31(5), 519-537.
HEIDI - Harmonisation of European Incident Definition(2001). Initiative for
ATM (2001). Eurocontrol. Ed.1.1 - 25/04/2001.
Hetherington, C., Flin, R. & Mearns, K. (2006). Safety in shipping: The
human element. Journal of Safety Research, 37, 401-411.
Hogg, M.A. & Vaughan, G.M. (2002). Social psychology (3rd ed.). London:
Prentice Hall.
Hinkle, D. N. (1965). The change of personal constructs from the viewpoint
of a theory of construct Implications (Doctoral dissertation, Ohio
State University).
Hockey, G.R.J. (1997). Compensatory control in the regulation of human
performance under stress and high workload: a cognitlve
energetical framework. Biological Psychology, 45, 73-93.
Hockey, G. R. J. & Earle, F. (2006). Control over the scheduling of
Simulated office work reduces the impact of workload on mental
fatigue and task performance. Journal of Experimental Psychology:
Applied, 12(1), 50-65.
Hollenbeck, J. R., ligen, D. R., Tuttle, D. B., & Sego, D. J. (1995). Team
performance on monitoring tasks: An examination of deciSion errors
in contexts requiring sustained attention. Journal of Applied
Psychology, 89(6), 685-696.
Huttunen, K., Keranen, H., Vayrynen, E., Paakkonen, R., Leino, T. (2011).
Effect of cognitive load on speech prosody in aviation: Evidence
from military Simulator flights. Applied ErgonomiCS, 42(2), 348-357.
Hollnagel, E., Kaarstad, M., & Lee, H. (1999). Error mode prediction.
ErgonomiCS, 42(11), 1457-1471.
290
References
Hollnagel, E., Woods, D. D., & leveson, N. (2006). Resilience engineering:
Concepts and precepts. UK: Ashgate Publishing Company.
International Civil Aviation Organization [lCAO] (2001). Accident and
Incident Investigation. Annex 13 To the Convention on
InternationalCivil Aviation. Ninth Edition. ICAO.
International Civil Aviation Organization [lCAO] (2001). Air Traffic Services:
Air Traffic Control Service, Flight Information Service, Alerting
Service. Annex 11 To the Convention on International
Civil Aviation. Thirteenth Edition. ICAO.
International Civil Aviation Organization [ICAO] (2005). Threat and Error
Management (TEM) in Air Traffic Control, Preliminary Edition. ICAO.
International Civil AViation Organization [ICAO] (2007). Air Traffic
Management. Procedures for Air Navigation Services, DOC 4444
ATM/SOl, Fifthteenth Edition. ICAO.
International Civil Aviation Organization [lCAO] (2012). Fatigue Risk
Management Systems: Manual for Regulators. First Edition (Doc
9966). ICAO.
Isaac, A. R. & Ruitenberg (1999). Air traffic control: Human performance
factors. UK: Ashgate publishing company
Johnson, C. W. (2002). Reasons for the failure of incident reporting In the
healthcare and rail Industries. In Components of System Safety:
Proceedings of the 10th Safety-Critical Systems Symposium. Berlin:
Springer Verlag (pp. 31-60).
Jones, D.G, & Endsley, M. R. (1996). Sources of situation awareness errors
in aviation. Aviation, Space and Environmental Medicine, 67(6),
506-512.
Kahneman, D. (1973). Attention and Effort. Englewod CliffS, NJ: Prentice
Hall.
Kalsbeek, J. W. H. (1981). The production of behaviour and its
accompanying stresses. In E. N. Corlett & J. Richardson (Eds.),
Stress, Work Design and Productivity. Sussex: John Wiley and Sons
Limited.
Kanki, B. G., Folk, V. G., & Irwin, C. M. (1991). Communication variations
and aircrew performance. The International Journal of Aviation
Psychology, 1(2), 149-162.
Karasek, R. & Theorell, T. (1990). Healthy work, stress, productivity, and
the reconstruction of working life. USA: Harper Collins Publishers.
291
References
Kiffin-Petersen, S. A. & Cordery, J. L. (2003). International Journal of
Human Resource Management, 14(1), 93-U6.
Kirwan, B. (2011). Incident reduction and risk migration. Safety SCience,
49(1), U-20.
Kirwan, B., Evans, A., Donohoe, L., Kilner, A., Lamoureux, T., Atkinson, T.,
& MacKendrick, H. (1997). Human factors in the ATM system design
life cycle. In proceedings of EUROCONTROL/FAA ATM R&D
Seminar (pp. 16-20).
Kirwan, B., Kaarstad, M., Hauland, G., & Follesoe, K. (1995). See no evil,
hear no evil, speak no evil: verbal protocol analysis, eye movement
analysis, and nuclear power plant diagnosis. Contemporary
Ergonomics, 249-249.
Kirwan, B., Scaife, R., & Kennedy, R. (2001). Investigating complexity
factors in UK air traffic management. Human Factors and Aerospace
Safety, 1(2), 125 - 144.
Koester, T. (2003). Situation awareness and situation dependent behaviour
adjustment in the maritime work domain. Paper presented at the
Proceedings of HCI International. Crete: Greece.
Kontogiannis, T. (1999). Training effective human performance In the
management of stressful emergencies. Cognition, Technology &
Work, 1(1), 7-24.
Kontogiannis, T. & Kossiavelou, Z. (1999). Stress and team performance:
principles and challenges for Intelligent decision aids. Safety Science,
33, 103-128.
Lamoureux, T. (1999). The Influence of aircraft proximity data on the
subjective mental workload of controllers In the air traffic control
task. Ergonomics, 42(11), 1482-1491.
Lazarus, R. 5., Deese, J., & Osler, S.F. (1952). The effects of psychological
stress upon performance. Psychological Bulletin, 49(4), 293-317.
Lazarus, R. S. & Folkman, S. (1984). Stress, appraisal and coping.
New York: Springer Publishing Company.
LeBlance, V. (2009). The effects of acute stress on performance:
Implications for health professions education. Academic Medicine,
84(107), s25-s33.
Le Fevre, M., Matheny, J., Kolt, G.S. (2003) Eustress, distress, and
Interpretation in occupational stress. Journal of Managerial
Psychology, 18 (7), 726 - 744.
292
References
Lee, K. A., Hicks, G., & Nino-Murcia, G. (1991). Validity and reliability of a
scale to assess fatigue. Psychiatry research, 36(3), 291-298.
Lee, J. P., & Moray, N. (1992). Trust, control strategies and allocation of
function in humanmachine systems. Ergonomics. 35(10): 1243-
1270.
Leonard, M., Graham, S., & Bonacum, D. (2004). The human factor: the
critical importance of effective teamwork and communication In
providing safe care. Quality and Safety In Health Care, 13(1), 185-
i90.
Leronovitz, D. R., & Philipp, M. D. (1987). Human factors requirements
engineering for air traffic control systems. In G. Salvendy (Ed.),
Handbook of Human Factors. London: Wiley & Sons: 1771-1789.
Loft, S., Sanderson, P., Neal, A., & Mooij, M. (2007). Modeling and
predicting mental workload in en route air traffic control: Critical
review and broader implications. Human Factors, 49(3), 376-399.
Lundberg, U., and Frankenhaeuser, M. (1980). Pituitary adrenal and
sympathetic-adrenal correlates of distress and effort. Journal of
Psychosomatic Research, 24, 125-130.
McKinney, E. H., Barker, J. R., Smith, D. R., & Davis, K. J. (2004). The role
of communication values In swift starting action teams: IT Insights
from flight crew experience. Information & management, 41(8),
1043-1056.
Ma, R. & Kaber, D. B. (2005). Situation awareness and workload in driving
while using adaptive cruise control and a cell phone. International
Journal of Industrial ErgonomiCS, 35, 939-953.
MacCallum, R. C., Zhang, S., Preacher, K. J., & Rucker, D. D. (2002). On
the practice of dichotomization of quantitative variables.
Psychological methods, 7(1), 19.
Mackay, C., Cox, T., Burrows, G., & Lazzerlnl, T. (1978). An Inventory for
the measurement of self-reported stress and arousal. British Journal
of Social & Clinical Psychology; British Journal of Social & Clinical
Psychology.
Mackieh, A. & Cilingir, C. (1998). Effects of performance shaping factors on
human error. International Journal of Industrial ErgonomiCS, 22,
285-292.
Mackworth, N.H., 1957. Vigilance. The Advancement of SCience 53, 389-
393.
293
References
Malakis, S. (2008). ATe decision making in emergency scenarios.
Unpublished doctoral dissertation. Technical University of Crete,
Greece.
Malakis, S., Kontogiannis, T., & Kirwan, B. (2010a). Managing emergencies
and abnormal situations in air traffic control (Part I): Taskwork
strategies. Applied Ergonomics, 41(4), 620-627.
Malakis, S., Kontogiannis, T., & Kirwan, B. (2010b). Managing emergencies
and abnormal situations in air traffic control (Part II): Teamwork
strategies. Applied ergonomics, 41(4), 628-635.
Mann, L., & Tan, C. (1993). The hassled decision maker: The effects of
perceived time pressure on information processing in decision
making. Australian Journal of Management, 18(2), 197-210.
Martinussen, M. & Richardsen, A. M. (2006). Air traffic controller burnout:
Survey responses regarding job demands, job resources, and health.
Aviation, Space and Environmental Medicine, 77, 422-428
Matthews, G. (2002). Towards a transactional ergonomics for driver stress
and fatigue. Theoretical Issues In Ergonomic SCience, 3(2), 195-211.
Matthews, G., & Davies, D. R. (2001). Individual differences In energetic
arousal and sustained attention: A dual-task study. Personality and
individual Differences, 31(4), 575-589.
Matthews, G., Davies, D. R., Westerman, S. J., & Stammers, R. B. (2000).
Human Performance. Cognition, Stress and Individual Differences.
East Sussex: Psychology Press.
Maule, A. J., Hockey, G. R. J., & Bdzola, L. (2000). Effects of time-pressure
on decision-making under uncertainty: changes In affective state
and information processing strategy. Acta Psychologlca, 104(3),
283-301.
Miles, J., & Shevlin, M. (2001). Applying regression and correlation: A
guide for students and researchers. UK: Sage Publications Limited.
Millen, L., Edwards, T., Golightly, D., Sharples,S., Wilson, J. R., and
Kirwan, B. (2011). Systems change in transport control:
applications of cognitive work analysis. The International Journal of
Aviation Psychology, 21(1), 62-84.
Millward, L. J. (2006). Focus Groups. In G. M. Breakwell, S. Hammond, C.
Fife-Schaw, & J. A. Smith (Eds.). Research methods In psychology
(3rd Ed.). UK: Sage Publications.
294
References
Mishra, A. K. (1996). Organizational responses to crisis: The centrality of
trust.
Melton, C. E., McKenzie, J. M., Polis, B. D., Hoffman, M., & Saldivar, J. T.
(1973). Physiological responses in air traffic control personnel:
Houston intercontinental tower. FAA-AM-73-21.
Mogford, R. H. (1997). Mental models and situation awareness In air traffic
control. The International Journal of Aviation Psychology, 7(4), 331-
341.
Morey, J. C., Simon, R., Jay, G. D., Wears, R. L., Salisbury, M., Dukes, K.
A., & Svensson, J., & Andersson, J. (2006). Speech acts,
communication problems, and fighter pilot team performance.
Ergonomics, 49(12-13), 1226-1237.
Morrison, R., & Wright, R.H. (1989). Air traffic control and communications
problems: An overview of recent ASRS data. Proceedings of the
Fifth International Symposium on Aviation Psychology, 902-907.
Mosier, K. L., Skitka, L. J., & Korte, K. J. (1994). Cognitive and social
psychological Issues In flight crew/automation Interaction. In M.
Mouloua, & R. Parasuraman (Eds.), Human performance In automated
systems: Current research and trends, Hillsdale NJ: Erlbaum.
Muir, B. M. (1988). Trust between humans and machines, and the design
of decision aids. In E. Hollnagel, G. Mancini, & D. D. Woods (eds.),
Cognitive engineering In complex dynamic worlds. London Academic
Press: 71-83.
Muir, B. M. (1994). Trust In automation: Part I, theoretical Issues in the
study of trust and human intervention in automated systems.
Ergonomica, 39(3): 429-460.
Muir, B. M., & Moray, N. (1996). Trust In automation: part II, experimental
studies of trust and human Intervention in a process control
simulation. Ergonomics. 37(11): 1905-1922.
Murray, I. R., Baber, C., & South, A. (1996). Towards a definition and
working model of stress and its effects on speech. Speech
Communication, 20, 3-12.
NeaL, A. & Kwantes, P. F. (2009). An evidence accumulation model for
conflict detection performance In an air traffic control task. Human
Factors,51(2), 164-180.
295
References
Nielsen, B. (1999). Influence of body temperature on the development of
fatigue during prolonged exercise in the heat. Journal of Applied
Physiology, 86(3), 1032-1039.
Nickerson, R. S. (1992). Looking Ahead: Human Factors Challenges In a
Changing World. Mahwah, Nl: Erlbaum.
Niessen, C., Eyferth, K., & Bierwagen, T. (1999). Modelling cognitive
processes of experienced air traffic controllers. Ergonomics, 42(2),
1507-1520.
Nunes, A. & Kramer, A. F. (2009). Experience based mitigation of age
related performance declines: Evidence from air traffic control.
Journal of Experimental Psychology: Applied, 15(1), 12-24.
Oken, B. S., Salinsky, M. C., & Elsas, S. M. (2006). Vigilance, alertness, or
sustained attention: physiological basis and measurement. Clinical
Neurophysiology, 117(9), 1885-1901.
Ozel, F. (2001). Time pressure and stress as a factor during emergency
egress. Safety SCience, 38,95-107.
Parasuraman, R., & Davies, D. R. (1977). A taxonomic analysis of vigilance
performance. In R. R. Mackie (Ed.),Vigilance: Theory, Operational
Performance And Physiological Correlates (pp. 559-574). New York:
Plenum
Parasuraman, R., & Davies, D. R. (1976). Decision theory analysis of
response latencies In vigilance. Journal of Experimental Psychology:
Human Perception and Performance, 2(4), 578-590.
Parasuraman, R., & Mouloua, M. (1987). Interaction of signal
discriminability and task type In vigilance decrement. Attention,
Perception, & Psychophysics, 41 (1), 17-22.
Parasuraman, R., Sheridan, T. B., & Wickens, C. D. (2008). Situation
awareness, mental workload and trust in automation: Viable,
empirically supported cognitive engineering constructs. Journal of
Cognitive Engineering and Decision Making, 2(2), 140-160.
Park, F., Ha, M., YI, Y., & Kim, Y. (2006). Subjective fatigue and stress
hormone levels in urine according to duration of shiftwork. Journal
of Occupational Health, 48,446-450.
Park, K. S. & lung, K. T. (1996). Considering performance shaping factors
In situation-specific human error probabilities. International Journal
of Industrial Ergonomics, 18, 325-331.
296
References
Pigeau, R. A., Angus, R. G., O'Neill, P., & Mack, I. (1995). Vigilance
latencies to aircraft detection among NORAD surveillance operators.
Human Factors: The Journal of the Human Factors and Ergonomics
Society, 37(3), 622-634.
Posner, M. I. (1980). Orienting of attention: The VIIth Sir Frederic Bartlett
lecture. Quarterly Journal of Experimental Psychology, 32A, 3-25.
Posner, M. 1., & Petersen, S. E. (1990). The attention system of the human
brain. Annual Review of Neuroscience, 13, 25-42.
Prinzo, O. V. (1998). An analysis of voice communication in a simulated
approach control experiment. Final Report. DOT/FAA/AM-98/17.
Civil Aeromedical Institute. Oklahoma City: Oklahoma.
Rantanen, E. M.,McCarley, J. S., & Xu, X. (2004). Time delays In air traffic
control communication loop: Effect on controller performance and
workload. International Journal of Aviation Psychology, 14, 369-394.
Rantanen, E. M., Maynard, P. W., & Ozhan, D. (2005). The Impact of sector
characteristics and aircraft count on air traffic control
communications and workload. 13th International Symposium on
Aviation Psychology. Dayton: Ohio.
Rantenan, E. M. & Nunes, A. (2005). Hierarchical conflict detection in air
traffic control. The International Journal of Aviation Psychology,
15(4), 339 - 362.
Rasmussen, T. & Jeppesen, H. J. (2006). Teamwork and associated
psychological factors: A review. Work & Stress, 20(2), 105-128.
Reason, P., & Bradbury, H. (Eds.). (2006). Handbook of action research:
The concise paperback edition. UK: Sage Publications.
Redding, R. E. (1992). Analysis of operational errors and workload in air
traffic control. In Human Factors and Ergonomics SOCiety Annual
Meeting Proceedings, 36(17), 1321-1325. Human Factors and
Ergonomics Society.
Repetti, R. L. (1993). Short-term effects of occupational stressor on daily
mood and health complaints. Health and Psychology, 12(2), 125-
131.
Ribas, V. R., de Almeida, C. A. V., & Martins, A. L. M. (2009).017
Evaluation of sleepiness in Brazilian air traffic controllers. Sleep
Medicine, 10, 55.
Rodgers, M. D., Mogford, R. H., & Strauch, B. (2000). Post hoc assessment
of situation awareness in air traffic control incidents and major
297
References
aircraft accidents. Situation awareness analysis and measurement
(pp73-112). In M. R. Endsley, M. R., & D. J. Garland (2000) (Eds.).
Situation awareness: analysis and measurement, NJ: Lawrence
Erlbaum Associates.
Rodgers, M. D., & Nye, L. G. (1993). Factors associated with the severity
of operational errors at air route traffic control centers. In M. D.
Rodgers (Ed.), An examination of the operational error data base
for air route traffic control centers (DOT/FAA/AM-TN93/22).
Robson, C. (2002). Real World Research (2nd ed.). Oxford: Blackwell.
Rognin, L., & Blanquart, J. P. (2001). Human communication,
mutual awareness and system dependability. Lessons learnt from
air-traffic control field studies. Reliability Engineering & System
Safety, 71(3), 327-336.
Ruffell-Smith, H. P. (1979). A simulator study of the interaction of pilot
workload with errors, vigilance and decisions. (NASA Technical
Memorandum 78482). Moffett Field, CA: NASA-AMES Research
Center.
Ruiz, R., Absil, E., Harmegnies, B., Legros, C., & Poch, D. (1996). Tlme
and spectrum-related variabilities in stressed speech under
laboratory and real conditions. Speech Communication, 20, 111-
129.
Salas, E., Prince, C., Baker, D. P., & Shrestha, L. (1995). Situation
awareness In team performance: Implications for measurement and
training. Human Factors, 37(1), 123-136.
Sarter, N. B. & Woods, D. D. (1991). Situation awareness: A critical but 111-
defined phenomenon. International Journal of Aviation Psychology,
1(1), 45-57.
Schneider, W., & Detweiler, M. (1988). The Role of Practice in Dual-Task
Performance: Toward Workload Modeling a Connectionist/Control
Architecture. Human Factors: The Journal of the Human Factors and
Ergonomics Society, 30(5), 539-566.
Schroeder, D. J., & Nye, L. G. (1993). An examination of the workload
conditions associated with operational errors/deviations at air route
traffic control centers. Washington, DC: Federal Aviation
Administration Office of Aerospace Medicine.
Schroeder, D. J., Rosa, R. R., & Witt, L. A. (1998). Some effects of 8 vs
10-hour work schedules on the test performance/alertness of air
298
References
traffic control specialists. International Journal of Industrial
Ergonomics, 21, 307-21.
Seamster, T. L., Redding, R. E., Cannon, J. R., Ryder, J. M., & Purcell, J. A.
(1993).Cognitive task analysis of expertise in air traffic control.
International Journal of Aviation Psychology, 3(4), 257-287.
Sega, R., Cesana, G., Cost, G., Ferrario, M., Bombelli, M. & Mancia, G.
(1998). Ambulatory blood pressure in air traffic controllers.
American Journal of Hypertension, 11, 208-212.
Selye, H. (1964). From dream to discovery. New York: McGraw-Hili
Serfaty, D., Entin, E., & Volpe, C. (1993). Adaptation to stress in team
decision making and coordination. In Proceedings of the Human
Factors Society 37h Annual MeetIng, Santa Monica, CA, 1228-1232.
Sexton, J. B. & Helmreich, R. L. (1999). Analyzing cockpit communication:
The links between language, performance, error, and workload. In
Proceedings of the Tenth International Symposium on Aviation
Psychology, Columbus, OH.
Sharples, S., Edwards, T., and Balfe, N. (2012). Inferring cognitive state
from observed interaction. Proceedings of the 4th AHFE
International Conference, 21-25th July, San Francisco: USA.
Shaw, J. B. & Weekley, J. A. (1985). The effects of objective work-load
variations of psychological strain and post-work-Ioad performance.
Journal of Management, 11(1), 87-98.
Shiffrin, R. M., & Schneider, W. (1977). Controlled and automatic human
information processing: II. Perceptual learning, automatic attending
and a general theory. Psychological review, 84(2), 127-190.
Shorrock, S. T. (2007). Errors of perception in air traffic control. Safety
SCience, 45, 890-904.
Skantze, G. (2005). Exploring human error recovery strategies:
Implications for spoken dialogue systems. Speech Communication,
45, 325-341.
Smit, A. S., Eling, P. A. T. M., Coenen, A. M. L. (2004). Mental effort
causes vigilance decrease due to resource depletion. Acta
Psychologica, 115, 35-42.
Sperandio, J. C. (1971). Variation of operator's strategies and regulating
effects on workload. Ergonomics, 14(5), 571-577.
Stager, P., & Hameluck, D. (1990). Ergonomics in air traffic control.
Ergonomics, 33(4), 493-499.
299
References
Stager, P., Hameluck, D., & Jubis, R. (1989, October). Underlying factors
in air traffic control incidents. In Proceedings of the Human Factors
and Ergonomics Society Annual Meeting, 33(2),43-46. UK: Sage
Publications.
Stangor, C. (2010). Research methods for the behavioral sciences (2nd Ed.).
NY: Houghton Mifflin Company.
Stern, J.A., Boyer, D., Schroeder, D., Touchstone, M. & Stoliarov, N.
(1994). Blinks, saccades and fixations pauses during vigilance task
performance: Time on task. (DOT/FAA/AM94/26). Washington, DC:
Office of Aviation Medicine.
Svensson E., Angelborg-Thanderz M., Sjoberg L., & Olsson S. (1997).
Information complexity-mental workload and performance In
combat aircraft. Ergonomics, 40(3), 362-380.
Tajima, A. (2004). Fatal miscommunication: English In aviation safety.
World Englishes, 23(3), 451-470.
Tattersall, A.J., Foord, P.S., 1996. An experimental evaluation of
instantaneous self-assessment as a measure of workload.
ErgonomiCS, 39(5), 740-748.
Taylor, R. M. & Selcon, S. J. (1991). Subjective measurement of situational
awareness. In Queinnec & Daniellou (Eds.), Designing for everyone,
Proceeding of the 11 th Congress of the International Ergonomics
association(0789-791). London: Taylor and Francis.
Tenney, Y.J. & Spector, S. L. (2001). Comparisons of HBR models with
human-in-the-Ioop performance in a simplified air traffic control
simulation with and without HLA protocols: Task simulation, human
data and results. Proceedings of the 10th Conference on Computer
Generated Forces & Behaviour Representation, Norfolk, VA, 15-17
May.
Thackray, R. I., & Touchstone, R. M. (1989). Detection efficiency on an air
traffic control monitoring task with and without computer aiding.
Aviation, Space, and Environmental Medicine, 60, 744-748.
Treisman, A. M., & Davies, A. (1973). Divided attention to ear and eye. In
S. Kornblum (Ed.), Attention and Performance (Vol. IV). London:
Academic Press.
Treisman, A. M. (1964). Verbal cues, language and meaning in selective
attention. American Journal of Psychology, 77, 206-219.
300
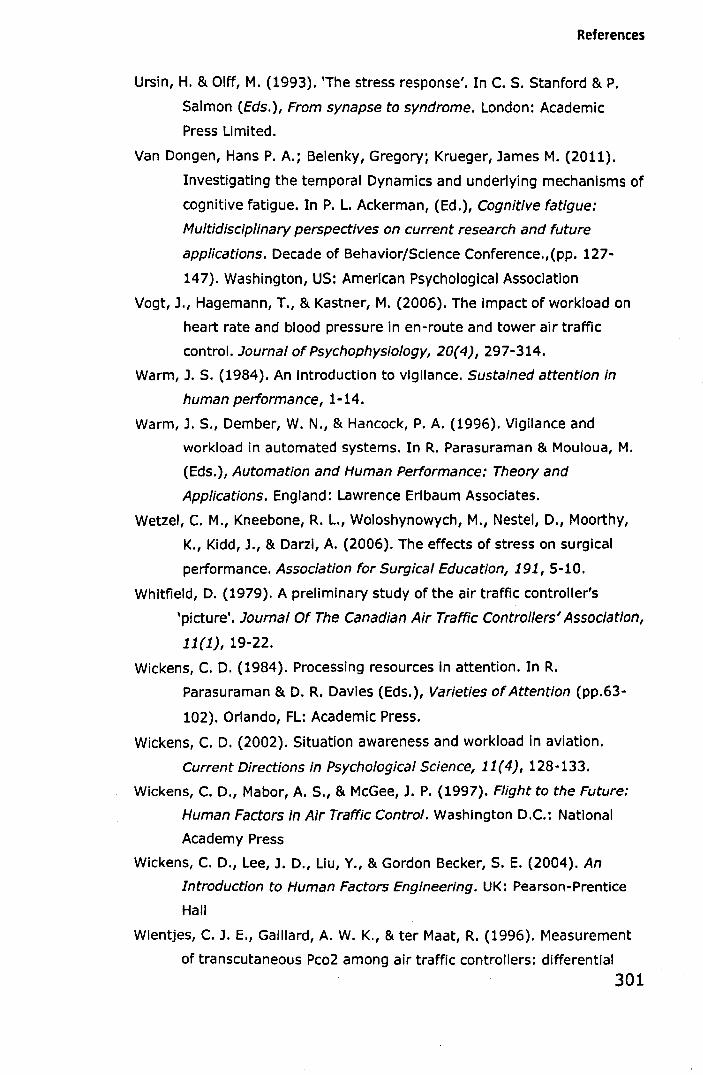
References
Ursin, H. & Olff, M. (1993). 'The stress response'. In C. S. Stanford & P.
Salmon (Eds.), From synapse to syndrome. London: Academic
Press Limited.
Van Dongen, Hans P. A.; Belenky, Gregory; Krueger, James M. (2011).
Investigating the temporal Dynamics and underlying mechanisms of
cognitive fatigue. In P. L. Ackerman, (Ed.), Cognitive fatigue:
Multidisciplinary perspectives on current research and future
applications. Decade of Behavior/Science Conference.,{pp. 127-
147). Washington, US: American Psychological Association
Vogt, J., Hagemann, T., & Kastner, M. (2006). The Impact of workload on
heart rate and blood pressure in en-route and tower air traffic
control. Journal of Psychophysiology, 20(4), 297-314.
Warm, J. S. (1984). An Introduction to vigilance. Sustained attention In
human performance, 1-14.
Warm, J. S., Dember, W. N., & Hancock, P. A. (1996). Vigilance and
workload in automated systems. In R. Parasuraman & Mouloua, M.
(Eds.), Automation and Human Performance: Theory and
Applications. England: Lawrence Erlbaum Associates.
Wetzel, C. M., Kneebone, R. L., Woloshynowych, M., Nestel, D., Moorthy,
K., Kidd, J., & Darzi, A. (2006). The effects of stress on surgical
performance. Association for Surgical Education, 191, 5-10.
Whitfield, D. (1979). A preliminary study of the air traffic controller's
'picture'. Journal Of The Canadian Air Traffic Controllers' Association,
11(1), 19-22.
Wickens, C. D. (1984). Processing resources In attention. In R.
Parasuraman & D. R. Davies (Eds.), Varieties of Attention (pp.63-
102). Orlando, FL: Academic Press.
Wickens, C. D. (2002). Situation awareness and workload in aviation.
Current Directions in Psychological Science, 11(4), 128-133.
Wickens, C. D., Mabor, A. S., & McGee, J. P. (1997). Flight to the Future:
Human Factors in Air Traffic Control. Washington D.C.: National
Academy Press
Wickens, C. D., Lee, J. D., Liu, Y., & Gordon Becker, S. E. (2004). An
Introduction to Human Factors Engineering. UK: Pearson-Prentice
Hall
Wientjes, C. J. E., Gaillard, A. W. K., & ter Maat, R. (1996). Measurement
of transcutaneous Pc02 among air traffic controllers: differential
301

References
responding to workload and stress. Biological Psychology, 43(3),
250-251.
Wilkinson, R. (1969). Some factors Influencing the effect of environmental
stressors upon performance. Psychological Bulletin, 72(4), 260.
Willemyns, M., Gallois, C., & Callan, V. J. (2003). Trust me, I'm your boss:
trust and power in supervisor-supervisee communication.
International Journal of Human Resource Management, 14(1), 117-
127.
Williamson, A., Lombardi, D. A., Folkard, S., Stutts, J., Courtney, T. K., &
Connor, J. L. (2011). The link between fatigue and safety. Accident
Analysis & Prevention, 43(2), 498-515.
Winship, C., & Mare, R. D. (1992). Models for sample selection bias.
Annual Review of Sociology, 327-350.
Womack, B. D. & Hansen, J. H. L. (1996). Classification of speech under
stress using target driven features. Speech Communication, 20,
131-150.
Woldring, M. (1999). Team resource management In European Air TraffiC
Control. Air & Space Europe, 1(1), 81-84.
Wyon D. P., Wyon I., & Norin F. (1996). Effects of moderate heat stress on
driver significance in a moving vehicle. Ergonomics, 39(1), 61-75.
Yeo, G. & Neal, A. (2008). Subjective cognitive effort: A model of states,
traits, and time. Journal of Applied Psychology, 9(3), 617-631.
Yerkes, R. M" & Dodson, J. D. (1908). The relation of strength of stimulus
to rapidity of habit-formation. Journal of Comparative Neurology
and Psychology, 18, 459-482.
Young, M.S. and Stanton, N.S. (2002). Malleable attentlonal resources
theory: a new explanation for the effects of mental underload on
performance. Human Factors, 44(3), 365-375.
Zeier, H., Brauchli, P., & Joller-Jemelka, H. I. (1996). Effects of work
demands on immunoglobulin A and cortisol In air traffic controllers.
Biological Psychology, 42, 413-423.
302
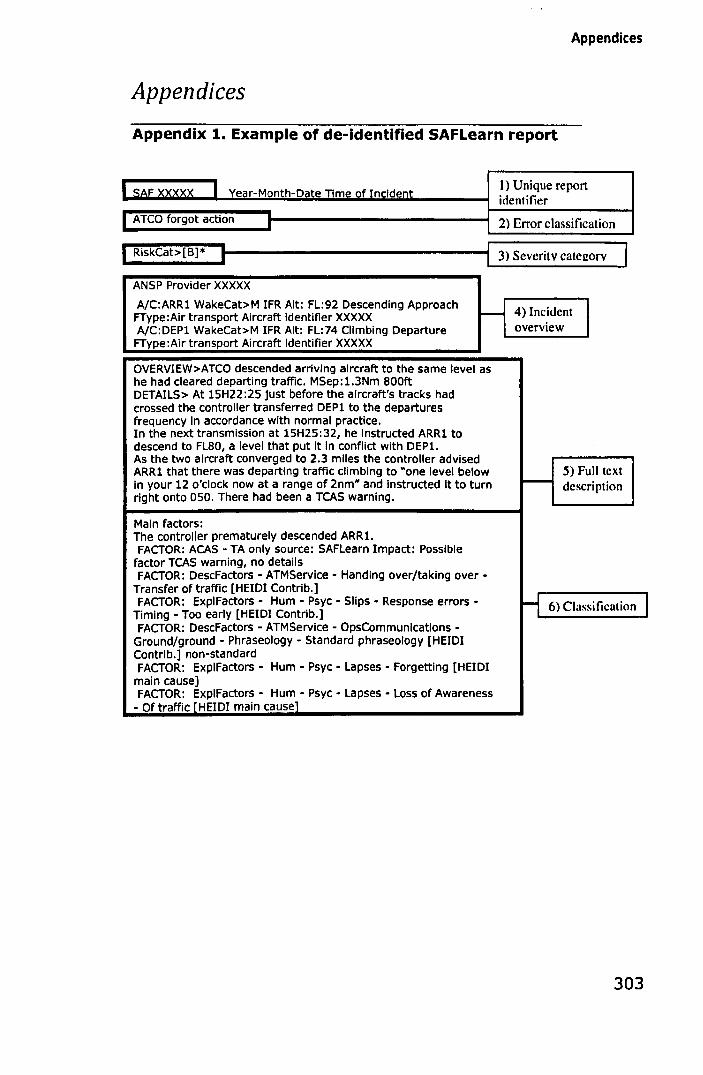
Appendices
Appendices
Appendix 1. Example of de-identified SAFLearn report
1) Unique report I SAF XXX xx I Year-Month-Date Time of Incident identifier
I ATCO forgot action • 2) Error classification
RiskCat>[B)* 3) Seventy categorY
ANSP Provider XXXXX
A/C:ARR1 WakeCat>M IFR Alt: FL:92 Descending Approach FType:Air transport Aircraft Identifier XXXXX A/C:DEP1 WakeCat>M IFR Alt: FL:74 Climbing Departure
FType:Air transport Aircraft Identifier XXXXX
~ 4) Incidcnt overview
OVERVIEW>ATCO descended arriving aircraft to the same level as he had cleared departing traffic. MSep: 1.3Nm SOOft DETAILS> At 15H22:25 just before the aircraft's tracks had crossed the controller transferred DEP1 to the departures frequency In accordance with normal practice. In the next transmission at 15H25:32, he Instructed ARRI to descend to FLSO, a level that put It In conflict with DEPl. As the two aircraft converged to 2.3 miles the controller advised ARRI that there was departing traffic climbing to "one level below In your 12 o'clock now at a range of 2nm" and Instructed It to turn right onto 050. There had been a TCAS warning.
Main factors: The controller prematurely descended ARRl. FACTOR: ACAS - TA only source: SAFLearn Impact: Possible
factor TCAS warning, no details FACTOR: DescFactors - ATMService - Handing over/taking over -
Transfer of traffiC [HEIDI Contrib.] FACTOR: ExplFactors - Hum - Psyc - Slips - Response errors -
Timing - Too early [HEIDI Contrib.] FACTOR: DescFactors - ATMService - OpsCommunlcations -
Ground/ground - Phraseology - Standard phraseology [HEIDI Contrib.] non-standard FACTOR: ExplFactors - Hum - Psyc - Lapses - Forgetting [HEIDI
main cause] FACTOR: ExplFactors - Hum - Psyc - Lapses - Loss of Awareness
- Of traffic rHEIDI main cause]
5) Full tcxt - description
H 6) Classification I
303
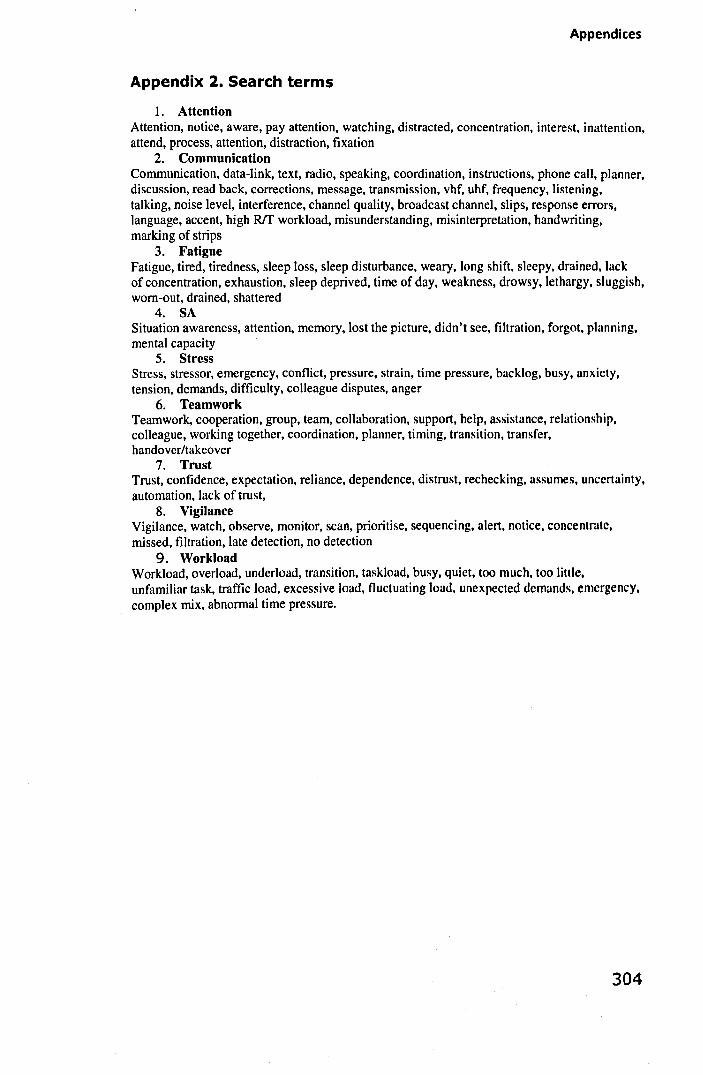
Appendices
Appendix 2. Search terms
1. Attention Attention, notice, aware, pay attention, watching, distracted, concentration, interest, inattention, attend, process, attention, distraction, fixation
2. Communication Communication, data-link, text, radio, speaking, coordination, instructions, phone call, planner, discussion, read back, corrections, message, transmission, vhf, uhf, frequency, listening, talking, noise level, interference, channel quality, broadcast channel, slips, response errors, language, accent, high Rtf workload, misunderstanding, misinterpretation, handwriting, marking of strips
3. Fatigue Fatigue, tired, tiredness, sleep loss, sleep disturbance, weary, long shift, sleepy, drained. lack of concentration, exhaustion, sleep deprived, time of day. weakness, drowsy. lethargy. sluggish, worn-out, drained. shattered
4. SA Situation awareness, attention, memory, lost the picture. didn't see. filtration, forgot. planning. mental capacity
5. Stress Stress, stressor, emergency, conflict. pressure. strain, time pressure. backlog, busy. anxiety, tension, demands, difficulty, colleague disputes, anger
6. Teamwork Teamwork, cooperation, group, team, collaboration, support, help, assistance, relationship. colleague, working together, coordination, planner, timing. transition, transfer, handover/takeover
7. Trust Trust, confidence, expectation. reliance. dependence, distrust. rechecking. assumes. uncertainty. automation, lack of trust.
S. Vigilance Vigilance, watch, observe, monitor, scan, prioritise, sequencing. alert, notice. concentrate. missed, filtration. late detection. no detection
9. Workload Workload, overload, underload, transition, taskload, busy. quiet, too much. too little. unfamiliar task. traffic load. excessive load. fluctuating load. unexpected demands. emergency. complex mix, abnormal time pressure.
304
Appendices
Appendix 3. HEIDI (2001) lower-level classification terms mapped to the higher-level factor
Heidi Categories Category Examples Attention Distraction: over long time, over short time, Fixation
on important information, Complacency Communication 1. Slips, Response errors, Slip of tongue/pen
2. Communications, Spoken communications; Call-sign confusion, Ground-ground communication; 3. Written communication: Data link, Handwriting, Marking of strips
Fatigue Sleep loss, Sleep disturbance, Tiredness, acute, chronic, other fatigue issues
Loss of awareness (Situation Of traffic, Mental Capacity, Loss of picture, Loss of awareness) SA Coordination (Teamwork) 1. Team Skills: Transfer of responsibility,
Handover/takeover, PoorlUnclearlNo coordination, Inadequate transfer 2. Poor communication: Pilot, colleagues 3. Team Management: Returning to sector after break, Temporary unmanned position, Poor splitting/collapsing sectors 4. Timing: too early, late, long, short, transition
Trust 1. Confidence, in automation, complacency 2. Trust in others & automation: Over, Under, Mistrust
Detection (Vigilance) Late detection, No detection, Monitoring Workload 1. Workload issues: Too much, Too little, Task
shedding, Unfamiliar task/novel situation, underload, complexity, changes 2. Traffic and airspace: Traffic load/complexity, Excessive load, Fluctuating load, Unexpected demands, Complex .. Unusual situations
305

IMAGING SERVICES NORTH Boston Spa, Wetherby
West Yorkshire, LS23 7BQ
www.bl.uk
BEST COpy AVAILABLE.
VARIABLE PRINT QUALITY

IMAGING SERVICES NORTH Boston Spa, Wetherby
West Yorkshire, LS23 7BQ
www.bl,uk
PAGE NUMBERING AS
ORIGINAL
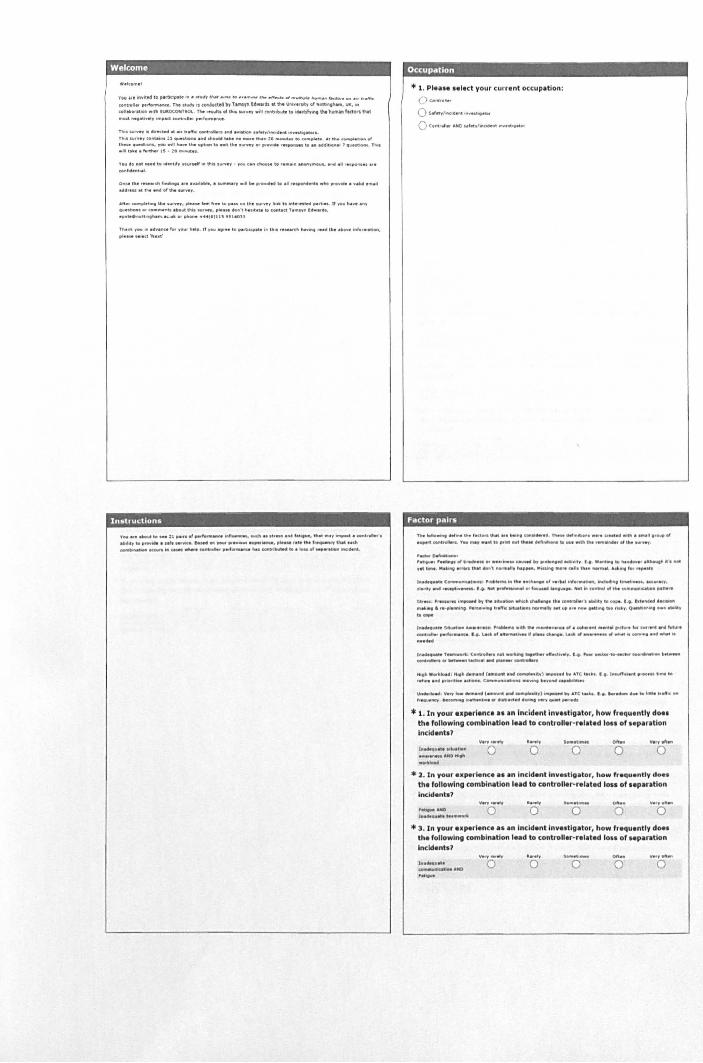
Welcome
YOII I t ' 1n""eeI' 10 pMtKJpeC. HI .. ftlH/r u.~._ ,. .,,-____ ., ,..1IIf,~ ........ '" I..,..,. _ ... 'r._ (,nDeliet ,.rf.rm-.. the INdy.S eofI6v<ted '" <hfM'f1'\ U •• '" "" 1M: ijllW.rMy Clf .~'"."-. UK, lit
~Iab,",*, .,", fl,ll;OCONTIOl n. .nllltl" tt.. ....... .-- Mil C1IfItllbw l ... Ita""'" \M l\UlI'IIl' fKt.n tNot moot .... .t ..... ., 'ft\jlKt aMO\I .... , ,...-tOlm.ne,
tho. w...., .. 11,-.1 lit __ b.1hc -.....no ............ 10 .... fet,o/ • ..."cI.fIt ."'-.. ........
Ttl. , ........ , e. __ H ..... '- . " lIItouW 11,11.,.. _ ,.,h ... 10 •• _ •• te c_..a.r •. • tt ... _"","1_ af
tI>eM ........... , ,... -.I, ...... tIM I9bOII t.- •• " tht ._., or .,... ,""ft_ t .... Mdobtol'l.1 '.u..--. ' "h .. • itl lI .... fI.t~15-:O .......... u .
OfIe.tfle ........ t;tor .............. ".".,,'-• • _....,.'1I Mp ...... d to • • r .SjIoOIIIhIoU ................ . ...... . .... ..
• lId.e.u.ttlo.tltA401ttM_...,.., .
• ,.. .. '_""", .... u.. ....... .." ,'-_ ......... too " ' " '" tn. _"tf liM uMlter"'" ~,t_. It ,.u .... " .... " ."'.~. Of It __ nb "'wtttl .. II4In<..,., ........... ·, ... "".t. Ute_Ict T,,,,,.,,, fd • .,..,. • • jI.u . ... n ............ K ... lot' __ "'\')11S '5t.alJ
, .... ".. ... _,,, ...... ftC. foo,lt1oIrheljl . l f ' ........ ,.,.rtK,p .... ,II '"I .... M.K"' ..... '""f .... Ilu.. .... ,,.Inlo."",."Oft. pl ...... t.ct ...... ,·
Inst. uctions
't_.,.~l .... !I_ •• '~+fI,,_ .. wd! .. . to_.II4 'AtI.IM. fNl_.,........,a.~ ....... _(lilli, No ............ " --...n . ...... etI .............. _ n .... _ ........ ,.tt' tN '' '''-' tNi I Mft
-oOMt_ tet""" '" c-. ........ tift""'''' ..... _~. _~ .. . .... ., ....... -'---.""
Occupation
• 1 . Pleilae aelect your current occupation:
Oc:.- "·R#r O W9ty'''''' ... ''I ..... Kt .. _
Oc.ntr"' ... A .. o .. '..,rlfl(I4I<HII " ..... ' .... OI
factor pcdl S
no. '*"' ......... , ... 'M l ooc: .... 'fwIt ........ ,' _ ....... n .... .." .. ~~ ••• r. cr .... M . ,ttI . __ II,IWoUt'''
.JIfotft Wflh'toIIoIo! • • ,,_ ,_1M I • .,IM toll' ttw. .... rt.I_ III IIU _ttl! ttl. r-.. ft4,er" t ... _'H1'.
.~ "",*,-1
'"'''' ,. ....... ., tir94fI ... If ... r_ .. ~ "' til ......... /IIdl.,,,,, t, ",.nt .. I. ". nNwr .. """''' It'. filet
.et ta_ . ..... ioftt efY"tf. IMt .,,\ ""IIl. It, "' .. "". ",j~", ",.r, (111.11"" _",.1, """HI" .... ,.ttt 1 ..... ~.e~_1 "~.MI'he •• doe"," ... rW"","-.tiefl, ~".t-ef_ ... """",,, v.ntt .... r«ttlll ........ t ............. .-.. .. f~ I.e"fw. ... fItet IfI «tItr.i eJ, ... _~"" .... ,ttl'll
,to .... I"._\H"'"""""'..,'IM .. bHI~.I"("~t ... (eIIttOIlot, •• IM .. "I.~, I . . .... tt" .... ~ ",lilt.,. , ....... !WI,". ~ """1( 1I'tII.~ _",tll'f' _ ... re _ .... 11'19 tM n"',. ~h'''''''' •• " .... .,
"-I~""W $lt16M_,.,. ... "..II~. wlttltJle "" ....... _ .,.~ _",eI .. od ..... "',,",,",..wIM,,,, ~ ..... """."'".' .•. lMtllf.,._._il.,M.dI ...... ltc*" .w...-., ."11,. _ ............ It ", •• 494
I~ ' .. /II_Ill C_ .... ,,,, _10 .... tetttNt Ift"I'"", t., . .... M«_'''_~'_ ......... _ .......... ~tlodlc.tj .... "' __ .....
"toh W ....... I "10ft "/II.'" ( __ ,.1'14 ~/IIflle"t,,) ....... .1 ,,,' .. ,e I"~' I,. I_tflc_t flfOC ... I",,, t. r.t'_ . ......... ,t_Mtf_. C_ ... _II_. _"'I ... _""" c .. e,"tie,
U ........ l "'." .............. 1_"" MI4_,,",,' illl~'" Alet.", t . . ... · .... IIIw. .. httlt ..... I& ..
I~ . .. --.. _""""' ...... tI-a ... loII"IIIt.,.., ___ ....
* 1. In your ..... rl.nco •• an Incldont Inv •• lIgator, how froquontly d .... tho following combination I •• d to controllar-ral.t.d lOll of .oplratlon Incidentsl
1114.11._11"'. "hI.tot" - .. _""'0 ...... _ .....
Vtf'IIf"",
o ..... , .... o o
* l . In your experience aa an Incident Investigator, how frequently doe. tho following comblnltlon Itld to controller-ralltod lOll of .. paratlon lneldonto? ....
o .3. In your experience aa an Incident Inve.tla_tor, how frequently doe,
tho following combination I •• d to controllor-rallt.d lOll of .. p .... tlon Incidental
s.... .. '_ ..... o o
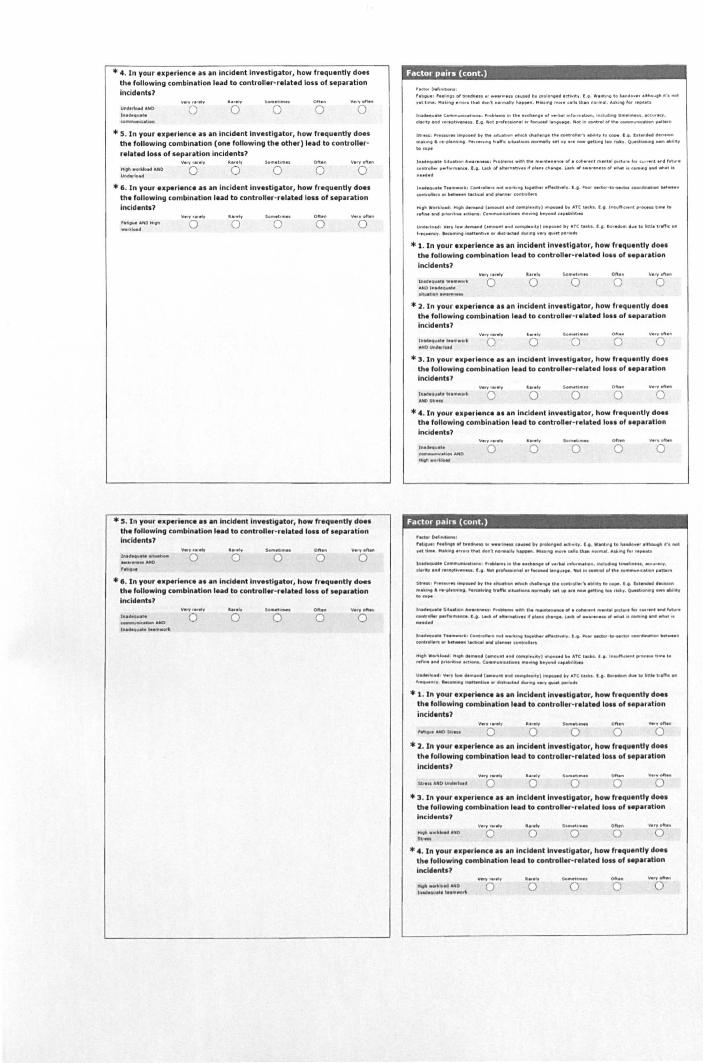
.4. In your I.plrllnce alan incidlnt Invlltigator, how frlqulntly doel the following combination le .. d to controller .. rllated 1011 of siparation incidlnts7
UftNrt.M AHD ........... .t. - o
* 5 . In your Ixperlenci alan incidlnt InvIstigator, how frlqulntly dOli thl following combination (onl following thl othlr) Ilad to controUlr· rilltid loss of siparation incidents?
o o * 6 . In your Ixperlinci as In Incident invIstlgator, how frlquently dOl.
thl following combination Ilad to controlle.r-rllatld loIS of separation incldlnts?
.~.
o
* 5 . In your ex.,.rlenc ••• an Incident Investigator, how frlquently doe. the following combination lead to conuoller· relatM 10 •• of .eparltion IMldent.?
"'.4..-1Me........ ~O..-r ,.t .....
'0 Oft • •
o * a. In your e.perience a. an Incident Investigator, how f.-.qulntly doe.
the fotlowing combination Iud to controlllr· related 1011 of .. p.ration Incidents?
1Ae ...... ___ 0
1N4et ..... ' • • M_""
v..."....,
o .... o ....... - ..~
o o
Factor pairs (cont.)
'Kt .. o.f,f'I~ ' '.toev. , '"'''''' '' tw.dnoe .. ..- ••• , ... . .. ulllftl .¥ .... Iof'l." .d ...... y f • • W.""II, 10 ... 11l1li . ...... !thow,1I If', _ ,It ,,_, ""~ III' . "... .• Itwot ..... " _"'." II .. ,,"", "'IS"", _. , . 11. Ih. n ....... . ! . ..... ''''1 ,... ........ t.
I~ .. ot. C-_.t_, lIT ........ loft lho ... ct. ................. , ...... ..... , ,""'IIfiII'''I .. ""~,,.. ... KC: .. Ky,
u...ty aM ,toe . ... ' .... H . I •• Not .... -., .. I.., ...... I. ,..MOO. NM ill woot,.llf tho _W"IQtIOf'I\NlIet ..
Str..: .... _ -"",11 ..., tIIIoI eot\oM .... . '"' .. dl4 .. k .... lho -..., .. .w.c, ,. _ " bl ....... 11100._
", ... "" . ...... "" ........ wo" .... Ir.fht "ty~ --"W .. tw" ... -.-tl.lftt 1M .. " Qut...-. .... "",tty ,.ce,.. '" .......... . " ..... 001 . .. . ,'.no ... ".ble"" .1\:1111'10 "".'1'\1 . ... 11«1 If .. ,oil .. '. " ' m.n,.I,oct" ... ,., ~ ..... "t.nO Mv .. (lfntrel .... ,..-4..-"".", •. I." let" ., . 11 .. 11.' ..... rI ,... ". ch."" • . Ledo If . ............ . tw.t .. '-.nt ........... , Ie
l ........ w ... T_~. c..t ...... _ . ..... 1It ",edoo., of'\' __ I, I • . '- Md.·to.....u .. _111", .. _~ ..
c.ou ......... ""-. \IIItlC:_ ..... ,a-. Wft" ...... H'," Ww ...... ""- 1III. 1ftOIMI C. .. _I • ..., _,Io'''yl .......... Itt AtC ....... I, , ... v"" ..... "'kOM U_ , • • .- .M "_,, .. Kl_. C_",,_IC.OI_. _ ...... IN, .... ",..~Itbet
* 1. 1n your Ixperlence I. an Incidlnt Invlltlgator, how frlqulntlv dOli thl follow ing combination Ilad to controller-relat.d 10 •• of 'Iparatlon Incidents?
Oft, .. \I.,.,efl ...
o o * 1. ln your Ixperilnce •• an Incidlnt Invlltigator, how frlqulntly does
thl follow ing combination Iud to controller-relatld 1011 0' 'Iparation IncidlnU? '-_M._
o 10' o • , . In your I.perlinci a. an Incident Investigator, how frlqulntly doe.
the follow ing combination Il ad to controlll ,.. ,.latid losl of .Iplrltlon Incidents? ..... , __ .U~ ..
o o o * 4. In your e.plrienci •• an Incident Inv .. tlg.tor, how frequlntly doe.
the following combination Ilad to controlllr·re~tld 1011 of .Ip.ratlon Incident,? ....
o o
Factor palls (cont.)
'_ ... o.f~.
'~I 'M ....... -'tw ................ It,,",," """""".a,,,\tY, I. w .................. ".r.~"·I_ ,et IN "'.1Df'Io _.,. tMI"" __ , II, .... """, "' ....... _ . , • • , UI. .. ~fIII .l . .... IfI • .., ... "tII, tAHe.wot. C-_ .. _ .~. Ml I ... .. dlMI. of ......... '"'_ .. ~. "",,,,,,,..1;"""_ ... e«"'Kf. de .. I.,.1I4 tKf,,'_.I, Hot enf_.lw ....... )elltu .. ' "'" MlUo!II'" -' lhe c. __ ,_ •• " , ,"
Str ... . "', _IM _ .......... ,he -mt ..... .tMc.h c ..... /If. lII . ''''''' ...... . .. Irt, I. -.e, I. tAl"""" ~ "'.~ .... . .-.. ".IIft ... ' . rotMfIIlI"'lfic IItIIoO'_...,.. .... Nt "" ..... __ fI"1fII ... , .... ." o-ttOfllfll _ .. II"" h_ ......... vet. l.w.t_ It ...... " , ............. 1111 , .... -...._." . cehoeI.,.,. "' .... Iei OK''''' hi , .. _ MM "" .... .......... ...-feo"' ... t • . Wd." ... Of ......... fI ___ ........... a..ct:"' ••• _ • .,~ .. -.....,.hM ..
", •• 4'" 1"-..-... '--'1 c.-............ _"'"'II ' ......... ..,"'1 ...... , r , ..... _ ... ~ .. _____ .. QtIU .... .,IMt_~OftIII"I_(eIIItf .. _
tfi,lI w.,. ...... H .... III.MOfII4I_.1HI1 . .. 4 _.Iu.",' ""' ..... h .. tc: lMIt • • ' , . !I'\..n'!' .. _ , .--. .. t._ , • .-.f .... aM ~_ Kt_. C:-II"lUIMIfi. -vifto •• .,-4 UfI.It,I,~
U""""" v-*' ..... ItIOIIIoiIIII_ .... MiIII_ ... Ity) ..... M • .., . TCI"h tt ............ ttnkb.tfw:1fI '.......n '-"-t ~M""'" •• tf"ad'" ...... _., .... ........
* 1. In your Ix,.r&ence a. In Incident Inv'Itigator, how frequlntly dN. thl following combination II.d to controller- rllated 1011 of •• paratlon Incld.nt.? ..... Y"-,~,"
o o o * 2. In your ,.",",Me a. an Incident InvOItigator, how frequently d ....
the following combination I.ad to controller-related lOll of .eparatlon IMld.nt.?
DO_
o .3, In your I.".rilnce a. an Incident Inve,Ugator, how frlqulntly does
the following comblnltion I.ad to controller- rlillted '0" of .epllratlon Incld.nU7
M .. h ........... 0 .,,, .. \I..., ... ...,
o .~ .. o
...... ,- Oft." \I.,.,ef\ ..
o o o * 4. In your 1 • .,.rJence a. an Incldlnt Invest 'gator, how frequently doe.
the following combination le.d to controlllr"relatid 10" 0' separation Incident.?
'0 -o _"M
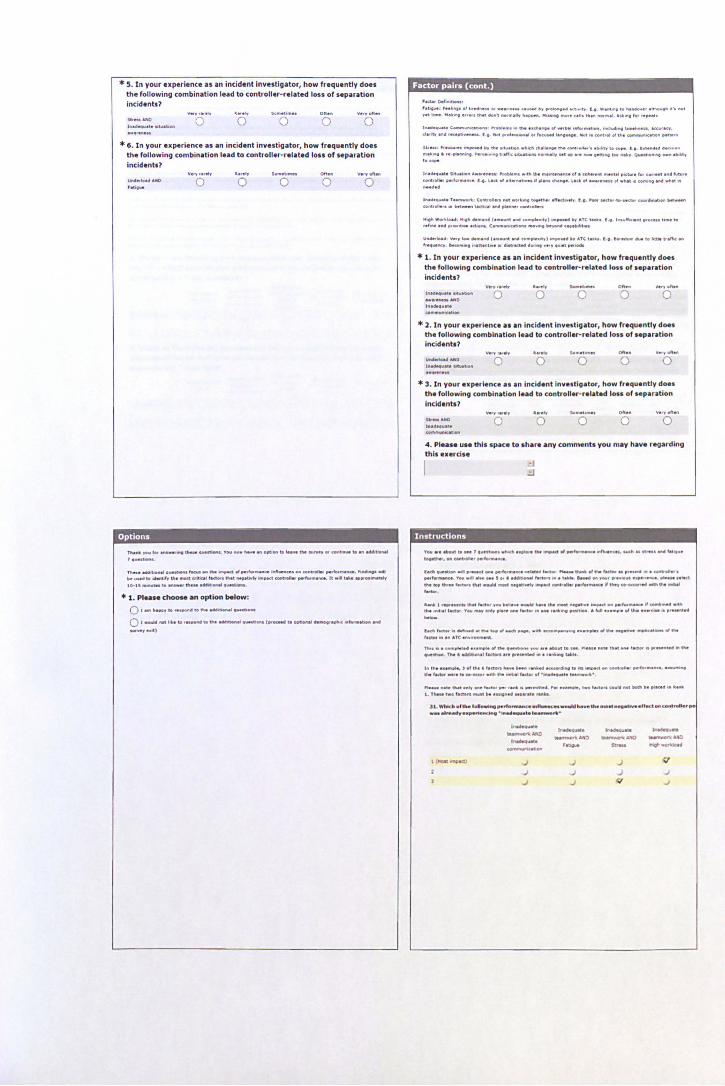
* S. In your experience as an incident investigator, how frequently does the fo llowing combination lead to controller-related loss of separation incidents?
Oft . ...
o o * 6. In your experience as an incident investigator, how frequently does
the following combination Iud to conb-oller-related loss of separation incidents? ..... " ' .... - o o o
Options
fNfttye .. ,.. ............ ctIoeM .. _., .... _.~MI ........ to .. _tlM:_,..,., ... ~UoMl .... dIMoIoI 7 .. _tt_ T_ . ... ~I ........ _~_ct.. .... ..-. " .... "'-_irlfI __ ._c.n ......... ...... ""._. ,.II<II.~ .... bot ...... ,.lMI!ttfy tIM ....... cnI~ fad ..... tNt """ett<o.., .... pad ~ ........... -. It ... , tMI(. "111.'_~'y
'O·u._t"'._'NM....." ........ ~
• 1. Pluse choose an option below:
01-"-"" ..... ___ .. I.' ... ...w.~ _.t-O I ................. tD l " ...... I ......... ~ .. ___ ( .. -...II.~t~r.phICIII,.,...bH."" __ ., ... 01'
Factor pairs (cont.)
'_o.fl"'~.: '.too ... , , ••• , ... ,. or lI ..... *A ...... " ...... ,._ to, ,..~ ... .a .... .., . ! . • . W ..... '"O t. h ......... r.~ OI',_t
,~I"". , ",.k."O . n ... lhoot .... , _""H, h.O ... ", "' ... ~ _. u ti' th.1I _"'., . . ... ' ... 0 f.r ,.. .... "
l ......,j ..... ..-.. C-_t_. 0 • ..,._ If! dM • • "' ...... 1 ... ' .... "" ..... _. 1fOd ...... ~ .... ... ecc......:y,
d erlt¥ ell. ,_ott .. _ . ! 0 Mot O' ... --' .. ,~ ..... u.oe ,... ... _ •• crf lhe_"lUt .... ~Iat ..
~lr"." ' ,.,._," '''' ....... ~ the •• tu.lieII .h",h th.lle __ ~ . ..... ', . bol.l" te _ . I •• • I"' ....... ,,_ ... ..
"'. 10. ...... ~. · ... _'"O ... ru ....... tr .Hoc NWetI4M _-u., HI "II"" _ .,..-tto,.. t .. .-,. ~1fIO _" .... 111'
"-III. MqlHlle $4:..- .......... : "'c.bMme .1ltI tW _,tIt ..... _ of . ( ............ ",_. 1 ..,ct ..... t .. ( ..... _ ......... t...-. ~r.II., ,....tDl_tw: •• I: ,f . Led '" .".'"._ 01 ...... tn. ...... LOf.k ", ........... ", .tIM It (om .... o./11111 .""t" " •• 01 • •
''"'''flI ... t.te._Of\,c:.IIII ........... .. ,~ ~ ' ''«to .. ...,. t .. . .... _ .... _~ ~ ....... _ .... _
e. ........ , ... bet..- toau .M IIioeftMr C_, .....
...... "'..-.10.04, H'Oh ..... 11. (._t .... c.M ..... ",) ""-,,.., -.TC: ... 11. I •• , ..... ,,"" .. "" .,._. "_ M ,." ........ ...-_,_...:tl_. c: ___ ._ ..... ....,....C".~.
u ........... V.ry ..... l1li ...... l1<li ( __ lit .... (."' ....... , ' tIft,oM. to, ,.TC: t .... , f .. . .... .0- ..... I, IIU" b."I(''''
, ...... ftC" ---.... ttlett . ... tt<o • ..- .... retted . "' ....... , ....... OW..-.1. In your experience alln Incident Investigator, how frequently does
the following combinat ion I.ald to controller·r.lalted loss of 5epa,.tlon incidents?
VtrY,w" , .... " ....... t._.tJoo .. 0 o o 'n, .... 4\.
* 2. In your e.plrience alln Incident Investigator, how frequently does the fol lowing combination lead to controller-related losl of leplrltion incldentl?
"" .. o o * 3. In your experience II In incident InvesUgaltor, how frequently does
the following combination le3d to controller· related loss of separation Incidlnts?
00_
o o 4. PI •••• us. thll.pace to share Iny conlment.l you may hlv. regarding th is e.ercis.
Instructions
YMI ... __ ...... ,.IM.t_ ..... d\ ....... t:M ""'o-Mt ", ......... ......u~ •• • ",,11 II Mr. ....... tet .....
'''foIt/I«. ",~'''''''''''_
fedt 4IMM_ ." .,._fIt _ " ,t.rIl"l'_,"Ioc .. '~ .. ....... \tWIto .11tw'_" ,_ ...... . C*ftb",., '. ...,,-- T ... ,,, .... Me' w I ... ,,-.. ~ ... tow. ~ ... .,... ... n_ "", .. I\aI . ,... ..... lect ttl • ..,1tW ... 1.a.1 ttl" -'til ___ eat .... " ........... GMU ....... ~ Ii' , ... " • • __ ..... tr-. ~ ,_ . ....... I ,_ ... .,.. "" .. r..:t., .......... u . _loll ,..". doe ........ OM' .... -..ct _ ... ,..-. ~t -"~ oM." ttw " ..... , feeteo' , T~ _y .".., "'en _ t_ '" _ r4f\k1nt ..-111M! A fit_ .""'oJ." ttl" OIlOlC ... 1I ,_!'It .. ..... 1lac .. ' __ .. .......-.. .. u...te.",..cfo ..... . otto_ ..................... "Ute ... _ ......... __ I .. . ,.«000111 ... ATCtfII .. ,rN ..... 1It
n.. .... c_""' ....... ___ " doe ~ __ II . ..... W , ... ,.. ....... ttI-t_ tea .... ..... "l .. 1fI It •• . _11:_ flit, e44iUeMl '4Chft 4A "' .... 1ItI'III HI . ......... lHk
I .. ttIe ... M .... ,., tht, f.ctwo ...... "- I.,.. .... _III'''' ...... --.ct _ -.. , .. ti ... _ftC .......... ,'" u-..'-«or _ ... _._~ ... ,h I'" """' •• • f.a .... f ·1fIH.IMIt. l",,,,_,· .... __ ttwot_ty_, __ ......... _ ... ttte4 ,. .. ...... . .... fMt ..... ce .... _ ......... ~II'I.""
l .T ..... t_'ecun_' .... Hof/I ...... .,.M.,..i\b , • • wt..c. •• t l:Mtol ...... pe.rl.""-ce ... "-*c; .. ...u~th ..... t .q.t ....... flec::I_t;aM~,. ._ .... .4v~ .. Ift .. ..-t.~ ,_.
'-' I".~ 'N_ "'~A#IIO ......... - tIt~"'O OI«t'MOI"tNO
I~ClUlit. , ...... - .... ......... ..............-1 (MDIt1ll'ftS:.u, .J .J .J Q
.J J .J J
.J J Q .J
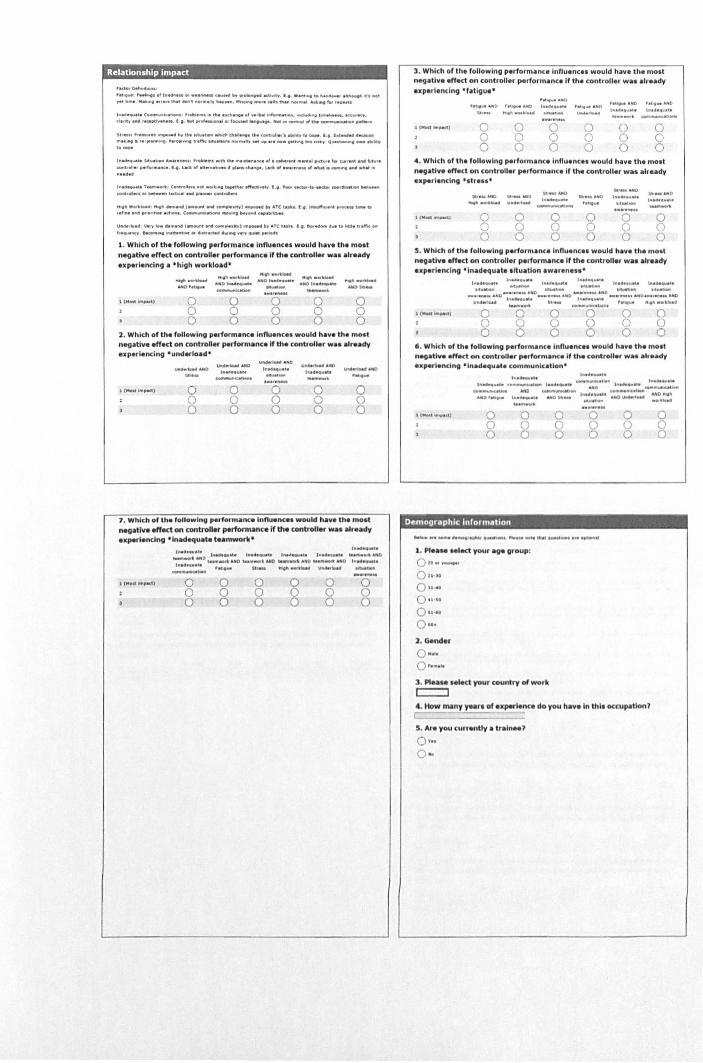
Relationship impact
'_0efIn __ .: , ... " .... : ' ........ f br ....... II' .... rifM.M ,, __ "" ........... _"It\' . •.•. • ...,... .. Iuo..--................ , r.-t t. __ kMO ... .,.. \'Nt ~"t _ .... It, "',l1li'" ""_ .... _ .• A" ""aft _",eI ......... ,., f .... I.
h'.d._t. C_ .. ~. ~ ........ tto. . o:dl.,..ef"""" N\'-_.~",to"""""'_""',
d"",~,-",,"," ... I .. IIot,,,," .. -.I.,f"""'''''''''''' *''''' __ ''u..~,...,,. SI'_I " . ... Iif"n ,---' h ~ "tu.~ .MII m . II ...... I'" _.1190 .. , Wtty I. m .... I ., hlMl4" __ ",10k,,", .... .... _ ... '-Ire ........ ,me...-. ____ '''' _ ... _ .... ..-n .... _ nlot, 0.-1-. _ .....
1"' ........ 1. '.",' 1_ ........ _ : ,.,..... ........ th n.. .... ,lIWn.M." .. eM .. ", ...... ,oct .... , .. "',,''''' aMI fvtll~ ~"I.r .... _.10(. t .• . u.ct." .tt .. " . twHIf ~d\.t"" • • l.Kt., _W_ .. tII ...... "C_"", ..w wfI.tII "
I" ....... ~ T_~. c..-.. ...... ot ......t.oIt w..ttt.f t'ft'.a, .. ...., I; t . ..... .n.t-t.---. _____ .... _ cont ........... ....., todKal ....... _ ~..-.n
""II I'1 ....... loM: "'''II'' ""' ..... f ____ .M _,...otyl 1M .......... At(~ .. '" 1""'._ ~_ ~ .. 1 .... '_aIMI ........ t_act>_.c:_IHI~.-. ..... ..-4~tot.-.
u ........... v.", I_ IIotm.ftOII 1 __ M .M _ ... " .. " ........... '.rCt .... 1 . . ... _.vet.loetj. "'." ...... f_IOO', ~ _tt.~ ...... bKt .... N1AtI • .,.,~ ... ..,....
1. Which of the following p.rform~nc. Influence. would h~y. the most negative effed on controller performance if the controtler was already experiencing a -high workload' -- -_ .... . ............
"'"-" .. _r.....I ..... -"tM4
AIIIO'·lofuI .... 0 iAN ....... ~DI .......... ....... M_
lIHMt""P«t) 0 0 0 0 0 0 0 0 0 0 0 0 0 0 0
2. Which of the following performance Influence. would have the mo.t neoative effect on controller performance I' the controller was already experiencing ·underload-
LM .............. D I" ...... t .
u~ .C) _ ...
I,.., ...... '. ' •• 44411101. , .... -N-'
I ( ...... ""fIIMt) 0 0 0 0 0 0 0 0 0 0 0 0 0 0 0
7 . Which of the foflowlng perlormiiACe Influence. would Ntve the most negative effect on controllir perfonnancelf the controller wa. already experiencing ·INKloquate teamwortc* , ......... , ..
I~ .... tot I" ... -"U. 1"'''111 1641'. 1,..,4 • .,.,. • .... 4 ..... ' .... _ .. ""0 ~-- .... 0 t.....-... rt .. 1ItO t •• ",_ ....... 0 ___ tr. oUID "'-"""0 I " ....... ' . ll1M •• II....,...... SCI_ ............ ........ ~
o o o o o o
o o o
o o o o o o
o o o
3. Which of the following performance Influence. would have the most negative effect on controller performance If the controller was already experiencing -fatigue-
h I ..... tM :J, h i ... ",.0 1 • • 4 . ....... ,ft ..... ANO
o o o
o o o
.. ..--o o o o o o
, . ...... ""'0 ht ..... AHO
1" ........ 1. 1111' '',,,,.,.
o o o o o
4 . Which of the following performance Influences would hive the most negative effect on controll.r performance1f the controller w.s already Ixperllnclng 'stre .. ' .. _- --- I" .......... 5tr_ ""0 ,,, ......... I ............ . . .... ..... --- h ... ", ...... - .--tC~_"') 0 0 0 0 0 0
0 0 0 0 0 0 0 0 0 0 0 0
S. Which of thl following performlnce Influence. would have the mOlt nejlatlve Ifflct on controllir perfonnancolf the controller wa. already experiencing 'Inadlqultl ,Ituatlon Iw.reneu·
1,. ....... ,, 1".::::.=. 1 ............ 1:::=. I" ....... ft. I" ....... . .....-- .. t__ """"_ . .w. __
_=-~ .. o --:::~::o -~:: '''0 -;:'7.:~:O _-;:::. .... o .".;~:::.:.": ...... _.. .._ ... ftK .......
o 0 0 0 0 0 o 0 0 0 0 0 o 0 0 0 0 0
6 . Which of the following performlnce lnnuence. would havi thl mOlt "eoatlv. effect on controller ,..rformanc:. if the ClOntroUer wa. alrudy ex,.,..lenc1ng - Inad~uate communication '
o o o
Demographic inrolmlltion
o o o
1. PI ..... etect your aoe group:
Ou ........... . 0 .. · .. 0 .. · O UM 0 .... 0··· 1. Glndlr
O ·~· 0 '--'" 3. PI ..... atect your country of wortc
c::::::J
o o o
o o o
o o o
4. How many y ..... of exper1ence do you ha.e In thl. occupation? C- --5. Are you currently I tra in .. ?
0 ..
o o o
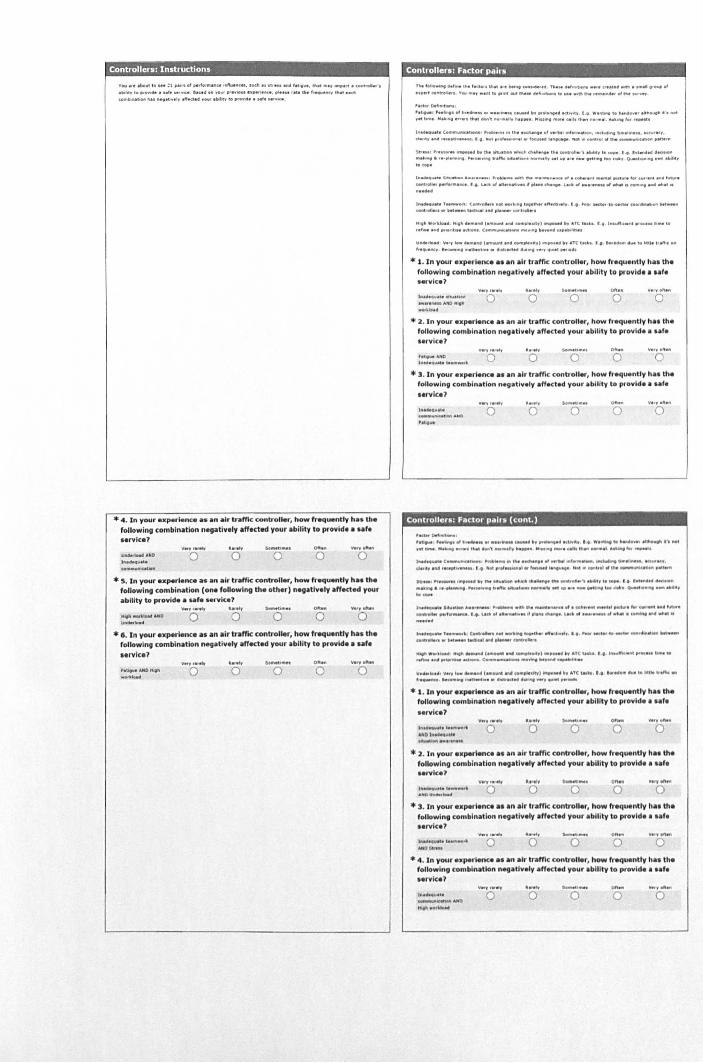
Controllers: Instructions
You .. *vt t o Itt:l .... ,.1 "rfonn.nu ,"fk.Iit"UI. ,IKII .. tl1_...., f.' ...... ~ "'., ~. _ ...... , • bol"" t • .,..... . -..I. " ,,,..,. e.,. eI ....... '" __ "'-_fln. "",.w r ... ~ "_.ftC'f' rNt • .dI
(OrfI~""bOf\ ...... ,..,._el, 1tIto<t. 1II ._ .bolle. , • ..-.1 .. .. I. "_.
* 4 . In your experience ••• n air tr.ffic controUer, how freq .... ntly h •• the following combination negativ.1y affected your ability to provld. a .. f. •• rvlce?
UMti ..... ND , ...... ".,. -_ .. .... -o • 5 . In your e.".rienc:e ;II. an air traffic contf'O ..... , how frequently ha. the
following combination (one following the other) negatlv,ly affected your IIbility to provide a df. Mrvic.? ..... .....
o o * 6. In your uperience .s an air traffic: controller, how fr~uently has the
following combination negativety affected your ability to provide auf • • ervlce., .... -o lO' ... ~
o
Controllers: Factor pai ..
,he ,..10 ...... "'_ v •• fed .... thot ........ c .......... Tho .. .." .. ,~. _'. tI'O., ............ 1 ....... ..
,.,ett eoll""",". t'w "'J •• nt t. ",1ft( _ tfI.e .. _fi.ot_ .. w • • 'tll tIM ._" ..... '" III ..... .,..
'..ct" Do"~ • • • tI .... , ' •• 11,..'.,' .............. ,,_ u .......... ...-I ...... .ct,. ,,,, f • • "hl\tJftt t .... OI4o_t • • " ...... ". IIOt ,.t b_ ..... Iu ... . /TW, tto.t"" ... , ... u, "" ...... ", ........ -. Utlt ,10.,. ...... .t "'''III, for ",..at. ,,, .... ,,"". e_"Nt .. _· " .. It"" Oft Ih .... duo ..... 01 ft.". 1 "" ...... "' ..... , _ ....... b ... I, .... , u(\Wee,. ~*''''''_0I>t~' _ . c ..... ...-_ _ . , .. t_ .. lI ... \HIIIt _ .. ~..c"the_K __ " ....
"'"-r"' ..... • ............ hltotwtu.o_ ... od>do'"" ... th.--...,.., ·.-....cyt._ I .e t~l ....... I11_ M ...... , ..... . _ .... ""c.o .... , Ir."'" _tl_ ........ 1'" Nt "" ... _ eeu .... '" II....., ~_""' .. '" .1101,,'1' .. -I" ....... t. s~_ ...... _ . ", .... __ II . . .. _ .... "C. tf . UIIwo . nt .. -... 'K'llKO ..... C ... t_ .... f ... "," Wftt ............. "'.IW.. r, lKto"' .... M __ il"_tdloo ..... Udo"' t • • _"' ....... ~ ............ t .. II .... .
1 ..... ......., , .. _~ e ................... _~, ... ~tfI ••• fflfdl .... .,. t. , ~ tI(t .. . ... ...a. ~"' .. _ ........ ,., ......... kt_t~ ......... _ -'-, .....
M" .. W.nloMti l ""II .. "', ... It_..w _, .... ty) "" ..... IJy "'e tub I. h •• ,,"" ...... ree_ 11_ t. ...... IWII .......,'- Kt1_ e_",-.t __ . 111, INyeA4 c;If . .. lotIet
U ..... rIo*ll v..., ........ fIIIIl_"""' • .,. _ .... "" "" ......... ' ATCt ..... I,. "''__ __ 1. Iotu. t, oHoc lit , ........ My ""'"" ... 'n.tt"'~ ...... "'M.t . ......... ".t' .. ~_ ....
* 1. tn your experience.t an air traffic controller, how frequently hat the foilowing combination negativ.ly affected your ability to provide a .. f, .eryic.?
1."' .. 11 .... _ , .. '" "" •• I\HIIANOMith _ ..... ,
"..., ...... o
..... o
.2. In your experience at an air traffic controller, how frequently ha. the following combination n-OlUvlly affect.d your ability to provide. la', •• rv ice?
Of'l . ..
o o .3. In your •• perlence ., an air traffic controller, how trequenUV h •• the
following combln.tlon neo.t lve.v .,tee-t.d your abltitv to provide • •• t • .... let?
I .... '''' .. ... ~ o o
..... -
Controllers: Facto. pail . (cant. )
' __ Oofo......-, hbfvo l ''"Me,., , ..... " ...... J ..... c..-M'" .,.,.. ... " ..... Cy •••• MoAt n lI __ t .II~ ...... , ...... ................ u..tlotll, __ ..... ""',.." 1ok ...... _.P .. 'hM _ .... ' .... IAf,., .... "'.
1""-"",'-'(_ t_ ~ ....... I .... -.~.tt ... r ........... "'~. ""'..,..ttoNfilWt ... _M'f, eMf", ~III rKoHt.'I--. t. 111M ",.t ....... ", .I~ ............. WI ""I." filM ~ Hft lIotl",fI
" ..... , "'_' ......... "" "" ........... ..n "'~'''''~ ...... o4oIOIo4't ...... t... flt.fl.4lttf .... _ .......... _ ... ~ ... ~ ..-tHlltotu ..... __ "" "' lit .... _ ......... "" ..... 0..-""" _ .-01., .. -I .. ~ .... ... II""""" ..... ""' .............. "tht ..... fI~."."" .. .-t ... .". ....... " ... (~,.... .... """' • .......... f_..u. •.•. lMt " . .... ....u. .. illl"If,"~. IAIt' '" ••• ~ tI.twot .. ~1IfIIII"'1t"
.~ ... , .. _~ e...-~ _ -'UtIf ' .... u--... , ......... ....., Mtteot ,,_ ... _ ..... _ Mt_
~ .. IMt_~""""""'~"""" ...... fI . .. ~ ... "" ........... I.""""" tlllll _'It.",) ... ~ .... ATt. .... , . ft. I ...... " ..... '" ""'~ . .. Ii .... rttfi.oo.e .... ",oOf'It_ ., .. _ C-O"'..-t __ ...... It., .......... _ "' ..... 1 ..... v,u, s.. "-___ 101M"", aM _~.,ty) tI-.,....!II h IlTC t ..... _ I t , ...... ~ Nt "hit" h.ltI,.,. ,.,....,. ~1oIt -'.t"" ... . .. MV~" W"",,,,,,,, -""...-...
*1. ln yourexpertence .. an air traffic controller, how frequentlv ha. the following combination negallvely affect.d your ability to provide ... f • •• rvlce? ...... ,...." .... ....
o o o • ::I. In 'lour •• "eMMa •• an air traffic control"r, how frequ.ntly h.s the
foilowlng combln.tlon negatively affected your .bility to provide a •• fe .ervlce?
II .......... ' I"~.' . .. t .. __ 0 ....
o * 3. In your ,,,pertence •• an air tr.ffic: controller, how frequently h .. the
following combination n.gatlvely affected your ability to provide a .af • •• rvlc.? --o o o
* 4 . In your e.fMrtence •• an air traffic controller, how frequently ha. the following combination negatlv,l, affected your ability to provide a .. f • •• rvlce?
l"""\Otl. (~ ... . JtO Ko,,,_UIoM
. ...., o
... .t,_ .. ~ o o
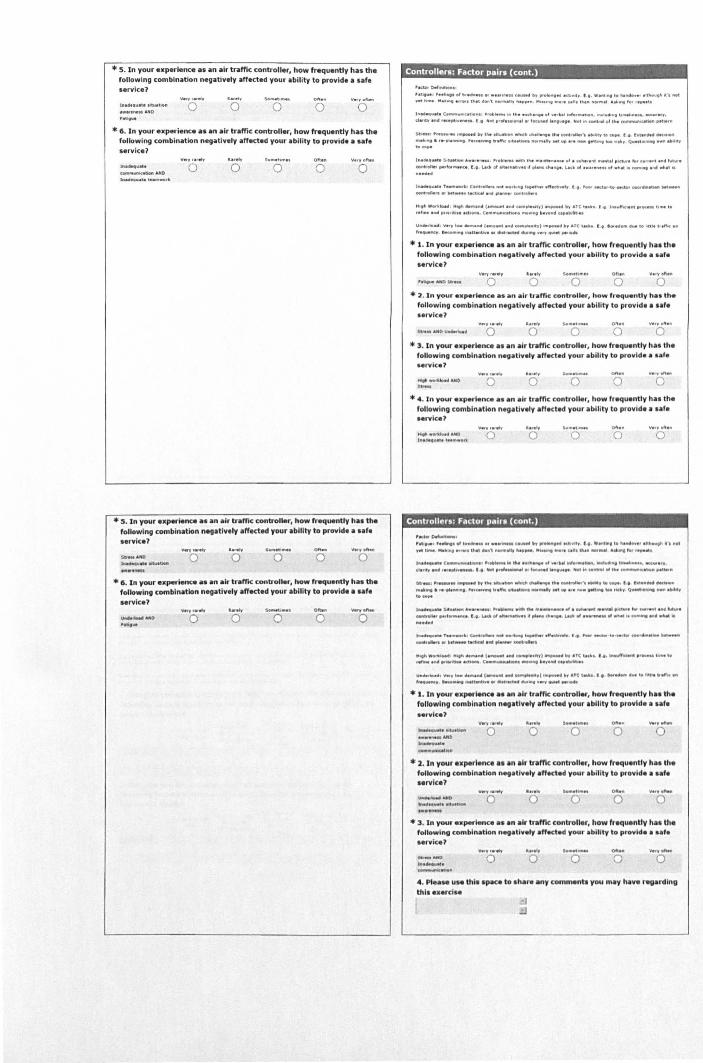
* 5. In your explrience as itn lIir trllfflc controller, how frequently has the following combination neg.ativlly affected your ability to provide a safe .ervlce1
s."'-t>_ 011\, ..
a a * 6. In your experience it. an air traffic controller, how frequently has the
following combination negoltively IIffectld your ability to provide II .af. .ervlce?
v .. , ••• ..., . .... 1., ott ...
a o o o I" ........... CMI __ ~.t.HO
I ........... ttt. __ rto
• S. In your experience II. an IIlr traffic controller, how frequently ha. the following combination negatlvlly affected your Ibillty to provldl I nfl 'Irvice1
'0 o Oft"
o 0' v .. , ell ...
o * 6. In your experience ... n air tratfk controller, how frequently hu the
following combination nlgativlly affectld your abll1ty to provldl a .. fl •• rvlcl?
y .. , • ....., let .... ..... ....... ~ o a o o a
Controllers: Factor pair. (cont.)
'"""o.fu,.t_Il .. t .... ' ,..~ ef .... ... $1., •••• HI ... u ....... II, ,........t M;t,w.h • g . W_'nti Ie ............. ft ......... IIi ... " 'I"I't b_ " .............. ,n., 1IMfI" -....H, ......... ", .. , .. , .... '. ~IL. ,~ ..... __ , ........ tOf •• ,..11
1 ........ Il. C. ___ I ...... "loll"''', , .. 1'" • • cto . ..... 1 .... IMI."" ....... I ..... 1ftQ_ .. , 1'...-...... , """ ... "',. ct.nty . MI,t!QtIt •• _ .... t "-t, ....... _., .. ,_ ........... Net ... ~oIthe_'"u~,.,t., ..
kt-_ : ..... ..,/" I ............ .". ......... " wtItc .. (fl.., ..... tIw c...u.u. ' ...... ry" w..- I. 'dlft'" 11«,,_ ... .... ...... I4t_ ........ c.. ...... "'''''1( .""""'~ " ...... ., _ .... __ --" .... _ ",,", QvofM ....... _ . "t, 1.,-IMIIe._. &,' __ ..... "" .. : .... ~ •• 11" 1M "' • • IIt .... _ .1 . ~ ... , ""_., ,oa...-..... " ...... _ .... tvilOft _ .... Itt ........... _ ••.• . l..tdo of .1ttrf\M ...... tf "' .... c. ....... . . ltc. 01 .... , . ..... of.hlol .. _ .... ",III ..... 1 ..
" ..... 4
, ...... "'.'" T .......... I c._ ..... __ " III, .... u ... .t't.etl ..... ., I ...... Md. ... ,. ""_ ~""tt_ Nt_ .. 0MlJ,,"-"., w.-", \M;tKII . .... "' __ tr.Iow.
H,g~ ......... . " .. " ..,... ..... (1"' __ .1'14 ,_,Ie •. I,1 "", .... !ltv AtC t .. h . f t I ...... "oc ..... ,._ t,_ t. ,.,_ ..... ",,,,,,,,.Idl_. Ceoo\ ... _"""*,, _."" • ..... 1'14 Ull •• ' ...... u" ......... , "'.,., lew .......... {_ .......... _"'ntvl _ ...... h .rr.tc u ... I .t ....... _."" t. I.U'" t •• ffc_ ,....~ ""' ___ tltfItN, .... rM;t ... lI ......... .., 1tV""_'"
• 1. In your e.porfence a. an air traffic controllar, how frequently hal the following combination neg_tht.'V affected your .billty to proyide ••• fe .ervlcl?
v." ,ftefl
o o * 2. ln your experief\Ul ... an air traffic control"r, how frequently ha. the
following combination negatlvlly affected your Ibility to provldl 0 nfo •• rvlte?
onlll
o * S. In your experience a. an air traffic controller, how frlquently has the
foUowing combination negatively affected your ability to proyld •••• fe Hrylc.l?
..... ., r .. .,' .... o a
• 4. In your experience a. an air tr.me controUlr, how frequently h ... the following combln.tlon nlgltlv,ly offectld your ability to provldo I nlo •• rvlce? ...... 0fI • • V • •• eftlft
o o o
Controllers: Facto. pail. (cont.)
'.Wo.f'-k_1 ' .... , ' ........ of h .......... ""-" , ...... ,", " ........ 111 ,," . ~oty It Wt10tlflf ,. h,."" .It ..... h •• fllltl .,... '"" .. It.,.. It"" thM .... , _"' .. .., .... , ..... 1III ... "'tI _. cell. u..11 __ .1 MiIlIflot .... ,...... ... ,
1~.( __ ~I ............... ~., ... , .... """., _ ...... IttdwoII"'''''''''MI • • ''-_M¥. tllnty"';ltoUI'4.l_l. 1iot~'...-.Ittf.wt.t4"fIt ......... 1fI_MII"ltw_oc..u..,~"".
__ l ... _ .......... ..,ttot_ ........ t( .. "' ....... ~.~·' ....... f~ ...... .. bl~4~
"' ....... ,.. ,..1Wt1ftt. ,..._ .... 'tI"C ........... _......,. "' .... .... iMI ....... , •• , o--e-.... - ... , .. -I~M. IItt_ ' ......... 1 ~ .>tII'" "' .... _Meet . ..... ..-t ....... tt;l.lChIfI ... hi. , ... """" •
_~, .. f_""" I: • • 1..Id .,tIII .. _tlY .. lI,... do."... ....... 11 •• __ '" .""1.-.... eM ...... Ie
I .......... T .. --"' ~,.... _ --"-t~tff~. l .. "'-_ ~ _4111111 ••• 1_
UoIIl ....... tt ......... tIIdJUI ... ~.-b ......
",." ."'!eM " ........... I'I1II( . ..... tM ~ .. it, .... "..... loy 6fC "".10., I • • ,_me,.fIIt II"C. ... ll_ t. '''''''''' .. _ItIM~ c_~_",..." ......... '.110 .......
• 1. In your 1 .. .,...Jence •• an air tr.fflc controUer, how frequently h •• the following comblnltlon negltlvlly afflctod your obillty to provldl 0 .. ,, .ervlce'
......... " ......... -
... _ .. .t.NO ..... ""'-. -_ ... .... .., a
.... a a
• 2. In your e.porlence I. In Ilr tramc controller, how lrequently hi. tha following comblnaUon n-eaUv.'y .ffectld your ability to pt'ovlde • uf. "Nice? ......
o * 3. In your •• .,.rienc. a. on air traffic controller, how frequently has the
fotlowing combination negatlv.'y .ffect.d your ability to provide a •• f • •• rvice?
.... t,
o 0" .......... o - ,-o
4. Pie ..... us. thi' space to .har. any commenta you may Nve ~.rdfng thl. ex.rcl ••
I
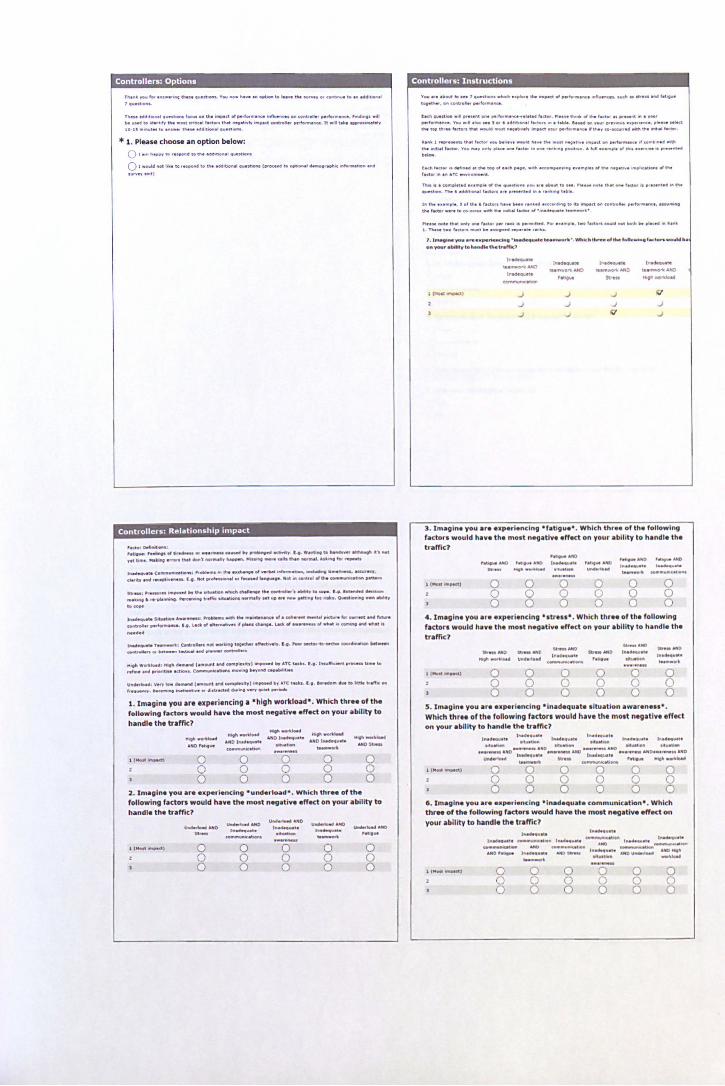
Controllers: Options
,toH •• H't'oll'. I_M1IIfI,'_ I'" u.. ""put 01 " rlOO .... _ , .. n_ftC •• eft c",lI.II ..... rlo.......u. ,.1141"'9._111 bcooM4 t.od ... tlf., .... _tcnb<.' .IId ... ' .... I'I ........ " 'M • .ct~~MI. It."' t..Ic ........... tII.,
* 1. Pl ..... choose an option below: o t_h . ... .,t'I ~",... .. t.u., ."".t' .... 1 ~_ 0,-""" "" ItI"!I r"~" tt\, ""'1I'''''' ._'_I~ ho...--.. "-.r.eh,c "' ........ bo .. . ....
'lII"V'wu,t)
Controlle. s : Relationship impact
,-~,
'.tot-l , ....... ., ~ .. ... t_ ClYMIf.., ........... .n-t' r .• . w.""", t .... ......-. . ....... It"'" ,.t b-. ""III" •• ,.,... IMt _, .... r ... 1tT ",.,.... "",'11, -. uBI 111. ... -""'-,... .... flo ~
1 ....... "'.t.C .... "'~: "~ . ... th. "'do. .... oI ....... "'t_.~IIIM'I~b""' ..... -.cw..ey. dao">ty .... rec ... i ......... I .o NoM ... -'-.' .. fKu0e4 ..... If ... Mot""'~flltn. __ ... ,.... ..
Sb_ : ""-_ "" ........ tM ___ -'*. .. ~ ........ dI>e """"'""Ioer' .......... "_ . ..... bt-aH "--....un, ..... pI.I'W'I~ . ... t....,.... Ir."" IIW.I __ "'e'" Ht II. __ .-n"". '" .... .,. o--t..-. _ ..... It, to_
I~ ... t. S.t\l~ ,,_.-, ........... lth tN_tftUNlI«". ~"-"'.....u-'" ~1A4Mw. tIftCnI ............ _ . . .. .. . l.c*"' .. _"'",f .. _~.LIcl..,.w_.,wtwot .. ___ .. aoh.t.
" ..... .. .......... '" 1'_-": c...tr.l ... 1'IOt -,"III, lOfIrlMf .""' ''''''' Lt. ,...MCQf .... wct.o _ .... _INt_ -~. ~- '-""' .... ""'-" ~ H"h .,.,. .... , " •• .-4'_"""" ", .. e.II'I,Ie .. t,1 "",.... '" "TC , ..... . " ., . '_ "1CJOeftt ~ •• ' b_ ..
rIf_ 1M ,.....,tlH .n-•. C-... II_''- - ........... ., ....... ~-
u ......... , Vtrt tew ........... C_nt.M _ ....... ,_ ....... ' a,rC, .. b. r t ........ .,. hllot1k tulht .. ..-.-. .. C4"'""'."-'_ ........... I>act ..... -_ ~.- .... ...
1. Imagine you are experiencing I -high workload· . Whic.h thr •• of the following fadors would have the most nevative effect on your abil ity to
hondl. tho troffic? Iot" .. ..t ..... -_ .... ...... _" .....
H.,tI..n ..... ' 111011'114..-..,
"'OI~ONIto "1110 "",,"III.t. .... -UlO' .... »> -' "0_
l lMMtw..-t1 0 0 0 0 0 0 0 0 0 0 0 0 0 0 0
2 . Imagine you n. experiencing ·underload· . Which thr •• of the following factors would have the molt nevativ •• ffect on your ability to hand Ie the traffic?
~""'''''''''O ~""'''''D ' ...... _t. u ........... oUID _ ...
1 .......... -- - _. ,-~
lIMMt_,....:cl 0 0 0 0 0 0 0 0 0 0 0 0 0 0 0
Controllers: Instructions
,,_ .... ,lIeut t. ... 7 ._.'-. _ht<h .. ."... LIM _..-ct 01 .....,r.eftC. "'''"'''''; ... ,1oId\ II ...... ..,.,. I .. ..., .
t"""""._c ... tr ..... _,.",..""'.
[1(11 .»>" ........ 11 ...... 1It In. " , ... _ ..... , ...... f.d .... ....... th ..... of I .... IKI .... ,. . .... t ... . .,_
~.IIC_. " ....... .... M.' .. ' ...... _.1 f ... too. ... . II ......... 111...-....-. n" ... ..ee. ,1 .... ,,'Kt the I .. tfIt ... lid: .... 1Not ....... _ It ..... trt.ty w..p.aa ,_ ~_"'._" t ... , w -1CWfTflI ..... no. _ ... '-.
1;."" I •• ,. ... ..u \h it feet",.... ..., •• ~ . _I .... " . thO' __ 1I. t ..... ' ..... d III ,,""""II\C. ", .... ~ ...... . "h
the ifill .. , l..a ... YMj .... " .,,1_ .,1 ___ l-.ct ........ ",I\~ '''' ,..'""' ..... . "'" .I ..... 10 of!h ......... , ............... ... --lcch l.a .... ..,_ fl dot ,_. "' . .... , .... . ·n , .oe_.", .... ... ",,141. of the ..... tl . . ..... hc:at_ "'1 ...
f.ctf.<,".II . TC .... .. _rot
TIIo-. •• " ... Ikt . . ... Ift". If tilt. ._ot ..... , ... ,o_,Mvc II . ... 1> • • __ • dooM _ 'Mt ... if , '_"' lIt,. 11\ U .. • _t_n..6 ..... '_" _.., ............................ tt._. III ttM ...... '10. J .1 the 6 I.a .... 1'1 ..... ".11 .. n ~ • • I>CCCIt.III, II itt _Hft", COl'lt,..II., " ..... "'. ftC • • "'''1fltftI u..f_ ..... III~_ ... dootto._"' I_tl·'~.t"_.~·
1. I-oI_yv!ot. ,.. . .... rMItdn.·~'ult. ' • ......--k·. Whlckt..,....'"" ' .I .. wtftelect.A_ ... oiI ... _veu, · bMM.yt .... ftd ... ... tr.flk't
,,-1~~ I .. ~te ,,-
te~AN!) Cllm'll . ltt N It) ho..mwo"c ",",O c .. ."..O\:AHO
I"~~. "' .... " .... HlO~ "f'ckIM
I(MoIt~ .J .J .J Q
.J .J .J .J
.J Q .J
3. Imagine you ar •• xperienclng 'fatlgue' . Which three of the following f.ctora would hlv. the most negatlv, effKt on your ability to hind Ie the traffic?
'.""""1'10 ' ... ..,. ..... 0 ' .. .. _AIiO ,,,,,,,""0 r._ ..... 1tJID I"" .... ". ," ..... ",., I ............ t. """'-~ ..... te.",,,,r"
1 1 ... " .... ,.nJ 0 0 '·0 0 0 0 0 0 0 0 0 0 0 0 0 0 0 0
4 . Im.glne you a re experiencing ·str ... • . Which th .... of the follow ing f.ctors would have the moat n.gative .ffect on your .blllty to hindi. the traffic? -- _ .. 0
Itr ... "..o '''' ..... '''.1. ..... .".0
' n,4"tMl. "II"""" .... - • Utt4.,I .... , ........ _""""1'1 , .......... .-... " 1 ( ......... ..-«1 0 0 0 0 0 0
0 0 0 0 0 0 0 0 0 0 0 0
5 . Im'gine you .r. exp.riencing ' inadequlte s ttuation .w.r.n .•. ·. Which thr •• of tho follow ing foctors would ha •• tho mOlt nOll0tl ••• ffoct on your ability to hand I. the traffic?
IMMuIt. 1".:.*:.=. ' ...... 111.'. 1:::;:1. 11I ........ t . I~ .... ONII • ..t ... _ __ .. '''Il10 ." .... - ••• _.t.MO "'~ wt&N ___
"=:.-:0 I~"'=. '-;.= ... 0 11I ..... ".tI .... ,::: AHo,:~~~:: 0 "'0 0 -0- 0 0 o 0 0 0 0 0 000 0 0 0
6 . Im.glne you .... experiencing ' Inadequat. communication' . Which th .... of the following facto,.. would h~ve the mOlt n*'Qative affect on your ability to handl. the traffic?
1 . .... "It. ~=.:.. I ..... "'.'.
~=:.. '-.::It_ ~~:~ '110 ..:.::"--=::' __ OCcl_
."0 '.tIfW 1=. AltO..... '='· "..0 uMI>o''-f == o o o
o o o o o o
.. -o o o
o o o
o o o
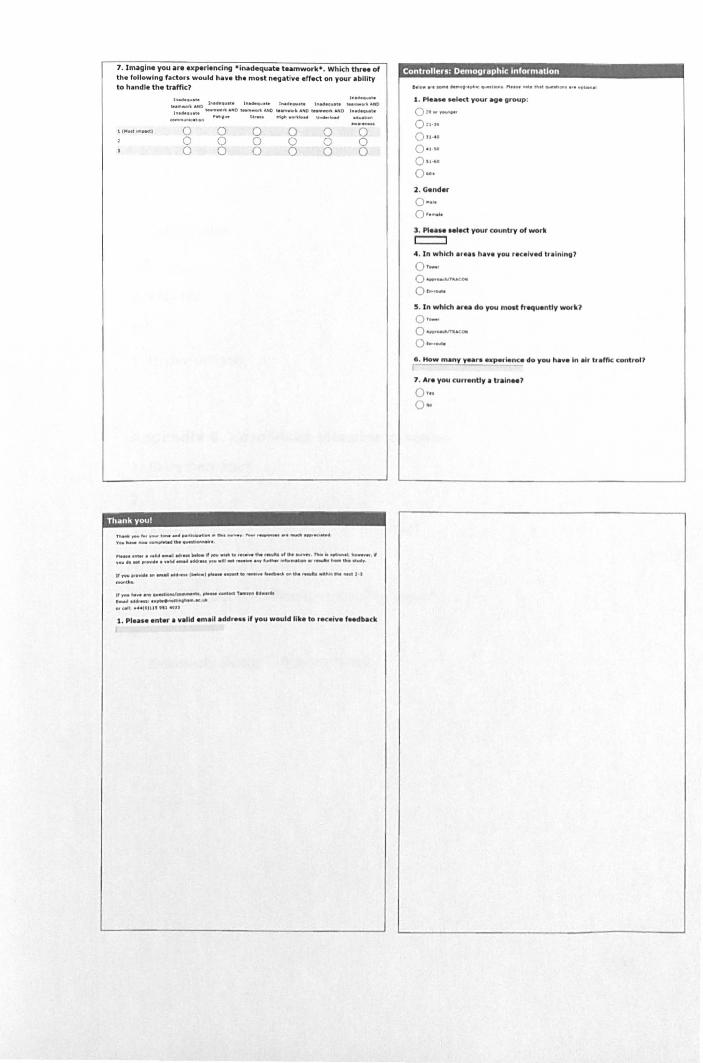
7 . I~gln. you are experlendng *iNldequate tumwork". Whkh three of the following factors would have the most negative .n.ct on your ability to handle the traffic?
~=·::o 11\ .... "". 11\......... 1"" ... "It. lftMefI"u, ~=:-:o 1 ..... ' ... 1. ,--_ .... " "0 1 __ '10 AHO t..",-,: iIoNO ~ ,,"0 1 .......... 1.
Thank you I
o o o
'-0.... "." .............
o o o
o o o
o o o
o o o
T ...... ~,... _ ,_ ... "'I~- - ""- ---• ., "-.-- ... ~ ___ y- .. ---~ ..... ~-.
o o o
'Ae .... M ...... IHI ...... ,_Iioftew"f'M onVItIt •• _ .... ,..-IbefltM-., ,,. ...... _ . l l ""-, 1f ,.v"MII......,... • •• IMI--' ...... 't'WwtII_.--.. ... fIattMo ..... ~.,-* • ..--ttIIII .. ."., "...., ,... ..... HI _M ""r_ ( ..... ),-. .... ,... .. r.ut ........ edt .. u..~. _ .. ,,, , ... ftt" 2· ,
_th ..
1f ... 1w ... ..,......-J ___ . ... _~ T-.,II ... ..-.
f .... ~ ...... ""'" ..... "-.M . f1/41 Ofull .... (O)lIl ... . . U
1. Plea •• tnt ... a vand tmalladdr ••• lf you would Ilk. to recelv. , .. duck
I
Controllers: Demogr aphic information
1 . PI •• se select your age group:
O:· .. ~ 0"·,, a u ... . 0 .. .. 0 .. ... 0 .. · 2. G.nd.r
O hM.'. 3. Pi ..... .teet your country of _rk
c=:::::J .. . In which .rUI hlv, you r.celved ' rllnln01
o~,.,co-
0 ·_ ... · 5. In which ar .. do you moat frequently work?
0 '-0--"", .. 0·_· , • • How mlny yea,.. .x:per~nce do you hlye In Ilr traffic control?
7. Ar. you currently It"ln .. ?
0, .. 0 ..
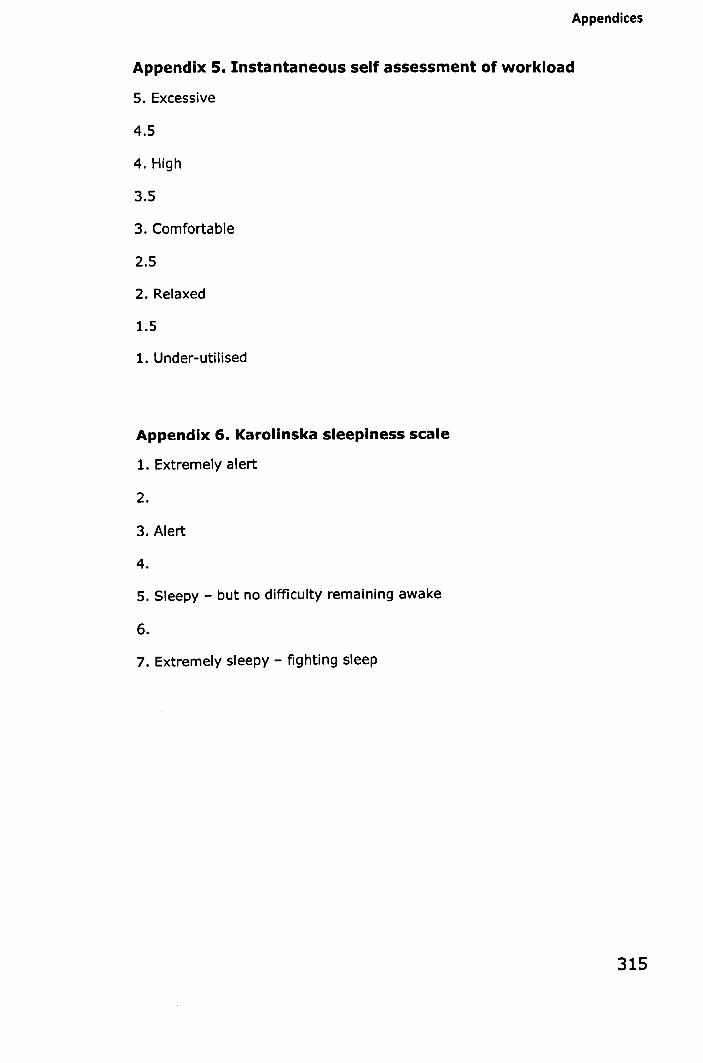
Appendices
Appendix 5. Instantaneous self assessment of workload
5. Excessive
4.5
4. High
3.5
3. Comfortable
2.5
2. Relaxed
1.5
1. Under-utilised
Appendix 6. Karolinska sleepiness scale
1. Extremely alert
2.
3. Alert
4.
5. Sleepy - but no difficulty remaining awake
6.
7. Extremely sleepy - fighting sleep
315
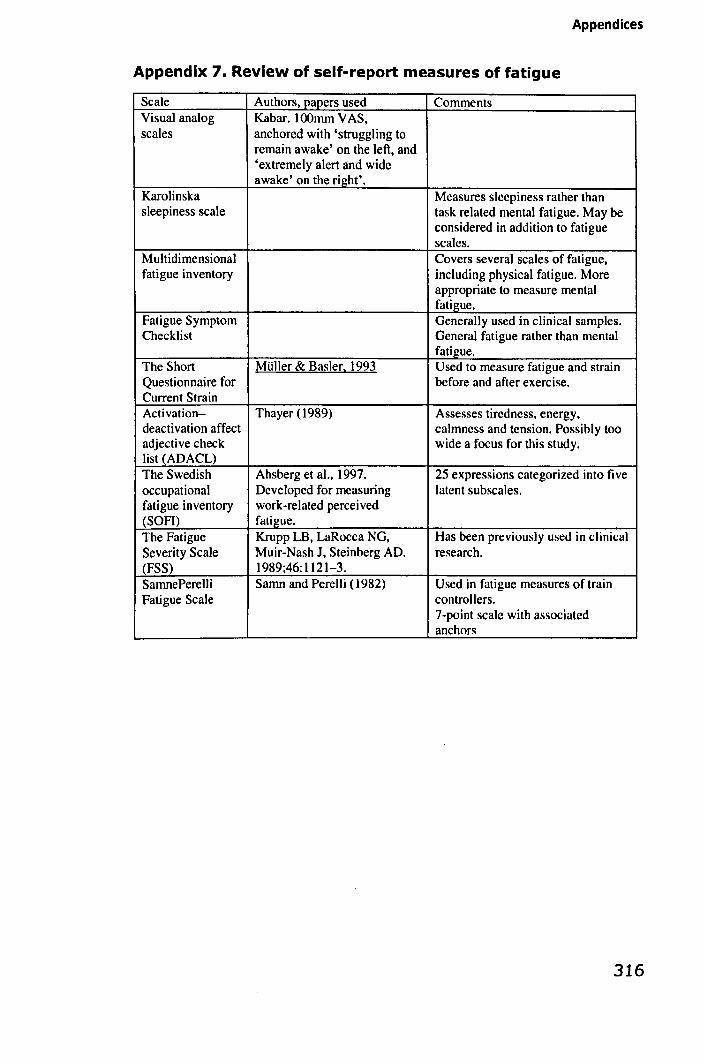
Appendices
Appendix 7. Review of self-report measures of fatigue
Scale Authors, papers used Comments Visual analog Kabar. l00mm V AS, scales anchored with 'struggling to
remain awake' on the left, and 'extremely alert and wide awake' on the ri~ht'.
Karolinska Measures sleepiness rather than sleepiness scale task related mental fatigue. May be
considered in addition to fatigue scales.
Multidimensional Covers several scales of fatigue, fatigue inventory including physical fatigue. More
appropriate to measure mental fatigue.
Fatigue Symptom Generally used in clinical samples. Checklist General fatigue rather than mental
fatigue. The Short Milller & Basler, 1993 Used to measure fatigue and strain Questionnaire for before and after exercise. Current Strain Activation- Thayer (1989) Assesses tiredness, energy, deactivation affect calmness and tension. Possibly too adjective check wide a focus for this study. list (ADACL) The Swedish Ahsberg et a\., 1997. 25 expressions categorized into five occupational Developed for measuring latent subscales. fatigue inventory work-related perceived (SOFI) fatigue. The Fatigue Krupp LB, LaRocca NG, Has been previously used in clinical Severity Scale Muir-Nash ], Steinberg AD. research. (FSS) 1989;46:1121-3. SarnnePerelli Samn and Perelli (1982) Used in fatigue measures of train Fatigue Scale controllers.
7-point scale with associated anchors
316
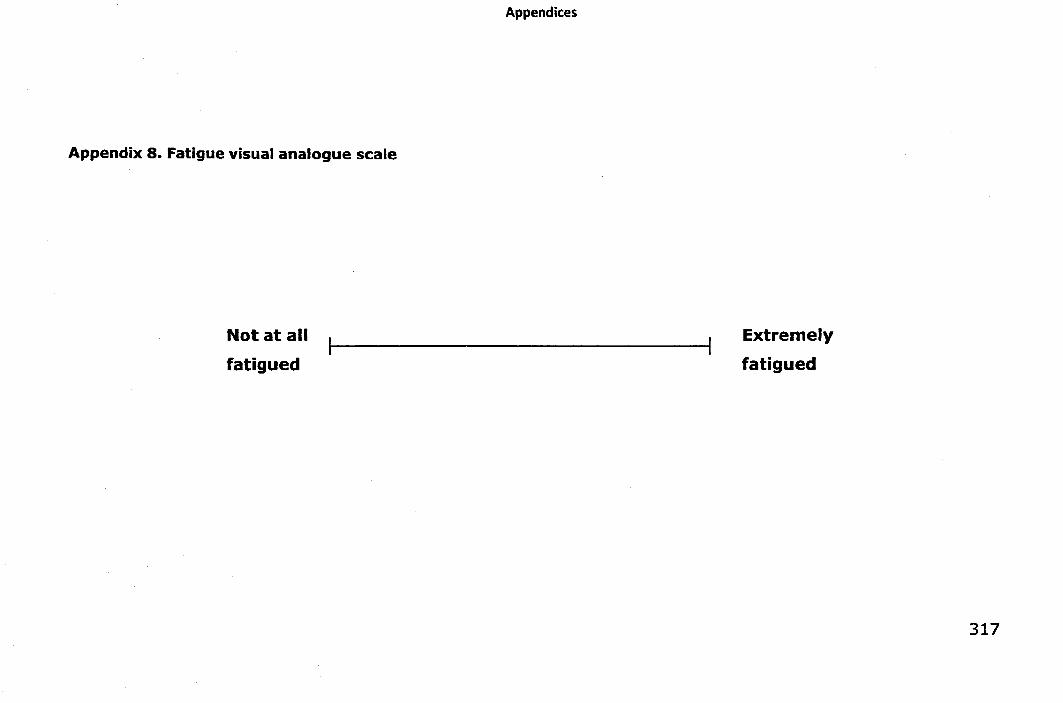
Appendix 8. Fatigue visual analogue scale
Not at all
fatigued
Appendices
Extremely
fatigued
317
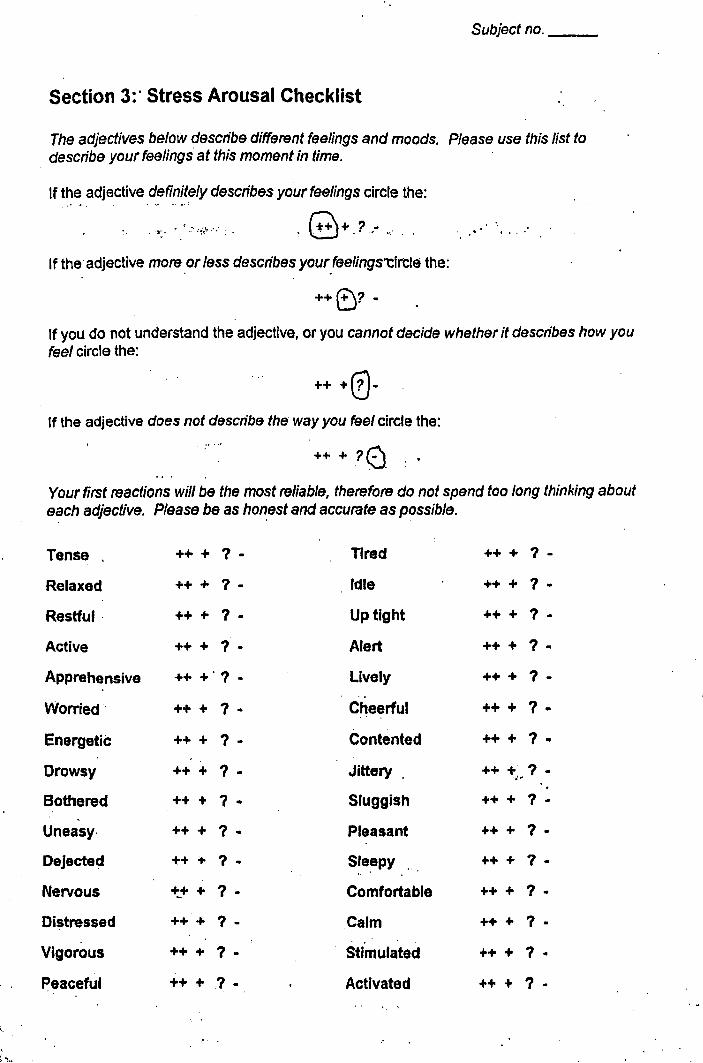
Subject no. __ _
Section 3:' Stress Arousal Checklist
The adjectives below describe different feelings and moods. Please use this list to describe your feelings at this moment in time.
If the adjective definitely describes your feelings circle the:
, 8+,7.- .. If the' adjective more or less describes your feefings1:ircle the:
++B? -
If you do not understand the adjective, or you cannot decide whether it describes how you feel circle the:
++ +0-If the adjective does not describe the way you feel circle the:
++ + 70, :' Your first reactions will be the most reliable, therefore do not spend too long thinking about each adjective. Please be as hon,est and accurate as possible.
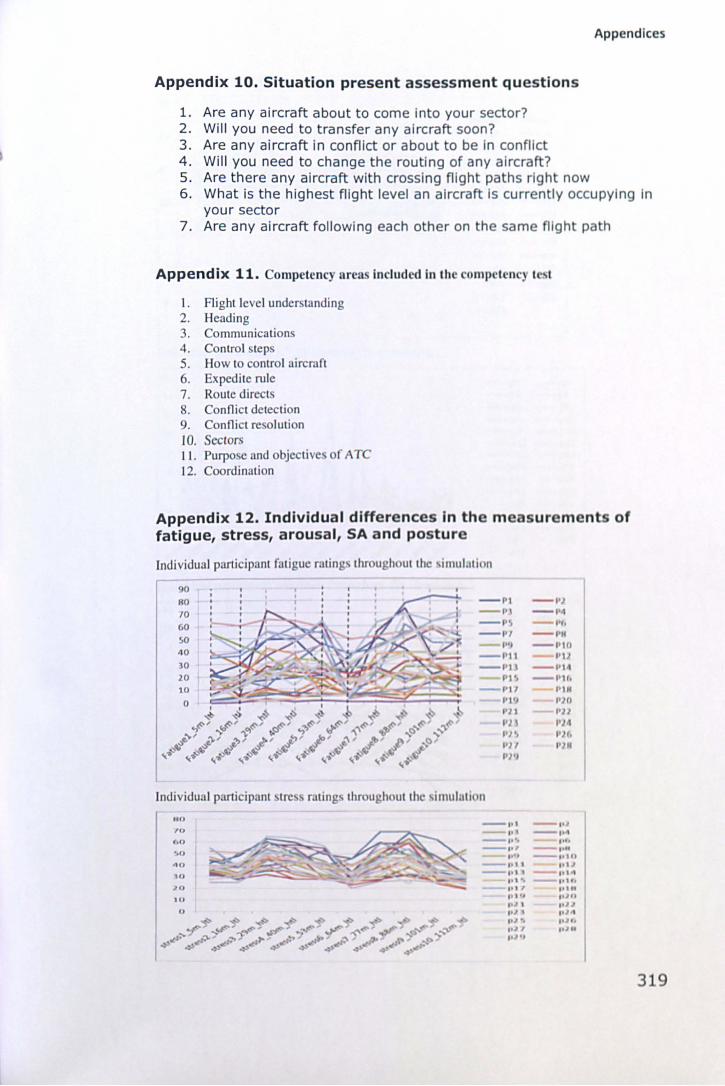
Appendices
Appendix 10. Situation present assessment questions
1. Are any aircraft about to come into your sector? 2. Will you need to t ra nsfer any aircraft soon? 3. Are any ai rcraft in conflict or about to be in conflict 4 . Will you need to change the routing of any ai rcraft? 5. Are there any aircraft with crossing flight paths right now 6. What is the highest flight level an aircraft is currently occupying in
your sector 7. Are any aircraft following each other on the same fJlgh path
Appendix 11. omp t n y nr in luded in th
I . Flight level under land ing 2. Heading 3. Communi ation 4 . Control tep 5. How to ntr I 6. Exp di te rule 7. R ute dir t.
8. Connict dele ti n 9. Conni t re oluti n 10. eclOr I I. Purpo c and bj A 12. oordination
Appendix 12. Individual differences In th m fatigue, stress, arousal, SA nd posture
ur m n of
Indi idual pard ipant fatigu ratin
o 80 10 o o
4 0
30 20 10
()
Indi idual participant .,tre , ., ralins ., thr u.h
un ,., hU
' ,n
"" \(1
.In
'If
n
h ut th ' 'imul il l n
- I I - 1'/ - 1'1 - 11
- I ', - I'" - 1'1 - I N
- I ' - 1 111 - I'l l - I II - I' - I" - Itl ·, -I ' lt - I'll 1' 1M
" /U "II 11 III,
I')" 1'/"
- I" - t ') - I' - .,. - I·-· - .,f. --I" --I'" --.... - ,.t .. - ,,' 1 , ... .. -- tt" .,' ,
,11 " ", "I· 1)1' I."
11/-'
319
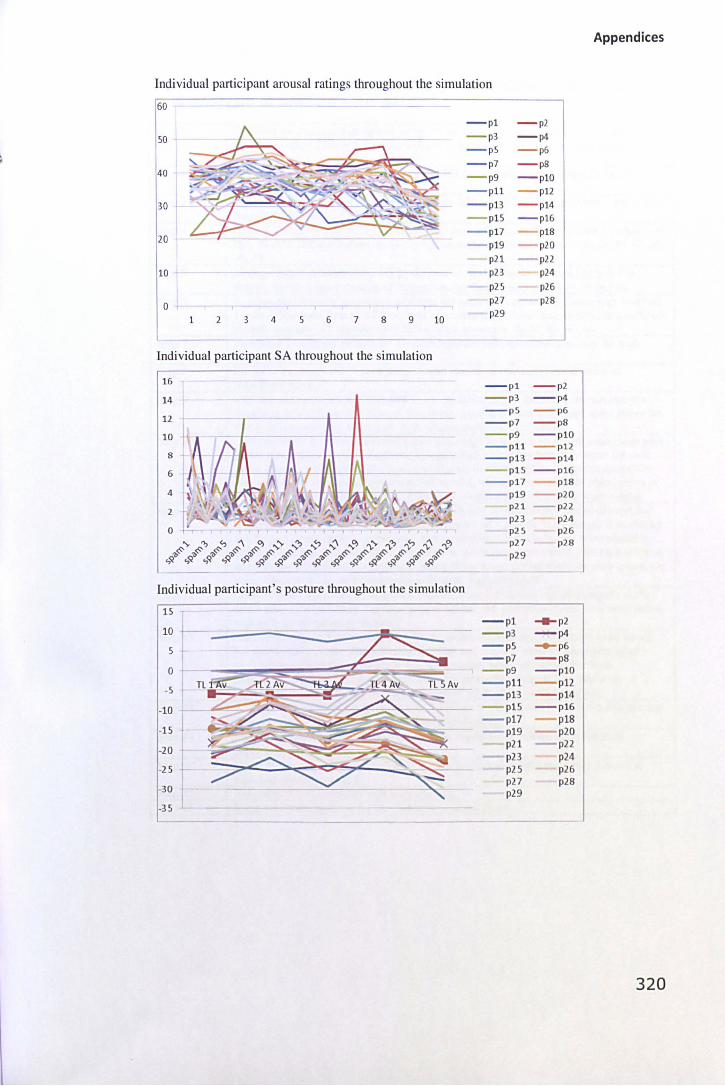
Individual participant arousal ratings throughout the simulation
60
50
40
30
20
10
0 2 3 4 5 6 7 8 9
Individual participant SA throughout the simulation
15
14 L
12
10
8
5
4
2
o
10
...,. '? <:l <$''\ <$'0) ...,."'" ...,.'? ~ .:;. ...,.0) ","'" '),'? ",<:l -V ","> 9'b<$' 9'b<$' 9'b<$' 9'b 9'b ~<$' ~<$' ~<$' ~<$' ~<$' ~<$' ~<$' ~<$' ~<$' ~<$' ~ ~ ~ ~ ~ ~ ~ ~ ~ ~ ~ ~ ~ ~ ~
Individual participant's posture throughout the simulation
15
10 t--~~~~ ____ ~~~~ __ 5
0
-5 TL
-10
-15
-20
-25 L
-30
-35
- pl - p2 - p3 -p4 - p5 - p5 - p7 - p8 - p9 - plO - p11 - p12 - pH - p14 - p15 - pl6 - p17 - pl8 - p19 - p20
p21 - p22 pH p2S p27 p29
--pI --p3 --p5 --p7 --p9 --p11 --p13 --p15 --p17 --p19
pH p23 p25 p27 p29
- p1 - p3 - p5 - p7 --p9 - pll --p13 - p15 - p17
p19 p21 pH p25 p27 p29
p24 p26 p28
--p2 -p4
--p6 --p8 --pl0 --p12 --p14 --p16
p18 p20
--p22 p24 p26 p28
..... p2 -p4 ..... p6 - p8 --pl0 - p12 --p14 - p16
p1S p20
- p22 p24 p26 p28
Appendices
320
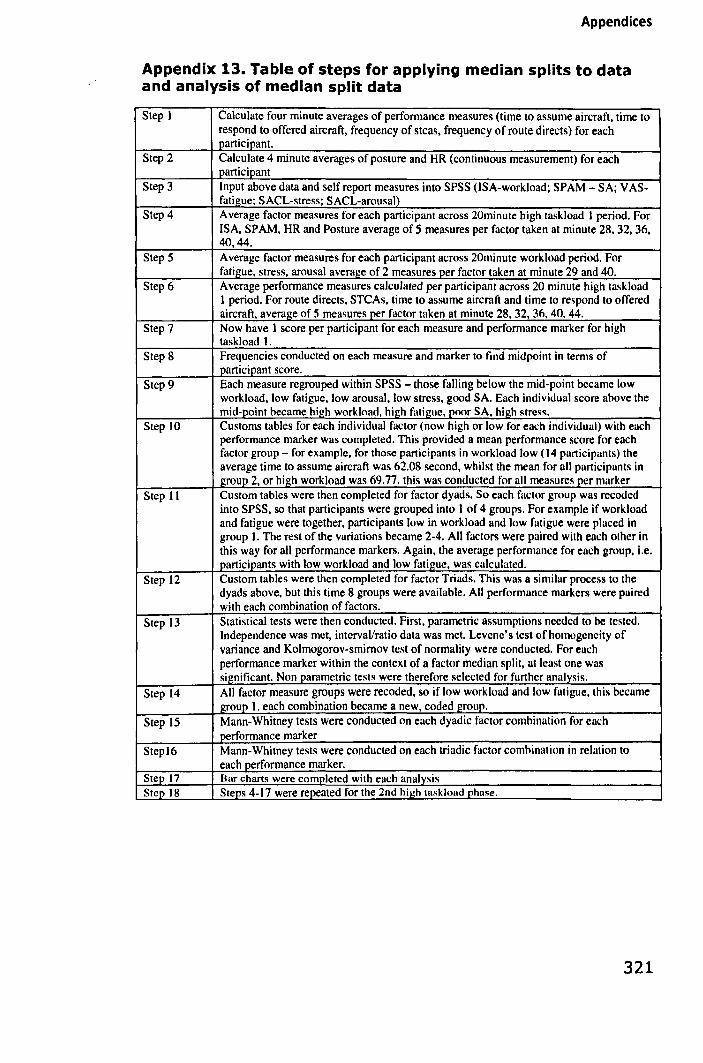
Appendices
Appendix 13. Table of steps for applying median splits to data and analysis of median split data
Step 1 Calculate four minute averages of performance measures (time to assume aircraft, time to respond to offered aircraft, frequency of stcas, frequency of route directs) for each Participant.
Step 2 Calculate 4 minute averages of posture and HR (continuous measurement) for each participant
Step 3 Input above data and self report measures into SPSS (lSA-workload; SP AM - SA; V AS-fatigue; SACL-stress; SACL-arousal)
Step 4 Average factor measures for each participant across 20minute high taskload I period. For ISA, SP AM, HR and Posture average of 5 measures per factor taken at minute 28, 32, 36, 40,44.
Step 5 Average factor measures for each participant across 20minute workload period. For fatigue, stress, arousal average of 2 measures per factor taken at minute 29 and 40.
Step 6 Average performance measures calculated per participant across 20 minute high taskload 1 period. For route directs, STCAs, time to assume aircraft and time to respond to offered aircraft, average of 5 measures per factor taken at minute 28. 32. 36. 40. 44.
Step 7 Now have 1 score per participant for each measure and performance marker for high taskload I.
Step 8 Frequencies conducted on each measure and marker to find midpoint in terms of participant score.
Step 9 Each measure regrouped within SPSS - those falling below the mid-point became low workload, low fatigue, low arousal, low stress, good SA. Each individual score above the mid-point became high workload. high fatigue. poor SA. high stress.
Step 10 Customs tables for each individual factor (now high or low for each individual) with each performance marker was completed. This provided a mean performance score for each factor group - for example, for those participants in workload low (14 participants) the average time to assume aircraft was 62.08 second, whilst the mean for all participants in group 2, or high workload was 69.77. this was conducted for all measures per marker
Step II Custom tables were then completed for factor dyads. So each factor group was recoded into SPSS, so that participants were grouped into I of 4 groups. For example if workload and fatigue were together, participants low in workload and low fatigue were placed in group I. The rest of the variations became 2-4. All factors were paired with each other in this way for all performance markers. Again, the average performance for each group, i.e. participants with low workload and low fatigue, was calculated.
Step 12 Custom tables were then completed for factor Triads. This was a similar process to the dyads above, but this time 8 groups were available. All performance markers were paired with each combination of factors.
Step 13 Statistical tests were then conducted. First, parametric assumptions needed to be tested. Independence was met, intervaVratio data was met. Levene's test of homogeneity of variance and Kolmogorov-smimov test of normality were conducted. For each performance marker within the context of a factor median split, at least one was significant. Non parametric tests were therefore selected for further analysis.
Step 14 All factor measure groups were recoded, so if low workload and low fatigue, this became group I. each combination became a new, coded group.
Step 15 Mann-Whitney tests were conducted on each dyadic factor combination for each performance marker
StepI6 Mann-Whitney tests were conducted on each triadic factor comhination in relation to each performance marker.
St~17 Bar charts were completed with each analysis Step 18 Steps 4-17 were repeated for the 2nd high task load phase.
321
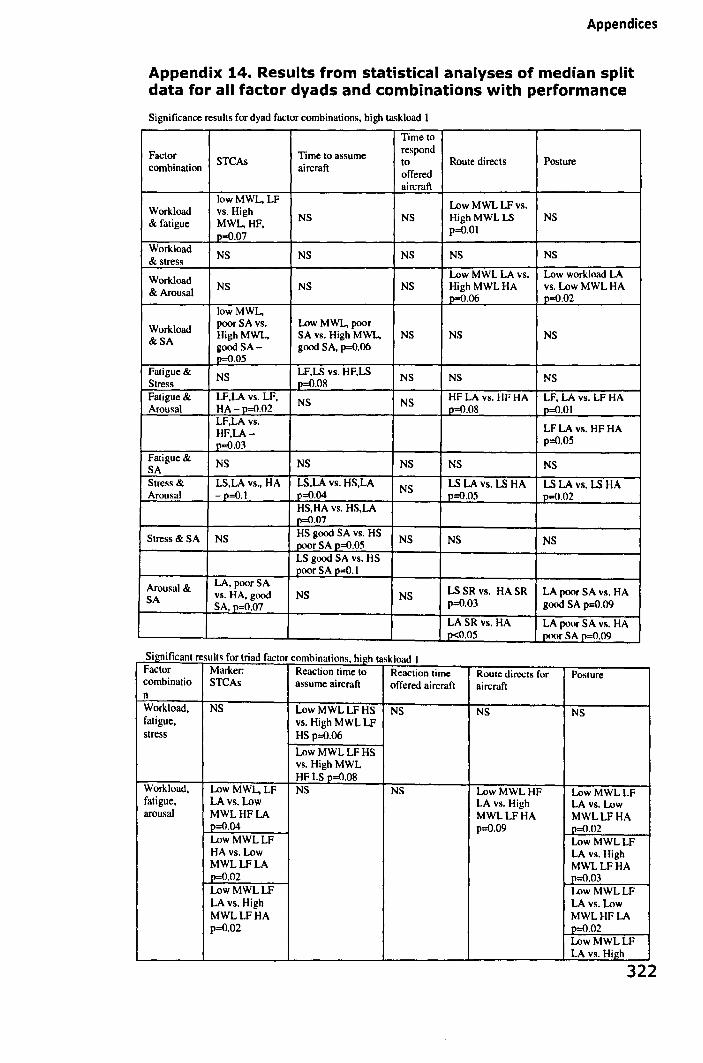
Appendices
Appendix 14. Results from statistical analyses of median split data for all factor dyads and combinations with performance
Significance results for dyad factor combinations, high taskload 1
Time to
Factor Time to assume respond
combination STCAs
aircraft to Route directs Posture offered aircraft
10wMWL,LF Low MWL LF vs. Workload vs. High
NS NS High MWL LS NS & fatigue MWL,HF,
p=O.Ol p=O.07
Workload NS NS NS NS NS
& stress
Workload Low MWL LA vs. Low workload LA NS NS NS High MWLHA vs. Low MWL HA
& Arousal p=O.06 p_=O.02 lowMWL,
Workload poorSAvs. Low MWL, poor
&SA HighMWL, SA vs. High MWL, NS NS NS good SA- good SA. p=O.06 p=O.05
Fatigue & NS LF,LS vs. HF.LS NS NS NS Stress ~::O.O8 Fatigue & LF,LA vs. LF,
NS NS HF LA vs. HF HA LF, LA vs. LF HA Arousal HA-p=O.02 ~=O.O8 ~=O.OI
LF,LAvs. LF LA vs. HF HA HF,LA-p::O.05 1'=0.03
Fatigue & NS NS NS NS NS SA
Stress & LS,LAvs., HA LS,LA vs. HS,LA NS LS LA vs. LS HA LS LA vs. LS HA
Arousal -p=O.1 ~=O.04 p=O.05 p=O.02 HS,HA vs. HS,LA
...,E.=O.07
Stress & SA NS HS good SA vs. HS
NS NS NS 200r SA p=O.OS LS good SA vs. HS ~oor SA p=O.1
Arousal & LA, poor SA LS SR vs. HA SR LA poor SA vs. HA vs. HA, good NS NS SA
SA,~=0.07 p=O.03 good SA p::O.09
LASR vs. HA LA poor SA vs. HA p<O.05 poor SA p=O.09
S' 'fi Igm Icant results for tnad factor combinations, high taskload I Factor Marker: Reaction time to Reaction time Route directs for Posture combinatio STCAs assume aircraft offered aircraft aircraft n Workload, NS Low MWLLFHS NS NS NS fatigue, vs. High MWL LF stress HS p::O.06
Low MWLLFHS vs. HighMWL HF LS p::O.08
Workload, Low MWL,LF NS NS Low MWLHF Low MWLLF fatigue, LAvs. Low LA vs. High LAvs. Low arousal MWLHFLA MWLLFHA MWLLFHA
~::O.04 p::O.09 1'=0.02 Low MWLLF Low MWLLF HAvs. Low LAvs. High MWL LF LA MWLLFHA p=O.02 ...,E.=O.03 Low MWLLF Low MWLLF LAvs. High LA vs. Low MWLLFHA MWLHFLA p::O.02 p=O.02
Low MWLLF LAvs. High
322
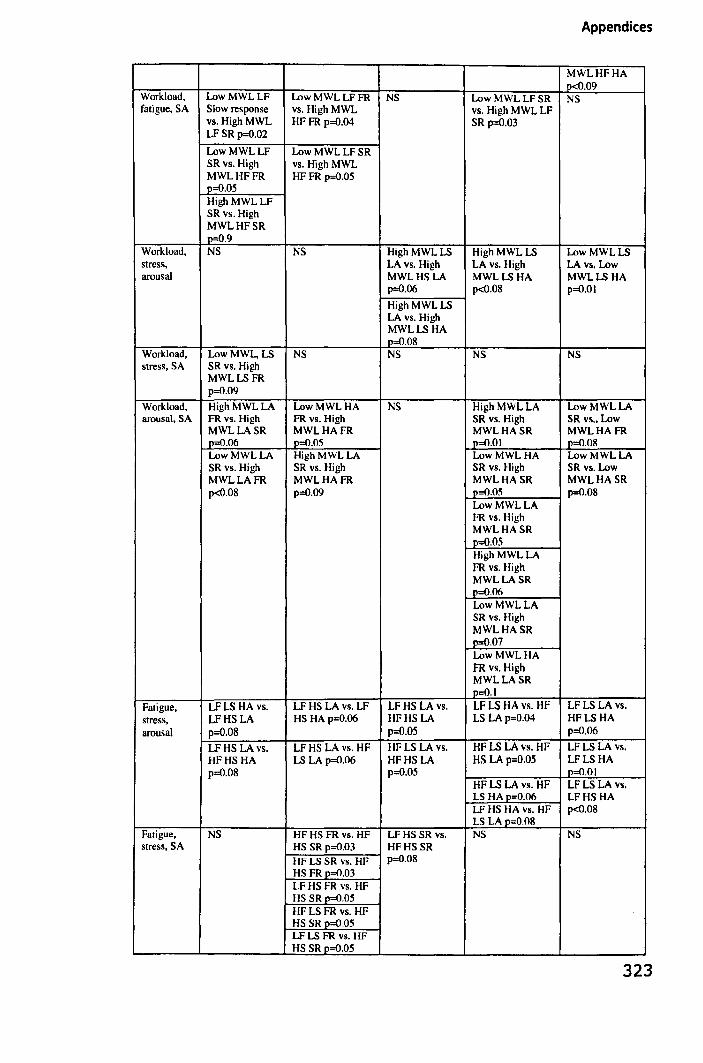
Appendices
MWLHFHA p<O.09
Workload. Low MWLLF LowMWLLFFR NS LowMWLLFSR NS fatigue. SA Slow response vs.HighMWL vs. High MWL LF
vs. High MWL HFFR p=O.04 SRp=O.03 LFSRp=O.02
Low MWLLF Low MWLLFSR SR vs. High vs. HighMWL MWLHFFR HFFRp=O.05 p=O.05 High MWLLF SR vs.High MWLHFSR p=O.9
Workload. NS NS High MWLLS High MWLLS Low MWLLS stress. LAvs. High LAvs. High LA vs. Low arousal MWLHSLA MWLLSHA MWLLSHA
p=O.06 p<O.08 p=O.OI
High MWLLS LA vs. High MWLLSHA p=O.08
Workload. LowMWL, LS NS NS NS NS stress. SA SR vs. High
MWLLSFR p=O.09
Workload. High MWLLA Low MWLHA NS High MWL LA Low MWLLA arousal. SA FR vs. High FR vs. High SR vs. High SR vs .• Low
MWLLASR MWLHAFR MWLHASR MWLHAFR p=O.06 p=O.05 p=O.OI p=(l.OR Low MWL LA High MWLLA LowMWLHA Low MWLLA SR vs. High SR vs. High SR vs. High SR vs. Low MWLLAFR MWLHAFR MWLHASR MWLHASR p<O.08 p=O.09 1'=0.05 p=O.08
Low MWLLA FR vs. High MWLHASR p=O.05 High MWLLA FR vs. High MWLLASR 0=0.06 Low MWL LA SR vs. High MWLHASR p=O.07 Low MWLHA FR vs. High MWLLASR p=O.1
Fatigue. LFLS HA vs. LF HS LA vs. LF LFHS LA vs. LF LS HA vs. HF LF LS LA vs. stress. LFHSLA HS HAp=O.06 HFHSLA LS LAp=O.04 HFLSHA
arousal p=O.08 p=O.05 p=O.06
LFHS LA vs. LF HS LA vs. HF HFLS LA vs. HF LS LA vs. HF LF LS LA vs. HFHSHA LS LAp=O.06 HFHS LA HS LAp=O.05 LFLSHA p=O.08 p=O.05 1'=0.01
HF LS LA vs. HF LFLS LA vs. LS HAp=O.06 LFHSHA LF HS HA vs. HF p<O.08 LS LA p=O.08
Fatigue. NS HF HS FR vs. HF LFHS SR vs. NS NS stress. SA HS SR p=O.03 HFHSSR
HF LS SR vs. HF p=O.08 HS FRp=O.03 LF HS FR vs. HF HS SR p=O.05 HF LS FR vs. HF HS SRp=O.05 LF LS FR vs. HF HS SR~=O.05
323
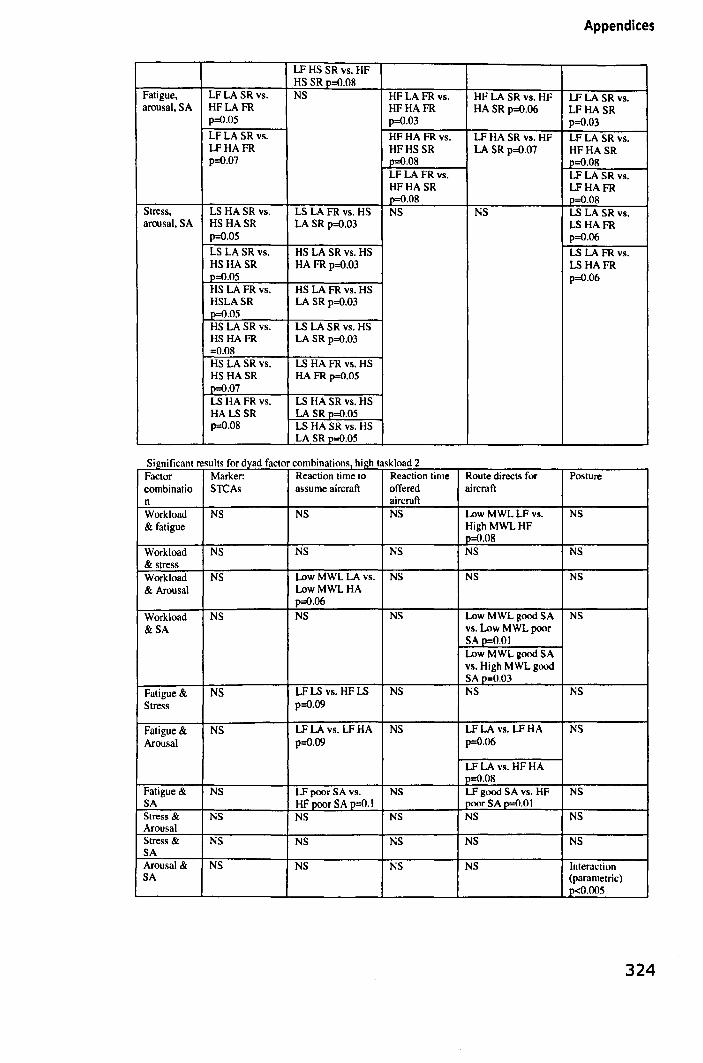
Appendices
LF HS SR vs. HF HS SR p=O.08
Fatigue, LFLASR vs. NS HF LA FR vs. HF LA SR vs. HF LFLASR vs. arousal, SA HFLAFR HFHAFR HA SR p=O.06 LFHASR
p=O.05 p=0.03 p=O.03 LF LA SR vs. HFHA FR vs. LF HA SR vs. HF LFLA SR vs. LFHAFR HFHS SR LA SR p=O.07 HFHASR p=O.07 p=O.08 ~=O.08
LF LA FR vs. LFLA SR vs. HFHASR LFHAFR ~08 p=O.08
Stress, LSHASR vs. LS LA FR vs. HS NS NS LS LA SR vs. arousal, SA HS HASR LASR p=O.03 LSHAFR
p=O.05 p=O.06 LS LASR vs. HS LA SR vs. HS LS LA FR vs. HSHASR HAFRp=O.03 LS HAFR p=O.05 p=O.06 HS LAFR vs. HS LA FR vs. HS HSLASR LA SR p=O.03 ])=0.05 HS LA SR vs. LS LA SR vs. HS HS HAFR LASRp=O.03 =0.08 HS LASR vs. LS HA FR vs. HS HSHASR HAFR p=O.05 p=O.07 LS HAFR vs. LS HA SR vs. HS HALSSR LASR~=O.05 p=O.08 LS HA SR vs. HS
LA SR p=O.05
Significant results for dyad actor com matlons, Igi tas loa b' h' h k d 2 Factor Marker: Reaction time to Reaction time Route directs for Posture combinatio STCAs assume aircraft offered aircraft n aircraft Workload NS NS NS Low MWL LF vs. NS & fatigue High MWLHF
~=O.O8
Workload NS NS NS NS NS & stress Workload NS Low MWL LA vs. NS NS NS & Arousal Low MWL HA
p=O.06
Workload NS NS NS Low MWL good SA NS &SA vs. Low MWL poor
SA~=O.OI Low MWL good SA vs. High MWL good SA p=0.03
Fatigue & NS LF LS vs. HF LS NS NS NS Stress p=O.09
Fatigue & NS LF LA vs. LF HA NS LF LA vs. LF HA NS Arousal p=O.09 p=O.06
LF LA vs. HF HA p=O.08
Fatigue & NS LF poor SA vs. NS LF good SA vs. HF NS SA HF poor SA~=O.I poor SA~=O.OI Stress & NS NS NS NS NS Arousal Stress & NS NS NS NS NS SA Arousal & NS NS NS NS Interaction SA (parametric)
p<O.OO5
324
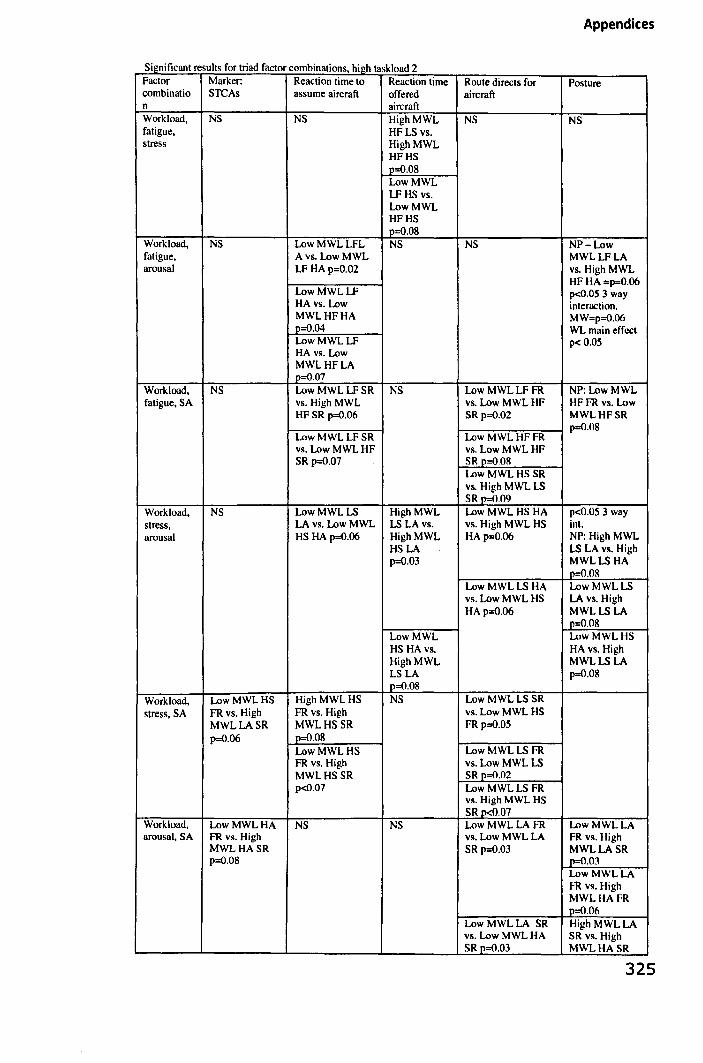
Appendices
Significant results for triad factor combinations, high taskload 2 Factor Marker: Reaction time to Reaction time Route directs for Posture combinatio STCAs assume aircraft offered aircraft n aircraft Workload, NS NS HighMWL NS NS fatigue, HFLS vs. stress HighMWL
HFHS p=O.08 LowMWL LFHS vs. LowMWL HFHS p=O.08
Workload, NS LowMWLLFL NS NS NP-Low fatigue, Avs. LowMWL MWL LF LA arousal LFHAp=O.02 vs. HighMWL
HF HA =p=O.06 Low MWLLF p<O.OS 3 way HAvs. Low interaction. MWLHFHA MW=p=O.06 p=O.04 WL main effect Low MWLLF p< 0.05 HAvs. Low MWLHFLA p=O.07
Workload, NS LowMWLLFSR NS Low MWLLFFR NP: LowMWL fatigue, SA vs.HighMWL vs. Low MWL HF HFFR vs. Low
HFSRp=O.06 SR p=O.02 MWLHFSR
LowMWLLFSR Low MWLHFFR p=O.08
vs. Low MWL HF vs. Low MWL HF SR p=O.07 SR p=O.08
Low MWLHS SR vs. High MWL LS SR p=O.09
Workload, NS Low MWLLS HighMWL LowMWLHSHA p<O.OS 3 way stress, LA vs. Low MWL LS LAvs. vs. High MWL HS into arousal HS HAp=O.06 HighMWL HAp=O.06 NP: HighMWL
HSLA LS LA vS. High p=O.03 MWLLSHA
p=O.08 LowMWLLSHA Low MWLLS vs. Low MWL HS LA vS. High HA p=O.06 MWLLSLA
p=O.08 LowMWL Low MWLHS HS HAvs. HAvs. High HighMWL MWLLSLA LSLA p=O.08 p=O.08
Workload, Low MWLHS High MWLHS NS Low MWLLS SR stress, SA FR vS. High FR vs. High vs. Low MWL HS
MWLLASR MWLHSSR FRp=O.05 p=O.06 p=O.08
Low MWLHS Low MWL LS FR FR vS. High vs. Low MWL LS MWLHSSR SR p=O.02 p<O.07 Low MWLLS FR
vS. High MWL HS SRp<O.07
Workload, Low MWLHA NS NS LowMWLLAFR Low MWLLA arousal, SA FR vS. High vS. Low MWL LA FR vs. High
MWLHASR SR p=O.03 MWLLASR p=O.08 p=O.03
Low MWLLA FR vS. High MWLHAFR p=O.06
Low MWLLA SR High MWLLA vS. Low MWL HA SR vS. High SR p=O.03 MWLHASR
325
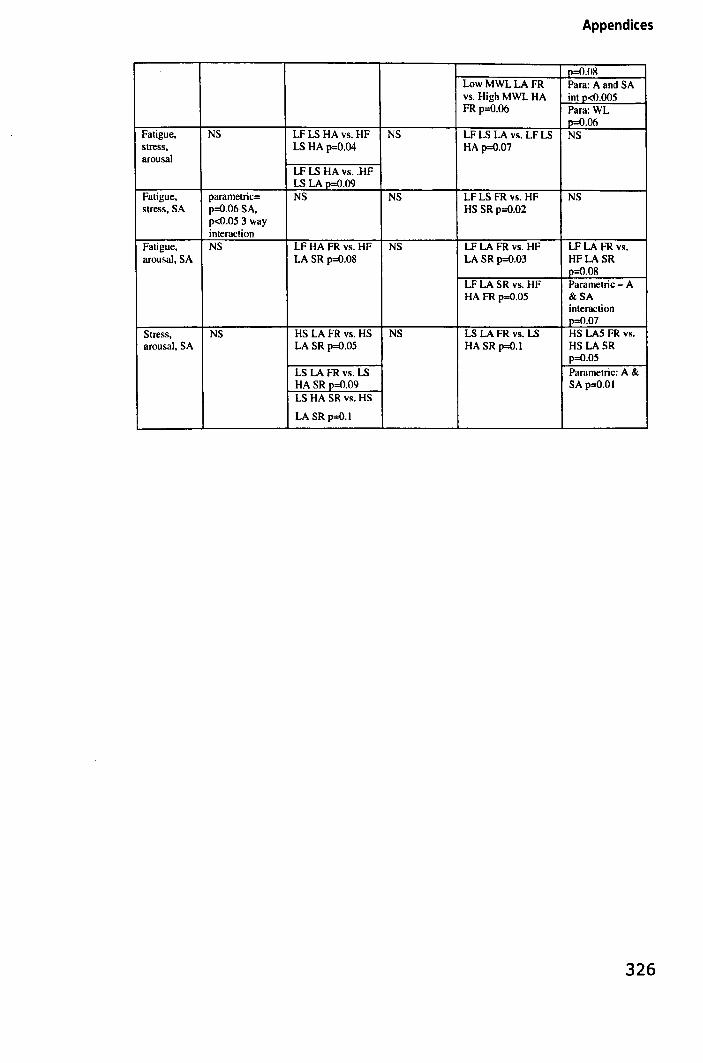
Appendices
p::O.08 LowMWLLAFR Para: A and SA vs. High MWL HA intp<O.OO5 FR p=O.06 Pard: WL
p=O.06 Fatigue, NS LF LS HA vs. HF NS LF LS LA vs. LF LS NS stress, LSHAp=O.04 HAp=O.07 arousal
LF LS HA vs .. HF LS LA p=O.09
Fatigue, parametric= NS NS LF LS FR vs. HF NS stress, SA p=O.06 SA. HS SRp=O.02
p<o.OS 3 way interaction
Fatigue, NS LF HA FR vs. HF NS LF LA FR vs. HF LFLA FR vs. arousal, SA LA SR p=O.08 LASR p=O.03 HFLASR
p::O.08 LF LA SR vs. HF Parametric - A HA FR p::O.OS &SA
interaction p::O.07
Stress, NS HS LA FR vs. HS NS LS LA FR vs. LS HS LAS FR vs. arousal, SA LA SRp=O.05 HA SR p::O.l HS LASR
p::O.OS LS LA FR vs. LS Parametric: A & HA SR p=O.09 SAp=O.OI LS HA SR vs. HS
LA SR p::O.J
326

Appendices
Appendix 15. Initial 137 behavioural markers
Behavioural markers Glance away from Move head around Shake head
Mouthing' instructions or flight levels etc under breath
'ohwell'
screen' Grouped controlling
Hand in fist
Hand in lap
the screen instead of just eyes Move jaw
Moving leg up and down
Shift position/move in chair Shrug
Sigh
Angry Hand off mouse Moving side to side Sit up stmighter
Anns folded Bang mouse on table? Bite finger
Hand to face
Hand to face -fidgeting Hand to mouth - not
Moving whole body up and down
Negative verbal -bored
Slow, considered actions Slump down in seat
Smile
Blink more- keeping awake? Blinking hard
Blinking slower
sighing Harder clicking
Head down (chin towards chest)
Negative verbal expressions Negative verbal sounds Negative verbal
Speaking louder in answer to questions
Squinting
Blow cheeks out Head forward words Nod
Staring/fixed
Bottom lip out Head supported by hands
Not blinking Stretch
Stretches nC(;k/I1ead Burst of sudden activity (usually after a 1 min 'rest' from completing SACL) Cheek twitch
Chew bottom lip
Chew inside cheek
Clench fist
Clicking inaccuracy/errors Clicking with no need Come on
Head to side-considering? Head up (straightened to be level with screen) Hmm'
Hold arm
Hold breath
Hunchedlbody close together
Itch face
Itch head
00' shape with lips
Open and close mouth Open hand (that's not on mouse) and tum palm up-sometime accompanied with Play with mouth
Play with pen
Playing' with face? i.e. scrunch up (move face?) or pull skinllip etc. (need
un Suck bottom lip
Suck in breath
Suck lips
Swallowing hard
Swearing
Swing side to side on chair Talk to self
Tapping fingers
Teeth on lips
Cradle face Itch leg to be specific?) Teeth/juw clenched
Defensive controlling - reactive
Drink
Drowsy (narrowing eyelids etc.)
Itch neck
Jerky and sudden movements
Jerky head movements
Pout
Press lips together
Pull mouth (like small smile/considering)
Tongue out
Touch face
Touch hair
Tut
Eyebrows pulled together-frown
Laugh
Leaning on desk
relaxed
Release/forceful blow of air
Unnecessary actions (commissions?)
Eyebrows raised
Eyebrows together
Less eye movement
Lick lips
Rigid position
Rub eyes
Verbal expressions of panic/no idea
and up - puzzled? Little movement/still Rub face/neck Verbal relaxed
Eyes wide Look at watch Rub self Verbal relief i.e. ok, cool. good
Face red More decisive Sat back Verbal tired
Face relaxed actions More eye movement,
Sat forward towards screen
What?'
Face scrunched faster Scan screen more Worried - face tense 'what?' Faster and more
More focused on centre Scowl Wrinkle nose
clicking More moving Scratch head Yawn Fidgeting with arm
forgetting Mouth open Scrunch lips to side
of face
327