Traffic Modelling and Performance Evaluation in the Kotor Cruise Port
10
Strojniški vestnik - Journal of Mechanical Engineering 59(2013)9, 526-535 Received for review: 2012-12-31 © 2013 Journal of Mechanical Engineering. All rights reserved. Received revised form: 2013-05-24 DOI:10.5545/sv-jme.2012.942 Special Issue, Original Scientific Paper Accepted for publication: 2013-06-24 *Corr. Author’s Address: University of Maribor, Faculty of Organizational Sciences, Kidričeva cesta 55a, 4000 Kranj, Slovenia, [email protected] 526 0 INTRODUCTION Over the previous decade, the cruise ship market has become extremely attractive due to increased destinations and leisure activities. Recently, it has become evident that the increased traffic throughput in ports, has led to serious traffic congestion [1]. Therefore, it is in ports’ interest to reduce their queues in order to obtain higher profits. The port of Kotor was introduced as a new cruise destination (which had not previously been investigated in the literature) by Dragović et al. [2]. They described the Boka Kotorska Bay location, the entrance of the port of Kotor, the draft characteristics, how ships approach the port and other performance metrics such as berth length and draft along the quay. A simulation model was developed to investigate the impact of the possible main berth extension on the port’s operational policies. To briefly summarize, the Kotor cruise port consists of one berth for receiving cruise ships, a river berth for smaller cruise ships (which is not taken into account in this study), and two anchorages that are positioned near the port (Fig. 1). If the main berth is taken, larger ships are anchored, i.e. queued; this is a common scenario in the peak season. However, passengers from anchored ships do not have a proper approach for disembarking and sightseeing. The consequence is a lesser revenue for the city of Kotor and its surroundings. Furthermore, anchored ships are subject to a higher probability of collision with other ships because of the narrow passage to the port and the tendering boats, used to take passengers to land, represent a certain danger for tourists. Anchorage Anchorage Cruise berth Fig. 1. Location of berth and anchorages in Kotor Bay This paper aims to justify an investment in the main berth extension in order to reduce the number of ships in the queue and to increase the port’s revenue. The analysis employs an analytical approach and discrete event simulation to provide a model of the cruise port sufficient to produce valid results. The rest of this paper is organized as follows. In the next subsection, a literature review is given. Section 1 provides port-calling frequency statistics to show the importance of incoming traffic in Kotor cruise port. In Section 2, a problem formulation with extended berth assumption and port revenue analysis is described. Next, Section 3 provides queuing assumptions of the considered problem while in Section 4, the simulation model with input data, variable distribution and model validation is explained. Computational results are given in Section Traffic Modelling and Performance Evaluation in the Kotor Cruise Port Kofjač, D. – Škurić, M. – Dragović, B. – Škraba, A. Davorin Kofjač 1,* – Maja Škurić 2 – Branislav Dragović 2 – Andrej Škraba 1 1 University of Maribor, Faculty of Organizational Sciences, Slovenia 2 University of Montenegro, Maritime Faculty, Montenegro Simulation modelling of traffic in the Kotor cruise port is used for performance evaluation and optimization of the operational policy. During the summer, the traffic intensity of the cruise ships’ arrivals is higher than in other periods of the year. The increased traffic intensity causes congestion at anchorages, which can lead to significant dissatisfaction of the cruise ship operators and passengers. The simulation model, based on the port calling frequency statistics and port tariff charges, is developed. First, the simulation model is validated against the real data. Second, several simulations are performed, where the scenarios of an extended main berth and of increased traffic intensity are evaluated in order to minimize congestion and to maximize revenue. Simulation results indicate significant queue reductions and a higher revenue, thus justifying the intention in the main berth extension. Keywords: traffic modelling, port revenue, operational policy, simulation, model validation, Kotor cruise port
Transcript of Traffic Modelling and Performance Evaluation in the Kotor Cruise Port

Strojniški vestnik - Journal of Mechanical Engineering 59(2013)9, 526-535 Received for review: 2012-12-31© 2013 Journal of Mechanical Engineering. All rights reserved. Received revised form: 2013-05-24DOI:10.5545/sv-jme.2012.942 Special Issue, Original Scientific Paper Accepted for publication: 2013-06-24
*Corr. Author’s Address: University of Maribor, Faculty of Organizational Sciences, Kidričeva cesta 55a, 4000 Kranj, Slovenia, [email protected]
0 INTRODUCTION
Over the previous decade, the cruise ship market has become extremely attractive due to increased destinations and leisure activities. Recently, it has become evident that the increased traffic throughput in ports, has led to serious traffic congestion [1]. Therefore, it is in ports’ interest to reduce their queues in order to obtain higher profits.
The port of Kotor was introduced as a new cruise destination (which had not previously been investigated in the literature) by Dragović et al. [2]. They described the Boka Kotorska Bay location, the entrance of the port of Kotor, the draft characteristics, how ships approach the port and other performance metrics such as berth length and draft along the quay. A simulation model was developed to investigate the impact of the possible main berth extension on the port’s operational policies.
To briefly summarize, the Kotor cruise port consists of one berth for receiving cruise ships, a river berth for smaller cruise ships (which is not taken into account in this study), and two anchorages that are positioned near the port (Fig. 1). If the main berth is taken, larger ships are anchored, i.e. queued; this is a common scenario in the peak season. However, passengers from anchored ships do not have a proper approach for disembarking and sightseeing. The consequence is a lesser revenue for the city of Kotor and its surroundings. Furthermore, anchored ships are subject to a higher probability of collision with other ships because of the narrow passage to the port and the tendering boats, used to take passengers to land, represent a certain danger for tourists.
Anchorage
Anchorage
Cruise berth
Fig. 1. Location of berth and anchorages in Kotor Bay
This paper aims to justify an investment in the main berth extension in order to reduce the number of ships in the queue and to increase the port’s revenue. The analysis employs an analytical approach and discrete event simulation to provide a model of the cruise port sufficient to produce valid results.
The rest of this paper is organized as follows. In the next subsection, a literature review is given. Section 1 provides port-calling frequency statistics to show the importance of incoming traffic in Kotor cruise port. In Section 2, a problem formulation with extended berth assumption and port revenue analysis is described. Next, Section 3 provides queuing assumptions of the considered problem while in Section 4, the simulation model with input data, variable distribution and model validation is explained. Computational results are given in Section
Traffic Modelling and Performance Evaluation in the Kotor Cruise Port
Kofjač, D. – Škurić, M. – Dragović, B. – Škraba, A.Davorin Kofjač1,* – Maja Škurić2 – Branislav Dragović2 – Andrej Škraba1
1 University of Maribor, Faculty of Organizational Sciences, Slovenia 2 University of Montenegro, Maritime Faculty, Montenegro
Simulation modelling of traffic in the Kotor cruise port is used for performance evaluation and optimization of the operational policy. During the summer, the traffic intensity of the cruise ships’ arrivals is higher than in other periods of the year. The increased traffic intensity causes congestion at anchorages, which can lead to significant dissatisfaction of the cruise ship operators and passengers. The simulation model, based on the port calling frequency statistics and port tariff charges, is developed. First, the simulation model is validated against the real data. Second, several simulations are performed, where the scenarios of an extended main berth and of increased traffic intensity are evaluated in order to minimize congestion and to maximize revenue. Simulation results indicate significant queue reductions and a higher revenue, thus justifying the intention in the main berth extension. Keywords: traffic modelling, port revenue, operational policy, simulation, model validation, Kotor cruise port
Strojniški vestnik - Journal of Mechanical Engineering 59(2013)9, 526-535
527Traffic Modelling and Performance Evaluation in the Kotor Cruise Port
5. The main conclusions and suggestions for future directions are presented in Section 6.
0.1 Literature Review
Despite the fact that many investigations related to cruise ships have attempted to find the key influential factors for an effective cruise destination, there are only a few papers that deal with cruise port infrastructure improvements based on revenue analysis. In [3], port technical information, port marketing and development, and cruise ship activity at Leith (northern Europe) with detailed port charges and plans for a new cruise ship terminal are given. A shift-share analysis to adapt the procedure to the cruise business and execute it for the first time in order to describe the change in passenger flows through ports is described in [4]. An example of the passenger head tax charges was introduced to indicate the importance to the port’s revenue stream. In [5], a simple analytical model of cruise and cargo queuing is given. On the basis of summary of marginal costs and benefits, the author supported an automatic priority for cruise ships. In [6], a dynamic programming model to maximize the average revenue rather than the profit from the cruises is proposed. The derived optimal revenue and the corresponding total cost were studied simultaneously.
In contrast, considering the queuing theory, in [7] potential risks and their levels as consequences of increased liquefied natural gas (LNG) activities are identified. Using a quantitative approach, collision (probability of collision can be described as a stationary Poisson distributed stochastic process) and grounding risk assessment is obtained through an automatic identification system (AIS). A model for optimizing vehicle schedules under disrupted conditions is developed in [8]. It optimizes the recovery of a single-terminal system with relatively short feeder routes on which vehicle round-trip
times are exponentially distributed, and arrivals at the terminal are Poisson-distributed. In [9], seaports are described via agent-based modelling and system dynamics, showing that the queuing theory can be effectively used in conjunction with system dynamics and statistical distributions.
Taking into account the operational policy in the cruise port, simulation modelling of cruise ship traffic in the Boka Kotorska Bay is proposed in [2]. The solution for minimizing the number of ships at anchorage is given, representing a solid foundation for this study.
Considering the literature review and especially [2], we can describe the objectives of the paper. The first is to develop a simulation model that is adequate for describing the cruise ship traffic volume in the port of Kotor, regarding only larger ships, unlike [2], in which all ships were taken into account. The second objective is to show the increased port revenue per peak season based on the extended berth assumption and increased traffic volume prediction. Unlike previous research, this paper introduces an analytical approach for the cruise port traffic modelling. Third, the revenue criteria function to maximize the cruise port’s total revenue is introduced.
1 PORT CALLING FREQUENCY STATISTICS
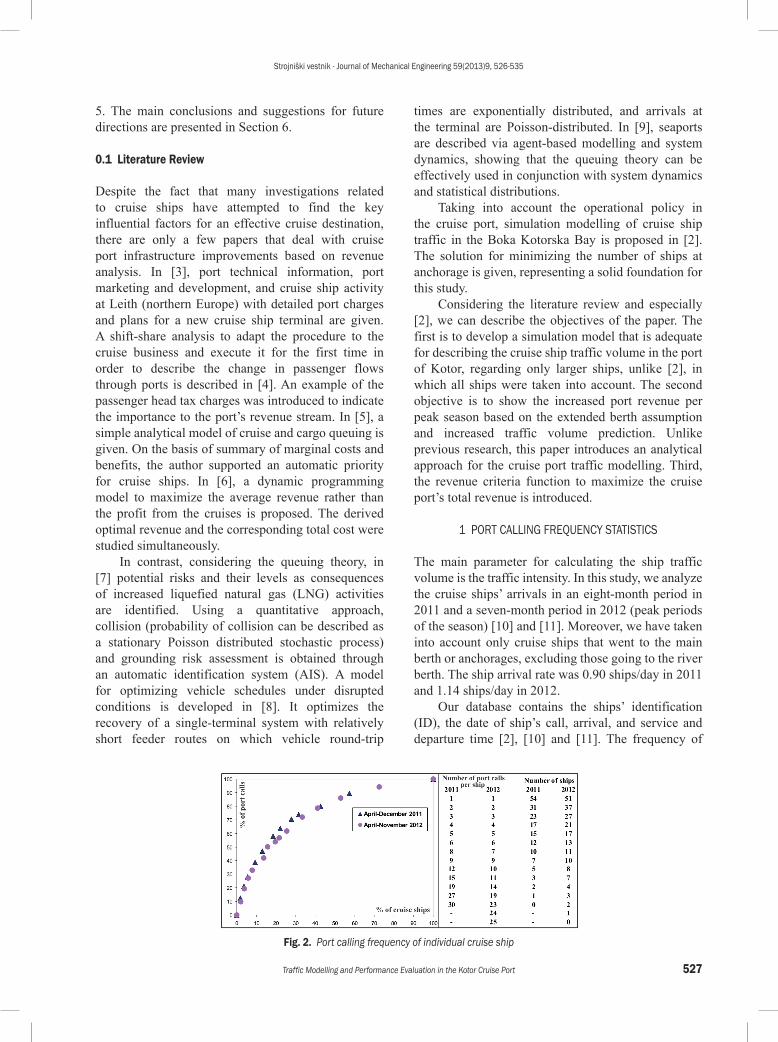
The main parameter for calculating the ship traffic volume is the traffic intensity. In this study, we analyze the cruise ships’ arrivals in an eight-month period in 2011 and a seven-month period in 2012 (peak periods of the season) [10] and [11]. Moreover, we have taken into account only cruise ships that went to the main berth or anchorages, excluding those going to the river berth. The ship arrival rate was 0.90 ships/day in 2011 and 1.14 ships/day in 2012.
Our database contains the ships’ identification (ID), the date of ship’s call, arrival, and service and departure time [2], [10] and [11]. The frequency of
Fig. 2. Port calling frequency of individual cruise ship

Strojniški vestnik - Journal of Mechanical Engineering 59(2013)9, 526-535
528 Kofjač, D. – Škurić, M. – Dragović, B. – Škraba, A.
port callings is presented in Fig. 2. The methodology was adapted from [12]. Similar to [2], but excluding the ships that went to the river berth, we recorded the port calling frequency statistics: in 2011, 54 cruise ships made 219 port calls, while in 2012, 51 ships made 243 port calls. From June to October in 2011 and 2012, there were two or more port calls in a day, and there were situations when cruise ships arrived and departed almost simultaneously [2], [10], [11] and [13], thus making a queue at the anchorages because only one ship can be moored at the main berth.
It should be noted that about 30% of the callers produced approximately 60 to 65% of the total port calls. Moreover, three or more port calls (58% in 2011 and 51% in 2012) were made by the 23 and 27 most frequent callers (21 and 14% of the total number of ships in 2011 and 2012, respectively). This implies that the most frequent callers would occasionally make three or four port calls per day simultaneously [2], thus creating traffic congestion by occupying both the main berth and both anchorages.
2 PROBLEM FORMULATION
The company that provides port services in the port of Kotor is the Port of Kotor A.D. (PKAD). It is a public limited company in which the municipality of Kotor is a key stakeholder, with a 56.97% shareholding. In this study, we assume that PKAD might extend the main berth for flexible berth allocation planning, especially in the peak season when the large cruise ships are more frequent.
2.1 New Scenario Assumption
In this study, we assume a main berth extension from 380 to 500 m (total quay length) to allow for servicing of two large ships simultaneously. Thus, the guaranteed water depth of 8 m extends approximately 300 m along the quay (Fig. 3, left side), enabling the port to handle larger ships. More than 96% of port calls occupied this length in both 2011 and 2012, while only 1.4% in 2011 and 3.3% in 2012 of total port
calls were serviced simultaneously. The additional 200 m of quay length provides service to ships with the maximum allowable draft of 6.5 m (Fig. 3, right side). Currently, the proposed quay length of 500 m is the only possible scenario, because the right side of the quay has the maximum allowable draft of 5 m, while the minimum safety clearance required for a ship making a turn in the harbor basin on the left side does not permit the extension of more than 120 m. To summarize, such a quay extension would ensure more flexible berth allocation planning, especially in the peak season, when the large cruise ships are more frequent.
The new scenario assumption consists of two possibilities. In the first, we assume that the existing berth extends to 500 m on the left side of the quay with mooring dolphins without a gangway [2]. The second implies the extension using mooring dolphins but with a gangway or a construction of a floating dock, such as steel pontoon barges. This facility presented in Fig. 3 consists of a system of two mooring/breasting dolphins, where mooring dolphins are connected to the existing main berth with the gangway [2]. Therefore, a simulation is used to propose a new operational policy because in the case of the extended quay, many cruise ships can be transferred from anchorages to the main berth.
2.2 Port Revenue Analysis
In port literature, fees and charges are mostly levied as per gross tonnage (GT) which is an essential element of a cruise port’s revenue stream. The cruise port revenue consists of [10], [11] and [13]: • Services to cruise ship (berthing, anchoring,
mooring/unmooring);• Services to passengers (ship’s tender and
embarkation/disembarkation);• Navigation services (port signalling, pilotage
service using a pilotage boat);• Hinterland services (fresh water supply, waste
removal, car (bus) fee, inspection and custom fee);
Fig. 3. Berth layout in case of new scenario [2]
Strojniški vestnik - Journal of Mechanical Engineering 59(2013)9, 526-535
529Traffic Modelling and Performance Evaluation in the Kotor Cruise Port
• Security and safety services (unfortunately, still not defined in the Kotor cruise port).Berthing fees depend on GT, the length of a cruise
ship, fresh water supply, waste removal and charge per passenger on-board on arrival. Furthermore, mooring/unmooring operations require an additional small boat. In the case of an anchored ship, the parameters for GT and passengers on-board on arrival are taken into account. In this situation, a ship’s tender with lifeboats is used for embarkation/disembarkation and the charge for every boat call at berth is calculated.
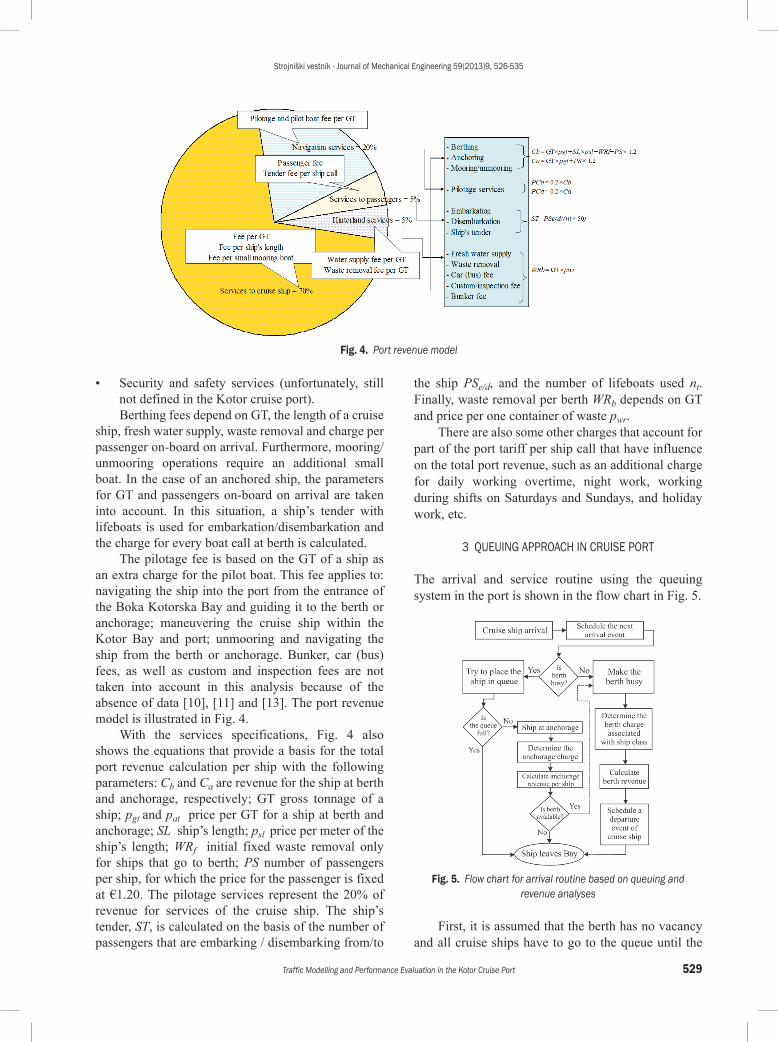
The pilotage fee is based on the GT of a ship as an extra charge for the pilot boat. This fee applies to: navigating the ship into the port from the entrance of the Boka Kotorska Bay and guiding it to the berth or anchorage; maneuvering the cruise ship within the Kotor Bay and port; unmooring and navigating the ship from the berth or anchorage. Bunker, car (bus) fees, as well as custom and inspection fees are not taken into account in this analysis because of the absence of data [10], [11] and [13]. The port revenue model is illustrated in Fig. 4.
With the services specifications, Fig. 4 also shows the equations that provide a basis for the total port revenue calculation per ship with the following parameters: Cb and Ca are revenue for the ship at berth and anchorage, respectively; GT gross tonnage of a ship; pgt and pat price per GT for a ship at berth and anchorage; SL ship’s length; psl price per meter of the ship’s length; WRf initial fixed waste removal only for ships that go to berth; PS number of passengers per ship, for which the price for the passenger is fixed at €1.20. The pilotage services represent the 20% of revenue for services of the cruise ship. The ship’s tender, ST, is calculated on the basis of the number of passengers that are embarking / disembarking from/to
the ship PSe/d, and the number of lifeboats used nt. Finally, waste removal per berth WRb depends on GT and price per one container of waste pwr.
There are also some other charges that account for part of the port tariff per ship call that have influence on the total port revenue, such as an additional charge for daily working overtime, night work, working during shifts on Saturdays and Sundays, and holiday work, etc.
3 QUEUING APPROACH IN CRUISE PORT
The arrival and service routine using the queuing system in the port is shown in the flow chart in Fig. 5.
Fig. 5. Flow chart for arrival routine based on queuing and revenue analyses
First, it is assumed that the berth has no vacancy and all cruise ships have to go to the queue until the
Fig. 4. Port revenue model

Strojniški vestnik - Journal of Mechanical Engineering 59(2013)9, 526-535
530 Kofjač, D. – Škurić, M. – Dragović, B. – Škraba, A.
main berth becomes available. Second, it must be assumed that most of these ships that went to queue first do not need to go to the berth when it becomes available. These ships rest in the queue (anchorages) for a certain period of time. However, there were rare situations when the berth becomes vacant. In such a case, the ship from the queue changes its position and goes to the main berth. Next, the charges are determined, and the revenue of the port is calculated. Finally, when the ship’s service time runs out, the ship leaves the port.
Here, we give the explicit formulae for port with one berth and a finite number of ships in the queue that represent the real situation in the Kotor cruise port. Hence, the corresponding queuing model in Kendall’s notation is M/D/1/m. In [14], the transient analytical solution of M/D/1/m queues based on M/D/1/m as a finite capacity queuing system, with m – 1 waiting spaces in the queue is defined. In our study, we also suppose that cruise ships arrive according to a Poisson process at arrival rate λ. The mean service rate per berth is μ. Therefore, cruise ships that see a full system upon arrival are rejected and do not further influence the system.
The traffic intensity for this model is defined
as θ = λ / μ. Let α θ θk
k
ke= −
! denote the probability
of k arrivals during a service of the ship. Using a probability transition matrix of the embedded Markov chain [14] and [15]; it is possible to derive the stationary probability distribution of the number of cruise ships in the M/D/1/m queue:
pbm
01
11
=+ −θ
, (1)
p b bb
k mkk k
m
=−
+= −−
−
1
111 1
θ, , ..., , (2)
p bbmm
m
= −+
−
−
11
1
1θ, (3)
where the coefficients bn are given by b0 = 1 and
bk
n k e nn
kk n k k
k
n
=−
− ∀ ≥−
=∑ ( )
!( ) , .( )1 1
0
θθ (4)
According to the second formula of Theorem 2 from [14], for an average waiting time in the M/D/1/m queue,
W mb m
bq M D m
kk
m
m( / / / ) ,1
0
1
1
1 1= − −
−
=
−
−
∑θ µ
(5)
whence by Little’s law it follows that the average number of cruise ships in the queue is
L mb m
bq M D m
kk
m
m( / / / ) ,1
0
1
1
1= − −−
=
−
−
∑θ
λµ
(6)
which implies
L mb m
bq M D m
kk
m
m( / / / ) ( ) .1
0
1
1
1= − −−
=
−
−
∑θ (7)
As observed in [16], a more exact approach to the calculation of average waiting time in the M/D/nb/m queue is possible through the M/Ek/nb/m queue with Erlang-k services by making k large enough and number of berths, nb > 1. In [16], it was also observed that many related approximations would yield a new approach for the calculation of the waiting time probabilities in the M/D/nb/m queue. Of course, the M/D/1/m queue is an exceptional case of the M/G/1/m queue for which precise equations of various performance measures have already been derived in the literature.
In contrast, also observing that there are no exact solutions for the M/D/nb/m queue, a good heuristic to approximate M/D/nb/m queue with an M/D/1/m queue, the service rate of which is nb times greater than those of M/D/nb/m queue, was proposed quite recently in [17]. Their approach is well verified by related simulation results. Bearing in mind that their idea consists of the obvious heuristic fact that an M/D/nb/m queue can be replaced by a M/D/1/m queue, the service rate of which is increased to balance the reduction from a multi-server system to a single server one [17].
In view of their numerical results based on analytical expressions for the M/D/1/m queue, we believe that their proposed simulation method is much more adequate than the classic Cosmetatos-type approximations, which are limited to the infinite capacity queuing system (for a discussion, see [16], subsection 2.3).
4 SIMULATION MODEL
In our case, discrete event simulation is used to provide insight into the consequent changes of the operational policy. This simulation utilizes a mathematical/logical model of a physical system that portrays state changes at precise points in simulated time [18] and [19]. The

Strojniški vestnik - Journal of Mechanical Engineering 59(2013)9, 526-535
531Traffic Modelling and Performance Evaluation in the Kotor Cruise Port
proposed simulation model was developed in Flexsim [20], with a screenshot provided in Fig. 6. The main window provides instant insight into some variables. In the upper part of the screenshot, the revenues can be observed: TR is total revenue, Ca+Cb revenue of ships at berth and anchorage, PCa+PCb revenue from pilotage services for ships at berth and anchorage, WRb revenue from waste removal and ST revenue from ships’ tendering services. In the lower part, average berthing (service), approaching and departure time can be observed, together with the total number of ships at the main berth and anchorages.
Fig. 6. A screenshot of the simulation model with intermediate simulation results
The simulation model structure is made in accordance with the flow chart in Fig. 5. All input values for the parameters within the described model are based on the data collected during the study period. The simulation model includes the traffic intensity of ships with different lengths and GT, their arrival and service patterns and their costs in the Boka Kotorska Bay.
4.1 Input Data
After the data analysis, it is evident that the total revenue mostly depends on the GT of the ship and the number of passengers per ship [10]. In Fig. 7, the relation between average GT per ship and average passenger capacity per ship for the peak seasons from 2008 to 2012 is given. Evidently, there is the increased trend of average GT and passenger capacity of ships for both berth and anchorages. This figure affirms the increased trend of cruise ship arrivals from 2008 to 2012. Therefore, the port’s revenues were drastically changed. The average passenger capacity per ship increased five times and three times for ships going to the anchorage and berth, respectively. However, the
average GT per ship going to the anchorage increased almost seven times while the same parameter for the berth increased three times. Fig. 7 justifies the object of our study, which is based on change in operational policy in the case of the new scenario.
The input data for the simulation model is based on the traffic intensity and actual cruise ship port callings for the eight-month period in 2011 and seven-month period in 2012 [10]. This involved 219 ship calls in 2011 and 243 ship calls in 2012. The ships were categorized into the following classes according to the GT of ships (see Fig. 8): up to 5000 GT; 5001–10000 GT; 10001–20000 GT; 20001–40000 GT; 40001–60000 GT; 60001–80000 GT; 80001–100000 GT and over 100001 GT. Ship arrival probabilities were as follows: 17.35 and 15.23% for first class, 12.33 and 11.11% for second, 13.24 and 16.87% for third, 26.03 and 16.46% for fourth, 19.63 and 24.28% for fifth, 6.85 and 5.35% for sixth, 0.00 and 2.88% for seventh and 4.57 and 7.82% for eighth class of ships for 2011 and 2012, respectively. As can be observed in Fig. 8, the class of ships with the highest traffic is fourth in 2011 while in 2012, the fifth class of ships made the biggest number of port calls.
Fig. 7. Increase of GT and passenger capacity per ship from 2008 to 2012 [10]
Fig. 8. Number of port calls in respect to GT class for considered study period [10]
Strojniški vestnik - Journal of Mechanical Engineering 59(2013)9, 526-535
532 Kofjač, D. – Škurić, M. – Dragović, B. – Škraba, A.
4.2 Variable Distributions
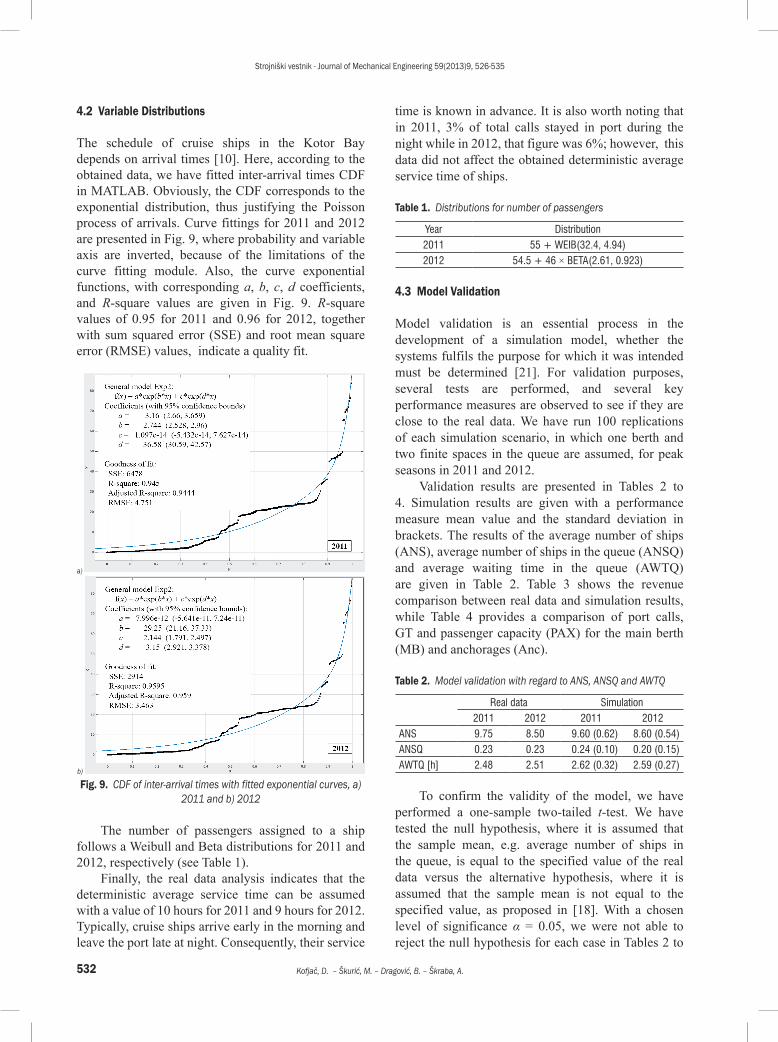
The schedule of cruise ships in the Kotor Bay depends on arrival times [10]. Here, according to the obtained data, we have fitted inter-arrival times CDF in MATLAB. Obviously, the CDF corresponds to the exponential distribution, thus justifying the Poisson process of arrivals. Curve fittings for 2011 and 2012 are presented in Fig. 9, where probability and variable axis are inverted, because of the limitations of the curve fitting module. Also, the curve exponential functions, with corresponding a, b, c, d coefficients, and R-square values are given in Fig. 9. R-square values of 0.95 for 2011 and 0.96 for 2012, together with sum squared error (SSE) and root mean square error (RMSE) values, indicate a quality fit.
a)
b)
Fig. 9. CDF of inter-arrival times with fitted exponential curves, a) 2011 and b) 2012
The number of passengers assigned to a ship follows a Weibull and Beta distributions for 2011 and 2012, respectively (see Table 1).
Finally, the real data analysis indicates that the deterministic average service time can be assumed with a value of 10 hours for 2011 and 9 hours for 2012. Typically, cruise ships arrive early in the morning and leave the port late at night. Consequently, their service
time is known in advance. It is also worth noting that in 2011, 3% of total calls stayed in port during the night while in 2012, that figure was 6%; however, this data did not affect the obtained deterministic average service time of ships.
Table 1. Distributions for number of passengers
Year Distribution2011 55 + WEIB(32.4, 4.94)2012 54.5 + 46 × BETA(2.61, 0.923)
4.3 Model Validation
Model validation is an essential process in the development of a simulation model, whether the systems fulfils the purpose for which it was intended must be determined [21]. For validation purposes, several tests are performed, and several key performance measures are observed to see if they are close to the real data. We have run 100 replications of each simulation scenario, in which one berth and two finite spaces in the queue are assumed, for peak seasons in 2011 and 2012.
Validation results are presented in Tables 2 to 4. Simulation results are given with a performance measure mean value and the standard deviation in brackets. The results of the average number of ships (ANS), average number of ships in the queue (ANSQ) and average waiting time in the queue (AWTQ) are given in Table 2. Table 3 shows the revenue comparison between real data and simulation results, while Table 4 provides a comparison of port calls, GT and passenger capacity (PAX) for the main berth (MB) and anchorages (Anc).
Table 2. Model validation with regard to ANS, ANSQ and AWTQ
Real data Simulation2011 2012 2011 2012
ANS 9.75 8.50 9.60 (0.62) 8.60 (0.54)ANSQ 0.23 0.23 0.24 (0.10) 0.20 (0.15)AWTQ [h] 2.48 2.51 2.62 (0.32) 2.59 (0.27)
To confirm the validity of the model, we have performed a one-sample two-tailed t-test. We have tested the null hypothesis, where it is assumed that the sample mean, e.g. average number of ships in the queue, is equal to the specified value of the real data versus the alternative hypothesis, where it is assumed that the sample mean is not equal to the specified value, as proposed in [18]. With a chosen level of significance α = 0.05, we were not able to reject the null hypothesis for each case in Tables 2 to

Strojniški vestnik - Journal of Mechanical Engineering 59(2013)9, 526-535
533Traffic Modelling and Performance Evaluation in the Kotor Cruise Port
4. Therefore, we can tentatively accept the model as valid [18].
Table 3. Model validation with regard to revenue
Revenue
Real data Simulation2011
[104 €]2012
[104 €]2011
[104 €]2012
[104 €]Tariff 89.5 112.1 86.9 (5.1) 109.9 (4.2)Pilotage 22.3 28.0 21.7 (1.3) 27.5 (1.1)Waste removal 4.1 4.7 3.9 (0.9) 4.5 (0.7)Pilot and/or mooring boat
4.7 5.1 4.5 (0.8) 4.9 (0.7)
Ship’s tender 1.7 8.7 1.6 (0.5) 8.4 (0.9)Total 122.3 158.7 118.6 (6.3) 155.2 (6.5)
Table 4. Model validation with regard to number of port calls, GT and PAX for main berth and anchorages
Real data Simulation2011 2012 2011 2012
MB Calls 136 149 132 (8.1) 148 (4.0)Anc Calls 83 94 82 (3.8) 89 (8.5)Total Calls 219 243 214 (9.1) 237 (11.1)
Real data Simulation2011[104]
2012[104]
2011[104]
2012[104]
MB GT 410.1 486.9 400.2 (19.4) 514.9 (52.2)Anc GT 313.7 434.9 301.9 (24.3) 398.5 (63.1)Ttl GT 723.8 921.8 702.1 (37.7) 913.4 (28.5)
Real data Simulation2011[103]
2012[103]
2011[103]
2012[103]
MB PAX 102.3 121.4 95.5 (12.4) 119.0 (6.4)Anc PAX 65.6 100.7 68.4 (6.4) 98.6 (6.3)Ttl PAX 167.9 222.1 163.9 (9.6) 217.6 (8.8)
By presenting these simulation results, we can conclude that the model reflects the real system accordingly, and it is suitable to make a further ‘what-if’ analysis by varying input parameters.
5 COMPUTATIONAL RESULTS
Following the model validation, we have run several simulation scenarios in order to simulate the possible port performance as a consequence of the main berth extension to cope with the increasing traffic. We have assumed that the existing berth (EX) has been extended (EXT) to 500 m, thus being capable of servicing two ships simultaneously if their total length does not exceed the berth length. Further, we have assumed the increase of traffic by shortening the inter-arrival times by 20 and by 40%. Hence, we have run the following scenarios: a) EXT_11, an extended
berth with real inter-arrival times in 2011, b) EXT_12, an extended berth with real inter-arrival times in 2012, c) EX20_12, an existing berth with 20% shorter inter-arrival times than in 2012, d) EX40_12, an existing berth with 40% shorter inter-arrival times than in 2012, e) EXT20_12, an extended berth with 20% shorter inter-arrival times than in 2012, f) EXT40_12, an extended berth with 40% shorter inter-arrival times than in 2012. Again, we have run 100 replications of each simulation scenario.
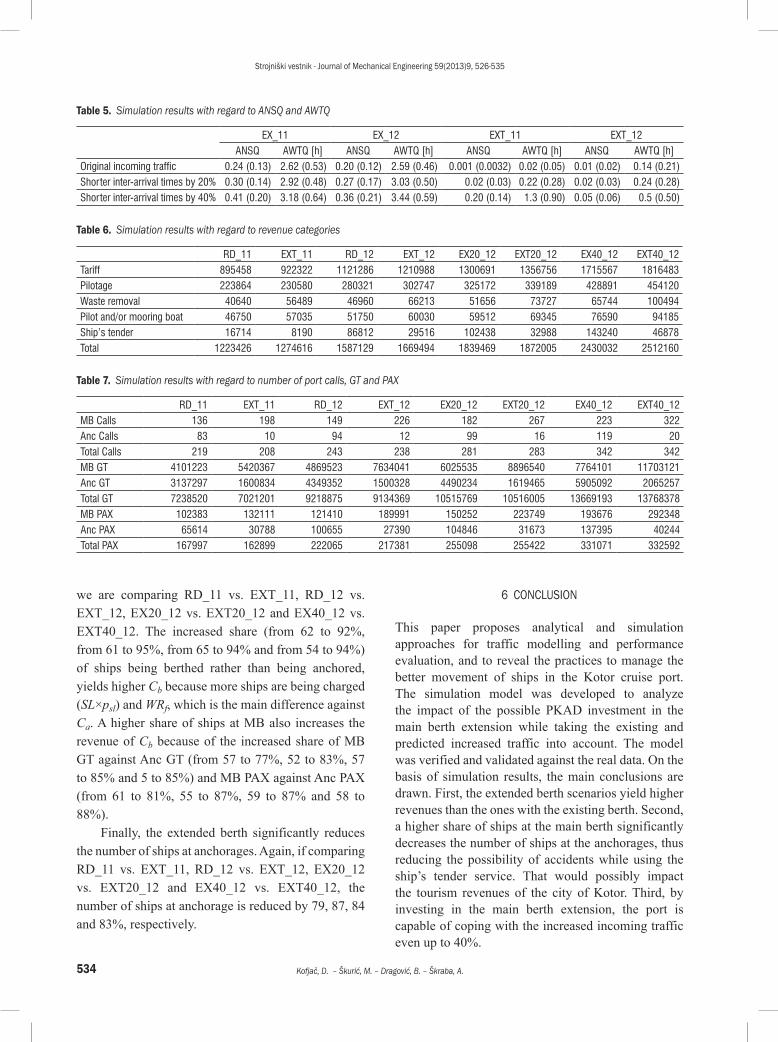
Table 5 (the left part) presents the results for original incoming traffic in 2011 and 2012, and the increased incoming traffic, in the case of the existing berth. The numbers in brackets represent the standard deviation of replication results. The results indicate that if the incoming traffic had been increased, the ANSQ and AWTQ would also have been increased as expected in both 2011 and 2012. In 2011, ANSQ would increase by 25 and 71% if the incoming traffic would increase by shorter inter-arrival times by 20 and 40%, respectively. AWTQ would increase by 12 and 22%. Similarly, in 2012, the ANSQ would increase by 33 and 76% while AWTQ would increase by 17 and 33%. The right part of Table 5 reflects the scenarios with the extended berth. As expected, the ANSQ and AWTQ would significantly decrease in comparison with the existing berth scenarios, because the extended berth is capable of servicing two ships simultaneously. In 2011, the ANSQ would decrease by 99.5, 93 and 51% for the original and increased incoming traffic due to shorter inter-arrival times by 20 and 40%, respectively. AWTQ would decrease by 99.2, 92 and 59%. In 2012, the ANSQ would decrease by 95, 93 and 87%, and the AWTQ would decrease by 95, 92 and 85%.
The results in Table 6 reveal that the extended berth scenarios yield higher revenues than the ones with existing berth real data (RD) if comparing RD_11 vs. EXT_11 (for 4%), RD_12 vs. EXT_12 (for 5%), EX20_12 vs. EXT20_12 (for 2%) and EX40_12 vs. EXT40_12 (for 4%), respectively. The total revenues are increased because of the increased value of tariff (by 3, 8, 4 and 6%), pilotage (by 3, 8, 4 and 6%), waste removal (by 39, 41, 42 and 52%) and pilot and/or mooring boat (by 22, 16, 16 and 23%). The ship’s tender revenue is decreased (by 51, 66, 68 and 67%), because fewer ships are being anchored, as shown in Table 7. However, this decrease is lower than the increase of the other revenue categories.
Furthermore, analysis of simulation results with regard to GT, PAX and number of port calls in Table 7, reveals some more aspects that affect increased revenues in the case of the extended berth. Again,
Strojniški vestnik - Journal of Mechanical Engineering 59(2013)9, 526-535
534 Kofjač, D. – Škurić, M. – Dragović, B. – Škraba, A.
we are comparing RD_11 vs. EXT_11, RD_12 vs. EXT_12, EX20_12 vs. EXT20_12 and EX40_12 vs. EXT40_12. The increased share (from 62 to 92%, from 61 to 95%, from 65 to 94% and from 54 to 94%) of ships being berthed rather than being anchored, yields higher Cb because more ships are being charged (SL×psl) and WRf, which is the main difference against Ca. A higher share of ships at MB also increases the revenue of Cb because of the increased share of MB GT against Anc GT (from 57 to 77%, 52 to 83%, 57 to 85% and 5 to 85%) and MB PAX against Anc PAX (from 61 to 81%, 55 to 87%, 59 to 87% and 58 to 88%).
Finally, the extended berth significantly reduces the number of ships at anchorages. Again, if comparing RD_11 vs. EXT_11, RD_12 vs. EXT_12, EX20_12 vs. EXT20_12 and EX40_12 vs. EXT40_12, the number of ships at anchorage is reduced by 79, 87, 84 and 83%, respectively.
6 CONCLUSION
This paper proposes analytical and simulation approaches for traffic modelling and performance evaluation, and to reveal the practices to manage the better movement of ships in the Kotor cruise port. The simulation model was developed to analyze the impact of the possible PKAD investment in the main berth extension while taking the existing and predicted increased traffic into account. The model was verified and validated against the real data. On the basis of simulation results, the main conclusions are drawn. First, the extended berth scenarios yield higher revenues than the ones with the existing berth. Second, a higher share of ships at the main berth significantly decreases the number of ships at the anchorages, thus reducing the possibility of accidents while using the ship’s tender service. That would possibly impact the tourism revenues of the city of Kotor. Third, by investing in the main berth extension, the port is capable of coping with the increased incoming traffic even up to 40%.
Table 5. Simulation results with regard to ANSQ and AWTQ
EX_11 EX_12 EXT_11 EXT_12ANSQ AWTQ [h] ANSQ AWTQ [h] ANSQ AWTQ [h] ANSQ AWTQ [h]
Original incoming traffic 0.24 (0.13) 2.62 (0.53) 0.20 (0.12) 2.59 (0.46) 0.001 (0.0032) 0.02 (0.05) 0.01 (0.02) 0.14 (0.21)Shorter inter-arrival times by 20% 0.30 (0.14) 2.92 (0.48) 0.27 (0.17) 3.03 (0.50) 0.02 (0.03) 0.22 (0.28) 0.02 (0.03) 0.24 (0.28)Shorter inter-arrival times by 40% 0.41 (0.20) 3.18 (0.64) 0.36 (0.21) 3.44 (0.59) 0.20 (0.14) 1.3 (0.90) 0.05 (0.06) 0.5 (0.50)
Table 6. Simulation results with regard to revenue categories
RD_11 EXT_11 RD_12 EXT_12 EX20_12 EXT20_12 EX40_12 EXT40_12Tariff 895458 922322 1121286 1210988 1300691 1356756 1715567 1816483Pilotage 223864 230580 280321 302747 325172 339189 428891 454120Waste removal 40640 56489 46960 66213 51656 73727 65744 100494Pilot and/or mooring boat 46750 57035 51750 60030 59512 69345 76590 94185Ship’s tender 16714 8190 86812 29516 102438 32988 143240 46878Total 1223426 1274616 1587129 1669494 1839469 1872005 2430032 2512160
Table 7. Simulation results with regard to number of port calls, GT and PAX
RD_11 EXT_11 RD_12 EXT_12 EX20_12 EXT20_12 EX40_12 EXT40_12MB Calls 136 198 149 226 182 267 223 322Anc Calls 83 10 94 12 99 16 119 20Total Calls 219 208 243 238 281 283 342 342MB GT 4101223 5420367 4869523 7634041 6025535 8896540 7764101 11703121Anc GT 3137297 1600834 4349352 1500328 4490234 1619465 5905092 2065257Total GT 7238520 7021201 9218875 9134369 10515769 10516005 13669193 13768378MB PAX 102383 132111 121410 189991 150252 223749 193676 292348Anc PAX 65614 30788 100655 27390 104846 31673 137395 40244Total PAX 167997 162899 222065 217381 255098 255422 331071 332592
Strojniški vestnik - Journal of Mechanical Engineering 59(2013)9, 526-535
535Traffic Modelling and Performance Evaluation in the Kotor Cruise Port
Further, this paper provides a correlation between ship’s GT and PAX that are the most salient parameters for berth extension. In this manner, the study offers many improvements considering the different insights for operational policy of tendering service in the coming years.
The proposed methodology may be used for improving various segments of the port, especially with regard to the ship traffic intensity and operational policies, which can be considered as the core components of the system.
Future research is possible in several areas. First, the impact of the increased number of tourists disembarking to the main berth on the economy of local area is vital. Second, the construction of the passenger terminal building might lead to a better PKAD and municipality economy. Therefore, developing security and safety services in future is necessary in order to attract more operators to the Kotor cruise port. Finally, gas emissions and ballast water management strategies might be investigated.
6 ACKNOWLEDGMENT
This work was partially supported by the Ministry of Higher Education, Science and Technology of the Republic of Slovenia; Program No. P5-0018.
7 REFERENCES
[1] Almaz, O.A., Altiok, T. (2012). Simulation modeling of the vessel traffic in Delaware River: Impact of deepening on port performance. Simulation Modelling Practice and Theory, vol. 22, no. 3, p. 146-165, DOI:10.1016/j.simpat.2011.12.004.
[2] Dragović, B., Škurić, M., Kofjač, D. (2012). A proposed simulation based operational policy for cruise ships in the Port of Kotor. Maritime Policy & Management, accepted for publication on February 4th, 2013.
[3] Baird, A.J. (1997). An investigation into the suitability of an enclosed seaport for cruise ships the case of Leith. Maritime Policy & Management, vol. 24, no. 1, p. 31-43, DOI:10.1080/03088839700000054.
[4] Marti, B.E., Cartaya, S. (1996). Caribbean cruising: Competition among US homeports. Maritime Policy & Management, vol. 23, no. 1, p. 15-25, DOI:10.1080/03088839600000049.
[5] Wood, T.W. (1982). The economics of mixed cargo and cruise ship traffic in a port. Journal of Transport Economics and Policy, vol. 16, no. 1, p. 43-53.
[6] Hersh, M., Ladany, S.P. (1989). Optimal scheduling of ocean cruises. INFOR, vol. 27, no. 1, p. 48-57.
[7] Perkovic, M., Gucma, L., Przywarty, M., Gucma, M., Petelin, S., Vidmar, P. (2012). Nautical risk assessment for LNG operations at the Port of Koper. Strojniški
vestnik - Journal of Mechanical Engineering, vol. 58, no. 10, p. 607-613, DOI:10.5545/sv-jme.2010.265.
[8] Markovic, N., Schonfeld, P. (2013). Scheduling for a single-terminal intermodal system recovery with Poisson arrivals. Strojniški vestnik - Journal of Mechanical Engineering, In press, DOI:10.5545/sv-jme.2010.268.
[9] Latilla, L. (2011). Modelling seaports with agent-based modelling and system dynamics. International Journal of Logistics Systems and Management, vol. 10, no. 1, p. 90-109, DOI:10.1504/IJLSM.2011.042055.
[10] Port of Kotor A.D. Statistic information (2012), from http://www.portofkotor.co.me/en/O-luci/statistic-informations.html, accessed on 2012-12-15.
[11] Statistical Office of Montenegro –MONSTAT. Foreign vessels on cruise in Montenegro, 2011, from http://www.monstat.org/userfiles/file/turizam/kruzna%20putovanja/Foreign%20vessels%20on%20cruise%20in%20Montenegro,%20Release%20PDF.pdf, accessed on 2012-12-15.
[12] Tzannatos, E. (2010). Cost assessment of ship emission reduction methods at berth: the case of the Port of Piraeus, Greece. Maritime Policy & Management, vol. 37, no. 4, p. 427-445, DOI:10.1080/03088839.2010.486655.
[13] Auditor’s Report for Port of Kotor (2011). from http://scmn.me/fajlovi/LUKO201112R.pdf, accessed on 2012-11-15.
[14] Garcia, J.-M., Brun, O., Gauchard, D. (2002). Transient analytical solution of M/D/1/N queues. Journal of Applied Probability, vol. 39, no. 4, p. 853-864, DOI:10.1239/jap/1037816024.
[15] Brun, O., Garcia, J.M. (2000). Analytical solution of finite capacity M/D/1 queues. Journal of Applied Probability, vol. 37, no. 4, p. 1092-1098, DOI:10.1239/jap/1014843086.
[16] Tijms, H. (2006). New and old results for the M/D/c queue. International Journal of Electronics and Communications, vol. 60, no. 2, p. 125-130, DOI:10.1016/j.aeue.2005.11.008.
[17] Rajabi, A., Dadlani, A., Hormozdiari, F., Khonsari, A., Kianrad, A. Razi, H.S. (2008). Analysis of the impact of wavelength converters on contention resolution in optical burst switching. 2nd Asia International Conference on Modelling & Simulation, p. 259-264.
[18] Banks, J., Carson, S.J., Nelson, B.L., Nicol, D.M. (2010). Discrete-event System Simulation, 5th ed., Prentice Hall, Upper Saddle River.
[19] White, L.R. (2012). A hierarchical production planning system simulator. International Journal of Simulation Modelling, vol. 11, no. 1, p. 40-57, DOI:10.2507/IJSIMM11(1)4.199.
[20] Flexsim Simulation Software. Flexsim, from http://www.flexsim.com, accessed on 2012-12-15.
[21] Desel, J. (2002). Model validation – A theoretical issue? Esparza, J. , Lakos, C. (eds.), 23rd International Conference ICATPN 2002, Lecture Notes in Computer Science, vol. 2360, p. 23-43.