
Influence of Outdoor Air Conditions on the Air Source Heat Pumps Performance
10
Energy Procedia 45 (2014) 653 – 662 1876-6102 © 2013 The Authors. Published by Elsevier Ltd. Selection and peer-review under responsibility of ATI NAZIONALE doi:10.1016/j.egypro.2014.01.070 ScienceDirect 68th Conference of the Italian Thermal Machines Engineering Association, ATI2013 Influence of outdoor air conditions on the air source heat pumps performance Pamela Vocale a, *, Gian Luca Morini b , Marco Spiga a a Department of Industrial Engineering, University of Parma, Parco Area delle Scienze 181/A, 43124 Parma, Italy b DIN, Alma Mater Studiorum Università di Bologna, Viale Risorgimento 2, 40136 Bologna, Italy Abstract The purpose of the present work is the investigation of the effect of the outdoor air temperature and relative humidity on the performance of an air heat pump, when the reverse-cycle defrosting is considered. The frost formation process has been analyzed by developing a simplified model which relates the number of defrost cycles to the outdoor air conditions. Moreover the energy consumption due to the defrosting has been taken into account in the evaluation of the heat pump performance. The results, carried out for many Italian sites, point out that the outdoor air conditions play an important role in determining the amount of defrost cycles; however the frost formation is mainly affected by the relative humidity. The analysis highlights also that the defrosting contribution on the heat pump performance is not negligible when the heat pump that operates in wet weather, although cold; in these conditions the hourly COP may be reduced by up to 20%. However, this effect becomes less relevant, but not negligible, when the seasonal heat pump performance is evaluated; the maximum decrease of SCOP, observed for the all analyzed cases, is less than 13%. Keywords: Air source heat pumps; defrosting effect; defrosting cycles; SCOP. 1. Introduction The reduction of buildings energy consumption and the use of the renewable energies are necessary measures for decreasing the European greenhouse gas emissions, as indicated in the last EPBD (i.e. Directive 2010/31/EU). In * Corresponding author. Tel.: +0-039-0521-905855; fax: +0-039-0521-905705. E-mail address: [email protected] Available online at www.sciencedirect.com © 2013 The Authors. Published by Elsevier Ltd. Selection and peer-review under responsibility of ATI NAZIONALE
-
Upload
independent -
Category
Documents
-
view
3 -
download
0
Transcript of Influence of Outdoor Air Conditions on the Air Source Heat Pumps Performance

Energy Procedia 45 ( 2014 ) 653 – 662
1876-6102 © 2013 The Authors. Published by Elsevier Ltd.Selection and peer-review under responsibility of ATI NAZIONALEdoi: 10.1016/j.egypro.2014.01.070
ScienceDirect
68th Conference of the Italian Thermal Machines Engineering Association, ATI2013
Influence of outdoor air conditions on the air source heat pumps performance
Pamela Vocalea,*, Gian Luca Morinib, Marco Spigaa aDepartment of Industrial Engineering, University of Parma, Parco Area delle Scienze 181/A, 43124 Parma, Italy
bDIN, Alma Mater Studiorum Università di Bologna, Viale Risorgimento 2, 40136 Bologna, Italy
Abstract
The purpose of the present work is the investigation of the effect of the outdoor air temperature and relative humidity on the performance of an air heat pump, when the reverse-cycle defrosting is considered. The frost formation process has been analyzed by developing a simplified model which relates the number of defrost cycles to the outdoor air conditions. Moreover the energy consumption due to the defrosting has been taken into account in the evaluation of the heat pump performance. The results, carried out for many Italian sites, point out that the outdoor air conditions play an important role in determining the amount of defrost cycles; however the frost formation is mainly affected by the relative humidity. The analysis highlights also that the defrosting contribution on the heat pump performance is not negligible when the heat pump that operates in wet weather, although cold; in these conditions the hourly COP may be reduced by up to 20%. However, this effect becomes less relevant, but not negligible, when the seasonal heat pump performance is evaluated; the maximum decrease of SCOP, observed for the all analyzed cases, is less than 13%. © 2013 The Authors. Published by Elsevier Ltd. Selection and peer-review under responsibility of ATI NAZIONALE.
Keywords: Air source heat pumps; defrosting effect; defrosting cycles; SCOP.
1. Introduction
The reduction of buildings energy consumption and the use of the renewable energies are necessary measures for decreasing the European greenhouse gas emissions, as indicated in the last EPBD (i.e. Directive 2010/31/EU). In
* Corresponding author. Tel.: +0-039-0521-905855; fax: +0-039-0521-905705.
E-mail address: [email protected]
Available online at www.sciencedirect.com
© 2013 The Authors. Published by Elsevier Ltd.Selection and peer-review under responsibility of ATI NAZIONALE

654 Pamela Vocale et al. / Energy Procedia 45 ( 2014 ) 653 – 662
order to improve the efficiency of the building heating and cooling systems, different solutions can be adopted. The use of the heat pumps represent certainly an important measure to achieve energy saving.
Heat pump performance is significantly affected by the operating conditions, such as the features of the heat sources, the heating demand and the heat pump control system. Since the outdoor air temperature is extremely variable over the heating period the Coefficient Of Performance (COP) of the air heat pumps cannot be evaluated by considering the steady state monthly values of the outdoor air temperature but by using the so-called bin method, based on an evaluation of the cumulative frequency of the outdoor air temperature in a fixed locality.
However the energy performance of air heat pumps is affected not only by the outdoor air temperature, but by the air humidity as well. When the air moisture content is high and temperature is lower than 6°C, frost formation on the surface of the airside heat exchanger may occur and consequently the heat pump performance can be reduced or even the system may stop.
The frost formation is a complex process. In literature several works which investigate the mechanism of frost formation in heat exchangers characterized by simple geometry (i.e. cylinders, flat plates and parallel plates), have been presented [1–10]. Moreover the frost formation process in heat exchangers characterized by more complex geometries, has been investigated by many authors [11-21]. However they analyze specific geometries, therefore it becomes difficult to use these results for general purpose investigation.
The frost needs to be removed periodically to improve the efficiency of operation. This can be carried out in different ways: by resorting to the electric resistance or by inverting the cycle or by stopping the compressor or by using hot gas. When the heat pump can operate in reversible mode the defrost is generally obtained by inverting the cycle. The energy consumption due to the defrost cycles has to be considered in calculating the heat pump performance but the calculation methods proposed by the European standards ignore this effect.
The present paper intends to numerically investigate the effect of the outdoor air temperature and relative humidity on the frost production and the impact of defrosting on the performance of an air heat pump (COP and Seasonal COP), in the case of reverse-cycle defrosting.
For the purpose of this study the amount of defrost cycles per season has been evaluated by using a simplified model which enables to estimate the needed defrost cycles depending on the outdoor air conditions. The numerical simulations have been carried out by considering many Italians towns.
Nomenclature
cp Specific heat at constant pressure (kJ kg-1 K-1) COP Coefficient of Performance E Energy (kJ) h Specific enthalpy (kJ kga
-1) m Dry air mass flow rate (kg s-1) p Pressure (Pa) P Building heating demand (kW) Q Heat flow rate, thermal power (kW) RH Relative humidity SCOP Seasonal Coefficient of Performance t Temperature (°C) x Moisture content (kgv kga
-1) W Electric power (kW) z Number of bin hours Greek symbols
Performance reduction coefficient Heat of fusion (kJ kg-1)
Time interval (s) Subscript a Air adj Adjusted

Pamela Vocale et al. / Energy Procedia 45 ( 2014 ) 653 – 662 655
c Cooling elbu Electric backup heater ev Evaporation dp Dew point fr Frost in Inlet out Outlet sat Saturation sb Stand-by th Thermal w Wall
2. Problem statement
2.1. Frost production
In order to explain the frost formation process, let us start from the analysis of the heat transfer in the external coil. If one considers a specific i-th bin air temperature, the rate of heat captured from the cold heat source (outdoor air) by means of the external evaporator can be estimated by applying the energy conservation principle to the heat pump:
, ,11ev i th i
i
Q QCOP
(1)
where ,th iQ is thermal output and COPi denotes the Coefficient of Performance of the heat pump. For any bin air temperature, the value of the rate of energy transferred to the building and of COP is known by using the manufacturer data.
The specific enthalpy of the air at the outlet section of the evaporator can be estimated by the balance equation:
,, ,
ev iout i in i
a
Qh h
m (2)
being am the dry air mass flow rate through the external side of the evaporator (this value can be evaluated by the manufacturer data) and hin,i the specific enthalpy of the air at the inlet of the external coil which can be calculated as a function of the air temperature (t) and of the moisture content (x) by solving the classical equations describing the physical properties of moist air (ASHRAE [22]):
1,006 2501 1.84
(t)0.622(t)
sat
tot sat
h t x t
RH pxp RH p
(3)
where ptot is the total pressure of the moist air which depends on the altitude, psat is saturation pressure and RH denotes the air relative humidity. For each i-th bin the value of the outdoor air enthalpy (hin.i) is known if the values of the outdoor temperature and of the relative humidity are known.
In this way, by using equation (3) and equation (2) the value of the air enthalpy at the exit of the evaporator can be calculated as a function of the i-th bin temperature and of the outdoor air relative humidity. The value of the air

656 Pamela Vocale et al. / Energy Procedia 45 ( 2014 ) 653 – 662
enthalpy obtained by equation (2) has to be compared with the dew point value (hdp,i) which can be obtained by equation (3) using the value of the moisture content of the outdoor air (xin,i) and the value RH=1:
, , , ,
, , , ,
( )
( )out i dp i out i in i
out i dp i out i in i
h h x x no frost productionh h x x frost production
(4)
If hout,i<hdp,i the value of the moisture content of the outdoor air at the exit of the evaporator (xout,i) is estimated by solving the system of equation (3), with RH=1 and h=hout,i.
Once the decrease of the water vapor content in the air through the evaporator is known, the frost accumulation rate on the cold surface of the external coil can be calculated by:
, , ,fr i a in i out im m x x (5)
However the choice of the RH value of the outside air for any bin is not a simple task because there is not a univocal link between the RH values and the air temperature.
2.2. Defrosting cycles
Experimental results showed that if the outdoor coil temperature is above -3°C there is practically no frost accumulation on the outdoor coil when the ambient temperature is in the range of 0 to 6°C, which is the range at which frost is most likely to accumulate [18]. When the ambient temperature is outside the range of 0-6°C the defrosting cycles are generally not necessary because above 6°C the coil temperature will be warm enough to prevent frost formation on the evaporator, and below 0°C the moisture content of the air will be too low for a heavy frost accumulation on the coil.
When the frost is built up on the external surface of the evaporator the refrigerant pressure during the evaporation process tends to decrease and this accelerates the frost formation because the surface temperature of the heat exchanger decreases. In order to avoid this effect, when the surface temperature of the external coil (or the refrigerant pressure) becomes lower than a setup value, the heat pump activates a defrost cycle. If the heat pump is reversible the most used defrosting method is the inversion of the thermodynamic cycle; this action temporarily warms up the outdoor coil and melts the frost from the coil. In this defrost cycle, the outdoor fan is prevented from turning on when the heat pump switches over, and the temperature rise of the outdoor coil is accelerated and increased. A heat pump unit will defrost regularly when frost conditions occur. The defrost cycle should be long enough to melt the frost, and short enough to be energy-efficient. The energy required to melt the frost produced during one hour is:
, , , ,0fr i fr i fr p fr w iE m c t (6)
being fr and cp,fr the heat of fusion and the specific heat at constant pressure of the frost respectively. indicates the seconds in one bin (1 hour) and tw,i denotes the wall temperature which depends on the outdoor air temperature, external coil features, refrigerant temperature and heat transfer coefficients.
Once the energy required to remove the frost is known, the minimum defrosting time can be evaluated by considering the ratio of the energy required to melt the frost to the cooling capacity of the heat pump:
,fr,min,i
,
fr i
c i
EQ
(7)
In general, fr,min is lower than 1 hour and, depending on the ambient temperature and humidity conditions, it can vary from 10 s up to 2-5 minutes. Actually the defrosting cycle duration is longer than fr,min. Typical

Pamela Vocale et al. / Energy Procedia 45 ( 2014 ) 653 – 662 657
defrosting cycles are represented in Figure 1; before activating the inversion, the heat pump is switched off for a period equal to sb (i.e. 1 minute).
Fig. 1. Typical defrosting cycles and stand-by periods for an air heat pump (N=2).
During the stand-by period the defrost relays turn on the compressor, switch the reversing valve of the heat pump, turn on the interior electric heating element, and stop the fan at the outdoor coil from spinning and finally the heat pump operates following the cooling cycle. The unit remains in the defrost cycle (or cooling cycle) until the thermostat on the bottom of the outdoor coil senses that the outdoor coil temperature has reached the desired value (typically about 10-12°C). At this temperature, the outdoor coil should be free of frost. A typical defrost cycle might run from 30 seconds to a few minutes ( fr) and it is generally fixed by the heat pump manufacturer. After that period, the frost thermostat opens the circuit then the defrost cycle stops, the internal heater turns off, the valve reverses, and the unit returns to the heating cycle after a stand-by period equal to 'sb. (i.e. 30 seconds). The defrost cycles are repeated regularly at timed intervals during an hour.
Therefore the duration of the whole defrosting period for each hour can be evaluated by:
, 'fr tot sb fr sbN (8)
where the needed number of defrosting cycles per hour N can be estimated as follows:
,min,imax fr
fr
N (9)
Generally N=1 can be sufficient if the timer of the single defrosting cycle fr is set as equal to the maximum value of fr,min during the winter season; in this case, the defrosting cycle will be activated each 60 minutes.
2.3. Heat pump performance
When the frost is removed by inverting the cycle, the defrost cycles effect on heat pump performance is twofold: the energy supplied to the building decreases and the building heating demand increases due to the energy carried off by the heat pump in the cooling mode. At the same time, the electrical consumption increases due to the energy spent to melt the frost and to feed the electric-resistance heater equipped with the heat pump which allows to match the required heating demand.
The hourly overall electrical consumption can be computed with:
, , , 1 ( ' )adj i i fr tot c i fr elbu fr i sb sbW W W W W (10)

658 Pamela Vocale et al. / Energy Procedia 45 ( 2014 ) 653 – 662
where iW and cW denote the electric power supplied to the heat pump when it operates in heating and in cooling mode, respectively and elbuW is the required capacity of the internal electric backup heater which operates during the inversion of the cycle. The last term on the right side of equation (10) takes into account, by means of the
coefficient, the heat pump performance reduction due to the intermittent operation. By considering the thermal energy transferred to the heat distribution fluid and the overall electrical consumption
for each i-th bin temperature of the heating season (n is the number of bins having a number of hours larger than 0) the seasonal performance of the heat pump can be calculated:
,1
,1
n
i th ii
n
i adj ii
z QSCOP
z W
(11)
3. Results
The model defined above was applied to 6 northern Italian towns and 4 central and southern Italian sites, characterized by different weather conditions. To calculate the bin distribution for each locality during the whole heating season, the procedure described by the UNI TS 11300/4 Italian standard was followed. The frost accumulation rate was estimated by assuming a monthly average value of the outdoor air relative humidity (RH) derived from the UNI 10349 Italian standard.
The heat pump model chosen for the study (Galletti MCA 10H) is an air-to-water electrically-driven heat pump which can reach the thermal output of 11.13 kW and the water output temperature can range from 30 °C to 50 °C. The unit is equipped with two fans of axial type which move air at a volumetric flow rate of 5580 m3/h. The compressor is of variable speed operation: the thermal output of the heat pump can range from 25% to 100% of the maximum heat power, to match the building heating demand. The heat pump performance for each bin temperature was evaluated according to the UNI TS 11300/4 Italian standard; the trend of thermal output is shown in Figure 2.
The results here presented were carried out considering a building whose the overall heat transfer coefficient (transmission + ventilation) is equal to 697.14 W/K. For the considered building the heating demand (P) becomes zero when the outdoor air temperature is equal to 16°C, accounting for the effects due to the internal and solar heat gains, as shown in Figure 2. The bivalent temperature (i.e. the outdoor temperature point at which the heat pump is declared to have a heating capacity able to meet 100% of the building heating demand) was 2°C, as shown in Figure 2 and the cut-off temperature of the ASHP was fixed at -5°C.
Fig. 2. Thermal output of the heat pump and building heating demand as a function of the external air temperature.
-5 -3 -1 1 3 5 7 9 11 13 150
2
4
6
8
10
12
14
16
te [°C]
P [k
W]
0
2
4
6
8
10
12
14
16
Qth
,max
[kW
]
HP Thermal output
Heating demand
Bivalent temperature
Pamela Vocale et al. / Energy Procedia 45 ( 2014 ) 653 – 662 659
For the considered heat pump the stand-by period ( sb+ ’sb) is set to 2 minutes and the performance reduction due to the intermittent operation ( ) is equal to 2%.
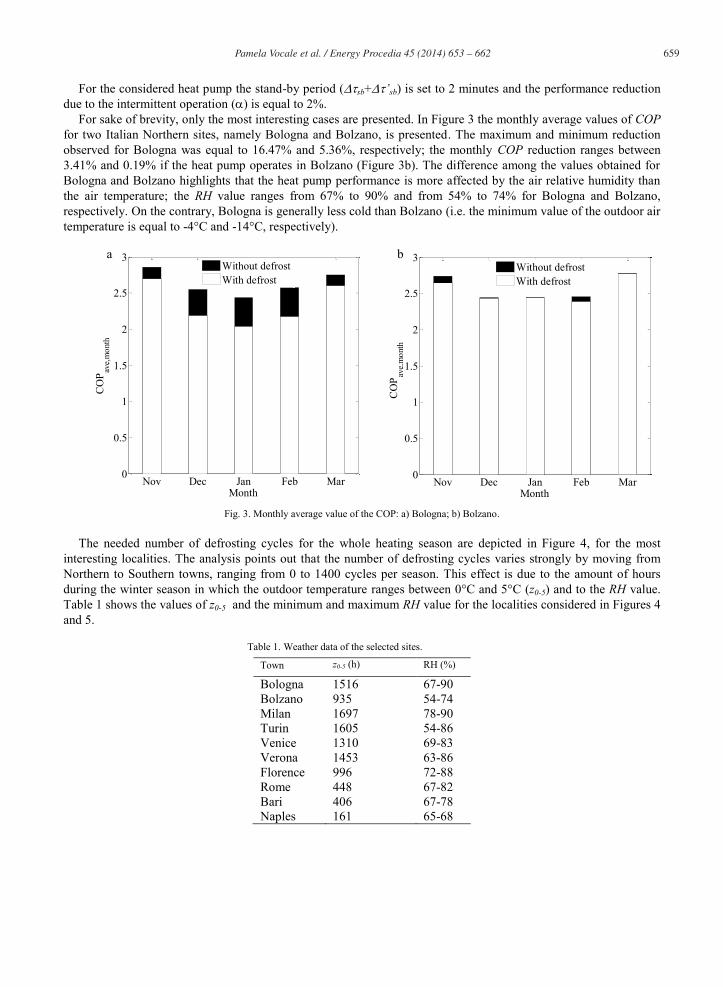
For sake of brevity, only the most interesting cases are presented. In Figure 3 the monthly average values of COP for two Italian Northern sites, namely Bologna and Bolzano, is presented. The maximum and minimum reduction observed for Bologna was equal to 16.47% and 5.36%, respectively; the monthly COP reduction ranges between 3.41% and 0.19% if the heat pump operates in Bolzano (Figure 3b). The difference among the values obtained for Bologna and Bolzano highlights that the heat pump performance is more affected by the air relative humidity than the air temperature; the RH value ranges from 67% to 90% and from 54% to 74% for Bologna and Bolzano, respectively. On the contrary, Bologna is generally less cold than Bolzano (i.e. the minimum value of the outdoor air temperature is equal to -4°C and -14°C, respectively).
Fig. 3. Monthly average value of the COP: a) Bologna; b) Bolzano.
The needed number of defrosting cycles for the whole heating season are depicted in Figure 4, for the most interesting localities. The analysis points out that the number of defrosting cycles varies strongly by moving from Northern to Southern towns, ranging from 0 to 1400 cycles per season. This effect is due to the amount of hours during the winter season in which the outdoor temperature ranges between 0°C and 5°C (z0-5) and to the RH value. Table 1 shows the values of z0-5 and the minimum and maximum RH value for the localities considered in Figures 4 and 5.
Table 1. Weather data of the selected sites.
Town z0-5 (h) RH (%)
Bologna 1516 67-90 Bolzano 935 54-74 Milan 1697 78-90 Turin 1605 54-86 Venice 1310 69-83 Verona 1453 63-86 Florence 996 72-88 Rome 448 67-82 Bari 406 67-78 Naples 161 65-68
Nov Dec Jan Feb Mar0
0.5
1
1.5
2
2.5
3
Month
Without defrostWith defrost
Nov Dec Jan Feb Mar0
0.5
1
1.5
2
2.5
3
Month
CO
P ave,
mon
th
Without defrostWith defrost
a b
CO
P ave,
mon
th

660 Pamela Vocale et al. / Energy Procedia 45 ( 2014 ) 653 – 662
Fig. 4. Number of defrosting cycles per heating season.
The data shown in Figure 4 confirm that towns characterized by larger values of the relative humidity need more defrosting cycles. Figure 5 shows the comparison between the SCOP evaluated by taking into account the defrosting effect and the theoretical value of the SCOP obtained by ignoring the defrost of the external coil. The Seasonal COP reduction ranges between 1.51% (Bolzano) and 12.67% (Bologna).
By observing Figure 5 it can be noticed that in many cases in Italy, if the defrosting effect is ignored, as suggested by the calculation methods proposed by the European standard (EN 14825), the real energy consumption of the ASHP can be underestimated and hence the value of the SCOP overestimated. As discussed above, this effect becomes less relevant when the heat pumps operate in sites characterized by low values of the air relative humidity (RH<80%) and by outdoor air temperature that is out of the range 0-5°C for many hours. For the other localities, it can be recommended to account for the defrosting effect in order to properly evaluate the energy consumption of the air heat pump.
Fig. 5. Defrosting influence on the seasonal heat pump performance (SCOP).
Bologna Bolzano Milan Turin Venice Verona Florence Rome Bari Naples0
200
400
600
800
1000
1200
1400
Locality
Def
rost
cyc
les
Bologna Bolzano Milan Turin Venice Verona Florence Rome Bari Naples0
0.5
1
1.5
2
2.5
3
Locality
SCO
P
Without defrostWith defrost

Pamela Vocale et al. / Energy Procedia 45 ( 2014 ) 653 – 662 661
Since the RH value plays a leading role in determining the frost formation, further numerical simulations, by using the hourly weather data provided by Meteonorm database [23], were performed. More specifically three different cases were analyzed: in the case 1, a monthly average value of the outdoor air RH was assumed for each air bin temperature of the month; in the case 2, a bin average value of the outdoor air RH was used for each bin of the month and in the case 3 the hourly data of RH were considered (i.e. hourly simulation).
The results of this further analysis point out that the effect of defrost can be overestimated if a monthly average value of RH is assumed; on the contrary by considering a bin average value of the RH the reduction of the heat pump performance may be underestimated. Obviously the hourly simulation (case 3) constitute the reference case, since hourly data for both temperature and RH of the outdoor air, were considered.
Fig. 6. Influence of RH value on the monthly average value of the COP: a) Bologna; b) Bolzano.
Figure 6 shows the comparison between the monthly average values of COP calculated by considering the above mentioned cases. The results depicted in Figure 6 were obtained by considering the weather data of Bologna and Bolzano, respectively. The same trend can be observed for other towns. The maximum COPave,month reduction is about 17% (case 1), 4% (case 2) and 6% (case 3), for Bologna; if the heat pump operates in Bolzano, its performance can be reduced by about 9%, 1% and 4%.
However by considering the whole heating season the seasonal performance of the heat pump (SCOP) can be reduced by about 11% (case 1), 2% (case 2) and 5% (case 3), for Bologna; the SCOP reduction can be less than 6%, 1% and 2%, respectively, if the heat pump operates in Bolzano. These results confirm that the choice of the RH value is very crucial in order to properly evaluate the frost accumulation rate on the cold surface of the external coil and consequently the effect of the defrost on the heat pump performance.
4. Conclusions
The influence of the outdoor air temperature and relative humidity on the energy performance of the air source heat pumps has been numerically investigated. Many Italian sites characterized by different weather data have been analyzed; temperature and relative humidity values within the range -5°C - 5°C and 50% - 90%, respectively, have been considered. For the purpose of the here presented study the frost formation process has been analyzed by developing a simplified model which enables to correlate the frost production and the external air conditions.
a b

662 Pamela Vocale et al. / Energy Procedia 45 ( 2014 ) 653 – 662
The numerical analysis points out that both temperature and relative humidity of the outdoor air affects the frost formation process; however the relative humidity plays a leading role in determining the amount of frost that can be accumulated. The effect of defrosting process has been also investigated, when the defrost is obtained by inverting the cycle of the refrigerant. The numerical results highlight that the monthly average of the COP can be reduced by up to 17% when the heat pump operates in sites in which the values of air relative humidity are very high (RH>80%) and the outdoor air temperature is within the range 0-6°C during the winter for many hours. Therefore in these localities the role of the defrosting cannot be ignored for an accurate evaluation of the real energy consumption of an air source heat pump. By considering the whole heating season the SCOP reduction may range between 1.51% and 12.67%, for the considered localities. Finally, further investigations on the role of the air relative humidity in the frost formation process have been performed, by using hourly data derived from the Meteonorm database. This latter analysis highlights that depending on the chosen value of the RH for each air bin temperature, the heat pump performance can be overestimated or underestimated. Moreover the hourly simulation points out that the COP can be reduced by about 20% in wet sites.
References
[1] Jones B W, Parker J D. Frost Formation with Varying Environmental Parameters. J. Heat Transfer 1975;97:255-9. [2] Schneider H W. Equation of the growth rate of frost forming on cooled surfaces. Int. J. Heat and Mass Transfer 1978; 21: 1019–24 [3] Tao Y X, Besant R W, Rezkallah K S. A mathematical model for predicting the densification and growth of frost on a flat plate. Int. J. Heat
and Mass Transfer 1993; 36: 353–63. [4] Lee K S, Kim W-S, Lee T-H. A one-dimensional model for frost formation on a cold flat surface. Int. J. Heat and Mass Transfer 1997; 40:
4359–65. [5] Lee Y B, Ro S T. An experimental study of frost formation on a horizontal cylinder under cross flow. Int. J. Refrigeration 2001; 24: 468–74. [6] Yun R, Kim Y, Min M-K. Modeling of frost growth and frost properties with airflow over a flat plate. Int. J. Refrigeration 2002; 25: 362–71. [7] Seker D, Karatas H, Egrican N. Frost formation on fin- and- tube heat exchangers. Part II—Experimental investigation of frost formation on
fin- and- tube heat exchangers. Int. J. Refrigeration 2004; 27: 375–7. [8] Kandula M. Frost growth and densification in laminar flow over flat surfaces. Int. J. Heat and Mass Transfer 2011; 54: 3719–31. [9] Hermes C J L. An analytical solution to the problem of frost growth and densification on flat surfaces. Int. J. Heat and Mass Transfer 2012;
55: 7346–51. [10] Wang W, Guo Q C, Lu W P, Feng Y C, Na W. A generalized simple model for predicting frost growth on cold flat plate. Int. J. Refrigeration
2012; 35: 475–86. [11] Kondepudi S N, O’Neal D L. Frosting performance of tube fin heat exchangers with wavy and corrugated fins. Experimental Thermal and
Fluid Science 1991; 4: 613–8. [12] Kondepudi S N, O’Neal D L. Performance of finned-tube heat exchangers under frosting conditions: I. Simulation model. Int. J.
Refrigeration 1993; 16: 175–80. [13] Yan W-M, Li H-Y, Wu Y-J, Li J-Y, Chang W-R. Performance of finned tube heat exchangers operating under frosting conditions. Int. J.
Heat and Mass Transfer 2003; 46: 871–7. [14] Xia Y, Zhong Y, Hrnjak P S, Jacobi A M. Frost, defrost, and refrost and its impact on the air-side thermal-hydraulic performance of
louvered-fin, flat-tube heat exchangers. Int. J. Refrigeration 2006; 29: 1066–79. [15] Da Silva D L, Hermes C J L, Melo C. Experimental study of frost accumulation on fan-supplied tube-fin evaporators. Applied Thermal
Engineering 2011; 31: 1013–20. [16] Yao Y, Jiang Y, Deng S, Ma Z. A study on the performance of the airside heat exchanger under frosting in an air source heat pump water
heater/chiller unit. Int. J. Heat and Mass Transfer 2004; 47: 3745–56. [17] Hewitt N, Huang M J. Defrost cycle performance for a circular shape evaporator air source heat pump. Int. J. Refrigeration 2008; 31: 444–
52. [18] Guo X-M, Chen Y-G, Wang W-H, Chen C-Z. Experimental study on frost growth and dynamic performance of air source heat pump system.
Applied Thermal Engineering 2008; 28: 2267–78. [19] Jenkins D, Tucker R, Ahadzi M, Rawlings R. The performance of air-source heat pumps in current and future offices. Energy and Buildings
2009; 40: 1901–10. [20] Chen Y-g, Guo X-m. Dynamic defrosting characteristics of air source heat pump and effects of outdoor air parameters on defrost cycle
performance. Applied Thermal Engineering 2009; 29: 2701–7. [21] Gong G, Tang J, Lv D, Wang H. Research on frost formation in air source heat pump at cold-moist conditions in central-south China.
Applied Energy 2013; 102: 571–81. [22] American Society of Heating, Refrigerating and Air-Conditioning Engineers 2001 ASHRAE Handbook of Fundamentals Atlanta. [23] METEONORM-Global Meteorological Database for Solar Energy and Applied Climatology, Version 5, (http://www.meteotest.com).