Human mtDNA Haplogroups Associated with High or Reduced Spermatozoa Motility
15
Am. J. Hum. Genet. 67:682–696, 2000 682 Human mtDNA Haplogroups Associated with High or Reduced Spermatozoa Motility Eduardo Ruiz-Pesini, 1 Ana-Cristina Lapen ˜a, 1 Carmen Dı ´ez-Sa ´nchez, 1 Acisclo Pe ´rez-Martos, 1 Julio Montoya, 1 Enrique Alvarez, 2 Miguel Dı ´az, 3 Antonio Urrie ´s, 4 Luis Montoro, 5 Manuel J. Lo ´ pez-Pe ´rez, 1 and Jose ´ A. Enrı ´quez 1 1 Departamento de Bioquı ´mica y Biologı ´a Molecular y Celular, Universidad de Zaragoza, 2 Unidad de Andrologı ´a. Hospital 12 de Octubre de Madrid, 3 Clı ´nica Ginecolo ´gica de Zaragoza, and 4 Nueva Clı ´nica Quiro ´ n de Zaragoza, Zaragoza, Spain; and 5 Laboratorio de Reproduccio ´n Humana, Hospital Principe de Asturias, Alcala ´ de Henares, Madrid A variety of mtDNA mutations responsible for human diseases have been associated with molecular defects in the OXPHOS system. It has been proposed that mtDNA genetic alterations can also be responsible for sperm dys- function. In addition, it was suggested that if sperm dysfunction is the main phenotypic consequence, these mutations could be fixed as stable mtDNA variants, because mtDNA is maternally inherited. To test this possibility, we have performed an extensive analysis of the distribution of mtDNA haplogroups in white men having fertility problems. We have found that asthenozoospermia, but not oligozoospermia, is associated with mtDNA haplogroups in whites. Thus, haplogroups H and T are significantly more abundant in nonasthenozoospermic and asthenozoospermic populations, respectively, and show significant differences in their OXPHOS performance. Introduction There is increasing evidence showing that sperm motility is strongly dependent on the ATP supplied by the mi- tochondrial oxidative phosphorylation system (OX- PHOS) (Ford and Harrison 1981; Halangk et al. 1985; Pascual et al. 1996; Ruiz-Pesini et al. 1998). Four of the five enzymatic complexes that constitute the OXPHOS system are partially encoded by mitochondrial DNA (mtDNA). Thus, mutations in mtDNA genes that impair the expression of one or more proteins encoded in the mtDNA can promote diseases in humans (Enriquez et al. 1995; Larsson and Clayton 1995; Wallace 1995; Schon et al. 1997; Zeviani and Antozzi 1997). Accord- ingly, it has been proposed that mutations in the mtDNA affecting the performance of mitochondria ATP pro- duction could cause reduced sperm motility and, there- fore, asthenozoospermia (Følgero et al. 1993; Kao et al. 1995; Frank and Hurst 1996; St. John et al. 1997; Zev- iani and Antozzi 1997). About 10%–13% of couples suffer from infertility, which is caused by male dysfunc- tion in 40% of the cases. Untreatable subfertility caused by poor semen quality accounts for 75% of patients consulting for fertility problems. This is due mainly to Received April 20, 2000; accepted for publication July 6, 2000; electronically published August 9, 2000. Address for correspondence and reprints: Dr. Jose ´ A. Enrı´quez,De- partamento de Bioquimica y Biologica Molecular y Celular, Univer- sidad de Zaragoza, Miguel Servet 177, 50013-Zaragoza, Spain. E- mail: [email protected] q 2000 by The American Society of Human Genetics. All rights reserved. 0002-9297/2000/6703-0016$02.00 a low number of sperm cells (oligozoospermia) or to asthenozoospermia (Baker 1994). The frequency of the known pathological mtDNA mutations within the population is insufficient to ex- plain a significant proportion of the asthenozoospermic patients. However, it was recently proposed that if sperm dysfunction is the main, or the only phenotypic consequence of a mtDNA mutation, those mutation(s) could be fixed as stable mtDNA haplotype(s) or even haplogroup(s). This could be possible due to the fact that mtDNA is maternally inherited, and would not suffer selective pressure throughout the male lineage (Frank and Hurst 1996). Therefore, these mutations could be accumulated within a population in a relatively high proportion. We have investigated this possibility by analyzing the distribution of Caucasian mtDNA hap- logroups (Wallace 1995; Brown et al. 1997; Hofmann et al. 1997b, 1997c; Richards et al. 1996; Torroni et al. 1996, 1997) in men having fertility problems. Material and Methods Semen Collection and Analysis Donors from the area of Madrid and Zaragoza (Spain) were asked to collect semen by masturbation under hy- gienic conditions, after a period of sexual abstinence of 3–5 d. The samples were analyzed following standard protocols (WHO 1992) within a period of 2 h at hospital fertility facilities. They were allowed to liquefy for 30 min at 377C. Then the volume of the ejaculate was measured, and the number and percentage of motile spermatozoa
-
Upload
independent -
Category
Documents
-
view
0 -
download
0
Transcript of Human mtDNA Haplogroups Associated with High or Reduced Spermatozoa Motility

Am. J. Hum. Genet. 67:682–696, 2000
682
Human mtDNA Haplogroups Associated with High or ReducedSpermatozoa MotilityEduardo Ruiz-Pesini,1 Ana-Cristina Lapena,1 Carmen Dıez-Sanchez,1 Acisclo Perez-Martos,1Julio Montoya,1 Enrique Alvarez,2 Miguel Dıaz,3 Antonio Urries,4 Luis Montoro,5Manuel J. Lopez-Perez,1 and Jose A. Enrıquez1
1Departamento de Bioquımica y Biologıa Molecular y Celular, Universidad de Zaragoza, 2Unidad de Andrologıa. Hospital 12 de Octubre deMadrid, 3Clınica Ginecologica de Zaragoza, and 4Nueva Clınica Quiron de Zaragoza, Zaragoza, Spain; and 5Laboratorio de ReproduccionHumana, Hospital Principe de Asturias, Alcala de Henares, Madrid
A variety of mtDNA mutations responsible for human diseases have been associated with molecular defects in theOXPHOS system. It has been proposed that mtDNA genetic alterations can also be responsible for sperm dys-function. In addition, it was suggested that if sperm dysfunction is the main phenotypic consequence, these mutationscould be fixed as stable mtDNA variants, because mtDNA is maternally inherited. To test this possibility, we haveperformed an extensive analysis of the distribution of mtDNA haplogroups in white men having fertility problems.We have found that asthenozoospermia, but not oligozoospermia, is associated with mtDNA haplogroups in whites.Thus, haplogroups H and T are significantly more abundant in nonasthenozoospermic and asthenozoospermicpopulations, respectively, and show significant differences in their OXPHOS performance.
Introduction
There is increasing evidence showing that sperm motilityis strongly dependent on the ATP supplied by the mi-tochondrial oxidative phosphorylation system (OX-PHOS) (Ford and Harrison 1981; Halangk et al. 1985;Pascual et al. 1996; Ruiz-Pesini et al. 1998). Four of thefive enzymatic complexes that constitute the OXPHOSsystem are partially encoded by mitochondrial DNA(mtDNA). Thus, mutations in mtDNA genes that impairthe expression of one or more proteins encoded in themtDNA can promote diseases in humans (Enriquez etal. 1995; Larsson and Clayton 1995; Wallace 1995;Schon et al. 1997; Zeviani and Antozzi 1997). Accord-ingly, it has been proposed that mutations in the mtDNAaffecting the performance of mitochondria ATP pro-duction could cause reduced sperm motility and, there-fore, asthenozoospermia (Følgero et al. 1993; Kao et al.1995; Frank and Hurst 1996; St. John et al. 1997; Zev-iani and Antozzi 1997). About 10%–13% of couplessuffer from infertility, which is caused by male dysfunc-tion in 40% of the cases. Untreatable subfertility causedby poor semen quality accounts for 75% of patientsconsulting for fertility problems. This is due mainly to
Received April 20, 2000; accepted for publication July 6, 2000;electronically published August 9, 2000.
Address for correspondence and reprints: Dr. Jose A. Enrıquez, De-partamento de Bioquimica y Biologica Molecular y Celular, Univer-sidad de Zaragoza, Miguel Servet 177, 50013-Zaragoza, Spain. E-mail: [email protected]
q 2000 by The American Society of Human Genetics. All rights reserved.0002-9297/2000/6703-0016$02.00
a low number of sperm cells (oligozoospermia) or toasthenozoospermia (Baker 1994).
The frequency of the known pathological mtDNAmutations within the population is insufficient to ex-plain a significant proportion of the asthenozoospermicpatients. However, it was recently proposed that ifsperm dysfunction is the main, or the only phenotypicconsequence of a mtDNA mutation, those mutation(s)could be fixed as stable mtDNA haplotype(s) or evenhaplogroup(s). This could be possible due to the factthat mtDNA is maternally inherited, and would notsuffer selective pressure throughout the male lineage(Frank and Hurst 1996). Therefore, these mutationscould be accumulated within a population in a relativelyhigh proportion. We have investigated this possibilityby analyzing the distribution of Caucasian mtDNA hap-logroups (Wallace 1995; Brown et al. 1997; Hofmannet al. 1997b, 1997c; Richards et al. 1996; Torroni etal. 1996, 1997) in men having fertility problems.
Material and Methods
Semen Collection and Analysis
Donors from the area of Madrid and Zaragoza (Spain)were asked to collect semen by masturbation under hy-gienic conditions, after a period of sexual abstinence of3–5 d. The samples were analyzed following standardprotocols (WHO 1992) within a period of 2 h at hospitalfertility facilities. They were allowed to liquefy for 30 minat 377C. Then the volume of the ejaculate was measured,and the number and percentage of motile spermatozoa
Ruiz-Pesini et al.: mtDNA Haplogroups and Spermatozoa Motility 683
was evaluated (WHO 1992). In particular, sperm-motilityanalysis was performed at room temperature, a minimumof four microscopy fields were systematically scanned andthe motility of each spermatozoon graded as “a,” “b,”“c,” or “d,” according to whether it showed rapid pro-gressive motility, slow or sluggish progressive motility,nonprogressive motility, or no motility at all. The per-centage of spermatozoa in each category was estimatedafter >100 spermatozoa were counted.
Spermatozoa morphology was assessed by optic mi-croscopy. The proportion of sperm cells with apparenthead defects (large heads, small heads, and taperingheads), midpiece malformations, or tail abnormalities(multiple tails or coiled tails) was estimated. Samplesshowing sperm cell agglutination, severe flagellar de-fects, or very high semen viscosity were discarded.
Flagella-Activity Measurements
The activity of several mitochondrial OXPHOS com-plexes was inhibited by increased concentrations of ro-tenone (an inhibitor for the NADH dehydrogenase orcomplex I-EC 1.6.5.3), antimycine A (an inhibitor for thecytochrome c reductase or complex III-EC 1.10.2.2), orcyanide (inhibitor for the cytochrome c oxidase or com-plex IV- EC 1.9.3.1) and the proportion of sperm cellsable to manifest any kind of flagella activity was moni-tored by microscopy cell count in a Neubauer chamberafter 3 min in the presence of the drug. In order to main-tain a short and homogenous timing between the differentmeasurements, several microscopic fields in each samplewere video recorded for further quantification.
Spermatozoa Vertical Progression
Spermatozoa vertical progression was estimated byvertical introduction of a capillary tube filled with a4.8% glucose isotonic solution to a semen sample andallowance of the entrance of the spermatozoa for 30 min.After that period of time, the distance (in mm) that thespermatozoa were able to progress along the capillarytube was estimated.
DNA Analysis and Sequencing
Mitochondrial DNA levels were estimated as follows:∼0.5 mg of total DNA, extracted from semen and pre-viously denaturalized with 0.5 M NaOH, was trans-ferred to a nylon filter by Slot-Blot. Then, filters werehybridized for the first time with a 273-bp mitochondrialprobe against the 16S mt-rRNA gene (nt 1621–1894).The same filter was rehybridized, after stripping, with a431-bp nuclear probe against the 18S n-rRNA gene (nt757–1188). Probes were labeled by PCR with 32[P]-dTTP(Amersham). Filters were hybridized with 500,000–1,000,000 counts per minute/ml of the appropriateprobe. Hybridization was performed in 6# SSC at 687C
and the blots were exposed for fluorography. Autora-diograms were evaluated by a LKB laser densitometer(model ULTROSCAN XL), with GelScan XL software.DNA sequencing was performed by the Thermo Se-quenase radiolabeled terminator cycle sequencing Kit(Amersham) as specified by the manufacturer.
Haplogroup Determination
The samples were haplogrouped by PCR amplificationof short mtDNA fragments, followed by restriction en-zyme analysis, as described elsewhere (Torroni et al.1996), but with some modifications (table 1). Thus, wehave used the nomenclature proposed by the Emorygroup, with minor modifications (Wallace 1995; Torroniet al. 1996; Brown et al. 1997; Torroni et al. 1997). Inparticular, since it has been recently proposed that thehaplogroup previously designated as “K” belongs to thehaplogroup U and should be considered a sub haplo-group of it (Macaulay et al. 1999), we have joined theindividuals of K and U haplogroups and designated themas “haplogroup KU.” In addition, we have reduced thenumber of the polymorphic sites screened in all samplesto four specific positions: the 7025 AluI, 10394 DdeI,and 12308 HinfI sites (Torroni et al. 1996) and the 4216AflIII site.
These four polymorphic sites allow the classificationof individuals into four groups: those who belong tohaplogroups H, KU, and T–J, and those who belong tohaplogroups L, M, I, W, X, and V (Torroni et al. 1996,1997). The identity of the haplogroups T and J wasfurther established by the analysis of additional poly-morphic sites as indicated in table 1. Because of the lowratio of mtDNA/nDNA present in spermatozoa, PCRconditions were optimized in order to avoid amplifica-tion of mitochondrial pseudogenes. Screening for theT10463C and the G15928A polymorphisms was per-formed by RFLP analysis, as described elsewhere(Houshmand et al. 1994). The G15928A polymorphismwas confirmed by DNA sequencing. A full descriptionof the oligodeoxynucleotides utilized and the PCR am-plification conditions are available upon request.
Biochemical Determinations
Semen samples (0.5–2 ml) were centrifuged for 10 minat 600 # g at room temperature. Seminal plasma wascollected for the biochemical determinations. Fructoseand citric acid concentration were determined by spec-trophotometry in an Hitachi autoanalyzer, using standardkits (Boehringer Mannheim catalogue numbers 139106and 139076) according to the supplier’s specifications.Carnitine concentration was estimated as previously de-scribed (Rodriguez-Segade et al. 1985). The concentrationof different metals (calcium, zinc, and magnesium) wasestimated at the hospital facilities by atomic absorption.

684 Am. J. Hum. Genet. 67:682–696, 2000
Table 1
MtDNA Polymorphic Sites Used to Define the mtDNA Haplogroups
MTDNAHAPLOGROUP
RESULTS AT SITEa
17025AluI 112308HinfI 14216AflIII 14914MaeI 113366BamH1 113704MvaI 18249AvaII
H 2 2 2/1 ND/2 ND/2 ND/1 NDV 1 2 2 ND ND ND 2KU 1 1 2 ND ND ND NDJ 1 2 1 2 2 2 NDT 1 2 1 1 1 1 NDI 1 2 2 ND ND 1 1W 1 2 2 ND ND ND 1X 1 2 2 ND ND ND 2M 1 2 2 ND ND 1 2L 1 2 2 ND ND 1 2O 1 2 2 ND ND 1 2
NOTE.—The presence of the indicated restriction-enzyme polymorphic sites was investigated in short PCR fragments amplified from mtDNA.The plus sign (1) indicates that the enzyme is able to cut the amplified PCR fragment, and the minus sign (2) indicates that it is not. The plus/minus sign (5) indicates that there are members of these haplogroups that could, or could not, be cut by the enzyme. Results following a slash(/) apply to only a few individuals. The names of the haplogroups are as described elsewhere (Macaulay et al. 1999), except for O, whichcorresponds to a set of unassigned individuals.
a nd p not determined.
Enzyme Activity Analysis
At room temperature, 0.5–2 ml of semen was centri-fuged for 10 min at 600 # g. Seminal plasma was elim-inated and the pellet was washed with saline solution.Samples were centrifuged again for 10 min at 600 # g,supernatants were discarded, and the spermatozoa wereresuspended in the required volume of 20 mM potassiumphosphate (pH 7.0) to reach a final concentration of 2# 105 cells/ml. Then samples were homogenized byfreeze thawing before analysis, as described elsewhere(Ruiz-Pesini et al. 1998). The activities of NADH de-hydrogenase (NADH DH, complex I), succinate dehy-drogenase (complex II- EC 1.3.99.1), cytochrome coxidase (COX, complex IV), and citrate synthase (CS-EC 4.1.3.7) in spermatozoa homogenates were measuredspectrophotometrically in a Beckman DU-650 spectro-photometer (Beckman Instruments) by monitoring thereduction of ferricyanide (complex I), 2,6 diclorophen-olindophenol (DCPIP) (complex II), the oxidation of cy-tochrome c (complex IV) or the condensation of dition-itrobenzoate (DTNB) with free Coenzyme A, aspreviously described (Ruiz-Pesini et al. 1998). Proteinconcentration was measured by the Lowry’s method.Specific activities were expressed as nmol # min21 #mg protein21. All chemicals were from BoehringerMannheim and Sigma Chemicals.
Statistical Analysis
The differences in haplogroup frequency distributionbetween populations were assessed by the x2 test fromcontingency tables. The contribution of individual tablecells to the x2 was done by post hoc analysis by thefollowing statistic:
O 2 E,
R CÎE ∗ 1 2 ∗ 1 2( ) ( )N N
where O is the observed frequency, C the column total,R the row total, N the grand total and E is . This(CR)/Nform of standardized residual follows a standard normaldistribution.
Additionally, probabilities for the distribution of indi-vidual haplogroups in asthenozoospermic and nonas-thenozoospermic populations was estimated by means ofFisher’s exact test from 2 # 2 contingency tables, wherethe frequency of all haplogroups but the one to be testedwas added. The differences between haplogroups in sem-inogram parameters, spermatozoa vertical progression,specific activity of NADH dehydrogenase (complex I),succinate dehydrogenase (complex II), cytochrome coxidase (complex IV), and citrate synthase were assessedby analysis of variance (ANOVA). Paired haplogroup dif-ferences were assessed by the post hoc Fisher’s protectedleast significant difference test (PLSD). All tests and cal-culations were done with the statistical package StatView5.0 for Macintosh (SAS Institute, Inc.).
Results
OXPHOS and Spermatozoa Motility
Our primary goal was the investigation of fixedmtDNA variants with potential phenotypic conse-quences in human sperm quality. Therefore, we focusedon the potential association between mtDNA and oneof the more relevant parameters of the spermiogram, themotility of the spermatozoa. The spermatozoa have veryspecialized mitochondria that are exclusively located in
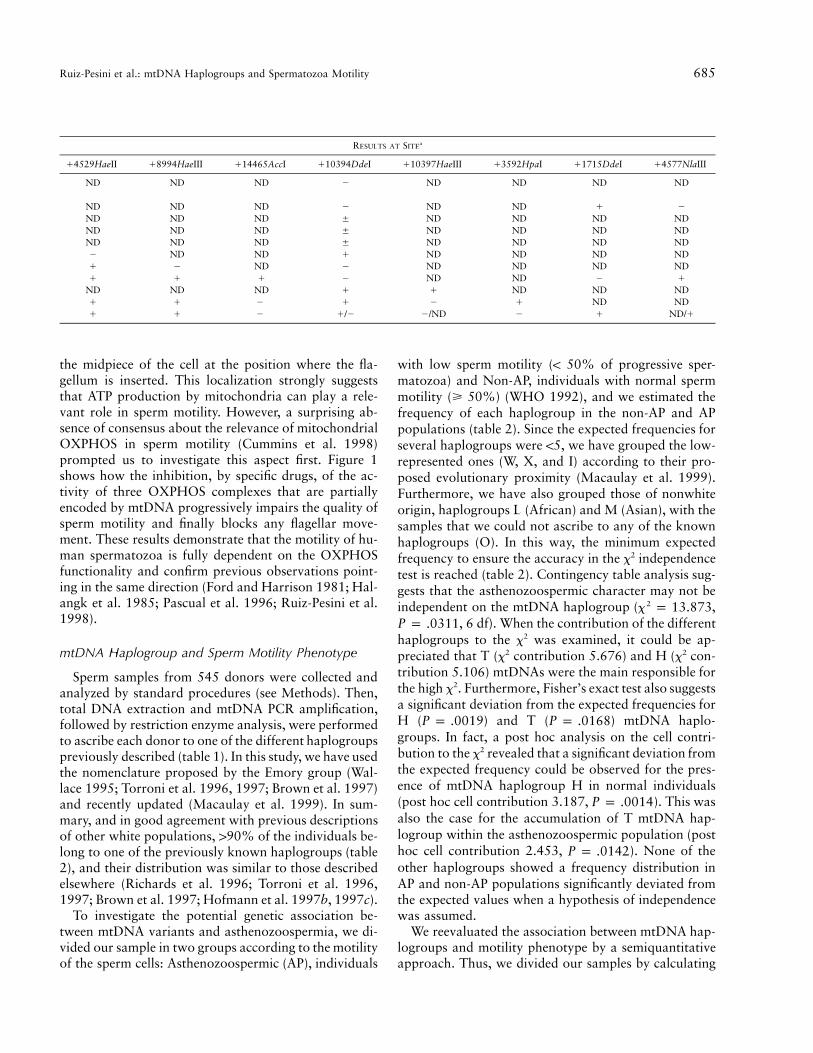
Ruiz-Pesini et al.: mtDNA Haplogroups and Spermatozoa Motility 685
RESULTS AT SITEa
14529HaeII 18994HaeIII 114465AccI 110394DdeI 110397HaeIII 13592HpaI 11715DdeI 14577NlaIII
ND ND ND 2 ND ND ND ND
ND ND ND 2 ND ND 1 2ND ND ND 5 ND ND ND NDND ND ND 5 ND ND ND NDND ND ND 5 ND ND ND ND2 ND ND 1 ND ND ND ND1 2 ND 2 ND ND ND ND1 1 1 2 ND ND 2 1
ND ND ND 1 1 ND ND ND1 1 2 1 2 1 ND ND1 1 2 1/2 2/ND 2 1 ND/1
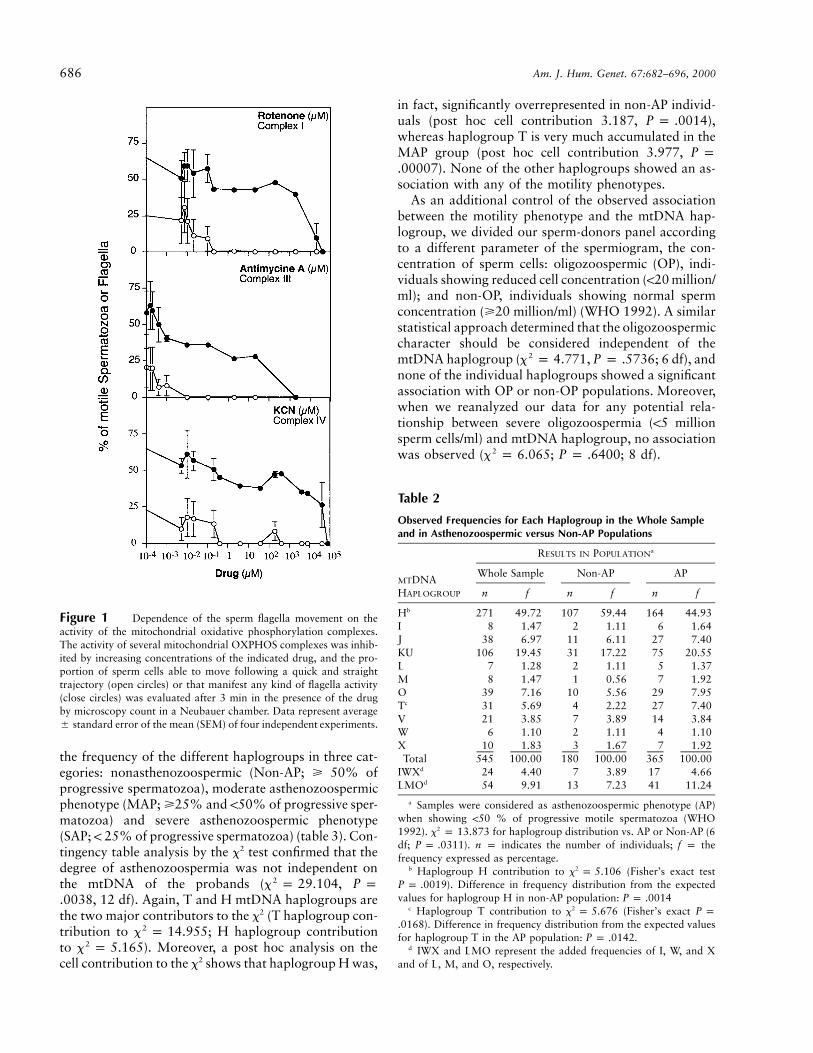
the midpiece of the cell at the position where the fla-gellum is inserted. This localization strongly suggeststhat ATP production by mitochondria can play a rele-vant role in sperm motility. However, a surprising ab-sence of consensus about the relevance of mitochondrialOXPHOS in sperm motility (Cummins et al. 1998)prompted us to investigate this aspect first. Figure 1shows how the inhibition, by specific drugs, of the ac-tivity of three OXPHOS complexes that are partiallyencoded by mtDNA progressively impairs the quality ofsperm motility and finally blocks any flagellar move-ment. These results demonstrate that the motility of hu-man spermatozoa is fully dependent on the OXPHOSfunctionality and confirm previous observations point-ing in the same direction (Ford and Harrison 1981; Hal-angk et al. 1985; Pascual et al. 1996; Ruiz-Pesini et al.1998).
mtDNA Haplogroup and Sperm Motility Phenotype
Sperm samples from 545 donors were collected andanalyzed by standard procedures (see Methods). Then,total DNA extraction and mtDNA PCR amplification,followed by restriction enzyme analysis, were performedto ascribe each donor to one of the different haplogroupspreviously described (table 1). In this study, we have usedthe nomenclature proposed by the Emory group (Wal-lace 1995; Torroni et al. 1996, 1997; Brown et al. 1997)and recently updated (Macaulay et al. 1999). In sum-mary, and in good agreement with previous descriptionsof other white populations, 190% of the individuals be-long to one of the previously known haplogroups (table2), and their distribution was similar to those describedelsewhere (Richards et al. 1996; Torroni et al. 1996,1997; Brown et al. 1997; Hofmann et al. 1997b, 1997c).
To investigate the potential genetic association be-tween mtDNA variants and asthenozoospermia, we di-vided our sample in two groups according to the motilityof the sperm cells: Asthenozoospermic (AP), individuals
with low sperm motility (! 50% of progressive sper-matozoa) and Non-AP, individuals with normal spermmotility (> 50%) (WHO 1992), and we estimated thefrequency of each haplogroup in the non-AP and APpopulations (table 2). Since the expected frequencies forseveral haplogroups were !5, we have grouped the low-represented ones (W, X, and I) according to their pro-posed evolutionary proximity (Macaulay et al. 1999).Furthermore, we have also grouped those of nonwhiteorigin, haplogroups L (African) and M (Asian), with thesamples that we could not ascribe to any of the knownhaplogroups (O). In this way, the minimum expectedfrequency to ensure the accuracy in the x2 independencetest is reached (table 2). Contingency table analysis sug-gests that the asthenozoospermic character may not beindependent on the mtDNA haplogroup ( ,2x p 13.873
, 6 df). When the contribution of the differentP p .0311haplogroups to the x2 was examined, it could be ap-preciated that T (x2 contribution 5.676) and H (x2 con-tribution 5.106) mtDNAs were the main responsible forthe high x2. Furthermore, Fisher’s exact test also suggestsa significant deviation from the expected frequencies forH ( ) and T ( ) mtDNA haplo-P p .0019 P p .0168groups. In fact, a post hoc analysis on the cell contri-bution to the x2 revealed that a significant deviation fromthe expected frequency could be observed for the pres-ence of mtDNA haplogroup H in normal individuals(post hoc cell contribution 3.187, ). This wasP p .0014also the case for the accumulation of T mtDNA hap-logroup within the asthenozoospermic population (posthoc cell contribution 2.453, ). None of theP p .0142other haplogroups showed a frequency distribution inAP and non-AP populations significantly deviated fromthe expected values when a hypothesis of independencewas assumed.
We reevaluated the association between mtDNA hap-logroups and motility phenotype by a semiquantitativeapproach. Thus, we divided our samples by calculating
686 Am. J. Hum. Genet. 67:682–696, 2000
Figure 1 Dependence of the sperm flagella movement on theactivity of the mitochondrial oxidative phosphorylation complexes.The activity of several mitochondrial OXPHOS complexes was inhib-ited by increasing concentrations of the indicated drug, and the pro-portion of sperm cells able to move following a quick and straighttrajectory (open circles) or that manifest any kind of flagella activity(close circles) was evaluated after 3 min in the presence of the drugby microscopy count in a Neubauer chamber. Data represent average5 standard error of the mean (SEM) of four independent experiments.
Table 2
Observed Frequencies for Each Haplogroup in the Whole Sampleand in Asthenozoospermic versus Non-AP Populations
MTDNAHAPLOGROUP
RESULTS IN POPULATIONa
Whole Sample Non-AP AP
n f n f n f
Hb 271 49.72 107 59.44 164 44.93I 8 1.47 2 1.11 6 1.64J 38 6.97 11 6.11 27 7.40KU 106 19.45 31 17.22 75 20.55L 7 1.28 2 1.11 5 1.37M 8 1.47 1 0.56 7 1.92O 39 7.16 10 5.56 29 7.95Tc 31 5.69 4 2.22 27 7.40V 21 3.85 7 3.89 14 3.84W 6 1.10 2 1.11 4 1.10X 10 1.83 3 1.67 7 1.92Total 545 100.00 180 100.00 365 100.00
IWXd 24 4.40 7 3.89 17 4.66LMOd 54 9.91 13 7.23 41 11.24
a Samples were considered as asthenozoospermic phenotype (AP)when showing !50 % of progressive motile spermatozoa (WHO1992). x2 p 13.873 for haplogroup distribution vs. AP or Non-AP (6df; ). n p indicates the number of individuals; f p theP p .0311frequency expressed as percentage.
b Haplogroup H contribution to (Fisher’s exact test2x p 5.106). Difference in frequency distribution from the expectedP p .0019
values for haplogroup H in non-AP population: P p .0014c Haplogroup T contribution to (Fisher’s exact2x p 5.676 P p
). Difference in frequency distribution from the expected values.0168for haplogroup T in the AP population: .P p .0142
d IWX and LMO represent the added frequencies of I, W, and Xand of L, M, and O, respectively.
the frequency of the different haplogroups in three cat-egories: nonasthenozoospermic (Non-AP; > 50% ofprogressive spermatozoa), moderate asthenozoospermicphenotype (MAP; >25% and !50% of progressive sper-matozoa) and severe asthenozoospermic phenotype(SAP; ! 25% of progressive spermatozoa) (table 3). Con-tingency table analysis by the x2 test confirmed that thedegree of asthenozoospermia was not independent onthe mtDNA of the probands ( ,2x p 29.104 P p
, 12 df). Again, T and H mtDNA haplogroups are.0038the two major contributors to the x2 (T haplogroup con-tribution to ; H haplogroup contribution2x p 14.955to ). Moreover, a post hoc analysis on the2x p 5.165cell contribution to the x2 shows that haplogroup H was,
in fact, significantly overrepresented in non-AP individ-uals (post hoc cell contribution 3.187, ),P p .0014whereas haplogroup T is very much accumulated in theMAP group (post hoc cell contribution 3.977, P p
). None of the other haplogroups showed an as-.00007sociation with any of the motility phenotypes.
As an additional control of the observed associationbetween the motility phenotype and the mtDNA hap-logroup, we divided our sperm-donors panel accordingto a different parameter of the spermiogram, the con-centration of sperm cells: oligozoospermic (OP), indi-viduals showing reduced cell concentration (!20 million/ml); and non-OP, individuals showing normal spermconcentration (>20 million/ml) (WHO 1992). A similarstatistical approach determined that the oligozoospermiccharacter should be considered independent of themtDNA haplogroup ( , ; 6 df), and2x p 4.771 P p .5736none of the individual haplogroups showed a significantassociation with OP or non-OP populations. Moreover,when we reanalyzed our data for any potential rela-tionship between severe oligozoospermia (!5 millionsperm cells/ml) and mtDNA haplogroup, no associationwas observed ( ; ; 8 df).2x p 6.065 P p .6400

Ruiz-Pesini et al.: mtDNA Haplogroups and Spermatozoa Motility 687
Table 3
Observed Frequencies for mtDNA Haplogroups in SAP, MAP, and Non-AP
MTDNAHAPLOGROUP
RESULTS IN PHENOTYPEa
Non-AP MAP SAP All
n f n f n f n f
Hb 107 59.44 100 45.66 64 43.84 271 49.72IWX 7 3.89 10 4.57 7 4.79 24 4.40J 11 6.11 19 8.68 8 5.48 38 6.97KU 31 17.22 39 17.81 36 24.66 106 19.45LMO 13 7.22 22 10.05 19 13.01 54 9.91Tc 4 2.22 23 10.50 4 2.74 31 5.69V 7 3.89 6 2.74 8 5.48 21 3.85Total 180 100.00 219 100.00 146 100.00 545 100.00
a Samples were considered as MAP when they showed !50% and >25% of pro-gressive motile spermatozoa, and they were considered as SAP when they showed!25% of progressive motile spermatozoa. for haplogroup distribution2x p 29.104vs. SAP, MAP, or non-AP (12 df; ). n p the number of individuals; f pP p .0038the frequency expressed as percentage.
b Haplogroup H contribution to . Difference in frequency distribution2x p 5.165from the expected values for haplogroup H in non-AP population: .P p .0014
c Haplogroup T contribution to . Difference in frequency distribution2x p 14.955from the expected values for haplogroup T in AP population: .P p .00007
The combination of the two characters of the sper-miogram, motility and concentration of sperm cells, de-fine four distinct phenotypes: 241 individuals were pureasthenozoospermic A (pA), 25 were pure oligozoos-permic (pO), 123 were asthenooligozoospermic (AO),and 155 did not show any deficient phenotype and weredesignated controls (C). Therefore, to confirm that theasthenozoospermic character alone is responsible for theobserved associations, the distribution of the mtDNAhaplogroups in the control subpopulation was comparedto that in the pure asthenozoospermic one (table 4). Inorder to reach the minimal number of expected individ-uals for a confident x2 analysis, the reduction in thenumber of samples forced us to consider several hap-logroups of lower interest together (IWX, LMO, and V)in one that was called “Rest.” Despite of that, the x2-independence test supports again the interpretation pro-posed above, i.e., the non-random distribution ofmtDNA haplogroups with respect to the motility phe-notype ( ; ; 8 df). Thus, a signifi-2x p 16.99 P p .0302cant accumulation of H mtDNA haplotypes within thecontrol population (post hoc test 3.282; ) andP p .001of T mtDNA haplotypes within the MAP population(post hoc test 2.650; ) was observed.P p .008
The observed accumulation of H and T mtDNAswithin the non-AP and the MAP motility groups, re-spectively, could be a secondary association determinedby an additional parameter of the seminogram. To in-vestigate this possibility, we tested the potential variationbetween haplogroups of several other parameters of theseminogram. These evaluate a potential bias in the sam-pling process (age of the donors, time between sample
collection, and analysis), differences in ejaculated vol-ume, or pH as well as in the cellular composition of thesemen (spermatozoa concentration, spermatozoa vital-ity, proportion of abnormal spermatozoa morphology,and concentration of round cells). In addition, severalbiochemical parameters that are used as markers of theprostatic functionality (citric acid, zinc, magnesium, andcalcium concentration), seminal vesicle functionality(fructose concentration) and epididimal functionality(carnitine concentration) were evaluated. The number ofindividual samples utilized for these analyses was vari-able and dependent on their availability. Therefore wealso estimated if the observed accumulation of haplo-groups T and H within the MAP and, respectively, thenon-AP population, was maintained in the subpopula-tion utilized for the analysis of each parameter. Table 5shows a summary of the results obtained and indicatesthat none of the investigated parameters but motilityphenotype is significantly different between haplogroupsH and T.
For a large set of the samples ( ), we couldn p 223perform an additional motility test consisting in the mea-surement of the maximum distance that the spermatozoapopulation from different individuals are able to swim,in 30 min; in a capillary tube introduced vertically intothe semen sample (vertical progression). This analysiswas performed before the mtDNA haplogroup of thesamples was determined and without knowing the sper-miogram analysis. As shown in figure 2, the verticalprogression of spermatozoa was variable between hap-logroups. Interestingly, it was maximum for haplogroupH and minimum for haplogroup T being significantly

688 Am. J. Hum. Genet. 67:682–696, 2000
Table 4
Observed Frequencies for mtDNA Haplogroups in Non-AP, Pure SAP, and Pure MAP
MTDNAHAPLOGROUP
RESULTS IN POPULATIONa
Non-AP Pure MAP Pure SAP All
n f n f n f n f
Hb 95 61.29 70 42.94 37 47.44 202 51.01J 8 5.16 16 9.82 5 6.41 29 7.32KU 25 16.13 32 19.63 16 20.51 73 18.43Rest 23 14.84 30 18.40 17 21.79 70 17.68Tc 4 2.58 15 9.20 3 3.85 22 5.56Total 155 100.00 163 100.00 78 100.00 396 100.00
a Samples were considered to be pure MAP when they show !50% and >25% ofprogressive motile spermatozoa and >20 # 106 spermatozoa per milliliter. Sampleswere considered to be pure SAP when they showed !25% of progressive motile sper-matozoa and >20 # 106 spermatozoa per milliliter. for haplogroup dis-2x p 16.988tribution vs. pure SAP, pure MAP, or Control (8 df; ). n p indicates theP p .0302number of individuals; f p frequency, expressed as a percentage.
b Haplogroup H contribution to . Difference in frequency distribution from2x p 5.49the expected values for haplogroup H in non-AP: .P p .001
c Haplogroup T contribution to . Difference in frequency distribution from2x p 6.78the expected values for haplogroup T in AP: .P p .008
different ( , Fisher PLSD test). The rest of theP p .029haplogroups showed an intermediate capacity of verticalprogression although the differences between them werenot significant.
Confirmation that the vertical progression is also agood quantitative estimation of the degree of astheno-zoospermia came from the fact that those individualsclassified as nonasthenozoospermic showed an averagespermatozoa vertical progression of 6.87 5 1.74 mm( ), whereas in moderate asthenozoospermic wasn p 704.89 5 1.67 mm ( ) and severe asthenozoos-n p 103permic was 2.380 5 1.74 mm ( ). As expected,n p 50there is a strong association between vertical progressionand the motility phenotype (SAP, MAP, and non-AP)established by the percentage of motile spermatozoa( ; 2 df; ; ANOVA). Furthermore,F p 101.086 P ! .0001differences in vertical progression between paired groupswere always significant as estimated by the Fisher’s PLSDpost hoc test ( in all cases).P ! .0001
Finally, to discard any bias in the sampling of ourhaplogroup T individuals, the hypervariable region I(position 16083–16378 in the noncoding region ofmtDNA) of 29 of our 31 Ts was sequenced. Thus, wewere able to identify several main sublineages with 20different haplotypes (fig. 3). Interestingly, they includeall the T branches described for the German population(Hofmann et al. 1997c), showing that our T populationis truly representative of the white T haplogroup. Inaddition, the non-AP as well as the SAP individuals werescattered among the different branches of the T haplo-type tree. These results strongly suggest that the accu-mulation of T in the MAP population is due to the hap-
logroup itself rather than to a particular sublineagewithin the haplogroup T.
Different OXPHOS Performance between SpermSamples Carrying H or T mtDNAs
In order to get some insights on the molecular mech-anism underlying the observed association betweenmtDNA haplogroups and spermatozoa motility, we firsttested the OXPHOS performance in sperm homogenateof the 136 individuals from whom we had enough avail-able sample. Those 136 samples represented a mix ofSAP, MAP, and non-AP (39, 58, and 39 samples, re-spectively) and a variety of haplogroups H, J, KU, andT (60, 17, 27, and 5, respectively). Samples belongingto the remaining haplogroups (I, X, V, W, L, M, and O;5, 3, 3, 1, 4, 4, and 7) were grouped together ( )n p 27and were called “Rest” for the purpose of statisticalanalysis. As shown in figure 4, complex I–specific activ-ity measured in spermatozoa homogenates was variablebetween different haplogroups, being, on average, 22%lower in samples carrying T mtDNAs than in those car-rying H mtDNAs. However, this variability was not sig-nificant enough to reject the independence hypothesisbetween the mtDNA haplogroups and NADH DH ac-tivity (ANOVA ), and no significant differencesP p .593between paired haplogroups were observed. Since all Tsamples fall in the MAP category, the difference inNADH DH activity considering only MAP individualswas also investigated. Again, a nonsignificant reductionof the complex I activity of T individuals versus that inH individuals could be observed (ANOVA ).P p .873

Ruiz-Pesini et al.: mtDNA Haplogroups and Spermatozoa Motility 689
Figure 2 Vertical-progression analysis. Differences in the abilityof spermatozoa carrying different mtDNAs to swim from the semeninto a capillar tube in a period of 30 min. n is the number of samples,and the asterisk (*) indicates significant differences between the dis-tance of vertical progression for haplogroup T versus haplogroup Hcarrying mtDNA samples ( ; Fisher’s PLSD test).P p .029
Table 5
Differences in Seminal Parameters between H and T mtDNA Carrier Populations
PARAMETER
nWHOLE
POPULATION
HAPLOGROUPT VER-SUS Ha
T IN
MAPb
H IN
NON-APbAll H T H T
Age (years) 360 169 17 32.6 5 6.0 32.6 5 6.3 33.6 5 4.8 .4778 !.001 !.001Preanalytic time (min) 235 109 12 45.9 5 14.7 44.1 5 12.9 47.9 5 18.8 .3933 .002 .002Seminal volume (ml) 513 252 31 3.3 5 1.7 3.3 5 1.7 3.4 5 1.9 .7039 !.001 !.001Seminal pH 317 156 18 7.7 5 .3 7.8 5 .3 7.8 5 .4 .4213 .004 .002Prostatic markers:
Citric acid (mg/dl) 202 95 11 533 5 300 570 5 343 550 5 244 .8329 !.001 !.001Zn (mg/dl) 201 95 11 10.8 5 6.3 11.3 5 6.4 11.9 5 6.2 .8082 !.001 !.001Mg (mg/dl) 202 95 11 8.2 5 4.4 8.5 5 4.6 7.5 5 4.2 .8080 !.001 !.001Ca (mg/dl) 202 95 11 35.4 5 14.6 37.5 5 15.6 33.6 5 12.6 .4035 !.001 !.001
Seminal vesicle marker:Fructose (mg/dl) 202 95 11 295 5 132 281 5 142 344 5 164 .1383 !.001 !.001
Epididimal marker:Carnitine (mM) 197 93 11 485 5 231 497 5 234 446 5 211 .4877 !.001 !.001
Cellular parameters:Sperm concentration (million cells/ml) 544 270 31 48.4 5 44.1 51.4 5 46.3 40.9 5 30.6 .2084 !.001 !.001Vital spermatozoa (%) 211 100 17 49.6 5 16.7 49.5 5 17.8 47.2 5 13.8 .6577 .006 .006Abnormal spermatozoa (%) 238 119 17 50.7 5 17.0 48.4 5 16.8 52.1 5 14.9 .4082 !.001 !.001Round cells (million cells/ml) 251 119 15 4.3 5 3.5 4.0 5 3.2 3.8 5 3.2 .7807 !.001 !.001
a Estimation of the potential signification (Fisher’s PLSD test) for the difference between the mean values of the indicated parameter forH and T mtDNA carriers.
b Significance of the association of T and H individuals with the MAP and non-AP populations, respectively, for the subset of samplesincluded in the analysis of each seminal parameter.
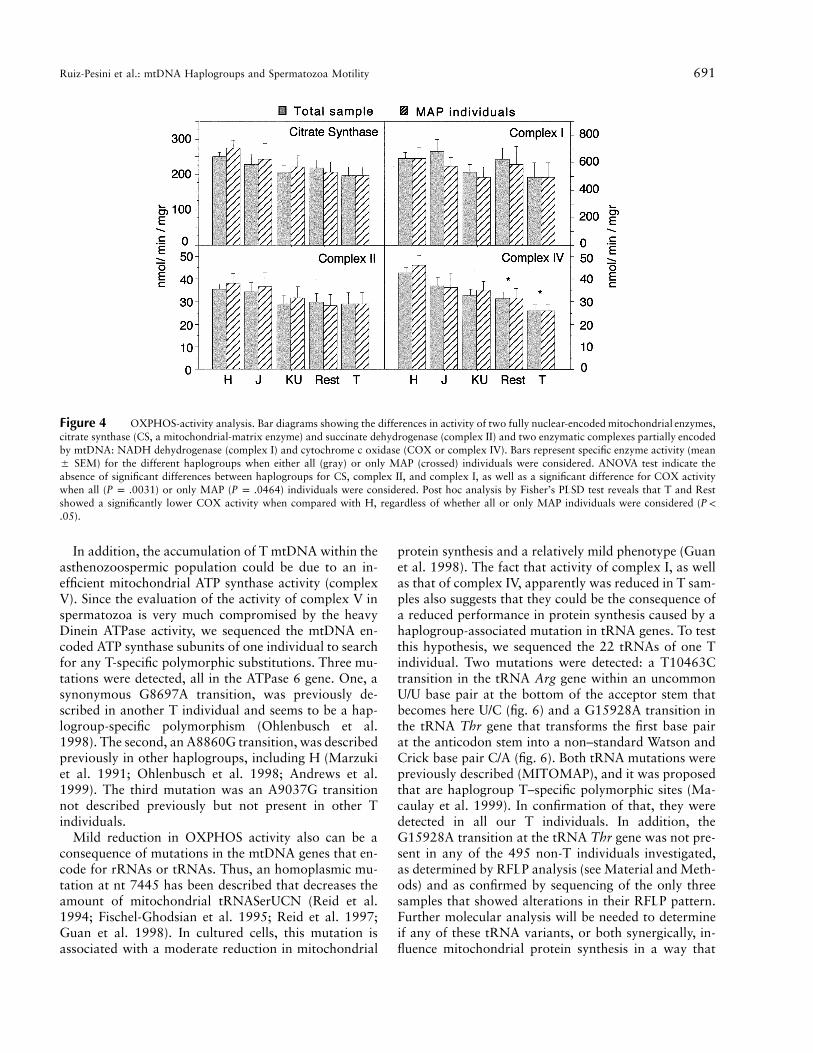
On the contrary, ANOVA analysis indicated that com-plex IV–specific activity showed a significant variabilitybetween the different haplogroups regardless of the mo-tility phenotype in the subpopulations included in theanalysis (ANOVA for total sample andP p .0031
for MAP individuals; fig. 4). Thus, T hap-P p .0464logroup showed the lowest COX activity when com-pared with H mtDNA haplogroup. This difference wassignificant by the Fisher’s PLSD post hoc test (P p
for total sample and for MAP indi-.0184 P p .0159viduals). The other haplogroups showed intermediateCOX activity that were not (J and KU) or were signif-icantly different (Rest, for total sample andP p .0016
, for MAP) from that estimated for the HP p .0116haplogroup (fig. 4). In addition, small and nonsignificantdifferences between haplogroups in the specific activityof complex II (the only respiratory complex with allsubunits encoded by nuclear genes) and citrate synthase(a mitochondrial matrix located enzyme) could be ob-served (fig. 4).
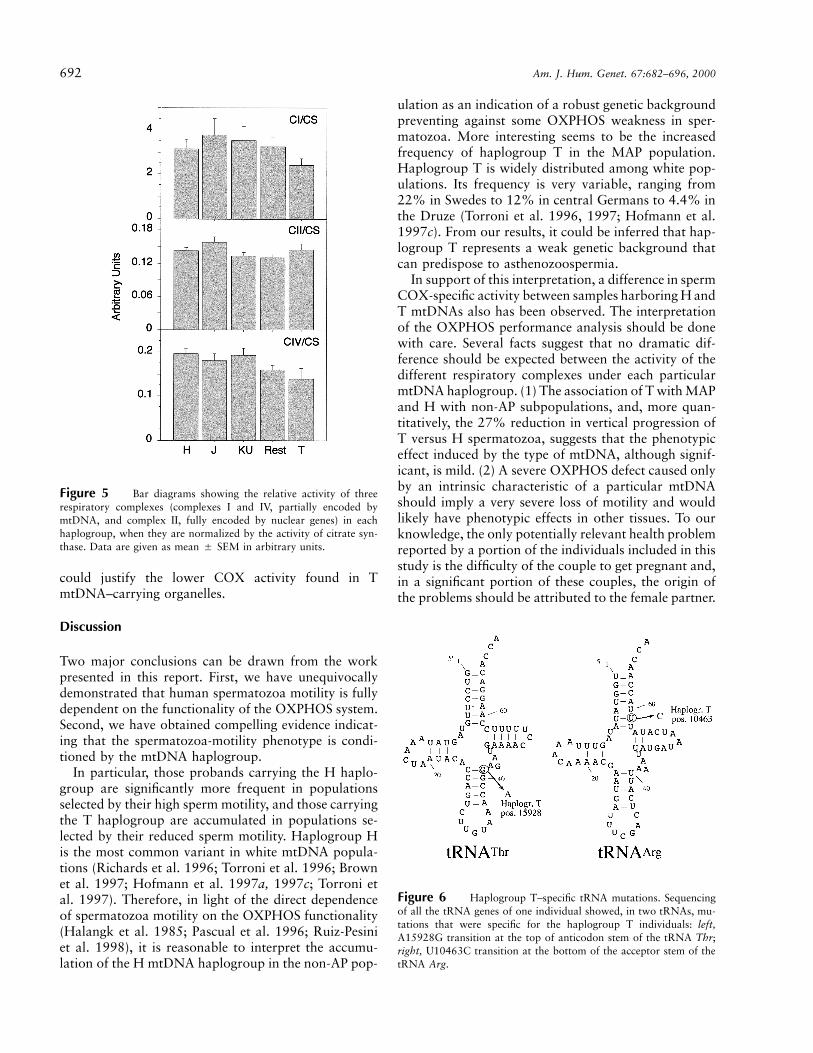
Furthermore, when the activity of the different res-piratory complexes was normalized to the activity of thecitrate synthase, an interesting figure arose (fig. 5). Bothcomplex I and complex IV showed high relative activityin samples carrying the H mtDNA haplogroup and thelowest relative activity in samples harboring the TmtDNA. Thus, T samples showed 23% and 29% re-ductions, respectively, in complexes I and IV, with re-
spect to H samples. However, these differences were notstatistically significant by the ANOVA test. Moreover,the activity of complex II, when normalized by citratesynthase, was virtually identical between the differenthaplogroups, and, in particular, between H and T. De-spite the absence of statistical significance, it should beremarked that those complexes that are partially en-coded by mtDNA (complex I and IV) showed a similarreduction in their relative activity per mitochondria be-tween haplogroups H and T. On the contrary, the com-

690 Am. J. Hum. Genet. 67:682–696, 2000
Figure 3 Sequence analysis of mtDNA haplogroup T carriers. Nucleotide differences at the hypervariable region I (HVRI) of the noncodingregion of mtDNA that define 20 haplotypes in 29 individuals harboring the T haplogroup. The phenotype of the different individuals is indicatedas SAP (blackened circles) or non-AP (unblackened circles); all the other samples showed MAP (striped circles). Each individual is indicated bya letter/number code.
plex that has no subunits encoded by mtDNA showedsimilar activity in all haplogroups. Therefore, samplesof individuals belonging to the T and H mtDNA hap-logroups seem to present the largest difference in spermOXPHOS performance between haplogroups.
Additional Haplogroup T–Specific mtDNAPolymorphisms
The differences in OXPHOS performance betweenhaplogroups were not a consequence of haplogroup-spe-cific differences in mtDNA level as estimated by ANOVAanalysis, since the proportion of mtDNA/nDNA be-tween the different haplogroups was very similar (datanot shown). Several polymorphic markers that differ-entiate the T haplogroup are located at genes that encodecomplex I subunits (T4216C at ND1, A 4917G at ND2,and G13368A at ND5) which promote either amino acidsubstitutions (YrH at ND1 and DrN at ND2) or nochanges (ND5). These changes could be invoked to ex-plain the apparently lower performance of complex I in
T mtDNA carrying individuals. However, these couldnot explain the more significant reduction in complexIV activity observed in T individuals. Therefore, to in-vestigate the molecular reason why COX activity wasreduced in T samples, we sequenced the full set of COXgenes encoded in the mtDNA for one T individual. Threealterations from the Cambridge sequence were detected.One, the expected C7028T transition, was located in theCO I gene (which is common to all white haplogroups,with the exception of H) and is a synonymous mutation.The second was located in the CO II gene and is also asynonymous C7891T transition not previously de-scribed. Finally, the third mutation, a G9559C trans-version, was located in the CO III gene, and it impliesa variation from proline to arginine. This last mutationhas been recently reported as an error of the Cambridgesequence (Andrews et al. 1999) and is not specific forhaplogroup T. Therefore, none of these polymorphismscould justify the reduced COX activity associated withT mtDNA.
Ruiz-Pesini et al.: mtDNA Haplogroups and Spermatozoa Motility 691
Figure 4 OXPHOS-activity analysis. Bar diagrams showing the differences in activity of two fully nuclear-encoded mitochondrial enzymes,citrate synthase (CS, a mitochondrial-matrix enzyme) and succinate dehydrogenase (complex II) and two enzymatic complexes partially encodedby mtDNA: NADH dehydrogenase (complex I) and cytochrome c oxidase (COX or complex IV). Bars represent specific enzyme activity (mean5 SEM) for the different haplogroups when either all (gray) or only MAP (crossed) individuals were considered. ANOVA test indicate theabsence of significant differences between haplogroups for CS, complex II, and complex I, as well as a significant difference for COX activitywhen all ( ) or only MAP ( ) individuals were considered. Post hoc analysis by Fisher’s PLSD test reveals that T and RestP p .0031 P p .0464showed a significantly lower COX activity when compared with H, regardless of whether all or only MAP individuals were considered (P !
)..05
In addition, the accumulation of T mtDNA within theasthenozoospermic population could be due to an in-efficient mitochondrial ATP synthase activity (complexV). Since the evaluation of the activity of complex V inspermatozoa is very much compromised by the heavyDinein ATPase activity, we sequenced the mtDNA en-coded ATP synthase subunits of one individual to searchfor any T-specific polymorphic substitutions. Three mu-tations were detected, all in the ATPase 6 gene. One, asynonymous G8697A transition, was previously de-scribed in another T individual and seems to be a hap-logroup-specific polymorphism (Ohlenbusch et al.1998). The second, an A8860G transition, was describedpreviously in other haplogroups, including H (Marzukiet al. 1991; Ohlenbusch et al. 1998; Andrews et al.1999). The third mutation was an A9037G transitionnot described previously but not present in other Tindividuals.
Mild reduction in OXPHOS activity also can be aconsequence of mutations in the mtDNA genes that en-code for rRNAs or tRNAs. Thus, an homoplasmic mu-tation at nt 7445 has been described that decreases theamount of mitochondrial tRNASerUCN (Reid et al.1994; Fischel-Ghodsian et al. 1995; Reid et al. 1997;Guan et al. 1998). In cultured cells, this mutation isassociated with a moderate reduction in mitochondrial
protein synthesis and a relatively mild phenotype (Guanet al. 1998). The fact that activity of complex I, as wellas that of complex IV, apparently was reduced in T sam-ples also suggests that they could be the consequence ofa reduced performance in protein synthesis caused by ahaplogroup-associated mutation in tRNA genes. To testthis hypothesis, we sequenced the 22 tRNAs of one Tindividual. Two mutations were detected: a T10463Ctransition in the tRNA Arg gene within an uncommonU/U base pair at the bottom of the acceptor stem thatbecomes here U/C (fig. 6) and a G15928A transition inthe tRNA Thr gene that transforms the first base pairat the anticodon stem into a non–standard Watson andCrick base pair C/A (fig. 6). Both tRNA mutations werepreviously described (MITOMAP), and it was proposedthat are haplogroup T–specific polymorphic sites (Ma-caulay et al. 1999). In confirmation of that, they weredetected in all our T individuals. In addition, theG15928A transition at the tRNA Thr gene was not pre-sent in any of the 495 non-T individuals investigated,as determined by RFLP analysis (see Material and Meth-ods) and as confirmed by sequencing of the only threesamples that showed alterations in their RFLP pattern.Further molecular analysis will be needed to determineif any of these tRNA variants, or both synergically, in-fluence mitochondrial protein synthesis in a way that
692 Am. J. Hum. Genet. 67:682–696, 2000
Figure 5 Bar diagrams showing the relative activity of threerespiratory complexes (complexes I and IV, partially encoded bymtDNA, and complex II, fully encoded by nuclear genes) in eachhaplogroup, when they are normalized by the activity of citrate syn-thase. Data are given as mean 5 SEM in arbitrary units.
Figure 6 Haplogroup T–specific tRNA mutations. Sequencingof all the tRNA genes of one individual showed, in two tRNAs, mu-tations that were specific for the haplogroup T individuals: left,A15928G transition at the top of anticodon stem of the tRNA Thr;right, U10463C transition at the bottom of the acceptor stem of thetRNA Arg.
could justify the lower COX activity found in TmtDNA–carrying organelles.
Discussion
Two major conclusions can be drawn from the workpresented in this report. First, we have unequivocallydemonstrated that human spermatozoa motility is fullydependent on the functionality of the OXPHOS system.Second, we have obtained compelling evidence indicat-ing that the spermatozoa-motility phenotype is condi-tioned by the mtDNA haplogroup.
In particular, those probands carrying the H haplo-group are significantly more frequent in populationsselected by their high sperm motility, and those carryingthe T haplogroup are accumulated in populations se-lected by their reduced sperm motility. Haplogroup His the most common variant in white mtDNA popula-tions (Richards et al. 1996; Torroni et al. 1996; Brownet al. 1997; Hofmann et al. 1997a, 1997c; Torroni etal. 1997). Therefore, in light of the direct dependenceof spermatozoa motility on the OXPHOS functionality(Halangk et al. 1985; Pascual et al. 1996; Ruiz-Pesiniet al. 1998), it is reasonable to interpret the accumu-lation of the H mtDNA haplogroup in the non-AP pop-
ulation as an indication of a robust genetic backgroundpreventing against some OXPHOS weakness in sper-matozoa. More interesting seems to be the increasedfrequency of haplogroup T in the MAP population.Haplogroup T is widely distributed among white pop-ulations. Its frequency is very variable, ranging from22% in Swedes to 12% in central Germans to 4.4% inthe Druze (Torroni et al. 1996, 1997; Hofmann et al.1997c). From our results, it could be inferred that hap-logroup T represents a weak genetic background thatcan predispose to asthenozoospermia.
In support of this interpretation, a difference in spermCOX-specific activity between samples harboring H andT mtDNAs also has been observed. The interpretationof the OXPHOS performance analysis should be donewith care. Several facts suggest that no dramatic dif-ference should be expected between the activity of thedifferent respiratory complexes under each particularmtDNA haplogroup. (1) The association of T with MAPand H with non-AP subpopulations, and, more quan-titatively, the 27% reduction in vertical progression ofT versus H spermatozoa, suggests that the phenotypiceffect induced by the type of mtDNA, although signif-icant, is mild. (2) A severe OXPHOS defect caused onlyby an intrinsic characteristic of a particular mtDNAshould imply a very severe loss of motility and wouldlikely have phenotypic effects in other tissues. To ourknowledge, the only potentially relevant health problemreported by a portion of the individuals included in thisstudy is the difficulty of the couple to get pregnant and,in a significant portion of these couples, the origin ofthe problems should be attributed to the female partner.

Ruiz-Pesini et al.: mtDNA Haplogroups and Spermatozoa Motility 693
On the contrary, if specific particularities of the spermOXPHOS system biogenesis were the main factor re-sponsible for the association between low sperm mo-tility and haplogroup T, either severe or moderate as-thenozoospermic phenotype could be expected withoutcompromising the OXPHOS performance in other tis-sues. (3) However, the relatively high frequency of theT mtDNA in white populations strongly suggests thatthe effect of this mtDNA in male fertility should not bedramatic. This is true since the lack of selective pressureagainst male mtDNA is not absolute because popula-tions with a high proportion of otherwise healthy in-fertile males, will reduce the successful pregnancy rate,and the survival of the population would be compro-mised. It should be mentioned here that MAP men mustbe considered subfertile individuals, rather than infertileones (Baker 1994). Therefore, it is reasonable to expectonly mild OXPHOS differences between H and TmtDNAs.
The determination of consistent small differences inthe activity of OXPHOS complexes between samples isalways compromised by the high intrinsic variability ofthe enzymatic determinations. In fact, this has been alsodifficult to establish in well-characterized pathogenichomoplasmic mtDNA mutations—that is, those causingnonsyndromic deafness (Prezant et al. 1993; Reid et al.1994; Fischel-Ghodsian et al. 1995) or Leber’s opticneuropathy (LHON) (Howell 1999) (see below). Inspite of that, in this work, we were able to detect sta-tistically significant differences in the COX activity be-tween individuals harboring the H mtDNA and thoseharboring the T mtDNA. The difference is maintainedwhen the activity is normalized by a mitochondrial-matrix enzyme activity (citrate synthase), although thestatistical significance is lost. Nevertheless, there are ad-ditional indications that made us to propose that theCOX activity—and probably the NADH DH activityas well—are truly different between spermatozoa har-boring H and T mtDNAs. First, there is a coherentrelationship between the accumulation of H or T in-dividuals within the non-AP and AP populations, re-spectively, and the OXPHOS figures. Second, and moreimportantly, when normalized by citrate synthase, thereis a positive correlation between the activity of the com-plexes partially encoded by mtDNA (complex I, 23%decreased in T vs. H; complex IV, 29% decreased in Tvs. H). On the contrary, this correlation is not main-tained with the only complex that has all its subunitsencoded by nuclear genes (complex II, 1% increased inT vs. H). Very interestingly, the amount of reduction incomplex I or complex IV needed to affect overall cellrespiration in cultured human cells, and, therefore, ATPproduction is 20% for COX (Villani and Attardi 1997)and ∼20% for NADH DH (Bai et al. 2000). Thus, theestimated reduction in OXPHOS performance in T ver-
sus H mtDNA backgrounds seems to be sufficient toinduce differences in overall respiration rate and ATPproduction. Then, the relative lower ATP productioncapacity of spermatozoa harboring T mtDNA, in a sit-uation of high energy demands (motile spermatozoa),would be the cause of the observed differences in themotility of the spermatozoa. Therefore, although westill must be cautious in the interpretation of this data,we strongly believe that they indicate that a minor, butconsistent, general difference between the OXPHOSperformance of spermatozoa harboring H or T mtDNAsexplains their association with populations showingvariable degree of sperm-motility capacity.
If this interpretation is correct, it is still necessary tounderstand how established mtDNA haplogroups (likeT) can favor asthenozoospermia and not obviously in-volve other tissues. It could be that some particular char-acteristics of spermatozoa (e.g., nuclear-encoded sperm-specific OXPHOS subunits, etc.) make them especiallysensitive to particular haplogroups. Therefore, this sen-sitivity would be not only an intrinsic characteristic ofa particular mtDNA, but also a consequence of the spe-cific characteristics of the biogenesis of the sperm OX-PHOS system. Alternatively, it could happen that, infact, some haplogroups promote a reduction in OX-PHOS performance, albeit a very mild one in normalcircumstances. Thus, only in the presence of environ-mental insults and/or certain nuclear backgrounds willthe OXPHOS activity associated with a particularly in-efficient mtDNA haplogroup drop below the pathogenicthreshold. On the contrary, a more robust haplogroupwill keep the OXPHOS activity over such a thresholdin similar circumstances. It is, then, a plausible hypoth-esis that one of the more demanding OXPHOS activities(e.g., flagellar movement) will be affected first. More-over, this would also imply that, under certain circum-stances, this lower performance could be further am-plified and could promote defects other than moderatedasthenozoospermia.
Tissue specificity and variable degree of penetranceare hallmarks of mtDNA mutation–dependent disor-ders, most typically of those associated with homo-plasmic mtDNA mutations that cause nonsyndromicdeafness (Prezant et al. 1993; Reid et al. 1994; Fischel-Ghodsian et al. 1995) or LHON (for review, see Howell[1999]). The use of cellular models for the investigationof an homoplasmic mtDNA mutation at position 7445,affecting tRNA Ser (UCN) precursor processing, a non-syndromic deafness–causing mutation, has revealed amild biochemical phenotype (Guan et al. 1998) or acomplete absence of one (Reid et al. 1997). However,a clear defective molecular phenotype could be observedin all cases: a severe reduction in the level of tRNA Ser(UCN) (Reid et al. 1997; Guan et al. 1998). On theother hand, a potential influence of the nuclear context

694 Am. J. Hum. Genet. 67:682–696, 2000
in the expression of the biochemical defects associatedwith a mitochondrial 12S rRNA mutation causing alsononsyndromic deafness has been proposed (Guan et al.1996). Interestingly enough, it has also been proposedthat, at least in some families, the latest mutation con-fers susceptibility to aminoglycoside-induced ototoxic-ity (Prezant et al. 1993). Therefore, the molecular con-sequence of a mild (and homoplasmic) mtDNAmutation is transformed into a biochemical defect onlyafter environmental insults, in susceptible nuclear back-grounds, and/or in specific cellular types. Despite that,the primary molecular cause of the disease is themtDNA mutation. Thus, analysis of the expression ofwell-characterized homoplasmic pathogenic mtDNAmutations can illustrate the potential phenotypic con-sequences, although milder than those of such muta-tions, of some mtDNA haplogroups.
Additional observations give support to the interpre-tation that mtDNA haplogroup T is intrinsically proneto development of OXPHOS defects. DIDMOAD is arare human disease characterized by diabetes insipidus,diabetes mellitus, optic atrophy and deafness, and it canbe caused by defects in both nuclear and mitochondrialgenomes (Rotig et al. 1993; Polymeropoulos et al.1994). Very interestingly, a group of eight DIDMOADpatients were found to be preferentially associated withhaplogroup T (Hofmann et al. 1997b, 1997c). In ad-dition, an increased frequency of T mtDNA among mul-tiple sclerosis (MS) patients has been described (Kalmanet al. 1995; Mayr-Wohlfart et al. 1996).
The demonstration of negative (H) as well as positive(T) association of mtDNA haplogroups with astheno-zoospermia strongly supports a model in which mtDNAhaplogroups could contribute differentially to the per-formance of the OXPHOS system. In fact, it is intrigu-ing that other mtDNA haplogroups were asymmetri-cally distributed between AP and non-AP populationsand showed differences in COX-specific activity. It isalso plausible that only certain sublineages within a par-ticular haplogroup may be phenotypically relevant.Therefore, further investigation, with a more extendedsample, will be needed to establish definitively the po-tential influence of other white mtDNA haplogroups.Nevertheless, a tendency has been observed suggestingthat mtDNA haplogroups, at first thought to be phe-notypically indistinguishable, could have OXPHOSphenotypic consequences and be involved in humanpathology.
In this respect, the existence of tissue-specific selectivepressures for different polymorphic mouse mtDNA var-iants has been recently proposed (Jenuth et al. 1997).There is also an increasing amount of evidence sug-gesting that the penetrance of two of the three commonprimary LHON mutations is significantly increased inhaplogroup J (Brown et al. 1997; Hofmann et al. 1997b,
1997c; Torroni et al. 1997). In addition, the positiveand negative associations of haplogroups T and H withasthenozoospermia found in this report, the prevalenceof haplogroup T in DIDMOAD and MS patients men-tioned above (Kalman et al. 1995; Mayr-Wohlfart et al.1996; Hofmann et al. 1997b, 1997c), the accumulationof haplogroup U in occipital stroke (Majamaa et al.1998), and the J haplogroup in human centenarians (DeBenedictis et al. 1999) also point in the same direction.
Asthenozoospermia is considered a major cause ofuntreatable male subfertility (Baker 1994). The role ofhaplogroup T in promoting asthenozoospermia is prob-ably related to an intrinsic higher sensitivity of the OX-PHOS energy production to a variety of environmentalor genetic factors. Thus, this mtDNA background couldbe a secondary, but relevant, contributing factor in atleast 7%–10% of the asthenozoospermic males. More-over, it is very likely that future studies will extend fur-ther the implication of both mtDNA- and nuclear-en-coded OXPHOS genes as a major cause of spermdysfunction (Følgero et al. 1993; Frank and Hurst 1996;Kao et al. 1995; St. John et al. 1997; Zeviani and An-tozzi 1997; Cummins et al. 1998; Ruiz-Pesini et al.1998). Then, the isolation of well-defined genetic back-grounds that are positively or negatively associated withasthenozoospermia can contribute to understanding ofthe causes of male infertility and can help to better de-fine therapeutic strategies.
Acknowledgments
These investigations were supported by the Spanish Fondode Investigaciones Sanitarias (FIS95-1783 and FIS98-1033)and by the Ayuntamiento de Zaragoza. We are very gratefulto Drs. F. Martınez-Azorın, P. Fernandez-Sılva, J. Arenas, L.Rodrıguez-Vela, C. Leal-Carinena, F. Aisa, J. A. Duque and J.Sanchez-Rubio for help in various phases of the work. Thetechnical assistance of Santiago Morales and Carsten Krantzis gratefully acknowledged.
Electronic-Database Information
The URL for data in this article is as follows:
MITOMAP: A Human Mitochondrial Genome Database,http://www.gen.emory.edu/mitomap.html
References
Andrews RM, Kubacka I, Chinnery PF, Lightowlers RN, Turn-bull DM, Howell N (1999) Reanalysis and revision of theCambridge reference sequence for human mitochondrialDNA. Nat Genet 23:147
Bai Y, Shakeley RM, Attardi G (2000) Tight control of res-piration by NADH dehydrogenase ND5 subunit gene ex-pression in mouse mitochondria. Mol Cell Biol 20:805–815

Ruiz-Pesini et al.: mtDNA Haplogroups and Spermatozoa Motility 695
Baker HW (1994) Clinical male infertility. II. Critical evalu-ation of the prospects for therapy. Reprod Fertil Dev 6:9–12
Brown MD, Sun F, Wallace DC (1997) Clustering of CaucasianLeber hereditary optic neuropathy patients containing the11778 or 14484 mutations on an mtDNA lineage. Am JHum Genet 60:381–387
Cummins JM, Jequier AM, Martin R, Mehmet D, GoldblattJ (1998) Semen levels of mitochondrial DNA deletions inmen attending an infertility clinic do not correlate with phe-notype. Int J Androl 21:47–52
De Benedictis G, Rose G, Carrieri G, De Luca M, Falcone E,Passarino G, Bonafe M, Monti D, Baggio G, Bertolini S,Mari D, Mattace R, Franceschi C (1999) MitochondrialDNA inherited variants are associated with successful agingand longevity in humans. Faseb J 13:1532–1536
Enriquez JA, Chomyn A, Attardi G (1995) MtDNA mutationin MERRF syndrome causes defective aminoacylation oftRNA(Lys) and premature translation termination. Nat Ge-net 10:47–55
Fischel-Ghodsian N, Prezant TR, Fournier P, Stewart IA, MawM (1995) Mitochondrial mutation associated with nonsyn-dromic deafness. Am J Otolaryngol 16:403–408
Følgero T, Bertheussen K, Lindal S, Torbergsen T, Oian P(1993) Mitochondrial Disease and Reduced Sperm Motility.Hum Reprod 8:1863–1868
Ford WC, Harrison A (1981) The role of oxidative phos-phorylation in the generation of ATP in human spermato-zoa. J Reprod Fertil 63:271–278
Frank SA, Hurst LD (1996) Mitochondria and male disease.Nature 383:224
Guan MX, Enriquez JA, Fischel-Ghodsian N, Puranam RS,Lin CP, Maw MA, Attardi G (1998) The deafness-associatedmitochondrial DNA mutation at position 7445, which af-fects tRNASer(UCN) precursor processing, has long-rangeeffects on NADH dehydrogenase subunit ND6 gene ex-pression. Mol Cell Biol 18:5868–5879
Guan MX, Fischel-Ghodsian N, Attardi G (1996) Biochemicalevidence for nuclear gene involvement in phenotype of non-syndromic deafness associated with mitochondrial 12SrRNA mutation. Hum Mol Genet 5:963–971
Halangk W, Bohnensack R, Kunz W (1985) Interdependenceof mitochondrial ATP production and extramitochondrialATP utilization in intact spermatozoa. Biochim Biophys Acta808:316–322
Hofmann S, Bezold R, Jaksch M, Kaufhold P, Obermaier-Kus-ser B, Gerbitz KD (1997a) Analysis of the mitochondrialDNA from patients with Wolfram (DIDMOAD) syndrome.Mol Cell Biochem 174:209–213
Hofmann S, Bezold R, Jaksch M, Obermaier-Kusser B, Mer-tens S, Kaufhold P, Rabl W, Hecker W, Gerbitz KD (1997b)Wolfram (DIDMOAD) syndrome and Leber hereditary opticneuropathy (LHON) are associated with distinct mitochon-drial DNA haplotypes. Genomics 39:8–18
Hofmann S, Jaksch M, Bezold R, Mertens S, Aholt S, PaprottaA, Gerbitz KD (1997c) Population genetics and disease sus-ceptibility: characterization of central European haplo-groups by mtDNA gene mutations, correlation with D loopvariants and association with disease. Hum Mol Genet 6:1835–1846
Houshmand M, Larsson NG, Holme E, Oldfors A, Tulinius
MH, Andersen O (1994) Automatic sequencing of mito-chondrial tRNA genes in patients with mitochondrial en-cephalomyopathy. Biochim Biophys Acta 1226:49–55
Howell N (1999) Human mitochondrial diseases: answeringquestions and questioning answers. Int Rev Cytol 186:49–116
Jenuth JP, Peterson AC, Shoubridge EA (1997) Tissue-specificselection for different mtDNA genotypes in heteroplasmicmice. Nat Genet 16:93–95
Kalman B, Lublin FD, Alder H (1995) Mitochondrial DNAmutations in multiple sclerosis. Mult Scler 1:32–36
Kao SH, Chao HT, Wei YH (1995) Mitochondrial deoxyri-bonucleic acid 4977-bp deletion is associated with dimin-ished fertility and motility of human sperm. Biol Reprod 52:729–736
Larsson NG, Clayton DA (1995) Molecular genetic aspects ofhuman mitochondrial disorders. Annu Rev Genet 29:151–178
Macaulay V, Richards M, Hickey E, Vega E, Cruciani F, GuidaV, Scozzari R, Bonne-Tamir B, Sykes B, Torroni A (1999)The emerging tree of West Eurasian mtDNAs: a synthesisof control- region sequences and RFLPs. Am J Hum Genet64:232–249
Majamaa K, Finnila S, Turkka J, Hassinen IE (1998) Mito-chondrial DNA haplogroup U as a risk factor for occipitalstroke in migraine. Lancet 352:455–456
Marzuki S, Noer AS, Lertrit P, Thyagarajan D, Kapsa R, Ut-thanaphol P, Byrne E (1991) Normal variants of humanmitochondrial DNA and translation products: the buildingof a reference data base. Hum Genet 88:139–145
Mayr-Wohlfart U, Paulus C, Henneberg A, Rodel G (1996)Mitochondrial DNA mutations in multiple sclerosis patientswith severe optic involvement. Acta Neurol Scand 94:167–171
Ohlenbusch A, Wilichowski E, Hanefeld F (1998) Character-ization of the mitochondrial genome in childhood multiplesclerosis I. Optic neuritis and LHON mutations. Neurope-diatrics 29:175–179
Pascual ML, Cebrian-Perez JA, Lopez-Perez MJ, Muino-Blanco T (1996) Short-term inhibition of the energy metab-olism affects motility but not surface properties of spermcells. Biosci Rep 16:35–40
Polymeropoulos MH, Swift RG, Swift M (1994) Linkage ofthe gene for Wolfram syndrome to markers on the short armof chromosome 4. Nat Genet 8:95–97
Prezant TR, Agapian JV, Bohlman MC, Bu X, Oztas S, QiuWQ, Arnos KS, Cortopassi GA, Jaber L, Roteer JI, ShohatM, Fischel-Ghodsian N (1993) Mitochondrial ribosomalRNA mutation associated with both antibiotic-induced andnon-syndromic deafness. Nat Genet 4:289–294
Reid FM, Rovio A, Holt IJ, Jacobs HT (1997) Molecular phe-notype of a human lymphoblastoid cell-line homoplasmicfor the np 7445 deafness-associated mitochondrial muta-tion. Hum Mol Genet 6:443–449
Reid FM, Vernham GA, Jacobs HT (1994) A novel mito-chondrial point mutation in a maternal pedigree with sen-sorineural deafness. Hum Mutat 3:243–247
Richards M, Corte-Real H, Forster P, Macaulay V, Wilkinson-Herbots H, Demaine A, Papiha S, Hedges R, Bandelt HJ,Sykes B (1996) Paleolithic and neolithic lineages in the Eu-

696 Am. J. Hum. Genet. 67:682–696, 2000
ropean mitochondrial gene pool. Am J Hum Genet 59:185–203
Rodriguez-Segade S, de la Pena CA, Paz JM, Del Rio R (1985)Determination of L-carnitine in serum, and implementationon the ABA-100 and CentrifiChem 600. Clin Chem 31:754–757
Rotig A, Cormier V, Chatelain P, Francois R, Saudubray JM,Rustin P, Munnich A (1993) Deletion of MitochondrialDNA in a case of early-onset diabetes-mellitus, optic atro-phy, and deafness (Wolfram syndrome, MIM 222300). JClin Invest 91:1095–1098
Ruiz-Pesini E, Diez C, Lapena AC, Perez-Martos A, MontoyaJ, Alvarez E, Arenas J, Lopez-Perez M (1998) Correlationof sperm motility with mitochondrial enzymatic activities.Clin Chem 44:1616–1620
Schon EA, Bonilla E, DiMauro S (1997) Mitochondrial DNAmutations and pathogenesis. J Bioenerg Biomembrane 29:131–149
St. John JC, Cooke ID, Barratt CL (1997) Mitochondrial mu-tations and male infertility. Nat Med 3:124–125
Torroni A, Huoponen K, Francalacci P, Petrozzi M, MorelliL, Scozzari R, Obinu D, Savontaus ML, Wallace DC (1996)
Classification of European mtDNAs from an analysis ofthree European populations. Genetics 144:1835–1850
Torroni A, Petrozzi M, D’Urbano L, Sellitto D, Zeviani M,Carrara F, Carducci C, Leuzzi V, Carelli V, Barboni P, DeNegri A, Scozzari R (1997) Haplotype and phylogeneticanalyses suggest that one European-specific mtDNA back-ground plays a role in the expression of Leber hereditaryoptic neuropathy by increasing the penetrance of the pri-mary mutations 11778 and 14484. Am J Hum Genet 60:1107–1121
Villani G, Attardi G (1997) In vivo control of respiration bycytochrome c oxidase in wild-type and mitochondrial DNAmutation-carrying human cells. Proc Natl Acad Sci USA 94:1166–1171
Wallace DC (1995) Mitochondrial DNA variation in humanevolution, degenerative disease, and aging. Am J Hum Genet57:201–223
WHO (1992) World Health Organization laboratory manualfor the examination of human semen and sperm-cervicalmucus interactions. Cambridge University Press, Cam-bridge, United Kingdom
Zeviani M, Antozzi C (1997) Mitochondrial disorders. MolHum Reprod 3:133–148