
Ethanol withdrawal acts as an age-specific stressor to activate cerebellar P38 kinase
Upload
umcutrechtCategory
view
1download
0
Frontiers in Human Neuroscience www.frontiersin.org May 2010 | Volume 4 | Article 41 | 1
HUMAN NEUROSCIENCEORIGINAL RESEARCH ARTICLE
published: 26 May 2010doi: 10.3389/fnhum.2010.00041
through connections to the SC, some direct and some through the BG nuclei (Munoz and Everling, 2004). The cortical frontal and supplementary eye fi elds (FEF/SEF) and lateral-intra-parietal eye fi elds contribute to saccadic eye movement generation and project directly to the midbrain oculomotor structure superior colliculus (SC) through the cortico-tectal tract (Segraves et al., 1987). The SC is the main gateway to the oculomotor nuclei in the brainstem that directly control the extra-ocular eye muscles (Sparks, 2002).
Projections from the FEF/SEF to the SC are relayed through the BG in two parallel pathways using multiple inhibitory synapses (Hikosaka et al., 2000), see also Figure 1. The excitatory direct path-way starts with projections from the FEF to the caudate nucleus (CN) that inhibit the substantia nigra pars reticulata (SNpr) that itself normally tonically inhibits the SC. Therefore the direct path-way provides a net excitatory infl uence of the FEF over the SC as tonic inhibition of the SC is released when the pathway is activated. The inhibitory indirect pathway between FEF and SC through the BG runs from the FEF/SEF to the CN, the external segment of the globus pallidus (GPe), the sub-thalamic nucleus (STN), the SNpr, and fi nally the SC (Munoz and Everling, 2004). Although it was sug-gested that this pathway might prevent inappropriate automatic eye movements evoked by the SC (Munoz and Everling, 2004), many uncertainties remain how this complex system controls purposeful eye movements.
INTRODUCTIONWhen we react to events in our direct environment, the proper reaction often depends on the context of the situation. For example, when a cup falls from the table, we would normally grab it auto-matically. On the other hand, when the cup contains boiling hot coffee, we might choose to withdraw our hand to prevent a burn.
Single-neuron recordings on non-human primates suggest that higher cortical areas control purposeful behavior, whereas subcorti-cal areas are responsible for automatic reactions. Multiple parallel excitatory and inhibitory loops, from a large number of cortical areas through the basal ganglia (BG), modulate cortical activity and therefore might subserve many functions such as eye and bodily movements and even higher cognitive processes (Alexander and Crutcher, 1990).
The BG neuroanatomy is thus well suited to select one reaction over others (Redgrave et al., 1999). The neurophysiology underly-ing the ability to select the proper reaction in a certain context has often been studied using eye movements as a model system. The pro- and anti-saccade paradigm requires participants to either look toward or away from an emerging target and has proven to be an ideal behavioral paradigm to study our control over response selection (Munoz and Everling, 2004).
From a large body of work on non-human primates a network dedicated to saccade control has been identifi ed in which the frontal cortex exerts infl uence over eye movement generation
Human fronto-tectal and fronto-striatal-tectal pathways activate differently during anti-saccades
Antoin D. de Weijer, Rene C. W. Mandl, Iris E. C. Sommer, Matthijs Vink, Rene S. Kahn
and Sebastiaan F. W. Neggers*
Department of Psychiatry, Rudolf Magnus Institute of Neuroscience, University Medical Center Utrecht, Utrecht, Netherlands
Almost all cortical areas in the vertebrate brain take part in recurrent connections through the subcortical basal ganglia (BG) nuclei, through parallel inhibitory and excitatory loops. It has been suggested that these circuits can modulate our reactions to external events such that appropriate reactions are chosen from many available options, thereby imposing volitional control over behavior. The saccade system is an excellent model system to study cortico-BG interactions. In this study two possible pathways were investigated that might regulate automaticity of eye movements in the human brain; the cortico-tectal pathway, running directly between the frontal eye fi elds (FEF) and superior colliculus (SC) and the cortico-striatal pathway from the FEF to the SC involving the caudate nucleus (CN) in the BG. In an event-related functional magnetic resonance imaging (fMRI) paradigm participants made pro- and anti-saccades. A diffusion tensor imaging (DTI) scan was made for reconstruction of white matter tracts between the FEF, CN and SC. DTI fi ber tracts were used to divide both the left and right FEF into two sub-areas, projecting to either ipsilateral SC or CN. For each of these FEF zones an event-related fMRI timecourse was extracted. In general activity in the FEF was larger for anti-saccades. This increase in activity was lateralized with respect to anti-saccade direction in FEF zones connected to the SC but not for zones only connected to the CN. These fi ndings suggest that activity along the contralateral FEF–SC projection is responsible for directly generating anti-saccades, whereas the pathway through the BG might merely have a gating function withholding or allowing a pro-saccade.
Keywords: frontal eye fi elds, superior colliculus, caudate nucleus, anti-saccades, DTI, fMRI
Edited by:
Chris Rorden, University of South Carolina, USA
Reviewed by:
Tony Ro, City College of New York, USAPaul Corballis, Georgia Institute of Technology, USA
*Correspondence:
Sebastiaan F. W. Neggers, Department of Psychiatry, Rudolf Magnus Institute for Neuroscience, University Medical Center Utrecht, Heidelberglaan 100, Room B.01.103, 3584 CX Utrecht, Netherlands. e-mail: [email protected]

Frontiers in Human Neuroscience www.frontiersin.org May 2010 | Volume 4 | Article 41 | 2
de Weijer et al. In vivo connectivity of the human FEF
In the light of the above, there are three (not mutually exclusive) scenarios to correctly generate an anti-saccade, see also Figures 1B–D. First, the indirect pathway through the BG ipsilateral to saccade direction could be used to inhibit the ipsilateral SC and hence prevent it from executing an automatic pro-saccade to the target (Figure 1B). In that case, the signal from the FEF into the indirect pathway would be lateralized in an ipsilateral fashion with respect to saccade direction (higher FEF activation for ipsilateral saccades). Second, the direct pathway from the FEF through the BG contralat-eral to saccade direction could receive more input to disinhibit the SC contralateral to saccade direction (Figure 1D) and have it gen-erate an anti-saccade. If so, the signal from the FEF into the direct pathway would be lateralized in a contralateral fashion with respect to saccade direction (higher activation for contralateral saccades in the part of the FEF connected to the direct pathway). Third, the projections from the FEF directly to the SC contralateral to saccade direction, bypassing the BG, could be enhanced to overcome an automatic pro-saccade that would otherwise have been executed (Figure 1D). If the latter mechanism is driving anti-saccade pro-duction, the signal coming from FEF neurons connected directly to the SC should be lateralized in a contralateral fashion with respect to saccade direction. Also, a combination of the aforementioned pathways could be used to generate anti-saccades, i.e. they are not mutually exclusive.
Hardly any in vivo human connectivity or functional imag-ing reports exist that deal with how cortico-BG and cortico-tectal loops control the context dependent execution of an eye move-ment. Therefore, we combined diffusion tensor imaging (DTI) and functional magnetic resonance imaging (fMRI) acquired during the performance of pro- and anti-saccades to determine which of the projections from the FEF to the SC is modulated during anti-saccades. The time course of blood-oxygenation-level-dependent (BOLD) activation in FEF-regions projecting to the CN and SC during pro- and anti-saccades were compared.
To this end the entire FEF as determined using fMRI acti-vation maps was parcellated into different zones based on the white matter tracts uniquely connecting it to the SC and CN, and
event-related BOLD responses in such zones were compared over experimental conditions. Combining fMRI activation patterns and DTI- tractography to investigate the function of connectivity pat-terns as is demonstrated here might also be a fruitful technique for other fi elds of neuroscience research.
MATERIALS AND METHODSPARTICIPANTSAll 15 participants (mean age 23 years, eight males and seven females, all right-handed) were screened for MRI contra- indications. Their vision was normal or corrected to normal. At the beginning of each session the procedures of the experiments were explained, after which a written informed consent was obtained. This study has been approved by the medical ethical commission of the University Medical Center in Utrecht.
APPARATUSImaging was performed on a clinical Philips 3 T Achieva MRI scan-ner (Philips Medical Systems, Best, Netherlands), equipped with a SENSE coil with eight independent receivers allowing parallel imaging (Pruessmann et al., 1999). Stimuli were projected (using the Presentation software from Neurobehavioral systems) on a Plexiglas 1 m wide screen placed at 2 m distance from the partici-pants, and viewed through a mirror mounted on the head coil.
BEHAVIORAL PARADIGMSThe fi rst task for the participants in the scanner was an eye move-ment task organized in blocks of eye movements in rapid succes-sion. In this manuscript we refer to this task as the so-called FEF ‘localizer’. Block designs yield superior signal detection power as compared to event-related designs (Aguirre and D’Esposito, 2000; Donaldson and Buckner, 2001) and is therefore useful to local-ize individual FEFs. The localizer task consisted of blocks with pro- and anti-saccades trials in rapid succession. Initially, partici-pants had to fi xate a white circle (1° × 1° visual angle) at the center of a black screen. The circle changes its color to red or blue (the ‘cue’) and remained visible for 500 ms. The cue color determined
FIGURE 1 | Possible mechanisms for the FEF to regulate pro- and
anti-saccade generation. The target is displayed as a black dot. For pro-saccades, the FEF contralateral to saccade direction can send a motor command directly to the SC in the same hemisphere and/or through the CN > SNpr (the so called ‘direct pathway’) (A). For anti-saccades, more scenarios are possible: the FEF ipsilateral to saccade direction could
actively inhibition ipsilateral SC (through the ‘indirect pathway’) (B), thus inhibiting a pro-saccade. The FEF contralateral to saccade direction could excite the SC in the same hemisphere directly (C) or through the CN > GPe > SNpr (‘direct’) pathway (D), enforcing an anti-saccade over a pro-saccade. Also, a combination of scenario (B–D) could underly anti-saccade generation.

Frontiers in Human Neuroscience www.frontiersin.org May 2010 | Volume 4 | Article 41 | 3
de Weijer et al. In vivo connectivity of the human FEF
whether participant needed to perform a pro-saccade (red dot) or an zanti-saccade (blue dot). 300 ms after disappearance of the cue a peripheral white circle of the same size (as the target) appeared, at 3.8° or 14.8° at the left or right side of the center circle. Participants had to make a (pro-)saccade to the target when the cue was red, or to the empty region of the screen exactly opposite of the target when the cue was blue (e.g., the anti-saccade condition). The target remained visible for 950 ms. Subsequently, the white fi xation circle reappeared at the center of the screen for 250 ms to indicate the start of a new trial. A block of 10 such trials lasted 20 s. After each block a center white circle appeared that had to be fi xated for 20 s. In total the task lasted 8 min, including 12 saccade and 12 fi xation blocks. This task has proven to be successful in robustly activating, among others, the entire zone around the precentral sulcus rep-resenting human FEF (Neggers et al., 2007; Van Ettinger-Veenstra et al., 2009). We will defi ne the FEF here as all voxels activated above threshold by this task.
In the next three sessions participants had to perform an event-related pro- and anti-saccade task. This task was designed to dissoci-ate BOLD responses from subsequent pro- and anti-saccades. It was identical to the fi rst task, except for larger inter-trial- intervals and there was no explicit rest period. The cue was visible for 3000 ms, the target 6000 ms and the fi xation point, which indicated to participants to make a saccade back to the center of the screen, was visible for 3000 ms after which a new cycle started. A ran-dom interval between +500 and −500 ms was added to the onset of the cue to prevent predictability of the events. For each trial the same random interval was subtracted at the end to assure each trial lasted 12 s. Stimulus dimensions and colors were the same as in the localizer task. In total 40 trials occurred in one session, which lasted 8 min. Three such sessions were conducted consecutively to allow for short rest periods every 8 min, realizing 120 event-related trials in total for each participant. Trials were ordered such that fi ve event-related trials were presented together in rows of fi ve pro- or fi ve anti-saccades trials. The direction and eccentricity of the targets was pseudo-randomized from trial to trial, as was the order of the pro- or anti-saccade series of fi ve trials. No eyetracking was performed, as we know from experience outside the MRI that compliance is near perfect for the event-related task as there is a substantial time period between the pro- or anti-saccade cue and the actual saccade target.
IMAGE ACQUISITIONFor each fMRI session of 8 min, 1000 functional T2* weighted BOLD volumes were acquired using a PRESTO-SENSE acqui-sition scheme. This method has proven to be more sensitive to signal changes than conventional 2D echo-planar imaging (EPI, Neggers et al., 2008), which is useful for individual FEF localiza-tion and event-related response detection. Scan parameters were: TR = 21.75 ms, TE = 32.4 ms; FOV (ap, fh, rl) = 224 mm × 256 mm × 128 mm, fl ip angle = 10°, matrix: 64 × 64 × 32 slices, voxel size 4 mm isotropic, 8-channel head coil, SENSE factor = 2 and 1.8 (in the left/right and anterior–posterior phase encoding directions, respectively). One volume was acquired in 500 ms by using parallel imaging in two directions. Note that PRESTO is a pulse sequence that uses 3D acquisition (exciting an entire volume per RF pulse) instead of the 2D planar acquisition, which is still common in most
fMRI studies that use EPI. Hence TR, which is defi ned as the time between successive excitations of each proton, equals 21.75 ms. It is sometimes erroneously assumed that TR equals acquisition time per volume, which is only true for 2D EPI (that is still com-mon in fMRI acquisition). The advantage of 3D acquisition for event-related fMRI study designs is that, using parallel imaging techniques, it can be accelerated in two phase encoding directions instead of one, allowing the extremely fast acquisition times per volume as used here (Neggers et al., 2008).
For correct coregistration of the functional scans and the T1-weighted scan one isolated PRESTO-SENSE volume, the ‘reference’ or FA25 scan, was acquired with a fl ip angle of 25° instead of 10° leading to more T1 weighting and hence anatomical contrast. It is otherwise identical to the functional MRI scans.
After functional MRI scanning, a single shot EPI–DTI scan was obtained, consisting of 32 diffusion-weighted scans (b = 1000 s/mm2) with non-colinear gradient directions and one diffusion unweighted scan (b = 0 s/mm2) Scan parameters were: TR/TE = 7400/70 ms, FOV 240 mm, matrix 128 × 128, 75 slices thickness 2 mm, no gap, SENSE factor 3, no cardiac gating. Finally, a detailed T1-weighted scan was obtained with param-eters TR/TE = 9.87/4.6 ms, fl ip angle = 8°, FOV 224 × 160 × 168, matrix = 256 × 256, slice thickness 1 mm (no gap).
DATA ANALYSIS: GENERAL APPROACHThe main objective of the analyses was to divide the individual FEFs, as identifi ed with the fMRI ‘localizer’ session, into four different zones: projecting to the ipsilateral CN or SC (for the left and right FEF). This division was based on fi ber tracts reconstructed from DTI data that connect the FEF with the SC and CN. Subsequently, event-related BOLD responses following leftward or rightward pro- or anti- saccades are statistically compared for each of these four FEF zones. This was done as follows. First, the functional data from the short FEF ‘localizer’ task and DTI data (for fi ber reconstruction) were analyzed. Second, by combining reconstructed fi ber tracts and functional data, FEF vox-els could be divided into two groups: uniquely connected to either CN or SC. For two additional control analyses also FEF zones con-nected to neither CN or SC or both were considered. Finally from these different voxel sets an event-related time course was extracted, using data from the three event-related sessions. An estimate of the response amplitudes was used for statistical analysis in order to com-pare response amplitudes between different FEF zones and conditions. For preprocessing fMRI data SPM5 was used (http://www.fi l.ion.ucl.ac.uk/spm/software/spm5/) and matlab routines developed in-house. The details of all the steps are given below.
DATA ANALYSIS: SPATIAL PREPROCESSINGThe T1-weighted anatomical scan and the B0 scan (and all DTI images along with it) were coregistered to the ‘reference scan’ (a single T2* weighted scan with a fl ip angle of 25°) using a rigid body transformation. All four functional sessions were realigned (using the reference scan as the fi rst image) to correct for head move-ments. Images were resliced at 4 mm × 4 mm × 4 mm and spatially smoothed with an 8 × 8 × 8 full-width at half maximum Gaussian kernel. All analysis was done in native space, therefore no transfor-mations other then rigid body transformations (such as normaliza-tion to MNI stereotactic space) were performed at this stage.

Frontiers in Human Neuroscience www.frontiersin.org May 2010 | Volume 4 | Article 41 | 4
de Weijer et al. In vivo connectivity of the human FEF
DATA ANALYSIS: STATISTICAL ANALYSIS OF fMRI DATAFor the statistical modeling of the ‘localizer’ task (block design) a general linear model (GLM) with two regressors was fi tted to each voxel separately, a common procedure in fMRI analysis. For the fi rst regressor, a box-car function (1 for 20 s during the task blocks and 0 during 20 s rest blocks) was convolved with the default canonical hemodynamic response function (HRF) from SPM5 (2 weighted gamma functions). The second regressor is a constant modeling baseline. A t-contrast testing the regression coeffi cient of the task regressor against 0 was calculated (e.g., testing for higher activation during the saccade blocks as compared to fi xation), and thresh-olded at P < 0.05 corrected for the entire brain volume according to a multiple comparison correction using random fi eld theory (Worsley et al., 1992, 1996).
To isolate individual left and right FEFs, fi rst the activation maps of the ‘localizer’ task were divided into different sets of connected (e.g., directly neighboring) voxels with supra-threshold t-values (‘clustering’). This results in a series of volumes with one con-nected cluster of activated voxels per volume. Next, those maps were selected manually that (at least partially) overlap with the FEF as defi ned in the volumes of Interest (VOI) Brainmap data-base (Nielsen and Hansen, 2002). All supra-threshold voxels were substituted with 1, other voxels with 0. To accommodate possible inaccuracy, known to occur with fi ber tracking because of noise and partial volume error (PVE, Basser et al., 2000; Mori and van Zijl, 2002; Huang et al., 2004), the resulting FEF masks were dilated by one voxel in all directions. The above procedure resulted in a mask in which all clusters not considered to be the FEF were eliminated, but still large enough to catch most fi ber tracts coming from sub-cortical seed areas (see below).
DATA ANALYSIS: DTI FIBER TRACKINGThe DTI&FiberTools software (Kreher et al., 2006) was used for computation of the tensors and the fractional anisotropy (FA), and for the construction of the white-matter tracts. Fiber tracking was done according the FACT algorithm (Mori et al., 1999), as imple-mented in the DTI&FiberTools. Tracking (brute force) was initiated from every voxel in the brain using the standard parameters for the DTI&fi ber toolbox, and at a later stage only fi bers passing through the selected CN and SC ROIs were retained (Conturo et al., 1999). Criteria for fi ber tracking: as a ‘startmask’ FA >0.25 and mean dif-fusivity <0.0016 mm2/s were used. As end mask FA >0.15 and mean diffusivity <0.002 mm2/s were used. Additional termination criteria were a maximum curvature of the track of 53.1° and a track travers-ing less than fi ve voxels. Other studies using the FACT algorithm have used similar tracking parameters (Jiang et al., 2006).
As ROIs, both left and right SC and CN were used. They were manually delineated based on anatomical properties visible on T1-weighted scans. Corresponding locations were projected to the diffusion unweighted (B0) image. We selected CN and SC anatomi-cally which is feasible due to their clear anatomical contrasts in a T1-weighted scan. It is generally hard to measure fMRI signal change in the SC due to the physiological noise in the midbrain and its large distance to the MR receive coils, especially using highly accelerated fMRI acquisition as in the current study (Raghunathan, 2004). Furthermore, most likely only parts of the CN are activated by eye movements (Neggers et al., 2005), at present it is unclear for
humans which part for which task. Therefore, we chose to manually delineate the entire CN and SC on structural scans rather than using functional MR activation patters to not overly bias our results. All fi ber bundles were calculated that originate from the SC, left CN and right CN ROIs in native space images.
Further fi ber selection using the aforementioned ROIs and further analyses were done with matlab 2006b scripts developed in-house, see below for details.
DATA ANALYSIS: VOXEL SELECTIONIn the present study event-related BOLD responses to pro- or anti-saccades in zones of the FEF uniquely projecting to the SC or the CN were the main measure of interest. Therefore the left and right FEF volumes as obtained with the fMRI localizer task (see above) were divided into zones projecting to one of these areas as follows.
FEF voxels were selected as belonging to one out of four ‘pro-jection classes’: uniquely connected to the ipsilateral CN or SC, to both or to neither CN nor SC. To be classifi ed as a connected voxel it had to be within an area of 10 mm from a fi ber endpoint originating in the SC and/or the CN and positioned in the left or right FEF mask obtained as explained above. We chose this 1-cm distance criterion based on the fact that mainly FA stop criteria cause fi bers to terminate at some distance before reaching gray matter, as is well known for FACT fi ber tracking (Jones, 2008). The 1-cm criterion should allow fMRI activated voxels in the gray matter to be associated with fi bers stopping just before reaching gray matter. With an fMRI-to-fi ber selection distance lower than 1 cm we did not observe one or more projection zones for too many subjects (see also Data Analysis: Data Imputation).
DATA ANALYSIS: EVENT-RELATED TIME COURSE EXTRACTIONFor each voxel in one of the four FEF projection classes, the unprocessed fMRI time series data was extracted from the three event-related sessions in which participants executed pro- or anti-saccades.
Peri-stimulus time histograms (PSTHs), which can be thought of as averaged event-related responses corrected for overlap of sub-sequent events which is sometimes referred to as ‘selective averag-ing’. PSTHs were created for all voxels within a certain projection class. This is done for leftward and rightward pro- or anti-saccades separately. In order to determine a PSTH, a fi nite impulse response (FIR) model was fi tted to the time series data of each voxel, with the four conditions (pro- or anti-saccade, left- or rightward) modeled separately (window length 12 s and bin size 0.500). The regression coeffi cients of a FIR model refl ect the averaged BOLD signal for a series of time points for a select event type (e.g., leftward, right-ward, pro- or anti-saccade), corrected for the overlapping BOLD response (lasting ∼12 s) of subsequent events, without assuming any predetermined shape of the hemodynamic response (Goutte et al., 2000). To remove low frequency signal drifts, high pass fi l-tering was performed alongside with the FIR modeling using a 128-s cut off frequency. The PSTHs were created with in-house matlab scripts, making use of matlab functions available in the SPM5 matlab code base. Average PSTHs were created from the per-voxel PSTHs for the four saccade types (pro-saccades to the left or right and anti-saccades to the left or right) and four projection zones separately. Note that anti-saccades to the left were defi ned as

Frontiers in Human Neuroscience www.frontiersin.org May 2010 | Volume 4 | Article 41 | 5
de Weijer et al. In vivo connectivity of the human FEF
a saccadic eye movement toward the left, and hence a target located at the right side of the screen. The above procedure was repeated for every participant.
DATA ANALYSIS: STATISTICAL ANALYSIS ON RESPONSE AMPLITUDESTo perform a statistical analysis on the amplitude of the extracted PSTH profi les the default HRF h from SPM5 (parameters RT = 0.503, onset delay 4.5 s and an amplitude of 1) is fi tted to the individual mean PSTH per condition and projection zone. The function was fi tted to the PSTH data using a GLM. The model was constituted of two regressors: the function h discussed above and a constant modeling baseline. The calculated regression coeffi cient associated with h refl ects the estimated amplitude of the event-related fMRI response, comparable to global percentage in signal change.
The individual PSTH amplitudes obtained this way were sub-jected to an analysis of variance (ANOVA) to statistically test for effects of saccade condition (pro- or anti-saccades, leftward or right-ward) and projection class (left or right CN or SC, both or none).
DATA ANALYSIS: DATA IMPUTATIONFor some participants specifi c white matter tracts (only for unique connections between the left or right FEF with ipsilateral SC or CN) could not be established using the criteria described above, resulting in missing values in the statistical analysis of the response amplitudes. This was not due to problems with data acquisition (see also the Discussion). Missing tracts were not an issue for projection classes to neither SC nor CN or both. Because each projection is included in four conditions (pro-saccade to the left or right, anti-saccade to the left or right) a missing projection resulted in four missing cells for the ANOVA of that participant. An option was to exclude the participant with one or more missing values which would reduce our sample size to six participants which lacks the statistical power to pick up any difference of interest on the group level. Another possibility is to estimate the missing values based on the data pattern, as missing FEF projection zones were almost equally distributed over subjects (that is, it is not always the same bundle that is missing). The most straightforward way to accomplish this is to use the grand mean of each variable. However, this would artifi cially lower standard error, possible leading to false positives. Therefore, the missing data pattern was qualifi ed as random missing data (Little and Rubin, 2002), which makes imputation possible and is a common procedure in compa-rable circumstances. Missing values were imputed by EM algorithm (expectation maximization) with the use of NORM software V2.03 (Schafer, 1999). This algorithm produces maximum likelihood (ML) estimates of the mean values, standard deviation and correlations. Note that we accept only one missing tract out of four to not overly rely on missing value estimation.
For FEF zones uniquely connected to SC or CN, the fi tted HRF values were analyzed using SPSS 12 using a 2 × 2 × 4 within- subjects repeated measures ANOVA. The fi rst factor (condition) has two levels; pro- and anti-saccade. The second factor (direc-tion) has two levels; leftward and rightward. Finally the third factor (projection class) contains four levels, representing the FEF areas connected to ipsilateral SC or CN: left CN, right CN, left SC and right SC. Similar ANOVAs were performed for additional analyses of FEF zones connected to both SC and CN, or none (see Results).
On an important note, the comparison of absolute PSTH response amplitudes over FEF zones is not highly informative as they are obtained from clusters in different brain regions consisting of different numbers of voxels. However, differences or interactions with one of the experimental manipulations within a region, and comparisons of these differences with other regions are interpret-able as the interactions arise from the same set of voxels.
RESULTSLOCALIZATION OF FEFThe individual FEF could be properly localized using the fast pro- anti-saccade ‘localizer’ task. Besides the FEF, parietal and occipital cortices were also activated. The non-FEF clusters were removed from the maps to create FEF masks (see Materials and Methods). One participant showed no evident activation in the FEF and was excluded from further analysis. See Figure 2 for the individual activation maps of four participants. Note the considerable variability in shape, loca-tion and size of activated regions over subjects (see also Neggers et al., 2007; Van Ettinger-Veenstra et al., 2009). From these activation maps, the right and left FEF masks were created by assessing the proximity of connected clusters of voxels to known FEF coordinates (Nielsen and Hansen, 2002) (see Materials and Methods).
DTI FIBER TRACKING RESULTSFor 11 participants at least three out of four tracts could be estab-lished. See Figure 3 for an illustrative example of the fi bers con-necting the CN, SC with the FEF for two such participants. Four participants were excluded from further analyses as less than three of the four intended white matter tracts connecting each FEF with the ipsilateral SC and CN could be isolated.
FEF PARCELLATION INTO PROJECTION ZONESAfter performing the FEF voxel classifi cation according to their projection target (to ipsilateral SC or CN), for the 11 remaining par-ticipants at least three out of four clusters of voxels were obtained uniquely projecting to either the left and right SC or left and right CN. See Table 1 for an overview of the voxel classifi cation details per participant.
The relative volume of each projection zones was calculated as a percentage of the entire FEF mask (as depicted in Figure 2) on the same side (e.g., for the left and right hemisphere sepa-rately). Averaged over subjects, the CN-L and CN-R projection zones entailed 9.1% and 10.3% of the entire FEF volume, the SC-L and SC-R projection zones 10.3% and 5.0%. Voxels classifi ed as connected to both the ipsilateral CN and SC occupied 28.0% and 15.6% for left and right FEF, and FEF voxels not connected to either CN or SC comprised 52.6% and 69.1% for the left and right FEF, respectively.
To investigate whether the FEF projection zones are located on a particular side of the FEF for most participants, the average coordi-nates of the classifi ed clusters were transformed from native space to MNI stereotactic atlas space (comparable to Talairach). Using the ‘unifi ed segmentation’ algorithm in SPM5 (Ashburner and Friston, 2005), an inverse normalization warping fi eld was obtained from the high contrast T1-weighted structural scan that can be used to transform individual coordinates to MNI coordinates. See Figure 4 for the layout in MNI space of FEF voxels uniquely projecting to

Frontiers in Human Neuroscience www.frontiersin.org May 2010 | Volume 4 | Article 41 | 6
de Weijer et al. In vivo connectivity of the human FEF
the CN and the SC from four representative participants, overlaid on a slice (through the center of the cluster of voxels dubbed FEF) from the normalized structural T1-weighted anatomical scan.
The zones in the FEF projecting to the ipsilateral SC were com-pared with the FEF zones projecting to the CN in order to establish whether there is a general tendency for specifi c tracts to originate in a certain part of the FEF. For the left hemisphere, the mean MNI location of the FEF-cluster connected with the CN was (−28, 1, 46) and of the cluster connected with the SC (−22, −2, 52). In the right hemisphere, the corresponding values were (25, 3, 44) and (17, 2, 58), respectively. In the right hemisphere, the zones in the FEF projecting to the CN tended to be located more laterally; the mean X-coordinate for CN cluster is signifi cantly larger than the mean x-coordinate for the SC-cluster [T(6) = −2,744, P < 0.05]. Also the FEF zones pro-jecting to the CN tended to be located more inferior in the right hemisphere, its Z-coordinate is signifi cantly smaller [T(6) = −2,914, P < 0.05] then for zones projecting to the SC. For the left hemisphere the latter differences were not signifi cant [T(9) = −1,121, P < 0.291 for x-coordinate and T(9) = −1,009, P < 0.339 for z-coordinate]. Note that the t-tests were performed on FEF coordinates for only those subjects for which the respective FEF zones could be established.
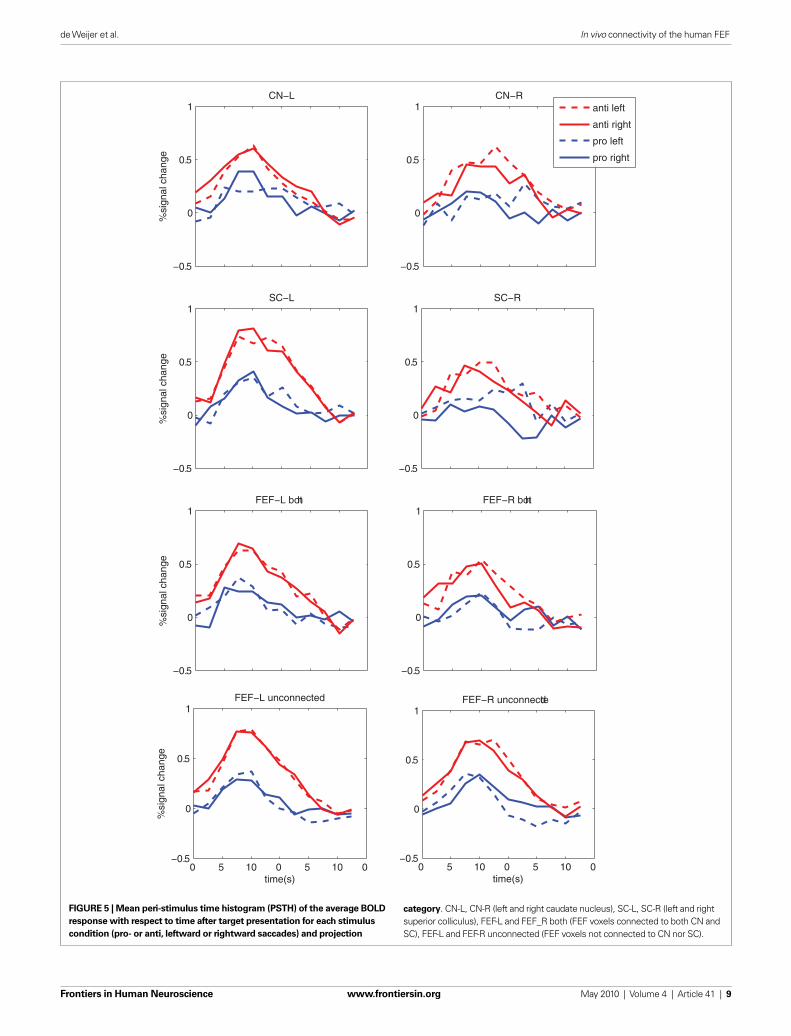
EVENT-RELATED TIME COURSETo investigate the event-related fMRI timecourse for each condi-tion and each FEF projection zone the PSTHs were calculated, see Figure 5. When no white matter tracts were found for a particular participant and projection, no PSTH could be calculated for that FEF subzone for any condition. PSTH calculation for FEF voxels in the left FEF-CN projection class was possible for all 11 participants
and for 9 participants for the right FEF-CN projection class. For FEF–SC projection class, this was possible for 10 participants for the left SC and for 9 participants for the right SC, see also Table 1.
Interestingly, FEF responses seem larger in general for anti- saccades as compared to pro-saccades. Also, a lateralization of saccade related FEF responses (e.g., the left FEF activating more for saccades to the right and vice versa) as known from single cell recording in non-human primates (Bruce and Goldberg, 1985), was found for the FEF zones projecting to the SC or for FEF zones projecting to both SC and CN, for anti-saccades only.
Note that the average hemodynamic (e.g., fMRI) response amplitudes (bar height in Figure 5) should not to be compared between FEF zones directly. They are derived from regions with different number of voxels in different parts of the brain; averaging hemodynamic amplitudes over different numbers of voxels for the different zones of the FEF can bias results. The effects of interest are differences of response amplitude between experimental con-ditions, or interactions thereof, within a region. We assume these differences can then be compared over regions.
For statistical analysis the response amplitude for each PSTH was estimated using a model of the standard HRF from SPM5 (two superimposed gamma functions). These estimated response ampli-tudes represent the signal change for each condition and projection zone. See Figure 6 for an overview. Response amplitudes for the various conditions were then tested statistically. First a 2 × 2 × 4 within-subjects ANOVA was performed for FEF zones uniquely connected to the SC or the CN (data in Figure 6A), missing values had to be estimated for fi ve subjects for whom no DTI connection could be established for at most one out of four FEF zones, see
FIGURE 2 | FEF activation t-map for the ‘localizer’ task in four individual
participants at threshold t > 3, overlaid on their T1-weighted structural
scan, in a coronal (upper panels) and axial (lower panels) view. Only the clusters of activated voxels are shown that overlap with known locations of the
FEF. The data is shown in MNI atlas space and has been normalized from native space only for visualization purposes in this fi gure. The color codes denote T-values for the contrast saccade-block vs rest. For every slice the y and z MNI coordinate of the cross-section are given in millimeter.

Frontiers in Human Neuroscience www.frontiersin.org May 2010 | Volume 4 | Article 41 | 7
de Weijer et al. In vivo connectivity of the human FEF
Section ‘Data Analysis: Data Imputation’ for details. In Table 2 the individual response amplitudes are given for these projection zones and all four conditions. Imputed values are depicted in bold.
A signifi cant main effect for the variable ‘condition’ was found [F(1,10) = 35.146, P < 0.05], indicating that the fi tted response amplitude is higher in general for anti-saccades as compared to pro-saccades. The within-subjects ANOVA also revealed a three way interaction for ‘condition × projection × target’ [F(3,30) = 3.129, P < 0.05]. This implies that the increase in response amplitude for
anti-saccades as compared to pro-saccades is mainly observed for FEF zones projecting to the SC, in a lateralized fashion. The latter indicates that the small effects visible in Figure 5 are signifi cant.
A post hoc ANOVA on response amplitude in FEF zones project-ing to the SC revealed a signifi cant interaction ‘target × projection’ [F(1,10) = 8.057, P < 0.05]. In Figure 6A this effect is encircled; it implies that specifi cally for FEF zones projecting the SC, response amplitudes in the left or right FEF were larger when saccades were made to the contralateral side as compared to the ipsilateral side.
FIGURE 3 | Reconstructed DTI fi ber tracts from different regions of the FEF leading to the SC (blue) or the CN (yellow) for two different individual
participants (A,B). Activity around the FEF as determined with the ‘localizer’ task is rendered in red.

Frontiers in Human Neuroscience www.frontiersin.org May 2010 | Volume 4 | Article 41 | 8
de Weijer et al. In vivo connectivity of the human FEF
Additionally, we computed PSTHs and response amplitudes for FEF voxels found to be connected to both the CN and the SC (Figures 5 and 6B). As before, an increase in response amplitude for anti-saccades as compared to pro-saccades was found for FEF zones connected to both the SC and CN [condition: F(1,10) = 31.7, P < 0.001]. Interestingly, for anti-saccades we found a tendency for the same preference for contralateral saccades as for voxels only connected to the SC, which was signifi cant at trend level in the ANOVA on estimated response amplitudes [projection × condition: F(1,10) = 3.62, P = 0.086].
Next, we computed PSTHs for ‘unconnected’ FEF voxels (e.g., in the localizer maps from Figure 2, but not connected to CN or SC), see Figure 5. For unconnected voxels, PSTH ampli-tudes were again larger for anti-saccades in general [condition: F(1,10) = 38.3, P < 0.001]. No other effect was observed for unconnected voxels, e.g., no response was lateralized with respect to saccade direction. This demonstrates that the lateralization with respect to anti-saccade direction found for SC projection zones is specifi c.
As a fi nal control analysis, we assigned FEF voxels to one of the four projection zones randomly (per FEF, e.g., left FEF voxels were randomly assigned to left CN or left SC zones, never to right CN or right SC projection zones). An identical ANOVA as for the CN and SC projection zones was performed, and again anti-saccades yielded higher response amplitudes [condition: F(1,10) = 36.1, P < 0.001]. No other fi ndings were observed, and response amplitudes were not lateralized with respect to saccade direction.
DISCUSSIONThis study used a combination of fMRI and DTI to disentangle the role of the parallel projections between the FEF and SC in regulating saccades. Both the pathways from FEF to SC as well as to CN were clearly modulated by task set; for anti-saccades all FEF-regions showed a large increase in response amplitude with respect to pro-saccades directed to the same side. From research on non-
Table 1 | The amount of voxels selected per FEF projection zone, for each
participant. The FEF Projection zones are defi ned as voxels uniquely
connected to the ipsilateral caudate nucleus and superior colliculus: CN_l and
SC_l for the left FEF, and CN_r and SC_r for the right FEF. Also, the number of
subjects for which those connections could be established is given, as well
as the average size of the zones in voxels.
Subject From FEF to: CN_l CN_r SC_l SC_r
1 118 167 0 2
2 27 50 1 19
3 41 23 6 0
4 15 17 82 52
5 2 0 76 47
6 49 261 44 0
7 1 1 140 101
8 2 67 13 25
9 35 80 44 48
10 90 7 4 2
11 32 0 10 2
No. of subjects 11 9 10 9
with connections
Average size 37 61 38 27
FIGURE 4 | Spatial distribution of FEF voxels connected to the SC (red
circles) or to the CN (blue circles), in MNI space, plotted in coronal view for
four subjects. The circles are projected to a 2D coronal plane coinciding with a coronal section of the T1 scan normalized to MNI, halfway the selected cluster of
voxels to indicate their position with respect to the individual cerebral anatomy. Note that the distribution of selected FEF voxels entails 3 dimensions, and the T1 coronal section only 2. This projection is therefore only indicative of the course anatomical location of the voxels and does not exactly match sulcal anatomy.
For the response amplitudes in FEF zones projecting to the CN this effect was far from signifi cant with F(1,10) = 0.019, P = 0.89. We pooled data for large and small saccade amplitudes as no signifi cant differences were observed.
It should be noted here that averaged over all subjects, the FEF projection zones connected to the CN were larger than projection zones connected to the SC, both in absolute (number of voxels) and in relative terms (as a percentage of FEF volume), see section ‘FEF Parcellation into Projection Zones’. The latter implies that lack of statistical power cannot explain the fact that results were not found for FEF zones connected to the CN, as it comprises averaging over more voxels.
Frontiers in Human Neuroscience www.frontiersin.org May 2010 | Volume 4 | Article 41 | 9
de Weijer et al. In vivo connectivity of the human FEF
−0.5
0
0.5
1CN−L
%si
gnal
cha
nge
−0.5
0
0.5
1CN−R
−0.5
0
0.5
1SC−L
%si
gnal
cha
nge
−0.5
0
0.5
1SC−R
anti left
anti right
pro left
pro right
−0.5
0
0.5
1
%si
gnal
cha
nge
FEF−L both
−0.5
0
0.5
1FEF−R both
0 5 10 0 5 10 0 −0.5
0
0.5
1
time(s)
%si
gnal
cha
nge
FEF−L unconnected
0 5 10 0 5 10 0 −0.5
0
0.5
1
time(s)
FEF−R unconnected
FIGURE 5 | Mean peri-stimulus time histogram (PSTH) of the average BOLD
response with respect to time after target presentation for each stimulus
condition (pro- or anti, leftward or rightward saccades) and projection
category. CN-L, CN-R (left and right caudate nucleus), SC-L, SC-R (left and right superior colliculus), FEF-L and FEF_R both (FEF voxels connected to both CN and SC), FEF-L and FEF-R unconnected (FEF voxels not connected to CN nor SC).

Frontiers in Human Neuroscience www.frontiersin.org May 2010 | Volume 4 | Article 41 | 10
de Weijer et al. In vivo connectivity of the human FEF
Table 2 | Fitted response amplitudes for FEF zones projecting to either SC or CN and for each condition, for all individual subjects. Due to
connections that could not be established (at most 1 per subject, otherwise subject would have been excluded), some of the data had to be estimated
(inputted; see Materials and Methods). Estimated values are depicted in bold.
Area CN left CN right SC left SC right
condition
Pro L Pro R Anti L Anti R Pro L Pro R Anti L Anti R Pro L Pro R Anti L Anti R Pro L Pro R Pro R Anti R
Subject 1 0.251 0.612 0.501 0.582 0.155 −0.052 0.476 0.257 0.187 0.359 0.507 0.463 −0.134 −0.303 0.317 0.309
Subject 2 0.142 0.217 0.322 0.276 −0.054 0.088 −0.013 0.165 0.066 0.1 −0.029 −0.043 0.12 0.219 0.061 0.172
Subject 3 0.145 0.2 0.5 0.417 0.69 0.343 0.542 0.644 −0.142 0.093 0.408 0.35 0.082 0.101 0.253 0.221
Subject 4 0.396 0.324 0.185 0.705 0.038 0.188 0.809 0.381 0.186 0.326 0.728 0.723 0.136 0.255 0.705 0.647
Subject 5 0.45 0.075 0.945 −0.078 0.341 −0.045 0.354 0.194 0.725 0.621 0.849 0.821 0.631 0.301 0.759 0.633
Subject 6 0.473 0.308 0.56 0.719 0.727 0.498 0.947 0.842 0.426 0.27 0.952 1.054 0.402 0.179 0.674 0.477
Subject 7 −0.084 0.124 0.433 −0.093 0.136 −0.288 0.092 0.166 0.467 0.391 0.688 0.575 0.07 0.231 0.498 0.457
Subject 8 0.446 −0.096 0.702 0.051 0.061 −0.129 0.405 −0.18 0.216 0.436 0.583 0.656 0.093 0.128 0.37 0.212
Subject 9 0.622 0.405 0.266 0.349 0.085 −0.026 0.043 0.091 0.46 0.213 0.195 0.483 0.511 0.321 0.923 0.616
Subject 10 0.68 0.209 0.904 0.881 0.69 0.151 1.12 0.223 1.482 0.831 1.172 1.428 0.579 0.133 0.364 −0.063
Subject 11 0.643 0.587 0.746 0.983 0.358 0.194 0.713 0.328 0.323 0.537 0.577 0.584 0.17 −0.082 0.38 0.08
human primates, it is known that the FEF represent contralateral saccades (Bruce and Goldberg, 1985). Interestingly, anti-saccade responses in the present study were lateralized in FEF zones con-nected to the SC or to both the CN and SC, e.g., larger responses were observed for saccades directed contralaterally. This was not observed for FEF-regions projecting to the CN. The laterality effects were subtle (but signifi cant), which might be due to limited preci-sion of DTI fi ber tracking (see also below) and hence averaging of
fMRI responses. Importantly, lack of statistical power as a result of smaller projection zones cannot explain the fact that results were not found for FEF zones connected to the CN, as CN projection zones were actually larger than SC zones.
In the introduction, we proposed three possible (not mutu-ally exclusive) pathways through which the FEF could enforce anti- saccade execution, as depicted in Figure 1, alongside with predictions for the lateralization of FEF responses with respect to
ProL ProR AntiL AntiR0
0.2
0.4
0.6
0.8
1
CN−L
%si
gnal
cha
nge
ProL ProR AntiL AntiR0
0.2
0.4
0.6
0.8
1CN−R
ProL ProR AntiL AntiR0
0.2
0.4
0.6
0.8
1SC−L
%si
gnal
cha
nge
ProL ProR AntiL AntiR0
0.2
0.4
0.6
0.8
1SC−R
ProL ProR AntiL AntiR0
0.2
0.4
0.6
0.8
1FEF−L both
%si
gnal
cha
nge
ProL ProR AntiL AntiR0
0.2
0.4
0.6
0.8
1FEF−R both
ProL ProR AntiL AntiR0
0.2
0.4
0.6
0.8
1FEF−L unconnected
%si
gnal
cha
nge
ProL ProR AntiL AntiR0
0.2
0.4
0.6
0.8
1FEF−R unconnected
A B
FIGURE 6 | (A) Average hemodynamic response amplitudes of the hemodynamic responses for each condition and FEF zone uniquely connected to the CN or SC. The lateralization observed for anti-saccades of the response amplitudes with respect to
saccade direction is highlighted with red circles. Error bars denote standard error. (B) Same response amplitudes for FEF zones connected to both the CN and SC and for FEF zones connected to neither SC nor CN.

Frontiers in Human Neuroscience www.frontiersin.org May 2010 | Volume 4 | Article 41 | 11
de Weijer et al. In vivo connectivity of the human FEF
saccade direction. For generation of anti-saccades the FEF > CN pathways, we predicted larger ipsilateral activation of FEF zones connected to the CN when the indirect pathway is used (Figure 1B) or larger contralateral activation when the direct pathway is used (Figure 1D). None of the latter was observed. When, however, the direct FEF > SC pathway (Figure 1C) is instrumental in anti-saccade generation, we predicted larger activation for FEF zones connected to the SC contralateral to saccade direction, which was indeed observed. Based on the present results and assumed model pathways, the pathway from the FEF to the SC from Figure 1C can therefore be concluded to be more clearly involved in the generation of anti-saccades and/or the inhibition of pro-saccades as compared to the pathways to the CN.
Intriguingly, the same lateralization as in FEF zones connected to the SC was observed (at trend level) for FEF zones connected to both the CN and SC. This could still imply that the connections to the SC mainly contribute to anti-saccade generation, as this lateralization was not observed in FEF zones purely connected to the CN. Due to the limited spatial resolution of both DTI fi ber tracking and fMRI, the present results cannot determine whether the effects for FEF zones connected to both CN and SC are due to neurons connected to both regions, to the fact that neurons connected to either the SC or CN are found in close proximity (e.g., in one fMRI voxel), or to the spatial inaccuracy in DTI fi ber tracking leading to overlapping projection zones. The lateralization of FEF responses with respect to saccade direction was not found for voxels connected to neither CN nor SC, confi rming that the structural parcellation of the FEF into projection zones specifi cally separates FEF function.
We succeeded in localizing two unique regions within both left and right FEF with different functional properties, by determining the white matter tracts connecting the FEF to the SC and CN. This demonstrates that parcellation of a cortical area as defi ned by fMRI activation patterns using DTI-tractography data is a fruitful tech-nique. Moreover, the parcellation (although rather variable over individuals), exhibited a general pattern: FEF-regions projecting to the CN tend to be located more inferior and more lateral than the FEF-regions projecting to the SC. This was mainly observed in the right hemisphere.
Another important fi nding was that for all FEF zones, anti-sac-cades evoke larger responses than pro-saccades. Several other recent functional imaging studies also reported that in general oculomo-tor areas in the frontal and parietal cortex exhibit larger responses around anti-saccades as compared to pro-saccades (Connolly et al., 2002; Ford et al., 2005). Clearly, the frontal cortex is involved in the control over automatic in favor of purposeful behavior, as is also known from monkey single cell recordings (Everling and Munoz, 2000), lesion studies (Guitton et al., 1985) and TMS studies (Terao et al., 1998). The FEF zones connected to the SC are not special in this respect, only regarding lateralization with respect to anti-sac-cade direction they are special.
The role of the many connections between the frontal cortex and the midbrain running through the BG in the control over automatic behavior is still far less clear. It has often been suggested that by means of the inhibitory connections to the SNpr through the CN, the FEF must be in a central position to determine whether the strong tonic inhibition of the SC by the SNpr is released or not (Hikosaka et al., 2000; Munoz and Everling, 2004). Based on the multitude of mostly recurrent pathways through the BG from many
cortical areas, some authors also conclude that a key role of the BG is the selection of an appropriate response from the repertoire of all possible responses (Redgrave et al., 1999), and even that it constitutes a central selection device. This is mostly derived from animal studies, as data on human BG functioning and connectivity is scarce. There is some compelling evidence that indeed the BG are controlling the execution of our responses in a context dependent manner (Vink et al., 2005; Grol et al., 2006). However, none of these studies is combining functional activation data with structural anatomical measures about connectivity such as DTI..
Among the fi rst in vivo reports on human FEF-BG connectivity during anti-saccades, our results suggest that for the oculomotor system, the direct connections between the FEF and SC are involved in anti-saccades to a larger extent than the connections from the FEF to BG. This of course does not suggest that the pathway through the BG does not play a role in performing anti-saccade tasks as the portions of the FEF connected to the CN did show a general (non-lateralized) increase for anti-saccades.
One can speculate on the function of this increase for the oculo-motor pathways through the CN. When performing anti-saccades, a series of processing steps needs to be successfully completed, most likely under control from the FEF. First, the system has to be set for the task by interpreting the instruction. FEF activation differences between pro- and anti-saccades have been reported before saccade target appearance (Helminski and Segraves, 2003), confi rming involvement of the FEF in ‘preparatory set’. After this, the automatic pro-saccade is to be suppressed and fi nally, a motor command should be prepared in the opposite direction and then sent to the midbrain, a process referred to as ‘vector inversion’ (Collins et al., 2008). This command should be stronger than the command needed for the pro-saccade in order to keep the pro-saccade suppressed, and hence, lateralized with respect to saccade direction. The latter could be accomplished by the FEF through its direct connections to the SC (Segraves et al., 1987; Stanton et al., 1988), that preserve a contralateral movement fi eld topography (Stanton et al., 1988). This is in agreement with our fi ndings of an increase in BOLD activation for anti-saccades in a lateralized fashion in FEF zones projecting to the SC. Competition within the SC and between the right and left SC, as has been reported for non-human primates (Moschovakis et al., 1988; Munoz and Istvan, 1998), would then resolve the confl ict between the desired anti-sac-cade and the prepotent automatic pro-saccade in favor of the anti-saccade. Together with the direct control of anti-saccade execution through direct FEF–SC connections as proposed in Figure 1C, the general suppression of the SC and hence prevention of erroneous pro-saccades mentioned before, presumably slightly earlier in time than actual anti-saccade generation, might be accomplished by FEF pathways involving the inhibitory indirect pathway through the CN and SNpr. This inhibition of the SC is, however, not necessarily performed ipsilateral to saccade direction as depicted in Figure 1B. Activation of a pathway in one hemisphere during anti-saccades would probably result in bilateral suppression of the SC by the SNpr as has been reported for monkeys (Liu and Basso, 2008). Such a brief suppression of the SC should not occur for pro-saccades, which might explain higher BOLD responses for anti-saccades in general. When one SNpr bilaterally inhibits the SC, as observed for monkeys (Liu and Basso, 2008), one would not necessarily expect lateralization with respect to saccade direction for this pathway,
Frontiers in Human Neuroscience www.frontiersin.org May 2010 | Volume 4 | Article 41 | 12
de Weijer et al. In vivo connectivity of the human FEF
which is indeed what we observe for the input signals into the BG pathway from the FEF. One could refer to this putative mechanism as a ‘gating’ function as it can determine whether a pro-saccade is allowed or not.
The integration of DTI and fMRI data as applied here could be a novel way to delineate functional differences within larger fMRI activation maps, by using structural anatomical infor-mation regarding connectivity patterns. However, the present approach clearly has it limitations. First and foremost, current DTI/fi ber tracking techniques do not yield precise representations of white matter tracts, but merely a likely location for a set of fi bers. Tracking according to the principle direction of diffusion in each voxel is prone to measurement noise in each DTI voxel, is disturbed by crossing fi ber tracts (Basser et al., 2000; Mori and van Zijl, 2002; Huang et al., 2004) and depends on tracking algo-rithm used (Mori and van Zijl, 2002). Specifi cally, fi ber tracking algorithms tend to end shortly before they reach gray matter, as the measured diffusion approaches isotropy there (Jones, 2008). Therefore, we used a 1-cm sphere around each activated voxel to be able classify it to fi bers that end before reaching gray mat-ter. Furthermore we incorporated some degree of uncertainty in both the starting regions in the SC and CN as well as in the target region in the FEF as determined using fMRI (e.g., dilated ROIs). The latter approach provides us with only a rough estimate of which parts of the FEF are connected to the CN and SC, leading to averaging of activation measures over subjects which might explain why our main result, however signifi cant, is small in size. Furthermore, substantial individual variability exists in both the actual FEF location, similar to previous reports (Neggers et al., 2007; Van Ettinger-Veenstra et al., 2009), and in a few participants one of the four fi ber bundles of interest could not be isolated. This poses another problem in performing group wise statistics: the inability to reconstruct specifi c tracts in a minority of partici-pants. This was dealt with by using statistical data imputation (see Materials and Methods and Schafer, 1999; Little and Rubin, 2002). This method estimates the BOLD response at the end of the miss-ing fi ber tract (with maximization likelihood estimates) using the response amplitude data for the remaining three tracts together with the values of the other subjects. This is a common and valid method in hypothesis testing using datasets where missing values are inevitable, and can maximize the information one can get out of such incomplete data. Actually, one can bias results when only including participants without any missing values and discard-ing participants with a missing value, as the underlying reason for missing observations could artifi cially separate the partici-pants with a missing value from completely observed participants (Raghunathan, 2004). This would complicate extrapolation of the fi ndings to the population from which the sample of subjects was drawn. Furthermore, we only accepted data from subjects where one out of four tracts could not be established, to not overly rely on missing cell estimation.
Note that the fact that sometimes a tract could not be estab-lished was not due to problems with data acquisition, the diffusion-weighted recordings had normal signal-to-noise ratios for subjects with a tract that could not be established. Rather, this problem is most likely due to the imprecision in the FACT algorithm used for DTI fi ber tracking as mentioned before.
One could argue that curvature for DTI fi bers leading to more dorsal FEF-regions, as the SC zones we observed, are selected with a bias (e.g., less fi bers). Namely, fi bers to more dorsal regions might be more curved as to more lateral regions and hence stop earlier due to the maximal curvature tracking parameter used in the FACT fi ber tracking algorithm (see Materials and Methods). However, as explained above, we accommodated spatial biases and inaccuracies of fi ber tracking by both dilating the FEF ROI as well as CN and SC masks, and incorporating a 1-cm sphere around an activated fMRI voxel to associate it with a bundle. Finally, the differences in average location between SC and CN zones were rather small. We therefore believe that it is possible that DTI fi bers to the more dorsal FEF zone are more often missed due to slightly higher curvature is an unlikely account of our result.
Notwithstanding the challenges mentioned above, we were able to detect subtle but signifi cant differences on a group level between anti- and pro-saccade response characteristics within a single sub-region that was determined using a robust fMRI localizer task and the connectivity patterns with other regions as determined with DTI..
Several recent developments in both fMRI and DTI acquisition and analysis might ameliorate some of the issues we encountered. High-resolution fMRI acquisition techniques (8 mm3/voxel at 3 T or 1 mm3/voxel at 7 T) now become available due to parallel imaging (de Zwart et al., 2006) and higher fi eld strengths (Duong et al., 2002; Bodurka et al., 2007). The large activation patterns as determined with conventional fMRI resolution (∼64 mm3/voxel) can, when using high-resolution fMRI, be expected to break up in multiple patches that are more precisely localized which facilitates the classifi cations of activation patches to certain DTI fi ber tracts. Less averaging of the BOLD signal over partially gray and white matter/cerebral spinal fl uid voxels has been shown to be benefi cial to localization (Duong et al., 2002). Secondly, by using shortened readout epochs, parallel imaging would also decrease the typical spatial EPI distortion (de Zwart et al., 2005) that might have been somewhat different for DTI and fMRI volumes, improving coreg-istration of both modalities during post processing. Furthermore, the spatial registration of fMRI and DTI data could be improved by scanning DTI twice, with a phase encoding direction running anterior–posterior and vice versa the second time (Andersson et al., 2003). Finally, recent reports suggested fi ber tracking algorithms that might be less susceptible to imaging noise and crossing fi ber tracts (Mori and van Zijl, 2002), further improving the spatial accuracy.
In summary, the present combined fMRI–DTI study of the human oculomotor system demonstrated that the cortico-tectal pathway from the FEF seems to be most clearly involved in generat-ing anti-saccades. The cortico-striatal pathway from the FEF could have a more general gating function releasing and recovering tonic inhibition of the midbrain by the SNpr at the right moment. The present fi ndings also demonstrate that parcellation of fMRI activa-tion patterns using DTI-fi ber tracking can provide new insights in the function of complex neuronal networks in the human brain.
ACKNOWLEDGMENTThe authors thank Björn Kreher for his support on using DTI&FiberTools.

Frontiers in Human Neuroscience www.frontiersin.org May 2010 | Volume 4 | Article 41 | 13
de Weijer et al. In vivo connectivity of the human FEF
striate cortex in the guidance of eye movements in the monkey. J. Neurosci. 7, 3040–3058.
Sparks, D. L. (2002). The brainstem con-trol of saccadic eye movements. Nat. Rev. Neurosci. 3, 952–964.
Stanton, G. B., Goldberg, M. E., and Bruce, C. J. (1988). Frontal eye fi eld efferents in the macaque monkey: II. Topography of terminal fi elds in midbrain and pons. J. Comp. Neurol. 271, 493–506.
Terao, Y., Fukuda, H., Ugawa, Y., Hikosaka, O., Hanajima, R., Furubayashi, T., Sakai, K., Miyauchi, S., Sasaki, Y., and Kanazawa, I. (1998). Visualization of the information flow through human oculomotor cortical regions by transcranial magnetic stimulation. J. Neurophysiol. 80, 936–946.
Van Ettinger-Veenstra, H. M., Huijbers, W., Gutteling, T. P., Vink, M., Kenemans, J. L., and Neggers, S. F. W. (2009). fMRI guided TMS on cortical eye fi elds: the frontal but not intraparietal eye fi elds regulate the coupling between visuo-spatial attention and eye movements. J. Neurophysiol. 102, 3469–3480.
Vink, M., Kahn, R. S., Raemaekers, M., van den, H. M., Boersma, M., and Ramsey, N. F. (2005). Function of striatum beyond inhibition and execution of motor responses. Hum. Brain Mapp. 25, 336–344.
Worsley, K. J., Evans, A. C., Marrett, S., and Neelin, P. (1992). A three-dimensional statistical analysis for CBF activation studies in human brain. J. Cereb. Blood Flow Metab. 12, 900–918.
Worsley, K. J., Marrett, S., Neelin, P., Vandal, A. C., Friston, K. J., and Evans, A. C. (1996). A unifi ed statistical approach for determining signifi cant signals in images of cerebral activation. Hum. Brain Mapp. 4, 58–73.
Conflict of Interest Statement: The authors declare that the research was con-ducted in the absence of any commercial or fi nancial relationships that could be con-strued as a potential confl ict of interest.
Received: 10 November 2009; paper pending published: 24 February 2010; accepted: 22 April 2010; published online: 26 May 2010.Citation: de Weijer AD, Mandl RCW, Sommer IEC, Vink M, Kahn RS and Neggers SFW (2010) Human fronto-tectal and fronto-striatal-tectal pathways activate differently during anti-saccades. Front. Hum. Neurosci. 4:41. doi: 10.3389/fnhum.2010.00041Copyright © 2010 de Weijer, Mandl, Sommer, Vink, Kahn and Neggers. This is an open-access article subject to an exclusive license agreement between the authors and the Frontiers Research Foundation, which permits unrestricted use, distribution, and reproduction in any medium, provided the original authors and source are credited.
Mori, S., Crain, B. J., Chacko, V. P., and van Zijl, P. C. (1999). Three-dimensional tracking of axonal projections in the brain by magnetic resonance imaging. Ann. Neurol. 45, 265–269.
Mori, S., and van Zijl, P. C. (2002). Fiber tracking: principles and strategies – a technical review. NMR. Biomed. 15, 468–480.
Moschovakis, A. K., Karabelas, A. B., and Highstein, S. M. (1988). Structure–function relationships in the primate superior colliculus. I. Morphological classifi cation of efferent neurons. J. Neurophysiol. 60, 232–262.
Munoz, D. P., and Everling, S. (2004). Look away: the anti-saccade task and the voluntary control of eye movement. Nat. Rev. Neurosci. 5, 218–228.
Munoz, D. P., and Istvan, P. J. (1998). Lateral inhibitory interactions in the intermedi-ate layers of the monkey superior col-liculus. J. Neurophysiol. 79, 1193–1209.
Neggers, S. F. W., Hermans, E. J., and Ramsey, N. F. (2008). Enhanced sen-sitivity with fast three-dimensional blood-oxygen-level-dependent func-tional MRI: comparison of SENSE-PRESTO and 2D-EPI at 3 T. NMR. Biomed. 21, 663–676.
Neggers, S. F. W., Huijbers, W., Vrijlandt, C. M., Vlaskamp, B. N., Schutter, D. J., and Kenemans, J. L. (2007). TMS pulses on the frontal eye fi elds break coupling between visuospatial attention and eye movements. J. Neurophysiol. 98, 2765–2778.
Neggers, S. F. W., Raemaekers, M. A. H., Lampmann, E. E. L., Postma, A., and Ramsey, N. F. (2005). Cortical and subcortical contributions to saccade latency in the human brain. Eur. J. Neurosci. 21, 2853–2863.
Nielsen, F. A., and Hansen, L. K. (2002). Modeling of activation data in the BrainMap database: detection of outliers. Hum. Brain Mapp. 15, 146–156.
Pruessmann, K. P., Weiger, M., Scheidegger, M. B., and Boesiger, P. (1999). SENSE: sensitivity encoding for fast MRI. Magn. Reson. Med. 42, 952–962.
Raghunathan, T. E. (2004). What do we do with missing data? Some options for analysis of incomplete data. Annu. Rev. Public Health 25, 99–117.
Redgrave, P., Prescott, T. J., and Gurney, K. (1999). The basal ganglia: a vertebrate solution to the selection problem? Neuroscience 89, 1009–1023.
Schafer, J. L. (1999). NORM: Multiple Imputation of Incomplete Multivariate Data Under a Normal Model [Computer software]. University Park, PA: Department of Statistics, Pennsylvania State University.
Segraves, M. A., Goldberg, M. E., Deng, S. Y., Bruce, C. J., Ungerleider, L. G., and Mishkin, M. (1987). The role of
Duong, T. Q., Yacoub, E., Adriany, G., Hu, X., Ugurbil, K., Vaughan, J. T., Merkle, H., and Kim, S. G. (2002). High- resolution, spin-echo BOLD, and CBF fMRI at 4 and 7 T. Magn. Reson. Med. 48, 589–593.
Everling, S., and Munoz, D. P. (2000). Neuronal correlates for preparatory set associated with pro-saccades and anti-saccades in the primate frontal eye fi eld. J. Neurosci. 20, 387–400.
Ford, K. A., Goltz, H. C., Brown, M. R., and Everling, S. (2005). Neural processes associated with antisaccade task per-formance investigated with event-related FMRI. J. Neurophysiol. 94, 429–440.
Goutte, C., Nielsen, F. A., and Hansen, L. K. (2000). Modeling the haemody-namic response in fMRI using smooth FIR fi lters. IEEE Trans. Med. Imaging 19, 1188–1201.
Grol, M. J., de Lange, F. P., Verstraten, F. A., Passingham, R. E., and Toni, I. (2006).Cerebral changes during performance of overlearned arbitrary visuomotor associations. J. Neurosci. 26, 117–125.
Guitton, D., Buchtel, H. A., and Douglas, R. M. (1985). Frontal lobe lesions in man cause diffi culties in suppressing reflexive glances and in generating goal-directed saccades. Exp. Brain Res. 58, 455–472.
Helminski, J. O., and Segraves, M. A. (2003). Macaque frontal eye field input to saccade-related neurons in the superior colliculus. J. Neurophysiol. 90, 1046–1062.
Hikosaka, O., Takikawa, Y., and Kawagoe, R. (2000). Role of the basal ganglia in the control of purposive saccadic eye movements. Physiol. Rev. 80, 953–978.
Huang, H., Zhang, J., van Zijl, P. C., and Mori, S. (2004). Analysis of noise effects on DTI-based tractography using the brute-force and multi-ROI approach. Magn. Reson. Med. 52, 559–565.
Jiang, H., van Zijl, P. C., Kim, J., Pearlson, G. D., and Mori, S. (2006). DtiStudio: resource program for diffusion ten-sor computation and fiber bundle tracking. Comput. Methods Programs Biomed. 81, 106–116.
Jones, D. K. (2008). Studying connections in the living human brain with diffu-sion MRI. Cortex 44, 936–952.
Kreher, B., Hennig, J., and Il’yasov, K. (2006). DTI&FiberTools: a complete toolbox for DTI calculation, fiber tracking, and combined evaluation. Proceeding of ISMRM 14th International Scientifi c Meeting. Seattle, USA.
Little, R. J. A., and Rubin, D. B. (2002). Statistical Analysis with Missing Data, 2nd Edn. New York: Wiley.
Liu, P., and Basso, M. A. (2008). Substantia nigra stimulation infl uences monkey superior colliculus neuronal activ-ity bilaterally. J. Neurophysiol. 100, 1098–1112.
REFERENCESAguirre, G. K., and D’Esposito, M. (2000).
“Experimental design for brain fMRI,” in Functional MRI, eds C. Moonen and T. W. Bandettini (Heidelberg/Berlin: Springer-Verlag), 369–380.
Alexander, G. E., and Crutcher, M. D. (1990). Functional architecture of basal ganglia circuits: neural substrates of parallel processing. Trends Neurosci. 13, 266–271.
Andersson, J. L., Skare, S., and Ashburner, J. (2003). How to correct susceptibility distortions in spin-echo echo-planar images: application to diffusion tensor imaging. Neuroimage 20, 870–888.
Ashburner, J., and Friston, K. J. (2005). Unified segmentation. Neuroimage 26, 839–851.
Basser, P. J., Pajevic, S., Pierpaoli, C., Duda, J., and Aldroubi, A. (2000). In vivo fi ber tractography using DT-MRI data. Magn. Reson. Med. 44, 625–632.
Bodurka, J., Ye, F., Petridou, N., Murphy, K., and Bandettini, P. A. (2007). Mapping the MRI voxel volume in which thermal noise matches physi-ological noise – implications for fMRI. Neuroimage 34, 542–549.
Bruce, C. J., and Goldberg, M. E. (1985). Primate frontal eye fields. I. Single neurons discharging before saccades. J. Neurophysiol. 53, 603–635.
Collins, T., Vergilino-Perez, D., Delisle, L., and Doré-Mazars, K. (2008).Visual versus motor vector inversions in the antisaccade task: a behavioral inves-tigation with saccadic adaptation. J. Neurophysiol. 99, 2708–2718.
Connolly, J. D., Goodale, M. A., Menon, R. S., and Munoz, D. P. (2002). Human fMRI evidence for the neural corre-lates of preparatory set. Nat. Neurosci. 5, 1345–1352.
Conturo, T. E., Lori, N. F., Cull, T. S., Akbudak, E., Snyder, A. Z., Shimony, J. S., McKinstry, R. C., Burton, H., and Raichle, M. E. (1999). Tracking neuro-nal fi ber pathways in the living human brain. Proc. Natl. Acad. Sci. U.S.A. 96, 10422–10427.
de Zwart, J. A., Silva, A. C., van, G. P., Kellman, P., Fukunaga, M., Chu, R., Koretsky, A. P., Frank, J. A., and Duyn, J. H. (2005). Temporal dynamics of the BOLD fMRI impulse response. Neuroimage 24, 667–677.
de Zwart, J. A., van Gelderen, P., Golay, X., Ikonomidou, V. N., and Duyn, J. H. (2006). Accelerated parallel imaging for functional imaging of the human brain. NMR. Biomed. 19, 342–351.
Donaldson, D. L., and Buckner, R. L. (2001). “Effective paradigm design,” in Functional MRI: An Introduction to Methods, eds P. Jezzard, P. M. Matthews and S. M. Smith (New York: Oxford University Press Inc.), 177–195.
Copyright © 2022 FDOKUMEN