An internal clock for predictive saccades is established identically by auditory or visual...
18
An internal clock for predictive saccades is established identically by auditory or visual information Wilsaan M. Joiner 1 , Jung-Eun Lee 1 , Adrian Lasker 2 , and Mark Shelhamer 1,3 1 Department of Biomedical Engineering, The Johns Hopkins University, School of Medicine, Baltimore, MD 21287 2 Department of Neurology, The Johns Hopkins University, School of Medicine, Baltimore, MD 21287 3 Department of Otolaryngology -- Head & Neck Surgery, The Johns Hopkins University, School of Medicine, Baltimore, MD 21287 Abstract Previously we have shown that repetitive predictive saccades to alternating visual targets are mediated by an internal clock. That is, when subjects track a periodic visual stimulus alternating at a high rate (a small inter-stimulus interval, ISI, of 500 or 833 ms), they use an internal estimate of stimulus timing to pre-program the eye movement timing. Auditory pacing tones at the same rate also generate predictive saccades. It is natural to ask if an identical internal clock is used to generate the predictive saccades in each case. We hypothesized that if subjects can use auditory information to establish an internal estimate of stimulus timing – as we demonstrated can be done with visual targets – then the distributions of predictive inter-saccade intervals should demonstrate the well- known “Scalar Property” for either Auditory Cued or Visual Cued stimuli: inter-saccade interval histograms should be almost identical when each is divided by its mean. However, when making reactive saccades to a pacing stimulus (at a low rate), there should be a difference in the timing statistics between Auditory and Visual pacing, due to differences in sensory processing. We report here that the variances of inter-saccade intervals at three predictive pacing rates (ISIs of 500, 833, and 1000 ms) are equivalent, whereas the variance for Auditory Cued Pacing was greater than that for Visual Cued Pacing during reactive saccades at two reactive pacing rates (ISIs of 1667 and 2500 ms). When the inter-saccade interval histograms at the predictive pacing rates were normalized, the distributions were nearly identical for both Visual and Auditory Cued Pacing, which means that the Scalar Property holds for predictive saccades from either pacing stimulus. These results suggest that (1) an internal timing reference (clock) can be established by either auditory or visual information, and (2) during predictive tracking the variability in saccade timing is due to the variability in the internal timing representation, while during reactive tracking the variability in saccade timing depends on the sensory modality used to trigger the saccades. Keywords prediction; timing; internal clock; visual; auditory Correspondence: Wilsaan Joiner, Johns Hopkins School of Medicine, Department of Biomedical Engineering, 720 Rutland Avenue/606 Traylor Bldg., Baltimore, MD 21205 USA, 410-955-2904, 410-614-1746 FAX, [email protected] Publisher's Disclaimer: This is a PDF file of an unedited manuscript that has been accepted for publication. As a service to our customers we are providing this early version of the manuscript. The manuscript will undergo copyediting, typesetting, and review of the resulting proof before it is published in its final citable form. Please note that during the production process errors may be discovered which could affect the content, and all legal disclaimers that apply to the journal pertain. NIH Public Access Author Manuscript Vision Res. Author manuscript; available in PMC 2008 June 1. Published in final edited form as: Vision Res. 2007 June ; 47(12): 1645–1654. NIH-PA Author Manuscript NIH-PA Author Manuscript NIH-PA Author Manuscript
-
Upload
independent -
Category
Documents
-
view
3 -
download
0
Transcript of An internal clock for predictive saccades is established identically by auditory or visual...
An internal clock for predictive saccades is established identicallyby auditory or visual information
Wilsaan M. Joiner1, Jung-Eun Lee1, Adrian Lasker2, and Mark Shelhamer1,31 Department of Biomedical Engineering, The Johns Hopkins University, School of Medicine, Baltimore, MD21287
2 Department of Neurology, The Johns Hopkins University, School of Medicine, Baltimore, MD 21287
3 Department of Otolaryngology -- Head & Neck Surgery, The Johns Hopkins University, School of Medicine,Baltimore, MD 21287
AbstractPreviously we have shown that repetitive predictive saccades to alternating visual targets aremediated by an internal clock. That is, when subjects track a periodic visual stimulus alternating ata high rate (a small inter-stimulus interval, ISI, of 500 or 833 ms), they use an internal estimate ofstimulus timing to pre-program the eye movement timing. Auditory pacing tones at the same ratealso generate predictive saccades. It is natural to ask if an identical internal clock is used to generatethe predictive saccades in each case. We hypothesized that if subjects can use auditory informationto establish an internal estimate of stimulus timing – as we demonstrated can be done with visualtargets – then the distributions of predictive inter-saccade intervals should demonstrate the well-known “Scalar Property” for either Auditory Cued or Visual Cued stimuli: inter-saccade intervalhistograms should be almost identical when each is divided by its mean. However, when makingreactive saccades to a pacing stimulus (at a low rate), there should be a difference in the timingstatistics between Auditory and Visual pacing, due to differences in sensory processing. We reporthere that the variances of inter-saccade intervals at three predictive pacing rates (ISIs of 500, 833,and 1000 ms) are equivalent, whereas the variance for Auditory Cued Pacing was greater than thatfor Visual Cued Pacing during reactive saccades at two reactive pacing rates (ISIs of 1667 and 2500ms). When the inter-saccade interval histograms at the predictive pacing rates were normalized, thedistributions were nearly identical for both Visual and Auditory Cued Pacing, which means that theScalar Property holds for predictive saccades from either pacing stimulus. These results suggest that(1) an internal timing reference (clock) can be established by either auditory or visual information,and (2) during predictive tracking the variability in saccade timing is due to the variability in theinternal timing representation, while during reactive tracking the variability in saccade timingdepends on the sensory modality used to trigger the saccades.
Keywordsprediction; timing; internal clock; visual; auditory
Correspondence: Wilsaan Joiner, Johns Hopkins School of Medicine, Department of Biomedical Engineering, 720 Rutland Avenue/606Traylor Bldg., Baltimore, MD 21205 USA, 410-955-2904, 410-614-1746 FAX, [email protected]'s Disclaimer: This is a PDF file of an unedited manuscript that has been accepted for publication. As a service to our customerswe are providing this early version of the manuscript. The manuscript will undergo copyediting, typesetting, and review of the resultingproof before it is published in its final citable form. Please note that during the production process errors may be discovered which couldaffect the content, and all legal disclaimers that apply to the journal pertain.
NIH Public AccessAuthor ManuscriptVision Res. Author manuscript; available in PMC 2008 June 1.
Published in final edited form as:Vision Res. 2007 June ; 47(12): 1645–1654.
NIH
-PA Author Manuscript
NIH
-PA Author Manuscript
NIH
-PA Author Manuscript

IntroductionWe have previously shown that repetitive predictive saccades made in response to alternatingvisual targets are mediated by an internal clock. That is, when subjects track a periodic visualstimulus alternating at a high rate (a small inter-stimulus interval, ISI, of 500 or 833 ms), theyuse an internal estimate of stimulus timing to pre-program the eye movements (Joiner &Shelhamer, 2006). The distributions of the inter-saccade intervals (time between saccades) atthese predictive pacing rates demonstrate the Scalar Property (Gibbon, 1977;Gibbon,Malapani, Dale and Gallistel, 1997;Meck & Benson, 2002): the variance of the time estimateincreases with the square of the mean. Thus, inter-saccade interval distributions (which duringpredictive tracking represent the distribution of the time estimates) at different rates arestatistically indistinguishable when each is divided by its mean.
This relationship has been modeled by the following framework (Treisman, 1963;Gibbon etal., 1997;Meck & Benson, 2002): an internal estimate of a time interval is generated byintegrating, over time, a signal which represents an internal counter. When the integrated signalreaches threshold (which specifies the required interval duration), a timed event occurs (in thiscase a saccade), and the integrator is reset to start a new cycle. Typically the integrated signalhas a random component due to neural noise, and this leads to randomness in the event times(time estimates). More specifically, the longer the inter-event interval, the longer theintegration time of the noisy signal, and hence the more variability there will be in the eventtimes (Schöner, 2002). However, the variability of the time estimate is proportional to theinterval length (Weber’s Law) and thus the distributions of inter-event intervals for differentinterval lengths should be nearly identical when each is divided by its mean, demonstratingthe Scalar Property. This is not the case when making reactive movements to a visual stimulusas we demonstrated for repetitive saccades made to targets alternating at a lower pacing rate(a large ISI of 2500 ms); in this case, the variability of the inter-saccade intervals is due to thevariability in reaction time from trial to trial (the passage of time is not internally estimated)and thus the Scalar Property does not apply (Joiner & Shelhamer, 2006).
Other investigators have demonstrated differences in single saccadic responses to auditory andvisual stimuli. For example, for horizontal targets less than 40 deg from the point of fixation,the reaction time for a localized auditory target is greater and more variable than that for avisual target at the same eccentricity (Zahn, Abel and Dell’Osso, 1978;Zahn, Abel, Dell’Ossoand Daroff, 1979;Zambarbieri, Schmid, Magenes and Prablanc, 1982). In addition, for auditorytargets, the mean reaction time decreases as the target eccentricity increases, whereas theopposite relationship is seen for visual targets (Yao & Peck, 1997;Zahn et al., 1978;Zambarbieriet al., 1982). Despite these differences, when tracking a repetitive visual or auditory stimulusalternating at a short ISI (for example 1000 ms), subjects make comparable predictive responses(saccade latency less than 100 ms) regardless of the sensory modality (Zambarbieri, Schmidand Ventre, 1987).
The purpose of this study was to utilize the Scalar Property to compare the inter-saccade intervaldistributions formed from repetitive saccade tracking when cued by different pacing modalitiesand at different pacing rates. Based on the findings described above, we hypothesized that ifsubjects can use auditory information to establish an internal estimate of target timing – as wedemonstrated can be done with visual targets – then the distributions of (predictive) inter-saccade intervals at short inter-stimulus intervals should demonstrate the Scalar Property, forboth auditory and visual stimuli. For example, the normalized inter-saccade intervaldistributions for auditory pacing at an ISI of 1000 ms should be statistically indistinguishablefrom the distributions from visual pacing at a smaller ISI. However, when making reactivesaccades at a low pacing rate, there should be a difference in the timing statistics due todifferences in the reactive response to the different sensory stimuli. That is, the normalized
Joiner et al. Page 2
Vision Res. Author manuscript; available in PMC 2008 June 1.
NIH
-PA Author Manuscript
NIH
-PA Author Manuscript
NIH
-PA Author Manuscript
inter-saccade interval distributions at reactive pacing rates should not be identical acrossdifferent pacing rates within a stimulus modality (i.e., comparing visual-cued pacing at an ISIof 2500 to visual-cued pacing at an ISI of 1667 ms) or across different sensory cues within apacing rate (i.e., comparing visual-cued pacing at an ISI of 2500 ms to auditory-cued pacingat the same ISI).
To test this hypothesis we recorded the eye movements of eight subjects during two pacingconditions: (1) Visual Cued Pacing – subjects tracked LED targets alternating between twofixed positions at a given ISI, (2) Auditory Cued Pacing – both LED targets remainedilluminated and subjects made saccades between the two when signaled by a pacing tone froman overhead speaker. We tested two reactive (ISIs of 2500 and 1667 ms) and three predictive(ISIs of 556, 833, and 1000 ms) pacing rates. We report that the variances of the inter-saccadeintervals at all predictive pacing rates were approximately equivalent, whereas the inter-saccade interval variance for Auditory Cued Pacing was typically greater than that for VisualCued Pacing during reactive saccades at the lower pacing rates. When the inter-saccade intervalhistograms at the predictive rates were normalized, the distributions were nearly identical forboth Visual and Auditory Cued Pacing. These results suggest that (1) an internal timingreference can be established by either auditory or visual information, and (2) during predictivetracking the variability in saccade timing is due to the variability in the internal timingrepresentation, while during reactive tracking the variability in saccade timing depends on thesensory modality used to trigger the saccades.
MethodsGeneral
The eye movements of eight subjects (A–H) were recorded while they performed 10 separateblocks of a saccade-tracking task. In each block of trials the timing information was from eithera visual or an auditory stimulus. Only subjects G and H had prior knowledge of the goals ofthe study. Informed consent, according to the local institutional review board, was obtainedfrom each participant. Data were acquired on a PC-compatible Pentium 166-MHz computerrunning real-time experiment control software developed in-house. Horizontal movements ofthe eyes were recorded with a Series 1000 Binocular Infrared Recording System (Microguide),sampled at 1000 Hz. The system was calibrated prior to data acquisition by having subjectsfixate visual targets at known locations. Subjects were seated in a stationary chair in front ofa tangent screen (124 cm in front of the subject) on which were located two LED targets (leftand right 15 deg). The head was fixed with a chin rest. Subjects were given no explicitinstructions as to timing or accuracy; in the visual tracking tasks they were told simply to “lookat the target” and in the auditory tasks, where both lights were illuminated, to “look at the nexttarget when you hear the beep.”
Visual Cued Tracking TaskIn the Visual Cued tracking task subjects tracked LED targets alternating between two fixedpositions (±15 deg) at a given ISI. Each subject made 100 saccades at five pacing rates: ISIsof 2500, 1667, 1000, 833, and 556 ms. There were two pacing rates that generally promotedreactive tracking (ISIs of 1667 and 2500 ms) and three pacing rates that largely promotedpredictive tracking (ISIs of 556, 833, and 1000 ms). Examples of tracking at the lowest andhighest pacing rates (ISIs of 2500 and 556 ms) for this task are shown in Figure 1A and B forsubject B.
Auditory Cued Tracking TaskIn the Auditory Cued tracking task subjects made saccades between the two continuouslyilluminated LED targets (±15 deg) when signaled by a pacing tone (200 ms in duration) from
Joiner et al. Page 3
Vision Res. Author manuscript; available in PMC 2008 June 1.
NIH
-PA Author Manuscript
NIH
-PA Author Manuscript
NIH
-PA Author Manuscript

a speaker located above the subject (not coincident with either visual target). The pacing tonewas not localized to either target position. The tone was given with the same ISIs as in thevisual tracking task (ISIs of 2500, 1667, 1000, 833, and 556 ms), for 100 eye movements ateach ISI. Examples for the lowest and highest pacing rates for this task (ISIs of 2500 and 556ms) are shown in Figure 1C and D for subject B.
Pacing rate and stimulus-cue modality were counterbalanced between subjects. Subjectsperformed one block (consisting of 100 saccades) for each combination of sensory cue andpacing rate (10 blocks total).
Data AnalysisAnalysis of eye-tracking data was done off-line. First, eye velocity and acceleration werecalculated using a four-point digital differentiator based upon a least-squares derivativealgorithm (Savitzky & Golay, 1964). This is an efficient iterative method of fitting a third-order polynomial to each data point and the preceding and following two values, then findingthe derivative of the fitted polynomial. This introduces less noise than conventionaldifferentiators. Eye movement latency was determined by comparing the onset of the primarysaccade to the onset of the target in each trial. Saccade onset was determined using a velocitythreshold (≥60°/s). Inter-saccade interval was the time between each primary saccade.
ResultsTracking Variability and Weber’s Law
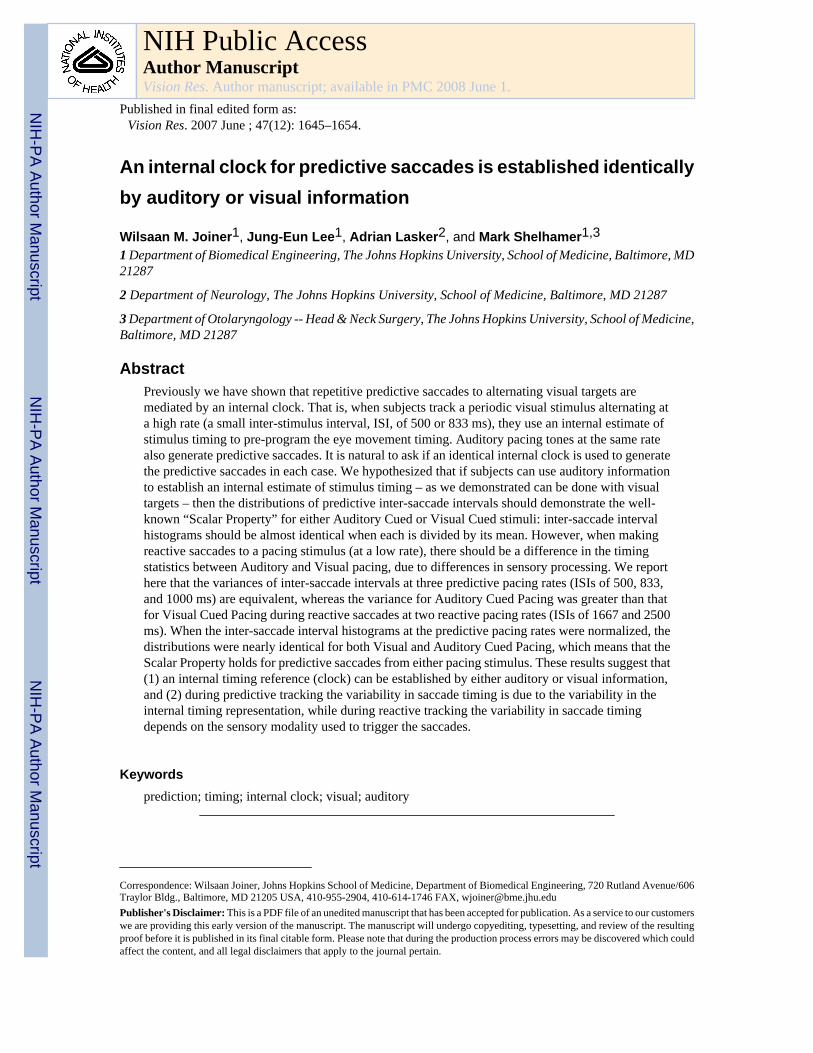
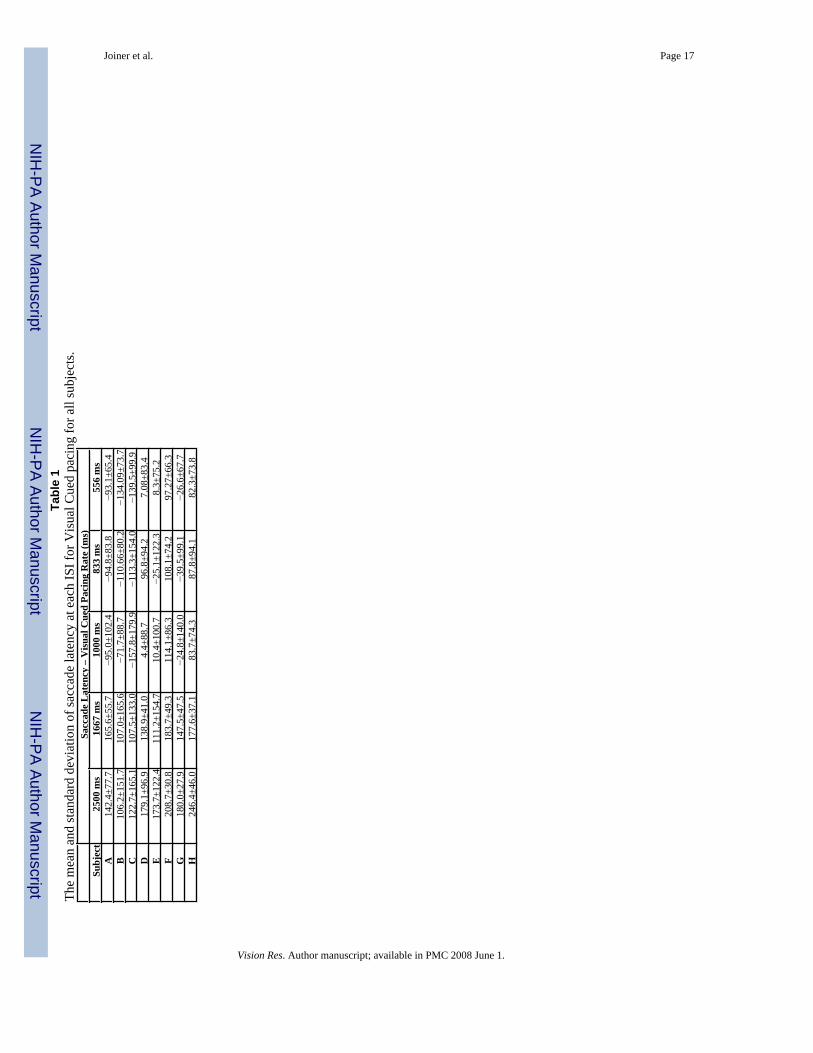
Subjects demonstrated the same tracking behavior for the same pacing rate for both sensoryconditions. An example is shown in Figure 2 for subject A. Displayed are histograms of saccadelatency from the two sensory stimulus conditions (Visual and Auditory Cued Pacing) for thefive pacing rates (ISIs of 2500, 1667, 1000, 833, and 556 ms). The thick black dashed line ineach panel represents a latency of 100 ms, which we consider the criterion for definingpredictive saccades (Isotalo, Lasker and Zee, 2005;Leigh & Zee, 1999). At the two lowestpacing rates (ISIs of 2500 and 1667 ms) the latency histograms are grouped to the right of thedashed line for both sensory stimuli conditions. This demonstrates that the subject is mainlymaking reactive movements to both sensory cues at these timing rates. At the three highestpacing rates (ISIs of 1000, 833, and 556 ms) the latency histograms are grouped to the left ofthe dashed line and distributed below 0 ms. Thus, at these pacing rates the subject is largelymaking predictive movements (eye movements before the stimulus cue) for both sensorystimuli conditions. These results are also summarized in Tables 1 and 2 for all subjects.
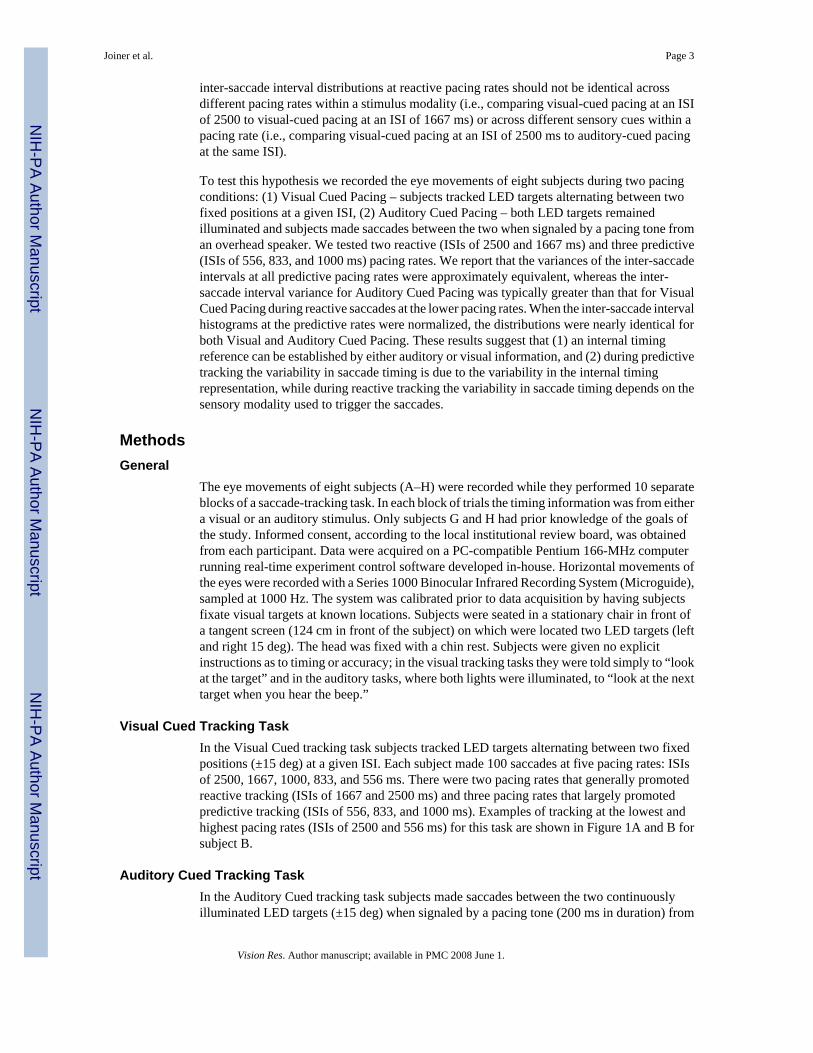
In Figure 3 the standard deviation of the inter-saccade intervals for Visual Cued Pacing isplotted against the variance for Auditory Cued Pacing for all subjects. The two slowest pacingrates (ISIs of 2500 and 1667 ms) are displayed in Figure 3A and the three fastest pacing rates(ISIs of 1000, 833, and 556 ms) in Figure 3B. The thick black dashed line represents equalvariance of the eye movement timing (inter-saccade intervals) from the two sensory stimulusconditions. During the slowest pacing rates, the standard deviation of the inter-saccade intervalsduring Auditory Cued Pacing is generally greater than during Visual Cued Pacing; the pointsplotted in Figure 3A are mainly grouped below the dashed black line. This was not the case atthe three fastest pacing rates displayed in Figure 3B. In this case the points are distributed alongthe black dashed line demonstrating that the eye movement timing variability is approximatelyequivalent during the two sensory stimuli conditions. The data in Figure 3B also exhibitWeber’s Law in both sensory conditions: timing variability increases as the duration of thetimed interval increases. As shown in the Figure 3B, the standard deviation of the inter-saccadeintervals made to the ISI of 556 ms during the two sensory stimuli conditions is largely groupedbelow the ISIs of 833 and 1000 ms.
Joiner et al. Page 4
Vision Res. Author manuscript; available in PMC 2008 June 1.
NIH
-PA Author Manuscript
NIH
-PA Author Manuscript
NIH
-PA Author Manuscript
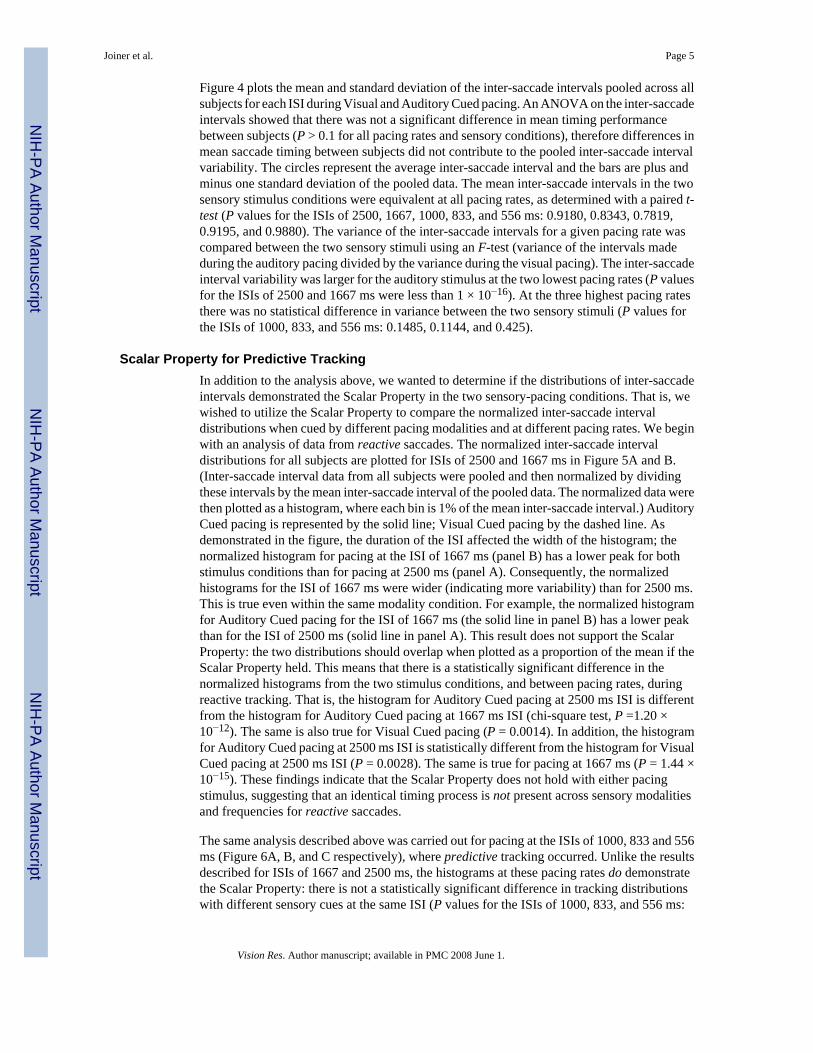
Figure 4 plots the mean and standard deviation of the inter-saccade intervals pooled across allsubjects for each ISI during Visual and Auditory Cued pacing. An ANOVA on the inter-saccadeintervals showed that there was not a significant difference in mean timing performancebetween subjects (P > 0.1 for all pacing rates and sensory conditions), therefore differences inmean saccade timing between subjects did not contribute to the pooled inter-saccade intervalvariability. The circles represent the average inter-saccade interval and the bars are plus andminus one standard deviation of the pooled data. The mean inter-saccade intervals in the twosensory stimulus conditions were equivalent at all pacing rates, as determined with a paired t-test (P values for the ISIs of 2500, 1667, 1000, 833, and 556 ms: 0.9180, 0.8343, 0.7819,0.9195, and 0.9880). The variance of the inter-saccade intervals for a given pacing rate wascompared between the two sensory stimuli using an F-test (variance of the intervals madeduring the auditory pacing divided by the variance during the visual pacing). The inter-saccadeinterval variability was larger for the auditory stimulus at the two lowest pacing rates (P valuesfor the ISIs of 2500 and 1667 ms were less than 1 × 10⁻¹⁶). At the three highest pacing ratesthere was no statistical difference in variance between the two sensory stimuli (P values forthe ISIs of 1000, 833, and 556 ms: 0.1485, 0.1144, and 0.425).
Scalar Property for Predictive TrackingIn addition to the analysis above, we wanted to determine if the distributions of inter-saccadeintervals demonstrated the Scalar Property in the two sensory-pacing conditions. That is, wewished to utilize the Scalar Property to compare the normalized inter-saccade intervaldistributions when cued by different pacing modalities and at different pacing rates. We beginwith an analysis of data from reactive saccades. The normalized inter-saccade intervaldistributions for all subjects are plotted for ISIs of 2500 and 1667 ms in Figure 5A and B.(Inter-saccade interval data from all subjects were pooled and then normalized by dividingthese intervals by the mean inter-saccade interval of the pooled data. The normalized data werethen plotted as a histogram, where each bin is 1% of the mean inter-saccade interval.) AuditoryCued pacing is represented by the solid line; Visual Cued pacing by the dashed line. Asdemonstrated in the figure, the duration of the ISI affected the width of the histogram; thenormalized histogram for pacing at the ISI of 1667 ms (panel B) has a lower peak for bothstimulus conditions than for pacing at 2500 ms (panel A). Consequently, the normalizedhistograms for the ISI of 1667 ms were wider (indicating more variability) than for 2500 ms.This is true even within the same modality condition. For example, the normalized histogramfor Auditory Cued pacing for the ISI of 1667 ms (the solid line in panel B) has a lower peakthan for the ISI of 2500 ms (solid line in panel A). This result does not support the ScalarProperty: the two distributions should overlap when plotted as a proportion of the mean if theScalar Property held. This means that there is a statistically significant difference in thenormalized histograms from the two stimulus conditions, and between pacing rates, duringreactive tracking. That is, the histogram for Auditory Cued pacing at 2500 ms ISI is differentfrom the histogram for Auditory Cued pacing at 1667 ms ISI (chi-square test, P =1.20 ×10⁻¹²). The same is also true for Visual Cued pacing (P = 0.0014). In addition, the histogramfor Auditory Cued pacing at 2500 ms ISI is statistically different from the histogram for VisualCued pacing at 2500 ms ISI (P = 0.0028). The same is true for pacing at 1667 ms (P = 1.44 ×10⁻¹⁵). These findings indicate that the Scalar Property does not hold with either pacingstimulus, suggesting that an identical timing process is not present across sensory modalitiesand frequencies for reactive saccades.
The same analysis described above was carried out for pacing at the ISIs of 1000, 833 and 556ms (Figure 6A, B, and C respectively), where predictive tracking occurred. Unlike the resultsdescribed for ISIs of 1667 and 2500 ms, the histograms at these pacing rates do demonstratethe Scalar Property: there is not a statistically significant difference in tracking distributionswith different sensory cues at the same ISI (P values for the ISIs of 1000, 833, and 556 ms:
Joiner et al. Page 5
Vision Res. Author manuscript; available in PMC 2008 June 1.
NIH
-PA Author Manuscript
NIH
-PA Author Manuscript
NIH
-PA Author Manuscript

0.33, 1.00, 0.99). In other words, the normalized histogram for Auditory Cued pacing at theISI of 1000 ms is not significantly different from the histogram for Visual Cued pacing at thesame ISI (panel A). All histograms presented in panels A, B, and C are again displayed in panelD for comparison. As shown in panel D, qualitatively all six distributions overlap in maximumvalue and width. Statistically, there is not a significant difference in 9 of the 15 possiblecomparisons between normalized histograms (P>0.01, chi-square test). As one example, thenormalized inter-saccade interval histogram for Visual Cued pacing at the ISI of 556 ms isstatistically indistinguishable from the normalized inter-saccade interval histogram forAuditory Cued pacing at the ISI of 1000 ms (P = 1.00). The fact that the Scalar Property holdsfor predictive saccades in both sensory modalities indicates that they share a common timingmechanism.
DiscussionIn this study we have provided evidence that human subjects use the same internal timingmechanism (neural clock) to predictively track targets when cued by a repetitive visual orauditory stimulus. We base this conclusion on two behavioral results: (1) the variance of theinter-saccade intervals at the three predictive pacing rates tested (ISIs of 500, 833, and 1000ms) were statistically indistinguishable between the two sensory conditions, (2) when the inter-saccade interval histograms at the predictive pacing rates were normalized, the distributionswere nearly identical for both Visual and Auditory Cued pacing.
Previous Behavioral Studies that Support Separate Modality-Specific Timing MechanismsThere are numerous differences in perceptual and motor responses to auditory versus visualstimuli that suggest that repetitive responses to these two stimuli might not be mediated by thesame timing mechanism. For example, there is a long line of research that has shown thatacoustic intervals are judged longer than visual intervals of the same physical duration(Goldstone, Boardman and Lhamon, 1959;Behar & Bevin, 1961;Goldstone & Goldfarb,1964a,b;Goldstone & Lhamon, 1972,1974;Walker & Scott, 1981). This difference led Penneyand colleagues (2001) to propose that the two stimuli cause a putative internal clock to run atdifferent rates. In terms of an integrate-to-threshold timing mechanism this would mean thatthe linear-rising noisy signal grows at a faster rate for visual compared to auditory stimuli. Itshould be noted, however, that in the study reported here we are examining the time betweenmotor responses rather than the duration of the sensory stimulus. That is, the integrated signalrepresents the estimate of the time between motor responses (saccades) rather than the durationof the visual or auditory stimulus. In this way we believe we are engaging the same timekeepingmechanism with each sensory modality, resulting in the equivalence of the distributions of thetiming between movements (inter-saccade intervals) for different pacing rates and sensorycues.
Recent imaging studies have also suggested a separation in the neural areas responsible fortimekeeping to auditory and visual stimuli. Jantzen and colleagues (2005) examined neuralactivity in healthy human subjects as they coordinated a finger-thumb opposition movementto either a visual or auditory stimulus presented repeatedly at an ISI of 800 ms. They foundincreased activity in the superior temporal gyrus during auditory cued pacing, while visualpacing generally increased activity in the superior parietal lobe, the middle temporal area, andright middle frontal gyrus. In addition, the authors reported that there was not a statisticaldifference in the inter-response interval variability between the two modalities. Anotherimaging study examined repetitive finger presses to different sensory stimuli presented at anISI of 400 ms (Jäncke, Loose, Lutz, Specht and Shah, 2000). These authors found that activitygenerally increased in the premotor cortex, supplementary motor area, and thalamus duringauditory pacing, while visual pacing typically activated the inferior parietal lobule and
Joiner et al. Page 6
Vision Res. Author manuscript; available in PMC 2008 June 1.
NIH
-PA Author Manuscript
NIH
-PA Author Manuscript
NIH
-PA Author Manuscript

cerebellar vermis. However, unlike the Jantzen study, these authors reported that the inter-tapinterval variance during synchronization to the visual stimulus was larger than duringsynchronization to the auditory stimulus. Other differences in the oculomotor responses tothese two stimuli are noted in the introduction section. (It is important to note that the aboveexamples support the hypothesis that temporal processing is mediated by distributed brain areas(Rao, Harrington, Haaland, Bobholz, Cox and Binder, 1997;Buonomano & Karmarkar,2002;Buhusi & Meck, 2005). It is not our intent to argue that the brain represents time in acentral manner, but rather that the data that we present here suggest that the temporalprocessing, whether centralized or distributed, during predictive saccade tracking is the samewhen the timing information is provided by different modalities.)
Though in this study, during reactive tracking Auditory Cued pacing elicited greater variabilitythan Visual Cued pacing, there is evidence that the opposite relationship holds for repetitivemanual responses (Jäncke et al., 2000;Chen, Repp and Patel, 2002;Kolers & Brewster, 1985).In addition, the greater variability of single saccadic reaction times to auditory targets notedin the introduction is attributed to delays in reconstructing target position from non-visualinformation (Yao & Peck, 1997;Zambarbieri et al., 1982). However, in the current study targetposition was always visually presented, even when the timing information was auditory. Thatis, the response time during reactive tracking to a purely visual stimulus was less variable thanthe response time to a visual stimulus cued by an auditory source. It is possible that the increasedvariability for the auditory condition is related to having to deliberately disengage fixationwhereas during the visual condition the jumping of the target diminishes if not eliminates theduration of this process. An interesting future study would be to compare the reaction timevariability to purely visual targets to the response variability to visual targets cued by a non-localized auditory signal.
Previous Behavioral Studies that Support a Modality-Independent Timing MechanismDespite the evidence outlined above for separate modality-specific timing mechanisms, thereis an abundance of previous reports that support a timing mechanism that performs equally forauditory and visual stimuli. For example, Eijkman and Vendrik (1965) found, with a durationdetection task, that the accuracy of timing was equal for visual and auditory stimuli and alsothat the combination of both modalities did not increase the accuracy of timing. The fact thatperformance did not improve by combining the stimuli suggests the use of one common centralclock for both modalities. Warm and colleagues (1975) found that training to increase accuracyin temporal discrimination transferred between modalities, again suggesting a common clock.There are also results from non-primates (Roberts, 1982) that suggest that both light and soundcues can be utilized similarly in an internal clock mechanism.
The use of auditory and visual stimuli for timing has also been demonstrated for oculomotorsmooth pursuit. In a recent study by Jarrett and Barnes (2005) subjects tracked a visual targetmoving at a constant velocity to the right and then returning leftward with a variable reversaltime. The start and reversal times of the upcoming visual stimulus were provided by eitheraudio cues prior to target presentation or direct visual information (repetitive tracking of thestimulus). The times of eye reversal with respect to the stimulus, for the visual-only and theauditory-cued conditions, were not significantly different. These findings show that timinginformation derived from auditory cues or from direct visual motion can be used equally wellby human subjects to predictively time the anticipatory initiation and trajectory change ofpursuit eye movements.
Recent studies of synchronized tapping have also investigated responses to auditory and visualpacing stimuli. Merchant and colleagues (2006) examined the variance of inter-tap intervals(ITIs) as subjects tapped in synchrony to an auditory or visual stimulus presented at ISIs thatranged from 350 to 1000 ms. Similar to the results presented in Figure 3B, they reported similar
Joiner et al. Page 7
Vision Res. Author manuscript; available in PMC 2008 June 1.
NIH
-PA Author Manuscript
NIH
-PA Author Manuscript
NIH
-PA Author Manuscript

variance in the inter-tap intervals during the two sensory stimuli conditions. In addition,consistent with the present results, the inter-tap interval variance increased as interval lengthincreased for both sensory conditions.
In a similar study (Chen et al., 2002) subjects tapped in synchrony to either an auditory (tone)or visual (LED) stimulus presented repetitively at an ISI of 488 ms. The authors performedspectral analysis on the ITIs and on the latency time series. (The power spectra representfluctuations in each quantity as a function of frequency, not tapping performance at differentpacing frequencies.) They found that there were differences in ITIs and in latency variability(as seen by differences in the power spectra) above a critical frequency that corresponded tofluctuation intervals longer than 3 seconds. That is, over time intervals of more than 3 seconds,the variability of the visual condition was greater than that of the auditory condition. However,for intervals of less than 3 seconds the variances of the two sensory conditions were similar.The authors state that, “This integration process may be mostly determined by a centralmechanism, and less dependent upon different modalities. This could be the reason that weobserved similar variances in auditory and visual synchronization within 3 seconds… Thistime scale may represent a modality-independent temporal integration window which operatesin sensorimotor integration” Supporting our findings, these results suggest that the timingmechanisms in synchronized tapping to ISIs below 3 seconds are similar across modalities,but when synchronized to ISIs above 3 seconds there are variability difference across sensorymodalities.
This 3-second interval has been shown to be a threshold in tapping behavior in other studiesas well (MacDorman, 1962;Engström, Kelso and Holroyd, 1996;Miyake, Onishi and Poppel,2004). When tapping to a pacing metronome, if the stimulus period is longer than 3 seconds,subjects typically respond after the stimulus, indicating that participants are reacting to thestimulus. When the period is shorter than 3 seconds, participants usually anticipate the stimulus,responding before each click. In duration-discrimination tasks Weber’s Law (the observationthat the variability of the time estimate is proportional to the interval length) is violated fordurations longer than 2 seconds (Getty, 1975). There is also a difference in brain evokedpotentials and accuracy when participants reproduce intervals above and below 3 seconds(Elbert, Ulrich, Rockstroh and Lutzenberger, 1991). These results led Mates and colleagues(1994) to suggest that this interval is the upper limit of a temporal integration process insensorimotor synchronization.
These results complement our previous findings (Shelhamer & Joiner, 2003;Shelhamer,2005), where we showed that sequences of predictive saccades are correlated over a span ofapproximately two seconds. We hypothesize that this correlation represents feedback on theperformance of previous movements that occurred within this time window. This informationon past performance is then used for updating the estimate of the next stimulus interval(feedforward). In this manner the timing between saccades can be estimated, and a responsecan be initiated in anticipation of the next in a sequence of repetitive stimuli. (We note thatwith no prior timing information, initial predictive saccade tracking can only occur after atleast three eye movements (two intervals) (Zorn, Joiner, Lasker and Shelhamer, 2007). Thatis, the subject must make a reactive response to the first two target jumps of the sequence andcan only use the acquired timing information to affect the third and later eye movements.Therefore, predictive tracking typically occurs at ISIs where three or more eye movements fallwithin the approximate two-second time span (ISI ≤1000 ms).) We hypothesize that thismanner of estimating the time between upcoming movements is identical during Auditory andVisual Cued pacing, which results in the distributions of the inter-saccade interval beingstatistically indistinguishable. However when the intervals cannot be estimated (stimulustiming falls outside this time window, typically ISIs > 1000 ms) the subject must react ratherthan anticipate the stimulus. In this way the processing of the sensory information (as
Joiner et al. Page 8
Vision Res. Author manuscript; available in PMC 2008 June 1.
NIH
-PA Author Manuscript
NIH
-PA Author Manuscript
NIH
-PA Author Manuscript

previously demonstrated for single reactive saccades, Zahn et al., 1978,1979;Zambarbieri etal., 1982) determines the time between reactive saccades and results in differences betweeninter-saccade interval distributions in the two sensory conditions.
Acknowledgements
Supported by NIH EY015193 and T32-MH 20069. The authors would like to thank Dale Roberts for technicalassistance.
ReferencesBehar I, Bevan W. The perceived duration of auditory and visual intervals: cross-modal comparisons and
interaction. American Journal of Psychology 1961;74:17–26. [PubMed: 13688683]Buhusi CV, Meck WH. What makes us tick? Functional and neural mechanisms of interval timing. Nature
Reviews Neuroscience 2005;6:755–765.Buonomano DV, Karmarkar UR. How do we tell time? Neuroscientist 2002;8:42–51. [PubMed:
11843098]Chen Y, Repp BH, Patel AD. Spectral decomposition of variability in synchronization and continuation
tapping: comparisons between auditory and visual pacing and feedback conditions. Human MovementScience 2002;21:515–32. [PubMed: 12450682]
Eijkman E, Vendrik JH. Can a sensory system be specified by its internal noise? Journal of the AcousticalSociety of America 1965;37:1102–1109. [PubMed: 14339720]
Elbert T, Ulrich R, Rockstroh B, Lutzenberger W. The processing of temporal intervals reflected byCNV-like brain potentials. Psychophysiology 1991;28:648–55. [PubMed: 1816592]
Engström DA, Kelso JAS, Holroyd T. Reaction-anticipation transitions in human perception-actionpatterns. Human Movement Science 1996;15:809–832.
Getty DJ. Discrimination of short temporal intervals: A comparison of two models. Perception &Psychophysics 1975;18:1–8.
Gibbon J. Scalar expectancy theory and Weber’s law in animal timing. Psychological Review1977;84:279–325.
Gibbon J, Malapani C, Dale CL, Gallistel CR. Toward a neurobiology of temporal cognition: advancesand challenges. Current Opinion in Neurobiology 1997;7:170–184. [PubMed: 9142762]
Goldstone S, Boardman WK, Lhamon WT. Intersensory comparisons of temporal judgments. Journal ofExperimental Psychology 1959;57:243–248. [PubMed: 13641599]
Goldstone S, Goldfarb JL. Auditory and visual time judgment. Journal of General Psychology 1964a;70:369–387. [PubMed: 14140126]
Goldstone S, Goldfarb JL. Direct comparison of auditory and visual durations. Journal of ExperimentalPsychology 1964b;67:483–485. [PubMed: 14171241]
Goldstone S, Lhamon WT. Auditory-visual differences in human temporal judgment. Perceptual andMotor Skills 1972;34:623–633. [PubMed: 5021814]
Goldstone S, Lhamon WT. Studies of auditory-visual differences in human time judgment. 1. Sounds arejudged longer than lights. Perceptual and Motor Skills 1974;39:63–82. [PubMed: 4415924]
Isotalo E, Lasker AG, Zee DS. Cognitive influences on predictive saccadic tracking. Experimental BrainResearch 2005;165:461–469.
Jäncke L, Loose R, Lutz K, Specht K, Shah NJ. Cortical activations during paced finger-tapping applyingvisual and auditory pacing stimuli. Brain Research Cognitive Brain Research 2000;10:51–66.[PubMed: 10978692]
Jantzen KJ, Steinberg FL, Kelso JA. Functional MRI reveals the existence of modality and coordination-dependent timing networks. Neuroimage 2005;25:1031–1042. [PubMed: 15850722]
Jarrett C, Barnes G. The use of non-motion-based cues to pre-programme the timing of predictive velocityreversal in human smooth pursuit. Experimental Brain Research 2005;164:423–430.
Joiner WM, Shelhamer M. An internal clock generates repetitive predictive saccades. Experimental BrainResearch 2006;175:305–320.
Joiner et al. Page 9
Vision Res. Author manuscript; available in PMC 2008 June 1.
NIH
-PA Author Manuscript
NIH
-PA Author Manuscript
NIH
-PA Author Manuscript

Kolers PA, Brewster JM. Rhythms and responses. Journal of Experimental Psychology: HumanPerception & Performance 1985;11:150–167. [PubMed: 3159834]
Leigh, RJ.; Zee, DS. The Neurology of Eye Movements. 3. Philadelphia: FA Davis Company; 1999.MacDorman CE. Synchronization with auditory models of varying complexity. Perceptual and Motor
Skills 1962;15:595–602.Mates J, Radil T, Müller U, Pöppel E. Temporal integration in sensorimotor synchronization. Journal of
Cognitive Neuroscience 1994;6:332–340.Meck WH, Benson AM. Dissecting the brain’s internal clock: how frontal-striatal circuitry keeps time
and shifts attention. Brain and Cognition 2002;48:195–211. [PubMed: 11812042]Merchant, H.; Zarco, W.; Prado, L. 2006 Neuroscience Meeting Planner. Atlanta, GA: Society for
Neuroscience; 2006. 2006. Differential effect of stimulus modality on perception and production oftime intervals. Program No. 572.16. Online
Miyake Y, Onishi Y, Poppel E. Two types of anticipation in synchronization tapping. ActaNeurobiologiae Experimentalis 2004;64:415–426. [PubMed: 15283483]
Penney TB, Gibbon J, Meck WH. Differential effects of auditory and visual signals on clock speed andtemporal memory. Journal of Experimental Psychology: Human Perception & Performance2000;26:1770–1787. [PubMed: 11129373]
Rao SM, Harrington DL, Haaland KY, Bobholz JA, Cox RW, Binder JR. Distributed neural systemsunderlying the timing of movements. Journal of Neuroscience 1997;17:5528–5535. [PubMed:9204934]
Roberts S. Cross-modal use of an internal clock. Journal of Experimental Psychology: Animal BehaviorProcesses 1982;8:2–22. [PubMed: 7057141]
Savitzky A, Golay MJE. Smoothing and differentiation of data by simplified least squares procedures.Analytical Chemistry 1964;38:1627–1639.
Schöner G. Timing, clocks, and dynamical systems. Brain and Cognition 2002;48:31–51. [PubMed:11812031]
Shelhamer M, Joiner WM. Saccades exhibit abrupt transition between reactive and predictive, predictivesaccade sequence have long-term correlations. Journal of Neurophysiology 2003;90:2763–2769.[PubMed: 14534279]
Shelhamer M. Sequences of predictive saccades are correlated over a span of ~2 s and produce a fractaltime series. Journal of Neurophysiology 2005;93:2002–2011. [PubMed: 15548627]
Treisman M. Temporal discrimination and the indifference interval. Implications for a model of the“internal clock”. Psychology Monographs 1963;77:1–31.
Walker JT, Scott KJ. Auditory-visual conflicts in the perceived duration of lights, tones and gaps. Journalof Experimental Psychology: Human Perception & Performance 1981;7:1327–1339. [PubMed:6458656]
Warm JS, Stutz RM, Vassolo PA. Intermodal transfer in temporal discrimination. Perception &Psychophysics 1975;18:281–286.
Yao L, Peck CK. Saccadic eye movements to visual and auditory targets. Experimental Brain Research1997;115:25–34.
Zahn JR, Abel LA, Dell’Osso LF. Audio-ocular response characteristics. Sensory Processes 1978;2:32–37. [PubMed: 705354]
Zahn JR, Abel LA, Dell’Osso LF, Daroff RB. The audioocular response: intersensory delay. SensoryProcesses 1979;3:60–65. [PubMed: 515741]
Zambarbieri D, Schmid R, Magenes G, Prablanc C. Saccadic responses evoked by presentation of visualand auditory targets. Experimental Brain Research 1982;47:417–427.
Zambarbieri, D.; Schmid, R.; Ventre, J. Saccadic eye movements to predictable visual and auditorytargets. In: O’Regan, JK.; L’evy-Schoen, A., editors. Eye Movements: From Physiology toCognition. New York: Elsevier; 1987.
Zorn A, Joiner WM, Lasker AG, Shelhamer M. Sensory versus motor information in the control ofpredictive saccade timing. Exp Brain Res. 200710.1007/s00221-006-0806-y
Joiner et al. Page 10
Vision Res. Author manuscript; available in PMC 2008 June 1.
NIH
-PA Author Manuscript
NIH
-PA Author Manuscript
NIH
-PA Author Manuscript

Figure 1.Representation of the experimental conditions. During Visual Cued Pacing (panels A and B)subjects tracked LED targets alternating at a fixed interval (ISI) between two fixed positions.During Auditory Cued Pacing (panels C and D) subjects made saccades between the twoconstantly illuminated LED targets when signaled by a pacing tone (gray trace) given at a fixedISI. At low pacing rates (e.g., an ISI of 2500 ms) subjects generally made reactive eyemovements after the sensory stimulus (panels A and C). At high pacing rates (e.g., an ISI of500 ms) subjects largely made predictive movements before the sensory stimulus (panels Band D).
Joiner et al. Page 11
Vision Res. Author manuscript; available in PMC 2008 June 1.
NIH
-PA Author Manuscript
NIH
-PA Author Manuscript
NIH
-PA Author Manuscript

Figure 2.Histograms (20 ms bins) of saccade latency for subject A during Visual (top row) and AuditoryCued Pacing (bottom row). Each column represents one of five pacing rates (ISIs of 2500,1667, 1000, 833, and 556 ms). The thick black dashed line in each panel marks a latency of100 ms, which is considered the criterion for predictive saccades.
Joiner et al. Page 12
Vision Res. Author manuscript; available in PMC 2008 June 1.
NIH
-PA Author Manuscript
NIH
-PA Author Manuscript
NIH
-PA Author Manuscript

Figure 3.The standard deviation of the inter-saccade intervals during Visual Cued Pacing is plottedagainst the standard deviation of the inter-saccade intervals during Auditory Cued Pacing forall subjects. Panel A shows the respective stimulus-cued standard deviations during reactivepacing at ISIs of 2500 and 1667 ms. Panel B shows the respective stimulus-cued standarddeviations during predictive pacing at ISIs of 1000, 833, and 556 ms. The thick black dashedline represents equal inter-saccade interval variance in both sensory stimuli conditions.
Joiner et al. Page 13
Vision Res. Author manuscript; available in PMC 2008 June 1.
NIH
-PA Author Manuscript
NIH
-PA Author Manuscript
NIH
-PA Author Manuscript

Figure 4.Mean and standard deviation of the inter-saccade intervals pooled across all subjects for eachISI during Visual (black trace) and Auditory (gray trace) Cued pacing. The circles representthe average inter-saccade interval and the bars signify ± 1 SD across the pooled data.
Joiner et al. Page 14
Vision Res. Author manuscript; available in PMC 2008 June 1.
NIH
-PA Author Manuscript
NIH
-PA Author Manuscript
NIH
-PA Author Manuscript
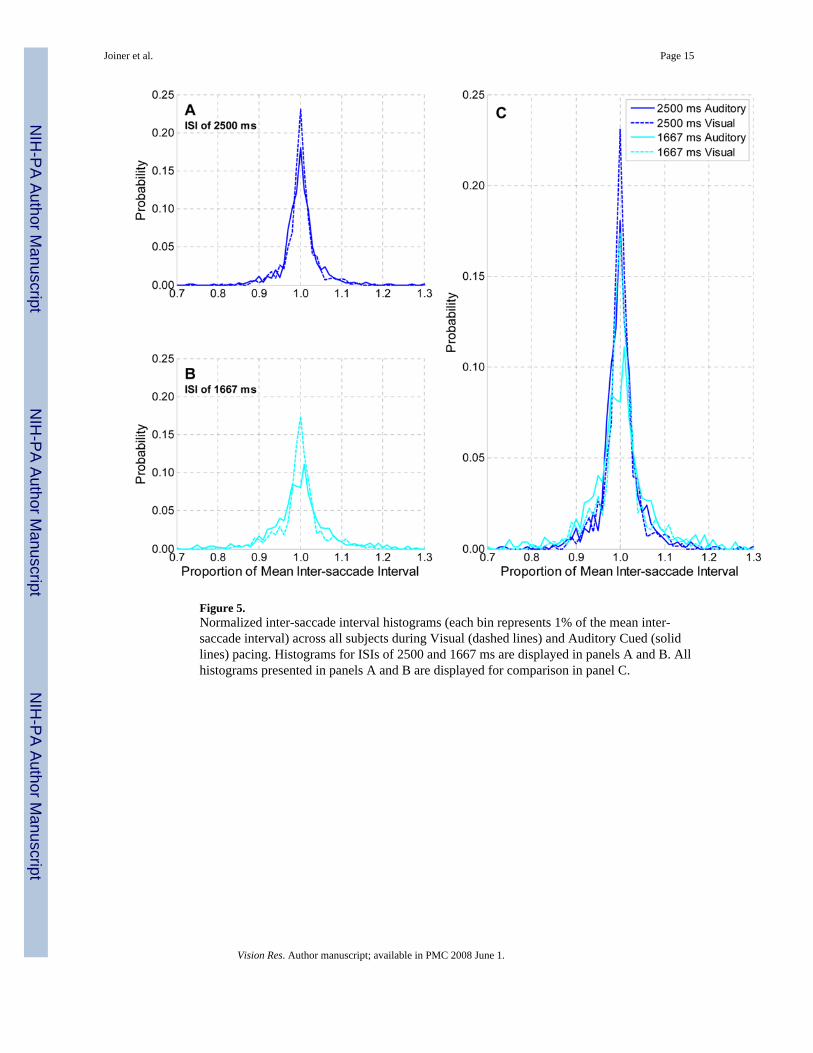
Figure 5.Normalized inter-saccade interval histograms (each bin represents 1% of the mean inter-saccade interval) across all subjects during Visual (dashed lines) and Auditory Cued (solidlines) pacing. Histograms for ISIs of 2500 and 1667 ms are displayed in panels A and B. Allhistograms presented in panels A and B are displayed for comparison in panel C.
Joiner et al. Page 15
Vision Res. Author manuscript; available in PMC 2008 June 1.
NIH
-PA Author Manuscript
NIH
-PA Author Manuscript
NIH
-PA Author Manuscript

Figure 6.Normalized inter-saccade interval histograms (each bin represents 1% of the mean inter-saccade interval) across all subjects for ISIs of 1000, 833, and 556 ms (panels A, B, and Crespectively). Interpretation of the data is the same as for Figure 5. All histograms presentedin panels A, B, and C are displayed for comparison in panel D.
Joiner et al. Page 16
Vision Res. Author manuscript; available in PMC 2008 June 1.
NIH
-PA Author Manuscript
NIH
-PA Author Manuscript
NIH
-PA Author Manuscript
NIH
-PA Author Manuscript
NIH
-PA Author Manuscript
NIH
-PA Author Manuscript
Joiner et al. Page 17Ta
ble
1Th
e m
ean
and
stan
dard
dev
iatio
n of
sacc
ade
late
ncy
at e
ach
ISI f
or V
isua
l Cue
d pa
cing
for a
ll su
bjec
ts.
Sacc
ade
Lat
ency
– V
isua
l Cue
d Pa
cing
Rat
e (m
s)Su
bjec
t25
00 m
s16
67 m
s10
00 m
s83
3 m
s55
6 m
sA
142.
4±77
.716
5.6±
55.7
−95.
0±10
2.4
−94.
8±83
.8−9
3.1±
65.4
B10
6.2±
151.
710
7.0±
165.
6−7
1.7±
88.7
−110
.66±
80.2
−134
.09±
73.7
C12
2.7±
165.
110
7.5±
133.
0−1
57.8
±179
.9−1
13.3
±154
.0−1
39.5
±99.
9D
179.
1±96
.913
8.9±
41.0
4.4±
88.7
96.8
±94.
27.
08±8
3.4
E17
3.7±
122.
411
1.2±
154.
710
.4±1
00.7
−25.
1±12
2.3
8.3±
75.2
F20
8.7±
30.8
183.
7±49
.311
4.1±
86.3
108.
1±74
.297
.27±
66.3
G18
0.0±
27.9
147.
5±47
.5−2
4.8±
140.
0−3
9.5±
99.1
−26.
6±67
.7H
246.
4±46
.017
7.6±
37.1
83.7
±74.
387
.8±9
4.1
82.3
±73.
8
Vision Res. Author manuscript; available in PMC 2008 June 1.

NIH
-PA Author Manuscript
NIH
-PA Author Manuscript
NIH
-PA Author Manuscript
Joiner et al. Page 18Ta
ble
2Th
e m
ean
and
stan
dard
dev
iatio
n of
sacc
ade
late
ncy
at e
ach
ISI f
or A
udito
ry C
ued
paci
ng fo
r all
subj
ects
.Sa
ccad
e L
aten
cy –
Aud
itory
Cue
d Pa
cing
Rat
e (m
s)Su
bjec
t25
00 m
s16
67 m
s10
00 m
s83
3 m
s55
6 m
sA
188.
7±67
.817
6.6±
84.9
−113
.6±9
2.2
−133
.3±1
00.1
−82.
8±63
.2B
111.
1±12
0.7
128.
5±12
6.7
−99.
8±81
.8−1
37.7
±91.
2−1
19.9
±53.
0C
171.
1±64
.410
5.8±
139.
7−7
2.1±
166.
9−9
4.5±
169.
9−3
7.9±
112.
5D
149.
7±96
.710
3.5±
130.
7−1
22.8
±120
.8−8
2.1±
83.2
−112
.9±6
9.5
E18
7.3±
146.
712
2.7±
123.
9−1
57.5
±154
.7−1
37.8
±122
.5−8
7.1±
102.
1F
153.
7±10
7.5
105.
8±73
.633
.0±1
06.1
53.3
±77.
769
.0±6
2.5
G17
6.1±
46.8
208.
0±69
.1−6
4.4±
113.
3−6
3.0±
92.4
−28.
2±54
.2H
236.
4±12
9.8
232.
5±70
.491
.0±6
1.6
90.5
±85.
582
.8±7
1.9
Vision Res. Author manuscript; available in PMC 2008 June 1.