Human-environment interactions at regional scales: the complex topography hypothesis applied to...
12
Human–environment interactions at regional scales: the complex topography hypothesis applied to surface archaeological records in Australia and North America SIMON J. HOLDAWAY, GEOFFREYC.P. KING, MATTHEW J. DOUGLASS and PATRICIA C. FANNING SJH: University of Auckland and University of Queensland; GCPK: Institut de Physique du Globe Paris; MJD: University of Nebraska-Lincoln; PCF: Macquarie University ABSTRACT We match stone artefact distributions and assemblage compositions at the local geographical scale to measures of both complex topography and environmental history, as suggested by the work of Bailey and King. By comparing two study regions that have different topographic complexity measures, one in western New South Wales, Australia, and the other in Oglala National Grassland, North American Great Plains, we show that people created distinct long-term landscape use histories in both regions. While stone artefact manufacture and use, and indeed the transport of stone artefacts over great distances, feature in both areas, the accumulation of stone artefacts in different places leads to a quite different site use history in each of the case study regions. Keywords: stone artefacts, topographic complexity, mobility. Correspondence: Simon J. Holdaway, Anthropology, School of Social Sciences, University of Auckland, Private Bag 92019, Auckland 1142, New Zealand. Email: [email protected] In 1988, David Frankel wrote an influential paper on the issues around the units archaeologists use to characterise change (Frankel 1988). Change can always be detected in the archaeological record at some level, which raises the problem of how to evaluate different forms of change. Frequently, this is done by interpreting change as the result of human behaviour in relation to ecological resource availability. However, as Bailey (2005) remarked, short-term ecologically based environmental changes may not be the best means with which to evaluate the types of changes associated with human evolution. Bailey and King (2011) instead suggest topographic complexity as a measure that operates at the type of temporal scale suitable for answering evolutionary questions. The complex topography hypothesis as applied to human evolution (Bailey & King 2011; King & Bailey 2006) suggests that active tectonics produced landscapes that provided opportunities for hominins to monitor animal resources in ways that allowed them to outcompete other predators while also finding protection from carnivores. This adaptation created a powerful selection pressure in human evolution. Here, we consider the implications of this hypothesis by investigating landscapes characterised by the opposite of topographic complexity where, at least in principle, humans could exploit places where variation in topography was relatively low. Two study areas – semi-arid Australia and the Great Plains of North America – were chosen because they allowed an initial investigation into how the hypothesis might operate in regions of minimal topographic complexity, occupied by modern rather than archaic hominins, and where the surface archaeological record had been recorded and analysed in similar ways. The significance of both case studies is the relationships that they help illustrate between the long-term interaction of people and the environment in comparison to variations in the archaeological record that reflect the accumulation of behaviours that occur over shorter time periods. As Frankel (1988) commented, to understand change we need to consider the time periods over which it occurred and how different time periods impact on the types of changes we can see. Here, we extend Frankel’s discussion to include variable geographical as well as temporal scales. THE COMPLEX TOPOGRAPHY HYPOTHESIS Some general trends in hominin evolution are widely accepted. For example, our ancestors were ground-dwelling bipeds who ate a diverse range of food types, including quantities of meat. Hominin fossils show an increase in both body and brain size, while archaeological sites demonstrate the manufacture of stone artefacts. Hominins were able to deal with heat stress, foraged over long distances and were characterised by a Archaeology in Oceania, Vol. 50 Supplement (2015): 58–69 DOI: 10.1002/arco.5054 © 2015 Oceania Publications
Transcript of Human-environment interactions at regional scales: the complex topography hypothesis applied to...
Human–environment interactions at regional scales: the complex topographyhypothesis applied to surface archaeological records in Australia and
North America
SIMON J. HOLDAWAY, GEOFFREY C.P. KING, MATTHEW J. DOUGLASS andPATRICIA C. FANNING
SJH: University of Auckland and University of Queensland; GCPK: Institut de Physique du Globe Paris;MJD: University of Nebraska-Lincoln; PCF: Macquarie University
ABSTRACT
We match stone artefact distributions and assemblage compositions at the local geographical scale to measures of both complextopography and environmental history, as suggested by the work of Bailey and King. By comparing two study regions that have differenttopographic complexity measures, one in western New South Wales, Australia, and the other in Oglala National Grassland, NorthAmerican Great Plains, we show that people created distinct long-term landscape use histories in both regions. While stone artefactmanufacture and use, and indeed the transport of stone artefacts over great distances, feature in both areas, the accumulation of stoneartefacts in different places leads to a quite different site use history in each of the case study regions.
Keywords: stone artefacts, topographic complexity, mobility.
Correspondence: Simon J. Holdaway, Anthropology, School of Social Sciences, University of Auckland, Private Bag92019, Auckland 1142, New Zealand. Email: [email protected]
In 1988, David Frankel wrote an influential paper on theissues around the units archaeologists use to characterisechange (Frankel 1988). Change can always be detected inthe archaeological record at some level, which raises theproblem of how to evaluate different forms of change.Frequently, this is done by interpreting change as the resultof human behaviour in relation to ecological resourceavailability. However, as Bailey (2005) remarked,short-term ecologically based environmental changes maynot be the best means with which to evaluate the types ofchanges associated with human evolution. Bailey and King(2011) instead suggest topographic complexity as ameasure that operates at the type of temporal scale suitablefor answering evolutionary questions.
The complex topography hypothesis as applied tohuman evolution (Bailey & King 2011; King & Bailey2006) suggests that active tectonics produced landscapesthat provided opportunities for hominins to monitor animalresources in ways that allowed them to outcompete otherpredators while also finding protection from carnivores.This adaptation created a powerful selection pressure inhuman evolution. Here, we consider the implications ofthis hypothesis by investigating landscapes characterisedby the opposite of topographic complexity where, at leastin principle, humans could exploit places where variationin topography was relatively low. Two study areas –semi-arid Australia and the Great Plains of North America
– were chosen because they allowed an initial investigationinto how the hypothesis might operate in regions ofminimal topographic complexity, occupied by modernrather than archaic hominins, and where the surfacearchaeological record had been recorded and analysed insimilar ways. The significance of both case studies is therelationships that they help illustrate between thelong-term interaction of people and the environment incomparison to variations in the archaeological record thatreflect the accumulation of behaviours that occur overshorter time periods. As Frankel (1988) commented, tounderstand change we need to consider the time periodsover which it occurred and how different time periodsimpact on the types of changes we can see. Here, weextend Frankel’s discussion to include variablegeographical as well as temporal scales.
THE COMPLEX TOPOGRAPHY HYPOTHESIS
Some general trends in hominin evolution are widelyaccepted. For example, our ancestors wereground-dwelling bipeds who ate a diverse range of foodtypes, including quantities of meat. Hominin fossils showan increase in both body and brain size, whilearchaeological sites demonstrate the manufacture of stoneartefacts. Hominins were able to deal with heat stress,foraged over long distances and were characterised by a
bs_bs_banner
Archaeology in Oceania, Vol. 50 Supplement (2015): 58–69DOI: 10.1002/arco.5054
© 2015 Oceania Publications
relatively long period of childhood and learning. Theconsequences of these adaptations were that homininsrequired regular access to water, had increased their levelof animal protein intake compared to ancestral forms,needed access to stone for artefact manufacture and had asocial organisation capable of providing increased levels ofparental care (King & Bailey 2006). The combination ofthese behaviours would be facilitated by a meat-eatingniche inaccessible to other carnivores, where homininsaccessed animal protein through hunting and/orscavenging, or exploited such resources at times whencompetition from other species was less severe. However,such behaviour would also potentially expose hominins togreater predation dangers. In the words of King and Bailey(2006: 268),
Feedback between different elements of this package iscommonly emphasised, for example between daytimehunting, upright stance and physiological adaptation toheat stress, between stone tools, meat-eating andincreased brain size, between increased brain size andcognitive skills in communication and problem-solving,and between cognitive skills, spatial memory and theuse of larger and more environmentally diversehome-ranges.
A number of conditions might favour these adaptations:an environment with varied plant and animal resources,accessible water, locations giving protection fromcarnivores and the potential to trap animals. Bailey andKing consider that the African Rift fulfils all these criteriabecause it comprises an area of localised topographiccomplexity that results from active tectonics. It was thecomplex topography of places such as the Rift, they argue,that allowed hominins to access the large animal biomassfrom the neighbouring savannah plains (Bailey & King2011).
A key aspect of the topographic complexity hypothesisis that tectonic activity occurs in time frames that correlatewell with the scales at which species evolve and at whichecological interactions can be observed. In some parts ofthe world, continued tectonic activity helps to maintaintopographical, hydrological and environmental conditionsthat differ considerably from neighbouring landscapes thatare tectonically inactive (Bailey et al. 2011). In landscapeswith little tectonic relief, features such as waterholes andassociated vegetation occur when the water table reachesthe surface. These conditions make the availability ofwater and food resources in these areas more susceptibleto environmental oscillations such as desiccations andlocal aridity. Following the complex topographyhypothesis, such landscapes should show variation inhuman adaptation compared to those places with morecomplex topography. It might also be expected thathumans reacted in similar ways to less complextopography.
As the discussion above illustrates, consideration of theramification of the complex topography hypothesis hasfocused on the earliest periods of hominin evolution, when
the behaviours that differentiate ancestral hominins fromearlier species are thought to have evolved (e.g. Winderet al. 2013). However, another way to investigate thehypothesis is to consider examples where humanssuccessfully negotiated living in less complex topographies– in simple terms, the plains – rather than the dissected,tectonically complex regions considered in previousapplications of the hypothesis so far. Bailey and King(2011) cite studies by Marean (1997) and Dewar et al.(2006), as well as the results of the Kilithi project (Baileyet al. 1993), that illustrate how peoples from latePleistocene and Holocene contexts used local and regionaltopographic complexity to access food and water, and tomonitor the movement of, as well as to capture, mobileprey. It is useful to consider how these activities weremanaged in places that lacked the types of complextopography that have been identified in the African andMediterranean examples. In the case studies describedbelow, the archaeological records from semi-arid Australia(specifically, western New South Wales), where theregional topographic complexity is low and local resourceavailability is spatially and regionally variable, arecompared with the archaeological record from a study areain the Great Plains of North America, where the regionaltopographic complexity is more varied and local resourcesavailability is more predictable. In both studies, the datawe use are the spatial patterning of stone artefactsdistributed across the landscape. We demonstrate that thearchaeological record patterns in distinctly different wayswhen, as Frankel (1988) suggested, it is considered at avariety of temporal and spatial scales.
APPLYING THE COMPLEXTOPOGRAPHY HYPOTHESIS
Proxy measures of the topography of the earth’s surfacethat help indicate likely locations of tectonic complexityhave been developed by tectonic geomorphologists. Togenerate a measure of topographic complexity, filterfunctions are used to convert elevation data into a measureof topographic roughness (the mathematical basis forroughness calculation is provided in Bailey et al. 2011,appendix 1). However, rough terrain is not dependentsimply on elevation – it can occur at high and lowelevations, and on both steeper and flatter areas. Forarchaeologists, understanding complex topography isimportant because past peoples moved and, in someinstances, they moved considerable distances. However,archaeologists have encountered difficulties incharacterising environments at sufficiently large scales tocapture such movement, given the comparatively smallspatial scales at which archaeological research isundertaken. An alternative is to work down from the largescale to the local level, and then to focus on parts of alandscape that give more specific examples of how aregion was used (Bailey & King 2011). Satellite imageryand digital elevation data together with GPS provide theability to combine large-scale mapping with local
Archaeology in Oceania 59
© 2015 Oceania Publications
observation. These technologies, which have informedstudies that relate continental-scale tectonic deformation tosurface processes, can also be applied, as described here,to archaeological problems (Hubert-Ferrari et al. 2002;Tapponnier et al. 2001). Through the use of a variety ofimage processing and GIS technologies, it is nowrelatively easy to visualise a location projected on a wholeseries of scales. Here, we combine our characterisation ofregional topographic complexity with the localised scale ofour case study areas, where the specific consequences ofthe more general processes can be observed.
SEMI-ARID WESTERN NEW SOUTHWALES, AUSTRALIA
Our first study area is located on the valley floor marginsof an ephemeral stream (Rutherfords Creek), draining acatchment of 6500 ha in western New South Wales (NSW)(Figure 1). The climate today is semi-arid and vegetationcover is sparse and patchy. Extensive areas of stony(“gibber”) and bare surfaces mantle the slopes and plains.Surface visibility, and therefore the quantity of the surfacearchaeological record, is highest where there is an absenceof vegetation, and the surface is lagged (or winnowed),forming scalds1 (Holdaway et al. 2008). Stone artefactsand heat retainer hearths are exposed on scalds as the finersediments are removed by unconcentrated overland flow(Fanning et al. 2009). Scald formation thus leads to theexposure of artefacts but not their lateral movement.Artefacts are deflated on to a common surface butotherwise remain where they were discarded. In a sense,therefore, sediment erosion has “excavated” thearchaeological record, offering a unique opportunity forinvestigation of large quantities of this record distributedacross the landscape. We begin by describing analyses ofthis archaeological record and then provide a context forinterpreting the results by considering these in relation tothe regional topographic complexity. As discussed above,this approach provides an alternative to interpreting theresults in relation to short-term ecologically basedenvironmental changes (Bailey 2005), developing the ideasthat Frankel (1988) proposed.
The archaeological recordHeat retainer hearths – the remains of what were onceshallow subterranean ovens – are a ubiquitousarchaeological feature in western NSW, and are identifiedarchaeologically by clusters of heat-fractured hearthstones. In Rutherfords Creek, the oldest hearths are foundin locations at some distance from modern channels,where surfaces are relatively ancient (i.e. several thousandyears) and were preserved from subsequent erosionepisodes. In places closer to the modern channels, hearthsare more recent, because older hearths that once existed inthese locations have been eroded away, along with thesediments into which they were excavated. In each of theareas investigated, a range of ages was found for hearths
that are located within a few tens of metres from eachother (Holdaway et al. 2008).
Elsewhere in western NSW (Holdaway & Fanning2014), we have characterised this form of occupation asreflecting a low redundancy in place use; that is, wherethere is a largely uniform degree of variability in place usesuch that one place looks more or less similar to another.While people used places more than once, no one place inthe Rutherfords Creek valley was used more often thananywhere else. This is reflected in the distribution of thehearths themselves. Those that are visible as a result ofexposure are distributed up and down the valley, with noobvious concentration either near the creek mouth, whereit discharges into an ephemeral lake, nor at points in themid-section of the valley, nor indeed at its headwaters.Along the 15 km or so length of the drainage, Aboriginalpeople found the need to create hearths at many differentplaces and did so, as far as we can determine, at manydifferent points in time over the past 2500 years(Holdaway et al. 2008).
The low redundancy in place use indicated by the heatretainer hearths is matched by similarities in thecomposition of stone artefact assemblages. The scaldsdiscussed above provided ready-made sampling units. Wesurveyed the location of approximately 2500 scalds andsampled 5% of these by area. The three-dimensionallocation coordinates of all artefacts with a maximum clastdimension > 20 mm were recorded on the resulting 96sampling units. Features that might restrict visibility orindicate disturbance, such as soil islands or rills, were alsomapped. A variety of technological and typologicalattributes of the stone artefacts were recorded.
Sources of knappable stone are distributed widely in thestudy area, with silcrete and quartz the dominantlithologies used for artefact production. Silcrete occurs inoutcrops of duricrust and associated boulder mantles thatform the residual capping of mesas and plateaux thatborder the catchment, as cobbles and gibbers formingdesert pavements on the hillslopes, and in the channel bedsof dry creeks. Quartz is not local to the Rutherfords CreekCatchment, but was instead brought in from elsewhere. Asmooth, rounded cortex covers the exterior of both silcreteand quartz nodules (Douglass & Holdaway 2011). Analysisof around 25000 stone artefacts recorded in the samplingunits shows little variation in assemblage composition forscalds located in different parts of the catchment. Allassemblages are dominated by flakes and cores, with fewretouched tools. Silcrete cobbles were selected forknapping in much larger numbers than quartz andquartzite, and show low variability in size and shape.
An analytical methodology known as the cortex ratio(Dibble et al. 2005; Douglass 2010; Douglass & Holdaway2011; Douglass et al. 2008; Holdaway et al. 2008; Linet al. 2010) provides a measure of the effects of artefacttransport on to the formation of the archaeological record.This approach is based on a comparison between theamount of artefact cortical surface area in an assemblageand that which should be present given the volume of
60 Human–environment interactions at regional scales
© 2015 Oceania Publications
stone worked and the approximate size and shape of thecobbles that were knapped. Results for artefacts made ontwo different types of silcrete (Table 1) indicate thatcortical surface area is under-represented within thesampling units at Rutherfords Creek, an outcome thatstrongly suggests that a significant number of the artefactsproduced from the raw material there were transportedelsewhere and are thus absent from archaeological recordwithin the catchment. In this process of artefact removal, itis inferred that a deficit in expected cortex proportions ismost likely the result of the selective removal of flakes foruse elsewhere.
The cortex ratio value needs to be assessed in relationto levels of core reduction. If cores are only lightlyreduced, they will retain large quantities of cortex and willalso comprise the bulk of the mass in an assemblage. Evenif the majority of flakes produced from these cores areremoved, the cortex ratio will dip only slightly below one.This can be assessed by calculating three separate cortexratio values, one related to the volume and surface area ofthe cores, one to the volume and surface area of the flakesand one for the combined assemblage. For the cortex ratioof the entire assemblage to deviate substantially belowone, cores must be reduced beyond light flaking. This in asense “frees up” the volume from the cobbles and enablesselection of large numbers of flakes for removal(Holdaway & Douglass in press).
The cortex ratio results suggest that artefacts,specifically flakes, were removed and not replaced, sincethere is insufficient flake surface area present to accountfor the number of cobbles that were worked. If flakes hadeither not been removed, or had been removed and othersdeposited in their place, then the cortex ratios would tendtowards one. It is therefore parsimonious to suggest thatflakes were moved outside the valley and not returned. Inall of the areas that we have studied in western NSW, lowcortex ratio values suggesting a high degree of flakemovement are nearly always indicated, implying thatmovement was over distances greater than those betweenone catchment and the next (Douglass 2010; Holdaway &Fanning 2014). The inability to find places with a cortexratio value of one suggests larger-scale regional patterns inthe movement of people, as seen through the transportationof flakes that occurred over long periods of time.
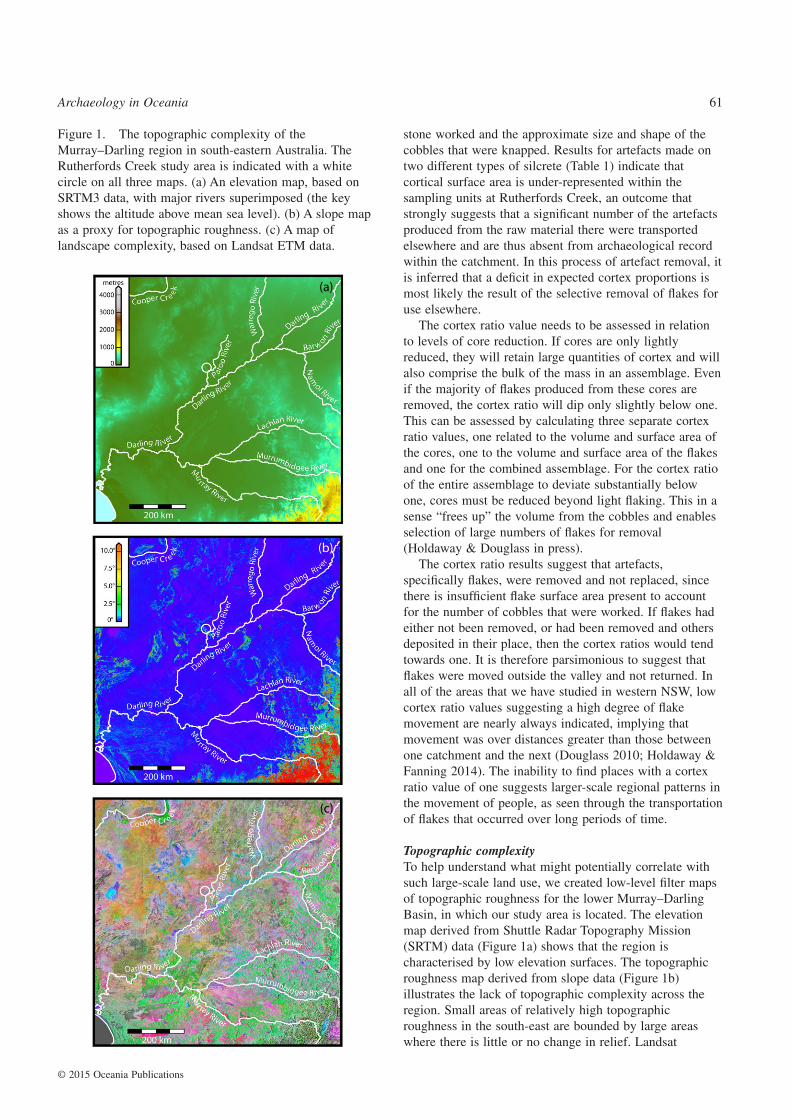
Topographic complexityTo help understand what might potentially correlate withsuch large-scale land use, we created low-level filter mapsof topographic roughness for the lower Murray–DarlingBasin, in which our study area is located. The elevationmap derived from Shuttle Radar Topography Mission(SRTM) data (Figure 1a) shows that the region ischaracterised by low elevation surfaces. The topographicroughness map derived from slope data (Figure 1b)illustrates the lack of topographic complexity across theregion. Small areas of relatively high topographicroughness in the south-east are bounded by large areaswhere there is little or no change in relief. Landsat
Figure 1. The topographic complexity of theMurray–Darling region in south-eastern Australia. TheRutherfords Creek study area is indicated with a whitecircle on all three maps. (a) An elevation map, based onSRTM3 data, with major rivers superimposed (the keyshows the altitude above mean sea level). (b) A slope mapas a proxy for topographic roughness. (c) A map oflandscape complexity, based on Landsat ETM data.
(a)
(b)
(c)
Archaeology in Oceania 61
© 2015 Oceania Publications

Enhanced Thematic Mapper (ETM) data for the sameregion (Figure 1c) indicates, on the other hand, a highdegree of local heterogeneity of the landscape, most likelya product of modern vegetation cover plus regolithvariation. To the degree that this heterogeneity can be usedas a proxy for past environmental resource abundance, itsuggests that at a local level, resources were likely to behighly variable. However, this inference needs to beinterpreted in relation to environmental processes that havean impact on resource abundance. In western NSW,resource heterogeneity did not translate into the formationof regularly recurring resource patches, largely as aconsequence of low soil fertility combined with theclimatic variability (Holdaway et al. 2013). In general,Australia is characterised as having an “infertile, wellsorted landscape” (Stafford Smith & Morton 1990: 261).Long periods with little or no rain are separated by shortperiods of very abrupt rainfall. At the same time,Australian soils are depleted in nitrogen and phosphorous,largely as a result of the continent’s tectonic history(Morton et al. 2011: 317). Average soil fertility, however,masks considerable local variation in nutrients over avariety of different spatial scales from 101 to 104 m2, anobservation that is reflected graphically in the colourvariation shown in Figure 1c.
Lack of fertility and intermittent rainfall thus combineto produce a landscape that varies both spatially but alsotemporally in ways that were not easy to predict. This isopposite to the Great Plains case study discussed below,where Kornfeld and Osborn (2003) note that there is atendency for Great Plains environments to displayrelatively high spatial and temporal autocorrelation inresource availability. For humans, lack of predictability inenvironmental resource heterogeneity meant that a locationrich in resources at one moment in time might becomedepleted at another, with little way of predicting whensuch a change might occur, an observation that makessense of the variable ethnohistorical accounts describedbelow. Iterated across space and through time, thissuggests that, in contrast with the Great Plains case study,individual resource patch locations in the western NSWstudy area were neither continuously or cyclicallyattractive for occupation (Holdaway et al. 2013).
Ethnohistorical sources describe Aboriginal peopleliving along the Darling and Murray Rivers at Europeancontact. However, the accounts describe variability ingroup size, only some of which can be accounted forby seasonal differences in resource abundance (Allen1971). Movements away from the rivers allowed for theexploitation of game and grass seeds, and a range of small
Table 1. Cortex ratio values for the Rutherfords Creek sampling units. Separate ratio values are calculated for cores,flakes and the total assemblage, following the method discussed in Douglass (2010). Ratio values were calculated using asingle estimate of original cobble size for all sampling units. Cases with missing values, where flakes or cores were eithernot present or present in too small a number to permit calculation of the ratio, are not reported.
Samplingunit
Clast silcrete Matrix silcrete Samplingunit
Clast silcrete Matrix silcrete
Core Flake Total Core Flake Total Core Flake Total Core Flake Total
9999 0.63 0.46 0.55 0.81 0.47 0.45 17122 0.64 0.57 0.66 0.78 0.48 0.4810136 0.4 0.63 0.65 0.87 0.65 0.63 17147 0.56 0.45 0.02 0.55 0.38 0.3610141 0.42 0.87 0.85 0.55 0.81 0.66 17286 0.66 0.62 0.72 0.69 0.46 0.4910145 0.35 0.67 0.57 0.46 0.64 0.51 17354 0.43 0.48 0.52 0.93 0.77 0.5310166 2.09 1.42 2.08 0.4 0.42 0.35 17424 0.34 0.58 0.49 0.68 0.37 0.3310193 1 0.85 1.03 0.71 0.68 0.57 17582 0.35 0.56 0.54 0.52 0.61 0.4810227 0.18 0.65 0.46 1.61 0.57 0.73 17762 0.49 0.65 0.65 0.95 0.73 0.6810249 0.82 0.57 0.72 0.68 0.68 0.57 17792 0.38 0.28 0.35 0.56 0.48 0.4210270 0.88 0.76 0.92 1.13 0.74 0.77 17847 0.36 0.68 0.71 1.01 0.56 0.5310306 0.25 0.61 0.54 1.3 0.4 0.4 17897 0.5 0.71 0.69 0.86 0.66 0.5910327 0.54 0.41 0.53 0.52 0.44 0.4 17926 0.41 0.3 0.38 0.46 0.47 0.410333 0.63 0.52 0.65 0.36 0.66 0.47 17928 0.15 0.96 0.55 0.31 0.45 0.3310338 0.47 0.51 0.54 0.93 1.1 0.9 17954 0.41 0.61 0.6 0.47 0.56 0.4710397 0.3 0.61 0.55 1.13 0.59 0.58 23496 0.83 0.33 0.63 0.33 0.52 0.3910448 0.34 0.53 0.54 0.61 0.5 0.43 24340 0.3 0.37 0.39 0.41 0.41 0.3410610 0.36 0.6 0.58 0.96 0.89 0.75 24358 1.07 0.49 1.02 0.92 0.69 0.7410623 0.51 0.58 0.62 1.15 0.63 0.68 24392 0.38 0.35 0.4 1.05 0.38 0.4110633 0.5 0.6 0.63 0.87 0.57 0.55 24488 0.32 0.32 0.37 0.43 0.62 0.510662 0.63 0.72 0.77 0.19 0.55 0.28 24609 1.04 0.69 0.97 0.87 0.46 0.4910680 0.37 0.32 0.4 1.44 0.55 0.7 27109 0.57 0.66 0.69 0.97 0.82 0.7410702 0.39 0.55 0.58 0.65 0.71 0.58 27149 0.7 0.53 0.74 0.38 0.58 0.4310726 0.8 0.86 0.98 0.99 0.89 0.78 38268 0.87 0.47 0.73 0.62 0.73 0.610734 0.9 0.44 0.52 0.74 0.9 0.72 38297 0.56 0.61 0.66 0.45 0.46 0.3914010 0.28 0.44 0.45 0.74 0.55 0.51 41533 0.8 0.37 0.58 0.26 0.61 0.417020 0.25 0.44 0.45 1.46 0.53 0.54 43302 0.69 0.96 0.89 0.7 0.95 0.7417028 0.21 0.71 0.69 0.45 0.48 0.4 43321 0.85 0.81 0.94 0.66 0.79 0.6517051 0.69 0.34 0.58 0.28 0.46 0.37 43383 0.41 0.59 0.62 0.37 0.53 0.4117076 0.61 0.48 0.58 1.85 0.4 0.45 44945 0.6 0.38 0.49 0.6 0.5 0.44
62 Human–environment interactions at regional scales
© 2015 Oceania Publications
animals were collected, larger animals being hunted withnets and clubs rather than with spears. While Allen talksabout seasonal differences in mobility, he also notes howthe ethnohistorical accounts document marked differencesin population numbers recorded on return visits during thesame season. Thus the productivity of particular sources atparticular places through time, even within the sameseason, is difficult to gauge based on the ethnohistoricalaccounts alone.
Allen recorded people moving from areas west of theDarling River to the Darling River or to the BullooOverflow to access riverine resources. This movement wastwo-way, in the sense that people who inhabited theriverine areas would sometimes move out into the ranges.It is possible that these kinds of movements are similar tothose we have recorded from the Rutherfords Creek studyarea, as well as from the other locations in western NSWthat we have studied (Holdaway & Fanning 2014).Accounts suggest that prolonged drought reduced themobility options for groups as water sources became moredispersed and the availability of plant foods declined.Drought therefore probably reduced the landscapeheterogeneity discussed above, but not in a way thatimproved resource predictability.
If resources were episodic in their availability, bothspatially and temporally, it might be expected that manyplaces would see at least some use and therefore wouldsee the creation of an archaeological record. Using a “dotson maps” approach, the landscape would appear to becovered by a carpet of occupation debris, as though allplaces were used at once. In fact, the opposite is the case;absolute dating of hearth remains and land surfaces onwhich the artefacts rest (Holdaway & Fanning 2014;Holdaway et al. 2002, 2005) demonstrates that this carpetof dots is instead a signature of high mobility by smallnumbers of people in a landscape where the ecology andtopography leads to the wide dispersal of the materialremains of occupation.
Image analysis of the region in which it is situated giveslandscape context to the archaeological record fromRutherfords Creek. The low redundancy in place use, asevidenced by the variety of ages and the wide distributionof hearths, indicates how multiple places saw use, but noneat levels significantly higher than its neighbours. Lowredundancy in place use is also indicated by similarities inassemblage composition. Analysis of the stone artefactsindicates movement, suggesting high mobility consistentwith the need to move often and far to find the resourcesthat became available through time, rather than residentialoccupation sites.
THE NORTH AMERICAN GREAT PLAINS: THEOGLALA NATIONAL GRASSLAND
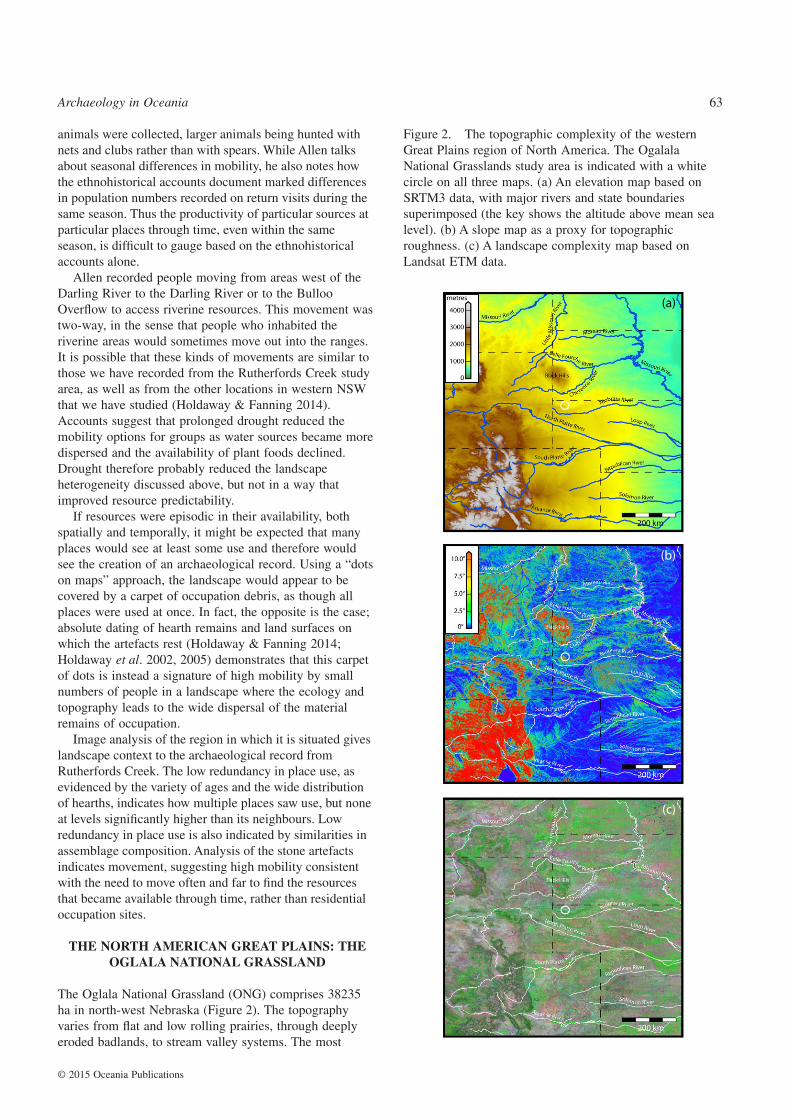
The Oglala National Grassland (ONG) comprises 38235ha in north-west Nebraska (Figure 2). The topographyvaries from flat and low rolling prairies, through deeplyeroded badlands, to stream valley systems. The most
Figure 2. The topographic complexity of the westernGreat Plains region of North America. The OgalalaNational Grasslands study area is indicated with a whitecircle on all three maps. (a) An elevation map based onSRTM3 data, with major rivers and state boundariessuperimposed (the key shows the altitude above mean sealevel). (b) A slope map as a proxy for topographicroughness. (c) A landscape complexity map based onLandsat ETM data.
(a)
(b)
(c)
Archaeology in Oceania 63
© 2015 Oceania Publications
prominent feature is the Pine Ridge Escarpment,positioned along the southern edge of the grassland. Theseupland areas in the Plains are likened by Kornfeld andOsborn (2003) to habitat patches.
A 10–13 km wide piedmont zone bordering the PineRidge Escarpment of the grasslands is dissected bynumerous incised streams. Extensive erosion has createdbadland exposures. A region of low-relief, rolling hillsdeveloped on Pierre Shales is located north of this zone.Springs originating at the Miocene/Oligocene geologicalcontact create permanent and intermittent streams that area primary water source (Meston 1976). These feed into theWhite River basin locally and the Cheyenne River furtherto the north (Figure 2). The modern environment issemi-arid, with broad seasonal changes reflecting acontinental climate. On average, 400–500 mm ofprecipitation falls annually in these areas, with highvariability. Rain falls predominantly in the months of Mayto July; January temperatures range from an average of−13° to +2°C; July temperatures range from an average14° to 33°C (Wandsnider et al. 2008).
The archaeological recordArchaeological surveys of eroded areas and deflated hillsand ridgelines were conducted along the Sand Creekdrainage, a lagged cobble bed below a hillslope locallyknown as Pete Smith Hill, badland exposures within thevicinity of Toadstool Geologic Park, and deflatedhillslopes exposed by grass fires near the Hudson–MengBison bone bed and north of Roundtop Butte. Thechronology of human occupation in the region is based onprojectile point typologies and these individual study areaseach display considerable temporal depth.
Unlike Australia, sources of flakable stone in the GreatPlains are limited, which had an impact on how peoplemade artefacts, and how these were distributed. Rawmaterials belonging to the locally available ChamberlainPass Formation are the most common in all of thesampling areas, but there is also evidence for the use ofmaterial from more distant sources. These include WhiteRiver Silicates, which outcrop throughout the broaderregion (Hoard et al. 1993) as well as locally, and are alsofound as water-worn cobbles within the Chamberlain PassFormation, Flattop Chalcedony (Colorado), HartvilleUplift chert (Wyoming), and a variety of non-localquartzites, mostly from Wyoming and South Dakota.
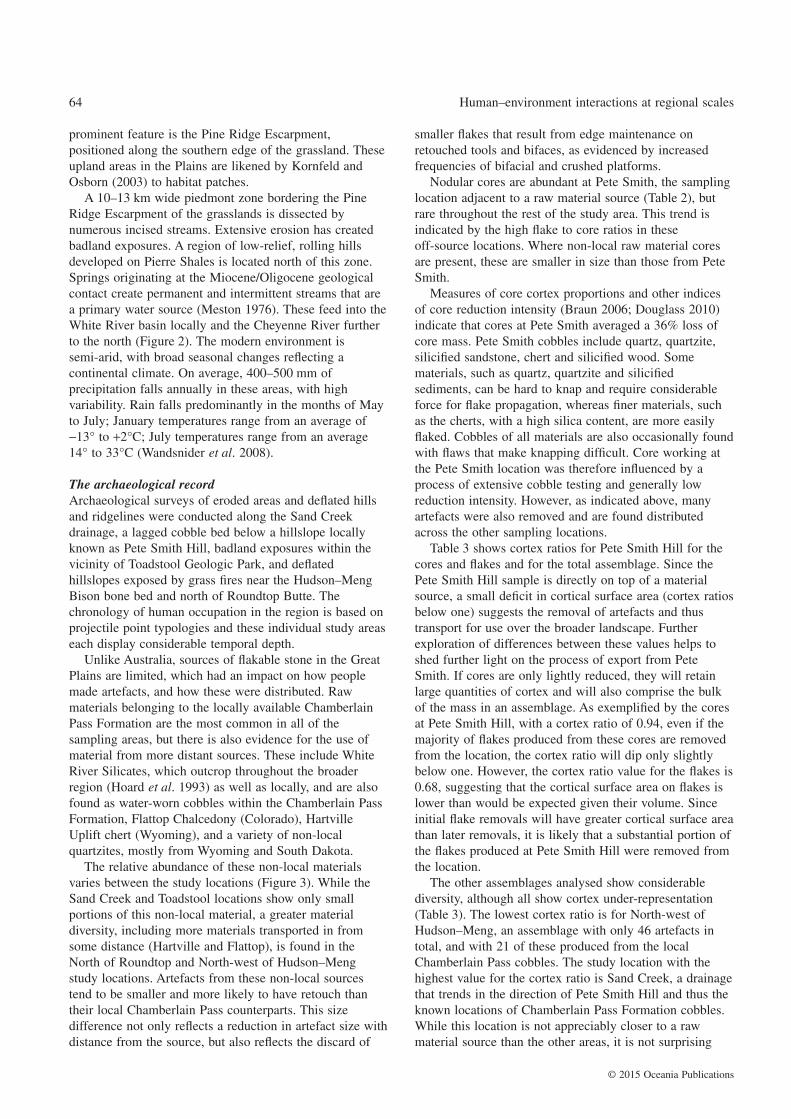
The relative abundance of these non-local materialsvaries between the study locations (Figure 3). While theSand Creek and Toadstool locations show only smallportions of this non-local material, a greater materialdiversity, including more materials transported in fromsome distance (Hartville and Flattop), is found in theNorth of Roundtop and North-west of Hudson–Mengstudy locations. Artefacts from these non-local sourcestend to be smaller and more likely to have retouch thantheir local Chamberlain Pass counterparts. This sizedifference not only reflects a reduction in artefact size withdistance from the source, but also reflects the discard of
smaller flakes that result from edge maintenance onretouched tools and bifaces, as evidenced by increasedfrequencies of bifacial and crushed platforms.
Nodular cores are abundant at Pete Smith, the samplinglocation adjacent to a raw material source (Table 2), butrare throughout the rest of the study area. This trend isindicated by the high flake to core ratios in theseoff-source locations. Where non-local raw material coresare present, these are smaller in size than those from PeteSmith.
Measures of core cortex proportions and other indicesof core reduction intensity (Braun 2006; Douglass 2010)indicate that cores at Pete Smith averaged a 36% loss ofcore mass. Pete Smith cobbles include quartz, quartzite,silicified sandstone, chert and silicified wood. Somematerials, such as quartz, quartzite and silicifiedsediments, can be hard to knap and require considerableforce for flake propagation, whereas finer materials, suchas the cherts, with a high silica content, are more easilyflaked. Cobbles of all materials are also occasionally foundwith flaws that make knapping difficult. Core working atthe Pete Smith location was therefore influenced by aprocess of extensive cobble testing and generally lowreduction intensity. However, as indicated above, manyartefacts were also removed and are found distributedacross the other sampling locations.
Table 3 shows cortex ratios for Pete Smith Hill for thecores and flakes and for the total assemblage. Since thePete Smith Hill sample is directly on top of a materialsource, a small deficit in cortical surface area (cortex ratiosbelow one) suggests the removal of artefacts and thustransport for use over the broader landscape. Furtherexploration of differences between these values helps toshed further light on the process of export from PeteSmith. If cores are only lightly reduced, they will retainlarge quantities of cortex and will also comprise the bulkof the mass in an assemblage. As exemplified by the coresat Pete Smith Hill, with a cortex ratio of 0.94, even if themajority of flakes produced from these cores are removedfrom the location, the cortex ratio will dip only slightlybelow one. However, the cortex ratio value for the flakes is0.68, suggesting that the cortical surface area on flakes islower than would be expected given their volume. Sinceinitial flake removals will have greater cortical surface areathan later removals, it is likely that a substantial portion ofthe flakes produced at Pete Smith Hill were removed fromthe location.
The other assemblages analysed show considerablediversity, although all show cortex under-representation(Table 3). The lowest cortex ratio is for North-west ofHudson–Meng, an assemblage with only 46 artefacts intotal, and with 21 of these produced from the localChamberlain Pass cobbles. The study location with thehighest value for the cortex ratio is Sand Creek, a drainagethat trends in the direction of Pete Smith Hill and thus theknown locations of Chamberlain Pass Formation cobbles.While this location is not appreciably closer to a rawmaterial source than the other areas, it is not surprising
64 Human–environment interactions at regional scales
© 2015 Oceania Publications
Figure 3. Raw material proportions for each of the study areas (right) by weight and (left) by artefact count.
Archaeology in Oceania 65
© 2015 Oceania Publications
that local stone occurs here in the greatest proportion andthat the cortex ratio (0.91, Table 3) is comparable to thatfor Pete Smith Hill. However, within the Sand Creekvalley in general, cores are rare (n = 6) and flakesrelatively common (the flake to core ratio is 17; Table 2).
The cortex ratio for flakes at Sand Creek is > 1,indicating the addition of cortical flakes along with somecores, a pattern that, while close to that seen at Pete SmithHill, reverses the relative order of the values for cores andflakes. At Pete Smith Hill, cores are overly cortical andflakes are under cortical; at Sand Creek, flakes are overlycortical, while cores have lower cortex proportions. Ifbigger, and therefore on average overly cortical, flakes areremoved from source locations such as Pete Smith Hill,the cortex ratio values are greater than one at the locationswhere they are discarded.
This pattern becomes clearer if a division of theassemblages within Sand Creek is considered (Table 3).
The 2011 artefacts were collected from along thecreekline, as well as a larger quantity of artefacts sampledfrom an arroyo system running perpendicular to the valleyand up to its margins. In contrast, the survey in 2012concentrated on the floodplain scalds further to the west,and thus upstream, of the assemblages from 2011.Assemblage-wide values for the 2011 data have a cortexratio of 1.11, while the assemblage-wide cortex ratio for2012 has a cortex ratio of 0.55. The cortex ratio for the2011 flakes is 1.22, while that for the 2012 flakes is 0.53(Table 3).
Based on cortex ratio values, North of Roundtop andToadstool are similar to each other, while the North-westof Hudson–Meng assemblage is similar to Sand Creek2012. For complete flake mass, Toadstool (17.5 g) issimilar to Sand Creek 2011 (16.1 g), but with less corticalsurface area per artefact. This is also shown by the flake tocore ratio. Complete flake mass at North-west ofHudson–Meng (2.9 g) and North of Roundtop (1.0 g)resemble that at Sand Creek 2012 (2.8 g), but the cortexratio value for North-west of Hudson–Meng isconsiderably lower, while for North of Roundtop it isconsiderably higher, than Sand Creek 2012.
In sum, this small sample of locations showsconsiderable variation in raw material use. Projectile pointtypologies suggest a considerable antiquity for the regionin general, and points spanning thousands of years arefound together in individual study assemblages. Thus, thediversity seen in the lithics from these areas is not areflection of differences in activities in a few individualoccupations but, instead, reflects broad trends in use ofthese individual study locations through time. Combiningall study locations shows a pattern of local raw materialuse with material working its way out from local sources,mostly in the form of larger, overly cortical flakes. Whilesome locations show places where large, cortical flakeswere abandoned, it remains unclear how large a spatialscale is required to account for the overall pattern of flakeremoval. Other locations, however, do not show thedeposition of large, cortical flakes. Instead, theseassemblages with smaller flakes may indicate either thecontinued removal of larger flake products (as implied bythe platform data at Sand Creek 2012) or else theconversion of these transported flake forms into retouchedtools, either through use or manufacture. This isparticularly clear from the small yet rather cortical flakesat the North of Round top location, where the size rangeof flakes is constrained and rates of retouch are relativelyhigh.
In locations with smaller artefacts, implying a differentpattern of material use with an emphasis on refurbishmentand economical stone utilisation, higher rates of non-localmaterial artefact deposition are also seen. These locationshave a different relationship to raw material economy andprovisioning, and demonstrate a process where lithic rawmaterial use is more reflective of the broader use of spacewithin a context of material poverty. These sampling areasare removed from drainages in the study area, instead
Table 2. Flake to core ratios for the sampling units for allraw materials (A) and for Chamberlain Pass Formationmaterials (B).
A: Flake-to-core ratios, all raw materials
Raw material N MNI flakes Cores F/C ratio
NRTP 208 76 0 N/ANWHM 46 20 0 N/APS 238 101 69 1.46SC 287 164 9 18.22TS 116 70 4 17.5
B: Flake-to-core ratios, Chamberlain Pass Formation
Raw material N MNI flakes Cores F/C ratio
NRTP 71 26 0 N/ANWHM 21 9 0 N/ASC 166 102 6 17TS 80 47 3 15.67
Table 3. Cortex ratios for the Oglala National Grasslandsampling areas. Separate ratio values are calculated forcores, flakes and the total assemblage, following themethod discussed in Douglass (2010). Ratio values werecalculated using a single estimate of original cobble sizefor all sampling units. Missing values indicate cases whereflakes or cores were either not present or present in toosmall a number to permit calculation of the ratio.
Survey location Coreassemblage
Flakeassemblage
Totalassemblage
Pete Smith Hill 0.94 0.68 0.87North of Roundtop 0.75 0.79North-west of
Hudson–Meng0.23 0.23
SC 0.63 1.09 0.91SC2011 0.74 1.22 1.11SC2012 0.56 0.55 0.53Toadstool 0.66 0.77 0.73
66 Human–environment interactions at regional scales
© 2015 Oceania Publications
being positioned along prairie/upland margins associatedwith the transition from the Pine Ridge to the expansiveflat Plains in the north of the study area. Thus, differentlocations in the ONG are variably sensitive to the two-wayprocesses of raw material moving out from a local sourceand coming to rest over the broader landscape, andmaterials from other more distant sources working theirway into the study area.
Topographic complexityAs the complex topography analysis confirms (Figure 2),topographic differences throughout the ONG study regionare more pronounced than for the Australian case study.The Pine Ridge Escarpment and associated uplandfeatures, together with an array of drainages that radiateoff them and into the flatter grasslands to the north, createa patchwork of habitats within the immediate study area.Extending outwards, the location of the study areas isnoteworthy for its position between the topographicdiversity of the Pine Ridge and the Black Hills, both ofwhich create landmarks that dominate the visiblelandscape. At a regional scale, the spring-fed creeklines ofthe immediate study area connect to large stream systems,and ultimately to a series of west-to-east flowing, incisedrivers that to some degree create corridors for movementthat are much more complex than that of theMurray–Darling region in Australia.
The landscape complexity map (Figure 2c) suggeststhat, overall, this landscape is much more homogeneous ata local level, but more heterogeneous at a broader level,than is the case in the Australian study area. In the plains,the diversity in terrain creates a greater mixture ofresource availability, and thus lends a degree of ecologicaldiversity and complexity to the broader study area. Thecombined effect is a greater array of opportunities forresource exploitation through the temporal and spatialautocorrelation of flora and faunal species within theseunique topographic and physiographic contexts. Thisserves to increase the predictability of resource availabilityover the long term in a way that is very different from thelong-term homogeneity and resource unpredictability thatis seen in the Australian case study. When coupled withraw material access that is limited to a few distributedlocations, the result is a high redundancy in place use,reflected in the marked differences in assemblagecomposition in different landscape contexts that have along history. Similar observations have been made forother parts of the Great Plains region. In a series of casestudies, the concept of ecological islands is used to explorea diverse array of habitats and features that punctuate thebroader Great Plains grassland environment (Kornfeld &Osborn 2003). The scale of these studies ranges from aconsideration of large topographical and ecological zones,such as the Black Hills and Nebraska Sand Hills, tosmaller patterns related to individual hydrological features(e.g. playa lakes and lake systems), to even smallerredundancies in the occurrence of species of plant andfaunal resources (e.g. sego lilies and ungulates). This
resource island concept, and its general relationship to thestructure imposed by changes in topography within thebroader Plains setting, makes sense with the patterningobserved in the ONG. The topographic features of the PineRidge within the study area and the Black Hills to thenorth, both visible from several of the locations analysedin this study, served as fixtures of relative ecologicaldiversity in the landscape. At a more local scale, thepositioning of the Pine Ridge and associated uplandscreates unique ecological contexts within which differentspecies of plains and upland flora and fauna can be found.Localized springs and rainwater run-off create intermittentyet relatively predictable water sources, which in turn leadto drainage features that connect the local landscape to alarger system of creeks and rivers. Thus, unlike theAustralian case study, the conditions of marginal yetimportant topographical complexity in the ONG studyarea, and the ecological feedbacks that result, provide adegree of resource and thus land-use continuity that breaksfrom the broader flat seas of grass that characterize theregion in general. This landscape is still topographicallymundane at a large scale, and as attested by the movementof stone artefacts between sources separated by hundredsof kilometres, required the use of extensive mobility andextended home ranges as a key feature of Great Plainshuman adaptation. Yet within this process of large-scalehuman mobility, the constellations of ecological andtopographical islands imposed a degree of spatial andtemporal resource predictability that served to guidebroader regional patterns of land use that, through time,resulted in the distinct diversity of place-use historiesimplied by the lithic patterning observed in the ONG studylocations.
DISCUSSION
As outlined in the Australian case study, Aboriginal peoplefaced environmental challenges in the past. Resourceabundance was unpredictable owing to the combination ofa highly variable rainfall and low nutrient levels, itself aproduct of the topographic history of the continent. It isthe ecological consequences of both variable rainfall andlow nutrients that help us to understand how Aboriginalpeople interacted with the environment in the way theydid. Archaeological sites from a variety of locations in thesemi-arid region of Australia show evidence for high levelsof movement (Holdaway et al. 2013). This in turn suggestsa response to a flora and fauna that evolved to deal withmarked and unpredictable changes, one that operated at avariety of temporal and spatial scales in a topographicallyundifferentiated landscape that was characterised by highlocal heterogeneity but little systematic, regionallypredictable pattern through time. Faced with suchunpredictability, people moved frequently and over longdistances.
In contrast, the ONG study area represents a region of“islands” within a grassland “sea” (Kornfeld & Osborn2003). The study area also has distinct raw material
Archaeology in Oceania 67
© 2015 Oceania Publications

sources that contrast with a general material poverty in thewider region. Similar to the Australian example, peopletransported flakes. However, in the ONG case study,artefact transport indicates a pattern of land use that is inmarked contrast to patterns shown in the Australianexample.
In Australia, assemblage diversity is present only at thesmallest, local level, seen in the variability in stone artefactassemblages amongst the sampling units studied. Butexpanded to the scale of an entire drainage system, thisvariability does not scale up into different patterns of userelated to landform. On the contrary, assemblagecomposition shows an almost random variation across thestudy area. In contrast, within a relatively circumscribedarea of the ONG, differences in raw materials, in artefactsize and in indications of retouch are apparent. It reallydoes appear that there are distinct, highly redundant,histories of landscape use in the broader grasslands, wheresimilar types of behaviour are generated on uniquetopographic and ecological contexts. To put it simply, inthe ONG example certain places appear to have been usedin similar ways throughout history but differently to otherplaces, whereas, in the Australian example, different placesright across the study area appear to have been used inlargely similar ways. There is continuity in the means bywhich different elements of the broader ONG study areaattracted human use through time, whereas in RutherfordsCreek there is a lack of fixity in landscape elements, andthe overarching patterns suggest low redundancy of landuse over large tracks of geographical territory. Thus, theplace-use histories of the ONG study area and that ofRutherfords Creek are distinctly different, a differencethat can be related to their differing landscapecomplexities, illustrated here using analyses of satellitedata (Figures 1 & 2).
CONCLUSION
In this study, we have matched stone artefact distributionand assemblage composition at the local geographicalscale to measures of both complex topography andenvironmental history at the regional scale, illustrating theissues that Frankel discussed in his 1988 paper. Bailey andKing (2011) suggest topographic complexity as a measurethat operates at the type of temporal and spatial scalessuitable for answering evolutionary questions. To test thisproposition requires that measures of topographiccomplexity be related to observations of the archaeologicalrecord. By comparing two study regions that have differenttopographic complexity measures, we show that peoplecreated distinct long-term landscape-use histories in bothregions. While stone artefact manufacture and use, andindeed the transport of stone artefacts over great distances,feature in both areas, the accumulation of stone artefacts indifferent places leads to a quite different site-use history,one characterised by low redundancy in place use in theAustralian example and one with high place-useredundancy in the ONG study. We set out to study regions
that had a different topographic complexity to theexamples of the complex topography hypothesis inprevious studies. What we discovered was that, while boththe regions selected might be described as plains, theirtopography is quite different. The fact that this differenceis matched by differences in their respective archaeologicalrecords suggests that the method has sensitivity to the wayin which people used past landscapes.
ACKNOWLEDGEMENTS
We are grateful to Aboriginal Traditional Owners ofcountry in our western NSW study areas for theirpermission to conduct research. The Australian researchwas funded by an Australian Research Council DiscoveryProject Grant, and Macquarie and University of Aucklandresearch grants to SJH and PCF. Research in the OglalaNational Grassland was completed with the assistance ofUniversity of Nebraska Archaeological Field Schoolstudents and staff. We would also like to thank DennisKuhnel and staff at the Hudson–Meng Education andResearch Center and Nebraska National Forests andGrasslands. Continued research on the ONG and relatedgrasslands is supported by a USDA Forest ServiceChallenge Grant to MJD. GK acknowledges fundingsupport from the European Research Council throughAdvanced Grant 269586 DISPERSE under the “Ideas”Specific Programme of the Seventh FrameworkProgramme. This paper is DISPERSE contribution no. 18and IPGP contribution no. 3606.
NOTE
1. “Scald” is a local term describing unvegetated patches ofground where topsoils or surface sediments have been erodedby wind and/or water, exposing saline subsoils or subsurfacesediments. They may occur naturally, or as a result ofovergrazing (Charman & Murphy 2000: 62).
CONFLICT OF INTEREST
The authors declare that they have no conflict of interestfor this article.
REFERENCES
Allen, H.A. 1971. Where the Crow Flies Backwards: Man andLand in the Darling Basin. Unpublished PhD thesis,Australian National University, Canberra.
Bailey, G.N. 2005. Site catchment analysis. In C. Renfrew and P.Bahn (eds), Archaeology: The Key Concepts, pp. 230–235.Routledge, London.
Bailey, G.N. and King, G.C.P. 2011. Dynamic landscapes andhuman evolution: Tectonics, coastlines and the reconstructionof human habitats. Quaternary Science Reviews 30:1533–1553.
Bailey, G.N., King, G.C.P. and Sturdy, D.A. 1993. Activetectonics and land-use strategies: A Palaeolithic example fromnorthwest Greece. Antiquity 67: 292–312.
68 Human–environment interactions at regional scales
© 2015 Oceania Publications
Bailey, G.N., Reynolds, S.C. and King, G.C.P. 2011. Landscapesof human evolution: Models and methods of tectonicgeomorphology and the reconstruction of hominin landscapes.Journal of Human Evolution 60: 257–280.
Braun, D.R. 2006. The Ecology of Oldowan Technology:Perspectives from Koobi Fora and Kanjera South.Unpublished PhD Dissertation, Rutgers University, NewBrunswick, NJ.
Charman, P.E.V. and Murphy, B.W. 2000. Soils: TheirProperties and Management. Oxford University Press, SouthMelbourne.
Dewar, G.D., Halkett, D., Hart, T., Orton, J. and Sealy, J. 2006.Implications of a mass kill site of springbok (Antidorcasmarsupialis) in South Africa: Hunting practices, genderrelations, and sharing in the Later Stone Age. Journal ofArchaeological Science 33: 1266–1275.
Dibble, H.L., Schurmans, U.A., Iovita, R.P. and McLaughlin,M.V. 2005. The measurement and interpretation of cortex inlithic assemblages. American Antiquity 70: 545–560.
Douglass, M.J. 2010. The Archaeological Potential of InformalLithic Technologies. Unpublished PhD thesis, University ofAuckland, Auckland.
Douglass, M.J. and Holdaway, S.J. 2011. Quantifying stone rawmaterial size distributions: Investigating cortex proportions inlithic assemblages from western New South Wales. In J.Specht and R. Torrence (eds), Changing Perspectives inAustralian Archaeology, pp. 45–58. Technical Reports of theAustralian Museum, Online 23, 1–2. Australian Museum,Sydney.
Douglass, M.J., Holdaway, S.J., Fanning, P.C. and Shiner, J.I.2008. An assessment and archaeological application of cortexmeasurement in lithic assemblages. American Antiquity 73:513–526.
Fanning, P.C., Holdaway, S.J., Rhodes, E.J. and Bryant, T.G.2009. The surface archaeological record in arid Australia:Geomorphic controls on preservation, exposure, and visibility.Geoarchaeology 24: 121–146.
Frankel, D. 1988. Characterising change in prehistoricsequences: A view from Australia. Archaeology in Oceania23: 41–48.
Hoard, R.J., Bozell, J.R., Holen, S.R., Glascock, M.D., Neff, H.and Elam, J.M. 1993. Source determination of White RiverGroup Silicates from two archaeological sites in the GreatPlains. American Antiquity 58 (4): 698–710.
Holdaway, S.J. and Douglass, M.J. In press. Use beyondmanufacture: Non-flint stone artifacts from Fowlers Gap,Australia. Lithic Technology.
Holdaway, S.J. and Fanning, P.C. 2014. Geoarchaeology ofAboriginal Landscapes in Semiarid Australia. CSIRO,Collingwood, Vic.
Holdaway, S.J., Fanning, P.C. and Shiner, J.I. 2005. Absence ofevidence or evidence of absence? Understanding thechronology of indigenous occupation of western New SouthWales, Australia. Archaeology in Oceania 40: 33–49.
Holdaway, S.J., Fanning, P.C. and Rhodes, E.J. 2008.Challenging intensification: Human–environment interactionsin the Holocene geoarchaeological record from western NewSouth Wales, Australia. The Holocene 18: 411–420.
Holdaway, S.J., Douglass, M.J. and Fanning, P.C. 2013. A newecological framework for understanding human–environmentinteractions in arid Australia. In D. Frankel, S. Lawrence andJ. Webb (eds), Archaeology in Environment and Technology:Intersections and Transformations, pp. 51–68. Routledge,Melbourne.
Holdaway, S.J., Fanning, P.C., Witter, D.C., Jones, J., Nicholls,G. and Shiner, J.I. 2002. Variability in the chronology of laterHolocene occupation on the arid margin of southeasternAustralia. Journal of Archaeological Science 29: 351–363.
Hubert-Ferrari, A., Armijo, R., King, G.C.P., Meyer, B. andBarka, A. 2002. Morphology, displacement and slip ratesalong the North Anatolian fault, Turkey. Journal ofGeophysical Research: Solid Earth 107: ETG 9-1–ETG 9-33.
King, G.C.P. and Bailey, G.N. 2006. Tectonics and humanevolution. Antiquity 80: 265–286.
Kornfeld, M. and Osborn, A.J. 2003. Islands on the Plains:Ecological, Social, and Ritual Use of Landscapes. TheUniversity of Utah Press, Salt Lake City, UT.
Lin, S.C., Douglass, M.J., Holdaway, S.J. and Floyd, B. 2010. Theapplication of 3D laser scanning technology to the assessmentof ordinal and mechanical cortex quantification in lithicanalysis. Journal of Archaeological Science 37: 694–702.
Marean, C.W. 1997. Hunter–gatherer foraging strategies intropical grasslands: Model building and testing in the EastAfrican Middle and Later Stone Age. Journal ofAnthropological Archaeology 16: 189–225.
Meston, L.K. 1976. Archaeological Investigations in the WhiteRiver Region, Northwest Nebraska. Department ofAnthropology, University of Nebraska, Lincoln, NE.
Morton, S.R., Stafford Smith, D.M., Dickman, C.R., Dunkerley,D.L., Friedel, M.H., McAllister, R.R.J., Reid, J.R.W., Roshier,D.A., Smith, M.A., Walsh, F.J., Wardle, G.M., Watson, I.W.and Westoby, M. 2011. A fresh framework for the ecology ofarid Australia. Journal of Arid Environments 75: 313–329.
Stafford Smith, D.M. and Morton, S.R. 1990. A framework forthe ecology of arid Australia. Journal of Arid Environments18: 255–278.
Tapponnier, P., Zhiqin, X., Roger, F., Meyer, B., Arnaud, N.,Wittlinger, G. and Jingsui, Y. 2001. Oblique stepwise rise andgrowth of the Tibet Plateau. Science 294: 1671–1677.
Wandsnider, L.A., Mackling, E.A. and Douglass, M.J. 2008.Cultural Resources Inventory for the Ash Creek and RoundtopHazardous Fuels Reduction Project Areas of the NebraskaNational Forest, Dawes and Sioux County, Nebraska. Reportprepared for US Department of Agriculture Forest Service,Nebraska National Forest, Chadron, NE 69337, USA.
Winder, I.C., King, G.C.P., Devès, M. and Bailey, G.N. 2013.Complex topography and human evolution: the missing link.Antiquity 87: 333–349.
Archaeology in Oceania 69
© 2015 Oceania Publications