Presentation on Cosmetic Hypothesis Analysis - MIET
24
Presentation on Cosmetic Hypothesis Analysis Presented By: Aman Agarwal Ayushi Jain Govind Dilip
-
Upload
khangminh22 -
Category
Documents
-
view
4 -
download
0
Transcript of Presentation on Cosmetic Hypothesis Analysis - MIET

Presentation on Cosmetic Hypothesis Analysis
Presented By: Aman Agarwal
Ayushi Jain Govind
Dilip

Objectives
1. To analyze the consumers brand preferences for cosmetic products.
2. To evaluate consumers attitude towards the usage of cosmetic products.
3. To evaluate consumers perception about the important factors pertaining to cosmetic products purchase decision.

Hypotheses
1. Sales of different brand of cosmetic products are uniformly distributed i.e there is no significant difference in the sales of different cosmetic products brands.
2. There is no significant difference among the consumers of cosmetic products on the factors like age, marital status and income etc.
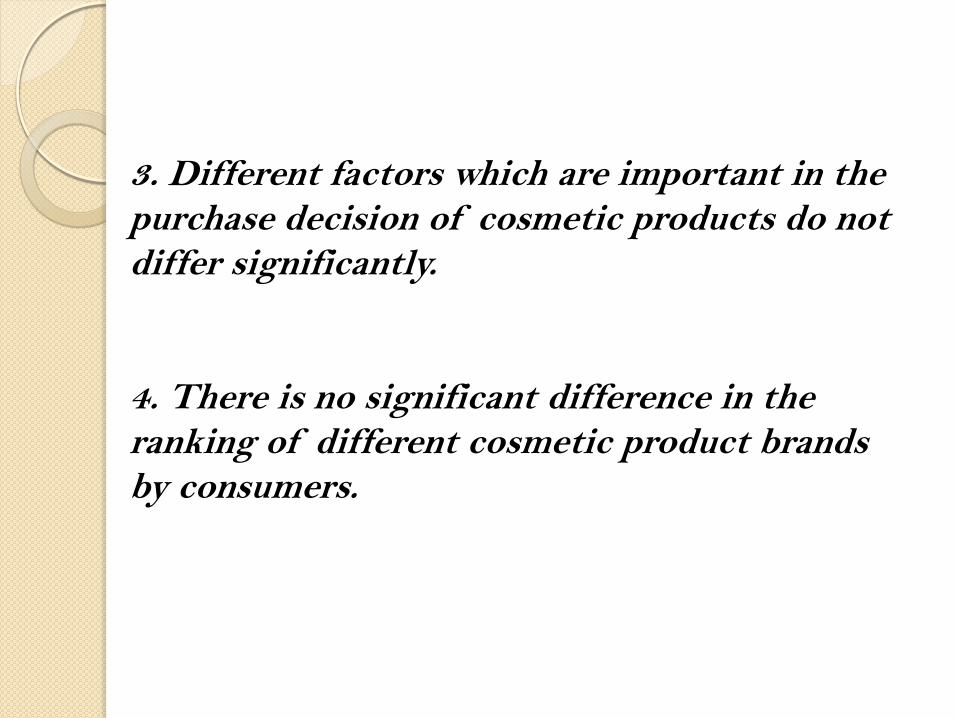
3. Different factors which are important in the purchase decision of cosmetic products do not differ significantly. 4. There is no significant difference in the ranking of different cosmetic product brands by consumers.

Hypothesis -1 Sales of different brand of cosmetic products are uniformly distributed i.e there is no significant difference in the sales of different cosmetic products brands.
To test the hypothesis, chi square test was applied.

Brand Count Lakme 18 L’Oreal 8 Oriflame 4 Revlon 4 Amway 8 Himalaya 8 Maybelline 4 Elle 18 15 Total 69
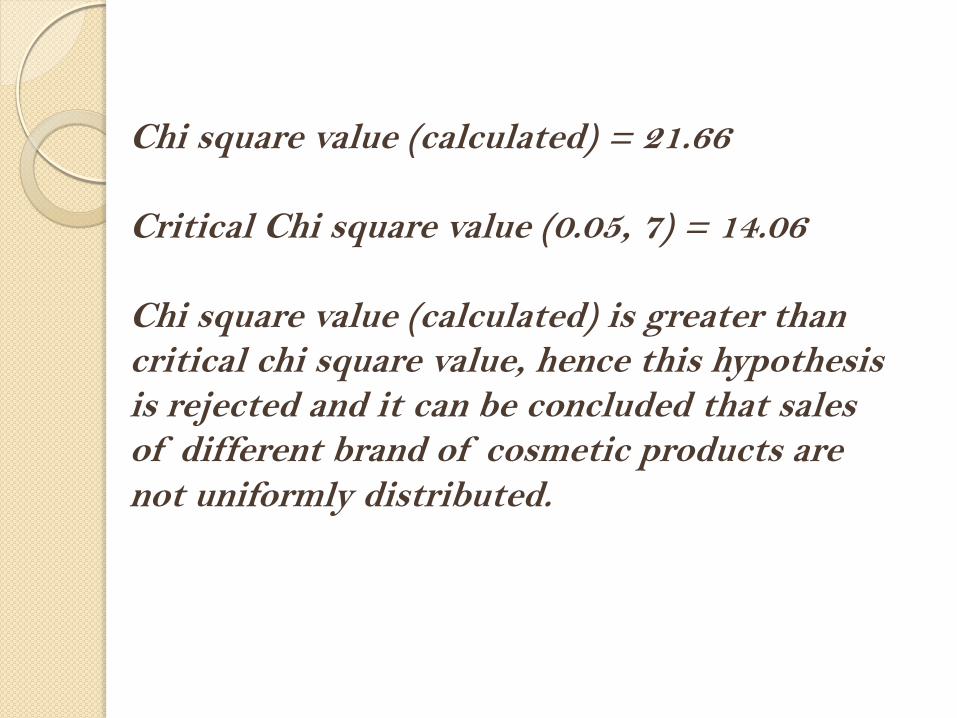
Chi square value (calculated) = 21.66 Critical Chi square value (0.05, 7) = 14.06 Chi square value (calculated) is greater than critical chi square value, hence this hypothesis is rejected and it can be concluded that sales of different brand of cosmetic products are not uniformly distributed.

Hypothesis- 2
Hypothesis 2 (a): Consumes of the different age group (age group 18-25 & 26-35) do not differ significantly on their attitude towards usage of cosmetic products. To test this hypothesis z test was applied with following results:
AGE MEAN N Z VALUE
Z VALUE CRITICAL AT 0. 5 & 125 DF
RESULT
Age 18-25 44.06 50 -0.576 1.95 Insignificant
Age 26-35 44.88 17 Accept Null Hypothesis

Since the calculated z value is less than z critical (two tailed) at .05 significance level, hence null hypothesis is accepted and it can be said that there is no significant difference in the attitude of consumes of the different age group (age group 18-25 & 26-35) towards usage of cosmetic products.
Hypothesis 2 (b): Married and unmarried consumers do not differ significantly in their attitude towards the use of cosmetic products. To test this hypothesis z test was applied with following results:

Since the calculated z value is less than z critical (two tailed) at .05 significance level, hence null hypothesis is accepted and it can be said that there is no significant difference in the attitude of married and unmarried consumers towards usage of cosmetic products.
Status Mean N Z Value
Z Value critical at .05
and 125 df
Result
Married 44.24 21 0.02 1.95 Insignificant
Unmarried 44.21 25 Accept Null Hypothesis

Hypothesis 2 (c): Consumers of different income bracket do not differ significantly on their attitude towards the use of cosmetic products. To test this hypothesis ANOVA was applied with following results:
ANOVA : Single Factor Summary
Groups Count Sum Average Variance
Below 20000
6 288 48 4
20000-40000 24 1060 44.16667 35.01449
40001-60000 19 851 44.78947 21.84211
Above 60000 23 985 42.82609 22.69565
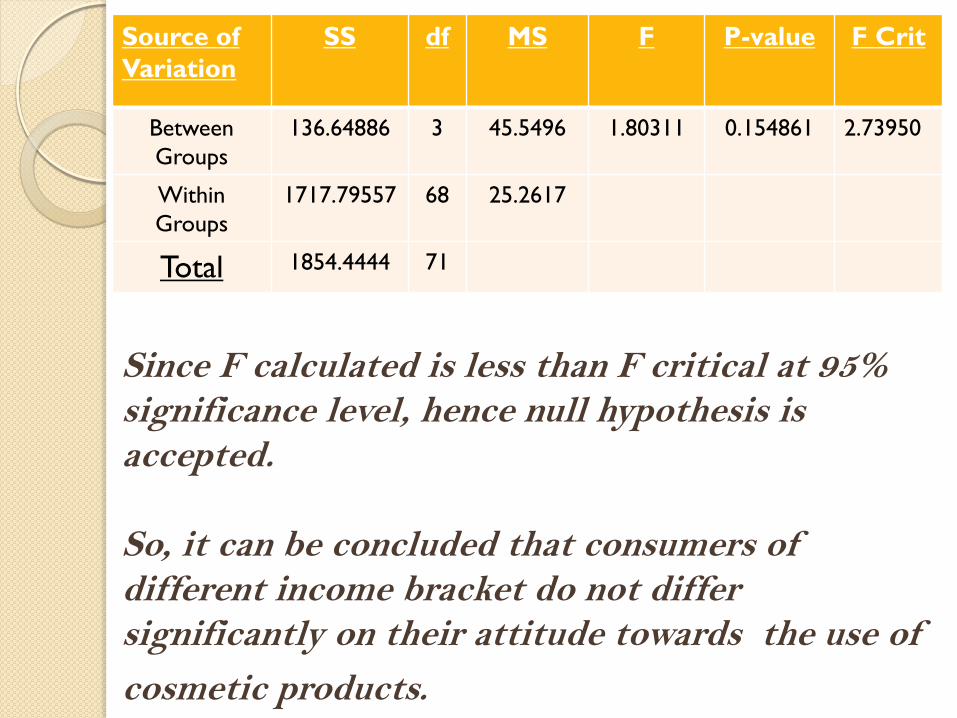
Since F calculated is less than F critical at 95% significance level, hence null hypothesis is accepted. So, it can be concluded that consumers of different income bracket do not differ significantly on their attitude towards the use of
cosmetic products.
Source of Variation
SS df MS F P-value F Crit
Between Groups
136.64886 3 45.5496 1.80311 0.154861 2.73950
Within Groups
1717.79557 68 25.2617
Total 1854.4444 71
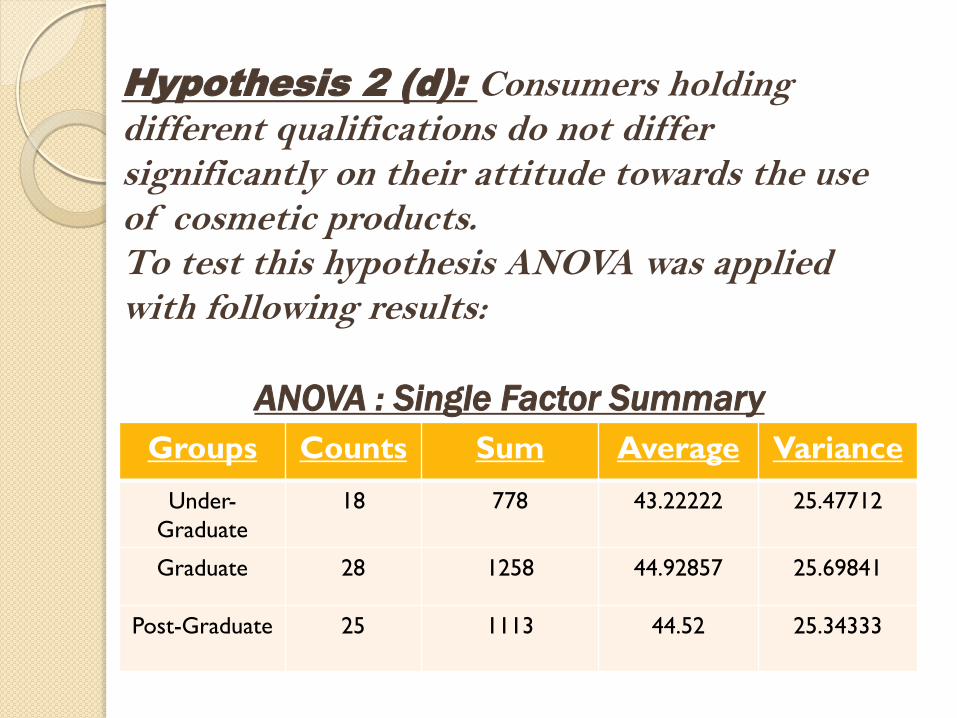
Hypothesis 2 (d): Consumers holding different qualifications do not differ significantly on their attitude towards the use of cosmetic products. To test this hypothesis ANOVA was applied with following results:
ANOVA : Single Factor Summary
Groups Counts Sum Average Variance
Under-Graduate
18 778 43.22222 25.47712
Graduate 28 1258 44.92857 25.69841
Post-Graduate 25 1113 44.52 25.34333

Since F calculated is less than F critical at 95% significance level, hence null hypothesis is accepted. So, it can be concluded that consumers holding different qualification do not differ significantly on
their attitude towards the use of cosmetic products.
Source Of
Variation
SS df MS F p-value F- Crit
Between Groups
32.9889291 2 16.49446 0.646391 0.527122 3.131672
Within Groups
1735.20825 68 25.51777
Total 1768.19718 70

Hypothesis 2 (e): Consumers of different occupations do not differ significantly on their attitude towards the use of cosmetic products.
ANOVA: Single Factor Summary
Groups Count Sum Average Variance
Student 42 1849 44.02381 22.17015
Housewife 10 456 45.6 18.04444
Service 9 425 47.22222 28.44444
Business 6 250 41.66667 23.46667
Professionals 5 204 40.8 59.7

Since F calculated is less than F critical at 95% significance level, hence null hypothesis is accepted. So, it can be concluded that consumers of different occupation do not differ significantly on their attitude
towards the use of cosmetic products.
Source
of
Variati
on
SS df MS F P-value F crit
Between Groups
199.3794 4 49.84484 2.017808 0.101874 2.508695
Within Groups
1655.065 67 24.70246
Total 1854.444 71

Hypothesis 3: Different factors which are important in the purchase decision of cosmetic products for consumers do not differ significantly. To test this hypothesis ANOVA was applied with following results:
ANOVA: Single Factor Summary
Groups Count Sum Average Variance
Price 72 280 3.888889 1.536776
Brand 72 319 4.430556 0.473983
Reputation 72 293 4.069444 0.769757
Recommendatio
n
72 266 3.694444 0.834898
Special Offers 72 232 3.222222 1.161189
Packaging 72 234 3.25 1.373239

Since F calculated is greater than F critical at 95% significance level, hence null hypothesis is rejected. So, it can be concluded that different factors which are important in the purchase decision of cosmetic
products for consumers differ significantly.
Source
of
Variation
SS df MS F P-
value
F crit
Between
Groups
80.3240
7
5 16.06481 15.67339 3.59E-14 2.235174
Within
Groups
436.638
9
426 1.024974
Total 516.963 431

Descriptive statistics analysis
Brand Count Lakme 18 L’Oreal 08 Oriflame 04 Revlon 04 Amway 08 Himalaya 08 Maybelline 04 Elle 18 15 Total 69

0
5
10
15
20
25
30
35
Rank 1 Rank 2 Rank 3 Rank 4 Rank 5 Rank 6 Rank 7 Rank 8
Lakme
L’Oreal Oriflame
RANKING PERFORMANCE

CUSTOMER PROFILES
AGE PROFILE
50
17
3 2
18-25
26-35
36-45
46-55
GENDER
72
FEMALE

MARITAL STATUS
21
51
Married
Unmarried
MONTHLY FAMILY INCOME(Rs.):
6
24
19
23
BELOW 20,000
20,000-40,000
40,001-60,000
ABOVE 60,000

EDUCATIONAL QUALIFICATION
18
28
25
2
Under -Graduate Graduate
Post-Graduate Others
OCCUPATION
42 10
9
6 6
Sales
Student
Service
Business
Professionals
Others