Human disturbance and forest diversity in the Tansa Valley, India
22
Biodiversity and Conservation 12: 1051–1072, 2003. 2003 Kluwer Academic Publishers. Printed in the Netherlands. Human disturbance and forest diversity in the Tansa Valley, India 1 2,3, 2 * RADHAVEACH , DAVID LEE and TOM PHILIPPI 1 2 A1 /301 Kumar Prerama, Aundh, Pune-7, India; Department of Biological Sciences, Florida 3 * International University, FL 33199, USA; Fairchild Tropical Garden, Miami, FL 33199, USA; Author for correspondence (e-mail: leed@fiu.edu; fax: 11-305-348-1986) Received 31 October 2001; accepted in revised form 30 May 2002 Key words: Biodiversity, Disturbance, Forests, India, Tropical deciduous Abstract. We assessed the diversity of woody plants at 15 forested sites in the Tansa Valley of Thane District, in Maharashtra, India. The fewest species (11) were seen at a degraded mangrove site near the river mouth, and the greatest number (150) in the rich semi-evergreen forest on Tungar Hill. For all sites there were 141 tree, 25 shrub and 15 liana species, a total of 181 species. Excluding the mangrove site, which had no species in common with the other 14 sites, we analyzed the species distributions in detail. 2 These sites ranged in area from 4 to 30 km each, had woody floras of 89 6 6 species, and varied in intensity of human impact. Despite a history of exploitation and substantial reduction in biomass from firewood collecting, set fires and illicit tree felling, considerable plant diversity remains in the area. We found a modest increase in species richness in transects away from two villages. We observed the exploitation of the forest by the principal users, primarily of the Warli Tribe. They exploited a wide variety of forest resources (92 species), for medicines, foods, construction materials, household goods, manure and other purposes. They collected 15 items for sale. By far the single most important item collected was firewood, which dramatically reduced forest biomass within 2 km of villages. The species distributions in these forest remnants are strongly nested, mostly due to varying degrees of disturbance at individual sites. The high species diversity on Tungar Hill is most likely a relict of the earlier character of forests throughout much of the valley. It merits the highest priorities for preservation, as a refuge for Western Ghat species at the northern limits of their distributions. Introduction Few forested areas on our planet have not been influenced by human activity. Yet, the effects of long-term human influences on forest biodiversity are not very well understood. India’s forests have been exploited for millennia, and particularly intensely during the past two centuries. Here we describe and analyse the patterns of woody plant diversity in 15 isolated forest tracts in the Tansa Valley, a rural area northeast of Mumbai in the Thane District, Maharashtra, India (Figure 1a). We speculate about the influences on this diversity, particularly human activity, in the forest remnants. Floristic diversity and forest types in the Tansa Valley The TansaValley has been studied floristically in the past. Collections in the region
-
Upload
independent -
Category
Documents
-
view
3 -
download
0
Transcript of Human disturbance and forest diversity in the Tansa Valley, India

Biodiversity and Conservation 12: 1051–1072, 2003. 2003 Kluwer Academic Publishers. Printed in the Netherlands.
Human disturbance and forest diversity in the TansaValley, India
1 2,3, 2*RADHA VEACH , DAVID LEE and TOM PHILIPPI1 2A1/301 Kumar Prerama, Aundh, Pune-7, India; Department of Biological Sciences, Florida
3 *International University, FL 33199, USA; Fairchild Tropical Garden, Miami, FL 33199, USA; Authorfor correspondence (e-mail: [email protected]; fax: 11-305-348-1986)
Received 31 October 2001; accepted in revised form 30 May 2002
Key words: Biodiversity, Disturbance, Forests, India, Tropical deciduous
Abstract. We assessed the diversity of woody plants at 15 forested sites in the Tansa Valley of ThaneDistrict, in Maharashtra, India. The fewest species (11) were seen at a degraded mangrove site near theriver mouth, and the greatest number (150) in the rich semi-evergreen forest on Tungar Hill. For all sitesthere were 141 tree, 25 shrub and 15 liana species, a total of 181 species. Excluding the mangrove site,which had no species in common with the other 14 sites, we analyzed the species distributions in detail.
2These sites ranged in area from 4 to 30 km each, had woody floras of 89 6 6 species, and varied inintensity of human impact. Despite a history of exploitation and substantial reduction in biomass fromfirewood collecting, set fires and illicit tree felling, considerable plant diversity remains in the area. Wefound a modest increase in species richness in transects away from two villages. We observed theexploitation of the forest by the principal users, primarily of the Warli Tribe. They exploited a widevariety of forest resources (92 species), for medicines, foods, construction materials, household goods,manure and other purposes. They collected 15 items for sale. By far the single most important itemcollected was firewood, which dramatically reduced forest biomass within 2 km of villages. The speciesdistributions in these forest remnants are strongly nested, mostly due to varying degrees of disturbance atindividual sites. The high species diversity on Tungar Hill is most likely a relict of the earlier character offorests throughout much of the valley. It merits the highest priorities for preservation, as a refuge forWestern Ghat species at the northern limits of their distributions.
Introduction
Few forested areas on our planet have not been influenced by human activity. Yet,the effects of long-term human influences on forest biodiversity are not very wellunderstood. India’s forests have been exploited for millennia, and particularlyintensely during the past two centuries. Here we describe and analyse the patterns ofwoody plant diversity in 15 isolated forest tracts in the Tansa Valley, a rural areanortheast of Mumbai in the Thane District, Maharashtra, India (Figure 1a). Wespeculate about the influences on this diversity, particularly human activity, in theforest remnants.
Floristic diversity and forest types in the Tansa Valley
The Tansa Valley has been studied floristically in the past. Collections in the region

1052
Figure 1. Map of the Tansa Valley, Thane District, in the State of Maharashtra north of Mumbai(Bombay), India. (a) General location of study area, (b) entire valley, (c) central part of the valley withmost of the forest remnant locations indicated; symbols are provided in Table 1. The distance from east towest on this map is approximately 18 km.
helped in the completion of the floras of the Bombay Presidency by Cooke (1904) aswell as the forest flora by Talbot (1894). Two dissertations (Billore 1972; Koshyand Shah 1987) have added to this information.
Champion and Seth (1968) described the forests of the Thane District as MoistDeciduous Forest Bearing Teak (Type 3B/C1b). Gaussen et al. (1966) described

1053
these forests as ‘slightly humid’ of the series Tectona-Terminalia-Adina-Anogeis-sus. At higher elevations (slightly lower temperatures and more precipitation) adifferent forest type occurs, described by Champion and Seth (1968) as part of thesouthern subtropical broadleaved hill forest (8A/C2), specifically the westernsubtropical hill forest. Gaussen et al. (1966) described these forests as dense andsemi-deciduous. The forest types delineated by Champion and Seth and the FrenchInstitute were not viewed as pristine, but were partly the result of a history of humanintervention. This use has opened up the forest, reduced its ability to store moisture,and has probably shifted the species composition to a more drought- and fire-tolerant mix. Widespread deforestation in the entire region may also have alteredlocal climates (Meher-Homji 1979) by reducing precipitation, and altering thespecies composition of the remaining forests.
Assessing forest diversity
Standard ecological methods for assessing plant diversity involve the random orhaphazard establishment of quadrats varying in size and shape, and the enumerationof individuals of species within the quadrats. These data are then subjected to avariety of statistical assessments. Species diversity in Indian tropical forests hasbeen assessed in this way (Chandrashekara and Ramakrishnan 1994; Gaulier et al.1995; Ganesh et al. 1996; Pascal and Pelissier 1996; Parthasarathy and Sethi 1997;Parthasarathy 1999; Rai 2000). The actual number of species of different classes(i.e. trees, shrubs, lianas) in these surveys was not large compared to the lists ofspecies enumerated for the forests (Pascal 1986; Rai 2000), or compared to diversitydocumented in other tropical forests.
A problem in this approach, which may be exacerbated in vegetation with ahistory of disturbance, is that much of the diversity occurs in small refuges,physically isolated from disturbance or supplied with moisture from a small streamor spring. Thus, sampling with quadrats may substantially underestimate the totalspecies diversity. For animal diversity, where mobility discourages the use of suchsampling, species lists have long been a source of information for the analysis ofisolated communities (Brown and Lomolino 1998). Recently, such methods ofanalysis have been applied to tree species diversity in forest remnants (Honnay et al.1999; Ranta et al. 1999). New methods of the analysis of nestedness (Atmar andPatterson 1993; Jonsson 2001) have made such assessments of diversity even moreattractive. An additional attractiveness of the use of species lists is that it becomespossible to enlist local knowledge in assessing plant diversity, without the necessityof detailed surveying of quadrats in the field.
The purpose of this research
In this study we address four questions. (1) What are the patterns of woody plantspecies distribution in the valley? (2) What factors are associated with forestdiversity? These may include spatial proximity, elevation range, size of forestremnant, and disturbance intensity. (3) How might present diversity in forest

1054
Tab
le1.
Des
crip
tion
ofsi
telo
catio
nsfo
rfo
rest
biod
iver
sity
surv
eys.
Abb
revi
atio
nsC
oord
inat
esEl
evat
ion
Nam
ean
dde
scrip
tion;
buff
erdi
stan
ce(k
m)/
dist
urba
nce
Surv
eySp
ecie
spr
esen
tTo
tal
(m)
area
/tot
al
fore
st 2(k
m)
Tree
sSh
rubs
Lian
as
BE
7285
99E
20–3
00B
elch
atep
and
Dev
dong
hri
4/80
6310
679
1983
19N
Two
hills
north
ofriv
eran
dw
esto
fMan
dagn
iPea
k;10
/5
DH
7285
79E
20–4
00D
ham
nian
dK
ala
6/80
679
778
3
1983
19N
Fore
ston
two
hills
sout
hof
Takm
akM
ount
ain;
10/5
DY
7380
29E
50–5
20D
yari
Hill
(US)
8/22
9312
1011
5
1982
49N
Slop
esan
dsu
mm
itrid
gead
join
ing
Gho
tara
Peak
;9/
6
DZ
7380
79E
50–4
05D
auze
Hill
6/12
556
465
1983
39N
Isol
ated
pyra
mid
-like
hill
surr
ound
edby
indu
stry
;4/
3
MA
7380
29E
100–
600
Man
dagn
iPe
ak(M
B)
10/1
478
105
93
1983
29N
Slop
esan
dsu
mm
itpl
atea
uof
prom
inen
tpea
k
north
ofG
anes
hpur
iV
illag
e;12
/4
MB
7380
19E
20–5
0M
anda
gni
Peak
Bas
e(M
A)
4/14
594
568
1983
19N
Fore
stto
sout
h
and
sout
hwes
t
ofm
ount
ain;
3/4
MH
7381
49E
100–
900
Mah
uli
Fort
Mou
ntai
n10
/65
7314
592
1982
89N
Sum
mit
plat
eau
and
uppe
rslo
pesn
orth
side
;
serie
sof
forts
onal
lpe
aks;
10/6
MU
7380
09E
50–4
90M
urum
baan
dG
hori
Don
gar
(MA
,TA
)6/
8077
106
93
1983
49N
Hill
snor
thw
esto
fMan
dagn
i,ne
arN
andn
i
and
Kal
ambh
aivi
llage
s;10
/5
TA7285
79E
50–6
00Ta
kmak
Fort
Mou
ntai
n(M
U)
10/8
076
115
92
1983
49N
Tosu
mm
itfo
rest
ofm
ain
peak
and
larg
eho
rn;
fort
site
;8/
5

1055
TL7381
49E
100–
150
Tans
aLa
kesi
de4/
8060
45
69
1983
69N
Fore
stal
ong
rese
rvoi
ron
north
and
wes
tsi
des;
4/4
TP7380
09E
20–5
0Ta
pova
nH
ill3/
360
54
69
1983
09N
Deg
rade
dfo
rest
ontw
osm
all
hills
near
Gan
eshp
uri
Vil-
lage
;1/
4
TS7382
29E
100–
150
Tans
aSo
urce
Fore
st4/
7050
66
62
1983
69N
Expl
oite
dfo
rest
near
Kha
rdi
Vill
age,
alon
gfir
st2
kmof
river
;15
/3
TT7285
49E
,5
Tans
aM
outh
4/4
64
111
1983
09N
Deg
rade
dm
ainl
ym
angr
ove
vege
tatio
nfr
omK
aniv
deV
il-
lage
toco
nflue
nce
with
Vaita
rna
Riv
er,t
idal
;1/
1
TU7285
59E
40–7
00Tu
ngar
Hill
30/1
2011
521
1415
0
1982
69N
Slop
esan
dsu
mm
itpl
atea
uof
mos
tpro
min
entp
eak
inth
e
area
;15
/8
US
7380
29E
50–6
00U
sgao
nH
ills
&G
hota
raPe
ak(D
Y)
14/2
286
138
107
1982
69N
Slop
es,
lead
ing
tow
ards
ridge
and
mai
npe
akso
uth
of
Usg
aon
Res
ervo
ir,fo
rtsi
te;
8/4
Tota
ls14
125
1518
1
Each
site
isgi
ven
anab
brev
iatio
n(c
orre
spon
ding
tolo
catio
nson
the
map
sin
Figu
res1
and
2),c
oord
inat
esfo
rlon
gitu
dean
dla
titud
e,el
evat
ions
,and
abr
iefd
escr
iptio
n.B
uffe
rdis
tanc
eis
the
furth
estd
ista
nce
from
the
edge
of
the
fore
stto
the
inte
rior
ofth
esi
te,a
nddi
stur
banc
e(1
–10)
isde
scrib
edin
the
Met
hods
sect
ion.
Loca
tions
inpa
rent
hese
s;(B
E)de
note
san
othe
rfo
rest
rem
nant
conn
ecte
dby
degr
aded
fore
st.

1056
remnants help us to reconstruct the composition of these forests earlier in history?(4) How do the tribal communities exploit these forest areas today, and what effectdoes this have on forest diversity and health? We obtained data to answer thesequestions through intensive sampling and the listing of woody species diversity at15 forest remnants in the valley, three transects near villages adjacent to forest, andobservations on minor forest product use by tribal groups. This research has allowedus to determine the places of highest diversity in the valley and the nature of currentexploitation. These results will also help devise strategies for forest conservation inthis region.
Sites and methods
Sites
The study sites are in the drainage of the Tansa River, 50 km north of Mumbai(Figure 1a). The valley is well known for its hot springs and pilgrimage sites. TheTansa Valley is characteristic of the Konkan, a narrow belt of land along the westcoast from Goa in the south to Gujarat in the north. The region is underlain by basalt(Deccan trap) produced at the end of the Jurassic. Erosion has left low (500–900 m)isolated peaks in the valley. Alkaline dark heavy clay soils (‘regur’ or black cotton)cover most of the valley, with more weathered oxisols on the peaks. The tropicaldeciduous forests in the area have developed in seasonally dry tropical conditions(average temperature in January of 24 8C compared to 318 in April, and thesouthwest Monsoon, with rains (ca. 2500 mm) primarily in June–September(Santapau and Randeria 1970; Meher-Homji 1979).
Fifteen forested areas in the valley were selected and examined (Table 1, Figure1a, b and c), representing the remaining forest cover in the valley. Woody plant
2diversity was sampled in forest patches of approximately 4–30 km . We estimatedthe size of the area surveyed and the maximum distance within the site to forest edgefrom our field work. Since all of the sites were heavily disturbed on their fringes, weterm this value the ‘buffer distance’. We also estimated the area of the total forest inwhich the fragment was surveyed from satellite imagery (PO94/RO59 L3 QU:2, 21NOV96/11:21:34 F:N19:28:30/E73:01:20 and 23 JAN99/11:32:36 F:N19:23:09/E073:17:04, National Remote Sensing Agency, Hyderabad, India). We sampled
2areas that could be adequately sampled in five or more field days (3–14 km ). Thearea on Tungar Hill was much larger because of its potentially higher diversity, andwas visited over 20 times
Methods
The forest sites were visited by different routes and in different seasons, from 1995to 2001. The elevations of individual plant observations were determined with analtimeter, and some locations were confirmed by GPS towards the end of the study.
Problematical species were checked against herbarium specimens from the
1057
Blatter Herbarium (BLAT) at St Xavier’s College, The Botanical Survey of India(BSI) in Pune, and the Royal Botanical Gardens, Kew (UK). Herbarium specimenswere collected from rare or unidentified taxa and deposited in BLAT. We de-termined correct scientific names and authorities from Pascal (1986), Ambasta(1986), Almeida (1996–1998), Mabberley (1998), as well as the Index Kewensis.Some family names were changed according to contemporary research (TheAngiosperm Phylogeny Group (APG) 1998).
We ranked the degree of forest disturbance at each site on a scale of increasingdisturbance from 1 to 10, where 1 would be a forest of closed canopy, no evidenceof timber cutting or extraction of minor forest products, with a canopy 20–25 mhigh, 5 would be occasional stumps of cut trees, evidence of frequent exploitation ofminor forest products and a partly open canopy, and 10 would be no standing treesand numerous shrubs.
Two species, not strictly woody, were included because of their size, ecologicalimportance and persistence (see Appendix): Ensete superbum and Strobilanthescallosus. We also have added some herbaceous species collected by tribal people tothe Appendix, although these were not used for the diversity analyses.
We established two transects from the village of Usgaon and one from Keltan(Figure 1c), assessing the forest diversity at 500 m intervals (in 100 m wide strips)away from the villages. We determined the extent of tribal exploitation of forestresources primarily by observing and interviewing collectors during the ca. 150 tripsin the forest. We also interviewed two knowledgeable informants from UsgaonVillage and one from Gayagota Village, and visited village markets in Vajreshwariand Mandvi, interviewing vendors to determine the items sold and bartered by thetribal people.
The species richness of each forest fragment was indicated by the total number ofobserved woody species. We tested for the influence of the following factors
2potentially affecting species richness: (1) total sampled area (in km ), (2) buffer2distance (in km), (3) total forest area (in km ), and (4) disturbance intensity
(minimum of 1 to maximum of 10). The strength of these associations was testedwith Spearman rank correlations. The independent contribution of two factorssignificantly associated with species richness was then assessed with Spearmanpartial correlations, removing the effect of the other factor. We completed theseanalyses in SAS v. 8.1 (SAS Institute, Cary, North Carolina).
To visualize the patterns in compositional similarity, non-metric multidimension-al scaling was used to produce a graph in which the pairwise Euclidean distancesbetween fragments in the graph were maximally (rank) correlated with the corre-sponding pairwise Jaccard compositional dissimilarities. Since the presence andabsence of species was recorded, and not abundance, we chose the Jaccard metric toestimate compositional similarity between all pairs of fragments. It has the advan-tage that shared absences (species not present in either of the pair of fragments) arediscounted and not considered indicative of any similarity (Legendre and Legendre1998). Stress (lack of fit) was compared for solutions in 1–4 dimensions; twodimensions were adequate to reflect the variation. In order to test for broad spatialgradients we compared distance between all pairs of sites to their compositional

1058
similarity using a Mantel test. Similarly, we performed a Mantel test betweenpairwise compositional dissimilarity and corresponding differences in disturbanceintensity.
Given the disagreement about methodology for estimating nestedness among theforest sites (e.g. Atmar and Patterson 1995; Cook and Quinn 1998), we used morethan one method. We applied the ‘temperature calculator’ of Atmar and Patterson(1995) to provide an overall estimate comparable to existing literature. We alsocalculated row (the order of species richness in the 14 fragments) and column (theorder of occurrences at the 14 sites for all species) marginals for the null model,compared with the observed distributions among the fragments. Finally we used theprobabilistic null model RANNEST of Jonsson (2001) to test for nestedness in thestrictest sense.
Results
The 15 sites varied in totals of woody species. The smallest value was 11 at a highlydegraded mangrove tidal area (TT, Table 1). This area shared no species with theother areas and was excluded from the statistical analyses. The second least diversesite was degraded forest near the source of the Tansa River (TS), with 62 species.The most species-rich site was Tungar Hill, a large forest tract and the closest to thecoast (Figures 1c and 2; Table 1), with 150 species. This site contained all but 20 ofthe total of 170 species observed at all sites other than the mangrove (see Appendix).The total for the 14 sites included 135 trees, 21 shrubs and 14 lianas (Table 1), witha mean total of 89 6 6 (SE) species. The 14 sites varied in total woody speciesdiversity, area surveyed, total forest area, maximum buffer distance, and degree ofdisturbance (Table 1, Figure 2).
The species richness varied in the three transects adjacent to two villages in thefollowing ways. For the transect southwest of Usgaon (disturbance indices of 7, 7, 6,and 5 for 0.5 km increments away from the village), species totals were 60, 71, 52and 61. For the transect northeast of Usgaon (indices of 7, 7, and 8), species totalswere 35, 15 and 25. For the transect northwest of Kelthan (indices of 7, 7, 6, and 5),the species totals were 32, 42, 55 and 66. Twenty-four species were observed in8/11 of the quadrats (see Appendix).
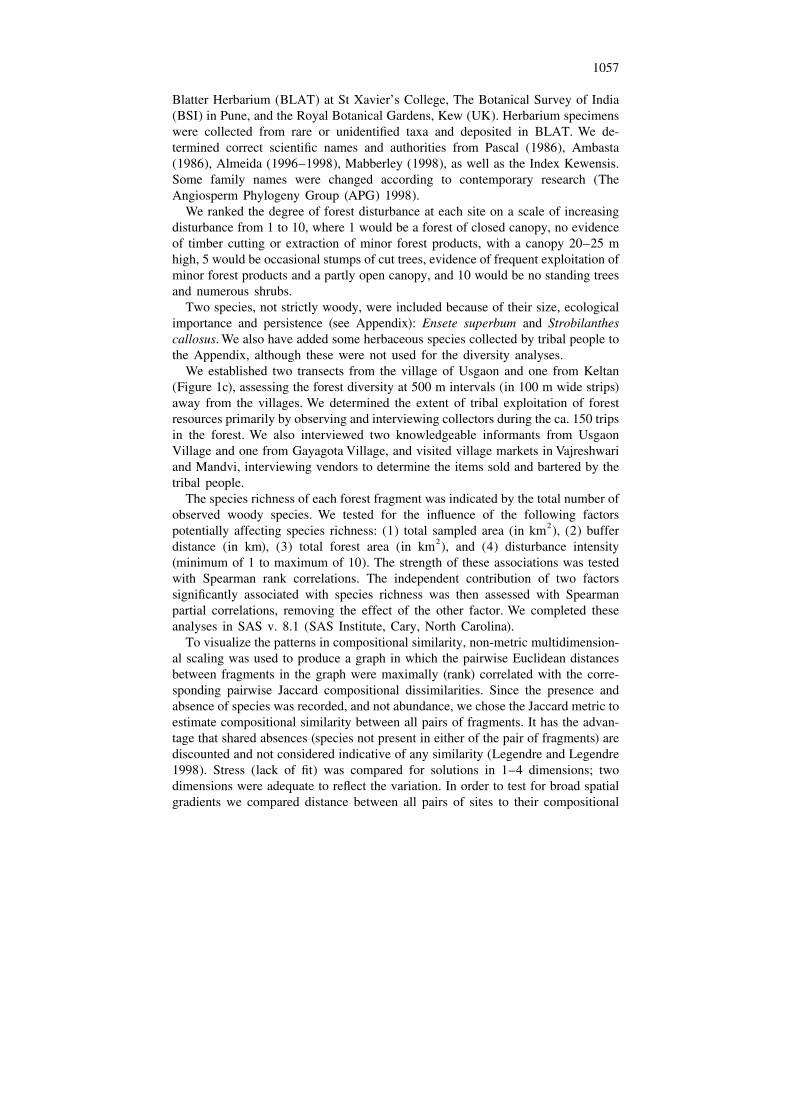
The species richness at the 14 sites was significantly correlated with the areassurveyed and disturbance intensity, but not correlated with maximum forest area ormaximum buffer distance (Table 2, Figure 2). Survey area and disturbance intensitywere moderately but not significantly correlated with each other (Spearman r 5
0.488 and P 5 0.075), and their separate effects were still significant on diversityafter partialling out their effects on each other (Table 2, right column). These effectspersisted even when the most diverse site (TU) was removed from the analysis.
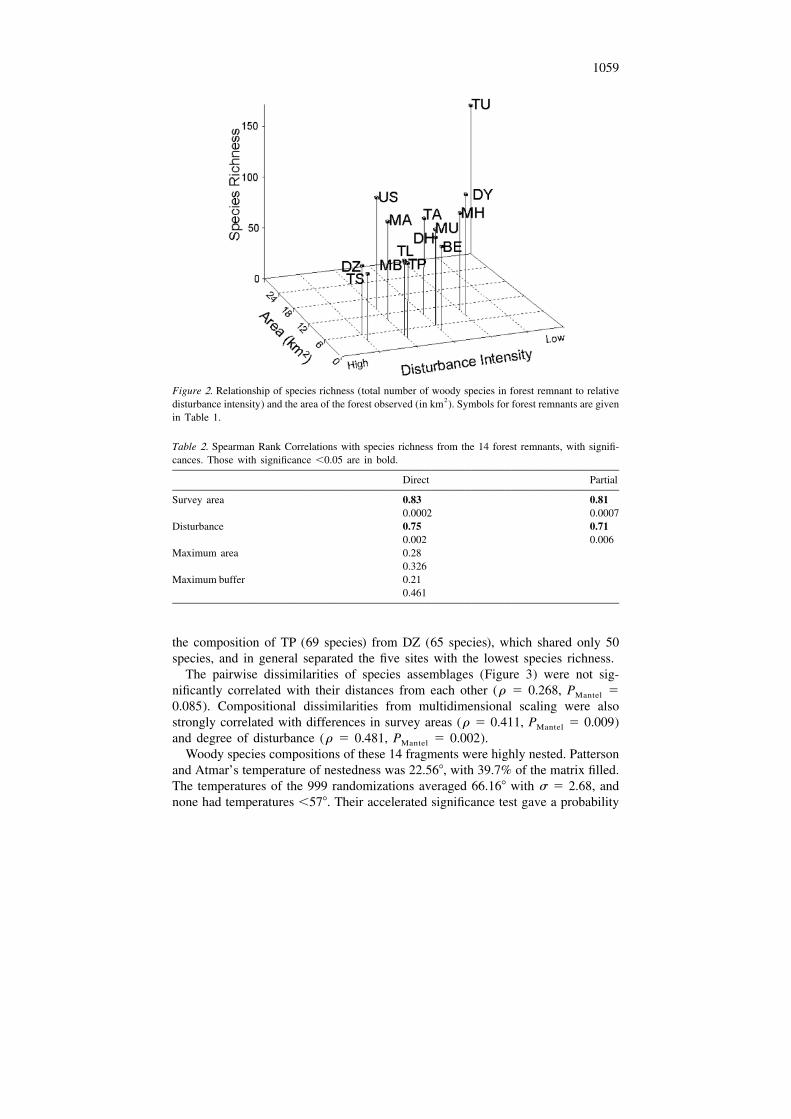
Non-metric multidimensional scaling captured the patterns of species composi-tion in two dimensions (Figure 3). The largest gradient in composition was speciesrichness, from TU (150 species) to TS (62 species). A secondary gradient separated
1059
Figure 2. Relationship of species richness (total number of woody species in forest remnant to relative2disturbance intensity) and the area of the forest observed (in km ). Symbols for forest remnants are given
in Table 1.
Table 2. Spearman Rank Correlations with species richness from the 14 forest remnants, with signifi-cances. Those with significance ,0.05 are in bold.
Direct Partial
Survey area 0.83 0.810.0002 0.0007
Disturbance 0.75 0.710.002 0.006
Maximum area 0.280.326
Maximum buffer 0.210.461
the composition of TP (69 species) from DZ (65 species), which shared only 50species, and in general separated the five sites with the lowest species richness.
The pairwise dissimilarities of species assemblages (Figure 3) were not sig-nificantly correlated with their distances from each other (r 5 0.268, P 5Mantel
0.085). Compositional dissimilarities from multidimensional scaling were alsostrongly correlated with differences in survey areas (r 5 0.411, P 5 0.009)Mantel
and degree of disturbance (r 5 0.481, P 5 0.002).Mantel
Woody species compositions of these 14 fragments were highly nested. Pattersonand Atmar’s temperature of nestedness was 22.568, with 39.7% of the matrix filled.The temperatures of the 999 randomizations averaged 66.168 with s 5 2.68, andnone had temperatures ,578. Their accelerated significance test gave a probability
1060
Figure 3. Multidimensional scaling, revealing patterns of compositional similarity among the 14 forestremnants. Symbols for forest remnants are given in Table 1. Sizes of circles reflect species richness ineach of the remnants. The axes in this analysis have no dimensions.
248,1.2 3 10 , 12.26 standard deviations between the mean of the randomizationsand the observed value. These sites also had more widespread species (on nearly allfragments) and more restricted species (on one or a few fragments) compared to theexpected number of distribution in the Atmar and Patterson (1993) null hypothesis(Figure 4, which predicted a range of 71–95 species). Jonsson’s (2001) null modelfor nestedness, conditional on the differences between species frequencies, was alsorejected.
Rural dwellers, primarily tribal, collected products from 92 plant species, includ-ing eight herbs not censused in the site inventories. Since some species yielded morethan one product, 127 items were collected. Some species yielded several items, likeMadhuca indica. The four most important uses were medicines (45 species), fruit(27), timber (15) and vegetables (13). Fifteen commodities were sold in markets orto middlemen for cash, not including the value of some illicitly cut timber (Ballal2000).
Discussion
Variation in forest diversity at sites within the Tansa Valley is correlated with other

1061
Figure 4. Number of species in relation to the number of fragments occupied. The solid curved lineindicates the expected distribution of species if the hypothesis of nestedness is rejected; the dashed linesindicate 95% confidence intervals (Atmar and Patterson 1993, 1995).
site variables. Their analysis has helped us to understand the factors influencingspecies diversity in the valley, and changes in diversity over time.
Patterns of forest diversity
The diversity of the 14 forest remnants is comparable to that of similar sites in Indiaand other seasonally dry regions in the tropics. The site with the most species wasTungar Hill (TU) with 150 species; the least diverse site (besides the mangrove sitewith 11 species, excluded from additional analysis) was a site near the river source(TS) with 62 species. These species totals approach or even surpass those publishedfor wet evergreen forests (Chandrashekara and Ramakrishnan 1994; Ganesh et al.1996; Pascal and Pelissier 1996; Rai 2000), but these estimates are from quadrats.The woody species diversity is less than that of similar sites in Indo-China (Rundeland Boonpragob 1995) or in Latin America (Gentry 1995). Dry forests in Mexicoare more species-rich, with less annual rainfall (Lott et al. 1987).
The correspondences with the forest types of Champion and Seth (1968) andGaussen et al. (1966) are not perfect; some differences would be expected betweenregions. These forests are floristically more diverse than those described at SanjayGandhi National Park in Mumbai (Santapau and Randeria 1970), the uplands onElephanta Island (Satyanarayan 1959), and consistent with those at moister sites onDeccan trap soils (Legris and Meher-Homji 1979). The 24 predominant species(seen in 13/15 of the sites and 8/11 of the 100 3 500 m quadrats in the disturbancetransects; see Appendix) are all persistent, resistant of fire and cutting, and areindicators of a history of disturbance. The higher frequency of teak is suggestive ofthis history of disturbance (as well as past silvicultural treatment).
Many species vary in presence from site to site, many are associated with moremoist forest associations, and reveal much about the distribution of diversity in theforests, as well as effects of disturbance.
Truly remarkable in its high diversity is the semi-evergreen forest of Tungar Hill,

1062
with 150 woody species. Twenty-four of the species at all sites (out of 181 species)are unique to this one location. Other mesic species characteristic of hill forest werealso found in neighboring peaks, like Mahuli, Takmak and Ghotara. Macarangapeltata and Pavetta indica occurred in areas below Ghotara and above Usgaonreservoir, as well as on Takmak, Dyari and Mahuli. Diospyros Montana alsooccurred on Mahuli, Ghotara and Usgaon, Takmak and Mandagni. Glochidionhohenackeri occurred on Tungar, Dyari, Takmak and Mahuli.
Legris and Meher-Homji (1977) described the predominant species of the hills ofthe Peninsula, including those of the northern portion of the Western Ghats, inmoister and evergreen forests. Their moist forest species at these 14 sites include(with the number of sites in parentheses): Dillenia pentagyna (10), Diospyrosmontana (5), Firmiana colorata (9), Lagerstroemia lanceolata (13), Macarangapeltata (5), Oroxylum indicum (7), Sterculia villosa (9), Toona ciliata (1), andEnsete superbum (11). However, in our experience D. montana, S. villosa and E.superbum are actually very drought-tolerant. We would add Mimusops elengi,Carallia brachiata, Mammea suriga, Ixora brachiata, Albizzia procera andBauhinia malabarica as indicators of moist forest. Four species described asdiagnostic of wet evergreen forests were also found on these sites: Garcinia indica(2), Spondias pinnata (11), Aporosa lindleyana and Sageraea laurifolia (both TUonly).
Despite Tungar’s moderate elevation (Table 1), species that normally grow atmuch higher elevations have established there. Koshy and Shah (1987) haddocumented some of this diversity and shown its relationship to the flora atKhandala (Santapau 1954), having in common such taxa as Diospyros montana,Garcinia indica and Mimusops elengi. They noted 38 woody taxa from Tungar, alsoseen in our collections. We have found additional rare and unusual taxa from thislocation, 22 of these species not listed by Koshy and Shah: Aglaia talbotii,Antidesma ghaesembilla, Caryota urens, Cleidion spiciflorum, Chukrasia tabularisvar. velutina, Flacourtia montana, Gymnosporia konkanensis, Litsea glutinosa,Margaritaria indica, Persea macrantha, Spermadictyon suaveolens, and others (seeAppendix). Some of these species are very rare from this region, collected from theKonkan for the first time (V. Almeida, personal communication); G. konkanensis isendemic to this site. A similar list of species was also observed in the summit area ofKamandurg Fort, some 3 km to the south (unpublished observations). This entireregion may well represent the largest remaining expanse of western subtropical hillforest (Champion and Seth 1968) in the Konkan, similar in diversity to Khandala tothe south (Santapau 1954), but larger in area and perhaps less disturbed.
Factors influencing species diversity
Two factors were strongly correlated with diversity: the disturbance index and thesize of the area surveyed (Figure 2, Table 2). Survey of a larger area should increasethe probability of detecting rare species, although surveys within quadrats in thedisturbance gradients yielded up to 71 species within only 5 ha. Initial recognition ofdiversity on Tungar led to a more careful surveillance of a larger area. However, the

1063
entire forest areas, represented by the sample areas, were not correlated with speciesrichness. Although degree of disturbance was correlated with species diversity, themaximum buffer distance was not. All of the forest remnants were subject to intensepressures of exploitation on their edges. However, neither total size nor bufferdistance explained the degree of disturbance within these sites. Some were moreprotected by steepness of slope and total elevation, distance from graded roads, andsmaller human populations in nearby villages.
We expected that rarer species might be confined to the moistest and most remotesites at the highest elevations. The proximity of the isolated mountains to the coastincreases their humidity and rainfall, which may lower the distribution limits ofmany of the trees of this forest (Whitmore 1984; Leuschner 1996), on Tungar Hilland, to a lesser extent, on other mountains in the valley. Actually, the highestelevations were dry and exposed, and most rare species occurred in small andprotected valleys beneath the summits. Most of the rare species, including thosegrowing exclusively on TU, actually grow over most of the elevation range, manynear the base of the hill (see Appendix). Thus, elevation may not be a very importantfactor.
Analysis of nestedness (Brown and Lomolino 1998) has developed as a powerfultool in explaining geographical patterns of diversity. Where species assemblages aresubsets within larger assemblages, explanations of such patterns invoke filters, suchas barriers to dispersal or distance, that remove species from islands or isolatedlocations. The 14 sites in the Tansa Valley were strongly nested, both in totaldiversity and in similarity. Only 20 species out of the 170 in the Tansa Valley(removing the mangrove site) were not observed in the most species-rich site, TU.Thus the other locations principally had subsets of species present in this one site.The maximum and minimum number of species were thus significantly greater andsmaller than predicted from the null model (Figure 4). However, contrary to acluster of islands adjacent to a mainland, nestedness in the Tansa Valley was notassociated with distance. Species dissimilarity was not associated with distance,despite the similarity and proximity of three of the more species-rich sites (DY, USand TA) to nearby TU (Figure 3).
Human disturbance
Presently the principal pressure on these sites is by tribal residents of villages nearthe forest margins. Four groups live in the valley: Koli, Warli, Thakur and Katkari(Anonymous 1982). The Warli traditionally used forest products and had anexcellent knowledge of forest biodiversity (Save 1945). Such groups have lived inthe area before and throughout this history. At low population densities theiroriginal impact on these forests was probably minor.
All of the sites were subject to this pressure on their margins, but some containedareas that were more protected because of isolation. Our qualitative assessments ofthe degrees of disturbance in the most isolated areas of the forest remnants, alongwith observations of forest products collected in these remnants, document these

1064
pressures. Certain observations (like tree stumps) document disturbance at least twodecades ago.
The collection of firewood and illicit tree felling are particularly important nearforest margins. Most visitors in the forests were collecting firewood. Only certainspecies important for other uses are exempt from such collecting. These includeMowha (Madhuca indica), used in the production of liquor, and fruit trees,particularly jamun (Syzygium cumini) and mango (Mangifera indica; see Appendix).
These collecting activities drop rapidly beyond 2 km, but other products aregathered throughout the forests. Our survey provides a low-end estimate of plantuses in these forests, particularly for medicinal plants. For instance, 19 additionalspecies in our survey had medicinal uses by Adivasi in Karjat, just south of ThaneDistrict (Anonymous 1998). Fire is an additional human impact in these forests,mostly near villages, but burning up-slope for considerable distances. Collection ofmost minor forest products has little effect on forest structure and biomass, but maysometimes contribute to tree mortality (like gum collecting in Sterculia urens).
We assessed the human impacts on forest diversity near two villages, Usgaon andKeltan (Figure 1c). Forests adjacent to these villages were dramatically differentcompared to more isolated ones nearby, like the hills above Usgaon and those at thebase of Mandagni Peak. Intense exploitation for firewood and timber dramaticallyreduced the biomass in these areas, and also reduced diversity. The only large treesclose to the villages are those with a particular value for the villagers, e.g. fruit. Yet,considerable diversity of hacked and stunted plants persisted, even within 500 m ofthese villages; 35 species to the N–NE and 60 species to the SW of Usgaon Village,and 32 species NW of Keltan. Species diversity only increased with distance alongthe transect NW of Keltan. In the SW direction from Usgaon the further distanceswere close to a paved highway. The 1000–1500 m section of the transect NE ofUsgaon was on a rocky ridge with fewer plants. The total forest diversity in each ofthese transects was less than that of the more intact forests studied at furtherdistances, 106 species in Usgaon and Ghotara Peak, and 90 species on the summitand slopes of Mandagni Peak. Presumably the species surviving in the areas nearvillages are particularly resistant to repeated lopping for firewood, fires andbrowsing by animals. Still, woody plant diversity is surprisingly high near thevillages. These species, typically those with the widest distributions in the valley(see Appendix), are extremely resilient.
All of these sites are within lands managed as Reserve Forest by the MaharashtraForest Department. Selective cutting continued in these forests, but probably lessextensively than by the British (the extraction roads were abandoned), and cuttinghad been banned by central government decree since 1988. Unfortunately detailedrecords were not available, but extensive logging had not been observed in theseareas for 20 years.
Disturbance history in the Tansa Valley
Over 2500 years of disturbance have affected the forests of the valley, particularlynear the river, but it is unclear if demand for timber was great enough to extend wellinto the isolated hills and these 14 sites until the last two centuries.

1065
The Tansa Valley was a major transportation corridor between the Deccan and thecoast, particularly for the important Buddhist center of Sopara (fifth century BCE;Campbell 1882). Timber exploitation for domestic and ship construction, as well asexport, probably continued through the succession of local kingdoms, and thenincreased with the rise of Portuguese Bassein, in the 16th century (Figure 1a), whentimber was used for the construction of Portuguese ships (Pereira 1935). A Britishofficial, Dr Hove, travelled through the district about 1786 and observed foreststhick with teak (evidence of earlier disturbance) northeast of Bassein (Campbell1882).
After the defeat of the Portuguese by the Marathas, the British eventuallyestablished control by 1818. Nearby Bombay became a major center of shipconstruction for the British navy, and depletion of these forests was a matter ofstrategic concern. Hove noted that these same trees were supplying the Bombaydockyards by 1820. Colonel Jervis, the Chief Engineer at Bombay, reported to theMilitary Board on his forest survey of the North Konkan in 1843: ‘‘The hillsstretching westward from Doogaur and Vijuirabhoy (e.g. Dugad and Vajreshwari) tothe sea were formerly covered with wood, but in 1843 on their sea face, there washardly a bush to be seen; all had been cut away for the Bombay market’’ (Stebbing1922). Such concerns led to the establishment of a state forest department, andrecovery of these forests. The new limits on forest use in the Thane District led to anuprising (Tucker 1979). The descriptions of forests in the Gazetteer of 1882 paint asomewhat refurbished picture (Campbell 1882). Their exploitation continued in the20th century, first by the British before the independence, then by the MaharashtraState Forest Department. More remote locations may have been exempt fromfelling, however.
Three of the forest remnants are sites of old hill forts, Mahuli (MH), Ghotara(US) and Takmak (TA), and Kamandurg to the south of the Tungar site. These fortswere constructed in the 14–15th centuries and were active until the 18th century(Campbell 1882). At times these sites were densely populated, leading to extensivedeforestation as well as introduction of exotic species, some native to other parts ofthe subcontinent. Some of these forts, like Mahuli, were put under siege, whichwould have further damaged the vegetation. Scriptures prescribed the planting ofauspicious plants in forts (Banerjee 1980), which may explain the presence ofnaturalized exotics not observed elsewhere in valley forests. Artocarpusheterophyllus (MH) is a fruit tree probably native only to the extreme south of India.Plumeria acuminata is native to Central America, but was probably brought to Indiaby the Portuguese and planted at MH. Tamarindus indica is native to tropical Africaand was seen at US and three other sites. Vitex negundo, doubtfully native to thisarea, has medicinal and religious significance; it was planted on MH, TA and US.Exclusion of these exotics from the statistical analyses did not affect any of ourconclusions.
Conclusions
Our results suggest that a history of disturbance, accelerated during the last century,

1066
has reduced biomass, canopy height and tree density in forests throughout thevalley. The forests and soils have thus retained less of the precipitation of themonsoon and increased the effect of the post-monsoon dry season on the vegetation.More mesic species have disappeared as the effects of disturbance have accumulatedover time. Descriptions of forests in the Thane District in the 19th century includeda number of common species which are no longer present or extremely rare(Campbell 1882). These include Michelia champaca L., Artocarpus heterophyllusand Garcinia indica (DY and TU). Although all of the forest remnants preservesome diversity in the face of periodic (and presently increasing) disturbancepressures, most of the species in these remnants are tolerant of drought stress, andcoppice well in response to cutting and lopping branches.
We have arrived at these conclusions by a direct approach: assessing total woodyspecies diversity by direct observation. This is an approach normally used in studiesof vertebrate diversity (Brown and Lomolino 1998). The statistical techniquesapplicable to such data provide considerable analytical power in comparing suchareas (Honnay et al. 1999; Ranta et al. 1999). This is a straightforward approach toanalyzing biodiversity in India, but the floristic knowledge to conduct such researchhas declined in the last two decades. The difficulties in comparing and assessingbiodiversity in vegetation remnants lie in the different techniques employed. Use ofquadrats probably underestimates diversity, frequently found in small and protectedsites, and different sizes and techniques of analysis make their comparisonsproblematic. The results reported here suggest that the valley forest was richer andmore mesic in character, and has declined in biodiversity and water retentioncapacity during the past century.
Tungar Hill (TU) is remarkable among all of the sites for its semi-evergreencharacter, high species richness, and presence of numerous rare and mesic species(but partially shared with pockets of forest remnants on nearby hills: DY, TA andUS). They represent a forest flora that once was more widely distributed in theTansa Valley.
Given its proximity to Mumbai and the densely populated suburban corridor onthe Western Railway north to Virar, the continuing existence of such a rich andextensive forest is truly remarkable, and it deserves preservation.
Acknowledgements
Many people helped in the completion of this research. Drs S.M. and M.R. Almeidaprovided much encouragement and helped with plant identifications. The followingpersons provided additional technical and field assistance (villages in parenthesesindicate informants): Brahmananda, Chandu (from Usgaon), Devram (Bhiwali),Claire Elouard, Ganpat Gorule, Rawji Harpade (Usgaon), Janardan Keni, RatanKode (Usgaon), Lydia Kos, Ram Chandra Patil, Subhas Patil, B.R. Ramesh,Shantaram (Gayagota), and Stacy West. Travel to India for D.W.L. was supported bythe National Science Foundation ([INT-9712753).

1067
Appendix
Distributions and uses of woody plant species observed in the Tansa Valley. S 5
shrub, L 5 liana and T 5 tree; (0–300) indicates the range of elevations in meterswhere the taxon was found. 1 and 0 indicate presence or absence of taxa at each ofthe locations, in alphabetical order of abbreviations (see Table 1: BE, DH, DY, DZ,MA, MB, MH, MU, TA, TL, TP, TS, TT, TU, and US). Letters also indicateeconomic uses observed for the species: A 5 alcoholic beverage; B 5 bidi or panconsumption; C 5 construction (wattle, cord, thatch); D 5 dyeing or preserving; E5 fodder, green manure; F 5 edible fruit; G 5 gums or resins; H 5 householdgoods (containers, baskets, implements); M 5 medicines; O 5 oils; R 5 religious,esthetic or magical uses; V 5 non-fruit food items; W 5 timber for houseconstruction, carts or boats or tools. $ denotes if the product is regularly sold tomiddlemen or in local markets. * denotes if the plant is exotic to the area butnaturalized. [ denotes if the plant was observed in 13/15 forest remnants, and D ifobserved in 5/8 disturbance quadrats.
Acanthaceae. Acanthus ilicifolius L. S(0–5) 000000000000100; Adhatodavasica Nees M; Strobilanthes callosus Nees S(70–900) C$ 111110111100011.Anacardiaceae. [DLannea coromandelica (Houtt.) Merr. T(0–700)111111111111011; Mangifera indica L. T(40–800) F$ 101010101111010;Semecarpus anacardium L. f. T(10–300) M 000010100010010; Spondias pinnata(L. f.) Kurz T(200–620) F 111111011100011. Annonaceae. [DMiliusa tomentosa(Roxb.) J. Sincl. T(0–700) FW 111111111111011; Sageraea laurifolia (Grah.)Blatter T(120–700) 000000000000010. Apocynaceae. Anodendron paniculatum A.DC. L(200–600) 001000000000010; [DCarissa congesta Wight. S(0–850) CFM111111111111011; Cryptolepis buchanani Roem. & Schut. M; [DHolarrhenaantidysenterica (L.) Wall. T(0–450) MV 111111111111011; *Plumeria acuminataAit. T(90–110) R 000000100000000; Wrightia arborea (Dennst.) Mabb. T(20–400) 111000000110011; [DWrightia tinctoria R. Br. T(0–850) 111111111111011.Araceae. Amorphophallus campanulatus Bl. ex Decne V$; Amorphophallus com-mutatus Engl.V$. Arecaceae. Caryota urens L. T(340–500) A 000000000000010;Phoenix sylvestris Roxb. T(50–100) A 000001000000000. Bignoniaceae.Dolichandrone falcata Seem. var. lawii (Seem.) Haines T(20–400)101110010101000; [Heterophragma quadriloculare (Roxb.) K. Schum. T(0–850)MW 111111111111011; Oroxylum indicum Vent. T(20–200) M 000001011101011;DStereospermum personatum (Hassk.) D. Chatterjee T(10–600) 111111111001011;Stereospermum xylocarpum Benth. & Hook. f. T(20–600) V 111110011110011.Boraginaceae. [Cordia dichotoma Forst. f. T(0–850) F 111111111110011; Cor-dia wallichii G. Don T(20–400) 110010100100000; Ehretia laevis Roxb. T(10–300) 000000100010000. Burseraceae. [DGaruga pinnata Roxb. T(0–500) F111111111111011. Capparidaceae. Capparis zeylanica L. FM; Crateva adansoniiDC. var. odora (Buch-Ham.) Jacobs T(20–300) 000001000010010. Celastraceae.[Cassine glauca Kuntze. T(20–500) M 111111111111011; [Celastrus paniculataWilld. L(0–600) M 111111111111011; Gymnosporia konkanensis Talbot S(40–650) 000000000000010; Reissantia grahami (Wight) Ding Hou L(400–700)

1068
000000000000010; Salacia chinensis L. S(300–600) 001000000000010.Clusiaceae. Garcinia indica Choisy T(40–600) F$ 001000000000010; Mammeasuriga Kosterm. T(60–700) MW 001000001000010. Combretaceae.[DAnogeissus latifolia Wall. ex Bedd. T(20–600) MGW 111111111111011;[DCalycopteris floribunda Lam. L(0–900) 111111111111011; [Combretumovalifolium Roxb. L(0–800) 111111111111011; [DTerminalia alata D. Dietr.T(0–850) CDGMW 111111111111011; [DTerminalia bellerica Roxb. T(0–850)M 111111111111011; Terminalia chebula Retz. T(650–900) M 000000100000010.Cornaceae. Alangium salviifolium (L. f.) Wang. T(20–80) F 000000000000010.Cucurbitaceae. Momordica dioica Roxb. ex Willd. V$. Dilleniaceae. Dilleniapentagyna Roxb. T(20–600) 111000011111011. Dioscoreaceae. Dioscorea bulbi-fera L.V$; Dioscorea hispida L. R. Ebenaceae. [DDiospyros melanoxylon Roxb.T(0–800) BW 111111111111011; Diospyros montana Roxb. T(200–700)001010001000011. Euphorbiaceae. Antidesma ghaesembilla Gaertn. T(20–500)000000000010011; Aporosa lindleyana Baill. T(40–500) 000000000000010;Bridelia hamiltoniana Wall. S(0–600) 110010010000010; [DBridelia retusaSpreng. T(0–800) FM 111111111111011; Cleidion spiciflorum Merr. T(350–450)000000000000010; Drypetes roxburghii (Wall.) Hurusawa T(30–600)001010000000011; [Emblica officinalis Gaertn. T(20–800) FM111111111111011; Euphorbia neriifolia L. S(20–900) CM 111110111000011;Excoecaria agallocha L. T(0–5) 000000000000100; Glochidion hohenhackeriBedd. T(140–850) 001000101000010; Homonia riparia Lour. S(0–300)000000000000010; Macaranga peltata (Roxb.) Muell. T(40–800)001000101000011; Mallotus aureo-punctatus M. Arg. S(350–450)000000000000010; Mallotus philippensis Muell. Arg. T(20–850) DM111010111010011; Margaritaria indica Airy Shaw T(40–400) 000000000000010;Sapium insigne Trimen T(120–600) 001000010000010; [DTrewia polycarpaBenth. ex Hook. f. T(0–600) 111111111111011. Fabaceae. Abrus precatorius L.M; [DAcacia chundra Willd. T(0–600) BGW 111111111111011; Acacia nilotica(L.) Delile T(0–100) C 000000001000000; [Acacia pennata (L.) Willd. L(5–600)111111111111011; Acacia suma Buch.-Ham. T(10–100) 000001000010001; Al-bizia lebbeck Benth. T(20–450) 001000010000001; Albizia procera Benth. T(20–850) 001011111011011; Bauhinia foveolata Dalz. T(60–650) 111111111100011;Bauhinia malabarica Roxb. T(30–500) B 011001011100011; [Bauhinia racemosaLam. T(0–850) B 111111111111011; [DButea monosperma (Lam.) Kuntze T(0–850) GMH 111111111111011; Butea parviflora Roxb. ex DC L(30–800)111000110001011; [Cassia fistula L. T(0–850) M 111111111101011;[DDalbergia lanceolaria L. f. T(0–400) 111111110111011; [DDalbergialatifolia Roxb. T(0–850) W 111111111111011; Derris scandens Benth. L(20–400)M 011001000001011; Derris trifoliata Lour. L(0–5) 000000000000100; Entadapursaetha DC L(200–500) CM 000000000000010; Erythrina stricta Roxb. T(10–500) MW 011001111110011; Erythrina suberosa Roxb. T(100–400)000000000000010; Mucuna pruriens (L.) DC M$; Ougeinia oojeinensis (Roxb.)Hochr. T(50–600) M 010110111100011; Pongamia pinnata Pierre T(0–800) O001011110001011; Pterocarpus marsupium Roxb. T(20–800) M

1069
111110111110011; *Tamarindus indica L. T(10–600) F 011010100000001.Flacourtiaceae. Casearia elliptica Willd. T(40–500) 001010111000011;[DCasearia graveolens Dalz. T(0–500) 111111111111011; [DFlacourtia indicaMerrill T(0–850) F 111111111110011; Flacourtia montana Grah. T(250–700)000000000000010. Gnetaceae. Gnetum ula Brongn. L(50–550) V$001000000000010. Lauraceae. Alseodaphne semicarpifolia Nees. var. angustifoliaMeissn. T(80–700) 000000000000010; Beilschmiedia dalzelli (Meissn.) Kosterm.T(400–700) 001000000000010; Litsea glutinosa (Lour.) C.B. Robins T(40–500)000000000000010; Persea macrantha Kosterm. T(150–650) 000000000000010.Lecythidaceae. Barringtonia acutangula Gaertn. T(0–2) 000000000000100;[Careya arborea Roxb. T(10–800) M 111011111111011. Liliaceae. Gloriosasuperba L. MR. Lythraceae. [DLagerstroemia lanceolata Wall. T(20–800) VW111011111111011; Lagerstroemia parviflora Roxb. T(40–400) 000100100101000;Woodfordia fruticosa Kurz S(0–800) 111110111001011. Malpighiaceae. Hiptagebenghalensis Kurz S(100–850) 001000100000010. Malvaceae. [DBombax ceibaL. T(0–800) HM 111111111111011; Bombax insigne Wall. T(100–600)011010010000011; Erinocarpus nimmonii J. Grah. T(60–200) 001001000001001;Eriolaena candollei Wall. T(60–600) 111110011000001; Firmiana colorata R. Br.T(20–700) 011100101011011; Grewia disperma Rottler ex Spreng S(50–550)001000000000011; [Grewia tiliaefolia Vahl T(20–850) F 111111111111011;[Helicteres isora L. S(10–500) M 111111111111011; Hibiscus hirtus L. M; Kydiacalycina Roxb. T(60–650) 011000010000011; Microcos paniculata L. T(40–850)000000100000010; Sterculia guttata Roxb. T(60–650) V 111110011000011;[Sterculia urens Roxb. T(10–800) GM$ 111111111111011; Sterculia villosaRoxb. T(150–600) 011110110100011. Melastomataceae. Memecylon umbellatumBurm. f. T(250–700) 001000000000010. Meliaceae. Aglaia talbotii S. RaghavanT(150–700) 000000000000010; Chukrasia tabularis A. Juss. var. velutina KingT(250–400) 000000000000010; Toona ciliata Roemer T(150–700)000000000000010. Menispermaceae. Tinospora cordifolia (Willd.) Miers ex Hookf. & Thoms. M. Moraceae. *Artocarpus heterophyllus Lam. T(20–850) F$000000100000000; Ficus amplissima Sm. T(10–700) 001010111010010; Ficusarnottiana Miq. T(20–900) 111110111010011; Ficus benghalensis L. T(5–100)EFM 000000000110000; Ficus drupacea Thunb. var. pubescens (Roth) CornerT(40–400) 000000000000010; Ficus exasperata Vahl. T(20–500)001010001010001; Ficus gibbosa Blume T(20–500) 001000000010010; Ficusheterophylla L. f. T(5–300) 001000001000011; Ficus hispida L. f. T(10–500)111010011000011; Ficus infectoria Roxb. var. lambertiana King T(10–850)001010110000011; Ficus nervosa Heyne ex Roth. T(60–700) 000000000000010;[Ficus racemosa Roxb. T(0–850) EFHM 111111111111011; *Ficus religiosa L.T(10–100) 000000100000000; Ficus talboti King T(400–550) 001000000000001;Streblus asper Lour. T(20–250) C 000000000000010. Moringaceae. Moringaconcanensis Nimmo T(100–400) MV 000010010000000. Musaceae. Ensete super-bum Cheeseman S(100–800) HV$ 111110111010011. Myrsinaceae. Aegicerascorniculatus Blanco S(0–5) 000000000000100; Embelia tsjeriam-cottam A. DCS(0–800) 101011110001011. Myrtaceae. Syzygium cumini (L.) Skeels T(0–850)

1070
AFM$ 111000111110011; Syzygium heyneanum Wall. ex Gamble T(0–850) MF111011101101011; Syzygium sp. T(350–600) 000000000000010. Olacaceae. Olaximbricata Roxb. L(200–600) 001000001000010. Oleaceae. Jasminummalabaricum Wight S(20–850) 001000101000011; Olea dioica Roxb. T(40–700)000000000000010; Schrebera swietenioides Roxb. T(10–200) 000111000110001.Pandanaceae. Pandanus furcatus Roxb. S(500–850) 000000100000010. Poaceae:Bambusa arundinacea Willd. T(20–850) CHV 111010111001011; Dendrocalamusstrictus Nees T(5–600) CH 101011011100011. Rhamnaceae. Ventilago bombaien-sis Dalz. L(100–700) 000000000000010; Ventilago calyculata Tul. L(50–450)000000000000010; Zizyphus mauritiana Lam. T(0–600) FM 001111001111011;Zizyphus oenoplia Mill. S(10–400) M 000001000010011; Zizyphus rugosa Lam.S(20–900) F 111010111101011; Zizyphus xylopyra Hoechst. ex A. Rich. T(20–500) FM 111111011001011. Rhizophoraceae. Carallia brachiata (Lour.) Merr.T(140–800) 011010111001011. Rubiaceae. [Adina cordifolia Benth. & Hook. f.T(0–600) W 111111111111011; Canthium diccocum (Gaertn.) Merr. var. umbel-latum Santapau and Merch. T(400–700) 000000000000010; Gardenia resiniferaKorth. T(40–250) M 000000000000010; [Hymenodictyon excelsum Wall. T(20–600) 111111011111011; Hymenodictyon obovatum Wall. T(50–700)101110110000011; Ixora brachiata Roxb. T(20–800) 111010111101011;[DMeyna laxiflora Robyns T(10–850) F 111111111111011; [Mitragyna par-vifolia (Roxb.) Korth. T(0–850) 111111111111011; Morinda tinctora Roxb. T(0–400) W 111111011110011; Pavetta indica L. var. tomentosa Hook. f. S(100–800)001000101000011; Spermadictyon suaveolens Roxb. S(300–900)110110111000011; [DXeromphis spinosa (Thunb.) Keay S(0–850)111011111111011; Xeromphis uliginosa (Retz.) Mahesh. T(20–300) V001011000000011. Rutaceae. Aegle marmelos Correa ex. Roxb. T(20–300) MR100111101000000. Salvadoraceae. Salvadora persica L. T(0–5)000000000000100. Sapindaceae. Sapindus trifoliatus L. T(20–500) H$111010011000011; [Schleichera oleosa Merr. T(10–800) FW 111111111101011.Sapotaceae. [DMadhuca indica J. F. Gmelin. T(0–400) AEFOV$111111111111011; Manilkara hexandra (Roxb.) Dugard T(10–60) F$000000100000010; Mimusops elengi L. T(40–700) FR 001000000000010. Son-neratiaceae. Sonneratia apetala Buch.-Ham. T(0–5) 000000000000100. Ul-maceae. Holoptelea integrifolia Planch. T(0–600) 111111111010011; Tremaorientalis Bl. T(0–850) 000000100010010. Verbenaceae. Avicennia acutissimaStapf ex Mold. S(0–5) 000000000000100; Avicennia marina (Forssk.) Vierh. T(0–5) 000000000000100; Avicennia officinalis L. T(0–5) 000000000000100; Cal-licarpa tomentosa (L.) Murr. S(200–700) 000000000000010; Clerodendron inerme(L.) Gaertn. S(0–5) 000000000000100; Gmelina arborea Roxb. T(10–600) MW111011011110011; [DTectona grandis L. f. T(0–550) CGW 111111111111011;*Vitex negundo L. S(0–850) M 000000101000011. Zingiberaceae. Costusspeciosus L. M.
References
Almeida M.R. 1996–1998. The Flora of Maharashtra. Vols. 1 and 2. Orient Press, Mumbai, India.

1071
Ambasta S.P. (ed.) 1986. The Useful Plants of India. Publications and Information Directorate, Council ofScientific and Industrial Research, New Delhi, India.
Anonymous 1982. Maharashtra State gazetteers. Thane District. Gazetteers Department of the Govern-ment of Maharashtra, Bombay, India.
Anonymous 1998. Karjat: adivasi vaidyak parampara. Academy of Development Science, Karjat,Maharashtra, India.
The Angiosperm Phylogeny Group (APG) 1998. An ordinal classification for the families of floweringplants. Annals of the Missouri Botanical Garden 85: 531–553.
Atmar W. and Patterson B.D. 1993. The measure of order and disorder in the distribution of species infragmented habitat. Oecologia 96: 373–382.
Atmar W. and Patterson B.D. 1995. The Nestedness Temperature Calculator: A Visual Basic Program.AICS Research, Inc., University Park, New Mexico, and the Field Museum, Chicago, Illinois.
Ballal M. 2000. Felling of Trees Depletes Thane’s Forest Cover. Times of India, Bombay, India, March30.
Banerjee S.C. 1980. Flora and Fauna in Sanskrit Literature. Naya Prokash, Calcutta, India.Billore K.V. 1972. The vegetation and flora of Thana District, Maharashtra State, Ph.D. Thesis, Ujjain
University, Madhya Pradesh, India.Brown J.V. and Lomolino M.V. 1998. Biogeography. 2nd edn. Sinauer Associates, Sunderland, Massachu-
setts.Campbell J.M. 1882. Gazetteer of the Bombay Presidency. Thana, Volume XIII, Part II. Government
Central Press, Bombay, India.Champion H.G. and Seth S.K. 1968. A Revised Survey of the Forest Types of India. Manager of
Publications, Government of India, Delhi, India.Chandrashekara U.M. and Ramakrishnan P.S. 1994. Vegetation and gap dynamics of a tropical wet
evergreen forest in the Western Ghats of Kerala, India. Journal of Tropical Ecology 10: 337–354.Cook R.R. and Quinn J.F. 1998. An evaluation of randomization models for nested species subset
analysis. Oecologia 113: 584–592.Cooke T. 1904. Flora of the Presidency of Bombay, two volumes. Taylor and Francis, London.Ganesh T., Ganesan R., Soubadra Devy M., Davidar P. and Bawa K.S. 1996. Assessment of plant
biodiversity at a mid-elevation evergreen forest of Kalakad-Mundanthurai Tiger Reserve, WesternGhats, India. Current Sciences 71: 379–391.
Gaulier A., Pascal J.P. and Puyravaud J.P. 1995. Assessing vegetation changes in the dry deciduousAinurmarigudi Reserve Forest, South India. Annales Des Sciences Foresteries 52: 444–454.
Gaussen H., Legris P., Labroue L., Meher-Homji V.M. and Viart M. 1966. Notice de la feuille. Bombay´ ´Travaux de la Section Scientifique et Technique, L’Institut Francais Pondichery, Hors Serie No. 8.
Gentry A.H. 1995. Diversity and floristic composition of neotropical dry forests. In: Bullock S.H.,Mooney H.A. and Medina E. (eds), Seasonally Dry Tropical Forests. Cambridge University Press,New York, pp. 146–194.
Honnay O., Hermy M. and Coppin P. 1999. Nested plant communities in deciduous forest fragments:species relaxation or nested habitats? Oikos 84: 119–129.
Jonsson B.G. 2001. A null model for randomization tests of nestedness in species assemblages.Oecologia 127: 309–313.
Koshy K.C. and Shah G.L. 1987. A contribution to the angiosperm flora and vegetation of Mandvi andGokhirva forest ranges in Maharashtra. Journal of Economic and Taxonomic Botany 10: 79–124.
Legendre P. and Legendre P. 1998. Numerical Ecology. 2nd English edn. Elsevier, Amsterdam.Legris P. and Meher-Homji V.M. 1977. Phytogeographic outlines of the hill ranges of peninsular India.
Tropical Ecology 18: 10–24.Legris P. and Meher-Homji V.M. 1979. The Deccan trap country and its vegetation patterns. Bulletin of
the Indian Natural Sciences Academy 45: 108–126.Leuschner C. 1996. Timberline and alpine vegetation on the tropical and warm-temperate oceanic islands
of the world: elevation, structure and floristics. Vegetatio 123: 193–206.Lott E.J., Bullock S.H. and Solis-Magallanes J.A. 1987. Floristic diversity and structure of upland and
arroyo forests of Coastal Jalisco. Biotropica 19: 228–235.Mabberley D.G. 1998. The Plant Book. 2nd edn. Cambridge University Press, Cambridge, UK.Meher-Homji V.M. 1979. A biometeorological assessment of climate: case studies of Bombay and
Mercara. Indian Geographical Journal 54: 43–54.

1072
Parthasarathy N. 1999. Tree diversity and distribution in undisturbed and human-impacted sites oftropical wet evergreen forest in southern Western Ghats, India. Biodiversity and Conservation 8:1365–1381.
Parthasarathy N. and Sethi P. 1997. Tree and liana species diversity and population structure in a tropicaldry evergreen forest in south India. Tropical Ecology 38: 19–30.
Pascal J.P. 1986. Explanatory booklet on the forest map of South India. L’Institut Francais de Pondichery,´Trav. Sect. Scient. Tech., Hors Seriee no. 18.
Pascal J.P. and Pelissier R. 1996. Structure and floristic composition of a tropical evergreen forest insouthwest India. Journal of Tropical Ecology 12: 191–214.
´Pereira A.B. 1935. Os Portugueses em Bacaim. Tipografia Rangel, Bastora, Portugal.Rai S.N. 2000. Productivity of Tropical Rain Forests of Karnataka. Punarvasu Publications, Dharwad,
Karnataka, India.¨Ranta P., Tanskanen A., Niemela J. and Kurtto A. 1999. Selection of islands for conservation in the urban
archipelago of Helsinki, Finland. Conservation Biology 13: 1293–1300.Rundel P.W. and Boonpragob K. 1995. Dry forest ecosystems of Thailand. In: Bullock S.H., Mooney
H.A. and Medina E. (eds), Seasonally Dry Tropical Forests. Cambridge University Press, New York,pp. 93–123.
Santapau H. 1954. The flora of Khandala on the Western Ghats of India. Records of the Botanical Surveyof India 16: 1–396.
Santapau H. and Randeria A.J. 1970. The botanical exploration of the Krishnagiri National Park, Borivli,near Bombay. Journal of the Bombay Natural History Society 53: 185–200.
Satyanarayan Y. 1959. Ecological studies of the Elephanta Island. Travaux Sect. Scient. Tech., InstitutFrancais de Pondichery 1: 99–116.
Save K.J. 1945. The Warlis. Padma Publications, Bombay, India.Stebbing E.P. 1922. The Forests of India, Vol. 3. John Lane, London.Talbot W.A. 1894. Systematic List of the Trees, Shrubs and Woody Climbers of the Bombay Presidency.
Government Central Press, Bombay, India.Tucker R. 1979. Forest management and imperial politics: Thana District, Bombay, 1823–1887. Indian
Economic and Social History Review 16: 273–300.Whitmore T.C. 1984. Tropical Rain Forests of the Far East. Oxford University Press, Oxford, UK.