Foreign holdings of U.S. Treasuries and U.S. Treasury yields
Upload
khangminh22Category
view
0download
0
HOW STRONG ARE U.S. TEACHER UNIONS?A STATE-BY-STATE COMPARISON
BY AMBER M. WINKLER, JANIE SCULL,
& DARA ZEEHANDELAAR
FOREWORD BY CHESTER E. FINN, JR. AND MICHAEL J. PETRILLI
OCTOBER 2012

Foreword ................................................................................................................................................................4
Executive Summary ...........................................................................................................................................8
Introduction ......................................................................................................................................................... 15
Background ........................................................................................................................................................20
Part I: Evaluating Teacher Union Strength ..............................................................................................22
Methodology .............................................................................................................................................. 26
Part II: Findings ................................................................................................................................................. 32
America’s Strongest Teacher Unions ................................................................................................ 36
America’s Weakest Teacher Unions .................................................................................................... 41
Part III: Taking a Closer Look—Teacher Union Influence by Area ..................................................44
Area 1: Resources and Membership ...................................................................................................44
Area 2: Involvement in Politics ............................................................................................................ 45
Area 3: Scope of Bargaining .................................................................................................................48
Area 4: State Policies ..............................................................................................................................49
Area 5: Perceived Influence ..................................................................................................................50
Part IV: Conclusions and Takeaways ......................................................................................................... 53
Part V: State Profiles .......................................................................................................................................60
Alabama ........................................................................................................................................................ 61
Alaska ............................................................................................................................................................ 67
Arizona...........................................................................................................................................................73
Arkansas ....................................................................................................................................................... 79
California ...................................................................................................................................................... 85
Colorado ........................................................................................................................................................ 91
Connecticut ................................................................................................................................................. 97
Delaware .....................................................................................................................................................103
District of Columbia ............................................................................................................................... 109
Florida ........................................................................................................................................................... 115
Georgia ......................................................................................................................................................... 121
Hawaii ........................................................................................................................................................... 127
Idaho. ............................................................................................................................................................ 133
Illinois............................................................................................................................................................139
Indiana .........................................................................................................................................................145
Iowa ................................................................................................................................................................ 151
Kansas .......................................................................................................................................................... 157
CONTENTS

Kentucky .....................................................................................................................................................163
Louisiana .....................................................................................................................................................169
Maine ............................................................................................................................................................ 175
Maryland .......................................................................................................................................................181
Massachusetts ........................................................................................................................................... 187
Michigan ......................................................................................................................................................193
Minnesota ...................................................................................................................................................199
Mississippi ..................................................................................................................................................205
Missouri .........................................................................................................................................................211
Montana ....................................................................................................................................................... 217
Nebraska ....................................................................................................................................................223
Nevada ........................................................................................................................................................229
New Hampshire .......................................................................................................................................235
New Jersey .................................................................................................................................................241
New Mexico ...............................................................................................................................................247
New York ....................................................................................................................................................253
North Carolina ..........................................................................................................................................259
North Dakota ............................................................................................................................................265
Ohio .............................................................................................................................................................. 271
Oklahoma ................................................................................................................................................... 277
Oregon ........................................................................................................................................................283
Pennsylvania .............................................................................................................................................289
Rhode Island .............................................................................................................................................295
South Carolina ..........................................................................................................................................301
South Dakota ............................................................................................................................................307
Tennessee ...................................................................................................................................................313
Texas .............................................................................................................................................................319
Utah ..............................................................................................................................................................325
Vermont .......................................................................................................................................................331
Virginia ........................................................................................................................................................337
Washington ...............................................................................................................................................343
West Virginia ............................................................................................................................................349
Wisconsin ...................................................................................................................................................355
Wyoming .....................................................................................................................................................361
Appendix A: Detailed Methodology and Rationale ..........................................................................367
Indicators and Weighting ....................................................................................................................367
Detailed Metric and Rationale ...........................................................................................................369
Appendix B: State-Level NEA and AFT Affiliates ............................................................................. 402
Endnotes ..........................................................................................................................................................404

4 HOW STRONG ARE U.S. TEACHER UNIONS? A STATE-BY-STATE COMPARISON
Foreword
So we resolved to dig deeper, determined
to parse the differences in strength across
state-level unions in the fifty states plus the
District of Columbia.
We were delighted and appreciative when
Education Reform Now—an affiliate of
Democrats for Education Reform—agreed
to join, co-sponsor, and help fund this
endeavor.
Which turned into one of the most
challenging research projects we have ever
undertaken at the Fordham Institute.
Let us acknowledge at the outset that
it’s not a perfect study. (We offer some
thoughts as to how we and others might
approach this thorny topic in the future.)
Let us admit that its conclusions are
more nuanced, even equivocal, than we’re
accustomed to. And let us recognize that,
just as we were gathering and analyzing
reams of data, multiple factors—economic
difficulties, political shifts, court decisions,
changing policy agendas, the arrival of
many new players—conspired to produce
enormous flux in precisely the realms that
we were examining. Sometimes we found
that a mere month could render part of our
laboriously-assembled data obsolete; we
adjusted where we could, but eventually
had to cease collecting and start making
sense of our data.
In the end, we learned a ton—about
individual states, about national patterns,
Everyone knows that teacher unions matter
in education politics and policies, but it’s
hard to determine just how much they
matter—and whether they wield greater
influence in some places than in others.
There’s plenty of conventional wisdom on
this topic, mostly along the lines of, “unions
are most powerful where they represent
most teachers and least consequential
where their bargaining rights and revenues
are restricted.”
But is that really true? And even if it is, does
it oversimplify a much more complex and
nuanced situation?
Veterans of the ed-policy wars—including
our own trustee Rod Paige, who is both
a former U.S. Secretary of Education
and a former local superintendent in the
biggest district in the biggest state that
bans collective bargaining—insisted to
us that teacher unions exert influence in
many ways at many levels, not just at the
bargaining table.
This deserved deeper investigation,
particularly since union critics (many of
them also ardent education reformers)
generally assert that unions are the
greatest obstacle to needed changes in
K–12 schooling, while union defenders (and
supporters of the education status quo)
insist that these organizations are bulwarks
of professionalism and safeguards against
untested innovation.
FOREWORD

5 HOW STRONG ARE U.S. TEACHER UNIONS? A STATE-BY-STATE COMPARISON
Foreword
about unexpected relationships, and
surprising exceptions.
Here are a few highlights:
• Teacher strikes, like the one recently
concluded in Chicago, are legal in
fourteen states and illegal in thirty-
seven.
• Thirty-two states require local school
boards to bargain collectively with
their teachers, fourteen states permit
local boards to do this, and five states
prohibit collective bargaining altogether
(Georgia, North Carolina, South
Carolina, Texas, and Virginia).
• Twenty-three states are “right to
work” states, which prohibit unions
from collecting agency fees from non-
members.* Twenty-eight jurisdictions
allow agency fees.
• In the 2010 state election cycle, teacher
unions in twenty-two states were
among the top ten overall donors
(excluding individual donations) to
candidates for governor and other
executive positions, legislature, high
court, and elected education positions.
In twenty-one states, they were among
the top five highest-giving interest
groups (including Colorado and Indiana,
where they ranked first).
• In just two states (Pennsylvania and
New Jersey) did our survey of insiders
unanimously deem teacher unions
to be the most influential entities in
shaping education policy over a recent
three-year period. But informants
in twenty states found the teacher
unions to be generally more influential,
on average, than all other entities
(including the state school board, state
superintendent, governor, legislators,
business interests, and advocacy
groups).
• The unions’ influence may be waning
at the state level. For the three years
prior to the 2011 legislative session,
education policies in most states
reflected union priorities. But in 2011,
a growing number of legislatures were
enacting policies that were less in line
with union priorities.
Note that we did not link our overall
rankings to state-level student
achievement. Of all the data included in
our metric, only a few of them (like teacher
employment policies) might affect student
achievement. Others, like state spending
on education, could “touch” students
indirectly, but there’s no strong evidence to
support their link to student performance.
We also have a timing problem since
many state policies are in flux and don’t
align with point-in-time snapshots of
achievement. Plus, we know that many
other factors at both the state and local
level could impact students, so theorizing
that a relationship exists between
state-level union activity and student
achievement strikes us as short-sighted.
Still, we can’t resist eyeballing whether
policies in a few high-performing states are
more in line with the positions of reformers
or traditional unions (without pointing
fingers either way). Massachusetts, the
highest-achieving state in the land, is a
* Something else we learned: The proper definition of “right-to-work” has nothing to do with denying unions the right to bargain collectively. Right-to-work states stop unions from requiring union membership (and payment of dues or other union fees) as a condition of employment. In any state, teachers are free not to join their local union, but in non-right-to-work states the union can still charge “agency fees” to non-member teachers. In right-to-work states, unions cannot charge agency fees, only membership dues. While just five states ban collective bargaining by teachers, twenty-three are right-to-work states that prohibit agency fees.

6 HOW STRONG ARE U.S. TEACHER UNIONS? A STATE-BY-STATE COMPARISON
Foreword
mixed bag—some policies are aligned to
union goals, others not. Two other high
achievers, Virginia and Colorado, part
ways: In the Old Dominion, policies are
highly aligned to union interests, but that’s
not the case in the Centennial State. And
education policies in California, with its
dismal achievement record, largely do
not reflect union interests, while those
in Mississippi, another notorious low
performer, are more aligned to them than
nearly anywhere else.* All of that to say
that no one on either side of the ed-reform
divide should be glib about this topic.
Plenty more is waiting to be learned about
teacher unions, how to gauge their strength
in the many venues and mechanisms
by which they exert it, and their role in
education policy. View this study as adding
another powerful lens to a telescope that’s
still being assembled. But peer through that
lens and you will see a lot—including some
surprises, paradoxes, and mysteries.
ACKNOWLEDGMENTS
This big study was the product of many
hands and heads. We’re grateful to the
Bodman Foundation, the Lynde and Harry
Bradley Foundation, and Education Reform
Now for their financial support, as well as
to our sister organization, the Thomas B.
Fordham Foundation.
We extend special thanks to Mitch Price,
former legal analyst at the Center for Rein-
venting Public Education, who assisted in
data collection and report writing. Former
Education Pioneer Laurent Rigal assisted
with survey development. Project advisors
provided tremendously useful input on the
* See 2011 NAEP state averages on 4th and 8th grade reading and math assessments, available http://nces.ed.gov/nationsreportcard/naepdata/dataset.aspx
study design and on successive drafts of
this complex report. In that capacity, we’re
grateful to Emily Cohen, independent con-
sultant and former district policy director
at the National Council on Teacher Quality
(NCTQ); Jonathan Gyurko, co-founder and
senior vice president, Leeds Global Part-
ners, LLC; Michael Hartney, doctoral can-
didate in Political Science at the University
of Notre Dame and a National Academy of
Education/Spencer Foundation Dissertation
Fellow; Frederick Hess, director of educa-
tion policy studies, American Enterprise
Institute; and Van Schoales, chief executive
of A+ Denver. Needless to say—but we’ll say
it anyway—we could not incorporate every
suggestion of every advisor, so complaints
and criticisms should be addressed to the
authors, not the advisors.
Others who provided useful feedback on
the study design and/or survey instrument
include Katharine Strunk, Tim Daly, Joe
Williams, Bill Koski, Mike Antonucci, Dan
Goldhaber, Terry Moe, and Marc Porter-
Magee. Denise Roth Barber at the National
Institute on Money in State Politics was
helpful in providing and explaining the
Institute’s data on campaign contributions.
Sandi Jacobs, vice president and managing
director of NCTQ, clarified various aspects
of state teacher policies and provided her
organization’s most recent data to us; staff
at the National Alliance for Public Charter
Schools did likewise.
We also appreciate the time and care
that stakeholders in each state took to
complete our survey during summer 2011.
These included state legislators, chief state
school officers and school board members,
staff in governors’ offices, charter school

7 HOW STRONG ARE U.S. TEACHER UNIONS? A STATE-BY-STATE COMPARISON
Foreword
organizations, and education advocacy
organizations, as well as knowledgeable
journalists.
At Fordham, Matt Richmond assisted in
report writing and oversaw production.
Daniela Fairchild and Chris Irvine (former
Fordham policy and operations associate)
assisted in survey administration and Tyson
Eberhardt and Joe Portnoy managed
dissemination. Numerous Fordham interns
and others also lent their capable hands:
Amanda Olberg, Remmert Dekker, Marena
Perkins, Gerilyn Slicker, Josh Pierson, Alicia
Goldberg, Keith McNamara (TFA Fellow),
Laura Johnson, Michael Ishimoto, Layla
Bonnot, Lisa Gibes, Anthony Shaw, Kai
Filipczak, and Ben Bennett. Special thanks
to current interns Asa Spencer and Pamela
Tatz for research assistance, proofreading,
and copy editing. Shannon Last served as
copyeditor and Bittersweet Creative as
layout designer and cover illustrator.
But the heaviest of heavy lifting on this
ambitious project was done by report
authors Amber Winkler, Fordham’s vice
president for research, her recently
arrived deputy and research manager,
Dara Zeehandelaar, and Janie Scull,
former research analyst and production
manager. We bow in admiration and
gratitude to the trio.
By Chester E. Finn, Jr. and Michael J. Petrilli

8 HOW STRONG ARE U.S. TEACHER UNIONS? A STATE-BY-STATE COMPARISON
Executive Summary
In recent years, debates over school reform
have increasingly focused on the role of
teacher unions in the changing landscape
of American K–12 education. On one hand,
critics argue that these unions, using
their powerful grip on education politics
and policy to great effect, bear primary
responsibility for blocking states’ efforts
to put into place overdue reforms that will
drive major-league gains in our educational
system. Such critics contend that the
unions generally succeed at preserving
teacher job security and other interests,
and do so at the expense of improved
opportunities for kids.
On the other side, we find union
defenders who stoutly maintain that
these organizations are bulwarks of
professionalism in education, that their
power is greatly exaggerated, that their
opposition to misguided reforms is
warranted, and that they couldn’t possibly
account for achievement woes—considering
that highly unionized states perform at
least as well as any others (and better
than many) on the National Assessment
of Educational Progress (NAEP) and other
indicators.
This debate has taken on an international
aspect, too, as critics of U.S. reform
initiatives (and defenders of unions)
point out that teachers are unionized all
over the world, including nearly all the
countries that surpass us on comparative
achievement measures such as the Trends
in International Mathematics and Science
Study (TIMSS) and Programme for
International Student Assessment (PISA).
Both sides agree that, for better or worse,
teacher unions look out for teacher
interests. This study sheds light on how
they use politics to do this, by measuring
teacher union strength, state by state, more
comprehensively than any other study to
date. It sought answers to three questions:
1. What elements are potential sources of
a union’s strength (i.e., inputs)?
2. How might unions wield power in terms
of behavior and conduct (i.e., processes
and activities)?
3. What are signs that they have gotten
their way (i.e., outcomes)?
We do not limit the answers to those
questions to routinely-studied channels
of union strength such as membership
density and bargaining status, though we
do include those. We also include such
other measures as alignment between state
policies and traditional union interests,
union contributions to political campaigns,
and the impressions of union influence held
by knowledgeable participant-observers
within the states. We chose to focus on
state-level unions rather than local ones,
because the state organizations are apt to
affect education policy on a large scale.
OUR APPROACH
To gauge union strength at the state level,
we gathered and synthesized data for
EXECUTIVE SUMMARY

9 HOW STRONG ARE U.S. TEACHER UNIONS? A STATE-BY-STATE COMPARISON
Executive Summary
thirty-seven different variables across five
broad areas:
Area 1: Resources and Membership
Internal union resources (members and
revenue), plus K–12 education spending
in the state, including the portion of such
spending devoted to teacher salaries and
benefits.
Area 2: Involvement in Politics
Teacher unions’ share of financial
contributions to state candidates and
political parties, and their representation
at the Republican and Democratic national
conventions.
Area 3: Scope of Bargaining
Bargaining status (mandatory, permitted,
or prohibited), scope of bargaining, right of
unions to deduct agency fees from non-
members, and legality of teacher strikes.
Area 4: State Policies
Degree of alignment between teacher
employment rules and charter school
policies with traditional union interests.
Area 5: Perceived Influence
Results of an original survey of key
stakeholders within each state, including
how influential the unions are in comparison
to other entities in the state, whether the
positions of policymakers are aligned with
those of teacher unions, and how effective
the unions have been in stopping policies
with which they disagree.
Using these data, we rank the relative
strength of state-level teacher unions in
fifty-one jurisdictions as compared to one
another (fifty states plus Washington, D.C.).
To do this, we score the state separately on
each of the five areas and rank the states
according to those scores. We then average
the five area scores and re-rank the states
accordingly.
RANKINGS
Table ES-1 displays the overall and area
ranks of each state.
TABLE ES-1. TEACHER UNION STRENGTH BY STATE
StateOverall Rank
Area 1: Resources & Membership
Area 2: Involvement in
Politics
Area 3: Scope of
Bargaining
Area 4: State
Policies
Area 5: Perceived Influence
Alabama 20 24* 1* 45* 18* 25
Alaska 15 13* 36* 4* 21* 36
Arizona 51 40* 49 45* 49* 48
Arkansas 48 50 47* 45* 20 37
California 6 20* 18* 1 37 1
Colorado 35 37* 18* 25 48 29
Connecticut 17 9* 29* 13 13 27
Delaware 19 9* 29* 15 36 18
District of Columbia 33 17 N/A 21 49* 41
Florida 50 47* 36* 35* 46* 50
Georgia 45 35* 36* 48* 26 45

10 HOW STRONG ARE U.S. TEACHER UNIONS? A STATE-BY-STATE COMPARISON
Executive Summary
StateOverall Rank
Area 1: Resources & Membership
Area 2: Involvement in
Politics
Area 3: Scope of
Bargaining
Area 4: State
Policies
Area 5: Perceived Influence
Hawaii 1 3* 1* 9 9 23
Idaho 36 30 4* 42 45 42*
Illinois 8 18* 12 3 39 28
Indiana 31 9* 13* 39 44 32
Iowa 27 27 23* 32 11 31
Kansas 32 33* 18* 31 14 30
Kentucky 28 35* 26* 26 10 11*
Louisiana 42 40* 44* 24 33 44
Maine 22 20* 44* 16 7* 11*
Maryland 23 26 40* 20 16 4
Massachusetts 21 13* 40* 12 21* 16
Michigan 16 6* 4* 22 51 20
Minnesota 14 3* 32* 2 46* 19
Mississippi 46 49 40* 43* 7* 51
Missouri 38 33* 47* 23 40 24
Montana 3 20* 10* 6 6 5
Nebraska 26 18* 13* 37 27 38
Nevada 25 28* 18* 27 28 10
New Hampshire 30 24* 40* 14 17 40
New Jersey 7 1* 26* 17* 5 2
New Mexico 37 46 32* 35* 29 8
New York 9 1* 13* 19 24* 21
North Carolina 40 47* 29* 48* 12 11*
North Dakota 24 28* 23* 33* 2* 14
Ohio 12 20* 17 10 23 35
Oklahoma 43 44* 26* 40 43 46
Oregon 2 9* 8* 4* 34* 3
Pennsylvania 4 13* 10* 7 41 7
Rhode Island 5 6* 4* 17* 15 15
South Carolina 49 51 35 43* 38 47
South Dakota 34 40* 1* 33* 34* 49
Tennessee 41 37* 18* 38 42 42*
Texas 44 44* 36* 48* 30* 34
Utah 39 37* 25 28* 30* 39
Vermont 11 6* 44* 8 2* 22
Virginia 47 40* 50 48* 4 33
Washington 10 3* 32* 11 18* 9
West Virginia 13 31* 4* 28* 1 6
Wisconsin 18 13* 8* 41 24* 17
Wyoming 29 31* 13* 28* 30* 26
* Indicates that a state is tied with one or more other states for this rank.

11 HOW STRONG ARE U.S. TEACHER UNIONS? A STATE-BY-STATE COMPARISON
Executive Summary
TABLE ES-2. TEACHER UNION STRENGTH BY RANK AND TIER
Tier 1Strongest
Tier 2Strong
Tier 3Average
Tier 4Weak
Tier 5Weakest
STATE OVERALL RANK STATE OVERALL
RANK STATE OVERALL RANK STATE OVERALL
RANK STATE OVERALL RANK
Hawaii 1 Vermont 11 Massachusetts 21 Kansas 32 Louisiana 42
Oregon 2 Ohio 12 Maine 22District of Columbia
33 Oklahoma 43
Montana 3 West Virginia 13 Maryland 23 South Dakota 34 Texas 44
Pennsylvania 4 Minnesota 14 North Dakota 24 Colorado 35 Georgia 45
Rhode Island 5 Alaska 15 Nevada 25 Idaho 36 Mississippi 46
California 6 Michigan 16 Nebraska 26 New Mexico 37 Virginia 47
New Jersey 7 Connecticut 17 Iowa 27 Missouri 38 Arkansas 48
Illinois 8 Wisconsin 18 Kentucky 28 Utah 39 South Carolina 49
New York 9 Delaware 19 Wyoming 29 North Carolina 40 Florida 50
Washington 10 Alabama 20 New Hampshire 30 Tennessee 41 Arizona 51
Indiana 31
Note: With fifty-one total jurisdictions, each tier comprises ten except Tier 3—the middle tier—which comprises eleven.
TABLE ES-3. TEACHER UNION STRENGTH BY RANK, TIER, BARGAINING STATUS, AND AGENCY FEES
Tier 1Strongest
Tier 2Strong
Tier 3Average
Tier 4Weak
Tier 5Weakest
STATE OVERALL RANK STATE OVERALL
RANK STATE OVERALL RANK
STATE OVERALL RANK STATE OVERALL
RANK
Hawaii 1 Vermont 11 Massachusetts 21 Kansas 32 Louisiana 42
Oregon 2 Ohio 12 Maine 22District of Columbia
33 Oklahoma 43
Montana 3 West Virginia 13 Maryland 23 South Dakota 34 Texas 44
Pennsylvania 4 Minnesota 14 North Dakota 24 Colorado 35 Georgia 45
Rhode Island 5 Alaska 15 Nevada 25 Idaho 36 Mississippi 46
California 6 Michigan 16 Nebraska 26 New Mexico 37 Virginia 47
New Jersey 7 Connecticut 17 Iowa 27 Missouri 38 Arkansas 48
Illinois 8 Wisconsin 18 Kentucky 28 Utah 39 South Carolina 49
New York 9 Delaware 19 Wyoming 29 North Carolina 40 Florida 50
Washington 10 Alabama 20 New Hampshire 30 Tennessee 41 Arizona 51
Indiana 31
Note: With fifty-one total jurisdictions, each tier comprises ten except Tier 3—the middle tier—which comprises eleven.
MANDATORY BARGAINING PERMITTED BARGAINING PROHIBITED BARGAINING AGENCY FEES PROHIBITED

12 HOW STRONG ARE U.S. TEACHER UNIONS? A STATE-BY-STATE COMPARISON
Executive Summary
We divided the fifty-one jurisdictions into
five tiers, from strongest to weakest. Table
ES-2 (page 11) shows the overall rank and
tier for each state.
Many of the states whose teacher unions
rank in the strongest tier—such as
California, New Jersey, and Washington—
are widely recognized for their powerful
teacher unions. Likewise, in many of the
weakest Tier 5 states, unions have suffered
some major defeats (Louisiana and Arizona)
or do not have much of a presence at all.
To be sure, bargaining status and agency
fees help define—but not completely
determine—the rankings (see Table ES-3,
which adds these variables). Mandatory
bargaining states are shaded in tan,
permitted-bargaining states are shaded in
green, and bargaining-prohibited states
in yellow. Red text indicates that the state
does not allow agency fees.
Most of the twenty strongest states (Tiers
1 and 2) require collective bargaining. But
so does Florida (Tier 5), ranked next-to-
last. Three of the twenty-strongest—Ohio,
West Virginia, and Alabama—permit but do
not require bargaining. Most of the twenty
weakest states (Tiers 4 and 5) prohibit
agency fees (red text), but three allow this
practice (Washington, D.C., New Mexico,
and Missouri). Nor do bargaining-prohibited
states invariably land in the weakest tier;
North Carolina, for instance, is in Tier 4.
GEOGRAPHY
Figure ES-1 maps states by tier. As
is evident, there are strong regional
associations. The West Coast and the
Northeast have nearly all of the strongest
unions in the nation (shaded light orange
and red), while southern states have the
weakest (in brown).
FIGURE ES-1. MAP OF TEACHER UNION STRENGTH BY TIER

13 HOW STRONG ARE U.S. TEACHER UNIONS? A STATE-BY-STATE COMPARISON
Executive Summary
Obviously there is nothing inherent to
geography that dictates union strength.
But it is correlated with factors that do—
the history of collective bargaining, the
rhetoric of unionism, and overall political or
ideological orientation. Places where unions
have long been regarded as necessary
and valuable parts of the economy and
polity are more apt to mandate bargaining
and to allow the collection of agency
fees. Employees are also more likely
to join unions themselves in areas with
long-standing favorable attitudes toward
organized labor. And in places that are
ideologically liberal, voters are more prone
to hold favorable views of unions and to
elect Democrat leaders, who in turn tend to
be more receptive to union interests.
The states with the strongest teacher
unions (Tier 1, mapped in red) are in the
Northeast and on the West Coast. All of
these states have mandatory bargaining,
allow agency fees, and have high
membership rates. They are politically and
ideologically liberal, and unions there rank
highly in perceived influence. The Tier 2
states in light orange are mostly in the
Midwest, which is also historically (and
currently) pro-labor but politically more
moderate. These states allow agency fees,
and the unionization rate is high even
though some permit rather than mandate
bargaining. Unions there tend to be
politically active, since elections and policy
outcomes are less predictable than in the
Tier 1 states.
In contrast, the western and central states
are largely rural and politically conservative,
with little history of unionism. They
generally rank in Tiers 3 and 4 (blue and
green). Many of them bar agency fees and
have low unionization rates, even where
bargaining is mandated. But unions there,
as well as most in New England, benefit
from the value placed on local control over
restrictive state mandates. As a result, the
policy environment tends to be aligned
with union interests because there aren’t
many statewide education policies as
such. Finally, the South is home to the
Tier 5 states with the weakest unions,
mapped in brown. These jurisdictions
are both ideologically conservative and
historically anti-union. Here bargaining
is either prohibited or permitted, but not
mandatory; union membership is low, even
where bargaining is allowed; and education
policy is not aligned with union interests.
FOUR KEY TAKEAWAYS
1. Mandatory bargaining appears
to tilt the playing field in favor of
stronger unions. At the very least, it is
a sufficient (though not an essential)
condition by which unions are made
strong. Where bargaining is optional
or prohibited, unions tend to score
“weaker” on our overall metric.
2. Resources make a difference. Dollars
and members are both important. With
higher revenue, a state union can not
only better finance its lobbying and
advocacy efforts, but also increase its
capacity to support the activities of
its local affiliates. Greater membership
means more union representation at
the ballot box, more letters and calls to
state leaders, and more boots on the
ground during rallies and campaigns—
and in turn, more revenue from member
dues.
3. The scope of bargaining matters a lot,
too, as does the right (or not) to strike.
Local unions can and do use collective
bargaining to protect teacher interests,
which can (among other things)
result in iron-clad job protections for
14 HOW STRONG ARE U.S. TEACHER UNIONS? A STATE-BY-STATE COMPARISON
Executive Summary
ineffective teachers. When a wide scope
of bargaining combines with ill-defined,
timid, or absent state policies, local
unions have more room to negotiate
contracts that serve their goals. And
local bargaining isn’t the only way to
secure teachers interests; sometimes
such protections are written directly
into state law.
4. The fact that a state has mandatory,
permissive, or broad bargaining
laws—or its unions enjoy abundant
resources—does not mean that state
policies are union-favorable and vice-
versa. Many states in our top two tiers
have education policies that are not
particularly favorable to teacher unions.
Conversely, states without strong
collective bargaining rights nonetheless
have union-friendly policies. That’s
because other factors matter, too,
sometimes greatly—beginning with
state leadership (both past and
present), federal policy, the condition
of the economy, the influence of other
key stakeholders, and the state’s own
macro-politics.

15 HOW STRONG ARE U.S. TEACHER UNIONS? A STATE-BY-STATE COMPARISON
Introduction
In recent years, debates over school reform
have increasingly focused on the role of
teacher unions in the changing landscape
of American K–12 education. On one hand,
critics argue that these unions, using
their powerful grip on education politics
and policy to great effect, bear primary
responsibility for blocking states’ efforts at
reforms that would otherwise drive major-
league gains in our educational system
by preserving teacher job security at the
expense of improved opportunities for
kids.1 Their defenders maintain that teacher
unions are bulwarks of professionalism
in education, that their power is greatly
exaggerated, and that highly unionized
states perform at least as well as any
others—and better than many—on the
National Assessment of Educational
Progress (NAEP) and other indicators.2
This debate has taken on an international
aspect, too, as critics of U.S. reform
initiatives (and defenders of unions) point
out that teachers are unionized all over the
world, including in nearly all the countries
that surpass us on measures such as the
Trends in International Mathematics and
Science Study (TIMSS) and Programme for
International Student Assessment (PISA).
What to believe?
A few facts are indisputable, beginning
with the fact that teacher unions are most
definitely large and highly visible. (Consider
recent goings-on in Chicago, for example.)
Education employs more unionized staff
than does any other profession in either the
public or private sector.* Between them,
the National Education Association (NEA)
and American Federation of Teachers
(AFT) have some 4.6 million members,
a combination of active teachers and
other public school employees, college
faculty and staff, retirees, and students.3
AFT President Randi Weingarten (much
like the man who built her union, Albert
Shanker) is among the most-quoted
education commentators in the land.
Washington watchers peer closely into
the latest federal policy or proposal for
evidence of changing relations between the
Obama White House and the unions. And
their activities are not just limited to the
national level, with teacher unions receiving
widespread attention for their battle to
protect bargaining rights in Wisconsin
and Ohio, their position as political and
financial heavyweights in California, and
their dogged struggle (and strike) against
change in Chicago.
INTRODUCTION HOW STRONG ARE U.S. TEACHER UNIONS?A STATE-BY-STATE COMPARISON
* As reported by the Bureau of Labor Statistics. The BLS also reports that of the active “education, training, and library occupations” workforce, 37 percent comprise members of unions or employee associations similar to a union. A total of 41 percent of that workforce are either union members or covered by a union/association contract. BLS does not disaggregate K–12 public school teachers from its figures (see Bureau of Labor Statistics, United States Department of Labor, “Economic News Release: Union Membership 2011 (Table 3),” January 27, 2012). Further, as of 2007, 65 percent of school districts nationwide had either a collective bargaining agreement (54 percent) or meet-and-confer agreement (11 percent) (see National Center for Education Statistics, “Characteristics of Public School Districts in the United States (NCES 2009-320),” June 30, 2009).

16 HOW STRONG ARE U.S. TEACHER UNIONS? A STATE-BY-STATE COMPARISON
Introduction
Much ink is spilled over the influence that
these organizations do or do not wield
on the federal, state, and local levels.
And there’s little doubt that they do their
utmost to influence policy on behalf of their
members. In many a capital, the teacher
union office building looms large on the
streetscape within a block or two of the
statehouse. In many a city, the first question
asked of any proposed education change is
“will the teacher union be okay with it?”
Serious books have been written about
the political power of teacher unions, of
which the most prominent recent example
is by Stanford political scientist Terry Moe.4
Much of their focus is on the local collective
bargaining process and its capacity to
frustrate change (and raise costs) by
writing requirements and prohibitions
“into the contract.” Also typically meriting
chapters in such books are the effects of
contract provisions on teacher quality, the
various ways that unions engage in political
activity by running, endorsing, financing,
supporting—and opposing—candidates
for public office, and examples of clashes
between union and education leaders over
reform.
Yet while we know that unions have
multiple channels through which they
can exert strength—including but not
limited to bargaining, striking, lobbying,
and participating in political campaigns—
most research to date uses hazy or overly
narrow definitions of such “strength.” What
proportion of teachers are unionized? Is
collective bargaining mandatory, permitted,
or illegal? Can unions collect agency
fees from teachers who choose not to be
members?* It’s a good start—but it’s not
enough. Answers to these questions alone
don’t accurately reflect a union’s power;
they merely frame the context in which it
works. It is like trying to determine whether
a runner is fast by measuring his shoe size.
So when we (and our colleagues at
Education Reform Now, an affiliate of
Democrats for Education Reform) wanted
to know which teacher unions are more (or
less) influential in their respective states,
we knew we had to do better. We asked
ourselves: What data do we need to more
accurately gauge union strength? What
else, besides bargaining status, agency
fees, and the ability to strike might make a
union strong, and on what scale? (Veteran
ex-superintendents from states that don’t
mandate bargaining tend to chortle when
we ask whether their teacher unions are
less “powerful,” almost instantly replying
that “what they can’t get at the bargaining
table they get at the statehouse,” or words
to that effect.) And once we devised a
better measure of strength, how would the
unions stack up? Is it possible that in some
places they are indeed eight-hundred-
pound gorillas, but in others more like
hamsters?
We were aware going in, and are more
aware today, that “teacher union strength”
comes in many forms and can be wielded—
and measured—in many ways. (That’s
true of strength in general, of course. Ask
yourself: Who is stronger, the person who
can lift one hundred pounds while standing
still or the one who can run around
the block while carrying fifty pounds?)
Carrying out such measures in comparable,
* While states that prohibit collective bargaining are often casually referred to as “right-to-work” states, this is not a correct use of the term. “Right-to-work” specifically refers to laws that prohibit union membership as a condition of employment; under such legislation, unions cannot automatically collect “agency fees” in lieu of dues from non-members and employers need not consider whether an individual belongs to the union or not. Bargaining status and right-to-work are different, and independent, concepts. For example, Florida requires bargaining but is nevertheless a right-to-work state. Should employees wish to form a union, the district must recognize them, but that union cannot collect agency fees from teachers who choose not to join. (See sidebar, Getting the Terminology Straight.)

17 HOW STRONG ARE U.S. TEACHER UNIONS? A STATE-BY-STATE COMPARISON
Introduction
defensible ways is no small undertaking,
however. On-point and contemporary data
are extremely hard to come by and, while
we wanted opinions and impressions from
knowledgeable folks on the ground, as well
as “hard” information, it’s no simple thing
to determine whom to ask, and what to ask
them—much less to get them to respond.
So we acknowledge at the outset that
this is a pioneering study, fraught with
methodological challenges, data difficulties,
and judgment calls. We’re wary of drawing
simplistic conclusions from a large and
complex body of data and loath to slice and
dice the inter-state comparisons too finely.
(You will find, for example, that Illinois is
exactly one notch above New York in terms
of the “strength” of its teacher unions, 8th
versus 9th in the national rankings. One
would, we think, be crazy to make a huge
deal of such a difference.)
Accordingly, we are humbler than usual
in the conclusions that we distill from this
investigation. We hope that this is a start
to future work, and we look forward to
feedback and commentary from others
and for access to better and newer data
that we can use to refine future analyses.
But this research is a necessary step
toward answering the Big Questions: How
is union strength related to securing more
funding for teachers and education? To the
promulgation or obstruction of reform? To
student achievement? We can’t begin to
answer such questions with accuracy until
we have a better definition and index of
“strength.”
Nothing that we learned, however, changed
the impression with which we began: Love
‘em or hate ‘em, teacher unions must be
taken seriously by educators, reformers,
and policymakers. Such folks may decide,
whether out of expediency or earnest
conviction, to woo or placate union leaders,
to compromise with them, or to ride
roughshod over them (insofar as that’s
possible to do), but they cannot avoid
paying attention to them.
Nor should they. Public education in the
United States is an exercise in democratic
decision making. Indeed, nearly every
significant decision about the organization
and operation of American schools is
established through the political process.5
Moreover, public education in the United
States is governed by an intricate web
of overlapping institutions and decision-
making mechanisms spread over multiple
levels of a federal political system.6
Teacher unions—like other interest-based
membership organizations—use power to
try to influence decisions made within this
policy-making maze, and they, like other
stakeholders in the system, have every right
to do so. Others entering that maze must
contend with those who already inhabit
it. The more new entrants know about the
methods, strengths, and weaknesses of
existing inhabitants, the better they are apt
to fare.
ORGANIZATION
This study compares the strength of state
teacher unions via a systematic examination
of how these organizations wield power,
examining them from multiple angles,
including the obvious—such as alignment of
state policies to traditional union interests—
and some that are less obvious, such as the
perceptions of local insiders.
We start with the background research
relevant to teacher union influence; Part I
explains the five areas in which we chose
to gauge union strength and the methods
we used for doing so; Parts II and III present
the findings—first the overall state results,

18 HOW STRONG ARE U.S. TEACHER UNIONS? A STATE-BY-STATE COMPARISON
Introduction
The language surrounding organized labor is often confusing and misunderstood. We define a few essential terms below.
Employee organizations: professional associations vs. unionsAn association is simply a group of individuals united under a common interest. If these individuals have the same occupation and see their purpose as advocating for and maintaining the legitimacy of that occupation, then they are a professional association. Regardless of where they work, teachers can always form a professional association. An association is a union only if it has bargaining rights, meaning that terms and conditions of teacher employment must be negotiated between the group and the school district, should the employees wish to do so. (Most unions do use their bargaining rights, but they don’t have to.)
The vast majority of local teacher unions, and most local teacher associations, are affiliated with a larger state association. Most of these in turn are affiliated with either the National Education Association or the American Federation of Teachers.
Types of agreements: collective bargaining vs. meet-and-conferA collective bargaining agreement (CBA) is a binding contract between a union and a school district or other employing entity. The contract can contain only certain provisions, as defined by state law (or allowed by virtue of silent state law), and is open for negotiation only at certain times, typically every three years. Disputes over the contract are settled by outside arbitration. Only unions can negotiate CBAs—although some may choose not to. A meet-and-confer agreement is a non-binding memorandum of understanding between an employee organization and a district. Under its terms, a dispute must get worked out locally, and the district can override the agreement in the event of a conflict. The agreement can be discussed, and altered, at any time, and the contents are not limited to certain provisions. Both unions and associations can enter into meet-and-confer agreements.*
Bargaining status: mandatory, permitted, or prohibitedBargaining status refers to the district’s relationship to the employee organization. Three types of bargaining status are possible: In mandatory bargaining states, all employee organizations have bargaining rights. In these states, it is up to the employees if they want to organize; if they want to be a union or an association; and if they want to negotiate a CBA, enter into a meet-and-confer agreement, or work under no agreement at all. The law requires that if employees wish to organize and use their bargaining rights to negotiate a contract, the district must recognize them as a union—and bargain with them. The employer must accept the employees’ choice.
In permitted bargaining states, districts may decide to grant employee organizations bargaining rights, to enter into a meet-and-confer agreement, or not recognize the employee organization at all. In these states it is still up to employees whether to organize. If they then wish to negotiate a CBA, they must first request recognition as a union—but districts are not obligated to recognize them as such. Even if the employees seek a non-binding meet-and-confer agreement, the district is not required to grant that request. The employees must accept the district’s choice.
In prohibited bargaining states, districts may not grant bargaining rights to employee organizations. Employees may still organize, but those organizations are associations, not unions. In such states, a district may still enter into non-binding meet-and-confer agreements with the association if it wishes to; the employees must accept the employer’s choice.
GETTING THE TERMINOLOGY STRAIGHT
* For multiple and diverse examples of district CBAs, see the National Council on Teacher Quality’s Teacher Rules, Roles, and Rights (TR3) database, http://www.nctq.org/tr3/home.jsp.

19 HOW STRONG ARE U.S. TEACHER UNIONS? A STATE-BY-STATE COMPARISON
Introduction
then by each of the five areas; Part IV sets
forth the conclusions and takeaways as we
interpret them; and Part V presents the
state-level profiles. The appendices include
a full explanation of our scoring metric and
data sources, as well as the rationale for
each indicator, and a list of state-level NEA
and AFT affiliates.
Right-to-work status and agency fees vs. automatic payroll deductions of member duesRight-to-work refers to the union-employee relationship in states where unions are allowed (mandatory or permitted bargaining states). (Prohibited bargaining states are right-to-work by default, because they have no unions.) Right-to-work laws stipulate that no union can require membership as a condition for employment. They also dictate that, should employees choose not to be members (which they are free to do, in any state, at any time), the union cannot charge them involuntary agency fees in lieu of membership dues. In states where unions are allowed, right-to-work status is independent from (and often confused with) bargaining status. Bargaining status describes the district-employee organization relationship; right-to-work status describes the union-employee relationship. So a mandatory bargaining state can also be right-to-work (for example, Nevada, Iowa, Indiana, and Florida), and a permitted bargaining state does not have to be right-to-work (permitted bargaining states Missouri, Kentucky, West Virginia, Ohio, and Colorado do not have right-to-work laws).
Regardless of right-to-work status, employee organizations are allowed to charge membership dues to those teachers who want to be members. Most organizations collect these dues via automatic payroll deductions—they subtract member dues from each teacher’s paycheck. In a handful of states, employee organizations are barred by state law from doing this if those deductions (or portions thereof) are used for political purposes.
GETTING THE TERMINOLOGY STRAIGHT

20 HOW STRONG ARE U.S. TEACHER UNIONS? A STATE-BY-STATE COMPARISON
Background
SUMMARY OF RESEARCH ON
TEACHER UNION INFLUENCE
Scholars and education policy observers
acknowledge that teacher unions are active
players in education policymaking and
decision making. Historically, research has
focused on a few key questions: How do
unions influence spending on education?
How do they shape policies (and other
political processes, like elections)? And how
do they influence student achievement?
The quest for a link between union strength
and education spending—particularly
on teacher wages—has received the
most attention.* Studies have generally
concluded that districts with strong unions
pay their teachers more.7 Other work
explored the relationship between union
strength and larger policy outcomes,
like NCLB-style accountability, teacher
merit pay, per-pupil expenditures, and the
adoption of charter school laws.8
Some research has focused not on policy
outcomes but rather on the political
activity of teacher unions as they lobby
for congenial policies and work to elect
candidates that are sympathetic toward
union interests. One study found that most
legislators rank teacher unions as the most
active lobbying organization in the state
capital, while another found that school
board candidates who are endorsed by
teacher unions win 76 percent of their
elections, compared with just 31 percent
of candidates who do not receive such
endorsements.9, 10
A host of studies has looked beyond
policy to probe for an association
between teacher union strength and
student achievement outcomes. These
analyses are complicated by the fact
that teacher unions cannot be randomly
assigned to some students or districts
in the same way that a new curriculum
or instructional strategy can, and so it is
difficult to assign causal credit or blame
to teacher unions for student achievement
outcomes. While some studies have found
a generally positive correlation between the
presence of a teacher union and student
performance on standardized tests, unions
are also associated with a widening gap
between low- and high-achieving students.11
Additional studies have linked unions
with standardizing education practices
and driving additional dollars into public
education and classroom instruction.12
The majority of existing studies rely on
narrow measures of union strength, either
the legality of collective bargaining or
the percentage of teachers who belong
BACKGROUND
* It is notoriously difficult to establish a cause-and-effect relationship between union membership and teacher salaries. For example, does a high membership rate better enable a union to negotiate for higher salaries, or are high membership rates and high wages the result of some other variable, such as a union-friendly political climate? We recognize this limitation in our own report and mitigate it by not limiting our definition of union influence to one variable (teacher salaries, for example, or union-favorable policies) but rather including multiple measures of potential union strength.
21 HOW STRONG ARE U.S. TEACHER UNIONS? A STATE-BY-STATE COMPARISON
Background
to a union (also known as “unionization
density” or the “unionization rate”). Neither,
however, captures the nexus between union
power and the processes and outcomes of
policymaking. Worse, each is potentially
misleading: union density is often simply a
proxy for bargaining status (or geography
and history—some areas of the country
are simply more unionized than others).
In turn, bargaining status (which applies
at the local level) has not stopped many
state-level unions from exerting substantial
power in the capital. Given the narrow
scope of these measures, some scholars
have questioned the findings of studies that
use them to define and gauge strength,
while others have called for more robust,
inclusive measures of union influence.13
Luckily, a more recent wave of research
on union influence has heeded that call,
recognizing that existing (and limited)
approaches have yielded an incomplete and
inconclusive picture of how unions affect
policymakers, education spending, and
ultimately, students. One study measured
union strength by combining bargaining
status, union density, and union campaign
contributions and found that higher
rates of union political giving correlate
with the adoption of fewer education
reform policies.14 A handful of researchers
have quantified local union strength by
measuring how much a district’s collective
bargaining agreement constrains the
unilateral authority of its leaders; their
findings suggest that restrictive labor
agreements have a negative impact on
student achievement (the most likely cause
being a contract that limits the principal’s
authority to manage and allocate personnel
for student benefit).15
Still, a common dilemma pervades all
of these recent studies. Resolving how
teacher unions influence salaries, political
outcomes, and student achievement is
impossible without an accurate definition of
what an “influential” union actually means—
and that definition is currently lacking.
Undaunted by this challenge (others might
say naïve!), we set out to bridge this gap,
assuming up front that a single variable is
a poor proxy for union strength. We posit
that the whole is greater than the sum of
its parts, and instead combine a number
of variables—thirty-seven, to be exact—to
rank the relative strength of state teacher
unions. Some of these variables, like
bargaining status and union density, are
familiar from earlier analyses. But we’ve
added many more—some publicly available
information but also new data of our own
design. (To our knowledge, this dataset
comprises the most data points to date
relative to the assets and activities of and
perspectives on state-level unions.) In the
end, we explain what this complex data
quilt tells us. But we’re getting ahead of
ourselves. Let’s turn to an explanation of
those data next.

22 HOW STRONG ARE U.S. TEACHER UNIONS? A STATE-BY-STATE COMPARISON
Part I: Evaluating Teacher Union Strength
This study attempts to measure teacher
union strength at the state level by
answering three broad questions. First,
what elements are potential sources of
a union’s strength (i.e., inputs)? Second,
how might unions wield power in terms of
behavior and conduct (i.e., processes and
activities)? And third, what are potential
signs that they have gotten their way (i.e.,
outcomes)?
Note that we do not attempt to separate
inputs, such as membership, from
outcomes, such as blocked legislation. We
count them both. Our rationale is simple: It
is nearly impossible to draw a line between
the two. Union-friendly state education
policies, for instance, are likely viewed as
outcomes—yet they also infuse a union with
additional strength (an input), whether or
not the union had a strong hand in creating
them. More revenue received by a union
(frequently viewed as an input) may bolster
its political giving (a process) and thus
give it more allies among state leaders
(an outcome of activities, but also now a
source of union strength)—who in turn may
favor policies that help the union gather
more revenue. High membership gives a
union a broader support base from which
to fight for legislation, for example, that
might limit the growth of charter schools—
which in turn may help maintain those high
membership numbers. The sources of union
strength (inputs) and the effects of a strong
union are simply inseparable.
No single attribute of teacher unions
defines their strength. Rather, strength
results from a blend of resources,
leadership, initiative, relationships, and
earlier effectiveness. Each of these
characteristics functions on a continuum;
each affects and is affected by the others.
Nor can one assume that the balance or
mix of these characteristics is uniform
across the country. The importance of
a union’s resources or relationships, its
leadership and initiative, or its effectiveness
in open versus behind-the-scenes political
debates, is largely related to the context
in which it operates. Teacher unions in
states that allow agency fees, for example,
may be able to amass greater financial
resources than their counterparts in
other states, and direct those resources
toward campaigning openly—even
confrontationally—for politicians and/or
policies. A union without extensive revenue
may instead work on building relationships
through quiet conversations behind closed
doors—but ultimately enjoy as much
success, demonstrating equivalent power
on the outcomes side. Likewise, a teacher
union in a state where few stakeholders
introduce reform initiatives, or even criticize
the status quo, need not invest copious
time and money rebuffing challenges,
whether they have adequate resources
or not; moreover, that lack of challengers
itself may—or may not—indicate the union’s
influence. Thus, we’ve attempted in this
study to capture both visible and invisible
(some may say “hard” and “soft”) elements
PART I: EVALUATING TEACHER UNION STRENGTH

23 HOW STRONG ARE U.S. TEACHER UNIONS? A STATE-BY-STATE COMPARISON
Part I: Evaluating Teacher Union Strength
Part I: Background
In our metric, we use “teacher union” to connote state-level affiliates of either the National Education Association (NEA) or the American Federation of Teachers (AFT). In the strictest of terms, these are professional associations, not unions, since state associations do not have bargaining rights themselves—and unions do (see sidebar, Getting the Terminology Straight, page 18). That said, local affiliates often ask a representative of the state association to negotiate on its behalf or advise it as the negotiation proceeds. While conventionally state-level NEA and AFT affiliates are called “unions” (and we maintain that convention here), they are technically all professional associations or teaching federations, not unions, regardless of whether the state allows collective bargaining or not. (The only exception is the Washington Teachers’ Union in the District of Columbia, which has bargaining rights.)
We refer to district-level employee organizations as “local unions” (for those that have bargaining rights) and “local associations” (for those that do not).
Every state is home to at least one NEA or AFT state-level teacher union; thirty states have two. They are largely advocacy and political action groups, helping organize teachers and gather resources to influence state policy and protect the interests of education professionals. Additionally, they provide support, training, and resources to their local affiliates, which in turn negotiate contracts or other agreements with school district leaders. Some also offer teacher professional development, health and liability insurance, legal and financial services, discounts, travel, and retiree resources. In some states, there also exist “independent professional associations” not affiliated with either the NEA or AFT. Most of these do not engage in political activity, and some simply provide insurance, teacher professional development, or other services. We do not include data for any state-level organization not affiliated with the NEA or AFT.
A NOTE ABOUT DICTION
of strength, such as annual revenues and
how insiders view the union’s status.
Taken together, these inputs, processes,
and outcomes paint a reasonably
comprehensive picture of power. In
this report, we consider indicators of
power in five categories: Resources and
Membership, Involvement in Politics, Scope
of Bargaining, State Policies, and Perceived
Influence. Below we describe each.
Area 1: Resources and Membership
This area measures the internal resources
on which unions rely (members and
revenue), and the financial resources
dedicated to education in the state. While
size and funds do not automatically make
one union more powerful than another,
the ability to amass people—to lobby
lawmakers, volunteer in campaigns, sign
petitions, vote in elections—and to bring
in more money are, in many cases, an
indicator of influence. Thus we examine
teacher union membership and revenues
relative to all public school teachers in
the state, judging that a critical mass of
membership and high revenue per teacher
build a necessary foundation for strong
unions. We also examine K–12 education
spending, including allocations by the
state, total per-pupil expenditures, and
the percentage of spending that goes to
teacher salaries and benefits.
Area 2: Involvement in Politics
State teacher unions do not negotiate
contracts. Their local affiliates do. The
state union’s place is in the state capital,
lobbying for or against (or helping design,
alter, or dismantle) policies that run the
legislative gamut: state budgets and

24 HOW STRONG ARE U.S. TEACHER UNIONS? A STATE-BY-STATE COMPARISON
Part I: Evaluating Teacher Union Strength
expenditures, revenue streams and taxes,
pensions and benefits, public employee
and education bargaining rules, charter
school and voucher laws, and teacher
employment policies. One way that unions
work for policies aligned with their interests
is by ensuring that elected officials favor
those interests—or at least do not actively
oppose them. Political giving is a key tactic
that unions use to support candidates
who champion their priorities, eliminate
candidates who do not, and encourage
incumbent office-holders to remain true
to their campaign promises. If a significant
proportion of donations to candidates and
parties comes from teacher unions, those
unions function as key political players and
thereby possess significant sway.
This category measures the extent to
which unions are positioned to influence
policymaking, including but not limited
to K–12 schooling. The majority of data
in this category represents teacher
unions’ political contributions to state
candidates and political parties. Due to
time and resource constraints, we could
not investigate more nuanced data such as
union contributions to winning candidates
or union support of one candidate in an
effort to remove his competitor. Rather, this
category gauges giving to all candidates for
state office, regardless of political party or
election outcome. We examine giving both
to candidates and to political parties, and
we compare teacher union contributions to
contributions from other politically active
sectors and industries in the state. We also
examine the percentage of delegates to
national political conventions that were
teacher union members; those data are
another reasonable clue as to the union’s
influence on the political process.
Area 3: Scope of Bargaining
This area links union strength to state laws
directly related to collective bargaining.
Is such bargaining mandatory, permitted,
or prohibited? How broad is the scope
of that bargaining (i.e., which issues can
or must be negotiated in a collective
bargaining agreement? Which are barred
from consideration?)? And do unions have
legally protected revenue sources, like
the right to collect agency fees from non-
members, or do right-to-work laws stop
them from doing so?
Bargaining status and agency fees measure
state union strength because both affect
the resources, status, and leverage of
unions at all levels. Not only can bargaining
bring a union increased membership and
revenue from those members, it also gives
a union visibility and status. And with
high membership, a state union can more
credibly claim that it represents teachers as
a constituency, which in turn lends weight
to its lobbying and advocacy campaigns
and increases state-leader receptivity to its
efforts. Mandatory bargaining laws facilitate
(and/or signal) a strong union presence,
and with that presence unions can better
use their political muscle to influence state
policy. Agency fees allow unions to collect
revenue from all teachers, not just union
members, which in turn can be used to
fund political (and other) activities.
Many past observers have assumed that
bargaining status and agency fees were the
only important indicators of union strength,
with strong unions in mandatory bargaining
states and in places where they can collect
agency fees. (These two ideas—bargaining
status and right-to-work laws—are separate
from one another but often conflated. See
Getting the Terminology Straight, page 18.)
While limited ability to secure funds from
non-members (part of the right-to-work
definition) might weaken a union, we also
found that many teacher unions in such

25 HOW STRONG ARE U.S. TEACHER UNIONS? A STATE-BY-STATE COMPARISON
Part I: Evaluating Teacher Union Strength
states are able to amass resources and
exert authority using other channels of
influence. Likewise, we found a number of
unions in permitted-bargaining states that
ranked higher (on our overall metric) than
their counterparts in mandatory-bargaining
states. That’s because bargaining status
alone did not determine their might.
In addition to bargaining status and agency
fees, we examine the scope of bargaining,
the legality of teacher strikes, and whether
or not unions can automatically deduct
dues from the paychecks of their members.
States that limit the scope of bargaining,
prohibit strikes, and prevent automatic
payroll deductions are limiting unions’
financial resources and leverage.
Area 4: State Policies
This area measures teacher union strength
by the degree of alignment between
state education policies and certain
traditional union priorities. The indicators
examine two types of policies in which
unions have shown considerable interest:
teacher employment rules and charter
school laws. The former policies include
teacher evaluations, tenure, layoffs, class
size, pensions, and performance pay. The
latter include laws related to the number
and variety of charter schools; the ease
with which they are authorized; and
whether or not charters are exempt from
state laws (including teacher certification
requirements), district regulations, and
collective bargaining agreements.
By including these policies in our metric,
we do not assume that teacher unions
shaped them. Even if “union-preferred”
policies are not direct outcomes of
union activity, a favorable policy climate
nevertheless represents a status quo that
protects the union. For example, to the
degree that school choice is constrained
within a state, teacher unions need not
fear that district schools will lose market
share or, by extension, that teachers will
sever their union ties while working in the
charter or private school sectors. Even if
the unions did not influence the policy,
they still benefit from the status quo—and
preserving that is a lot easier than
changing it.
Note, though, that our indicators are
neutral as to the policies and reforms
themselves. In other words, rather than
measure whether a union’s support of a
certain policy or reform is “good” or “bad,”
the metric assumes that teacher unions
will take a particular stance on each of the
policies, and simply measures the extent to
which existing policies align or do not align
with that stance. Yes, it oversimplifies a bit
to assume that all teacher unions share the
same stance on a given policy. Across the
nation, a handful of teacher unions have
bucked national trends—and the National
Education Association and the American
Federation of Teachers differ somewhat
in their policy positions. But while some
state unions may take a more nuanced or
multifaceted view toward certain policies,
teacher unions do act in the interest of their
members; hence, most will react similarly to
the same policies.
Area 5: Perceived Influence
This area gauges the unions’ perceived
influence through the eyes of
knowledgeable observers in the state.
Resources may give a union leverage,
but in some states revenue and members
do not equate to influence. Campaign
contributions reflect teacher-union
behavior but do not guarantee that a union
has real sway with candidates once (and
if) they are elected. Permissive bargaining
laws give unions room to maneuver and
may yield a key source of revenue, but

26 HOW STRONG ARE U.S. TEACHER UNIONS? A STATE-BY-STATE COMPARISON
Part I: Evaluating Teacher Union Strength
they do not, in and of themselves, impact
state policy outcomes. Further, a union-
favorable policy environment may be the
result of a strong, active union, or of long-
time public allegiance to an establishment-
friendly culture—allowing labor to lay low
rather than needlessly devoting financial
or political capital to further an agenda
that’s already reasonably satisfactory. Or
vice versa: The unions are major donors
to campaigns—but the state is already
predisposed against them or their interests.
In such circumstances, a union that
gives heavily to campaigns may be more
desperate than powerful.
Given these complexities, we use data
from an original survey of key stakeholders
within each state to capture perceived
influence: How much sway do these insiders
believe the teacher unions carry in their
state and in what ways? The survey asks
whether the positions of policymakers are
aligned with those of teacher unions, how
effective the unions have been in stopping
policies with which they disagree, and how
influential the unions are in comparison
to other entities in the state, among other
areas.
Table 1 summarizes each area and indicator
examined, as well as the percentage of the
total score that each represents. We discuss
the indicators (and data sources for each)
and the weighting system broadly below,
and with much greater detail in
Appendix A.
METHODOLOGY
Designing the Metric
To develop a metric that measured
potential sources, processes, and outcomes
of union influence, we first examined
the existing research on union activity,
asking how others quantified “strength”
and measured its manifestations. We
paid special attention to researchers’
reflections on future work needed, as many
acknowledged the limitations of their
methods and offered recommendations
to others in the field. We also assembled
an expert team of study advisors (see
Acknowledgments, page 5), some of whom
are prolific researchers on the topic, and
solicited their input on recommended
measures of union strength (and the data
we might gather to measure it).
Combining research, advisor input, and
our own experience, we devised the five
general areas described above. Next we
examined potential data sources, and
divided each area into “indicators” of
strength. Each major indicator is comprised
of one or more specific “sub-indicators”
that represent individual data points. For
example, Area 4 encompasses “State
Policies”; major indicator 4.4 constitutes
“Employment Policies”; and sub-indicators
4.4.1, 4.4.2, and 4.4.3 measure the degree
to which state policies on teacher tenure,
layoffs, and dismissal, respectively, align
with traditional union interests. (More on
the weighting of indicators below.)
For the full rationale behind the inclusion of
each indicator, see Appendix A.
Data Sources
Data for this study were collected in two
ways. First, we drew extant data from both
public and proprietary sources. Sources
are listed alongside each indicator in
Appendix A, and include the National
Center for Education Statistics, the National
Institute on Money in State Politics, the
National Council on Teacher Quality, and
the National Alliance for Public Charter
Schools. These data informed indicators in
Areas 1–4.

27 HOW STRONG ARE U.S. TEACHER UNIONS? A STATE-BY-STATE COMPARISON
Part I: Evaluating Teacher Union Strength
TABLE 1: WEIGHTING OF INDICATORS AND SUB-INDICATORS
AreaMajor Indicator and % of Total Score
Sub-Indicator and % of Total Score
AREA 1: RESOURCES & MEMBERSHIP
20%
1.1: Membership 6.7% 1.1.1: What percentage of public school teachers in the state are union members? 6.7%
1.2: Revenue 6.7% 1.2.1: What is the total yearly revenue (per teacher in the state) of the state-level NEA and/or AFT affiliate(s)?
6.7%
1.3: Spending on education 6.7% 1.3.1: What percentage of state expenditures (of state general funds, state restricted funds, state bonds, and federal “pass-through” funds) is directed to K-12 education?
2.2%
1.3.2: What is the total annual per-pupil expenditure (of funds from federal, state, and local sources) in the state?
2.2%
1.3.3: What percentage of total annual per-pupil expenditures is directed to teacher salaries and benefits?
2.2%
AREA 2: INVOLVEMENTIN POLITICS
20%
2.1: Direct contributions to candidates and political parties
6.7% 2.1.1: What percentage of the total contributions to state candidates was donated by teacher unions?
3.3%
2.1.2: What percentage of the total contributions to state-level political parties was donated by teacher unions?
3.3%
2.2: Industry influence 6.7% 2.2.1: What percentage of the contributions to state candidates from the ten highest-giving sectors was donated by teacher unions?
6.7%
2.3: Status of delegates 6.7% 2.3.1: What percentage of the state’s delegates to the Democratic and Republican conventions were members of teacher unions?
6.7%
AREA 3:SCOPE OF BARGAINING
20%
3.1: Legal scope of bargaining 6.7% 3.1.1: What is the legal status of collective bargaining? 3.3%
3.1.2: How broad is the scope of collective bargaining? 3.3%
3.2: Automatic revenue streams 6.7% 3.2.1: What is the unions’ legal right to automatically collect agency fees from non-members and/or collect member dues via automatic payroll deductions?
6.7%
3.3: Right to strike 6.7% 3.3.1: What is the legal status of teacher strikes? 6.7%
AREA 4:STATE POLICIES
20%
4.1: Performance pay 2.9% 4.1.1: Does the state support performance pay for teachers? 2.9%
4.2: Retirement 2.9% 4.2.1: What is the employer versus employee contribution rate to the teacher pension system?
2.9%
4.3: Evaluations 2.9% 4.3.1: What is the maximum potential consequence for veteran teachers who receive unsatisfactory evaluation(s)?
1.4%
4.3.2: Is classroom effectiveness included in teacher evaluations? If so, how is it weighted? 1.4%
4.4: Terms of employment 2.9% 4.4.1: How long before a teacher earns tenure? Is student/teacher performance considered in tenure decisions?
1.0%
4.4.2: How are seniority and teacher performance considered in teacher layoff decisions? 1.0%
4.4.3: What percentage of the teaching workforce was dismissed due to poor performance? 1.0%
4.5: Class size 2.9% 4.5.1: Is class size restricted for grades 1-3? If so, is the restriction larger than the national average (20)?
2.9%
4.6: Charter school structural limitations
2.9% 4.6.1: Is there a cap (limit) placed on the number of charter schools that can operate in the state (or other jurisdiction) and/or on the number of students who can attend charter schools?
1.0%
4.6.2: Does the state allow a variety of charter schools: start-ups, conversions, and virtual schools?
1.0%
4.6.3: How many charter authorizing options exist? How active are those authorizers? 1.0%
4.7: Charter school exemptions 2.9% 4.7.1: Are charter schools automatically exempt from state laws, regulations, and teacher certification requirements (except those that safeguard students and fiscal accountability)?
1.4%
4.7.2: Are charter schools automatically exempt from collective bargaining agreements (CBAs)? 1.4%

28 HOW STRONG ARE U.S. TEACHER UNIONS? A STATE-BY-STATE COMPARISON
Part I: Evaluating Teacher Union Strength
AreaMajor Indicator and % of Total Score
Sub-Indicator and % of Total Score
AREA 5:PERCEIVEDINFLUENCE20%
5.1: Relative influence of teacher unions
4.0% 5.1.1: How do you rank the influence of teacher unions on education policy compared with other influential entities?
4.0%
5.2: Influence over campaigns 4.0% 5.2.1: How often do Democrat candidates need teacher union support to get elected? 2.0%
5.2.2: How often do Republican candidates need teacher union support to get elected? 2.0%
5.3: Influence over spending 4.0% 5.3.1: To what extent do you agree that, even in times of cutbacks, teacher unions are effective in protecting dollars for education?
2.0%
5.3.2: Would you say that teacher unions generally make concessions to prevent reductions in pay and benefits, or fight hard to prevent those reductions?
2.0%
5.4: Influence over policy 4.0% 5.4.1: To what extent do you agree that teacher unions ward off proposals in your state with which they disagree?
1.0%
5.4.2: How often do existing state education policies reflect teacher union priorities? 1.0%
5.4.3: To what extent were state education policies proposed by the governor during your state’s latest legislative session in line with teacher union priorities?
1.0%
5.4.4: To what extent were legislative outcomes of your state’s latest legislative session in line with teacher union priorities?
1.0%
5.5: Influence over key stakeholders
4.0% 5.5.1: How often have the priorities of state education leaders aligned with teacher union positions in the past three years?
2.0%
5.5.2: Would you say that teacher unions typically compromise with policymakers to ensure that their preferred policies are enacted, or typically need not make concessions?
2.0%
Note: Percentages may not add to 100 due to rounding
Second, to capture those unseen aspects
of influence and power, we fielded a
survey of key stakeholders in each state
in Summer 2011. These data were used to
calculate Area 5. Stakeholders were asked
only to respond for the state in which
they reside/are most knowledgeable. We
reached out to state legislators, chief
state school officers and school board
members, governors’ offices, state-
level charter-schooling organizations,
education advocacy organizations,
and education journalists in each state.
These stakeholders are not meant to be
representative of all state residents, but
rather of a targeted group of nearly six
hundred key policy movers and shakers
with direct knowledge or experience with
unions in their respective states; hence,
they hold more informed perceptions
than the general public. For each state,
data are only included for those individual
survey questions for which we received
at least three responses (“not applicable”
and “don’t know” were counted as
non-response). We acknowledge that
this threshold response rate is low; but
given that our survey targeted specific
knowledgeable stakeholders in each state
(and we asked only an average of eleven
persons per state to participate), this small
sample is not as problematic as it would
be in a large-scale survey. Further, survey
data comprise only 20 percent of our
metric—and these stakeholder responses
showed a high degree of alignment with
the indicators used to compile the other 80
percent.
Note that many of the survey questions
asked respondents to characterize teacher
union activity over the last three years or
during the most recent legislative session.
As with the state policies included in Area
4, we recognize that the education policy
sector has undergone significant change

29 HOW STRONG ARE U.S. TEACHER UNIONS? A STATE-BY-STATE COMPARISON
Part I: Evaluating Teacher Union Strength
Four points related to our methods merit special attention.
First, state ranks are reported relative to each other, not on an absolute scale. Our work is premised on the assumption that there is no objective definition of “strong” and “weak” against which unions can be compared, and creating an absolute scale requires that very definition. As such, a state’s final score is a combination of measures of potential union influence in that state. Using that score to then rank states against each other gives meaning to the raw numbers—we can say a state with a higher score has unions that are “stronger” within that state as compared to unions in a state with a lower score. Second, the education policy is dynamic, but our data are static. As a result, the rankings might lag behind current conditions. This has the potential to affect some areas more than others. Data in Area 4, State Policies, reflect teacher employment and charter policies through the end of 2011. This captures most of the policies recently enacted by states, many of which were motivated by the federal Race to the Top competition and in anticipation of applying for waivers to the No Child Left Behind Act, and some of which are consequences of the 2010 election. Similarly, our stakeholder survey (Area 5) reflects conditions at the end of summer 2011. Some data are older, however. For example, the most recent available numbers on teacher union membership are from 2009. Including multiple measures mitigates this lag, but given the rapidly changing nature of politics and policy, we realize that what was true on the day this report goes to press might not be true the day after.
Third, the indicators in Areas 3 and 4, related to bargaining, teacher employment, and charter laws, reflect what is codified in state law (and, in a handful of cases, decided by the courts). However, a state’s constitution (and its interpretation by the courts) can also have a significant (or negligible) impact on education laws in that state. We discuss this more specifically in Appendix A.
Finally, while our measures are commonsensical, they nonetheless represent an inexact science. Further, sometimes only small numerical differences separate the states. Thus, after we ranked the states, we divided them into five broad “tiers” of union strength, from strongest to weakest. We report the tier in which each state falls, along with its overall ranking, area scores, and indicator scores. The use of tiers is meant to acknowledge the imprecision of the data. As with any exploratory analyses, we invite others to tweak our metric and weighting—and update our data sources—to craft potentially more accurate and robust methods.
METHODS HOUSEKEEPING
of late, particularly given the federal Race
to the Top competition, applications for
No Child Left Behind waivers, and state
elections (in 2010 and 2011) that ushered
in many new faces, often Republicans
eager to overhaul particular policies (see
Methods Housekeeping sidebar). We asked
respondents to focus on teacher union
strength in these more recent years, rather
than historically, to capture current trends.
(This is not to say that their responses were
not shaped by their overall perspective on
union strength, apt to have been formed
over many years.) But given the pace of
change in just the last year or two, policy
over a three-year period is not as static as
one would assume. Further, recent changes
do in many ways reflect a new weakening
of teacher union influence over education
policy in some states; whether that waning
of teacher union strength will last is another
question entirely. As in any research study,
our data reflect a moment in time—and the
current national and state policy climate

30 HOW STRONG ARE U.S. TEACHER UNIONS? A STATE-BY-STATE COMPARISON
Part I: Evaluating Teacher Union Strength
made that moment more temporal than
most. That said, we note recent education
policy changes in the state profile reports—
and indicate whether our data were able to
accommodate them as of press time.
In addition to the data sources noted
above, the state profiles (Part V) include
brief essays about recent policy-related
union activity (typically occurring in 2011–
12). These narratives, which appear at the
end of each profile, serve as additional
context for the more static quantitative
data. They are informed by both online
and print media, and in a few cases we
contacted state insiders when news reports
were conflicting.
Data Analysis: Grading and Ranking
After we gathered data for each sub-
indicator described in Table 1, we graded
them on a 0 to 4 scale, much like a
traditional college GPA scale, with “0”
reflecting an attribute of a weak teacher
union and “4” representing an attribute
of a strong one. To score a sub-indicator
that used continuous quantitative data—
for example, unionization rate, per-pupil
expenditures, or union donations to
candidates—we put the states in rank order
from greatest to least and divided that
list into quintiles. The states in the highest
quintile were scored “4,” in the next-highest
“3,” in the middle “2,” near the bottom “1,”
and in the lowest quintile “0.” For example,
on sub-indicator 1.1.1: Membership, we
ordered states based on the proportion
of their teachers who are unionized. The
highest quintile—the ten states that had
the highest unionization rate—scored “4.”
The ten with the lowest unionization rate
scored “0.”*
We translated qualitative information into
categorical data by assigning a grade
from 0 to 4 to particular outcomes. For
example, sub-indicator 4.1.1: Performance
Pay was drawn from the National Council
on Teacher Quality’s 2011 State Teacher
Policy Yearbook. In response to NCTQ’s
question, “Do states support performance
pay?” a state received “0” for “performance
included in salary schedule for all teachers”;
“1” for “performance bonuses required
to be available to all teachers”; “2” for
“performance pay permitted/encouraged
by the state”; “3” for state-sponsored
performance-pay initiatives offered in
select districts”; or “4” for “does not
support performance pay.” In cases where
there were not five possible outcomes, not
all scale points were used. When no data
were available for a state, or when a given
indicator did not apply to a particular state,
scores were coded as “N/A.”†
To calculate the overall rank of each state,
we first averaged the sub-indicators within
a major indicator; then major indicators
within the same area; and finally all five
areas (with each area thus comprising
20 percent of the overall score), resulting
in a final 0 to 4 score. States were then
ranked according to their final score, and
the list was again divided into quintiles.
The ten states with the highest scores—
those closest to “4”—were those with
the strongest unions. We call these “Tier
1” states. The ten states with the lowest
scores—those closest to “0”—were those
* With fifty-one jurisdictions overall, each quintile comprises ten jurisdictions, except the quintile scored as “2”—the middle quintile—which comprises eleven.
† We did not count the absence of a charter law in the metric because doing so required us to make an assumption we knew to be false: that unions had a hand in that absence in all nine states without charter laws. For example, neither Washington State nor North Dakota is home to a charter school law. The union role in each state is markedly different: In Washington, teacher unions have fought tooth and nail against a charter law for over a decade; but in North Dakota, other realities—such as the state’s overwhelmingly rural population—are stronger impediments to a charter law than teacher unions. Because we could not assign these states’ teacher unions (and those in the other seven without charter laws) a uniform score relative to their influence on the absence of a state charter law, we graded these states as “N/A” for those particular data points.

31 HOW STRONG ARE U.S. TEACHER UNIONS? A STATE-BY-STATE COMPARISON
Part I: Evaluating Teacher Union Strength
with the weakest unions, which we term
“Tier 5.”
Before finalizing the rankings, we used the
data to conduct a preliminary evaluation
of our measure: Did including multiple
indicators truly give us a more robust
definition of union strength? Or were they
all so tightly correlated that any union
that scored highly in one area was scoring
highly in all of them? Our analysis indicated
that it was the former. Unions that ranked
highly in one area did not necessarily rank
high (or low) in the others. The highest
significant correlation (0.7) was between
Area 1: Resources and Membership and
Area 3: Scope of Bargaining. This is not
surprising, because bargaining status is
tied to membership and agency fees to
union revenue. But the other significant
correlations ranged from 0.2 to 0.5,
and some areas were not significantly
correlated at all.* This reinforced our
contention that strong unions do not
look the same everywhere and that it is
therefore important to incorporate different
measures when defining “strength.” This
is also why the five areas are weighted
equally: we could not justify any one of
them determining more of the final score
than another.
*Of the ten possible pairings among areas 1-5, only six showed significant correlations. Data available upon request.

32 HOW STRONG ARE U.S. TEACHER UNIONS? A STATE-BY-STATE COMPARISON
Part II: Findings
OVERALL RANKS
Table 2 displays the overall rank and area
scores of each state.
We divided our fifty-one jurisdictions into
five tiers, from Tier 1 (the strongest) to Tier
5 (the weakest). Table 3 shows the overall
rank and tier for each state.
Many of the states whose teacher unions
fall into our top tier—such as California,
New Jersey, and Washington—are widely
recognized for having powerful teacher
unions. But others—such as Oregon,
Montana, and Rhode Island—may come
as a surprise. Further, the rankings are
only partially aligned to bargaining
status (widely used as a proxy for union
strength). All of the Tier 1 states mandate
TABLE 2. TEACHER UNION STRENGTH BY STATE
StateOverall Rank
Area 1: Resources & Membership
Area 2: Involvement in
Politics
Area 3: Scope of
Bargaining
Area 4: State
Policies
Area 5: Perceived Influence
Alabama 20 24* 1* 45* 18* 25
Alaska 15 13* 36* 4* 21* 36
Arizona 51 40* 49 45* 49* 48
Arkansas 48 50 47* 45* 20 37
California 6 20* 18* 1 37 1
Colorado 35 37* 18* 25 48 29
Connecticut 17 9* 29* 13 13 27
Delaware 19 9* 29* 15 36 18
District of Columbia 33 17 N/A 21 49* 41
Florida 50 47* 36* 35* 46* 50
Georgia 45 35* 36* 48* 26 45
collective bargaining, but so does Florida,
which ranked next-to-last. Restrictions on
bargaining likewise do not automatically
determine that a union is weak—not all five
states that prohibit collective bargaining
are in Tier 5 (North Carolina is in Tier 4),
and bargaining is only permitted, not
mandated, in three of the twenty strongest
(Ohio, West Virginia, and Alabama).
We saw this pattern of trends and
exceptions across not just bargaining
status but every variable we examined.
This emphasizes our core assumption:
bargaining status, agency fees, and
unionization rate alone do not determine
what makes a strong union. But a few key
factors appear to have a heavy hand in how
unions operate in each state. We expand on
those factors in the text that follows.
PART II: FINDINGS

33 HOW STRONG ARE U.S. TEACHER UNIONS? A STATE-BY-STATE COMPARISON
Part II: Findings
StateOverall Rank
Area 1: Resources & Membership
Area 2: Involvement in
Politics
Area 3: Scope of
Bargaining
Area 4: State
Policies
Area 5: Perceived Influence
Hawaii 1 3* 1* 9 9 23
Idaho 36 30 4* 42 45 42*
Illinois 8 18* 12 3 39 28
Indiana 31 9* 13* 39 44 32
Iowa 27 27 23* 32 11 31
Kansas 32 33* 18* 31 14 30
Kentucky 28 35* 26* 26 10 11*
Louisiana 42 40* 44* 24 33 44
Maine 22 20* 44* 16 7* 11*
Maryland 23 26 40* 20 16 4
Massachusetts 21 13* 40* 12 21* 16
Michigan 16 6* 4* 22 51 20
Minnesota 14 3* 32* 2 46* 19
Mississippi 46 49 40* 43* 7* 51
Missouri 38 33* 47* 23 40 24
Montana 3 20* 10* 6 6 5
Nebraska 26 18* 13* 37 27 38
Nevada 25 28* 18* 27 28 10
New Hampshire 30 24* 40* 14 17 40
New Jersey 7 1* 26* 17* 5 2
New Mexico 37 46 32* 35* 29 8
New York 9 1* 13* 19 24* 21
North Carolina 40 47* 29* 48* 12 11*
North Dakota 24 28* 23* 33* 2* 14
Ohio 12 20* 17 10 23 35
Oklahoma 43 44* 26* 40 43 46
Oregon 2 9* 8* 4* 34* 3
Pennsylvania 4 13* 10* 7 41 7
Rhode Island 5 6* 4* 17* 15 15
South Carolina 49 51 35 43* 38 47
South Dakota 34 40* 1* 33* 34* 49
Tennessee 41 37* 18* 38 42 42*
Texas 44 44* 36* 48* 30* 34
Utah 39 37* 25 28* 30* 39
Vermont 11 6* 44* 8 2* 22
Virginia 47 40* 50 48* 4 33
Washington 10 3* 32* 11 18* 9
West Virginia 13 31* 4* 28* 1 6
Wisconsin 18 13* 8* 41 24* 17
Wyoming 29 31* 13* 28* 30* 26
* Indicates that a state is tied with one or more other states for this rank.

34 HOW STRONG ARE U.S. TEACHER UNIONS? A STATE-BY-STATE COMPARISON
Part II: Findings
TABLE 3. TEACHER UNION STRENGTH BY RANK AND TIER
Tier 1Strongest
Tier 2Strong
Tier 3Average
Tier 4Weak
Tier 5Weakest
STATE OVERALL RANK STATE OVERALL
RANK STATE OVERALL RANK STATE OVERALL
RANK STATE OVERALL RANK
Hawaii 1 Vermont 11 Massachusetts 21 Kansas 32 Louisiana 42
Oregon 2 Ohio 12 Maine 22District of Columbia
33 Oklahoma 43
Montana 3 West Virginia 13 Maryland 23 South Dakota 34 Texas 44
Pennsylvania 4 Minnesota 14 North Dakota 24 Colorado 35 Georgia 45
Rhode Island 5 Alaska 15 Nevada 25 Idaho 36 Mississippi 46
California 6 Michigan 16 Nebraska 26 New Mexico 37 Virginia 47
New Jersey 7 Connecticut 17 Iowa 27 Missouri 38 Arkansas 48
Illinois 8 Wisconsin 18 Kentucky 28 Utah 39 South Carolina 49
New York 9 Delaware 19 Wyoming 29 North Carolina 40 Florida 50
Washington 10 Alabama 20 New Hampshire 30 Tennessee 41 Arizona 51
Indiana 31
Note: With fifty-one total jurisdictions, each tier comprises ten except Tier 3—the middle tier—which comprises eleven.
FIGURE 1. MAP OF TEACHER UNION STRENGTH BY TIER

35 HOW STRONG ARE U.S. TEACHER UNIONS? A STATE-BY-STATE COMPARISON
Part II: Findings
Figure 1 maps each state’s overall rank by
shaded tiers. As shown, there are strong
regional trends. The West Coast and the
Northeast have nearly all of the strongest
unions in the nation (shaded red and light
orange), while southern states have the
weakest (in brown).
What might be the cause of these trends?
There is nothing inherent to geography
that dictates union strength, whether we’re
talking about teaching or other lines of
work. But geography is correlated with
factors that do: the history of collective
bargaining, the rhetoric of unionism, and
overall political or ideological orientation.
Places where unions have long been
regarded as necessary and valuable parts
of the economy will mandate bargaining,
and allow unions to collect agency fees
to do their work. The scope of bargaining
will be wide, because at some point state
leaders believed unions should have
leeway to negotiate with their employers.
Workers are more likely to be unionized if
organized labor is part of the state culture,
and as a result the unionization rate will
be high. Places where the rhetoric and
public opinion surrounding unionism is
favorable are more likely to trust and value
union positions rather than challenge them;
these values in turn are reflected in state
policies. And in places that are ideologically
more liberal, voters are more apt to hold
favorable views toward unions and to elect
Democrat leaders, who in turn tend to be
more receptive to the interests of organized
labor.
These factors are highly aligned with
geography. Organized labor in America
began with workers in the factories of the
Northeast and the railroads of the West,
and soon spread to manufacturing in the
Midwest. (Compare the economies of
these areas to the agrarian economy of
the South, which did not have corporatist
structures that facilitated organizing and
employee participation.) These same areas
tend to have long-standing favorable views
toward organized labor as a necessary
means to protect workers’ rights. They are
also the parts of the country that in recent
years have been lumped together as “blue
states.” The opposite is true in the South
and central parts of the United States—the
“red states.” Employers rejected organized
labor in the South and in the rural central
states there was not much need for it.
Neither history nor rhetoric nor ideology
favors unions in these parts of the country.
Given this alignment of geography with
factors that contribute to union strength in
general, the correlation between location
and our rankings shown in Figure 1 is
not surprising. The Tier 1 states with the
strongest teacher unions, mapped in red,
are in the West and Northeast—areas with
a history of organized labor, pro-union
sentiment, and a liberal ideology. All of
these states have mandatory bargaining
and allow agency fees, and all ranked highly
in Area 5 (Perceived Influence). The Tier
2 states in light orange are mostly in the
Midwest, which is also historically (and
currently) pro-labor but generally more
moderate politically. These states also allow
agency fees and, while some permit rather
than mandate bargaining, the unionization
rate is high regardless. Further, unions
tend to be politically active there (Area
2), where political and policy outcomes
are somewhat less predictable than in the
Tier 1 states. The Tier 3 and Tier 4 states
(blue and green) in the West and central
parts of the country are largely rural, with
little history of unionism, and often fairly
conservative in ideology. As such, most
of these states prohibit agency fees and
have low membership rates, even where
bargaining is mandated. On the other hand,

36 HOW STRONG ARE U.S. TEACHER UNIONS? A STATE-BY-STATE COMPARISON
Part II: Findings
in many such states local control is valued
over restrictive state mandates, and as a
result we see the policy environment (Area
4) aligned with union interests because
there aren’t many statewide education
policies as such. Finally, the Tier 5 states
with the weakest unions, mapped in brown,
are in the South, where states are both
ideologically conservative and historically
anti-union. In these states, bargaining is
either permitted or prohibited, membership
is very low even in states where bargaining
is allowed, and education policy is not
aligned with union interests.
In the pages that follow, we present the
overall strongest and weakest of the
bunch. Then we examine the strength of
state unions by each of the five major
areas that we analyzed: Resources and
Membership, Involvement in Politics, Scope
of Bargaining, State Policies, and Perceived
Influence.
AMERICA’S STRONGEST TEACHER UNIONS
Table 4 lists the ten states with the
strongest teacher unions according to our
analysis, both the state’s overall rank and
its rank within each of the five areas of our
metric. As the table shows, even states with
Tier 1 teacher unions vary widely across
those areas. Hawaii’s teacher unions, for
example, can claim the greatest political
involvement among the top ten states
(though Hawaii is tied in that category
with Alabama and South Dakota, which
fall into Tiers 2 and 4, respectively); New
Jersey and New York boast the most
significant membership and resources; and
California is home to the broadest scope
of bargaining and the strongest perceived
influence.
What do these strong teacher unions have
in common?*
* It is not surprising that “top” states do well on the indicators that we chose to include, but there is no expectation that they will share commonalities. Sometimes they did (for instance, relative to high membership, high revenue, and strong reputation) and sometimes they did not (e.g., mixed policy environments).
TABLE 4. TIER 1 (STRONGEST) TEACHER UNIONS
StateOverall Rank
Area 1: Resources & Membership
Area 2: Involvement in
Politics
Area 3: Scope of
Bargaining
Area 4: State
Policies
Area 5: Perceived Influence
Hawaii 1 3* 1* 9 9 23
Oregon 2 9* 8* 4* 34* 3
Montana 3 20* 10* 6 6 5
Pennsylvania 4 13* 10* 7 41 7
Rhode Island 5 6* 4* 17* 15 15
California 6 20* 18* 1 37 1
New Jersey 7 1* 26* 17* 5 2
Illinois 8 18* 12 3 39 28
New York 9 1* 13* 19 24* 21
Washington 10 3* 32* 11 18* 9
* Indicates that a state is tied with one or more other states for this rank

37 HOW STRONG ARE U.S. TEACHER UNIONS? A STATE-BY-STATE COMPARISON
Part II: Findings
The ability to amass people and money,
and maneuver within wide legal rights
It’s unlikely that a teacher union would
have much clout if it lacked a strong base
in at least one of the following: money,
members, or strong collective bargaining
rights. Table 4 shows this to be true. Every
state that falls into the top tier can claim
teacher unions with strong resources
and membership (Area 1); none of these
states ranks below 20th in this area. In
New Jersey and New York, for example,
nearly all teachers are unionized (97.1 and
Hawaii (Tier 1), Montana (Tier 1), and Alabama (Tier 2) are seeming outliers. Although Hawaii is now politically liberal, organized labor could not gain a foothold in the state until the 1950s (despite decades of trying). Yet it has some of the most permissive bargaining laws and union-favored education policies in the nation, and the state union has more resources—and is more politically active—than nearly anywhere else. Montana is a politically conservative, rural state surrounded by others in the midst of enacting anti-teacher-union legislation by the fistful—yet it mandates collective bargaining, gives it a wide scope, and allows agency fees. Unions are highly active in politics there, and state policies are highly aligned to union interests. Alabama prohibits agency fees and is firmly in the anti-labor, socially conservative south, yet its union is the most politically active in the nation, has one of the highest unionization rates in the permitted bargaining states, and generates a significant amount of revenue per teacher. What might explain the high ranking for these states?
Hawaii has only one school district, Alabama only 133. Having fewer local affiliates may allow an otherwise weak state union to direct more of its resources up to the statehouse instead of down to the districts, to mobilize its members more efficiently, and to present a unified front.
Hawaii and Montana unified early. The “unification date” is when local unions were required to affiliate with, and pay dues to, the state and national association. The three strongest state unions in this report—Hawaii, Oregon, and Montana—were among the first three NEA affiliates to unify, doing so between 1944 and 1946. Early unification gives state unions time to build infrastructure, develop leaders, amass resources, gain allies, and establish a position within the political culture.
Alabama is socially conservative but politically liberal. While Alabama voters have supported Republican presidential candidates for 50 years, the Alabama legislature was dominated by Democrats for more than a century (2010 marked the first time in 136 years that Republicans were the majority in both houses). This, coupled with the Alabama Education Association’s position as a storied cultural institution, led to a number of labor-friendly policies in what is generally perceived to be a “red” state.*
THREE SURPRISING HEAVYWEIGHTS
98.4 percent, respectively). No other state
spends more of its K–12 dollars on teacher
salaries and benefits than New York, at
63.5 percent; and New Jersey’s unions
collect the third-highest yearly revenue
per teacher, at $935.62. Washington State,
meanwhile, claims both the tenth-largest
yearly revenue per teacher ($633.59) and
the tenth-largest proportion of its state
budget spent on K–12 education (24.3
percent).
*Of course, there are exceptions to the exceptions. Florida and Louisiana (Tier 5) have fewer than eighty districts each. Idaho (Tier 4) and Arizona (Tier 5) unified early too. Mississippi (Tier 5) is also socially conservative but politically liberal. We explore these, and other apparent contradictions, in the individual state reports in Section V.

38 HOW STRONG ARE U.S. TEACHER UNIONS? A STATE-BY-STATE COMPARISON
Part II: Findings
Similarly, every state with teacher unions
in the top tier has permissive bargaining
laws (Area 3). Once again, none of these
states ranks below 20th on this indicator.
All ten are mandatory bargaining states and
allow unions to collect agency fees, a key
source of union revenue. California, which
ranks first overall in this area, ranks second
in terms of the number of items that fall
within the scope of negotiations: wages,
hours, transfers, layoffs, evaluations, fringe
benefits, leave, class size, and class load
are all mandatory subjects of bargaining
(along with others). The state also allows
teachers to strike. Illinois, Oregon, Montana,
Pennsylvania, and Hawaii are also among
the top ten most permissive bargaining
states.
A state’s scope of bargaining is likely
both an input and an outcome of union
strength. The ability to bargain and collect
agency fees is an input that confers greater
resources and leverage to local unions. This
is passed along to the state organizations,
which in return infuse their local affiliates
with additional strength by which to
expand bargaining rights—or to use the
other tools in their toolkit more effectively.
(See Part II: Evaluating Teacher Union
Strength.)
A strong perception of influence
among insiders
All of the states whose teacher unions
fall into the strongest tier score relatively
high in terms of perceived influence
(Area 5). Six are perceived to be among
the ten strongest in the nation, and only
one (Illinois) falls below 25th in this area.
With a strong foundation in people and
dollars (Area 1), unions maintain a visible
presence in the state; and even if they
are not always successful in advocating
for policies they favor, they are routinely
at the table (or very close by). In eight of
the Tier 1 states, for example, stakeholders
unanimously agreed that teacher unions
had fought hard to prevent any reductions
in pay and benefits during the recent
period of budgetary constraint, rather than
conceding that reductions were inevitable.
(Only in Illinois and Rhode Island did some
stakeholders indicate otherwise.)
This does not necessarily demonstrate that
the unions were successful, but another
set of survey responses suggests that
Tier 1 unions do have a voice in the policy
design process, even if they could not
prevent policies from being introduced. We
asked stakeholders whether the education
policies proposed by the governor in the
last legislative session were in line with
union priorities, and also whether the
outcomes of that session were in line
with union priorities. The answers to both
questions were mixed. In Montana and
Washington, the proposed policies were
fairly in line with union priorities, while in
Pennsylvania, New Jersey, and New York
they were not. In Oregon and Illinois, the
legislative outcomes aligned with union
goals. But one thing most Tier 1 states had
in common is that the legislative outcomes
were more in line with union priorities
than were the policies initially proposed.
This was the case in Hawaii, California,
New Jersey, Illinois, and New York. New
Jersey stakeholders reported the biggest
difference that we found anywhere (see
New Jersey state profile for more), and the
change in all five of those states was larger
than the national average. In Washington,
there was no change between the
proposed and enacted policies.
Further, when we asked stakeholders to
select and rank the five most influential
entities in education policy in their state,
the national average put the teacher
unions third. No Tier 1 state fell below that

39 HOW STRONG ARE U.S. TEACHER UNIONS? A STATE-BY-STATE COMPARISON
Part II: Findings
average, and all but Hawaii ranked their
unions as one of the top two major players
in education policy. So while unions might
not be successful everywhere—and in many
places, they were not—they still serve as
visible and active authorities in the thick of
policy debates.
A mixed state policy environment
Despite these perceptions of union
influence, however, many of the states
in the top tier have policies that are not
particularly favorable to those unions
(Area 4). Only three—Hawaii, Montana and
New Jersey—rank in the top quintile in
this area and four rank in the bottom half
nationally. We learn from this that abundant
resources, permissive bargaining laws, and
a strong reputation do not necessarily yield
a favorable state policy environment. For
example, Pennsylvania’s teacher unions
are strong in every other area, ranking
among the fifteen strongest on resources
and membership, political activity, scope
of bargaining, and perceived influence. Yet
the state is 41st for its policy environment:
It has in place many charter laws that
teacher unions typically oppose. Similarly,
Illinois’s teacher unions, which enjoy
permissive bargaining laws and a relatively
high level of political involvement, reside
in a state with several policies that unions
typically spurn: student achievement must
be the preponderant criterion in teacher
evaluations, some evidence of student
learning is considered in tenure decisions,
and districts must consider performance
when determining layoffs.*
A mixed level of political activity
The strongest teacher unions also vary
in their generosity to political campaigns
(Area 2). Some, such as those in Illinois
and Oregon, contribute a great deal, with 3
percent or more of all contributions to state
candidates coming from teacher unions.
But others, such as those in New Jersey
and California, donate less than 1 percent
of all contributions to state candidates.
This does not mean that the unions are
not major players—in California, between
2003 and 2010, they donated $7.3 million
dollars to candidates, the second-most in
the nation (Illinois was first at $17.2 million).
But in California, the total donations to
candidates exceeded $1 billion, meaning
that the union’s dollars made up a very thin
slice (just 0.7 percent) of that enormous
pie. Compare California’s Area 2 rank of
18th to Hawaii (1st), Rhode Island (4th),
and Montana (10th), all of which gave less
than $650,000 to candidates (in Montana,
only $42,000). In those states, candidates
simply do not receive that much campaign
money, which gives the union dollars
relatively greater heft. Perhaps the most
impressive entry on this list is Illinois, where
elections are among the most expensive in
the nation ($474 million, third-most after
California and Texas) and unions donated
$17.2 million of that to state candidates—a
percentage ranking them 1st on that
particular sub-indicator.
It may seem paradoxical that state teacher
unions could be perceived as influential
without proving successful—or even
participating—in the state policy realm.
* Note that two Tier 1 states—Montana and Washington—do not have charter legislation at all and thus received “N/A” on those indicators. They, along with the seven other states without such laws (Alabama, Kentucky, Nebraska, North Dakota, South Dakota, Vermont, and West Virginia) may see a slight bump in their scores since fewer indicators comprise their total score for Area 4. A plausible argument can be made that the absence of a charter school law is itself evidence of strong unions that have successfully deterred charter legislation. Washington State is an example of this. Yet it is also true that charter schools have simply been a non-issue in some states. The Center for Education Reform, for instance, reports that West Virginia has been “silent” about charter schools and “even the state’s teacher union recognized the need for alternatives.” And South Dakota “has not heard much discussion of charter schools…so a debate on [them] would be new.” (See “The Final Ten: How The States Without Charter Schools Can Make It To The Goal Line,” the Center for Education Reform, February 1, 2007, http://www.theparentsnetwork.org/_upload/CER_FinalTenCharterStates.pdf). For these reasons (and others detailed in Appendix A), we deemed “N/A” the appropriate mark for non-charter states.

40 HOW STRONG ARE U.S. TEACHER UNIONS? A STATE-BY-STATE COMPARISON
Part II: Findings
But keep in mind that state-level education
policy is just one arena where unions
can exert strength; equally, if not more
important to them, are their local affiliates’
capacity to affect district rules through
involvement in school board elections,
collective bargaining agreements, and such
collective actions as rallies, marches, and
lobby campaigns to pressure a district’s
board or superintendent. Unfortunately,
measuring local union activity exceeded
this project’s scope (see Appendix A)—
and a lot of what state unions do is train
their local affiliates on bargaining and
organizing, and advocate on their behalf.
Further, we’re more mindful than ever that
that influence and strength do not always
get manifested in public. Often what
happens behind the scenes can be more
consequential. We’re also aware that the
absence of visible activity or influence can
itself be an illustration of strong influence.
In some places, the unions have been so
influential for so long that they do not face
challenges to their power; thus, they need
not fork over sizeable contributions to
parties or candidates in order to preserve
a favorable status quo. This is most
prevalent in states that have consistently
had Democratic leadership, although we
saw it elsewhere as well (see state profiles,
Part V). Similarly, unions that enjoy wide
collective bargaining rights already may not
need to engage in state politics, inasmuch
as their local affiliates can protect teacher
interests at the district level instead.
We’re mindful, too, that it’s impossible
to tally everything that active unions
do, even when they do it publicly. Some
activities simply cannot be quantified.
Unions encourage their members to write
letters and make phone calls to legislators
in support of (or opposition to) certain
policies. They have “lobby days” where
union leaders and members meet with state
lawmakers, or rally at the state capitol—and
will often provide transportation so that
their numbers are large. During elections,
state unions organize their members to
volunteer for campaigns, walking precincts
and staffing phone banks. Union members
and their families represent a sizeable block
of voters themselves. But our analyses in
Area 2 also taught us a frustrating lesson—
campaign finance law simply does not
allow us to track every dollar that unions
spend on politics. We can track their
reported donations to candidates and
political parties. But we can’t account for
what they spend on behalf of a candidate
(or against another candidate)—for
example, in advertising and mail campaigns,
on member mobilization, or on general
advocacy and lobbying.
Yet, while some unions see favorable
policies but don’t visibly participate much
in politics, others engage intensely, though
state policies are not in their favor. Perhaps
their activities are an indication of their
attempts to reverse existing policies. Or
perhaps they are spending sizable sums not
in support of a candidate who will embrace
their interests, but simply to defeat one
whom they know will act against those
interests.*
* Likely, it is a bit of both. The New York Times recently reported that nationwide, union donations to Republican candidates have doubled since the 2010 election cycle (see Motoko Rich, “Seeking Allies, Teachers’ Unions Court G.O.P., Too,” New York Times, September 24, 2012, http://www.nytimes.com/2012/09/25/us/politics/challenged-by-old-allies-teachers-unions-court-gop.html). In our state reports, we found evidence for this as well.

41 HOW STRONG ARE U.S. TEACHER UNIONS? A STATE-BY-STATE COMPARISON
Part II: Findings
AMERICA’S WEAKEST TEACHER UNIONS
Table 5 lists the ten states with the weakest
teacher unions, again showing each state’s
rank on every one of the five areas in
our metric. As before, no single measure
dictates the overall ranking of a state’s
teacher unions: South Carolina claims the
least amount of resources; Mississippi
the frailest perception of influence; and
Georgia, Texas, and Virginia tie for the least
permissive bargaining laws.
Still, we can see several patterns—pretty
much the converse of those discussed
above—across the ten states.
Limited people and resources, and
restricted legal rights
Not surprisingly, these unions have
restricted legal rights. Few would expect
unions in states that prohibit collective
bargaining to amass as many people and
dollars as their counterparts in union-
friendly states, and here we see that
teacher unions that rank among the
weakest overall tend to have the fewest
members and thinnest resources. Six of the
ten states in Tier 5 are among the bottom
ten in unionization rates and the other four
fall in the bottom twenty. South Carolina
has the lowest membership rate—just 26.9
percent of the state’s teachers are union
members.* The Palmetto State union also
collects the least revenue per teacher in the
state—just $51.75 annually, versus a high of
$1,370.77 in Alaska. Together, this lack of
human and financial resources amounts to
feeble power for the state’s teacher unions.
Table 6 groups states by bargaining
status, and shows this to be the case: nine
of the ten Tier 5 states either permit or
prohibit—rather than require—collective
bargaining. (Only Florida mandates it.)
Further, all ten states in Tier 5 prohibit
TABLE 5. TIER 5 (WEAKEST) TEACHER UNIONS
StateOverall Rank
Area 1: Resources & Membership
Area 2: Involvement in
Politics
Area 3: Scope of
Bargaining
Area 4: State
Policies
Area 5: Perceived Influence
Louisiana 42 40* 44* 24 33 44
Oklahoma 43 44* 26* 40 43 46
Texas 44 44* 36* 48* 30* 34
Georgia 45 35* 36* 48* 26 45
Mississippi 46 49 40* 43* 7 51
Virginia 47 40* 50 48* 4 33
Arkansas 48 50 47* 45* 20 37
South Carolina 49 51 35 43* 38 47
Florida 50 47* 36* 35* 46* 50
Arizona 51 40* 49 45* 49 48
* Indicates that a state is tied with one or more other states for this rank
* Even if bargaining is prohibited, recall that teachers are always free to form a local professional association, and to affiliate with the state-level union. And teachers may also join the state association directly if their district does not have an employee organization. So while prohibiting bargaining does not render it impossible for a state to have a high unionization rate, it certainly makes it substantially more difficult for a state union to amass (and subsequently unify and mobilize) members.

42 HOW STRONG ARE U.S. TEACHER UNIONS? A STATE-BY-STATE COMPARISON
Part II: Findings
the automatic collection of agency fees.*
These states are indicated in red. While this
study demonstrates that many factors can
affect—or reflect—the overall influence of a
teacher union, residing in a state that allows
unions to collect funds from non-members
bodes well for that influence.
The perception of weak influence
With limited ability to collect resources
and members, and restricted bargaining
rights, it comes as no surprise that the
weakest teacher unions carry little weight
in the eyes of observers. Seven of the Tier
5 unions rank in the bottom ten states in
perceived influence (Area 5). Stakeholders
in all of these states routinely report that
other entities—such as school boards,
governors, and business roundtables—
are more influential in shaping education
policy. Many note that their state’s teacher
unions, particularly those in Mississippi,
are not effective in protecting dollars
for education, nor are they effective in
* While states that prohibit collective bargaining are often casually referred to as “right-to-work” states, this is not a correct use of the term. “Right-to-work” specifically refers to laws prohibiting union membership as a condition of employment; under such legislation, unions cannot automatically collect “agency fees” in lieu of dues from non-members. Bargaining status and right-to-work are different, and independent, concepts. For example, Florida both requires bargaining and is a right-to-work state. Should employees wish to form a union, the district must recognize and bargain with that union, but that union cannot collect agency fees from teachers who choose not to join. Note, too, that barring agency fees is not the same as prohibiting automatic payroll deductions of members’ dues; in the latter case, unions cannot automatically deduct dues from the paychecks of their own members. (See sidebar, Getting the Terminology Straight.)
TABLE 6. BARGAINING STATUS, AGENCY FEES, AND OVERALL RANKING
Bargaining Mandatory Bargaining Permitted Bargaining Prohibited
STATE OVERALL RANK STATE OVERALL RANK STATE OVERALL RANK STATE OVERALL RANK
Hawaii 1 Delaware 19 Ohio 12 North Carolina 40
Oregon 2 Massachusetts 21 West Virginia 13 Texas 44
Montana 3 Maine 22 Alabama 20 Georgia 45
Pennsylvania 4 Maryland 23 Kentucky 28 Virginia 47
Rhode Island 5 North Dakota 24 Wyoming 29 South Carolina 49
California 6 Nevada 25 Colorado 35
New Jersey 7 Nebraska 26 Idaho 36
Illinois 8 Iowa 27 Missouri 38
New York 9 New Hampshire 30 Utah 39
Washington 10 Indiana 31 Louisiana 42
Vermont 11 Kansas 32 Oklahoma 43
Minnesota 14District of Columbia
33 Mississippi 46
Alaska 15 South Dakota 34 Arkansas 48
Michigan 16 New Mexico 37 Arizona 51
Connecticut 17 Tennessee 41
Wisconsin 18 Florida 50
Bold red type indicates right-to-work states, which prohibit the automatic collection of agency fees.

43 HOW STRONG ARE U.S. TEACHER UNIONS? A STATE-BY-STATE COMPARISON
Part II: Findings
warding off education proposals with which
they disagree—particularly in Arizona,
Florida, and Louisiana. Stakeholders likely
perceive this weakness for a number of
reasons: little financial involvement in
elections (unions in Mississippi, Arkansas,
and South Carolina do not give much to
campaigns even though elections are
relatively inexpensive); an active union
donating heavily but facing competition
(unions in Florida, Texas, Georgia, and
Virginia all donate a lot of money, but
so do many other organizations); strong
Republican governors (Jeb Bush in Florida,
Bobby Jindal in Louisiana, and Jan Brewer
in Arizona); and Republican legislative
majorities (all but Arkansas and Virginia).
A mixed state policy environment
As with the strongest teacher unions,
the weakest unions are not necessarily
found in states with the most union-
unfavorable policy environments. Two
of them—Mississippi and Virginia—are
indeed in states with extremely union-
friendly policies.* In both places, teacher
evaluations need not include student
achievement data; evaluations need not
inform dismissal policies; and tenure is
conferred virtually automatically (after
three years in Virginia, and after just one
year in Mississippi).
But other teacher unions in Tier 5 inhabit
states with policies that don’t align
nearly so well with traditional union
interests. In Oklahoma and Florida,
student achievement must serve as
the preponderant criterion in teacher
evaluations; evidence of student learning
must be the major consideration in tenure
decisions; and administrators must consider
performance in determining layoffs. Further,
* Observers in Virginia, for instance, tell us that the state constitution is interpreted as granting control over all education issues to local school boards; thus the legislature is constrained when it comes to changing existing establishment-friendly policies. See Virginia state profile for more.
Oklahoma dismisses teachers at a higher
rate due to poor performance than nearly
every other state—3.7 percent annually,
compared to Arkansas, which dismisses
just 0.2 percent. The policy paradoxes
we discussed above apply in these states
as well.

44 HOW STRONG ARE U.S. TEACHER UNIONS? A STATE-BY-STATE COMPARISON
Part III: Taking a Closer Look— Teacher Union Influence by Area
As we’ve already seen, teacher union
influence varies greatly across the
dimensions that we examined. Strong
unions are not strong in the same ways, and
weak unions are not necessarily weak on all
fronts. This variation underscores the fact
that teacher unions are rarely uniform in
how they derive influence—and where they
direct it. They also differ in their goals and
the extent to which they strive to shape
policy in public (and quantifiable) ways. In
this section, we take a closer look at the
teacher unions that ranked strong and weak
in each of our five areas.
AREA 1: RESOURCES AND MEMBERSHIP
This area measures the internal resources
on which unions rely (members and
revenue), and the financial resources
dedicated to education in the state. While
size and funds do not automatically make
one union more powerful than another, the
ability to amass people and money is, in
many cases, an indicator of influence. Thus
we examine teacher union membership
in each state (relative to all public school
teachers) and revenues of each state-
level teacher union, judging that a critical
mass of membership and high revenue per
teacher build a necessary foundation for
strong unions. Though we have no way of
knowing whether high spending in a state
is the direct result of union influence, it is
nonetheless a source of union strength,
because unions—and the teachers they
represent—certainly benefit from it. Thus
we also examine K–12 education spending,
by the state and by the districts in the state,
and the percentage of that spending that
goes toward teacher salaries and benefits.
Table 7 shows the strongest and weakest
states in this area.
The strongest unions in this area uniformly
boast high membership densities—all
five rank in the top ten nationally on
this single indicator, with the lowest—
Minnesota—ranking 9th, with 95.7 percent
of its teachers unionized. They also bring
in substantial revenues per teacher in the
state—all rank in the top twenty nationally
here, with New Jersey collecting $935.62
per teacher (3rd-highest), and New York
pulling in $536.38 per teacher (20th).
(Compare that to Alaska with the highest
revenue, $1370.77 per teacher, and South
Carolina with the lowest, $51.75.)
These states also boast high overall
spending on education. Most see either
high spending on education writ large or a
large proportion of per-pupil expenditures
going toward salaries and benefits. Few
states, however, spend copious dollars on
education and direct a large proportion of
those funds toward salaries and benefits.
For example, New Jersey only directs
52.5 percent of K–12 spending toward
teacher salaries and budgets (just eleven
jurisdictions direct less), yet overall K–12
spending in the Garden State is large:
PART III: TAKING A CLOSER LOOK–TEACHER UNION INFLUENCE BY AREA

45 HOW STRONG ARE U.S. TEACHER UNIONS? A STATE-BY-STATE COMPARISON
Part III: Taking a Closer Look— Teacher Union Influence by Area
$15,116 per pupil (6th-highest).* On the
other hand, Minnesota directs a high
percentage of its K–12 expenditures to
teacher salaries and benefits (59.4 percent;
3rd), but disburses less money per pupil
($11,472; 24th). New York is noteworthy
because annual per-pupil expenditures
total $15,863 (5th) and a high percentage
of those generous expenditures goes to
teacher salaries and benefits (63.5 percent;
1st).
Conversely, the weakest unions in this area
report thin membership and low revenues
per teacher. As previously noted, South
Carolina posts the smallest figures for
both. Even Florida, which posts the highest
figures on these measures among the
bottom five states, has a unionization rate
of just 55.8 percent and annual revenues
of only $181.56 per teacher. Still, there are
a few surprises in this area. A substantial
percentage of K–12 expenditures in North
Carolina go to teacher salaries and benefits
(58.5 percent; 4th). In real dollars, however,
that does not amount to much, considering
that the Tarheel State spends just $9,024.13
annually per pupil (44th). Florida ranks in
the middle, rather than at the bottom, in
terms of state spending on education (20.1
percent of state expenditures; 22nd). And
Arkansas falls in the middle when it comes
to per-pupil expenditures, with $10,756.66
(30th).
AREA 2: INVOLVEMENT IN POLITICS
This category measures ways in which a
state union might influence laws, policies,
and budgets. Because many forms of
influence are impossible to quantify and
compare, most of the data in this category
represent the unions’ financial donations
to candidates and political parties (their
share of total contributions, and how they
stack up against other sectors like police
and firefighter unions, farm bureaus, and
major oil and gas producers). And we tally
how many delegates to the Democratic
and Republican National Conventions were
themselves teacher union members.
Two methodological notes warrant
mention—the first regarding what
we counted and the second what we
compared—because our report of unions’
share of financial contributions is apt to
strike the reader as low. First, for the years
examined, we combine direct contributions
from any national, state, or local teacher
union (and the political action committees
TABLE 7. RESOURCES AND MEMBERSHIP
Strongest Unions
Area 1 Rank Overall Rank Weakest Unions Area 1 Rank Overall Rank
New Jersey 1 7 Florida 47 50
New York 1 9 North Carolina 47 40
Hawaii 3 1 Mississippi 49 46
Minnesota 3 14 Arkansas 50 48
Washington 3 10 South Carolina 51 49
*States like New Jersey that do not spend large fractions of their K–12 funds on teacher salaries and benefits tend to spend more money on support services—including administration, operations and management, and instructional staff support—than other states.

46 HOW STRONG ARE U.S. TEACHER UNIONS? A STATE-BY-STATE COMPARISON
Part III: Taking a Closer Look— Teacher Union Influence by Area
connected to those unions) to candidates
or parties in a particular state. This is not
to say that unions did not spend money
in other ways. However, campaign finance
law does not require unions to tabulate
every dollar they spend on politics and how
it was spent. Reporting requirements are
even more lax for corporations, so the only
way to calculate unions’ share of political
spending is by comparing donations to
candidates and political parties. We cannot
report or compare spending on behalf of
candidates (on advertising, for example, or
electioneering communications), spending
on member communications (meaning
unions advertise to their own members,
encouraging them to vote), and support
not quantifiable by a dollar amount (such
as providing volunteers to walk precincts
or make telephone calls). For the same
reasons, we must also omit union spending
on lobbying and general advocacy.* Further,
while we were able to link union-connected
political action committees (PACs) with
their associated union, we could not do so
for single-issue/ideologically-oriented PACs
that were only union-supported; these non-
connected PACs donate to candidates (or
again, spend on their behalf) but we cannot
tabulate those dollars.†
Second, when we compared union
contributions with total donations to
candidates and parties, the “total”
amount included both inside and outside
money. “Inside money” for candidates are
those funds provided by the candidate
himself, donations from individuals to the
candidate’s political action committee
(PAC), and contributions from political
parties. “Outside money” refers to
donations from external PACs, lobbyists,
interest groups, and (depending on
state election laws) labor unions and
corporations. Between 2003 and 2010,
inclusive, candidates for state office
raised over $8 billion, with about 36
percent originating from “outside
money” (from state to state, outside
money ranged anywhere from 5 to 60
percent of candidates’ total finances).‡
Likewise, political parties are funded by
“inside money”—in this case, donations
to parties’ PACs from individuals—and
“outside money” (see above). Between
2003 and 2010, parties raised $1.6 billion,
nearly equally divided between inside and
outside sources. Because inside money
is such a large share of campaign funds,
when we divide union contributions to
candidates/parties by total dollars amassed
by candidates/parties, the union’s share
(and that of any outside donor) will seem
disproportionately small. For further details,
see Appendix A.
Table 8 shows the strongest and weakest
teacher unions in this area.
The seven unions that rank strongest in
this area vary greatly. Alabama is the only
one with teacher unions that donate large
proportions to both political candidates
and parties: they supplied 2.8 percent of all
contributions to candidates (4th) and 9.7
percent of all contributions to parties (1st).
* A recent Wall Street Journal report found that donations and lobbying activities account for a small share of union political spending compared with union expenditures on member mobilization and advocacy. Even the AFT agreed, arguing that since its mission is organizing and activism, it will naturally spend significant amounts on these activities. Thus, the percentages we report here are extremely conservative representations of what unions actually spend on politics. For more information, see Appendix A, Area 2; Tom McGinty and Brody Mullins, “Political Spending by Unions Far Exceeds Direct Donations,” Wall Street Journal, July 10, 2012; and Jeff Hauser, “Wall Street Journal Compares Union Political Spending to Corporate Donations,” AFL-CIO, July 10 2012.
† Contributions are self-reported by donors. Most union-affiliated PACs (meaning the PAC is simply the political arm of the union) report that affiliation on their donor forms, and we include donations from these PACs with those of their related union. But unions are free to support any PAC they choose, and campaign finance law and the record-keeping that aligns with it do not permit us to track the way that those donations eventually make their way to candidates.
‡ Data provided to authors by staff at the National Institute on Money in State Politics, 2011.

47 HOW STRONG ARE U.S. TEACHER UNIONS? A STATE-BY-STATE COMPARISON
Part III: Taking a Closer Look— Teacher Union Influence by Area
(Compare this to Maine’s teacher unions,
which contributed just 0.02 percent of total
contributions to state-office candidates,
and Alaska’s, which contributed no money
at all to state political parties—both ranked
in last place in those respective categories.)
Most teacher unions targeted either
political candidates or parties. For example,
Hawaii’s unions gave the 9th-largest
percentage to candidates (1.5 percent) but
the 26th-largest percentage to parties (1
percent); conversely, Michigan’s teacher
unions gave 0.9 percent to candidates
(18th) but 4.2 percent to parties (3rd).
The strongest state teacher unions all
gave significant amounts to candidates
vis-a-vis the highest-giving outside
sources (grouped by economic sector) in
their states, although their percentages
varied. Teacher union contributions in
Hawaii equaled 15.4 percent of the total
contributed by the ten highest-giving
sectors (7th), highest among the top states
in Area 2. (Compare this to teacher union
contributions in Colorado, which equaled
25.8 percent (1st); and to those in Maine,
which only equaled 0.03 percent, the
smallest.) It bears repeating, however, that
strong unions sometimes have the luxury of
not spending money on politics.
The strongest unions in this area also
sent lots of delegates to the national
conventions. In Rhode Island, a full 33.3
percent of delegates were members of
teacher unions (compare this to Kentucky,
in which no delegates identified as teacher
union members). Among the seven strong
teacher unions in Area 2, only West Virginia
fell below the top ten for this particular
measure. (It ranked 19th with 15.2 percent
of its delegates identifying as teacher union
members.)
Teacher unions ranking weakest in this
category were not necessarily uninvolved
in politics—sometimes they faced
competition. This was the case in Virginia,
where the union did give a substantial
amount of money, but total campaign
spending from all sources was high as well.
Other unions faced a similar situation—
expensive elections—and chose not to
give much (Louisiana, Missouri, Arkansas).
Then, there were those that stayed out of
the game all together—unions in Vermont,
Maine, and Arizona did not give much,
TABLE 8. INVOLVEMENT IN POLITICS
Strongest Unions
Area 2 Rank Overall Rank Weakest Unions Area 2 Rank Overall Rank
Hawaii 1 1 Vermont 44 11
Alabama 1 20 Maine 44 22
South Dakota 1 34 Louisiana 44 42
Michigan 4 16 Missouri 47 38
Rhode Island 4 5 Arkansas 47 48
Idaho 4 36 Arizona 49 51
West Virginia 4 13 Virginia 50 47
Note: Due to ties in the ranking, more than five teacher unions are represented among both the top and bottom five teacher unions.

48 HOW STRONG ARE U.S. TEACHER UNIONS? A STATE-BY-STATE COMPARISON
Part III: Taking a Closer Look— Teacher Union Influence by Area
even though elections in their respective
states were not particularly expensive.
Regardless of the context, however,
donations from these unions amounted to
a very small share of both total money and
contributions from the sectors representing
the ten highest-giving outside sources;
nearly all of the weak teacher unions ranked
in the bottom quintile in both of these
categories.*
AREA 3: SCOPE OF BARGAINING
Here we examine bargaining status
(mandatory, permitted, or prohibited);
the scope of subjects that can (or must)
be addressed through bargaining; the
union’s legal right to collect agency fees
automatically and/or to collect member
dues via automatic payroll deductions;
and the legality of teacher strikes. Table 9
shows the strongest and weakest states in
this area.
The teacher unions that rank among
the strongest in this area all reside—
unsurprisingly—in states that require
collective bargaining, permit agency fees
to be collected automatically, and allow
teachers to strike. Where they differ is in
the range of items that can be negotiated
under local collective bargaining.
California’s unions enjoy the second-
broadest scope of bargaining in the nation.
Of the twenty-one items that we examined,
eleven must be bargained in the Golden
State: wages, hours, terms and conditions
of employment, grievance procedures,
transfers, layoffs, evaluations, fringe
benefits, leave, class load, and class size.
(Nevada had the broadest scope, requiring
fourteen.†) The remaining ten items may
also be bargained, at the discretion of
the districts. None of the provisions we
examined is explicitly excluded from
negotiations. Minnesota, with the next
broadest scope, mandates that seven
TABLE 9. SCOPE OF BARGAINING
Strongest Unions
Area 3 Rank Overall Rank Weakest Unions Area 3 Rank Overall Rank
California 1 6 Alabama 45 20
Minnesota 2 14 Arkansas 45 48
Illinois 3 8 Arizona 45 51
Oregon 4 2 North Carolina 48 40
Alaska 4 15 Georgia 48 45
Texas 48 44
Virginia 48 47
Note: Due to a tie in the ranking, more than five states are represented among the bottom five teacher unions shown above.
*A few did, however, contribute above-average proportions to political parties: Teacher unions in Maine, Louisiana, and Arizona gave 1.14 percent (23rd-largest), 1.09 percent (24th-largest), and 0.95 percent (25th-largest) of all party contributions, respectively. These teacher unions also varied in their representation at national party conventions, from those in Missouri, which comprised 12.1 percent of delegates (31st-largest), to Vermont, which only comprised 5.0 percent (47th-largest).
† While Nevada allows its teacher unions the broadest scope of bargaining in the nation, it does not rank among the top five states in this category because it prohibits its unions from automatically collecting agency fees, and also prohibits teacher strikes.

49 HOW STRONG ARE U.S. TEACHER UNIONS? A STATE-BY-STATE COMPARISON
Part III: Taking a Closer Look— Teacher Union Influence by Area
items be negotiated through collective
bargaining, explicitly permits two, and does
not address the remaining twelve (implicitly
allowing their inclusion in the scope of
bargaining as well).
The four weakest unions in this area—North
Carolina, Georgia, Texas, and Virginia—all
prohibit collective bargaining, agency fees,
and teacher strikes. Alabama, Arkansas, and
Arizona—tied for second-to-last place—
do not address collective bargaining in
education in state law. Districts, then, may
decide whether to negotiate with employee
organizations, and what may be bargained.
These three states do, however, prohibit
agency fees.*
AREA 4: STATE POLICIES
This area gauges the extent of alignment
between state-level education policies and
traditional union interests. The indicators
address policy issues largely considered to
be important to unions, including teacher
employment policies (performance pay,
retirement benefits, evaluations, tenure, and
dismissal), class size, and charter school
policies (limits on the number and variety
of charters, the range of authorizers, and
collective bargaining exemptions from state
laws, district policies, and local collective
bargaining agreements).† Where state
policies align with traditional teacher
union interests, we rank those unions as
strong; where policies are not aligned, they
are rated weaker. (See Appendix A for
rationale.)
Table 10 shows the strongest and weakest
states in this area.
The strongest teacher unions in Area 4
reside in states with teacher policies that
align well with traditional union interests.
Teacher employment policies in West
Virginia, North Dakota, and Vermont are
very much in line with union priorities.
In all three, the state does not support
performance pay; does not require that
TABLE 10. STATE POLICIES
Strongest Unions
Area 4 Rank Overall Rank Weakest Unions Area 4 Rank Overall Rank
West Virginia 1 13 Minnesota 46 14
North Dakota 2 24 Florida 46 50
Vermont 2 21 Colorado 48 35
Virginia 4 47 District of Columbia 49 33
New Jersey 5 7 Arizona 49 51
Michigan 51 16
Note: Due to a tie in the ranking, more than five states are represented among the bottom five teacher unions shown above.
* The degree to which bargaining occurs in bargaining-permitted states varies greatly. As of 2008, no Alabama districts were covered by a collective bargaining agreement, while 43.5 percent had meet-and-confer agreements (and 56.5 percent had no agreement at all). In Arkansas, 1.5 percent of districts had a CBA, 9.7 percent a meet-and-confer agreement, and 88.7 percent no agreement. And in Arizona, 0.4 percent had a CBA, 14.4 percent a meet-and-confer agreement, and 85.2 percent no agreement. Compare these with other bargaining-permitted states such as Ohio, where 75.5 percent of districts have CBAs. See National Center for Education Statistics, Schools and Staffing Survey (SASS), 2007-08.
† States without charter school laws are coded as “N/A” for those data points and thus have fewer indicators in this area. See Appendix A.

50 HOW STRONG ARE U.S. TEACHER UNIONS? A STATE-BY-STATE COMPARISON
Part III: Taking a Closer Look— Teacher Union Influence by Area
student achievement data factor into
teacher evaluations; and does not require
tenure or layoff decisions to weigh teacher
effectiveness. North Dakota grants tenure
after only two years, West Virginia and
Vermont after three (the national norm).
In all three states, there is no mandate that
ineffective teachers be immediately eligible
for dismissal. In North Dakota and Vermont,
the state articulates no consequences for
unsatisfactory evaluations, and in West
Virginia such teachers must be put on
an improvement plan first. All three also
have K–3 class size restrictions (whereas
twenty-four states do not), and none of
the three has a charter school law. West
Virginia has the further distinction of having
employers that contribute more, relative
to teachers, to employee pensions than
every other state save Louisiana. In 2011,
West Virginia employers were responsible
for contributing to teacher pensions at
a rate of 29.2 percent of salary (35.4
percent including social security), while
the employee only contributed at a rate of
6.0 percent (12.2 percent including social
security).
Virginia and New Jersey do have charter
laws, but they drastically limit the
expansion and autonomy of the charter
sector. In New Jersey, only the state
commissioner of education can authorize
charters, while local districts cannot. And
in Virginia, both the local district and the
state board of education must approve
charter applications—the fact that the
Old Dominion is home to just four charter
schools is evidence of this constraint.
Both states limit charter autonomy as
well: charters fall under all state laws and
district regulations, including those which
require full teacher certification, and cannot
apply for exemptions. Further, in Virginia,
all charters fall under their authorizing
district’s collective bargaining agreement,
and in New Jersey only charter start-
ups are exempt (conversion schools are
not). Both states also have union-favored
teacher employment laws nearly identical
to those in West Virginia, North Dakota, and
Vermont.
Weak teacher unions in Area 4 are found
in states where employment law does not
offer blanket job security for teachers
(that is, without consideration of their
performance), and in states where charter
law promotes the expansion and autonomy
of the sector. In Florida and Michigan,
the state requires that performance be
factored into teacher pay; that student
achievement be the preponderant criterion
in evaluations; and that districts consider
teacher performance when making layoff
decisions. In Arizona, employees are
required to contribute to their pension
plans at a higher rate than employers
(through 2011, just four other states did
likewise). Further, Idaho and Minnesota
both dismiss relatively high proportions
of teachers due to poor performance
relative to other states—3.5 and 3.7
percent annually, respectively. Finally,
four of these five states have no class size
restrictions (Florida does), four permit
the widest variety of charter-school types
(all but Michigan), and all five exempt
charter schools from collective bargaining
agreements.
AREA 5: PERCEIVED INFLUENCE
To capture the “invisible” side of
teacher union strength, we surveyed key
stakeholders in each state. We had them
rank a number of influential entities in their
state, teacher unions included, and asked
them the degree to which unions affected
policy (both education and financial),
influenced elections, and had allies in the

51 HOW STRONG ARE U.S. TEACHER UNIONS? A STATE-BY-STATE COMPARISON
Part III: Taking a Closer Look— Teacher Union Influence by Area
capital. We also asked whether existing
policies, policies recently proposed by the
governor, and policies recently enacted
by the legislature, aligned with their state
union’s priorities.
Table 11 shows the strongest and weakest
states in this area.
It is not surprising that California and New
Jersey top the list; both states’ teacher
unions are famous for the extent of their
political and policy influence. Four of the
five strongest state unions (not Maryland)
are also in the top ten strongest overall.
According to stakeholders, in all five of
these states teacher unions are either the
most or second-most influential entities
on education policies (more so than
other key players such as superintendent
associations, school boards, and
governors). Unions in all five states fought
hard to prevent cuts in pay and benefits
during the recent period of budgetary
constraint. And respondents in all five
states agreed that the unions generally
succeeded in preventing or minimizing
cuts. In most of these states, the union
benefitted from allies inside government:
Respondents in every state but New
Jersey indicated that the priorities of state
education leaders tend to align with the
positions held by teacher unions. And for
every state but Montana, respondents
noted that, more often than not, their
unions need not compromise to ensure
that their preferred policies are enacted at
the state level. Finally, respondents in all
five states agreed that Democrats often
need teacher union support to get elected;
in Maryland and Montana, Republicans
sometimes do, too.
One thing the top-five states have in
common is that Democrats tend to be in
charge. In California, Maryland, and Oregon,
that party has a majority in the legislature
and also controls the governorship.
Montana has a Republican legislature
and a Democrat governor, and in New
Jersey it is the reverse. But this does not
guarantee that the top-five unions in Area
5 have a strong command over recent
education policies—which may reflect
a wave of challenges to teacher union
authority initiated by Race to the Top
competitions and No Child Left Behind
waiver applications. Stakeholders noted
that existing policies in all five states
largely aligned with union priorities. But
stakeholders also said that the policies
proposed by governors during the latest
legislative session were less aligned with
union priorities than the existing ones. New
Jersey stood out among the five; there,
stakeholders reported that education
policies proposed by Governor Christie
were not at all in line with the priorities
TABLE 11. PERCEIVED INFLUENCE
Strongest Unions
Area 5 Rank Overall Rank Weakest Unions Area 5 Rank Overall Rank
California 1 6 South Carolina 47 49
New Jersey 2 7 Arizona 48 51
Oregon 3 2 South Dakota 49 34
Maryland 4 23 Florida 50 50
Montana 5 3 Mississippi 51 46

52 HOW STRONG ARE U.S. TEACHER UNIONS? A STATE-BY-STATE COMPARISON
Part III: Taking a Closer Look— Teacher Union Influence by Area
held by teacher unions, although existing
policies often were. Yet respondents went
on to indicate that the outcome or fate
of those proposals after legislative action
were mostly in line with union priorities in
that state.
For those teacher unions with the weakest
perceived influence, respondents uniformly
rank the unions as the fourth- or fifth-
most influential entity in the state when it
came to education policy. In these states,
neither proposals nor outcomes of the
recent legislative session were in line with
union priorities, nor were existing policies.
In some states, however, this was not from
lack of trying. South Dakota tied for first on
its involvement in politics (Area 2), Arizona
unions have been fighting tooth and nail
against a spate of anti-union legislation
(see Arizona’s state profile, page 72), and
stakeholders in Florida, Mississippi, and
South Dakota noted that their unions have
struggled forcefully to prevent cuts in
teacher pay and benefits. Respondents in
Florida and Arizona agreed that Democrats
in their states need union support to get
elected, but those states, as well as the
other three, have Republican governors and
legislative majorities.

53 HOW STRONG ARE U.S. TEACHER UNIONS? A STATE-BY-STATE COMPARISON
Part IV: Conclusions and Takeaways
PART IV: CONCLUSIONS AND TAKEAWAYS
We conducted this analysis during a period
of change, even turmoil, in education
policies and politics. The Race to the Top
(RTTT) competition, the advent of NCLB
waivers, state elections (in 2010 and 2011)
that ushered in Republican candidates
eager to overhaul particular policies, anti-
union sentiment—all of these drove reform
in many of the states, even in jurisdictions
(such as California and Michigan) where
unions have traditionally enjoyed safe
shelter. The arrival on the scene of pro-
reform Democrats (most visibly in the
form of Democrats for Education Reform
and its many state-level affiliates, as well
as Secretary of Education Arne Duncan’s
spirited leadership of federal policy in
this realm) has half-erased the old truism
that Democrats can be counted upon to
do the unions’ bidding. In response to
these and other changes in the political
landscape, the unions are compromising,
trading, sometimes conceding on things
that they wouldn’t have before. For them,
these are uncertain and unpredictable
times, particularly in the face of epochal
reforms such as the universalizing of
school choice, the demand for results-
based accountability, and the widening
use of student achievement in teacher
evaluations. In many cases, the unions
cannot stop such developments, so instead
they are mobilizing to shape (some might
say weaken) them. We found this kind of
behavior in many places, including New
Jersey, Arkansas, Minnesota, Nevada, and
Kentucky.
Labor policy itself has also undergone
massive change in the past few years.
Wisconsin is the most visible case in point
here, but other states have had similar
battles. In Ohio, for example, voters
repealed S.B. 5 in November 2011 after
vigorous union campaigning against the
bill. It would have prohibited public-sector
strikes, eliminated binding arbitration for
employee-management disputes, and
narrowed the scope of bargaining. Across
the state line in Indiana, Governor Mitch
Daniels signed a 2011 bill that restricted the
scope of bargaining to wages and benefits.
A year later, the Hoosier State became
the first right-to-work state in the rust
belt (thus prohibiting unions there from
collecting agency fees from non-members).
The fiscal crunch of the past four years
has also imperiled some long-standing
assumptions and earlier teacher-union
victories. Despite the cushion of federal
“stimulus” money, states and districts
have raised class sizes, closed schools, cut
programs, laid off teachers, frozen salaries,
reduced health benefits (or required
teachers pay more for them), and propped
up shaky pension systems by a combination
of diminished benefits and increased
employee contributions.
Recognizing the fluidity of the present
situation and acknowledging that our data
are a snapshot in time—in some cases an
earlier time—we nevertheless leave this
analysis with four over-riding impressions.
We make no causal claims, nor are any of

54 HOW STRONG ARE U.S. TEACHER UNIONS? A STATE-BY-STATE COMPARISON
Part IV: Conclusions and Takeaways
these assertions free from exceptions, but
it would be irresponsible not to share with
readers the picture that these data have
drawn in our minds.
1. Mandatory bargaining appears to tilt the
playing field in favor of stronger unions.
Where bargaining is optional or prohibited,
unions tend to rank “weaker” on our overall
metric.*
Consider Table 12. Seventeen of the top
twenty strongest unions are in mandatory
bargaining states. Nine of the weakest ten
are in states where bargaining is prohibited
altogether or permitted but not required.
But what about the four states that don’t
follow this pattern? Why are unions in Ohio,
West Virginia, and Alabama strong (even
though bargaining is not mandatory), and
in Florida weak (even though bargaining is
mandatory in the Sunshine State)? On to
our next point…
2. Resources make a difference. It’s no
surprise, but it needs to be underscored.
Funding (from member dues and agency
fees) and membership matter. Revenue
is important to unions, as it is to other
* While this seems tautological given that the calculation of overall rank includes bargaining status, recall that the metric also includes thirty-six other sub-indicators, not all of which are related, even indirectly, to whether local districts must, may, or cannot negotiate binding contracts with teacher associations.
TABLE 12. TEACHER UNION STRENGTH BY RANK, TIER, BARGAINING STATUS, AND AGENCY FEES
Tier 1Strongest
Tier 2Strong
Tier 3Average
Tier 4Weak
Tier 5Weakest
STATE OVERALL RANK STATE OVERALL
RANK STATE OVERALL RANK STATE OVERALL
RANK STATE OVERALL RANK
Hawaii 1 Vermont 11 Massachusetts 21 Kansas 32 Louisiana 42
Oregon 2 Ohio 12 Maine 22District of Columbia
33 Oklahoma 43
Montana 3 West Virginia 13 Maryland 23 South Dakota 34 Texas 44
Pennsylvania 4 Minnesota 14 North Dakota 24 Colorado 35 Georgia 45
Rhode Island 5 Alaska 15 Nevada 25 Idaho 36 Mississippi 46
California 6 Michigan 16 Nebraska 26 New Mexico 37 Virginia 47
New Jersey 7 Connecticut 17 Iowa 27 Missouri 38 Arkansas 48
Illinois 8 Wisconsin 18 Kentucky 28 Utah 39 South Carolina 49
New York 9 Delaware 19 Wyoming 29 North Carolina 40 Florida 50
Washington 10 Alabama 20 New Hampshire 30 Tennessee 41 Arizona 51
Indiana 31
Note: With fifty-one total jurisdictions, each tier comprises ten except Tier 3—the middle tier—which comprises eleven.
MANDATORY BARGAINING PERMITTED BARGAINING PROHIBITED BARGAINING AGENCY FEES PROHIBITED

55 HOW STRONG ARE U.S. TEACHER UNIONS? A STATE-BY-STATE COMPARISON
Part IV: Conclusions and Takeaways
organizations—regardless of whether they
use it to donate to political campaigns,
lobby policymakers, finance public relations
and advertising campaigns, mobilize
members to write letters and rally, or
train their local affiliates to bargain and
organize. (Indeed, the more money they
have, the less they are forced to choose
among such power-enhancing activities.)
Likewise, membership is important, not
only as a source of revenue but also
because members themselves are key to
boots-on-the-ground efforts. And agency
fees allow unions to collect dollars from
non-members, enabling them to continue
their work (and gain visibility and policy
victories, which in turn encourage more
teachers to join). This iterative relationship
between fees, membership, and revenues
virtually guarantees the organizational
health of unions in many states.
The ability to collect agency fees is
especially crucial for unions in states with a
low percentage of dues-paying members.
Permitted bargaining status can reduce
the unionization rate because districts
are not required to recognize employee
organizations as unions (77 percent of all
districts in mandatory bargaining states
have unions, compared to 17 percent in
permitted bargaining states). Bargaining
status alone is not the only contributing
factor to low unionization—recall that
permitted bargaining states are mostly
located in parts of the nation where
organized labor is not particularly popular.
In all states, regardless of bargaining status,
teachers can choose not to organize, or
opt to operate as an employee association
rather than a union.* Further, in all states,
individual teachers can opt out of union
membership (and thus union dues).
When states allow unions to collect agency
fees from non-members, it lessens the
effects of decreased membership (and
member dues) owing to bargaining status
or other factors. Unions in mandatory
bargaining states collect an average of
$581 annually per teacher in the state; in
permitted bargaining states, $296. The
nearly $300 difference isn’t surprising—
mandatory bargaining states have more
unionized teachers (83 compared to 61
percent). But the average union revenue
in mandatory bargaining states that allow
agency fees is a whopping $650, compared
to $405 in mandatory states that do not.16
The fiscal advantage gained by unions
in mandatory bargaining states is nearly
completely lost if they cannot collect
agency fees—especially if mandatory
bargaining does not translate into higher
unionization.†
Now back to the four states that rank
differently than their bargaining status
seems to indicate that they should.
Ohio, West Virginia, and Alabama do not
mandate collective bargaining but do allow
agency fees. Not all Tier 5 states prohibit
bargaining (Florida requires it, and five
others permit it), but they all forbid agency
fees. And 18 of the 20 weakest states
restrict union revenue in some way, either
by prohibiting agency fees (sixteen of
them) or barring unions from automatically
collecting dues from members’ paychecks
(Colorado and New Mexico). That’s
* For example, New York and Michigan are both mandatory bargaining states, with about 700 districts each. In New York, approximately 80 percent of districts have unions, while in Michigan only 65 percent do. Compare this to Ohio, where bargaining is only permitted, yet 75 percent of 600 districts have unions, while only one percent of nearby Missouri’s 525 districts are unionized despite the fact that it permits bargaining as well.
† Florida is a prime example: Although bargaining is mandatory, only 56 percent of Florida teachers actually belong to unions, and because the state forbids agency fees the state association collects only $182 in annual revenue per teacher. Compare this to Kentucky, where bargaining is permitted. The unionization rate is nearly comparable to Florida, at 58 percent. Yet the state permits agency fees, and the state association there sees annual revenue of $521 per teacher.

56 HOW STRONG ARE U.S. TEACHER UNIONS? A STATE-BY-STATE COMPARISON
Part IV: Conclusions and Takeaways
more decisive than mandatory collective
bargaining, which we found in thirty-two
states—but six of these end up in the
bottom two tiers (Kansas, Washington, D.C.,
South Dakota, New Mexico, Tennessee, and
Florida). The message for union opponents
is fairly clear: If you want to weaken unions
politically, focus on prohibiting agency fees
and/or mandatory payroll deductions (via
“paycheck protection” measures), not just
on ending the right to bargain collectively.
3. The scope of bargaining matters a lot,
too, as does the right (or not) to strike.
Consider this observation by Michelle
Rhee, former chancellor of the District of
Columbia school system, who now heads
the StudentsFirst reform-advocacy group:17
Collective bargaining for wages and
benefits is not the reason American schools
fail. Even in…states that do not have
collective bargaining, we still see many
of the problems that hurt our schools:
bureaucratic inertia, red tape limits on
parent choice, seniority-based layoffs,
and fiscal irresponsibility. Overseas, many
countries see teachers unions drive high
standards and expectations for all teachers.
The problem is not collective bargaining.
The problems arise when unions use
collective bargaining to push for policies
that devalue great teachers, such as
insisting that all teachers should be treated
as interchangeable in terms of performance
and pay.
Unions should have every right to continue
representing their members, speaking up
for teachers as they negotiate salaries,
professional development and benefits. But
they should not actually be co-managing
school systems, and many decisions do
not belong on the bargaining table. For
example, it would present a huge conflict
of interest for unions to be negotiating
performance evaluations when unions
have to represent effective and ineffective
teachers alike. Districts should be able
to create evaluations, reward teachers’
success, empower parents with more
choices, and run the school system while
held to high standards for accountability
and success.
The problem, of course, is that in many
states the scope of local bargaining is
nearly boundless, often including relentless
protection of the jobs of ineffective
teachers. This is a matter within the
purview of state policy, however. In fact,
Lorraine McDonnell and Anthony Pascal
concluded that the scope of provisions of
a state law were “significant predictors” of
what contracts included.18
When permissive bargaining rules combine
with ill-defined state policies, local unions
have a lot of wiggle room to negotiate
contracts that serve their goals more
than those of their pupils. Moreover,
some state laws protect union interests
outright, making bargaining unnecessary.
For example, when laying off teachers,
only Idaho and Utah prohibit districts from
considering seniority, and just eight states
allow districts to impose their own layoff
rules without negotiations. Contrast this to
the sixteen states where the law protects
teacher interests (seniority is the sole
criteria for layoffs in five states and must
be considered as one of several factors
in eleven) and the remaining twenty-
five, where the state sets no rules at all
and layoffs are within the scope of local
collective bargaining.
The recent Chicago teacher strike illustrates
the impact of strong local collective
bargaining policies that intersect with
permissive state laws. Illinois law requires

57 HOW STRONG ARE U.S. TEACHER UNIONS? A STATE-BY-STATE COMPARISON
Part IV: Conclusions and Takeaways
that student growth be a “significant
factor” in teacher evaluations, but does
not specify further.* Districts are free to
develop their own evaluation systems, or
can opt-in to a system designed by the
state (in which student achievement counts
for half of a teacher’s overall evaluation).
State law also implicitly allows bargaining
over evaluations, meaning that each district
can decide whether it will negotiate over
the issue, and Chicago Public Schools
(CPS) agreed to do so. (Insiders assert
that the Chicago Teachers Union, or CTU,
refused to negotiate with the district over
health care and other benefits unless CPS
agreed to negotiate over evaluations.)†
During those negotiations, the CTU insisted
that no more than 30 percent of a teacher’s
evaluation be based on student scores,
while CPS wanted 45 percent. When labor
and management could not come to an
agreement on evaluations, the teachers
went on strike, which is legal under Illinois
law. (Ostensibly, the walkout was over
salaries, since technically teachers cannot
strike over evaluations.) Facing intense
pressure to resolve the dispute, CPS leaders
agreed on 30 percent. But had the state
defined and mandated evaluation criteria
(rather than suggested it), not included
evaluations within the scope of bargaining,
and/or not given teachers the right to
strike, CPS would likely have been able
to impose its own standards. (Of course,
whether 0 percent, 10 percent, 30 percent,
or some other percentage is the “right”
proportion allocated to student results
has been, and continues to be, open to
vigorous debate.)
Contrast the Illinois situation with the
present state of play in Wisconsin, where
Act 10 limited collective bargaining to wage
increases only. Existing legislation also
banned teacher strikes in the Badger State
and barred teacher evaluations from the
scope of bargaining. That meant Wisconsin
districts had the power unilaterally to
impose higher health premium shares on
employees, to shift pension contributions
to workers, and to cut other personnel
costs. In fact, raising eligibility for retiree
health benefits and redesigning health
plans—changes made possible by Governor
Walker’s reforms—was estimated to save
Milwaukee Public Schools $117 million in
2012 alone.19 (Subsequently, a Wisconsin
judge struck down the limitations on
bargaining; Walker has vowed to appeal.)
4. The fact that a state has mandatory,
permissive or broad bargaining laws—or
its unions enjoy abundant resources—does
not mean that state policies are union-
favorable, and vice-versa. Many of the
states in our top two tiers are home to
state-level policies that are not particularly
favorable to teacher unions. Take California,
Illinois, and Minnesota (overall ranks: 6th,
8th, and 14th). They have the widest scopes
of bargaining in the country. Sundry areas
must be bargained, spanning salary and
benefits to teacher evaluations to working
conditions. Agency fees are allowed, and
teachers are permitted to strike. Nearly
all teachers are union members, and state
unions there see some of the highest
revenue in the nation. Yet, education
policies in those same three states are less
aligned with traditional union positions
than in many other states (37th, 39th, and
46th, respectively). All three have charter
*Incidentally, the Illinois Education Association played a central role in shaping the state law on evaluation.
† Further, once a topic has been negotiated in the past, that precedent stands for the future. So CTU’s approach was not unusual.

58 HOW STRONG ARE U.S. TEACHER UNIONS? A STATE-BY-STATE COMPARISON
Part IV: Conclusions and Takeaways
caps with room for growth or no cap at all.
All allow a variety of public charter schools
(new charter school startups, public school
conversions, and virtual schools) and
automatically exempt them from most state
laws and district regulations, including local
collective bargaining agreements. Two
(Minnesota and Illinois) require that teacher
evaluations be significantly informed by
student achievement or growth measures,
and two (Minnesota and California) support
performance pay. Minnesota also requires
that teacher performance be considered
before granting tenure. Clearly, these
are not the policies that unions tend to
advocate.
Conversely, states without strong collective
bargaining rights may nonetheless have
union-friendly policies. Take Mississippi
and North Carolina. The former does not
address collective bargaining in state law
and the latter prohibits it; both have low
membership and revenue. Yet policies
in both states are generally favorable to
teacher union interests. Mississippi has
some of the strictest due-process laws in
the nation, thanks to the state’s Education
Employment Procedures Law, so teacher
jobs rest secure. And North Carolina’s
teacher association has a strong ally in
Democratic governor Beverly Perdue (not
to mention that twenty-seven of the last
thirty governors in the Tar Heel state have
been Democrats). Negotiating rights and
resources, then, become less critical when
unions have other aprons to hide behind.
All of which goes to say, collective
bargaining is far from the whole story when
it comes to shaping education policy at the
state level and the role of unions therein.
Other factors—and players—obviously
matter, too, often greatly, beginning with
state leadership (past and present), federal
policy, the condition of the economy,
the influence of other key education
stakeholders, and the state’s own macro-
politics.
Why do some state unions (Pennsylvania,
Minnesota, and Michigan) have what look
like vital elements of power—bargaining is
mandatory, agency fees are allowed, and
union membership is high—yet fail to enjoy
policy environments aligned with their
interests (at least in this study’s current
snapshot)? How is it that state policies
are so union-friendly in states like West
Virginia and Kentucky, despite the fact that
bargaining is permitted or prohibited and/
or agency fees banned?
A closer look reveals an unsurprising
insight. What did most of the “should-be-
weak-but-aren’t” unions have in common?
Democratic governors and legislative
majorities. What did most of the “should-
be-strong-but-aren’t” unions share?
Republican state leadership. Indeed the
political climate can do much to constrain
the influence of resource-rich unions and
magnify the strength of those without
ample resources of their own.
The bottom line? Unions do not have carte
blanche at the statehouse even if they
do wield enormous influence over pay
and working conditions on the ground.
Historically, they were dominant voices in
state-level debates over education because
particular issues of enormous interest to
them and their members were not high
priorities for most other interest groups.20
On other issues, teacher unions could
easily find allies among other sectors of
organized labor, thus adding to their clout.
Moreover, elected state education board
members (and local board members, too)
typically gain office in low turnout elections
that can be swayed relatively easily by

59 HOW STRONG ARE U.S. TEACHER UNIONS? A STATE-BY-STATE COMPARISON
Part IV: Conclusions and Takeaways
organized groups with keen interest in
who wins them. With the recent explosion
of education reform advocacy groups,
however, teacher unions now have more
adversaries and rivals, and fewer automatic
allies, in statehouse politics and policy
decisions.21, 22
The venue is changing, too, as hard-
fought policies move from statehouse to
schoolhouse. One recent study actually
found that states with strong unions
appeared more likely to pass teacher
evaluation measures with union support,
because their unions were confident
they could shape the terms by which
such programs would actually function.23
Another focused on teacher performance
pay and found that unions have just as
much influence in the implementation
phase of reform as they did in the design of
the bill that eventually became law. In some
cases, unions shaped proposals for merit
pay so drastically that the resulting law was
impossible to implement, and in other cases
they undermined implementation such that
the laws were reduced to token reforms.24
For the future: This kind of research is
hard—but more of it needs to be done. We
found previous efforts to gauge teacher
union strength to be in the ballpark, but
imprecise. Most of the states we ranked on
the “stronger” side of the distribution will
come as no surprise to veteran observers of
the education-policy wars. Most are known
to be strongholds of union influence. Many
are in the old industrial Northeast, and
several others would be termed “deep blue”
by political analysts. Similarly, the “weak”
side of the distribution displays a lot of
predictable states. But there are surprises,
too.
For those who tackle this complicated
topic in the future, we suggest three
improvements.* First, include indicators
of a state’s political climate: What is the
party affiliation of the governor, legislators,
and education leaders (e.g., the state
superintendent, the members of state
board of education), and how many were
endorsed by the union? Second, mindful
of the complexity and inconsistency of
state election laws, it would be enormously
valuable to obtain a complete accounting
of the union’s share of all types of political
spending—not just donations, but also
advertising, member mobilization, lobbying,
and advocacy. Finally, a revised measure
would account for political brick walls—
provisions of state constitutions (although
in theory these can be amended); long-
standing labor-friendly policies that may
be regarded as sacred (although such
cattle may be slaughtered); and seemingly
permanent elements of a state’s political
culture (although these, too, may turn out
to be malleable). Surely there are other
methodological and data improvements to
be made. We trust that readers won’t be
shy in sharing them with us.
* Raw data are available upon request. Send email to [email protected].

60 HOW STRONG ARE U.S. TEACHER UNIONS? A STATE-BY-STATE COMPARISON
Part V: State Profiles
PART V: STATE PROFILES

IntroductionPart IV: Taking a Closer Look–Teacher Union Influence Area
AREA 1: RESOURCES AND MEMBERSHIP
TIED FOR 24TH
With 85.6 percent of its teachers unionized,
the Yellowhammer State posts the
18th-highest unionization rate in the
country (and has a far higher than average
rate among states where bargaining is
similarly permitted but not mandatory).
The Alabama Education Association (AEA)
brings in $501 per teacher annually (24th
of 51 jurisdictions). The state devotes a
considerable portion of its own budget to
K–12 education—25.3 percent of total state
expenditures (8th). But the number of
total dollars from state, federal, and local
sources is only moderate: Alabama spends
$10,320 per pupil (34th). Of those funds,
52.9 percent are directed toward teacher
salaries and benefits (36th).
AREA 2: INVOLVEMENT IN POLITICS2
TIED FOR 1ST
Alabama’s union plays a larger role in state
politics than do its counterparts in nearly
every other state, with contributions from
the AEA far outstripping those from any
other source (it ties with Hawaii and South
Dakota for first in this area). In the past ten
years, contributions from teacher unions
accounted for 2.8 percent of all donations
received by candidates for state office
(4th). Those donations also equaled 7.7
percent of the funds from the ten highest-
giving sectors in the state (18th). Further,
9.7 percent of contributions to Alabama
political parties came from teacher unions,
the highest proportion we found in any
state. These donations represent a key
part of the AEA’s political strategy (see
sidebar). Adding to the union heft was
ALABAMA OVERALL RANK: 20TH1
TIER 2 (STRONG)
STRONGER WEAKER
1. RESOURCES AND MEMBERSHIP
OVERALL
2. INVOLVEMENT IN POLITICS
3. SCOPE OF BARGAINING
4. STATE POLICIES
5. PERCEIVED INFLUENCE
Overall Rank: 20thTier 2 (Strong)
ALABAMA
20
1
18
24
25
45

its representation at the Democratic and
Republican national conventions, where
27.3 percent of all Alabama delegates
identified themselves as teacher union
members (2nd).3
AREA 3: SCOPE OF BARGAINING
TIED FOR 45TH
Alabama law does not address the
legality of collective bargaining in
education, implicitly permitting it (and
implicitly including all twenty-one
provisions examined in this metric within
the scope of bargaining). However, the
state does not permit teacher strikes, nor
can unions automatically collect agency
fees from non-member teachers. (This
limitation hinders the AEA less than similar
restrictions in other states. It has higher
per-teacher revenue than the unions in all
but two other states that prohibit agency
fees—see Area 1.)
AREA 4: STATE POLICIES
TIED FOR 18TH
Many Alabama policies align with
traditional teacher union interests.
The state does not require that student
achievement data factor into teacher
evaluations or tenure decisions, and it
does not articulate specific consequences
for those who receive unsatisfactory
evaluations. Further, the criteria for layoffs
are left to the discretion of districts,
which are not required to consider
teacher performance. On the other hand,
Alabama dismisses teachers due to poor
performance at a higher rate than all but a
handful of states, and it does not mandate
class-size restrictions for grades K–3.
Alabama has no charter school law.4
AREA 5: PERCEIVED INFLUENCE
25TH
Stakeholders report that Alabama’s state
teacher union is powerful, but it faces
competition in education policy debates.
They rate the union as about equal, in terms
of influence, to education advocacy groups,
the state school board, and the association
of school administrators. Stakeholders
note that the teacher union is effective
in protecting dollars for education and
warding off education reform proposals
with which it disagrees. But they also
report that policies proposed by the
governor in the latest legislative session
were only somewhat in line with teacher
union priorities and that the outcomes of
the latest session were mostly not in line
with those priorities (consistent with the
state electing a Republican supermajority
in 2010—see sidebar).5 Respondents report
that the priorities of state education leaders
rarely aligned with teacher union positions
in the last three years.
OVERALL
20TH
Alabama’s state teacher union is highly
involved in state politics, contributing large
sums to political campaigns (although that
may change if its revenue declines because
it cannot automatically collect dues—see
sidebar). It is ranked stronger than its
counterparts in eleven other states where
bargaining is permitted but not required;
among similar states, only Ohio (12th) and
West Virginia (14th) had higher overall
scores.
Overall Rank: 20thTier 2 (Strong)
ALABAMA

For over fifty years, the Alabama Education Association (AEA) and Paul Hubbert, its long-time executive director, have been staunch and respected defenders of civil rights. Hubbert, along with second-in-command Joe Reed, spearheaded the unification of the white and African American state teacher unions, fought to protect education funding against cuts from segregationist Governor George Wallace, and secured a living wage for school employees. In the process, he created one of the best-organized and funded state unions in the nation.6
During the 2010 gubernatorial election, however, Hubbert and the AEA might have taken the state motto Audemus Jura Nostra Defendere (“We Dare Defend Our Rights”) a bit too far. The Republican primary run-off that year pitted Bradley Byrne against Robert Bentley. Byrne was a former senator, former Alabama State Board of Education member, and former Democrat.7 Bentley was a relatively unassuming two-term legislator who defeated the third-place candidate by only 200 votes to force the run-off.8 The AEA usually stayed out of Republican politics—Hubbert was vice chairman of the Alabama Democratic Party, Reed its chair for minority affairs. But not this time.
Over his long career, Byrne had clashed with the union over mandatory background checks for teachers and tenure reform, among other things. He was also blunt about his opinion of the AEA: “I don’t think AEA stands for the best of their profession. AEA stands for the worst of it,” he once said at a news conference. “…Over my time as a board member I learned more and more about their control not just over education issues, but over business taxation issues, economic development issues and even blocking certain types of ethics reform.”9 But during the primary campaign, Byrne went further than public criticism—he spent $8 million on an advertising campaign against the AEA. Hubbert pounced. “If Bradley Byrne had left us alone, we would have been only slightly involved in the governor’s race,” he said, “…[but instead] he threatened to burn our house down.”10 Thus, the AEA spent $3 million on advertising against Byrne and gave hundreds of thousands of dollars more to PACs which supported Bentley.11 But voters reacted against Byrne’s attacks on the respected union by resoundingly electing Bentley, who went on to defeat Democrat Ron Sparks—who also received contributions from the AEA—in the general election. In total, the union spent $8.6 million on the 2010 campaign.12
Outgoing GOP Governor Bob Riley, a Byrne supporter, was livid, and made sure to get in a parting shot. In an unusual December 2010 session, he enlisted the newly-elected Republican legislature and passed a bill barring any public-employee union from automatically collecting dues from its members via payroll deductions—teacher unions included.13 Riley and his supporters said this measure would curtail undue lobbying influence.14 The AEA described the statute, and the $2.4 million a year that it stood to lose, as a “mortal threat to our schools, our profession, and our association.”15 Not surprisingly, it sued the state, where federal courts are now deciding the matter.16 That law, however, was only the first of several passed by Republicans, who are clearly enjoying their first majority in decades. Despite the efforts of the AEA, teachers saw their pay cut and their generous deferred-retirement plan killed.17
When Hubbert and Reed both retired in 2011, the AEA’s future seemed even more uncertain. “We were staring down the barrel of a loaded cannon,” said Gregory Graves, the AEA’s new second-in-command.18 But financially savvy Executive Director Henry Mabry surprised everyone in 2012. He and the AEA vigorously opposed a bill to legalize charter schools, which the Senate subsequently voted down. This was the third such failed attempt since 1999, and Governor Bentley indicated he would not push for round four.19,20 And with AEA support, lawmakers preserved teacher jobs (even though state revenue decreased), saved teacher tenure (against pressure to eliminate it), and blocked the use of student achievement data in layoff decisions (despite a host of similar bills in neighboring states).21,22,23 Given these recent successes, and with Mabry at the helm and Bentley in the governor’s office, it looks like 2011 was only a bump in the road for the AEA.
ALIVE AND KICKING
Overall Rank: 20thTier 2 (Strong)
ALABAMA

OVERALL RANK: 20TH
Area and Ranka General Indicator Sub-IndicatorSub-Indicator Rank/Statusb
AREA 1: RESOURCES & MEMBERSHIP
Membership By rank, what percentage of public-school teachers in the state are union members? 18th
Revenue By rank, what is the total yearly revenue (per teacher in the state) of the state-level NEA and/ or AFT affiliate(s)?
24th
Spending on education By rank, what percentage of state expenditures (of state general funds, state restricted funds, state bonds, and federal “pass-through” funds) is directed to K-12 education?
8th
By rank, what is the total annual per-pupil expenditure (of funds from federal, state, and local sources) in the state?
34th
By rank, what percentage of total annual per-pupil expenditures is directed to teacher salaries and benefits?
36th
AREA 2: INVOLVEMENTIN POLITICS
Contributions to candidates and political parties
By rank, what percentage of the total contributions to state candidates was donated by teacher unions?
4th
By rank, what percentage of the total contributions to state-level political parties was donated by teacher unions?
1st
Industry influence By rank, what percent of the contributions to state candidates from the ten highest-giving sectors was donated by teacher unions?
18th
Status of delegates By rank, what percentage of the state’s delegates to the Democratic and Republican conventions were members of teacher unions?
2nd
AREA 3:SCOPE OF BARGAINING
Legal scope of bargaining What is the legal status of collective bargaining? Neither required nor prohibited
By rank, how broad is the scope of collective bargaining? 38th*
Automatic revenue streams What is the unions’ legal right to automatically collect agency fees from non-members and/or collect member dues via automatic payroll deductions?
Agency fees prohibited
Right to strike What is the legal status of teacher strikes? Prohibited
AREA 4:STATE POLICIES
Performance pay Does the state support performance pay for teachers? State does not support
Retirement By rank, what is the employer- versus employee-contribution rate to the teacher pension system? 33rd
Evaluations What is the maximum potential consequence for veteran teachers who receive unsatisfactory evaluation(s)?
No consequences articulated
Is classroom effectiveness included in teacher evaluations? If so, how is it weighted? Not required
Terms of employment How long before a teacher earns tenure? Three years
Is student/teacher performance considered in tenure decisions? If so, how is it weighted? Not included
Is seniority considered in teacher layoff decisions? If so, how is it weighted? Optional; Weighted at district discretion
Is teacher performance included in teacher layoff decisions? If so, how is it weighted? Not required
By rank, what percentage of the teaching workforce was dismissed due to poor performance? 47th
Class size Is class size restricted for grades 1-3? If so, is the restriction higher or lower than the national average (20)?
No restriction
ALABAMA RANKINGS BY AREA AND INDICATOR
24
1*
45*
18*
Overall Rank: 20thTier 2 (Strong)
ALABAMA

Area and Rank General Indicator Sub-IndicatorSub-Indicator Rank/Status
AREA 4:STATE POLICIES
(cont.)
Charter school structural limitationsc
Is there a cap (limit) placed on the number of charter schools that can operate in the state (or other jurisdiction) and/or on the number of students who can attend charter schools?
N/A
Does the state allow a variety of charter schools: start-ups, conversions, and virtual schools? N/A
How many charter authorizing options exist? How active are those authorizers? N/A
Charter school exemptionsc Are all charter schools automatically exempt from state laws and state/district regulations (except those that safeguard students and fiscal accountability)? If not, are they eligible for exemptions?
N/A
Are all charter schools automatically exempt from state teacher-certification requirements? If not, are they eligible for exemptions?
N/A
Are all charter schools automatically exempt from collective bargaining agreements (CBAs)? If not, are they eligible for exemptions?
N/A
AREA 5:PERCEIVED INFLUENCEd
Relative influence of teacher unions
How do you rank the influence of teacher unions on education policy compared with other influential entities?
Second- or third-most influential
Influence over campaigns On a scale from always to never, how often do Democratic candidates need teacher-union support to get elected?
Often/Always
On a scale from always to never, how often do Republican candidates need teacher-union support to get elected?
Sometimes
Influence over spending To what extent, from strongly agree to strongly disagree, do you agree that even in times of cutbacks, teacher unions are effective in protecting dollars for education?
Agree
Given recent budgetary constraints, would you say that teacher unions generally make concessions to prevent reductions in pay and benefits or fight hard to prevent those reductions?
Fight
Influence over policy To what extent, from strongly agree to strongly disagree, do you agree that teacher unions ward off proposals in your state with which they disagree?
Agree
On a scale from always to never, how often do existing state education policies reflect teacher-union priorities?
Sometimes/Often
To what extent, from totally in line to not at all in line, were state education policies proposed by the governor during your state’s latest legislative session in line with teacher-union priorities?
Somewhat in line
To what extent, from totally in line to not at all in line, were legislative outcomes of your state’s latest legislative session in line with teacher-union priorities?
Mostly not in line/Somewhat in line
Influence over key stakeholders
On a scale from always to never, how often have the priorities of state education leaders aligned with teacher-union positions in the past three years?
Rarely/Sometimes
Would you say that teacher unions typically compromise with policymakers to ensure that their preferred policies are enacted, or typically need not make concessions?
Compromise
* Tied with another state
a Area ranks are calculated using a weighted average of sub-indicators. For a more detailed description, see Appendix A.
b Where possible, we report a state’s rank as compared to other states on a given metric. For example, out of 51 states, Alabama has the 18th-highest percentage of teachers who are union members. Otherwise, we report a status: In Alabama, collective bargaining is neither required nor prohibited, and union agency fees are prohibited. For a more detailed description of our metrics and methodology, see Appendix A. To request the raw data for your state, send an email to [email protected].
c Alabama does not have a charter school law.
d For all survey questions, stakeholders were asked specifically about teacher unions, candidates, policies, and leaders in their state. In addition, we asked about unions and policies in the “current legislative session,” but because legislative calendars vary from state to state, responses refer to policies proposed and enacted within the 2010-11 window.
Overall Rank: 20thTier 2 (Strong)
ALABAMA
18*
25

ENDNOTES
1 A state’s overall rank is calculated as follows: First, we score it on multiple sub-indicators (sub-indicator data and scores for Alabama are shown in the table, Alabama Rankings by Area and Indicator). Second, we take a weighted average of the sub-indicators in each of five areas. In each area, we use that average to place the states in rank order: For example, in Area 1: Resources and Membership, Alabama is ranked 24th of 51 based on the weighted average of its sub-indicators. To generate the state’s overall rank, we average the five area ranks together, then re-order the states. For a more detailed description of data sources and methodology, see Appendix A.
2 Readers should note that these figures include only direct donations from unions and union-connected PACs, but not their spending on electioneering/advertising, mobilizing the union’s own membership, lobbying, or advocacy. A recent Wall Street Journal report found that donations and lobbying activities account for a small share of union political spending compared with their expenditures on member mobilization and advocacy. Even the AFT agreed, making the argument that since its mission is organizing and activism, it will naturally spend significant amounts on these activities. Thus, the percentages we report here are extremely conservative representations of what unions actually spend on politics. For more information, see Appendix A, Area 2; Tom McGinty and Brody Mullins, “Political Spending by Unions Far Exceeds Direct Donations,” Wall Street Journal, July 10, 2012; and Jeff Hauser, “Wall Street Journal Compares Union Political Spending to Corporate Donations,” AFL-CIO, July 10, 2012.
3 At the time of publication, the 2000 conventions were the most recent for which such detailed data were available in forms that met rigorous standards. However, 2008 data provided by the Democratic National Convention were highly correlated with the reliable figures from 2000.
4 We do not include data for sub-indicators pertaining to charters when calculating the ranking of states that do not have charter school laws. While some might argue that the lack of such a law is in itself evidence for union strength, we do not have sufficient data to link that absence to union activity. The nine states without charter laws are home to very different contexts—while teacher unions in some states may have played a significant role in keeping charter laws at bay, in others, they played little or no role. Still, in Alabama, the state union can take substantial credit for the absence of a charter law (see sidebar).
5 We asked stakeholders about unions and policies in the “current legislative session,” but because legislative calendars vary from state to state, responses refer to policies proposed and enacted within the 2010-11 window.
6 Dana Beyerle, “Alabama Education Association Leader Paul Hubbert Retires After 42 Years Of Service,” Tuscaloosa News, January 2, 2012, http://www.tuscaloosanews.com/article/20120102/news/120109997?p=1&tc=pg.
7 Kim Chandler, “Campaign 2010: Bradley Byrne’s Clash With AEA Marks His Career,” Birmingham News, July 4, 2010, http://blog.al.com/spotnews/2010/07/campaign_2010_bradley_byrnes_c.html.
8 Charles J. Dean, “Robert Bentley Formally Kicks Off Campaign In Alabama GOP Governor’s Race,” Birmingham News, June 21, 2010, http://blog.al.com/spotnews/2010/06/bentley.html.
9 Chandler.
10 Bob Lowry, “AEA Executive Secretary Paul Hubbert: Bradley Byrne ‘Threatened To Burn Our House Down,’” Huntsville Times, July 14, 2010, http://blog.al.com/breaking/2010/07/hubbert_byrne_threatened_to_bu.html.
11 “Alabama Mystery Solved,” Factcheck.org, September 30, 2010, http://www.factcheck.org/2010/09/alabama-mystery-solved/.
12 Associated Press, “Bill To Curb AEA, ASEA Moves Forward,” Tuscaloosa News, December 20, 2010, http://www.tuscaloosanews.com/article/20101210/NEWS/101209608.
13 Sean Cavanagh, “Alabama Lawmakers, Unions, Spar Over Payroll Deductions,” Education Week, December 15, 2010, http://blogs.edweek.org/edweek/state_edwatch/2010/12/alabama_lawmakers_unions_spar_over_payroll_deductions.html.
14 Campbell Robertson, “Ethics Plan Is Offered By Governor In Alabama,” New York Times, December 1, 2010, http://www.nytimes.com/2010/12/02/us/02alabama.html.
15 Cavanagh.
16 Challan Stephens, “Alabama Education Association Survives Appeal, Payroll Deductions To Continue,” Huntsville Times, April 5, 2011, http://blog.al.com/breaking/2011/04/alabama_education_association_5.html.
17 George Talbot, “Henry Mabry’s Success At Helm Of AEA Surprise Story Of Legislative Session,” Press-Register, May 16, 2012, http://blog.al.com/live/2012/05/george_talbot_1.html.
18 Ibid.
19 Charles J. Dean, “Alabama Gov. Robert Bentley Eases Off Charter School Push,” Birmingham News, June 28, 2012, http://blog.al.com/spotnews/2012/06/alabama_gov_robert_bentley_eas.html.
20 Larry Lee, “Alabama Voices: Charter School Loss A Victory For State,” Montgomery Advertiser, August 3, 2012, http://www.montgomeryadvertiser.com/article/20120805/OPINION/308050002/Alabama-Voices-Charter-school-loss-victory-state.
21 David White, “Alabama House Of Representatives Passes State Education Budget,” Birmingham News, April 29, 2009, http://www.al.com/news/birminghamnews/statebriefs.ssf?/base/news/1240993112264050.xml&coll=2.
22 “Legislative Success,” Alabama Education Association, accessed August 10, 2012, http://www.myaea.org/AEAPolitics.html.
23 Joy Resmovits, “Alabama House Passes Bill That Maintains Teacher Tenure But Dilutes Its Protections,” HuffingtonPost.com, May 26, 2011, http://www.huffingtonpost.com/2011/05/26/alabama-house-passes-teacher-tenure-bill_n_867585.html.
Overall Rank: 20thTier 2 (Strong)
ALABAMA

STRONGER WEAKER
1. RESOURCES AND MEMBERSHIP
OVERALL
2. INVOLVEMENT IN POLITICS
3. SCOPE OF BARGAINING
4. STATE POLICIES
5. PERCEIVED INFLUENCE
AREA 1: RESOURCES AND MEMBERSHIP
(TIED FOR 13TH)
Alaska’s two state teacher unions enjoy
high membership and revenue totals.
With 89.3 percent of the state’s teachers
belonging to unions, the unionization rate
in the Last Frontier is 17th-highest of 51
jurisdictions. More impressive, the NEA
and AFT state-level affiliates bring in a
whopping $1,371 per teacher annually—
the most of any state. External funding
for K-12 education is more complicated.
While Alaska spends $16,174 per pupil
annually (3rd), only 49.8 percent of these
expenditures go toward teacher salaries
and benefits (50th of 51).
AREA 2: INVOLVEMENT IN POLITICS2
TIED FOR 36TH
Despite high revenue, teacher unions
contribute proportionally less to Alaska
state politics than they do in most other
states. Between 2003 and 2010, donations
from unions accounted for just 0.45 percent
of the money received by candidates for
state office (31st). Alaska is also the only
state in which the unions gave no money to
state political parties. And only 12.9 percent
of Alaskan delegates to the Democratic
and Republican national conventions were
teacher union members (27th).3
ALASKA OVERALL RANK: 15TH1
TIER 2 (STRONG)
15
36
21
13
36
4
Overall Rank: 15th Tier 2 (Strong)
ALASKA

AREA 3: SCOPE OF BARGAINING
TIED FOR 4TH
Alaska has very permissive bargaining laws.
Not only is collective bargaining mandatory
in public education, but the state also lets
its unions automatically collect agency fees
from non-member teachers and allows its
school teachers to strike. Alaska education
leaders value bottom-up decision making
(see sidebar); rather than mandating
statewide terms of teacher employment,
Alaska’s bargaining laws require that eight
of the twenty-one items examined in this
metric be bargained between districts
and their teachers: wages, hours, terms
and conditions of employment, grievance
procedures, transfers, insurance benefits,
fringe benefits, and extra-curricular duties.
Ten provisions are not addressed by law,
which implicitly includes them in the scope
of bargaining as well. Only three items are
explicitly excluded from bargaining: class
load, class size, and length of the school
year.
AREA 4: STATE POLICIES
TIED FOR 21ST
Many of Alaska’s education policies,
particularly those relating to teacher
employment, align with traditional union
interests. The state does not require that
student achievement data factor into
teacher evaluations or tenure decisions,
and it does not require its districts to
consider teacher performance in layoff
decisions. Other policies, however, do not
reflect union priorities. Teachers are eligible
for dismissal after multiple unsatisfactory
evaluations and are dismissed due to poor
performance at a higher rate than in all but
one other state (South Dakota). Unions
also typically favor limiting charter school
expansion; and while Alaska does not place
a cap on the number of charters allowed
in the state, it does limit potential school
operators to a single authorizing option.
Alaska also holds charters to all state and
district laws, including those related to
teacher certification, and requires that they
participate in existing collective bargaining
agreements (though schools may apply for
exemptions).
AREA 5: PERCEIVED INFLUENCE
36TH
Stakeholder rankings place the strength
of Alaska teacher unions toward the
bottom of the national list. They rate the
unions’ influence on education policy
below that of the state school board,
state association of school administrators,
and education advocacy organizations.
Further, they note that state education
leaders only sometimes align with teacher
union positions. Like unions in many other
states, Alaska teacher unions often turn to
compromise to see some of their preferred
policies enacted. Survey respondents
report that policies proposed and enacted
in the latest legislative session were only
somewhat in line with teacher union
priorities.4
OVERALL
15TH
Alaska’s teacher unions enjoy a wide scope
of bargaining and significant internal
resources. They maintain a low profile in
state elections and are not viewed as the
loudest voice in education policy; still, many
policies at the state level align with their
interests.
Overall Rank: 15th Tier 2 (Strong)
ALASKA

Two of the biggest battles between legislators and unions in the Lower 48—education reform and money—simply aren’t being waged to the same degree in Alaska. Traditionally a Republican state, the Alaskan State Department of Education decided to opt out of the Race to the Top competition in 2010. Education Commissioner Larry LeDoux explained, “Alaska has the right to be suspicious of an initiative where we hand over authority.”5 Alaska is also one of just five states that did not adopt the Common Core State Standards, preferring to let districts decide their own academic standards.6 And in 2012, Alaska received a waiver from No Child Left Behind, which for one year will freeze the increasing proficiency levels required by federal law. Education leaders argued that the law is too rigid; applying its urban-centric philosophies to Alaska is “just illogical” said Les Morse, the Deputy Education Commissioner.7 State leaders will use the breathing room to further exercise their autonomy: “At the same time we’re doing this freeze, we’re also putting together an application for a comprehensive waiver in which the state would implement its own accountability system,” said Eric Fry, spokesperson for the Alaska Department of Education, “so it wouldn’t make sense to run the schools and districts through another year of the old NCLB when we’re going to be changing things pretty soon.”8
With state leaders not pushing very hard for controversial reforms, the teacher unions have little to argue about. And with an abundance of natural resources, Alaska has witnessed fewer of the recession-tinged budgetary issues plaguing most of the country.9 (Still, NEA-Alaska president Barb Angaiak noted, “The slight increase of just over 1 percent [in education funding for the 2012 fiscal year] is not acceptable in light of increased operational costs.”)10 The state has witnessed significant conflict over just one issue: pensions. The mandatory shift in 2005 away from a defined-benefit to a defined-contribution pension plan for all state workers (including teachers) provoked six years of union efforts to reverse the law.11 In April 2012, the union’s push to let teachers choose between the two options was nearly successful, as SB 121 passed in the Senate before dying in the House.12 NEA-Alaska may get another chance: a new appointee to the Alaska Retirement Management board announced in July 2012 that he supports a return to the defined-benefit system.13 With little else to fight about, however, for now it’s pretty quiet on the Last Frontier.
PEACE AND QUIET
Overall Rank: 15th Tier 2 (Strong)
ALASKA

OVERALL RANK: 15TH
Area and Ranka General Indicator Sub-IndicatorSub-Indicator Rank/Statusb
AREA 1: RESOURCES & MEMBERSHIP
Membership By rank, what percentage of public-school teachers in the state are union members? 17th
Revenue By rank, what is the total yearly revenue (per teacher in the state) of the state-level NEA and/ or AFT affiliate(s)?
1st
Spending on education By rank, what percentage of state expenditures (of state general funds, state restricted funds, state bonds, and federal “pass-through” funds) is directed to K-12 education?
49th
By rank, what is the total annual per-pupil expenditure (of funds from federal, state, and local sources) in the state?
3rd
By rank, what percentage of total annual per-pupil expenditures is directed to teacher salaries and benefits?
50th
AREA 2: INVOLVEMENTIN POLITICS
Contributions to candidates and political parties
By rank, what percentage of the total contributions to state candidates was donated by teacher unions?
31st
By rank, what percentage of the total contributions to state-level political parties was donated by teacher unions?
50th
Industry influence By rank, what percent of the contributions to state candidates from the ten highest-giving sectors was donated by teacher unions?
33rd
Status of delegates By rank, what percentage of the state’s delegates to the Democratic and Republican conventions were members of teacher unions?
27th
AREA 3:SCOPE OF BARGAINING
Legal scope of bargaining What is the legal status of collective bargaining? Mandatory
By rank, how broad is the scope of collective bargaining? 10th*
Automatic revenue streams What is the unions’ legal right to automatically collect agency fees from non-members and/or collect member dues via automatic payroll deductions?
Permitted
Right to strike What is the legal status of teacher strikes? Permitted
AREA 4:STATE POLICIES
Performance pay Does the state support performance pay for teachers? State does not support
Retirement By rank, what is the employer- versus employee-contribution rate to the teacher pension system? 17th
Evaluations What is the maximum potential consequence for veteran teachers who receive unsatisfactory evaluation(s)?
Eligible for dismissal
Is classroom effectiveness included in teacher evaluations? If so, how is it weighted? Not required
Terms of employment How long before a teacher earns tenure? Three years
Is student/teacher performance considered in tenure decisions? If so, how is it weighted? Not included
Is seniority considered in teacher layoff decisions? If so, how is it weighted? Required; Considered among other factors
Is teacher performance included in teacher layoff decisions? If so, how is it weighted? Not required
By rank, what percentage of the teaching workforce was dismissed due to poor performance? 50th
Class size Is class size restricted for grades 1-3? If so, is the restriction higher or lower than the national average (20)?
No restriction
ALASKA RANKINGS BY AREA AND INDICATOR
13*
36*
4*
21*
Overall Rank: 15th Tier 2 (Strong)
ALASKA

Area and Rank General Indicator Sub-IndicatorSub-Indicator Rank/Status
AREA 4:STATE POLICIES
(cont.)
Charter school structural limitations
Is there a cap (limit) placed on the number of charter schools that can operate in the state (or other jurisdiction) and/or on the number of students who can attend charter schools?
No state cap
Does the state allow a variety of charter schools: start-ups, conversions, and virtual schools? Yes
How many charter authorizing options exist? How active are those authorizers? Single option, Some activity
Charter school exemptions Are all charter schools automatically exempt from state laws and state/district regulations (except those that safeguard students and fiscal accountability)? If not, are they eligible for exemptions?
Yes
Are all charter schools automatically exempt from state teacher-certification requirements? If not, are they eligible for exemptions?
No; Schools cannot apply for exemption
Are all charter schools automatically exempt from collective bargaining agreements (CBAs)? If not, are they eligible for exemptions?
No; Schools can apply for exemptions
AREA 5:PERCEIVED INFLUENCEc
Relative influence of teacher unions
How do you rank the influence of teacher unions on education policy compared with other influential entities?
Fourth-most influential
Influence over campaigns On a scale from always to never, how often do Democratic candidates need teacher-union support to get elected?
Sometimes/Often
On a scale from always to never, how often do Republican candidates need teacher-union support to get elected?
Sometimes
Influence over spending To what extent, from strongly agree to strongly disagree, do you agree that even in times of cutbacks, teacher unions are effective in protecting dollars for education?
Neutral
Given recent budgetary constraints, would you say that teacher unions generally make concessions to prevent reductions in pay and benefits or fight hard to prevent those reductions?
Fight
Influence over policy To what extent, from strongly agree to strongly disagree, do you agree that teacher unions ward off proposals in your state with which they disagree?
Neutral
On a scale from always to never, how often do existing state education policies reflect teacher-union priorities?
Sometimes/Often
To what extent, from totally in line to not at all in line, were state education policies proposed by the governor during your state’s latest legislative session in line with teacher-union priorities?
Mostly not in line/Somewhat in line
To what extent, from totally in line to not at all in line, were legislative outcomes of your state’s latest legislative session in line with teacher-union priorities?
Somewhat/Mostly in line
Influence over key stakeholders
On a scale from always to never, how often have the priorities of state education leaders aligned with teacher-union positions in the past three years?
Sometimes/Often
Would you say that teacher unions typically compromise with policymakers to ensure that their preferred policies are enacted, or typically need not make concessions?
Compromise
* Tied with another state
a Area ranks are calculated using a weighted average of sub-indicators. For a more detailed description, see Appendix A.
b Where possible, we report a state’s rank as compared to other states on a given metric. For example, out of 51 states, Alaska has the 17th-highest percentage of teachers who are union members. Otherwise, we report a status: Alaska has mandatory collective bargaining, and union agency fees are permitted. For a more detailed description of our metrics and methodology, see Appendix A. To request the raw data for your state, send an email to [email protected].
c For all survey questions, stakeholders were asked specifically about teacher unions, candidates, policies, and leaders in their state. In addition, we asked about unions and policies in the “current legislative session,” but because legislative calendars vary from state to state, responses refer to policies proposed and enacted within the 2010-11 window.
Overall Rank: 15th Tier 2 (Strong)
ALASKA
21*
36

ENDNOTES
1 A state’s overall rank is calculated as follows: First, we score it on multiple sub-indicators (sub-indicator data and scores for Alaska are shown in the table, Alaska Rankings by Area and Indicator). Second, we take a weighted average of the sub-indicators in each of five areas. In each area, we use that average to place the states in rank order: For example, in Area 1: Resources and Membership, Alaska is ranked 13th of 51 based on the weighted average of its sub-indicators. To generate the state’s overall rank, we average the five area ranks together, then re-order the states. For a more detailed description of data sources and methodology, see Appendix A.
2 Readers should note that these figures include direct donations only, not union and union-connected PAC spending on electioneering/advertising, mobilizing the union’s own membership, lobbying, or advocacy. A recent Wall Street Journal report found that donations and lobbying activities account for a small share of union political spending compared with their expenditures on member mobilization and advocacy. Even the AFT agreed, making the argument that since its mission is organizing and activism, it will naturally spend significant amounts on these activities. Thus, the percentages we report here are extremely conservative representations of what unions actually spend on politics. For more information, see Appendix A, Area 2; Tom McGinty and Brody Mullins, “Political Spending by Unions Far Exceeds Direct Donations,” Wall Street Journal, July 10, 2012; and Jeff Hauser, “Wall Street Journal Compares Union Political Spending to Corporate Donations,” AFL-CIO, July 10, 2012.
3 At the time of publication, the 2000 conventions were the most recent for which such detailed data were available in forms that met rigorous standards. However, 2008 data provided by the Democratic National Convention were highly correlated with the reliable figures from 2000.
4 We asked stakeholders about unions and policies in the “current legislative session,” but because legislative calendars vary from state to state, responses refer to policies proposed and enacted within the 2010-11 window.
5 Jeremy Hsieh, “Alaska Opts Out Of Race To The Top School Grants,” Daily News Miner (Fairbanks, AK), May 4, 2010, http://www.newsminer.com/view/full_story/7295348/article-Alaska-opts-out-of-Race-to-the-Top-school-grants.
6 Lisa Demer, “Comeau Presses For Adoption Of National School Standards,” Anchorage Daily News, March 14, 2012, http://www.adn.com/2012/03/13/2369208/comeau-presses-for-new-school.html.
7 Rosemary Shinohara, “Feds Grant Waiver To Alaska On No Child Left Behind,” Anchorage Daily News, July 12, 2012, http://www.adn.com/2012/07/11/v-printer/2539128/feds-give-alaska-waiver-on-no.html.
8 Dave Donaldson, “State Gets First Federal Waiver For No Child Left Behind,” Alaska Public Radio Network, July 6, 2012, http://www.alaskapublic.org/2012/07/06/state-gets-first-federal-waiver-for-no-child-left-behind/.
9 Phil Oliff and Michael Leachman, “New School Year Brings Steep Cuts In State Funding For Schools,” Center on Budget and Policy Priorities, October 7, 2011, http://www.cbpp.org/cms/?fa=view&id=3569.
10 Barb Angaiak, “Statement On Governor Parnell’s FY2012 Budget And State Of The State Speech,” NEA-Alaska, January 20, 2011, http://www.neaalaska.org/nea/node/392.
11 “Priority Legislation,” NEA-Alaska, accessed September 10, 2012, http://www.neaalaska.org/nea/node/19.
12 Pat Forgey, “Senate OK’s Traditional Retirement Plan For Public Employees,” Juneau Empire, April 15, 2012, http://juneauempire.com/state/2012-04-15/senate-oks-traditional-retirement-plan-public-employees#.T-nV2hdDzId.
13 Pat Forgey, “Retirement Board Gets New Appointments,” Juneau Empire, July 17, 2012, 2012, http://juneauempire.com/local/2012-07-17/retirement-board-gets-appointments.
Overall Rank: 15th Tier 2 (Strong)
ALASKA

STRONGER WEAKER
1. RESOURCES AND MEMBERSHIP
OVERALL
2. INVOLVEMENT IN POLITICS
3. SCOPE OF BARGAINING
4. STATE POLICIES
5. PERCEIVED INFLUENCE
AREA 1: RESOURCES AND MEMBERSHIP
TIED FOR 40TH
Arizona’s two state teacher unions contend
with low membership numbers and thin
resources. Just 44.5 percent of teachers
in the Grand Canyon State are unionized,
47th out of 51 states. (Its unionization
rate is even 15 percent lower than the
average among the fourteen states where
bargaining is similarly permitted but
not required.) The state’s NEA and AFT
affiliates bring in just $208 annually per
teacher in the state (40th). Education
resources are low as well: While the state
directs 21.5 percent of its own expenditures
to K-12 education (16th), Arizona spends a
total (from state, local, and federal sources)
of only $8,655 annually per pupil (48th).
Teachers do, however, receive a relatively
large slice of that small pie, with 55 percent
of those expenditures dedicated to their
salaries and benefits (20th).
AREA 2: INVOLVEMENT IN POLITICS2
49TH
Teacher unions have not been major donors
to Arizona politics in the past decade
(perhaps seeing the futility of giving to
campaigns in so red a state—see sidebar).
Of the contributions received by state
political candidates, just 0.16 percent came
from teacher unions; unions in only five
states contributed less. Union donations to
political parties were just as paltry (0.95
percent; 25th). Further, only 6.3 percent
of the delegates to the Democratic and
Republican national conventions from this
historically conservative state identified as
teacher union members (44th).3
ARIZONA OVERALL RANK: 51ST1
TIER 5 (WEAKEST)
51
49
49
40
48
45
Overall Rank: 51stTier 5 (Weakest)
ARIZONA

AREA 3: SCOPE OF BARGAINING
TIED FOR 45TH
Arizona state law does not address
collective bargaining in education; districts
may decide whether to negotiate with
employee organizations (and are not
legally bound by the resulting agreements).
The scope of bargaining is likewise at
the discretion of districts. State law
does prohibit unions from automatically
collecting agency fees from non-members.
It also does not permit any public employee
strikes, teachers included.
AREA 4: STATE POLICIES
TIED FOR 49TH
Arizona teacher-employment and charter
policies are less aligned with traditional
teacher union interests than in any
other state, save Michigan. Arizona law
requires that student achievement data
significantly inform teacher evaluations,
and it does not allow districts to consider
seniority in determining layoffs—positions
typically opposed by unions. While unions
favor limiting charter schools, Arizona
promotes their growth. The state does
not cap the overall number of charters
and allows for multiple authorizers
(although the vast majority are overseen
by the state, with local school boards
authorizing only a handful). Moreover,
charter schools are automatically exempt
from most state laws (including those
related to teacher certification) and district
regulations (including collective bargaining
agreements).
AREA 5: PERCEIVED INFLUENCE
48TH
Stakeholders in Arizona view teacher
unions as weak. Survey respondents rank
their influence on education policy behind
that of the business roundtable/chamber of
commerce, education advocacy groups, the
state school board, and the charter school
association. They report that teacher unions
are not effective in protecting dollars for
education or in warding off education
proposals with which they disagree, and
that state education leaders are only
sometimes aligned with teacher-union
positions.
OVERALL
51ST
Arizona’s teacher unions are the weakest
in the nation. Even though bargaining is
permitted, they have low membership and
few financial resources. State law limits the
unions’ power to strike and gather revenue,
supports charter school expansion, and
does not offer teachers many of the job
securities seen in other states.
Overall Rank: 51stTier 5 (Weakest)
ARIZONA

For the Arizona Education Association (AEA), “strength in numbers” seems like an appropriate mantra. One example of joining forces: The AEA supported Republican Governor Jan Brewer’s Proposition 100—a temporary increase in sales tax to help finance education—and put its money where its mouth was by donating to the campaign and raising additional funds on the initiative’s behalf. The AEA acknowledged that it was “quite unusual” for it to support a Republican-led proposal, but its appetite for funding made for a temporary truce.4 With the short-term tax increase about to expire, the union aligned with numerous other groups—including education advocates, business alliances, and state Democrats—to support an initiative on the November 2012 ballot to make Proposition 100 permanent (and the courts have twice-thwarted opponents’ attempts to stop the initiative before the vote).5,6
The tax increase isn’t the only time other organizations, and the courts, gave the AEA a hand. The union couldn’t stop lawmakers from increasing employee pension contributions, but it supported a lawsuit filed by the Arizona State Retirement System citing the state breached its contract with retirees. Before the suit went to court, the legislature not only passed a bill returning to the old rate but also refunded the money back to the teachers, and the AEA celebrated.7 The union also won an injunction against a 2011 statute that would have stopped unions from deducting dues from members’ paychecks without annual authorization, if that money were to be used for political purposes. Adamant that this law inhibited free speech, AEA President Andrew Morrill declared “our voice for quality public schools will not be silenced.”8 But Brewer and fellow Republicans may do more than silence the union voice—they may well destroy it. If SB 1485, proposed in early 2012, passes, it will prohibit all public employees from unionizing with a law even more devastating than the one recently passed in Wisconsin (which only limited the scope of bargaining).9 The bill is currently tabled until the Senate reopens in 2013. Until then, all the unions in Arizona can do is wait and hope that they won’t have to go it alone.
ON PINS AND NEEDLES
Overall Rank: 51stTier 5 (Weakest)
ARIZONA

OVERALL RANK: 51ST
Area and Ranka General Indicator Sub-IndicatorSub-Indicator Rank/Statusb
AREA 1: RESOURCES & MEMBERSHIP
Membership By rank, what percentage of public-school teachers in the state are union members? 47th
Revenue By rank, what is the total yearly revenue (per teacher in the state) of the state-level NEA and/ or AFT affiliate(s)?
40th
Spending on education By rank, what percentage of state expenditures (of state general funds, state restricted funds, state bonds, and federal “pass-through” funds) is directed to K-12 education?
16th
By rank, what is the total annual per-pupil expenditure (of funds from federal, state, and local sources) in the state?
48th
By rank, what percentage of total annual per-pupil expenditures is directed to teacher salaries and benefits?
20th
AREA 2: INVOLVEMENTIN POLITICS
Contributions to candidates and political parties
By rank, what percentage of the total contributions to state candidates was donated by teacher unions?
46th
By rank, what percentage of the total contributions to state-level political parties was donated by teacher unions?
25th
Industry influence By rank, what percent of the contributions to state candidates from the ten highest-giving sectors was donated by teacher unions?
49th
Status of delegates By rank, what percentage of the state’s delegates to the Democratic and Republican conventions were members of teacher unions?
44th
AREA 3:SCOPE OF BARGAINING
Legal scope of bargaining What is the legal status of collective bargaining? Neither required nor prohibited
By rank, how broad is the scope of collective bargaining? 38th*
Automatic revenue streams What is the unions’ legal right to automatically collect agency fees from non-members and/or collect member dues via automatic payroll deductions?
Agency fees prohibited
Right to strike What is the legal status of teacher strikes? Prohibited
AREA 4:STATE POLICIES
Performance pay Does the state support performance pay for teachers? State supports/ encourages
Retirement By rank, what is the employer- versus employee-contribution rate to the teacher pension system? 46thc
Evaluations What is the maximum potential consequence for veteran teachers who receive unsatisfactory evaluation(s)?
Teacher improvement plan
Is classroom effectiveness included in teacher evaluations? If so, how is it weighted? Required; Significantly informs evaluation
Terms of employment How long before a teacher earns tenure? Three years
Is student/teacher performance considered in tenure decisions? If so, how is it weighted? Not included
Is seniority considered in teacher layoff decisions? If so, how is it weighted? Optional; May be considered among other factors
Is teacher performance included in teacher layoff decisions? If so, how is it weighted? Not required
By rank, what percentage of the teaching workforce was dismissed due to poor performance? 33rd
Class size Is class size restricted for grades 1-3? If so, is the restriction higher or lower than the national average (20)?
No restriction
ARIZONA RANKINGS BY AREA AND INDICATOR
40*
49
45*
49*
Overall Rank: 51stTier 5 (Weakest)
ARIZONA

Area and Rank General Indicator Sub-IndicatorSub-Indicator Rank/Status
AREA 4:STATE POLICIES
(cont.)
Charter school structural limitations
Is there a cap (limit) placed on the number of charter schools that can operate in the state (or other jurisdiction) and/or on the number of students who can attend charter schools?
No state cap (but authorizers are capped)
Does the state allow a variety of charter schools: start-ups, conversions, and virtual schools? Yes
How many charter authorizing options exist? How active are those authorizers? Two or more w/ limited activity
Charter school exemptions Are all charter schools automatically exempt from state laws and state/district regulations (except those that safeguard students and fiscal accountability)? If not, are they eligible for exemptions?
Complete automatic exemptions for all schools
Are all charter schools automatically exempt from state teacher-certification requirements? If not, are they eligible for exemptions?
Yes
Are all charter schools automatically exempt from collective bargaining agreements (CBAs)? If not, are they eligible for exemptions?
Automatically exempt
AREA 5:PERCEIVED INFLUENCEd
Relative influence of teacher unions
How do you rank the influence of teacher unions on education policy compared with other influential entities?
Fourth- or fifth-most influential
Influence over campaigns On a scale from always to never, how often do Democratic candidates need teacher-union support to get elected?
Sometimes/Often
On a scale from always to never, how often do Republican candidates need teacher-union support to get elected?
Rarely
Influence over spending To what extent, from strongly agree to strongly disagree, do you agree that even in times of cutbacks, teacher unions are effective in protecting dollars for education?
Disagree
Given recent budgetary constraints, would you say that teacher unions generally make concessions to prevent reductions in pay and benefits or fight hard to prevent those reductions?
Generally concede
Influence over policy To what extent, from strongly agree to strongly disagree, do you agree that teacher unions ward off proposals in your state with which they disagree?
Disagree
On a scale from always to never, how often do existing state education policies reflect teacher-union priorities?
Rarely/Sometimes
To what extent, from totally in line to not at all in line, were state education policies proposed by the governor during your state’s latest legislative session in line with teacher-union priorities?
Mostly not in line/Somewhat in line
To what extent, from totally in line to not at all in line, were legislative outcomes of your state’s latest legislative session in line with teacher-union priorities?
Mostly not in line/Somewhat in line
Influence over key stakeholders
On a scale from always to never, how often have the priorities of state education leaders aligned with teacher-union positions in the past three years?
Sometimes
Would you say that teacher unions typically compromise with policymakers to ensure that their preferred policies are enacted, or typically need not make concessions?
Generally compromise
* Tied with another state
a Area ranks are calculated using a weighted average of sub-indicators. For a more detailed description, see Appendix A.
b Where possible, we report a state’s rank as compared to other states on a given metric. For example, out of 51 states, Arizona has the 47th-highest percentage of teachers who are union members. Otherwise, we report a status: In Arizona, collective bargaining is neither required nor prohibited, and union agency fees are prohibited. For a more detailed description of our metrics and methodology, see Appendix A. To request the raw data for your state, send an email to [email protected]. c At the time our metric was calculated, a lawsuit over Arizona pension contributions was ongoing (see sidebar); at press time, Arizona amended its layoff policy to prohibit a district from retaining teachers based on seniority.
d For all survey questions, stakeholders were asked specifically about teacher unions, candidates, policies, and leaders in their state. In addition, we asked about unions and policies in the “current legislative session,” but because legislative calendars vary from state to state, responses refer to policies proposed and enacted within the 2010-11 window.
49*
48
Overall Rank: 51stTier 5 (Weakest)
ARIZONA
ENDNOTES
1 A state’s overall rank is calculated as follows: First, we score it on multiple sub-indicators (sub-indicator data and scores for Arizona are shown in the table, Arizona Rankings by Area and Indicator). Second, we take a weighted average of the sub-indicators in each of five areas. In each area, we use that average to place the states in rank order: For example, in Area 1: Resources and Membership, Arizona is ranked 40th of 51 based on the weighted average of its sub-indicators. To generate the state’s overall rank, we average the five area ranks together, then re-order the states. For a more detailed description of data sources and methodology, see Appendix A.
2 Readers should note that these figures include only direct donations from unions and union-connected PACs, but not their spending on electioneering/advertising, mobilizing the union’s own membership, lobbying, or advocacy. A recent Wall Street Journal report found that donations and lobbying activities account for a small share of union political spending compared with their expenditures on member mobilization and advocacy. Even the AFT agreed, making the argument that since its mission is organizing and activism, it will naturally spend significant amounts on these activities. Thus, the percentages we report here are extremely conservative representations of what unions actually spend on politics. For more information, see Appendix A, Area 2; Tom McGinty and Brody Mullins, “Political Spending by Unions Far Exceeds Direct Donations,” Wall Street Journal, July 10, 2012; and Jeff Hauser, “Wall Street Journal Compares Union Political Spending to Corporate Donations,” AFL-CIO, July 10, 2012.
3 At the time of publication, the 2000 conventions were the most recent for which such detailed data were available in forms that met rigorous standards. However, 2008 data provided by the Democratic National Convention were highly correlated with the reliable figures from 2000.
4 Jeremy Duda, “Brewer, Allies Make Final Plea For Prop. 100,” Arizona Capitol Times, May 17, 2010, http://azcapitoltimes.com/news/2010/05/17/brewer-allies-make-final-plea-for-prop-100/.
5 E.J. Perkins, “Understanding Arizona’s Propositions: 2012 Series, Prop 204,” Morrison Institute for Public Policy, Arizona State University, August 2012, http://morrisoninstitute.asu.edu/2012-understanding-arizonas-propositions/2012-proposition-204-quality-education-and-jobs-act.
6 “Prop. 204 Wins Second Court Victory,” Arizona City Independent, August 22, 2012, http://www.trivalleycentral.com/arizona_city_independent/news/prop-wins-second-court-victory/article_69760958-afc1-553e-83d6-68d6d1f5e79d.html.
7 Craig Harris, “Arizona Public Workers Will Get Refunds,” Arizona Republic, February 10, 2012, http://www.azcentral.com/arizonarepublic/local/articles/2012/02/08/20120208arizona-public-workers-will-get-refunds.html.
8 “AEA Wins Injunction Against Educator Gag Bill,” Arizona Education Association, accessed July 23, 2012, http://arizonaea.org/home/403.htm.
9 Sarah Jaffe, “Arizona’s Vicious War On Workers,” Alternet.com, February 6, 2012, http://www.salon.com/2012/02/06/arizonas_vicious_war_on_workers/.
Overall Rank: 51stTier 5 (Weakest)
ARIZONA

STRONGER WEAKER
1. RESOURCES AND MEMBERSHIP
OVERALL
2. INVOLVEMENT IN POLITICS
3. SCOPE OF BARGAINING
4. STATE POLICIES
5. PERCEIVED INFLUENCE
AREA 1: RESOURCES AND MEMBERSHIP
50TH
Arkansas’s state teacher union has low
membership and scant resources. With
just 35 percent of its teachers belonging
to the union, the Natural State posts the
second-smallest membership density
in the country. Further, the Arkansas
Education Association (AEA) brings in
only $140 per teacher annually, 46th out
of 51 jurisdictions. State spending on
education is low: 17.4 percent of state
expenditures in Arkansas are directed
toward K–12 education (35th). Overall
dollars for education (from local, state, and
federal sources) are relatively low as well—
Arkansas spends $10,757 per pupil (30th),
with 51.1 percent of that money going
toward teacher salaries and benefits (45th).
AREA 2: INVOLVEMENT IN POLITICS2
TIED FOR 47TH
Teacher unions have been relatively
uninvolved in Arkansas state politics over
the past decade. Just 0.27 percent of
donations to candidates for state office
came from the AEA (38th of 51).3 Further,
only 0.21 percent of the donations received
by state political parties came from teacher
unions (44th). Unions had a comparatively
quiet presence at the Democratic and
Republican national conventions as well:
11.8 percent of Arkansas delegates were
teacher-union members (32nd).4
ARKANSAS OVERALL RANK: 48TH1
TIER 5 (WEAKEST)
48
47
20
50
37
45
Overall Rank: 48th Tier 5 (Weakest)
ARKANSAS

AREA 3: SCOPE OF BARGAINING
TIED FOR 45TH
Arkansas neither grants nor denies
collective bargaining rights to teachers
and other public employees. While the law
requires that districts maintain personnel
policies that stipulate a number of teacher
working conditions (including salaries,
benefits, and evaluations), it does not
explicitly require (or prohibit) bargaining
over any of these provisions. As such, all
twenty-one items examined in this metric
are within the scope of bargaining. The
state bars unions from collecting agency
fees automatically, however, and does not
allow teachers to strike.
AREA 4: STATE POLICIES
20TH
Arkansas’s state policies are a mixed
bag; some align or partially align with
traditional union interests, while others do
not. For example, the state requires that
objective measures of student learning be
included in teacher evaluations (counter
to union goals), but it does not specify
what those measures are or how much
weight they should be given. The state
allows charter schools to apply for waivers
from district regulations and teacher-
certification requirements (again counter
to union goals), but it also does not grant
charters automatic exemptions from such
policies, as does the law in many other
states. Arkansas does not require districts
to consider teacher performance when
determining layoffs and has the nation’s
lowest annual rate of dismissal due to poor
teacher performance (0.16 percent). Other
state policies are not union-favorable,
however: For example, the consequences of
unsatisfactory teacher evaluations are more
stringent than in many states.
AREA 5: PERCEIVED INFLUENCE
37TH
Stakeholders in Arkansas indicate that
the state teacher union is active but
not universally successful in politics.
They report that it fought hard, given
recent budgetary constraints, to prevent
reductions in teacher pay and benefits.
But they also note that policies proposed
by the governor in the latest legislative
session, and those actually enacted,
were only somewhat in line with teacher
union priorities.5 Stakeholders rank union
influence on education policy behind that
of the business roundtable/chamber of
commerce, education reform advocacy
groups, the state association of school
administrators, and the state charter school
association. They also note that the union
often turns to compromise to see some
favorable policies enacted rather than
maintaining a hard line.
OVERALL
48TH
While some of Arkansas’s policies favor
union interests, its state-level teacher union
struggles to build a strong foundation of
resources and a powerful reputation in
policy debates. Even though bargaining is
permitted, the strength of the state union
is comparable to that of unions in states
where bargaining is explicitly prohibited by
law.
Overall Rank: 48th Tier 5 (Weakest)
ARKANSAS

“You win some, you lose some” might best describe politics in 2011 and 2012 for the Arkansas Education Association (AEA). Although it supported the state’s Race to the Top (RTTT) application, it actively fought against a number of state policies that would have strengthened the state’s bid but threatened teacher job security and traditional union interests.6 Reform proponents did manage to overturn a policy that maintained seniority as a key factor in teacher dismissals,7 but it was likely too little, too late. Federal reviewers ultimately dinged the state for its inability to link student and teacher data, its limited alternative routes for educators and principals to enter the profession, and its still-weak enthusiasm for performance-based teacher evaluations.8 Arkansas’s RTTT application was ultimately rejected.
In other legislation, the AEA can claim victory for its role in killing off a “parent trigger” bill—which would have allowed parents to remove their children from failing schools. But the AEA failed to advance legislation that would have added yet another way for teachers and staff to appeal disciplinary actions and performance reviews.9 And despite union opposition, Arkansas increased the cap on the number of charter schools. Act 987 (passed in 2011) removed the fixed cap, which had been twenty-four, and allows for deliberate (some might say sluggish) growth.10 The union’s argument that raising the cap would “result in more segregation [and] fewer resources for students” apparently fell on deaf ears.11 So while the tug-of-war in Arkansas continues, one thing is certain: The AEA has been very busy pulling on its end of the rope.
PUSH AND PULL
Overall Rank: 48th Tier 5 (Weakest)
ARKANSAS

OVERALL RANK: 48TH
Area and Ranka General Indicator Sub-IndicatorSub-Indicator Rank/Statusb
AREA 1: RESOURCES & MEMBERSHIP
Membership By rank, what percentage of public-school teachers in the state are union members? 50th
Revenue By rank, what is the total yearly revenue (per teacher in the state) of the state-level NEA and/ or AFT affiliate(s)?
46th
Spending on education By rank, what percentage of state expenditures (of state general funds, state restricted funds, state bonds, and federal “pass-through” funds) is directed to K-12 education?
35th*
By rank, what is the total annual per-pupil expenditure (of funds from federal, state, and local sources) in the state?
30th
By rank, what percentage of total annual per-pupil expenditures is directed to teacher salaries and benefits?
45th
AREA 2: INVOLVEMENTIN POLITICS
Contributions to candidates and political parties
By rank, what percentage of the total contributions to state candidates was donated by teacher unions?
38th
By rank, what percentage of the total contributions to state-level political parties was donated by teacher unions?
44th
Industry influence By rank, what percent of the contributions to state candidates from the ten highest-giving sectors was donated by teacher unions?
41st
Status of delegates By rank, what percentage of the state’s delegates to the Democratic and Republican conventions were members of teacher unions?
32nd
AREA 3:SCOPE OF BARGAINING
Legal scope of bargaining What is the legal status of collective bargaining? Permitted
By rank, how broad is the scope of collective bargaining? 38th*
Automatic revenue streams What is the unions’ legal right to automatically collect agency fees from non-members and/or collect member dues via automatic payroll deductions?
Agency fees prohibited
Right to strike What is the legal status of teacher strikes? Prohibited
AREA 4:STATE POLICIES
Performance pay Does the state support performance pay for teachers? State supports/ encourages
Retirement By rank, what is the employer- versus employee-contribution rate to the teacher pension system? 12th
Evaluations What is the maximum potential consequence for veteran teachers who receive unsatisfactory evaluation(s)?
Eligible for dismissal
Is classroom effectiveness included in teacher evaluations? If so, how is it weighted? Evidence of student “learning” required
Terms of employment How long before a teacher earns tenure? Three yearsc
Is student/teacher performance considered in tenure decisions? If so, how is it weighted? Not included
Is seniority considered in teacher layoff decisions? If so, how is it weighted? Optional; May be considered among other factorsc
Is teacher performance included in teacher layoff decisions? If so, how is it weighted? Not required
By rank, what percentage of the teaching workforce was dismissed due to poor performance? 1st
Class size Is class size restricted for grades 1-3? If so, is the restriction higher or lower than the national average (20)?
Yes; Higher
ARKANSAS RANKINGS BY AREA AND INDICATOR
50
47*
45*
20
Overall Rank: 48th Tier 5 (Weakest)
ARKANSAS

Area and Rank General Indicator Sub-IndicatorSub-Indicator Rank/Status
AREA 4:STATE POLICIES
(cont.)
Charter school structural limitations
Is there a cap (limit) placed on the number of charter schools that can operate in the state (or other jurisdiction) and/or on the number of students who can attend charter schools?
State cap with ample room for growth
Does the state allow a variety of charter schools: start-ups, conversions, and virtual schools? Yes
How many charter authorizing options exist? How active are those authorizers? Single option; Some activity
Charter school exemptions Are all charter schools automatically exempt from state laws and state/district regulations (except those that safeguard students and fiscal accountability)? If not, are they eligible for exemptions?
No; Schools can apply for exemptions
Are all charter schools automatically exempt from state teacher-certification requirements? If not, are they eligible for exemptions?
No; Schools can apply for exemptions
Are all charter schools automatically exempt from collective bargaining agreements (CBAs)? If not, are they eligible for exemptions?
Partially; Full automatic exemption for some schools
AREA 5:PERCEIVED INFLUENCEd
Relative influence of teacher unions
How do you rank the influence of teacher unions on education policy compared with other influential entities?
Third- or fourth-most influential
Influence over campaigns On a scale from always to never, how often do Democratic candidates need teacher-union support to get elected?
Sometimes/Often
On a scale from always to never, how often do Republican candidates need teacher-union support to get elected?
Rarely/Sometimes
Influence over spending To what extent, from strongly agree to strongly disagree, do you agree that even in times of cutbacks, teacher unions are effective in protecting dollars for education?
Neutral
Given recent budgetary constraints, would you say that teacher unions generally make concessions to prevent reductions in pay and benefits or fight hard to prevent those reductions?
Fight
Influence over policy To what extent, from strongly agree to strongly disagree, do you agree that teacher unions ward off proposals in your state with which they disagree?
Neutral
On a scale from always to never, how often do existing state education policies reflect teacher-union priorities?
Sometimes
To what extent, from totally in line to not at all in line, were state education policies proposed by the governor during your state’s latest legislative session in line with teacher-union priorities?
Somewhat in line
To what extent, from totally in line to not at all in line, were legislative outcomes of your state’s latest legislative session in line with teacher-union priorities?
Somewhat in line
Influence over key stakeholders
On a scale from always to never, how often have the priorities of state education leaders aligned with teacher-union positions in the past three years?
Sometimes
Would you say that teacher unions typically compromise with policymakers to ensure that their preferred policies are enacted, or typically need not make concessions?
Compromise
* Tied with another state
a Area ranks are calculated using a weighted average of sub-indicators. For a more detailed description, see Appendix A.
b Where possible, we report a state’s rank as compared to other states on a given metric. For example, out of 51 states, Arkansas has the 50th-highest percentage of teachers who are union members. Otherwise, we report a status: Arkansas permits collective bargaining, and union agency fees are prohibited. For a more detailed description of our metrics and methodology, see Appendix A. To request the raw data for your state, send an email to [email protected].
c As of March 2011, Arkansas teachers do not have tenure; after a three-year probationary term, they reach “non-probationary” status. State law allows districts to set their own criteria for granting such status and does not require that they consider teacher effectiveness. However, “non-probationary” teachers receive the same basic protections as those who have tenure in other states in that their contracts are permanent unless the district chooses not to renew them (as opposed to continuing contracts which must be renewed on an annual basis).
d For all survey questions, stakeholders were asked specifically about teacher unions, candidates, policies, and leaders in their state. In addition, we asked about unions and policies in the “current legislative session,” but because legislative calendars vary from state to state, responses refer to policies proposed and enacted within the 2010-11 window.
20
37
Overall Rank: 48th Tier 5 (Weakest)
ARKANSAS

ENDNOTES
1 A state’s overall rank is calculated as follows: First, we score it on multiple sub-indicators (sub-indicator data and scores for Arkansas are shown in the table, Arkansas Rankings by Area and Indicator). Second, we take a weighted average of the sub-indicators in each of five areas. In each area, we use that average to place the states in rank order: For example, in Area 1: Resources and Membership, Arkansas is ranked 50th of 51 based on the weighted average of its sub-indicators. To generate the state’s overall rank, we average the five area ranks together, then re-order the states. For a more detailed description of data sources and methodology, see Appendix A.
2 Readers should note that these figures include only direct donations from unions and union-connected PACs, but not their spending on electioneering/advertising, mobilizing the union’s own membership, lobbying, or advocacy. A recent Wall Street Journal report found that donations and lobbying activities account for a small share of union political spending compared with their expenditures on member mobilization and advocacy. Even the AFT agreed, making the argument that since its mission is organizing and activism, it will naturally spend significant amounts on these activities. Thus, the percentages we report here are extremely conservative representations of what unions actually spend on politics. For more information, see Appendix A, Area 2; Tom McGinty and Brody Mullins, “Political Spending by Unions Far Exceeds Direct Donations,” Wall Street Journal, July 10, 2012; and Jeff Hauser, “Wall Street Journal Compares Union Political Spending to Corporate Donations,” AFL-CIO, July 10, 2012.
3 Arkansas is one of just four states where local teacher associations did not contribute to candidates and political parties. In Arkansas, the AEA was the lone union donor to candidates; it also gave to parties, as did national teacher unions.
4 At the time of publication, the 2000 conventions were the most recent for which such detailed data were available in forms that met rigorous standards. However, 2008 data provided by the Democratic National Convention were highly correlated with the reliable figures from 2000.
5 We asked stakeholders about unions and policies in the “current legislative session,” but because legislative calendars vary from state to state, responses refer to policies proposed and enacted within the 2010-11 window.
6 “Race To The Top,” Arkansas Education Association, accessed July 27, 2011, http://www.aeaonline.org/members/RTT.asp.
7 “AEA Supports HB2178 ‘Teacher Evaluation Bill,’” Arkansas Education Association, accessed July 27, 2011, http://msg4svc.net/servlet/Pv?c=703d6e6561617226733d30266d3d32323326743d4826723d302664613d30267469643d30.
8 Race To The Top Technical Review Form – Tier 1, accessed June 29, 2012, http://www2.ed.gov/programs/racetothetop/phase1-applications/comments/arkansas.pdf.
9 Arkansas Senate Bill 884, 88th General assembly, March 2011, http://www.arkleg.state.ar.us/assembly/2011/2011R/Bills/SB884.pdf.
10 According to the Arkansas Senate newsletter: “When the number of charter schools gets to within two of the limit, the limit increases by five. (For example, if the state Board of Education approves 22 charter schools the maximum number allowed will go up to 29.)” See http://www.arkansas.gov/senate/newsroom/index.php?do:newsDetail=1&news_id=302.
11 “Clarification: HB 1894 ‘Parent Trigger’ Bill Fails In House Education Committee,” Arkansas Education Association, accessed July 27, 2011, http://msg4svc.net/servlet/Pv?c=703d6e6561617226733d30266d3d32323526743d4826723d302664613d30267469643d30.
Overall Rank: 48th Tier 5 (Weakest)
ARKANSAS

STRONGER WEAKER
1. RESOURCES AND MEMBERSHIP
OVERALL
2. INVOLVEMENT IN POLITICS
3. SCOPE OF BARGAINING
4. STATE POLICIES
5. PERCEIVED INFLUENCE
AREA 1: RESOURCES AND MEMBERSHIP
TIED FOR 20TH
California’s NEA and AFT state affiliates
have relatively robust resources, although
education spending in the state, and on
teachers in particular, is not particularly
high. The Golden State has the 11th-highest
rate of teacher union membership—93.6
percent of teachers are unionized. The
two state unions bring in $597 annually
per teacher in the state (13th of 51). But
California is infamous for its financial
struggles (see sidebar). While a relatively
high percentage of state expenditures
go to K-12 education (20.9 percent; 19th),
when combined with federal and local
funds, that state money amounts to just
$8,667 in annual per-pupil spending (47th).
Teachers receive a comparatively small
piece of that already-small pie, with 53.2
percent of expenditures going toward their
salaries and benefits (33rd).
AREA 2: INVOLVEMENT IN POLITICS2
TIED FOR 18TH
California’s teacher unions invest heavily
in building a strong presence in state
politics.3 In the past decade, 0.69 percent
of donations to California state candidates
came from teacher unions (21st). Those
contributions amounted to 6 percent of
the money from the state’s ten highest-
giving sectors (22nd). The unions also
gave 4.3 percent of the funds received by
state political parties, ranking 2nd. Finally,
12.3 percent of California delegates to
the Democratic and Republican national
conventions were teacher union members
(30th).4
CALIFORNIA OVERALL RANK: 6TH1
TIER 1 (STRONGEST)
6
18
37
20
1
1
Overall Rank: 6thTier 1 (Strongest)
CALIFORNIA

AREA 3: SCOPE OF BARGAINING
1ST
California has the most union-friendly
bargaining laws in the nation. The state
requires collective bargaining in education,
lets its unions automatically deduct
agency fees from non-member teachers,
and permits teacher strikes. Further, of
the twenty-one items examined in this
metric, California mandates that eleven are
bargained (only Nevada requires more).
The remaining ten provisions are implicitly
within the scope of bargaining, as state law
is silent on them.
AREA 4: STATE POLICIES
37TH
California’s charter school policies are not
nearly as union-favorable as its bargaining
laws. Unions typically want to limit
charter school expansion, but California
encourages it: The state cap on the number
of charters allows ample room for growth,
and charters are automatically exempt from
district collective bargaining agreements
and nearly every state law and district
regulation (although the state does place
stringent application and accountability
requirements on virtual schools). Teacher-
employment policies are a mixed bag.
The state supports performance pay
for teachers, but only in underachieving
schools. Teachers are not automatically
eligible for dismissal after an unsatisfactory
evaluation, but California teachers are
dismissed because of poor performance
at a higher rate than in most other
states. Student learning is not a required
component to either tenure or teacher
evaluations, but the state also does not
mandate class-size restrictions.
AREA 5: PERCEIVED INFLUENCE
1ST
The responses from California stakeholders
put the state’s unions at the top of the
most-powerful list. They rank unions as one
of the most influential forces on education
policy and report that, even under recent
budgetary constraints, they have been
effective in protecting dollars for education
and in warding off education reform
proposals with which they disagree (for
example, K-12 education avoided massive
mid-year cuts in 2011, a considerable
accomplishment given California’s fiscal
problems, but one that may not last long—
see sidebar). Survey respondents also
reveal that while policies proposed by the
governor in the latest legislative session
were only somewhat in line with union
priorities, outcomes of the session were
mostly in line with those priorities.5 Finally,
they report that state education leaders are
often aligned with teacher union positions,
and they unanimously agreed that teacher
unions need not compromise to see their
preferred policies enacted.
OVERALL
6TH
The Golden State’s teacher unions are quite
powerful; in a state that does not spend
much on K-12 education, they’ve gathered
considerable internal resources (and
do not shy away from dedicating those
resources to state politics—with apparent
success, given their present reputation
for influence). Although charter and
employment policies are not well aligned
with traditional union interests, California is
exceptionally permissive when it comes to
teacher bargaining rights.
Overall Rank: 6thTier 1 (Strongest)
CALIFORNIA

These days, everyone in the Golden State is counting their pennies. In 2010, lawmakers seeking Race to the Top (RTTT) dollars passed bills that removed the cap on charter schools; created a “trigger law” that let parents petition for new staff, management, or programs at their children’s school; encouraged districts to improve failing schools by firing staff or converting them to charters; and included student achievement in teacher evaluations.6 Not surprisingly, the state’s teacher unions did not support these measures.7 And when California’s first and second RTTT applications were rejected, reviewer comments indicated that the lack of union support had a lot to do with the decision. Noting that the first application was not endorsed by the unions in 74 percent of California districts (including six of the state’s largest ten), one reviewer stated that “the lack of union buy-in at this stage raises serious concerns about the ability of the State to implement the Race to the Top reforms.”8 The California Federation of Teachers president Marty Hittleman reacted positively: “These ideas [in the new bills] will create more harm than good. Now at least California will not be the guinea pig for these misguided proposals.”9
Rather than try again, pro-labor Governor Jerry Brown shelved RTTT and turned his attention to the state’s impending financial crisis. At first, union interests seemed safe: In June 2011, legislators passed a last-minute bill that prohibited teacher layoffs during the 2011–12 school year. 10 Then Brown announced the bad news: California had anticipated a 2011 revenue increase of $4 billion but might fall an astounding $3.7 billion short. If the projections became reality, public education would share in $2 billion of automatic cuts. State unions and their local affiliates rallied, and by year’s end, K-12 districts (and their teachers) could breathe a sigh of relief—they would see only $330 million in cuts, most of which would come from transportation.11 To the chagrin of education advocates, however, Brown now threatens to slash nearly $5 billion from K-12 education if voters don’t pass his November 2012 initiative to increase sales tax and income tax for the wealthy. As the unions again rally to protect funds for education, they face a challenge to their own funds as well—another November initiative, Proposition 32, would limit union political contributions and payroll deductions, a major source of union power.12 With their livelihood, as well as precious dollars for teachers and students, on the ballot, it is shaping up to be an active—and expensive—campaign season for California teacher unions.13
DOLLARS AND SENSE
Overall Rank: 6thTier 1 (Strongest)
CALIFORNIA

OVERALL RANK: 6TH
Area and Ranka General Indicator Sub-IndicatorSub-Indicator Rank/Statusb
AREA 1: RESOURCES & MEMBERSHIP
Membership By rank, what percentage of public-school teachers in the state are union members? 11th
Revenue By rank, what is the total yearly revenue (per teacher in the state) of the state-level NEA and/ or AFT affiliate(s)?
13th
Spending on education By rank, what percentage of state expenditures (of state general funds, state restricted funds, state bonds, and federal “pass-through” funds) is directed to K-12 education?
19th
By rank, what is the total annual per-pupil expenditure (of funds from federal, state, and local sources) in the state?
47th
By rank, what percentage of total annual per-pupil expenditures is directed to teacher salaries and benefits?
33rd
AREA 2: INVOLVEMENTIN POLITICS
Contributions to candidates and political parties
By rank, what percentage of the total contributions to state candidates was donated by teacher unions?
21st
By rank, what percentage of the total contributions to state-level political parties was donated by teacher unions?
2nd
Industry influence By rank, what percent of the contributions to state candidates from the ten highest-giving sectors was donated by teacher unions?
22nd
Status of delegates By rank, what percentage of the state’s delegates to the Democratic and Republican conventions were members of teacher unions?
30th
AREA 3:SCOPE OF BARGAINING
Legal scope of bargaining What is the legal status of collective bargaining? Mandatory
By rank, how broad is the scope of collective bargaining? 2nd
Automatic revenue streams What is the unions’ legal right to automatically collect agency fees from non-members and/or collect member dues via automatic payroll deductions?
Permitted
Right to strike What is the legal status of teacher strikes? Permitted
AREA 4:STATE POLICIES
Performance pay Does the state support performance pay for teachers? State-sponsored initiatives offered in select districts
Retirement By rank, what is the employer- versus employee-contribution rate to the teacher pension system? 26th
Evaluations What is the maximum potential consequence for veteran teachers who receive unsatisfactory evaluation(s)?
Teacher improvement plan
Is classroom effectiveness included in teacher evaluations? If so, how is it weighted? Not required
Terms of employment How long before a teacher earns tenure? Two years
Is student/teacher performance considered in tenure decisions? If so, how is it weighted? Not included
Is seniority considered in teacher layoff decisions? If so, how is it weighted? Required; Considered among other factors
Is teacher performance included in teacher layoff decisions? If so, how is it weighted? Not required
By rank, what percentage of the teaching workforce was dismissed due to poor performance? 40th
Class size Is class size restricted for grades 1-3? If so, is the restriction higher or lower than the national average (20)?
No restriction
CALIFORNIA RANKINGS BY AREA AND INDICATOR
20*
18*
1
37
Overall Rank: 6thTier 1 (Strongest)
CALIFORNIA

Area and Rank General Indicator Sub-IndicatorSub-Indicator Rank/Status
AREA 4:STATE POLICIES
(cont.)
Charter school structural limitations
Is there a cap (limit) placed on the number of charter schools that can operate in the state (or other jurisdiction) and/or on the number of students who can attend charter schools?
State cap with ample room for growth
Does the state allow a variety of charter schools: start-ups, conversions, and virtual schools? Yes
How many charter authorizing options exist? How active are those authorizers? Two or more w/ limited jurisdiction
Charter school exemptions Are all charter schools automatically exempt from state laws and state/district regulations (except those that safeguard students and fiscal accountability)? If not, are they eligible for exemptions?
Yes
Are all charter schools automatically exempt from state teacher-certification requirements? If not, are they eligible for exemptions?
No; Certification is required but terms are flexible
Are all charter schools automatically exempt from collective bargaining agreements (CBAs)? If not, are they eligible for exemptions?
Yes
AREA 5:PERCEIVED INFLUENCEc
Relative influence of teacher unions
How do you rank the influence of teacher unions on education policy compared with other influential entities?
Most or second-most influential
Influence over campaigns On a scale from always to never, how often do Democratic candidates need teacher-union support to get elected?
Often/Always
On a scale from always to never, how often do Republican candidates need teacher-union support to get elected?
**
Influence over spending To what extent, from strongly agree to strongly disagree, do you agree that even in times of cutbacks, teacher unions are effective in protecting dollars for education?
Agree
Given recent budgetary constraints, would you say that teacher unions generally make concessions to prevent reductions in pay and benefits or fight hard to prevent those reductions?
Fight
Influence over policy To what extent, from strongly agree to strongly disagree, do you agree that teacher unions ward off proposals in your state with which they disagree?
Agree
On a scale from always to never, how often do existing state education policies reflect teacher-union priorities?
Sometimes/Often
To what extent, from totally in line to not at all in line, were state education policies proposed by the governor during your state’s latest legislative session in line with teacher-union priorities?
Somewhat/Mostly in line
To what extent, from totally in line to not at all in line, were legislative outcomes of your state’s latest legislative session in line with teacher-union priorities?
Mostly/Totally in line
Influence over key stakeholders
On a scale from always to never, how often have the priorities of state education leaders aligned with teacher-union positions in the past three years?
Often
Would you say that teacher unions typically compromise with policymakers to ensure that their preferred policies are enacted, or typically need not make concessions?
Does not concede
* Tied with another state
** Insufficient number of responses to this particular question
a Area ranks are calculated using a weighted average of sub-indicators. For a more detailed description, see Appendix A.
b Where possible, we report a state’s rank as compared to other states on a given metric. For example, out of 51 states, California has the 11th-highest percentage of teachers who are union members. Otherwise, we report a status: California has mandatory collective bargaining, and union agency fees are permitted. For a more detailed description of our metrics and methodology, see Appendix A. To request the raw data for your state, send an email to [email protected].
c For all survey questions, stakeholders were asked specifically about teacher unions, candidates, policies, and leaders in their state. In addition, we asked about unions and policies in the “current legislative session,” but because legislative calendars vary from state to state, responses refer to policies proposed and enacted within the 2010-11 window.
37
1
Overall Rank: 6thTier 1 (Strongest)
CALIFORNIA

ENDNOTES
1 A state’s overall rank is calculated as follows: First, we score it on multiple sub-indicators (sub-indicator data and scores for California are shown in the table, California Rankings by Area and Indicator). Second, we take a weighted average of the sub-indicators in each of five areas. In each area, we use that average to place the states in rank order: For example, in Area 1: Resources and Membership, California is ranked 20th of 51 based on the weighted average of its sub-indicators. To generate the state’s overall rank, we average the five area ranks together, then re-order the states. For a more detailed description of data sources and methodology, see Appendix A.
2 Readers should note that these figures include only direct donations from unions and union-connected PACs, but not their spending on electioneering/advertising, mobilizing the union’s own membership, lobbying, or advocacy. A recent Wall Street Journal report found that donations and lobbying activities account for a small share of union political spending compared with their expenditures on member mobilization and advocacy. Even the AFT agreed, making the argument that since its mission is organizing and activism, it will naturally spend significant amounts on these activities. Thus, the percentages we report here are extremely conservative representations of what unions actually spend on politics. For more information, see Appendix A, Area 2; Tom McGinty and Brody Mullins, “Political Spending by Unions Far Exceeds Direct Donations,” Wall Street Journal, July 10, 2012; and Jeff Hauser, “Wall Street Journal Compares Union Political Spending to Corporate Donations,” AFL-CIO, July 10, 2012.
3 While our overall metric reports the strength of state teacher unions, this area also captures contributions to state campaigns and parties from national unions and local union affiliates. Typically, their contributions are much smaller than the donations from the state unions. But in California, total donations from a large number of local unions account for about 10 percent of total union dollars.
4 At the time of publication, the 2000 conventions were the most recent for which such detailed data were available in forms that met rigorous standards. However, 2008 data provided by the Democratic National Convention were highly correlated with the reliable figures from 2000.
5 We asked stakeholders about unions and policies in the “current legislative session,” but because legislative calendars vary from state to state, responses refer to policies proposed and enacted within the 2010-11 window.
6 Corey G. Johnson, “We Lost Again In Race To The Top. Now What?” California Watch, August 25, 2010, http://californiawatch.org/dailyreport/we-lost-again-race-top-now-what-4258.
7 Howard Blume, “Schwarzenegger Signs School Legislation,” Los Angeles Times, January 8, 2010, http://articles.latimes.com/2010/jan/08/local/la-me-race8-2010jan08.
8 U.S. Department of Education, “States’ Applications, Scores, And Comments For Phase 1,” last modified February 12, 2012, http://www2.ed.gov/programs/racetothetop/phase1-applications/index.html.
9 Jill Tucker, “California Misses Cut For US Education Funds,” San Francisco Chronicle, March 5, 2010, http://www.sfgate.com/education/article/California-misses-cut-for-U-S-education-funds-3271306.php.
10 John Fensterwald, “Brown Names Seven To State Board,” Silicon Valley Education Foundation, January 6, 2011, http://toped.svefoundation.org/2011/01/06/brown-appoints-majority-to-state-board/.
11 Associated Press, “Budget Shortfall Triggers $1b In California Midyear Cuts,” December 13, 2011, http://sanfrancisco.cbslocal.com/2011/12/13/california-midyear-california-to-learn-extent-of-midyear-budget-cuts/.
12 Joe Garofoli, “Calif. Prop. 32 In Unions’ Crosshairs,” San Francisco Chronicle, July 18, 2012, http://www.sfgate.com/politics/joegarofoli/article/Calif-Prop-32-in-unions-crosshairs-3718306.php.
13 As of this writing, the California Teachers Association has put aside $7.5 million to fight Prop 32. Another $9 million has been authorized by the board to defeat Prop 32 and help pass Prop 30 (which provides education dollars by increasing the tax rate for wealthy individuals). See http://blogs.sacbee.com/the_state_worker/2012/08/california-teachers-association-gives-75-million-to-no-on-32.html.
Overall Rank: 6thTier 1 (Strongest)
CALIFORNIA

STRONGER WEAKER
1. RESOURCES AND MEMBERSHIP
OVERALL
2. INVOLVEMENT IN POLITICS
3. SCOPE OF BARGAINING
4. STATE POLICIES
5. PERCEIVED INFLUENCE
AREA 1: RESOURCES AND MEMBERSHIP
TIED FOR 37TH
Colorado’s two state teacher unions have
limited financial resources and membership.
With 62.4 percent of its teachers unionized,
the Centennial State posts the 34th-highest
rate of teacher union membership out of
51 jurisdictions. The state unions bring
in $256 annually per teacher in the state
(36th). State spending on K–12 education
is relatively high, but high spending
does not translate into expenditures on
teachers. While 25.5 percent of the state
expenditures go toward K–12 education
(7th), total K–12 per-pupil expenditures
from all sources ($9,155) and the
percentage of that total money directed to
teacher salaries and benefits (50.9 percent)
are lower than in nearly every other state in
the country.
AREA 2: INVOLVEMENT IN POLITICS2
TIED FOR 18TH
Teacher unions have been quite active
donors in Colorado state politics over
the past decade.3 Their contributions
accounted for 2.1 percent of all the funds
received by state-level political candidates,
placing them 6th compared to unions in
other states. A whopping 25.8 percent
of all money donated by the ten highest-
giving sectors in the state came from
teacher unions, the largest such proportion
in the country. In addition, teacher union
contributions comprised 0.84 percent
of the total donations to state political
parties (28th). Despite high levels of
giving, however, only 4.2 percent of
Colorado’s delegates to the Democratic
and Republican national conventions were
teacher union members—only Kentucky
had fewer.4
COLORADO OVERALL RANK: 35TH1
TIER 4 (WEAK)
35
18
48
37
29
25
Overall Rank: 35thTier 4 (Weak)
COLORADO

AREA 3: SCOPE OF BARGAINING
25TH
Colorado neither grants nor denies
collective bargaining rights to teachers
and other public employees. While it does
allow unions to collect agency fees from
non-members, unions cannot automatically
deduct dues from the paychecks of its own
members without their written consent.
The state permits teacher strikes.
AREA 4: STATE POLICIES
48TH
Many state policies in Colorado do not
align with teacher union interests. The
state requires that student achievement
be the preponderant criterion in teacher
evaluations and mandates that teachers
be eligible for dismissal (rather than
improvement plans) after multiple
unsatisfactory ratings. Districts must also
consider teacher performance alongside
seniority when making tenure and
layoff decisions, and they must include
performance as a basis for compensation.
Further, the state does not cap the number
of charter schools allowed to operate; it
exempts charters from many state and
district laws and regulations; and charter
schools do not typically participate in
district collective bargaining agreements.
AREA 5: PERCEIVED INFLUENCE
29TH
The reputation of teacher unions in
Colorado is strong in some areas, weak in
others. Stakeholders rank teacher unions
as the second-most influential entities
on education policy, behind education
advocacy organizations. In addition, they
report that teacher unions fought hard
during the recent period of budgetary
stringency to prevent reductions in pay
and benefits, and that they are generally
effective in protecting dollars for education.
On the other hand, survey respondents
note that policies proposed by the
governor and those subsequently enacted
in the latest legislative session were only
partly in line with union priorities.5 They
report that state education leaders are
only sometimes aligned with teacher
union positions and that teacher unions
more often than not turn to compromise
to see some of their policies enacted.
This perception may stem from the union
role in the design and implementation of
Colorado’s teacher-evaluation system (see
sidebar).
OVERALL
35TH
Despite limited resources, Colorado’s
teacher unions are active in state politics.
And, despite a state policy environment
that is not particularly union-favorable, they
have garnered moderate influence in the
state, as perceived by stakeholders.
Overall Rank: 35thTier 4 (Weak)
COLORADO

Eyes across the nation will closely monitor the implementation of Colorado’s new teacher-evaluation system, slated to take effect in 2013-14. The “Educator Effectiveness” legislation, passed in Spring 2010 as part of Senate Bill 191, requires that at least half of a teacher’s evaluation be based on student academic growth. Opponents, including the vocal Colorado Education Association (CEA), offered staunch resistance when the bill was first proposed, arguing that the new law was vague, underfunded, and ill-conceived. CEA President Beverly Ingle remarked, “CEA has been involved in every education reform measure in this state—CAP4K, longitudinal growth, accountability, and accreditation. We know what works in education in Colorado—and SB 191 doesn’t.”6
Lawmakers went back to the drawing board. They added, among other changes, a provision that permitted seniority to be considered in layoffs and an appeals process for teachers placed on probation. Soon after, the bill was endorsed by Randi Weingarten, president of the American Federation of Teachers: “What’s happened here is they [Colorado lawmakers] have totally worked, in terms of the amendments, to ensure that evaluations are done with teachers—not to teachers.”7 Yet the NEA-affiliated CEA was slower to come around, bemoaning that the bill still “…punish[es] teachers and undermine[s] the profession.”
State Senator Michael Johnson, key architect and champion of the bill, appeared to welcome the criticism: “I honestly say to people that those who opposed the bill did more to improve it than anyone.”8 As Colorado districts gear up to implement the new law, however, it is clear that this duel is far from over.
A ROCKY START
Overall Rank: 35thTier 4 (Weak)
COLORADO

OVERALL RANK: 35TH
Area and Ranka General Indicator Sub-IndicatorSub-Indicator Rank/Statusb
AREA 1: RESOURCES & MEMBERSHIP
Membership By rank, what percentage of public-school teachers in the state are union members? 34th
Revenue By rank, what is the total yearly revenue (per teacher in the state) of the state-level NEA and/ or AFT affiliate(s)?
36th
Spending on education By rank, what percentage of state expenditures (of state general funds, state restricted funds, state bonds, and federal “pass-through” funds) is directed to K-12 education?
7th
By rank, what is the total annual per-pupil expenditure (of funds from federal, state, and local sources) in the state?
43rd
By rank, what percentage of total annual per-pupil expenditures is directed to teacher salaries and benefits?
46th
AREA 2: INVOLVEMENTIN POLITICS
Contributions to candidates and political parties
By rank, what percentage of the total contributions to state candidates was donated by teacher unions?
6th
By rank, what percentage of the total contributions to state-level political parties was donated by teacher unions?
28th
Industry influence By rank, what percent of the contributions to state candidates from the ten highest-giving sectors was donated by teacher unions?
1st
Status of delegates By rank, what percentage of the state’s delegates to the Democratic and Republican conventions were members of teacher unions?
49th
AREA 3:SCOPE OF BARGAINING
Legal scope of bargaining What is the legal status of collective bargaining? Neither required nor prohibited
By rank, how broad is the scope of collective bargaining? 38th*
Automatic revenue streams What is the unions’ legal right to automatically collect agency fees from non-members and/or collect member dues via automatic payroll deductions?
Automatic payroll deductions prohibited
Right to strike What is the legal status of teacher strikes? Permitted
AREA 4:STATE POLICIES
Performance pay Does the state support performance pay for teachers? State does not support
Retirement By rank, what is the employer- versus employee-contribution rate to the teacher pension system? 8th
Evaluations What is the maximum potential consequence for veteran teachers who receive unsatisfactory evaluation(s)?
Eligible for dismissal
Is classroom effectiveness included in teacher evaluations? If so, how is it weighted? Required; Preponderant criterion
Terms of employment How long before a teacher earns tenure? Three years
Is student/teacher performance considered in tenure decisions? If so, how is it weighted? Required; Preponderant criterion
Is seniority considered in teacher layoff decisions? If so, how is it weighted? Optional; May be considered among other factors
Is teacher performance included in teacher layoff decisions? If so, how is it weighted? Required; Considered among other factors
By rank, what percentage of the teaching workforce was dismissed due to poor performance? 38th
Class size Is class size restricted for grades 1-3? If so, is the restriction higher or lower than the national average (20)?
No restriction
COLORADO RANKINGS BY AREA AND INDICATOR
37*
18*
25
48
Overall Rank: 35thTier 4 (Weak)
COLORADO

Area and Rank General Indicator Sub-IndicatorSub-Indicator Rank/Status
AREA 4:STATE POLICIES
(cont.)
Charter school structural limitations
Is there a cap (limit) placed on the number of charter schools that can operate in the state (or other jurisdiction) and/or on the number of students who can attend charter schools?
No state cap
Does the state allow a variety of charter schools: start-ups, conversions, and virtual schools? Yes
How many charter authorizing options exist? How active are those authorizers? Two or more w/ limited jurisdiction
Charter school exemptions Are all charter schools automatically exempt from state laws and state/district regulations (except those that safeguard students and fiscal accountability)? If not, are they eligible for exemptions?
Yes
Are all charter schools automatically exempt from state teacher-certification requirements? If not, are they eligible for exemptions?
No; Certification is required but can be waived
Are all charter schools automatically exempt from collective bargaining agreements (CBAs)? If not, are they eligible for exemptions?
Yes
AREA 5:PERCEIVED INFLUENCEc
Relative influence of teacher unions
How do you rank the influence of teacher unions on education policy compared with other influential entities?
Second- or third-most influential
Influence over campaigns On a scale from always to never, how often do Democratic candidates need teacher-union support to get elected?
Sometimes/Often
On a scale from always to never, how often do Republican candidates need teacher-union support to get elected?
Never/Rarely
Influence over spending To what extent, from strongly agree to strongly disagree, do you agree that even in times of cutbacks, teacher unions are effective in protecting dollars for education?
Agree
Given recent budgetary constraints, would you say that teacher unions generally make concessions to prevent reductions in pay and benefits or fight hard to prevent those reductions?
Fight
Influence over policy To what extent, from strongly agree to strongly disagree, do you agree that teacher unions ward off proposals in your state with which they disagree?
Neutral
On a scale from always to never, how often do existing state education policies reflect teacher-union priorities?
Sometimes
To what extent, from totally in line to not at all in line, were state education policies proposed by the governor during your state’s latest legislative session in line with teacher-union priorities?
Mostly not in line/Somewhat in line
To what extent, from totally in line to not at all in line, were legislative outcomes of your state’s latest legislative session in line with teacher-union priorities?
Mostly not in line/Somewhat in line
Influence over key stakeholders
On a scale from always to never, how often have the priorities of state education leaders aligned with teacher-union positions in the past three years?
Rarely/Sometimes
Would you say that teacher unions typically compromise with policymakers to ensure that their preferred policies are enacted, or typically need not make concessions?
Generally compromise
* Tied with another state
a Area ranks are calculated using a weighted average of sub-indicators. For a more detailed description, see Appendix A.
b Where possible, we report a state’s rank as compared to other states on a given metric. For example, out of 51 states, Colorado has the 34th-highest percentage of teachers who are union members. Otherwise, we report a status: In Colorado, collective bargaining is neither required nor prohibited, and union agency fees are prohibited. For a more detailed description of our metrics and methodology, see Appendix A. To request the raw data for your state, send an email to [email protected].
c For all survey questions, stakeholders were asked specifically about teacher unions, candidates, policies, and leaders in their state. In addition, we asked about unions and policies in the “current legislative session,” but because legislative calendars vary from state to state, responses refer to policies proposed and enacted within the 2010-11 window.
48
29
Overall Rank: 35thTier 4 (Weak)
COLORADO

ENDNOTES
1 A state’s overall rank is calculated as follows: First, we score it on multiple sub-indicators (sub-indicator data and scores for Colorado are shown in the table, Colorado Rankings by Area and Indicator). Second, we take a weighted average of the sub-indicators in each of five areas. In each area, we use that average to place the states in rank order: For example, in Area 1: Resources and Membership, Colorado is ranked 37th of 51 based on the weighted average of its sub-indicators. To generate the state’s overall rank, we average the five area ranks together, then re-order the states. For a more detailed description of data sources and methodology, see Appendix A.
2 Readers should note that these figures include only direct donations from unions and union-connected PACs, but not their spending on electioneering/advertising, mobilizing the union’s own membership, lobbying, or advocacy. A recent Wall Street Journal report found that donations and lobbying activities account for a small share of union political spending compared with their expenditures on member mobilization and advocacy. Even the AFT agreed, making the argument that since its mission is organizing and activism, it will naturally spend significant amounts on these activities. Thus, the percentages we report here are extremely conservative representations of what unions actually spend on politics. For more information, see Appendix A, Area 2; Tom McGinty and Brody Mullins, “Political Spending by Unions Far Exceeds Direct Donations,” Wall Street Journal, July 10, 2012; and Jeff Hauser, “Wall Street Journal Compares Union Political Spending to Corporate Donations,” AFL-CIO, July 10, 2012.
3 Colorado is noteworthy because of the activity level of its local unions, both in terms of the large number of unions that gave to state candidates and the high dollar amounts given by those local unions, especially in comparison with contributions from the state affiliates.
4 At the time of publication, the 2000 conventions were the most recent for which such detailed data were available in forms that met rigorous standards. However, 2008 data provided by the Democratic National Convention were highly correlated with the reliable figures from 2000.
5 We asked stakeholders about unions and policies in the “current legislative session,” but because legislative calendars vary from state to state, responses refer to policies proposed and enacted within the 2010-11 window.
6 “CEA Teachers Hold Rally At State Capitol To Tell Lawmakers ‘We Know What Works,’” PR Newswire, April 23, 2010, http://www.prnewswire.com/news-releases/cea-teachers-hold-rally-at-state-capitol-to-tell-lawmakers-we-know-what-works-91928204.html.
7 Jeremy Meyer, “AFT’s Randi Weingarten Weighs In,” Denver Post, May 6, 2010, http://blogs.denverpost.com/coloradoclassroom/2010/05/06/afts-randi-weingarten-weighs-in/318/.
8 Yesenia Robles, “Colorado’s Education-Reform Leader Spreads Ideas Nationwide,” Denver Post, January 16, 2011, http://www.denverpost.com/news/ci_17109350#ixzz1tw1vjOBx.
Overall Rank: 35thTier 4 (Weak)
COLORADO

STRONGER WEAKER
1. RESOURCES AND MEMBERSHIP
OVERALL
2. INVOLVEMENT IN POLITICS
3. SCOPE OF BARGAINING
4. STATE POLICIES
5. PERCEIVED INFLUENCE
AREA 1: RESOURCES AND MEMBERSHIP
TIED FOR 9TH
Connecticut’s NEA and AFT state affiliates
have a broad foundation of resources from
a variety of sources. With 98.8 percent of
its teachers unionized, the Constitution
State posts the largest percentage of
unionized teachers in the nation. The unions
see $516 per teacher each year, the 22nd
highest revenue among all states. While
education spending by the state places
Connecticut in the middle of the pack
(the state is 21st in the percentage of its
expenditures directed to K-12 education),
total per-pupil revenue from all sources is
high: $13,959 annually, the 9th-highest in
the country.
AREA 2: INVOLVEMENT IN POLITICS2
TIED FOR 29TH
Connecticut’s teacher unions have been
moderately involved in state politics over
the last ten years. Their contributions
made up a relatively small portion of
total donations received by candidates
for state office (0.32 percent, putting the
state in 35th place). Teacher unions were
a bigger presence among donors to state
political parties, giving 2.0 percent of all
donations received by parties (14th). Of the
Connecticut delegates to the Democratic
and Republican national conventions, 15.4
percent were teacher union members
(18th).3
CONNECTICUT OVERALL RANK: 17TH1
TIER 2 (STRONG)
17
29
13
9
27
13
Overall Rank: 17thTier 2 (Strong)
CONNECTICUT

AREA 3: SCOPE OF BARGAINING
13TH
Connecticut is one of thirty-two states that
require collective bargaining for public
school teachers, and state law allows
unions to automatically collect agency fees
from non-member teachers—a key source
of union revenue. The state allows for a
broad scope of bargaining: Of twenty-one
items examined in this metric, the state
explicitly excludes just one as a subject of
bargaining: pension/retirement benefits.
The remaining twenty are either mandated
topics for bargaining (seven items),
permitted subjects (one item), or the
state is silent on their inclusion, implicitly
permitting them (twelve items). The state
does not allow teacher strikes.
AREA 4: STATE POLICIES
13TH
Most Connecticut policies align at least
partially with traditional teacher union
interests. While state requires that
objective evidence of student learning
factor into teacher evaluations, it does
not specify what weight those data
should carry. While it takes teachers four
years to earn tenure (the national norm is
three), as of May 2012, the state granted
tenure nearly automatically and required
all ineffective teachers to go through
remediation before they were dismissed.
(As of press time, however, the law now
requires teacher effectiveness to factor into
tenure decisions and provides channels
to dismiss ineffective teachers without
intervention; unfortunately, the changes
made were too late to be included in
our calculations.) Unions traditionally
oppose individual performance pay, and
Connecticut does not provide it. Further,
state law caps the number of charter
schools allowed to operate and only offers
one viable authorizer to prospective
charter operators. In addition, Connecticut
teachers contribute proportionally less to
their pensions than their employers do, as
compared to teachers in all but two other
states. A handful of policies, however, run
counter to union goals: The state does
not mandate a maximum class size for
grades K-3 and is permissive in the types
of charters it allows (meaning new start-
ups, public-school conversions, and virtual
charter schools).
AREA 5: PERCEIVED INFLUENCE
27TH
Stakeholders in Connecticut perceive
the teacher unions to be one influential
entity of many. Survey respondents rank
teacher unions second- or third-most
influential, along with education advocacy
organizations and the state school board.
They agree that teacher unions are effective
in protecting dollars for education and in
warding off most statutory proposals with
which they disagree. But they note that
both policies proposed by the governor
in the latest legislative session and those
actually enacted were only somewhat in
line with union priorities.4 Moreover, they
report that state teacher unions, like many
of their counterparts in other states, more
often than not turn to compromise to see
some of their preferred policies enacted.
OVERALL
17TH
Connecticut boasts the highest teacher
union membership in the nation. Its unions
enjoy a broad scope of bargaining and
favorable state policy environment, and
they have garnered a reputation among
stakeholders as moderately influential.
Overall Rank: 17thTier 2 (Strong)
CONNECTICUT
With education his main priority for the 2012 legislative session, Governor Dannel Malloy set his sights on reforming teacher tenure. He declared in his state of the state speech, “In today’s system, basically the only thing you have to do is show up for four years. Do that, and tenure is yours.”5 The comment quickly inflamed teacher tempers across the Constitution State. “There was no need for the governor to kick off his ‘year of education reform’ by being so adversarial to teachers,” said Kristen Record, the state’s 2011 Teacher of the Year. “He made purposeful statements that were outright lies and damaged his relationship and credibility with teachers.”6
Malloy appeared to learn from his mistake. In March 2012, he back-pedaled: “In my state of the state speech I used some words to describe tenure which, taken in isolation, did not do a good job of describing my feelings on the subject... Every day, Connecticut’s teachers do far more than show up.”7 Despite his reversal, however, unions seized upon the gaffe to paint Malloy as out-of-touch and anti-teacher, and the education reform bill passed by the legislature in May 2012 lacked many of his original proposals, including provisions to make tenure rules more stringent, link teacher evaluations with pay and certification, and strip teachers in the lowest-performing schools of many rights guaranteed by collective bargaining.8
On the other hand, the reform bill did redesign the teacher evaluation system: While evaluations will not have a significant impact on teacher job security (a major union victory), student performance will count for 45 percent of a teacher’s rating—changes also endorsed by the governor.9 And teacher tenure must be “informed by” the results of the evaluations. The Connecticut Education Association (CEA) charged that the evaluation guidelines are ill-advised: “This bill puts the cart before the horse,” said CEA president Phil Apruzzese. “These systems aren’t properly developed yet.”10 After seeing only partial success with the reform bill, Malloy may have learned a valuable lesson here: It’s important to play nice with the CEA.
MIND YOUR MANNERS
Overall Rank: 17thTier 2 (Strong)
CONNECTICUT

OVERALL RANK: 17TH
Area and Ranka General Indicator Sub-IndicatorSub-Indicator Rank/Statusb
AREA 1: RESOURCES & MEMBERSHIP
Membership By rank, what percentage of public-school teachers in the state are union members? 1st
Revenue By rank, what is the total yearly revenue (per teacher in the state) of the state-level NEA and/ or AFT affiliate(s)?
22nd
Spending on education By rank, what percentage of state expenditures (of state general funds, state restricted funds, state bonds, and federal “pass-through” funds) is directed to K-12 education?
27th
By rank, what is the total annual per-pupil expenditure (of funds from federal, state, and local sources) in the state?
9th
By rank, what percentage of total annual per-pupil expenditures is directed to teacher salaries and benefits?
21st
AREA 2: INVOLVEMENTIN POLITICS
Contributions to candidates and political parties
By rank, what percentage of the total contributions to state candidates was donated by teacher unions?
35th
By rank, what percentage of the total contributions to state-level political parties was donated by teacher unions?
14th
Industry influence By rank, what percent of the contributions to state candidates from the ten highest-giving sectors was donated by teacher unions?
47th
Status of delegates By rank, what percentage of the state’s delegates to the Democratic and Republican conventions were members of teacher unions?
18th
AREA 3:SCOPE OF BARGAINING
Legal scope of bargaining What is the legal status of collective bargaining? Mandatory
By rank, how broad is the scope of collective bargaining? 8th*
Automatic revenue streams What is the unions’ legal right to automatically collect agency fees from non-members and/or collect member dues via automatic payroll deductions?
Permitted
Right to strike What is the legal status of teacher strikes? Prohibited
AREA 4:STATE POLICIES
Performance pay Does the state support performance pay for teachers? State does not support
Retirement By rank, what is the employer- versus employee-contribution rate to the teacher pension system? 3rd
Evaluations What is the maximum potential consequence for veteran teachers who receive unsatisfactory evaluation(s)?
Teacher improvement planc
Is classroom effectiveness included in teacher evaluations? If so, how is it weighted? Evidence of student “learning” required
Terms of employment How long before a teacher earns tenure? Four years
Is student/teacher performance considered in tenure decisions? If so, how is it weighted? Not includedc
Is seniority considered in teacher layoff decisions? If so, how is it weighted? Optional; Weighted at district discretion
Is teacher performance included in teacher layoff decisions? If so, how is it weighted? Not required
By rank, what percentage of the teaching workforce was dismissed due to poor performance? 23rd
Class size Is class size restricted for grades 1-3? If so, is the restriction higher or lower than the national average (20)?
No restriction
CONNECTICUT RANKINGS BY AREA AND INDICATOR
9*
29*
13
13
Overall Rank: 17thTier 2 (Strong)
CONNECTICUT

Area and Rank General Indicator Sub-IndicatorSub-Indicator Rank/Status
AREA 4:STATE POLICIES
(cont.)
Charter school structural limitations
Is there a cap (limit) placed on the number of charter schools that can operate in the state (or other jurisdiction) and/or on the number of students who can attend charter schools?
State cap with limited room for growth
Does the state allow a variety of charter schools: start-ups, conversions, and virtual schools? Yes
How many charter authorizing options exist? How active are those authorizers? Single option; No or limited activity
Charter school exemptions Are all charter schools automatically exempt from state laws and state/district regulations (except those that safeguard students and fiscal accountability)? If not, are they eligible for exemptions?
No; Schools can apply for exemptions
Are all charter schools automatically exempt from state teacher-certification requirements? If not, are they eligible for exemptions?
No; Certification is required but can be partially waived
Are all charter schools automatically exempt from collective bargaining agreements (CBAs)? If not, are they eligible for exemptions?
Partially; Full automatic exemption for some schools, others must apply for waivers
AREA 5:PERCEIVED INFLUENCEc
Relative influence of teacher unions
How do you rank the influence of teacher unions on education policy compared with other influential entities?
Second- or third-most influential
Influence over campaigns On a scale from always to never, how often do Democratic candidates need teacher-union support to get elected?
Sometimes/Often
On a scale from always to never, how often do Republican candidates need teacher-union support to get elected?
Rarely/Sometimes
Influence over spending To what extent, from strongly agree to strongly disagree, do you agree that even in times of cutbacks, teacher unions are effective in protecting dollars for education?
Agree
Given recent budgetary constraints, would you say that teacher unions generally make concessions to prevent reductions in pay and benefits or fight hard to prevent those reductions?
Generally fight
Influence over policy To what extent, from strongly agree to strongly disagree, do you agree that teacher unions ward off proposals in your state with which they disagree?
Agree
On a scale from always to never, how often do existing state education policies reflect teacher-union priorities?
Sometimes/Often
To what extent, from totally in line to not at all in line, were state education policies proposed by the governor during your state’s latest legislative session in line with teacher-union priorities?
Somewhat/Mostly in line
To what extent, from totally in line to not at all in line, were legislative outcomes of your state’s latest legislative session in line with teacher-union priorities?
Somewhat in line
Influence over key stakeholders
On a scale from always to never, how often have the priorities of state education leaders aligned with teacher-union positions in the past three years?
Sometimes/Often
Would you say that teacher unions typically compromise with policymakers to ensure that their preferred policies are enacted, or typically need not make concessions?
Generally compromise
* Tied with another state
a Area ranks are calculated using a weighted average of sub-indicators. For a more detailed description, see Appendix A.
b Where possible, we report a state’s rank as compared to other states on a given metric. For example, out of 51 states, Connecticut has the highest percentage of teachers who are union members. Otherwise, we report a status: Connecticut has mandatory collective bargaining, and union agency fees are permitted. For a more detailed description of our metrics and methodology, see Appendix A. To request the raw data for your state, send an email to [email protected].
c See note in Area 4, above.
d For all survey questions, stakeholders were asked specifically about teacher unions, candidates, policies, and leaders in their state. In addition, we asked about unions and policies in the “current legislative session,” but because legislative calendars vary from state to state, responses refer to policies proposed and enacted within the 2010-11 window.
13
27
Overall Rank: 17thTier 2 (Strong)
CONNECTICUT

ENDNOTES
1 A state’s overall rank is calculated as follows: First, we score it on multiple sub-indicators (sub-indicator data and scores for Connecticut are shown in the table, Connecticut Rankings by Area and Indicator). Second, we take a weighted average of the sub-indicators in each of five areas. In each area, we use that average to place the states in rank order: For example, in Area 1: Resources and Membership, Connecticut is ranked 9th of 51 based on the weighted average of its sub-indicators. To generate the state’s overall rank, we average the five area ranks together, then re-order the states. For a more detailed description of data sources and methodology, see Appendix A.
2 Readers should note that these figures include only direct donations from unions and union-connected PACs, but not their spending on electioneering/advertising, mobilizing the union’s own membership, lobbying, or advocacy. A recent Wall Street Journal report found that donations and lobbying activities account for a small share of union political spending compared with their expenditures on member mobilization and advocacy. Even the AFT agreed, making the argument that since its mission is organizing and activism, it will naturally spend significant amounts on these activities. Thus, the percentages we report here are extremely conservative representations of what unions actually spend on politics. For more information, see Appendix A, Area 2; Tom McGinty and Brody Mullins, “Political Spending by Unions Far Exceeds Direct Donations,” Wall Street Journal, July 10, 2012; and Jeff Hauser, “Wall Street Journal Compares Union Political Spending to Corporate Donations,” AFL-CIO, July 10, 2012.
3 At the time of publication, the 2000 conventions were the most recent for which such detailed data were available in forms that met rigorous standards. However, 2008 data provided by the Democratic National Convention were highly correlated with the reliable figures from 2000.
4 We asked stakeholders about unions and policies in the “current legislative session,” but because legislative calendars vary from state to state, responses refer to policies proposed and enacted within the 2010-11 window.
5 Jacqueline Rabe Thomas, “Malloy Clarifies The ‘Only Thing You Have To Do Is Show Up’ Comment About Teachers,” CT Mirror, March 21, 2012, http://www.ctmirror.org/blogs/malloy-backtracks-all-you-have-do-show-comment-about-teachers.
6 Ken Dixon, “This Time, Malloy Swallowed Compromises,” CT Post, May 12, 2012, http://www.ctpost.com/local/article/This-time-Malloy-swallowed-compromises-3553866.php.
7 Thomas.
8 Jacqueline Rabe Thomas, “Education Reform Bill Passes, Praised As Good Step, Clears legislature,” CT Mirror, May 8, 2012, http://www.ctmirror.org/story/16286/education-reform-bill-clears-legislature.
9 Associated Press, “Conn. Endorses New Teacher Evaluation Methods,” CT Post, February 10, 2012, http://www.ctpost.com/local/article/Conn-endorses-new-teacher-evaluation-methods-3252498.php.
10 Jacqueline Rabe Thomas and Uma Ramiah, “Teachers Unions Say ‘No’ To Malloy’s Tenure Plan,” CT Mirror, February 21, 2012, http://www.ctmirror.org/story/15501/teachers-unions-battle-governor-education-committee-hearing.
Overall Rank: 17thTier 2 (Strong)
CONNECTICUT

STRONGER WEAKER
1. RESOURCES AND MEMBERSHIP
OVERALL
2. INVOLVEMENT IN POLITICS
3. SCOPE OF BARGAINING
4. STATE POLICIES
5. PERCEIVED INFLUENCE
AREA 1: RESOURCES AND MEMBERSHIP
TIED FOR 9TH
Delaware’s state teacher union benefits
from reasonably strong resources from its
own members and sees substantial funding
for K-12 education. Fully 90.1 percent
of teachers in the First State are union
members, the 16th-highest unionization
rate among 51 jurisdictions. The NEA-
affiliated Delaware State Education
Association (DSEA) brings in $547
annually per teacher in the state (18th).
Spending on K-12 education in general,
and specifically on teacher salaries and
benefits, is comparatively high in the state
(see sidebar). Education accounts for 24
percent of state expenditures (12th). Of the
$11,905 that is spent per-pupil in the state
each year (22nd), 56.5 percent goes toward
teacher salaries and benefits (11th).
AREA 2: INVOLVEMENT IN POLITICS2
TIED FOR 29TH
Compared to teacher unions elsewhere,
Delaware’s gave moderately to state politics
in the past ten years. Contributions from
the union amounted to 0.32 percent (36th)
of donations to candidates for state office
and 0.55 percent (36th) of donations to
state political parties. Union representation
at the Democratic and Republican national
conventions was moderate as well, with 12
percent of Delaware’s delegates identifying
as teacher union members (tying for 28th).3
DELAWARE OVERALL RANK: 19TH1
TIER 2 (STRONG)
19
29
36
9
18
15
Overall Rank: 19th Tier 2 (Strong)
DELAWARE

AREA 3: SCOPE OF BARGAINING
15TH
Delaware gives its teacher unions a fair
amount of room to bargain. It requires
collective bargaining—one of thirty-
two states that do so—and the scope
of bargained provisions is broad. Of
twenty-one items examined in this metric,
just one is prohibited as a subject of
bargaining: transfer/teacher reassignment.
Five provisions are required subjects of
bargaining, one is explicitly allowed, and
fourteen are implicitly included because
the state does not address them. Only
one item—teacher transfers—may not
be bargained. Delaware lets its unions
automatically collect agency fees from
teachers who are not union members (a key
source of union revenue), but it does not
permit teacher strikes.
AREA 4: STATE POLICIES
36TH
Delaware policies are less aligned with
traditional union interests than are policies
in most other states. Student achievement
data must be the preponderant factor in
teacher evaluations and taken into account
when granting tenure. Teachers are eligible
for dismissal after multiple unsatisfactory
ratings, and districts can decide on the
criteria for layoffs. Still, districts are not
obligated to base layoff decisions on
teacher performance (as opposed to
seniority), and Delaware teachers are
dismissed due to poor performance at a
lower rate than in all but one other state
(Arkansas). While many state policies
encourage the expansion and autonomy
of charter schools (positions typically
opposed by unions), the state offers
prospective school operators only limited
authorizing options.
AREA 5: PERCEIVED INFLUENCE
18TH
Delaware stakeholders reported a stronger
union than most. They rank teacher unions
as the second- or third-most influential
entity on education reform, alongside the
business roundtable/chamber of commerce
and education advocacy organizations.
They report that both Democrats and
Republicans often need teacher union
support to be elected; the former is similar
to responses from other states, but in
most states, Republicans rarely need union
support. Delaware stakeholders note that
even given budgetary constraints, teacher
unions are effective in protecting dollars
for education and in warding off education
reform proposals with which they disagree
(see sidebar). Interestingly, the union may
play a role in changing legislators’ minds:
Respondents report that policies proposed
by the governor in the latest legislative
session were only somewhat aligned with
union priorities, but that enacted policies
were mostly in line with those priorities.4
OVERALL
19TH
Delaware’s teacher union has substantial
resources from its members and sees
higher spending on K-12 education than
in many other states. State laws give it
ample room to bargain and, while many
teacher-employment and charter policies
are not aligned with typical union positions,
Delaware stakeholders report that it is
actually quite influential—perhaps due to its
reputation for collaboration (see sidebar).
Overall Rank: 19th Tier 2 (Strong)
DELAWARE

Delaware, “The First State,” was also first to receive Race to the Top (RTTT) funds (about $119 million) in April 2010, in part due to all of its local unions endorsing reform legislation.5 The Delaware State Education Association (DSEA) had previously collaborated with politicians, philanthropists, business leaders, and advocacy groups on education reform, and the state’s RTTT application was no exception: Then-president Diane Donahue even co-presented Delaware’s application to the RTTT judges along with Governor Jack A. Markell. Markell lauded the team effort: “In Delaware, you don’t have to choose between consensus and bold [action]. In Delaware, you get both.” Donahue’s thoughts on the collaboration were more blunt: “We’re taking a risk…[but] I’d rather be at the table than on the menu.”6 As a part of the application, the unions agreed to teacher evaluations that include student-growth data, bonuses for highly-effective teachers who work in high-need schools, and decreased job security for ineffective and probationary teachers. But as of January 2012, the evaluations as originally designed are on hiatus. The state secretary of education announced that Delaware would not be using the value-added metric for teacher evaluations in the upcoming school year due to insufficient test data and an unproven system. Instead, state officials and teachers would develop measures based on data other than standardized tests. (Note that other states are implementing value-added teacher evaluations despite union objections that the systems are untested—see, for example, the District of Columbia, Colorado, and Connecticut.)7
Other news in early 2012 made it clear that the unions are very much not “on the menu.” In a February statement to the state finance committee, the DSEA gave thanks for past salary increases, praised increases to education spending in the budget, and asked for another raise (which it got).8,9 With bargaining rights, teacher employment policies, and dollars for education in the crosshairs of legislatures across the country, the DSEA’s mode of collaboration appears to pay dividends.
THERE’S NO “I” IN “TEAM”
Overall Rank: 19th Tier 2 (Strong)
DELAWARE

OVERALL RANK: 19TH
Area and Ranka General Indicator Sub-IndicatorSub-Indicator Rank/Statusb
AREA 1: RESOURCES & MEMBERSHIP
Membership By rank, what percentage of public-school teachers in the state are union members? 16th
Revenue By rank, what is the total yearly revenue (per teacher in the state) of the state-level NEA and/ or AFT affiliate(s)?
18th
Spending on education By rank, what percentage of state expenditures (of state general funds, state restricted funds, state bonds, and federal “pass-through” funds) is directed to K-12 education?
12th
By rank, what is the total annual per-pupil expenditure (of funds from federal, state, and local sources) in the state?
22nd
By rank, what percentage of total annual per-pupil expenditures is directed to teacher salaries and benefits?
11th
AREA 2: INVOLVEMENTIN POLITICS
Contributions to candidates and political parties
By rank, what percentage of the total contributions to state candidates was donated by teacher unions?
36th
By rank, what percentage of the total contributions to state-level political parties was donated by teacher unions?
36th
Industry influence By rank, what percent of the contributions to state candidates from the ten highest-giving sectors was donated by teacher unions?
30th
Status of delegates By rank, what percentage of the state’s delegates to the Democratic and Republican conventions were members of teacher unions?
28th*
AREA 3:SCOPE OF BARGAINING
Legal scope of bargaining What is the legal status of collective bargaining? Mandatory
By rank, how broad is the scope of collective bargaining? 13th
Automatic revenue streams What is the unions’ legal right to automatically collect agency fees from non-members and/or collect member dues via automatic payroll deductions?
Permitted
Right to strike What is the legal status of teacher strikes? Prohibited
AREA 4:STATE POLICIES
Performance pay Does the state support performance pay for teachers? State does not support
Retirement By rank, what is the employer- versus employee-contribution rate to the teacher pension system? 11th
Evaluations What is the maximum potential consequence for veteran teachers who receive unsatisfactory evaluation(s)?
Eligible for dismissal
Is classroom effectiveness included in teacher evaluations? If so, how is it weighted? Required; Preponderant criterion
Terms of employment How long before a teacher earns tenure? Three years
Is student/teacher performance considered in tenure decisions? If so, how is it weighted? Required; Preponderant criterion
Is seniority considered in teacher layoff decisions? If so, how is it weighted? Optional; Weighted at district discretion
Is teacher performance included in teacher layoff decisions? If so, how is it weighted? Not required
By rank, what percentage of the teaching workforce was dismissed due to poor performance? 2nd
Class size Is class size restricted for grades 1-3? If so, is the restriction higher or lower than the national average (20)?
No restriction
DELAWARE RANKINGS BY AREA AND INDICATOR
9*
29*
15
36
Overall Rank: 19th Tier 2 (Strong)
DELAWARE

Area and Rank General Indicator Sub-IndicatorSub-Indicator Rank/Status
AREA 4:STATE POLICIES
(cont.)
Charter school structural limitations
Is there a cap (limit) placed on the number of charter schools that can operate in the state (or other jurisdiction) and/or on the number of students who can attend charter schools?
No state cap (but authorizers are capped)
Does the state allow a variety of charter schools: start-ups, conversions, and virtual schools? Start-ups and conversions only
How many charter authorizing options exist? How active are those authorizers? Single option; No or limited activity
Charter school exemptions Are all charter schools automatically exempt from state laws and state/district regulations (except those that safeguard students and fiscal accountability)? If not, are they eligible for exemptions?
Yes
Are all charter schools automatically exempt from state teacher-certification requirements? If not, are they eligible for exemptions?
Partially; All schools receive automatic exemptions for some teachers
Are all charter schools automatically exempt from collective bargaining agreements (CBAs)? If not, are they eligible for exemptions?
Yes
AREA 5:PERCEIVED INFLUENCEc
Relative influence of teacher unions
How do you rank the influence of teacher unions on education policy compared with other influential entities?
Second- or third-most influential
Influence over campaigns On a scale from always to never, how often do Democratic candidates need teacher-union support to get elected?
Often/Always
On a scale from always to never, how often do Republican candidates need teacher-union support to get elected?
Sometimes/Often
Influence over spending To what extent, from strongly agree to strongly disagree, do you agree that even in times of cutbacks, teacher unions are effective in protecting dollars for education?
Strongly agree
Given recent budgetary constraints, would you say that teacher unions generally make concessions to prevent reductions in pay and benefits or fight hard to prevent those reductions?
Generally fight
Influence over policy To what extent, from strongly agree to strongly disagree, do you agree that teacher unions ward off proposals in your state with which they disagree?
Agree
On a scale from always to never, how often do existing state education policies reflect teacher-union priorities?
Sometimes/Often
To what extent, from totally in line to not at all in line, were state education policies proposed by the governor during your state’s latest legislative session in line with teacher-union priorities?
Somewhat/Mostly in line
To what extent, from totally in line to not at all in line, were legislative outcomes of your state’s latest legislative session in line with teacher-union priorities?
Somewhat/Mostly in line
Influence over key stakeholders
On a scale from always to never, how often have the priorities of state education leaders aligned with teacher-union positions in the past three years?
Sometimes/Often
Would you say that teacher unions typically compromise with policymakers to ensure that their preferred policies are enacted, or typically need not make concessions?
Generally compromise
* Tied with another state
a Area ranks are calculated using a weighted average of sub-indicators. For a more detailed description, see Appendix A.
b Where possible, we report a state’s rank as compared to other states on a given metric. For example, out of 51 states, Delaware has the 16th-highest percentage of teachers who are union members. Otherwise, we report a status: Delaware has mandatory collective bargaining, and union agency fees are permitted. For a more detailed description of our metrics and methodology, see Appendix A. To request the raw data for your state, send an email to [email protected].
c For all survey questions, stakeholders were asked specifically about teacher unions, candidates, policies, and leaders in their state. In addition, we asked about unions and policies in the “current legislative session,” but because legislative calendars vary from state to state, responses refer to policies proposed and enacted within the 2010-11 window.
36
18
Overall Rank: 19th Tier 2 (Strong)
DELAWARE

ENDNOTES
1 A state’s overall rank is calculated as follows: First, we score it on multiple sub-indicators (sub-indicator data and scores for Delaware are shown in the table, Delaware Rankings by Area and Indicator). Second, we take a weighted average of the sub-indicators in each of five areas. In each area, we use that average to place the states in rank order: For example, in Area 1: Resources and Membership, Delaware is ranked 9th of 51 based on the weighted average of its sub-indicators. To generate the state’s overall rank, we average the five area ranks together, then re-order the states. For a more detailed description of data sources and methodology, see Appendix A.
2 Readers should note that these figures include only direct donations from unions and union-connected PACs, but not their spending on electioneering/advertising, mobilizing the union’s own membership, lobbying, or advocacy. A recent Wall Street Journal report found that donations and lobbying activities account for a small share of union political spending compared with their expenditures on member mobilization and advocacy. Even the AFT agreed, making the argument that since its mission is organizing and activism, it will naturally spend significant amounts on these activities. Thus, the percentages we report here are extremely conservative representations of what unions actually spend on politics. For more information, see Appendix A, Area 2; Tom McGinty and Brody Mullins, “Political Spending by Unions Far Exceeds Direct Donations,” Wall Street Journal, July 10, 2012; and Jeff Hauser, “Wall Street Journal Compares Union Political Spending to Corporate Donations,” AFL-CIO, July 10, 2012.
3 At the time of publication, the 2000 conventions were the most recent for which such detailed data were available in forms that met rigorous standards. However, 2008 data provided by the Democratic National Convention were highly correlated with the reliable figures from 2000.
4 We asked stakeholders about unions and policies in the “current legislative session,” but because legislative calendars vary from state to state, responses refer to policies proposed and enacted within the 2010-11 window.
5 Nick Anderson, “Input Of Teachers Unions Key To Successful Entries In Race To The Top,” Washington Post, April 3, 2010, http://www.washingtonpost.com/wp-dyn/content/article/2010/04/02/AR2010040201022.html.
6 Ibid.
7 Esme E. Deprez and John Hechinger, “Grading Teachers Sparks Conflict As States Vie For Grants,” BusinessWeek.com, February 24, 2012, http://www.businessweek.com/news/2012-02-24/grading-teachers-sparks-conflict-as-states-vie-for-grants.html.
8 Fredericka Jenner, “JFC Testimony: Education,” Delaware State Education Association, February 14, 2012, http://www.dsea.org/PDF/JFCTestimonyFSJ021412.pdf.
9 Seanna Adcox, “SC Lawmakers Approve Budget, Keep Government Going,” Associated Press, June 29, 2012, http://finance.yahoo.com/news/sc-lawmakers-approve-budget-keep-123723843.html.
Overall Rank: 19th Tier 2 (Strong)
DELAWARE

STRONGER WEAKER
1. RESOURCES AND MEMBERSHIP
OVERALL
2. INVOLVEMENT IN POLITICS
3. SCOPE OF BARGAINING
4. STATE POLICIES
5. PERCEIVED INFLUENCE
AREA 1: RESOURCES AND MEMBERSHIP
17TH
The Washington Teachers’ Union (WTU)
has significant financial resources from its
members, who enjoy high spending for K-12
education. 84.5 percent of D.C. teachers
belong to the WTU (21st-highest among
51 jurisdictions). With sizable member
dues, the union brings in $729 annually per
teacher (6th). But while per-pupil spending
in D.C. is the 4th-highest in the nation,
at $16,034 per year, the District does not
allocate much—just 33.2 percent—of those
dollars to teacher salaries and benefits, the
lowest such proportion nationwide.2
AREA 2: INVOLVEMENT IN POLITICS
N/A3
AREA 3: SCOPE OF BARGAINING
21ST
The District of Columbia joins thirty-one
states where collective bargaining is
required by law. The District also allows the
WTU to collect agency fees automatically
from non-members, which buttresses
the union’s financial resources. Further,
of the twenty-one items we examined
for this report, five must be negotiated:
wages, hours, terms and conditions of
employment, insurance benefits, and
fringe benefits. However, D.C. explicitly
excludes more provisions than most
states: management rights, transfers
and assignments, layoffs, dismissals,
and evaluations cannot be bargained.
Bargaining over the remaining items is
permitted, but not required. The District
prohibits teacher strikes.
DISTRICT OF COLUMBIA
OVERALL RANK: 33RD1
TIER 4 (WEAK)
33
n/a
49
17
41
21
Overall Rank: 33rdTier 4 (Weak)
DISTRICT OF COLUMBIA

AREA 4: STATE POLICIES
TIED FOR 49TH
Most D.C. teacher-employment policies do
not align with traditional union interests.
From its inception, the District’s new
(and much-discussed) teacher evaluation
system, IMPACT, has been the subject of
prolonged acrimony between the WTU
and District leaders (see sidebar). The
system requires that student achievement
be the preponderant criterion in teacher
evaluations, and those who receive
ineffective rankings are eligible for
dismissal. Further, while the probationary
period for teachers is nominally two years,
a teacher can be dismissed for ineffective
evaluations at any time in her career
regardless of tenure status.4 The District’s
charter school policies are even less
aligned with the traditional union position,
which seeks to limit charter expansion and
autonomy. The District caps the number of
charters that are allowed to open, but the
cap is high—and some 40 percent of D.C.
students are enrolled in charter schools.
Further, charter law allows for a variety of
school types and provides charters with
automatic exemptions from many laws
and regulations, including the District’s
collective bargaining agreement.
AREA 5: PERCEIVED INFLUENCE
41ST
Stakeholders report that the WTU has
limited clout. Survey respondents rank
several other entities as more influential
over education policy: the mayor (who
in turn appoints the school chancellor),
the Washington Board of Trade, and the
association of school administrators.
Respondents note that the union is not
effective in warding off education proposals
with which it disagrees or in protecting
dollars for education—a marked change
from the WTU’s stronghold over D.C.
education policy prior to the administration
of Mayor Adrian Fenty and Chancellor
Michelle Rhee. But when the District
of Columbia Public Education Reform
Amendment Act of 2007 put administration
of D.C. schools under mayoral control, it
also greatly expanded the discretionary
power of the office, consequently reducing
that of the union. The combination of a
strong chancellor, limited union authority,
and a membership divided over whether
their union should fight reforms—or
embrace them—led to a significant drop in
the WTU’s influence over District leaders.5
OVERALL
33RD
While the WTU enjoys substantial revenue
from its members, the union has a weak
reputation in a jurisdiction where a limited
scope of bargaining and two successive
reform-minded school chancellors used
that position’s expansive authority over
evaluations, dismissals, and personnel
decisions to create a policy environment
that is not at all union-favorable. The
Race To The Top initiative has brought
some of those policies into the national
education- policy mainstream, and because
evaluations and dismissals are out of the
WTU’s hands, it is unlikely that the union
will see its former strength fully restored.
(Still, it may have a chance to regain some
of its former clout, as current Chancellor
Kaya Henderson appears open to a less
antagonistic relationship with the District’s
teachers—see sidebar).
Overall Rank: 33rdTier 4 (Weak)
DISTRICT OF COLUMBIA

Three years after its 2009 adoption, the District’s high-profile value-added teacher-evaluation model known as IMPACT—developed during Michelle Rhee’s colorful stint as Chancellor—continues to rattle the Washington Teachers Union (WTU). IMPACT was the first such system to be implemented in the country, and although the WTU grudgingly agreed to it, the union did not have much of a choice since evaluations are strictly within the purview of DCPS management. Union leaders contended that it was implemented prematurely and was unreliable, punitive, and based on a false premise: that student test scores accurately measure teacher ability and only teacher ability (as opposed to conditions outside the classroom).6 “The scores don’t reflect the existing conditions that students bring into the classrooms, issues pertaining to family dysfunction, economic circumstance, poverty,” said WTU president Nathan Saunders.7 But the union had no actual say over evaluation and dismissal rules, and consequently, the results of IMPACT led to the termination of 542 teachers for poor performance between 2010 and 2012.8, 9 On the other hand, D.C. also ranked 988 of its approximately 4,100 teachers “highly effective” in 2012, making them eligible for bonuses of up to $25,000—which have so far been funded by outside donors but, as of 2013, will be paid for from the district’s pocket.10 Unlike teacher evaluations and dismissals, performance pay is a part of the collective-bargaining agreement—and was the subject of a high-profile and prolonged round of contract negotiations that was finally resolved in April 2010 with the help of AFT president Randi Weingarten.
When Henderson took over from Rhee as chancellor of DCPS, WTU leaders pressed to de-emphasize the role of standardized testing in the IMPACT metric.11 Beginning in 2013, student achievement will still be half of a teacher’s evaluation, but standardized test scores will be just one part of that score (35 percent of the total evaluation, down from 50 percent); teacher-developed assessments of student learning will make up the rest (15 percent of the total). Henderson explained that the change was “in response to feedback from teachers,” and she clarified that “while we believe strongly that value-added is the fairest and most accurate method of capturing a teacher’s impact on student achievement, we recognize that this measure does not reflect everything your students have learned.”12 The WTU applauded the move.13
In another successful campaign, the WTU ensured that the District made good on its obligations to teachers who had their positions eliminated due to budget cutbacks and declining enrollments. A provision in the 2010 collective bargaining agreement specified that those “excessed” teachers with good evaluations and twenty years of service were eligible for early retirement with full benefits. When first asked to hand over the funds to carry out this provision, the District said it lacked the money.14 WTU then accused the District of questionable accounting; the District replied that the union had not filed the necessary paperwork; but by May 2012, they had come to agreement, announcing that the District will allocate $10.2 million over the next five years to fund these benefits.15 Politics appear to be alive and well in the nation’s capital.
MAKING AN IMPACT IN WASHINGTON, D.C.
Overall Rank: 33rdTier 4 (Weak)
DISTRICT OF COLUMBIA

OVERALL RANK: 33RD
Area and Ranka General Indicator Sub-IndicatorSub-Indicator Rank/Statusb,c
AREA 1: RESOURCES & MEMBERSHIP
Membership By rank, what percentage of public-school teachers in the state are union members? 21st
Revenue By rank, what is the total yearly revenue (per teacher in the state) of the state-level NEA and/ or AFT affiliate(s)?
6th
Spending on education By rank, what percentage of state expenditures (of state general funds, state restricted funds, state bonds, and federal “pass-through” funds) is directed to K-12 education?
_
By rank, what is the total annual per-pupil expenditure (of funds from federal, state, and local sources) in the state?
4th
By rank, what percentage of total annual per-pupil expenditures is directed to teacher salaries and benefits?
51st
AREA 2: INVOLVEMENTIN POLITICS
Contributions to candidates and political parties
By rank, what percentage of the total contributions to state candidates was donated by teacher unions?
_
By rank, what percentage of the total contributions to state-level political parties was donated by teacher unions?
_
Industry influence By rank, what percent of the contributions to state candidates from the ten highest-giving sectors was donated by teacher unions?
_
Status of delegates By rank, what percentage of the state’s delegates to the Democratic and Republican conventions were members of teacher unions?
_
AREA 3:SCOPE OF BARGAINING
Legal scope of bargaining What is the legal status of collective bargaining? Mandatory
By rank, how broad is the scope of collective bargaining? 14th
Automatic revenue streams What is the unions’ legal right to automatically collect agency fees from non-members and/or collect member dues via automatic payroll deductions?
Permitted
Right to strike What is the legal status of teacher strikes? Prohibited
AREA 4:STATE POLICIESD
Performance pay Does the state support performance pay for teachers? State does not support
Retirement By rank, what is the employer- versus employee-contribution rate to the teacher pension system? 49th
Evaluations What is the maximum potential consequence for veteran teachers who receive unsatisfactory evaluation(s)?
Eligible for dismissal
Is classroom effectiveness included in teacher evaluations? If so, how is it weighted? Required; Preponderant criterion
Terms of employment How long before a teacher earns tenure? Two years
Is student/teacher performance considered in tenure decisions? If so, how is it weighted? Required; Preponderant criterion
Is seniority considered in teacher layoff decisions? If so, how is it weighted? Required; Considered among other factors
Is teacher performance included in teacher layoff decisions? If so, how is it weighted? Required; Considered among other factors
By rank, what percentage of the teaching workforce was dismissed due to poor performance? 21st
Class size Is class size restricted for grades 1-3? If so, is the restriction higher or lower than the national average (20)?
No restriction
DISTRICT OF COLUMBIA RANKINGS BY AREA AND INDICATOR
17
n/a
21
49*
Overall Rank: 33rdTier 4 (Weak)
DISTRICT OF COLUMBIA

Area and Rank General Indicator Sub-IndicatorSub-indicator Rank/Status
AREA 4:STATE POLICIES
(cont.)
Charter school structural limitations
Is there a cap (limit) placed on the number of charter schools that can operate in the state (or other jurisdiction) and/or on the number of students who can attend charter schools?
No state cap (but authorizers are capped)
Does the state allow a variety of charter schools: start-ups, conversions, and virtual schools? Yes
How many charter authorizing options exist? How active are those authorizers? Two or more w/ limited activity
Charter school exemptions Are all charter schools automatically exempt from state laws and state/district regulations (except those that safeguard students and fiscal accountability)? If not, are they eligible for exemptions?
Yes
Are all charter schools automatically exempt from state teacher-certification requirements? If not, are they eligible for exemptions?
Yes
Are all charter schools automatically exempt from collective bargaining agreements (CBAs)? If not, are they eligible for exemptions?
Yes
AREA 5:PERCEIVED INFLUENCEDe
Relative influence of teacher unions
How do you rank the influence of teacher unions on education policy compared with other influential entities?
Third- or fourth-most influential
Influence over campaigns On a scale from always to never, how often do Democratic candidates need teacher-union support to get elected?
Sometimes/Often
On a scale from always to never, how often do Republican candidates need teacher-union support to get elected?
**
Influence over spending To what extent, from strongly agree to strongly disagree, do you agree that even in times of cutbacks, teacher unions are effective in protecting dollars for education?
Disagree
Given recent budgetary constraints, would you say that teacher unions generally make concessions to prevent reductions in pay and benefits or fight hard to prevent those reductions?
Generally fight
Influence over policy To what extent, from strongly agree to strongly disagree, do you agree that teacher unions ward off proposals in your state with which they disagree?
Disagree
On a scale from always to never, how often do existing state education policies reflect teacher-union priorities?
Rarely/Sometimes
To what extent, from totally in line to not at all in line, were state education policies proposed by the governor during your state’s latest legislative session in line with teacher-union priorities?
**
To what extent, from totally in line to not at all in line, were legislative outcomes of your state’s latest legislative session in line with teacher-union priorities?
**
Influence over key stakeholders
On a scale from always to never, how often have the priorities of state education leaders aligned with teacher-union positions in the past three years?
Sometimes
Would you say that teacher unions typically compromise with policymakers to ensure that their preferred policies are enacted, or typically need not make concessions?
Compromise
** Not applicable or insufficient number of responses to this particular question
a Area ranks are calculated using a weighted average of sub-indicators. For a more detailed description, see Appendix A.
b Where possible, we report a state’s rank as compared to other states on a given metric. For example, out of 51 jurisdictions, the District of Columbia has the 21st-highest percentage of teachers who are union members. Otherwise, we report a status: the District of Columbia has mandatory collective bargaining, and union agency fees are permitted. For a more detailed description of our metrics and methodology, see Appendix A. To request the raw data for D.C., send an email to [email protected].
c Our data sources for certain indicators did not always include the District of Columbia. In Area 1, the National Association of State Budget Officers’ State Expenditure Report does not include the District in its analyses because its revenues and expenditures are not comparable to other states. In Area 2, the National Institute on Money in State Politics collects campaign finance reports filed by candidates for state, but not local, office.
d See notes in Area 4, above, and in Appendix A regarding our treatment of D.C. policy mandates.
e For all survey questions, stakeholders were asked specifically about teacher unions, candidates, policies, and leaders in their jurisdiction or state.
49*
41
Overall Rank: 33rdTier 4 (Weak)
DISTRICT OF COLUMBIA

ENDNOTES
1 A state’s overall rank is calculated as follows: First, we score it on multiple sub-indicators (sub-indicator data and scores for Washington, D.C. are shown in the table, District of Columbia Rankings by Area and Indicator). Second, we take a weighted average of the sub-indicators in each of five areas. In each area, we use that average to place the states in rank order: For example, in Area 1: Resources and Membership, the District is ranked 17th of 51 based on the weighted average of its sub-indicators. To generate the state’s overall rank, we average the five area ranks together, then re-order the states. For a more detailed description of data sources and methodology, see Appendix A.
2 We understand that this percentage appears very low, especially given the attention the District receives for its high per-pupil expenditures and teacher salaries. There are numerous explanations that might account for this: First, D.C. is unique because the majority of employer pension contributions to teacher pensions is the obligation of the U.S. Treasury, not the school district. Second, the NCES cautions against comparing the District of Columbia to other states because it has only one school district, and therefore per-pupil expenditures (and allocations for salaries and benefits as compared to other operating expenses) are not similar to those in other states. Third, per-pupil spending in urban districts tends to be considerably higher than non-urban districts in the same, but D.C. does not see its high expenditures averaged with lower ones from non-urban districts. Finally, the District used external funding sources for its teacher performance bonuses (although as of 2013 that will no longer be the case).
3 The National Institute on Money in State Politics collects campaign-finance reports filed by candidates for state, but not local, offices, and hence does not report any data for Washington, D.C. Further, the Consortium for Political and Social Research’s 2000 Convention Delegate Survey does not include information on D.C. delegates to the Democratic and Republican national conventions. As such, we could not score the WTU on its involvement in politics.
4 DCPS also has a performance-pay system, where teachers earn bonuses after receiving one “highly effective” yearly rating and are eligible for raises to their base salary after multiple years of positive evaluations. To receive the bonuses and raises, they must also waive job protection should they be excessed and unable to find another placement (see DCPS Impactplus, http://www.dc.gov/DCPS/In+the+Classroom/Ensuring+Teacher+Success/IMPACT+(Performance+Assessment)/IMPACTplus). However, this is a negotiated program between the WTU and the District rather than a policy mandate from the District, and as such, we do not record D.C. as having state-required performance pay. See Appendix A, note in sub-indicator 3.1.2, for a detailed explanation.
5 We administered our survey in Summer 2011, after contract negotiations between Michelle Rhee and the WTU closed. Although the WTU called AFT president Randi Weingarten to help resolve the two-and-a-half-year dispute over (among other things) merit pay, transfers based on teacher performance, and the elimination of tenure, the resulting contract was heralded as a victory for Rhee. Although the union added clauses for transparency, the spirit of Rhee’s original provisions remained intact. The contract (and 2009’s student achievement-based IMPACT system for teacher evaluations and dismissals, over which the WTU had no say) confirmed that the WTU’s strength had significantly diminished since the district came under mayoral control.
6 Bill Turque, “D.C. Launches Rigorous Teacher Evaluation System,” Washington Post, October 1, 2009, http://www.washingtonpost.com/wp-dyn/content/article/2009/09/30/AR2009093004729.html.
7 Lisa Gartner, “D.C. Urges Schools To De-Emphasize Standardized Testing For Teacher Evaluations,” Washington Examiner, May 23, 2012, http://washingtonexaminer.com/article/646356.
8 “D.C. Schools Fires More Than 400 Teachers,” HuffingtonPost.com, September 14, 2011, http://www.huffingtonpost.com/2011/07/15/dc-schools-fires-more-tha_n_900120.html.
9 Emma Brown, “98 D.C. Teachers Fired For Poor Performance,” Washington Post, August 2, 2012, http://www.washingtonpost.com/local/education/98-dc-teachers-fired-for-poor-performance-school-officials-say/2012/08/01/gJQAu67vPX_story.html.
10 Ibid.
11 Nathan Saunders, “Impact 3.0,” Washington Teachers’ Union, August 3, 2012, http://wtuteacherslounge.org/2012/08/03/impact-3-0/.
12 Evaluations for General Education Teachers with Individual Value-Added Student Achievement Data (DCPS IMPACT guidebook 2012–13), http://www.dc.gov/DCPS/In+the+Classroom/Ensuring+Teacher+Success/IMPACT+(Performance+Assessment)/IMPACT+Guidebooks.
13 Gartner.
14 Bill Turque, “D.C. Says There’s No Money For Contract Early Retirement Provision,” Washington Post, November 17, 2011, http://www.washingtonpost.com/blogs/dc-schools-insider/post/dc-pleads-poverty-for-teacher-early-retirement/2011/10/25/gIQAXaxRUN_blog.html.
15 Bill Turque, “DCPS, Union Reach Accord On Teacher Retirement,” Washington Post, May 14, 2012, http://www.washingtonpost.com/blogs/dc-schools-insider/post/dcps-union-reach-accord-on-teacher-retirement/2012/05/14/gIQA1HPBPU_blog.html.
Overall Rank: 33rdTier 4 (Weak)
DISTRICT OF COLUMBIA

AREA 2: INVOLVEMENT IN POLITICS 2
TIED FOR 36TH
Compared to other states, Florida teacher
unions were not major donors during the
past decade of state politics (that said, our
calculations are conservative and unions
have certainly been active, especially in the
courts—see sidebar). Contributions from
teacher unions made up just 0.21 percent
(42nd) of total donations to candidates
for state office.3 Those contributions
comprised just 1.4 percent of the donations
to candidates from the ten highest-giving
sectors in the state (45th). Teacher unions
did, however, contribute 1.7 percent of
all donations received by state political
parties (17th). But the union presence at
the Democratic and Republican national
conventions was not particularly strong,
with 12.5 percent of Florida’s delegates
identifying as teacher union members
(28th).4
STRONGER WEAKER
1. RESOURCES AND MEMBERSHIP
OVERALL
2. INVOLVEMENT IN POLITICS
3. SCOPE OF BARGAINING
4. STATE POLICIES
5. PERCEIVED INFLUENCE
AREA 1: RESOURCES AND MEMBERSHIP
TIED FOR 47TH
Florida’s state-level teacher union contends
with limited financial resources and low
membership. Just 55.8 percent of the
state’s teachers are union members (40th
of 51 jurisdictions). Further, the merged
state-level NEA and AFT affiliate, the
Florida Education Association (FEA),
brings in a mere $182 annually per teacher
in the state (42nd). The union also does
not see high spending on education as
compared to other states: While the state
directs 20.1 percent of its expenditures to
K–12 education (22nd), dollars per-pupil
(a combination of state, federal, and local
money) amounts to just $9,576 (40th).
Only 49.9 percent of those dollars go
toward teacher salaries and benefits—just
two states spend smaller portions.
FLORIDA OVERALL RANK: 50TH1
TIER 5 (WEAKEST)
50
36
46
47
50
35
Overall Rank: 50thTier 5 (Weakest)
FLORIDA

AREA 3: SCOPE OF BARGAINING
TIED FOR 35TH
While Florida is one of thirty-two states
that require collective bargaining, unions
are not allowed to automatically collect
agency fees from non-member teachers,
and therefore union revenues are limited
(see Area 1). State law also prohibits
teacher strikes. Florida does, however,
have a relatively permissive scope of
bargaining: Of twenty-one items examined
in this metric, four must be negotiated—
wages, hours, terms and conditions of
employment, and grievance procedures—
and only teacher dismissal is prohibited.
Bargaining is permitted over the remaining
sixteen items—the inclusion of insurance
benefits is explicitly left to the discretion of
the districts, and fifteen items are implicitly
within the scope of bargaining because the
state does not address them at all.
AREA 4: STATE POLICIES
TIED FOR 46TH
Florida education policies are less aligned
with traditional union interests than
the policies of nearly every other state.
Recent laws eliminated tenure for new
teachers, required student achievement
data to be the predominant criterion
in teacher evaluations, and outlined
stringent consequences for unsatisfactory
evaluations (see sidebar). Teacher
performance must be considered in layoff
decisions (while seniority is an optional
criterion), and Florida is one of just three
states with a state-supported mandatory
system of merit pay for all teachers.
Further, the state does not limit the number
and type of charter schools allowed to
operate, and it automatically exempts
them from district collective bargaining
agreements. On the other hand, Florida is
one of just two states that have a state-
mandated class size limit that is smaller
than the national average (Nevada is the
other).
AREA 5: PERCEIVED INFLUENCE
50TH
Stakeholders report that Florida’s state
union is very weak—only Mississippi
respondents perceived their unions to
be weaker. Florida stakeholders rank the
union’s influence on education policy
below the state charter school association,
education advocacy groups, the state
association of school administrators,
and the business roundtable/chamber
of commerce. While respondents report
that Democrats running for state-level
office often need teacher union support
to get elected, they also note that state
education leaders are rarely aligned with
union positions and that the union was not
effective in protecting dollars for education
and in warding off proposals with which it
disagrees. Finally, respondents indicate that
policies proposed by the governor in the
latest legislative session were mostly not in
line, and the policies actually enacted were
not at all in line, with union priorities (an
unsurprising response given that recently
the FEA seems unable to sway lawmakers
and has on several occasions turned to the
courts instead—see sidebar).5
OVERALL
50TH
Florida’s state teacher union is one of
the weakest in the nation: It has scant
resources, few recent policy successes,
a feeble reputation, and few allies in the
capitol. Florida’s state union is by far the
weakest of any state in which bargaining is
mandatory.
Overall Rank: 50thTier 5 (Weakest)
FLORIDA

On its face, Florida’s 2012–13 budget looked good for schools, promising a $1 billion increase to K–12 education.6 But according to Florida Education Association (FEA) president Andy Ford, that’s not enough for local districts, which must find a way to fill the hole left by depleted local funds (caused by plunging property values) and the end of federal “bailout” money. It’s not just inadequate dollars for education, but also how those dollars are used that has the FEA upset: The budget allocated money for charter school expansion and increased tax credits for corporations that donate to voucher-like scholarships for attending private schools, which Ford pans as “another example of political leaders favoring unproven and less-accountable schools over our traditional neighborhood schools.”7,8 (Of course, the FEA has long opposed voucher programs.)9 Perhaps the FEA will take its objections to court, as it did in response to a 2011 law requiring state employees to contribute 3 percent of their salaries to pensions (they did not previously pay into the system). That law was overturned in circuit court in March 2012, but the FEA will have to wait until the end of the year, or beyond, for the state supreme court to make a final decision.10
With no allies in the Republican-led governor’s office and legislature, the FEA again turned to the courts. In March 2011, legislators passed SB 736, despite the union’s warning that it would result in “unfair decisions about pay and employment, potential lawsuits, and lost educational opportunity for tens of thousands of the state’s schoolchildren.”11 Praised by Michelle Rhee (and slammed by AFT president Randi Weingarten), the law eliminated tenure for new teachers, tied teacher pay and dismissals to evaluations rather than seniority, and required that at least half of a teacher’s evaluation be based on student growth on standardized tests.12 Resorting once more to the courts, the FEA sued to block the bill on grounds that it was unconstitutional. But it’s unlikely that the union will halt the reforms in the long run—the state denied the allegations of the suit, districts have already started implementing the evaluation system, and the FEA does not actually oppose merit pay (but believes that teacher evaluations should be bargained).13 With two lawsuits pending and Republican-majority state leaders set on education reform, the FEA may soon find the gavel insufficient protection.
TELL IT TO THE JUDGE
Overall Rank: 50thTier 5 (Weakest)
FLORIDA

OVERALL RANK: 50TH
Area and Ranka General Indicator Sub-IndicatorSub-Indicator Rank/Statusb
AREA 1: RESOURCES & MEMBERSHIP
Membership By rank, what percentage of public-school teachers in the state are union members? 40th
Revenue By rank, what is the total yearly revenue (per teacher in the state) of the state-level NEA and/ or AFT affiliate(s)?
42nd
Spending on education By rank, what percentage of state expenditures (of state general funds, state restricted funds, state bonds, and federal “pass-through” funds) is directed to K-12 education?
22nd
By rank, what is the total annual per-pupil expenditure (of funds from federal, state, and local sources) in the state?
40th
By rank, what percentage of total annual per-pupil expenditures is directed to teacher salaries and benefits?
49th
AREA 2: INVOLVEMENTIN POLITICS
Contributions to candidates and political parties
By rank, what percentage of the total contributions to state candidates was donated by teacher unions?
42nd
By rank, what percentage of the total contributions to state-level political parties was donated by teacher unions?
17th
Industry influence By rank, what percent of the contributions to state candidates from the ten highest-giving sectors was donated by teacher unions?
45th
Status of delegates By rank, what percentage of the state’s delegates to the Democratic and Republican conventions were members of teacher unions?
28th*
AREA 3:SCOPE OF BARGAINING
Legal scope of bargaining What is the legal status of collective bargaining? Mandatory
By rank, how broad is the scope of collective bargaining? 20th
Automatic revenue streams What is the unions’ legal right to automatically collect agency fees from non-members and/or collect member dues via automatic payroll deductions?
Agency fees prohibited
Right to strike What is the legal status of teacher strikes? Prohibited
AREA 4:STATE POLICIES
Performance pay Does the state support performance pay for teachers? Required for all teachers
Retirement By rank, what is the employer- versus employee-contribution rate to the teacher pension system? 36th
Evaluations What is the maximum potential consequence for veteran teachers who receive unsatisfactory evaluation(s)?
Eligible for dismissal
Is classroom effectiveness included in teacher evaluations? If so, how is it weighted? Required; Preponderant criterion
Terms of employment How long before a teacher earns tenure? Annual contracts only
Is student/teacher performance considered in tenure decisions? If so, how is it weighted? Required; Preponderant criterion
Is seniority considered in teacher layoff decisions? If so, how is it weighted? Optional; May be considered among other factors
Is teacher performance included in teacher layoff decisions? If so, how is it weighted? Required; Considered among other factors
By rank, what percentage of the teaching workforce was dismissed due to poor performance? 15th
Class size Is class size restricted for grades 1-3? If so, is the restriction higher or lower than the national average (20)?
Yes; Lower
FLORIDA RANKINGS BY AREA AND INDICATOR
47*
36*
35*
46*
Overall Rank: 50thTier 5 (Weakest)
FLORIDA

Area and Rank General Indicator Sub-IndicatorSub-Indicator Rank/Status
AREA 4:STATE POLICIES
(cont.)
Charter school structural limitations
Is there a cap (limit) placed on the number of charter schools that can operate in the state (or other jurisdiction) and/or on the number of students who can attend charter schools?
No state cap
Does the state allow a variety of charter schools: start-ups, conversions, and virtual schools? Yes
How many charter authorizing options exist? How active are those authorizers? Two or more w/ limited jurisdiction
Charter school exemptions Are all charter schools automatically exempt from state laws and state/district regulations (except those that safeguard students and fiscal accountability)? If not, are they eligible for exemptions?
Partially; Some automatic exemptions for all schools
Are all charter schools automatically exempt from state teacher-certification requirements? If not, are they eligible for exemptions?
No; Schools cannot apply for exemptions
Are all charter schools automatically exempt from collective bargaining agreements (CBAs)? If not, are they eligible for exemptions?
Yes
AREA 5:PERCEIVED INFLUENCEc
Relative influence of teacher unions
How do you rank the influence of teacher unions on education policy compared with other influential entities?
Fifth-most influential or below
Influence over campaigns On a scale from always to never, how often do Democratic candidates need teacher-union support to get elected?
Often/Always
On a scale from always to never, how often do Republican candidates need teacher-union support to get elected?
Never/Rarely
Influence over spending To what extent, from strongly agree to strongly disagree, do you agree that even in times of cutbacks, teacher unions are effective in protecting dollars for education?
Disagree
Given recent budgetary constraints, would you say that teacher unions generally make concessions to prevent reductions in pay and benefits or fight hard to prevent those reductions?
Fight
Influence over policy To what extent, from strongly agree to strongly disagree, do you agree that teacher unions ward off proposals in your state with which they disagree?
Disagree
On a scale from always to never, how often do existing state education policies reflect teacher-union priorities?
Rarely
To what extent, from totally in line to not at all in line, were state education policies proposed by the governor during your state’s latest legislative session in line with teacher-union priorities?
Not at all/Mostly not in line
To what extent, from totally in line to not at all in line, were legislative outcomes of your state’s latest legislative session in line with teacher-union priorities?
Not at all in line
Influence over key stakeholders
On a scale from always to never, how often have the priorities of state education leaders aligned with teacher-union positions in the past three years?
Rarely
Would you say that teacher unions typically compromise with policymakers to ensure that their preferred policies are enacted, or typically need not make concessions?
Compromise
* Tied with another state
a Area ranks are calculated using a weighted average of sub-indicators. For a more detailed description, see Appendix A.
b Where possible, we report a state’s rank as compared to other states on a given metric. For example, out of 51 states, Florida has the 40th-highest percentage of teachers who are union members. Otherwise, we report a status: Florida has mandatory collective bargaining, and union agency fees are prohibited. For a more detailed description of our metrics and methodology, see Appendix A. To request the raw data for your state, send an email to [email protected].
c For all survey questions, stakeholders were asked specifically about teacher unions, candidates, policies, and leaders in their state. In addition, we asked about unions and policies in the “current legislative session,” but because legislative calendars vary from state to state, responses refer to policies proposed and enacted within the 2010-11 window.
46*
50
Overall Rank: 50thTier 5 (Weakest)
FLORIDA

ENDNOTES
1 A state’s overall rank is calculated as follows: First, we score it on multiple sub-indicators (sub-indicator data and scores for Florida are shown in the table, Florida Rankings by Area and Indicator). Second, we take a weighted average of the sub-indicators in each of five areas. In each area, we use that average to place the states in rank order: For example, in Area 1: Resources and Membership, Florida is ranked 47th of 51 based on the weighted average of its sub-indicators. To generate the state’s overall rank, we average the five area ranks together, then re-order the states. For a more detailed description of data sources and methodology, see Appendix A.
2 Readers should note that these figures include only direct donations from unions and union-connected PACs, but not their spending on electioneering/advertising, mobilizing the union’s own membership, lobbying, or advocacy. A recent Wall Street Journal report found that donations and lobbying activities account for a small share of union political spending compared with their expenditures on member mobilization and advocacy. Even the AFT agreed, making the argument that since its mission is organizing and activism, it will naturally spend significant amounts on these activities. Thus, the percentages we report here are extremely conservative representations of what unions actually spend on politics. For more information, see Appendix A, Area 2; Tom McGinty and Brody Mullins, “Political Spending by Unions Far Exceeds Direct Donations,” Wall Street Journal, July 10, 2012; and Jeff Hauser, “Wall Street Journal Compares Union Political Spending to Corporate Donations,” AFL-CIO, July 10, 2012.
3 The indicators in Area 2 are calculated using total contributions to state candidates and political parties from local, state, and national unions. In the majority of cases, the state unions gave much higher sums than all the local unions combined, with the national associations giving little (or nothing). Florida is an exception because the sum of the donations from individual local affiliates is far greater than the contributions from the state union.
4 At the time of publication, the 2000 conventions were the most recent for which such detailed data were available in forms that met rigorous standards. However, 2008 data provided by the Democratic National Convention were highly correlated with the reliable figures from 2000.
5 We asked stakeholders about unions and policies in the “current legislative session,” but because legislative calendars vary from state to state, responses refer to policies proposed and enacted within the 2010-11 window.
6 Lizette Alvarez, “Florida Higher Education May Face Big Budget Cuts,” New York Times, March 6, 2012, http://www.nytimes.com/2012/03/07/education/florida-higher-education-may-face-big-budget-cuts.html.
7 Andy Ford, “Public Education Shortchanged — Again,” Star-Banner, April 22, 2012, http://www.ocala.com/article/20120422/OPINION/120429969.
8 Jeff Solochek, “Voucher Debate Spreads As Florida Expands Access,” Tampa Bay Times, April 9, 2012, http://www.tampabay.com/blogs/gradebook/content/voucher-debate-spreads-florida-expands-access.
9 Most famously, the FEA (along with the NEA and AFT) supported a group of parents in filing a lawsuit against former Governor Jeb Bush’s Opportunity Scholarships—a voucher program which proposed public money to pay private school tuition. After a six-year court battle led by NEA lawyers, the Florida Supreme Court ordered the voucher program closed. See Sam Dillon, “Florida Supreme Court Blocks School Vouchers, New York Times, January 6, 2006, http://www.nytimes.com/2006/01/06/national/06florida.html; the Institute for Justice, “Safeguarding Educational Freedom: Latest Legal Showdown For School Choice Heads To Florida Supreme Court,” accessed August 27, 2012, http://www.ij.org/florida-school-choice-background.
10 Kathleen Haughney, “Judge Overturns Public Employee Pension Contribution Requirement,” Florida Sun-Sentinel, March 6, 2012, http://articles.sun-sentinel.com/2012-03-06/business/fl-judge-to-rule-on-pension-20120306_1_florida-retirement-system-public-employees-retirement-age.
11 “Teachers, Researchers: SB 736 Takes Wrong Track,” Florida Education Association, February 22, 2011, http://feaweb.org/teachers-researchers-sb-736-takes-wrong-track.
12 Bill Kaczor, “Gov. Scott Signs Florida Teacher Pay, Tenure Bill,” Associated Press, March 25, 2011, http://www.businessweek.com/ap/financialnews/D9M68VQ01.htm.
13 Jeff Solochek, “Florida Teacher Lawsuit Over SB736 Moves Slowly,” Tampa Bay Times, November 15, 2011, http://www.tampabay.com/blogs/gradebook/content/florida-teacher-lawsuit-over-sb-736-moves-slowly.
Overall Rank: 50thTier 5 (Weakest)
FLORIDA

Overall Rank: 45thTier 5 (Weakest)
GEORGIA
IntroductionPart IV: Taking a Closer Look–Teacher Union Influence Area
AREA 1: RESOURCES AND MEMBERSHIP
TIED FOR 35TH
Georgia’s two state-level teacher
associations (one affiliated with the NEA,
the other with the AFT) have limited
financial and membership resources.
Collective bargaining is prohibited in the
state, and just 54.8 percent of its teachers
belong to teacher associations (41st of 51
jurisdictions). They bring in $87 per Georgia
teacher annually (49th, ahead of just Texas
and South Carolina). On the other hand,
Georgia spends a relatively large portion
of its state budget on K-12 education (24.4
percent, placing it 9th). Total per-pupil
spending is on the low side of the middle
($9,827 per year; 38th), but a relatively high
proportion of those dollars goes to teacher
salaries and benefits (57.5 percent; 7th).
AREA 2: INVOLVEMENT IN POLITICS2
TIED FOR 36TH
Compared to teacher unions in other states,
Georgia’s associations are not particularly
involved in state politics. In the past
decade, just 0.33 percent of contributions
to candidates for state office came from
them (34th); these donations made up
only 2.9 percent of the funds contributed
by the ten highest-giving sectors in the
state (37th). In addition, the associations
gave only 0.34 percent of the contributions
to state political parties (42nd). Finally,
13.4 percent of Georgia’s delegates to the
Democratic and Republication national
conventions identified as teacher union
members (25th).3
GEORGIA OVERALL RANK: 45TH1
TIER 5 (WEAKEST)
STRONGER WEAKER
1. RESOURCES AND MEMBERSHIP
OVERALL
2. INVOLVEMENT IN POLITICS
3. SCOPE OF BARGAINING
4. STATE POLICIES
5. PERCEIVED INFLUENCE
45
36
26
35
45
48

Overall Rank: 45thTier 5 (Weakest)
GEORGIA
AREA 3: SCOPE OF BARGAINING
TIED FOR 48TH; LAST PLACE
Georgia is one of only five states that
explicitly prohibit collective bargaining.
Although teachers can opt to join local
and/or state professional associations,
those entities may not automatically collect
agency fees from non-members who work
in districts they represent (a limitation that
contributes to the low association revenues
noted in Area 1). The state also prohibits
teacher strikes.
AREA 4: STATE POLICIES
26TH
While some Georgia policies, particularly
those dealing with teacher employment,
align with traditional union interests, others
do not. Teachers earn tenure after three
years (the national norm), and student
learning is not considered in tenure
decisions. Although teacher evaluations
must include evidence of student learning,
state law lets districts decide how learning
is defined and measured and how much
weight it carries among all evaluation
criteria. On the other hand, unions typically
do not support charter schools, and
Georgia law encourages charter expansion
and autonomy—it does not cap the
number of charters, and it allows start-ups,
conversions, and virtual schools. While not
automatically exempt, charters can apply
for exemptions to state laws (including
teacher certification requirements) and
district regulations.
AREA 5: PERCEIVED INFLUENCE
45TH
Georgia stakeholders describe teacher
associations that are comparatively weaker
than those in nearly every other state.
Survey respondents rank them as less
influential than the state school boards
association, the state charter school
association, and education advocacy
groups. They note that state education
leaders only sometimes align with
teacher association positions and that the
associations are not effective in protecting
dollars for education. Further, they report
that policies both proposed by the
governor and those actually enacted during
the latest legislative session were generally
not in line with teacher association
priorities.4
OVERALL
45TH
Georgia’s teacher associations are weak
across the board, not surprising in a state in
which collective bargaining is prohibited—
and whose politics are fairly conservative.
They have few resources and a weak
reputation. While teacher employment
policies are somewhat union-favorable,
charter laws are not, and the associations
stayed out of the way when lawmakers
enacted reforms en route to receiving a
Race to the Top award (see sidebar).

Overall Rank: 45thTier 5 (Weakest)
GEORGIA
The NEA-affiliated Georgia Association of Educators (GAE) has kept a fairly low profile in the Peach State. When in 2010 state leaders required districts to design and implement teacher evaluation systems based on student growth—to meet the requirements of their successful Race to the Top application—the GAE did not vociferously object (although the GAE did express dismay that the system was punitive, lacked teacher input, and would be implemented inconsistently).5,6 It did successfully lobby to kill SB 469, a 2012 proposal that would prohibit automatic payroll deductions of member dues—but only with the help of an array of strange bedfellows, including the Tea Party, the Occupy movement, civil rights activists, and religious leaders.7
The GAE is also keeping a relatively low profile on a constitutional amendment allowing the state to authorize charter schools. Voters will decide on the issue in November 2012, but so far the union has limited its activities to issuing press releases and fundraising.8 The charter conflict began in 2009 when the legislature established the Georgia Charter Schools Commission and granted it power to approve and fund new charters, just as local districts could.9 In May 2011, however, the Georgia Supreme Court held that the Commission violated the constitutionally protected authority of local districts and revoked the charters of the seventeen Commission-authorized schools (out of a total of 127 charters in the state), affecting 16,000 students.10 Pro-reform lawmakers responded with the pending constitutional amendment, which drove a rift between Governor Nathan Deal, who supports it, and State Superintendent John Barge, a former rural superintendent who broke with fellow Republicans to come out staunchly against it. Barge stated that the amendment is unnecessary, redundant, and would cost district schools $430 million over the next five years: “Until all of our public school students are in school for a full 180-day school year, until essential services like student transportation and student support can return to effective levels, and until teachers regain jobs with full pay for a full school year, we should not redirect one more dollar away from Georgia’s local school districts.”11 The GAE applauded Barge, stating, “His announcement shows he fully understands the negative ramifications for our public school children.”12
September 2012 polls show voters are divided: half support the amendment, one-quarter oppose it, and one-quarter are undecided. To date, the GAE hasn’t begun advertising or otherwise campaigning in earnest.13 Given that Deal’s endorsement helped two candidates narrowly win their tight primary races in August, and that teacher unions are embroiled in a public-relations nightmare (despite negative public opinion statewide, the GAE and AFT publicly defended the rights of 178 Atlanta teachers caught in the biggest testing scandal in history), the union could find it has little support from voters come November. 14,15
WINNERS NEVER CHEAT, CHEATERS NEVER WIN

Overall Rank: 45thTier 5 (Weakest)
GEORGIA
OVERALL RANK: 45TH
Area and Ranka General Indicator Sub-IndicatorSub-Indicator Rank/Statusb
AREA 1: RESOURCES & MEMBERSHIP
Membership By rank, what percentage of public-school teachers in the state are union members? 41st
Revenue By rank, what is the total yearly revenue (per teacher in the state) of the state-level NEA and/ or AFT affiliate(s)?
49th
Spending on education By rank, what percentage of state expenditures (of state general funds, state restricted funds, state bonds, and federal “pass-through” funds) is directed to K-12 education?
9th
By rank, what is the total annual per-pupil expenditure (of funds from federal, state, and local sources) in the state?
38th
By rank, what percentage of total annual per-pupil expenditures is directed to teacher salaries and benefits?
7th
AREA 2: INVOLVEMENTIN POLITICS
Contributions to candidates and political parties
By rank, what percentage of the total contributions to state candidates was donated by teacher unions?
34th
By rank, what percentage of the total contributions to state-level political parties was donated by teacher unions?
42nd
Industry influence By rank, what percent of the contributions to state candidates from the ten highest-giving sectors was donated by teacher unions?
37th
Status of delegates By rank, what percentage of the state’s delegates to the Democratic and Republican conventions were members of teacher unions?
25th
AREA 3:SCOPE OF BARGAINING
Legal scope of bargaining What is the legal status of collective bargaining? Prohibited
By rank, how broad is the scope of collective bargaining? 47th*
Automatic revenue streams What is the unions’ legal right to automatically collect agency fees from non-members and/or collect member dues via automatic payroll deductions?
Bargaining is not allowed
Right to strike What is the legal status of teacher strikes? Prohibited
AREA 4:STATE POLICIES
Performance pay Does the state support performance pay for teachers? Available to all teachers
Retirement By rank, what is the employer- versus employee-contribution rate to the teacher pension system? 20th
Evaluations What is the maximum potential consequence for veteran teachers who receive unsatisfactory evaluation(s)?
Teacher improvement plan
Is classroom effectiveness included in teacher evaluations? If so, how is it weighted? Evidence of student “learning” required
Terms of employment How long before a teacher earns tenure? Three years
Is student/teacher performance considered in tenure decisions? If so, how is it weighted? Not included
Is seniority considered in teacher layoff decisions? If so, how is it weighted? Required; Considered among other factors
Is teacher performance included in teacher layoff decisions? If so, how is it weighted? Not required
By rank, what percentage of the teaching workforce was dismissed due to poor performance? 18th
Class size Is class size restricted for grades 1-3? If so, is the restriction higher or lower than the national average (20)?
Yes; Higher
GEORGIA RANKINGS BY AREA AND INDICATOR
35*
36*
48*
26

Overall Rank: 45thTier 5 (Weakest)
GEORGIA
Area and Rank General Indicator Sub-IndicatorSub-Indicator Rank/Status
AREA 4:STATE POLICIES
(cont.)
Charter school structural limitations
Is there a cap (limit) placed on the number of charter schools that can operate in the state (or other jurisdiction) and/or on the number of students who can attend charter schools?
No state cap
Does the state allow a variety of charter schools: start-ups, conversions, and virtual schools? Yes
How many charter authorizing options exist? How active are those authorizers? Single option; Some activity
Charter school exemptions Are all charter schools automatically exempt from state laws and state/district regulations (except those that safeguard students and fiscal accountability)? If not, are they eligible for exemptions?
No; Schools can apply for exemptions
Are all charter schools automatically exempt from state teacher-certification requirements? If not, are they eligible for exemptions?
No; Schools can apply for exemptions
Are all charter schools automatically exempt from collective bargaining agreements (CBAs)? If not, are they eligible for exemptions?
Yes
AREA 5:PERCEIVED INFLUENCEc
Relative influence of teacher unions
How do you rank the influence of teacher unions on education policy compared with other influential entities?
Fourth-most influential
Influence over campaigns On a scale from always to never, how often do Democratic candidates need teacher-union support to get elected?
Sometimes/Often
On a scale from always to never, how often do Republican candidates need teacher-union support to get elected?
Rarely
Influence over spending To what extent, from strongly agree to strongly disagree, do you agree that even in times of cutbacks, teacher unions are effective in protecting dollars for education?
Disagree
Given recent budgetary constraints, would you say that teacher unions generally make concessions to prevent reductions in pay and benefits or fight hard to prevent those reductions?
Generally fight
Influence over policy To what extent, from strongly agree to strongly disagree, do you agree that teacher unions ward off proposals in your state with which they disagree?
Neutral
On a scale from always to never, how often do existing state education policies reflect teacher-union priorities?
Rarely
To what extent, from totally in line to not at all in line, were state education policies proposed by the governor during your state’s latest legislative session in line with teacher-union priorities?
Mostly not in line/Somewhat in line
To what extent, from totally in line to not at all in line, were legislative outcomes of your state’s latest legislative session in line with teacher-union priorities?
Mostly not in line/Somewhat in line
Influence over key stakeholders
On a scale from always to never, how often have the priorities of state education leaders aligned with teacher-union positions in the past three years?
Rarely/Sometimes
Would you say that teacher unions typically compromise with policymakers to ensure that their preferred policies are enacted, or typically need not make concessions?
Compromise
* Tied with another state
a Area ranks are calculated using a weighted average of sub-indicators. For a more detailed description, see Appendix A.
b Where possible, we report a state’s rank as compared to other states on a given metric. For example, out of 51 states, Georgia has the 41st-highest percentage of teachers who are union members. Otherwise, we report a status: In Georgia, collective bargaining is prohibited, and teacher strikes are also prohibited. For a more detailed description of our metrics and methodology, see Appendix A. To request the raw data for your state, send an email to [email protected].
c For all survey questions, stakeholders were asked specifically about teacher unions, candidates, policies, and leaders in their state. In addition, we asked about unions and policies in the “current legislative session,” but because legislative calendars vary from state to state, responses refer to policies proposed and enacted within the 2010-11 window.
26
45

Overall Rank: 45thTier 5 (Weakest)
GEORGIA
ENDNOTES
1 A state’s overall rank is calculated as follows: First, we score it on multiple sub-indicators (sub-indicator data and scores for Georgia are shown in the table, Georgia Rankings by Area and Indicator). Second, we take a weighted average of the sub-indicators in each of five areas. In each area, we use that average to place the states in rank order: For example, in Area 1: Resources and Membership, Georgia is ranked 35th of 51 based on the weighted average of its sub-indicators. To generate the state’s overall rank, we average the five area ranks together, then re-order the states. For a more detailed description of data sources and methodology, see Appendix A.
2 Readers should note that these figures include only direct donations from unions and union-connected PACs, but not their spending on electioneering/advertising, mobilizing the union’s own membership, lobbying, or advocacy. A recent Wall Street Journal report found that donations and lobbying activities account for a small share of union political spending compared with their expenditures on member mobilization and advocacy. Even the AFT agreed, making the argument that since its mission is organizing and activism, it will naturally spend significant amounts on these activities. Thus, the percentages we report here are extremely conservative representations of what unions actually spend on politics. For more information, see Appendix A, Area 2; Tom McGinty and Brody Mullins, “Political Spending by Unions Far Exceeds Direct Donations,” Wall Street Journal, July 10, 2012; and Jeff Hauser, “Wall Street Journal Compares Union Political Spending to Corporate Donations,” AFL-CIO, July 10, 2012.
3 At the time of publication, the 2000 conventions were the most recent for which such detailed data were available in forms that met rigorous standards. However, 2008 data provided by the Democratic National Convention were highly correlated with the reliable figures from 2000.
4 We asked stakeholders about unions and policies in the “current legislative session,” but because legislative calendars vary from state to state, responses refer to policies proposed and enacted within the 2010-11 window.
5 Jaime Sarrio, “Teachers To Be Graded On Student Test Scores,” Atlanta Journal-Constitution, January 2, 2011, http://www.ajc.com/news/news/local/teachers-to-be-graded-on-student-test-scores/nQpLG/.
6 “Evaluations and Peer Review” and “GAE Emphasizes That New RT3 Teacher Evaluation Instrument Must Be Implemented Uniformly,” Georgia Association of Educators, accessed August 31, 2012, http://gae2.org/content.asp?contentid=736 and http://gae2.org/content.asp?ContentId=1555.
7 Gloria Tatum, “Occupy Atlanta, Tea Party Patriots Defeat SB 469,” Atlanta Progressive News, March 30, 2012, http://www.atlantaprogressivenews.com/interspire/news/2012/03/30/occupy-atlanta-tea-party-patriots-defeat-sb-469.html.
8 Walter Jones, “Half Of Polled Voters Favor Charter School Amendment,” Morris News Service, September 11, 2012, http://www.cedartownstd.com/view/full_story/20114157/article-Half-of-polled-voters-favor-charter-school-amendment?instance=home_news_lead_story.
9 D. Aileen Dodd, “Georgia Charter School Ruling To Reverberate Across Nation,” Atlanta Journal-Constitution, March 21, 2011, http://www.ajc.com/news/news/local/georgia-charter-school-ruling-to-reverberate-acros/nQrm6/. HB 881, the legislation creating the Commission (http://gcsc.georgia.gov/gcsc/HB881/hb881.pdf), granted it permission to authorize (§20-2-2081) and fund (§20-2-2090) “commission charter schools” as “special schools” allowable by Article VIII, Section V, Paragraph VII(a) of the Georgia constitution. House Bill 881 also provides that commission charter schools receive extra state funding equal to the local funding they would miss by not being chartered by a local district. When it created and funded commission charter schools, the Commission was operating within the power given to it by HB 881. However, the May 2011 Supreme Court ruling found HB 881 unconstitutional, saying that the constitution did not intend for “special schools” to supersede local district’s exclusive control over K-12 education. The state could authorize special schools but could not give them additional money, because that money was taken from the students’ original district’s share of state funding.
10 Ibid.; “Georgia Charter Schools Weigh Options After State Court Declines To Revisit Decision,” HuffingtonPost.com, June 14, 2011,http://www.huffingtonpost.com/2011/06/14/georgia-charter-schools_n_877014.html. The commission charter schools can reapply as special schools but would receive direct state and federal funds only, without the state-matched local funds.
11 Dave Williams, “Georgia Schools Chief Opposes Charter School Amendment,” Atlanta Business Chronicle, August 14, 2012, http://www.bizjournals.com/atlanta/news/2012/08/14/georgia-schools-chief-opposes-charter.html.
12 Deanna Allen (ed.), “GAE Lauds State Superintendent’s Stance Against Charter School Constitutional Amendment,” Patch Network, August 15, 2012, http://barrow.patch.com/announcements/gae-lauds-state-superintendents-stance-against-charter-school-constitutional-amendment.
13 Jones.
14 Greg Toppo, “AFT teachers Union To Defend Educators In Cheating Scandals,” USA Today, July 12, 2011,http://www.usatoday.com/news/education/2011-07-11-teachers-union-cheating_n.htm.
15 “GAE pleased To See Fair Dismissal Process Working,” Georgia Association of Educators, June 28, 2012, http://gae2.org/content.asp?contentid=1649.

Overall Rank: 1stTier 1 (Strongest)
HAWAII
IntroductionPart IV: Taking a Closer Look–Teacher Union Influence Area
AREA 1: RESOURCES AND MEMBERSHIP
TIED FOR 3RD
Hawaii’s state teacher union, the Hawaii
State Teachers Association (HSTA),
benefits from abundant resources and a
high membership rate. It is also Hawaii’s
only teacher union—the state consists of
a single school district—and 96.7 percent
of teachers are members (the 7th-highest
unionization rate of 51 jurisdictions
nationwide). The HTSA brings in $705
annually per teacher in the state, also
the 7th-highest. In addition, per-pupil
expenditures in the Aloha state are 13th-
highest across the country at $13,090
per student, and 54.4 percent of those
expenditures go toward teacher salaries
and benefits (23rd).
AREA 2: INVOLVEMENT IN POLITICS2
TIED FOR 1ST
Hawaii’s teacher union has been a major
player in state politics in the past ten years.
Its donations accounted for 1.5 percent of
total contributions received by candidates
for state office (9th); those contributions
equaled 15.4 percent of all contributions
from the ten highest-giving sectors in the
state (7th). In addition, a full 20.2 percent
of Hawaii’s delegates to the Democratic
and Republican national conventions were
teacher union members (9th).3
AREA 3: SCOPE OF BARGAINING
9TH
Hawaii is one of twenty-one states that
require collective bargaining and permit
unions to automatically collect agency
HAWAII OVERALL RANK: 1ST1 TIER 1 (STRONGEST)
STRONGER WEAKER
1. RESOURCES AND MEMBERSHIP
OVERALL
2. INVOLVEMENT IN POLITICS
3. SCOPE OF BARGAINING
4. STATE POLICIES
5. PERCEIVED INFLUENCE
1
1
9
3
23
9

Overall Rank: 1stTier 1 (Strongest)
HAWAII
fees from non-member teachers—a key
source of union revenue. Still, the state
limits the scope of bargaining in some
ways: Of twenty-one subjects examined in
this analysis, Hawaii law explicitly prohibits
bargaining over four: management rights,
transfers, layoffs, and pension/retirement
benefits. On the other hand, the remaining
seventeen items are either required (wages,
hours, insurance benefits, fringe benefits,
and terms and conditions of employment)
or permitted bargaining subjects.
AREA 4: STATE POLICIES
9TH
In part because they tend to protect
teacher job security, Hawaii policies are
closely aligned with traditional union
interests. State law does not require
that teacher evaluations include student
achievement data. Further, it grants
tenure virtually automatically after just
two years (one of only six states that
confer tenure in fewer than three years),
and layoff decisions are based solely on
seniority rather than teacher performance.
Compared to most other states, Hawaii
teachers contribute less to their pensions
than their employers do, and the state’s
teacher-dismissal rate is the 12th-lowest in
the country, with just 1.1 percent dismissed
each year because of poor performance.
Hawaii law also does not favor charter
schools: The state places a cap with limited
room for growth on the number of charters
that can operate, allows for only a single
authorizer, and requires that all charter
schools be part of existing collective
bargaining agreements (although they can
apply for exemptions).
AREA 5: PERCEIVED INFLUENCE
23RD
Despite the union’s considerable resources,
when compared to respondents in other
states, Hawaii stakeholders perceive the
strength of their union to be moderate, on
par with that of the state school board and
association of school administrators. They
agree that the HSTA fought hard in light
of recent budgetary constraints to prevent
reductions in pay and benefits and that the
union is generally effective in protecting
dollars for education. But they report that
policies proposed by the governor in the
latest legislative session and those actually
enacted were only somewhat in line with
union priorities.4 The perception of limited
influence despite substantial resources
could indicate that the state union is
maintaining a low profile in a favorable
environment, may reflect the union’s recent
clashes with state leaders (see sidebar), or
potentially illustrates the union’s waning
reputation after the state famously (or
infamously) briefly implemented a four-day
week in the fall of 2009 as a belt-tightening
measure.
OVERALL
1ST
Hawaii’s teacher union enjoys substantial
financial resources, a large, unified
membership, and a favorable policy climate.
It is actively involved in state politics,
and—despite its local reputation for only
moderate influence—it is the strongest
state union in the nation.

Overall Rank: 1stTier 1 (Strongest)
HAWAII
In December 2011, Hawaii received a letter from the U.S. Department of Education warning that it risked losing the $75 million that the Aloha State had won through the Race to the Top (RTTT) competition because it had failed to make significant progress on the goals outlined in its application.5 In response, the state and its union leaders quickly drafted a tentative contract that included a new teacher evaluation system incorporating student growth, thus fulfilling one of the main components of the state’s RTTT plan.6 However, union members rejected the proposed contract by a two to one margin, the first time in the history of the Hawaii State Teachers Association that the “rank and file” refused a recommendation by their leaders.7 Legislation intended to pave the way for the new evaluation system died in the Senate in April 2012.8,9
The following month, the Department of Education announced that while it would remain on “high-risk” status, Hawaii would keep its RTTT grant for now. After visiting Hawaii, Department officials commended state and local leaders for their attempts to fulfill their RTTT plan. Later that month, the HSTA re-voted on the original contract deal—and this time, the members of this strongest state union in the nation approved it by 66 to 34 percent. (One reporter covering the story wrote, “In reconsidering the contract, the union stressed to members that it’s the best deal they can get.”)10 It isn’t clear whether Governor Neil Abercrombie will accept the union’s second-chance approval, as he had previously insisted that after HSTA rejected the contract the first time, the offer was no longer valid.11 But it may behoove both sides to come to an agreement soon, unless they’d like more visitors from Washington.
ALOHA FROM WASHINGTON

Overall Rank: 1stTier 1 (Strongest)
HAWAII
OVERALL RANK: 1ST
Area and Ranka General Indicator Sub-IndicatorSub-Indicator Rank/Statusb
AREA 1: RESOURCES & MEMBERSHIP
Membership By rank, what percentage of public-school teachers in the state are union members? 7th
Revenue By rank, what is the total yearly revenue (per teacher in the state) of the state-level NEA and/ or AFT affiliate(s)?
7th
Spending on education By rank, what percentage of state expenditures (of state general funds, state restricted funds, state bonds, and federal “pass-through” funds) is directed to K-12 education?
35th*
By rank, what is the total annual per-pupil expenditure (of funds from federal, state, and local sources) in the state?
13th
By rank, what percentage of total annual per-pupil expenditures is directed to teacher salaries and benefits?
23rd
AREA 2: INVOLVEMENTIN POLITICS
Contributions to candidates and political parties
By rank, what percentage of the total contributions to state candidates was donated by teacher unions?
9th
By rank, what percentage of the total contributions to state-level political parties was donated by teacher unions?
26th
Industry influence By rank, what percent of the contributions to state candidates from the ten highest-giving sectors was donated by teacher unions?
7th
Status of delegates By rank, what percentage of the state’s delegates to the Democratic and Republican conventions were members of teacher unions?
9th
AREA 3:SCOPE OF BARGAINING
Legal scope of bargaining What is the legal status of collective bargaining? Mandatory
By rank, how broad is the scope of collective bargaining? 31st
Automatic revenue streams What is the unions’ legal right to automatically collect agency fees from non-members and/or collect member dues via automatic payroll deductions?
Permitted
Right to strike What is the legal status of teacher strikes? Permitted
AREA 4:STATE POLICIES
Performance pay Does the state support performance pay for teachers? State does not support
Retirement By rank, what is the employer- versus employee-contribution rate to the teacher pension system? 10th
Evaluations What is the maximum potential consequence for veteran teachers who receive unsatisfactory evaluation(s)?
Eligible for dismissal
Is classroom effectiveness included in teacher evaluations? If so, how is it weighted? Not required
Terms of employment How long before a teacher earns tenure? Two years
Is student/teacher performance considered in tenure decisions? If so, how is it weighted? Not included
Is seniority considered in teacher layoff decisions? If so, how is it weighted? Required; Sole factor
Is teacher performance included in teacher layoff decisions? If so, how is it weighted? Not required
By rank, what percentage of the teaching workforce was dismissed due to poor performance? 12th
Class size Is class size restricted for grades 1-3? If so, is the restriction higher or lower than the national average (20)?
No restriction
HAWAII RANKINGS BY AREA AND INDICATOR
3*
1*
9
9

Overall Rank: 1stTier 1 (Strongest)
HAWAII
Area and Rank General Indicator Sub-IndicatorSub-Indicator Rank/Status
AREA 4:STATE POLICIES
(cont.)
Charter school structural limitations
Is there a cap (limit) placed on the number of charter schools that can operate in the state (or other jurisdiction) and/or on the number of students who can attend charter schools?
State cap with limited room for growth
Does the state allow a variety of charter schools: start-ups, conversions, and virtual schools? Yes
How many charter authorizing options exist? How active are those authorizers? Single option; No or limited activity
Charter school exemptions Are all charter schools automatically exempt from state laws and state/district regulations (except those that safeguard students and fiscal accountability)? If not, are they eligible for exemptions?
Yes
Are all charter schools automatically exempt from state teacher-certification requirements? If not, are they eligible for exemptions?
No; Schools cannot apply for exemptions
Are all charter schools automatically exempt from collective bargaining agreements (CBAs)? If not, are they eligible for exemptions?
No; Schools can apply for exemptions
AREA 5:PERCEIVED INFLUENCEc
Relative influence of teacher unions
How do you rank the influence of teacher unions on education policy compared with other influential entities?
Second- or third-most influential
Influence over campaigns On a scale from always to never, how often do Democratic candidates need teacher-union support to get elected?
Often
On a scale from always to never, how often do Republican candidates need teacher-union support to get elected?
Sometimes
Influence over spending To what extent, from strongly agree to strongly disagree, do you agree that even in times of cutbacks, teacher unions are effective in protecting dollars for education?
Neutral
Given recent budgetary constraints, would you say that teacher unions generally make concessions to prevent reductions in pay and benefits or fight hard to prevent those reductions?
Fight
Influence over policy To what extent, from strongly agree to strongly disagree, do you agree that teacher unions ward off proposals in your state with which they disagree?
Agree
On a scale from always to never, how often do existing state education policies reflect teacher-union priorities?
Sometimes
To what extent, from totally in line to not at all in line, were state education policies proposed by the governor during your state’s latest legislative session in line with teacher-union priorities?
Mostly not in line/Somewhat in line
To what extent, from totally in line to not at all in line, were legislative outcomes of your state’s latest legislative session in line with teacher-union priorities?
Somewhat in line
Influence over key stakeholders
On a scale from always to never, how often have the priorities of state education leaders aligned with teacher-union positions in the past three years?
Sometimes
Would you say that teacher unions typically compromise with policymakers to ensure that their preferred policies are enacted, or typically need not make concessions?
Sometimes compromise, sometimes do not need to concede
* Tied with another state
a Area ranks are calculated using a weighted average of sub-indicators. For a more detailed description, see Appendix A.
b Where possible, we report a state’s rank as compared to other states on a given metric. For example, out of 51 states, Hawaii has the 7th-highest percentage of teachers who are union members. Otherwise, we report a status: Hawaii has mandatory collective bargaining, and union agency fees are permitted. For a more detailed description of our metrics and methodology, see Appendix A. To request the raw data for your state, send an email to [email protected].
c For all survey questions, stakeholders were asked specifically about teacher unions, candidates, policies, and leaders in their state. In addition, we asked about unions and policies in the “current legislative session,” but because legislative calendars vary from state to state, responses refer to policies proposed and enacted within the 2010-11 window.
9
23

Overall Rank: 1stTier 1 (Strongest)
HAWAII
ENDNOTES
1 A state’s overall rank is calculated as follows: First, we score it on multiple sub-indicators (sub-indicator data and scores for Hawaii are shown in the table, Hawaii Rankings by Area and Indicator). Second, we take a weighted average of the sub-indicators in each of five areas. In each area, we then use that average to place the states in rank order: For example, in Area 1: Resources and Membership, Hawaii is ranked 3rd of 51 based on the weighted average of its sub-indicators. To generate the state’s overall rank, we average the five area ranks together, then re-order the states. For a more detailed description of data sources and methodology, see Appendix A.
2 Readers should note that these figures include only direct donations from unions and union-connected PACs, but not their spending on electioneering/advertising, mobilizing the union’s own membership, lobbying, or advocacy. A recent Wall Street Journal report found that donations and lobbying activities account for a small share of union political spending compared with their expenditures on member mobilization and advocacy. Even the AFT agreed, making the argument that since its mission is organizing and activism, it will naturally spend significant amounts on these activities. Thus, the percentages we report here are extremely conservative representations of what unions actually spend on politics. For more information, see Appendix A, Area 2; Tom McGinty and Brody Mullins, “Political Spending by Unions Far Exceeds Direct Donations,” Wall Street Journal, July 10, 2012; and Jeff Hauser, “Wall Street Journal Compares Union Political Spending to Corporate Donations,” AFL-CIO, July 10, 2012.
3 At the time of publication, the 2000 conventions were the most recent for which such detailed data were available in forms that met rigorous standards. However, 2008 data provided by the Democratic National Convention were highly correlated with the reliable figures from 2000.
4 We asked stakeholders about unions and policies in the “current legislative session,” but because legislative calendars vary from state to state, responses refer to policies proposed and enacted within the 2010-11 window.
5 Michele McNeil, “Ed Dept. Takes Action Against Hawaii For Race To Top Stumbles,” Education Week, December 22, 2011, http://blogs.edweek.org/edweek/campaign-k-12/2011/12/_this_is_the_departments.html.
6 Michele McNeil, “In Big Setback For Race To Top, Hawaii Teachers Reject Contract,” Education Week, January 20, 2012, http://blogs.edweek.org/edweek/campaign-k-12/2012/01/big_setback_for_hawaiis_race_t.html.
7 Katherine Poythress, “Hawaii Teachers Reject New Contract With State,” Honolulu Civil Beat, January 19, 2012, http://www.civilbeat.com/articles/2012/01/19/14624-hawaii-teachers-reject-new-contract-with-state/.
8 Michele McNeil, “Is Hawaii One Step Closer To Losing Race To Top Grant?” Education Week, April 13, 2012, http://blogs.edweek.org/edweek/campaign-k-12/2012/04/with_the_fate_of_hawaiis.html.
9 Alyson Klein, “Hawaii Hangs On To Race To The Top Grant, For Now,” Education Week, May 4, 2012, http://blogs.edweek.org/edweek/campaign-k-12/2012/05/hawaii_hangs_on_to_race_to_the.html.
10 Jennifer Sinco Kelleher, “Hawaii Teachers Union Approves Union Contract,” BusinessWeek.com, May 24, 2012, http://www.businessweek.com/ap/2012-05-24/hawaii-teachers-union-approves-union-contract.
11 Ibid.

Overall Rank: 36th Tier 4 (Weak)
IDAHO
IntroductionPart IV: Taking a Closer Look–Teacher Union Influence Area
AREA 1: RESOURCES AND MEMBERSHIP
30TH
While Idaho’s state teacher unions have
limited resources from their members,
they see relatively high spending on
education—and teachers—in the state. Only
62.2 percent of teachers in the Gem State
are union members, the 35th-highest rate
of 51 jurisdictions (and about equal to the
average unionization rate in states where
bargaining is similarly permitted but not
required). Union revenue is also low: Idaho’s
NEA and AFT state-level affiliates see $444
annually per teacher in the state (29th).
But the state directs 26.1 percent of its
expenditures toward K–12 education—only
four other states spend a higher proportion.
Although state money, combined with
federal and local, amounts to not much per
pupil ($8,840; 45th), 55.9 percent of those
dollars go toward teacher salaries and
benefits (13th).
AREA 2: INVOLVEMENT IN POLITICS2
TIED FOR 4TH
Idaho’s teacher unions have been a
significant presence in the state politics
over the past decade. Their contributions
comprised 1.4 percent of total donations
received by candidates for state office
(11th) and 11.7 percent of candidate
donations from the ten highest-giving
sectors in the state (also 11th). Moreover,
teacher unions contributed 3.1 percent of
the donations received by state political
parties (6th). The unions’ involvement
extended beyond financial, with 23.1
percent of all Idaho delegates to the
IDAHO OVERALL RANK: 36TH1 TIER 4 (WEAK)
STRONGER WEAKER
1. RESOURCES AND MEMBERSHIP
OVERALL
2. INVOLVEMENT IN POLITICS
3. SCOPE OF BARGAINING
4. STATE POLICIES
5. PERCEIVED INFLUENCE
36
4
45
30
42
42

Overall Rank: 36th Tier 4 (Weak)
IDAHO
Democratic and Republican national
conventions identifying as teacher union
members (very few states had more).3
AREA 3: SCOPE OF BARGAINING
42ND
Idaho is one of fourteen states that permits,
but does not require, collective bargaining,
and the scope of that bargaining is limited.
At the time that we calculated our data,
Idaho prohibited three of the twenty-one
items we examined from being included
in collective bargaining: tenure, teacher
transfer/reassignment, and layoffs. Should
districts choose to negotiate with their
employees, they must bargain wages,
insurance benefits, fringe benefits, and
leave. State law did not address the
remaining fourteen items on our list, leaving
them to the discretion of districts. (Note,
though, that the recently-passed SB 1108
limits the scope of collective bargaining
further: Only cost-of-living adjustments
to wages and benefits are now allowable
bargaining topics, although voters may
overturn the law later in 2012—see sidebar.
The law was passed after we calculated our
metric, and thus, its provisions were not
included in our analyses.) Further, Idaho
does not permit teacher strikes.
AREA 4: STATE POLICIES
45TH
Teacher policies in Idaho are among
the least-aligned with traditional union
interests of any state. For instance, Idaho
requires that student achievement data
be the preponderant criterion in teacher
evaluations and bans seniority from
consideration in layoff decisions. Recent
legislation eliminated tenure for new
teachers, who instead will work on annual
contracts. Further, with 3.5 percent of
all teachers laid off annually due to poor
performance, its dismissal rate is the
7th-highest in the country. Finally, the
state does not require charter schools to
participate in district collective bargaining
agreements.
AREA 5: PERCEIVED INFLUENCE
TIED FOR 42ND
When compared to other states,
stakeholder responses indicate that Idaho’s
teacher unions are relatively weak. While
they note that Democrats always need
teacher union support to be elected,
consistent with the high levels of giving
discussed in Area 2, they report that the
unions are weak in nearly every other
respect. Survey respondents rank their
influence on education policy below that
of the state school board, state association
of school administrators, and state school
boards association. They also report
that teacher unions are not effective in
protecting dollars for education, that the
positions of state education leaders rarely
align with those of teacher unions, and
that policies proposed the governor and
enacted in the latest legislative session
were not at all in line with teacher union
priorities.4
OVERALL
36TH
While Idaho’s teacher unions are
relatively significant donors and party-
convention-goers—and have rendered
their endorsement crucial to Democratic
political candidates—they operate within
an unfavorable policy environment and
have not garnered much of a reputation for
changing that environment.

Overall Rank: 36th Tier 4 (Weak)
IDAHO
A 2010 Republican sweep of the Idaho legislature and governor’s office gave reformers (and opponents of collective bargaining in education) a major opportunity for action—one which they immediately exploited. In early 2011, lawmakers passed a bill that gutted teacher bargaining rights and completely changed state employment and evaluation policies. Under SB 1108, all existing contracts are void and the scope of bargaining is now limited to wages and benefits, and if a district and its union cannot agree on the terms of compensation, district leaders are allowed to impose them. Evaluations, transfers, and workload (among many other things) are now off the table and completely in the hands of state and district leaders.5,6 The bill also eliminates tenure for new teachers, placing them on annual contracts (which districts can extend to two years at their discretion), and removes seniority as a factor in layoff decisions. A companion bill, SB 1110, established merit pay.7 Republican Sen. John Goedde emphasized that SB 1108 “isn’t about collective bargaining; it’s about putting students first.”8 But Democrat Rep. Brian Cronin (a former public school teacher) countered, “Let’s stop pretending that SB 1108 has anything to do with [student achievement]. The bill intends to dismantle the Idaho Education Association, put teachers in their place, and make sure that teachers are effectively silenced.”9
Despite the pushback from the capitol, teachers and the IEA are doing their best to make sure that they are heard, organizing teacher protests and student walkouts across the state.10 The Idaho Education Association filed a lawsuit against the state, Governor C.L. Otter, and State Superintendant Tom Luna, alleging that they “overstepped their legal bounds” by enacting a law that is unconstitutional on a number of fronts; the court initially rejected the suit, and the union is currently appealing the decision.11 But the IEA has another opportunity to overturn both SB 1108 and SB 1110: It collected enough signatures to place veto referendums on the 2012 ballot (and tried, but failed, to put a recall of Luna before the voters as well).12 In June 2012, meanwhile, twenty-one school districts took advantage of SB 1108. They unilaterally decided on provisions relative to teacher wages and benefits when negotiations with local unions reached an impasse.13 An overstep or the right step? Voters will decide in November.
WATCH YOUR STEP

Overall Rank: 36th Tier 4 (Weak)
IDAHO
OVERALL RANK: 36TH
Area and Ranka General Indicator Sub-IndicatorSub-Indicator Rank/Statusb
AREA 1: RESOURCES & MEMBERSHIP
Membership By rank, what percentage of public-school teachers in the state are union members? 35th
Revenue By rank, what is the total yearly revenue (per teacher in the state) of the state-level NEA and/ or AFT affiliate(s)?
29th
Spending on education By rank, what percentage of state expenditures (of state general funds, state restricted funds, state bonds, and federal “pass-through” funds) is directed to K-12 education?
5th
By rank, what is the total annual per-pupil expenditure (of funds from federal, state, and local sources) in the state?
45th
By rank, what percentage of total annual per-pupil expenditures is directed to teacher salaries and benefits?
13th
AREA 2: INVOLVEMENTIN POLITICS
Contributions to candidates and political parties
By rank, what percentage of the total contributions to state candidates was donated by teacher unions?
11th
By rank, what percentage of the total contributions to state-level political parties was donated by teacher unions?
6th
Industry influence By rank, what percent of the contributions to state candidates from the ten highest-giving sectors was donated by teacher unions?
11th
Status of delegates By rank, what percentage of the state’s delegates to the Democratic and Republican conventions were members of teacher unions?
6th*
AREA 3:SCOPE OF BARGAININGC
Legal scope of bargaining What is the legal status of collective bargaining? Permitted
By rank, how broad is the scope of collective bargaining? 32nd
Automatic revenue streams What is the unions’ legal right to automatically collect agency fees from non-members and/or collect member dues via automatic payroll deductions?
Agency fees prohibited
Right to strike What is the legal status of teacher strikes? Prohibited
AREA 4:STATE POLICIES
Performance pay Does the state support performance pay for teachers? Available to all teachers
Retirement By rank, what is the employer- versus employee-contribution rate to the teacher pension system? 25th
Evaluations What is the maximum potential consequence for veteran teachers who receive unsatisfactory evaluation(s)?
Teacher improvement plan
Is classroom effectiveness included in teacher evaluations? If so, how is it weighted? Required; Preponderant criterion
Terms of employment How long before a teacher earns tenure? Annual contracts only
Is student/teacher performance considered in tenure decisions? If so, how is it weighted? Not included
Is seniority considered in teacher layoff decisions? If so, how is it weighted? Not considered
Is teacher performance included in teacher layoff decisions? If so, how is it weighted? Not required
By rank, what percentage of the teaching workforce was dismissed due to poor performance? 45th
Class size Is class size restricted for grades 1-3? If so, is the restriction higher or lower than the national average (20)?
No restriction
IDAHO RANKINGS BY AREA AND INDICATOR
30
4*
42
45

Overall Rank: 36th Tier 4 (Weak)
IDAHO
Area and Rank General Indicator Sub-IndicatorSub-Indicator Rank/Status
AREA 4:STATE POLICIES
(cont.)
Charter school structural limitationsc
Is there a cap (limit) placed on the number of charter schools that can operate in the state (or other jurisdiction) and/or on the number of students who can attend charter schools?
State cap with limited room for growth
Does the state allow a variety of charter schools: start-ups, conversions, and virtual schools? Yes
How many charter authorizing options exist? How active are those authorizers? Two or more w/ limited jurisdiction
Charter school exemptionsc Are all charter schools automatically exempt from state laws and state/district regulations (except those that safeguard students and fiscal accountability)? If not, are they eligible for exemptions?
Partially; Some automatic exemptions for all schools
Are all charter schools automatically exempt from state teacher-certification requirements? If not, are they eligible for exemptions?
No; Schools can apply for exemptions
Are all charter schools automatically exempt from collective bargaining agreements (CBAs)? If not, are they eligible for exemptions?
Yes
AREA 5:PERCEIVED INFLUENCEd
Relative influence of teacher unions
How do you rank the influence of teacher unions on education policy compared with other influential entities?
Fourth- or fifth-most influential
Influence over campaigns On a scale from always to never, how often do Democratic candidates need teacher-union support to get elected?
Often/Always
On a scale from always to never, how often do Republican candidates need teacher-union support to get elected?
Rarely
Influence over spending To what extent, from strongly agree to strongly disagree, do you agree that even in times of cutbacks, teacher unions are effective in protecting dollars for education?
Disagree
Given recent budgetary constraints, would you say that teacher unions generally make concessions to prevent reductions in pay and benefits or fight hard to prevent those reductions?
Generally fight
Influence over policy To what extent, from strongly agree to strongly disagree, do you agree that teacher unions ward off proposals in your state with which they disagree?
Neutral
On a scale from always to never, how often do existing state education policies reflect teacher-union priorities?
Sometimes
To what extent, from totally in line to not at all in line, were state education policies proposed by the governor during your state’s latest legislative session in line with teacher-union priorities?
Not at all/Mostly not in line
To what extent, from totally in line to not at all in line, were legislative outcomes of your state’s latest legislative session in line with teacher-union priorities?
Not at all/Mostly not in line
Influence over key stakeholders
On a scale from always to never, how often have the priorities of state education leaders aligned with teacher-union positions in the past three years?
Rarely/Sometimes
Would you say that teacher unions typically compromise with policymakers to ensure that their preferred policies are enacted, or typically need not make concessions?
Generally compromise
* Tied with another state
a Area ranks are calculated using a weighted average of sub-indicators. For a more detailed description, see Appendix A.
b Where possible, we report a state’s rank as compared to other states on a given metric. For example, out of 51 states, Idaho has the 35th-highest percentage of teachers who are union members. Otherwise, we report a status: Idaho permits collective bargaining, and union agency fees are prohibited. For a more detailed description of our metrics and methodology, see Appendix A. To request the raw data for your state, send an email to [email protected]. c See note in Area 3, above, and sidebar.
d For all survey questions, stakeholders were asked specifically about teacher unions, candidates, policies, and leaders in their state. In addition, we asked about unions and policies in the “current legislative session,” but because legislative calendars vary from state to state, responses refer to policies proposed and enacted within the 2010-11 window.
45
42*

Overall Rank: 36th Tier 4 (Weak)
IDAHO
ENDNOTES
1 A state’s overall rank is calculated as follows: First, we score it on multiple sub-indicators (sub-indicator data and scores for Idaho are shown in the table, Idaho Rankings by Area and Indicator). Second, we take a weighted average of the sub-indicators in each of five areas. In each area, we use that average to place the states in rank order: For example, in Area 1: Resources and Membership, Idaho is ranked 30th of 51 based on the weighted average of its sub-indicators. To generate the state’s overall rank, we average the five area ranks together, then re-order the states. For a more detailed description of data sources and methodology, see Appendix A.
2 Readers should note that these figures include only direct donations from unions and union-connected PACs, but not their spending on electioneering/advertising, mobilizing the union’s own membership, lobbying, or advocacy. A recent Wall Street Journal report found that donations and lobbying activities account for a small share of union political spending compared with their expenditures on member mobilization and advocacy. Even the AFT agreed, making the argument that since its mission is organizing and activism, it will naturally spend significant amounts on these activities. Thus, the percentages we report here are extremely conservative representations of what unions actually spend on politics. For more information, see Appendix A, Area 2; Tom McGinty and Brody Mullins, “Political Spending by Unions Far Exceeds Direct Donations,” Wall Street Journal, July 10, 2012; and Jeff Hauser, “Wall Street Journal Compares Union Political Spending to Corporate Donations,” AFL-CIO, July 10, 2012.
3 At the time of publication, the 2000 conventions were the most recent for which such detailed data were available in forms that met rigorous standards. However, 2008 data provided by the Democratic National Convention were highly correlated with the reliable figures from 2000.
4 We asked stakeholders about unions and policies in the “current legislative session,” but because legislative calendars vary from state to state, responses refer to policies proposed and enacted within the 2010-11 window.
5 Laura Zuckerman, “By A 20-15 Vote, The Idaho Senate On Thursday Approved Legislation That Curtails Collective Bargaining By Public School Teachers,” Reuters, February 24, 2011, http://www.reuters.com/article/2011/02/24/us-idaho-teachers-idUSTRE71N7A220110224.
6 “Idaho Educators Challenge Constitutionality Of SB 1108,” Idaho Education Association, April 27, 2011, http://idahoea.org/news/iea-challenges-constitutionality-of-senate-bill-1108.
7 Betsy Z. Russell, “Bill Limits Teachers’ Bargaining Powers,” Spokesman-Review, March 9, 2011, http://www.spokesman.com/stories/2011/mar/09/bill-limits-teachers-bargaining-powers/.
8 Zuckerman.
9 Russell.
10 KTVB and Associated Press, “Proposed Education Reforms Prompt Strong Reaction From Students,” KTVB.com, February 28, 2011, http://www.ktvb.com/news/Students-walk-out-of-class-in-protest-of-education-reform-plan-117064878.html.
11 Idaho Education Association.
12 Sean Cavanagh, “Idaho Schools Superintendant Won’t Face Recall,” Education Week, June 28, 2011, http://blogs.edweek.org/edweek/state_edwatch/2011/06/idaho_school_superintendent_wont_face_recall.html.
13 Betsy Z. Russell, “21 Idaho Districts Unilaterally Set Contracts For Teachers,” Spokesman-Review, June 21, 2012, http://www.spokesman.com/stories/2012/jun/21/21-idaho-districts-unilaterally-set-contracts-for/.

Overall Rank: 8thTier 1 (Strongest)
ILLINOIS
IntroductionPart IV: Taking a Closer Look–Teacher Union Influence Area
AREA 1: RESOURCES AND MEMBERSHIP
TIED FOR 18TH
While the two state-level teacher unions
in Illinois have high membership rates
compared to other states, the union
revenues and spending on K–12 education
are both in the middle of the pack. Fully
96.2 percent of teachers in the Land of
Lincoln belong to unions (8th-highest out
of 51 jurisdictions). But the state’s NEA and
AFT affiliates bring in just $497 annually
per teacher in the state (25th). Spending
on K–12 education by the state is moderate,
accounting for 18.7 percent of Illinois’s
expenditures (29th). Education dollars
from all sources (local, state, and federal)
are moderate as well—$11,229 per pupil
annually (27th), with 53.1 percent of that
money going toward teacher salaries and
benefits (34th).
AREA 2: INVOLVEMENT IN POLITICS2
12TH
Teacher unions have been significant
contributors to state political campaigns in
Illinois over the past decade: Teacher-union
donations to state candidates comprised
3.6 percent of all such donations, the
largest proportion in the land.3 Of the
money donated by the ten highest-giving
sectors, teacher unions gave 18.2 percent
(3rd). Unions focused their contributions
on candidates as opposed to state political
parties: a mere 0.6 percent of donations to
parties in Illinois came from teacher unions
(33rd). Finally, 14.2 percent of all delegates
to the Democratic and Republican national
conventions were teacher union members
(23rd).4
ILLINOIS OVERALL RANK: 8TH1
TIER 1 (STRONGEST)
STRONGER WEAKER
1. RESOURCES AND MEMBERSHIP
OVERALL
2. INVOLVEMENT IN POLITICS
3. SCOPE OF BARGAINING
4. STATE POLICIES
5. PERCEIVED INFLUENCE
8
12
39
18
28
3

Overall Rank: 8thTier 1 (Strongest)
ILLINOIS
AREA 3: SCOPE OF BARGAINING
3RD
Illinois is one of twenty-one states that
both require collective bargaining and allow
unions to automatically collect agency fees
from non-member teachers, a key source
of union revenue. The state also has one of
the broadest scopes of bargaining in the
nation—of the potential contract provisions
examined in this metric, all twenty-one
may be bargained. State law mandates that
five be negotiated: wages, hours, terms
and conditions of employment, class load,
and extracurricular duties.5 The remaining
sixteen provisions are either explicitly
permitted (four items) or implicitly allowed
because the state takes no position; and,
as recently demonstrated by the Chicago
Teachers Union, Illinois law permits teacher
strikes.
AREA 4: STATE POLICIES
39TH
Many of Illinois’s state policies do not align
with traditional teacher union interests. The
state specifies that teacher evaluations be
significantly informed by student growth.
Tenure is granted after four years (three
years is the national norm) and the tenure
decision must take student growth into
consideration. Layoff decisions must take
teacher performance into account rather
than relying on seniority alone. Further,
Illinois law allows new and virtual charter
schools, as well as conversions of traditional
public schools. Charters are not required
to participate in collective bargaining
agreements. A handful of policies, however,
are more favorable to unions: The state
does not support performance pay, and
it places a cap on the number of charter
schools allowed to operate. The paucity of
favorable policies may have encouraged
union donations to state politics (Area 2),
which more than doubled between 2004
and 2010.
AREA 5: PERCEIVED INFLUENCE
28TH
Stakeholders in Illinois perceive teacher
unions to be an active—if not always
effective—force in state politics. Survey
respondents rank the union among the
entities with the greatest influence on
education policies, after the state school
board. They report that Democrats
often need teacher union support to be
elected, and that state education leaders
often align with union positions. But they
note that education policies proposed
by the governor and those enacted in
the most recent legislative session were
only somewhat in line with teacher union
priorities.6 They also report that, in a time
of recent budgetary constraints, teacher
unions conceded from the outset that
some reductions in pay and benefits were
acceptable.
OVERALL
8TH
Illinois state teacher unions operate
in a favorable collective bargaining
environment and are very active in state-
level politics. Yet despite these advantages,
they do not have a particularly favorable
policy environment, and their perceived
effectiveness is moderate when compared
with unions in other states.

Overall Rank: 8thTier 1 (Strongest)
ILLINOIS
In contrast to the political war waged in many neighboring states, Illinois state legislators, teacher unions, and the governor reached détente in Spring 2011. They jointly backed SB 7, a sweeping education-reform bill that considers teacher performance (not just seniority) in teacher pay, tenure, and dismissal; streamlines the dismissal process; and makes legal strikes more difficult.7,8 (The spirit of cooperation clearly didn’t extend to Chicago, where implementing SB 7 was a major part of the September 2012 Chicago Teachers Union strike—the first strike in twenty-five years.9) Despite support for the bill, however, there has been a major hang-up to implementing it: dollars. “We keep [making aggressive reforms] for less and less money…and there’s a breaking point,” warned State Superintendent Chris Koch.10
To avoid that financial cliff, in late 2011 Senate Democrats, along with Democrat Governor Pat Quinn, proposed a comprehensive plan to reform the state pension system. As of July 2012, the bill remained stalled in the legislature due to an unlikely meeting of the minds between labor unions and Republican representatives.11,12 Reacting to the requirement that local districts make up for state cuts, Dan Montgomery, president of the Illinois Federation of Teachers, railed that “there’s no free choice here, but a coercive dilemma where a public servant must choose between harm on the one hand or more harm on the other.”13 Republican lawmakers agreed: The bill would force districts to raise property taxes or make cuts in the classroom, neither of which is palatable. Democrat Representative Elaine Nekritz countered that moving the burden away from the state was essential: “With this change, we can move away from being financial laughingstocks.” With the clock ticking down on the state’s gravely underfunded pensions and lawmakers acting with no sense of urgency, time may make a fool of them all.
DOWN TO THE WIRE

Overall Rank: 8thTier 1 (Strongest)
ILLINOIS
OVERALL RANK: 8TH
Area and Ranka General Indicator Sub-IndicatorSub-Indicator Rank/Statusb
AREA 1: RESOURCES & MEMBERSHIP
Membership By rank, what percentage of public-school teachers in the state are union members? 8th
Revenue By rank, what is the total yearly revenue (per teacher in the state) of the state-level NEA and/ or AFT affiliate(s)?
25th
Spending on education By rank, what percentage of state expenditures (of state general funds, state restricted funds, state bonds, and federal “pass-through” funds) is directed to K-12 education?
29th
By rank, what is the total annual per-pupil expenditure (of funds from federal, state, and local sources) in the state?
27th
By rank, what percentage of total annual per-pupil expenditures is directed to teacher salaries and benefits?
34th
AREA 2: INVOLVEMENTIN POLITICS
Contributions to candidates and political parties
By rank, what percentage of the total contributions to state candidates was donated by teacher unions?
1st
By rank, what percentage of the total contributions to state-level political parties was donated by teacher unions?
33rd
Industry influence By rank, what percent of the contributions to state candidates from the ten highest-giving sectors was donated by teacher unions?
3rd
Status of delegates By rank, what percentage of the state’s delegates to the Democratic and Republican conventions were members of teacher unions?
23rd
AREA 3:SCOPE OF BARGAINING
Legal scope of bargaining What is the legal status of collective bargaining? Mandatory
By rank, how broad is the scope of collective bargaining? 7th
Automatic revenue streams What is the unions’ legal right to automatically collect agency fees from non-members and/or collect member dues via automatic payroll deductions?
Permitted
Right to strike What is the legal status of teacher strikes? Permitted
AREA 4:STATE POLICIES
Performance pay Does the state support performance pay for teachers? State does not support
Retirement By rank, what is the employer- versus employee-contribution rate to the teacher pension system? 23rd
Evaluations What is the maximum potential consequence for veteran teachers who receive unsatisfactory evaluation(s)?
Eligible for dismissal
Is classroom effectiveness included in teacher evaluations? If so, how is it weighted? Required; Significantly informs evaluation
Terms of employment How long before a teacher earns tenure? Four years
Is student/teacher performance considered in tenure decisions? If so, how is it weighted? Required; Included as one of multiple criteria
Is seniority considered in teacher layoff decisions? If so, how is it weighted? Optional; May be considered among other factors
Is teacher performance included in teacher layoff decisions? If so, how is it weighted? Required; Considered among other factors
By rank, what percentage of the teaching workforce was dismissed due to poor performance? 32nd
Class size Is class size restricted for grades 1-3? If so, is the restriction higher or lower than the national average (20)?
Yes; Higher
ILLINOIS RANKINGS BY AREA AND INDICATOR
18*
12
3
39

Overall Rank: 8thTier 1 (Strongest)
ILLINOIS
Area and Rank General Indicator Sub-IndicatorSub-Indicator Rank/Status
AREA 4:STATE POLICIES
(cont.)
Charter school structural limitations
Is there a cap (limit) placed on the number of charter schools that can operate in the state (or other jurisdiction) and/or on the number of students who can attend charter schools?
State cap with some room for growth
Does the state allow a variety of charter schools: start-ups, conversions, and virtual schools? Yes
How many charter authorizing options exist? How active are those authorizers? Two or more w/ limited jurisdiction
Charter school exemptions Are all charter schools automatically exempt from state laws and state/district regulations (except those that safeguard students and fiscal accountability)? If not, are they eligible for exemptions?
Yes
Are all charter schools automatically exempt from state teacher-certification requirements? If not, are they eligible for exemptions?
No; Schools can apply for exemptions
Are all charter schools automatically exempt from collective bargaining agreements (CBAs)? If not, are they eligible for exemptions?
Yes
AREA 5:PERCEIVED INFLUENCEc
Relative influence of teacher unions
How do you rank the influence of teacher unions on education policy compared with other influential entities?
Second- or third-most influential
Influence over campaigns On a scale from always to never, how often do Democratic candidates need teacher-union support to get elected?
Often/Always
On a scale from always to never, how often do Republican candidates need teacher-union support to get elected?
Sometimes
Influence over spending To what extent, from strongly agree to strongly disagree, do you agree that even in times of cutbacks, teacher unions are effective in protecting dollars for education?
Neutral
Given recent budgetary constraints, would you say that teacher unions generally make concessions to prevent reductions in pay and benefits or fight hard to prevent those reductions?
Generally concede
Influence over policy To what extent, from strongly agree to strongly disagree, do you agree that teacher unions ward off proposals in your state with which they disagree?
Agree
On a scale from always to never, how often do existing state education policies reflect teacher-union priorities?
Sometimes/Often
To what extent, from totally in line to not at all in line, were state education policies proposed by the governor during your state’s latest legislative session in line with teacher-union priorities?
Mostly not in line/Somewhat in line
To what extent, from totally in line to not at all in line, were legislative outcomes of your state’s latest legislative session in line with teacher-union priorities?
Somewhat/Mostly in line
Influence over key stakeholders
On a scale from always to never, how often have the priorities of state education leaders aligned with teacher-union positions in the past three years?
Sometimes/Often
Would you say that teacher unions typically compromise with policymakers to ensure that their preferred policies are enacted, or typically need not make concessions?
Generally compromise
* Tied with another state
a Area ranks are calculated using a weighted average of sub-indicators. For a more detailed description, see Appendix A.
b Where possible, we report a state’s rank as compared to other states on a given metric. For example, out of 51 states, Illinois has the 8th-highest percentage of teachers who are union members. Otherwise, we report a status: Illinois has mandatory collective bargaining, and union agency fees are permitted. For a more detailed description of our metrics and methodology, see Appendix A. To request the raw data for your state, send an email to [email protected].
c For all survey questions, stakeholders were asked specifically about teacher unions, candidates, policies, and leaders in their state. In addition, we asked about unions and policies in the “current legislative session,” but because legislative calendars vary from state to state, responses refer to policies proposed and enacted within the 2010-11 window.
39
28

Overall Rank: 8thTier 1 (Strongest)
ILLINOIS
ENDNOTES
1 A state’s overall rank is calculated as follows: First, we score it on multiple sub-indicators (sub-indicator data and scores for Illinois are shown in the table, Illinois Rankings by Area and Indicator). Second, we take a weighted average of the sub-indicators in each of five areas. In each area, we use that average to place the states in rank order: For example, in Area 1: Resources and Membership, Illinois is ranked 18th of 51 based on the weighted average of its sub-indicators. To generate the state’s overall rank, we average the five area ranks together, then re-order the states. For a more detailed description of data sources and methodology, see Appendix A.
2 Readers should note that these figures include only direct donations from unions and union-connected PACs, but not their spending on electioneering/advertising, mobilizing the union’s own membership, lobbying, or advocacy. A recent Wall Street Journal report found that donations and lobbying activities account for a small share of union political spending compared with their expenditures on member mobilization and advocacy. Even the AFT agreed, making the argument that since its mission is organizing and activism, it will naturally spend significant amounts on these activities. Thus, the percentages we report here are extremely conservative representations of what unions actually spend on politics. For more information, see Appendix A, Area 2; Tom McGinty and Brody Mullins, “Political Spending by Unions Far Exceeds Direct Donations,” Wall Street Journal, July 10, 2012; and Jeff Hauser, “Wall Street Journal Compares Union Political Spending to Corporate Donations,” AFL-CIO, July 10, 2012.
3 While our overall metric reports the strength of state teacher unions, this area also captures contributions to state campaigns and parties from national unions and local union affiliates. Typically, the total contributions from each are much smaller than the donations from the state unions. But in Illinois’s case, a local union (the AFT-affiliated Chicago Teachers Union) gave almost as much as the state unions did.
4 At the time of publication, the 2000 conventions were the most recent for which such detailed data were available in forms that met rigorous standards. However, 2008 data provided by the Democratic National Convention were highly correlated with the reliable figures from 2000.
5 Illinois Senate Bill 7, passed June 2011, stipulates that hours are a permissive rather than mandatory subject in districts that serve cities with a population greater than 500,000 people (in other words, Chicago). In such cases, district leaders can decide whether to negotiate or impose the length of the work and school day/year. See Note 9, below, for more.
6 We asked stakeholders about unions and policies in the “current legislative session,” but because legislative calendars vary from state to state, responses refer to policies proposed and enacted within the 2010-11 window.
7 Ellen Alberding, “Illinois: The New Leader In Education Reform,” Chicago Tribune, June 13, 2011, http://articles.chicagotribune.com/2011-06-13/news/ct-oped-0613-reform-20110613_1_piece-of-education-legislation-teachers-kimberly-lightford.
8 Illinois Senate Bill 7, accessed July 23, 2012, http://www.ilga.gov/legislation/97/SB/09700SB0007sam001.htm.
9 The Chicago strike touched on many of the contentious issues in education reform: merit pay (and teacher pay more generally), evaluations, and length of school day. The conflict began in July 2012 when an arbitrator ruled that while the city could lengthen the school day, it could not demand teachers work more hours without additional compensation. However, both union and management rejected the plan laid out by the ruling, and talks stalled through the summer, resulting in a seven-day strike at the start of the school year in September. The agreement that eventually ended the walkout does maintain Mayor Rahm Emanuel’s stated primary goals: Students now have a longer school day and principals kept their right to decide which teachers to hire. But the settlement’s other provisions reflect the union’s goals, perhaps because Democratic leadership—including the well-connected Emanuel—was concerned about the strike’s effect on the presidential election. The agreement does not contain merit pay; gives teachers across-the-board raises of 3 percent, 2 percent, and 2 percent over the next three years; sets the portion of evaluations based on student growth at 30 percent, nearly at the minimum level of 25 percent required by state law; leaves teacher work hours untouched while requiring the city to hire additional teachers to cover the lengthened school day; and ensures that half of all new district hires are teachers who were laid off in 2010 due to budget constraints. As of publication, details of the new contract were being finalized, after which it must be approved by rank-and-file union members. But it appears safe to say that the CTU got most of what it wanted. See “Chicago Teachers Strike: Union, Emanuel Disagree On Bottom Line,” HuffingtonPost.com, September 9, 2012, http://www.huffingtonpost.com/2012/09/10/chicago-teachers-school-b_n_1869477.html; “Chicago Teachers Agree To End Strike, Classes To Resume Wednesday,” NBC News, September 18, 2012, http://usnews.nbcnews.com/_news/2012/09/18/13938248-chicago-teachers-agree-to-end-strike-classes-to-resume-wednesday?lite.
10 Ray Long, “Education Reforms Underfunded, Illinois School Chief Warns,” Chicago Tribune, July 18, 2011, http://articles.chicagotribune.com/2011-07-18/news/ct-met-education-reform-funding-20110718_1_evaluations-teacher-performance-education-reforms.
11 “Schools Predict Local Burdens From Pension Plan,” Illinois Daily Herald, May 30, 2012, http://www.dailyherald.com/article/20120530/news/705309938/.
12 Associated Press, “Illinois Governor Hints At Calling Legislative Session Next Month Over Pensions,” Chicago Tribune, July 18, 2012, http://www.chicagotribune.com/news/local/sns-ap-il--illinois-pensions-quinn-20120718,0,5084344.story.
13 Dave McKinney and Andrew Maloney, “Unions: Pension Bill Forces Choice ‘Between Harm…Or More Harm,’” Chicago Sun-Times, May 29, 2012, http://www.suntimes.com/news/cityhall/12844079-418/unions-pension-changes-force-choice-between-harm-or-more-harm.html.

Overall Rank: 31stTier 4 (Average)
INDIANA
IntroductionPart IV: Taking a Closer Look–Teacher Union Influence Area
AREA 1: RESOURCES AND MEMBERSHIP
TIED FOR 9TH
Indiana’s state teacher unions have
substantial internal resources, and see that
K–12 education (and teacher salaries and
benefits) accounts for a high percentage
of spending in the state. With 73.7 percent
of its teachers belonging to unions, the
Hoosier State posts the 29th-highest
unionization rate of 51 states. The NEA
and AFT state-level affiliates bring in
$679 annually per Indiana teacher (8th
of 51). Further, a hefty 30.1 percent of
state expenditures to go K–12 education
(2nd; only Vermont allocates a higher
percentage toward education).2 While total
per-pupil expenditures are right around
the national mean ($10,419 annually; 33rd),
teachers benefit from a large share of those
dollars—55.3 percent goes toward their
salaries and benefits (19th).
AREA 2: INVOLVEMENT IN POLITICS3
TIED FOR 13TH
Indiana’s teacher unions have been a
larger presence in state politics than their
counterparts in most other states. In the
past decade, 2.8 percent of contributions
to candidates for state office came from
teacher unions (3rd). Of the donations
originating from the top ten highest-
giving sectors in the state, 16.7 percent
were from the unions (5th). The unions
focused on candidates rather than state
political parties, however, contributing
only 0.2 percent of all donations to Indiana
parties (45th). And 14.3 percent of all
Indiana delegates to the Democratic and
Republican national conventions were
teacher union members (22nd).4
INDIANA OVERALL RANK: 31ST1
TIER 4 (AVERAGE)
STRONGER WEAKER
1. RESOURCES AND MEMBERSHIP
OVERALL
2. INVOLVEMENT IN POLITICS
3. SCOPE OF BARGAINING
4. STATE POLICIES
5. PERCEIVED INFLUENCE
31
13
44
9
32
39

Overall Rank: 31stTier 4 (Average)
INDIANA
AREA 3: SCOPE OF BARGAINING
39TH
Indiana is one of thirty-two states that
require collective bargaining, but on
this indicator it ranks lower than every
other mandatory-bargaining state except
Wisconsin (and lower even than seven of
the fourteen states where bargaining is
permitted but not required—see sidebar).
The low rank is largely due to state law that
sharply limits the number of issues that can
be bargained: Indiana explicitly prohibits
bargaining over sixteen of the twenty-one
items examined in this report. Only four
must be bargained—wages, and insurance,
pension/retirement, and fringe benefits—
and bargaining over grievance procedures
is permitted but not required. Unions’ legal
rights were further limited by recently
enacted right-to-work legislation that
stops them from collecting agency fees, a
key source of revenue, from non-member
teachers. The new law will likely diminish
the now-abundant financial resources
discussed in Area 1. Indiana also does not
permit teacher strikes.
AREA 4: STATE POLICIES
44TH
Indiana policies are less aligned with
traditional union interests than those
in nearly every other state. Per recent
legislation, Indiana is one of only three
states with a state-supported mandatory
system of merit pay for all teachers.
Further, evidence of student learning must
significantly inform teacher evaluations,
and teachers are automatically eligible for
dismissal after unsatisfactory evaluations.
Indiana charter laws are also contrary to
the typical union position, which looks
to limit charter expansion and autonomy.
Indiana allows new, conversion, and virtual
charter schools, offers multiple authorizing
options for school operators, and does not
cap the total number of charters. Nor are
charters required to participate in district
collective bargaining agreements. They can
also apply for exemptions to state teacher
certification requirements. The unfavorable
bargaining (Area 3) and state policy (Area
4) environments may account for the high
level of teacher union campaign donations
(Area 2), as unions try to change existing
conditions.
AREA 5: PERCEIVED INFLUENCE
32ND
Indiana’s stakeholders view teacher unions
as active players in state policy debates,
but agree that unions have not pulled much
sway of late. While they strongly agree that
Democrats need teacher union support
to get elected, they rank teacher unions
as less influential in shaping state policy
than education advocacy organizations
and the governor. Further, their responses
indicate state education leaders are the
least aligned with the union position than
they are in any other state, and the unions
have not seen much success of late in this
Republican-dominated state (see sidebar).
In fact, respondents report that policies
proposed by the governor and enacted in
the latest legislative session were mostly
not in line with teacher union priorities.5
OVERALL
31ST
Indiana teacher unions are stronger
than those in some states but weaker
than those in many others—and Indiana
ranks low among the states in which
bargaining is mandatory (27th of 33).
They have considerable internal resources
(and contribute relatively generously to
candidates for state office), but while the
state dedicates a high proportion of its

Overall Rank: 31stTier 4 (Average)
INDIANA
2011 was not a good year for the Indiana State Teachers Association (ISTA). Mirroring his 2005 executive order that eliminated collective bargaining for state workers, Republican Governor Mitch Daniels signed a bill that restricted the scope of teachers’ bargaining to wages and benefits. With evaluations, transfers, and dismissals off the negotiating table, Daniels and State Superintendent of Education Tony Bennett proposed SB 1, which Republican lawmakers quickly passed. The law mandates that teacher evaluations be based in part on student growth, and requires merit pay while lessening the weight of seniority and advanced degrees on salaries (although, in a nod to local autonomy, district leaders may choose their own evaluation model).6,7 The ISTA organized a boisterous rally at the statehouse in what ISTA director Heidi Miller called “an indication of how serious, how concerned, our teachers are about how the so-called education reform is going to impact their students.”8 The protest saw no success, although it did prompt Daniels to issue a written statement saying “as always, the union’s demand is more money, no change…Their priority is their organization, not the young people of Indiana.”9 In the same session, the legislature removed the state’s cap on charter schools, expanded the number of charter authorizers, and required that district schools share transportation funds with charters. This was immediately followed by HB 1003, which created a publicly funded voucher program, implemented tax deductions for private school tuition, and expanded tax credits for organizations offering private school scholarships.10 Bennett praised lawmakers for their work, and sent a message to the unions: “I commend the committee members…for their courage to do what is right in the face of considerable opposition from those whose primary objective seems to be protecting a system of school buildings rather than advocating for all Indiana children.”11
As if 2011 weren’t bad enough, in 2012 another resounding piece of anti-union legislation made Indiana the first right-to-work state in the Rust Belt.12 The ISTA also discovered that it couldn’t rely on the courts for protection against anti-union state leaders: Although it filed a successful lawsuit against a portion of SB 1 on grounds that it violated Indiana labor law, the overall restrictions on collective bargaining still stand.13 The union also supported a lawsuit to stop HB 1003, claiming that it violated the state constitution by directing taxpayer money to religious institutions, but a Superior Court judge upheld the measure.14 With Bennett up for re-election in November 2012 in a race receiving national attention (and out-fundraising his union-supported Democrat challenger nearly ten-to-one), the union might not have allies in the capitol any time soon.15 So while nearby Wisconsin has received national attention for its anti-labor stance, the wide range of education-specific policies in Indiana may actually make it a better contender for most teacher-union-unfriendly state in the nation.
FROM BAD TO WORSE
money to K–12 education, the laws that
limit the scope of bargaining, prescribe
teacher employment policies, and set forth
charter school policies show little alignment
with traditional union interests. Their
resources and already-weak reputation will
likely diminish due to new legislation and
a Republican-led legislature (again, see
sidebar).

Overall Rank: 31stTier 4 (Average)
INDIANA
OVERALL RANK: 31ST
Area and Ranka General Indicator Sub-IndicatorSub-Indicator Rank/Statusb
AREA 1: RESOURCES & MEMBERSHIP
Membership By rank, what percentage of public-school teachers in the state are union members? 29th
Revenue By rank, what is the total yearly revenue (per teacher in the state) of the state-level NEA and/ or AFT affiliate(s)?
8th
Spending on education By rank, what percentage of state expenditures (of state general funds, state restricted funds, state bonds, and federal “pass-through” funds) is directed to K-12 education?
2nd
By rank, what is the total annual per-pupil expenditure (of funds from federal, state, and local sources) in the state?
33rd
By rank, what percentage of total annual per-pupil expenditures is directed to teacher salaries and benefits?
19th
AREA 2: INVOLVEMENTIN POLITICS
Contributions to candidates and political parties
By rank, what percentage of the total contributions to state candidates was donated by teacher unions?
3rd
By rank, what percentage of the total contributions to state-level political parties was donated by teacher unions?
45th
Industry influence By rank, what percent of the contributions to state candidates from the ten highest-giving sectors was donated by teacher unions?
5th
Status of delegates By rank, what percentage of the state’s delegates to the Democratic and Republican conventions were members of teacher unions?
22nd
AREA 3:SCOPE OF BARGAINING
Legal scope of bargaining What is the legal status of collective bargaining? Mandatory
By rank, how broad is the scope of collective bargaining? 45th
Automatic revenue streams What is the unions’ legal right to automatically collect agency fees from non-members and/or collect member dues via automatic payroll deductions?
Agency fees prohibited
Right to strike What is the legal status of teacher strikes? Prohibited
AREA 4:STATE POLICIES
Performance pay Does the state support performance pay for teachers? Required for all teachers
Retirement By rank, what is the employer- versus employee-contribution rate to the teacher pension system? 19th
Evaluations What is the maximum potential consequence for veteran teachers who receive unsatisfactory evaluation(s)?
Eligible for dismissal
Is classroom effectiveness included in teacher evaluations? If so, how is it weighted? Required; Significantly informs evaluation
Terms of employment How long before a teacher earns tenure? Three years
Is student/teacher performance considered in tenure decisions? If so, how is it weighted? Required; Included as one of multiple criteria
Is seniority considered in teacher layoff decisions? If so, how is it weighted? Optional; May be considered among other factors
Is teacher performance included in teacher layoff decisions? If so, how is it weighted? Required; Considered among other factors
By rank, what percentage of the teaching workforce was dismissed due to poor performance? 25th
Class size Is class size restricted for grades 1-3? If so, is the restriction higher or lower than the national average (20)?
Yes; Higher
INDIANA RANKINGS BY AREA AND INDICATOR
9*
13*
39
44

Overall Rank: 31stTier 4 (Average)
INDIANA
Area and Rank General Indicator Sub-IndicatorSub-Indicator Rank/Status
AREA 4:STATE POLICIES
(cont.)
Charter school structural limitationsc
Is there a cap (limit) placed on the number of charter schools that can operate in the state (or other jurisdiction) and/or on the number of students who can attend charter schools?
No state cap
Does the state allow a variety of charter schools: start-ups, conversions, and virtual schools? Yes
How many charter authorizing options exist? How active are those authorizers? Two or more active/available options
Charter school exemptionsc Are all charter schools automatically exempt from state laws and state/district regulations (except those that safeguard students and fiscal accountability)? If not, are they eligible for exemptions?
Partially; Some automatic exemptions for some schools
Are all charter schools automatically exempt from state teacher-certification requirements? If not, are they eligible for exemptions?
No; Schools can apply for exemptions
Are all charter schools automatically exempt from collective bargaining agreements (CBAs)? If not, are they eligible for exemptions?
Yes
AREA 5:PERCEIVED INFLUENCEc
Relative influence of teacher unions
How do you rank the influence of teacher unions on education policy compared with other influential entities?
Third-most influential
Influence over campaigns On a scale from always to never, how often do Democratic candidates need teacher-union support to get elected?
Always
On a scale from always to never, how often do Republican candidates need teacher-union support to get elected?
Rarely
Influence over spending To what extent, from strongly agree to strongly disagree, do you agree that even in times of cutbacks, teacher unions are effective in protecting dollars for education?
Neutral
Given recent budgetary constraints, would you say that teacher unions generally make concessions to prevent reductions in pay and benefits or fight hard to prevent those reductions?
Fight
Influence over policy To what extent, from strongly agree to strongly disagree, do you agree that teacher unions ward off proposals in your state with which they disagree?
Neutral
On a scale from always to never, how often do existing state education policies reflect teacher-union priorities?
Sometimes
To what extent, from totally in line to not at all in line, were state education policies proposed by the governor during your state’s latest legislative session in line with teacher-union priorities?
Not at all/Mostly not in line
To what extent, from totally in line to not at all in line, were legislative outcomes of your state’s latest legislative session in line with teacher-union priorities?
Mostly not in line
Influence over key stakeholders
On a scale from always to never, how often have the priorities of state education leaders aligned with teacher-union positions in the past three years?
Rarely
Would you say that teacher unions typically compromise with policymakers to ensure that their preferred policies are enacted, or typically need not make concessions?
Sometimes compromise, sometimes do not need to concede
* Tied with another state
a Area ranks are calculated using a weighted average of sub-indicators. For a more detailed description, see Appendix A.
b Where possible, we report a state’s rank as compared to other states on a given metric. For example, out of 51 states, Indiana has the 29th-highest percentage of teachers who are union members. Otherwise, we report a status: Indiana has mandatory collective bargaining, and union agency fees are prohibited. For a more detailed description of our metrics and methodology, see Appendix A. To request the raw data for your state, send an email to [email protected].
c For all survey questions, stakeholders were asked specifically about teacher unions, candidates, policies, and leaders in their state. In addition, we asked about unions and policies in the “current legislative session,” but because legislative calendars vary from state to state, responses refer to policies proposed and enacted within the 2010-11 window.
44
32

Overall Rank: 31stTier 4 (Average)
INDIANA
ENDNOTES
1 A state’s overall rank is calculated as follows: First, we score it on multiple sub-indicators (sub-indicator data and scores for Indiana are shown in the table, Indiana Rankings by Area and Indicator). Second, we take a weighted average of the sub-indicators in each of five areas. In each area, we use that average to place the states in rank order: For example, in Area 1: Resources and Membership, Indiana is ranked 9th of 51 based on the weighted average of its sub-indicators. To generate the state’s overall rank, we average the five area ranks together, then re-order the states. For a more detailed description of data sources and methodology, see Appendix A.
2 Readers may be aware that Indiana passed legislation in 2009 that required all of a school district’s general-fund revenue come from directly from the state, therefore eliminating local property taxes and by necessity increasing K–12 education’s share of overall state expenditures. See Robert S. Michael, Terry E. Spradlin, and Fatima R. Carson, “Changes in Indiana School Funding,” Center for Evaluation and Education Policy, Summer 2009, accessed August 28, 2012, http://ceep.indiana.edu/projects/PDF/PB_V7N2_Summer_2009_EPB.pdf.
3 Readers should note that these figures include only direct donations from unions and union-connected PACs, but not their spending on electioneering/advertising, mobilizing the union’s own membership, lobbying, or advocacy. A recent Wall Street Journal report found that donations and lobbying activities account for a small share of union political spending compared with their expenditures on member mobilization and advocacy. Even the AFT agreed, making the argument that since its mission is organizing and activism, it will naturally spend significant amounts on these activities. Thus, the percentages we report here are extremely conservative representations of what unions actually spend on politics. For more information, see Appendix A, Area 2; Tom McGinty and Brody Mullins, “Political Spending by Unions Far Exceeds Direct Donations,” Wall Street Journal, July 10, 2012; and Jeff Hauser, “Wall Street Journal Compares Union Political Spending to Corporate Donations,” AFL-CIO, July 10, 2012.
4 At the time of publication, the 2000 conventions were the most recent for which such detailed data were available in forms that met rigorous standards. However, 2008 data provided by the Democratic National Convention were highly correlated with the reliable figures from 2000.
5 We asked stakeholders about unions and policies in the “current legislative session,” but because legislative calendars vary from state to state, responses refer to policies proposed and enacted within the 2010-11 window.
6 Elle Moxley, “How Districts Are Preparing For State-Mandated Teacher Evaluations,” StateImpact Indiana, May 16, 2012, http://stateimpact.npr.org/indiana/2012/05/16/how-school-districts-are-preparing-for-mandatory-teacher-evaluations/.
7 Maureen Hayden, “Gov. Daniels Signs ‘Landmark’ Education Bill,” Herald Bulletin, April 30, 2011, http://heraldbulletin.com/local/x833654119/Seniority-degrees-lose-value-under-new-plan.
8 Mark Peterson, “Charter School Bill Passes Test,” WNDU Indiana, February 12, 2011, http://www.wndu.com/localnews/headlines/Charter_school_bill_passes_test_115983179.html.
9 Kent Erdahl, “Teachers Fill Statehouse, Rally Against Proposed Education Reforms,” WXIN-TV (Fox59.com), February 9, 2011, http://www.fox59.com/news/wxin-education-reform-indiana-educators-packed-the-statehouse-on-tuesday-to-voice-their-concerns-about-education-reforms-proposed-by-governor-mitch-daniels-and-making-their-way-through-20110208,0,7282343.story.
10 Sean Cavanagh, “Indiana Education Package Bears Conservative Stamp,” Education Week, Issue 31, http://www.edweek.org/ew/articles/2011/05/12/31indiana.h30.html.
11 Indiana Department of Education press release, “Bennett Statement Of Education Bills Passing Committee,” February 16, 2011, http://www.doe.in.gov/news/bennett-statement-education-bills-passing-committee.
12 Mary Beth Schneider and Chris Sikich, “Indiana Becomes Rust Belt’s First Right-To-Work State,” Indianapolis Star, February 2, 2012, http://www.usatoday.com/news/nation/story/2012-02-01/indiana-right-to-work-bill/52916356/1.
13 NSBA Legal Clips, “Indiana Court Preliminarily Enjoins State Department Of Education From Requiring School Districts To Use Teacher Contract Form,” National School Boards Association, August 25, 2011, http://legalclips.nsba.org/?p=8296.
14 Associated Press, “Judge Upholds Indiana School Voucher Law,” January 13, 2012, http://www.ibj.com/judge-upholds-indiana-school-voucher-law/PARAMS/article/31962.
15 Kyle Stokes, “Interactive Map: Who’s Giving Money In The Campaign For State superintendent,” StateImpact Indiana, August 2, 2012, http://stateimpact.npr.org/indiana/2012/08/02/interactive-map-whos-giving-money-in-the-campaign-for-state-superintendent/.

Overall Rank: 27thTier 3 (Average)
IOWA
IntroductionPart IV: Taking a Closer Look–Teacher Union Influence Area
AREA 1: RESOURCES AND MEMBERSHIP
27TH
Compared with unions in other states, the
membership and financial resources of
Iowa’s state teacher union is in the middle
of the pack. Approximately three out of
four teachers in the Hawkeye State are
union members (its membership rate of
73.3 percent is 30th out of 51 jurisdictions).
From its members, the Iowa Education
Association brings in $496 annually per
teacher in the state (26th of 51). And
while 57.3 percent of total K–12 education
spending in Iowa goes to teacher salaries
and benefits (8th), just 17.4 percent of state
expenditures go toward K–12 education
(34th), giving teachers what amounts to a
large slice of a small pie.
AREA 2: INVOLVEMENT IN POLITICS2
TIED FOR 23RD
Teacher unions have been moderately
active in Iowa state politics over the past
decade.3 Their donations amounted to
0.59 percent of the total contributions to
candidates for state office (25th) and 2.2
percent of donations received by state
political parties (12th). Further, 16.6 percent
of Iowa’s delegates to the Democratic and
Republican national conventions were
teacher union members (16th).4
AREA 3: SCOPE OF BARGAINING
32ND
While Iowa is one of thirty-two states
that require collective bargaining, the
state does not permit its unions to
automatically collect agency fees from
IOWA OVERALL RANK: 27TH1
TIER 3 (AVERAGE)
STRONGER WEAKER
1. RESOURCES AND MEMBERSHIP
OVERALL
2. INVOLVEMENT IN POLITICS
3. SCOPE OF BARGAINING
4. STATE POLICIES
5. PERCEIVED INFLUENCE
27
23
11
27
31
32

Overall Rank: 27thTier 3 (Average)
IOWA
non-member teachers, and it prohibits
teacher strikes. Still, the state allows a
broad scope of bargaining: Of twenty-
one provisions examined in this metric,
nine must be negotiated: wages, hours,
grievance procedures, transfers/teacher
reassignments, layoffs, evaluation processes
and instruments, insurance benefits, fringe
benefits, and leave. Only one item, pension/
retirement benefits, is explicitly excluded
from negotiations. Bargaining over the
remaining eleven items is implicitly allowed
because the state is silent on them.
AREA 4: STATE POLICIES
11TH
Iowa’s education policies generally
align with traditional teacher union
interests. State law does not require that
student achievement factor into teacher
evaluations; does not support teacher
performance pay; and grants tenure
virtually automatically after three years.
Further, charter schools are limited;
although there’s no cap on the number
of such schools, Iowa does not allow new
or virtual charters, only conversions of
existing district schools. It also requires
all charters to be approved by both a
local school board and the state board of
education—a more restrictive authorizing
policy than in many other states. All charter
school teachers must be certified and all
charter schools must participate in district
collective bargaining agreements.
AREA 5: PERCEIVED INFLUENCE
31ST
Stakeholders report that the Iowa union
has limited reach. Survey respondents rank
its influence on education policy slightly
behind that of the state school board
and slightly ahead of the association of
school administrators, the school board
association, and education advocacy
organizations. But they note that state
education leaders only sometimes align
with teacher union priorities, and that
unions often turn to compromise to
see their preferred policies enacted. In
addition, stakeholders report that policies
proposed in the latest legislative session
were mostly not in line with union priorities,
while policies actually enacted were only
somewhat in line.5
OVERALL
27TH
While Iowa teachers see a comparatively
large share of overall spending on K–12
education going to teacher salary and
benefits, their state union does not have a
large degree of financial and membership
resources itself. Even though unions
contribute significant amounts to state
political parties, and enjoy a favorable
policy environment at the state level,
stakeholders do not perceive the union as
particularly influential.

Overall Rank: 27thTier 3 (Average)
IOWA
The slide of Hawkeye students from well above the national average in reading and math in the early to mid-1990s down to average in 2011 garnered significant concern from state leaders.6 In July 2011, Republican governor Terry Branstad hosted the Iowa Education Summit, and Chris Bern, then president of the Iowa State Education Association (ISEA), was pleased with the results: “It was a good exchange of a lot of different ideas.”7 He was not so enthusiastic when Branstad presented the blueprint for his education reform bill, which included a progressive plan for compensation, increased tenure requirements, and a plan to decertify teachers on the basis of unsatisfactory evaluations.8
Discussion of the plan in the legislature quickly broke along party lines, with Republicans supporting the governor while Senate Democrats insisted on amending provisions related to student testing, the expansion of charter schools, and online education. The ISEA also pushed hard for such amendments.9 The reform bill that the Senate finally passed replaced the formal annual evaluations that Branstad sought with peer reviews two out of every three years, omitted a value-added assessment system, and reduced opportunities for online learning.10 “Unfortunately, I think the Senate bill is a much watered-down version,” lamented Branstad.11 But the two chambers of the legislature passed the bill, which the governor signed in May 2012 (although not without taking one last swipe at the law, calling it “a first step” but affirming that “bold reform is still needed”).12
Turns out more than just Iowans were paying attention to the outcome. When the federal government issued a stack of NCLB waivers in June 2012, Iowa was conspicuously omitted. The state’s department of education and governor both pointed fingers at lawmakers, indicating that legislative (in)action was to blame. “Responsibility for the denial of this request lies squarely at the feet of the Iowa Legislature, which did too little to improve our schools despite repeated warnings,” said Branstad.13 Whether the legislature is to blame for its toothless reform bill or the union for pressuring lawmakers to remove the teeth, little help is in sight for Iowa’s still-sliding students.
MIRED IN MEDIOCRITY

Overall Rank: 27thTier 3 (Average)
IOWA
OVERALL RANK: 27TH
Area and Ranka General Indicator Sub-IndicatorSub-Indicator Rank/Statusb
AREA 1: RESOURCES & MEMBERSHIP
Membership By rank, what percentage of public-school teachers in the state are union members? 30th
Revenue By rank, what is the total yearly revenue (per teacher in the state) of the state-level NEA and/ or AFT affiliate(s)?
26th
Spending on education By rank, what percentage of state expenditures (of state general funds, state restricted funds, state bonds, and federal “pass-through” funds) is directed to K-12 education?
34th
By rank, what is the total annual per-pupil expenditure (of funds from federal, state, and local sources) in the state?
21st
By rank, what percentage of total annual per-pupil expenditures is directed to teacher salaries and benefits?
8th
AREA 2: INVOLVEMENTIN POLITICS
Contributions to candidates and political parties
By rank, what percentage of the total contributions to state candidates was donated by teacher unions?
25th
By rank, what percentage of the total contributions to state-level political parties was donated by teacher unions?
12th
Industry influence By rank, what percent of the contributions to state candidates from the ten highest-giving sectors was donated by teacher unions?
35th
Status of delegates By rank, what percentage of the state’s delegates to the Democratic and Republican conventions were members of teacher unions?
16th
AREA 3:SCOPE OF BARGAINING
Legal scope of bargaining What is the legal status of collective bargaining? Mandatory
By rank, how broad is the scope of collective bargaining? 4th*
Automatic revenue streams What is the unions’ legal right to automatically collect agency fees from non-members and/or collect member dues via automatic payroll deductions?
Agency fees prohibited
Right to strike What is the legal status of teacher strikes? Prohibited
AREA 4:STATE POLICIES
Performance pay Does the state support performance pay for teachers? State does not support
Retirement By rank, what is the employer- versus employee-contribution rate to the teacher pension system? 29th
Evaluations What is the maximum potential consequence for veteran teachers who receive unsatisfactory evaluation(s)?
Teacher improvement plan
Is classroom effectiveness included in teacher evaluations? If so, how is it weighted? Not required
Terms of employment How long before a teacher earns tenure? Three years
Is student/teacher performance considered in tenure decisions? If so, how is it weighted? Not included
Is seniority considered in teacher layoff decisions? If so, how is it weighted? Optional; Weighted at district discretion
Is teacher performance included in teacher layoff decisions? If so, how is it weighted? Not required
By rank, what percentage of the teaching workforce was dismissed due to poor performance? 17th
Class size Is class size restricted for grades 1-3? If so, is the restriction higher or lower than the national average (20)?
No restriction
IOWA RANKINGS BY AREA AND INDICATOR
27
23*
32
11

Overall Rank: 27thTier 3 (Average)
IOWA
Area and Rank General Indicator Sub-IndicatorSub-indicator Rank/Status
AREA 4:STATE POLICIES
(cont.)
Charter school structural limitations
Is there a cap (limit) placed on the number of charter schools that can operate in the state (or other jurisdiction) and/or on the number of students who can attend charter schools?
No state cap
Does the state allow a variety of charter schools: start-ups, conversions, and virtual schools? Conversions only
How many charter authorizing options exist? How active are those authorizers? Single option; No or limited activity
Charter school exemptions Are all charter schools automatically exempt from state laws and state/district regulations (except those that safeguard students and fiscal accountability)? If not, are they eligible for exemptions?
No; Schools can apply for exemptions
Are all charter schools automatically exempt from state teacher-certification requirements? If not, are they eligible for exemptions?
No; Schools cannot apply for exemptions
Are all charter schools automatically exempt from collective bargaining agreements (CBAs)? If not, are they eligible for exemptions?
No; No allowable exemptions
AREA 5:PERCEIVED INFLUENCEc
Relative influence of teacher unions
How do you rank the influence of teacher unions on education policy compared with other influential entities?
Second-most influential
Influence over campaigns On a scale from always to never, how often do Democratic candidates need teacher-union support to get elected?
Sometimes
On a scale from always to never, how often do Republican candidates need teacher-union support to get elected?
Rarely
Influence over spending To what extent, from strongly agree to strongly disagree, do you agree that even in times of cutbacks, teacher unions are effective in protecting dollars for education?
Disagree
Given recent budgetary constraints, would you say that teacher unions generally make concessions to prevent reductions in pay and benefits or fight hard to prevent those reductions?
Generally fight
Influence over policy To what extent, from strongly agree to strongly disagree, do you agree that teacher unions ward off proposals in your state with which they disagree?
Neutral
On a scale from always to never, how often do existing state education policies reflect teacher-union priorities?
Sometimes
To what extent, from totally in line to not at all in line, were state education policies proposed by the governor during your state’s latest legislative session in line with teacher-union priorities?
Not at all/Mostly not in line
To what extent, from totally in line to not at all in line, were legislative outcomes of your state’s latest legislative session in line with teacher-union priorities?
Somewhat in line
Influence over key stakeholders
On a scale from always to never, how often have the priorities of state education leaders aligned with teacher-union positions in the past three years?
Sometimes/Often
Would you say that teacher unions typically compromise with policymakers to ensure that their preferred policies are enacted, or typically need not make concessions?
Sometimes compromise, sometimes do not need to concede
* Tied with another state
a Area ranks are calculated using a weighted average of sub-indicators. For a more detailed description, see Appendix A.
b Where possible, we report a state’s rank as compared to other states on a given metric. For example, out of 51 states, Iowa has the 30th-highest percentage of teachers who are union members. Otherwise, we report a status: Iowa has mandatory collective bargaining, and union agency fees are prohibited. For a more detailed description of our metrics and methodology, see Appendix A. To request the raw data for your state, send an email to [email protected].
c For all survey questions, stakeholders were asked specifically about teacher unions, candidates, policies, and leaders in their state. In addition, we asked about unions and policies in the “current legislative session,” but because legislative calendars vary from state to state, responses refer to policies proposed and enacted within the 2010-11 window.
11
31

Overall Rank: 27thTier 3 (Average)
IOWA
ENDNOTES
1 A state’s overall rank is calculated as follows: First, we score it on multiple sub-indicators (sub-indicator data and scores for Iowa are shown in the table, Iowa Rankings by Area and Indicator). Second, we take a weighted average of the sub-indicators in each of five areas. In each area, we use that average to place the states in rank order: For example, in Area 1: Resources and Membership, Iowa is ranked 27th of 51 based on the weighted average of its sub-indicators. To generate the state’s overall rank, we average the five area ranks together, then re-order the states. For a more detailed description of data sources and methodology, see Appendix A.
2 Readers should note that these figures include only direct donations from unions and union-connected PACs, but not their spending on electioneering/advertising, mobilizing the union’s own membership, lobbying, or advocacy. A recent Wall Street Journal report found that donations and lobbying activities account for a small share of union political spending compared with their expenditures on member mobilization and advocacy. Even the AFT agreed, making the argument that since its mission is organizing and activism, it will naturally spend significant amounts on these activities. Thus, the percentages we report here are extremely conservative representations of what unions actually spend on politics. For more information, see Appendix A, Area 2; Tom McGinty and Brody Mullins, “Political Spending by Unions Far Exceeds Direct Donations,” Wall Street Journal, July 10, 2012; and Jeff Hauser, “Wall Street Journal Compares Union Political Spending to Corporate Donations,” AFL-CIO, July 10, 2012.
3 In this metric, we include contributions from state unions and their local and national affiliates. While in most states the state-level union is the largest donor, in Iowa the AFT-national is a major contributor as well.
4 At the time of publication, the 2000 conventions were the most recent for which such detailed data were available in forms that met rigorous standards. However, 2008 data provided by the Democratic National Convention were highly correlated with the reliable figures from 2000.
5 We asked stakeholders about unions and policies in the “current legislative session,” but because legislative calendars vary from state to state, responses refer to policies proposed and enacted within the 2010-11 window.
6 “State Profiles,” National Center for Education Statistics, accessed July 20, 2012, http://nces.ed.gov/nationsreportcard/states/.
7 Steve Woodhouse, “ISEA’s Bern Pleased That Teachers Have Role In Education Reform,” Journal Express, August 5, 2011, http://journalexpress.net/local/x850291497/ISEAs-Bern-pleased-that-teachers-have-role-in-education-reform.
8 Jeff Ignatius, “No Poison Apple? Terry Branstad’s Education Proposal Aims To Be Palatable To Varied Legislators And Interests. They’re Open To Reform But Leery,” River Cities’ Reader, January 19, 2012, http://www.rcreader.com/commentary/branstad-education-reform/.
9 “Education Reform Talking Points,” Iowa State Education Association, March 7, 2012, http://www.isea.org/assets/document/TP_ed_reform_bill-revised.pdf.
10 Jason Clayworth, “Iowa Senate Passed Education Reform; Hurdles Ahead,” Des Moines Register, April 9, 2012, http://blogs.desmoinesregister.com/dmr/index.php/2012/04/09/iowa-senate-passed-education-reform-hurdles-ahead/.
11 Ibid.
12 Jason Clayworth, “Branstad Signs Education Reform; Shakes Finger For Using ‘One-Time Money,’” Des Moines Register, May 25, 2012, http://blogs.desmoinesregister.com/dmr/index.php/2012/05/25/branstad-signs-education-reform-shakes-finger-for-using-one-time-money/.
13 Mary Stegmeir, “Iowa Denied NCLB Waiver,” Des Moines Register, June 21, 2012, http://blogs.desmoinesregister.com/dmr/index.php/2012/06/21/iowa-denied-nclb-waiver/.

KANSAS Overall Rank: 32nd1
Tier 4 (Weak)
IntroductionPart IV: Taking a Closer Look–Teacher Union Influence Area
AREA 1: RESOURCES AND MEMBERSHIP
TIED FOR 33RD
Kansas’s state teacher unions do not
receive substantial resources from their
members, but spending on education in the
state is high. With just 54.7 percent of its
teachers unionized, the Sunflower State’s
membership rate is only 42nd of 51 states.
The state’s NEA and AFT affiliates bring
in $336 annually per teacher in the state
(32nd). On the other hand, Kansas directs
26.0 percent of its expenditures towards
K–12 education—only five states allocate
a higher percentage. Further, annual per-
pupil expenditures total $12,056 (20th),
with 55.6 percent of that going to teacher
salaries and benefits (17th).
AREA 2: INVOLVEMENT IN POLITICS2
TIED FOR 18TH
Kansas’s teacher unions are reasonably
active participants in state politics. Over
the past ten years, 0.92 percent of the total
donations received by candidates for state
office came from the unions (19th). Those
contributions amounted to 6.9 percent
of donations to candidates from the ten
highest-giving sectors in the state (20th). In
addition, teacher unions contributed 0.49
percent of the money received by state
political parties (37th). Finally, 13.1 percent
of all Kansas delegates to the Democratic
and Republican national conventions were
teacher union members (26th).3
KANSAS OVERALL RANK: 32ND1
TIER 4 (WEAK)
STRONGER WEAKER
1. RESOURCES AND MEMBERSHIP
OVERALL
2. INVOLVEMENT IN POLITICS
3. SCOPE OF BARGAINING
4. STATE POLICIES
5. PERCEIVED INFLUENCE
32
18
14
33
30
31

Overall Rank: 32ndTier 4 (Weak)
KANSAS
AREA 3: SCOPE OF BARGAINING
31ST
While Kansas law requires collective
bargaining, it does not allow unions to
automatically collect agency fees from
non-members. The law also forbids teacher
strikes, but it does include a wide scope
of provisions in collective bargaining:
Of twenty-one items examined in this
metric, Kansas mandates ten be subjects
of bargaining: wages, hours, terms and
conditions of employment, grievance
procedures, dismissal, insurance benefits,
pension/retirement benefits, fringe benefits,
leave, and class load. Only one item (length
of the teacher school year) is explicitly
outside the scope of bargaining; the state is
silent on the remaining ten items, implicitly
permitting them all.
AREA 4: STATE POLICIES
14TH
Compared to other states, policies
in Kansas are generally aligned with
traditional union interests. The state does
not require that student achievement data
factor into teacher evaluations, and it does
not outline consequences for unsatisfactory
evaluations. Teachers earn tenure after
three years (the national norm), and
student achievement data are not a factor
here, either. The state does not support
performance pay, nor does it require that
districts consider teacher performance
when determining layoffs. Further, state
law does not exempt charter schools from
teacher certification requirements, and it
requires charters to participate in district
collective bargaining agreements (though
individual schools may seek waivers).
AREA 5: PERCEIVED INFLUENCE
30TH
According to Kansas stakeholders, teacher
unions are a moderately powerful force
in state politics but may not face much of
a challenge, noting that state education
leaders often align with the union position.
Survey respondents rank unions as the
second- or third-most influential entity on
education policy, behind the state school
board and alongside the association of
school administrators. While they note that
outcomes of the latest legislative session
were only somewhat in line with teacher
union priorities, they agree that teacher
unions are generally effective in protecting
dollars for education and warding off
education reform proposals with which
they disagree.4
OVERALL
32ND
Kansas teacher unions are strong in a
handful of key areas—state spending
on education and the general policy
environment—but relatively weak in
others, including financial and membership
resources, and the scope of bargaining.
While close to the middle of the pack
nationwide, they are among the least-
powerful unions in states in which
bargaining is mandatory (South Dakota,
Tennessee, New Mexico, and Florida rank
below them, while 27 other mandatory-
bargaining states rank higher).

Overall Rank: 32ndTier 4 (Weak)
KANSAS
The past few years have seen a massive budgetary battle waged in the Jayhawk State—with education on the front lines. In 2011, the Kansas National Education Association (KNEA) teamed up with school board members, superintendents, and liberal lawmakers to fight against funding cuts that would, according to them, set spending levels back twenty years and severely impact students.5 While conservative legislators argued that education spending should rise and fall with tax revenues (and Kansas had certainly seen its revenues fall with the recession), the KNEA countered that the legislature should follow the advice of its own Kansas Advisory Council on Intergovernmental Relations, which recommended raising revenue by discontinuing a $196 million sales tax exemption for industry. Despite concerns about the economic impact of removing the exemption, KNEA President Blake West declared that the state must end the “decade of continuous tax cuts that have crippled the state’s ability to provide essential services to its citizens.”6 KNEA director of governmental affairs Mark Desetti went a step further: “If this Legislature can’t support our schools, maybe we should find one that will.”7 But in May 2012, to the chagrin of the union (but with the approval of pro-business groups), Governor Sam Brownback signed into law yet more breaks; the new law included reductions in individual income tax rates and the exemption of most small business income from any state taxes.8
In the summer of 2012, the KNEA set about making its threat to the legislature a reality. The month before the August primaries, the union released its list of recommended legislative candidates. Of the 131 incumbent House and Senate members running for re-election, it endorsed only 60.9 “Do not allow a candidate to say, ‘I believe in public schools.’ Hold their feet to the fire,” said Desetti.10 Predictably, the KNEA did not have a single endorsement in common with those of the Kansas Chamber of Commerce, the union’s foe during the push to remove tax breaks for industry. Jeff Glendening, the Chamber’s vice president of political affairs, proclaimed that the teacher union is “wholly about money. How much money is going into the system.”11 The Kansas primary, and 2012 general election, will see the voters decide where the money should go.
ALL ABOUT THE MONEY

Overall Rank: 32ndTier 4 (Weak)
KANSAS
OVERALL RANK: 32ND
Area and Ranka General Indicator Sub-IndicatorSub-Indicator Rank/Statusb
AREA 1: RESOURCES & MEMBERSHIP
Membership By rank, what percentage of public-school teachers in the state are union members? 42nd
Revenue By rank, what is the total yearly revenue (per teacher in the state) of the state-level NEA and/ or AFT affiliate(s)?
32nd
Spending on education By rank, what percentage of state expenditures (of state general funds, state restricted funds, state bonds, and federal “pass-through” funds) is directed to K-12 education?
6th
By rank, what is the total annual per-pupil expenditure (of funds from federal, state, and local sources) in the state?
20th
By rank, what percentage of total annual per-pupil expenditures is directed to teacher salaries and benefits?
17th
AREA 2: INVOLVEMENTIN POLITICS
Contributions to candidates and political parties
By rank, what percentage of the total contributions to state candidates was donated by teacher unions?
19th
By rank, what percentage of the total contributions to state-level political parties was donated by teacher unions?
37th
Industry influence By rank, what percent of the contributions to state candidates from the ten highest-giving sectors was donated by teacher unions?
20th
Status of delegates By rank, what percentage of the state’s delegates to the Democratic and Republican conventions were members of teacher unions?
26th
AREA 3:SCOPE OF BARGAINING
Legal scope of bargaining What is the legal status of collective bargaining? Mandatory
By rank, how broad is the scope of collective bargaining? 3rd
Automatic revenue streams What is the unions’ legal right to automatically collect agency fees from non-members and/or collect member dues via automatic payroll deductions?
Agency fees prohibited
Right to strike What is the legal status of teacher strikes? Prohibited
AREA 4:STATE POLICIES
Performance pay Does the state support performance pay for teachers? State does not support
Retirement By rank, what is the employer- versus employee-contribution rate to the teacher pension system? 28th
Evaluations What is the maximum potential consequence for veteran teachers who receive unsatisfactory evaluation(s)?
No consequences articulated
Is classroom effectiveness included in teacher evaluations? If so, how is it weighted? Not required
Terms of employment How long before a teacher earns tenure? Three years
Is student/teacher performance considered in tenure decisions? If so, how is it weighted? Not included
Is seniority considered in teacher layoff decisions? If so, how is it weighted? Optional; Weighted at district discretion
Is teacher performance included in teacher layoff decisions? If so, how is it weighted? Not required
By rank, what percentage of the teaching workforce was dismissed due to poor performance? 24th
Class size Is class size restricted for grades 1-3? If so, is the restriction higher or lower than the national average (20)?
No restriction
KANSAS RANKINGS BY AREA AND INDICATOR
33*
18*
31
14

Overall Rank: 32ndTier 4 (Weak)
KANSAS
Area and Rank General Indicator Sub-IndicatorSub-Indicator Rank/Status
AREA 4:STATE POLICIES
(cont.)
Charter school structural limitations
Is there a cap (limit) placed on the number of charter schools that can operate in the state (or other jurisdiction) and/or on the number of students who can attend charter schools?
No state cap
Does the state allow a variety of charter schools: start-ups, conversions, and virtual schools? Yes
How many charter authorizing options exist? How active are those authorizers? Single option; Some activity
Charter school exemptions Are all charter schools automatically exempt from state laws and state/district regulations (except those that safeguard students and fiscal accountability)? If not, are they eligible for exemptions?
No; Schools can apply for exemptions
Are all charter schools automatically exempt from state teacher-certification requirements? If not, are they eligible for exemptions?
No; Schools cannot apply for exemptions
Are all charter schools automatically exempt from collective bargaining agreements (CBAs)? If not, are they eligible for exemptions?
No; Schools can apply for exemptions
AREA 5:PERCEIVED INFLUENCEc
Relative influence of teacher unions
How do you rank the influence of teacher unions on education policy compared with other influential entities?
Second- or third-most influential
Influence over campaigns On a scale from always to never, how often do Democratic candidates need teacher-union support to get elected?
Sometimes/Often
On a scale from always to never, how often do Republican candidates need teacher-union support to get elected?
Sometimes
Influence over spending To what extent, from strongly agree to strongly disagree, do you agree that even in times of cutbacks, teacher unions are effective in protecting dollars for education?
Agree
Given recent budgetary constraints, would you say that teacher unions generally make concessions to prevent reductions in pay and benefits or fight hard to prevent those reductions?
Generally concede
Influence over policy To what extent, from strongly agree to strongly disagree, do you agree that teacher unions ward off proposals in your state with which they disagree?
Agree
On a scale from always to never, how often do existing state education policies reflect teacher-union priorities?
Sometimes/Often
To what extent, from totally in line to not at all in line, were state education policies proposed by the governor during your state’s latest legislative session in line with teacher-union priorities?
**
To what extent, from totally in line to not at all in line, were legislative outcomes of your state’s latest legislative session in line with teacher-union priorities?
Mostly not in line/Somewhat in line
Influence over key stakeholders
On a scale from always to never, how often have the priorities of state education leaders aligned with teacher-union positions in the past three years?
Often
Would you say that teacher unions typically compromise with policymakers to ensure that their preferred policies are enacted, or typically need not make concessions?
Compromise
* Tied with another state
** Insufficient number of responses to this particular question
a Area ranks are calculated using a weighted average of sub-indicators. For a more detailed description, see Appendix A.
b Where possible, we report a state’s rank as compared to other states on a given metric. For example, out of 51 states, Kansas has the 42nd-highest percentage of teachers who are union members. Otherwise, we report a status: Kansas has mandatory collective bargaining, and union agency fees are prohibited. For a more detailed description of our metrics and methodology, see Appendix A. To request the raw data for your state, send an email to [email protected].
c For all survey questions, stakeholders were asked specifically about teacher unions, candidates, policies, and leaders in their state. In addition, we asked about unions and policies in the “current legislative session,” but because legislative calendars vary from state to state, responses refer to policies proposed and enacted within the 2010-11 window.
14
30

Overall Rank: 32ndTier 4 (Weak)
KANSAS
ENDNOTES
1 A state’s overall rank is calculated as follows: First, we score it on multiple sub-indicators (sub-indicator data and scores for Kansas are shown in the table, Kansas Rankings by Area and Indicator). Second, we take a weighted average of the sub-indicators in each of five areas. In each area, we use that average to place the states in rank order: For example, in Area 1: Resources and Membership, Kansas is ranked 33rd of 51 based on the weighted average of its sub-indicators. To generate the state’s overall rank, we average the five area ranks together, then re-order the states. For a more detailed description of data sources and methodology, see Appendix A.
2 Readers should note that these figures include only direct donations from unions and union-connected PACs, but not their spending on electioneering/advertising, mobilizing the union’s own membership, lobbying, or advocacy. A recent Wall Street Journal report found that donations and lobbying activities account for a small share of union political spending compared with their expenditures on member mobilization and advocacy. Even the AFT agreed, making the argument that since its mission is organizing and activism, it will naturally spend significant amounts on these activities. Thus, the percentages we report here are extremely conservative representations of what unions actually spend on politics. For more information, see Appendix A, Area 2; Tom McGinty and Brody Mullins, “Political Spending by Unions Far Exceeds Direct Donations,” Wall Street Journal, July 10, 2012; and Jeff Hauser, “Wall Street Journal Compares Union Political Spending to Corporate Donations,” AFL-CIO, July 10, 2012.
3 At the time of publication, the 2000 conventions were the most recent for which such detailed data were available in forms that met rigorous standards. However, 2008 data provided by the Democratic National Convention were highly correlated with the reliable figures from 2000.
4 We asked stakeholders about unions and policies in the “current legislative session,” but because legislative calendars vary from state to state, responses refer to policies proposed and enacted within the 2010-11 window.
5 Angela Deines, “Education Advocates Rally Against Budget Cuts,” Capitol Journal, July 30, 2011, http://cjonline.com/news/2011-07-30/education-advocates-rally-against-budget-cuts#.TkVL4GFl8oE.
6 Blake West, “What’s Important, What’s Urgent,” Kansas National Education Association, n.d., http://www.knea.org/home/614.htm.
7 Deines.
8 Emily Behlmann, “What Does The Kansas Tax Reform Plan Mean For You,” Wichita Business Journal, May 11, 2012, http://www.bizjournals.com/wichita/blog/2012/05/what-does-the-kansas-tax-reform-plan.html?page=all.
9 Mark Desetti, “KNEA Makes Preliminary Candidate Recommendations For The August 7 Primary Election,” Kansas National Education Association, August 7, 2012, http://www.knea.org/home/1618.htm.
10 Dawn Bormann, “Education Is Key In Kansas Primaries,” Kansas City Star, July 26, 2012, http://www.kansascity.com/2012/07/20/3724067/education-is-at-focus-of-kansas.html.
11 Ibid.

Overall Rank: 28thTier 3 (Average)
KENTUCKY
IntroductionPart IV: Taking a Closer Look–Teacher Union Influence Area
AREA 1: RESOURCES AND MEMBERSHIP
TIED FOR 35TH
In Kentucky, collective bargaining is
permitted but not required, which means
the single state-level teacher union has
relatively sparse financial and membership
resources. With only 58.4 percent of its
teachers unionized, the membership
rate in Bluegrass State is 37th out of 51
jurisdictions. And the Kentucky Education
Association brings in just $304 annually
per teacher in the state (35th). Even
though 55.8 percent of K–12 expenditures
are directed toward teacher salaries and
benefits (14th), that amounts to a big piece
of a small pie: Per-pupil spending puts
Kentucky 36th ($10,231 annually).
AREA 2: INVOLVEMENT IN POLITICS2
TIED FOR 26TH
Compared to other states, union
involvement in state politics ranks Kentucky
in the middle of the pack. In the past
decade, 0.54 percent of the total donations
to state candidates came from teacher
unions (28th). While not particularly hefty
overall, those contributions amounted
to 16.1 percent of the money donated
by the ten highest-giving sectors in the
state (6th). In addition, 0.57 percent
of the total donations to state political
parties came from teacher unions (35th).
Despite this financial presence, however,
none of Kentucky’s delegates to the
2000 Democratic or Republican national
conventions identified as a teacher union
member.3
KENTUCKY OVERALL RANK: 28TH1
TIER 3 (AVERAGE)
STRONGER WEAKER
1. RESOURCES AND MEMBERSHIP
OVERALL
2. INVOLVEMENT IN POLITICS
3. SCOPE OF BARGAINING
4. STATE POLICIES
5. PERCEIVED INFLUENCE
28
26
10
35
11
26

Overall Rank: 28thTier 3 (Average)
KENTUCKY
AREA 3: SCOPE OF BARGAINING
26TH
Kentucky law addresses neither collective
bargaining nor agency fees in public
education, thus implicitly permitting
both. The omission opens all twenty-one
provisions examined in this metric for
bargaining. The state does not permit
public employees, teachers included, to
strike.
AREA 4: STATE POLICIES
10TH
Policies in Kentucky are aligned
more closely with traditional teacher
union interests than in most other
states. State law does not require
that student achievement data factor
into teacher evaluations, nor does it
outline consequences for unsatisfactory
evaluations. Districts are not required
to consider teacher performance when
making layoffs. An additional handful of
policies partially align: Tenure is conferred
virtually automatically, but only after four
years (the national norm is three). There
is a class size restriction for K–3, but it is
larger than the national average class size.
Kentucky does not have a charter school
law.4
AREA 5: PERCEIVED INFLUENCE
TIED FOR 11TH
Compared to stakeholders in other
states, those in Kentucky report that
their teacher union is quite influential.
Survey respondents rank it as the most-
or second-most influential organization
in state education policy. They agree that
it is effective in protecting dollars for
education and very effective in warding
off education proposals with which it
disagrees. They note that policies proposed
by the governor and enacted in the latest
legislative session were mostly in line
with teacher union priorities, and that the
positions of state education leaders often
align with those of unions (see sidebar).5
OVERALL
28TH
Kentucky’s state teacher union operates
in a favorable policy environment, and
although it has limited resources and
donates relatively modestly to state politics
compared to unions in other states, in
Kentucky it has quite a reputation for
influence. Further, the Kentucky union is
stronger than those in nine of the other
thirteen states in which bargaining is
permitted but not mandatory.

Overall Rank: 28thTier 3 (Average)
KENTUCKY
With a governor like Steve Beshear, it’s hard for the Kentucky Education Association (KEA) to complain. In June 2011, the National Education Association (NEA) crowned him “America’s Greatest Education Governor” for “f[ighting] to preserve resources for K–12 education and the Commonwealth’s students and classrooms.”6 Under Beshear’s watch, Bluegrass State lawmakers passed proposals that supported preschool programs and preserved education funding (and teacher pensions and health benefits) despite statewide budget cuts. “The most important investment a state can make is in the education of its children, and that’s why I have fought hard to protect the basic funding for our classrooms despite nine rounds of budget cuts,” Beshear remarked after receiving the award.7
The union-friendly policies were not lucky accidents. The Bluegrass Institute, a conservative watchdog group, reported that the Kentucky Education Political Action Committee and Better Schools Kentucky (both union PACs) were the biggest spenders on the campaigns of politicians “friendly to their cause” in 2010, giving more than $850,000 combined.8 Beshear won re-election in November 2011 by a landslide with the help of another PAC, Kentucky Family Values, to which the Kentucky Education Association and its affiliates were major donors.9 Already a KEA ally before the election, Beshear is likely to remain a friend of the union. Sharron K. Oxendine, president of the Kentucky Education Association, raved, “There is not a better friend of public education and educators than Steve Beshear.”10 Jim Waters of the Bluegrass Institute isn’t so smitten. “Is it any wonder that politicians ‘friendly’ to the unions’ cause are stubbornly refusing to allow reform measures that give parents a choice, hold teachers and administrators accountable, cut wasteful spending and demand measurable results from the bureaucracy?”11
FRIENDS IN HIGH PLACES

Overall Rank: 28thTier 3 (Average)
KENTUCKY
OVERALL RANK: 28TH
Area and Ranka General Indicator Sub-IndicatorSub-Indicator Rank/Statusb
AREA 1: RESOURCES & MEMBERSHIP
Membership By rank, what percentage of public-school teachers in the state are union members? 37th
Revenue By rank, what is the total yearly revenue (per teacher in the state) of the state-level NEA and/ or AFT affiliate(s)?
35th
Spending on education By rank, what percentage of state expenditures (of state general funds, state restricted funds, state bonds, and federal “pass-through” funds) is directed to K-12 education?
24th*
By rank, what is the total annual per-pupil expenditure (of funds from federal, state, and local sources) in the state?
36th
By rank, what percentage of total annual per-pupil expenditures is directed to teacher salaries and benefits?
14th
AREA 2: INVOLVEMENTIN POLITICS
Contributions to candidates and political parties
By rank, what percentage of the total contributions to state candidates was donated by teacher unions?
28th
By rank, what percentage of the total contributions to state-level political parties was donated by teacher unions?
35th
Industry influence By rank, what percent of the contributions to state candidates from the ten highest-giving sectors was donated by teacher unions?
6th
Status of delegates By rank, what percentage of the state’s delegates to the Democratic and Republican conventions were members of teacher unions?
50th
AREA 3:SCOPE OF BARGAINING
Legal scope of bargaining What is the legal status of collective bargaining? Neither required nor prohibited
By rank, how broad is the scope of collective bargaining? 33rd*
Automatic revenue streams What is the unions’ legal right to automatically collect agency fees from non-members and/or collect member dues via automatic payroll deductions?
Neither required nor prohibited
Right to strike What is the legal status of teacher strikes? Prohibited
AREA 4:STATE POLICIES
Performance pay Does the state support performance pay for teachers? State supports/encourages
Retirement By rank, what is the employer- versus employee-contribution rate to the teacher pension system? 14th
Evaluations What is the maximum potential consequence for veteran teachers who receive unsatisfactory evaluation(s)?
No consequences articulated
Is classroom effectiveness included in teacher evaluations? If so, how is it weighted? Not required
Terms of employment How long before a teacher earns tenure? Four years
Is student/teacher performance considered in tenure decisions? If so, how is it weighted? Not included
Is seniority considered in teacher layoff decisions? If so, how is it weighted? Required; Considered among other factors
Is teacher performance included in teacher layoff decisions? If so, how is it weighted? Not required
By rank, what percentage of the teaching workforce was dismissed due to poor performance? 42nd
Class size Is class size restricted for grades 1-3? If so, is the restriction higher or lower than the national average (20)?
Yes; Higher
KENTUCKY RANKINGS BY AREA AND INDICATOR
35*
26*
26
10

Overall Rank: 28thTier 3 (Average)
KENTUCKY
Area and Rank General Indicator Sub-IndicatorSub-Indicator Rank/Status
AREA 4:STATE POLICIES
(cont.)
Charter school structural limitationsc
Is there a cap (limit) placed on the number of charter schools that can operate in the state (or other jurisdiction) and/or on the number of students who can attend charter schools?
N/A
Does the state allow a variety of charter schools: start-ups, conversions, and virtual schools? N/A
How many charter authorizing options exist? How active are those authorizers? N/A
Charter school exemptionsc Are all charter schools automatically exempt from state laws and state/district regulations (except those that safeguard students and fiscal accountability)? If not, are they eligible for exemptions?
N/A
Are all charter schools automatically exempt from state teacher-certification requirements? If not, are they eligible for exemptions?
N/A
Are all charter schools automatically exempt from collective bargaining agreements (CBAs)? If not, are they eligible for exemptions?
N/A
AREA 5:PERCEIVED INFLUENCEd
Relative influence of teacher unions
How do you rank the influence of teacher unions on education policy compared with other influential entities?
Most- or second-most influential
Influence over campaigns On a scale from always to never, how often do Democratic candidates need teacher-union support to get elected?
Sometimes/Often
On a scale from always to never, how often do Republican candidates need teacher-union support to get elected?
Sometimes
Influence over spending To what extent, from strongly agree to strongly disagree, do you agree that even in times of cutbacks, teacher unions are effective in protecting dollars for education?
Agree
Given recent budgetary constraints, would you say that teacher unions generally make concessions to prevent reductions in pay and benefits or fight hard to prevent those reductions?
Fight
Influence over policy To what extent, from strongly agree to strongly disagree, do you agree that teacher unions ward off proposals in your state with which they disagree?
Strongly agree
On a scale from always to never, how often do existing state education policies reflect teacher-union priorities?
Sometimes/Often
To what extent, from totally in line to not at all in line, were state education policies proposed by the governor during your state’s latest legislative session in line with teacher-union priorities?
Mostly in line
To what extent, from totally in line to not at all in line, were legislative outcomes of your state’s latest legislative session in line with teacher-union priorities?
Somewhat/Mostly in line
Influence over key stakeholders
On a scale from always to never, how often have the priorities of state education leaders aligned with teacher-union positions in the past three years?
Sometimes/Often
Would you say that teacher unions typically compromise with policymakers to ensure that their preferred policies are enacted, or typically need not make concessions?
Compromise
* Tied with another state
a Area ranks are calculated using a weighted average of sub-indicators. For a more detailed description, see Appendix A.
b Where possible, we report a state’s rank as compared to other states on a given metric. For example, out of 51 states, Kentucky has the 37th-highest percentage of teachers who are union members. Otherwise, we report a status: In Kentucky, collective bargaining is neither required nor prohibited, and union agency fees are also neither required nor prohibited. For a more detailed description of our metrics and methodology, see Appendix A. To request the raw data for your state, send an email to [email protected].
c Kentucky does not have a charter school law.
d For all survey questions, stakeholders were asked specifically about teacher unions, candidates, policies, and leaders in their state. In addition, we asked about unions and policies in the “current legislative session,” but because legislative calendars vary from state to state, responses refer to policies proposed and enacted within the 2010-11 window.
10
11*

Overall Rank: 28thTier 3 (Average)
KENTUCKY
ENDNOTES
1 A state’s overall rank is calculated as follows: First, we score it on multiple sub-indicators (sub-indicator data and scores for Kentucky are shown in the table, Kentucky Rankings by Area and Indicator). Second, we take a weighted average of the sub-indicators in each of five areas. In each area, we use that average to place the states in rank order: For example, in Area 1: Resources and Membership, Kentucky is ranked 35th of 51 based on the weighted average of its sub-indicators. To generate the state’s overall rank, we average the five area ranks together, then re-order the states. For a more detailed description of data sources and methodology, see Appendix A.
2 Readers should note that these figures include only direct donations from unions and union-connected PACs, but not their spending on electioneering/advertising, mobilizing the union’s own membership, lobbying, or advocacy. A recent Wall Street Journal report found that donations and lobbying activities account for a small share of union political spending compared with their expenditures on member mobilization and advocacy. Even the AFT agreed, making the argument that since its mission is organizing and activism, it will naturally spend significant amounts on these activities. Thus, the percentages we report here are extremely conservative representations of what unions actually spend on politics. For more information, see Appendix A, Area 2; Tom McGinty and Brody Mullins, “Political Spending by Unions Far Exceeds Direct Donations,” Wall Street Journal, July 10, 2012; and Jeff Hauser, “Wall Street Journal Compares Union Political Spending to Corporate Donations,” AFL-CIO, July 10, 2012.
3 At the time of publication, the 2000 conventions were the most recent for which such detailed data were available in forms that met rigorous standards. However, 2008 data provided by the Democratic National Convention were highly correlated with the reliable figures from 2000.
4 We do not include data for sub-indicators pertaining to charters when calculating the ranking of states that do not have charter school laws. While some might argue that the lack of such a law is in itself evidence for union strength, we do not have sufficient data to link that absence to union activity. The nine states without charter laws are home to very different contexts—while teacher unions in some states may have played a significant role in keeping charter laws at bay, in others, they played little or no role.
5 We asked stakeholders about unions and policies in the “current legislative session,” but because legislative calendars vary from state to state, responses refer to policies proposed and enacted within the 2010-11 window.
6 “NEA Honors Steve Beshear With America’s Greatest Education Governor Award,” National Education Association, accessed June 28, 2012, http://www.nea.org/home/45673.htm.
7 Ibid.
8 Jim Waters, “Teachers Unions Top Spending By Kentucky PACS,” Bluegrass Institute, January 31, 2011, http://www.bipps.org/teachers-unions-top-spending-by-kentucky-pacs/.
9 Tom Loftus, “Kentucky Governor Steve Beshear Reports Raising $4 Million For Campaign; David Williams Takes In $1 Million,” Courier-Journal, October 12, 2011, http://cincinnati.com/blogs/nkypolitics/2011/10/12/beshear-raises-4-million-williams-raises-1-million/.
10 National Education Association.
11 Waters.

Overall Rank: 42ndTier 5 (Weakest)
LOUISIANA
IntroductionPart IV: Taking a Closer Look–Teacher Union Influence Area
AREA 1: RESOURCES AND MEMBERSHIP
TIED FOR 40TH
Louisiana’s state teacher unions contend
with limited resources and low membership;
teachers there do not see particularly
high (or low) spending on K–12 education.
Collective bargaining is permitted but not
required, and only 57.8 percent of teachers
in the Pelican State belong to unions (the
38th-largest unionization rate among 51
jurisdictions). The NEA and AFT state-level
affiliates bring in a mere $144 annually per
Louisiana teacher (45th). Louisiana directs
18.1 percent of state expenditures toward
K–12 education (30th), and overall per-pupil
expenditures are $12,253 each year (18th),
with just 52.8 percent of those dollars spent
on teacher salaries and benefits (37th).
AREA 2: INVOLVEMENT IN POLITICS2
TIED FOR 44TH
Louisiana’s teacher unions are less involved
in politics than unions in nearly every
other state. In the past decade, just 0.18
percent of the donations to candidates
for state office came from them (45th).
Union contributions made up 1.75 percent
of the money from the ten highest-giving
sectors in the state (43rd). The unions
gave relatively more to state political
parties, giving 1.1 percent of the total
donations (24th). But just 8.3 percent of
Louisiana delegates to the Democratic
and Republication national conventions
identified as teacher union members
(39th).3
LOUISIANA OVERALL RANK: 42ND1
TIER 5 (WEAKEST)
STRONGER WEAKER
1. RESOURCES AND MEMBERSHIP
OVERALL
2. INVOLVEMENT IN POLITICS
3. SCOPE OF BARGAINING
4. STATE POLICIES
5. PERCEIVED INFLUENCE
42
44
33
40
44
24

Overall Rank: 42ndTier 5 (Weakest)
LOUISIANA
AREA 3: SCOPE OF BARGAINING
24TH
Louisiana law does not explicitly address
collective bargaining in public education,
implicitly permitting it (and opening all
twenty-one provisions examined in our
metric to bargaining). The state allows its
public employees, teachers included, to
strike, although it prevents unions from
automatically collecting agency fees from
non-members.
AREA 4: STATE POLICIES
33RD
While a few of Louisiana’s state policies
align with traditional teacher union
interests, many do not. The state requires
that student achievement be the main
criterion in teacher evaluations, and
teachers are automatically eligible for
dismissal if they receive unsatisfactory
evaluations. At the time we calculated
our metric, the state mandated seniority-
based layoffs and did not consider student
learning in tenure decisions, positions it
reversed in April 2012. Louisiana is also
known for its charter-friendly environment
(see sidebar): The state does not cap
the number of charter schools and
automatically exempts them from many
state laws and district regulations (but
charters must apply for exemptions to
teacher certification requirements).
AREA 5: PERCEIVED INFLUENCE
44TH
Stakeholder responses reflected teacher
unions that are weaker in Louisiana than in
nearly every other state. Respondents rank
the governor (Bobby Jindal), the charter
school association, the state school board,
and the state school board association as
more influential than the teacher unions
when it comes to education policy. They
report that the unions are not effective in
warding off education proposals with which
they disagree, and that state education
leaders rarely align with union positions.
Further, they note that policies proposed by
the governor in the latest legislative session
were not at all in line with teacher union
priorities, and that the session’s outcomes
were mostly not in line with their priorities.4
Finally, they report that teacher unions
more often than not turn to compromise
to see some of their preferred policies
enacted.
OVERALL
42ND
State teacher unions are weaker in
Louisiana than unions in other states on
nearly every metric that we examined. They
have thin internal resources. They see a low
investment in K–12 education by the state
and operate in a largely unfavorable policy
environment. They have a weak reputation
among stakeholders, perhaps belying a
union that sees futility in donating heavily
to politics in a state famous for its union-
opposed reforms.

Overall Rank: 42ndTier 5 (Weakest)
LOUISIANA
To many observers across the land, education in Louisiana is inextricably linked with choice. In 2003, the state legislature created the Recovery School District, paving the way for rapid charter school growth.5 Louisiana charters are automatically exempt from nearly every state education policy, and in 2010 the legislature passed Governor Bobby Jindal’s Red Tape Reduction Act, which allowed traditional districts to ask for waivers from the laws as well. (The Louisiana Federation of Teachers tried, but failed, to stop the Act in the state supreme court.)6 The state also recently enacted bills supporting home schooling, permitting (and paying for) students to take courses online if they are dissatisfied with what is offered at their local school, expanding the number of charter school authorizers, and creating a “parent trigger” mechanism.7,8
But no choice policy has received as much attention as Louisiana’s voucher programs. In 2008, the state offered vouchers for private school tuition to students in the Recovery School District, and also allowed individuals to claim private school tuition as a tax deduction (a rarity among the states). Two years later, lawmakers extended the voucher program to include special education students across the state, and in 2012 they enacted tax rebates for donors to school tuition organizations, which in turn provide private school scholarships.9 But when in 2012 the legislature passed Jindal’s proposal to expand the voucher program to students statewide, and not just those in low-income families, the already-infuriated unions had had enough. The Louisiana Association of Educators (LAE) and the Louisiana Federation of Teachers (LFT) sued, calling the program an unconstitutional use of taxpayer money to fund private institutions. LFT President Steve Monaghan accused Jindal of using the voucher program as a vehicle to further everyone’s interests except the students’: “If this administration cared as much about children as it does about satisfying corporate donors and national political ambitions, it would concentrate on improving all our schools for all our children.”10 Jindal responded forcefully: “The coalition of the status quo have fought reform every step of the way, so it is no surprise they are making this last ditch effort to convince the courts to overrule the vote of the people and the Legislature. Holding up these reforms in court will only deny parents and students the opportunity to escape failing schools. Our kids do not get a second chance to grow up.”11
In August 2012, the Louisiana Supreme Court denied an injunction to suspend the voucher program while awaiting a trial on its constitutionality, scheduled for October 2012 (post-press time for us, unfortunately). The LFT expressed disappointment and vowed it would keep fighting the law (and that it would rally to change the “sham” accountability standards for private schools in the meantime).12 The LAE went further, threatening to sue any private school that accepted state voucher money. An angry Jindal declared that “union leaders are stooping to new lows and trying to strong-arm schools to keep our kids from getting a quality education.”13 As yet, however, the state is going forward with the program and the LAE’s threat remains empty. Louisiana’s motto is “Union, Justice, and Confidence.” The unions are confident they’ll get justice; but so is Jindal.
ALL EYES ON THE PELICAN STATE

Overall Rank: 42ndTier 5 (Weakest)
LOUISIANA
OVERALL RANK: 42ND
Area and Ranka General Indicator Sub-IndicatorSub-Indicator Rank/Statusb
AREA 1: RESOURCES & MEMBERSHIP
Membership By rank, what percentage of public-school teachers in the state are union members? 38th
Revenue By rank, what is the total yearly revenue (per teacher in the state) of the state-level NEA and/ or AFT affiliate(s)?
45th
Spending on education By rank, what percentage of state expenditures (of state general funds, state restricted funds, state bonds, and federal “pass-through” funds) is directed to K-12 education?
30th
By rank, what is the total annual per-pupil expenditure (of funds from federal, state, and local sources) in the state?
18th
By rank, what percentage of total annual per-pupil expenditures is directed to teacher salaries and benefits?
37th
AREA 2: INVOLVEMENTIN POLITICS
Contributions to candidates and political parties
By rank, what percentage of the total contributions to state candidates was donated by teacher unions?
45th
By rank, what percentage of the total contributions to state-level political parties was donated by teacher unions?
24th
Industry influence By rank, what percent of the contributions to state candidates from the ten highest-giving sectors was donated by teacher unions?
43rd
Status of delegates By rank, what percentage of the state’s delegates to the Democratic and Republican conventions were members of teacher unions?
39th
AREA 3:SCOPE OF BARGAINING
Legal scope of bargaining What is the legal status of collective bargaining? Neither required nor prohibited
By rank, how broad is the scope of collective bargaining? 33rd*
Automatic revenue streams What is the unions’ legal right to automatically collect agency fees from non-members and/or collect member dues via automatic payroll deductions?
Agency fees prohibited
Right to strike What is the legal status of teacher strikes? Permitted
AREA 4:STATE POLICIES
Performance pay Does the state support performance pay for teachers? State supports/encourages
Retirement By rank, what is the employer- versus employee-contribution rate to the teacher pension system? 1st
Evaluations What is the maximum potential consequence for veteran teachers who receive unsatisfactory evaluation(s)?
Eligible for dismissal
Is classroom effectiveness included in teacher evaluations? If so, how is it weighted? Required; Preponderant criterion
Terms of employmentc How long before a teacher earns tenure? Three years
Is student/teacher performance considered in tenure decisions? If so, how is it weighted? Not included
Is seniority considered in teacher layoff decisions? If so, how is it weighted? Required; Considered among other factors
Is teacher performance included in teacher layoff decisions? If so, how is it weighted? Not required
By rank, what percentage of the teaching workforce was dismissed due to poor performance? 46th
Class size Is class size restricted for grades 1-3? If so, is the restriction higher or lower than the national average (20)?
Yes; Higher
LOUISIANA RANKINGS BY AREA AND INDICATOR
40*
44*
24
33

Overall Rank: 42ndTier 5 (Weakest)
LOUISIANA
Area and Rank General Indicator Sub-IndicatorSub-Indicator Rank/Status
AREA 4:STATE POLICIES
(cont.)
Charter school structural limitations
Is there a cap (limit) placed on the number of charter schools that can operate in the state (or other jurisdiction) and/or on the number of students who can attend charter schools?
No state cap
Does the state allow a variety of charter schools: start-ups, conversions, and virtual schools? Yes
How many charter authorizing options exist? How active are those authorizers? Two or more w/limited activity
Charter school exemptions Are all charter schools automatically exempt from state laws and state/district regulations (except those that safeguard students and fiscal accountability)? If not, are they eligible for exemptions?
Yes
Are all charter schools automatically exempt from state teacher-certification requirements? If not, are they eligible for exemptions?
No; Schools can apply for exemptions
Are all charter schools automatically exempt from collective bargaining agreements (CBAs)? If not, are they eligible for exemptions?
Partially; Full automatic exemption for some schools
AREA 5:PERCEIVED INFLUENCEd
Relative influence of teacher unions
How do you rank the influence of teacher unions on education policy compared with other influential entities?
Fourth- or fifth-most influential
Influence over campaigns On a scale from always to never, how often do Democratic candidates need teacher-union support to get elected?
Often
On a scale from always to never, how often do Republican candidates need teacher-union support to get elected?
Sometimes
Influence over spending To what extent, from strongly agree to strongly disagree, do you agree that even in times of cutbacks, teacher unions are effective in protecting dollars for education?
Neutral
Given recent budgetary constraints, would you say that teacher unions generally make concessions to prevent reductions in pay and benefits or fight hard to prevent those reductions?
Sometimes concede, sometimes fight
Influence over policy To what extent, from strongly agree to strongly disagree, do you agree that teacher unions ward off proposals in your state with which they disagree?
Disagree
On a scale from always to never, how often do existing state education policies reflect teacher-union priorities?
Rarely/Sometimes
To what extent, from totally in line to not at all in line, were state education policies proposed by the governor during your state’s latest legislative session in line with teacher-union priorities?
Not at all in line
To what extent, from totally in line to not at all in line, were legislative outcomes of your state’s latest legislative session in line with teacher-union priorities?
Mostly not in line/Somewhat in line
Influence over key stakeholders
On a scale from always to never, how often have the priorities of state education leaders aligned with teacher-union positions in the past three years?
Rarely
Would you say that teacher unions typically compromise with policymakers to ensure that their preferred policies are enacted, or typically need not make concessions?
Compromise
* Tied with another state
a Area ranks are calculated using a weighted average of sub-indicators. For a more detailed description, see Appendix A.
b Where possible, we report a state’s rank as compared to other states on a given metric. For example, out of 51 states, Louisiana has the 38th-highest percentage of teachers who are union members. Otherwise, we report a status: In Louisiana, collective bargaining is neither required nor prohibited, and union agency fees are prohibited. For a more detailed description of our metrics and methodology, see Appendix A. To request the raw data for your state, send an email to [email protected].
c See Area 4 above.
d For all survey questions, stakeholders were asked specifically about teacher unions, candidates, policies, and leaders in their state. In addition, we asked about unions and policies in the “current legislative session,” but because legislative calendars vary from state to state, responses refer to policies proposed and enacted within the 2010-11 window.
33
44

Overall Rank: 42ndTier 5 (Weakest)
LOUISIANA
ENDNOTES
1 A state’s overall rank is calculated as follows: First, we score it on multiple sub-indicators (sub-indicator data and scores for Louisiana are shown in the table, Louisiana Rankings by Area and Indicator). Second, we take a weighted average of the sub-indicators in each of five areas. In each area, we use that average to place the states in rank order: For example, in Area 1: Resources and Membership, Louisiana is ranked 40th of 51 based on the weighted average of its sub-indicators. To generate the state’s overall rank, we average the five area ranks together, then re-order the states. For a more detailed description of data sources and methodology, see Appendix A.
2 Readers should note that these figures include only direct donations from unions and union-connected PACs, but not their spending on electioneering/advertising, mobilizing the union’s own membership, lobbying, or advocacy. A recent Wall Street Journal report found that donations and lobbying activities account for a small share of union political spending compared with their expenditures on member mobilization and advocacy. Even the AFT agreed, making the argument that since its mission is organizing and activism, it will naturally spend significant amounts on these activities. Thus, the percentages we report here are extremely conservative representations of what unions actually spend on politics. For more information, see Appendix A, Area 2; Tom McGinty and Brody Mullins, “Political Spending by Unions Far Exceeds Direct Donations,” Wall Street Journal, July 10, 2012; and Jeff Hauser, “Wall Street Journal Compares Union Political Spending to Corporate Donations,” AFL-CIO, July 10, 2012.
3 At the time of publication, the 2000 conventions were the most recent for which such detailed data were available in forms that met rigorous standards. However, 2008 data provided by the Democratic National Convention were highly correlated with the reliable figures from 2000.
4 We asked stakeholders about unions and policies in the “current legislative session,” but because legislative calendars vary from state to state, responses refer to policies proposed and enacted within the 2010-11 window.
5 “The Public Charter Schools Dashboard,” National Alliance for Public Charter Schools, 2012, accessed August 29, 2012, http://dashboard.publiccharters.org/dashboard/schools/page/overview/state/LA/year/2012.
6 Joe Gyan Jr., “La. High Court: Red Tape Reduction Act Suit Premature,” Advocate, July 5, 2012, http://theadvocate.com/news/3260826-123/la-high-court-red-tape.
7 “Louisiana Course Choice,” Louisiana Department of Education, accessed August 29, 2012, http://www.doe.state.la.us/coursechoice/.
8 Sean Cavanagh, “La. School Choice Options Expand After Sweeping Education Overhaul,” Education Week, April 13, 2012, http://www.edweek.org/ew/articles/2012/04/13/28louisiana.h31.html.
9 “School Choice In Louisiana,” The Friedman Foundation, last updated August 27, 2012, http://www.edchoice.org/School-Choice/State/LA.aspx.
10 “Supreme Court Won’t Enjoin Jindal’s Voucher Scheme,” Louisiana Federation of Teachers, August 16, 2012, http://la.aft.org/index.cfm?action=article&articleID=fcba6bd0-f65d-498a-866e-e587b22c5a6f.
11 Kevin Mooney, “Louisiana Voucher Applications Roll Forward Despite Union Lawsuits,” ThePelicanPost.com, July 2, 2012, http://www.thepelicanpost.org/2012/07/02/louisiana-voucher-applications-roll-forward-despite-union-lawsuits/.
12 “Voucher Accountability A Sham, LFT Says,” Louisiana Federation of Teachers, July 24, 2012, http://la.aft.org/index.cfm?action=article&articleID=709b83c2-b450-4708-9b33-e06de028e0a6.
13 “Louisiana Teachers Union Threatens To Sue Private Schools Over Voucher Program,” FoxNews.com, August 6, 2012, http://www.foxnews.com/politics/2012/08/06/louisiana-teachers-union-threatens-schools-over-voucher-program/.

Overall Rank: 22ndTier 3 (Average)
MAINE
IntroductionPart IV: Taking a Closer Look–Teacher Union Influence Area
AREA 1: RESOURCES AND MEMBERSHIP
TIED FOR 20TH
The state teacher unions in Maine see
somewhat substantial resources. 77.1
percent of Maine teachers are union
members, the 25th-highest unionization
rate of 51 jurisdictions. The state-level NEA
and AFT affiliates generate annual revenue
of $621 per teacher in the state (11th).
In addition, teachers see considerable
resources dedicated to K–12 education: The
state ranks 7th in annual per-pupil spending
($14,591), and 54.0 percent of education
expenditures go to teacher salaries and
benefits (25th).
AREA 2: INVOLVEMENT IN POLITICS2
TIED FOR 44TH
In the past decade, Maine’s teacher unions
have not shown much of a financial
presence during elections. Their donations
amounted to a mere 0.02 percent of total
contributions to candidates for state office,
and accounted for just 0.03 percent of
the contributions to candidates from the
top ten highest-giving sectors (unions
in no other state gave a smaller percent
on either measure). The teacher unions
gave comparatively more to state political
parties (1.1 percent of donations to parties
came from unions; 23rd). Raising Maine’s
ranking in this area are its delegates
to the Democratic and Republican
conventions—11.1 percent identified as
teacher union members (33rd).3
MAINE OVERALL RANK: 22ND1
TIER 3 (AVERAGE)
STRONGER WEAKER
1. RESOURCES AND MEMBERSHIP
OVERALL
2. INVOLVEMENT IN POLITICS
3. SCOPE OF BARGAINING
4. STATE POLICIES
5. PERCEIVED INFLUENCE
22
44
7
20
11
16

Overall Rank: 22ndTier 3 (Average)
MAINE
AREA 3: SCOPE OF BARGAINING
16TH
Maine is one of thirty-two states that
require collective bargaining, and its laws
permit a wider scope of bargaining than
most. Of the twenty-one items examined
in this metric, four must be bargained in
Maine: wages, hours, terms and conditions
of employment, and grievance procedures.
Bargaining over the remaining seventeen
is implicitly permitted since they are not
addressed by state law. While teacher
strikes are prohibited, unions are allowed
to automatically deduct agency fees from
the wages of non-member teachers, an
important source of the high revenue
reflected in Area 1.
AREA 4: STATE POLICIES
TIED FOR 7TH
At the time we calculated our data, Maine
policies were more aligned with traditional
union interests than in nearly every other
state. As recently as March 2012, the state
did not support performance pay, there
were no articulated consequences for
unsatisfactory teacher evaluations, and
neither teacher evaluations nor teacher
tenure decisions needed to take student
achievement into account. (Maine, however,
is one example of many where the policy
environment is rapidly changing. In April
2012 the state approved, though it has
yet to implement, a student-achievement-
based evaluation system. It also decreased
the pre-tenure probationary period
from three to two years, although the
change occurred after we concluded
our calculations.) While unions typically
oppose the expansion of charter schools,
the state made them legal in 2011. Still,
that legislation attends to some union
interests. Though charters are automatically
exempt from many state laws and district
regulations, they must follow state teacher
certification requirements and cannot apply
for exemptions. Similarly, while charters are
exempted from district-union contracts,
employees at a school may opt to bargain
collectively.
AREA 5: PERCEIVED INFLUENCE
TIED FOR 11TH
Maine stakeholders report that their
teacher unions are strong, but perhaps
not as strong as they used to be. Survey
respondents rank teacher unions, along
with the state association of school
administrators, as the most influential
entity in shaping education policy. They
report that the unions are highly effective in
fending off education proposals with which
they disagree and (in a time of budgetary
constraint) are successful in protecting
dollars for education. However, respondents
also indicate that policies proposed by
the governor and enacted in the latest
legislative session (which include the
charter law referenced in Area 4) were not
in line with teacher union priorities.4
OVERALL
22ND
Despite their significant financial resources,
Maine teacher unions are not particularly
active donors to state politics and they’ve
recently lost some key battles. However,
they enjoy a strong reputation and many
state policies still align with union interests.

Overall Rank: 22ndTier 3 (Average)
MAINE
Despite the shift in Maine politics in 2010 that gave Republicans control of both houses and the governorship, the Maine Education Association (MEA) has seen a number of potentially devastating bills land far from the mark.5 The union blocked Governor Paul LePage’s proposal to end collective bargaining for public employees and his push for right-to-work laws.6,7 Budget cuts did land a jab, however: the state cut cost-of-living adjustments for the pensions of retired teachers (as of August 2012, a lawsuit supported by the MEA is pending) and the union ultimately couldn’t prevent a measure that allows local school districts to seek less expensive health plans for current employees.8 Legislators also increased the pre-tenure probationary period for teachers from two years to three, the national norm, and passed a bill legalizing charter schools (Maine previously had no such thing).9 Yet the law limits the number of charters and their enrollment, and charter teachers are allowed to bargain collectively—alleviating a major point of conflict between charter supporters and unions.10
So far, 2012 is shaping up to be an equally mixed bag for the MEA. Sponsored by Governor LePage in anticipation of the state’s NCLB waiver request, LD 1858 required that teachers be evaluated on student learning (among other criteria), and after two years of ineffective ratings teachers would be eligible for dismissal. The union objected, not to the use of student data (a requirement for the waiver) but to evaluations that could potentially be based entirely on standardized test scores and developed without teacher input. “Ninety-five percent of it, we can completely embrace,” said John Kosinski of the MEA.11 With amendments that ensured due process for fired teachers, and left the details of data use to the discretion of the districts and their local unions, the bill passed in April 2012.12 Despite the compromise, Governor LePage seems set on limiting or eliminating collective bargaining for public employees, and the MEA may soon see the gloves come completely off.13
IT COULD BE WORSE

Overall Rank: 22ndTier 3 (Average)
MAINE
OVERALL RANK: 22ND
Area and Ranka General Indicator Sub-IndicatorSub-Indicator Rank/Statusb
AREA 1: RESOURCES & MEMBERSHIP
Membership By rank, what percentage of public-school teachers in the state are union members? 25th
Revenue By rank, what is the total yearly revenue (per teacher in the state) of the state-level NEA and/ or AFT affiliate(s)?
11th
Spending on education By rank, what percentage of state expenditures (of state general funds, state restricted funds, state bonds, and federal “pass-through” funds) is directed to K-12 education?
33rd
By rank, what is the total annual per-pupil expenditure (of funds from federal, state, and local sources) in the state?
7th
By rank, what percentage of total annual per-pupil expenditures is directed to teacher salaries and benefits?
25th
AREA 2: INVOLVEMENTIN POLITICS
Contributions to candidates and political parties
By rank, what percentage of the total contributions to state candidates was donated by teacher unions?
50th
By rank, what percentage of the total contributions to state-level political parties was donated by teacher unions?
23rd
Industry influence By rank, what percent of the contributions to state candidates from the ten highest-giving sectors was donated by teacher unions?
50th
Status of delegates By rank, what percentage of the state’s delegates to the Democratic and Republican conventions were members of teacher unions?
33rd
AREA 3:SCOPE OF BARGAINING
Legal scope of bargaining What is the legal status of collective bargaining? Mandatory
By rank, how broad is the scope of collective bargaining? 15th*
Automatic revenue streams What is the unions’ legal right to automatically collect agency fees from non-members and/or collect member dues via automatic payroll deductions?
Permitted
Right to strike What is the legal status of teacher strikes? Prohibited
AREA 4:STATE POLICIES
Performance pay Does the state support performance pay for teachers? State does not support
Retirement By rank, what is the employer- versus employee-contribution rate to the teacher pension system? 6th
Evaluationsc What is the maximum potential consequence for veteran teachers who receive unsatisfactory evaluation(s)?
No consequences articulated
Is classroom effectiveness included in teacher evaluations? If so, how is it weighted? Not required
Terms of employmentc How long before a teacher earns tenure? Three years
Is student/teacher performance considered in tenure decisions? If so, how is it weighted? Not included
Is seniority considered in teacher layoff decisions? If so, how is it weighted? Optional; May be considered among other factors
Is teacher performance included in teacher layoff decisions? If so, how is it weighted? Not required
By rank, what percentage of the teaching workforce was dismissed due to poor performance? 44th
Class size Is class size restricted for grades 1-3? If so, is the restriction higher or lower than the national average (20)?
Yes; Higher
MAINE RANKINGS BY AREA AND INDICATOR
20*
44*
16
7*

Overall Rank: 22ndTier 3 (Average)
MAINE
Area and Rank General Indicator Sub-IndicatorSub-Indicator Rank/Status
AREA 4:STATE POLICIES
(cont.)
Charter school structural limitations
Is there a cap (limit) placed on the number of charter schools that can operate in the state (or other jurisdiction) and/or on the number of students who can attend charter schools?
State cap with limited room for growth
Does the state allow a variety of charter schools: start-ups, conversions, and virtual schools? Yes
How many charter authorizing options exist? How active are those authorizers? Two or more w/limited jurisdiction
Charter school exemptions Are all charter schools automatically exempt from state laws and state/district regulations (except those that safeguard students and fiscal accountability)? If not, are they eligible for exemptions?
Yes
Are all charter schools automatically exempt from state teacher-certification requirements? If not, are they eligible for exemptions?
No; Schools cannot apply for exemptions
Are all charter schools automatically exempt from collective bargaining agreements (CBAs)? If not, are they eligible for exemptions?
Yes; Teachers at each school can choose to bargain collectively
AREA 5:PERCEIVED INFLUENCEd
Relative influence of teacher unions
How do you rank the influence of teacher unions on education policy compared with other influential entities?
Most- or second-most influential
Influence over campaigns On a scale from always to never, how often do Democratic candidates need teacher-union support to get elected?
Often/Always
On a scale from always to never, how often do Republican candidates need teacher-union support to get elected?
Rarely/Sometimes
Influence over spending To what extent, from strongly agree to strongly disagree, do you agree that even in times of cutbacks, teacher unions are effective in protecting dollars for education?
Agree
Given recent budgetary constraints, would you say that teacher unions generally make concessions to prevent reductions in pay and benefits or fight hard to prevent those reductions?
Fight
Influence over policy To what extent, from strongly agree to strongly disagree, do you agree that teacher unions ward off proposals in your state with which they disagree?
Strongly agree
On a scale from always to never, how often do existing state education policies reflect teacher-union priorities?
Sometimes/Often
To what extent, from totally in line to not at all in line, were state education policies proposed by the governor during your state’s latest legislative session in line with teacher-union priorities?
Mostly not in line/Somewhat in line
To what extent, from totally in line to not at all in line, were legislative outcomes of your state’s latest legislative session in line with teacher-union priorities?
Mostly not in line
Influence over key stakeholders
On a scale from always to never, how often have the priorities of state education leaders aligned with teacher-union positions in the past three years?
Sometimes/Often
Would you say that teacher unions typically compromise with policymakers to ensure that their preferred policies are enacted, or typically need not make concessions?
Does not generally concede
* Tied with another state
a Area ranks are calculated using a weighted average of sub-indicators. For a more detailed description, see Appendix A.
b Where possible, we report a state’s rank as compared to other states on a given metric. For example, out of 51 states, Maine has the 25th-highest percentage of teachers who are union members. Otherwise, we report a status: Maine has mandatory collective bargaining, and union agency fees are permitted. For a more detailed description of our metrics and methodology, see Appendix A. To request the raw data for your state, send an email to [email protected].
c See Area 4, above, and sidebar.
d For all survey questions, stakeholders were asked specifically about teacher unions, candidates, policies, and leaders in their state. In addition, we asked about unions and policies in the “current legislative session,” but because legislative calendars vary from state to state, responses refer to policies proposed and enacted within the 2010-11 window.
7*
11*

Overall Rank: 22ndTier 3 (Average)
MAINE
ENDNOTES
1 A state’s overall rank is calculated as follows: First, we score it on multiple sub-indicators (sub-indicator data and scores for Maine are shown in the table, Maine Rankings by Area and Indicator). Second, we take a weighted average of the sub-indicators in each of five areas. In each area, we use that average to place the states in rank order: For example, in Area 1: Resources and Membership, Maine is ranked 20th of 51 based on the weighted average of its sub-indicators. To generate the state’s overall rank, we average the five area ranks together, then re-order the states. For a more detailed description of data sources and methodology, see Appendix A.
2 Readers should note that these figures include only direct donations from unions and union-connected PACs, but not their spending on electioneering/advertising, mobilizing the union’s own membership, lobbying, or advocacy. A recent Wall Street Journal report found that donations and lobbying activities account for a small share of union political spending compared with their expenditures on member mobilization and advocacy. Even the AFT agreed, making the argument that since its mission is organizing and activism, it will naturally spend significant amounts on these activities. Thus, the percentages we report here are extremely conservative representations of what unions actually spend on politics. For more information, see Appendix A, Area 2; Tom McGinty and Brody Mullins, “Political Spending by Unions Far Exceeds Direct Donations,” Wall Street Journal, July 10, 2012; and Jeff Hauser, “Wall Street Journal Compares Union Political Spending to Corporate Donations,” AFL-CIO, July 10, 2012.
3 At the time of publication, the 2000 conventions were the most recent for which such detailed data were available in forms that met rigorous standards. However, 2008 data provided by the Democratic National Convention were highly correlated with the reliable figures from 2000.
4 We asked stakeholders about unions and policies in the “current legislative session,” but because legislative calendars vary from state to state, responses refer to policies proposed and enacted within the 2010-11 window.
5 “Leadership Matters,” Bangor Daily News, July 22, 2011, http://bangordailynews.com/2011/07/22/opinion/leadership-matters/.
6 Abby Rapoport, “The Union Fight You Might Not Have Been Watching,” American Prospect, June 7, 2012, http://prospect.org/article/union-fight-you-might-not-have-been-watching.
7 “Hard Realities, Some Good News,” Maine Education Association, accessed June 28, 2012, http://www.maineeducationassociation.org/home/875.htm.
8 “125th Maine Legislature Wreaks Havoc,” Maine Education Association, accessed June 28, 2012, http://www.maine.nea.org/home/1245.htm.
9 Harry R. Pringle, “Legislature Increases Probationary Period To Three years,” School Law Advisory, http://www.schoollaw.com/html/pdf/687.pdf.
10 “Charter School Laws Across The States 2012,” Center for Education Reform, April 2012, http://www.edreform.com/wp-content/uploads/2012/04/CER_2012_Charter_Laws.pdf.
11 Susan McMillan, “Teacher Evaluations: Differences About Appealing Dismissals Key,” Kennebec Journal, March 15, 2012, http://www.kjonline.com/news/differences-about-appealing-dismissals-key_2012-03-14.html.
12 Eric Russell, “Committee Approves System For Evaluating Maine’s Teachers,” Bangor Daily News, March 21, 2012, http://bangordailynews.com/2012/03/21/politics/teacher-evaluation-bill-takes-strange-turn-in-committee/.
13 Rapoport.

Overall Rank: 23rd Tier 3 (Average)
MARYLAND
IntroductionPart IV: Taking a Closer Look–Teacher Union Influence Area
AREA 1: RESOURCES AND MEMBERSHIP
26TH
Maryland posts moderate financial and
membership resources for its teacher
unions. On the one hand, collective
bargaining is mandatory in the Old Line
State, and 84.8 of Maryland’s teachers are
union members (the 20th-highest rate of 51
jurisdictions). Yet its NEA and AFT state-
level affiliates generate annual revenues of
just $329 per teacher in the state (33rd).
Spending on education is also moderate:
20.6 percent of the state’s expenditures go
to K–12 education (21st), and funds from
local, state, and federal sources amount
to $12,703 per pupil each year (17th) with
56.0 percent of those dollars dedicated to
teacher salaries and benefits (12th).
AREA 2: INVOLVEMENT IN POLITICS2
TIED FOR 40TH
Compared with their counterparts
nationwide, Maryland’s teacher unions do
not have a strong financial presence in state
elections. In the past ten years, only 0.43
percent of the donations to candidates
to state office came from teacher unions
(32nd); those contributions amounted to
4.2 percent of the donations from the top
ten highest-contributing sectors in the state
(31st). Teacher unions gave at a slightly
higher rate to state political parties—1.3
percent of all contributions (20th). But only
5.4 percent of delegates to the Democratic
and Republican national conventions were
teacher union members (46th).3
MARYLAND OVERALL RANK: 23RD1 TIER 3 (AVERAGE)
STRONGER WEAKER
1. RESOURCES AND MEMBERSHIP
OVERALL
2. INVOLVEMENT IN POLITICS
3. SCOPE OF BARGAINING
4. STATE POLICIES
5. PERCEIVED INFLUENCE
23
40
16
26
4
20

Overall Rank: 23rd Tier 3 (Average)
MARYLAND
AREA 3: SCOPE OF BARGAINING
20TH
Maryland is one of thirty-two states that
require collective bargaining for public-
school teachers, and the scope of that
bargaining is wider than most. Of twenty-
one possible contract items examined in
this report, Maryland requires that four—
wages, hours, terms of employment, and
transfers/reassignments—be negotiated.
By not addressing them, the state implicitly
includes fifteen additional provisions in
the scope of bargaining. Only two items
are explicitly prohibited: length of the
school year and class size. Further, unions
are allowed to automatically collect
agency fees from non-member teachers,
a key source of union revenue. Still, the
state limits the strength of its unions by
prohibiting teacher strikes.
AREA 4: STATE POLICIES
16TH
Maryland teacher policies generally align
with traditional teacher union interests. The
state does not articulate consequences for
unsatisfactory evaluations, and districts
need not consider student achievement
when awarding tenure (although they must
include it as the preponderant criterion
in teacher evaluations). Layoff decisions
are at the discretion of the district, and
they are not required to include teacher
performance in those decisions. The state’s
charter laws are also mostly in line with the
typical union position. While there is no
cap on the number of charters in the state,
and new, conversion, and virtual schools
are all allowed, only local school boards
can authorize charters. Further, charter
schools are bound by state laws, district
regulations, and collective bargaining
agreements (although schools may apply
for exemptions to all three, save for state
teacher certification rules).
AREA 5: PERCEIVED INFLUENCE
4TH
Based on stakeholder perceptions,
Maryland teacher unions are among the
strongest in the nation. Stakeholders agree
that teacher unions are effective in warding
off proposals with which they disagree,
and that they need not compromise to see
their preferred policies enacted at the state
level. They also note that the state board
of education and state education chief are
often in line with union policy positions. In
addition—and unlike many other states—
respondents in Maryland agreed that
policies both proposed by the governor
and enacted in the latest legislative
session were mostly in line with teacher
union priorities (not surprising given the
overwhelming Democrat majority in the
capitol—see sidebar).4
OVERALL
23RD
Maryland’s teacher unions may not spend
a lot of money on political campaigns, but
they may not need to. They enjoy a strong
reputation and a relatively favorable policy
climate. Given that education policies in
Maryland are more closely aligned with
traditional union interests than in most
states, perhaps the state unions are
exhibiting power quietly, or perhaps the
favorable climate permits them to stay
uninvolved unless threatened.

Overall Rank: 23rd Tier 3 (Average)
MARYLAND
In 2010, Maryland unions had an ally in Democrat Governor Martin O’Malley. He has publically praised his partnerships with organized labor, and the National Education Association (NEA) even gave him its “America’s Greatest Education Governor Award.”5,6 In April of that year, O’Malley signed the Education Reform Act as part of the state’s bid for Race to the Top (RTTT) money. He promoted the Act (which increased the pre-tenure probationary period from two to three years—the national norm—and incorporated a student growth component into teacher evaluations) as a compromise with state teacher unions because it did not detail how student performance would be incorporated in the evaluations. Instead, the details were left to local districts and their unions.7,8 Education reformers were unimpressed: “It’s still a pretty tame, modest proposal compared to what other states have done,” said Matthew Joseph, director of Maryland’s Advocates for Children and Youth.9
The Maryland Department of Education agreed. Its RTTT application ignored the Act’s requirement that student growth be no more than 35 percent of a teacher’s evaluation. Instead, it promised that growth would comprise 50 percent.10 Local unions were livid, and only two out of twenty-four signed the application.11 Maryland State Education Association (MSEA) President Clara Floyd tried to smooth over the schism, remarking in a press release that “the Governor and his staff worked tirelessly to improve the application. While the decision whether or not to sign on to the application was a local one, we can all join together in thanking the Governor for his work.”12 But she also expressed concerns to the state Department of Education that the proposed evaluation rules “usurp the authority granted to local boards of education through the Education Reform Act and existing collective bargaining statutes.”13
Despite the union opposition, Maryland’s RTTT application was accepted, and Maryland unions rallied in Annapolis against former ally O’Malley to fight a proposed increase in pension contributions from 5 to 7 percent (they lost). Further salt in the wound: Only one-third of the increased revenue was allocated to the pension fund; the other two-thirds went to plug holes in the state’s general budget.14 Districts also took a hit with a 2012 law requiring they take on $130 million of state pension costs for teachers.15 With O’Malley torn between labor demands, financial constraint, and pressure from reformers, the union may soon second-guess that commemorative plaque.
ON SECOND THOUGHT

Overall Rank: 23rd Tier 3 (Average)
MARYLAND
OVERALL RANK: 23RD
Area and Ranka General Indicator Sub-IndicatorSub-Indicator Rank/Statusb
AREA 1: RESOURCES & MEMBERSHIP
Membership By rank, what percentage of public-school teachers in the state are union members? 20th
Revenue By rank, what is the total yearly revenue (per teacher in the state) of the state-level NEA and/ or AFT affiliate(s)?
33rd
Spending on education By rank, what percentage of state expenditures (of state general funds, state restricted funds, state bonds, and federal “pass-through” funds) is directed to K-12 education?
21st
By rank, what is the total annual per-pupil expenditure (of funds from federal, state, and local sources) in the state?
17th
By rank, what percentage of total annual per-pupil expenditures is directed to teacher salaries and benefits?
12th
AREA 2: INVOLVEMENTIN POLITICS
Contributions to candidates and political parties
By rank, what percentage of the total contributions to state candidates was donated by teacher unions?
32nd
By rank, what percentage of the total contributions to state-level political parties was donated by teacher unions?
20th
Industry influence By rank, what percent of the contributions to state candidates from the ten highest-giving sectors was donated by teacher unions?
31st
Status of delegates By rank, what percentage of the state’s delegates to the Democratic and Republican conventions were members of teacher unions?
46th
AREA 3:SCOPE OF BARGAINING
Legal scope of bargaining What is the legal status of collective bargaining? Mandatory
By rank, how broad is the scope of collective bargaining? 29th*
Automatic revenue streams What is the unions’ legal right to automatically collect agency fees from non-members and/or collect member dues via automatic payroll deductions?
Permitted
Right to strike What is the legal status of teacher strikes? Prohibited
AREA 4:STATE POLICIES
Performance pay Does the state support performance pay for teachers? State does not support
Retirement By rank, what is the employer- versus employee-contribution rate to the teacher pension system? 15th
Evaluations What is the maximum potential consequence for veteran teachers who receive unsatisfactory evaluation(s)?
No consequences articulated
Is classroom effectiveness included in teacher evaluations? If so, how is it weighted? Required; Preponderant criterion
Terms of employment How long before a teacher earns tenure? Three years
Is student/teacher performance considered in tenure decisions? If so, how is it weighted? Not included
Is seniority considered in teacher layoff decisions? If so, how is it weighted? Optional; Weighted at district discretion
Is teacher performance included in teacher layoff decisions? If so, how is it weighted? Not required
By rank, what percentage of the teaching workforce was dismissed due to poor performance? 31st
Class size Is class size restricted for grades 1-3? If so, is the restriction higher or lower than the national average (20)?
No restriction
MARYLAND RANKINGS BY AREA AND INDICATOR
26
40*
20
16

Overall Rank: 23rd Tier 3 (Average)
MARYLAND
Area and Rank General Indicator Sub-IndicatorSub-Indicator Rank/Status
AREA 4:STATE POLICIES
(cont.)
Charter school structural limitations
Is there a cap (limit) placed on the number of charter schools that can operate in the state (or other jurisdiction) and/or on the number of students who can attend charter schools?
No state cap
Does the state allow a variety of charter schools: start-ups, conversions, and virtual schools? Start-ups and conversions only
How many charter authorizing options exist? How active are those authorizers? Single option; Some activity
Charter school exemptions Are all charter schools automatically exempt from state laws and state/district regulations (except those that safeguard students and fiscal accountability)? If not, are they eligible for exemptions?
No; Schools can apply for exemptions
Are all charter schools automatically exempt from state teacher-certification requirements? If not, are they eligible for exemptions?
No; Schools cannot apply for exemptions
Are all charter schools automatically exempt from collective bargaining agreements (CBAs)? If not, are they eligible for exemptions?
No; Schools can apply for exemptions
AREA 5:PERCEIVED INFLUENCEc
Relative influence of teacher unions
How do you rank the influence of teacher unions on education policy compared with other influential entities?
Second- or third-most influential
Influence over campaigns On a scale from always to never, how often do Democratic candidates need teacher-union support to get elected?
Often/Always
On a scale from always to never, how often do Republican candidates need teacher-union support to get elected?
Sometimes/Often
Influence over spending To what extent, from strongly agree to strongly disagree, do you agree that even in times of cutbacks, teacher unions are effective in protecting dollars for education?
Agree
Given recent budgetary constraints, would you say that teacher unions generally make concessions to prevent reductions in pay and benefits or fight hard to prevent those reductions?
Fight
Influence over policy To what extent, from strongly agree to strongly disagree, do you agree that teacher unions ward off proposals in your state with which they disagree?
Agree
On a scale from always to never, how often do existing state education policies reflect teacher-union priorities?
Often
To what extent, from totally in line to not at all in line, were state education policies proposed by the governor during your state’s latest legislative session in line with teacher-union priorities?
Somewhat/Mostly in line
To what extent, from totally in line to not at all in line, were legislative outcomes of your state’s latest legislative session in line with teacher-union priorities?
Somewhat/Mostly in line
Influence over key stakeholders
On a scale from always to never, how often have the priorities of state education leaders aligned with teacher-union positions in the past three years?
Often
Would you say that teacher unions typically compromise with policymakers to ensure that their preferred policies are enacted, or typically need not make concessions?
Does not generally concede
* Tied with another state
a Area ranks are calculated using a weighted average of sub-indicators. For a more detailed description, see Appendix A.
b Where possible, we report a state’s rank as compared to other states on a given metric. For example, out of 51 states, Maryland has the 20th-highest percentage of teachers who are union members. Otherwise, we report a status: Maryland has mandatory collective bargaining, and union agency fees are permitted. For a more detailed description of our metrics and methodology, see Appendix A. To request the raw data for your state, send an email to [email protected]. c For all survey questions, stakeholders were asked specifically about teacher unions, candidates, policies, and leaders in their state. In addition, we asked about unions and policies in the “current legislative session,” but because legislative calendars vary from state to state, responses refer to policies proposed and enacted within the 2010-11 window.
16
4

Overall Rank: 23rd Tier 3 (Average)
MARYLAND
ENDNOTES
1 A state’s overall rank is calculated as follows: First, we score it on multiple sub-indicators (sub-indicator data and scores for Maryland are shown in the table below, Maryland Rankings by Area and Indicator). Second, we take a weighted average of the sub-indicators in each of five areas. In each area, we use that average to place the states in rank order: For example, in Area 1: Resources and Membership, Maryland is ranked 26th of 51 based on the weighted average of its sub-indicators. To generate the state’s overall rank, we average the five area ranks together, then re-order the states. For a more detailed description of data sources and methodology, see Appendix A.
2 Readers should note that these figures include only direct donations from unions and union-connected PACs, but not their spending on electioneering/advertising, mobilizing the union’s own membership, lobbying, or advocacy. A recent Wall Street Journal report found that donations and lobbying activities account for a small share of union political spending compared with their expenditures on member mobilization and advocacy. Even the AFT agreed, making the argument that since its mission is organizing and activism, it will naturally spend significant amounts on these activities. Thus, the percentages we report here are extremely conservative representations of what unions actually spend on politics. For more information, see Appendix A, Area 2; Tom McGinty and Brody Mullins, “Political Spending by Unions Far Exceeds Direct Donations,” Wall Street Journal, July 10, 2012; and Jeff Hauser, “Wall Street Journal Compares Union Political Spending to Corporate Donations,” AFL-CIO, July 10, 2012.
3 At the time of publication, the 2000 conventions were the most recent for which such detailed data were available in forms that met rigorous standards. However, 2008 data provided by the Democratic National Convention were highly correlated with the reliable figures from 2000.
4 We asked stakeholders about unions and policies in the “current legislative session,” but because legislative calendars vary from state to state, responses refer to policies proposed and enacted within the 2010-11 window.
5 Mike Hall, “Workers And Their Unions Key To Economic Turnaround, Election outcome,” AFL-CIO Now, June 17, 2012, http://www.aflcio.org/Blog/Political-Action-Legislation/Workers-and-Their-Unions-Key-to-Economic-Turnaround-Election-Outcome.
6 Aaron C. Davis, “NEA Names O’Malley Education Governor Of The Year,” Washington Post, June 30, 2010, http://voices.washingtonpost.com/annapolis/2010/06/nea_omalley_education_governor.html.
7 “Governor Martin O’Malley To Introduce Education Reform Legislation,” Office of Governor Martin O’Malley, February 15, 2010, http://www.governor.maryland.gov/pressreleases/100215.asp.
8 Michael Birnbaum, “Bill Targets ‘Race To Top’ Contest’s Goals,” Washington Post, April 13, 2010, http://www.washingtonpost.com/wp-dyn/content/article/2010/04/12/AR2010041204264.html.
9 Ibid.
10 Andrew Ujifusa, “O’Malley Eyes Compromise On State Teacher Evaluations,” Maryland Gazette, November 18, 2010, http://ww2.gazette.net/stories/11182010/prinsch175028_32542.php.
11 “Race To The Top Application Assurances,” U.S. Department of Education, May 27, 2010, http://www2.ed.gov/programs/racetothetop/phase2-applications/maryland.pdf.
12 “MSEA Applauds Governor O’Malley’s Work On Maryland’s Race To The Top Application,” Maryland State Education Association, June 2, 2010, http://www.marylandeducators.org/detail.aspx?id=928.
13 Erica Green, “Teachers Union Challenges Race To The Top Application,” May 7, 2012, Baltimore Sun, http://articles.baltimoresun.com/2010-05-07/news/bs-md-msea-letter-20100507_1_teachers-union-million-in-federal-race-maryland-state-education-association.
14 Andrew Schotz, “Part Of Maryland Pension Hike To Go Toward Balancing State Budget,” Herald-Mail, April 14, 2011, http://articles.herald-mail.com/2011-04-14/news/29419953_1_pension-system-pension-fund-maryland-state-retirement.
15 David Hill, “MD Senate Approves Tax Hike, Pension Shift,” Washington Times, May 15, 2012, http://www.washingtontimes.com/news/2012/may/15/md-senate-approves-tax-hike-pension-shift/?page=all.

Overall Rank: 21stTier 3 (Average)
MASSACHUSETTS
IntroductionPart IV: Taking a Closer Look–Teacher Union Influence Area
AREA 1: RESOURCES AND MEMBERSHIP
TIED FOR 13TH
Massachusetts’s teacher unions benefit
from a high density of unionized teachers,
financial resources from their members,
and a significant dedication of funds for
education in the state. With 92.8 percent of
its teachers unionized, Massachusetts posts
the 13th-highest rate of 51 jurisdictions.
The state’s NEA and AFT affiliates bring
in annual revenue of $615 for each teacher
in the state (12th). Per-pupil expenditures
are high—local, state, and federal funds
combine to $13,361 annually per student
(12th), and 58.4 percent of those dollars are
directed to teacher salaries and benefits
(5th). Yet the state itself allocates just 12.6
percent of its own expenditures to K–12
education (just three states allocate less).2
AREA 2: INVOLVEMENT IN POLITICS3
TIED FOR 40TH
Despite their ample financial resources,
compared to unions in other states
Massachusetts teacher unions did not
spend much money on state candidates
and political parties.4 In the past decade,
just 0.2 percent of the donations to
candidates for state office came from
teacher unions (43rd nationally). Union
contributions to state political parties were
also comparatively small (0.25 percent of
the total received by parties; also 43rd).
These low numbers may be indicative of
unions that do not feel that high spending
will benefit them or that are satisfied with
the current political environment (see Areas
3, 4, and 5). In addition, the percentage of
Massachusetts delegates to the Democratic
and Republican national conventions who
identify as teacher union members (9.4
percent) is ranked 35th.
MASSACHUSETTS OVERALL RANK: 21ST1
TIER 3 (AVERAGE)
STRONGER WEAKER
1. RESOURCES AND MEMBERSHIP
OVERALL
2. INVOLVEMENT IN POLITICS
3. SCOPE OF BARGAINING
4. STATE POLICIES
5. PERCEIVED INFLUENCE
21
40
21
13
16
12

Overall Rank: 21stTier 3 (Average)
MASSACHUSETTS
AREA 3: SCOPE OF BARGAINING
12TH
Massachusetts is one of thirty-two states
that require collective bargaining, and
the scope of bargaining is wider there
than in most other states. All twenty-one
items examined in this metric are within
the scope of bargaining: Eight provisions
must be negotiated (wages, hours, terms
and conditions of employment, layoffs,
insurance benefits, fringe benefits, class
load, and class size) and thirteen are
implicitly permitted. While the state does
not permit teacher strikes, it does allow
unions to automatically collect agency fees
from non-member teachers.
AREA 4: STATE POLICIES
21ST
Taken together, Massachusetts policies are
more union-favorable than those in some
states, but less than in others. Teacher
employment policies are mixed. Districts do
not need to consider teacher performance
when making layoff decisions but must
consider seniority; both are in line with
traditional union interests. But student
achievement is factored into teacher
evaluations and tenure decisions—policies
contrary to union goals. The state’s charter
laws are also mixed. While some charter
schools are exempt from district collective
bargaining agreements, others are not.
While the state grants some automatic
exemptions to laws and regulations to
selected schools, it does not give them
to all schools (and does not exempt them
from all regulations). The state also has
a fairly restrictive cap on the number of
charter schools and does not allow virtual
schools.
AREA 5: PERCEIVED INFLUENCE
16TH
State stakeholders perceive teacher unions
to be relatively strong, ranking them the
most influential entity in shaping education
policy (slightly ahead of the state board
of education). They report that Democrats
need teacher union support to get elected,
and that the state education chief and
board often align with teacher union
positions. While they indicate that policies
proposed by the governor and enacted
in the latest legislative session were only
somewhat in line with union priorities,
stakeholders actually reported more union-
policy alignment than did those in many
other states.5
OVERALL
21ST
While Massachusetts is often described
as a state with powerful teacher unions—a
perception echoed in our survey of
stakeholders in the state—the Bay State’s
teacher unions rank near the middle of
the pack nationwide. Many Massachusetts
laws are favorable to union interests,
but, considering their meager campaign
contributions, unions may be enjoying a
friendly environment rather than creating it.

Overall Rank: 21stTier 3 (Average)
MASSACHUSETTS
Massachusetts teacher unions have a decades-long history of working with education reformers and state leaders to enact significant reform measures, assenting to (and even helping design) progressive policies so long as core union interests are attended to. The most recent example: Stand for Children, a national education reform group, set its sights on Massachusetts policy. The group wanted to replace seniority with teacher performance as the primary factor in layoff decisions; rather than wait for lawmakers to take the lead, it gathered enough signatures in late 2011 to place the issue on the November 2012 ballot.6 The Massachusetts Teachers Association (MTA) reacted fiercely, basing its objections on the fact that the state’s teacher evaluation system had not yet been implemented, let alone tested. Its website asserted that “a national organization with no particular expertise in education—Stand for Children—is seeking to disrupt the implementation of this system…This divisive proposal is a gimmick that will divert time, money and energy away from important priorities for our students.”7 To stop the measure, the MTA filed a lawsuit questioning its constitutionality in January 2012.
But rather than wait for the court (or the voters) to decide, the MTA opted to compromise. It agreed to support SB 2315, a bill with the same intent but different specifics than Stand for Children’s initiative. Performance still replaced seniority in layoff decisions, but the bill also funded principal training and a data reporting system. It also did not contain some of the initiative’s more aggressive options, such as giving the state the right to veto any evaluation system negotiated between a district and its union, and requiring principals’ approval in teacher transfers).8 In exchange, the reform group took its measure off the ballot, and in June 2012, the legislature passed the bill and Democrat Governor Deval Patrick signed it into law.9,10 The effects of the compromise: Both sides avoided an expensive autumn campaign, and the negative image that would likely have accompanied it. Plus, the union proved to be an architect of teacher policy rather than a bystander (and in control of its own destiny rather than leaving it up to the voters). In this case, the MTA seemed to decide that fighting it out was not the best choice.
FIGHT OR FLIGHT

Overall Rank: 21stTier 3 (Average)
MASSACHUSETTS
OVERALL RANK: 21ST
Area and Ranka General Indicator Sub-IndicatorSub-Indicator Rank/Statusb
AREA 1: RESOURCES & MEMBERSHIP
Membership By rank, what percentage of public-school teachers in the state are union members? 13th
Revenue By rank, what is the total yearly revenue (per teacher in the state) of the state-level NEA and/ or AFT affiliate(s)?
12th
Spending on education By rank, what percentage of state expenditures (of state general funds, state restricted funds, state bonds, and federal “pass-through” funds) is directed to K-12 education?
47th
By rank, what is the total annual per-pupil expenditure (of funds from federal, state, and local sources) in the state?
12th
By rank, what percentage of total annual per-pupil expenditures is directed to teacher salaries and benefits?
5th
AREA 2: INVOLVEMENTIN POLITICS
Contributions to candidates and political parties
By rank, what percentage of the total contributions to state candidates was donated by teacher unions?
43rd
By rank, what percentage of the total contributions to state-level political parties was donated by teacher unions?
43rd
Industry influence By rank, what percent of the contributions to state candidates from the ten highest-giving sectors was donated by teacher unions?
24th
Status of delegates By rank, what percentage of the state’s delegates to the Democratic and Republican conventions were members of teacher unions?
35th
AREA 3:SCOPE OF BARGAINING
Legal scope of bargaining What is the legal status of collective bargaining? Mandatory
By rank, how broad is the scope of collective bargaining? 4th*
Automatic revenue streams What is the unions’ legal right to automatically collect agency fees from non-members and/or collect member dues via automatic payroll deductions?
Permitted
Right to strike What is the legal status of teacher strikes? Prohibited
AREA 4:STATE POLICIES
Performance pay Does the state support performance pay for teachers? State-sponsored initiatives offered in select districts
Retirement By rank, what is the employer- versus employee-contribution rate to the teacher pension system? 7th
Evaluations What is the maximum potential consequence for veteran teachers who receive unsatisfactory evaluation(s)?
Teacher improvement plan
Is classroom effectiveness included in teacher evaluations? If so, how is it weighted? Evidence of student “learning” required
Terms of employment How long before a teacher earns tenure? Three years
Is student/teacher performance considered in tenure decisions? If so, how is it weighted? Required; Included as one of multiple criteria
Is seniority considered in teacher layoff decisions? If so, how is it weighted? Required; Considered among other factors
Is teacher performance included in teacher layoff decisions? If so, how is it weighted? Not required
By rank, what percentage of the teaching workforce was dismissed due to poor performance? 43rd
Class size Is class size restricted for grades 1-3? If so, is the restriction higher or lower than the national average (20)?
No restriction
MASSACHUSETTS RANKINGS BY AREA AND INDICATOR
13
40*
12
21

Overall Rank: 21stTier 3 (Average)
MASSACHUSETTS
Area and Rank General Indicator Sub-IndicatorSub-Indicator Rank/Status
AREA 4:STATE POLICIES
(cont.)
Charter school structural limitations
Is there a cap (limit) placed on the number of charter schools that can operate in the state (or other jurisdiction) and/or on the number of students who can attend charter schools?
State cap with some room for growth
Does the state allow a variety of charter schools: start-ups, conversions, and virtual schools? Start-ups and conversions only
How many charter authorizing options exist? How active are those authorizers? Single option; Some activity
Charter school exemptions Are all charter schools automatically exempt from state laws and state/district regulations (except those that safeguard students and fiscal accountability)? If not, are they eligible for exemptions?
Partially; Some automatic exemptions for some schools
Are all charter schools automatically exempt from state teacher-certification requirements? If not, are they eligible for exemptions?
No; Schools cannot apply for exemptions
Are all charter schools automatically exempt from collective bargaining agreements (CBAs)? If not, are they eligible for exemptions?
Partially; Some schools are not exempt, others can choose to bargain or not
AREA 5:PERCEIVED INFLUENCEc
Relative influence of teacher unions
How do you rank the influence of teacher unions on education policy compared with other influential entities?
Second-most influential
Influence over campaigns On a scale from always to never, how often do Democratic candidates need teacher-union support to get elected?
Often
On a scale from always to never, how often do Republican candidates need teacher-union support to get elected?
Rarely
Influence over spending To what extent, from strongly agree to strongly disagree, do you agree that even in times of cutbacks, teacher unions are effective in protecting dollars for education?
Agree
Given recent budgetary constraints, would you say that teacher unions generally make concessions to prevent reductions in pay and benefits or fight hard to prevent those reductions?
Fight
Influence over policy To what extent, from strongly agree to strongly disagree, do you agree that teacher unions ward off proposals in your state with which they disagree?
Neutral
On a scale from always to never, how often do existing state education policies reflect teacher-union priorities?
Sometimes/Often
To what extent, from totally in line to not at all in line, were state education policies proposed by the governor during your state’s latest legislative session in line with teacher-union priorities?
Somewhat in line
To what extent, from totally in line to not at all in line, were legislative outcomes of your state’s latest legislative session in line with teacher-union priorities?
Somewhat in line
Influence over key stakeholders
On a scale from always to never, how often have the priorities of state education leaders aligned with teacher-union positions in the past three years?
Sometimes/Often
Would you say that teacher unions typically compromise with policymakers to ensure that their preferred policies are enacted, or typically need not make concessions?
Sometimes compromise, sometimes do not need to concede
* Tied with another state
a Area ranks are calculated using a weighted average of sub-indicators. For a more detailed description, see Appendix A.
b Where possible, we report a state’s rank as compared to other states on a given metric. For example, out of 51 states, Massachusetts has the 13th-highest percentage of teachers who are union members. Otherwise, we report a status: Massachusetts has mandatory collective bargaining, and union agency fees are permitted. For a more detailed description of our metrics and methodology, see Appendix A. To request the raw data for your state, send an email to [email protected].
c For all survey questions, stakeholders were asked specifically about teacher unions, candidates, policies, and leaders in their state. In addition, we asked about unions and policies in the “current legislative session,” but because legislative calendars vary from state to state, responses refer to policies proposed and enacted within the 2010-11 window.
21
16

Overall Rank: 21stTier 3 (Average)
MASSACHUSETTS
ENDNOTES
1 A state’s overall rank is calculated as follows: First, we score it on multiple sub-indicators (sub-indicator data and scores for Massachusetts are shown in the table, Massachusetts Rankings by Area and Indicator). Second, we take a weighted average of the sub-indicators in each of five areas. In each area, we use that average to place the states in rank order: For example, in Area 1: Resources and Membership, Massachusetts is ranked 13th of 51 based on the weighted average of its sub-indicators. To generate the state’s overall rank, we average the five area ranks together, then re-order the states. For a more detailed description of data sources and methodology, see Appendix A.
2 Two factors explain the disparity between the high ranking on per-pupil expenditures and the low ranking for the percentage of state spending that goes to education. First, Massachusetts districts rely on local funds more heavily than in most other states (largely because of the state’s affluence). Second, total spending is higher in Massachusetts than in nearly every other state; as such, 12.6 percent of state expenditures still amount to an extremely high allocation of dollars per student by the state alone.
3 Readers should note that these figures include only direct donations from unions and union-connected PACs, but not their spending on electioneering/advertising, mobilizing the union’s own membership, lobbying, or advocacy. A recent Wall Street Journal report found that donations and lobbying activities account for a small share of union political spending compared with their expenditures on member mobilization and advocacy. Even the AFT agreed, making the argument that since its mission is organizing and activism, it will naturally spend significant amounts on these activities. Thus, the percentages we report here are extremely conservative representations of what unions actually spend on politics. For more information, see Appendix A, Area 2; Tom McGinty and Brody Mullins, “Political Spending by Unions Far Exceeds Direct Donations,” Wall Street Journal, July 10, 2012; and Jeff Hauser, “Wall Street Journal Compares Union Political Spending to Corporate Donations,” AFL-CIO, July 10, 2012.
4 The AFT-affiliated Boston Teachers Union donated nearly as much to state candidates as did the Massachusetts Federation of Teachers, and substantially more than the state’s NEA affiliate, the Massachusetts Teachers Association. Further, the Boston union donated more to state political parties than the two state-level unions combined.
5 We asked stakeholders about unions and policies in the “current legislative session,” but because legislative calendars vary from state to state, responses refer to policies proposed and enacted within the 2010-11 window.
6 Will Richmond, “Massachusetts Ballot Question Takes On Teacher Seniority,” Herald News, June 4, 2012, http://www.heraldnews.com/news/x1842810767/Fall-River-ballot-question-takes-on-teacher-seniority.
7 “Stand For Children Ballot Initiative Fails To Deliver,” Massachusetts Teachers Association, http://www.massteacher.org/news/archive/2011/12-07.aspx.
8 Frank Phillips, “Massachusetts Teachers Union Agrees To Give Up Key Rights On Seniority,” Boston Globe, June 8, 2012, http://articles.boston.com/2012-06-08/metro/32104943_1_ballot-question-teachers-union-ballot-initiative/3.
9 Associated Press, “Mass. Teacher Union Oks Deal On Ballot Question,” Boston Globe, June 7, 2012, http://www.boston.com/news/education/articles/2012/06/07/mass_teacher_union_oks_deal_on_ballot_question/.
10 Text of Senate Bill No. 02315, June 20, 2012, http://www.malegislature.gov/Bills/BillHtml/119213?generalCourtId=1.

Overall Rank: 16thTier 2 (Strong)
MICHIGAN
IntroductionPart IV: Taking a Closer Look–Teacher Union Influence Area
AREA 1: RESOURCES AND MEMBERSHIP
TIED FOR 6TH
Michigan’s state teacher unions benefit
from both substantial internal resources
and relatively high state spending on
education. The majority of Michigan
teachers—92.0 percent—are union
members (the 14th-highest membership
rate out of 51 jurisdictions), and the state-
level NEA and AFT affiliates bring in $903
per Michigan teacher each year (4th of 51).
Members of the Wolverine State’s teacher
unions also benefit from state spending:
K–12 education’s share of state expenditures
is 28.2 percent (also 4th of 51). However,
per-pupil spending (a combination of local,
state, and federal funds) is in the middle of
the pack at $10,624 (31st), with 51.7 percent
of those dollars directed to teacher salaries
and benefits (43rd).
AREA 2: INVOLVEMENT IN POLITICS2
TIED FOR 4TH
Over the past decade, teacher unions in
Michigan have been more active in politics
than those in nearly every other state.
They contributed 4.2 percent of total
donations received by state-level political
parties; only in California and Alabama did
teacher unions give a higher percentage
to their states’ political parties. They were
only slightly less generous with their
contributions to candidates for state office:
Donations from teacher unions accounted
for 0.9 percent of the funds received by
such candidates (18th), and 10.0 percent
of such Donations from the ten highest-
giving sectors in the state (14th). Finally, a
full 23.1 percent of Michigan’s delegates to
the Democratic and Republican national
conventions were members of teacher
unions (5th).3
MICHIGAN OVERALL RANK: 16TH1
TIER 2 (STRONG)
STRONGER WEAKER
1. RESOURCES AND MEMBERSHIP
OVERALL
2. INVOLVEMENT IN POLITICS
3. SCOPE OF BARGAINING
4. STATE POLICIES
5. PERCEIVED INFLUENCE
16
4
51
6
20
22

Overall Rank: 16thTier 2 (Strong)
MICHIGAN
AREA 3: SCOPE OF BARGAINING
22ND
Though Michigan is one of thirty-two
states that require collective bargaining
in public education, it restricts the scope
of that bargaining more than many others
do. Of the twenty-one items examined
in this metric, Michigan law requires that
only three—wages, hours, and terms of
employment—are included in negotiations.
It explicitly prohibits six provisions, more
than most mandatory-bargaining states:
transfers/teacher reassignments, layoffs,
dismissal, evaluations, insurance benefits,
and length of the school year. The twelve
remaining subjects are either explicitly left
to the discretion of the districts or implicitly
permitted because state law is silent. While
Michigan allows its unions to collect agency
fees from non-members—a key source of
the revenue reflected in Area 1—it prohibits
teacher strikes.
AREA 4: STATE POLICIES
51ST
Michigan policies are the least-aligned to
traditional teacher union interests of all
the states; given that a number of these
policies were passed in 2011 and 2012, this
lack of alignment is in spite of, or perhaps
explains, the unions’ high level of political
activity. For example, teacher performance
is included in the salary schedule for all
teachers; student achievement must be
the preponderant criterion in teacher
evaluations; and teachers are eligible for
dismissal after multiple unsatisfactory
ratings (as opposed to being placed on
an improvement plan). Michigan is one
of only five states that wait five years
before granting tenure to teachers (the
national norm is three), and one of only
eight where evidence of pupil learning
is the preponderant criterion in tenure
decisions. (In most states, tenure is granted
without considering student achievement
at all). The state’s charter school laws are
no better aligned: Michigan’s cap on the
number of charters now leaves ample room
for growth, the state offers many viable
authorizing options for charter schools,
and it automatically exempts charters from
district collective bargaining agreements.
AREA 5: PERCEIVED INFLUENCE
20TH
Despite the adverse policy environment,
stakeholders in Michigan report having
stronger teacher unions than do our
informants in many other states.
Survey respondents strongly agree that
Democratic candidates for state office need
teacher union support to win, reflecting
the high degree of union contributions to
Michigan politics (Area 2). But respondents
rank teacher unions the second- or third-
most influential entity on state education
policy, not the first, and note that unions
are neither especially effective nor
ineffective in warding off proposals with
which they disagree. Further, stakeholders
note that policies proposed by the
governor during the latest legislative
session were not at all in line with teacher
union priorities, and those that were
enacted were mostly not in line with those
priorities, reflecting a shift in Michigan’s
historically pro-labor environment (see
sidebar).4
OVERALL
16TH
Michigan’s teacher unions show a striking
disparity in resources and political
involvement on the one hand and their
actual influence on policy on the other.
Although Michigan is traditionally held as a
bastion of unionism, teacher unions began

Overall Rank: 16thTier 2 (Strong)
MICHIGAN
Both 2010 and 2011 were rough for unions in Michigan. The 2010 election brought a new Republican governor who made it clear that he was no friend of organized labor.5 Republicans also won majorities in both houses of the state’s legislature, as well as on the Supreme Court, and immediately looked to undermine union protections and prerogatives. Toward the end of the 2011 legislative session, one labor advocacy group denounced that the eighty-five proposed bills with an anti-labor message “start from the view that Michigan’s economic problems are the fault of public employees and the poor, rather than driven by a merciless recession and the auto industry’s contraction.”6,7
Teacher unions, in particular, found themselves facing a clutch of new laws aimed at their traditional rights: Public Acts 100 through 103 reduced the scope of collective bargaining to salary, benefits, and hours; made it more difficult for teachers to gain tenure; removed seniority from dismissal decisions; and required annual teacher evaluations that heavily weighed student growth.8
The biggest blow was Public Act 4. That 2011 statute gives the State Superintendent of Public Instruction and the governor the authority to intervene in governmental bodies facing bankruptcy, school districts included. In such districts, they can appoint an “emergency district manager” to control finances, which includes the right to eliminate or modify an existing union contract.9 By early 2012, the Detroit and Highland Park school districts had emergency managers at the helm, and they did not shy away from making cuts.10 For example, faced with an $86.3 million deficit, Roy Roberts, the emergency manager for Detroit, unilaterally imposed a 10 percent wage cut on employees and increased employee contributions to their health benefits plan to 20 percent.11 He converted low-performing schools into charters, closed others, and placed some in a new state-wide district—saving $7.5 million in annual operating costs along the way.12 Labor may yet have the last word, however. In November 2012, Michigan voters will decide whether to repeal Public Act 4. This referendum is the result of a massive campaign by an advocacy coalition called Stand Up For Democracy, which gathered the 162,000 necessary signatures—and then 64,000 more—to put the repeal on the ballot (and suspend the Act in the meantime). But after a union-supported campaign to recall Governor Rick Snyder fizzled in June 2012, the outcome of the repeal vote is far from certain.13 Michigan is known as the Wolverine State, but its teacher unions may no longer have the same bite.
STATE OF EMERGENCY
to lose influence under Governor John
Engler in the mid-1990s and recently lost
key allies at the state level. Without state
leaders on their side, they have only limited
avenues to leverage their resources into
policies they support (see sidebar).

Overall Rank: 16thTier 2 (Strong)
MICHIGAN
OVERALL RANK: 16TH
Area and Ranka General Indicator Sub-IndicatorSub-Indicator Rank/Statusb
AREA 1: RESOURCES & MEMBERSHIP
Membership By rank, what percentage of public-school teachers in the state are union members? 14th
Revenue By rank, what is the total yearly revenue (per teacher in the state) of the state-level NEA and/ or AFT affiliate(s)?
4th
Spending on education By rank, what percentage of state expenditures (of state general funds, state restricted funds, state bonds, and federal “pass-through” funds) is directed to K-12 education?
4th
By rank, what is the total annual per-pupil expenditure (of funds from federal, state, and local sources) in the state?
31st
By rank, what percentage of total annual per-pupil expenditures is directed to teacher salaries and benefits?
43rd
AREA 2: INVOLVEMENTIN POLITICS
Contributions to candidates and political parties
By rank, what percentage of the total contributions to state candidates was donated by teacher unions?
18th
By rank, what percentage of the total contributions to state-level political parties was donated by teacher unions?
3rd
Industry influence By rank, what percent of the contributions to state candidates from the ten highest-giving sectors was donated by teacher unions?
14th
Status of delegates By rank, what percentage of the state’s delegates to the Democratic and Republican conventions were members of teacher unions?
5th
AREA 3:SCOPE OF BARGAINING
Legal scope of bargaining What is the legal status of collective bargaining? Mandatory
By rank, how broad is the scope of collective bargaining? 37th
Automatic revenue streams What is the unions’ legal right to automatically collect agency fees from non-members and/or collect member dues via automatic payroll deductions?
Permitted
Right to strike What is the legal status of teacher strikes? Prohibited
AREA 4:STATE POLICIES
Performance pay Does the state support performance pay for teachers? Required for all teachers
Retirement By rank, what is the employer- versus employee-contribution rate to the teacher pension system? **
Evaluations What is the maximum potential consequence for veteran teachers who receive unsatisfactory evaluation(s)?
Eligible for dismissal
Is classroom effectiveness included in teacher evaluations? If so, how is it weighted? Required; Preponderant criterion
Terms of employment How long before a teacher earns tenure? Five years
Is student/teacher performance considered in tenure decisions? If so, how is it weighted? Required; Preponderant criterion
Is seniority considered in teacher layoff decisions? If so, how is it weighted? Optional; May be considered among other factors
Is teacher performance included in teacher layoff decisions? If so, how is it weighted? Required; Considered among other factors
By rank, what percentage of the teaching workforce was dismissed due to poor performance? 36th
Class size Is class size restricted for grades 1-3? If so, is the restriction higher or lower than the national average (20)?
No restriction
MICHIGAN RANKINGS BY AREA AND INDICATOR
6*
4*
22
51

Overall Rank: 16thTier 2 (Strong)
MICHIGAN
Area and Rank General Indicator Sub-IndicatorSub-Indicator Rank/Status
AREA 4:STATE POLICIES
(cont.)
Charter school structural limitations
Is there a cap (limit) placed on the number of charter schools that can operate in the state (or other jurisdiction) and/or on the number of students who can attend charter schools?
State cap with ample room for growth
Does the state allow a variety of charter schools: start-ups, conversions, and virtual schools? Start-ups and virtual schools only
How many charter authorizing options exist? How active are those authorizers? Two or more active/available options
Charter school exemptions Are all charter schools automatically exempt from state laws and state/district regulations (except those that safeguard students and fiscal accountability)? If not, are they eligible for exemptions?
No; Schools can apply for exemptions
Are all charter schools automatically exempt from state teacher-certification requirements? If not, are they eligible for exemptions?
No; Schools cannot apply for exemptions
Are all charter schools automatically exempt from collective bargaining agreements (CBAs)? If not, are they eligible for exemptions?
Yes
AREA 5:PERCEIVED INFLUENCEc
Relative influence of teacher unions
How do you rank the influence of teacher unions on education policy compared with other influential entities?
Second- or third-most influential
Influence over campaigns On a scale from always to never, how often do Democratic candidates need teacher-union support to get elected?
Often/Always
On a scale from always to never, how often do Republican candidates need teacher-union support to get elected?
Never/Rarely
Influence over spending To what extent, from strongly agree to strongly disagree, do you agree that even in times of cutbacks, teacher unions are effective in protecting dollars for education?
Agree
Given recent budgetary constraints, would you say that teacher unions generally make concessions to prevent reductions in pay and benefits or fight hard to prevent those reductions?
Fight
Influence over policy To what extent, from strongly agree to strongly disagree, do you agree that teacher unions ward off proposals in your state with which they disagree?
Neutral
On a scale from always to never, how often do existing state education policies reflect teacher-union priorities?
Sometimes
To what extent, from totally in line to not at all in line, were state education policies proposed by the governor during your state’s latest legislative session in line with teacher-union priorities?
Not at all/Mostly not in line
To what extent, from totally in line to not at all in line, were legislative outcomes of your state’s latest legislative session in line with teacher-union priorities?
Mostly not in line/Somewhat in line
Influence over key stakeholders
On a scale from always to never, how often have the priorities of state education leaders aligned with teacher-union positions in the past three years?
Sometimes/Often
Would you say that teacher unions typically compromise with policymakers to ensure that their preferred policies are enacted, or typically need not make concessions?
Does not generally concede
* Tied with another state
** Insufficient data; see Appendix A.
a Area ranks are calculated using a weighted average of sub-indicators. For a more detailed description, see Appendix A.
b Where possible, we report a state’s rank as compared to other states on a given metric. For example, out of 51 states, Michigan has the 14th-highest percentage of teachers who are union members. Otherwise, we report a status: Michigan has mandatory collective bargaining, and union agency fees are permitted. For a more detailed description of our metrics and methodology, see Appendix A. To request the raw data for your state, send an email to [email protected].
c For all survey questions, stakeholders were asked specifically about teacher unions, candidates, policies, and leaders in their state. In addition, we asked about unions and policies in the “current legislative session,” but because legislative calendars vary from state to state, responses refer to policies proposed and enacted within the 2010-11 window.
51
20

Overall Rank: 16thTier 2 (Strong)
MICHIGAN
ENDNOTES
1 A state’s overall rank is calculated as follows: First, we score it on multiple sub-indicators (sub-indicator data and scores for Michigan are shown in the table, Michigan Rankings by Area and Indicator). Second, we take a weighted average of the sub-indicators in each of five areas. In each area, we use that average to place the states in rank order: For example, in Area 1: Resources and Membership, Michigan is ranked 6th of 51 based on the weighted average of its sub-indicators. To generate the state’s overall rank, we average the five area ranks together, then re-order the states. For a more detailed description of data sources and methodology, see Appendix A.
2 Readers should note that these figures include only direct donations from unions and union-connected PACs, but not their spending on electioneering/advertising, mobilizing the union’s own membership, lobbying, or advocacy. A recent Wall Street Journal report found that donations and lobbying activities account for a small share of union political spending compared with their expenditures on member mobilization and advocacy. Even the AFT agreed, making the argument that since its mission is organizing and activism, it will naturally spend significant amounts on these activities. Thus, the percentages we report here are extremely conservative representations of what unions actually spend on politics. For more information, see Appendix A, Area 2; Tom McGinty and Brody Mullins, “Political Spending by Unions Far Exceeds Direct Donations,” Wall Street Journal, July 10, 2012; and Jeff Hauser, “Wall Street Journal Compares Union Political Spending to Corporate Donations,” AFL-CIO, July 10, 2012.
3 At the time of publication, the 2000 conventions were the most recent for which such detailed data were available in forms that met rigorous standards. However, 2008 data provided by the Democratic National Convention were highly correlated with the reliable figures from 2000.
4 We asked stakeholders about unions and policies in the “current legislative session,” but because legislative calendars vary from state to state, responses refer to policies proposed and enacted within the 2010-11 window.
5 Nathan Bomey, “Rick Snyder, Virg Bernero Will Test Voters’ Opinions On Organized Labor, Outsourcing,” Annarbor.com, August 5, 2010, http://ww.annarbor.com/elections/rick-snyder-virg-bernero-will-test-voters-opinions-on-organized-labor-outsourcing/.
6 Evan Rohar, “Michigan Unions And Poor Face 85 Hostile Laws,” Labor Notes, October 26, 2011, http://labornotes.org/2011/10/michigan-unions-and-poor-face-85-hostile-laws.
7 John Rummel, “Michigan Warning: Republican Extremism Goes Too Far,” People’s World, December 16, 2011, http://peoplesworld.org/michigan-warning-republican-extremism-goes-too-far/.
8 “Anti-Collective Bargaining And Tenure Bills Enactment,” AFT Michigan, August 16, 2011, http://aftmichigan.org/files/tenure-cb-pkg2011.pdf.
9 “Local Government And School District Fiscal Accountability Emergency Manager,” AFT Michigan, April 20, 2011, http://aftmichigan.org/files/emergencymanager.pdf.
10 Simone Landon, “Public Act 4, Michigan Emergency Manager Law, Marks First Anniversary,” HuffingtonPost.com, March 16, 2012, http://www.huffingtonpost.com/2012/03/16/public-act-4-michigan-emergency-manager-law-anniversary_n_1353510.html.
11 Associated Press, “Emergency Manager Roy Roberts To Impose 10 Percent Wage Cuts In Detroit Public Schools,” July 29, 2011, http://www.mlive.com/news/detroit/index.ssf/2011/07/emergency_manager_roy_roberts.html.
12 Simone Landon, “Detroit To Close 9 Schools, Convert 4 To Charters,” HuffingtonPost.com, February 8, 2012, http://www.huffingtonpost.com/2012/02/08/detroit-school-closings_n_1263165.html.
13 Dave Murray, “Michigan Rising Ending Effort To Recall Gov. Snyder, Looks To Form Progressive Think Tank,” MLive.com, June 7, 2012, http://www.mlive.com/politics/index.ssf/2012/06/michigan_rising_ending_effort.html.

Overall Rank: 14thTier 2 (Strong)
MINNESOTA
IntroductionPart IV: Taking a Closer Look–Teacher Union Influence Area
AREA 1: RESOURCES AND MEMBERSHIP
TIED FOR 3RD
Minnesota’s merged NEA-AFT affiliate and
its members benefit from both substantial
resources and relatively generous state
spending on K–12 education. Indeed,
95.7 percent of teachers are unionized
in the North Star State, the 9th-highest
rate among all 51 jurisdictions. The state
union brings in $582 per teacher in the
state (15th). Further, 23.3 percent of state
expenditures go to K–12 education (13th),
and Minnesota teachers see a substantial
amount of the $11,471 spent per pupil
(24th) allocated to their salaries and
benefits (59.3 percent; 3rd).
AREA 2: INVOLVEMENT IN POLITICS2
TIED FOR 32ND
Despite its financial resources, Minnesota’s
teacher unions were less involved in the
last decade of state politics than were their
counterparts in most other states.3 Their
donations to candidates for state office
amounted to just 0.46 percent of the total
(30th); these contributions constituted
2.5 percent of the donations to candidates
from the ten highest-contributing sectors
in the state (39th). A relatively higher
proportion—2.2 percent—of total donations
to state political parties came from
Minnesota teacher unions (13th). The union
voice at the Democratic and Republican
national conventions was also quieter than
in most other states, with 9.4 percent of
Minnesota delegates identifying as teacher
union members (34th).4
MINNESOTA OVERALL RANK: 14TH1
TIER 2 (STRONG)
STRONGER WEAKER
1. RESOURCES AND MEMBERSHIP
OVERALL
2. INVOLVEMENT IN POLITICS
3. SCOPE OF BARGAINING
4. STATE POLICIES
5. PERCEIVED INFLUENCE
14
32
46
3
19
2

Overall Rank: 14thTier 2 (Strong)
MINNESOTA
AREA 3: SCOPE OF BARGAINING
2ND
Minnesota is one of thirty-two states that
require collective bargaining, and its laws
give unions a wider scope of bargaining
(and more organizational prerogatives)
than in every other state save California.
Minnesota requires seven items to be
bargained (wages, hours, terms and
conditions of employment, grievance
procedures, fringe benefits, class size, and
length of teacher planning periods) and
permits another two (management rights
and pension/retirement benefits). State
law is silent on the remaining twelve items,
implicitly including them in the scope of
bargaining. Further, Minnesota allows its
unions to collect agency fees from non-
member teachers (a key source of union
revenue) and is one of only twelve states
where teachers explicitly possess the right
to strike.
AREA 4: STATE POLICIES
TIED FOR 46TH
While Minnesota’s state teacher union
sees abundant resources and permissive
bargaining laws, it also faces many state-
level policies that do not align with
traditional union interests. Minnesota
permits performance pay and requires
that student achievement significantly
informs teacher evaluations (but not
tenure decisions). Further, the state’s
charter laws—the oldest in the land—run
decidedly counter to the union preference
for limiting the expansion and autonomy
of such schools. Minnesota does not cap
the number of charters; permits new,
conversion, and virtual schools; and
provides multiple authorizing options.
Charters are also automatically exempt
from collective bargaining agreements,
district regulations, and state laws, except
for those related to teacher certification.
AREA 5: PERCEIVED INFLUENCE
19TH
Despite the adverse policies, Minnesota
stakeholders rate their union as more
influential than do stakeholders in many
other states. Along with the business
roundtable/chamber of commerce, they
place the union as the most influential
entity in shaping education policy. They
further note that it not only fought hard
to prevent reductions in pay and benefits,
but also that it is effective in protecting
dollars for education. On the other
hand, they report that state policies only
sometimes reflect union interests and that
outcomes of the latest legislative session
were only somewhat in line with teacher
union priorities.5 Perhaps this is because, as
survey respondents indicate, the priorities
of the current state education chief and
board of education are only sometimes
aligned with teacher union priorities.
OVERALL
14TH
Minnesota’s teacher union is strong in
terms of resources and membership, and
the state has generous bargaining laws
that favor unions. While its union has a
reputation for strength, it does not have
many present-day allies in state politics and
the current policy environment is one of the
most union-unfriendly in the nation (and
with union rights under constant attack,
may become even less friendly in the near
future—see sidebar).

Overall Rank: 14thTier 2 (Strong)
MINNESOTA
Minnesota is one of the only states in the Midwest where the governor is not mired in intense clashes with public unions. In 2012, Democrat Mark Dayton vetoed two GOP-sponsored measures that would have severely limited collective bargaining rights for teachers. In his veto letter of HF 1974, Dayton affirmed his position: “The Legislature is well aware that I have opposed, and will continue to oppose, unilateral changes to the collective bargaining process.”6 He also vetoed a 2012 bill requiring districts to base layoffs on teacher performance and not seniority, calling it another in a series of proposals that are “anti-public schools, anti-public school teachers, or anti-collective bargaining rights.”7 To circumvent the governor, House Republicans began discussion of a constitutional amendment to make Minnesota a right-to-work state—an amendment that the voters, not the governor, would decide. But against heavy lobbying from the state’s labor unions, the amendment never got off the ground (although the idea itself still has supporters in both the House and Senate).8
When it comes to the budget, however, Dayton takes less of a pro-union hard line. In an attempt to pave the way for later bipartisan compromise on the 2011 budget, he signed a Republican-backed (and union-opposed) bill that authorized alternative licensure options for nontraditional and mid-career teachers.9 But no such compromise resulted, and to break a budget deadlock and a twenty-day government shutdown, Dayton agreed to Republican demands and took tax increases for the wealthy and for corporations completely off the table (despite the contributions of Education Minnesota, the state’s NEA-AFT affiliate, which helped fund a $1 million campaign in support of Dayton’s original plan).10,11 Without the revenue from tax increases, and to the immense frustration of education leaders, the state delayed already-overdue payments to school districts.12 And it looks like lawmakers aren’t done with licensure yet either; in 2012 they enacted a bill that requires more stringent testing for new teachers. But for Education Minnesota, these defeats are small potatoes compared to the averted-for-now crisis of the elimination of teacher bargaining rights. For that, the NEA repaid Dayton in July 2012 by naming him “America’s Greatest Education Governor.”
SHELTER FROM THE STORM

Overall Rank: 14thTier 2 (Strong)
MINNESOTA
OVERALL RANK: 14TH
Area and Ranka General Indicator Sub-IndicatorSub-Indicator Rank/Statusb
AREA 1: RESOURCES & MEMBERSHIP
Membership By rank, what percentage of public-school teachers in the state are union members? 9th
Revenue By rank, what is the total yearly revenue (per teacher in the state) of the state-level NEA and/ or AFT affiliate(s)?
15th
Spending on education By rank, what percentage of state expenditures (of state general funds, state restricted funds, state bonds, and federal “pass-through” funds) is directed to K-12 education?
13th
By rank, what is the total annual per-pupil expenditure (of funds from federal, state, and local sources) in the state?
24th
By rank, what percentage of total annual per-pupil expenditures is directed to teacher salaries and benefits?
3rd
AREA 2: INVOLVEMENTIN POLITICS
Contributions to candidates and political parties
By rank, what percentage of the total contributions to state candidates was donated by teacher unions?
30th
By rank, what percentage of the total contributions to state-level political parties was donated by teacher unions?
13th
Industry influence By rank, what percent of the contributions to state candidates from the ten highest-giving sectors was donated by teacher unions?
39th
Status of delegates By rank, what percentage of the state’s delegates to the Democratic and Republican conventions were members of teacher unions?
34th
AREA 3:SCOPE OF BARGAINING
Legal scope of bargaining What is the legal status of collective bargaining? Mandatory
By rank, how broad is the scope of collective bargaining? 4th*
Automatic revenue streams What is the unions’ legal right to automatically collect agency fees from non-members and/or collect member dues via automatic payroll deductions?
Permitted
Right to strike What is the legal status of teacher strikes? Permitted
AREA 4:STATE POLICIES
Performance pay Does the state support performance pay for teachers? State supports/encourages
Retirement By rank, what is the employer- versus employee-contribution rate to the teacher pension system? 39th
Evaluations What is the maximum potential consequence for veteran teachers who receive unsatisfactory evaluation(s)?
Teacher improvement plan
Is classroom effectiveness included in teacher evaluations? If so, how is it weighted? Required; Significantly informs evaluation
Terms of employment How long before a teacher earns tenure? Three years
Is student/teacher performance considered in tenure decisions? If so, how is it weighted? Not included
Is seniority considered in teacher layoff decisions? If so, how is it weighted? Required; Considered among other factors
Is teacher performance included in teacher layoff decisions? If so, how is it weighted? Not required
By rank, what percentage of the teaching workforce was dismissed due to poor performance? 49th
Class size Is class size restricted for grades 1-3? If so, is the restriction higher or lower than the national average (20)?
No restriction
MINNESOTA RANKINGS BY AREA AND INDICATOR
3*
32*
2
46*

Overall Rank: 14thTier 2 (Strong)
MINNESOTA
Area and Rank General Indicator Sub-IndicatorSub-Indicator Rank/Status
AREA 4:STATE POLICIES
(cont.)
Charter school structural limitations
Is there a cap (limit) placed on the number of charter schools that can operate in the state (or other jurisdiction) and/or on the number of students who can attend charter schools?
No state cap
Does the state allow a variety of charter schools: start-ups, conversions, and virtual schools? Yes
How many charter authorizing options exist? How active are those authorizers? Two or more active/available options
Charter school exemptions Are all charter schools automatically exempt from state laws and state/district regulations (except those that safeguard students and fiscal accountability)? If not, are they eligible for exemptions?
Yes
Are all charter schools automatically exempt from state teacher-certification requirements? If not, are they eligible for exemptions?
No; Schools cannot apply for exemptions
Are all charter schools automatically exempt from collective bargaining agreements (CBAs)? If not, are they eligible for exemptions?
Yes
AREA 5:PERCEIVED INFLUENCEc
Relative influence of teacher unions
How do you rank the influence of teacher unions on education policy compared with other influential entities?
Second- or third-most influential
Influence over campaigns On a scale from always to never, how often do Democratic candidates need teacher-union support to get elected?
Often/Always
On a scale from always to never, how often do Republican candidates need teacher-union support to get elected?
Rarely
Influence over spending To what extent, from strongly agree to strongly disagree, do you agree that even in times of cutbacks, teacher unions are effective in protecting dollars for education?
Agree
Given recent budgetary constraints, would you say that teacher unions generally make concessions to prevent reductions in pay and benefits or fight hard to prevent those reductions?
Fight
Influence over policy To what extent, from strongly agree to strongly disagree, do you agree that teacher unions ward off proposals in your state with which they disagree?
Agree
On a scale from always to never, how often do existing state education policies reflect teacher-union priorities?
Sometimes/Often
To what extent, from totally in line to not at all in line, were state education policies proposed by the governor during your state’s latest legislative session in line with teacher-union priorities?
Somewhat/Mostly in line
To what extent, from totally in line to not at all in line, were legislative outcomes of your state’s latest legislative session in line with teacher-union priorities?
Somewhat in line
Influence over key stakeholders
On a scale from always to never, how often have the priorities of state education leaders aligned with teacher-union positions in the past three years?
Rarely/Sometimes
Would you say that teacher unions typically compromise with policymakers to ensure that their preferred policies are enacted, or typically need not make concessions?
Does not generally concede
* Tied with another state
a Area ranks are calculated using a weighted average of sub-indicators. For a more detailed description, see Appendix A.
b Where possible, we report a state’s rank as compared to other states on a given metric. For example, out of 51 states, Minnesota has the 9th-highest percentage of teachers who are union members. Otherwise, we report a status: Minnesota has mandatory collective bargaining, and union agency fees are permitted. For a more detailed description of our metrics and methodology, see Appendix A. To request the raw data for your state, send an email to [email protected]. c For all survey questions, stakeholders were asked specifically about teacher unions, candidates, policies, and leaders in their state. In addition, we asked about unions and policies in the “current legislative session,” but because legislative calendars vary from state to state, responses refer to policies proposed and enacted within the 2010-11 window.
46*
19

Overall Rank: 14thTier 2 (Strong)
MINNESOTA
ENDNOTES
1 A state’s overall rank is calculated as follows: First, we score it on multiple sub-indicators (sub-indicator data and scores for Minnesota are shown in the table, Minnesota Rankings by Area and Indicator). Second, we take a weighted average of the sub-indicators in each of five areas. In each area, we use that average to place the states in rank order: For example, in Area 1: Resources and Membership, Minnesota is ranked 3rd of 51 based on the weighted average of its sub-indicators. To generate the state’s overall rank, we average the five area ranks together, then re-order the states. For a more detailed description of data sources and methodology, see Appendix A.
2 Readers should note that these figures include only direct donations from unions and union-connected PACs, but not their spending on electioneering/advertising, mobilizing the union’s own membership, lobbying, or advocacy. A recent Wall Street Journal report found that donations and lobbying activities account for a small share of union political spending compared with their expenditures on member mobilization and advocacy. Even the AFT agreed, making the argument that since its mission is organizing and activism, it will naturally spend significant amounts on these activities. Thus, the percentages we report here are extremely conservative representations of what unions actually spend on politics. For more information, see Appendix A, Area 2; Tom McGinty and Brody Mullins, “Political Spending by Unions Far Exceeds Direct Donations,” Wall Street Journal, July 10, 2012; and Jeff Hauser, “Wall Street Journal Compares Union Political Spending to Corporate Donations,” AFL-CIO, July 10, 2012.
3 While our overall metric reports the strength of state teacher unions, this area also captures contributions to state campaigns and parties from national unions and local union affiliates. Typically, the total contributions from each are much smaller than the donations from the state unions. But in Minnesota’s case, local unions in Minneapolis and St. Paul together gave as much to state politics as did the state-level union.
4 At the time of publication, the 2000 conventions were the most recent for which such detailed data were available in forms that met rigorous standards. However, 2008 data provided by the Democratic National Convention were highly correlated with the reliable figures from 2000.
5 We asked stakeholders about unions and policies in the “current legislative session,” but because legislative calendars vary from state to state, responses refer to policies proposed and enacted within the 2010-11 window.
6 Office of Governor Mark Dayton, press release, April 12, 2012, http://mn.gov/governor/images/Ch_245_HF1974_veto-attach.pdf.
7 Jon Collins, “Dayton Vetoes Bill That Would Weaken Teacher Seniority,” Minnesota Public Radio, May 3, 2012, http://minnesota.publicradio.org/display/web/2012/05/03/teacher-seniority-bill-veto/.
8 Tom Scheck, “House Forced To Deal With Right-To-Work Amendment,” Minnesota Public Radio, April 27, 2012, http://minnesota.publicradio.org/collections/special/columns/polinaut/archive/2012/04/house_forced_to.shtml.
9 Tim Pugmire, “Dayton Signs Minn. Teacher License Bill Into Law,” Minnesota Public Radio, March 7, 2011, http://minnesota.publicradio.org/display/web/2011/03/07/teacher-licensure/.
10 “U.S. State Of Minnesota Ends Longest Government Shutdown,” People’s Daily Online, July 21, 2011, http://english.peopledaily.com.cn/90001/90777/90852/7447021.html.http://www.startribune.com/opinion/otherviews/125667103.html?page=1&c=y
11 David Taintor, “Furloughed In Minnesota – The Story Of One State Worker,” TPM.com, July 11, 2011, http://tpmdc.talkingpointsmemo.com/2011/07/how-minnesotas-government-shutdown-is-affecting-one-laid-off-state-employee.php.
12 Tom Weber, “Budget Deal Draws Criticism From Education Officials,” Minnesota Public Radio, July 14, 2011, http://minnesota.publicradio.org/display/web/2011/07/14/shutdown-budget-education-reaction/.

Overall Rank: 46thTier 5 (Weakest)
MISSISSIPPI
IntroductionPart IV: Taking a Closer Look–Teacher Union Influence Area
AREA 1: RESOURCES AND MEMBERSHIP
49TH
Mississippi’s teacher unions face low
membership and a dearth of resources.
With just 36.8 percent of all teachers
unionized, the Magnolia State posts the
3rd-lowest unionization rate nationwide. A
smaller percentage of Mississippi teachers
are unionized than in twelve of the other
thirteen states in which bargaining is
permitted (and smaller even than in four
of the five states in which bargaining is
illegal). Mississippi’s NEA and AFT affiliates
bring only $89 in revenue per teacher in
the state (48th out of 51 jurisdictions).
Spending on education is low in Mississippi,
too: Just 17.0 percent of state expenditures
go toward K–12 education (38th) and,
of the annual $9,708 spent per pupil (a
combination of local, state, and federal
funds; 39th), only 53.5 percent goes toward
teacher salaries and benefits (31st).
AREA 2: INVOLVEMENT IN POLITICS2
TIED FOR 40TH
Mississippi’s teacher unions are less
involved in state-level political campaigns
than their counterparts in most other
states. In the past decade, their donations
amounted to only 0.14 percent of total
contributions received by candidates for
state office (48th). Their share of donations
to state political parties was equally small
(just 0.07 percent, also 48th). These
limited financial donations are somewhat
offset by the fairly high percentage of
Mississippi delegates to the Democratic
and Republican national conventions who
identified as teacher union members (18.8
percent; 11th).3
MISSISSIPPI OVERALL RANK: 46TH1
TIER 5 (WEAKEST)
STRONGER WEAKER
1. RESOURCES AND MEMBERSHIP
OVERALL
2. INVOLVEMENT IN POLITICS
3. SCOPE OF BARGAINING
4. STATE POLICIES
5. PERCEIVED INFLUENCE
46
40
7
49
51
43

Overall Rank: 46thTier 5 (Weakest)
MISSISSIPPI
AREA 3: SCOPE OF BARGAINING
TIED FOR 43RD
Mississippi does not address collective
bargaining in education, neither prohibiting
nor requiring it (and consequently all
twenty-one contract items examined in
this report are implicitly within the scope
of bargaining). However, the law does
specifically prohibit teacher strikes. Further,
teacher unions fall under the purview of
state labor laws, which bar any union from
automatically collecting agency fees from
non-members.
AREA 4: STATE POLICIES
TIED FOR 7TH
Despite other indications that its teacher
unions are weak, Mississippi policies are
more closely aligned with traditional union
interests than in nearly every other state.4
Mississippi grants tenure after only one
year—the only state to do so that quickly
(the national norm is three years); further,
student learning is not a criterion in tenure
decisions. Districts may decide their own
standards for layoffs (with no requirement
that teacher performance be included), and
there are no articulated consequences for
unsatisfactory evaluations. Further, when
we calculated our metric, the state did not
require that student achievement factor
into teacher evaluations. (At press time,
however, Mississippi had approved—but
not yet implemented—a policy requiring
that student achievement on state tests
comprise half of a teacher’s evaluation.)
Charter laws are equally favorable to
union positions (see sidebar): The state
has a tight cap on charters with no room
for growth, and allows only conversion
charters, not start-ups or virtual charter
schools. Nor does it exempt charter
schools from state teacher certification
requirements or district collective
bargaining agreements. Further, the state
board of education is the sole authorizer,
and can convert a failing district school to
a charter only after a petition from parents
at that school. With these limited avenues
for authorizing, the state has only a single
charter school.5
AREA 5: PERCEIVED INFLUENCE
51ST
Mississippi stakeholders perceive their
teacher unions to be quite weak, indeed the
least influential in the nation. Respondents
rank their influence below that of the state
school board, the governor’s office, and
parent coalitions. They report that the
teacher unions are not effective in warding
off proposals with which they disagree or
in protecting dollars for education. Further,
they note that the positions of state
education leaders are only sometimes in
line with those of teachers unions, and that
Democrats only sometimes need teacher
union support to get elected—whereas
respondents in most states reported that
Democrats often or always need union
support.
OVERALL
46TH
Mississippi’s teacher unions are among
the least potent in the nation, ranking
alongside unions in states where bargaining
is prohibited. Membership is notably low.
The unions do not have a reputation for
strength among stakeholders, and do not
participate in state politics to a significant
degree. Yet Mississippi policies are well
aligned with union positions (especially in
comparison to its neighboring southern
states). Perhaps it is because these
policies are in place that the union is not
more active: many of its goals are already
realized (see sidebar).

Overall Rank: 46thTier 5 (Weakest)
MISSISSIPPI
The Mississippi Association of Educators (MAE) and AFT-Mississippi (AFT-MS) don’t have much to work with. Not only does Mississippi law stop unions from collecting agency fees, it also prevents them from automatically collecting dues from the paychecks of their own members.6 Then again, the MAE and AFT-MS don’t have that much to do, because teacher jobs in the Magnolia State are among the most secure in the nation, thanks to the state’s Education Employment Procedures Law. (That law and its predecessors date back the 1970s, a period of staunch Democratic leadership in the state, and give new meaning to “due process.”)7
Despite their self-defined primary roles as advocates, not political heavyweights, the MAE and AFT-MS have recently engaged in two major policy debates. First, Governor Phil Bryant is pressing districts hard to switch from seniority-based salary schedules to merit pay. Both associations are hesitant to support pay based on evaluations that use standardized test scores, and worry that the system may be punitive rather than productive.8 MAE president Kevin Gilbert doubts that merit pay is money well spent, pointing out that a better alternative is raising overall teacher pay in a state where educator salaries are, on average, the second-lowest in the nation.9 But the state’s achievement-based evaluation system, developed in order to improve the state’s chances of receiving an NCLB waiver, is still in its infancy, and it is unlikely that merit pay based on that system will find a foothold in the near future.10
Second, lawmakers sought to amend the state’s existing charter law with the Mississippi Public Charter Schools Act of 2012. While charter schools have been legal in Mississippi since 1997, because of the tight restrictions on authorizing, the state has only a single one. According to the Center for Education Reform (CER), the Magnolia State’s current law is one of the nation’s weakest. (The National Alliance for Public Charter Schools concurs.) It was passed only to increase the odds of winning money in the federal Race to the Top competition.11,12 The 2012 Charter Schools Act proposed to expand authorizing options, permit charters in all districts rather than only underperforming ones, allow new and virtual as well as conversion schools, and exempt charter teachers from state certification requirements and the Education Employment Procedures Law.13 The MAE took a hard line against the proposal, objecting that it would undermine due process for educators and allow uncertified, under-qualified teachers into high-needs classrooms. The measure later died in committee. While the resources of Mississippi’s teacher association are limited, their bully pulpit is not.
THE STRONG, SILENT TYPE

Overall Rank: 46thTier 5 (Weakest)
MISSISSIPPI
OVERALL RANK: 46TH
Area and Ranka General Indicator Sub-IndicatorSub-Indicator Rank/Statusb
AREA 1: RESOURCES & MEMBERSHIP
Membership By rank, what percentage of public-school teachers in the state are union members? 49th
Revenue By rank, what is the total yearly revenue (per teacher in the state) of the state-level NEA and/ or AFT affiliate(s)?
48th
Spending on education By rank, what percentage of state expenditures (of state general funds, state restricted funds, state bonds, and federal “pass-through” funds) is directed to K-12 education?
38th
By rank, what is the total annual per-pupil expenditure (of funds from federal, state, and local sources) in the state?
39th
By rank, what percentage of total annual per-pupil expenditures is directed to teacher salaries and benefits?
31st
AREA 2: INVOLVEMENTIN POLITICS
Contributions to candidates and political parties
By rank, what percentage of the total contributions to state candidates was donated by teacher unions?
48th
By rank, what percentage of the total contributions to state-level political parties was donated by teacher unions?
48th
Industry influence By rank, what percent of the contributions to state candidates from the ten highest-giving sectors was donated by teacher unions?
48th
Status of delegates By rank, what percentage of the state’s delegates to the Democratic and Republican conventions were members of teacher unions?
11th
AREA 3:SCOPE OF BARGAINING
Legal scope of bargaining What is the legal status of collective bargaining? Neither required nor prohibited
By rank, how broad is the scope of collective bargaining? 33rd*
Automatic revenue streams What is the unions’ legal right to automatically collect agency fees from non-members and/or collect member dues via automatic payroll deductions?
Agency fees prohibited
Right to strike What is the legal status of teacher strikes? Prohibited
AREA 4:STATE POLICIES
Performance pay Does the state support performance pay for teachers? State supports/encourages
Retirement By rank, what is the employer- versus employee-contribution rate to the teacher pension system? 34th
Evaluations What is the maximum potential consequence for veteran teachers who receive unsatisfactory evaluation(s)?
No consequences articulated
Is classroom effectiveness included in teacher evaluations? If so, how is it weighted? Not required
Terms of employment How long before a teacher earns tenure? One year
Is student/teacher performance considered in tenure decisions? If so, how is it weighted? Not included
Is seniority considered in teacher layoff decisions? If so, how is it weighted? Optional; Weighted at district discretion
Is teacher performance included in teacher layoff decisions? If so, how is it weighted? Not required
By rank, what percentage of the teaching workforce was dismissed due to poor performance? 41st
Class size Is class size restricted for grades 1-3? If so, is the restriction higher or lower than the national average (20)?
Yes; Higher
MISSISSIPPI RANKINGS BY AREA AND INDICATOR
49
40*
43*
7*

Overall Rank: 46thTier 5 (Weakest)
MISSISSIPPI
Area and Rank General Indicator Sub-IndicatorSub-Indicator Rank/Status
AREA 4:STATE POLICIES
(cont.)
Charter school structural limitations
Is there a cap (limit) placed on the number of charter schools that can operate in the state (or other jurisdiction) and/or on the number of students who can attend charter schools?
State cap with no room for growth
Does the state allow a variety of charter schools: start-ups, conversions, and virtual schools? Conversions only
How many charter authorizing options exist? How active are those authorizers? Single option; No or limited activity
Charter school exemptions Are all charter schools automatically exempt from state laws and state/district regulations (except those that safeguard students and fiscal accountability)? If not, are they eligible for exemptions?
No; Schools can apply for exemptions
Are all charter schools automatically exempt from state teacher-certification requirements? If not, are they eligible for exemptions?
No; Schools cannot apply for exemptions
Are all charter schools automatically exempt from collective bargaining agreements (CBAs)? If not, are they eligible for exemptions?
No; Staff are exempt from state employment laws, not bargaining agreements
AREA 5:PERCEIVED INFLUENCEc
Relative influence of teacher unions
How do you rank the influence of teacher unions on education policy compared with other influential entities?
Fourth- or fifth-most influential
Influence over campaigns On a scale from always to never, how often do Democratic candidates need teacher-union support to get elected?
Sometimes
On a scale from always to never, how often do Republican candidates need teacher-union support to get elected?
Never/Rarely
Influence over spending To what extent, from strongly agree to strongly disagree, do you agree that even in times of cutbacks, teacher unions are effective in protecting dollars for education?
Disagree
Given recent budgetary constraints, would you say that teacher unions generally make concessions to prevent reductions in pay and benefits or fight hard to prevent those reductions?
Generally fight
Influence over policy To what extent, from strongly agree to strongly disagree, do you agree that teacher unions ward off proposals in your state with which they disagree?
Disagree
On a scale from always to never, how often do existing state education policies reflect teacher-union priorities?
Rarely/Sometimes
To what extent, from totally in line to not at all in line, were state education policies proposed by the governor during your state’s latest legislative session in line with teacher-union priorities?
Not at all/Mostly not in line
To what extent, from totally in line to not at all in line, were legislative outcomes of your state’s latest legislative session in line with teacher-union priorities?
Mostly not in line/Somewhat in line
Influence over key stakeholders
On a scale from always to never, how often have the priorities of state education leaders aligned with teacher-union positions in the past three years?
Sometimes/Often
Would you say that teacher unions typically compromise with policymakers to ensure that their preferred policies are enacted, or typically need not make concessions?
Compromise
* Tied with another state
a Area ranks are calculated using a weighted average of sub-indicators. For a more detailed description, see Appendix A.
b Where possible, we report a state’s rank as compared to other states on a given metric. For example, out of 51 states, Mississippi has the 49th-highest percentage of teachers who are union members. Otherwise, we report a status: In Mississippi, collective bargaining is neither required nor prohibited, and union agency fees are prohibited. For a more detailed description of our metrics and methodology, see Appendix A. To request the raw data for your state, send an email to [email protected]. c For all survey questions, stakeholders were asked specifically about teacher unions, candidates, policies, and leaders in their state. In addition, we asked about unions and policies in the “current legislative session,” but because legislative calendars vary from state to state, responses refer to policies proposed and enacted within the 2010-11 window.
7*
51

Overall Rank: 46thTier 5 (Weakest)
MISSISSIPPI
ENDNOTES
1 A state’s overall rank is calculated as follows: First, we score it on multiple sub-indicators (sub-indicator data and scores for Mississippi are shown in the table, Mississippi Rankings by Area and Indicator). Second, we take a weighted average of the sub-indicators in each of five areas. In each area, we use that average to place the states in rank-order: For example, in Area 1: Resources and Membership, Mississippi is ranked 49th of 51 based on the weighted average of its sub-indicators. To generate the state’s overall rank, we average the five area ranks together, then re-order the states. For a more detailed description of data sources and methodology, see Appendix A.
2 Readers should note that these figures include only direct donations from unions and union-connected PACs, but not their spending on electioneering/advertising, mobilizing the union’s own membership, lobbying, or advocacy. A recent Wall Street Journal report found that donations and lobbying activities account for a small share of union political spending compared with their expenditures on member mobilization and advocacy. Even the AFT agreed, making the argument that since its mission is organizing and activism, it will naturally spend significant amounts on these activities. Thus, the percentages we report here are extremely conservative representations of what unions actually spend on politics. For more information, see Appendix A, Area 2; Tom McGinty and Brody Mullins, “Political Spending by Unions Far Exceeds Direct Donations,” Wall Street Journal, July 10, 2012; and Jeff Hauser, “Wall Street Journal Compares Union Political Spending to Corporate Donations,” AFL-CIO, July 10, 2012.
3 At the time of publication, the 2000 conventions were the most recent for which such detailed data were available in forms that met rigorous standards. However, 2008 data provided by the Democratic National Convention were highly correlated with the reliable figures from 2000.
4 The presence of union-friendly policies in states with weak unions presents a conundrum (see main report). Mississippi’s unique political history serves as partial explanation. The Magnolia State was basically a one-party state until 1992, and Democrats led one if not both houses of the legislature until 2011. Still, Democrats in rural areas tend to be socially conservative and align their views with those of Republican presidential candidates, which is why observers tend to think of Mississippi as a “red state.” The state’s labor laws relative to teachers (who unionized in the mid 1960s) originated from an era of Democratic leadership.
5 Mississippi first enacted its original charter law in 1997, but lawmakers did not renew it before it lapsed in 2009. At that time, only one charter was in operation in the entire state, and it was a charter in name only (the school was part of its local district and did not have an independent board). When the 1997 law expired, the school was taken over completely by its district. Between 1997 and 2009, lawmakers discussed renewing and expanding the law but no bill ever passed, for reasons varying from fear of segregation and cherry-picking high performers to the diversion of money from district schools. A new law enacted in 2010 is nearly identical to the 1997 original. See Marquita Brown, “Charter School Law May Get Strengthened,” Hattiesburg American, January 11, 2009, http://www.hattiesburgamerican.com/article/20090112/NEWS01/901120318/Charter-school-law-may-get-strengthened.
6 Mississippi Association of Educators, http://maetoday.nea.org/images/ProductImage_34.pdf.
7 Ward Schaefer, “Teachers Fire Back At Film,” Jackson Free Press, November 10, 2010, http://www.jacksonfreepress.com/news/2010/nov/10/teachers-fire-back-at-film/. According to Rachel Hicks, executive director of the education advocacy organization Mississippi First, state law is equivalent to tenure, even if statute avoids that term. She elaborates: “Essentially, we have a system where if you breathe in a district for two consecutive years, you essentially cannot be fired unless you do something really bad that jeopardizes the health and welfare of your students. Even though we say we don’t have tenure, we have a shadow system of tenure.” (See also Note 4, above.)
8 Associated Press, “Governor Phil Bryant touting new attempt to pay teachers based on student performance,” Gulflive.com, July 28, 2012, accessed August 20, 2012, http://blog.gulflive.com/mississippi-press-news/2012/07/gov_phil_bryant_touting_new_at.html.
9 Ibid.
10 Annie Gilbertson, “Inside Mississippi Teacher Evaluations,” Mississippi Public Broadcasting, February 24, 2012, http://mpbonline.org/News/article/inside_mississippi_teacher_evaluations.
11 Alison Consoletti, ed., Charter School Laws Across the States, Center for Education Reform (Washington, D.C.: April 2012), http://www.edreform.com/wp-content/uploads/2012/04/CER_2012_Charter_Laws.pdf.
12 Todd Ziebarth, Measuring Up to the Model: A Ranking of State Public Charter School Laws, National Alliance for Public Charter Schools (Washington, D.C.: January 2012), http://www.publiccharters.org/data/files/Publication_docs/NAPCS_2012_StateLawRankings_Final_20120117T162953.pdf. Ziebarth, vice president at the National Alliance for Public Charter Schools and lead author of the report, explains: “Significant improvements are needed in every aspect of Mississippi’s law, most notably by allowing start-up charter schools and virtual charter schools, providing additional authorizing options for charter applicants, beefing up the law in relation to the model law’s four quality control components, increasing operational autonomy, and ensuring equitable operational funding and equitable access to capital funding and facilities.” See http://www.wdam.com/story/16535878/mississippi-charter-schools-rated-worst-in-the-nation.
13 “MAE Legislative Update,” Mississippi Association of Educators, March 9, 2012, http://maetoday.nea.org/News.asp?s=1&nid=74.

Overall Rank: 38thTier 4 (Weak)
MISSOURI
IntroductionPart IV: Taking a Closer Look–Teacher Union Influence Area
AREA 1: RESOURCES AND MEMBERSHIP
TIED FOR 33RD
Missouri’s teacher unions stand out neither
for their member-generated resources nor
for the level of education expenditures in
their state. Just 76.6 percent of Missouri
teachers are unionized, the 26th-highest
unionization rate across 51 jurisdictions
(although well above the average rate of
60.9 percent where bargaining is permitted
but not required). The Show Me State’s
state-level NEA and AFT affiliates bring in
$167 annually per teacher in the state (44th
of 51). While state spending on education
is relatively high (K–12 education accounts
for 21.7 percent of state expenditures; 15th),
overall per-pupil spending is moderate
($10,935 per year; 29th). Roughly 54
percent of total K–12 education dollars go
toward teacher salaries and benefits (28th).
AREA 2: INVOLVEMENT IN POLITICS2
TIED FOR 47TH
Missouri’s teacher unions are less involved
with state political campaigns than their
counterparts in nearly every other state. In
the past ten years, their direct donations
equaled only 0.25 percent of contributions
to candidates for state office (40th), and
0.39 percent of contributions to state
political parties (41st). Their presence at
the Democratic and Republican national
conventions was also minimal, with just 12.1
percent of Missouri delegates identifying as
teacher union members (31st).3
MISSOURI OVERALL RANK: 38TH1
TIER 4 (WEAK)
STRONGER WEAKER
1. RESOURCES AND MEMBERSHIP
OVERALL
2. INVOLVEMENT IN POLITICS
3. SCOPE OF BARGAINING
4. STATE POLICIES
5. PERCEIVED INFLUENCE
38
47
40
33
24
23

Overall Rank: 38thTier 4 (Weak)
MISSOURI
AREA 3: SCOPE OF BARGAINING
23RD
Missouri is one of three states that explicitly
permit—but not require—collective
bargaining by teachers (eleven other states
implicitly allow it by neither prohibiting
nor requiring it). However, few provisions
of collective bargaining are addressed
in state law: Of the twenty-one items
examined in our metric, two—wages and
terms and conditions of employment—must
be negotiated (should a district choose
to bargain at all). State statute does not
address the remaining nineteen. Unions
may automatically collect agency fees from
non-member teachers, but teacher strikes
are not allowed.
AREA 4: STATE POLICIES
40TH
Teacher employment and charter school
laws are less aligned with traditional union
interests in Missouri than in most other
states. Missouri is one of only eleven
states where districts must consider
teacher performance in determining which
teachers are laid off. It is also one of just
five states in which teachers must work
five years before receiving tenure (the
national norm is three), although it does
not require that student learning factor into
tenure decisions or teacher evaluations.
Unions typically oppose autonomy for
charter schools, but Missouri law grants
them partial exemptions from state laws
and teacher certification requirements,
and full exemption from district collective
bargaining agreements. The state also
permits new, conversion, and virtual charter
schools—although only in 2012 did the state
allow charters in districts other than Kansas
City and St. Louis.
AREA 5: PERCEIVED INFLUENCE
24TH
Stakeholders report that Missouri’s teacher
unions are active in shaping education
policy but do not dominate the process.
They indicate that the unions, along with
the state school board association and
association of school administrators, are all
influential in education policy. Respondents
note that the unions are effective in
warding off education proposals with which
they disagree, and that policies proposed
by the governor in the latest legislative
session were in line with union priorities,
although the outcomes of that session
were only somewhat in line.4 Finally, they
report that state education leaders are
only sometimes aligned with teacher union
priorities.
OVERALL
38TH
Missouri’s teacher unions do not distinguish
themselves across any of the areas of
strength examined in our metric, and the
state’s overall rank places it in the middle of
the fourteen bargaining-permitted states.
The state is one of only nine that did not
rank higher than 20th in any single area.

Overall Rank: 38thTier 4 (Weak)
MISSOURI
Unions in states seeking Race to the Top funding or NCLB waivers tend to find themselves on the defensive, and the Missouri National Education Association (MNEA) is no exception. At the close of the 2012 legislative session, its legislative director wrote, “MNEA defends public education against extremist attacks: Legislative leaders push extreme agenda and fail to act on real needs of students and educators.”5 Among the measures most offensive to the MNEA were proposals to eliminate tenure and “last in, first out” layoff policies, ensure that ineffective teachers were eligible for dismissal, require that at least half of every teacher’s evaluation be based on student test scores, and implement performance-based pay. After heavy amending, none of those measures passed—not because lawmakers didn’t want the reforms, but because House-Senate bickering and union-supported amendments left the bills without teeth.6,7,8 Despite the fact that it could not enact statewide teacher evaluation standards, however, Missouri secured a 2012 NCLB waiver after it agreed that districts would develop, pilot, and implement student-achievement-based systems locally.9
The legislature did manage to put politics aside and pass a bill expanding charter schools from St. Louis and Kansas City to all failing districts, despite MNEA’s opposition that they should be limited until the charter accountability system is improved (and until charter teachers receive due process rights).10 But with an NCLB waiver in their pocket, and state leaders who can’t seem to agree, Missouri’s teacher unions may be able to rest easy for awhile. At least until lawmakers take up discussions over tenure and evaluations again—which they’ve vowed to do.
DEFENSIVE PLAY

Overall Rank: 38thTier 4 (Weak)
MISSOURI
OVERALL RANK: 38TH
Area and Ranka General Indicator Sub-IndicatorSub-Indicator Rank/Statusb
AREA 1: RESOURCES & MEMBERSHIP
Membership By rank, what percentage of public-school teachers in the state are union members? 26th
Revenue By rank, what is the total yearly revenue (per teacher in the state) of the state-level NEA and/ or AFT affiliate(s)?
44th
Spending on education By rank, what percentage of state expenditures (of state general funds, state restricted funds, state bonds, and federal “pass-through” funds) is directed to K-12 education?
15th
By rank, what is the total annual per-pupil expenditure (of funds from federal, state, and local sources) in the state?
29th
By rank, what percentage of total annual per-pupil expenditures is directed to teacher salaries and benefits?
28th
AREA 2: INVOLVEMENTIN POLITICS
Contributions to candidates and political parties
By rank, what percentage of the total contributions to state candidates was donated by teacher unions?
40th
By rank, what percentage of the total contributions to state-level political parties was donated by teacher unions?
41st
Industry influence By rank, what percent of the contributions to state candidates from the ten highest-giving sectors was donated by teacher unions?
42nd
Status of delegates By rank, what percentage of the state’s delegates to the Democratic and Republican conventions were members of teacher unions?
31st
AREA 3:SCOPE OF BARGAINING
Legal scope of bargaining What is the legal status of collective bargaining? Permitted
By rank, how broad is the scope of collective bargaining? 29th*
Automatic revenue streams What is the unions’ legal right to automatically collect agency fees from non-members and/or collect member dues via automatic payroll deductions?
Permitted
Right to strike What is the legal status of teacher strikes? Prohibited
AREA 4:STATE POLICIES
Performance pay Does the state support performance pay for teachers? State-sponsored initiatives offered in select districts
Retirement By rank, what is the employer- versus employee-contribution rate to the teacher pension system? 42nd*
Evaluations What is the maximum potential consequence for veteran teachers who receive unsatisfactory evaluation(s)?
Teacher improvement plan
Is classroom effectiveness included in teacher evaluations? If so, how is it weighted? Not required
Terms of employment How long before a teacher earns tenure? Five years
Is student/teacher performance considered in tenure decisions? If so, how is it weighted? Not included
Is seniority considered in teacher layoff decisions? If so, how is it weighted? Optional; May be considered among other factors
Is teacher performance included in teacher layoff decisions? If so, how is it weighted? Required; Considered among other factors
By rank, what percentage of the teaching workforce was dismissed due to poor performance? 28th
Class size Is class size restricted for grades 1-3? If so, is the restriction higher or lower than the national average (20)?
Yes; Higher
MISSOURI RANKINGS BY AREA AND INDICATOR
33*
47*
23
40

Overall Rank: 38thTier 4 (Weak)
MISSOURI
Area and Rank General Indicator Sub-IndicatorSub-Indicator Rank/Status
AREA 4:STATE POLICIES
(cont.)
Charter school structural limitations
Is there a cap (limit) placed on the number of charter schools that can operate in the state (or other jurisdiction) and/or on the number of students who can attend charter schools?
State cap with limited room for growth
Does the state allow a variety of charter schools: start-ups, conversions, and virtual schools? Yes
How many charter authorizing options exist? How active are those authorizers? Two or more w/limited jurisdiction
Charter school exemptions Are all charter schools automatically exempt from state laws and state/district regulations (except those that safeguard students and fiscal accountability)? If not, are they eligible for exemptions?
Partially; Some automatic exemptions for all schools
Are all charter schools automatically exempt from state teacher-certification requirements? If not, are they eligible for exemptions?
Partially; All schools receive automatic exemptions for some teachers
Are all charter schools automatically exempt from collective bargaining agreements (CBAs)? If not, are they eligible for exemptions?
Yes
AREA 5:PERCEIVED INFLUENCEc
Relative influence of teacher unions
How do you rank the influence of teacher unions on education policy compared with other influential entities?
Second- or third-most influential
Influence over campaigns On a scale from always to never, how often do Democratic candidates need teacher-union support to get elected?
Often/Always
On a scale from always to never, how often do Republican candidates need teacher-union support to get elected?
Sometimes
Influence over spending To what extent, from strongly agree to strongly disagree, do you agree that even in times of cutbacks, teacher unions are effective in protecting dollars for education?
Neutral
Given recent budgetary constraints, would you say that teacher unions generally make concessions to prevent reductions in pay and benefits or fight hard to prevent those reductions?
Sometimes concede, sometimes fight
Influence over policy To what extent, from strongly agree to strongly disagree, do you agree that teacher unions ward off proposals in your state with which they disagree?
Agree
On a scale from always to never, how often do existing state education policies reflect teacher-union priorities?
Often
To what extent, from totally in line to not at all in line, were state education policies proposed by the governor during your state’s latest legislative session in line with teacher-union priorities?
Mostly/Totally in line
To what extent, from totally in line to not at all in line, were legislative outcomes of your state’s latest legislative session in line with teacher-union priorities?
Mostly not in line/Somewhat in line
Influence over key stakeholders
On a scale from always to never, how often have the priorities of state education leaders aligned with teacher-union positions in the past three years?
Sometimes
Would you say that teacher unions typically compromise with policymakers to ensure that their preferred policies are enacted, or typically need not make concessions?
Sometimes compromise, sometimes do not need to concede
* Tied with another state
a Area ranks are calculated using a weighted average of sub-indicators. For a more detailed description, see Appendix A.
b Where possible, we report a state’s rank as compared to other states on a given metric. For example, out of 51 states, Missouri has the 26th-highest percentage of teachers who are union members. Otherwise, we report a status: In Missouri, collective bargaining is permitted, and union agency fees are also permitted. For a more detailed description of our metrics and methodology, see Appendix A. To request the raw data for your state, send an email to [email protected].
c For all survey questions, stakeholders were asked specifically about teacher unions, candidates, policies, and leaders in their state. In addition, we asked about unions and policies in the “current legislative session,” but because legislative calendars vary from state to state, responses refer to policies proposed and enacted within the 2010-11 window.
40
24

Overall Rank: 38thTier 4 (Weak)
MISSOURI
ENDNOTES
1 A state’s overall rank is calculated as follows: First, we score it on multiple sub-indicators (sub-indicator data and scores for Missouri are shown in the table, Missouri Rankings by Area and Indicator). Second, we take a weighted average of the sub-indicators in each of five areas. In each area, we use that average to place the states in rank order: For example, in Area 1: Resources and Membership, Missouri is ranked 33rd of 51 based on the weighted average of its sub-indicators. To generate the state’s overall rank, we average the five area ranks together, then re-order the states. For a more detailed description of data sources and methodology, see Appendix A.
2 Readers should note that these figures include only direct donations from unions and union-connected PACs, but not their spending on electioneering/advertising, mobilizing the union’s own membership, lobbying, or advocacy. A recent Wall Street Journal report found that donations and lobbying activities account for a small share of union political spending compared with their expenditures on member mobilization and advocacy. Even the AFT agreed, making the argument that since its mission is organizing and activism, it will naturally spend significant amounts on these activities. Thus, the percentages we report here are extremely conservative representations of what unions actually spend on politics. For more information, see Appendix A, Area 2; Tom McGinty and Brody Mullins, “Political Spending by Unions Far Exceeds Direct Donations,” Wall Street Journal, July 10, 2012; and Jeff Hauser, “Wall Street Journal Compares Union Political Spending to Corporate Donations,” AFL-CIO, July 10, 2012.
3 At the time of publication, the 2000 conventions were the most recent for which such detailed data were available in forms that met rigorous standards. However, 2008 data provided by the Democratic National Convention were highly correlated with the reliable figures from 2000.
4 We asked stakeholders about unions and policies in the “current legislative session,” but because legislative calendars vary from state to state, responses refer to policies proposed and enacted within the 2010-11 window.
5 Otto Fajen, “MNEA Defends Public Education Against Extremist Attacks,” Missouri National Education Association, accessed August 30, 2012, http://www.mnea.org/Missouri/News/MNEA_defends_public_education_against_extremist_at_268.aspx.
6 Ibid. See also Otto Fajen, “Legislative Update,” Missouri National Education Association, May 25, 2012, http://www.mnea.org/Uploads/Public/Documents/Capitol/LegUpdates/2012/19-May25.pdf.
7 Virginia Young, “Pressure Builds For Teacher Tenure Reform,” St. Louis Post-Dispatch, April 8, 2012, http://www.stltoday.com/news/local/education/pressure-builds-for-teacher-tenure-reform/article_ad0134b0-0e8b-5a75-8222-294e43da6c5c.html.
8 Elisa Crouch, “Missouri To Develop New Teacher Evaluation Tool,” St. Louis Post-Dispatch, April 4, 2012, http://www.stltoday.com/news/local/education/missouri-to-develop-new-teacher-evaluation-tool/article_25b7c53c-9cc4-52ba-a831-f252f67b6c08.html.
9 “ESEA Flexibility Requests and Related Documents,” U.S. Department of Education, accessed September 4, 2012, http://www.ed.gov/esea/flexibility/requests.
10 Fajen.

Overall Rank: 3rdTier 1 (Strongest)
MONTANA
IntroductionPart IV: Taking a Closer Look–Teacher Union Influence Area
AREA 1: RESOURCES AND MEMBERSHIP
TIED FOR 20TH
Though Montana’s single state teacher
union derives a substantial amount of
internal resources from its own members,
it does not see much funding from the
state. A total of 82.6 percent of Montana
teachers are unionized, the 23rd-highest
membership rate across 51 states. And the
merged NEA-AFT state-level affiliate brings
in $814 annually per Montana teacher (5th
of 51). But while overall K–12 education
spending is high (local, state, and federal
funds amount to $13,773 per pupil per
year, 10th-highest), only 51.1 percent of
those funds go toward teacher salaries and
benefits (44th). Montana itself does not
allot a large proportion of its expenditures
to K–12 education—just 15.3 percent (43rd).
AREA 2: INVOLVEMENT IN POLITICS2
TIED FOR 10TH
While state politics in Montana was not
a big-money game in the past decade,
Montana’s teacher unions were among the
more active players (and played a bigger
role than their counterparts in many other
states).3 Contributions from the unions
accounted for 2.7 percent of the donations
to political parties in the Treasure State
(10th). Even though their donations to
candidates for state office did not add
much to candidates’ overall totals (0.2
percent came from unions; 44th), about $1
out of every $10 given to candidates by the
ten highest-giving sectors in the state came
from teacher unions (15th). They also had a
non-monetary presence: 22.4 percent (8th)
of Montana’s delegates to the Democratic
and Republican national conventions were
teacher union members.4
MONTANA OVERALL RANK: 3RD1
TIER 1 (STRONGEST)
STRONGER WEAKER
1. RESOURCES AND MEMBERSHIP
OVERALL
2. INVOLVEMENT IN POLITICS
3. SCOPE OF BARGAINING
4. STATE POLICIES
5. PERCEIVED INFLUENCE
3
10
6
20
5
6

Overall Rank: 3rdTier 1 (Strongest)
MONTANA
AREA 3: SCOPE OF BARGAINING
6TH
Montana is one of thirty-two states
that require collective bargaining. It
also permits teacher strikes, and allows
unions to automatically collect agency
fees (a key source of revenue) from non-
member teachers. In addition, state law
gives teacher unions greater scope of
bargaining than in most other states. Of
twenty-one items examined in this analysis,
Montana requires that four be subjects
of collective bargaining—wages, hours,
terms and conditions of employment, and
fringe benefits. It’s silent on the remaining
seventeen provisions, implicitly including
them all in negotiations.
AREA 4: STATE POLICIES
6TH
Many of Montana’s education policies
are closely aligned with traditional
teacher union interests. The state does
not support performance pay, does not
articulate consequences for unsatisfactory
evaluations, and does not require that
student achievement data be part of
teacher evaluations or tenure decisions.
Districts need not consider teacher
performance when determining teacher
layoffs. Finally, though not calculated
into our metric, Montana does not have a
charter school law—in fact, no such bill has
even made it to the legislature floor since
2002 (see sidebar).5
AREA 5: PERCEIVED INFLUENCE
5TH
While stakeholders in Montana do not
consistently rank teacher unions as the
strongest force in education policy, they
do report a very powerful union influence.
Survey respondents note that it is effective
in protecting dollars for education, and
strongly agree that it has been successful in
warding off education proposals with which
it disagrees. Furthermore, they indicate that
policies proposed by the governor in the
state’s latest legislative session were mostly
in line with teacher union priorities (though
they note that enacted policies were only
somewhat in line), that the priorities of
state education officials are often aligned
with those of the teacher union.6
OVERALL
3RD
Montana’s teacher union shows consistent
strength across the board. It benefits from
high annual revenue; has a significant
financial presence in political campaigns;
enjoys a broad scope of bargaining; and
maintains a favorable policy climate. Its
perceived influence is significantly higher
than the union in Hawaii (1st overall), and
its state policy environment is significantly
more union-friendly than that in Oregon
(2nd overall).

Overall Rank: 3rdTier 1 (Strongest)
MONTANA
Because of, or perhaps in spite of, its strength, the Montana Education Association-Montana Federation of Teachers (MEA-MFT) is in the calm at the eye of a virtual storm of anti-union sentiment. Surrounded by states undergoing a flurry of activity to limit union rights—Idaho, Colorado, Iowa, Minnesota, and Wisconsin among them—the MEA-MFT has not faced significant threats from the governor, and in April 2011 it successfully blocked several major proposals from lawmakers.7 First, the MEA-MFT came out hard against a plan to legalize, and fund, charter schools. The union spared no hyperbole in dubbing HB 603 “one of the most dangerous school privatization bills ever introduced.”8 Had it survived to be heard on the House floor, the bill would have been the first such charter measure to make it that far since 2002. But HB 603 died in committee in April 2011.9 Charter opponents dodged another bullet when language that would have again allowed and funded charters was struck from SB 329.10 The MEA-MFT also rallied its troops against a bill that would redefine “good cause” for teacher terminations and “truncate due process” for dismissals; SB 315 was rejected on the floor, 42-57.11
The union also made a few proposals of its own, including one seeking a 2011 reinstatement of salary raises for public employees after a two-year freeze. The MEA-MFT joined other public employee unions and Democrat Governor Brian Schweitzer in support of the raises, and 500 of its members attended a rally to “Save Public Services and Education.”12 Apparently, however, Montana lawmakers are not as amenable to union interests when they involve asking for money: Two different iterations of the bill were voted down in April 2011, and lawmakers won’t vote on the governor’s third attempt until after Schweitzer’s successor is chosen in November 2012.13 Depending on what that election brings, the powerful MEA-MFT may see more clear skies or face stormy weather ahead.
WEATHERING THE STORM

Overall Rank: 3rdTier 1 (Strongest)
MONTANA
OVERALL RANK: 3RD
Area and Ranka General Indicator Sub-IndicatorSub-Indicator Rank/Statusb
AREA 1: RESOURCES & MEMBERSHIP
Membership By rank, what percentage of public-school teachers in the state are union members? 23rd
Revenue By rank, what is the total yearly revenue (per teacher in the state) of the state-level NEA and/ or AFT affiliate(s)?
5th
Spending on education By rank, what percentage of state expenditures (of state general funds, state restricted funds, state bonds, and federal “pass-through” funds) is directed to K-12 education?
43rd
By rank, what is the total annual per-pupil expenditure (of funds from federal, state, and local sources) in the state?
10th
By rank, what percentage of total annual per-pupil expenditures is directed to teacher salaries and benefits?
44th
AREA 2: INVOLVEMENTIN POLITICS
Contributions to candidates and political parties
By rank, what percentage of the total contributions to state candidates was donated by teacher unions?
44th
By rank, what percentage of the total contributions to state-level political parties was donated by teacher unions?
10th
Industry influence By rank, what percent of the contributions to state candidates from the ten highest-giving sectors was donated by teacher unions?
15th
Status of delegates By rank, what percentage of the state’s delegates to the Democratic and Republican conventions were members of teacher unions?
8th
AREA 3:SCOPE OF BARGAINING
Legal scope of bargaining What is the legal status of collective bargaining? Mandatory
By rank, how broad is the scope of collective bargaining? 15th
Automatic revenue streams What is the unions’ legal right to automatically collect agency fees from non-members and/or collect member dues via automatic payroll deductions?
Permitted
Right to strike What is the legal status of teacher strikes? Permitted
AREA 4:STATE POLICIES
Performance pay Does the state support performance pay for teachers? State does not support
Retirement By rank, what is the employer- versus employee-contribution rate to the teacher pension system? 32nd
Evaluations What is the maximum potential consequence for veteran teachers who receive unsatisfactory evaluation(s)?
No consequences articulated
Is classroom effectiveness included in teacher evaluations? If so, how is it weighted? Not required
Terms of employment How long before a teacher earns tenure? Three years
Is student/teacher performance considered in tenure decisions? If so, how is it weighted? Not included
Is seniority considered in teacher layoff decisions? If so, how is it weighted? Optional; Weighted at district discretion
Is teacher performance included in teacher layoff decisions? If so, how is it weighted? Not required
By rank, what percentage of the teaching workforce was dismissed due to poor performance? 34th
Class size Is class size restricted for grades 1-3? If so, is the restriction higher or lower than the national average (20)?
Yes; Higher
MONTANA RANKINGS BY AREA AND INDICATOR
20*
10*
6
6

Overall Rank: 3rdTier 1 (Strongest)
MONTANA
Area and Rank General Indicator Sub-IndicatorSub-Indicator Rank/Status
AREA 4:STATE POLICIES
(cont.)
Charter school structural limitationsc
Is there a cap (limit) placed on the number of charter schools that can operate in the state (or other jurisdiction) and/or on the number of students who can attend charter schools?
N/A
Does the state allow a variety of charter schools: start-ups, conversions, and virtual schools? N/A
How many charter authorizing options exist? How active are those authorizers? N/A
Charter school exemptionsc Are all charter schools automatically exempt from state laws and state/district regulations (except those that safeguard students and fiscal accountability)? If not, are they eligible for exemptions?
N/A
Are all charter schools automatically exempt from state teacher-certification requirements? If not, are they eligible for exemptions?
N/A
Are all charter schools automatically exempt from collective bargaining agreements (CBAs)? If not, are they eligible for exemptions?
N/A
AREA 5:PERCEIVED INFLUENCEd
Relative influence of teacher unions
How do you rank the influence of teacher unions on education policy compared with other influential entities?
Second-most influential
Influence over campaigns On a scale from always to never, how often do Democratic candidates need teacher-union support to get elected?
Often/Always
On a scale from always to never, how often do Republican candidates need teacher-union support to get elected?
Sometimes
Influence over spending To what extent, from strongly agree to strongly disagree, do you agree that even in times of cutbacks, teacher unions are effective in protecting dollars for education?
Agree
Given recent budgetary constraints, would you say that teacher unions generally make concessions to prevent reductions in pay and benefits or fight hard to prevent those reductions?
Fight
Influence over policy To what extent, from strongly agree to strongly disagree, do you agree that teacher unions ward off proposals in your state with which they disagree?
Strongly agree
On a scale from always to never, how often do existing state education policies reflect teacher-union priorities?
Often
To what extent, from totally in line to not at all in line, were state education policies proposed by the governor during your state’s latest legislative session in line with teacher-union priorities?
Mostly in line
To what extent, from totally in line to not at all in line, were legislative outcomes of your state’s latest legislative session in line with teacher-union priorities?
Somewhat/Mostly in line
Influence over key stakeholders
On a scale from always to never, how often have the priorities of state education leaders aligned with teacher-union positions in the past three years?
Often
Would you say that teacher unions typically compromise with policymakers to ensure that their preferred policies are enacted, or typically need not make concessions?
Sometimes compromise, sometimes do not need to concede
* Tied with another state
a Area ranks are calculated using a weighted average of sub-indicators. For a more detailed description, see Appendix A.
b Where possible, we report a state’s rank as compared to other states on a given metric. For example, out of 51 states, Montana has the 23rd-highest percentage of teachers who are union members. Otherwise, we report a status: Montana has mandatory collective bargaining, and union agency fees are permitted. For a more detailed description of our metrics and methodology, see Appendix A. To request the raw data for your state, send an email to [email protected].
c Montana does not have a charter school law.
d For all survey questions, stakeholders were asked specifically about teacher unions, candidates, policies, and leaders in their state. In addition, we asked about unions and policies in the “current legislative session,” but because legislative calendars vary from state to state, responses refer to policies proposed and enacted within the 2010-11 window.
6
5

Overall Rank: 3rdTier 1 (Strongest)
MONTANA
ENDNOTES
1 A state’s overall rank is calculated as follows: First, we score it on multiple sub-indicators (sub-indicator data and scores for Montana are shown in the table, Montana Rankings by Area and Indicator). Second, we take a weighted average of the sub-indicators in each of five areas. In each area, we use that average to place the states in rank order: For example, in Area 1: Resources and Membership, Montana is ranked 20th of 51 based on the weighted average of its sub-indicators. To generate the state’s overall rank, we average the five area ranks together, then re-order the states. For a more detailed description of data sources and methodology, see Appendix A.
2 Readers should note that these figures include only direct donations from unions and union-connected PACs, but not their spending on electioneering/advertising, mobilizing the union’s own membership, lobbying, or advocacy. A recent Wall Street Journal report found that donations and lobbying activities account for a small share of union political spending compared with their expenditures on member mobilization and advocacy. Even the AFT agreed, making the argument that since its mission is organizing and activism, it will naturally spend significant amounts on these activities. Thus, the percentages we report here are extremely conservative representations of what unions actually spend on politics. For more information, see Appendix A, Area 2; Tom McGinty and Brody Mullins, “Political Spending by Unions Far Exceeds Direct Donations,” Wall Street Journal, July 10, 2012; and Jeff Hauser, “Wall Street Journal Compares Union Political Spending to Corporate Donations,” AFL-CIO, July 10, 2012.
3 The indicators in Area 2 are calculated using total contributions to state candidates and political parties from local, state, and national unions. In the majority of cases, the state unions gave much higher sums than all the local unions combined, with the national associations giving little (or nothing). Montana is an exception because the sum of the donations from local affiliates is comparable to the total from the state union.
4 At the time of publication, the 2000 conventions were the most recent for which such detailed data were available in forms that met rigorous standards. However, 2008 data provided by the Democratic National Convention were highly correlated with the reliable figures from 2000.
5 We do not include data for sub-indicators pertaining to charters when calculating the ranking of states that do not have charter school laws. While some might argue that the lack of such a law is in itself evidence for union strength, we do not have sufficient data to link that absence to union activity. The nine states without charter laws are home to very different contexts—while teacher unions in some states may have played a significant role in keeping charter laws at bay, in others, they played little or no role.
6 We asked stakeholders about unions and policies in the “current legislative session,” but because legislative calendars vary from state to state, responses refer to policies proposed and enacted within the 2010-11 window.
7 Gail Schontzler, “Public Enemy Or Middle-Class Champion?” Bozeman Daily Chronicle, March 21, 2011, http://www.bozemandailychronicle.com/news/article_5c3616ee-527a-11e0-8cd4-001cc4c03286.html.
8 “Dangerous: HB 603,” MEA-MFT, April 8, 2011, http://www.mea-mft.org/Articles/dangerous_hb_603.aspx.
9 “Legislative Detail: MT House Bill 603 – 2011 Regular Session,” LegiScan, April 28, 2011, http://legiscan.com/gaits/view/296309.
10 Cody Bloomsburg, “K–12 Funding Bill Takes A Shaky Step Forward In The House,” Session ’11, April 27, 2011, http://session11dotorg.wordpress.com/2011/04/27/k-12-funding-takes-a-tentative-step-forward/.
11 “Victory On Teacher Tenure,” MEA-MFT, April 28, 2011, http://www.mea-mft.org/Articles/victory_on_teacher_tenure.aspx.
12 “500+ Attend Rally To Save Public Services & Education,” MEA-MFT, February 21, 2011, http://www.mea-mft.org/Articles/500_attend_rally_to_save_public_services_education.aspx.
13 Charles S. Johnson, “Montana House Rejects Employee Pay Plan,” Missoulian State Bureau, April 20, 2011, http://missoulian.com/news/state-and-regional/article_097d1448-6bbb-11e0-8105-001cc4c002e0.html; Charles S. Johnson, “House Rejects Pay Plan Bill Again,” Helena Independent Record, April 27, 2011, http://helenair.com/news/article_3c32b03e-708c-11e0-85e9-001cc4c002e0.html.

Overall Rank: 26thTier 3 (Average)
NEBRASKA
IntroductionPart IV: Taking a Closer Look–Teacher Union Influence Area
AREA 1: RESOURCES AND MEMBERSHIP
TIED FOR 18TH
Nebraska’s state teacher union has
comparatively moderate resources but
its members benefit from relatively high
spending on education in the state. With
85.3 percent of its teachers identifying as
union members, the unionization rate in
the Cornhusker State is 19th-highest of 51
jurisdictions. The Nebraska State Education
Association (NSEA) brings in $467 per
teacher each year (28th). Funds from
local, state, and federal sources amount to
$12,823 per pupil, per year (15th), with a
full 59.6 percent of those dollars allotted
to teacher salaries and benefits (2nd; only
New York’s allotment is higher). Yet the
state’s own spending is relatively modest,
with just 15.8 percent of its budget directed
to K–12 education (40th).
AREA 2: INVOLVEMENT IN POLITICS2
TIED FOR 13TH
Teacher unions contribute significantly to
state politics in Nebraska, at least when
compared with other states.3 In the past
decade, union donations amounted to 2.4
percent of total contributions to candidates
for state office (5th). Those donations
came to 17.4 percent of the funds donated
by the ten highest-giving sectors in the
state (4th). Moreover, 2.9 percent of the
donations to Nebraska political parties
came from teacher unions (8th). Taken
together, those figures indicate that unions
were a major player in Nebraska elections.
On the other hand, only 7.7 percent of the
state’s delegates to the Democratic and
Republican national conventions were
teacher union members (41st).4
NEBRASKA OVERALL RANK: 26TH1
TIER 3 (AVERAGE)
STRONGER WEAKER
1. RESOURCES AND MEMBERSHIP
OVERALL
2. INVOLVEMENT IN POLITICS
3. SCOPE OF BARGAINING
4. STATE POLICIES
5. PERCEIVED INFLUENCE
26
18
13
27
38
37

Overall Rank: 26thTier 3 (Average)
NEBRASKA
AREA 3: SCOPE OF BARGAINING
37TH
Though Nebraska is one of thirty-two
states that require collective bargaining
for public-school teachers, unions are not
allowed to automatically collect agency
fees—a key source of union revenue—
from non-member teachers. State law is
relatively indifferent regarding the scope
of bargaining: Of the twenty-one items
examined in our metric, Nebraska requires
just three to be negotiated—wages, hours,
and terms and conditions of employment.
It takes no stand on the remaining eighteen
items, implicitly permitting them all. Finally,
Nebraska prohibits teacher strikes.
AREA 4: STATE POLICIES
27TH
While many of Nebraska’s teacher
employment policies align with traditional
teacher union interests, some do not. The
state does not require student achievement
factor into teacher evaluations or tenure
decisions. Tenure is conferred after three
years (the national norm), and must be
considered in layoff decisions (when
districts need not consider teacher
performance). But it also requires that
employees contribute a greater share of
their pension funds (relative to employer
contributions) than forty other states.
Nebraska does not have a charter school
law.5
AREA 5: PERCEIVED INFLUENCE
38TH
While stakeholders in Nebraska do not
perceive teacher unions to be dominant in
shaping education policy, they do view the
unions as active participants in the process.
Nebraska is one of just four states in which
stakeholders indicated that both Democrats
and Republicans often need teacher union
support to be elected. (Nebraska even has
an NSEA-endorsed Republican governor—
see sidebar.) But survey respondents rank
the union as only the third- or fourth-most
influential entity in state education policy,
consistently placing the school board and
administrator associations above it. In
addition, respondents indicate that, in light
of recent budgetary constraints, the union
acceded to reductions in pay and benefits
rather than fighting against them. Given the
high percentage of district spending that
goes to teacher salaries but the relatively
low proportion of state spending that goes
to K–12 education (see Area 1), perhaps
respondents are reflecting on the union’s
failure to secure higher salaries from the
state (see sidebar).
OVERALL
26TH
Nebraska’s teacher unions are a strong
presence in state politics—and have made
their election endorsements important
for both Democrats and Republicans.
Bargaining laws and teacher employment
policies are no more or less aligned with
union interests than in other states—
although unlike many other states, these
policies seem less vulnerable to change
(see sidebar).

Overall Rank: 26thTier 3 (Average)
NEBRASKA
The NSEA knows a good investment when it sees one. In 2006, it endorsed Republican Dave Heineman for governor, and was the single biggest donor to his 2010 re-election campaign—after he backed raises and better benefits for teachers.6 Two years later, the union successfully lobbied Heineman to increase state aid for education from the proposed $814 to $853 million (though still a $27 million decrease from 2011–12). It also mobilized its members against the governor’s tax relief plan and successfully curbed tax cuts by two-thirds of the original proposal.7 This was all firmly in line with the vision of NSEA president Nancy Fulton, who explained the importance of investing in lobbying to her members: “I firmly believe that money matters, and that when it comes to education spending, policymakers are ‘pennywise and pound foolish.’ Pushing those policymakers to provide adequate funding for our public schools will pay dividends in the long run.”8
That push included demands for higher teacher salaries, which are among the lowest in the nation, and again the NSEA had the governor on its side.9 Heineman wrote to NSEA leaders, urging them to help their members negotiate pay raises with the help of federal stimulus funds. To the amazement (and chagrin) of lawmakers, he even told the union to use his letter to pressure school boards during collective bargaining. (His letter read, in part, “I am skeptical of mandating how school districts spend their state aid, but I’ve grown increasingly concerned that the substantial increases in state aid have not been reflected in teacher pay.”)10
The NSEA enjoyed only partial success here: Instead of awarding teachers across-the-board raises, in 2010 Nebraska became one of a handful of states that both require performance pay and fund it. However, merit pay is an exception to the more general durability of the education status quo in Nebraska. The state did not enact major education reforms before submitting its Race to the Top applications (which were, unsurprisingly, rejected), and it did not try for an NCLB waiver. Most recently, the legislature passed an NSEA-endorsed plan to evaluate schools and districts (but not teachers) using student performance, with the details yet to be determined by the State Board of Education.11 So far, it seems that the NSEA’s political investments are paying off.
WITH A LITTLE HELP FROM MY FRIENDS

Overall Rank: 26thTier 3 (Average)
NEBRASKA
OVERALL RANK: 26TH
Area and Ranka General Indicator Sub-IndicatorSub-Indicator Rank/Statusb
AREA 1: RESOURCES & MEMBERSHIP
Membership By rank, what percentage of public-school teachers in the state are union members? 19th
Revenue By rank, what is the total yearly revenue (per teacher in the state) of the state-level NEA and/ or AFT affiliate(s)?
28th
Spending on education By rank, what percentage of state expenditures (of state general funds, state restricted funds, state bonds, and federal “pass-through” funds) is directed to K-12 education?
40th
By rank, what is the total annual per-pupil expenditure (of funds from federal, state, and local sources) in the state?
15th
By rank, what percentage of total annual per-pupil expenditures is directed to teacher salaries and benefits?
2nd
AREA 2: INVOLVEMENTIN POLITICS
Contributions to candidates and political parties
By rank, what percentage of the total contributions to state candidates was donated by teacher unions?
5th
By rank, what percentage of the total contributions to state-level political parties was donated by teacher unions?
8th
Industry influence By rank, what percent of the contributions to state candidates from the ten highest-giving sectors was donated by teacher unions?
4th
Status of delegates By rank, what percentage of the state’s delegates to the Democratic and Republican conventions were members of teacher unions?
41st
AREA 3:SCOPE OF BARGAINING
Legal scope of bargaining What is the legal status of collective bargaining? Mandatory
By rank, how broad is the scope of collective bargaining? 24th*
Automatic revenue streams What is the unions’ legal right to automatically collect agency fees from non-members and/or collect member dues via automatic payroll deductions?
Agency fees prohibited
Right to strike What is the legal status of teacher strikes? Prohibited
AREA 4:STATE POLICIES
Performance pay Does the state support performance pay for teachers? Available to all teachers
Retirement By rank, what is the employer- versus employee-contribution rate to the teacher pension system? 41st
Evaluations What is the maximum potential consequence for veteran teachers who receive unsatisfactory evaluation(s)?
No consequences articulated
Is classroom effectiveness included in teacher evaluations? If so, how is it weighted? Not required
Terms of employment How long before a teacher earns tenure? Three years
Is student/teacher performance considered in tenure decisions? If so, how is it weighted? Not included
Is seniority considered in teacher layoff decisions? If so, how is it weighted? Required; Considered among other factors
Is teacher performance included in teacher layoff decisions? If so, how is it weighted? Not required
By rank, what percentage of the teaching workforce was dismissed due to poor performance? 35th
Class size Is class size restricted for grades 1-3? If so, is the restriction higher or lower than the national average (20)?
Yes; Higher
NEBRASKA RANKINGS BY AREA AND INDICATOR
18*
13*
37
27

Overall Rank: 26thTier 3 (Average)
NEBRASKA
Area and Rank General Indicator Sub-IndicatorSub-Indicator Rank/Status
AREA 4:STATE POLICIES
(cont.)
Charter school structural limitationsc
Is there a cap (limit) placed on the number of charter schools that can operate in the state (or other jurisdiction) and/or on the number of students who can attend charter schools?
N/A
Does the state allow a variety of charter schools: start-ups, conversions, and virtual schools? N/A
How many charter authorizing options exist? How active are those authorizers? N/A
Charter school exemptionsc Are all charter schools automatically exempt from state laws and state/district regulations (except those that safeguard students and fiscal accountability)? If not, are they eligible for exemptions?
N/A
Are all charter schools automatically exempt from state teacher-certification requirements? If not, are they eligible for exemptions?
N/A
Are all charter schools automatically exempt from collective bargaining agreements (CBAs)? If not, are they eligible for exemptions?
N/A
AREA 5:PERCEIVED INFLUENCEd
Relative influence of teacher unions
How do you rank the influence of teacher unions on education policy compared with other influential entities?
Third- or fourth-most influential
Influence over campaigns On a scale from always to never, how often do Democratic candidates need teacher-union support to get elected?
Often/Always
On a scale from always to never, how often do Republican candidates need teacher-union support to get elected?
Often
Influence over spending To what extent, from strongly agree to strongly disagree, do you agree that even in times of cutbacks, teacher unions are effective in protecting dollars for education?
Neutral
Given recent budgetary constraints, would you say that teacher unions generally make concessions to prevent reductions in pay and benefits or fight hard to prevent those reductions?
Concede
Influence over policy To what extent, from strongly agree to strongly disagree, do you agree that teacher unions ward off proposals in your state with which they disagree?
Agree
On a scale from always to never, how often do existing state education policies reflect teacher-union priorities?
Sometimes
To what extent, from totally in line to not at all in line, were state education policies proposed by the governor during your state’s latest legislative session in line with teacher-union priorities?
Somewhat in line
To what extent, from totally in line to not at all in line, were legislative outcomes of your state’s latest legislative session in line with teacher-union priorities?
Somewhat/Mostly in line
Influence over key stakeholders
On a scale from always to never, how often have the priorities of state education leaders aligned with teacher-union positions in the past three years?
Sometimes/Often
Would you say that teacher unions typically compromise with policymakers to ensure that their preferred policies are enacted, or typically need not make concessions?
Compromise
* Tied with another state
a Area ranks are calculated using a weighted average of sub-indicators. For a more detailed description, see Appendix A.
b Where possible, we report a state’s rank as compared to other states on a given metric. For example, out of 51 states, Nebraska has the 19th-highest percentage of teachers who are union members. Otherwise, we report a status: Nebraska has mandatory collective bargaining, and union agency fees are prohibited. For a more detailed description of our metrics and methodology, see Appendix A. To request the raw data for your state, send an email to [email protected].
c Nebraska does not have a charter school law.
d For all survey questions, stakeholders were asked specifically about teacher unions, candidates, policies, and leaders in their state. In addition, we asked about unions and policies in the “current legislative session,” but because legislative calendars vary from state to state, responses refer to policies proposed and enacted within the 2010-11 window.
27
38
Overall Rank: 26thTier 3 (Average)
NEBRASKA
ENDNOTES
1 A state’s overall rank is calculated as follows: First, we score it on multiple sub-indicators (sub-indicator data and scores for Nebraska are shown in the table, Nebraska Rankings by Area and Indicator). Second, we take a weighted average of the sub-indicators in each of five areas. In each area, we use that average to place the states in rank order: For example, in Area 1: Resources and Membership, Nebraska is ranked 18th of 51 based on the weighted average of its sub-indicators. To generate the state’s overall rank, we average the five area ranks together, then re-order the states. For a more detailed description of data sources and methodology, see Appendix A.
2 Readers should note that these figures include only direct donations from unions and union-connected PACs, but not their spending on electioneering/advertising, mobilizing the union’s own membership, lobbying, or advocacy. A recent Wall Street Journal report found that donations and lobbying activities account for a small share of union political spending compared with their expenditures on member mobilization and advocacy. Even the AFT agreed, making the argument that since its mission is organizing and activism, it will naturally spend significant amounts on these activities. Thus, the percentages we report here are extremely conservative representations of what unions actually spend on politics. For more information, see Appendix A, Area 2; Tom McGinty and Brody Mullins, “Political Spending by Unions Far Exceeds Direct Donations,” Wall Street Journal, July 10, 2012; and Jeff Hauser, “Wall Street Journal Compares Union Political Spending to Corporate Donations,” AFL-CIO, July 10, 2012.
3 While our overall metric reports the strength of state teacher unions, this area also captures contributions to state campaigns and parties from national unions and local union affiliates. However, in Nebraska only three local unions contribute to state politics, and their donations were relatively tiny compared to the NSEA.
4 At the time of publication, the 2000 conventions were the most recent for which such detailed data were available in forms that met rigorous standards. However, 2008 data provided by the Democratic National Convention were highly correlated with the reliable figures from 2000.
5 When calculating the ranking of states that do not have a charter school law, we do not include any sub-indicators related to charters. While some might argue that the lack of such a law is in itself a statement of union strength, we do not have sufficient evidence to connect the absence with actions of the union.
6 Sean Cavanagh, “GOP governor backed by teachers’ union wins Nebraska,” Education Week, November 2, 2010, accessed August 28, 2012, http://blogs.edweek.org/edweek/state_edwatch/2010/11/dave_heineman_backed_by_teachers_union_is_re-elected_in_nebraska.html; “Heineman, The Teachers’ Union, And Irony,” NebraskaStatePaper.com, February 27, 2011, http://nebraska.statepaper.com/vnews/display.v/ART/2011/02/27/4d6b6cff2bc6f.
7 “Legislative Update,” Nebraska State Education Association, April 19, 2012, http://www.nsea.org/policy/LegUpdate.htm.
8 Nancy Fulton, “What I Believe,” Nebraska State Education Association, May 2012, http://www.nsea.org/news/all.htm?articleno=1223.
9 Teacher Portal, accessed August 31, 2012, http://www.teacherportal.com/teacher-salaries-by-state.
10 Margaret Reist, “Heineman Calls For Teacher Pay To Reflect State Aid Increases,” Lincoln Journal Star, June 19, 2009, http://journalstar.com/news/local/article_89655884-137c-5296-bb8f-dcf2a7710e39.html.
11 Bert Peterson, “War On Teachers Waged Across Nation,” Independent, May 5, 2012, http://www.theindependent.com/opinion/another_opinion/war-on-teachers-waged-across-nation/article_4e05aa74-9632-11e1-b52b-0019bb2963f4.html.

Overall Rank: 25thTier 3 (Average)
NEVADA
IntroductionPart IV: Taking a Closer Look–Teacher Union Influence Area
AREA 1: RESOURCES AND MEMBERSHIP
TIED FOR 28TH
Nevada’s state teacher union enjoys a fair
amount of resources from its members
but does not see much spending on K–12
education in the state. With 74.6 percent
of the state’s teachers unionized and
annual revenue of $435 per teacher, the
NEA-affiliated Nevada State Education
Association (NSEA) is in the middle of the
pack compared with unions in other states.
Spending on K–12 education is relatively
high—21.3 percent of the state’s budget
goes to K–12 education (the 17th-highest
proportion out of 51 jurisdictions). But
Nevada is at the bottom of the list when it
comes to total dollars for education from
local, state, and federal sources: Annual
per-pupil expenditures are just $8,363—
only one state spends less.
AREA 2: INVOLVEMENT IN POLITICS2
TIED FOR 18TH
Over the past ten years, teacher unions
contributed significant sums to state
political campaigns in Nevada.3 Donations
from unions constituted 1.7 percent
of the money received by state-level
candidates (the 7th-highest percentage
in the nation) and 2.8 percent of all giving
to state political parties (9th-highest).
But teacher unions faced competition:
Their contributions to political candidates
amounted to 6.5 percent of all donations
from the ten highest-giving sectors (21st).
Nor was the union voice at the Democratic
and Republican national conventions as
loud as in other states: Just 9.1 percent of
Nevada’s delegates were teacher union
members (37th).4
NEVADA OVERALL RANK: 25TH1
TIER 3 (AVERAGE)
STRONGER WEAKER
1. RESOURCES AND MEMBERSHIP
OVERALL
2. INVOLVEMENT IN POLITICS
3. SCOPE OF BARGAINING
4. STATE POLICIES
5. PERCEIVED INFLUENCE
25
28
18
28
10
27

Overall Rank: 25thTier 3 (Average)
NEVADA
AREA 3: SCOPE OF BARGAINING
27TH
Though Nevada is one of thirty-two
jurisdictions that require collective
bargaining, teachers are not allowed to
strike. The Silver State also prohibits unions
from automatically collecting agency fees, a
key source of revenue, from non-members.
Nevada nonetheless empowers unions
with a wide scope of collective bargaining;
of the twenty-one items examined in this
metric, Nevada explicitly requires that
fourteen be subjects of bargaining—more
than any other state.
AREA 4: STATE POLICIES
28TH
Nevada’s state policies are not perfectly in
line with traditional teacher union interests,
but neither are they badly misaligned.
Nevada permits, but does not require,
performance pay for teachers. State law
requires that student achievement be
the preponderant criterion in teacher
evaluations, but teachers can earn tenure
after just three years. It also mandates
that factors other than seniority—but not
student achievement—be considered in
layoff decisions. The state’s charter laws
are also a mixed bag: Nevada does not cap
charter schools (though some districts do),
but neither does it give them automatic
exemptions from most district regulations.
Collective bargaining agreements apply
only to charter employees on leave from
traditional schools.
AREA 5: PERCEIVED INFLUENCE
10TH
Stakeholders perceive teacher unions in
Nevada to be among the most influential
entities in shaping education policy, and
they report that both Democrats and
Republicans seeking state-level office often
need teacher union support to get elected.
Further, they agreed that teacher unions
are often effective in protecting dollars for
education and note that they fought hard
to prevent reductions in pay and benefits
during the recent period of budgetary
constraints. Respondents indicate, however,
that Nevada’s teacher unions have faced
struggles of late: Policies proposed by
the governor during the state’s recent
legislative session were mostly not in
line with teacher union priorities, and the
legislative outcomes were only somewhat in
line with them.5
OVERALL
25TH
Nevada’s teacher unions are more
involved in state politics than many of
their counterparts in other states, and
they enjoy a relatively strong reputation
for influence. The scope of bargaining and
state policy environment are middle-of-
the-road, neither particularly favorable nor
unfavorable to union interests.

Overall Rank: 25thTier 3 (Average)
NEVADA
The Clark County Education Association (CCEA) didn’t heed Superintendent Dwight Jones when he said in early 2012 that there was simply no money to raise teacher salaries. Jones had warned that layoffs would be inevitable if wages were not held steady. An arbitrator hired to mediate the dispute ruled in favor of the union, and the district paid teachers a total of $64 million in pay raises.6
In June 2012, however, Jones’s warning became reality. To offset the cost of the raises, the Clark County School District mailed pink slips to 419 teachers and let another 600 newly-vacated positions go unfilled. While the union contract stipulates that both performance and seniority are key criteria for layoffs, in reality, early-career teachers bore the brunt of the firings: Because only thirty-six veteran teachers met the union’s stringent definition of poor performance, roughly 380 newer teachers were let go instead. Teachers who survived the culling face an increase of three students per class, which brings the average to a hefty thirty-five students—one of the highest in the nation.
Faced with threats to teacher job security in Clark County (Las Vegas) and elsewhere, the Nevada state union proposed a solution that would increase state education funding and, ultimately, protect teacher salaries and jobs. The NSEA backed a ballot measure that would impose a 2 percent tax on businesses earning over $1 million a year, with the revenue going to the state’s general fund (and eventually reaching local school districts). Nevada businesses claimed the tax was illegal and misleading, and they are suing to stop the “Education Initiative.” If the union can muster over 72,000 signatures by November 2012, the 2013 legislature will consider approving the statutory initiative.7 Meanwhile, CCEA and Clark County district leaders are negotiating their 2012–13 contract; early observers say the talks “haven’t been promising.”8
BE CAREFUL WHAT YOU WISH FOR

Overall Rank: 25thTier 3 (Average)
NEVADA
OVERALL RANK: 25TH
Area and Ranka General Indicator Sub-IndicatorSub-Indicator Rank/Statusb
AREA 1: RESOURCES & MEMBERSHIP
Membership By rank, what percentage of public-school teachers in the state are union members? 28th
Revenue By rank, what is the total yearly revenue (per teacher in the state) of the state-level NEA and/ or AFT affiliate(s)?
30th
Spending on education By rank, what percentage of state expenditures (of state general funds, state restricted funds, state bonds, and federal “pass-through” funds) is directed to K-12 education?
17th
By rank, what is the total annual per-pupil expenditure (of funds from federal, state, and local sources) in the state?
50th
By rank, what percentage of total annual per-pupil expenditures is directed to teacher salaries and benefits?
26th
AREA 2: INVOLVEMENTIN POLITICS
Contributions to candidates and political parties
By rank, what percentage of the total contributions to state candidates was donated by teacher unions?
7th
By rank, what percentage of the total contributions to state-level political parties was donated by teacher unions?
9th
Industry influence By rank, what percent of the contributions to state candidates from the ten highest-giving sectors was donated by teacher unions?
21st
Status of delegates By rank, what percentage of the state’s delegates to the Democratic and Republican conventions were members of teacher unions?
37th
AREA 3:SCOPE OF BARGAINING
Legal scope of bargaining What is the legal status of collective bargaining? Mandatory
By rank, how broad is the scope of collective bargaining? 1st
Automatic revenue streams What is the unions’ legal right to automatically collect agency fees from non-members and/or collect member dues via automatic payroll deductions?
Agency fees prohibited
Right to strike What is the legal status of teacher strikes? Prohibited
AREA 4:STATE POLICIES
Performance pay Does the state support performance pay for teachers? State supports/encourages
Retirement By rank, what is the employer- versus employee-contribution rate to the teacher pension system? 42nd*
Evaluations What is the maximum potential consequence for veteran teachers who receive unsatisfactory evaluation(s)?
Teacher improvement plan
Is classroom effectiveness included in teacher evaluations? If so, how is it weighted? Required; Preponderant criterion
Terms of employment How long before a teacher earns tenure? Three years
Is student/teacher performance considered in tenure decisions? If so, how is it weighted? Required; Preponderant criterion
Is seniority considered in teacher layoff decisions? If so, how is it weighted? Optional; May be considered among other factors
Is teacher performance included in teacher layoff decisions? If so, how is it weighted? Not required
By rank, what percentage of the teaching workforce was dismissed due to poor performance? 4th
Class size Is class size restricted for grades 1-3? If so, is the restriction higher or lower than the national average (20)?
Yes; Lower
NEVADA RANKINGS BY AREA AND INDICATOR
28*
18*
27
28

Overall Rank: 25thTier 3 (Average)
NEVADA
Area and Rank General Indicator Sub-IndicatorSub-Indicator Rank/Status
AREA 4:STATE POLICIES
(cont.)
Charter school structural limitations
Is there a cap (limit) placed on the number of charter schools that can operate in the state (or other jurisdiction) and/or on the number of students who can attend charter schools?
No state cap (but authorizers are capped)
Does the state allow a variety of charter schools: start-ups, conversions, and virtual schools? Start-ups and virtual schools only
How many charter authorizing options exist? How active are those authorizers? Two or more w/limited jurisdiction
Charter school exemptions Are all charter schools automatically exempt from state laws and state/district regulations (except those that safeguard students and fiscal accountability)? If not, are they eligible for exemptions?
Yes
Are all charter schools automatically exempt from state teacher-certification requirements? If not, are they eligible for exemptions?
Partially; All schools receive automatic exemptions for some teachers
Are all charter schools automatically exempt from collective bargaining agreements (CBAs)? If not, are they eligible for exemptions?
Partially; Some automatic exemptions for all schools
AREA 5:PERCEIVED INFLUENCEc
Relative influence of teacher unions
How do you rank the influence of teacher unions on education policy compared with other influential entities?
Most- or second-most influential
Influence over campaigns On a scale from always to never, how often do Democratic candidates need teacher-union support to get elected?
Often/Always
On a scale from always to never, how often do Republican candidates need teacher-union support to get elected?
Sometimes/Often
Influence over spending To what extent, from strongly agree to strongly disagree, do you agree that even in times of cutbacks, teacher unions are effective in protecting dollars for education?
Agree
Given recent budgetary constraints, would you say that teacher unions generally make concessions to prevent reductions in pay and benefits or fight hard to prevent those reductions?
Fight
Influence over policy To what extent, from strongly agree to strongly disagree, do you agree that teacher unions ward off proposals in your state with which they disagree?
Agree
On a scale from always to never, how often do existing state education policies reflect teacher-union priorities?
Sometimes/Often
To what extent, from totally in line to not at all in line, were state education policies proposed by the governor during your state’s latest legislative session in line with teacher-union priorities?
Mostly not in line/Somewhat in line
To what extent, from totally in line to not at all in line, were legislative outcomes of your state’s latest legislative session in line with teacher-union priorities?
Somewhat in line
Influence over key stakeholders
On a scale from always to never, how often have the priorities of state education leaders aligned with teacher-union positions in the past three years?
Often
Would you say that teacher unions typically compromise with policymakers to ensure that their preferred policies are enacted, or typically need not make concessions?
Sometimes compromise, sometimes do not need to concede
* Tied with another state
a Area ranks are calculated using a weighted average of sub-indicators. For a more detailed description, see Appendix A.
b Where possible, we report a state’s rank as compared to other states on a given metric. For example, out of 51 states, Nevada has the 28th-highest percentage of teachers who are union members. Otherwise, we report a status: Nevada has mandatory collective bargaining, and union agency fees are prohibited. For a more detailed description of our metrics and methodology, see Appendix A. To request the raw data for your state, send an email to [email protected].
c For all survey questions, stakeholders were asked specifically about teacher unions, candidates, policies, and leaders in their state. In addition, we asked about unions and policies in the “current legislative session,” but because legislative calendars vary from state to state, responses refer to policies proposed and enacted within the 2010-11 window.
28
10

Overall Rank: 25thTier 3 (Average)
NEVADA
ENDNOTES
1 A state’s overall rank is calculated as follows: First, we score it on multiple sub-indicators (sub-indicator data and scores for Nevada are shown in the table, Nevada Rankings by Area and Indicator). Second, we take a weighted average of the sub-indicators in each of five areas. In each area, we use that average to place the states in rank order: For example, in Area 1: Resources and Membership, Nevada is ranked 28th of 51 based on the weighted average of its sub-indicators. To generate the state’s overall rank, we average the five area ranks together, then re-order the states. For a more detailed description of data sources and methodology, see Appendix A.
2 Readers should note that these figures include only direct donations from unions and union-connected PACs, but not their spending on electioneering/advertising, mobilizing the union’s own membership, lobbying, or advocacy. A recent Wall Street Journal report found that donations and lobbying activities account for a small share of union political spending compared with their expenditures on member mobilization and advocacy. Even the AFT agreed, making the argument that since its mission is organizing and activism, it will naturally spend significant amounts on these activities. Thus, the percentages we report here are extremely conservative representations of what unions actually spend on politics. For more information, see Appendix A, Area 2; Tom McGinty and Brody Mullins, “Political Spending by Unions Far Exceeds Direct Donations,” Wall Street Journal, July 10, 2012; and Jeff Hauser, “Wall Street Journal Compares Union Political Spending to Corporate Donations,” AFL-CIO, July 10, 2012.
3 While our overall metric reports the strength of state teacher unions (in this case, the Nevada State Education Association, Nevada’s NEA affiliate), this particular indicator also captures contributions from local (and national) affiliates. Typically, the contributions from locals are significantly smaller than the amount given by state unions. But in Nevada’s case, a local affiliate (Clark County Education Association) gave nearly as much as the state union.
4 At the time of publication, the 2000 conventions were the most recent for which such detailed data were available in forms that met rigorous standards. However, 2008 data provided by the Democratic National Convention were highly correlated with the reliable figures from 2000.
5 We asked stakeholders about unions and policies in the “current legislative session,” but because legislative calendars vary from state to state, responses refer to policies proposed and enacted within the 2010-11 window.
6 Trevon Milliard, “More Than 400 Teachers, Personnel Receive Pink Slips,” Las Vegas Review-Journal, June 11, 2012, http://www.lvrj.com/news/more-than-400-teachers-personnel-receive-pink-slips-158446925.html.
7 Associated Press, “Lawsuit Filed Against Nevada Tax Initiative,” Las Vegas Sun, June 26, 2012, http://www.lasvegassun.com/news/2012/jun/26/nv-nevada-tax-initiative-1st-ld-writethru/.
8 Milliard.

Overall Rank: 30thTier 3 (Average)
NEW HAMPSHIRE
IntroductionPart IV: Taking a Closer Look–Teacher Union Influence Area
AREA 1: RESOURCES AND MEMBERSHIP
TIED FOR 24TH
The Granite State’s financial resources,
unionized teaching force, and funding
for education all nudge its state teacher
unions toward the middle of the national
pack. With 84.4 percent of public school
teachers unionized, the Granite State posts
the 22nd-highest membership rate of 51
jurisdictions, and the state’s NEA and AFT
affiliates bring in $504 per teacher in the
state (23rd). State dollars for education
are roughly average, with 21.1 percent of
New Hampshire’s budget directed to K–12
education (18th). It ranks higher on overall
spending—local, state, and federal funds
combined amount to annual per-pupil
expenditures of $13,519 (11th), and teachers
see 55.6 percent of those dollars go toward
their salaries and benefits (16th).
AREA 2: INVOLVEMENT IN POLITICS2
TIED FOR 40TH
Compared to their counterparts elsewhere,
New Hampshire’s teacher unions were
relatively uninvolved in the past decade of
state politics. Their contributions amounted
to just 0.28 percent of all donations
received by candidates for state office
(37th), and 0.45 percent of donations
to state-level political parties (39th).
Further, they did not have a significant
presence at Democratic and Republican
national conventions: just 7.1 percent of
the delegates from New Hampshire were
teacher union members (42nd).3
NEW HAMPSHIRE OVERALL RANK: 30TH1
TIER 3 (AVERAGE)
STRONGER WEAKER
1. RESOURCES AND MEMBERSHIP
OVERALL
2. INVOLVEMENT IN POLITICS
3. SCOPE OF BARGAINING
4. STATE POLICIES
5. PERCEIVED INFLUENCE
30
24
40
17
40
14

Overall Rank: 30thTier 3 (Average)
NEW HAMPSHIRE
AREA 3: SCOPE OF BARGAINING
14TH
New Hampshire’s teacher unions enjoy
relatively permissive bargaining laws. It is
one of twenty-one states that both require
collective bargaining and allow unions
automatically to collect agency fees from
non-member teachers (a key source of
union revenue). The scope of bargaining is
also wide: Of twenty-one items examined
in our metric, New Hampshire requires that
six be negotiated: wages, hours, terms
and conditions of employment, dismissal,
leave, and extra-curricular duties. The state
only excludes one provision—management
rights—and implicitly permits the remaining
fourteen items by taking no position.
However, state law does not allow teacher
strikes.
AREA 4: STATE POLICIES
17TH
New Hampshire’s teacher employment
policies generally align with traditional
union interests. It does not support
performance pay, does not require
student achievement data to factor into
teacher evaluations or tenure decisions,
and does not articulate consequences
for unsatisfactory evaluations. Further,
districts do not have to consider teacher
performance when making layoffs
(although they do not have to consider
seniority, either). On the other hand, it takes
teachers five years to earn tenure versus
the national norm of three. Moreover, the
state’s charter policies are somewhat more
opposed to typical union positions. While
there is a cap on the number of charters, it
leaves ample room for growth, and charters
get partial automatic exemptions from
state certification rules and full exemptions
from collective bargaining agreements and
most other state laws.
AREA 5: PERCEIVED INFLUENCE
40TH
Stakeholders in New Hampshire perceive
teacher union strength to be more limited
than in most other states. Not a single
survey respondent said that the teacher
unions were among the influential entities
in education policy; only in Florida did
stakeholders say the same. They instead
report that the state school board,
association of school administrators,
and association of school boards were
influential. They also note that the unions
often rely on compromise to see their
preferred policies enacted, that they are
unable to ward off proposals with which
they disagree (although that may be less
true lately—see sidebar), and that the
positions of state education leaders are
not particularly aligned with those of the
teacher union.
OVERALL
30TH
While New Hampshire’s teacher unions are
not very involved in state politics and do
not garner a strong reputation, they do
enjoy many favorable state-level policies.
Perhaps it is because current state policies
already align with traditional union interests
that they are not more involved politically.

Overall Rank: 30thTier 3 (Average)
NEW HAMPSHIRE
State leaders and unions in the Granite State have been playing hardball for most of 2012. First, lawmakers considered three constitutional amendments that would reduce (or eliminate) the state’s obligations to fund public education—no surprise in a state with no sales or personal income tax. CACR 12 would permit the state to give fewer dollars to districts that could afford to raise money locally. CACR 8 would eliminate the state’s obligation to give local districts any funds (while also granting districts complete autonomy over curricula, hiring, and budget). And CACR 6 would require a legislative supermajority to pass new taxes, essentially freezing state revenues.4 NEA-New Hampshire came out hard against all three amendments; on CACR 12, president Rhonda Wesolowski lambasted that “schoolchildren lose when politicians play favorites and that is exactly what this amendment allows.”5 The House approved CACR 6 and 12, but not with enough votes to place them on the November ballot; CACR 8 died before lawmakers voted on it.6,7 Three failed amendments mean three strikes, one out, for legislators. Early 2012 also found New Hampshire’s unions battling three measures that AFT-New Hampshire called “union-busting bills and more attacks on our public employees and middle class families.”8 Senators tabled a proposal to make New Hampshire a right-to-work state after it didn’t gain enough momentum to prevail against a likely veto by Democrat Governor John Lynch. Next, they tabled a measure requiring employees and districts share the cost of any health insurance increases should a contract expire while a new one is being negotiated. A third proposal, allowing districts to ask that their local union be decertified as a legal bargaining unit if its membership became small enough, is locked in Senate committee.9,10 Three more strikes, two outs. In June 2012, however, school-choice proponents almost knocked one out of the park. The legislature passed a bill giving tax credits to businesses for donations to scholarship funds for private- and religious-school vouchers. The law also provided grants to parents who choose to home-school their children. Governor Lynch made a diving catch at the wall, vetoing the bill on the grounds that public money should not pay for private schools, and proponents couldn’t raise enough votes in the House to overturn the veto.11 That makes three outs for reformist lawmakers, and so, for the time being, New Hampshire’s teacher unions are safe at home.
COVERING ALL THE BASES

Overall Rank: 30thTier 3 (Average)
NEW HAMPSHIRE
OVERALL RANK: 30TH
Area and Ranka General Indicator Sub-IndicatorSub-Indicator Rank/Statusb
AREA 1: RESOURCES & MEMBERSHIP
Membership By rank, what percentage of public-school teachers in the state are union members? 22nd
Revenue By rank, what is the total yearly revenue (per teacher in the state) of the state-level NEA and/ or AFT affiliate(s)?
23rd
Spending on education By rank, what percentage of state expenditures (of state general funds, state restricted funds, state bonds, and federal “pass-through” funds) is directed to K-12 education?
18th
By rank, what is the total annual per-pupil expenditure (of funds from federal, state, and local sources) in the state?
11th
By rank, what percentage of total annual per-pupil expenditures is directed to teacher salaries and benefits?
16th
AREA 2: INVOLVEMENTIN POLITICS
Contributions to candidates and political parties
By rank, what percentage of the total contributions to state candidates was donated by teacher unions?
37th
By rank, what percentage of the total contributions to state-level political parties was donated by teacher unions?
39th
Industry influence By rank, what percent of the contributions to state candidates from the ten highest-giving sectors was donated by teacher unions?
29th
Status of delegates By rank, what percentage of the state’s delegates to the Democratic and Republican conventions were members of teacher unions?
42nd
AREA 3:SCOPE OF BARGAINING
Legal scope of bargaining What is the legal status of collective bargaining? Mandatory
By rank, how broad is the scope of collective bargaining? 10th*
Automatic revenue streams What is the unions’ legal right to automatically collect agency fees from non-members and/or collect member dues via automatic payroll deductions?
Permitted
Right to strike What is the legal status of teacher strikes? Prohibited
AREA 4:STATE POLICIES
Performance pay Does the state support performance pay for teachers? State does not support
Retirement By rank, what is the employer- versus employee-contribution rate to the teacher pension system? 27th
Evaluations What is the maximum potential consequence for veteran teachers who receive unsatisfactory evaluation(s)?
No consequences articulated
Is classroom effectiveness included in teacher evaluations? If so, how is it weighted? Not required
Terms of employment How long before a teacher earns tenure? Five years
Is student/teacher performance considered in tenure decisions? If so, how is it weighted? Not included
Is seniority considered in teacher layoff decisions? If so, how is it weighted? Optional; May be considered among other factors
Is teacher performance included in teacher layoff decisions? If so, how is it weighted? Not required
By rank, what percentage of the teaching workforce was dismissed due to poor performance? 37th
Class size Is class size restricted for grades 1-3? If so, is the restriction higher or lower than the national average (20)?
Yes; Higher
NEW HAMPSHIRE RANKINGS BY AREA AND INDICATOR
24*
40*
14
17

Overall Rank: 30thTier 3 (Average)
NEW HAMPSHIRE
Area and Rank General Indicator Sub-IndicatorSub-Indicator Rank/Status
AREA 4:STATE POLICIES
(cont.)
Charter school structural limitations
Is there a cap (limit) placed on the number of charter schools that can operate in the state (or other jurisdiction) and/or on the number of students who can attend charter schools?
State cap with ample room for growth
Does the state allow a variety of charter schools: start-ups, conversions, and virtual schools? Yes
How many charter authorizing options exist? How active are those authorizers? Single option; No or limited activity
Charter school exemptions Are all charter schools automatically exempt from state laws and state/district regulations (except those that safeguard students and fiscal accountability)? If not, are they eligible for exemptions?
Yes
Are all charter schools automatically exempt from state teacher-certification requirements? If not, are they eligible for exemptions?
Partially; All schools receive automatic exemptions for some teachers
Are all charter schools automatically exempt from collective bargaining agreements (CBAs)? If not, are they eligible for exemptions?
Yes
AREA 5:PERCEIVED INFLUENCEc
Relative influence of teacher unions
How do you rank the influence of teacher unions on education policy compared with other influential entities?
Fourth- or fifth-most influential
Influence over campaigns On a scale from always to never, how often do Democratic candidates need teacher-union support to get elected?
Often
On a scale from always to never, how often do Republican candidates need teacher-union support to get elected?
Rarely
Influence over spending To what extent, from strongly agree to strongly disagree, do you agree that even in times of cutbacks, teacher unions are effective in protecting dollars for education?
Neutral
Given recent budgetary constraints, would you say that teacher unions generally make concessions to prevent reductions in pay and benefits or fight hard to prevent those reductions?
Generally concede
Influence over policy To what extent, from strongly agree to strongly disagree, do you agree that teacher unions ward off proposals in your state with which they disagree?
Neutral
On a scale from always to never, how often do existing state education policies reflect teacher-union priorities?
Sometimes/Often
To what extent, from totally in line to not at all in line, were state education policies proposed by the governor during your state’s latest legislative session in line with teacher-union priorities?
Somewhat/Mostly in line
To what extent, from totally in line to not at all in line, were legislative outcomes of your state’s latest legislative session in line with teacher-union priorities?
Mostly not in line/Somewhat in line
Influence over key stakeholders
On a scale from always to never, how often have the priorities of state education leaders aligned with teacher-union positions in the past three years?
Sometimes/Often
Would you say that teacher unions typically compromise with policymakers to ensure that their preferred policies are enacted, or typically need not make concessions?
Generally compromise
* Tied with another state
a Area ranks are calculated using a weighted average of sub-indicators. For a more detailed description, see Appendix A.
b Where possible, we report a state’s rank as compared to other states on a given metric. For example, out of 51 states, New Hampshire has the 22nd-highest percentage of teachers who are union members. Otherwise, we report a status: New Hampshire has mandatory collective bargaining, and union agency fees are permitted. For a more detailed description of our metrics and methodology, see Appendix A. To request the raw data for your state, send an email to [email protected].
c For all survey questions, stakeholders were asked specifically about teacher unions, candidates, policies, and leaders in their state. In addition, we asked about unions and policies in the “current legislative session,” but because legislative calendars vary from state to state, responses refer to policies proposed and enacted within the 2010-11 window.
17
40

Overall Rank: 30thTier 3 (Average)
NEW HAMPSHIRE
ENDNOTES
1 A state’s overall rank is calculated as follows: First, we score it on multiple sub-indicators (sub-indicator data and scores for New Hampshire are shown in the table, New Hampshire Rankings by Area and Indicator). Second, we take a weighted average of the sub-indicators in each of five areas. In each area, we use that average to place the states in rank order: For example, in Area 1: Resources and Membership, New Hampshire is ranked 24th of 51 based on the weighted average of its sub-indicators. To generate the state’s overall rank, we average the five area ranks together, then re-order the states. For a more detailed description of data sources and methodology, see Appendix A.
2 Readers should note that these figures include only direct donations from unions and union-connected PACs, but not their spending on electioneering/advertising, mobilizing the union’s own membership, lobbying, or advocacy. A recent Wall Street Journal report found that donations and lobbying activities account for a small share of union political spending compared with their expenditures on member mobilization and advocacy. Even the AFT agreed, making the argument that since its mission is organizing and activism, it will naturally spend significant amounts on these activities. Thus, the percentages we report here are extremely conservative representations of what unions actually spend on politics. For more information, see Appendix A, Area 2; Tom McGinty and Brody Mullins, “Political Spending by Unions Far Exceeds Direct Donations,” Wall Street Journal, July 10, 2012; and Jeff Hauser, “Wall Street Journal Compares Union Political Spending to Corporate Donations,” AFL-CIO, July 10, 2012.
3 At the time of publication, the 2000 conventions were the most recent for which such detailed data were available in forms that met rigorous standards. However, 2008 data provided by the Democratic National Convention were highly correlated with the reliable figures from 2000.
4 Matt Murray, “Taxes And Schools: An In-Depth Look Into CACR6, CACR12, and CACR13,” Hampton-NorthHamptonPatch.com, June 2, 2012, http://hampton-northhampton.patch.com/blog_posts/taxes-and-schools-an-in-depth-look-into-cacr-6-cacr12-and-cacr13.
5 “CACR12 Wrong for New Hampshire’s Schoolchildren,” NEA New Hampshire, May 31, 2012, http://www.neanh.org/home/29.htm.
6 Holly Ramer, “NH Education Amendment Fails In House,” Associated Press, June 6, 2012, http://www.boston.com/news/local/new_hampshire/articles/2012/06/06/nh_school_funding_amendment_faces_key_vote/.
7 Laura Hainey, “CACR’s 6 And 12 Defeated,” New Hampshire Labor News, June 7, 2012, http://nhlabornews.com/2012/06/aft-nh-cacrs-6-and-12-defeated/.
8 “AFT-NH Member Action Needed – Defeat House Bills 1667, 1645, 1685, And 1206,” AFT New Hampshire, http://nh.aft.org/index.cfm?action=article&articleID=fca8369c-70b5-43d0-9edd-ec0e800fe39c.
9 Jake Berry, “Labor Remains Issue For Legislators,” Nashua Telegraph, March 18, 2012, http://www.nashuatelegraph.com/news/953922-196/capitol-watch-labor-remains-issue-for-legislators.html
10 Garry Rayno, “House Passes Right To Work Bill, But Well Short Of Votes Needed To Override Likely Veto,” New Hampshire Union Leader, March 14, 2012, http://www.unionleader.com/article/20120314/NEWS06/703149975.
11 “Governor’s Veto Message Regarding SB 372,” Office of Governor John Lynch, June 18, 2012, http://www.governor.nh.gov/media/news/2012/061812-sb372.htm.

Overall Rank: 7thTier 1 (Strongest)
NEW JERSEY
IntroductionPart IV: Taking a Closer Look–Teacher Union Influence Area
AREA 1: RESOURCES AND MEMBERSHIP
TIED FOR 1ST
New Jersey’s state teacher unions benefit
from abundant internal resources: With
97.1 percent of its teachers unionized,
the Garden State has the 6th-highest
membership rate of 51 jurisdictions. On
top of that, the NEA and AFT state-level
affiliates post $936 in annual revenue per
teacher (3rd of 51). Further, New Jersey
teachers see an unparalleled financial
commitment to K–12 education: 24.3
percent of state expenditures are devoted
to this domain (10th) and annual per-pupil
spending is high at $15,116 (6th).
AREA 2: INVOLVEMENT IN POLITICS2
TIED FOR 26TH
Despite ample revenues, the political
activity of New Jersey state teacher unions
ranks them in the middle of the national
pack. In the past decade, 0.58 percent of
total donations to candidates for state
office, and 0.68 percent of the donations to
state political parties, came from teacher
unions (27th and 31st, respectively).
Fifteen percent of the state’s delegates to
the Democratic and Republican national
conventions were teacher union members
(20th).3
NEW JERSEY OVERALL RANK: 7TH1
TIER 1 (STRONGEST)
STRONGER WEAKER
1. RESOURCES AND MEMBERSHIP
OVERALL
2. INVOLVEMENT IN POLITICS
3. SCOPE OF BARGAINING
4. STATE POLICIES
5. PERCEIVED INFLUENCE
7
1
26
5
2
17

Overall Rank: 7thTier 1 (Strongest)
NEW JERSEY
AREA 3: SCOPE OF BARGAINING
TIED FOR 17TH
New Jersey is one of twenty-one states
that both require collective bargaining in
education and allow unions to automatically
collect agency fees, a key source of
revenue, from non-member teachers. The
state slightly limits the breadth of that
bargaining: Of twenty-one items examined
in our metric, New Jersey requires that six
(more than most states) be bargained—
wages, hours, terms and conditions of
employment, grievance procedures, leave,
and class load. It prohibits three (also more
than most states) items from inclusion—
teacher transfer/reassignment, layoffs/
reductions in force, and pension/retirement
benefits. The remaining twelve are implicitly
permitted because the state does not
address them. In addition, teacher strikes
are not permitted.
AREA 4: STATE POLICIES
5TH
At the time we calculated our metric, New
Jersey’s teacher employment policies
were closely aligned with traditional
union interests, and its charter laws were
only slightly less so. The state does not
support performance pay and, up until
June 2012, it did not require student
achievement to factor into either teacher
evaluations or tenure decisions (which
teachers received after three years, the
national norm). In addition, there were no
articulated consequences for unsatisfactory
evaluations. This is changing, however.
S-1455, enacted but not yet implemented as
of press time, requires that tenure decisions
be informed by evidence of student
learning, makes ineffective teachers eligible
for dismissal, and extends the probationary
period from three to four years (see
sidebar). As for charter laws, the state
does not cap the number of such schools
and allows all forms (new, conversion, and
virtual). Charters are automatically exempt
from district laws and state regulations,
with the exception of teacher certification
requirements, and start-up charters are
fully exempt from collective bargaining
agreements as well. However, only the state
commissioner of education may authorize
charters of any kind.
AREA 5: PERCEIVED INFLUENCE
2ND
New Jersey’s teacher unions rank behind
only California’s in their reputation for
influence in state education policy. Indeed,
stakeholders unanimously rate them
as the most important shapers of such
policy. They also agree that the unions are
effective in protecting dollars for education
(even in times of cutbacks), and strongly
agree that they are effective in warding off
policy proposals with which they disagree.
Though they report that policies proposed
by the governor during the latest legislative
session were not at all in line with teacher
union priorities, they counter that the
session’s policy outcomes were mostly in
line with union priorities—a likely example
of the union’s power.4 Finally, they note,
again unanimously, that teacher unions
need not make concessions to ensure that
their preferred policies are enacted.
OVERALL
7TH
New Jersey’s teacher unions have leveraged
their robust resources and membership
to build a strong reputation and maintain
favorable policies at the state level. It is
likely because their reputation is so strong
that they need not contribute significantly
to state political campaigns (although they
do spend significant dollars on their own
political advertising—see sidebar).

Overall Rank: 7thTier 1 (Strongest)
NEW JERSEY
Republican Governor Chris Christie is not exactly a fan of unions. Exhibit A: In 2011, he co-authored a bill with Senate president (and Democrat) Steve Sweeney that raised pension contributions from current employees and eliminated cost-of-living increases in retiree benefits.5 As passed, the law also stripped teachers and other public employees of the right to bargain over those provisions in the future.6 In response, New Jersey Education Association (NJEA) President Barbara Keshishian rebuked state leaders: “A legislature and governor who will raid the pension checks of retirees and the paychecks of middle-class workers but lack the courage or integrity to ask the very wealthy to share the sacrifice of even a modest tax increase are not the representatives of the people who elected them.”7 (The NJEA also launched a million-dollar ad campaign against Sweeney, who won re-election anyway.)8
Exhibit B: After a year-and-a-half of debate on teacher tenure, in May 2012 Christie admonished the Democrat-led legislature—with his trademark charm and subtlety—“Do not send me watered down B.S. tenure reform.”9 Whether they followed instructions is arguable. The bill did extend the pre-tenure probationary period from three to four years, link tenure to teacher performance, and make ineffective teachers eligible for dismissal. The NJEA declared the overhaul a “win-win,” however, and praised Christie for including the union when crafting the bill.10 It’s not surprising that the union supported it: “last in, first out” layoffs remained untouched, and firing a tenured teacher first requires the approval of an independent arbitrator.11 Perhaps more surprising is that Christie included the NJEA at all, considering his comments on Face the Nation a year earlier: “the teachers of New Jersey deserve a union as great as they are…and they don’t have it.”12 Could this be a sign of a kinder, gentler Christie? Unlikely. It’s more like the mark of a governor who knows that bipartisan collaboration plays well: Christie boasted at the 2012 Republican National Convention that “They said it was impossible to touch the third rail of politics, to take on the public-sector unions and to reform a pension and health benefits system that was headed to bankruptcy. But with bipartisan leadership…we did it. [And] they said that it was impossible to speak the truth to the teachers’ union, [they said that real teacher tenure reform] would never happen. But for the first time in 100 years, with bipartisan support, you know the answer. We did it.”13 Seems like everyone in New Jersey is claiming a victory.
A TRUE WIN-WIN?

Overall Rank: 7thTier 1 (Strongest)
NEW JERSEY
OVERALL RANK: 7TH
Area and Ranka General Indicator Sub-IndicatorSub-Indicator Rank/Statusb
AREA 1: RESOURCES & MEMBERSHIP
Membership By rank, what percentage of public-school teachers in the state are union members? 6th
Revenue By rank, what is the total yearly revenue (per teacher in the state) of the state-level NEA and/ or AFT affiliate(s)?
3rd
Spending on education By rank, what percentage of state expenditures (of state general funds, state restricted funds, state bonds, and federal “pass-through” funds) is directed to K-12 education?
10th*
By rank, what is the total annual per-pupil expenditure (of funds from federal, state, and local sources) in the state?
6th
By rank, what percentage of total annual per-pupil expenditures is directed to teacher salaries and benefits?
39th
AREA 2: INVOLVEMENTIN POLITICS
Contributions to candidates and political parties
By rank, what percentage of the total contributions to state candidates was donated by teacher unions?
27th
By rank, what percentage of the total contributions to state-level political parties was donated by teacher unions?
31st
Industry influence By rank, what percent of the contributions to state candidates from the ten highest-giving sectors was donated by teacher unions?
27th
Status of delegates By rank, what percentage of the state’s delegates to the Democratic and Republican conventions were members of teacher unions?
20th*
AREA 3:SCOPE OF BARGAINING
Legal scope of bargaining What is the legal status of collective bargaining? Mandatory
By rank, how broad is the scope of collective bargaining? 24th*
Automatic revenue streams What is the unions’ legal right to automatically collect agency fees from non-members and/or collect member dues via automatic payroll deductions?
Permitted
Right to strike What is the legal status of teacher strikes? Prohibited
AREA 4:STATE POLICIES
Performance pay Does the state support performance pay for teachers? State does not support
Retirement By rank, what is the employer- versus employee-contribution rate to the teacher pension system? **
Evaluationsc What is the maximum potential consequence for veteran teachers who receive unsatisfactory evaluation(s)?
No consequences articulated
Is classroom effectiveness included in teacher evaluations? If so, how is it weighted? Not required
Terms of employmentc How long before a teacher earns tenure? Three years
Is student/teacher performance considered in tenure decisions? If so, how is it weighted? Not included
Is seniority considered in teacher layoff decisions? If so, how is it weighted? Required; Considered among other factors
Is teacher performance included in teacher layoff decisions? If so, how is it weighted? Not required
By rank, what percentage of the teaching workforce was dismissed due to poor performance? 27th
Class size Is class size restricted for grades 1-3? If so, is the restriction higher or lower than the national average (20)?
Yes; Higher
NEW JERSEY RANKINGS BY AREA AND INDICATOR
1*
26*
17*
5

Overall Rank: 7thTier 1 (Strongest)
NEW JERSEY
Area and Rank General Indicator Sub-IndicatorSub-Indicator Rank/Status
AREA 4:STATE POLICIES
(cont.)
Charter school structural limitations
Is there a cap (limit) placed on the number of charter schools that can operate in the state (or other jurisdiction) and/or on the number of students who can attend charter schools?
No state cap
Does the state allow a variety of charter schools: start-ups, conversions, and virtual schools? Yes
How many charter authorizing options exist? How active are those authorizers? Single option; Some activity
Charter school exemptions Are all charter schools automatically exempt from state laws and state/district regulations (except those that safeguard students and fiscal accountability)? If not, are they eligible for exemptions?
Yes
Are all charter schools automatically exempt from state teacher-certification requirements? If not, are they eligible for exemptions?
No; Schools cannot apply for exemptions
Are all charter schools automatically exempt from collective bargaining agreements (CBAs)? If not, are they eligible for exemptions?
Partially; Full automatic exemption for some schools
AREA 5:PERCEIVED INFLUENCEd
Relative influence of teacher unions
How do you rank the influence of teacher unions on education policy compared with other influential entities?
Most influential
Influence over campaigns On a scale from always to never, how often do Democratic candidates need teacher-union support to get elected?
Often
On a scale from always to never, how often do Republican candidates need teacher-union support to get elected?
Rarely/Sometimes
Influence over spending To what extent, from strongly agree to strongly disagree, do you agree that even in times of cutbacks, teacher unions are effective in protecting dollars for education?
Agree
Given recent budgetary constraints, would you say that teacher unions generally make concessions to prevent reductions in pay and benefits or fight hard to prevent those reductions?
Fight
Influence over policy To what extent, from strongly agree to strongly disagree, do you agree that teacher unions ward off proposals in your state with which they disagree?
Strongly agree
On a scale from always to never, how often do existing state education policies reflect teacher-union priorities?
Often/Always
To what extent, from totally in line to not at all in line, were state education policies proposed by the governor during your state’s latest legislative session in line with teacher-union priorities?
Not at all/Mostly not in line
To what extent, from totally in line to not at all in line, were legislative outcomes of your state’s latest legislative session in line with teacher-union priorities?
Mostly in line
Influence over key stakeholders
On a scale from always to never, how often have the priorities of state education leaders aligned with teacher-union positions in the past three years?
Sometimes/Often
Would you say that teacher unions typically compromise with policymakers to ensure that their preferred policies are enacted, or typically need not make concessions?
Does not concede
* Tied with another state
** Insufficient data; see Appendix A.
a Area ranks are calculated using a weighted average of sub-indicators. For a more detailed description, see Appendix A.
b Where possible, we report a state’s rank as compared to other states on a given metric. For example, out of 51 states, New Jersey has the 6th-highest percentage of teachers who are union members. Otherwise, we report a status: New Jersey has mandatory collective bargaining, and union agency fees are permitted. For a more detailed description of our metrics and methodology, see Appendix A. To request the raw data for your state, send an email to [email protected].
c See note in Area 4, above.
d For all survey questions, stakeholders were asked specifically about teacher unions, candidates, policies, and leaders in their state. In addition, we asked about unions and policies in the “current legislative session,” but because legislative calendars vary from state to state, responses refer to policies proposed and enacted within the 2010-11 window.
5
2

Overall Rank: 7thTier 1 (Strongest)
NEW JERSEY
ENDNOTES
1 A state’s overall rank is calculated as follows: First, we score it on multiple sub-indicators (sub-indicator data and scores for New Jersey are shown in the table, New Jersey Rankings by Area and Indicator). Second, we take a weighted average of the sub-indicators in each of five areas. In each area, we use that average to place the states in rank order: For example, in Area 1: Resources and Membership, New Jersey is ranked 1st of 51 based on the weighted average of its sub-indicators. To generate the state’s overall rank, we average the five area ranks together, then re-order the states. For a more detailed description of data sources and methodology, see Appendix A.
2 Readers should note that these figures include only direct donations from unions and union-connected PACs, but not their spending on electioneering/advertising, mobilizing the union’s own membership, lobbying, or advocacy. A recent Wall Street Journal report found that donations and lobbying activities account for a small share of union political spending compared with their expenditures on member mobilization and advocacy. Even the AFT agreed, making the argument that since its mission is organizing and activism, it will naturally spend significant amounts on these activities. Thus, the percentages we report here are extremely conservative representations of what unions actually spend on politics. For more information, see Appendix A, Area 2; Tom McGinty and Brody Mullins, “Political Spending by Unions Far Exceeds Direct Donations,” Wall Street Journal, July 10, 2012; and Jeff Hauser, “Wall Street Journal Compares Union Political Spending to Corporate Donations,” AFL-CIO, July 10, 2012.
3 At the time of publication, the 2000 conventions were the most recent for which such detailed data were available in forms that met rigorous standards. However, 2008 data provided by the Democratic National Convention were highly correlated with the reliable figures from 2000.
4 We asked stakeholders about unions and policies in the “current legislative session,” but because legislative calendars vary from state to state, responses refer to policies proposed and enacted within the 2010-11 window.
5 Sean Cavanagh, “N.J. Latest State To Move On Pension, Health Care Changes,” Education Week, June 24, 2011, http://blogs.edweek.org/edweek/state_edwatch/2011/06/new_jersey_latest_state_moving_forward_with_pension_changes.html.
6 Mark J. Magyar, “Collective Bargaining A Casualty Of The Christie-Sweeney Deal,” NewJerseySpotlight.com, June 16, 2011, http://www.njspotlight.com/stories/11/0616/0319/.
7 Barbara Keshishian, “Assembly Vote Strips Public Employees Of Rights,” June 23, 2011, http://www.njea.org/news/2011-06-23/assembly-vote-strips-public-employees-of-rights.
8 Magyar.
9 Maryann Spoto, “Christie To Dems: No ‘Watered-Down’ Teacher Tenure Bill,” NorthJersey.com, May 8, 2012, http://www.northjersey.com/news/Christie_to_Dems_No_watered-down_tenure_bill.html.
10 “A Win-Win For Students, Teachers, And The Public,” New Jersey Education Association, August 6, 2012, http://www.njea.org/news/2012-08-06/a-win-win-for-students-teachers-and-the-public.
11 Ben Velderman, “Despite Spin, Unions Win And Students Lose In Jersey,” EAGnews.org, June 19, 2012, http://eagnews.org/despite-spin-unions-win-and-students-lose-in-jersey/.
12 Sharon Harris-Zlotnick, “Gov. Christie Says NJ Teachers Deserve Better Than NJEA,” NewJerseyNewsroom.com, March 2, 2011, http://www.nje3.org/?p=5105.
13 “Transcript Of Chris Christie’s Speech At The Republican National Convention,” August 28, 2012, http://www.foxnews.com/politics/2012/08/28/transcript-chris-christie-speech-at-republican-national-convention/.

Overall Rank: 37thTier 4 (Weak)
NEW MEXICO
IntroductionPart IV: Taking a Closer Look–Teacher Union Influence Area
AREA 1: RESOURCES AND MEMBERSHIP
46TH
New Mexico’s teacher unions have few
internal resources, and the state’s districts
commit relatively little money to teacher
salaries and benefits. With just 41.0
percent of its teachers unionized, the Land
of Enchantment has by far the lowest
unionization rate of any state in which
bargaining is mandatory (and is 48th of
51 jurisdictions overall). Low membership
contributes to low annual revenue—the
state-level NEA and AFT affiliates bring
just $236 for every New Mexico teacher
(37th). Compared to other states, per-pupil
expenditures are middling, $11,101 annually
(28th), and just 52.0 percent of those
dollars goes toward teacher salaries and
benefits (42nd).
AREA 2: INVOLVEMENT IN POLITICS2
TIED FOR 32ND
Union involvement in the past decade
of New Mexico politics puts the state
near the middle of the national pack.3
Union contributions accounted for 0.90
percent of total donations to candidates
for state office (20th), and 4.6 percent of
the donations to candidates from the ten
highest-giving sectors in the state (28th).
Teacher unions also gave 0.78 percent
of the contributions received by state
political parties (29th). Finally, just 5.9
percent of all of New Mexico’s delegates
to the Democratic and Republican national
conventions were teacher union members
(only five states had fewer).4
NEW MEXICO OVERALL RANK: 37TH1
TIER 4 (WEAK)
STRONGER WEAKER
1. RESOURCES AND MEMBERSHIP
OVERALL
2. INVOLVEMENT IN POLITICS
3. SCOPE OF BARGAINING
4. STATE POLICIES
5. PERCEIVED INFLUENCE
37
46
32
29
8
35

Overall Rank: 37thTier 4 (Weak)
NEW MEXICO
AREA 3: SCOPE OF BARGAINING
TIED FOR 35TH
New Mexico is one of thirty-two states that
require collective bargaining. The scope
of bargaining is not particularly narrow or
permissive: Of twenty-one items examined
in our metric, New Mexico mandates that
four be bargained: wages, hours, terms and
conditions of employment, and grievance
procedures. Only one item is excluded—
pension/retirement benefits. Bargaining
over management rights is explicitly
permitted, and state law implicitly includes
the remaining fifteen items in the scope
of bargaining by not addressing them
at all. The state allows teacher unions to
collect agency fees from non-members,
but they cannot automatically deduct
dues from member paychecks unless they
first negotiate with their district to do so.
Teacher strikes are prohibited.
AREA 4: STATE POLICIES
29TH
While some of New Mexico’s teacher
employment policies align with traditional
union interests, many do not. The state
does not support performance pay, does
not require student achievement data to
factor into teacher evaluations or tenure
decisions, and does not compel districts
to consider performance in determining
which teachers are laid off. But teachers
pay a greater share of their retirement
contributions than their employers do—
the same is true in only four other states.
And, teachers are automatically eligible for
dismissal after unsatisfactory evaluations.
The state’s charter laws are equally mixed.
While charter schools must abide by the
state’s teacher certification requirements,
they are automatically exempt from
collective bargaining agreements.
AREA 5: PERCEIVED INFLUENCE
8TH
Despite low indications of strength in the
other four areas, New Mexico’s teacher
unions have a strong reputation among
education stakeholders. Our survey
respondents rank the unions one of the
top two most influential entities in state
education policy (the association of school
administrators is the other), and note
that Democrats (often) and Republicans
(sometimes) need teacher union support
to be elected. According to stakeholders,
teacher unions fight rather than concede
to prevent reductions in pay and benefits,
although they are neither effective nor
ineffective in protecting dollars for
education in general. Interestingly, while
stakeholders report that the policies
proposed by the governor in the latest
legislative session were mostly not in line
with union priorities, the policies enacted
in the latest session were mostly in line
with those priorities, and existing policies
frequently reflect union priorities. This is
perhaps a sign that the unions’ power lies in
their ability to shape the outcomes of state
politics, since it appears that legislators are
open to union input on measures related to
education (see sidebar).
OVERALL
37TH
While New Mexico’s unions ranked among
the least powerful in four of the five areas
reported here, stakeholders perceived that
their actual influence is quite substantial.

Overall Rank: 37thTier 4 (Weak)
NEW MEXICO
New Mexico’s new evaluation system may be a tool to evaluate the teachers, but the state’s teacher unions give it an F and called the state’s education leader a cheater.
With 87 percent of the state’s schools failing to meet federal accountability requirements for student achievement, in February 2012 state Secretary-Designate of Education Hanna Skandera sought a waiver from provisions of the No Child Left Behind act. She wanted to reward schools for growth, even if they were unable to bring students up to the required proficiency levels. The waiver touted a new evaluation system, jointly developed by a task force of teachers, administrators, parents, and teacher union representatives, under which half of a teacher’s rating would be based on student test scores—an evaluation system that had not actually been passed yet by the state legislature.5,6 After working with the NEA-NM to ensure due process for teachers was protected, the House approved the new system, but the Senate did not.7
Skandera was left with two choices: put the future of the waiver at risk, or take matters into her own hands. With the blessing of Governor Susana Martinez, Skandera opted for the latter. Using an executive order rather than statute, the state moved ahead with a standardized-test-based evaluation system (this time with test results comprising 35 percent, not 50 percent, of the total).8 In explaining why the Public Education Department circumvented the legislative process, Skandera stated bluntly, “We just can’t wait.”9 Predictably, her action incensed the state’s unions. Albuquerque Teachers Federation (ATF) president Ellen Bernstein called Skandera’s and Martinez’s policies “slogan reform,” image-boosting ploys with no real benefits for students.10 They issued a “no confidence” vote for Skandera in May 2012.
In July 2012, the ATF and the American Federation of Teachers New Mexico organized a massive rally, during which president Stephanie Ly proclaimed, “the state needs to go back to the drawing board.”11 But despite the conflict, it appears that New Mexico unions are more open to reform than their counterparts in other states—their objection, they say, is not to the inclusion of test scores in teacher evaluations, but that state education leaders steamrolled what began as a collaborative process.12
PLAYING BY HER OWN RULES

Overall Rank: 37thTier 4 (Weak)
NEW MEXICO
OVERALL RANK: 37TH
Area and Ranka General Indicator Sub-IndicatorSub-Indicator Rank/Statusb
AREA 1: RESOURCES & MEMBERSHIP
Membership By rank, what percentage of public-school teachers in the state are union members? 48th
Revenue By rank, what is the total yearly revenue (per teacher in the state) of the state-level NEA and/ or AFT affiliate(s)?
37th
Spending on education By rank, what percentage of state expenditures (of state general funds, state restricted funds, state bonds, and federal “pass-through” funds) is directed to K-12 education?
23rd
By rank, what is the total annual per-pupil expenditure (of funds from federal, state, and local sources) in the state?
28th
By rank, what percentage of total annual per-pupil expenditures is directed to teacher salaries and benefits?
42nd
AREA 2: INVOLVEMENTIN POLITICS
Contributions to candidates and political parties
By rank, what percentage of the total contributions to state candidates was donated by teacher unions?
20th
By rank, what percentage of the total contributions to state-level political parties was donated by teacher unions?
29th
Industry influence By rank, what percent of the contributions to state candidates from the ten highest-giving sectors was donated by teacher unions?
28th
Status of delegates By rank, what percentage of the state’s delegates to the Democratic and Republican conventions were members of teacher unions?
45th
AREA 3:SCOPE OF BARGAINING
Legal scope of bargaining What is the legal status of collective bargaining? Mandatory
By rank, how broad is the scope of collective bargaining? 20th*
Automatic revenue streams What is the unions’ legal right to automatically collect agency fees from non-members and/or collect member dues via automatic payroll deductions?
Automatic payroll deduction must be negotiated
Right to strike What is the legal status of teacher strikes? Prohibited
AREA 4:STATE POLICIES
Performance pay Does the state support performance pay for teachers? State does not support
Retirement By rank, what is the employer- versus employee-contribution rate to the teacher pension system? 45th
Evaluations What is the maximum potential consequence for veteran teachers who receive unsatisfactory evaluation(s)?
Eligible for dismissal
Is classroom effectiveness included in teacher evaluations? If so, how is it weighted? Not required
Terms of employment How long before a teacher earns tenure? Three years
Is student/teacher performance considered in tenure decisions? If so, how is it weighted? Not included
Is seniority considered in teacher layoff decisions? If so, how is it weighted? Optional; Weighted at district discretion
Is teacher performance included in teacher layoff decisions? If so, how is it weighted? Not required
By rank, what percentage of the teaching workforce was dismissed due to poor performance? 26th
Class size Is class size restricted for grades 1-3? If so, is the restriction higher or lower than the national average (20)?
Yes; Higher
NEW MEXICO RANKINGS BY AREA AND INDICATOR
46
32*
35*
29

Overall Rank: 37thTier 4 (Weak)
NEW MEXICO
Area and Rank General Indicator Sub-IndicatorSub-Indicator Rank/Status
AREA 4:STATE POLICIES
(cont.)
Charter school structural limitations
Is there a cap (limit) placed on the number of charter schools that can operate in the state (or other jurisdiction) and/or on the number of students who can attend charter schools?
State cap with some room for growth
Does the state allow a variety of charter schools: start-ups, conversions, and virtual schools? Start-ups and virtual schools only
How many charter authorizing options exist? How active are those authorizers? Two or more active/available options
Charter school exemptions Are all charter schools automatically exempt from state laws and state/district regulations (except those that safeguard students and fiscal accountability)? If not, are they eligible for exemptions?
No; Schools can apply for exemptions
Are all charter schools automatically exempt from state teacher-certification requirements? If not, are they eligible for exemptions?
No; Schools cannot apply for exemptions
Are all charter schools automatically exempt from collective bargaining agreements (CBAs)? If not, are they eligible for exemptions?
Yes
AREA 5:PERCEIVED INFLUENCEc
Relative influence of teacher unions
How do you rank the influence of teacher unions on education policy compared with other influential entities?
Most- or second-most influential
Influence over campaigns On a scale from always to never, how often do Democratic candidates need teacher-union support to get elected?
Often/Always
On a scale from always to never, how often do Republican candidates need teacher-union support to get elected?
Sometimes
Influence over spending To what extent, from strongly agree to strongly disagree, do you agree that even in times of cutbacks, teacher unions are effective in protecting dollars for education?
Neutral
Given recent budgetary constraints, would you say that teacher unions generally make concessions to prevent reductions in pay and benefits or fight hard to prevent those reductions?
Fight
Influence over policy To what extent, from strongly agree to strongly disagree, do you agree that teacher unions ward off proposals in your state with which they disagree?
Agree
On a scale from always to never, how often do existing state education policies reflect teacher-union priorities?
Often
To what extent, from totally in line to not at all in line, were state education policies proposed by the governor during your state’s latest legislative session in line with teacher-union priorities?
Mostly not in line/Somewhat in line
To what extent, from totally in line to not at all in line, were legislative outcomes of your state’s latest legislative session in line with teacher-union priorities?
Somewhat/Mostly in line
Influence over key stakeholders
On a scale from always to never, how often have the priorities of state education leaders aligned with teacher-union positions in the past three years?
**
Would you say that teacher unions typically compromise with policymakers to ensure that their preferred policies are enacted, or typically need not make concessions?
Does not generally concede
* Tied with another state
** Insufficient number of responses to this particular question
a Area ranks are calculated using a weighted average of sub-indicators. For a more detailed description, see Appendix A.
b Where possible, we report a state’s rank as compared to other states on a given metric. For example, out of 51 states, New Mexico has the 48th-highest percentage of teachers who are union members. Otherwise, we report a status: New Mexico has mandatory collective bargaining, and union agency fees are prohibited. For a more detailed description of our metrics and methodology, see Appendix A. To request the raw data for your state, send an email to [email protected].
c For all survey questions, stakeholders were asked specifically about teacher unions, candidates, policies, and leaders in their state. In addition, we asked about unions and policies in the “current legislative session,” but because legislative calendars vary from state to state, responses refer to policies proposed and enacted within the 2010-11 window.
29
8

Overall Rank: 37thTier 4 (Weak)
NEW MEXICO
ENDNOTES
1 A state’s overall rank is calculated as follows: First, we score it on multiple sub-indicators (sub-indicator data and scores for New Mexico are shown in the table, New Mexico Rankings by Area and Indicator). Second, we take a weighted average of the sub-indicators in each of five areas. In each area, we use that average to place the states in rank order: For example, in Area 1: Resources and Membership, New Mexico is ranked 46th of 51 based on the weighted average of its sub-indicators. To generate the state’s overall rank, we average the five area ranks together, then re-order the states. For a more detailed description of data sources and methodology, see Appendix A.
2 Readers should note that these figures include only direct donations from unions and union-connected PACs, but not their spending on electioneering/advertising, mobilizing the union’s own membership, lobbying, or advocacy. A recent Wall Street Journal report found that donations and lobbying activities account for a small share of union political spending compared with their expenditures on member mobilization and advocacy. Even the AFT agreed, making the argument that since its mission is organizing and activism, it will naturally spend significant amounts on these activities. Thus, the percentages we report here are extremely conservative representations of what unions actually spend on politics. For more information, see Appendix A, Area 2; Tom McGinty and Brody Mullins, “Political Spending by Unions Far Exceeds Direct Donations,” Wall Street Journal, July 10, 2012; and Jeff Hauser, “Wall Street Journal Compares Union Political Spending to Corporate Donations,” AFL-CIO, July 10, 2012.
3 The indicators in Area 2 are calculated using total contributions to state candidates and political parties from local, state, and national unions. In the majority of cases, the state unions gave much higher sums than all the local unions combined, with the national associations giving little (or nothing). New Mexico is an exception: combined donations from the NEA, the AFT, and the AFT-affiliated Albuquerque Teachers Federation nearly matched the donations from the state unions.
4 At the time of publication, the 2000 conventions were the most recent for which such detailed data were available in forms that met rigorous standards. However, 2008 data provided by the Democratic National Convention were highly correlated with the reliable figures from 2000.
5 Hailey Heinz, “Education Waiver Needs Work,” Albuquerque Journal, February 1, 2012, http://www.abqjournal.com/main/2012/02/01/news/education-waiver-needs-work.html.
6 Robert Nott, “Trio Of Bills Push For New Teacher Evaluation System,” New Mexican, February 2, 2012, http://www.santafenewmexican.com/localnews/2012-Legislature-Bills-push-for-teacher-evaluation-system.
7 “Legislative Advocacy Update,” National Education Association New Mexico, February 16, 2012, http://www.nea-nm.org/2002legislature/2012/2012%20current.html.
8 Milan Simonich, “Face-Off Looms On NM Teacher Evaluation,” El Paso Times, July 19, 2012, http://www.elpasotimes.com/news/ci_21107108/face-off-looms-teacher-evaluation.
9 Ibid.
10 Eddie Garcia, “Report Shows Decline In New Mexico Graduation Rates,” New Mexico Eyewitness News, March 19, 2012, http://www.kob.com/article/stories/S2544887.shtml.
11 Andra Cernavskis, “Protesters Rally Against Proposed Teacher Evaluation System,” New Mexican, July 18, 2012, http://www.santafenewmexican.com/localnews/071912teacherrally.
12 Hailey Heinz, “‘No Confidence’ Vote for Skandera,” Albuquerque Journal, May 9, 2012, http://www.abqjournal.com/main/2012/05/09/news/no-confidence-vote-for-skandera.html.

Overall Rank: 9thTier 1 (Strong)
NEW YORK
IntroductionPart IV: Taking a Closer Look–Teacher Union Influence Area
AREA 1: RESOURCES AND MEMBERSHIP
TIED FOR 1ST
New York’s state teacher union has
substantial internal resources and its
members benefit from generous funding
levels. Fully 98.4 percent of teachers are
unionized in the Empire State, and the
joint NEA-AFT New York State United
Teachers (NYSUT) brings in $536 annually
per teacher (the 20th-highest revenue
among 51 jurisdictions). New York also
spends more of its budget on K–12
education than do many other states (20.9
percent; 20th). These funds, combined
with local and federal dollars, amount to
per-pupil expenditures of $15,862 annually
(5th), of which a full 63.5 percent goes
toward teacher salaries and benefits
(by a considerable margin the highest
percentage in the nation).
AREA 2: INVOLVEMENT IN POLITICS2
TIED FOR 13TH
Over the past decade, New York’s teacher
unions have been more involved in politics
than those in many other states.3 Their
donations accounted for 0.68 percent of
total contributions received by candidates
for state office (22nd), and 5.0 percent
of the contributions to candidates from
the ten highest-giving sectors in the state
(26th). They are also prominent donors
to state political parties, contributing
3.4 percent of total party funds (5th).
Moreover, unions were comparatively
well-represented at the Democratic and
Republican national conventions, with
eighteen percent of New York delegates
identifying as teacher union members
(13th).
NEW YORK OVERALL RANK: 9TH1 TIER 1 (STRONG)
STRONGER WEAKER
1. RESOURCES AND MEMBERSHIP
OVERALL
2. INVOLVEMENT IN POLITICS
3. SCOPE OF BARGAINING
4. STATE POLICIES
5. PERCEIVED INFLUENCE
9
1
13
24
21
19

Overall Rank: 9thTier 1 (Strong)
NEW YORK
AREA 3: SCOPE OF BARGAINING
19TH
New York is one of twenty-one states that
require collective bargaining and allow
unions to automatically collect agency fees
from non-member teachers. But the state
limits the scope of that bargaining: Just
four of the twenty-one items examined
in our metric are required subjects of
bargaining: wages, hours, terms and
conditions of employment, and grievance
procedures. Of the remaining seventeen,
New York prohibits bargaining over tenure
and pensions, lets districts decide whether
to bargain over class size, and implicitly
includes the other fourteen items in the
scope of bargaining by not addressing
them in state law. The state prohibits
teacher strikes—though it must be noted
that some of the country’s largest and
longest teacher strikes have occurred there.
AREA 4: STATE POLICIES
TIED FOR 24TH
Many New York policies align with
traditional teacher union interests. For
example, the state does not support
performance pay for teachers and
seniority is the sole factor in layoff
decisions. In addition, employers pay
a greater share of employee pensions
(relative to teacher contributions) than
in many other states. However, teacher
evaluations must be significantly informed
by student achievement, and teachers
are automatically eligible for dismissal
after unsatisfactory ratings. Charter law is
an equally mixed bag: the state caps the
number of schools (but there is room for
ample growth under the gap), allows new
and conversion charters (but not virtual
schools), and partially (but not fully)
exempts charters from state laws, district
regulations, and collective bargaining
provisions.
AREA 5: PERCEIVED INFLUENCE
21ST
Stakeholders in New York perceive teacher
unions to be an active, but not necessarily
effective, presence in policymaking.
Respondents rank teacher unions among
the most influential entities in education
policy (along with the board of regents and
education advocacy organizations). But
they also note that the policies proposed
by the governor in the latest legislative
session were mostly not in line with
teacher union priorities, and outcomes of
the session were only somewhat in line.4
(Likely because the policy landscape is in
flux; see sidebar.) Further, they report that
state education leaders only sometimes
align with teacher union priorities, and that
teacher unions need to compromise to see
some of their preferred policies enacted.
OVERALL
9TH
New York is the birthplace of the teacher
union movement, and its state teacher
union ranks as one of the strongest
in the country. Bargaining laws and
teacher employment policies are union-
favorable (especially those codified during
New York’s decades of labor-friendly
leadership), and the union has significant
resources from its members. It falls short of
garnering a strong reputation, however—
likely because it faces stiff competition
from high-profile education reformers and
a governor with extensive powers over
education policy (see sidebar).

Overall Rank: 9thTier 1 (Strong)
NEW YORK
New York City is home to some of the biggest names in education reform—Joel Klein, Geoffrey Canada, Eva Moscowitz, and Michael Bloomberg, to name a few—yet in 2012, the most significant progress in New York came from Albany. When the state passed legislation in 2010 guaranteeing that it would implement a statewide high-quality teacher evaluation system as part of its $700 million Race to the Top application, Governor Andrew Cuomo had no idea that it would take education leaders so long to work out the details. But after more than two years, and with millions of dollars at risk, the New York State United Teachers (NYSUT) and state education officials had yet to agree on what those evaluations would look like. So Cuomo gave them a deadline, and an ultimatum: Decide, or else he would decide for them.5 After an all-night negotiating session, New York had new teacher evaluations: 40 percent of a teacher’s score would be based on student achievement (measured at least in part by growth on state standardized tests), and 60 percent on classroom observations and other subjective measures.6 Cuomo called the agreement “a victory for all New Yorkers” and NYSUT President Richard Iannuzzi conceded (or simply put on a brave face) when he said it is “good for students and fair to teachers.”7 Iannuzzi’s comments were a stark contrast to those he made less than a year earlier when the state board initially proposed increasing the role of state test scores from the previously-mandated 20 percent to up to 40 percent: “[the Board] chose politics over sound educational policy and the cheap way over the right way, doubling down on high-stakes tests of dubious worth.”8 Perhaps Cuomo’s ultimatum changed his mind, or perhaps Iannuzzi didn’t want to be left holding the bag if the state, and its teachers, lost their RTTT award.
Not a week after the agreement, New York City Mayor Bloomberg released the performance rankings of 18,000 individual teachers (the city had been using value-added evaluations for four years). NYC’s United Federation of Teachers (UFT) had tried legal avenues to block the disclosure, but to no avail, and now everyone in the city, and the nation, could see teachers’ names and ratings in the Wall Street Journal.9 Outraged, the UFT turned to state lawmakers and Cuomo, pressing for legislation to protect its members’ privacy. The NYSUT joined the fray, calling the release “a betrayal of the essential purpose of evaluations” and worrying that publicizing the ratings would undermine the new statewide system;10 even Bill Gates wrote in a New York Times editorial that “the surest way to weaken [evaluations] is to twist it into a capricious exercise in public shaming.”11 The result: Cuomo proposed a bill that allowed parents to see individual teachers’ rankings but blocked districts from releasing that information to the public—although the measure would not stop parents from sharing the scores themselves. Bloomberg opposed the bill outright, while the NYSUT wanted even stricter privacy measures; in the end, each took what they could get as lawmakers overwhelmingly approved the measure. “I’m glad it’s over,” said Iannuzzi.12 Considering the amount of time state leaders and the union have spent debating the evaluations, so is everybody else.
FULL DISCLOSURE

Overall Rank: 9thTier 1 (Strong)
NEW YORK
OVERALL RANK: 9TH
Area and Ranka General Indicator Sub-IndicatorSub-Indicator Rank/Statusb
AREA 1: RESOURCES & MEMBERSHIP
Membership By rank, what percentage of public-school teachers in the state are union members? 2nd
Revenue By rank, what is the total yearly revenue (per teacher in the state) of the state-level NEA and/ or AFT affiliate(s)?
20th
Spending on education By rank, what percentage of state expenditures (of state general funds, state restricted funds, state bonds, and federal “pass-through” funds) is directed to K-12 education?
20th
By rank, what is the total annual per-pupil expenditure (of funds from federal, state, and local sources) in the state?
5th
By rank, what percentage of total annual per-pupil expenditures is directed to teacher salaries and benefits?
1st
AREA 2: INVOLVEMENTIN POLITICS
Contributions to candidates and political parties
By rank, what percentage of the total contributions to state candidates was donated by teacher unions?
22nd
By rank, what percentage of the total contributions to state-level political parties was donated by teacher unions?
5th
Industry influence By rank, what percent of the contributions to state candidates from the ten highest-giving sectors was donated by teacher unions?
26th
Status of delegates By rank, what percentage of the state’s delegates to the Democratic and Republican conventions were members of teacher unions?
13th
AREA 3:SCOPE OF BARGAINING
Legal scope of bargaining What is the legal status of collective bargaining? Mandatory
By rank, how broad is the scope of collective bargaining? 28th
Automatic revenue streams What is the unions’ legal right to automatically collect agency fees from non-members and/or collect member dues via automatic payroll deductions?
Permitted
Right to strike What is the legal status of teacher strikes? Prohibited
AREA 4:STATE POLICIES
Performance pay Does the state support performance pay for teachers? State does not support
Retirement By rank, what is the employer- versus employee-contribution rate to the teacher pension system? 9th
Evaluations What is the maximum potential consequence for veteran teachers who receive unsatisfactory evaluation(s)?
Eligible for dismissal
Is classroom effectiveness included in teacher evaluations? If so, how is it weighted? Required; Significantly informs evaluation
Terms of employment How long before a teacher earns tenure? Three years
Is student/teacher performance considered in tenure decisions? If so, how is it weighted? Required; Included as one of multiple criteria
Is seniority considered in teacher layoff decisions? If so, how is it weighted? Required; Sole factor
Is teacher performance included in teacher layoff decisions? If so, how is it weighted? Not required
By rank, what percentage of the teaching workforce was dismissed due to poor performance? 14th
Class size Is class size restricted for grades 1-3? If so, is the restriction higher or lower than the national average (20)?
No restriction
NEW YORK RANKINGS BY AREA AND INDICATOR
1*
13*
19
24*

Overall Rank: 9thTier 1 (Strong)
NEW YORK
Area and Rank General Indicator Sub-IndicatorSub-Indicator Rank/Status
AREA 4:STATE POLICIES
(cont.)
Charter school structural limitations
Is there a cap (limit) placed on the number of charter schools that can operate in the state (or other jurisdiction) and/or on the number of students who can attend charter schools?
State cap with ample room for growth
Does the state allow a variety of charter schools: start-ups, conversions, and virtual schools? Start-ups and conversions only
How many charter authorizing options exist? How active are those authorizers? Two or more active/available options
Charter school exemptions Are all charter schools automatically exempt from state laws and state/district regulations (except those that safeguard students and fiscal accountability)? If not, are they eligible for exemptions?
Yes
Are all charter schools automatically exempt from state teacher-certification requirements? If not, are they eligible for exemptions?
Partially; All schools receive automatic exemptions for some teachers
Are all charter schools automatically exempt from collective bargaining agreements (CBAs)? If not, are they eligible for exemptions?
Partially; Some automatic exemptions for some schools
AREA 5:PERCEIVED INFLUENCEc
Relative influence of teacher unions
How do you rank the influence of teacher unions on education policy compared with other influential entities?
Second-most influential
Influence over campaigns On a scale from always to never, how often do Democratic candidates need teacher-union support to get elected?
Sometimes/Often
On a scale from always to never, how often do Republican candidates need teacher-union support to get elected?
Sometimes/Often
Influence over spending To what extent, from strongly agree to strongly disagree, do you agree that even in times of cutbacks, teacher unions are effective in protecting dollars for education?
Neutral
Given recent budgetary constraints, would you say that teacher unions generally make concessions to prevent reductions in pay and benefits or fight hard to prevent those reductions?
Fight
Influence over policy To what extent, from strongly agree to strongly disagree, do you agree that teacher unions ward off proposals in your state with which they disagree?
Neutral
On a scale from always to never, how often do existing state education policies reflect teacher-union priorities?
Sometimes/Often
To what extent, from totally in line to not at all in line, were state education policies proposed by the governor during your state’s latest legislative session in line with teacher-union priorities?
Mostly not in line
To what extent, from totally in line to not at all in line, were legislative outcomes of your state’s latest legislative session in line with teacher-union priorities?
Mostly not in line/Somewhat in line
Influence over key stakeholders
On a scale from always to never, how often have the priorities of state education leaders aligned with teacher-union positions in the past three years?
Sometimes/Often
Would you say that teacher unions typically compromise with policymakers to ensure that their preferred policies are enacted, or typically need not make concessions?
Generally compromise
* Tied with another state
a Area ranks are calculated using a weighted average of sub-indicators. For a more detailed description, see Appendix A.
b Where possible, we report a state’s rank as compared to other states on a given metric. For example, out of 51 states, New York has the 2nd-highest percentage of teachers who are union members. Otherwise, we report a status: New York has mandatory collective bargaining, and union agency fees are permitted. For a more detailed description of our metrics and methodology, see Appendix A. To request the raw data for your state, send an email to [email protected].
c For all survey questions, stakeholders were asked specifically about teacher unions, candidates, policies, and leaders in their state. In addition, we asked about unions and policies in the “current legislative session,” but because legislative calendars vary from state to state, responses refer to policies proposed and enacted within the 2010-11 window.
24*
21

Overall Rank: 9thTier 1 (Strong)
NEW YORK
ENDNOTES
1 A state’s overall rank is calculated as follows: First, we score it on multiple sub-indicators (sub-indicator data and scores for New York are shown in the table, New York Rankings by Area and Indicator). Second, we take a weighted average of the sub-indicators in each of five areas. In each area, we use that average to place the states in rank order: For example, in Area 1: Resources and Membership, New York is ranked 1st of 51 based on the weighted average of its sub-indicators. To generate the state’s overall rank, we average the five area ranks together, then re-order the states. For a more detailed description of data sources and methodology, see Appendix A.
2 Readers should note that these figures include only direct donations from unions and union-connected PACs, but not their spending on electioneering/advertising, mobilizing the union’s own membership, lobbying, or advocacy. A recent Wall Street Journal report found that donations and lobbying activities account for a small share of union political spending compared with their expenditures on member mobilization and advocacy. Even the AFT agreed, making the argument that since its mission is organizing and activism, it will naturally spend significant amounts on these activities. Thus, the percentages we report here are extremely conservative representations of what unions actually spend on politics. For more information, see Appendix A, Area 2; Tom McGinty and Brody Mullins, “Political Spending by Unions Far Exceeds Direct Donations,” Wall Street Journal, July 10, 2012; and Jeff Hauser, “Wall Street Journal Compares Union Political Spending to Corporate Donations,” AFL-CIO, July 10, 2012.
3 While our overall metric reports the strength of state teacher unions, this area also captures contributions to state campaigns and parties from other NEA- and AFT-affiliated state and local organizations. In New York, the NEA-affiliated New York State Council of Educational Associations was also a significant donor to state politics (albeit not at the level of the NYSUT), although it is officially a professional association/advocacy group and not a teacher union.
4 We asked stakeholders about unions and policies in the “current legislative session,” but because legislative calendars vary from state to state, responses refer to policies proposed and enacted within the 2010-11 window.
5 Lisa Fleisher, “Deal Clears Way For Teacher Evaluations In New York,” Wall Street Journal, February 16, 2012, http://blogs.wsj.com/metropolis/2012/02/16/deal-clears-way-for-teacher-evaluations-in-new-york/.
6 Fernando Santos and Winnie Hu, “A Last-Minute Deal On Teacher Evaluations,” School Book, February 16, 2012, http://www.schoolbook.org/2012/02/16/as-deadline-nears-a-compromise-on-teacher-evaluations/.
7 Ibid.; “NYSUT says Teacher Evaluation Agreement Is ‘Good For Students And Fair To Teachers,’” New York State United Teachers, February 16, 2012,http://www.nysut.org/cps/rde/xchg/nysut/hs.xsl/mediareleases_17505.htm.
8 Yoav Gonen, “Teachers Sue Over New State Ratings System,” New York Post, June 29, 2011, http://www.nypost.com/p/news/local/teachers_sue_over_new_state_ratings_Gx09N5GyGyXlxcjNA0xfMI.
9 Fernanda Santos and Sharon Otterman, “City Teacher Data Reports Are Released,” School Book, February 24, 2012, http://www.schoolbook.org/2012/02/24/teacher-data-reports-are-released/.
10 “NYSUT: Publicizing Teacher Ratings ‘Deplorable,’” New York State United Teachers, February 27, 2012, http://www.nysut.org/cps/rde/xchg/nysut/hs.xsl/mediareleases_17564.htm.
11 Bill Gates, “Shame Is Not The Solution,” New York Times, February 22, 2012, http://www.nytimes.com/2012/02/23/opinion/for-teachers-shame-is-no-solution.html?_r=2&ref=opinion.
12 Thomas Kaplan, “Albany To Limit The Disclosure Of Teacher Evaluations,” New York Times, June 21, 2012, http://www.nytimes.com/2012/06/22/nyregion/albany-to-limit-disclosure-of-teacher-evaluations.html.

Overall Rank: 40thTier 4 (Weak)
NORTH CAROLINA
IntroductionPart IV: Taking a Closer Look–Teacher Union Influence Area
AREA 1: RESOURCES AND MEMBERSHIP
TIED FOR 47TH
North Carolina’s NEA-affiliated state
teacher union has few internal resources
and its members enjoy relatively little
spending on K–12 education in the state.2
Collective bargaining in education is
prohibited in the Tarheel State, and just
49.5 percent of teachers are voluntary
members of teacher associations (the
46th-highest rate among 51 jurisdictions).
As a result, the North Carolina Association
of Educators (NCAE) brings in a mere
$111 in revenue each year per teacher in
the state (47th). North Carolina teachers
do, however, receive an unusually sizable
slice of a small pie when it comes to
expenditures on public education: While
annual per-pupil expenditures amount to
$9,024 annually per student (44th), 58.5
percent of those dollars go toward teacher
salaries and benefits (4th).
AREA 2: INVOLVEMENT IN POLITICS3
TIED FOR 29TH
Over the past decade, teacher unions gave
a significant amount to North Carolina
political parties, but were otherwise
relatively uninvolved in state campaigns.4
Union donations amounted to 2.7 percent
of all contributions received by political
parties (11th), but only 0.25 percent of total
dollars received by candidates for state
office (39th). Compared to other states,
union representation was moderate at
the Democratic and Republican national
conventions: 13.9 percent of North
Carolina’s delegates to the conventions
identified as teacher union members
(24th).5
NORTH CAROLINA OVERALL RANK: 40TH1
TIER 4 (WEAK)
STRONGER WEAKER
1. RESOURCES AND MEMBERSHIP
OVERALL
2. INVOLVEMENT IN POLITICS
3. SCOPE OF BARGAINING
4. STATE POLICIES
5. PERCEIVED INFLUENCE
40
47
29
12
11
48

Overall Rank: 40thTier 4 (Weak)
NORTH CAROLINA
AREA 3: SCOPE OF BARGAINING
TIED FOR 48TH; LAST PLACE
North Carolina has the most restrictive
bargaining laws in the nation. It is one of
only five states that prohibit collective
bargaining in education. No union or
professional association may collect agency
fees from non-members (and recent
legislation also bars teacher associations
from automatically collecting dues from
their own members—see sidebar). The state
does not allow teacher strikes.
AREA 4: STATE POLICIES
12TH
Collective bargaining aside, North
Carolina’s teacher employment policies
are more aligned with traditional union
interests than in most other states. North
Carolina does not support performance
pay, does not require districts to consider
teacher performance in determining layoffs,
and does not include student learning in
tenure decisions. Further, teachers are
dismissed due to poor performance at a
lower rate than most other states. (Despite
these union-friendly policies, however,
North Carolina earned an NCLB waiver in
2012, which may alleviate pressure from
reformers to change these policies.) On
the other hand, teacher unions typically
seek to limit the expansion and autonomy
of charter schools, but North Carolina
does not limit the number of charter
schools allowed to operate. It also allows
new, conversion, and virtual schools, and
provides some charters with full or partial
automatic exemptions from state laws and
district regulations.6
AREA 5: PERCEIVED INFLUENCE
TIED FOR 11TH
Stakeholders in North Carolina perceive
their state teacher association to be
relatively strong. Respondents agree that
the association fights hard to prevent
reductions in pay and benefits and is
effective in protecting dollars for education,
even in times of cutbacks. They also note
the association is able to ward off policy
proposals with which it disagrees, and that
state education leaders often align with
teacher union preferences. But they do
indicate that, while policies proposed by
the governor during the latest legislative
session were mostly in line with teacher
union priorities, the outcomes of that
session were only somewhat in line, a trend
similar to that in many other states.7
OVERALL
40TH
Despite low measures of resources and
membership and highly restrictive labor
laws, North Carolina’s teacher union has
built a strong reputation and has been
able to fend off a number of unfavorable
employment policies (a situation that may
soon change as the state is likely to regain
Republican leadership—see sidebar).

Overall Rank: 40thTier 4 (Weak)
NORTH CAROLINA
Caught up in partisan politics, the North Carolina Association of Education (NCAE) has Democrat Governor (and former teacher) Beverly Perdue on its side. In 2011, the legislature passed SB 727 (a bill Democrat Rep. Jennifer Weiss denounced as a “smackdown on teachers”), which prevents the teacher association from collecting dues from its own members via automatic payroll deductions.8 Democrat lawmakers and the NCAE called the bill revenge for their heavy criticism of GOP-initiated education-funding cuts. Perdue vetoed the measure.9 But at 1:00 a.m. just a few days into 2012, Republicans overrode her veto. Despite the ensuing outcry from Democrats, who called the move “vindictive” and “insane”—and from the governor, who termed it an “unprecedented, unconstitutional power grab”— the law stood.10
That fractious cycle portended further confrontation between Perdue on one side and the GOP-controlled legislature on the other, with the NCAE caught in the middle. Early in 2012, the legislature passed a budget that Perdue subsequently vetoed, worried that it did not provide sufficient funds for public education.11 It was the second year in a row that the governor vetoed the state budget, and the second year in a row that the legislature overrode her veto.12 In addition to cutting funding for education, the new budget contained another potential hit for teacher associations: a modified version of SB 795, the Excellent Public Schools Act. The original version would have introduced merit pay for teachers and an A-F rating system for schools, created a new K–3 literacy program, and overhauled tenure so that all teachers would be placed on one-year contracts and only after three or more of those could qualify for multi-year (but not more than four-year) contracts.13 But while some of the less controversial components of the bill (such as the school rating guidelines and the literacy program) made it through to the final version, after intense NCAE lobbying, hot-button issues like merit pay and tenure reform did not.14,15 Despite this partial victory, however, the momentum seems to be against the NCAE, and Perdue isn’t seeking re-election (she cited concerns that she was politicizing education policy, although her unpopularity in the traditionally Republican state made re-election an unlikely possibility).16
HIDING BEHIND THE APRON

Overall Rank: 40thTier 4 (Weak)
NORTH CAROLINA
OVERALL RANK: 40TH
Area and Ranka General Indicator Sub-IndicatorSub-Indicator Rank/Statusb
AREA 1: RESOURCES & MEMBERSHIP
Membership By rank, what percentage of public-school teachers in the state are union members? 46th
Revenue By rank, what is the total yearly revenue (per teacher in the state) of the state-level NEA and/ or AFT affiliate(s)?
47th
Spending on education By rank, what percentage of state expenditures (of state general funds, state restricted funds, state bonds, and federal “pass-through” funds) is directed to K-12 education?
26th
By rank, what is the total annual per-pupil expenditure (of funds from federal, state, and local sources) in the state?
44th
By rank, what percentage of total annual per-pupil expenditures is directed to teacher salaries and benefits?
4th
AREA 2: INVOLVEMENTIN POLITICS
Contributions to candidates and political parties
By rank, what percentage of the total contributions to state candidates was donated by teacher unions?
39th
By rank, what percentage of the total contributions to state-level political parties was donated by teacher unions?
11th
Industry influence By rank, what percent of the contributions to state candidates from the ten highest-giving sectors was donated by teacher unions?
40th
Status of delegates By rank, what percentage of the state’s delegates to the Democratic and Republican conventions were members of teacher unions?
24th
AREA 3:SCOPE OF BARGAINING
Legal scope of bargaining What is the legal status of collective bargaining? Prohibited
By rank, how broad is the scope of collective bargaining? 47th*
Automatic revenue streams What is the unions’ legal right to automatically collect agency fees from non-members and/or collect member dues via automatic payroll deductions?
Bargaining is not allowed
Right to strike What is the legal status of teacher strikes? Prohibited
AREA 4:STATE POLICIES
Performance pay Does the state support performance pay for teachers? State does not support
Retirement By rank, what is the employer- versus employee-contribution rate to the teacher pension system? 16th
Evaluations What is the maximum potential consequence for veteran teachers who receive unsatisfactory evaluation(s)?
Teacher improvement plan
Is classroom effectiveness included in teacher evaluations? If so, how is it weighted? Evidence of student “learning” required
Terms of employment How long before a teacher earns tenure? Four years
Is student/teacher performance considered in tenure decisions? If so, how is it weighted? Not included
Is seniority considered in teacher layoff decisions? If so, how is it weighted? Optional; Weighted at district discretion
Is teacher performance included in teacher layoff decisions? If so, how is it weighted? Not required
By rank, what percentage of the teaching workforce was dismissed due to poor performance? 8th
Class size Is class size restricted for grades 1-3? If so, is the restriction higher or lower than the national average (20)?
Yes; Higher
NORTH CAROLINA RANKINGS BY AREA AND INDICATOR
47*
29*
48*
12

Overall Rank: 40thTier 4 (Weak)
NORTH CAROLINA
Area and Rank General Indicator Sub-IndicatorSub-Indicator Rank/Status
AREA 4:STATE POLICIES
(cont.)
Charter school structural limitations
Is there a cap (limit) placed on the number of charter schools that can operate in the state (or other jurisdiction) and/or on the number of students who can attend charter schools?
No state cap
Does the state allow a variety of charter schools: start-ups, conversions, and virtual schools? Yes
How many charter authorizing options exist? How active are those authorizers? Single option; Some activity
Charter school exemptions Are all charter schools automatically exempt from state laws and state/district regulations (except those that safeguard students and fiscal accountability)? If not, are they eligible for exemptions?
Yes
Are all charter schools automatically exempt from state teacher-certification requirements? If not, are they eligible for exemptions?
Partially; All schools receive automatic exemptions for some teachers
Are all charter schools automatically exempt from collective bargaining agreements (CBAs)? If not, are they eligible for exemptions?
Partially; Full automatic exemption for some schools
AREA 5:PERCEIVED INFLUENCEc
Relative influence of teacher unions
How do you rank the influence of teacher unions on education policy compared with other influential entities?
Third-most influential
Influence over campaigns On a scale from always to never, how often do Democratic candidates need teacher-union support to get elected?
Often/Always
On a scale from always to never, how often do Republican candidates need teacher-union support to get elected?
Never/Rarely
Influence over spending To what extent, from strongly agree to strongly disagree, do you agree that even in times of cutbacks, teacher unions are effective in protecting dollars for education?
Agree
Given recent budgetary constraints, would you say that teacher unions generally make concessions to prevent reductions in pay and benefits or fight hard to prevent those reductions?
Fight
Influence over policy To what extent, from strongly agree to strongly disagree, do you agree that teacher unions ward off proposals in your state with which they disagree?
Agree
On a scale from always to never, how often do existing state education policies reflect teacher-union priorities?
Sometimes/Often
To what extent, from totally in line to not at all in line, were state education policies proposed by the governor during your state’s latest legislative session in line with teacher-union priorities?
Mostly/Totally in line
To what extent, from totally in line to not at all in line, were legislative outcomes of your state’s latest legislative session in line with teacher-union priorities?
Mostly not in line/Somewhat in line
Influence over key stakeholders
On a scale from always to never, how often have the priorities of state education leaders aligned with teacher-union positions in the past three years?
Often/Always
Would you say that teacher unions typically compromise with policymakers to ensure that their preferred policies are enacted, or typically need not make concessions?
Does not concede
* Tied with another state
a Area ranks are calculated using a weighted average of sub-indicators. For a more detailed description, see Appendix A.
b Where possible, we report a state’s rank as compared to other states on a given metric. For example, out of 51 states, North Carolina has the 46th-highest percentage of teachers who are union members. Otherwise, we report a status: In North Carolina, collective bargaining is prohibited, and teacher strikes are also prohibited. For a more detailed description of our metrics and methodology, see Appendix A. To request the raw data for your state, send an email to [email protected].
c For all survey questions, stakeholders were asked specifically about teacher unions, candidates, policies, and leaders in their state. In addition, we asked about unions and policies in the “current legislative session,” but because legislative calendars vary from state to state, responses refer to policies proposed and enacted within the 2010-11 window.
12
11*

Overall Rank: 40thTier 4 (Weak)
NORTH CAROLINA
ENDNOTES
1 A state’s overall rank is calculated as follows: First, we score it on multiple sub-indicators (sub-indicator data and scores for North Carolina are shown in the table, North Carolina Rankings by Area and Indicator). Second, we take a weighted average of the sub-indicators in each of five areas. In each area, we use that average to place the states in rank order: For example, in Area 1: Resources and Membership, North Carolina is ranked 47th of 51 based on the weighted average of its sub-indicators. To generate the state’s overall rank, we average the five area ranks together, then re-order the states. For a more detailed description of data sources and methodology, see Appendix A.
2 North Carolina, like other states (especially those in which collective bargaining is prohibited or permitted), has state-level professional teacher associations other than those affiliated with the NEA and/or AFT. These associations range from advocacy groups active in state policy and political campaigns to organizations offering teachers insurance and benefits. In this report, we do not include data for these independent professional associations.
3 Readers should note that these figures include only direct donations from unions and union-connected PACs, but not their spending on electioneering/advertising, mobilizing the union’s own membership, lobbying, or advocacy. A recent Wall Street Journal report found that donations and lobbying activities account for a small share of union political spending compared with their expenditures on member mobilization and advocacy. Even the AFT agreed, making the argument that since its mission is organizing and activism, it will naturally spend significant amounts on these activities. Thus, the percentages we report here are extremely conservative representations of what unions actually spend on politics. For more information, see Appendix A, Area 2; Tom McGinty and Brody Mullins, “Political Spending by Unions Far Exceeds Direct Donations,” Wall Street Journal, July 10, 2012; and Jeff Hauser, “Wall Street Journal Compares Union Political Spending to Corporate Donations,” AFL-CIO, July 10, 2012.
4 North Carolina is one of just five states where local teacher associations did not contribute to candidates and political parties. In North Carolina, the NCAE was the major donor to candidates, while the NEA gave a small amount as well. The opposite was the case in regard to political parties, with the NEA giving the bulk of the donations and the NCAE giving little.
5 At the time of publication, the 2000 conventions were the most recent for which such detailed data were available in forms that met rigorous standards. However, 2008 data provided by the Democratic National Convention were highly correlated with the reliable figures from 2000.
6 Still, according to the Center for Education Reform, the chartering process “remains very restrictive and the state’s leadership does not advocate for opening more high quality charter schools without explicit district support.” See http://www.edreform.com/wp-content/uploads/2012/04/CER_2012_Charter_Laws.pdf.
7 We asked stakeholders about unions and policies in the “current legislative session,” but because legislative calendars vary from state to state, responses refer to policies proposed and enacted within the 2010-11 window.
8 Bruce Mildwurf and Laura Leslie, “Legislature Saw Drama And Shifts,” WRAL News, July 25, 2011, http://www.charlotteobserver.com/2011/07/31/2493402/legislature-saw-drama-and-shifts.html.
9 John Rottet, “GOP Overrides Veto Of Bill To Weaken Teachers Group,” News & Observer, January 5, 2012, http://www.newsobserver.com/2012/01/05/1754535/gop-passes-late-night-bill-to.html.
10 Ibid., Mildwurf.
11 Gary Robertson, “N.C. Gop Lawmakers Mix Dem. Gov. Perdue’s Vetoes On Budget, Racial Justice, Fracking,” Associated Press, July 3, 2012, http://www2.hickoryrecord.com/news/2012/jul/03/nc-gop-lawmakers-nix-dem-gov-perdues-vetoes-budget-ar-2404409/.
12 Associated Press, “Legislature Overrides Governor Perdue Budget Veto,” July 2, 2012, http://www.witn.com/home/headlines/Legislature_Overrides_Governor_Perdue_Budget_Veto_161170655.html.
13 Jack Mercola, “N.C. Senate Considers Teacher Tenure Cut,” Duke University Chronicle, May 31, 2012, http://www.dukechronicle.com/article/nc-senate-considers-teacher-tenure-cut.
14 Tess Liegeois, “Back To School: Education Reform In North Carolina,” Heritage Foundation, August 13, 2012, http://blog.heritage.org/2012/08/13/back-to-school-education-reform-in-north-carolina/.
15 Emery P. Dalesio, “Senate In N.C. Works To Revamp Education Policy,” Associated Press, May 29, 2012, http://hamptonroads.com/2012/05/senate-nc-works-revamp-education-policy; NCAE Daily Political Briefing, “Senate Leader Meets With NCAE Lobbyists,” May 12, 2012, http://one.mansellgroup.com/servlet/Pv?p=neanc&m=525&s=0&t=H&r=N.
16 Gary D. Robertson, “NC Democratic Governor Perdue Won’t Seek Re-election,” Associated Press, January 26, 2012, http://www.timesunion.com/news/article/NC-Democratic-Gov-Perdue-won-t-seek-re-election-2720864.php.

Overall Rank: 24thTier 3 (Average)
NORTH DAKOTA
IntroductionPart IV: Taking a Closer Look–Teacher Union Influence Area
AREA 1: RESOURCES AND MEMBERSHIP
TIED FOR 28TH
North Dakota’s teacher unions are near
the middle of the pack when it comes
to both internal resources and spending
on public education in the state. Nearly
three-quarters (74.7 percent) of the
Peace Garden State’s teachers belong to
unions, the 27th-highest unionization rate
across 51 jurisdictions. The state NEA and
AFT affiliates also post the 27th-largest
annual revenue, at $472 per teacher
in the state. While North Dakota itself
directs a comparatively small portion
of its expenditures to K–12 education
(15.4 percent; 42nd), overall spending on
K–12 education is higher. North Dakota
spends $12,225 per student annually (a
combination of local, state, and federal
funds), and 53.8 percent of total education
dollars go to teacher salaries and benefits
(27th).
AREA 2: INVOLVEMENT IN POLITICS2
TIED FOR 23RD
Teacher union involvement in politics ranks
the state in the middle of the national
pack.3 Their contributions comprised 0.64
percent of total donations received by
candidates for state office (23rd) and 4.0
percent of donations to candidates from
the ten highest-giving sectors in the state
(32nd). Further, 0.59 percent of donations
received by state political parties came
directly from teacher unions (34th). (These
small percentages are not surprising given
the overall lack of activity in Bismarck—see
sidebar.) The unions had another source of
NORTH DAKOTA OVERALL RANK: 24TH1
TIER 3 (AVERAGE)
STRONGER WEAKER
1. RESOURCES AND MEMBERSHIP
OVERALL
2. INVOLVEMENT IN POLITICS
3. SCOPE OF BARGAINING
4. STATE POLICIES
5. PERCEIVED INFLUENCE
24
28
23
2
14
33

Overall Rank: 24thTier 3 (Average)
NORTH DAKOTA
influence besides their dollars, however:
A whopping 26.7 percent of all North
Dakota delegates to the Democratic and
Republican national conventions were
teacher union members (3rd).4
AREA 3: SCOPE OF BARGAINING
TIED FOR 33RD
North Dakota is one of eleven states
that require collective bargaining in
education but do not allow its teacher
unions to automatically collect agency
fees from non-member teachers (a key
source of union revenue). It also prohibits
teachers from striking. Still, the state has a
relatively permissive scope of bargaining:
Of twenty-one items examined in this
analysis, the Peace Garden State requires
bargaining over the terms and conditions
of employment, and explicitly permits
negotiations over transfers/reassignments,
layoffs, evaluation procedures, leave,
curriculum, and class size. State law is silent
on the remaining fourteen items, implicitly
permitting bargaining over all of them—and
prohibiting none.
AREA 4: STATE POLICIES
TIED FOR 2ND
North Dakota’s teacher employment
policies are closely aligned with traditional
teacher union interests, and the state has
no charter law, neither of which is likely to
change in the near future (see sidebar).5
North Dakota grants teachers tenure after
only two years (the national norm is three)
and does not require that student learning
factor into tenure decisions or teacher
evaluations. Nor need districts consider
teacher performance in layoffs.
AREA 5: PERCEIVED INFLUENCE
14TH
Stakeholders in North Dakota report
that teacher unions play a prominent
role in education politics, especially
when compared with responses from
other states. While unions may not be
the dominant political force—survey
respondents rank their influence as
equivalent to that of the state association
of school administrators and the state
school boards association—they do carry
clout: Respondents note that Democrats
always need union support to be elected
and that Republicans often do. Further,
they report that state education leaders are
often aligned with teacher union positions.
Stakeholders agree that the unions are
effective in protecting dollars for education
even in times of budgetary constraint, and
that both the proposals and the outcomes
of the latest legislative session were in
line with teacher union priorities.6 Still, like
stakeholders in most other states, they note
that the teacher unions often compromise
to ensure enactment of favored policies.
OVERALL
24TH
North Dakota’s teacher unions are neither
the strongest nor the weakest political force
in the nation. They enjoy a favorable policy
environment, however, and stakeholders
report that they are influential at the state
level, even without major internal resources
or donations to state politics.

Overall Rank: 24thTier 3 (Average)
NORTH DAKOTA
These days, the North Dakota Education Association (NDEA) doesn’t have much on its plate, as it benefits from the fact that state finances have been largely unaffected by the recent economic downturn: North Dakota is one of only two states that have not reported a budget shortfall these past several years. Nor is there much need for activity when no legislative session is planned for 2012, and lawmakers were in session for just four months in 2011.7,8 Further, state leaders don’t seem particularly interested in changing the status quo of education policy. They did not apply for Race to the Top funds and voted repeatedly to postpone submitting an application for an NCLB waiver, both of which would require the state to rethink its current employment and evaluation policies and enact charter legislation (which the state does not have, and which State Superintendent Wayne Stanstead doesn’t imagine his rural state will adopt any time soon).9,10
With little trouble being made for it or its members in the state capital, the NDEA focused its attention on maintaining funding for education and improving working conditions for its members. In June 2012, it helped defeat a ballot initiative that would have eliminated local property taxes (and the resulting dollars for education); the initiative was proposed by a conservative group that deemed such taxes unnecessary given the state’s budget surpluses. With over 70 percent of voters siding with the coalition of unions and local interests that opposed the measure, it was easily voted down.11 The following month, the NDEA lent its support to one of its local affiliates fighting for higher salaries and better housing opportunities for teachers in a district where an oil boom pushed average wages to $80,000 per year, but a starting teacher’s salary can be as low as $31,000.12 NDEA President Dakota Draper used the opportunity to call out lawmakers who have yet to decide “how much [money to give education], where it will come from and who will pay for it.”13 But with no pressure from leaders to change the state’s education policies, and no impending fights over state dollars, for the moment all is peaceful in the Peace Garden State.
“PEACE GARDEN STATE” SOUNDS ABOUT RIGHT

Overall Rank: 24thTier 3 (Average)
NORTH DAKOTA
OVERALL RANK: 24TH
Area and Ranka General Indicator Sub-IndicatorSub-Indicator Rank/Statusb
AREA 1: RESOURCES & MEMBERSHIP
Membership By rank, what percentage of public-school teachers in the state are union members? 27th
Revenue By rank, what is the total yearly revenue (per teacher in the state) of the state-level NEA and/ or AFT affiliate(s)?
27th
Spending on education By rank, what percentage of state expenditures (of state general funds, state restricted funds, state bonds, and federal “pass-through” funds) is directed to K-12 education?
42nd
By rank, what is the total annual per-pupil expenditure (of funds from federal, state, and local sources) in the state?
19th
By rank, what percentage of total annual per-pupil expenditures is directed to teacher salaries and benefits?
27th
AREA 2: INVOLVEMENTIN POLITICS
Contributions to candidates and political parties
By rank, what percentage of the total contributions to state candidates was donated by teacher unions?
23rd
By rank, what percentage of the total contributions to state-level political parties was donated by teacher unions?
34th
Industry influence By rank, what percent of the contributions to state candidates from the ten highest-giving sectors was donated by teacher unions?
32nd
Status of delegates By rank, what percentage of the state’s delegates to the Democratic and Republican conventions were members of teacher unions?
3rd
AREA 3;SCOPE OF BARGAINING
Legal scope of bargaining What is the legal status of collective bargaining? Mandatory
By rank, how broad is the scope of collective bargaining? 15th*
Automatic revenue streams What is the unions’ legal right to automatically collect agency fees from non-members and/or collect member dues via automatic payroll deductions?
Agency fees prohibited
Right to strike What is the legal status of teacher strikes? Prohibited
AREA 4:STATE POLICIES
Performance pay Does the state support performance pay for teachers? State does not support
Retirement By rank, what is the employer- versus employee-contribution rate to the teacher pension system? 37th
Evaluations What is the maximum potential consequence for veteran teachers who receive unsatisfactory evaluation(s)?
No consequences articulated
Is classroom effectiveness included in teacher evaluations? If so, how is it weighted? Not required
Terms of employment How long before a teacher earns tenure? Two years
Is student/teacher performance considered in tenure decisions? If so, how is it weighted? Not included
Is seniority considered in teacher layoff decisions? If so, how is it weighted? Optional; Weighted at district discretion
Is teacher performance included in teacher layoff decisions? If so, how is it weighted? Not required
By rank, what percentage of the teaching workforce was dismissed due to poor performance? 5th
Class size Is class size restricted for grades 1-3? If so, is the restriction higher or lower than the national average (20)?
Yes; Higher
NORTH DAKOTA RANKINGS BY AREA AND INDICATOR
28*
23*
33*
2*

Overall Rank: 24thTier 3 (Average)
NORTH DAKOTA
Area and Rank General Indicator Sub-IndicatorSub-Indicator Rank/Status
AREA 4:STATE POLICIES
(cont.)
Charter school structural limitationsc
Is there a cap (limit) placed on the number of charter schools that can operate in the state (or other jurisdiction) and/or on the number of students who can attend charter schools?
N/A
Does the state allow a variety of charter schools: start-ups, conversions, and virtual schools? N/A
How many charter authorizing options exist? How active are those authorizers? N/A
Charter school exemptionsc Are all charter schools automatically exempt from state laws and state/district regulations (except those that safeguard students and fiscal accountability)? If not, are they eligible for exemptions?
N/A
Are all charter schools automatically exempt from state teacher-certification requirements? If not, are they eligible for exemptions?
N/A
Are all charter schools automatically exempt from collective bargaining agreements (CBAs)? If not, are they eligible for exemptions?
N/A
AREA 5:PERCEIVED INFLUENCEd
Relative influence of teacher unions
How do you rank the influence of teacher unions on education policy compared with other influential entities?
Second- or third-most influential
Influence over campaigns On a scale from always to never, how often do Democratic candidates need teacher-union support to get elected?
Always
On a scale from always to never, how often do Republican candidates need teacher-union support to get elected?
Sometimes/Often
Influence over spending To what extent, from strongly agree to strongly disagree, do you agree that even in times of cutbacks, teacher unions are effective in protecting dollars for education?
Agree
Given recent budgetary constraints, would you say that teacher unions generally make concessions to prevent reductions in pay and benefits or fight hard to prevent those reductions?
**
Influence over policy To what extent, from strongly agree to strongly disagree, do you agree that teacher unions ward off proposals in your state with which they disagree?
Agree
On a scale from always to never, how often do existing state education policies reflect teacher-union priorities?
Sometimes/Often
To what extent, from totally in line to not at all in line, were state education policies proposed by the governor during your state’s latest legislative session in line with teacher-union priorities?
Mostly/Totally in line
To what extent, from totally in line to not at all in line, were legislative outcomes of your state’s latest legislative session in line with teacher-union priorities?
Mostly in line
Influence over key stakeholders
On a scale from always to never, how often have the priorities of state education leaders aligned with teacher-union positions in the past three years?
Often
Would you say that teacher unions typically compromise with policymakers to ensure that their preferred policies are enacted, or typically need not make concessions?
Compromise
* Tied with another state
** Insufficient number of responses to this particular question
a Area ranks are calculated using a weighted average of sub-indicators. For a more detailed description, see Appendix A.
b Where possible, we report a state’s rank as compared to other states on a given metric. For example, out of 51 states, North Dakota has the 27th-highest percentage of teachers who are union members. Otherwise, we report a status: North Dakota has mandatory collective bargaining, and union agency fees are prohibited. For a more detailed description of our metrics and methodology, see Appendix A. To request the raw data for your state, send an email to [email protected].
c North Dakota does not have a charter school law.
d For all survey questions, stakeholders were asked specifically about teacher unions, candidates, policies, and leaders in their state. In addition, we asked about unions and policies in the “current legislative session,” but because legislative calendars vary from state to state, responses refer to policies proposed and enacted within the 2010-11 window.
2*
14

Overall Rank: 24thTier 3 (Average)
NORTH DAKOTA
ENDNOTES
1 A state’s overall rank is calculated as follows: First, we score it on multiple sub-indicators (sub-indicator data and scores for North Dakota are shown in the table, North Dakota Rankings by Area and Indicator). Second, we take a weighted average of the sub-indicators in each of five areas. In each area, we use that average to place the states in rank order: For example, in Area 1: Resources and Membership, North Dakota is ranked 28th of 51 based on the weighted average of its sub-indicators. To generate the state’s overall rank, we average the five area ranks together, then re-order the states. For a more detailed description of data sources and methodology, see Appendix A.
2 Readers should note that these figures include only direct donations from unions and union-connected PACs, but not their spending on electioneering/advertising, mobilizing the union’s own membership, lobbying, or advocacy. A recent Wall Street Journal report found that donations and lobbying activities account for a small share of union political spending compared with their expenditures on member mobilization and advocacy. Even the AFT agreed, making the argument that since its mission is organizing and activism, it will naturally spend significant amounts on these activities. Thus, the percentages we report here are extremely conservative representations of what unions actually spend on politics. For more information, see Appendix A, Area 2; Tom McGinty and Brody Mullins, “Political Spending by Unions Far Exceeds Direct Donations,” Wall Street Journal, July 10, 2012; and Jeff Hauser, “Wall Street Journal Compares Union Political Spending to Corporate Donations,” AFL-CIO, July 10, 2012.
3 North Dakota is one of just five states where local teacher associations did not contribute to candidates and political parties. In North Dakota, the North Dakota Education Association (NDEA) was the lone union donor to candidates, while the NEA and AFT were the primary donors to parties (and the NDEA giving relatively little in comparison).
4 At the time of publication, the 2000 conventions were the most recent for which such detailed data were available in forms that met rigorous standards. However, 2008 data provided by the Democratic National Convention were highly correlated with the reliable figures from 2000.
5 We do not include data for sub-indicators pertaining to charters when calculating the ranking of states that do not have charter school laws. While some might argue that the lack of such a law is in itself evidence for union strength, we do not have sufficient data to link that absence to union activity. The nine states without charter laws are home to very different contexts—while teacher unions in some states may have played a significant role in keeping charter laws at bay, in others, they played little or none.
6 We asked stakeholders about unions and policies in the “current legislative session,” but because legislative calendars vary from state to state, responses refer to policies proposed and enacted within the 2010-11 window.
7 “North Dakota Legislative Assembly,” Ballotpedia, last modified May 17, 2012, http://ballotpedia.org/wiki/index.php/North_Dakota_Legislative_Assembly.
8 Phil Oliff, Chris Mai, and Vincent Palacios, “States Continue To Feel Recession’s Impact,” Center on Budget and Policy Priorities, June 27, 2012, http://www.cbpp.org/cms/index.cfm?fa=view&id=711.
9 Alyson Klein, “Is Race To The Top An Urban Game?” Education Week, December 15, 2009, http://blogs.edweek.org/edweek/campaign-k-12/2009/12/some_state_officials_have_a.html; Mara van Ells, “N.D. education committee recommends NCLB waiver,” Bismark Tribune, August 28, 2012, http://bismarcktribune.com/news/state-and-regional/n-d-education-committee-recommends-nclb-waiver/article_0d6e50c0-f18f-11e1-b2aa-0019bb2963f4.html.
10 After a year of delays, education leaders voted in September 2012 to apply for an NCLB waiver; the NDEA formally supported the state’s application. Sanstead, an incumbent not seeking re-election, stated that he believes the state should take advantage of the opportunity presented by the waiver. However, neither of the two candidates for his position as state superintendent are in favor of North Dakota submitting an application. In addition, the state did not enact any new reform policies to bolster its chances. See Mara van Ells, “North Dakota applies for waiver from No Child Left Behind,” Bismark Tribune, September 10, 2012, accessed September 14, 2012, http://bismarcktribune.com/news/state-and-regional/north-dakota-applies-for-waiver-from-no-child-left-behind/article_b5bbbc38-fb74-11e1-a6a4-0019bb2963f4.html.
11 Associated Press, “ND Voters Reject Ending Local Property Taxes,” Daily News, June 13, 2012, http://www.wahpetondailynews.com/article_824dc114-b553-11e1-87d0-001a4bcf887a.html.
12 Associated Press, “ND Oil Town’s Prosperity Doesn’t Reach Teachers,” July 6, 2012, http://www.foxnews.com/us/2012/07/06/nd-oil-town-prosperity-doesnt-reach-teachers/.
13 Ibid.

Overall Rank: 12thTier 2 (Strong)
OHIO
IntroductionPart IV: Taking a Closer Look–Teacher Union Influence Area
AREA 1: RESOURCES AND MEMBERSHIP
TIED FOR 20TH
Ohio’s teacher unions enjoy broad
resources from their members, but do not
see high spending on K–12 education in
general as compared with other states.
Despite the fact that collective bargaining
is optional in the Buckeye State, a full 91.5
percent of teachers are union members
(the 15th-highest unionization rate of 51
jurisdictions). Ohio’s NEA and AFT state
affiliates bring in $587 per Ohio teacher
(14th). But just 19.1 percent of state
expenditures go to K–12 education in Ohio
(28th) and total per-pupil expenditures
(a combination of local, state, and federal
funds) are moderate, too, at $11,382 per
year (25th). Of those dollars, just 50.2
percent go toward teacher salaries and
benefits (47th).
AREA 2: INVOLVEMENT IN POLITICS2
17TH
In the past decade, Ohio’s teacher unions
have been more active in politics than
unions in other states (and are among the
most active in the fourteen bargaining-
permitted states). Their contributions
amounted to 1.0 percent of total donations
received by candidates for state office
(17th) and 10.0 percent of donations to
candidates from the ten highest-giving
sectors in the state (13th). Further, they
contributed 3.0 percent of the money
received by state political parties (7th).
The unions are not, however, particularly
well-represented among Ohio’s delegates
to the Democratic and Republican national
conventions, only 7.9 percent of whom
identified as teacher union members
(40th).3
OHIO OVERALL RANK: 12TH1
TIER 2 (STRONG)
STRONGER WEAKER
1. RESOURCES AND MEMBERSHIP
OVERALL
2. INVOLVEMENT IN POLITICS
3. SCOPE OF BARGAINING
4. STATE POLICIES
5. PERCEIVED INFLUENCE
12
20
17
23
35
10

Overall Rank: 12thTier 2 (Strong)
OHIO
AREA 3: SCOPE OF BARGAINING
10TH
While bargaining is allowed but not
required in Ohio, the remainder of
the state’s bargaining laws are highly
permissive compared with other states.
Should a district choose to negotiate a
collective bargaining agreement with its
employee organization, it must negotiate
four of the twenty-one provisions we
examined: wages, hours, terms and
conditions of employment, and grievance
procedures. Bargaining over five more
items is explicitly permitted, and at
the time we calculated our metric, the
remaining twelve were implicitly allowed
because the state is silent on them. (The
state has since taken evaluations off the
table—see sidebar.) Further, the state
allows unions to automatically collect
agency fees from non-member teachers (a
key source of union revenue), and permits
teacher strikes.
AREA 4: STATE POLICIES
23RD
While some of Ohio’s teacher-employment
policies align with traditional union
interests, many do not (and those that
do are changing). Ohio does not grant
tenure easily—non-tenured teachers
licensed before 2011 must go through a
five-year probationary period, and those
licensed after 2011 face a seven-year
probationary period (the national norm
is three). And, student achievement must
be the preponderant criteria in teacher
evaluations. On the other hand, there is
no statewide system of performance pay,
teacher effectiveness is not considered
in tenure decisions, and at the time we
calculated our metric, seniority (not
teacher performance) was the primary
consideration in layoffs. (By press time,
however, legislation prohibited seniority
as a layoff criterion unless it was the
deciding factor between two teachers with
identical evaluations and may have laid
the foundation for statewide performance
pay via approval of the Cleveland Plan—
see sidebar.) The state’s charter laws
are equally mixed. They allow new,
virtual, and conversion schools and give
operators multiple authorizing options.
Ohio education leaders can cap the total
number of charters that each authorizer
may approve, but the cap is not a part
of state law and incorporates room for
growth. The state automatically exempts
start-up charters (only) from collective
bargaining agreements.
AREA 5: PERCEIVED INFLUENCE
35TH
Ohio stakeholders perceive the influence of
teacher unions to be somewhat limited. On
average, respondents place the unions as
the third- or fourth-most influential entity
in the state in shaping education policy,
behind the governor, state association
of school administrators, and education
advocacy organizations. They neither
agree nor disagree that teacher unions are
effective in protecting dollars for education
or in warding off proposals with which they
disagree—and report that both proposals
and outcomes of the latest legislative
session were mostly not in line with teacher
union priorities (likely due to the near-
elimination of collective bargaining rights
for public employees—see sidebar).4 But
teacher unions have been and remain an
active force in the state, if not necessarily
an effective one: Stakeholders note that
they fought hard, given recent budgetary
constraints, to prevent reductions in pay
and benefits.

Overall Rank: 12thTier 2 (Strong)
OHIO
In November 2011, Ohio voters repealed SB 5, and unions in the Buckeye State popped the champagne. Originally passed in the same month that Wisconsin stripped collective bargaining rights from its public-sector employees (March 2011), SB 5 prohibited public-sector strikes, eliminated binding arbitration for employee-management disputes, and drastically narrowed the scope of collective bargaining.5 In one of the most expensive campaigns ever waged over a state ballot initiative, teacher unions (both state and national) joined forces with the influential police and fire fighter associations, and the highly organized (and well-funded) political action group We Are Ohio. The Ohio Education Association (OEA), Ohio Federation of Teachers (OFT), and National Education Association (NEA) contributed some $7 million to the successful campaign to repeal the law.6,7 AFT President Randi Weingarten boasted after the vote, “Those who would dare try to strip collective bargaining rights away from hard-working citizens will now think twice”; OEA President Patricia Frost-Brooks chimed in, declaring that “Ohioans refused to turn their backs on the people who guard our safety and teach our children.”8,9
But it’s not the same when the OEA and OFT do not have their heavyweight interest group allies. For example, the biennial budget passed in 2011, as originally proposed by the governor (covering school years 2011-13) contained many provisions in the same spirit as SB 5. After three months of wrangling among the House, Senate, and governor, the version that passed omitted the language that would have barred collective bargaining over salaries and would have increased employee pension contributions. Still the OEA was not happy: “Despite these victories in the substitute bill, a number of changes to the bill represent significant steps backwards,” reported the union to its members.10 Among other items, the OEA objected to provisions opening the door to performance pay, reducing tenure protections, and requiring that half of a teacher’s evaluation be based on student growth as measured by standardized test scores. They were furious, too, when, a year later, lawmakers proposed that evaluations be removed from the scope of collective bargaining entirely. OEA Director of Education Policy Randy Flora argued to the House Education Committee that “the best teacher evaluation systems are those created collaboratively through the [local] collective bargaining process.”11 But once again, it could not stop the bill from becoming law, and evaluations are now entirely off the bargaining table.
Perhaps the OEA might learn from the OFT that resisting reform is not the best strategy in Ohio. During the budget debate, OFT staff did not object to the state’s evaluation mandates: “Those are things we pretty much agreed make a teacher a good, solid teacher,” commented OFT leader Deb Tully.12 The OFT even supported elements of Cleveland Mayor Frank Jackson’s reform plan, which, among other provisions, ties pay to teacher (and student) performance, eliminates seniority as a primary determinant for transfers and assignments, and allows the district to circumvent the union contract when intervening in failing schools. Its most vociferous objections pertained to “the precedent of local levy money going to support charter schools,” said OFT president Melissa Cropper. 13,14 It appears that Ohio unions must choose their battles carefully.
MONEY TALKS
OVERALL
12TH
Ohio’s teacher unions are fairly influential
compared with those in all states, and
are the most influential among the
bargaining-permitted states. They do not
rate particularly low in any of the five areas
examined here; however, the state is not
a particularly friendly place for organized
labor in general (see sidebar).

Overall Rank: 12thTier 2 (Strong)
OHIO
OVERALL RANK: 12TH
Area and Ranka General Indicator Sub-IndicatorSub-Indicator Rank/Statusb
AREA 1: RESOURCES & MEMBERSHIP
Membership By rank, what percentage of public-school teachers in the state are union members? 15th
Revenue By rank, what is the total yearly revenue (per teacher in the state) of the state-level NEA and/ or AFT affiliate(s)?
14th
Spending on education By rank, what percentage of state expenditures (of state general funds, state restricted funds, state bonds, and federal “pass-through” funds) is directed to K-12 education?
28th
By rank, what is the total annual per-pupil expenditure (of funds from federal, state, and local sources) in the state?
25th
By rank, what percentage of total annual per-pupil expenditures is directed to teacher salaries and benefits?
47th
AREA 2: INVOLVEMENTIN POLITICS
Contributions to candidates and political parties
By rank, what percentage of the total contributions to state candidates was donated by teacher unions?
17th
By rank, what percentage of the total contributions to state-level political parties was donated by teacher unions?
7th
Industry influence By rank, what percent of the contributions to state candidates from the ten highest-giving sectors was donated by teacher unions?
13th
Status of delegates By rank, what percentage of the state’s delegates to the Democratic and Republican conventions were members of teacher unions?
40th
AREA 3:SCOPE OF BARGAINING
Legal scope of bargaining What is the legal status of collective bargaining? Permitted
By rank, how broad is the scope of collective bargaining? 8th*
Automatic revenue streams What is the unions’ legal right to automatically collect agency fees from non-members and/or collect member dues via automatic payroll deductions?
Permitted
Right to strike What is the legal status of teacher strikes? Permitted
AREA 4:STATE POLICIES
Performance pay Does the state support performance pay for teachers? State does not support
Retirement By rank, what is the employer- versus employee-contribution rate to the teacher pension system? 21st
Evaluations What is the maximum potential consequence for veteran teachers who receive unsatisfactory evaluation(s)?
Teacher improvement plan
Is classroom effectiveness included in teacher evaluations? If so, how is it weighted? Required; Preponderant criterion
Terms of employmentc How long before a teacher earns tenure? Five years
Is student/teacher performance considered in tenure decisions? If so, how is it weighted? Not included
Is seniority considered in teacher layoff decisions? If so, how is it weighted? Required; Considered among other factors
Is teacher performance included in teacher layoff decisions? If so, how is it weighted? Not required
By rank, what percentage of the teaching workforce was dismissed due to poor performance? 30th
Class size Is class size restricted for grades 1-3? If so, is the restriction higher or lower than the national average (20)?
Yes; Higher
OHIO RANKINGS BY AREA AND INDICATOR
20*
17
10
23

Overall Rank: 12thTier 2 (Strong)
OHIO
Area and Rank General Indicator Sub-IndicatorSub-Indicator Rank/Status
AREA 4:STATE POLICIES
(cont.)
Charter school structural limitations
Is there a cap (limit) placed on the number of charter schools that can operate in the state (or other jurisdiction) and/or on the number of students who can attend charter schools?
State cap with some room for growth
Does the state allow a variety of charter schools: start-ups, conversions, and virtual schools? Yes
How many charter authorizing options exist? How active are those authorizers? Two or more active/available options
Charter school exemptions Are all charter schools automatically exempt from state laws and state/district regulations (except those that safeguard students and fiscal accountability)? If not, are they eligible for exemptions?
Yes
Are all charter schools automatically exempt from state teacher-certification requirements? If not, are they eligible for exemptions?
Partially; All schools receive automatic exemptions for some teachers
Are all charter schools automatically exempt from collective bargaining agreements (CBAs)? If not, are they eligible for exemptions?
Partially; Full automatic exemption for some schools
AREA 5:PERCEIVED INFLUENCEd
Relative influence of teacher unions
How do you rank the influence of teacher unions on education policy compared with other influential entities?
Third- or fourth-most influential
Influence over campaigns On a scale from always to never, how often do Democratic candidates need teacher-union support to get elected?
Often
On a scale from always to never, how often do Republican candidates need teacher-union support to get elected?
Rarely
Influence over spending To what extent, from strongly agree to strongly disagree, do you agree that even in times of cutbacks, teacher unions are effective in protecting dollars for education?
Neutral
Given recent budgetary constraints, would you say that teacher unions generally make concessions to prevent reductions in pay and benefits or fight hard to prevent those reductions?
Fight
Influence over policy To what extent, from strongly agree to strongly disagree, do you agree that teacher unions ward off proposals in your state with which they disagree?
Neutral
On a scale from always to never, how often do existing state education policies reflect teacher-union priorities?
Sometimes
To what extent, from totally in line to not at all in line, were state education policies proposed by the governor during your state’s latest legislative session in line with teacher-union priorities?
Mostly not in line
To what extent, from totally in line to not at all in line, were legislative outcomes of your state’s latest legislative session in line with teacher-union priorities?
Mostly not in line
Influence over key stakeholders
On a scale from always to never, how often have the priorities of state education leaders aligned with teacher-union positions in the past three years?
Sometimes/Often
Would you say that teacher unions typically compromise with policymakers to ensure that their preferred policies are enacted, or typically need not make concessions?
Generally compromise
* Tied with another state
a Area ranks are calculated using a weighted average of sub-indicators. For a more detailed description, see Appendix A.
b Where possible, we report a state’s rank as compared to other states on a given metric. For example, out of 51 states, Ohio has the 15th-highest percentage of teachers who are union members. Otherwise, we report a status: Ohio permits collective bargaining, and union agency fees are also permitted. For a more detailed description of our metrics and methodology, see Appendix A. To request the raw data for your state, send an email to [email protected].
c See Area 4 above.
d For all survey questions, stakeholders were asked specifically about teacher unions, candidates, policies, and leaders in their state. In addition, we asked about unions and policies in the “current legislative session,” but because legislative calendars vary from state to state, responses refer to policies proposed and enacted within the 2010-11 window.
23
35

Overall Rank: 12thTier 2 (Strong)
OHIO
ENDNOTES
1 A state’s overall rank is calculated as follows: First, we score it on multiple sub-indicators (sub-indicator data and scores for Ohio are shown in the table, Ohio Rankings by Area and Indicator). Second, we take a weighted average of the sub-indicators in each of five areas. In each area, we use that average to place the states in rank order: For example, in Area 1: Resources and Membership, Ohio is ranked 20th of 51 based on the weighted average of its sub-indicators. To generate the state’s overall rank, we average the five area ranks together, then re-order the states. For a more detailed description of data sources and methodology, see Appendix A.
2 Readers should note that these figures include only direct donations from unions and union-connected PACs, but not their spending on electioneering/advertising, mobilizing the union’s own membership, lobbying, or advocacy. A recent Wall Street Journal report found that donations and lobbying activities account for a small share of union political spending compared with their expenditures on member mobilization and advocacy. Even the AFT agreed, making the argument that since its mission is organizing and activism, it will naturally spend significant amounts on these activities. Thus, the percentages we report here are extremely conservative representations of what unions actually spend on politics. For more information, see Appendix A, Area 2; Tom McGinty and Brody Mullins, “Political Spending by Unions Far Exceeds Direct Donations,” Wall Street Journal, July 10, 2012; and Jeff Hauser, “Wall Street Journal Compares Union Political Spending to Corporate Donations,” AFL-CIO, July 10, 2012.
3 At the time of publication, the 2000 conventions were the most recent for which such detailed data were available in forms that met rigorous standards. However, 2008 data provided by the Democratic National Convention were highly correlated with the reliable figures from 2000.
4 We asked stakeholders about unions and policies in the “current legislative session,” but because legislative calendars vary from state to state, responses refer to policies proposed and enacted within the 2010-11 window.
5 Michael Scott, “Issue 2 Defeated: Million Votes Are In And 63 Percent Say No, AP Says,” Plain Dealer, November 8, 2011, http://www.cleveland.com/politics/index.ssf/2011/11/issue_2_early_ohio_election_re.html.
6 Glenn Thrush, “Ohio Senate Bill 5’s Repeal Buoys Dems,” Politico.com, October 8, 2011, 2012, http://www.politico.com/news/stories/1111/67918.html.
7 Sean Cavanagh, “Unions, Businesses Spend On Ohio Collective-Bargaining Fight,” Education Week, November 1, 2011, http://blogs.edweek.org/edweek/state_edwatch/2011/11/money_flows_into_ohio_fight_over_collective_bargaining.html.
8 Sean Cavanagh, “Ohio Voters Reject Law Limiting Teachers’ Collective Bargaining,” Education Week, November 8, 2011, http://blogs.edweek.org/edweek/state_edwatch/2011/11/ohio_1.html?qs=ohio+collective+bargaining.
9 “OEA Thanks Ohio For Defeating Issue 2,” Ohio Education Association, accessed July 19, 2012, http://www.ohea.org/victory-for-collective-bargaining.
10 “OEA Legislative Watch,” Ohio Education Association, April 29, 2011, http://www.ohea.org/Document/Get/21361 (for details of the modifications of the bill, see the OEA’s Legislative Watch Archive, http://www.ohea.org/legislative-watch-archive).
11 “Ohio Education Association Senate Bill 316 Testimony To House Education Committee,” Ohio Education Association, May 16, 2012, http://aces.ohea.org/site/DocServer/SB_316_Testimony_-_House_Education_Committee_Testimony_-.pdf?docID=661.
12 Patrick O’Donnell, “Ohio Teachers To Be Watched And Graded On Classroom Performance—And Many Are Ok With That,” Plain Dealer, January 2, 2012, http://blog.cleveland.com/metro/2012/01/ohio_teachers_to_be_watched_an.html.
13 Harry Graver, “Cleveland’s Education-Reform Plan,” National Review, July 23, 2012, http://www.nationalreview.com/articles/310205/cleveland-s-education-reform-plan-harry-graver?pg=1.
14 Reginald Fields, “Ohio Sen. Nina Turner At Odds With State Teachers Union,” Plain Dealer, May 10, 2012, http://www.cleveland.com/open/index.ssf/2012/05/ohio_sen_nina_turner_at_odds_w.html.

Overall Rank: 43rdTier 5 (Weakest)
OKLAHOMA
IntroductionPart IV: Taking a Closer Look–Teacher Union Influence Area
AREA 1: RESOURCES AND MEMBERSHIP
TIED FOR 44TH
Oklahoma’s state teacher unions do not
have substantial resources from their
members, nor do they see a significant
dedication of funds to K–12 education
in the state. First, a relatively low
proportion of Sooner State teachers are
union members—57.5 percent (39th of 51
jurisdictions). The NEA and AFT state-
level affiliates bring in just $233 annually
per Oklahoma teacher (38th). Moreover,
education spending in Oklahoma is
comparatively low. The state directs just
14.3 percent of its own budget into K–12
education, and total per-pupil spending
(from all sources, state, federal and local) is
$9,369 per pupil per year, with 52.0 percent
of that dedicated to teacher salaries and
benefits. Oklahoma ranks among the
bottom ten states in the nation on all three
of those spending measures.
AREA 2: INVOLVEMENT IN POLITICS2
TIED FOR 26TH
Compared with unions in other states,
Oklahoma teacher unions rank in the
middle of the pack in terms of their political
involvement over the past ten years. Their
contributions accounted for 0.42 percent
of total donations received by candidates
for state office (33rd), and 0.18 percent of
the total donations to state political parties
(46th). However, the unions had a strong
presence at the Democratic and Republican
national conventions, with 24.2 percent of
Oklahoma’s delegates being teacher union
members (only three states ranked higher).3
OKLAHOMA OVERALL RANK: 43RD1
TIER 5 (WEAKEST)
STRONGER WEAKER
1. RESOURCES AND MEMBERSHIP
OVERALL
2. INVOLVEMENT IN POLITICS
3. SCOPE OF BARGAINING
4. STATE POLICIES
5. PERCEIVED INFLUENCE
43
44
26
43
46
40

Overall Rank: 43rdTier 5 (Weakest)
OKLAHOMA
AREA 3: SCOPE OF BARGAINING
40TH
Oklahoma unions have limited, and
shrinking, freedom to bargain. Recently
the state repealed the law that mandated
collective bargaining; in major cities,
bargaining is now permitted, but not
required (see sidebar). The law also
prohibits teacher strikes and prevents
unions from automatically collecting
agency fees, a key source of union revenue,
from non-members. The state is fairly
permissive, however, on the scope of
bargaining. Of twenty-one items examined
in this report, Oklahoma mandates that
four be negotiated should districts choose
to bargain collectively with unions—
wages, hours, terms and conditions of
employment, and fringe benefits—and
implicitly permits all of the remaining items.
AREA 4: STATE POLICIES
43RD
Compared with other states, Oklahoma
policies are largely out of line with
traditional teacher union priorities. By law,
student achievement is the preponderant
criterion in both teacher evaluations and
tenure decisions. Teachers are eligible
for dismissal after multiple unsatisfactory
evaluations, and districts must consider
teacher performance (rather than seniority
alone) when making layoffs. Likely related,
Oklahoma dismisses teachers due to poor
performance at the fourth-highest rate
in the country. The unfavorable policy
environment extends to charter school
laws as well: Oklahoma’s charters are
automatically exempt from collective
bargaining agreements, state teacher
certification rules, and many other state
and district laws and regulations.
AREA 5: PERCEIVED INFLUENCE
46TH
Stakeholders in Oklahoma perceive that
the teacher unions are relatively weak.
On average, survey respondents rate the
teacher unions as less influential than
the business roundtable/chamber of
commerce, superintendent, and education
advocacy organizations. They report that
unions are not effective in protecting
dollars for education or in warding off
reform proposals with which they disagree.
Stakeholders also observe that policies
proposed by the governor and enacted in
the latest legislative session were mostly
not in line with teacher union priorities.4
OVERALL
43RD
Oklahoma’s teacher unions are weaker
that those in most other states: They claim
only limited membership and financial
resources, few favorable policies at the
state level, and a relatively weak reputation
among stakeholders. Like many other
states, Oklahoma is experiencing a high
degree of flux among state leaders—and
their positions—with respect to both unions
and education reforms (see sidebar), and
its position on any of these indicators is far
from certain.

Overall Rank: 43rdTier 5 (Weakest)
OKLAHOMA
In spring 2012, Oklahoma teacher unions avoided a veritable knockout punch. Anti-labor legislators had already landed a powerful blow the previous year, replacing the law that mandated collective bargaining in public education with one that permitted, but did not require, bargaining in the state’s 13 largest cities.5 Then, in early 2012, the senate passed SB 1530, also known as the “deregulation bill,” which gave traditional public schools in all cities the same autonomies granted to the state’s charter schools—including allowing local school boards to void their existing collective bargaining agreements if they so choose.6
Worried that districts would reduce teacher salaries, take away sick and personal leave, and eliminate special-duty pay, the Oklahoma Education Association (OEA) mobilized against the bill.7 At the union’s annual “Lobby Day,” members bent the ear of Rep. Todd Thomsen, who then asked fellow representatives during the hearing for the bill, “Can you name one thing the legislature has done for teachers’ best interest?”8 Lawmakers may have been considering those teacher interests instead of the best interests of the students when SB 1530 died in House committee. One superintendent pointed out the negative consequences of the defeat: “[My district] receives about $30,000 for textbooks...I would rather spend this money on technology and use online books that are a small fraction of the cost”—a sensible solution that would have been possible under SB 1530.9
In the wake of this fight, however, the OEA found its image tarnished (a problem made more urgent by the fact that it was losing membership due both to the new bargaining law and to net teacher job losses).10,11 The union began a massive “Stand Up for Public Education” campaign, aimed at improving the unions’ own public image, preserving the rights of teachers, and increasing funding for the traditional education system. The success of the campaign remains to be seen, but the tide seems to be turning against labor in Oklahoma; ironic for a state whose motto is Labor Omnia Vincit: “Labor Conquers All Things.”
ON THE ROPES

Overall Rank: 43rdTier 5 (Weakest)
OKLAHOMA
OVERALL RANK: 43RD
Area and Ranka General Indicator Sub-IndicatorSub-Indicator Rank/Statusb
AREA 1: RESOURCES & MEMBERSHIP
Membership By rank, what percentage of public-school teachers in the state are union members? 39th
Revenue By rank, what is the total yearly revenue (per teacher in the state) of the state-level NEA and/ or AFT affiliate(s)?
38th
Spending on education By rank, what percentage of state expenditures (of state general funds, state restricted funds, state bonds, and federal “pass-through” funds) is directed to K-12 education?
44th
By rank, what is the total annual per-pupil expenditure (of funds from federal, state, and local sources) in the state?
41st
By rank, what percentage of total annual per-pupil expenditures is directed to teacher salaries and benefits?
41st
AREA 2: INVOLVEMENTIN POLITICS
Contributions to candidates and political parties
By rank, what percentage of the total contributions to state candidates was donated by teacher unions?
33rd
By rank, what percentage of the total contributions to state-level political parties was donated by teacher unions?
46th
Industry influence By rank, what percent of the contributions to state candidates from the ten highest-giving sectors was donated by teacher unions?
34th
Status of delegates By rank, what percentage of the state’s delegates to the Democratic and Republican conventions were members of teacher unions?
4th
AREA 3:SCOPE OF BARGAINING
Legal scope of bargaining What is the legal status of collective bargaining? Permitted
By rank, how broad is the scope of collective bargaining? 15th*
Automatic revenue streams What is the unions’ legal right to automatically collect agency fees from non-members and/or collect member dues via automatic payroll deductions?
Agency fees prohibited
Right to strike What is the legal status of teacher strikes? Prohibited
AREA 4:STATE POLICIES
Performance pay Does the state support performance pay for teachers? State supports/encourages
Retirement By rank, what is the employer- versus employee-contribution rate to the teacher pension system? 18th
Evaluations What is the maximum potential consequence for veteran teachers who receive unsatisfactory evaluation(s)?
Eligible for dismissal
Is classroom effectiveness included in teacher evaluations? If so, how is it weighted? Required; Preponderant criterion
Terms of employment How long before a teacher earns tenure? Three years
Is student/teacher performance considered in tenure decisions? If so, how is it weighted? Required; Preponderant criterion
Is seniority considered in teacher layoff decisions? If so, how is it weighted? Optional; May be considered among other factors
Is teacher performance included in teacher layoff decisions? If so, how is it weighted? Required; Considered among other factors
By rank, what percentage of the teaching workforce was dismissed due to poor performance? 48th
Class size Is class size restricted for grades 1-3? If so, is the restriction higher or lower than the national average (20)?
Yes; Higher
OKLAHOMA RANKINGS BY AREA AND INDICATOR
44*
26*
40
43

Overall Rank: 43rdTier 5 (Weakest)
OKLAHOMA
Area and Rank General Indicator Sub-IndicatorSub-Indicator Rank/Status
AREA 4:STATE POLICIES
(cont.)
Charter school structural limitations
Is there a cap (limit) placed on the number of charter schools that can operate in the state (or other jurisdiction) and/or on the number of students who can attend charter schools?
State cap with some room for growth
Does the state allow a variety of charter schools: start-ups, conversions, and virtual schools? Start-ups and conversions only w/limited jurisdiction
How many charter authorizing options exist? How active are those authorizers? Two or more active/available options
Charter school exemptions Are all charter schools automatically exempt from state laws and state/district regulations (except those that safeguard students and fiscal accountability)? If not, are they eligible for exemptions?
Yes
Are all charter schools automatically exempt from state teacher-certification requirements? If not, are they eligible for exemptions?
Yes
Are all charter schools automatically exempt from collective bargaining agreements (CBAs)? If not, are they eligible for exemptions?
Yes
AREA 5:PERCEIVED INFLUENCEc
Relative influence of teacher unions
How do you rank the influence of teacher unions on education policy compared with other influential entities?
Fourth-most influential
Influence over campaigns On a scale from always to never, how often do Democratic candidates need teacher-union support to get elected?
Often
On a scale from always to never, how often do Republican candidates need teacher-union support to get elected?
Rarely
Influence over spending To what extent, from strongly agree to strongly disagree, do you agree that even in times of cutbacks, teacher unions are effective in protecting dollars for education?
Disagree
Given recent budgetary constraints, would you say that teacher unions generally make concessions to prevent reductions in pay and benefits or fight hard to prevent those reductions?
Generally fight
Influence over policy To what extent, from strongly agree to strongly disagree, do you agree that teacher unions ward off proposals in your state with which they disagree?
Disagree
On a scale from always to never, how often do existing state education policies reflect teacher-union priorities?
Sometimes
To what extent, from totally in line to not at all in line, were state education policies proposed by the governor during your state’s latest legislative session in line with teacher-union priorities?
Mostly not in line
To what extent, from totally in line to not at all in line, were legislative outcomes of your state’s latest legislative session in line with teacher-union priorities?
Mostly not in line
Influence over key stakeholders
On a scale from always to never, how often have the priorities of state education leaders aligned with teacher-union positions in the past three years?
Sometimes
Would you say that teacher unions typically compromise with policymakers to ensure that their preferred policies are enacted, or typically need not make concessions?
Compromise
* Tied with another state
a Area ranks are calculated using a weighted average of sub-indicators. For a more detailed description, see Appendix A.
b Where possible, we report a state’s rank as compared to other states on a given metric. For example, out of 51 states, Oklahoma has the 39th-highest percentage of teachers who are union members. Otherwise, we report a status: In Oklahoma collective bargaining is permitted, and union agency fees are prohibited. For a more detailed description of our metrics and methodology, see Appendix A. To request the raw data for your state, send an email to [email protected].
c For all survey questions, stakeholders were asked specifically about teacher unions, candidates, policies, and leaders in their state. In addition, we asked about unions and policies in the “current legislative session,” but because legislative calendars vary from state to state, responses refer to policies proposed and enacted within the 2010-11 window.
43
46

Overall Rank: 43rdTier 5 (Weakest)
OKLAHOMA
ENDNOTES
1 A state’s overall rank is calculated as follows: First, we score it on multiple sub-indicators (sub-indicator data and scores for Oklahoma are shown in the table, Oklahoma Rankings by Area and Indicator). Second, we take a weighted average of the sub-indicators in each of five areas. In each area, we use that average to place the states in rank order: For example, in Area 1: Resources and Membership, Oklahoma is ranked 44th of 51 based on the weighted average of its sub-indicators. To generate the state’s overall rank, we average the five area ranks together, then re-order the states. For a more detailed description of data sources and methodology, see Appendix A.
2 Readers should note that these figures include only direct donations from unions and union-connected PACs, but not their spending on electioneering/advertising, mobilizing the union’s own membership, lobbying, or advocacy. A recent Wall Street Journal report found that donations and lobbying activities account for a small share of union political spending compared with their expenditures on member mobilization and advocacy. Even the AFT agreed, making the argument that since its mission is organizing and activism, it will naturally spend significant amounts on these activities. Thus, the percentages we report here are extremely conservative representations of what unions actually spend on politics. For more information, see Appendix A, Area 2; Tom McGinty and Brody Mullins, “Political Spending by Unions Far Exceeds Direct Donations,” Wall Street Journal, July 10, 2012; and Jeff Hauser, “Wall Street Journal Compares Union Political Spending to Corporate Donations,” AFL-CIO, July 10, 2012.
3 At the time of publication, the 2000 conventions were the most recent for which such detailed data were available in forms that met rigorous standards. However, 2008 data provided by the Democratic National Convention were highly correlated with the reliable figures from 2000.
4 We asked stakeholders about unions and policies in the “current legislative session,” but because legislative calendars vary from state to state, responses refer to policies proposed and enacted within the 2010-11 window.
5 Sean Murphy, “Oklahoma Senate Panel Votes To Ax City Union Rights,” Associated Press, March 28, 2011, http://normantranscript.com/archive/x10256592/Okla-Senate-panel-votes-to-ax-city-union-rights.
6 Victor Skinner, “Oklahoma’s Teachers Unions Determined To Preserve Collective Bargaining,” News Blaze, April 3, 2012, http://newsblaze.com/story/20120403111136zzzz.nb/topstory.html.
7 Rob Anderson, “School ‘Deregulation’ Bill Controversial,” Tahlequah Daily Press, March 21, 2012, http://tahlequahdailypress.com/local/x715444021/School-deregulation-bill-controversial.
8 Kandis West, “Inspired Members Help Kill SB 1530,” in “The Education Focus,”Oklahoma Education Association, April/May 2012, http://okea.org/assets/files/2012%20April%20May%20Focus%20for%20web.pdf.
9 Anderson.
10 Ibid.
11 Stacy Martin and Patrick B. McGuigan, “Oklahoma’s Largest Teachers’ Union Losing Members,” CapitolBeatOK.com, June 21, 2011, http://capitolbeatok.com/reports/oklahomas-largest-teachers-union-losing-members.

Overall Rank: 2ndTier 1 (Strongest)
OREGON
IntroductionPart IV: Taking a Closer Look–Teacher Union Influence Area
AREA 1: RESOURCES AND MEMBERSHIP
TIED FOR 9TH
While Oregon’s state teacher unions benefit
from substantial internal resources from
their members, they and their members do
not see generous spending on education
overall. A high percentage of teachers in the
Beaver State—95.2 percent of them—belong
to unions (the 10th-highest unionization
rate of 51 jurisdictions). The NEA and AFT
state affiliates bring in the second-largest
annual revenues, a very substantial $984
for each teacher in the state. The state does
not contribute much of its own budget
(12.8 percent) to K–12 education (46th), and
while total spending (from state, federal,
and local sources) is in the middle of the
national pack at $10,517 per pupil per year
(32nd), just 52.2 percent of those dollars go
to teacher salaries and budgets (40th).
AREA 2: INVOLVEMENT IN POLITICS2
TIED FOR 8TH
Teacher unions have been highly active in
Oregon politics over the past decade. Of
the total donations to candidates for state
office, 3 percent came from the unions; only
in Illinois did candidates receive a higher
percentage from unions. Contributions
from unions accounted for 15.3 percent of
the donations to candidates from the ten
highest-giving sectors in the state (8th).
Unions also gave to the state’s political
parties, although not quite as heavily—1.2
percent of party donations in Oregon
came from teacher unions (21st). Finally,
18.1 percent of Oregon delegates to the
Democratic and Republican national
conventions were teacher union members,
ranking the state 12th.3
OREGON OVERALL RANK: 2ND1
TIER 1 (STRONGEST)
STRONGER WEAKER
1. RESOURCES AND MEMBERSHIP
OVERALL
2. INVOLVEMENT IN POLITICS
3. SCOPE OF BARGAINING
4. STATE POLICIES
5. PERCEIVED INFLUENCE
2
9
8
34
3
4

Overall Rank: 2ndTier 1 (Strongest)
OREGON
AREA 3: SCOPE OF BARGAINING
TIED FOR 4TH
Oregon bargaining laws are more
permissive and union-friendly than in
nearly every other state. The state requires
collective bargaining, allows unions to
automatically collect agency fees from
non-member teachers (a key source of
union-revenue), and permits teacher
strikes. The state also has a broad scope of
bargaining: Of twenty-one items examined
in this analysis, Oregon explicitly requires
or permits ten to be included in bargaining
(wages, hours, terms and conditions
of employment, grievance procedures,
insurance benefits, pension/retirement
benefits, fringe benefits, leave, curriculum,
and extracurricular duties). State law
is silent on another seven provisions,
implicitly opening them for bargaining, and
prohibits only four (evaluation process/
instruments, length of the school year, class
load, and class size).
AREA 4: STATE POLICIES
TIED FOR 34TH
Oregon’s teacher employment policies
are relatively in line with traditional union
interests: Oregon does not require that
teacher evaluations or tenure decisions
include student achievement data, nor
does it mandate that layoff decisions
take teacher performance into account.
Employers contribute 1.7 times more
to pensions than teachers do, a higher
proportion than in many other states.
However, while unions usually favor limiting
charter schools, Oregon law encourages
them. The state does not cap the number of
such schools, which may be virtual schools,
new charters, or conversions. All charters
are automatically exempt from most state
and district laws and regulations, and they
are not required to participate in district
collective bargaining agreements.
AREA 5: PERCEIVED INFLUENCE
3RD
Oregon stakeholders identify teacher
unions as very strong. Respondents rank
them as one of the two most influential
entities on education policy (along with
education advocacy organizations), and
note that they are effective in protecting
dollars for education and warding off
education proposals with which they
disagree. According to stakeholders,
between 2009 and 2011 the position of
state education leaders always aligned with
those of the teacher union, and Democrats
often needed teacher union support to get
elected. But while stakeholders report that
state-level education policies often reflect
teacher union priorities, the outcomes of
the latest legislative session were mostly
not in line with those priorities—indicating
that the unions may be facing more
opposition than they have in the past (see
sidebar).4
OVERALL
2ND
Oregon’s teacher unions have substantial
internal resources, are active donors to
politicians and parties, and enjoy highly
favorable bargaining rules. But other state
policies (especially related to charter
schools) do not align with traditional union
interests. Still, stakeholders report that they
are a strong force in the state.

Overall Rank: 2ndTier 1 (Strongest)
OREGON
What a difference two years makes. In 2010, the Oregon Education Association (OEA) enthusiastically endorsed Democrat John Kitzhaber’s run for governor.5 His election looked to be a boon for the already-strong OEA: Teacher unions had consistently had a powerful presence with Oregon’s lawmakers, and the 2011 legislative session was shaping up to be no exception. As in years past, the unions gave generously to Democratic candidates and already counted many legislators as allies.6
But something went awry. Only 13 of 31 bills that the state union supported passed in 2011; moreover, 11 of the 37 measures they opposed actually passed.7 Worse, the OEA saw former allies turn into foes. Kitzhaber endorsed GOP-sponsored laws to increase parental choice and expand charter schools in return for Republican support on measures that would increase his financial oversight and decision-making authority over education.8 Even Democratic legislators were no longer sure bets: In its traditional end-of-session report card, the OEA gave Fs to 8 Democrats (and 40 Republicans) out of 90 legislators. No senator, Democrat or Republican, earned higher than a C.9
With Oregon’s 2012 assembly session open for business, it is unclear how lawmakers will react to the OEA’s report card. Representative Matt Wingard, the author of last year’s Republican education bills, thinks the report card undermines the union’s position: “It hurts their credibility.”10 (That said, Wingard later had some credibility issues of his own.11) Currently, Oregon teacher unions are among the strongest in the nation. But with potentially damaged credibility, and evidence from other states that lawmakers’ sentiments are turning against union interests, it remains to be seen whether 2011 was a blemish on a strong record or indicative of things to come.
BURNING BRIDGES

Overall Rank: 2ndTier 1 (Strongest)
OREGON
OVERALL RANK: 2ND
Area and Ranka General Indicator Sub-IndicatorSub-Indicator Rank/Statusb
AREA 1: RESOURCES & MEMBERSHIP
Membership By rank, what percentage of public-school teachers in the state are union members? 10th
Revenue By rank, what is the total yearly revenue (per teacher in the state) of the state-level NEA and/ or AFT affiliate(s)?
2nd
Spending on education By rank, what percentage of state expenditures (of state general funds, state restricted funds, state bonds, and federal “pass-through” funds) is directed to K-12 education?
46th
By rank, what is the total annual per-pupil expenditure (of funds from federal, state, and local sources) in the state?
32nd
By rank, what percentage of total annual per-pupil expenditures is directed to teacher salaries and benefits?
40th
AREA 2: INVOLVEMENTIN POLITICS
Contributions to candidates and political parties
By rank, what percentage of the total contributions to state candidates was donated by teacher unions?
2nd
By rank, what percentage of the total contributions to state-level political parties was donated by teacher unions?
21st
Industry influence By rank, what percent of the contributions to state candidates from the ten highest-giving sectors was donated by teacher unions?
8th
Status of delegates By rank, what percentage of the state’s delegates to the Democratic and Republican conventions were members of teacher unions?
12th
AREA 3:SCOPE OF BARGAINING
Legal scope of bargaining What is the legal status of collective bargaining? Mandatory
By rank, how broad is the scope of collective bargaining? 10th*
Automatic revenue streams What is the unions’ legal right to automatically collect agency fees from non-members and/or collect member dues via automatic payroll deductions?
Permitted
Right to strike What is the legal status of teacher strikes? Permitted
AREA 4:STATE POLICIES
Performance pay Does the state support performance pay for teachers? State supports/encourages
Retirement By rank, what is the employer- versus employee-contribution rate to the teacher pension system? 13th
Evaluations What is the maximum potential consequence for veteran teachers who receive unsatisfactory evaluation(s)?
Teacher improvement plan
Is classroom effectiveness included in teacher evaluations? If so, how is it weighted? Not required
Terms of employment How long before a teacher earns tenure? Three years
Is student/teacher performance considered in tenure decisions? If so, how is it weighted? Not included
Is seniority considered in teacher layoff decisions? If so, how is it weighted? Required; Considered among other factors
Is teacher performance included in teacher layoff decisions? If so, how is it weighted? Not required
By rank, what percentage of the teaching workforce was dismissed due to poor performance? 13th
Class size Is class size restricted for grades 1-3? If so, is the restriction higher or lower than the national average (20)?
No restriction
OREGON RANKINGS BY AREA AND INDICATOR
9*
8*
4*
34*

Overall Rank: 2ndTier 1 (Strongest)
OREGON
Area and Rank General Indicator Sub-IndicatorSub-Indicator Rank/Status
AREA 4:STATE POLICIES
(cont.)
Charter school structural limitations
Is there a cap (limit) placed on the number of charter schools that can operate in the state (or other jurisdiction) and/or on the number of students who can attend charter schools?
No state cap
Does the state allow a variety of charter schools: start-ups, conversions, and virtual schools? Yes
How many charter authorizing options exist? How active are those authorizers? Single option; Some activity
Charter school exemptions Are all charter schools automatically exempt from state laws and state/district regulations (except those that safeguard students and fiscal accountability)? If not, are they eligible for exemptions?
Yes
Are all charter schools automatically exempt from state teacher-certification requirements? If not, are they eligible for exemptions?
Partially; All schools receive automatic exemptions for some teachers
Are all charter schools automatically exempt from collective bargaining agreements (CBAs)? If not, are they eligible for exemptions?
Yes
AREA 5:PERCEIVED INFLUENCEc
Relative influence of teacher unions
How do you rank the influence of teacher unions on education policy compared with other influential entities?
Most- or second-most influential
Influence over campaigns On a scale from always to never, how often do Democratic candidates need teacher-union support to get elected?
Often
On a scale from always to never, how often do Republican candidates need teacher-union support to get elected?
Rarely/Sometimes
Influence over spending To what extent, from strongly agree to strongly disagree, do you agree that even in times of cutbacks, teacher unions are effective in protecting dollars for education?
Agree
Given recent budgetary constraints, would you say that teacher unions generally make concessions to prevent reductions in pay and benefits or fight hard to prevent those reductions?
Fight
Influence over policy To what extent, from strongly agree to strongly disagree, do you agree that teacher unions ward off proposals in your state with which they disagree?
Agree
On a scale from always to never, how often do existing state education policies reflect teacher-union priorities?
Sometimes/Often
To what extent, from totally in line to not at all in line, were state education policies proposed by the governor during your state’s latest legislative session in line with teacher-union priorities?
Mostly not in line/Somewhat in line
To what extent, from totally in line to not at all in line, were legislative outcomes of your state’s latest legislative session in line with teacher-union priorities?
Mostly not in line/Somewhat in line
Influence over key stakeholders
On a scale from always to never, how often have the priorities of state education leaders aligned with teacher-union positions in the past three years?
Always
Would you say that teacher unions typically compromise with policymakers to ensure that their preferred policies are enacted, or typically need not make concessions?
Does not concede
* Tied with another state
a Area ranks are calculated using a weighted average of sub-indicators. For a more detailed description, see Appendix A.
b Where possible, we report a state’s rank as compared to other states on a given metric. For example, out of 51 states, Oregon has the 10th-highest percentage of teachers who are union members. Otherwise, we report a status: Oregon has mandatory collective bargaining, and union agency fees are permitted. For a more detailed description of our metrics and methodology, see Appendix A. To request the raw data for your state, send an email to [email protected].
c For all survey questions, stakeholders were asked specifically about teacher unions, candidates, policies, and leaders in their state. In addition, we asked about unions and policies in the “current legislative session,” but because legislative calendars vary from state to state, responses refer to policies proposed and enacted within the 2010-11 window.
34*
3

Overall Rank: 2ndTier 1 (Strongest)
OREGON
ENDNOTES
1 A state’s overall rank is calculated as follows: First, we score it on multiple sub-indicators (sub-indicator data and scores for Oregon are shown in the table, Oregon Rankings by Area and Indicator). Second, we take a weighted average of the sub-indicators in each of five areas. In each area, we use that average to place the states in rank order: For example, in Area 1: Resources and Membership, Oregon is 9th of 51 based on the weighted average of its sub-indicators. To generate the state’s overall rank, we average the five area ranks together, then re-order the states. For a more detailed description of data sources and methodology, see Appendix A.
2 Readers should note that these figures include only direct donations from unions and union-connected PACs, but not their spending on electioneering/advertising, mobilizing the union’s own membership, lobbying, or advocacy. A recent Wall Street Journal report found that donations and lobbying activities account for a small share of union political spending compared with their expenditures on member mobilization and advocacy. Even the AFT agreed, making the argument that since its mission is organizing and activism, it will naturally spend significant amounts on these activities. Thus, the percentages we report here are extremely conservative representations of what unions actually spend on politics. For more information, see Appendix A, Area 2; Tom McGinty and Brody Mullins, “Political Spending by Unions Far Exceeds Direct Donations,” Wall Street Journal, July 10, 2012; and Jeff Hauser, “Wall Street Journal Compares Union Political Spending to Corporate Donations,” AFL-CIO, July 10, 2012.
3 At the time of publication, the 2000 conventions were the most recent for which such detailed data were available in forms that met rigorous standards. However, 2008 data provided by the Democratic National Convention were highly correlated with the reliable figures from 2000.
4 We asked stakeholders about unions and policies in the “current legislative session,” but because legislative calendars vary from state to state, responses refer to policies proposed and enacted within the 2010-11 window.
5 OEA Leader Letter, “OEA-PIE Recommends Kitzhaber For Governor,” Oregon Education Association, accessed July 17, 2012, http://www.oregoned.org/site/apps/nlnet/content2.aspx?c=9dKKKYMDH&b=5186993&ct=8519601.
6 Jeff Mapes, “Oregon Teachers Union Hands Out Harsh Grades, Even To Longtime Legislative Allies,” Oregonian, August 18, 2011, http://blog.oregonlive.com/mapesonpolitics/2011/08/oregon_teachers_union_hands_ou.html.
7 2011 Legislative Summary, Oregon Education Association, accessed July 18, 2012, http://www.oregoned.org/atf/cf/%7B3F7AF7EC-F984-4631-A411-148CD1FB8421%7D/2011_OEA_legislative_summary.pdf.
8 Mapes.
9 2011 Legislative Summary.
10 Mapes.
11 Jeff Mapes, “Matt Wingard Leaves Oregon House Leadership Post After Allegations of Misconduct,” Oregonian, June 13, 2012, http://www.oregonlive.com/politics/index.ssf/2012/06/matt_wingard_leaves_oregon_hou.html.

Overall Rank: 4thTier 1 (Strongest)
PENNSYLVANIA
IntroductionPart IV: Taking a Closer Look–Teacher Union Influence Area
AREA 1: RESOURCES AND MEMBERSHIP
TIED FOR 13TH
Pennsylvania’s teacher unions benefit
from relatively high membership, ample
resources, and generous public education
funding. The Keystone State has the 12th-
highest rate of teacher union membership
in the nation (93.4 percent). In addition, its
state-level NEA and AFT affiliates bring in
the 19th-highest annual revenue, at $538
per teacher. Funding for K–12 education in
Pennsylvania is also substantial with 19.6
percent of state expenditures going toward
K–12 education (24th). Per-pupil spending,
a combination of local, state, and federal
funds amounts to $12,906 per year (14th).
AREA 2: INVOLVEMENT IN POLITICS2
TIED FOR 10TH
For at least the last ten years, teacher
unions have been quite active in
Pennsylvania state politics. Union
donations made up 1.5 percent of the
total contributions to candidates for state
office (10th-highest among states). Their
contributions also accounted for 7.4 percent
of direct donations from the ten highest-
giving sectors in Pennsylvania (19th).
The teacher unions prioritized giving to
candidates rather than parties, however,
giving the latter just 0.04 percent of total
monies received (less than everywhere
but Alaska). Further, a full 20.0 percent of
Pennsylvania delegates to the Democratic
and Republican national conventions
identified as members of teacher unions—a
proportion ranking 10th-largest nationwide.3
PENNSYLVANIA OVERALL RANK: 4TH1
TIER 1 (STRONGEST)
STRONGER WEAKER
1. RESOURCES AND MEMBERSHIP
OVERALL
2. INVOLVEMENT IN POLITICS
3. SCOPE OF BARGAINING
4. STATE POLICIES
5. PERCEIVED INFLUENCE
4
13
10
41
7
7

Overall Rank: 4thTier 1 (Strongest)
PENNSYLVANIA
AREA 3: SCOPE OF BARGAINING
7TH
Pennsylvania is one of thirty-two states
that require collective bargaining for
public school teachers, and one of twenty-
five that permit the automatic collection
of agency fees from all such teachers (a
key source of union revenue). The state
also allows for a relatively broad scope
of bargaining: Of twenty-one items
examined in this metric, Pennsylvania
law explicitly requires or permits four
as subjects of bargaining: wages, hours,
terms and conditions of employment, and
management rights. Its laws are silent on
the remaining seventeen items, implicitly
permitting them all. Pennsylvania also
permits teachers to strike.
AREA 4: STATE POLICIES
41ST
While a handful of Pennsylvania policies
are aligned with traditional teacher union
interests, many others, particularly those
bearing on charter schools, are not.
Relative to those that unions traditionally
support: The state does not require that
student achievement factor into teacher
evaluations, nor does it require that districts
consider teacher performance when
determining layoffs. Further, Pennsylvania
dismisses a smaller percentage of teachers
due to poor performance than all but two
other states. Yet many other policies do
not parallel traditional union interests:
The Keystone State’s charter school law
does not cap charter growth (although
some districts have restrictions), provides
automatic exemptions for charters
from many state and district laws and
regulations, and does not require that
charters participate in district collective
bargaining agreements. Further, the state
does not limit K–3 class sizes.
AREA 5: PERCEIVED INFLUENCE
7TH
Stakeholders perceive teacher unions
in Pennsylvania to be quite strong,
unanimously rating them as the most
influential entity in the state on matters
of education policy. They also strongly
agree that unions are effective in warding
off education proposals with which they
disagree and that, in a time of budgetary
constraints, they fought hard to protect
dollars for education. Further, they indicate
that Democrats seeking office almost
always need union support to be elected.
Still, stakeholders note that, despite the
unions’ past successes, education policies
proposed by the governor in the latest
legislative session were mostly not in line
with their priorities.4
OVERALL
4TH
Pennsylvania’s teacher unions enjoy broad
financial resources and membership,
are highly involved in politics, and wield
considerable influence at the state level.
The state’s NEA and AFT affiliates are some
of the most powerful in the nation.
Overall Rank: 4thTier 1 (Strongest)
PENNSYLVANIA
A recent survey of Pennsylvania districts concluded that school finances will descend from “difficult” to “desperate” in 2012-13—prompting cuts “unheard of since the Great Depression.”5 District leaders are not simply being fatalistic: On top of austerity cuts, the districts’ share of employee pension obligations will reportedly rise by 45 percent this year. When Governor Tom Corbett asked local unions to take a one-year salary freeze to lighten the fiscal load, James Testerman, the president of the Pennsylvania State Education Association, encouraged members to “seriously consider” the request.6 But they didn’t take the bait. In fact, one survey found that just 140 of the state’s 500 school districts froze employee pay in 2011-12—and freezes included teachers in just 83 districts.7 Teachers did not escape completely unscathed, however, as districts enacted other cuts (including layoffs) and state leaders are calling for even more belt-tightening in the years ahead.8
Pennsylvania’s teacher unions have had diminishing success in fending off school choice in its various forms, and state laws are relatively charter-friendly. In addition, in June 2012 the governor signed a new educational tax credit program into law while also bolstering the state’s existing system. AFT Pennsylvania calls the programs, which give tax credits to businesses that contribute to private school scholarship funds, “stealth vouchers” for kids in low-performing schools.9 Governor Corbett made vouchers his top priority coming into office in January 2011, and so far has triumphed over union objections.10 Still, given the unions’ record of success in staving off other reforms that threaten their members’ pay and job security, it could be that vouchers will be Corbett’s only victory.
VOUCHING FOR CHOICE

Overall Rank: 4thTier 1 (Strongest)
PENNSYLVANIA
OVERALL RANK: 4TH
Area and Ranka General Indicator Sub-IndicatorSub-Indicator Rank/Statusb
AREA 1: RESOURCES & MEMBERSHIP
Membership By rank, what percentage of public-school teachers in the state are union members? 12th
Revenue By rank, what is the total yearly revenue (per teacher in the state) of the state-level NEA and/ or AFT affiliate(s)?
19th
Spending on education By rank, what percentage of state expenditures (of state general funds, state restricted funds, state bonds, and federal “pass-through” funds) is directed to K-12 education?
24th*
By rank, what is the total annual per-pupil expenditure (of funds from federal, state, and local sources) in the state?
14th
By rank, what percentage of total annual per-pupil expenditures is directed to teacher salaries and benefits?
30th
AREA 2: INVOLVEMENTIN POLITICS
Contributions to candidates and political parties
By rank, what percentage of the total contributions to state candidates was donated by teacher unions?
10th
By rank, what percentage of the total contributions to state-level political parties was donated by teacher unions?
49th
Industry influence By rank, what percent of the contributions to state candidates from the ten highest-giving sectors was donated by teacher unions?
19th
Status of delegates By rank, what percentage of the state’s delegates to the Democratic and Republican conventions were members of teacher unions?
10th
AREA 3;SCOPE OF BARGAINING
Legal scope of bargaining What is the legal status of collective bargaining? Mandatory
By rank, how broad is the scope of collective bargaining? 20th*
Automatic revenue streams What is the unions’ legal right to automatically collect agency fees from non-members and/or collect member dues via automatic payroll deductions?
Permitted
Right to strike What is the legal status of teacher strikes? Permitted
AREA 4:STATE POLICIES
Performance pay Does the state support performance pay for teachers? State does not support
Retirement By rank, what is the employer- versus employee-contribution rate to the teacher pension system? 48th
Evaluations What is the maximum potential consequence for veteran teachers who receive unsatisfactory evaluation(s)?
Eligible for dismissal
Is classroom effectiveness included in teacher evaluations? If so, how is it weighted? Not required
Terms of employment How long before a teacher earns tenure? Three years
Is student/teacher performance considered in tenure decisions? If so, how is it weighted? Not included
Is seniority considered in teacher layoff decisions? If so, how is it weighted? Required; Sole factor
Is teacher performance included in teacher layoff decisions? If so, how is it weighted? Not required
By rank, what percentage of the teaching workforce was dismissed due to poor performance? 3rd
Class size Is class size restricted for grades 1-3? If so, is the restriction higher or lower than the national average (20)?
No restriction
PENNSYLVANIA RANKINGS BY AREA AND INDICATOR
13*
10*
7
41

Overall Rank: 4thTier 1 (Strongest)
PENNSYLVANIA
Area and Rank General Indicator Sub-IndicatorSub-Indicator Rank/Status
AREA 4:STATE POLICIES
(cont.)
Charter school structural limitations
Is there a cap (limit) placed on the number of charter schools that can operate in the state (or other jurisdiction) and/or on the number of students who can attend charter schools?
No state cap (but authorizers are capped)
Does the state allow a variety of charter schools: start-ups, conversions, and virtual schools? Yes
How many charter authorizing options exist? How active are those authorizers? Single option; Some activity
Charter school exemptions Are all charter schools automatically exempt from state laws and state/district regulations (except those that safeguard students and fiscal accountability)? If not, are they eligible for exemptions?
Yes
Are all charter schools automatically exempt from state teacher-certification requirements? If not, are they eligible for exemptions?
Partially; All schools receive automatic exemptions for some teachers
Are all charter schools automatically exempt from collective bargaining agreements (CBAs)? If not, are they eligible for exemptions?
Yes
AREA 5:PERCEIVED INFLUENCEc
Relative influence of teacher unions
How do you rank the influence of teacher unions on education policy compared with other influential entities?
Most influential
Influence over campaigns On a scale from always to never, how often do Democratic candidates need teacher-union support to get elected?
Often/Always
On a scale from always to never, how often do Republican candidates need teacher-union support to get elected?
Rarely
Influence over spending To what extent, from strongly agree to strongly disagree, do you agree that even in times of cutbacks, teacher unions are effective in protecting dollars for education?
Neutral
Given recent budgetary constraints, would you say that teacher unions generally make concessions to prevent reductions in pay and benefits or fight hard to prevent those reductions?
Fight
Influence over policy To what extent, from strongly agree to strongly disagree, do you agree that teacher unions ward off proposals in your state with which they disagree?
Strongly agree
On a scale from always to never, how often do existing state education policies reflect teacher-union priorities?
Sometimes/Often
To what extent, from totally in line to not at all in line, were state education policies proposed by the governor during your state’s latest legislative session in line with teacher-union priorities?
Not at all/Mostly not in line
To what extent, from totally in line to not at all in line, were legislative outcomes of your state’s latest legislative session in line with teacher-union priorities?
**
Influence over key stakeholders
On a scale from always to never, how often have the priorities of state education leaders aligned with teacher-union positions in the past three years?
**
Would you say that teacher unions typically compromise with policymakers to ensure that their preferred policies are enacted, or typically need not make concessions?
Does not generally concede
* Tied with another state
** Insufficient number of responses to this particular question
a Area ranks are calculated using a weighted average of sub-indicators. For a more detailed description, see Appendix A.
b Where possible, we report a state’s rank as compared to other states on a given metric. For example, out of 51 states, Pennsylvania has the 12th-highest percentage of teachers who are union members. Otherwise, we report a status: Pennsylvania has mandatory collective bargaining, and union agency fees are permitted. For a more detailed description of our metrics and methodology, see Appendix A. To request the raw data for your state, send an email to [email protected].
c For all survey questions, stakeholders were asked specifically about teacher unions, candidates, policies, and leaders in their state. In addition, we asked about unions and policies in the “current legislative session,” but because legislative calendars vary from state to state, responses refer to policies proposed and enacted within the 2010-11 window.
41
7

Overall Rank: 4thTier 1 (Strongest)
PENNSYLVANIA
ENDNOTES
1 A state’s overall rank is calculated as follows: First, we score it on multiple sub-indicators (sub-indicator data and scores for Pennsylvania are shown in the table, Pennsylvania Rankings by Area and Indicator). Second, we take a weighted average of the sub-indicators in each of five areas. In each area, we use that average to place the states in rank order: For example, in Area 1: Resources and Membership, Pennsylvania is ranked 13th of 51 based on the weighted average of its sub-indicators. To generate the state’s overall rank, we average the five area ranks together, then re-order the states. For a more detailed description of data sources and methodology, see Appendix A.
2 Readers should note that these figures include only direct donations from unions and union-connected PACs, but not their spending on electioneering/advertising, mobilizing the union’s own membership, lobbying, or advocacy. A recent Wall Street Journal report found that donations and lobbying activities account for a small share of union political spending compared with their expenditures on member mobilization and advocacy. Even the AFT agreed, making the argument that since its mission is organizing and activism, it will naturally spend significant amounts on these activities. Thus, the percentages we report here are extremely conservative representations of what unions actually spend on politics. For more information, see Appendix A, Area 2; Tom McGinty and Brody Mullins, “Political Spending by Unions Far Exceeds Direct Donations,” Wall Street Journal, July 10, 2012; and Jeff Hauser, “Wall Street Journal Compares Union Political Spending to Corporate Donations,” AFL-CIO, July 10, 2012.
3 At the time of publication, the 2000 conventions were the most recent for which such detailed data were available in forms that met rigorous standards. However, 2008 data provided by the Democratic National Convention were highly correlated with the reliable figures from 2000.
4 We asked stakeholders about unions and policies in the “current legislative session,” but because legislative calendars vary from state to state, responses refer to policies proposed and enacted within the 2010-11 window.
5 Associated Press, “Pa. School Groups’ Survey Sees Grimmer Finances,” Sentinel, May 22, 2012, http://cumberlink.com/news/local/state-and-regional/pa-school-groups-survey-sees-grimmer-finances/article_baacda5e-a41e-11e1-bb89-0019bb2963f4.html.
6 Tony Rhodin, “PA Teachers Union Urges Members To ‘Seriously Consider’ Wage Freeze,” Express-Times, March 16, 2011, http://www.lehighvalleylive.com/breaking-news/index.ssf/2011/03/jim_testerman_head_of_pennsylv.html.
7 Charles Thompson, “In Pennsylvania, Most Teachers Rejected Gov. Corbett’s Urging Of Pay Freezes In Face Of Budget Cuts,” Patriot News, September 5, 2011, http://www.pennlive.com/midstate/index.ssf/2011/09/in_pennsylvania_most_teachers.html.
8 “PSEA President Responds To Governor’s Call For A One-Year Pay Freeze,” Pennsylvania State Education Association, March 16, 2011, http://www.psea.org/general.aspx?id=7903.
9 “Governor Signs $27.7m Budget; Flat Funding, New Teacher Evaluation, Stealth Vouchers,” AFT Pennsylvania, accessed July 11, 2012, http://pa.aft.org/index.cfm?action=article&articleID=e6ec35b0-f50b-4b23-b816-7b0bcae3138b.
10 “Governor Corbett Cites School Vouchers As Priority For Fall Legislative Session,” CBS Philadelphia, September 19, 2011, http://philadelphia.cbslocal.com/2011/09/19/governor-corbett-cites-school-vouchers-as-priority-for-fall-legislative-session/.

Overall Rank: 5thTier 1 (Strongest)
RHODE ISLAND
IntroductionPart IV: Taking a Closer Look–Teacher Union Influence Area
AREA 1: RESOURCES AND MEMBERSHIP
TIED FOR 6TH
Rhode Island’s teacher unions benefit from
resources from its members, as well as
from spending on K–12 education in the
state. First, the Ocean State has one of the
highest membership rates in the nation
with 97.4 percent of its teachers belonging
to unions. Rhode Island’s NEA and AFT
state-level affiliates bring in $552 annually
per teacher in the state (17th out of 51
jurisdictions). What’s more, the unions see
high per-pupil expenditures ($14,567; 8th),
and 54.5 percent of those funds go toward
teacher salaries and benefits (22nd).
AREA 2: INVOLVEMENT IN POLITICS2
TIED FOR 4TH
Rhode Island’s teacher unions have been
extensively involved in state politics in
the past ten years.3 Donations from them
amounted to 1.2 percent of all donations
to candidates for state office (15th). Those
contributions made up 8.3 percent of the
money donated by the ten highest-giving
sectors in the state (16th), making unions
a major player in campaign seasons. They
gave to political parties at a similar level,
with 3.7 percent of total donations to Rhode
Island parties coming from teacher unions
(4th). In addition to money, the unions had
another source of influence: A whopping
one out of three Rhode Island delegates to
the Democratic and Republican national
conventions were teacher union members
(no state was higher on this metric).4
RHODE ISLAND OVERALL RANK: 5TH1
TIER 1 (STRONGEST)
STRONGER WEAKER
1. RESOURCES AND MEMBERSHIP
OVERALL
2. INVOLVEMENT IN POLITICS
3. SCOPE OF BARGAINING
4. STATE POLICIES
5. PERCEIVED INFLUENCE
5
6
4
15
15
17

Overall Rank: 5thTier 1 (Strongest)
RHODE ISLAND
AREA 3: SCOPE OF BARGAINING
TIED FOR 17TH
Rhode Island is one of thirty-two states
that require collective bargaining, and
one of twenty-five that permit unions
to automatically collect agency fees—a
valued source of union revenue—from
non-member teachers. But despite its
supportive stance toward bargaining in
general, state law is fairly neutral about the
specifics. Of twenty-one items examined
in this report, the state requires only three
to be subject to mandatory bargaining
(wages, hours, and terms and conditions
of employment, including benefits)
and is silent on the remaining eighteen
(implicitly including them all in the scope
of bargaining). The state does not permit
teacher strikes.
AREA 4: STATE POLICIES
15TH
While many Rhode Island policies align
with teacher union interests, others do
not. Rhode Island’s charter school laws, in
particular, mirror traditional union positions
by restricting how many such schools may
operate in the state, prohibiting virtual
charter schools, and allowing only the state
board of regents to authorize charters.
It also restricts charter autonomy—state
law requires all that charter teachers
are certified, and automatically exempts
some but not all schools from collective
bargaining agreements. District
employment policies, however, are less
in line with union interests: Rhode Island
requires that student achievement be
the preponderant criterion in teacher
evaluations, and teachers are eligible for
dismissal after multiple unsatisfactory
ratings. Still, not all employment policies
are union-averse. In Rhode Island, teachers
are dismissed due to poor performance at a
lower rate than in almost every other state.
And, compared to most other states, in the
past Rhode Island employers contributed
a higher proportion to pensions than
employees did—although that may soon
change (see sidebar).
AREA 5: PERCEIVED INFLUENCE
15TH
Stakeholders in Rhode Island perceive that
their teacher unions are relatively strong.
Respondents rate them as the second
or third most-influential entity in state
education politics, behind the board of
regents and alongside education advocacy
groups. They agree that, at a time of
budgetary constraint, unions are effective
in protecting state dollars for education,
and in warding off proposed reforms with
which they disagree. Further, they note that
Democrats running for state office always
need teacher union support to be elected
(see Area 2). Still, stakeholders report
that policies proposed by the governor
in the latest legislative session were only
somewhat in line with union priorities, and
those enacted were mostly not in line with
them, showing that the union’s power in
Rhode Island may be in flux–especially
when it comes to lawmakers.5
OVERALL
5TH
Rhode Island’s teacher unions enjoy robust
resources. Although they are active and
powerful participants in state politics, state
policies on teacher employment and the
scope of bargaining are not completely
union-favorable and recent defeats seem
to indicate that the unions, while still
strong, face a political environment that
has become more contentious of late, or at
least more divided (see sidebar).

Overall Rank: 5thTier 1 (Strongest)
RHODE ISLAND
After its first Race to the Top (RTTT) proposal was rejected in March 2010, Rhode Island education commissioner Deborah Gist knew she had to have the unions on board. “Every point is going to count, so [we were] very concerned and really wanted that sign-on,’’ she said.6 While she didn’t get universal support—the National Education Association of Rhode Island (NEARI) refused to endorse the second proposal—Rhode Island’s AFT affiliate, and many of its local unions, fell in line after their demands to rehire laid-off teachers were met.7 The state’s revised RTTT application was ultimately accepted in September 2010.8
The tenuous harmony between labor and management shattered in November 2011 when lawmakers overhauled the state’s troubled pension system. The Retirement Security Act forced state workers and teachers to move a portion of pension funds to a 401(k)-style account and suspended cost-of-living adjustments for current retirees.9 Democratic State Treasurer Gina Raimondo maintained that the law was “carefully designed by the General Assembly in an effort to save our state-administered retirement system” amid escalating costs to an already-underfunded pension.10 But in June 2012 the state’s major unions filed a suit against the Act, declaring that, under the law, benefits must be negotiated.11 Bob Walsh, president of NEARI, is confident that the courts will overturn the Act, declaring that the changed pension system “is going to be short lived—because it was illegal.”12 Now we’ll see if the courts agree…and if they don’t, who is going to foot the bill.
A SHORT-LIVED TRUCE

Overall Rank: 5thTier 1 (Strongest)
RHODE ISLAND
OVERALL RANK: 5TH
Area and Ranka General Indicator Sub-IndicatorSub-Indicator Rank/Statusb
AREA 1: RESOURCES & MEMBERSHIP
Membership By rank, what percentage of public-school teachers in the state are union members? 5th
Revenue By rank, what is the total yearly revenue (per teacher in the state) of the state-level NEA and/ or AFT affiliate(s)?
17th
Spending on education By rank, what percentage of state expenditures (of state general funds, state restricted funds, state bonds, and federal “pass-through” funds) is directed to K-12 education?
45th
By rank, what is the total annual per-pupil expenditure (of funds from federal, state, and local sources) in the state?
8th
By rank, what percentage of total annual per-pupil expenditures is directed to teacher salaries and benefits?
22nd
AREA 2: INVOLVEMENTIN POLITICS
Contributions to candidates and political parties
By rank, what percentage of the total contributions to state candidates was donated by teacher unions?
15th
By rank, what percentage of the total contributions to state-level political parties was donated by teacher unions?
4th
Industry influence By rank, what percent of the contributions to state candidates from the ten highest-giving sectors was donated by teacher unions?
16th
Status of delegates By rank, what percentage of the state’s delegates to the Democratic and Republican conventions were members of teacher unions?
1st
AREA 3:SCOPE OF BARGAINING
Legal scope of bargaining What is the legal status of collective bargaining? Mandatory
By rank, how broad is the scope of collective bargaining? 24th*
Automatic revenue streams What is the unions’ legal right to automatically collect agency fees from non-members and/or collect member dues via automatic payroll deductions?
Permitted
Right to strike What is the legal status of teacher strikes? Prohibited
AREA 4:STATE POLICIES
Performance pay Does the state support performance pay for teachers? State does not support
Retirement By rank, what is the employer- versus employee-contribution rate to the teacher pension system? 5th
Evaluations What is the maximum potential consequence for veteran teachers who receive unsatisfactory evaluation(s)?
Eligible for dismissal
Is classroom effectiveness included in teacher evaluations? If so, how is it weighted? Required; Preponderant criterion
Terms of employment How long before a teacher earns tenure? Three years
Is student/teacher performance considered in tenure decisions? If so, how is it weighted? Required; Included as one of multiple criteria
Is seniority considered in teacher layoff decisions? If so, how is it weighted? Optional; May be considered among other factors
Is teacher performance included in teacher layoff decisions? If so, how is it weighted? Required; Considered among other factors
By rank, what percentage of the teaching workforce was dismissed due to poor performance? 6th
Class size Is class size restricted for grades 1-3? If so, is the restriction higher or lower than the national average (20)?
Yes; Higher
RHODE ISLAND RANKINGS BY AREA AND INDICATOR
6*
4*
17*
15

Overall Rank: 5thTier 1 (Strongest)
RHODE ISLAND
Area and Rank General Indicator Sub-IndicatorSub-Indicator Rank/Status
AREA 4:STATE POLICIES
(cont.)
Charter school structural limitations
Is there a cap (limit) placed on the number of charter schools that can operate in the state (or other jurisdiction) and/or on the number of students who can attend charter schools?
State cap with some room for growth
Does the state allow a variety of charter schools: start-ups, conversions, and virtual schools? Start-ups and conversions only
How many charter authorizing options exist? How active are those authorizers? Single option; Some activity
Charter school exemptions Are all charter schools automatically exempt from state laws and state/district regulations (except those that safeguard students and fiscal accountability)? If not, are they eligible for exemptions?
No; Schools can apply for exemptions
Are all charter schools automatically exempt from state teacher-certification requirements? If not, are they eligible for exemptions?
No; Schools cannot apply for exemptions
Are all charter schools automatically exempt from collective bargaining agreements (CBAs)? If not, are they eligible for exemptions?
Partially; Full automatic exemption for some schools, others must apply for waivers
AREA 5:PERCEIVED INFLUENCEc
Relative influence of teacher unions
How do you rank the influence of teacher unions on education policy compared with other influential entities?
Second- or third-most influential
Influence over campaigns On a scale from always to never, how often do Democratic candidates need teacher-union support to get elected?
Always
On a scale from always to never, how often do Republican candidates need teacher-union support to get elected?
Rarely/Sometimes
Influence over spending To what extent, from strongly agree to strongly disagree, do you agree that even in times of cutbacks, teacher unions are effective in protecting dollars for education?
Agree
Given recent budgetary constraints, would you say that teacher unions generally make concessions to prevent reductions in pay and benefits or fight hard to prevent those reductions?
Generally fight
Influence over policy To what extent, from strongly agree to strongly disagree, do you agree that teacher unions ward off proposals in your state with which they disagree?
Agree
On a scale from always to never, how often do existing state education policies reflect teacher-union priorities?
Sometimes
To what extent, from totally in line to not at all in line, were state education policies proposed by the governor during your state’s latest legislative session in line with teacher-union priorities?
Mostly not in line/Somewhat in line
To what extent, from totally in line to not at all in line, were legislative outcomes of your state’s latest legislative session in line with teacher-union priorities?
Mostly not in line/Somewhat in line
Influence over key stakeholders
On a scale from always to never, how often have the priorities of state education leaders aligned with teacher-union positions in the past three years?
Rarely/Sometimes
Would you say that teacher unions typically compromise with policymakers to ensure that their preferred policies are enacted, or typically need not make concessions?
Does not concede
* Tied with another state
a Area ranks are calculated using a weighted average of sub-indicators. For a more detailed description, see Appendix A.
b Where possible, we report a state’s rank as compared to other states on a given metric. For example, out of 51 states, Rhode Island has the 5th-highest percentage of teachers who are union members. Otherwise, we report a status: Rhode Island has mandatory collective bargaining, and union agency fees are permitted. For a more detailed description of our metrics and methodology, see Appendix A. To request the raw data for your state, send an email to [email protected].
c For all survey questions, stakeholders were asked specifically about teacher unions, candidates, policies, and leaders in their state. In addition, we asked about unions and policies in the “current legislative session,” but because legislative calendars vary from state to state, responses refer to policies proposed and enacted within the 2010-11 window.
15
15

Overall Rank: 5thTier 1 (Strongest)
RHODE ISLAND
ENDNOTES
1 A state’s overall rank is calculated as follows: First, we score it on multiple sub-indicators (sub-indicator data and scores for Rhode Island are shown in the table, Rhode Island Rankings by Area and Indicator). Second, we take a weighted average of the sub-indicators in each of five areas. In each area, we use that average to place the states in rank order: For example, in Area 1: Resources and Membership, Rhode Island is ranked 6th of 51 based on the weighted average of its sub-indicators. To generate the state’s overall rank, we average the five area ranks together, then re-order the states. For a more detailed description of data sources and methodology, see Appendix A.
2 Readers should note that these figures include only direct donations from unions and union-connected PACs, but not their spending on electioneering/advertising, mobilizing the union’s own membership, lobbying, or advocacy. A recent Wall Street Journal report found that donations and lobbying activities account for a small share of union political spending compared with their expenditures on member mobilization and advocacy. Even the AFT agreed, making the argument that since its mission is organizing and activism, it will naturally spend significant amounts on these activities. Thus, the percentages we report here are extremely conservative representations of what unions actually spend on politics. For more information, see Appendix A, Area 2; Tom McGinty and Brody Mullins, “Political Spending by Unions Far Exceeds Direct Donations,” Wall Street Journal, July 10, 2012; and Jeff Hauser, “Wall Street Journal Compares Union Political Spending to Corporate Donations,” AFL-CIO, July 10, 2012.
3 A large number of local NEA and (especially) AFT affiliates in Rhode Island contributed nearly as much to state politics as did the Rhode Island Education Association and the Rhode Island Federation of Teachers, making those unions significant players at the state level as well.
4 At the time of publication, the 2000 conventions were the most recent for which such detailed data were available in forms that met rigorous standards. However, 2008 data provided by the Democratic National Convention were highly correlated with the reliable figures from 2000.
5 We asked stakeholders about unions and policies in the “current legislative session,” but because legislative calendars vary from state to state, responses refer to policies proposed and enacted within the 2010-11 window.
6 Michelle R. Smith, “More Teachers’ Unions Throw Support Behind R.I.’S Race To Top,” Associated Press, May 25, 2010, http://articles.boston.com/2010-05-25/news/29307687_1_teachers-unions-broad-stakeholder-support-districts.
7 Ibid.
8 Jennifer D. Jordan, “NEARI Declines To Sign On To Race to the Top,” Providence Journal, May 27, 2010, http://news.providencejournal.com/breaking-news/2010/05/neari-declines-to-sign-on-to-r-1.html.
9 Michael Corkery, “Rhode Island Public Workers To See Reduced Benefits,” Wall Street Journal, November 18, 2011, http://online.wsj.com/article/SB10001424052970203611404577045132098830806.html.
10 David Klepper, “RI Unions Sue To Block State Pension Overhaul; Chafee, Raimondo Say State Ready For Challenge,” The Republic, June 22, 2012, http://www.therepublic.com/view/story/d1e1076843934123abf565d26fe7ef57/RI--Pension-Lawsuit.
11 Ibid.
12 Ted Nesi, “Unions To RI: Negotiate A Pension Deal Before You Lose In Court,” WPRI.com, February 7, 2012, http://blogs.wpri.com/2012/02/07/unions-to-ri-negotiate-a-pension-deal-before-you-lose-in-court/.

Overall Rank: 49thTier 5 (Weakest)
SOUTH CAROLINA
IntroductionPart IV: Taking a Closer Look–Teacher Union Influence Area
AREA 1: RESOURCES AND MEMBERSHIP
51ST
South Carolina’s teacher association claims
fewer resources and a smaller membership
base than unions in any other state.
Collective bargaining between local districts
and teacher associations is prohibited in the
Palmetto State, and only 26.9 percent of
its teachers—the lowest rate in the nation—
belong to the state association. The state-
level NEA affiliate brings in the smallest
annual revenue in the country, just $52 per
South Carolina teacher. Teachers see scant
spending on education. Only 15.5 percent
of state expenditures are directed to K–12
education (only nine states allocate less).
Total dollars for education (a combination
of local, state, and federal funds) are low
as well: $10,237 per pupil, per year, with
52.9 percent of those dollars going toward
teacher salaries and benefits (both 35th).
AREA 2: INVOLVEMENT IN POLITICS2
35TH
Given the low revenue and membership
of South Carolina’s teacher association, it
comes as no surprise that its involvement in
state politics over the past decade has been
limited. Donations from the association
accounted for just 0.16 percent of the total
received by candidates for state office
(unions in few states contribute less), and
those donations equaled only 1.32 percent
of the donations from the ten highest-giving
sectors in the state (46th). The association
did, however, contribute 1.2 percent of
the total funds received by state political
parties, the 22nd-largest proportion across
states. Boosting the state’s ranking in
political involvement is the fact that 16.4
percent of South Carolina delegates to
the Democratic and Republican national
conventions identified as teacher union
members, 17th in the nation.3
SOUTH CAROLINA OVERALL RANK: 49TH1
TIER 5 (WEAKEST)
STRONGER WEAKER
1. RESOURCES AND MEMBERSHIP
OVERALL
2. INVOLVEMENT IN POLITICS
3. SCOPE OF BARGAINING
4. STATE POLICIES
5. PERCEIVED INFLUENCE
49
51
35
38
47
43

Overall Rank: 49thTier 5 (Weakest)
SOUTH CAROLINA
AREA 3: SCOPE OF BARGAINING
TIED FOR 43RD
South Carolina is one of only five states
that prohibit collective bargaining,
and employee associations may not
automatically collect agency fees from
non-members. Teacher strikes are neither
authorized nor prohibited by state law.
AREA 4: STATE POLICIES
38TH
State policies in South Carolina are
generally not aligned with traditional union
interests. Bonuses based on performance
must be available to all teachers. The state’s
charter law does not limit the number of
schools allowed to operate; provides for
two viable authorizing entities; and allows
automatic exemptions for charters from
many state and district laws, regulations,
and personnel policies. The union does,
however, benefit from two favorable
policies regarding teacher job security:
Student achievement need not factor
into teacher evaluations, and tenure is
conferred virtually automatically after two
years (the national norm is three). The
ratio of employer to employee pension
contributions and the dismissal rate due
to poor teacher performance rank in the
middle of the pack.
AREA 5: PERCEIVED INFLUENCE
47TH
Stakeholders in South Carolina perceive
teacher association strength to be very
limited. Survey respondents rank its
influence on education policy below that of
numerous other entities, such as the state
school board association, charter school
association, business roundtable/chamber
of commerce, and education advocacy
organizations; stakeholders in just two
other states ranked their teacher unions
as less influential. Respondents also note
that policies proposed by the governor
and enacted during the latest legislative
session were mostly not in line with teacher
association priorities. Further, they observe
that in a time of budgetary constraint, the
association conceded from the outset that
some reductions for pay and benefits were
inevitable.
OVERALL
49TH
With few resources, limited involvement in
state politics, and no legal authority, South
Carolina’s teacher association carries a
relatively weak reputation and faces many
unfavorable policies at the state level.

Overall Rank: 49thTier 5 (Weakest)
SOUTH CAROLINA
State Superintendent Mick Zais has been a very unpopular guy with the South Carolina Education Association (SCEA). In 2011, he refused to apply for $50 million in Race to the Top funds, calling it a “losing game…offering pieces of silver in exchange for more strings attached by Washington.”4 For the same reason, later that year he did not seek $144 million in federal “stimulus” money, making South Carolina the only state not to do so. SCEA president Jackie Hicks lamented “I think it’s sad that today we’re not keeping our children first in public education.” According to the SCEA, the funding could have provided salaries for 2,880 teachers and reduced class size as a result.5 Two SCEA briefs entitled “Superintendent of Education Mick Zais: Dead-Beat Dad” and “Superintendent is Derelict in His Duty” fanned the anti-Zais flames.6
The superintendent has instead focused on reforms to increase choice and offer schools regulatory relief. Zais’s chief legislative priority for 2012 has been charter schools, which he describes as “a tremendous step [on] the way to providing a personalized and customized education for every student.”7 In May 2012, the state passed a bill that more than doubles the number of charter schools.8 The law also requires district schools to host charter students for extracurricular activities when those activities are not provided by the charters themselves, and allows universities to sponsor their own schools. While the SCEA says that it does not object to charters overall, it stands firm that charter funding should not diminish funds for traditional district schools. The SCEA did block a voucher bill before the close of the 2012 legislative session, and worked doggedly to secure state funds to give teachers a 2 percent pay raise after four years of freezes and cuts.9,10 But it could not diminish the momentum of Zais and other charter-school supporters.11 The SCEA might not be pleased with its state superintendent, but school-choice advocates give him a gold star.
(NOT) THE TEACHER’S PET

Overall Rank: 49thTier 5 (Weakest)
SOUTH CAROLINA
OVERALL RANK: 49TH
Area and Ranka General Indicator Sub-IndicatorSub-Indicator Rank/Statusb
AREA 1: RESOURCES & MEMBERSHIP
Membership By rank, what percentage of public-school teachers in the state are union members? 51st
Revenue By rank, what is the total yearly revenue (per teacher in the state) of the state-level NEA and/ or AFT affiliate(s)?
51st
Spending on education By rank, what percentage of state expenditures (of state general funds, state restricted funds, state bonds, and federal “pass-through” funds) is directed to K-12 education?
41st
By rank, what is the total annual per-pupil expenditure (of funds from federal, state, and local sources) in the state?
35th
By rank, what percentage of total annual per-pupil expenditures is directed to teacher salaries and benefits?
35th
AREA 2: INVOLVEMENTIN POLITICS
Contributions to candidates and political parties
By rank, what percentage of the total contributions to state candidates was donated by teacher unions?
47th
By rank, what percentage of the total contributions to state-level political parties was donated by teacher unions?
22nd
Industry influence By rank, what percent of the contributions to state candidates from the ten highest-giving sectors was donated by teacher unions?
46th
Status of delegates By rank, what percentage of the state’s delegates to the Democratic and Republican conventions were members of teacher unions?
17th
AREA 3:SCOPE OF BARGAINING
Legal scope of bargaining What is the legal status of collective bargaining? Prohibited
By rank, how broad is the scope of collective bargaining? 47th*
Automatic revenue streams What is the unions’ legal right to automatically collect agency fees from non-members and/or collect member dues via automatic payroll deductions?
Prohibited
Right to strike What is the legal status of teacher strikes? Neither prohibited nor permitted
AREA 4:STATE POLICIES
Performance pay Does the state support performance pay for teachers? Available to all teachers
Retirement By rank, what is the employer- versus employee-contribution rate to the teacher pension system? 30th
Evaluations What is the maximum potential consequence for veteran teachers who receive unsatisfactory evaluation(s)?
Teacher improvement plan
Is classroom effectiveness included in teacher evaluations? If so, how is it weighted? Not required
Terms of employment How long before a teacher earns tenure? Two years
Is student/teacher performance considered in tenure decisions? If so, how is it weighted? Not included
Is seniority considered in teacher layoff decisions? If so, how is it weighted? Optional; Weighted at district discretion
Is teacher performance included in teacher layoff decisions? If so, how is it weighted? Not required
By rank, what percentage of the teaching workforce was dismissed due to poor performance? 20th
Class size Is class size restricted for grades 1-3? If so, is the restriction higher or lower than the national average (20)?
Yes; Higher
SOUTH CAROLINA RANKINGS BY AREA AND INDICATOR
51
35
43*
38

Overall Rank: 49thTier 5 (Weakest)
SOUTH CAROLINA
Area and Rank General Indicator Sub-IndicatorSub-Indicator Rank/Status
AREA 4:STATE POLICIES
(cont.)
Charter school structural limitations
Is there a cap (limit) placed on the number of charter schools that can operate in the state (or other jurisdiction) and/or on the number of students who can attend charter schools?
No state cap
Does the state allow a variety of charter schools: start-ups, conversions, and virtual schools? Yes
How many charter authorizing options exist? How active are those authorizers? Two or more options but must be pre-approved
Charter school exemptions Are all charter schools automatically exempt from state laws and state/district regulations (except those that safeguard students and fiscal accountability)? If not, are they eligible for exemptions?
Yes
Are all charter schools automatically exempt from state teacher-certification requirements? If not, are they eligible for exemptions?
Partially; All schools receive automatic exemptions for some teachers
Are all charter schools automatically exempt from collective bargaining agreements (CBAs)? If not, are they eligible for exemptions?
Partially; Some automatic exemptions for all schools
AREA 5:PERCEIVED INFLUENCEc
Relative influence of teacher unions
How do you rank the influence of teacher unions on education policy compared with other influential entities?
Fifth-most influential or below
Influence over campaigns On a scale from always to never, how often do Democratic candidates need teacher-union support to get elected?
Sometimes/Often
On a scale from always to never, how often do Republican candidates need teacher-union support to get elected?
Rarely
Influence over spending To what extent, from strongly agree to strongly disagree, do you agree that even in times of cutbacks, teacher unions are effective in protecting dollars for education?
Neutral
Given recent budgetary constraints, would you say that teacher unions generally make concessions to prevent reductions in pay and benefits or fight hard to prevent those reductions?
Generally concede
Influence over policy To what extent, from strongly agree to strongly disagree, do you agree that teacher unions ward off proposals in your state with which they disagree?
Neutral
On a scale from always to never, how often do existing state education policies reflect teacher-union priorities?
Rarely/Sometimes
To what extent, from totally in line to not at all in line, were state education policies proposed by the governor during your state’s latest legislative session in line with teacher-union priorities?
Not at all/Mostly not in line
To what extent, from totally in line to not at all in line, were legislative outcomes of your state’s latest legislative session in line with teacher-union priorities?
Mostly not in line/Somewhat in line
Influence over key stakeholders
On a scale from always to never, how often have the priorities of state education leaders aligned with teacher-union positions in the past three years?
Sometimes
Would you say that teacher unions typically compromise with policymakers to ensure that their preferred policies are enacted, or typically need not make concessions?
Sometimes compromise, sometimes do not need to concede
* Tied with another state
a Area ranks are calculated using a weighted average of sub-indicators. For a more detailed description, see Appendix A.
b Where possible, we report a state’s rank as compared to other states on a given metric. For example, out of 51 states, South Carolina has the 51st-highest percentage of teachers who are union members. Otherwise, we report a status: In South Carolina, collective bargaining is prohibited, and teacher strikes are neither prohibited nor permitted. For a more detailed description of our metrics and methodology, see Appendix A. To request the raw data for your state, send an email to [email protected].
c For all survey questions, stakeholders were asked specifically about teacher unions, candidates, policies, and leaders in their state. In addition, we asked about unions and policies in the “current legislative session,” but because legislative calendars vary from state to state, responses refer to policies proposed and enacted within the 2010-11 window.
38
47

Overall Rank: 49thTier 5 (Weakest)
SOUTH CAROLINA
ENDNOTES
1 A state’s overall rank is calculated as follows: First, we score it on multiple sub-indicators (sub-indicator scores for South Carolina are shown in the table, South Carolina Rankings by Area and Indicator). Second, we take a weighted average of the sub-indicators in each of five areas. In each area, we use that average to place the states in rank order: For example, in Area 1: Resources and Membership, South Carolina is ranked 51st of 51 based on the weighted average of its sub-indicators. To generate the state’s overall rank, we average the five area ranks together, then re-order the states. For a more detailed description of data sources and methodology, see Appendix A.
2 Readers should note that these figures include only direct donations from unions and union-connected PACs, but not their spending on electioneering/advertising, mobilizing the union’s own membership, lobbying, or advocacy. A recent Wall Street Journal report found that donations and lobbying activities account for a small share of union political spending compared with their expenditures on member mobilization and advocacy. Even the AFT agreed, making the argument that since its mission is organizing and activism, it will naturally spend significant amounts on these activities. Thus, the percentages we report here are extremely conservative representations of what unions actually spend on politics. For more information, see Appendix A, Area 2; Tom McGinty and Brody Mullins, “Political Spending by Unions Far Exceeds Direct Donations,” Wall Street Journal, July 10, 2012; and Jeff Hauser, “Wall Street Journal Compares Union Political Spending to Corporate Donations,” AFL-CIO, July 10, 2012.
3 At the time of publication, the 2000 conventions were the most recent for which such detailed data were available in forms that met rigorous standards. However, 2008 data provided by the Democratic National Convention were highly correlated with the reliable figures from 2000.
4 Mick Zais, “’Race to Top’ Is A Losing Game,” Post and Courier, June 1, 2011, http://www.postandcourier.com/article/20110601/ARCHIVES/306019940.
5 Adam Pinsker, “Educators Rally For More Funding,” MidlandsConnect.com, August 15, 2011, http://www.midlandsconnect.com/news/story.aspx?id=651622#.T9GbZuJYua4.
6 Jackie Hicks, “Superintendent Of Education Mick Zais: Dead-Beat Dad,” South Carolina Education Association, August 10, 2011, http://www.thescea.org/assets/document/Superintendent_of_Education_Mick_Zais.pdf.
7 Staff and wire report, “Governor Nikki Haley Signs Charter Bill Into Law,” Post and Courier, May 15, 2012, http://www.postandcourier.com/article/20120515/PC16/120519503/1177.
8 Ibid.
9 Associated Press, “SC Senate Overrides Budget Veto Of $10 Million To Help Districts Increase Teacher Salaries,” July 18, 2012, http://www.therepublic.com/view/story/aa2e446856434adba2f60bcd8ad4b16a/SC-XGR--Veto-Session-Education.
10 “2012 Legislative Session Updates,” South Carolina Education Association, accessed July 2, 2012, http://www.thescea.org/home/1524.htm.
11 Ibid.

Overall Rank: 34thTier 4 (Weak)
SOUTH DAKOTA
IntroductionPart IV: Taking a Closer Look–Teacher Union Influence Area
AREA 1: RESOURCES AND MEMBERSHIP
TIED FOR 40TH
South Dakota’s state teacher union has
limited resources from its members, and
does not see a large commitment of dollars
to K–12 education in general, or to teacher
salaries and benefits in particular. Only 54.1
percent of teachers are unionized in the
Mount Rushmore State (an unusually low
percentage compared to the other states
that also require collective bargaining, and
only the 43rd-highest membership rate
of all 51 jurisdictions nationwide). Its state
NEA affiliate brings in $370 annually South
Dakota per teacher (31st of 51). Further,
while South Dakota schools, many of them
rural, spend a fair amount of money on K–12
education—$11,232 annually per student
(26th)—just half of those funds go toward
teacher salaries and benefits (only three
states spend a smaller percentage).
AREAS 2: INVOLVEMENT IN POLITICS2
TIED FOR 1ST
The teacher union has been a significant
contributor to South Dakota politics over
the past ten years. It ties with Alabama and
Hawaii for most active union involvement.
Specifically, 1.4 percent of the donations
to candidates for state office came from
the South Dakota Education Association
(12th).3 Those contributions amounted
to roughly 14 percent of total donations
from the ten highest-giving sectors in the
state (10th). Unions donated to political
parties as well: 1.54 percent of total party
donations came from them (18th). (These
high rankings do not appear to make sense
given that the South Dakota Education
Association (SDEA) is relatively resource-
poor (see Area 1), until we consider that
the sum of donations from any source
SOUTH DAKOTA OVERALL RANK: 34TH1
TIER 4 (WEAK)
STRONGER WEAKER
1. RESOURCES AND MEMBERSHIP
OVERALL
2. INVOLVEMENT IN POLITICS
3. SCOPE OF BARGAINING
4. STATE POLICIES
5. PERCEIVED INFLUENCE
34
1
34
40
49
33

Overall Rank: 34thTier 4 (Weak)
SOUTH DAKOTA
to state candidates and parties in South
Dakota is one of the smallest totals in the
nation. Thus, the SDEA is able to be heavily
involved in state politics, without actually
giving much money.) The union voice was
also represented at the Democratic and
Republican national conventions—23.1
percent of South Dakota’s delegates were
union members (6th).4
AREA 3: SCOPE OF BARGAINING
TIED FOR 33RD
South Dakota is one of thirty-two states
that mandate collective bargaining and
it is relatively permissive regarding the
scope of negotiations. Of twenty-one items
examined in this report, South Dakota
law dictates that four must be subject
to bargaining: wages, hours, terms and
conditions of employment, and grievance
procedures. The state is silent on the
remaining seventeen items, implicitly
permitting them. South Dakota does
limit the strength of its unions, however,
by prohibiting them from automatically
collecting agency fees from non-member
teachers, and teachers are not allowed to
strike.
AREA 4: STATE POLICIES
TIED FOR 34TH
While some of South Dakota’s state
policies align with traditional teacher union
interests, others do not. South Dakota does
not have a charter school law.5 Neither
teacher evaluations nor tenure decisions
must include student achievement data
(although the former may soon change,
see sidebar), and there are no articulated
consequences for teachers who receive
unsatisfactory evaluations—all policies that
unions typically support. Despite its tenure
and evaluation policies, however, South
Dakota dismisses teachers due to poor
performance at a higher rate than any other
state. And the state does not require that
class size be restricted.
AREA 5: PERCEIVED INFLUENCE
49TH
Despite (or perhaps motivating) the union’s
involvement in state politics, stakeholders
in South Dakota report that it is relatively
weak. They indicate that several other
organizations have greater sway over
education policy: the state school board,
the school board association, and the
association of school administrators.
South Dakota is the only state in which
stakeholders report that Democrats rarely
need teacher union support to get elected
(elsewhere, Democrats at least sometimes
need that support). Respondents also note
that teacher unions are not effective in
protecting dollars for education or warding
off education reforms with which they
disagree, and that policies enacted in the
state’s latest legislative session were mostly
not in line with teacher union priorities.6
OVERALL
34TH
Despite its perceived ineffectiveness,
the South Dakota teacher union is highly
active in state politics. Such activity may
well illustrate the union’s effort to alter
unfavorable policies and hostile legislative
environments (see sidebar).

Overall Rank: 34thTier 4 (Weak)
SOUTH DAKOTA
The South Dakota Education Association (SDEA) has no love for a massive education-reform bill signed into law in February 2012. HB 1234 provides a $5,000 one-year bonus for up to 20 percent of every school’s top teachers, bases half of teacher evaluations on quantitative data (such as test scores), requires uniform teacher evaluations, and gradually phases out teacher tenure.7
Unable to stop legislators from passing the measure, the SDEA took it to the voters, collecting nearly 26,000 signatures (fewer than 16,000 were needed) to put its repeal on the November 2012 ballot. Union leaders insist that the bill will create unnecessary competition among teachers, undermining their work without addressing the real problem: Teachers do not have enough resources to do their job well. SDEA leader Amanda Mack lamented: “This bill is not the solution to the problems facing education in South Dakota. If we were able to fund the formula properly and able to give schools the resources that they need to determine what teachers to hire, what textbooks they need, [and] what supplies they need, we’d be in a much better position than we are.”8 To prove its point that overall, not selective, funding will do more for South Dakota students, the SDEA took to door knocking again—and this time gathered 34,000 signatures to put another measure on the ballot. The “Penny Tax” would add one cent to the state sales tax and is projected to yield $90 million for education.9 SDEA President Sandy Arseneault is pleased with the campaign thus far: “What a wonderful example of what we can accomplish if we come together with one voice.”10 Come November, voters will decide whether their voices harmonize with the union or the legislature.
THE PEOPLE’S CHOICE

Overall Rank: 34thTier 4 (Weak)
SOUTH DAKOTA
OVERALL RANK: 34TH
Area and Ranka General Indicator Sub-IndicatorSub-Indicator Rank/Statusb
AREA 1: RESOURCES & MEMBERSHIP
Membership By rank, what percentage of public-school teachers in the state are union members? 43rd
Revenue By rank, what is the total yearly revenue (per teacher in the state) of the state-level NEA and/ or AFT affiliate(s)?
31st
Spending on education By rank, what percentage of state expenditures (of state general funds, state restricted funds, state bonds, and federal “pass-through” funds) is directed to K-12 education?
39th
By rank, what is the total annual per-pupil expenditure (of funds from federal, state, and local sources) in the state?
26th
By rank, what percentage of total annual per-pupil expenditures is directed to teacher salaries and benefits?
48th
AREA 2: INVOLVEMENTIN POLITICS
Contributions to candidates and political parties
By rank, what percentage of the total contributions to state candidates was donated by teacher unions?
12th
By rank, what percentage of the total contributions to state-level political parties was donated by teacher unions?
18th
Industry influence By rank, what percent of the contributions to state candidates from the ten highest-giving sectors was donated by teacher unions?
10th
Status of delegates By rank, what percentage of the state’s delegates to the Democratic and Republican conventions were members of teacher unions?
6th*
AREA 3:SCOPE OF BARGAINING
Legal scope of bargaining What is the legal status of collective bargaining? Mandatory
By rank, how broad is the scope of collective bargaining? 15th*
Automatic revenue streams What is the unions’ legal right to automatically collect agency fees from non-members and/or collect member dues via automatic payroll deductions?
Agency fees prohibited
Right to strike What is the legal status of teacher strikes? Prohibited
AREA 4:STATE POLICIES
Performance pay Does the state support performance pay for teachers? State-sponsored initiatives offered in select districts
Retirement By rank, what is the employer- versus employee-contribution rate to the teacher pension system? 42nd*
Evaluations What is the maximum potential consequence for veteran teachers who receive unsatisfactory evaluation(s)?
No consequences articulated
Is classroom effectiveness included in teacher evaluations? If so, how is it weighted? Not required
Terms of employment How long before a teacher earns tenure? Three years
Is student/teacher performance considered in tenure decisions? If so, how is it weighted? Not included
Is seniority considered in teacher layoff decisions? If so, how is it weighted? Optional; Weighted at district discretion
Is teacher performance included in teacher layoff decisions? If so, how is it weighted? Not required
By rank, what percentage of the teaching workforce was dismissed due to poor performance? 51st
Class size Is class size restricted for grades 1-3? If so, is the restriction higher or lower than the national average (20)?
No restriction
SOUTH DAKOTA RANKINGS BY AREA AND INDICATOR
40*
1*
33*
34*

Overall Rank: 34thTier 4 (Weak)
SOUTH DAKOTA
Area and Rank General Indicator Sub-IndicatorSub-Indicator Rank/Status
AREA 4:STATE POLICIES
(cont.)
Charter school structural limitationsc
Is there a cap (limit) placed on the number of charter schools that can operate in the state (or other jurisdiction) and/or on the number of students who can attend charter schools?
N/A
Does the state allow a variety of charter schools: start-ups, conversions, and virtual schools? N/A
How many charter authorizing options exist? How active are those authorizers? N/A
Charter school exemptionsc Are all charter schools automatically exempt from state laws and state/district regulations (except those that safeguard students and fiscal accountability)? If not, are they eligible for exemptions?
N/A
Are all charter schools automatically exempt from state teacher-certification requirements? If not, are they eligible for exemptions?
N/A
Are all charter schools automatically exempt from collective bargaining agreements (CBAs)? If not, are they eligible for exemptions?
N/A
AREA 5:PERCEIVED INFLUENCEd
Relative influence of teacher unions
How do you rank the influence of teacher unions on education policy compared with other influential entities?
Fourth-most influential
Influence over campaigns On a scale from always to never, how often do Democratic candidates need teacher-union support to get elected?
Rarely
On a scale from always to never, how often do Republican candidates need teacher-union support to get elected?
Never/Rarely
Influence over spending To what extent, from strongly agree to strongly disagree, do you agree that even in times of cutbacks, teacher unions are effective in protecting dollars for education?
Disagree
Given recent budgetary constraints, would you say that teacher unions generally make concessions to prevent reductions in pay and benefits or fight hard to prevent those reductions?
Generally fight
Influence over policy To what extent, from strongly agree to strongly disagree, do you agree that teacher unions ward off proposals in your state with which they disagree?
Disagree
On a scale from always to never, how often do existing state education policies reflect teacher-union priorities?
Rarely/Sometimes
To what extent, from totally in line to not at all in line, were state education policies proposed by the governor during your state’s latest legislative session in line with teacher-union priorities?
Mostly not in line/Somewhat in line
To what extent, from totally in line to not at all in line, were legislative outcomes of your state’s latest legislative session in line with teacher-union priorities?
Mostly not in line/Somewhat in line
Influence over key stakeholders
On a scale from always to never, how often have the priorities of state education leaders aligned with teacher-union positions in the past three years?
Sometimes
Would you say that teacher unions typically compromise with policymakers to ensure that their preferred policies are enacted, or typically need not make concessions?
Compromise
* Tied with another state
a Area ranks are calculated using a weighted average of sub-indicators. For a more detailed description, see Appendix A.
b Where possible, we report a state’s rank as compared to other states on a given metric. For example, out of 51 states, South Dakota has the 43rd-highest percentage of teachers who are union members. Otherwise, we report a status: South Dakota has mandatory collective bargaining, and union agency fees are prohibited. For a more detailed description of our metrics and methodology, see Appendix A. To request the raw data for your state, send an email to [email protected].
c South Dakota does not have a charter school law.
d For all survey questions, stakeholders were asked specifically about teacher unions, candidates, policies, and leaders in their state. In addition, we asked about unions and policies in the “current legislative session,” but because legislative calendars vary from state to state, responses refer to policies proposed and enacted within the 2010-11 window.
34*
49

Overall Rank: 34thTier 4 (Weak)
SOUTH DAKOTA
ENDNOTES
1 A state’s overall rank is calculated as follows: First, we score it on multiple sub-indicators (sub-indicator data and scores for South Dakota are shown in the table, South Dakota Rankings by Area and Indicator). Second, we take a weighted average of the sub-indicators in each of five areas. In each area, we use that average to place the states in rank order: For example, in Area 1: Resources and Membership, South Dakota is ranked 40th of 51 based on the weighted average of its sub-indicators. To generate the state’s overall rank, we average the five area ranks together, then re-order the states. For a more detailed description of data sources and methodology, see Appendix A.
2 Readers should note that these figures include only direct donations from unions and union-connected PACs, but not their spending on electioneering/advertising, mobilizing the union’s own membership, lobbying, or advocacy. A recent Wall Street Journal report found that donations and lobbying activities account for a small share of union political spending compared with their expenditures on member mobilization and advocacy. Even the AFT agreed, making the argument that since its mission is organizing and activism, it will naturally spend significant amounts on these activities. Thus, the percentages we report here are extremely conservative representations of what unions actually spend on politics. For more information, see Appendix A, Area 2; Tom McGinty and Brody Mullins, “Political Spending by Unions Far Exceeds Direct Donations,” Wall Street Journal, July 10, 2012; and Jeff Hauser, “Wall Street Journal Compares Union Political Spending to Corporate Donations,” AFL-CIO, July 10, 2012.
3 South Dakota is one of just four states where local teacher associations did not contribute to candidates and political parties. In South Dakota, the SDEA was the lone union donor to candidates, while the SDEA along with the NEA and AFT gave to state political parties.
4 At the time of publication, the 2000 conventions were the most recent for which such detailed data were available in forms that met rigorous standards. However, 2008 data provided by the Democratic National Convention were highly correlated with the reliable figures from 2000.
5 We do not include data for sub-indicators pertaining to charters when calculating the ranking of states that do not have charter school laws. While some might argue that the lack of such a law is in itself evidence for union strength, we do not have sufficient data to link that absence to union activity. The nine states without charter laws are home to very different contexts—while teacher unions in some states may have played a significant role in keeping charter laws at bay, in others, they played little or no role.
6 We asked stakeholders about unions and policies in the “current legislative session,” but because legislative calendars vary from state to state, responses refer to policies proposed and enacted within the 2010-11 window.
7 Associated School Boards of South Dakota Issue Briefs, accessed June 7, 2012, http://www.asbsd.org/page174.aspx.
8 Jill Johnson, “SD Teacher Bonus Bill On November Ballot,” KDLT News, July 2, 2012, http://www.kdlt.com/index.php?option=com_content&task=view&id=18666&Itemid=57.
9 “Penny Sales Tax Vote Coming in November,” The Educator’s Advocate, December 2011/January 2012, http://sdea.org/assets/document/Advocate_DecJan_2011-2012.pdf.
10 Ibid.

Overall Rank: 41stTier 5 (Weakest)
TENNESSEE
IntroductionPart IV: Taking a Closer Look–Teacher Union Influence Area
AREA 1: RESOURCES AND MEMBERSHIP
TIED FOR 37TH
Tennessee’s state teacher union contends
with relatively low financial resources and
membership. Only 58.7 percent of teachers
in the Volunteer State are unionized
(the 36th-highest percentage out of 51
jurisdictions), and its NEA state affiliate
sees just $211 annually per Tennessee
teacher (39th). The state directs just 17.7
percent of its expenditures toward K–12
education (32nd). Total per-pupil spending
is low (just $8,695 per student annually,
46th), although 55.8 percent of those funds
go toward teacher salaries and benefits
(15th).
AREA 2: INVOLVEMENT IN POLITICS2
TIED FOR 18TH
Tennessee’s teacher union is in the middle
of the pack compared with those in other
states when it comes to involvement in
politics. Over the past ten years, donations
from the union accounted for 0.59 percent
of the total contributions received by
candidates for state office (26th), with
5.5 percent of the funds going to such
candidates from the ten highest-giving
sectors in the state (23rd). The union
gave to state political parties at a similar
level: 0.89 percent of total donations to
Tennessee’s parties came directly from its
teacher union (27th). And 15.0 percent of
Tennessee’s delegates to the Democratic
and Republican national conventions were
teacher union members (tied for 20th).3
TENNESSEE OVERALL RANK: 41ST1
TIER 5 (WEAKEST)
STRONGER WEAKER
1. RESOURCES AND MEMBERSHIP
OVERALL
2. INVOLVEMENT IN POLITICS
3. SCOPE OF BARGAINING
4. STATE POLICIES
5. PERCEIVED INFLUENCE
41
18
42
37
42
38

Overall Rank: 41stTier 5 (Weakest)
TENNESSEE
AREA 3: SCOPE OF BARGAINING
38TH
While Tennessee is one of thirty-two
states that require collective bargaining
by teachers, it restricts the scope of that
bargaining fairly severely.4 The state
explicitly prohibits negotiations over eight
of the twenty-one items examined in this
metric: management rights, tenure, teacher
transfers/reassignments, layoffs, dismissal,
evaluations, pension/retirement benefits,
and curriculum. State law requires six items
must be bargained, and implicitly permits
the remaining seven by taking no position.
The state also prohibits the automatic
collection of agency fees from non-member
teachers, a key source of union revenue.
Tennessee teachers are not permitted to
strike.
AREA 4: STATE POLICIES
42ND
Many state education policies do not
align with traditional teacher union
interests. State law permits performance
pay, requires that student achievement
be the preponderant criterion in teacher
evaluations, and renders teachers eligible
for dismissal after multiple unsatisfactory
ratings (the most stringent possible
consequence). Tenure is conferred
after five years (three is standard) and
depends primarily on evidence of student
learning. Districts must also consider
teacher performance, not only seniority,
in determining teacher layoffs. Tennessee
law does not cap the number of charters
that can operate in the state, and charter
teachers do not have to participate in
collective bargaining agreements. However,
authorizing options are limited and charts
are not automatically exempt charters
from state and district laws (although the
schools may apply for such exemptions).
AREA 5: PERCEIVED INFLUENCE
TIED FOR 42ND
Stakeholders in Tennessee currently
perceive teacher union strength as limited.
Survey respondents rank union influence on
education policy behind that of the state’s
education advocacy organizations, business
roundtable/chamber of commerce, and
school board association, among others.
They note that the union is not effective in
warding off education proposals with which
it disagrees, and indicate that the priorities
of state education leaders only sometimes
align to teacher union positions. Finally,
stakeholders report that policies proposed
by the governor during the latest legislative
session were mostly not in line with teacher
union priorities, while the outcomes of that
session were not at all in line.5
OVERALL
41ST
Tennessee’s state teacher union is
relatively weak across the board: While it
is moderately involved in state politics, it
faces thin resources and membership, an
unfriendly state policy environment, and
a restricted scope of bargaining. These,
taken together, have likely contributed
to its weakened reputation among state
stakeholders. Of the unions in states where
bargaining is mandatory, Tennessee’s is one
of the weakest.

Overall Rank: 41stTier 5 (Weakest)
TENNESSEE
The Tennessee Education Association (TEA) is trying to recover from a major re-write of Tennessee’s collective bargaining laws. While negotiations between a district and its teachers are still mandatory, the 2011 law calls for “collaborative conferencing,” where teachers can choose to be represented by a union—or not—and instead bargain as an organization of non-unionized professionals. The statute also prevents any union revenue garnered from employee payroll deductions from being used for political purposes.6 Lieutenant Governor Ron Ramsey touted the act as a defeat of the TEA: “For years upon years, one union has thwarted the progress of education in Tennessee…The barrier that has prevented us from putting the best possible teacher in every classroom will soon be removed.”7 TEA government relations director Jerry Winters declared that Ramsey’s interpretation went too far and that he “is beating his chest for political reasons.”8 Yet many Tennessee teachers agreed with Ramsey. Looking to escape what J.C. Bowman, the executive director of the Professional Educators Association of Tennessee (PEAT), calls the “partisan climate that created the political environment Tennessee teachers have faced in recent years,” hundreds left the TEA (and its local affiliates) for PEAT, its non-union rival.9,10
Despite its losses of membership and clout, the TEA rebounded somewhat in 2012, securing a 2.5 percent state-funded pay raise for teachers and a requirement that lawmakers must get comprehensive input from teachers before making any changes to the existing teacher evaluation system. It also defeated licensure changes, voucher legislation, and Governor Haslam’s controversial proposal to completely eliminate the state-mandated teacher salary schedule.11 However, with the traditional role, and power, of the Tennessee union now in flux, it’s difficult to say whether the TEA will make a full recovery.
HOLDING ON, BARELY

Overall Rank: 41stTier 5 (Weakest)
TENNESSEE
OVERALL RANK: 41ST
Area and Ranka General Indicator Sub-IndicatorSub-Indicator Rank/Statusb
AREA 1: RESOURCES & MEMBERSHIP
Membership By rank, what percentage of public-school teachers in the state are union members? 36th
Revenue By rank, what is the total yearly revenue (per teacher in the state) of the state-level NEA and/ or AFT affiliate(s)?
39th
Spending on education By rank, what percentage of state expenditures (of state general funds, state restricted funds, state bonds, and federal “pass-through” funds) is directed to K-12 education?
32nd
By rank, what is the total annual per-pupil expenditure (of funds from federal, state, and local sources) in the state?
46th
By rank, what percentage of total annual per-pupil expenditures is directed to teacher salaries and benefits?
15th
AREA 2: INVOLVEMENTIN POLITICS
Contributions to candidates and political parties
By rank, what percentage of the total contributions to state candidates was donated by teacher unions?
26th
By rank, what percentage of the total contributions to state-level political parties was donated by teacher unions?
27th
Industry influence By rank, what percent of the contributions to state candidates from the ten highest-giving sectors was donated by teacher unions?
23rd
Status of delegates By rank, what percentage of the state’s delegates to the Democratic and Republican conventions were members of teacher unions?
20th*
AREA 3:SCOPE OF BARGAINING
Legal scope of bargaining What is the legal status of collective bargaining? Mandatory
By rank, how broad is the scope of collective bargaining? 36th
Automatic revenue streams What is the unions’ legal right to automatically collect agency fees from non-members and/or collect member dues via automatic payroll deductions?
Agency fees prohibited
Right to strike What is the legal status of teacher strikes? Prohibited
AREA 4:STATE POLICIES
Performance pay Does the state support performance pay for teachers? State supports/encourages
Retirement By rank, what is the employer- versus employee-contribution rate to the teacher pension system? 35th
Evaluations What is the maximum potential consequence for veteran teachers who receive unsatisfactory evaluation(s)?
Eligible for dismissal
Is classroom effectiveness included in teacher evaluations? If so, how is it weighted? Required; Preponderant criterion
Terms of employment How long before a teacher earns tenure? Five years
Is student/teacher performance considered in tenure decisions? If so, how is it weighted? Required; Preponderant critera
Is seniority considered in teacher layoff decisions? If so, how is it weighted? Optional; May be considered among other factors
Is teacher performance included in teacher layoff decisions? If so, how is it weighted? Required; Considered among other factors
By rank, what percentage of the teaching workforce was dismissed due to poor performance? 10th
Class size Is class size restricted for grades 1-3? If so, is the restriction higher or lower than the national average (20)?
Yes; Higher
TENNESSEE RANKINGS BY AREA AND INDICATOR
37*
18*
38
42

Overall Rank: 41stTier 5 (Weakest)
TENNESSEE
Area and Rank General Indicator Sub-IndicatorSub-Indicator Rank/Status
AREA 4:STATE POLICIES
(cont.)
Charter school structural limitations
Is there a cap (limit) placed on the number of charter schools that can operate in the state (or other jurisdiction) and/or on the number of students who can attend charter schools?
No state cap
Does the state allow a variety of charter schools: start-ups, conversions, and virtual schools? Start-ups and conversions only
How many charter authorizing options exist? How active are those authorizers? Single option; Some activity
Charter school exemptions Are all charter schools automatically exempt from state laws and state/district regulations (except those that safeguard students and fiscal accountability)? If not, are they eligible for exemptions?
No; Schools can apply for exemptions
Are all charter schools automatically exempt from state teacher-certification requirements? If not, are they eligible for exemptions?
No; Schools cannot apply for exemptions
Are all charter schools automatically exempt from collective bargaining agreements (CBAs)? If not, are they eligible for exemptions?
Yes
AREA 5:PERCEIVED INFLUENCEc
Relative influence of teacher unions
How do you rank the influence of teacher unions on education policy compared with other influential entities?
Fifth-most influential or below
Influence over campaigns On a scale from always to never, how often do Democratic candidates need teacher-union support to get elected?
Often/Always
On a scale from always to never, how often do Republican candidates need teacher-union support to get elected?
Never/Rarely
Influence over spending To what extent, from strongly agree to strongly disagree, do you agree that even in times of cutbacks, teacher unions are effective in protecting dollars for education?
Neutral
Given recent budgetary constraints, would you say that teacher unions generally make concessions to prevent reductions in pay and benefits or fight hard to prevent those reductions?
Generally fight
Influence over policy To what extent, from strongly agree to strongly disagree, do you agree that teacher unions ward off proposals in your state with which they disagree?
Disagree
On a scale from always to never, how often do existing state education policies reflect teacher-union priorities?
Sometimes
To what extent, from totally in line to not at all in line, were state education policies proposed by the governor during your state’s latest legislative session in line with teacher-union priorities?
Not at all/Mostly not in line
To what extent, from totally in line to not at all in line, were legislative outcomes of your state’s latest legislative session in line with teacher-union priorities?
Not at all/Mostly not in line
Influence over key stakeholders
On a scale from always to never, how often have the priorities of state education leaders aligned with teacher-union positions in the past three years?
Sometimes/Often
Would you say that teacher unions typically compromise with policymakers to ensure that their preferred policies are enacted, or typically need not make concessions?
Generally compromise
* Tied with another state
a Area ranks are calculated using a weighted average of sub-indicators. For a more detailed description, see Appendix A.
b Where possible, we report a state’s rank as compared to other states on a given metric. For example, out of 51 states, Tennessee has the 36th-highest percentage of teachers who are union members. Otherwise, we report a status: Tennessee has mandatory collective bargaining, and union agency fees are prohibited. For a more detailed description of our metrics and methodology, see Appendix A. To request the raw data for your state, send an email to [email protected].
c For all survey questions, stakeholders were asked specifically about teacher unions, candidates, policies, and leaders in their state. In addition, we asked about unions and policies in the “current legislative session,” but because legislative calendars vary from state to state, responses refer to policies proposed and enacted within the 2010-11 window.
42
42*

Overall Rank: 41stTier 5 (Weakest)
TENNESSEE
ENDNOTES
1 A state’s overall rank is calculated as follows: First, we score it on multiple sub-indicators (sub-indicator data and scores for Tennessee are shown in the table, Tennessee Rankings by Area and Indicator). Second, we take a weighted average of the sub-indicators in each of five areas. In each area, we use that average to place the states in rank order: For example, in Area 1: Resources and Membership, Tennessee is ranked 37th of 51 based on the weighted average of its sub-indicators. To generate the state’s overall rank, we average the five area ranks together, then re-order the states. For a more detailed description of data sources and methodology, see Appendix A.
2 Readers should note that these figures include only direct donations from unions and union-connected PACs, but not their spending on electioneering/advertising, mobilizing the union’s own membership, lobbying, or advocacy. A recent Wall Street Journal report found that donations and lobbying activities account for a small share of union political spending compared with their expenditures on member mobilization and advocacy. Even the AFT agreed, making the argument that since its mission is organizing and activism, it will naturally spend significant amounts on these activities. Thus, the percentages we report here are extremely conservative representations of what unions actually spend on politics. For more information, see Appendix A, Area 2; Tom McGinty and Brody Mullins, “Political Spending by Unions Far Exceeds Direct Donations,” Wall Street Journal, July 10, 2012; and Jeff Hauser, “Wall Street Journal Compares Union Political Spending to Corporate Donations,” AFL-CIO, July 10, 2012.
3 At the time of publication, the 2000 conventions were the most recent for which such detailed data were available in forms that met rigorous standards. However, 2008 data provided by the Democratic National Convention were highly correlated with the reliable figures from 2000.
4 While Tennessee law mandates collective bargaining, it does not require that districts bargain with teacher unions, only with professional organizations—which may or may not be a union, at the discretion of the local employees (see sidebar).
5 We asked stakeholders about unions and policies in the “current legislative session,” but because legislative calendars vary from state to state, responses refer to policies proposed and enacted within the 2010-11 window.
6 “Professional Educators Collaborative Conferencing Act of 2011 Frequently Asked Questions,” Tennessee Department of Education, accessed July 20, 2012, http://www.tn.gov/education/doc/PECCAFAQ_June17.pdf.
7 Tim Ghianni, “Tennessee Limits Collective Bargaining Rights For Teachers,” Reuters.com, June 1, 2011, http://www.reuters.com/article/2011/06/01/us-unions-states-tennessee-idUSTRE75071I20110601.
8 Ibid.
9 J. C. Bowman, “A Note From The Executive Eirector,” Professional Educators of Tennessee, accessed July 20, 2012, http://www.proedtn.org/displaycommon.cfm?an=1&subarticlenbr=40.
10 Chas Sisk, “TN Teachers Union Gets Mixed Grades,” Tennessean, February 27, 2011, http://www.wbir.com/news/article/159016/0/TN-teachers-union-gets-mixed-grades.
11 “Many Wins For Teachers in 2012 Legislative Session,” Tennessee Education Association, accessed July 16, 2012, http://www.teateachers.org/news/many-wins-teachers-2012-legislative-session.

Overall Rank: 44thTier 5 (Weakest)
TEXAS
IntroductionPart IV: Taking a Closer Look–Teacher Union Influence Area
AREA 1: RESOURCES AND MEMBERSHIP
TIED FOR 44TH
Texas’s teacher associations have limited
membership and revenue, and do not
see high spending on education in the
state. Collective bargaining in education
is prohibited in the Lone Star State, and
62.7 percent of its teachers belong to
professional associations (still the 33rd-
highest percentage out of 51 states). But
even then, Texas’s state-level NEA and AFT
affiliates see just $53 annually per teacher
in the state—only the state association in
South Carolina takes in less. The state does
direct 29.8 percent of its total expenditures
toward K–12 education (3rd). But overall
K–12 expenditures are low: At $8,654 per
student per year, they are lower in just two
other states. And, 53.4 percent of those
expenditures go toward teacher salaries
and benefits (32nd).
AREA 2: INVOLVEMENT IN POLITICS2
TIED FOR 36TH
In the past decade, teacher associations
participated less in state politics in
Texas than did unions in many other
states (although their involvement was
comparable to that in the four other
states in which bargaining is prohibited).
Contributions from independent, NEA-
affiliated, and AFT-affiliated associations
accounted for just 0.60 percent of the
total donations received by candidates
for state office (24th of 51).3 Their share of
contributions to state political parties was
equally small—0.47 percent (38th). Further,
9.2 percent of all of Texas’s delegates to
the Democratic and Republican national
conventions were teacher union members
(36th).4
TEXAS OVERALL RANK: 44TH1
TIER 5 (WEAKEST)
STRONGER WEAKER
1. RESOURCES AND MEMBERSHIP
OVERALL
2. INVOLVEMENT IN POLITICS
3. SCOPE OF BARGAINING
4. STATE POLICIES
5. PERCEIVED INFLUENCE
44
36
30
44
34
48

Overall Rank: 44thTier 5 (Weakest)
TEXAS
AREA 3: SCOPE OF BARGAINING
TIED FOR 48TH; LAST PLACE
Texas is one of five states that prohibit
collective bargaining, and associations are
not allowed to collect agency fees. The
state does not permit teacher strikes.
AREA 4: STATE POLICIES
TIED FOR 30TH
A number of Texas policies align with
traditional teacher union interests—but
not all. Some union-friendly policies
relate to teacher evaluations and job
security: The state does not require that
student achievement data factor into
teacher evaluations, and confers tenure
on teachers virtually automatically after
three years (the national norm). Further,
unions typically support policies that
limit the expansion of charter schools,
and Texas places a cap on some (but not
all) types of charter schools. In addition,
while it allows both the state and local
school boards to authorize charters, the
state essentially serves as the only viable
authorizing option. On the union-averse
side, state law requires districts to consider
performance in determining teacher layoffs,
permits performance pay, does not require
charter school teachers to be certified, and
exempts state-authorized charters from
district personnel policies.
AREA 5: PERCEIVED INFLUENCE
34TH
Stakeholders in Texas report that the
reach of their state teacher associations
is somewhat limited. Survey respondents
rank their influence on education policy
alongside that of education advocacy
organizations but behind the business
roundtable/chamber of commerce. They
note that state policies only sometimes
reflect association priorities, and that
Texas education leaders only sometimes
align with those priorities. While they
report that the associations fought hard
given recent budgetary constraints to
prevent reductions in pay and benefits,
they also report that policies proposed
by the governor during the state’s latest
legislative session were mostly not in line
with association priorities, and that policies
actually enacted were only somewhat in
line with those priorities.5
OVERALL
44TH
Texas prohibits collective bargaining, and
its NEA and AFT affiliates have little in the
way of financial or membership resources.
While the state’s teacher associations
participate to a limited extent in state
politics and enjoy some favorable policies
at the state level, overall, Texas teacher
associations are comparatively weaker than
unions in nearly every other state.

Overall Rank: 44thTier 5 (Weakest)
TEXAS
Texas teachers don’t seem to mind that collective bargaining is prohibited in the Lone Star State. To the contrary, many of them have chosen to avoid the politics, and the conflict, that traditionally follows teacher unions. The state’s two largest independent teacher professional associations boast more combined revenue than the NEA-affiliated Texas State Teachers Association (TSTA) and AFT-affiliated Texas Federation of Teachers.6 The Association of Texas Professional Educators (ATPE) explains, “collective bargaining and exclusive consultation policies create an adversarial relationship between employees and employers that compromise students’ education.”7 With over 100,000 dues-paying members of the ATPE alone, it’s apparently a popular opinion.
The voice of labor is not completely silent in Texas, but it is louder in the state’s capital than in its districts. In 2011, Texas lawmakers slashed $4 billion in education over two years to help close a state budget shortfall, and the TSTA reacted by imploring Governor Rick Perry to dip into the state’s rainy day fund. Perry reluctantly agreed to a one-time use of the funds to stave off an impending budget crisis, but vowed, “I remain steadfastly committed to protecting the remaining balance.”8 A year later, he stayed true to his word. The TSTA called for a special legislative session, requesting another bailout for 2012-13: With an estimated 12,000 teacher jobs already lost and 8,200 elementary classes above legal class size limits,9 TSTA President Rita Haecker argued that “[u]ltimately, these cuts and crowded classrooms harm our students’ learning environment.”10 Governor Rick Perry responded, “I understand that [using the fund] seems like a logical answer for them…[but] the reality is everybody’s got to give and education’s the biggest part of [the state] budget.”11 Apparently his mind is made up, and this time the TSTA’s pleas fell on deaf ears.
SMALL FISH IN A BIG POND

Overall Rank: 44thTier 5 (Weakest)
TEXAS
OVERALL RANK: 44TH
Area and Ranka General Indicator Sub-IndicatorSub-Indicator Rank/Statusb
AREA 1: RESOURCES & MEMBERSHIP
Membership By rank, what percentage of public-school teachers in the state are union members? 33rd
Revenue By rank, what is the total yearly revenue (per teacher in the state) of the state-level NEA and/ or AFT affiliate(s)?
50th
Spending on education By rank, what percentage of state expenditures (of state general funds, state restricted funds, state bonds, and federal “pass-through” funds) is directed to K-12 education?
3rd
By rank, what is the total annual per-pupil expenditure (of funds from federal, state, and local sources) in the state?
49th
By rank, what percentage of total annual per-pupil expenditures is directed to teacher salaries and benefits?
32nd
AREA 2: INVOLVEMENTIN POLITICS
Contributions to candidates and political parties
By rank, what percentage of the total contributions to state candidates was donated by teacher unions?
24th
By rank, what percentage of the total contributions to state-level political parties was donated by teacher unions?
38th
Industry influence By rank, what percent of the contributions to state candidates from the ten highest-giving sectors was donated by teacher unions?
36th
Status of delegates By rank, what percentage of the state’s delegates to the Democratic and Republican conventions were members of teacher unions?
36th
AREA 3:SCOPE OF BARGAINING
Legal scope of bargaining What is the legal status of collective bargaining? Prohibited
By rank, how broad is the scope of collective bargaining? 47th*
Automatic revenue streams What is the unions’ legal right to automatically collect agency fees from non-members and/or collect member dues via automatic payroll deductions?
Bargaining is not allowed
Right to strike What is the legal status of teacher strikes? Prohibited
AREA 4:STATE POLICIES
Performance pay Does the state support performance pay for teachers? State supports/ encourages
Retirement By rank, what is the employer- versus employee-contribution rate to the teacher pension system? 38th
Evaluations What is the maximum potential consequence for veteran teachers who receive unsatisfactory evaluation(s)?
Teacher improvement plan
Is classroom effectiveness included in teacher evaluations? If so, how is it weighted? Not required
Terms of employment How long before a teacher earns tenure? Three years
Is student/teacher performance considered in tenure decisions? If so, how is it weighted? Not included
Is seniority considered in teacher layoff decisions? If so, how is it weighted? Optional; May be considered among other factors
Is teacher performance included in teacher layoff decisions? If so, how is it weighted? Required; Considered among other factors
By rank, what percentage of the teaching workforce was dismissed due to poor performance? 19th
Class size Is class size restricted for grades 1-3? If so, is the restriction higher or lower than the national average (20)?
Yes; Higher
TEXAS RANKINGS BY AREA AND INDICATOR
44*
36*
48*
30*

Overall Rank: 44thTier 5 (Weakest)
TEXAS
Area and Rank General Indicator Sub-IndicatorSub-Indicator Rank/Status
AREA 4:STATE POLICIES
(cont.)
Charter school structural limitations
Is there a cap (limit) placed on the number of charter schools that can operate in the state (or other jurisdiction) and/or on the number of students who can attend charter schools?
State cap with some room for growth
Does the state allow a variety of charter schools: start-ups, conversions, and virtual schools? Yes
How many charter authorizing options exist? How active are those authorizers? Two or more w/ limited activity
Charter school exemptions Are all charter schools automatically exempt from state laws and state/district regulations (except those that safeguard students and fiscal accountability)? If not, are they eligible for exemptions?
Partially; Some automatic exemptions for some schools
Are all charter schools automatically exempt from state teacher-certification requirements? If not, are they eligible for exemptions?
Partially; All schools receive automatic exemptions for some teachers
Are all charter schools automatically exempt from collective bargaining agreements (CBAs)? If not, are they eligible for exemptions?
Partially; Full automatic exemption for some schools
AREA 5:PERCEIVED INFLUENCEc
Relative influence of teacher unions
How do you rank the influence of teacher unions on education policy compared with other influential entities?
Third-most influential
Influence over campaigns On a scale from always to never, how often do Democratic candidates need teacher-union support to get elected?
Sometimes/Often
On a scale from always to never, how often do Republican candidates need teacher-union support to get elected?
Rarely
Influence over spending To what extent, from strongly agree to strongly disagree, do you agree that even in times of cutbacks, teacher unions are effective in protecting dollars for education?
Neutral
Given recent budgetary constraints, would you say that teacher unions generally make concessions to prevent reductions in pay and benefits or fight hard to prevent those reductions?
Generally fight
Influence over policy To what extent, from strongly agree to strongly disagree, do you agree that teacher unions ward off proposals in your state with which they disagree?
Neutral
On a scale from always to never, how often do existing state education policies reflect teacher-union priorities?
Sometimes/Often
To what extent, from totally in line to not at all in line, were state education policies proposed by the governor during your state’s latest legislative session in line with teacher-union priorities?
Mostly not in line
To what extent, from totally in line to not at all in line, were legislative outcomes of your state’s latest legislative session in line with teacher-union priorities?
Somewhat in line
Influence over key stakeholders
On a scale from always to never, how often have the priorities of state education leaders aligned with teacher-union positions in the past three years?
Sometimes/Often
Would you say that teacher unions typically compromise with policymakers to ensure that their preferred policies are enacted, or typically need not make concessions?
Sometimes compromise, sometimes do not need to concede
* Tied with another state
a Area ranks are calculated using a weighted average of sub-indicators. For a more detailed description, see Appendix A.
b Where possible, we report a state’s rank as compared to other states on a given metric. For example, out of 51 states, Texas has the 33rd-highest percentage of teachers who are union members. Otherwise, we report a status: In Texas, collective bargaining is prohibited, and teacher strikes are also prohibited. For a more detailed description of our metrics and methodology, see Appendix A. To request the raw data for your state, send an email to [email protected].
c For all survey questions, stakeholders were asked specifically about teacher unions, candidates, policies, and leaders in their state. In addition, we asked about unions and policies in the “current legislative session,” but because legislative calendars vary from state to state, responses refer to policies proposed and enacted within the 2010-11 window.
30*
34
Overall Rank: 44thTier 5 (Weakest)
TEXAS
ENDNOTES
1 A state’s overall rank is calculated as follows: First, we score it on multiple sub-indicators (sub-indicator data and scores for Texas are shown in the table, Texas Rankings by Area and Indicator). Second, we take a weighted average of the sub-indicators in each of five areas. In each area, we use that average to place the states in rank order: For example, in Area 1: Resources and Membership, Texas is ranked 44th of 51 based on the weighted average of its sub-indicators. To generate the state’s overall rank, we average the five area ranks together, then re-order the states. For a more detailed description of data sources and methodology, see Appendix A.
2 Readers should note that these figures include only direct donations from unions and union-connected PACs, but not their spending on electioneering/advertising, mobilizing the union’s own membership, lobbying, or advocacy. A recent Wall Street Journal report found that donations and lobbying activities account for a small share of union political spending compared with their expenditures on member mobilization and advocacy. Even the AFT agreed, making the argument that since its mission is organizing and activism, it will naturally spend significant amounts on these activities. Thus, the percentages we report here are extremely conservative representations of what unions actually spend on politics. For more information, see Appendix A, Area 2; Tom McGinty and Brody Mullins, “Political Spending by Unions Far Exceeds Direct Donations,” Wall Street Journal, July 10, 2012; and Jeff Hauser, “Wall Street Journal Compares Union Political Spending to Corporate Donations,” AFL-CIO, July 10, 2012.
3 Major donors in Texas include the state-level NEA and AFT associations, the national AFT and a handful of AFT-affiliated local associations, and two large, active professional associations not affiliated with either the NEA or AFT (see sidebar).
4 At the time of publication, the 2000 conventions were the most recent for which such detailed data were available in forms that met rigorous standards. However, 2008 data provided by the Democratic National Convention were highly correlated with the reliable figures from 2000.
5 We asked stakeholders about unions and policies in the “current legislative session,” but because legislative calendars vary from state to state, responses refer to policies proposed and enacted within the 2010-11 window.
6 Revenue calculated using publicly-available tax returns, downloaded from http://www.irs.gov/taxstats/charitablestats/article/0,,id=97186,00.html.
7 “Collective Bargaining/Exclusive Consultation,” Associated of Texas Professional Educators, accessed July 18, 2012, http://www.atpe.org/advocacy/issues/ColBarExcCon.asp.
8 Reuters, “Rick Perry Reverses Course on Rainy Day Fund,” HuffingtonPost.com, March 16, 2011, http://www.huffingtonpost.com/2011/03/15/rick-perry-rainy-day-fund_n_836339.html.
9 “TSTA Urges Special Session On Rainy Day Fund,” Texas State Teachers Association, February 1, 2012, http://www.tsta.org/sites/default/files/RainYDayFund.pdf.
10 “TSTA Calls For Special Session,” Coleman Chronicle, February 6, 2012, http://colemannews.com/tsta-calls-for-special-session/.
11 Allison Morrison, “TSTA Urges Governor Perry To Call Special Session,” EverythingLubbock.com, February 3, 2012, http://everythinglubbock.com/fulltext/?nxd_id=97992.

Overall Rank: 39thTier 4 (Weak)
UTAH
IntroductionPart IV: Taking a Closer Look–Teacher Union Influence Area
AREA 1: RESOURCES AND MEMBERSHIP
TIED FOR 37TH
The internal resources of Utah’s state
teacher unions are limited, and teachers do
not enjoy high levels of spending on K–12
education in the state. Bargaining between
districts and unions is permitted, but not
required in the Beehive State, and 63.6
percent of its teachers belong to unions
(the 32nd-highest unionization rate among
51 jurisdictions). The low membership rate,
combined with low dues, contributes to low
revenues for the NEA and AFT state-level
affiliates, which bring in just $170 annually
per Utah teacher (43rd). K–12 education
accounts for a relatively large share of state
spending (22.1 percent; 14th), although total
per-pupil funds (a combination of state,
local, and federal dollars) amounts to only
$7,217 per pupil annually, the lowest in the
nation. Of these dollars, a full 58.1 percent
go to teacher salaries and benefits (6th).
AREA 2: INVOLVEMENT IN POLITICS2
25TH
The political involvement of Utah’s teacher
unions places them in the middle of the
national pack. In the past decade, 1.2
percent of donations to candidates for state
office (14th) and 0.66 percent of donations
to political parties (32nd) came from
teacher unions. In addition, 8.8 percent of
Utah’s delegates to the Democratic and
Republican national conventions were
teacher union members (38th).3
UTAH OVERALL RANK: 39TH1
TIER 4 (WEAK)
STRONGER WEAKER
1. RESOURCES AND MEMBERSHIP
OVERALL
2. INVOLVEMENT IN POLITICS
3. SCOPE OF BARGAINING
4. STATE POLICIES
5. PERCEIVED INFLUENCE
39
25
30
37
39
28

Overall Rank: 39thTier 4 (Weak)
UTAH
AREA 3: SCOPE OF BARGAINING
TIED FOR 28TH
Utah law explicitly permits, but does not
require, collective bargaining in education
(but it takes no position on bargaining over
any specific provision, implicitly permitting
all twenty-one we examined for our report).
However, no union may automatically
collect agency fees from non-members
and teacher strikes are neither allowed nor
prohibited.
AREA 4: STATE POLICIES
TIED FOR 30TH
While some Utah policies align with
traditional union interests, others do not.
Teachers earn tenure after three years (the
national norm) and student learning is
not a required factor in tenure decisions;
while student achievement data must be
considered in teacher evaluations, how
much weight those data carry is at the
discretion of each district. However, when
making layoffs, districts must consider
teacher performance, and may not consider
seniority at all. Furthermore, the state does
not restrict class size (which is generally
large). State charter laws are also a mixed
bag. Unions traditionally support laws that
limit the expansion and autonomies of
charters, yet the state provides multiple
charter authorizers, allows all three kinds of
charter schools (new, conversion, virtual)
and automatically exempts charters from
the collective bargaining agreements of
districts that have them. Yet charters are
not automatically exempt from state laws
and district regulations and, while they may
seek waivers from some of them, they are
bound by the state teacher certification
rules.
AREA 5: PERCEIVED INFLUENCE
39TH
Stakeholders report that the state’s teacher
unions are not particularly strong, and
their responses rank Utah fairly low on the
national list. Teacher unions are described
as less influential than education advocacy
groups, the state school board, and the
legislature. Respondents note that state
education leaders are often aligned with
positions held by teacher unions, but that
the unions typically need to compromise to
see their preferred policies enacted. Finally,
respondents report that, while policies
proposed by the governor during Utah’s
latest legislative session were mostly in
line with teacher union priorities, enacted
policies were mostly not in line with those
priorities (although union influence in the
capitol appears to have strengthened in
2012—see sidebar).4
OVERALL
39TH
Utah’s teacher unions do not rank
particularly high in any area of strength.
They also land in the middle of the unions
in permitted-bargaining states.

Overall Rank: 39thTier 4 (Weak)
UTAH
In early 2011, Utah Education Association (UEA) President Sharon Gallagher-Fishbaugh was concerned that lawmakers would target her organization, seeking payback for the union’s involvement in Utah politics (and perhaps they hadn’t forgotten UEA’s hand in defeating a 2007 voucher law in a fierce battle that received national attention). “We have become the scapegoat,” she said. “We are being blamed for a situation we did not create.”5,6 So when Republican Senator Aaron Osmond, chair of the Senate Education Committee, announced later that year that he wanted to spearhead a massive overhaul to teacher employment policies in the upcoming 2012 legislative session, alarms went off for the UEA. Osmond explained that his (as-yet unwritten) plan would eliminate tenure and make all employees “at-will,” limit the scope of bargaining to salaries and benefits (and force all negotiations to occur in public), eliminate due process protections from state law, and require that 25 percent of teachers’ base salary be contingent on their performance.
But Osmond then took an unprecedented step: he asked educators for feedback on his ideas. First, he toured schools around the state. Then, he sat down with the UEA, representatives of the state school boards and superintendents associations, and state education leaders to design the actual policy that he would propose to the legislature.7 “For the first time that I can remember, UEA was at the table and an integral partner in the creation of a major reform bill,” said Gallagher-Fishbaugh, “…[and] being part of the process allowed us to focus on student learning while protecting teacher rights.” 8 And protect those rights they did: teachers kept tenure, bargaining, due process, and their seniority-based salary schedule. As passed, the bill did require that evaluations include (yet-to-be-specified) measures of student growth but allowed districts to develop their own evaluation systems. Teachers would lose their automatic yearly pay increases if they received poor evaluations, but they would not be eligible for immediate dismissal either (instead they first go through remediation). Administrators, not teachers, would see their base salaries affected by poor evaluations.9 And if that weren’t enough, lawmakers’ enthusiasm for this bill consigned other union-opposed bills—student-based “backpack” funding, vouchers, performance pay, the elimination of automatic payroll deductions, and more restrictions on collective bargaining—to failure.10,11
The media heralded Osmond as a “courageous lawmaker,” the state superintendent called the bill “a step forward,” and Senate President Michael Waddoups heralded the compromise as “a great kumbaya moment.”12,13 Others were skeptical—including Senator Stuart Adams, who worried that the union voice dominated discussions—but their criticism went unheard amidst the accolades showered on Osmond.14 In the end, it was unclear whether Osmond had experienced a true change of heart or whether he determined that a political turnaround was in his best interests. Still, with its new alliance with Osmond, the UEA’s recent successes in the state capital may be a sign that they have gone from sacrificial lamb to political lion.
STILL THE SCAPEGOAT?

Overall Rank: 39thTier 4 (Weak)
UTAH
OVERALL RANK: 39TH
Area and Ranka General Indicator Sub-IndicatorSub-Indicator Rank/Statusb
AREA 1: RESOURCES & MEMBERSHIP
Membership By rank, what percentage of public-school teachers in the state are union members? 32nd
Revenue By rank, what is the total yearly revenue (per teacher in the state) of the state-level NEA and/ or AFT affiliate(s)?
43rd
Spending on education By rank, what percentage of state expenditures (of state general funds, state restricted funds, state bonds, and federal “pass-through” funds) is directed to K-12 education?
14th
By rank, what is the total annual per-pupil expenditure (of funds from federal, state, and local sources) in the state?
51st
By rank, what percentage of total annual per-pupil expenditures is directed to teacher salaries and benefits?
6th
AREA 2: INVOLVEMENTIN POLITICS
Contributions to candidates and political parties
By rank, what percentage of the total contributions to state candidates was donated by teacher unions?
14th
By rank, what percentage of the total contributions to state-level political parties was donated by teacher unions?
32nd
Industry influence By rank, what percent of the contributions to state candidates from the ten highest-giving sectors was donated by teacher unions?
17th
Status of delegates By rank, what percentage of the state’s delegates to the Democratic and Republican conventions were members of teacher unions?
38th
AREA 3:SCOPE OF BARGAINING
Legal scope of bargaining What is the legal status of collective bargaining? Permitted
By rank, how broad is the scope of collective bargaining? 38th*
Automatic revenue streams What is the unions’ legal right to automatically collect agency fees from non-members and/or collect member dues via automatic payroll deductions?
Agency fees prohibited
Right to strike What is the legal status of teacher strikes? Neither prohibited nor permitted
AREA 4:STATE POLICIES
Performance pay Does the state support performance pay for teachers? State supports/ encourages
Retirement By rank, what is the employer- versus employee-contribution rate to the teacher pension system? 4th
Evaluations What is the maximum potential consequence for veteran teachers who receive unsatisfactory evaluation(s)?
Teacher improvement plan
Is classroom effectiveness included in teacher evaluations? If so, how is it weighted? Evidence of student “learning” required
Terms of employment How long before a teacher earns tenure? Three years
Is student/teacher performance considered in tenure decisions? If so, how is it weighted? Not included
Is seniority considered in teacher layoff decisions? If so, how is it weighted? Not considered
Is teacher performance included in teacher layoff decisions? If so, how is it weighted? Required; Considered among other factors
By rank, what percentage of the teaching workforce was dismissed due to poor performance? 9th
Class size Is class size restricted for grades 1-3? If so, is the restriction higher or lower than the national average (20)?
No restriction
UTAH RANKINGS BY AREA AND INDICATOR
37*
25
28*
30*

Overall Rank: 39thTier 4 (Weak)
UTAH
Area and Rank General Indicator Sub-IndicatorSub-Indicator Rank/Status
AREA 4:STATE POLICIES
(cont.)
Charter school structural limitations
Is there a cap (limit) placed on the number of charter schools that can operate in the state (or other jurisdiction) and/or on the number of students who can attend charter schools?
State cap with some room for growth
Does the state allow a variety of charter schools: start-ups, conversions, and virtual schools? Yes
How many charter authorizing options exist? How active are those authorizers? Two or more active/available options
Charter school exemptions Are all charter schools automatically exempt from state laws and state/district regulations (except those that safeguard students and fiscal accountability)? If not, are they eligible for exemptions?
No; Schools can apply for exemptions
Are all charter schools automatically exempt from state teacher-certification requirements? If not, are they eligible for exemptions?
No; Schools cannot apply for exemptions
Are all charter schools automatically exempt from collective bargaining agreements (CBAs)? If not, are they eligible for exemptions?
Yes
AREA 5:PERCEIVED INFLUENCEc
Relative influence of teacher unions
How do you rank the influence of teacher unions on education policy compared with other influential entities?
Third- or fourth-most influential
Influence over campaigns On a scale from always to never, how often do Democratic candidates need teacher-union support to get elected?
Often
On a scale from always to never, how often do Republican candidates need teacher-union support to get elected?
Rarely
Influence over spending To what extent, from strongly agree to strongly disagree, do you agree that even in times of cutbacks, teacher unions are effective in protecting dollars for education?
Neutral
Given recent budgetary constraints, would you say that teacher unions generally make concessions to prevent reductions in pay and benefits or fight hard to prevent those reductions?
Generally fight
Influence over policy To what extent, from strongly agree to strongly disagree, do you agree that teacher unions ward off proposals in your state with which they disagree?
Neutral
On a scale from always to never, how often do existing state education policies reflect teacher-union priorities?
Sometimes/Often
To what extent, from totally in line to not at all in line, were state education policies proposed by the governor during your state’s latest legislative session in line with teacher-union priorities?
Somewhat/Mostly in line
To what extent, from totally in line to not at all in line, were legislative outcomes of your state’s latest legislative session in line with teacher-union priorities?
Mostly not in line/Somewhat in line
Influence over key stakeholders
On a scale from always to never, how often have the priorities of state education leaders aligned with teacher-union positions in the past three years?
Often
Would you say that teacher unions typically compromise with policymakers to ensure that their preferred policies are enacted, or typically need not make concessions?
Compromise
* Tied with another state
a Area ranks are calculated using a weighted average of sub-indicators. For a more detailed description, see Appendix A.
b Where possible, we report a state’s rank as compared to other states on a given metric. For example, out of 51 states, Utah has the 32nd-highest percentage of teachers who are union members. Otherwise, we report a status: In Utah, collective bargaining is permitted, and union agency fees are prohibited. For a more detailed description of our metrics and methodology, see Appendix A. To request the raw data for your state, send an email to [email protected].
c For all survey questions, stakeholders were asked specifically about teacher unions, candidates, policies, and leaders in their state. In addition, we asked about unions and policies in the “current legislative session,” but because legislative calendars vary from state to state, responses refer to policies proposed and enacted within the 2010-11 window.
30*
39

Overall Rank: 39thTier 4 (Weak)
UTAH
ENDNOTES
1 A state’s overall rank is calculated as follows: First, we score it on multiple sub-indicators (sub-indicator data and scores for Utah are shown in the table, Utah Rankings by Area and Indicator). Second, we take a weighted average of the sub-indicators in each of five areas. In each area, we use that average to place the states in rank order: For example, in Area 1: Resources and Membership, Utah is ranked 37th of 51 based on the weighted average of its sub-indicators. To generate the state’s overall rank, we average the five area ranks together, then re-order the states. For a more detailed description of data sources and methodology, see Appendix A.
2 Readers should note that these figures include only direct donations from unions and union-connected PACs, but not their spending on electioneering/advertising, mobilizing the union’s own membership, lobbying, or advocacy. A recent Wall Street Journal report found that donations and lobbying activities account for a small share of union political spending compared with their expenditures on member mobilization and advocacy. Even the AFT agreed, making the argument that since its mission is organizing and activism, it will naturally spend significant amounts on these activities. Thus, the percentages we report here are extremely conservative representations of what unions actually spend on politics. For more information, see Appendix A, Area 2; Tom McGinty and Brody Mullins, “Political Spending by Unions Far Exceeds Direct Donations,” Wall Street Journal, July 10, 2012; and Jeff Hauser, “Wall Street Journal Compares Union Political Spending to Corporate Donations,” AFL-CIO, July 10, 2012.
3 At the time of publication, the 2000 conventions were the most recent for which such detailed data were available in forms that met rigorous standards. However, 2008 data provided by the Democratic National Convention were highly correlated with the reliable figures from 2000.
4 We asked stakeholders about unions and policies in the “current legislative session,” but because legislative calendars vary from state to state, responses refer to policies proposed and enacted within the 2010-11 window.
5 Sara Lenz, “Teacher Unions Under Attack Nationally And In Utah,” Deseret News, March 6, 2011, http://www.deseretnews.com/article/700116124/Teacher-unions-under-attack-nationally-and-in-Utah.html?pg=all.
6 Glen Warchol, “Vouchers Go Down In Crushing Defeat,” Salt Lake Tribune, November 7, 2007, http://www.sltrib.com/ci_7392263.
7 Aaron Osmond, “Seeking Input And Perspective From Our Educators: Comments And Thoughts On The Education Employee Reform Act Proposal,” UtahPublicEducation.org, November 4, 2011, http://utahpubliceducation.org/2011/11/04/seeking-input-and-perspective-from-our-educators/.
8 “Politics and Legislation,” Utah Education Association, accessed August 29, 2012, http://www.myuea.org/politics_legislation/uea_under_the_dome/2012_issue_public_education_employment_reform.aspx.
9 Ibid.
10 Ibid.
11 “Utah Bill Would Give Public Education Money Directly To Student ‘Savings Accounts,’ Not Schools,” HuffingtonPost.com, March 4, 2012, http://www.huffingtonpost.com/2012/02/15/utah-bill-would-give-publ_n_1279978.html.
12 Frank Pignanelli and LaVarr Webb, “In A Quiet Year, Here Are Some Courageous Lawmakers,” Deseret News, March 4, 2012, http://www.deseretnews.com/article/765556047/In-a-quiet-year-here-are-some-courageous-lawmakers.html?pg=all.
13 Benjamin Wood, “Public Education Stakeholders Endorse Evaluation Bill,” Deseret News, February 27, 2012, http://www.deseretnews.com/article/865551046/Public-education-stakeholders-endorse-evaluation-bill.html?pg=all.
14 Lisa Schencker, “Utah Teacher Employment Bill Gets Early Nod, But Only After Debate,” Salt Lake Tribune, February 28, 2012, http://www.sltrib.com/sltrib/politics/53601824-90/adams-administrators-bill-education.html.csp.

Overall Rank: 11thTier 2 (Strong)
VERMONT
IntroductionPart IV: Taking a Closer Look–Teacher Union Influence Area
AREA 1: RESOURCES AND MEMBERSHIP
TIED FOR 6TH
Vermont’s teacher unions benefit from
substantial resources from their members,
who in turn enjoy generous education
funding. A substantial 82.4 percent of
teachers in the Green Mountain State
belong to unions (the 24th-highest rate
of 51 jurisdictions), and the NEA and AFT
state-level affiliates bring in $672 annually
per Vermont teacher (9th). Further, 33.2
percent of state expenditures go to K–12
education, the highest such proportion
in the nation. Per-pupil spending (a
combination of state, federal, and local
funds) amounts to $17,847 annually, the
2nd-highest nationwide (behind Wyoming).
Although only 52.8 percent (38th) of those
dollars go to teacher salaries and benefits,
the pie itself is quite large.
AREA 2: INVOLVEMENT IN POLITICS2
TIED FOR 44TH
Vermont’s teacher unions are relatively
uninvolved in state politics, at least on the
metrics we examined. In the past decade,
their donations amounted to just 0.08
percent of all contributions to candidates
for state office (49th) and accounted for
only 0.72 percent of contributions to state
political parties (30th). These low levels
of financial involvement are particularly
interesting considering that it’s possible
to be a major donor in Vermont without
actually giving much money (the total of all
donations to candidates and parties is one
of the smallest in the nation). The teacher
unions’ low level of activity in this regard
may indicate that they are satisfied with
the status quo (see sidebar). Note, too, that
just 5 percent of the state’s delegates to
VERMONT OVERALL RANK: 11TH1
TIER 2 (STRONG)
STRONGER WEAKER
1. RESOURCES AND MEMBERSHIP
OVERALL
2. INVOLVEMENT IN POLITICS
3. SCOPE OF BARGAINING
4. STATE POLICIES
5. PERCEIVED INFLUENCE
11
44
2
6
22
8

Overall Rank: 11thTier 2 (Strong)
VERMONT
the Democratic and Republican national
conventions were teacher union members
(47th).3
AREA 3: SCOPE OF BARGAINING
8TH
Vermont is one of thirty-two states that
require collective bargaining in education,
and its bargaining laws are more union-
friendly than in most other states. Unions
can automatically collect agency fees
(a key source of their revenue) from
non-members, and teacher strikes are
permitted. Vermont also grants unions a
broad scope of bargaining: Of twenty-one
items examined in this analysis, wages,
hours, and grievance procedures are
mandatory subjects of bargaining; the
state is silent on the remaining eighteen,
implicitly permitting negotiations on all of
them.
AREA 4: STATE POLICIES
TIED FOR 2ND
State policies in Vermont are more closely
aligned with traditional teacher union
interests than in any other state save
West Virginia. Vermont does not support
performance pay, does not require student
achievement data to be factored into
teacher evaluations or tenure decisions,
and does not articulate consequences
for unsatisfactory evaluations. Further,
teachers earn tenure after two years (the
national norm is three), and districts need
not consider teacher performance when
making layoffs. Vermont has no charter
school law.4
AREA 5: PERCEIVED INFLUENCE
TIED FOR 22ND
Vermont’s teacher unions enjoy only a
fair reputation for political influence when
compared with unions in other states.
Survey respondents rank their influence
behind that of the state school board and
legislature, but agree that they are effective
in warding off education proposals with
which they disagree and in protecting
dollars for education. They note that while
policies proposed by the governor during
the latest legislative session were only
somewhat in line with union priorities,
enacted policies were mostly in line with
those priorities (especially noteworthy
given their lack of involvement in state
politics). But they also observe that the
positions of state education leaders
are only sometimes aligned to those of
teacher unions, and that unions typically
compromise to see some of their favored
policies enacted.
OVERALL
11TH
Vermont’s teacher unions benefit from
permissive bargaining laws and abundant
resources. With state policies that are
strongly aligned with their interests, and
education leaders who show no strong
appetite for changing the current state
of affairs (see sidebar), they are strong
without having to be major donors to state
politics.

Overall Rank: 11thTier 2 (Strong)
VERMONT
Not every state is pressing for drastic education reform. In fact, lawmakers in the Green Mountain State—known for its long history of local control—don’t seem to be seeking much change at all. In 2010, Education Commissioner Armando Vilaseca expressed little desire to overhaul current policies to meet federal Race to the Top (RTTT) guidelines: “What we’re hearing from [Secretary of Education Arne Duncan] is a pretty strong line: [no] charter schools, you lose points. You don’t have a teacher evaluation system that is tied into student outcomes, you lose points.”5 Rather than pass a charter law or change its evaluation system, Vermont did not apply (although in a letter to Duncan, Vilaseca attributed the choice to RTTT’s seeming bias against rural states, critically noting that “based on the culture and demographics of our communities, some states [like Vermont] may take a different approach to accomplishing the same goals of ensuring each student is given the education they need to thrive in the 21st century.”)6 That same year, lawmakers and the Vermont-NEA agreed on a pension plan that saved the state $15 million per year—after considerable horse trading. “What we’ve all produced is better: teachers working a bit longer, paying a bit more, but getting more when they retire,” says Vermont-NEA president Martha Allen.7
Vermont’s “thanks but no thanks” attitude to RTTT persisted when, in June 2012, the state board rescinded its NCLB waiver application, citing heavy constraints—especially the requirement that teacher evaluations be tied to yearly test results. “We feel it should be left up to districts as to how much they want to do that and make sure they have multiple indicators,” said Allen.8 John Fischer, deputy commissioner of the Vermont Department of Education, also expressed confidence in Vermont schools and the seeming irrelevance of waivers: “Generally, in Vermont, we’ve got great schools. We [are] looking at a continuous improvement cycle, not turning around failing schools.”9 While it is true that student performance rankings consistently put Vermont near the top of the country, it’s also true that their students are some of the more advantaged in the land.10,11
IF IT AIN’T BROKE…

Overall Rank: 11thTier 2 (Strong)
VERMONT
OVERALL RANK: 11TH
Area and Ranka General Indicator Sub-IndicatorSub-Indicator Rank/Statusb
AREA 1: RESOURCES & MEMBERSHIP
Membership By rank, what percentage of public-school teachers in the state are union members? 24th
Revenue By rank, what is the total yearly revenue (per teacher in the state) of the state-level NEA and/ or AFT affiliate(s)?
9th
Spending on education By rank, what percentage of state expenditures (of state general funds, state restricted funds, state bonds, and federal “pass-through” funds) is directed to K-12 education?
1st
By rank, what is the total annual per-pupil expenditure (of funds from federal, state, and local sources) in the state?
2nd
By rank, what percentage of total annual per-pupil expenditures is directed to teacher salaries and benefits?
38th
AREA 2: INVOLVEMENTIN POLITICS
Contributions to candidates and political parties
By rank, what percentage of the total contributions to state candidates was donated by teacher unions?
49th
By rank, what percentage of the total contributions to state-level political parties was donated by teacher unions?
30th
Industry influence By rank, what percent of the contributions to state candidates from the ten highest-giving sectors was donated by teacher unions?
38th
Status of delegates By rank, what percentage of the state’s delegates to the Democratic and Republican conventions were members of teacher unions?
47th
AREA 3:SCOPE OF BARGAINING
Legal scope of bargaining What is the legal status of collective bargaining? Mandatory
By rank, how broad is the scope of collective bargaining? 24th*
Automatic revenue streams What is the unions’ legal right to automatically collect agency fees from non-members and/or collect member dues via automatic payroll deductions?
Permitted
Right to strike What is the legal status of teacher strikes? Permitted
AREA 4:STATE POLICIES
Performance pay Does the state support performance pay for teachers? State does not support
Retirement By rank, what is the employer- versus employee-contribution rate to the teacher pension system? 31st
Evaluations What is the maximum potential consequence for veteran teachers who receive unsatisfactory evaluation(s)?
No consequences articulated
Is classroom effectiveness included in teacher evaluations? If so, how is it weighted? Not required
Terms of employment How long before a teacher earns tenure? Two years
Is student/teacher performance considered in tenure decisions? If so, how is it weighted? Not included
Is seniority considered in teacher layoff decisions? If so, how is it weighted? Optional; Weighted at district discretion
Is teacher performance included in teacher layoff decisions? If so, how is it weighted? Not required
By rank, what percentage of the teaching workforce was dismissed due to poor performance? 7th
Class size Is class size restricted for grades 1-3? If so, is the restriction higher or lower than the national average (20)?
Yes; Higher
VERMONT RANKINGS BY AREA AND INDICATOR
6*
44*
8
2*

Overall Rank: 11thTier 2 (Strong)
VERMONT
Area and Rank General Indicator Sub-IndicatorSub-Indicator Rank/Status
AREA 4:STATE POLICIES
(cont.)
Charter school structural limitationsc
Is there a cap (limit) placed on the number of charter schools that can operate in the state (or other jurisdiction) and/or on the number of students who can attend charter schools?
N/A
Does the state allow a variety of charter schools: start-ups, conversions, and virtual schools? N/A
How many charter authorizing options exist? How active are those authorizers? N/A
Charter school exemptionsc Are all charter schools automatically exempt from state laws and state/district regulations (except those that safeguard students and fiscal accountability)? If not, are they eligible for exemptions?
N/A
Are all charter schools automatically exempt from state teacher-certification requirements? If not, are they eligible for exemptions?
N/A
Are all charter schools automatically exempt from collective bargaining agreements (CBAs)? If not, are they eligible for exemptions?
N/A
AREA 5:PERCEIVED INFLUENCEd
Relative influence of teacher unions
How do you rank the influence of teacher unions on education policy compared with other influential entities?
Third-most influential
Influence over campaigns On a scale from always to never, how often do Democratic candidates need teacher-union support to get elected?
Often
On a scale from always to never, how often do Republican candidates need teacher-union support to get elected?
Rarely/Sometimes
Influence over spending To what extent, from strongly agree to strongly disagree, do you agree that even in times of cutbacks, teacher unions are effective in protecting dollars for education?
Agree
Given recent budgetary constraints, would you say that teacher unions generally make concessions to prevent reductions in pay and benefits or fight hard to prevent those reductions?
Fight
Influence over policy To what extent, from strongly agree to strongly disagree, do you agree that teacher unions ward off proposals in your state with which they disagree?
Agree
On a scale from always to never, how often do existing state education policies reflect teacher-union priorities?
Sometimes/Often
To what extent, from totally in line to not at all in line, were state education policies proposed by the governor during your state’s latest legislative session in line with teacher-union priorities?
Somewhat/Mostly in line
To what extent, from totally in line to not at all in line, were legislative outcomes of your state’s latest legislative session in line with teacher-union priorities?
Somewhat/Mostly in line
Influence over key stakeholders
On a scale from always to never, how often have the priorities of state education leaders aligned with teacher-union positions in the past three years?
Sometimes/Often
Would you say that teacher unions typically compromise with policymakers to ensure that their preferred policies are enacted, or typically need not make concessions?
Generally compromise
* Tied with another state a Area ranks are calculated using a weighted average of sub-indicators. For a more detailed description, see Appendix A. b Where possible, we report a state’s rank as compared to other states on a given metric. For example, out of 51 states, Vermont has the 24th-highest percentage of teachers who are union members. Otherwise, we report a status: Vermont has mandatory collective bargaining, and union agency fees are permitted. For a more detailed description of our metrics and methodology, see Appendix A. To request the raw data for your state, send an email to [email protected]. c Vermont does not have a charter school law.
d For all survey questions, stakeholders were asked specifically about teacher unions, candidates, policies, and leaders in their state. In addition, we asked about unions and policies in the “current legislative session,” but because legislative calendars vary from state to state, responses refer to policies proposed and enacted within the 2010-11 window.
2*
22

Overall Rank: 11thTier 2 (Strong)
VERMONT
ENDNOTES
1 A state’s overall rank is calculated as follows: First, we score it on multiple sub-indicators (sub-indicator data and scores for Vermont are shown in the table, Vermont Rankings by Area and Indicator). Second, we take a weighted average of the sub-indicators in each of five areas. In each area, we use that average to place the states in rank order: For example, in Area 1: Resources and Membership, Vermont is ranked 6th of 51 based on the weighted average of its sub-indicators. To generate the state’s overall rank, we average the five area ranks together, then re-order the states. For a more detailed description of data sources and methodology, see Appendix A.
2 Readers should note that these figures include only direct donations from unions and union-connected PACs, but not their spending on electioneering/advertising, mobilizing the union’s own membership, lobbying, or advocacy. A recent Wall Street Journal report found that donations and lobbying activities account for a small share of union political spending compared with their expenditures on member mobilization and advocacy. Even the AFT agreed, making the argument that since its mission is organizing and activism, it will naturally spend significant amounts on these activities. Thus, the percentages we report here are extremely conservative representations of what unions actually spend on politics. For more information, see Appendix A, Area 2; Tom McGinty and Brody Mullins, “Political Spending by Unions Far Exceeds Direct Donations,” Wall Street Journal, July 10, 2012; and Jeff Hauser, “Wall Street Journal Compares Union Political Spending to Corporate Donations,” AFL-CIO, July 10, 2012.
3 At the time of publication, the 2000 conventions were the most recent for which such detailed data were available in forms that met rigorous standards. However, 2008 data provided by the Democratic National Convention were highly correlated with the reliable figures from 2000.
4 We do not include data for sub-indicators pertaining to charters when calculating the ranking of states that do not have charter school laws. While some might argue that the lack of such a law is in itself evidence for union strength, we do not have sufficient data to link that absence to union activity. The nine states without charter laws are home to very different contexts—while teacher unions in some states may have played a significant role in keeping charter laws at bay, in others, they played little or none.
5 John Dillon, “Education Chief Says Vermont A Longshot For Federal Grant,” VPR News, April 19, 2010, http://www.vpr.net/news_detail/87803/education-chief-says-vermont-longshot-for-federal/.
6 Armando Vilaseca, “Commissioner Villaseca’s Letter to Secretary Duncan,” August 25, 2009, http://education.vermont.gov/new/pdfdoc/dept/recovery_act/vilaseca_duncan_letter_082809.pdf.
7 Stephen C. Fehr, “Unlike Some States, Vermont Works With Teachers Union To Solve Pension Problems,” NewJerseyNewsroom.com, March 25, 2010, http://www.newjerseynewsroom.com/nation/unlike-some-states-vermont-works-with-teachers-union-to-solve-pension-problems.
8 Lisa Rathke, “Vermont Opts Out Of No Child Left Behind Waiver,” Associated Press, June 3, 2012, http://www.boston.com/news/education/articles/2012/06/03/vermont_opts_out_of_no_child_left_behind_waiver/.
9 Ibid.
10 “NAEP State Comparisons,” National Center for Education Statistics, accessed August 15, 2012, http://nces.ed.gov/nationsreportcard/statecomparisons/.
11 The demographics in Vermont reveal that 95.5 percent of its population is white, with an above-average per-capita income and one of the lowest levels of inequality in the country (http://www.census.gov/prod/2011pubs/acs-16.pdf). This may be one of the reasons why Vermont lacks a charter law, as there is a common public sentiment that middle-class children do not need more schooling options.

Overall Rank: 47thTier 5 (Weakest)
VIRGINIA
IntroductionPart IV: Taking a Closer Look–Teacher Union Influence Area
AREA 1: RESOURCES AND MEMBERSHIP
TIED FOR 40TH
The NEA-affiliated Virginia Education
Association (VEA) predictably does
not see high membership or generate
large resources in this state where
bargaining is prohibited: Just 51.1 percent
of Old Dominion teachers are association
members (the 45th-highest rate of 51
jurisdictions), and the VEA brings in just
$194 annually per teacher in the state
(41st). Spending on K–12 education is
also toward the bottom of the national
list: 17.3 percent of state expenditures go
to education (37th), and total per-pupil
expenditures (from local, state, and federal
sources) amount to $10,095 (also 37th).
Still, 57.1 percent of those dollars go toward
teacher salaries and benefits (9th), quite a
large slice of a relatively small pie.
AREA 2: INVOLVEMENT IN POLITICS2
50TH; LAST PLACE
Over the past decade, teacher unions were
less involved in Virginia state politics than in
any other state. Their donations amounted
to just 0.22 percent of contributions
received by candidates for state office
(41st) and 0.17 percent of contributions
to state political parties (47th).3 The
union voice was not well-represented at
the Democratic and Republican national
conventions either: only 6.7 percent of
Virginia delegates identified as members of
teacher unions (43rd).4
VIRGINIA OVERALL RANK: 47TH1
TIER 5 (WEAKEST)
STRONGER WEAKER
1. RESOURCES AND MEMBERSHIP
OVERALL
2. INVOLVEMENT IN POLITICS
3. SCOPE OF BARGAINING
4. STATE POLICIES
5. PERCEIVED INFLUENCE
47
50
4
40
33
48

Overall Rank: 47thTier 5 (Weakest)
VIRGINIA
AREA 3: SCOPE OF BARGAINING
TIED FOR 48TH; LAST PLACE
Virginia is one of just five states that
prohibit collective bargaining in education,
and professional associations cannot
automatically collect agency fees from non-
members. Further, teachers are not allowed
to strike.
AREA 4: STATE POLICIES
4TH
State policies are more closely aligned
with traditional teacher union interests in
Virginia than they are in nearly every other
state. (Clearly this presents a paradox: no
bargaining, little political involvement, but
favorable policies. The state constitution
offers a partial explanation. It specifies that
“The supervision of schools in each school
division shall be vested in a school board,”
which has apparently been interpreted over
the years as meaning that the local school
board has total control over key areas.)5
The state does not articulate consequences
for unsatisfactory evaluations, nor does
it mandate that districts consider teacher
performance when making layoffs, and
it recommends, but does not require,
student achievement data to be factored
into teacher evaluations and tenure
decisions. Its weak charter laws are as
union-friendly as its employment policies:
While there is no cap on the number of
charters, only local school boards may
authorize them and—perhaps as a result—
there is little charter activity in the state.
Charters are not automatically exempt
from any state laws (and all their teachers
must be certified), and are held to all
district regulations and personnel policies
(although they can apply for waivers from
the former).
AREA 5: PERCEIVED INFLUENCE
33RD
Stakeholders in Virginia perceive that its
state teacher association has limited clout.
They rank its influence on education policy
behind that of the state board, governor’s
office, and school boards association.
They note that state education leaders are
only sometimes aligned with association
positions, and that the association typically
compromises to ensure that its preferred
policies are enacted (versus having
the clout to avoid compromise). Still,
stakeholders agree that the association
is effective in warding off proposals with
which it disagrees, and in protecting dollars
for education even in times of cutbacks.6
OVERALL
47TH
Though Virginia’s teacher association
operates without many resources and with
low levels of membership, and though
it is a minor donor to state politics, it
has a stronger reputation than unions in
many other states (including those where
bargaining is permitted or required) and
enjoys a very favorable state policy climate.

Overall Rank: 47thTier 5 (Weakest)
VIRGINIA
While union armor in other states has been dented by reformers, the Virginia Education Association (VEA) has done an impressive job side-stepping some major policy overhauls. True, it could not stop a 2012 law granting tax credits to donors to private school scholarship programs. Nor could it defeat a revised pension plan requiring all teachers to pay into the retirement system despite a recent reduction in benefits for new teachers (but the measure also required that teachers get raises to offset the increased contributions—and that local districts should foot the bill).7
But the VEA claimed victory when a bill died in committee that would have allowed state funding to follow the child into virtual schools. Furthermore, Virginia’s teacher evaluation guidelines are much less stringent than in other states: When initially passed in 2011, they recommended (but did not require) that only 40 percent of a teacher’s rating be based on student achievement as determined by “multiple measures,” not necessarily just standardized test scores.8 The 40 percent became mandatory only after the weak evaluations put the state’s NCLB waiver request in danger, with the Department of Education expressing concern that “because the weightings [for Student Academic Progress] are determined locally, it will likely produce a fragmented system that will have limited impact on student learning…[and] it can easily be watered down.”9
Finally, in early 2012, the VEA helped defeat HB 576, which threatened teacher job security. Proposed by Republican Governor Robert F. McDonnell as a way to root out ineffective teachers, that bill would have extended the probationary period for new teachers from three to five years, replaced permanent contracts with ones that administrators would decide whether to renew (or not) every three years, and removed the requirement for pre-dismissal improvement plans and appeal procedures for sub-par teachers.10 The VEA felt the bill gave administrators far too much power and left teachers defenseless against arbitrary firing. When the measure failed in the senate, VEA lobbyist Robley Jones breathed a little easier: “We’re very, very relieved. What was proposed was just overkill.”11 Governor McDonnell called the vote a “disappointing” rejection of a “bipartisan, national movement underway to bring more accountability to our schools,” foreshadowing, “Today’s vote is a delay. It is not a defeat.”12 As yet, McDonnell’s hopes for improvements to the state’s teacher employment policies remain unfulfilled. And Virginia was awarded an NCLB waiver anyway—which may signal that the status quo rests comfortably again.
VIRGINIA IS FOR (TENURE) LOVERS

Overall Rank: 47thTier 5 (Weakest)
VIRGINIA
OVERALL RANK: 47TH
Area and Ranka General Indicator Sub-IndicatorSub-Indicator Rank/Statusb
AREA 1: RESOURCES & MEMBERSHIP
Membership By rank, what percentage of public-school teachers in the state are union members? 45th
Revenue By rank, what is the total yearly revenue (per teacher in the state) of the state-level NEA and/ or AFT affiliate(s)?
41st
Spending on education By rank, what percentage of state expenditures (of state general funds, state restricted funds, state bonds, and federal “pass-through” funds) is directed to K-12 education?
37th
By rank, what is the total annual per-pupil expenditure (of funds from federal, state, and local sources) in the state?
37th
By rank, what percentage of total annual per-pupil expenditures is directed to teacher salaries and benefits?
9th
AREA 2: INVOLVEMENTIN POLITICS
Contributions to candidates and political parties
By rank, what percentage of the total contributions to state candidates was donated by teacher unions?
41st
By rank, what percentage of the total contributions to state-level political parties was donated by teacher unions?
47th
Industry influence By rank, what percent of the contributions to state candidates from the ten highest-giving sectors was donated by teacher unions?
44th
Status of delegates By rank, what percentage of the state’s delegates to the Democratic and Republican conventions were members of teacher unions?
43rd
AREA 3:SCOPE OF BARGAINING
Legal scope of bargaining What is the legal status of collective bargaining? Prohibited
By rank, how broad is the scope of collective bargaining? 47th*
Automatic revenue streams What is the unions’ legal right to automatically collect agency fees from non-members and/or collect member dues via automatic payroll deductions?
Bargaining is not allowed
Right to strike What is the legal status of teacher strikes? Prohibited
AREA 4:STATE POLICIES
Performance pay Does the state support performance pay for teachers? State-sponsored initiatives offered in select districts
Retirement By rank, what is the employer- versus employee-contribution rate to the teacher pension system? 24th
Evaluations What is the maximum potential consequence for veteran teachers who receive unsatisfactory evaluation(s)?
No consequences articulated
Is classroom effectiveness included in teacher evaluations? If so, how is it weighted? Not required
Terms of employment How long before a teacher earns tenure? Three years
Is student/teacher performance considered in tenure decisions? If so, how is it weighted? Not included
Is seniority considered in teacher layoff decisions? If so, how is it weighted? Optional; Weighted at district discretion
Is teacher performance included in teacher layoff decisions? If so, how is it weighted? Not required
By rank, what percentage of the teaching workforce was dismissed due to poor performance? 16th
Class size Is class size restricted for grades 1-3? If so, is the restriction higher or lower than the national average (20)?
Yes; Higher
VIRGINIA RANKINGS BY AREA AND INDICATOR
40*
50
48*
4

Overall Rank: 47thTier 5 (Weakest)
VIRGINIA
Area and Rank General Indicator Sub-IndicatorSub-Indicator Rank/Status
AREA 4:STATE POLICIES
(cont.)
Charter school structural limitations
Is there a cap (limit) placed on the number of charter schools that can operate in the state (or other jurisdiction) and/or on the number of students who can attend charter schools?
No state cap
Does the state allow a variety of charter schools: start-ups, conversions, and virtual schools? Start-ups and conversions only
How many charter authorizing options exist? How active are those authorizers? Single option; No or limited activity
Charter school exemptions Are all charter schools automatically exempt from state laws and state/district regulations (except those that safeguard students and fiscal accountability)? If not, are they eligible for exemptions?
No; Schools can apply for exemptions
Are all charter schools automatically exempt from state teacher-certification requirements? If not, are they eligible for exemptions?
No; Schools cannot apply for exemptions
Are all charter schools automatically exempt from collective bargaining agreements (CBAs)? If not, are they eligible for exemptions?
No; No allowable exemptions
AREA 5:PERCEIVED INFLUENCEc
Relative influence of teacher unions
How do you rank the influence of teacher unions on education policy compared with other influential entities?
Third- or fourth-most influential
Influence over campaigns On a scale from always to never, how often do Democratic candidates need teacher-union support to get elected?
**
On a scale from always to never, how often do Republican candidates need teacher-union support to get elected?
**
Influence over spending To what extent, from strongly agree to strongly disagree, do you agree that even in times of cutbacks, teacher unions are effective in protecting dollars for education?
Agree
Given recent budgetary constraints, would you say that teacher unions generally make concessions to prevent reductions in pay and benefits or fight hard to prevent those reductions?
Fight
Influence over policy To what extent, from strongly agree to strongly disagree, do you agree that teacher unions ward off proposals in your state with which they disagree?
Agree
On a scale from always to never, how often do existing state education policies reflect teacher-union priorities?
Sometimes
To what extent, from totally in line to not at all in line, were state education policies proposed by the governor during your state’s latest legislative session in line with teacher-union priorities?
**
To what extent, from totally in line to not at all in line, were legislative outcomes of your state’s latest legislative session in line with teacher-union priorities?
Somewhat in line
Influence over key stakeholders
On a scale from always to never, how often have the priorities of state education leaders aligned with teacher-union positions in the past three years?
Sometimes/Often
Would you say that teacher unions typically compromise with policymakers to ensure that their preferred policies are enacted, or typically need not make concessions?
Compromise
* Tied with another state
** Insufficient number of responses to this particular question
a Area ranks are calculated using a weighted average of sub-indicators. For a more detailed description, see Appendix A.
b Where possible, we report a state’s rank as compared to other states on a given metric. For example, out of 51 states, Virginia has the 45th-highest percentage of teachers who are union members. Otherwise, we report a status: In Virginia, collective bargaining is prohibited, and teacher strikes are also prohibited. For a more detailed description of our metrics and methodology, see Appendix A. To request the raw data for your state, send an email to [email protected].
c For all survey questions, stakeholders were asked specifically about teacher unions, candidates, policies, and leaders in their state. In addition, we asked about unions and policies in the “current legislative session,” but because legislative calendars vary from state to state, responses refer to policies proposed and enacted within the 2010-11 window.
4
33

Overall Rank: 47thTier 5 (Weakest)
VIRGINIA
ENDNOTES
1 A state’s overall rank is calculated as follows: First, we score it on multiple sub-indicators (sub-indicator data and scores for Virginia are shown in the table, Virginia Rankings by Area and Indicator). Second, we take a weighted average of the sub-indicators in each of five areas. In each area, we use that average to place the states in rank order: For example, in Area 1: Resources and Membership, Virginia is ranked 40th of 51 based on the weighted average of its sub-indicators. To generate the state’s overall rank, we average the five area ranks together, then re-order the states. For a more detailed description of data sources and methodology, see Appendix A.
2 Readers should note that these figures include only direct donations from unions and union-connected PACs, but not their spending on electioneering/advertising, mobilizing the union’s own membership, lobbying, or advocacy. A recent Wall Street Journal report found that donations and lobbying activities account for a small share of union political spending compared with their expenditures on member mobilization and advocacy. Even the AFT agreed, making the argument that since its mission is organizing and activism, it will naturally spend significant amounts on these activities. Thus, the percentages we report here are extremely conservative representations of what unions actually spend on politics. For more information, see Appendix A, Area 2; Tom McGinty and Brody Mullins, “Political Spending by Unions Far Exceeds Direct Donations,” Wall Street Journal, July 10, 2012; and Jeff Hauser, “Wall Street Journal Compares Union Political Spending to Corporate Donations,” AFL-CIO, July 10, 2012.
3 The indicators in Area 2 are calculated using total contributions to state candidates and political parties from local, state, and national unions. In the majority of cases, the state unions gave much higher sums than all the local unions combined, with the national associations giving little (or nothing). Virginia is an exception because the NEA and AFT gave as much (or in some years, more) to Virginia candidates and parties than did the VEA.
4 At the time of publication, the 2000 conventions were the most recent for which such detailed data were available in forms that met rigorous standards. However, 2008 data provided by the Democratic National Convention were highly correlated with the reliable figures from 2000.
5 See Article VIII, Section 7 of the Virginia State constitution. Further, Virginia courts have upheld the rights of local school boards to decide matters of employment and educational policy such that consequences for unsatisfactory evaluations cannot be mandated by the state, nor can the state require student achievement results be a component of teacher evaluations. Moreover, as indicated, charter schools are solely authorized by school boards and charter school employees “supervised” by them.
6 One insider indicated that the “VEA has the ability to push the ‘send’ button and generate hundreds and thousands of communications to the General Assembly demanding a ‘yes’ or ‘no’ vote on this or that. In a very short legislative session, this gives them the capacity to exercise outsized influence in the legislative process. They are also helped greatly by the alliance with VSBA (school boards) and VASS (school superintendents). I’ve found that school superintendents have a very powerful influence on General Assembly members, largely because— particularly in rural areas—they are frequently the area’s largest employer… As an elected official, wouldn’t you listen carefully to someone who employed 25,000+ constituents?”
7 Michael Martz, “General Assembly: Legislators Approve Far-Reaching State Pension Reforms,” Richmond Times-Dispatch, March 11, 2012, http://www2.timesdispatch.com/news/virginia-politics/2012/mar/11/tdmain01-general-assembly-legislators-approve-far--ar-1756593/.
8 Virginia Department of Education, http://www.doe.virginia.gov/teaching/performance_evaluation/#teachers; most states require a higher percentage and place a pre-determined weight on standardized test scores.
9 “ESEA Flexibility Peer Panel Notes,” U.S. Department of Education, March 16, 2012, http://www2.ed.gov/policy/eseaflex/panel-notes/va.pdf.
10 Emma Brown, “Tenure Proposal Revived In VA Senate,” Washington Post, February 23, 2012, http://www.washingtonpost.com/local/education/bill-to-end-teacher-tenure-protections-revived-in-va-senate/2012/02/23/gIQAnRbVWR_story.html.
11 Emma Brown, “Bill To Cut Tenure For Virginia Teachers Is Shelved,” Washington Post, March 8, 2012, http://www.washingtonpost.com/local/education/bill-to-cut-tenure-for-virginia-teachers-is-shelved/2012/02/27/gIQAEMaL0R_story.html.
12 Ibid.

Overall Rank: 10thTier 1 (Strongest)
WASHINGTON
IntroductionPart IV: Taking a Closer Look–Teacher Union Influence Area
AREA 1: RESOURCES AND MEMBERSHIP
TIED FOR 3RD
Washington’s teacher unions benefit
from high membership and substantial
member-based revenue. Fully 98.0 percent
of the Evergreen State’s teachers are
union members, the 4th-highest rate of
51 jurisdictions. The NEA and AFT state-
level affiliates bring in $634 annually per
Washington teacher (10th). About one-
quarter (24.3 percent) of Washington’s
expenditures are directed toward K–12
education (10th), despite the fact that
overall K–12 spending is not particularly
high—$9,320 annually per student (from
federal, state, and local sources; 42nd). In
addition, 54.2 percent of total education
dollars go toward teacher salaries and
benefits (24th).
AREA 2: INVOLVEMENT IN POLITICS2
TIED FOR 32ND
Even with their ample financial resources,
Washington’s teacher unions are not heavy
donors to state politics. In the past decade,
their donations amounted to only 0.49
percent of all contributions to candidates
for state office (29th), and 5.0 percent of
the donations to candidates contributed by
the ten highest-giving sectors in the state
(25th). Still, they contributed 2.0 percent
of the total donations received by state
political parties (15th). Union representation
among Washington’s delegates to the
Democratic and Republican national
conventions was also thin at 4.3 percent
(48th).3
WASHINGTON OVERALL RANK: 10TH1
TIER 1 (STRONGEST)
STRONGER WEAKER
1. RESOURCES AND MEMBERSHIP
OVERALL
2. INVOLVEMENT IN POLITICS
3. SCOPE OF BARGAINING
4. STATE POLICIES
5. PERCEIVED INFLUENCE
10
32
18
3
9
11

Overall Rank: 10thTier 1 (Strongest)
WASHINGTON
AREA 3: SCOPE OF BARGAINING
11TH
Washington is one of twenty-one states
that both require collective bargaining
and allow unions to automatically collect
agency fees, a key source of revenue, from
non-members. State law does not address
teachers’ (or any public employees’)
right to strike. The law is, however, quite
permissive when it comes to the scope
of bargaining for teachers: Of twenty-
one items examined in this analysis,
Washington requires bargaining over four
(wages, hours, terms and conditions of
employment, and insurance benefits) and
explicitly permits another (retirement
benefits and pensions). Only management
rights are excluded from bargaining, which
means the remaining fifteen items are
implicitly open to bargaining.
AREA 4: STATE POLICIES
TIED FOR 18TH
Washington’s teacher employment
policies tend to align with traditional union
interests. The state does not support
performance pay for teachers. Further, at
the time we calculated our rankings, the
state did not require student achievement
data be part of teacher evaluations, nor
did districts need to consider teacher
performance when making layoffs. (By
press time, however, the state enacted,
but had not yet implemented, SB 5895,
requiring that student data be used in
teacher evaluations and allowing teacher
performance to factor in layoff decisions).
Still, not all employment policies are
favorable to unions. For example, the state
does not mandate class size restrictions
and teachers are eligible for dismissal after
unsatisfactory evaluations, as opposed
to first being placed on an improvement
plan. Nevertheless, Washington teachers
were dismissed due to poor performance
at one of the lowest rates in the country.
Washington does not have a charter school
law.4
AREA 5: PERCEIVED INFLUENCE
9TH
Stakeholders in Washington perceive
their teacher unions to be quite strong
(especially when compared with
perceptions of union influence in other
states). They rank the unions the most
influential entity in shaping education
policy (with education advocacy groups as
a close second). Respondents agree that
teacher unions are effective in warding off
proposals with which they disagree and in
protecting dollars for education. They note
that policies proposed by the governor
and enacted in the latest legislative session
were mostly in line with teacher union
priorities, and that the positions of state
education leaders are often aligned with
those of teacher unions.5
OVERALL
10TH
Washington’s teacher unions benefit from
a strong membership and resource base, a
broad scope of bargaining, and favorable
teacher employment policies. While they
don’t contribute large sums to political
campaigns, stakeholders report that they
are active (and typically successful) in
shaping state policy. With such a strong
reputation, the teacher unions may find that
their dollars are better spent elsewhere—
such as trying to influence voters (see
sidebar).

Overall Rank: 10thTier 1 (Strongest)
WASHINGTON
School choice proponents in the Evergreen State are nothing if not persistent—and deep-pocketed. Voters rejected charter-school initiatives in 1996, 2000, and 2004, but choice advocates hope they’ve changed their mind: An initiative slated for the November 2012 ballot would allow up to forty charter schools to open in the next five years. Sponsors amassed about 350,000 signatures (100,000 more than necessary to be put on the ballot) and a whopping $3.3 million war chest from Bill Gates and others.6 Lawmakers such as Eric Pettigrew, D-Seattle, agree that the bill is necessary: “This initiative will finally bring Washington into the 21st century in terms of educational opportunities for public school students.”7
Voters aren’t the only ones in Washington talking about charters. In 2004, the legislature passed ESSHB 2295, which permitted charters so long as they were under contract with local school districts, but opponents brought the measure to referendum where it was soundly rejected by popular vote.8,9 In 2012, lawmakers once again debated a charter measure but, concerned that these schools would hire nonunion teachers and divert funds from already-strapped district schools, they never actually voted on the issue.10 With the fate of charters back in the hands of voters this autumn, the Washington Education Association (WEA)—which refers to charters as a “failed concept”—is bent on again blocking the reform.11 Citing the state’s already “numerous innovative public schools” and pointing out that charters would “siphon already limited dollars from existing public schools” but can show no proven record of success, the WEA has the money and members to ensure that it will remain a major force in this heated, and expensive, ongoing battle.12
FOURTH TIME’S THE CHARM?

Overall Rank: 10thTier 1 (Strongest)
WASHINGTON
OVERALL RANK: 10TH
Area and Ranka General Indicator Sub-IndicatorSub-Indicator Rank/Statusb
AREA 1: RESOURCES & MEMBERSHIP
Membership By rank, what percentage of public-school teachers in the state are union members? 4th
Revenue By rank, what is the total yearly revenue (per teacher in the state) of the state-level NEA and/ or AFT affiliate(s)?
10th
Spending on education By rank, what percentage of state expenditures (of state general funds, state restricted funds, state bonds, and federal “pass-through” funds) is directed to K-12 education?
10th*
By rank, what is the total annual per-pupil expenditure (of funds from federal, state, and local sources) in the state?
42nd
By rank, what percentage of total annual per-pupil expenditures is directed to teacher salaries and benefits?
24th
AREA 2: INVOLVEMENTIN POLITICS
Contributions to candidates and political parties
By rank, what percentage of the total contributions to state candidates was donated by teacher unions?
29th
By rank, what percentage of the total contributions to state-level political parties was donated by teacher unions?
15th
Industry influence By rank, what percent of the contributions to state candidates from the ten highest-giving sectors was donated by teacher unions?
25th
Status of delegates By rank, what percentage of the state’s delegates to the Democratic and Republican conventions were members of teacher unions?
48th
AREA 3:SCOPE OF BARGAINING
Legal scope of bargaining What is the legal status of collective bargaining? Mandatory
By rank, how broad is the scope of collective bargaining? 20th*
Automatic revenue streams What is the unions’ legal right to automatically collect agency fees from non-members and/or collect member dues via automatic payroll deductions?
Permitted
Right to strike What is the legal status of teacher strikes? Neither prohibited nor permitted
AREA 4:STATE POLICIES
Performance pay Does the state support performance pay for teachers? State does not support
Retirement By rank, what is the employer- versus employee-contribution rate to the teacher pension system? 22nd
Evaluationsc What is the maximum potential consequence for veteran teachers who receive unsatisfactory evaluation(s)?
Eligible for dismissal
Is classroom effectiveness included in teacher evaluations? If so, how is it weighted? Not required
Terms of employmentc How long before a teacher earns tenure? Three years
Is student/teacher performance considered in tenure decisions? If so, how is it weighted? Not included
Is seniority considered in teacher layoff decisions? If so, how is it weighted? Optional; Weighted at district discretion
Is teacher performance included in teacher layoff decisions? If so, how is it weighted? Not required
By rank, what percentage of the teaching workforce was dismissed due to poor performance? 11th
Class size Is class size restricted for grades 1-3? If so, is the restriction higher or lower than the national average (20)?
No restriction
WASHINGTON RANKINGS BY AREA AND INDICATOR
3*
32*
11
18*

Overall Rank: 10thTier 1 (Strongest)
WASHINGTON
Area and Rank General Indicator Sub-IndicatorSub-Indicator Rank/Status
AREA 4:STATE POLICIES
(cont.)
Charter school structural limitationsd
Is there a cap (limit) placed on the number of charter schools that can operate in the state (or other jurisdiction) and/or on the number of students who can attend charter schools?
N/A
Does the state allow a variety of charter schools: start-ups, conversions, and virtual schools? N/A
How many charter authorizing options exist? How active are those authorizers? N/A
Charter school exemptionsd Are all charter schools automatically exempt from state laws and state/district regulations (except those that safeguard students and fiscal accountability)? If not, are they eligible for exemptions?
N/A
Are all charter schools automatically exempt from state teacher-certification requirements? If not, are they eligible for exemptions?
N/A
Are all charter schools automatically exempt from collective bargaining agreements (CBAs)? If not, are they eligible for exemptions?
N/A
AREA 5:PERCEIVED INFLUENCEDe
Relative influence of teacher unions
How do you rank the influence of teacher unions on education policy compared with other influential entities?
Most- or second-most influential
Influence over campaigns On a scale from always to never, how often do Democratic candidates need teacher-union support to get elected?
Often
On a scale from always to never, how often do Republican candidates need teacher-union support to get elected?
Rarely/Sometimes
Influence over spending To what extent, from strongly agree to strongly disagree, do you agree that even in times of cutbacks, teacher unions are effective in protecting dollars for education?
Agree
Given recent budgetary constraints, would you say that teacher unions generally make concessions to prevent reductions in pay and benefits or fight hard to prevent those reductions?
Fight
Influence over policy To what extent, from strongly agree to strongly disagree, do you agree that teacher unions ward off proposals in your state with which they disagree?
Agree
On a scale from always to never, how often do existing state education policies reflect teacher-union priorities?
Sometimes/Often
To what extent, from totally in line to not at all in line, were state education policies proposed by the governor during your state’s latest legislative session in line with teacher-union priorities?
Mostly in line
To what extent, from totally in line to not at all in line, were legislative outcomes of your state’s latest legislative session in line with teacher-union priorities?
Mostly in line
Influence over key stakeholders
On a scale from always to never, how often have the priorities of state education leaders aligned with teacher-union positions in the past three years?
Sometimes/Often
Would you say that teacher unions typically compromise with policymakers to ensure that their preferred policies are enacted, or typically need not make concessions?
Sometimes compromise, sometimes do not need to concede
* Tied with another state
a Area ranks are calculated using a weighted average of sub-indicators. For a more detailed description, see Appendix A.
b Where possible, we report a state’s rank as compared to other states on a given metric. For example, out of 51 states, Washington has the 4th-highest percentage of teachers who are union members. Otherwise, we report a status: Washington has mandatory collective bargaining, and union agency fees are permitted. For a more detailed description of our metrics and methodology, see Appendix A. To request the raw data for your state, send an email to [email protected].
c See explanation in Area 4 above.
d Washington does not have a charter school law.
e For all survey questions, stakeholders were asked specifically about teacher unions, candidates, policies, and leaders in their state. In addition, we asked about unions and policies in the “current legislative session,” but because legislative calendars vary from state to state, responses refer to policies proposed and enacted within the 2010-11 window.
18*
9

Overall Rank: 10thTier 1 (Strongest)
WASHINGTON
ENDNOTES
1 A state’s overall rank is calculated as follows: First, we score it on multiple sub-indicators (sub-indicator data and scores for Washington are shown in the table, Washington Rankings by Area and Indicator). Second, we take a weighted average of the sub-indicators in each of five areas. In each area, we use that average to place the states in rank order: For example, in Area 1: Resources and Membership, Washington is ranked 3rd of 51 based on the weighted average of its sub-indicators. To generate the state’s overall rank, we average the five area ranks together, then re-order the states. For a more detailed description of data sources and methodology, see Appendix A.
2 Readers should note that these figures include only direct donations from unions and union-connected PACs, but not their spending on electioneering/advertising, mobilizing the union’s own membership, lobbying, or advocacy. A recent Wall Street Journal report found that donations and lobbying activities account for a small share of union political spending compared with their expenditures on member mobilization and advocacy. Even the AFT agreed, making the argument that since its mission is organizing and activism, it will naturally spend significant amounts on these activities. Thus, the percentages we report here are extremely conservative representations of what unions actually spend on politics. For more information, see Appendix A, Area 2; Tom McGinty and Brody Mullins, “Political Spending by Unions Far Exceeds Direct Donations,” Wall Street Journal, July 10, 2012; and Jeff Hauser, “Wall Street Journal Compares Union Political Spending to Corporate Donations,” AFL-CIO, July 10, 2012.
3 At the time of publication, the 2000 conventions were the most recent for which such detailed data were available in forms that met rigorous standards. However, 2008 data provided by the Democratic National Convention were highly correlated with the reliable figures from 2000.
4 We do not include data for sub-indicators pertaining to charters when calculating the ranking of states that do not have charter school laws. While some might argue that the lack of such a law is in itself evidence for union strength, we do not have sufficient data to link that absence to union activity. The nine states without charter laws are home to very different contexts—while teacher unions in some states may have played a significant role in keeping charter laws at bay, in others, they played little or none. However, in Washington, the state union can take substantial credit for the absence of a charter law (see sidebar).
5 We asked stakeholders about unions and policies in the “current legislative session,” but because legislative calendars vary from state to state, responses refer to policies proposed and enacted within the 2010-11 window.
6 Brian M. Rosenthal, “Latest Big Gift To Charter Schools Initiative: $600,000 From Wal-Mart Heiress,” Seattle Times, July 17, 2012, http://blogs.seattletimes.com/politicsnorthwest/2012/07/17/latest-eye-popping-gift-to-charter-school-initiative-600k-from-wal-mart-heiress/.
7 Schrader, Jordan, “Charter School Advocates Make Last-Minute Attempt To Reach 2012 Ballot,” News Tribune, May 22, 2012, http://blog.thenewstribune.com/politics/2012/05/22/charter-school-advocates-make-last-minute-attempt-to-reach-2012-ballot/.
8 “General Election,” Stevens County, Washington, January 25, 2006, http://www.co.stevens.wa.us/auditor/election/election/Ballot%20Titles/2004/110204.htm.
9 “R-55 Is Losing, But Hope Is Still Alive!” Washington Charter School Resource Center, November 3, 2004, http://www.wacharterschools.org/learn/history-nov04r55.htm.
10 Brian M. Rosenthal, “Well-Funded Charter School Initiative Has Nearly Enough Signatures To Make Ballot,” Seattle Times, July 2, 2012, http://seattletimes.nwsource.com/html/localnews/2018585780_charterschools03m.html.
11 Ibid.
12 “Charter Schools Drain Money From Already Underfunded Public Schools,” Washington Education Association, accessed August 16, 2012, http://www.washingtonea.org/index.php?option=com_content&view=article&id=3343:charter-schools-drain-money-from-already-underfunded-public-schools&catid=180.

Overall Rank: 13thTier 2 (Strong)
WEST VIRGINA
IntroductionPart IV: Taking a Closer Look–Teacher Union Influence Area
AREA 1: RESOURCES AND MEMBERSHIP
TIED FOR 31ST
The resources and union membership of
West Virginia’s teacher unions ranks them
in the middle of the national pack. Roughly
68 percent of teachers in the Mountain
State are unionized, the 31st-highest rate
of 51 jurisdictions. Its NEA and AFT state-
level affiliates post annual revenues of
$325 per teacher in the state (34th of 51).
Further, K–12 education accounts for just
10.5 percent of state spending, the smallest
percentage in the nation. Despite this low
allocation by the state, total per-pupil
expenditures (a combination of state, local,
and federal funds) are fairly high at $12,780
annually (16th), of which 55.3 percent goes
toward teacher salaries and benefits (18th).
AREA 2: INVOLVEMENT IN POLITICS2
TIED FOR 4TH
In the past ten years, West Virginia’s
teacher unions were more involved in
state politics than their counterparts
in nearly every other state. Their
donations accounted for 1.6 percent of
all contributions to candidates for state
office (8th); those donations amount
to 14.3 percent of contributions from
the ten highest-giving sectors in the
state (9th), demonstrating the unions’
significant financial role in political
campaigns. They also contributed 1.5
percent of total donations to state political
parties (19th)—and 15.2 percent of West
Virginia’s delegates to the Democratic and
Republican national conventions identified
as teacher union members (19th).3
WEST VIRGINIA OVERALL RANK: 13TH1
TIER 2 (STRONG)
STRONGER WEAKER
1. RESOURCES AND MEMBERSHIP
OVERALL
2. INVOLVEMENT IN POLITICS
3. SCOPE OF BARGAINING
4. STATE POLICIES
5. PERCEIVED INFLUENCE
13
4
1
31
6
28

Overall Rank: 13thTier 2 (Strong)
WEST VIRGINA
AREA 3: SCOPE OF BARGAINING
TIED FOR 28TH
West Virginia state law does not address
collective bargaining in education; districts
may decide whether to negotiate with
employee organizations. The scope of
bargaining is likewise left to the local
districts, should they choose to negotiate
with their employees. The state is also silent
on agency fees. Although public employee
strikes are not addressed by the state, the
courts have deemed them illegal.
AREA 4: STATE POLICIES
1ST
West Virginia’s policies are better aligned
with traditional union interests than those
in any other state. (Predictably, its first
Race to the Top application failed. Equally
predictably, all fifty-five local unions had
endorsed it, and there was no second
attempt—see sidebar). The state does
not support performance pay and does
not require student achievement data
to factor into either teacher evaluations
or tenure (which is granted after three
years, the national norm). Seniority is
the sole factor in layoff decisions, while
teacher performance is not considered at
all. Further, employers contribute nearly
three times more to teacher pensions
than employees do—only in Louisiana do
teachers give comparatively less to their
pensions. Nor does West Virginia have a
charter school law.4
AREA 5: PERCEIVED INFLUENCE
6TH
Although West Virginia has voted for
Republicans in the last three presidential
elections, it is traditionally Democratic
and pro-labor, particularly at the local
level—conditions reflected in the teacher
unions’ strong reputation among education
stakeholders. Survey respondents rank
them as one of the two most influential
entities in shaping education policy, behind
only the state board of education. They
note that Democrats running for state-
level office need teacher union support to
get elected, and that the positions of state
education leaders are often aligned with
those of the union. Further, stakeholders
agree that teacher unions are effective
in protecting dollars for education even
in times of cutbacks, and in warding off
education reform proposals with which
they disagree. Finally, while they report
that policies proposed by the governor
during the latest legislative session were
only somewhat aligned with teacher
union priorities, those that were enacted
were mostly aligned with union priorities
(perhaps a sign that much of the unions’
strength lies in their ability to change
proposals already on the table rather than
determine the policy agenda—see sidebar).
OVERALL
13TH
Despite the absence of mandatory
collective bargaining and moderate
financial resources, West Virginia’s teachers
unions have a strong presence in politics,
enjoy favorable state policies, and have
garnered a reputation for influence. Unions
in West Virginia join those in neighboring
Ohio (12th) as the strongest in permitted-
bargaining states.

Overall Rank: 13thTier 2 (Strong)
WEST VIRGINA
Labor unions have been a strong presence in the Mountain State since the 1870s, and its teacher unions—even without mandatory collective bargaining—share in that tradition. “The unions in West Virginia … are some of the most powerful state teachers unions in the nation,” said Marc Oestreich of the Heartland Institute, a conservative research group.5 Former Governor Joe Manchin agreed: After lawmakers could not agree on a slate of reform measures required for its second Race to the Top application (the first was rejected), he lamented, “The protection of [state] law gives our unions a much better comfort level than sitting down bargaining with the facts.”6 The state dropped its application, and subsequently convened a special committee of senators and outside members, including union representatives; not surprisingly, the special education legislative session that followed did not amount to much.7
In 2012, with the help of the West Virginia Education Association (WVEA), lawmakers again showed their resistance to change. In search of an NCLB waiver, in March the legislature passed what seemed like a watershed teacher evaluation bill, but was actually a watered-down version of the evaluation systems in many other states.8 After the WVEA successfully lobbied for amendments, HB 4236 now specifies that 80 percent of a teacher’s evaluation be based on adherence to teaching standards and 20 percent on student growth. That 20 percent is further broken down: 15 percent from evidence determined by the teacher and just 5 percent tied to student assessment results at the school-wide level.9 A report from the National Council on Teacher Quality gave the state’s new evaluation procedures a D+.10 WVEA President Dale Lee nonetheless apologized to his members: “I understand many people will question the student growth component in the evaluation bill. I am not crazy about it either, but it is a requirement if we are to get a waiver of NCLB and continue to receive some of our federal funds…some states are including student growth components of as much as 50 percent.”11 With West Virginia’s student performance among the lowest in the nation—the 2011 NAEP results place the state in the bottom 10 percent for math and the bottom 5 percent for reading—it would surely benefit youngsters if unions focused more on their achievement and less on teacher comfort.
THE NUMBERS JUST DON’T ADD UP

Overall Rank: 13thTier 2 (Strong)
WEST VIRGINA
OVERALL RANK: 13TH
Area and Ranka General Indicator Sub-IndicatorSub-Indicator Rank/Statusb
AREA 1: RESOURCES & MEMBERSHIP
Membership By rank, what percentage of public-school teachers in the state are union members? 31st
Revenue By rank, what is the total yearly revenue (per teacher in the state) of the state-level NEA and/ or AFT affiliate(s)?
34th
Spending on education By rank, what percentage of state expenditures (of state general funds, state restricted funds, state bonds, and federal “pass-through” funds) is directed to K-12 education?
50th
By rank, what is the total annual per-pupil expenditure (of funds from federal, state, and local sources) in the state?
16th
By rank, what percentage of total annual per-pupil expenditures is directed to teacher salaries and benefits?
18th
AREA 2: INVOLVEMENTIN POLITICS
Contributions to candidates and political parties
By rank, what percentage of the total contributions to state candidates was donated by teacher unions?
8th
By rank, what percentage of the total contributions to state-level political parties was donated by teacher unions?
19th
Industry influence By rank, what percent of the contributions to state candidates from the ten highest-giving sectors was donated by teacher unions?
9th
Status of delegates By rank, what percentage of the state’s delegates to the Democratic and Republican conventions were members of teacher unions?
19th
AREA 3:SCOPE OF BARGAINING
Legal scope of bargaining What is the legal status of collective bargaining? Neither required nor prohibited
By rank, how broad is the scope of collective bargaining? 38th*
Automatic revenue streams What is the unions’ legal right to automatically collect agency fees from non-members and/or collect member dues via automatic payroll deductions?
Neither required nor prohibited
Right to strike What is the legal status of teacher strikes? Prohibited
AREA 4:STATE POLICIES
Performance pay Does the state support performance pay for teachers? State does not support
Retirement By rank, what is the employer- versus employee-contribution rate to the teacher pension system? 2nd
Evaluations What is the maximum potential consequence for veteran teachers who receive unsatisfactory evaluation(s)?
Teacher improvement plan
Is classroom effectiveness included in teacher evaluations? If so, how is it weighted? Not required
Terms of employment How long before a teacher earns tenure? Three years
Is student/teacher performance considered in tenure decisions? If so, how is it weighted? Not included
Is seniority considered in teacher layoff decisions? If so, how is it weighted? Required; Sole factor
Is teacher performance included in teacher layoff decisions? If so, how is it weighted? Not required
By rank, what percentage of the teaching workforce was dismissed due to poor performance? 39th
Class size Is class size restricted for grades 1-3? If so, is the restriction higher or lower than the national average (20)?
Yes; Higher
WEST VIRGINIA RANKINGS BY AREA AND INDICATOR
31*
4*
28*
1

Overall Rank: 13thTier 2 (Strong)
WEST VIRGINA
Area and Rank General Indicator Sub-IndicatorSub-Indicator Rank/Status
AREA 4:STATE POLICIES
(cont.)
Charter school structural limitationsc
Is there a cap (limit) placed on the number of charter schools that can operate in the state (or other jurisdiction) and/or on the number of students who can attend charter schools?
N/A
Does the state allow a variety of charter schools: start-ups, conversions, and virtual schools? N/A
How many charter authorizing options exist? How active are those authorizers? N/A
Charter school exemptionsc Are all charter schools automatically exempt from state laws and state/district regulations (except those that safeguard students and fiscal accountability)? If not, are they eligible for exemptions?
N/A
Are all charter schools automatically exempt from state teacher-certification requirements? If not, are they eligible for exemptions?
N/A
Are all charter schools automatically exempt from collective bargaining agreements (CBAs)? If not, are they eligible for exemptions?
N/A
AREA 5:PERCEIVED INFLUENCEd
Relative influence of teacher unions
How do you rank the influence of teacher unions on education policy compared with other influential entities?
Most- or second-most influential
Influence over campaigns On a scale from always to never, how often do Democratic candidates need teacher-union support to get elected?
Often
On a scale from always to never, how often do Republican candidates need teacher-union support to get elected?
Rarely/Sometimes
Influence over spending To what extent, from strongly agree to strongly disagree, do you agree that even in times of cutbacks, teacher unions are effective in protecting dollars for education?
Agree
Given recent budgetary constraints, would you say that teacher unions generally make concessions to prevent reductions in pay and benefits or fight hard to prevent those reductions?
Fight
Influence over policy To what extent, from strongly agree to strongly disagree, do you agree that teacher unions ward off proposals in your state with which they disagree?
Agree
On a scale from always to never, how often do existing state education policies reflect teacher-union priorities?
Sometimes/Often
To what extent, from totally in line to not at all in line, were state education policies proposed by the governor during your state’s latest legislative session in line with teacher-union priorities?
Somewhat in line
To what extent, from totally in line to not at all in line, were legislative outcomes of your state’s latest legislative session in line with teacher-union priorities?
Somewhat/Mostly in line
Influence over key stakeholders
On a scale from always to never, how often have the priorities of state education leaders aligned with teacher-union positions in the past three years?
Sometimes/Often
Would you say that teacher unions typically compromise with policymakers to ensure that their preferred policies are enacted, or typically need not make concessions?
**
* Tied with another state
** Insufficient number of responses to this particular question
a Area ranks are calculated using a weighted average of sub-indicators. For a more detailed description, see Appendix A.
b Where possible, we report a state’s rank as compared to other states on a given metric. For example, out of 51 states, West Virginia has the 31st-highest percentage of teachers who are union members. Otherwise, we report a status: In West Virginia, collective bargaining is neither required nor prohibited, and teacher strikes are prohibited. For a more detailed description of our metrics and methodology, see Appendix A. To request the raw data for your state, send an email to [email protected].
c West Virginia does not have a charter school law.
d For all survey questions, stakeholders were asked specifically about teacher unions, candidates, policies, and leaders in their state. In addition, we asked about unions and policies in the “current legislative session,” but because legislative calendars vary from state to state, responses refer to policies proposed and enacted within the 2010-11 window.
1
6

Overall Rank: 13thTier 2 (Strong)
WEST VIRGINA
ENDNOTES
1 A state’s overall rank is calculated as follows: First, we score it on multiple sub-indicators (sub-indicator data and scores for West Virginia are shown in the table, West Virginia Rankings by Area and Indicator). Second, we take a weighted average of the sub-indicators in each of five areas. In each area, we use that average to place the states in rank order: For example, in Area 1: Resources and Membership, West Virginia is ranked 31st of 51 based on the weighted average of its sub-indicators. To generate the state’s overall rank, we average the five area ranks together, then re-order the states. For a more detailed description of data sources and methodology, see Appendix A.
2 Readers should note that these figures include only direct donations from unions and union-connected PACs, but not their spending on electioneering/advertising, mobilizing the union’s own membership, lobbying, or advocacy. A recent Wall Street Journal report found that donations and lobbying activities account for a small share of union political spending compared with their expenditures on member mobilization and advocacy. Even the AFT agreed, making the argument that since its mission is organizing and activism, it will naturally spend significant amounts on these activities. Thus, the percentages we report here are extremely conservative representations of what unions actually spend on politics. For more information, see Appendix A, Area 2; Tom McGinty and Brody Mullins, “Political Spending by Unions Far Exceeds Direct Donations,” Wall Street Journal, July 10, 2012; and Jeff Hauser, “Wall Street Journal Compares Union Political Spending to Corporate Donations,” AFL-CIO, July 10, 2012.
3 At the time of publication, the 2000 conventions were the most recent for which such detailed data were available in forms that met rigorous standards. However, 2008 data provided by the Democratic National Convention were highly correlated with the reliable figures from 2000.
4 We do not include data for sub-indicators pertaining to charters when calculating the ranking of states that do not have charter school laws. While some might argue that the lack of such a law is in itself evidence for union strength, we do not have sufficient data to link that absence to union activity. The nine states without charter laws are home to very different contexts—while teacher unions in some states may have played a significant role in keeping charter laws at bay, in others, they played little or none.
5 Walt Williams, “Few happy with state’s shot at school reform,” West Virginia Education Association, July 29, 2010, http://www.wvea.org/News---Events/2010-Archive/July/Few-happy-with-state-s-shot-at-school-reform.aspx.
6 Ibid.
7 Kallie Cart, “Manchin Drops Request For Federal School Grants; Ends Special Session,” Associated Press, May 20, 2010, http://www.wsaz.com/news/headlines/94284889.html.
8 “2011 State Teacher Policy Yearbook: National Summary,” National Council on Teacher Quality, 2011, accessed July 25, 2012, http://www.nctq.org/stpy11/reports/stpy11_national_report.pdf.
9 “H.B. 4236 – Annual Evaluations for Teachers and Administrators,” West Virginia Education Association, Final Legislative Update, March 14, 2012, http://www.wvea.org/Legislative-Action-Center/Legislative-Update.aspx.
10 National Council on Teacher Quality.
11 Ibid.

Overall Rank: 18thTier 2 (Strong)
WISCONSIN
IntroductionPart IV: Taking a Closer Look–Teacher Union Influence Area
Note: As of this writing, collective
bargaining nationwide was experiencing
a high degree of unpredictability and, in
some cases, volatility. Nowhere was that
more apparent in 2012 than in Wisconsin,
where major transformations to collective
bargaining laws portend significant
changes in the resources and strength of
its public employee unions. As such, we
present Wisconsin rankings, and those of
all the states, as a snapshot at the time of
publication. (See main report for additional
discussion.)
AREA 1: RESOURCES AND MEMBERSHIP
TIED FOR 13TH
Wisconsin’s teacher unions currently have
abundant resources and high membership
totals, and their members enjoy a larger
public investment in K–12 education than
in many other states. A full 98.3 percent of
Wisconsin teachers belong to unions, the
3rd-highest rate of 51 jurisdictions. Further,
the Badger State’s NEA and AFT state
affiliates bring in $520 annually per teacher
(21st of 51). In Wisconsin, K–12 education
expenditures account for 18.0 percent
of state spending (31st). Total funds for
education (a combination of local, state,
and federal dollars) amount to $11,783
per pupil (23rd), with 56.9 percent going
toward teacher salaries and benefits (10th).
AREA 2: INVOLVEMENT IN POLITICS2
TIED FOR 8TH
Wisconsin’s teacher unions have been
active donors over the past decade.3 Not
only did their contributions amount to 1.0
percent of donations to candidates for state
office (16th), but those donations equaled
WISCONSIN OVERALL RANK: 18TH1
TIER 2 (STRONG)
STRONGER WEAKER
1. RESOURCES AND MEMBERSHIP
OVERALL
2. INVOLVEMENT IN POLITICS
3. SCOPE OF BARGAINING
4. STATE POLICIES
5. PERCEIVED INFLUENCE
18
8
24
13
17
41

Overall Rank: 18thTier 2 (Strong)
WISCONSIN
a whopping 22.7 percent of all donations
to candidates from the ten highest-giving
sectors in the state (2nd), indicating
that the unions were real heavyweights
in Wisconsin politics. They also gave 1.9
percent of the donations received by
state political parties (16th). Finally, 17.2
percent of all Wisconsin delegates to
the Democratic and Republican national
conventions identified as teacher union
members (15th).4
AREA 3: SCOPE OF BARGAINING
41ST
Wisconsin is one of thirty-two states that
require collective bargaining. Although
2011’s Act 10 severely limited the scope of
bargaining to cost-of-living wage increases,
the Wisconsin court struck down the law
in September 2012 (see sidebar); Governor
Scott Walker vowed to appeal the outcome.
(Unfortunately, the court’s decision came
too close to our publication date for us
to take it into account when calculating
our metric.) Further, teacher unions may
collect agency fees from non-members and
automatically deduct dues from members’
paychecks. (As passed, Act 10 also
prohibited automatic payroll deductions,
but the court ruled that specific provision
unconstitutional in March 2012. The state
appealed, and as of September 2012, the
Seventh Circuit Court of Appeals was
hearing the matter.) Wisconsin does not
permit teacher strikes.
AREA 4: STATE POLICIES
TIED FOR 24TH
While Wisconsin’s teacher employment
policies generally align with traditional
teacher union interests, its charter laws are
less aligned. The state does not require
student achievement data to factor into
teacher evaluations or tenure decisions,
does not articulate consequences for
unsatisfactory evaluations, and does
not support statewide performance pay.
Further, seniority is the sole consideration
in teacher layoffs. Charter law, on the other
hand, allows new, conversion, and virtual
schools and multiple authorizers. While
charter teachers must be certified, their
schools are automatically exempt from
many other state laws. Schools authorized
by entities other than local districts receive
additional exemptions, and regardless
of where they are located, they are not
bound by district regulations and collective
bargaining agreements.
AREA 5: PERCEIVED INFLUENCE
17TH
While Wisconsin stakeholders generally
perceive teacher unions to be strong, recent
challenges to both state bargaining laws
and the historically pro-labor environment
have weakened their foundations. On the
one hand, survey respondents rank teacher
unions as the entity with the greatest
influence on education policies. (Education
advocacy groups, the school boards
association, and the association of school
administrators also rank high, but not as
high.) They also note that state education
leaders always align with teacher union
positions. On the other hand, they report
that policies proposed by the governor
and enacted in the latest legislative session
were not at all in line with teacher union
priorities, showing the widening gap
between the union’s reach on education
policies specifically, as opposed to state
policies in general. Further, respondents do
not believe unions are effective in warding
off education proposals with which they
disagree and in protecting dollars for
education—unsurprising in a state where
teacher unions, like those in Arizona and
Indiana, have seen their power significantly
curtailed.

Overall Rank: 18thTier 2 (Strong)
WISCONSIN
The nation witnessed firsthand the legislative blow dealt to public unions in the Badger State—and then their failure to recall the governor who landed that blow. In March 2011, Governor Scott Walker and his legislative allies limited the scope of public-sector bargaining to cost-of-living wage increases only. Act 10 also stopped local teacher unions from automatically collecting dues from their members and required that they hold a yearly vote in which the majority of all eligible employees must agree to recertify the union as their official bargaining agent. But public-safety unions such as those for police and firefighters were exempt, which ultimately proved to be the law’s undoing.5 The Wisconsin Education Association Council (WEAC) filed a lawsuit against the ban on payroll deductions and the recertification requirement, asserting that it violated workers’ equal-protection rights and their First Amendment right to organize. In March 2012, a federal judge agreed that teachers were being unfairly singled out—noting that the unions receiving exemptions were those that had endorsed Walker in 2010—and removed both provisions from the law.6 The ruling came just in time: twenty-eight local teacher unions were about to lose their bargaining status because they fell short of the required approval from the majority of bargaining-unit members.7,8 In spite of the court’s decision, however, in the fifteen months since Act 10 passed, the AFT-Wisconsin lost 6,000 of its 17,000 members; the NEA-affiliated WEAC refused to comment on its losses.9
Organized labor also sued to stop Act 10’s bargaining limitations, asserting that it unfairly singled out unionized public-sector workers and violated the “home rule” charter of the Wisconsin constitution that bans the state from imposing pension contribution rates on Milwaukee city workers. That suit was successful as well; as of September 2012, no part of the Act remained in effect, and unions hurried back to the negotiating table to bargain new contracts.10
In addition, organized labor backed the 2012 attempt to unseat Walker, with AFT-Wisconsin’s president Bryan Kennedy warning that failure to oust him “spells doom.”11 When the recall failed, he forced a smile: “We are disappointed, but not defeated.”12 In some respects, he was correct. Not only did the courts overturn Act 10, but the unions defended the traditional pension system and stopped further expansion of private school vouchers.13,14 They also revealed themselves to be open to teacher-quality reforms: AFT-Wisconsin helped education leaders develop a new evaluation system under which half of a teacher’s score is based on student growth and test scores.15 The WEAC then supported using those evaluations as a basis for merit pay.16 Of course, the unions’ motivations may not be entirely altruistic—with substantial losses in membership and bargaining power and the rulings to overturn Act 10 currently under appeal, it is more likely they are seeing the writing on the (classroom) wall.
WEATHERING THE STORM
OVERALL
18TH
Wisconsin teacher unions currently have
substantial resources from their members
and have been an active force in Wisconsin
state politics. But recent legislation, which
sharply erodes their collective bargaining
rights, likely heralds an era of diminished
strength for public unions in general, and
teacher unions in particular in the Badger
State.

Overall Rank: 18thTier 2 (Strong)
WISCONSIN
OVERALL RANK: 18TH
Area and Ranka General Indicator Sub-IndicatorSub-Indicator Rank/Statusb
AREA 1: RESOURCES & MEMBERSHIP
Membership By rank, what percentage of public-school teachers in the state are union members? 3rd
Revenue By rank, what is the total yearly revenue (per teacher in the state) of the state-level NEA and/ or AFT affiliate(s)?
21st
Spending on education By rank, what percentage of state expenditures (of state general funds, state restricted funds, state bonds, and federal “pass-through” funds) is directed to K-12 education?
31st
By rank, what is the total annual per-pupil expenditure (of funds from federal, state, and local sources) in the state?
23rd
By rank, what percentage of total annual per-pupil expenditures is directed to teacher salaries and benefits?
10th
AREA 2: INVOLVEMENTIN POLITICS
Contributions to candidates and political parties
By rank, what percentage of the total contributions to state candidates was donated by teacher unions?
16th
By rank, what percentage of the total contributions to state-level political parties was donated by teacher unions?
16th
Industry influence By rank, what percent of the contributions to state candidates from the ten highest-giving sectors was donated by teacher unions?
2nd
Status of delegates By rank, what percentage of the state’s delegates to the Democratic and Republican conventions were members of teacher unions?
15th
AREA 3:SCOPE OF BARGAINING
Legal scope of bargaining What is the legal status of collective bargaining? Mandatory
By rank, how broad is the scope of collective bargaining? 46thc
Automatic revenue streams What is the unions’ legal right to automatically collect agency fees from non-members and/or collect member dues via automatic payroll deductions?
Automatic payroll deductions prohibitedc
Right to strike What is the legal status of teacher strikes? Prohibited
AREA 4:STATE POLICIES
Performance pay Does the state support performance pay for teachers? State does not support
Retirement By rank, what is the employer- versus employee-contribution rate to the teacher pension system? 47th
Evaluations What is the maximum potential consequence for veteran teachers who receive unsatisfactory evaluation(s)?
No consequences articulated
Is classroom effectiveness included in teacher evaluations? If so, how is it weighted? Not required
Terms of employment How long before a teacher earns tenure? Three years
Is student/teacher performance considered in tenure decisions? If so, how is it weighted? Not included
Is seniority considered in teacher layoff decisions? If so, how is it weighted? Required; Sole factor
Is teacher performance included in teacher layoff decisions? If so, how is it weighted? Not required
By rank, what percentage of the teaching workforce was dismissed due to poor performance? 29th
Class size Is class size restricted for grades 1-3? If so, is the restriction higher or lower than the national average (20)?
No restriction
WISCONSIN RANKINGS BY AREA AND INDICATOR
13*
8*
41
24*

Overall Rank: 18thTier 2 (Strong)
WISCONSIN
Area and Rank General Indicator Sub-IndicatorSub-Indicator Rank/Status
AREA 4:STATE POLICIES
(cont.)
Charter school structural limitations
Is there a cap (limit) placed on the number of charter schools that can operate in the state (or other jurisdiction) and/or on the number of students who can attend charter schools?
No state cap (but authorizers are capped)
Does the state allow a variety of charter schools: start-ups, conversions, and virtual schools? Yes
How many charter authorizing options exist? How active are those authorizers? Two or more w/ limited jurisdiction
Charter school exemptions Are all charter schools automatically exempt from state laws and state/district regulations (except those that safeguard students and fiscal accountability)? If not, are they eligible for exemptions?
Partially; Full automatic exemptions for some schools
Are all charter schools automatically exempt from state teacher-certification requirements? If not, are they eligible for exemptions?
No; Schools cannot apply for exemptions
Are all charter schools automatically exempt from collective bargaining agreements (CBAs)? If not, are they eligible for exemptions?
Partially; Full automatic exemption for some schools
AREA 5:PERCEIVED INFLUENCEd
Relative influence of teacher unions
How do you rank the influence of teacher unions on education policy compared with other influential entities?
Most- or second-most influential
Influence over campaigns On a scale from always to never, how often do Democratic candidates need teacher-union support to get elected?
Often/Always
On a scale from always to never, how often do Republican candidates need teacher-union support to get elected?
Never/Rarely
Influence over spending To what extent, from strongly agree to strongly disagree, do you agree that even in times of cutbacks, teacher unions are effective in protecting dollars for education?
Neutral
Given recent budgetary constraints, would you say that teacher unions generally make concessions to prevent reductions in pay and benefits or fight hard to prevent those reductions?
Generally fight
Influence over policy To what extent, from strongly agree to strongly disagree, do you agree that teacher unions ward off proposals in your state with which they disagree?
Neutral
On a scale from always to never, how often do existing state education policies reflect teacher-union priorities?
Sometimes/Often
To what extent, from totally in line to not at all in line, were state education policies proposed by the governor during your state’s latest legislative session in line with teacher-union priorities?
Not at all in line
To what extent, from totally in line to not at all in line, were legislative outcomes of your state’s latest legislative session in line with teacher-union priorities?
Not at all/Mostly not in line
Influence over key stakeholders
On a scale from always to never, how often have the priorities of state education leaders aligned with teacher-union positions in the past three years?
Always
Would you say that teacher unions typically compromise with policymakers to ensure that their preferred policies are enacted, or typically need not make concessions?
Does not generally concede
* Tied with another state
a Area ranks are calculated using a weighted average of sub-indicators. For a more detailed description, see Appendix A.
b Where possible, we report a state’s rank as compared to other states on a given metric. For example, out of 51 states, Wisconsin has the 3rd-highest percentage of teachers who are union members. Otherwise, we report a status: Wisconsin has mandatory collective bargaining, and union agency fees are prohibited. For a more detailed description of our metrics and methodology, see Appendix A. To request the raw data for your state, send an email to [email protected].
c See notes in Area 3 and sidebar, above.
d For all survey questions, stakeholders were asked specifically about teacher unions, candidates, policies, and leaders in their state. In addition, we asked about unions and policies in the “current legislative session,” but because legislative calendars vary from state to state, responses refer to policies proposed and enacted within the 2010-11 window.
24*
17

Overall Rank: 18thTier 2 (Strong)
WISCONSIN
ENDNOTES
1 A state’s overall rank is calculated as follows: First, we score it on multiple sub-indicators (sub-indicator data and scores for Wisconsin are shown in the table, Wisconsin Rankings by Area and Indicator). Second, we take a weighted average of the sub-indicators in each of five areas. In each area, we use that average to place the states in rank order: For example, in Area 1: Resources and Membership, Wisconsin is ranked 13th of 51 based on the weighted average of its sub-indicators. To generate the state’s overall rank, we average the five area ranks together, then re-order the states. For a more detailed description of data sources and methodology, see Appendix A.
2 Readers should note that these figures include only direct donations from unions and union-connected PACs, but not their spending on electioneering/advertising, mobilizing the union’s own membership, lobbying, or advocacy. A recent Wall Street Journal report found that donations and lobbying activities account for a small share of union political spending compared with their expenditures on member mobilization and advocacy. Even the AFT agreed, making the argument that since its mission is organizing and activism, it will naturally spend significant amounts on these activities. Thus, the percentages we report here are extremely conservative representations of what unions actually spend on politics. For more information, see Appendix A, Area 2; Tom McGinty and Brody Mullins, “Political Spending by Unions Far Exceeds Direct Donations,” Wall Street Journal, July 10, 2012; and Jeff Hauser, “Wall Street Journal Compares Union Political Spending to Corporate Donations,” AFL-CIO, July 10, 2012.
3 The indicators in Area 2 are calculated using total contributions to state candidates and political parties from local, state, and national unions. In the majority of cases, the state unions gave much higher sums than all the local unions combined, with the national associations giving little (or nothing). Wisconsin is an exception because the sum of the donations from local affiliates is comparable to the total from the state union.
4 At the time of publication, the 2000 conventions were the most recent for which such detailed data were available in forms that met rigorous standards. However, 2008 data provided by the Democratic National Convention were highly correlated with the reliable figures from 2000.
5 “Wisc. Governor Officially Cuts Collective Bargaining,” NBC News, March 11, 2011, http://www.msnbc.msn.com/id/41996994/ns/politics-more_politics/t/wis-governor-officially-cuts-collective-bargaining/#.UBFms2FDzIc.
6 Clay Barbour and Mary Spicuzza, “Federal Court Strikes Down Parts Of Collective Bargaining Law,” Wisconsin State Journal, March 31, 2012, http://host.madison.com/wsj/news/local/govt-and-politics/federal-court-strikes-down-parts-of-collective-bargaining-law/article_562c581e-7a9f-11e1-9aea-0019bb2963f4.html; Brendan Fischer, “Federal Court Strikes Down Key Provisions Of Walker’s Act 10 As Unconstitutional,” PRWatch, March 30, 2012, http://www.prwatch.org/news/2012/03/11404/federal-court-strikes-down-key-provisions-walkers-act-10-unconstitutional.
7 Tom Tolan and Erin Richards, “Majority Of Education Unions Vote To Recertify,” Milwaukee Journal Sentinel, December 8, 2011, http://www.jsonline.com/news/education/education-unions-vote-to-recertify-sd3caui-135285458.html.
8 Matthew DeFour, “Nearly All State Teachers Unions Without Pact Seek Recertification,” Wisconsin State Journal, October 13, 2011, http://host.madison.com/wsj/news/local/education/local_schools/article_14750bca-f51e-11e0-b9d0-001cc4c002e0.html. Teachers in 148 districts voted to recertify their unions, twelve opted not to vote, and only one district had a majority of its teachers vote against recertification. For the other twenty-seven unions about to lose their bargaining status, a majority of the teachers who chose to vote wanted to recertify as a union, but to keep bargaining status the vote required approval from a majority of all eligible employees whether they voted or not.
9 Douglas Belkin and Kris Maher, “Wisconsin Unions See Ranks Drop Ahead of Recall Vote,” Wall Street Journal, May 30, 2012, http://online.wsj.com/article/SB10001424052702304821304577436462413999718.html
10 Judge Colas ruled that the law violated the rights of freedom of speech and freedom of assembly, essentially creating a separate class of workers with different rules based only on their decision to join the union. See Mark Guarino, “Court Decision Produces Twist in Wisconsin Union Fight,” Christian Science Monitor, September 24, 2012, http://www.csmonitor.com/USA/Politics/2012/0924/Court-decision-produces-twist-in-Wisconsin-union-fight.
11 Belkin and Maher.
12 “‘We Are Disappointed, But Not Defeated,’ Says AFT-Wisconsin President,” AFT-Wisconsin, June 6, 2012, http://www.aft-wisconsin.org/.
13 “Moving Education Forward: Bold Reforms,” Wisconsin Education Association Council, February 2011, http://www.weac.org/Libraries/PDF/WEACBoldReformsPlatform.sflb.ashx (on WEAC “Take Action” page, accessed August 14, 2012, http://www.weac.org/Issues_Advocacy.aspx).
14 “News Headlines,” Wisconsin Education Association Council, accessed July 19, 2012, http://www.weac.org/News_and_Publications.aspx.
15 Erin Richards, “Student Results Would Account For Half Of Teacher Evaluations,” November 7, 2011, http://www.jsonline.com/news/education/133412398.html.
16 Tony Galli, “Largest Teacher Union Backs Merit Pay,” WKOW Madison, February 8, 2011, http://www.wkow.com/Global/story.asp?S=13993642.

Overall Rank: 29thTier 3 (Average)
WYOMING
IntroductionPart IV: Taking a Closer Look–Teacher Union Influence Area
AREA 1: RESOURCES AND MEMBERSHIP
TIED FOR 31ST
Though Wyoming’s state-level teacher
union has sparse membership, the state’s
teachers benefit from a fairly substantial
public investment in K–12 education. Just
53.2 percent of teachers in the Equality
State are unionized. (Only seven states
have lower rates; most other states where
bargaining is permitted but not required are
in the same range as Wyoming.) Despite
the underwhelming level of membership,
however, the Wyoming Education
Association (WEA) posts $573 in annual
revenue per teacher in the state (16th;
while not included in this metric, it also
has one of the three highest per member
revenues in the nation as well). Per-pupil
expenditures are the highest of any state in
the nation at $18,068 annually, more than
double that of last-place Utah. Further,
53.7 percent of those dollars goes toward
teacher salaries and benefits (29th).
AREA 2: INVOLVEMENT IN POLITICS2
TIED FOR 13TH
Wyoming’s teacher union is more involved
in state politics than are its counterparts
in most other states.3 Over the past ten
years, its donations amounted to 1.3
percent of all contributions to candidates
for state office (13th) and 10.7 percent of
the money donated by the ten highest-
giving sectors in the state (12th). Its high
rankings on those measures are likely aided
by the union’s considerable revenues (see
Area 1) and the fact that candidates and
parties in Wyoming generally receive little
money—candidates get fewer total dollars
WYOMING OVERALL RANK: 29TH1
TIER 3 (AVERAGE)
STRONGER WEAKER
1. RESOURCES AND MEMBERSHIP
OVERALL
2. INVOLVEMENT IN POLITICS
3. SCOPE OF BARGAINING
4. STATE POLICIES
5. PERCEIVED INFLUENCE
29
13
30
31
26
28

Overall Rank: 29thTier 3 (Average)
WYOMING
than in any other state, making entry into
the political arena fairly low-cost. Finally,
17.9 percent of Wyoming’s delegates to
the Democratic and Republication national
conventions were teacher union members
(14th).4
AREA 3: SCOPE OF BARGAINING
TIED FOR 28TH
Wyoming is one of fourteen states that
permit, but do not require, collective
bargaining (seven of those states, Wyoming
included, explicitly allow it, while the other
seven permit it by omission). The law
does not outline the scope of collective
bargaining for districts that choose to
negotiate with their local unions, nor
does it address the legality of teacher
strikes. Wyoming does limit the revenue
potential of its unions by preventing them
from automatically collecting agency
fees from non-members; the fact that the
WEA still posts high revenue despite low
membership rates and no agency fees
shows its ability to generate significant
financial resources from its existing
members.
AREA 4: STATE POLICIES
TIED FOR 30TH
While Wyoming’s teacher employment
policies are reasonably well aligned with
traditional union interests, its charter
laws are less so. At the time our data
were analyzed, the state did not support
performance pay for teachers, nor did it
set forth consequences for unsatisfactory
evaluations. (By press time, the state
had passed measures in support of
performance pay and consequences for
poor teacher evaluations, yet actual plans
and implementation remain unresolved;
assuming these questions are resolved,
they will take effect in 2013—see sidebar.)
Further, districts do not have to consider
teacher performance when making layoffs,
and student learning does not factor into
tenure (which teachers earn after three
years, the national norm). Districts must
consider evidence of student learning
when evaluating their teachers, but the law
does not stipulate what that evidence is
or how much weight it must carry. On the
other hand, unions typically seek to limit
the number, the variety and the autonomy
of charter schools, but Wyoming does not
cap the number of schools and allows new,
conversion, and virtual schools. However, it
provides only a single authorizing option—
local districts—and there is little authorizing
activity (out of 344 public schools in the
state, only four are charters). Charter
schools are automatically exempt from
district collective bargaining agreements
where such exist, but they must follow all
other state laws and district regulations
unless they receive waivers from them and
all charter teachers must be certified.
AREA 5: PERCEIVED INFLUENCE
26TH
While stakeholders perceive Wyoming’s
teacher union to be active in shaping
policy, they also report that it is not
always successful in achieving its goals.
Respondents say it is one of the most
influential entities on education policy
in the state, along with the school board
association and association of school
administrators. They note that the union is
effective in warding off education proposals
with which it disagrees, but indicate that it
often must compromises with policymakers.
(Such compromises are evident in the
state’s new evaluation system, which the
union agreed to in principle. See sidebar.)
Stakeholders observe that the union also
makes concessions to prevent reductions
in pay and benefits, and that the outcomes
of the latest legislative session were only
somewhat in line with teacher union
priorities.5

Overall Rank: 29thTier 3 (Average)
WYOMING
In February 2011, it seemed like teacher tenure in Wyoming would become history. Yet to the relief of the Wyoming Education Association (WEA), the legislature eventually defeated a bill to make all teachers at-will employees. Lawmakers’ reasons ranged from support for teachers to fear of lawsuits from dismissed educators.6 The WEA’s position: better teacher evaluations, not the elimination of tenure, would improve education. Next came SF 114, an attempt to put video cameras in every classroom to evaluate teachers; given privacy and cost concerns, however, the idea did not make it past the Senate floor.7
Lawmakers did pass three related reform-oriented bills in 2011, but these amounted more to plans than actions. They established measures of student performance, required districts use performance-based evaluation systems (but did not specify what those systems were), and made recommendations on how to link evaluations to pay (but did not require districts do so). The WEA endorsed all three.8,9 Finally, SF 57, passed in 2012, outlined how accountability-based evaluations would actually work—but only applied to schools, not teachers. Significantly amended from the original proposal with the help, and ultimately blessing, of the WEA, the new legislation required that schools be evaluated using a combination of state standardized tests and non-test measures like graduation rates and credit accumulation. Individual teachers will not be evaluated until 2013, at which point unsatisfactory evaluations could lead to suspensions or dismissals.10 But the nuts and bolts of the teacher evaluation system—what exactly will comprise the evaluations and how much weight student performance will be given—remain to be developed. As a result, Wyoming did not follow through on its stated intent to apply for an NCLB waiver (since waiver applications require performance-based evaluations for teachers). Cindy Hill, Wyoming’s Superintendent of Public Instruction, was less than optimistic about whether the state will ever meet that requirement: “While efforts are ongoing to link student performance to teacher evaluation, it has not been successfully demonstrated elsewhere nor can I promise when it could be in Wyoming.”11 So plans remain just that for now in the Equality State, and with state leaders not pressing for more reforms, the WEA can rest easy for now.
PLANS ON PAPER ONLY
OVERALL
29TH
Wyoming’s teacher union is squarely in
the middle of the national pack in terms of
political clout, compared to all states and
to states in which bargaining is permitted
but not mandatory. Its revenues afford
it a significant presence in state politics,
although it does not have a reputation
among stakeholders as a political
heavyweight and state policies themselves
are not particularly aligned with union
interests.

Overall Rank: 29thTier 3 (Average)
WYOMING
OVERALL RANK: 29TH
Area and Ranka General Indicator Sub-IndicatorSub-Indicator Rank/Statusb
AREA 1: RESOURCES & MEMBERSHIP
Membership By rank, what percentage of public-school teachers in the state are union members? 44th
Revenue By rank, what is the total yearly revenue (per teacher in the state) of the state-level NEA and/ or AFT affiliate(s)?
16th
Spending on education By rank, what percentage of state expenditures (of state general funds, state restricted funds, state bonds, and federal “pass-through” funds) is directed to K-12 education?
48th
By rank, what is the total annual per-pupil expenditure (of funds from federal, state, and local sources) in the state?
1st
By rank, what percentage of total annual per-pupil expenditures is directed to teacher salaries and benefits?
29th
AREA 2: INVOLVEMENTIN POLITICS
Contributions to candidates and political parties
By rank, what percentage of the total contributions to state candidates was donated by teacher unions?
13th
By rank, what percentage of the total contributions to state-level political parties was donated by teacher unions?
40th
Industry influence By rank, what percent of the contributions to state candidates from the ten highest-giving sectors was donated by teacher unions?
12th
Status of delegates By rank, what percentage of the state’s delegates to the Democratic and Republican conventions were members of teacher unions?
14th
AREA 3:SCOPE OF BARGAINING
Legal scope of bargaining What is the legal status of collective bargaining? Permitted
By rank, how broad is the scope of collective bargaining? 38th*
Automatic revenue streams What is the unions’ legal right to automatically collect agency fees from non-members and/or collect member dues via automatic payroll deductions?
Agency fees prohibited
Right to strike What is the legal status of teacher strikes? Neither prohibited nor permitted
AREA 4:STATE POLICIES
Performance pay Does the state support performance pay for teachers? State does not support
Retirement By rank, what is the employer- versus employee-contribution rate to the teacher pension system? 40th
Evaluations What is the maximum potential consequence for veteran teachers who receive unsatisfactory evaluation(s)?
No consequences articulated
Is classroom effectiveness included in teacher evaluations? If so, how is it weighted? Evidence of student “learning” required
Terms of employment How long before a teacher earns tenure? Three years
Is student/teacher performance considered in tenure decisions? If so, how is it weighted? Not included
Is seniority considered in teacher layoff decisions? If so, how is it weighted? Optional; Weighted at district discretion
Is teacher performance included in teacher layoff decisions? If so, how is it weighted? Not required
By rank, what percentage of the teaching workforce was dismissed due to poor performance? 22nd
Class size Is class size restricted for grades 1-3? If so, is the restriction higher or lower than the national average (20)?
No restriction
WYOMING RANKINGS BY AREA AND INDICATOR
31*
13*
28*
30*

Overall Rank: 29thTier 3 (Average)
WYOMING
Area and Rank General Indicator Sub-IndicatorSub-Indicator Rank/Status
AREA 4:STATE POLICIES
(cont.)
Charter school structural limitations
Is there a cap (limit) placed on the number of charter schools that can operate in the state (or other jurisdiction) and/or on the number of students who can attend charter schools?
No state cap
Does the state allow a variety of charter schools: start-ups, conversions, and virtual schools? Yes
How many charter authorizing options exist? How active are those authorizers? Single option; No or limited activity
Charter school exemptions Are all charter schools automatically exempt from state laws and state/district regulations (except those that safeguard students and fiscal accountability)? If not, are they eligible for exemptions?
No; Schools can apply for exemptions
Are all charter schools automatically exempt from state teacher-certification requirements? If not, are they eligible for exemptions?
No; Schools cannot apply for exemptions
Are all charter schools automatically exempt from collective bargaining agreements (CBAs)? If not, are they eligible for exemptions?
Yes
AREA 5:PERCEIVED INFLUENCEc
Relative influence of teacher unions
How do you rank the influence of teacher unions on education policy compared with other influential entities?
Most- or second-most influential
Influence over campaigns On a scale from always to never, how often do Democratic candidates need teacher-union support to get elected?
Sometimes/Often
On a scale from always to never, how often do Republican candidates need teacher-union support to get elected?
Rarely/Sometimes
Influence over spending To what extent, from strongly agree to strongly disagree, do you agree that even in times of cutbacks, teacher unions are effective in protecting dollars for education?
Neutral
Given recent budgetary constraints, would you say that teacher unions generally make concessions to prevent reductions in pay and benefits or fight hard to prevent those reductions?
Generally concede
Influence over policy To what extent, from strongly agree to strongly disagree, do you agree that teacher unions ward off proposals in your state with which they disagree?
Agree
On a scale from always to never, how often do existing state education policies reflect teacher-union priorities?
Sometimes/Often
To what extent, from totally in line to not at all in line, were state education policies proposed by the governor during your state’s latest legislative session in line with teacher-union priorities?
**
To what extent, from totally in line to not at all in line, were legislative outcomes of your state’s latest legislative session in line with teacher-union priorities?
Somewhat in line
Influence over key stakeholders
On a scale from always to never, how often have the priorities of state education leaders aligned with teacher-union positions in the past three years?
Sometimes/Often
Would you say that teacher unions typically compromise with policymakers to ensure that their preferred policies are enacted, or typically need not make concessions?
Generally compromise
* Tied with another state
** Insufficient number of responses to this particular question
a Area ranks are calculated using a weighted average of sub-indicators. For a more detailed description, see Appendix A.
b Where possible, we report a state’s rank as compared to other states on a given metric. For example, out of 51 states, Wyoming has the 44th-highest percentage of teachers who are union members. Otherwise, we report a status: In Wyoming, collective bargaining is permitted, and union agency fees are prohibited. For a more detailed description of our metrics and methodology, see Appendix A. To request the raw data for your state, send an email to [email protected]
c For all survey questions, stakeholders were asked specifically about teacher unions, candidates, policies, and leaders in their state. In addition, we asked about unions and policies in the “current legislative session,” but because legislative calendars vary from state to state, responses refer to policies proposed and enacted within the 2010-11 window.
30*
26

Overall Rank: 29thTier 3 (Average)
WYOMING
ENDNOTES
1 A state’s overall rank is calculated as follows: First, we score it on multiple sub-indicators (sub-indicator data and scores for Wyoming are shown in the table, Wyoming Rankings by Area and Indicator). Second, we take a weighted average of the sub-indicators in each of five areas. In each area, we use that average to place the states in rank order: For example, in Area 1: Resources and Membership, Wyoming is ranked 31st of 51 based on the weighted average of its sub-indicators. To generate the state’s overall rank, we average the five area ranks together, then re-order the states. For a more detailed description of data sources and methodology, see Appendix A.
2 Readers should note that these figures include only direct donations from unions and union-connected PACs, but not their spending on electioneering/advertising, mobilizing the union’s own membership, lobbying, or advocacy. A recent Wall Street Journal report found that donations and lobbying activities account for a small share of union political spending compared with their expenditures on member mobilization and advocacy. Even the AFT agreed, making the argument that since its mission is organizing and activism, it will naturally spend significant amounts on these activities. Thus, the percentages we report here are extremely conservative representations of what unions actually spend on politics. For more information, see Appendix A, Area 2; Tom McGinty and Brody Mullins, “Political Spending by Unions Far Exceeds Direct Donations,” Wall Street Journal, July 10, 2012; and Jeff Hauser, “Wall Street Journal Compares Union Political Spending to Corporate Donations,” AFL-CIO, July 10, 2012.
3 Wyoming is one of just five states where local teacher associations did not contribute to candidates and political parties, and the only state in which the state association was the lone donor to both (in the other four states, the NEA and/or AFT gave money as well).
4 At the time of publication, the 2000 conventions were the most recent for which such detailed data were available in forms that met rigorous standards. However, 2008 data provided by the Democratic National Convention were highly correlated with the reliable figures from 2000.
5 We asked stakeholders about unions and policies in the “current legislative session,” but because legislative calendars vary from state to state, responses refer to policies proposed and enacted within the 2010-11 window.
6 Joan Barron, “Wyoming Senate Keeps Teacher Tenure,” Casper Star-Tribune, February 9, 2011, http://trib.com/news/state-and-regional/govt-and-politics/wyoming-senate-keeps-teacher-tenure/article_b3224066-7ed9-529d-9bb8-1e25733795dc.html.
7 Becky Orr, “Bill To Install Classroom Cameras Fails In Senate,” Wyoming Tribune Eagle, February 10, 2011, http://www.wyomingnews.com/articles/2011/02/03/news/20local_02-03-11.txt.
8 Joan Barron, “Wyoming House Committee Endorses Expanded School Year Bill,” Casper Star-Tribune, January 15, 2011, http://trib.com/news/state-and-regional/govt-and-politics/article_bb0ceae9-b1a3-57e0-b873-bd3a090a255c.html.
9 Joan Barron, “Education Accountability Bills Clear Wyoming Senate,” Casper Star-Tribune, February 10, 2011, http://trib.com/news/state-and-regional/govt-and-politics/article_d308a8d4-cd68-5a70-bcb2-f8b63995e7b3.html.
10 Wyoming Education Association, http://www.wyoea.org/home/539.htm; http://wyoea.org/home/537.htm.
11 Elysia Conner, “Wyoming Department Of Education Seeks Waiver Of Federal Progress Requirements,” Casper Star-Tribune, July 5, 2012, http://trib.com/news/state-and-regional/article_79e95b82-23d8-5d64-a3af-69868297f9c1.html.

367 HOW STRONG ARE U.S. TEACHER UNIONS? A STATE-BY-STATE COMPARISON.
Appendix A:Detailed Methodology and Rationale
APPENDIX A: DETAILED METHODOLOGYAND RATIONALE
The methodology for this report comprises numerous data sources and multiple
discrete data points. This appendix provides a detailed account of each. We also include
a short rationale for the inclusion of all data relative to their role in elucidating teacher
union strength.
INDICATORS AND WEIGHTING
To calculate a state’s overall rank, we scored it in five areas: Resources and Membership,
Involvement in Politics, Scope of Bargaining, State Policies, and Perceived Influence. Each
area is comprised of multiple sub-indicators, explained below. To get from sub-indicator to
area rank to overall rank, we take a weighted average of the sub-indicators in each of the
five areas (for example, Area 1, Resources and Membership, comprises five sub-indicators
that report various aspects of union revenues and membership, as well as overall spending
on K-12 education). We use that average to place the states in rank order in that area.
To generate a state’s overall rank, we average the five area ranks together, then order
the states based on that average. Table A-1 shows the sub-indicators in each area and
how much weight each is given when calculating the overall rank. (For clarity, we do not
show the weight of each indicator in the area rank. However, each major indicator carries
equal weight in its area. For example, 1.1 Membership, 1.2 Revenue, and 1.3 Spending on
Education are one-third of the Area 1 score. Likewise, each sub-indicator carries equal
weight in its major indicator.)
Preliminary analyses found that unions that ranked high in one area did not necessarily
rank high (or low) in the others. The highest significant correlation among the areas (0.7)
was between Area 1 (Resources and Membership) and Area 3 (Scope of Bargaining), not
a surprising result because bargaining status is tied to membership and agency fees to
union revenue. The other significant correlations ranged from 0.2 to 0.5, and some areas
were not significantly correlated at all.* This reinforced our guiding principle that strong
unions do not look the same everywhere and that it’s therefore important to incorporate
different measures when defining “strength.” This is also why the five areas are weighted
equally: We could not justify any one of them dictating more of the final score than
another.
In Table A-1, we explain the indicators and sub-indicators that comprise each of the five
areas. Text highlighted in tan describes the data, data sources, and methods. The rationale
for inclusion of those data follows (in teal).
* Of the ten possible pairings among Areas 1-5, only six showed significant correlations. Data available upon request.

368 HOW STRONG ARE U.S. TEACHER UNIONS? A STATE-BY-STATE COMPARISON.
Appendix A:Detailed Methodology and Rationale
TABLE A-1: WEIGHTING OF INDICATORS AND SUB-INDICATORS
AreaMajor Indicator and % of Total Score
Sub-Indicator and % of Total Score
AREA 1: RESOURCES & MEMBERSHIP
20%
1.1: Membership 6.7% 1.1.1: What percentage of public school teachers in the state are union members? 6.7%
1.2: Revenue 6.7% 1.2.1: What is the total yearly revenue (per teacher in the state) of the state-level NEA and/or AFT affiliate(s)?
6.7%
1.3: Spending on education 6.7% 1.3.1: What percentage of state expenditures (of state general funds, state restricted funds, state bonds, and federal “pass-through” funds) is directed to K-12 education?
2.2%
1.3.2: What is the total annual per-pupil expenditure (of funds from federal, state, and local sources) in the state?
2.2%
1.3.3: What percentage of total annual per-pupil expenditures is directed to teacher salaries and benefits?
2.2%
AREA 2: INVOLVEMENTIN POLITICS
20%
2.1: Direct contributions to candidates and political parties
6.7% 2.1.1: What percentage of the total contributions to state candidates was donated by teacher unions?
3.3%
2.1.2: What percentage of the total contributions to state-level political parties was donated by teacher unions?
3.3%
2.2: Industry influence 6.7% 2.2.1: What percentage of the contributions to state candidates from the ten highest-giving sectors was donated by teacher unions?
6.7%
2.3: Status of delegates 6.7% 2.3.1: What percentage of the state’s delegates to the Democratic and Republican conventions were members of teacher unions?
6.7%
AREA 3:SCOPE OF BARGAINING
20%
3.1: Legal scope of bargaining 6.7% 3.1.1: What is the legal status of collective bargaining? 3.3%
3.1.2: How broad is the scope of collective bargaining? 3.3%
3.2: Automatic revenue streams 6.7% 3.2.1: What is the unions’ legal right to automatically collect agency fees from non-members and/or collect member dues via automatic payroll deductions?
6.7%
3.3: Right to strike 6.7% 3.3.1: What is the legal status of teacher strikes? 6.7%
AREA 4:STATE POLICIES
20%
4.1: Performance pay 2.9% 4.1.1: Does the state support performance pay for teachers? 2.9%
4.2: Retirement 2.9% 4.2.1: What is the employer versus employee contribution rate to the teacher pension system?
2.9%
4.3: Evaluations 2.9% 4.3.1: What is the maximum potential consequence for veteran teachers who receive unsatisfactory evaluation(s)?
1.4%
4.3.2: Is classroom effectiveness included in teacher evaluations? If so, how is it weighted? 1.4%
4.4: Terms of employment 2.9% 4.4.1: How long before a teacher earns tenure? Is student/teacher performance considered in tenure decisions?
1.0%
4.4.2: How are seniority and teacher performance considered in teacher layoff decisions? 1.0%
4.4.3: What percentage of the teaching workforce was dismissed due to poor performance? 1.0%
4.5: Class size 2.9% 4.5.1: Is class size restricted for grades 1-3? If so, is the restriction larger than the national average (20)?
2.9%
4.6: Charter school structural limitations
2.9% 4.6.1: Is there a cap (limit) placed on the number of charter schools that can operate in the state (or other jurisdiction) and/or on the number of students who can attend charter schools?
1.0%
4.6.2: Does the state allow a variety of charter schools: start-ups, conversions, and virtual schools?
1.0%
4.6.3: How many charter authorizing options exist? How active are those authorizers? 1.0%
4.7: Charter school exemptions 2.9% 4.7.1: Are charter schools automatically exempt from state laws, regulations, and teacher certification requirements (except those that safeguard students and fiscal accountability)?
1.4%
4.7.2: Are charter schools automatically exempt from collective bargaining agreements (CBAs)? 1.4%

369 HOW STRONG ARE U.S. TEACHER UNIONS? A STATE-BY-STATE COMPARISON.
Appendix A:Detailed Methodology and Rationale
DETAILED METRIC AND RATIONALE
Area 1. Resources and Membership (20%)
This first area captures two quantitative measures of union resources. We examine a
union’s membership rate and revenue to determine the human and financial reserves on
which it can draw, which presumably augments or constrains its influence. While a larger
union (relative to the number of teachers in the state) with more funds is not inherently
more powerful than another, the ability to amass people (to lobby lawmakers, volunteer in
campaigns, sign petitions, and vote in elections) and monies is, in many cases, a precursor
to larger influence. So, then, greater spending on education does not necessarily imply a
strong union (and we have no way of determining whether high spending in a particular
state is the direct result of union influence). However, it is certainly in the unions’—and
their members’—best interest if the state makes a substantial investment in education.
We examine teacher union membership and revenues of each state-level teacher union.
We also examine the financial resources dedicated by the state and its districts to K-12
education in general, and to teacher salaries and benefits in particular.
Indicator 1.1: Teacher union membership (6.7%)
Sub-indicator 1.1.1: What percentage of public school teachers in the state are
union members? (6.7%)
AreaMajor Indicator and % of Total Score
Sub-Indicator and % of Total Score
AREA 5:PERCEIVED INFLUENCE
20%
5.1: Relative influence of teacher unions
4.0% 5.1.1: How do you rank the influence of teacher unions on education policy compared with other influential entities?
4.0%
5.2: Influence over campaigns 4.0% 5.2.1: How often do Democrat candidates need teacher union support to get elected? 2.0%
5.2.2: How often do Republican candidates need teacher union support to get elected? 2.0%
5.3: Influence over spending 4.0% 5.3.1: To what extent do you agree that, even in times of cutbacks, teacher unions are effective in protecting dollars for education?
2.0%
5.3.2: Would you say that teacher unions generally make concessions to prevent reductions in pay and benefits, or fight hard to prevent those reductions?
2.0%
5.4: Influence over policy 4.0% 5.4.1: To what extent do you agree that teacher unions ward off proposals in your state with which they disagree?
1.0%
5.4.2: How often do existing state education policies reflect teacher union priorities? 1.0%
5.4.3: To what extent were state education policies proposed by the governor during your state’s latest legislative session in line with teacher union priorities?
1.0%
5.4.4: To what extent were legislative outcomes of your state’s latest legislative session in line with teacher union priorities?
1.0%
5.5: Influence over key stakeholders
4.0% 5.5.1: How often have the priorities of state education leaders aligned with teacher union positions in the past three years?
2.0%
5.5.2: Would you say that teacher unions typically compromise with policymakers to ensure that their preferred policies are enacted, or typically need not make concessions?
2.0%
Note: Percentages may not add to 100 due to rounding

370 HOW STRONG ARE U.S. TEACHER UNIONS? A STATE-BY-STATE COMPARISON.
Appendix A:Detailed Methodology and Rationale
Membership percentages are drawn from the National Center for Education
Statistics’ Schools and Staffing Survey (2009) for 2007-08. Teachers were asked,
“Are you a member of a teachers’ union or an employee association similar to
a union?” States are ranked and divided into quintiles; those with the lowest
membership ratios receive “0,” while those with the highest membership ratios
receive “4.”
Rationale: If a large proportion of a state’s teachers are unionized, unions can
make a powerful argument to lawmakers that they represent the collective needs
of teachers.2 They are also better able to mobilize a visible and widespread
advocacy force. This is a key source of leverage during policy battles fought at the
ballot box as well as in the state capital; a large membership can lobby lawmakers
and state leaders, volunteer during campaigns, rally and protest, circulate
petitions and collect signatures for ballot measures, canvass and engage in media
campaigns for or against those measures, and mobilize its members to vote.
Indicator 1.2: Teacher union revenue (6.7%)
Sub-indicator 1.2.1: What is the total yearly revenue (per teacher in the state) of
the state-level NEA and/or AFT affiliate(s) (adjusted by the NCES Comparable
Wage Index)? (6.7%)
Revenue data are drawn from state-level teacher unions’ 990 forms submitted
between July 1, 2009 and June 30, 2010, collected by GuideStar, Inc. at www.
guidestar.org. Federally tax-exempt organizations such as unions file 990 forms
with the IRS every twelve months, but their reporting period does not necessarily
coincide with the fiscal year, which begins July 1. We therefore counted 990 forms
that had a start date within the Fiscal Year 2010 period.3 Union revenue (Part I, line
12) includes program service revenue (membership dues, fees from local affiliates,
and support from national unions) plus income from investments, contributions,
grants, and fundraising. Revenues for NEA and AFT state affiliates are combined
when both exist in the same state. (For a full list of state-level affiliates, see
Appendix B.)
We then divide total revenue by the total number of teachers in the state, drawn
from the NCES Common Core of Data for 2009-10. (Unions often argue that they
work on behalf of every teacher in the state, regardless of whether each teacher
pays dues or is a union member.) Dollar amounts are normed against the NCES
Comparable Wage Index from 2005, which adjusts financial data by geographical
2 For more information on the median voter theorem, see Randall G. Holcombe, “An empirical test of the median voter model,” Economic Inquiry 18, no. 2 (1980): 260-274 and Roger D. Congleton, “The Median Voter Model,” in The Encyclopedia of Public Choice (1st edition), eds. C. K. Rowley and F. Schneider, (New York, NY: Kluwer, 2003).
3 The Georgia Federation of Teachers’ 990 forms for FY2010 and FY2009 were not available from GuideStar, nor were FY2010 990 forms for AFT Oregon, AFT Pennsylvania, the Ohio Federation of Teachers, and AFT Utah. Instead, we use Georgia’s FY2008 form, FY2009 forms for Oregon and Pennsylvania, and Ohio’s and Utah’s FY2010 revenues (drawn from the Exempt Organizations Business Master File Extract at www.irs.gov/taxstats; posting data February 2, 2012). Further, the Idaho Federation of Teachers and Tennessee Federation of Teachers are not required to file a standard 990 because their annual incomes fall below $25,000; thus, we count those unions’ incomes as $0.

371 HOW STRONG ARE U.S. TEACHER UNIONS? A STATE-BY-STATE COMPARISON.
Appendix A:Detailed Methodology and Rationale
differences in wages and cost of living in order to better make comparisons across
states.4
States are ranked and divided into quintiles; those with the lowest revenue per
teacher receive “0,” while those with the highest revenue per teacher receive “4.”
Rationale: Like membership, a large yearly income does not ensure a strong
teacher union. But it does allow a teacher union to invest in political campaigns,
advocacy, and public relations (among other activities). We acknowledge that local
affiliates sometimes play a role in state politics, especially in large urban districts
such as Chicago, New York City, and Los Angeles. But we do not include their
revenue here because doing so risks double-counting: State unions usually do not
collect dues directly from teachers. Rather, local unions collect dues, then direct a
portion of that money to the state (and national) affiliate. We account for locals’
financial capital by including their direct contributions to political campaigns and
parties in Area 2.
Indicator 1.3: Spending on education (6.7%)
Sub-indicator 1.3.1: What percentage of the state’s total expenditures (of state
general funds, state restricted funds, state bonds, and federal “pass-through”
funds) go toward to K-12 education? (2.2%)
We report state spending on K-12 education as a portion of total state
expenditures. These funds are derived from four sources: state general funds, state
restricted funds, state bonds, and federal funds for education passed through
a state to its districts. Data are drawn from the National Association of State
Budget Officers’ State Expenditure Report (2010). We average the 2009, 2010, and
projected 2011 percentages.5
States are ranked and divided into quintiles; those with the smallest proportions
of expenditures on K-12 education receive “0,” while those with the largest
proportions receive “4.”
Rationale: A state is responsible for distributing money to K-12 education from
two sources. First, it allocates its own funds (the state general fund and state
restricted funds specifically earmarked for education and/or specific education
programs) to provide districts with general formula assistance, as well as
money for compensatory programs, special education, vocational programs,
and transportation. These funds are also used for expenses not affiliated with
4 See the National Center for Education Statistics, http://nces.ed.gov/pubsearch/pubsinfo.asp?pubid=2006865.
5 We include two important notes to the reader when interpreting this indicator. First, the National Association of State Budget Officers (NASBO) asked states to report K-12 education expenditures as a portion of state general, state restricted, state bond, and federal pass-through funds. However, K-12 spending is sometimes reported in relation to the state operating budget, which does not include restricted or capital project funds. K-12 expenditures as a portion of the operating budget will be larger than those same expenditures as a portion of total funds, as reported here. Second, “operating expenditures” are self-reported by the states. NASBO indicated that states should include employer contributions to current employees’ pensions and health benefits, student transportation, adult literacy programs, handicapped education programs, gifted and talented programs, vocational education, capital spending, and expenditures to support the state’s department of education. However, some states excluded (in whole or part) certain types of expenditures. For more information, see the National Association of State Budget Officers, “State Expenditure Report 2010,” http://www.nasbo.org/publications-data/state-expenditure-report.

372 HOW STRONG ARE U.S. TEACHER UNIONS? A STATE-BY-STATE COMPARISON.
Appendix A:Detailed Methodology and Rationale
districts, such as charter schools, voucher programs, and state-level department
of education operations and administration. Second, the state is responsible for
passing federal funds on to districts; these funds are for compensatory (Title I)
programs, special education, and nutrition (free- and reduced-price federal lunch
programs). Districts, in turn, receive these state allocations, plus local funds and
direct federal aid.
Indicator 1.3.1 measures the state to district funding channel—state general
funds, state restricted funds, and federal money passed through the state. Many
competing forces affect the amount that a state spends on education: States
have multiple financial obligations, and state political leaders, voters, and interest
groups all influence how much money the state allocates to education and to other
areas of its budget. As labor organizations, teacher unions work to protect and
further the interests of their members within an employment context—securing
dollars for K-12 education (or at least preventing or minimizing cuts) is a first step
toward higher salaries, better benefits, smaller class sizes, fewer layoffs or furlough
days, and better working conditions for teachers. To that extent, one measure of
union strength is its ability to influence state leaders to direct a large proportion of
overall expenditures toward K-12 education.
It is well known that some states opt to shoulder more of the K-12 budget
themselves, reducing the local share. We address this by including local funds in
sub-indicators 1.3.2 and 1.3.3. We also acknowledge that a large percentage of
overall expenditures directed to K-12 education might not translate into a high
dollar amount for K-12 education, if the state does not spend much money overall.
Indicator 1.3.1 reflects the way a state prioritizes education spending with respect
to its other financial obligations. Indicator 1.3.2 (below) captures the actual dollars
spent per pupil, and 1.3.3 indicates what percentage of those dollars goes to
teacher salaries and benefits.
Sub-indicator 1.3.2: What is the total annual per-pupil expenditure (of funds from
federal, state, and local sources) in the state (adjusted by NCES Comparable Wage
Index)? (2.2%)
Per-pupil expenditure data are drawn from the National Center for Education
Statistics’ (NCES) National Public Education Finance Survey (2011) for 2008-09.
NCES reports expenditures by all the Local Education Agencies (LEAs) in the state
on instruction and instruction-related activities (salaries and benefits for teachers
and teaching assistants, teacher training, instructional supplies, curriculum
development, student assessment, instructional technology, and libraries), student
support (guidance, social work, attendance, health and psychological services,
speech pathology, and audiology), administration (at the district and school level),
and operations (facilities, maintenance, transportation, and food services). It does
not include expenditures on capital outlay, interest on long-term debt, or programs
not part of public elementary and secondary education such as adult education,
community colleges, private schools, and community services. NCES then divides

373 HOW STRONG ARE U.S. TEACHER UNIONS? A STATE-BY-STATE COMPARISON.
Appendix A:Detailed Methodology and Rationale
total expenditures by the number of students in the state.
Dollar amounts are normed against the NCES Comparable Wage Index from 2005,
which adjusts financial data by geographical differences in wages and cost of
living in order to better make comparisons across states.
States are ranked and divided into quintiles; those with the smallest per-pupil
expenditures receive “0,” while those with the largest per-pupil expenditures
receive “4.”
Rationale: Districts spend funds received from three principal sources: state
allocations of state and federal money (as described in indicator 1.3.1), direct
federal aid, and local funds.9 District expenditures are reported as total per-pupil
spending (total expenditures divided by the number of students).
While 1.3.1 captures the way a state prioritizes education in relation to its other
financial obligations, 1.3.2 reflects the actual dollars spent by LEAs on educating
students. In general, teachers benefit from higher per-pupil expenditures: More
dollars per student can translate into higher teacher salaries and benefits, smaller
class sizes, greater spending on instructional programs, materials, support staff,
and other potential improvements to teacher capacity, working conditions,
and resources. A union that can generate high per-pupil expenditures is indeed
strong.10 This sub-indicator reflects that ability (as well as other influences on per-
pupil spending). Further, unlike 1.3.1 above, this indicator includes local monies,
which is important since state unions also lobby for increases in local funds (for
example, pressuring the state to allow counties to enact property taxes or raise
local sales taxes). Also, some states do not invest heavily in education because
local districts do; this indicator captures that.
Still, while higher per-pupil expenditures likely create favorable working conditions
for teachers, they do not necessarily translate into greater spending on teacher
salaries and benefits—data that comprise our next indicator.
Sub-indicator 1.3.3: What percentage of total annual per-pupil expenditures is on
teacher salaries and benefits? (2.2%)
Data for 2008-09 are drawn from the National Center for Education Statistics’
National Public Education Finance Survey (2011), Tables 2 and 9.11 States are ranked
and divided into quintiles; those with the smallest percentages receive “0,” while
those with the largest percentages receive “4.”
9 Data provided to authors by staff at the National Institute on Money in State Politics, 2011.
10 Recall that state and national teacher unions are not technically unions—they do not have bargaining rights—but, rather, trade associations called “unions” by convention. Depending on state law, true unions (such as local teacher unions) are allowed to donate to state candidates and parties directly.
11 State unions may donate to PACs and interest groups with ideological or single-issue missions, using money from member dues and agency fees. Some question the legality of such donations, given that members’ dues are ultimately being used for political purposes without members’ direct consent. Unions maintain that these contributions fall under the umbrella of their advocacy work.

374 HOW STRONG ARE U.S. TEACHER UNIONS? A STATE-BY-STATE COMPARISON.
Appendix A:Detailed Methodology and Rationale
Rationale: As labor organizations, teacher unions seek to ensure (and protect)
competitive pay commensurate with similarly-educated professionals in other
industries. Therefore, one potential indicator of union strength is the degree to
which K-12 expenditures in a state are directed to teacher salaries and benefits.
At first glance, indicator 1.3.3 reflects what appears to be a district-level rather
than a state-level decision. In all but five states (and the District of Columbia),
salaries are within the scope of bargaining between local districts and their unions.
Benefits are within the scope of bargaining in all but seven. Still, state unions
play an important role in how districts allocate money. First, they impact state
policy on, among other areas, retirement (including employer contributions to
pensions, retirement age, and benefits), class size (which in turn affects district
staffing ratios), and statewide cost-of-living adjustments to teacher salaries. All of
these, in turn, affect how many teachers a district hires and how much it spends
on their salaries and benefits. Second, state unions devote much time and energy
at the local level, advising their affiliates during negotiations (or even conducting
negotiations on their behalf). High allocations for teacher salaries and benefits
at the local level can therefore reflect a strong state union that is equipped—and
motivated—to help its local affiliates.
Area 2. Involvement in Politics (20%)
This category measures ways in which a state union might influence state laws, policies,
and budgets. Many forms of influence are impossible to quantify and compare, so most of
the data in this category represent teacher unions’ financial contributions to candidates
and political parties, capturing their influence among state lawmakers, executives such as
the governor, and education leaders (should these be elected officials in that particular
state). We also measure union representation in a state’s delegation to the Republican and
Democratic national conventions.
But first, a brief explanation of how state elections are financed is in order. (See A Lesson
in Campaign Finance sidebar for details on union political spending in general and during
elections in particular.) Campaign funds can be divided into two categories, depending
on the source: “inside money” and “outside money.” The former refers to funds provided
by the candidate himself, donations from individuals to the candidate’s political action
committee (PAC), and contributions from political parties. The latter refers to donations
from external PACs, lobbyists, interest groups, and (depending on state election laws)
labor unions and corporations. Between 2003 and 2010, inclusive, candidates for state
office raised over $8 billion, with about 36 percent originating from “outside money”
(from state to state, outside money ranged anywhere from 5 percent to 60 percent of
candidates’ total finances).12 Likewise, political parties are funded by “inside money”—in
this case, donations to parties’ PACs from individuals—and “outside money” (see above).

375 HOW STRONG ARE U.S. TEACHER UNIONS? A STATE-BY-STATE COMPARISON.
Appendix A:Detailed Methodology and Rationale
We know that unions devote a lot more resources to politics than the amount they and their PACs donate during elections. Campaign finance law makes it possible to compare union donations with those from other organizations to (very roughly) gauge their relative influence OR to get a (somewhat) complete idea of what unions, but not any other organization, spend on all political activities—but not both. We chose the former. Here’s why, and here’s what we’re missing.
What Is Political Spending?There are five general types of political spending. First, individuals and groups may make direct donations to state candidates, political parties, and ballot measures. Second, individuals and groups use independent expenditures to fund electioneering—for example, an advertising campaign on behalf of a candidate. Third, organizations engage in member communications to relay endorsements and policy positions to members and to mobilize members to volunteer and vote. Finally, organizations spend on non-electoral politics—activities like rallies, letter-writing campaigns, and petitions. Such expenditures are lobbying if they are related to a specific piece of legislation and advocacy if they support general union interests. What Are State Teacher Unions Allowed and Not Allowed to Do?As a federal tax-exempt nonprofit organization, a state union is not allowed to “influence the selection, nomination, election, or appointment of any person to any Federal, state, or local public office or to an office in a political organization.” As such, it cannot endorse candidates, donate to candidates or parties (or candidate and party PACs), or distribute campaign materials for or against a particular candidate via electioneering.6 The only way a state union can participate in partisan politics is through member communications—that is, it may encourage its members to vote a certain way or mobilize them on behalf of a candidate. Otherwise, its efforts must be non-partisan: It can lobby for or against issues (so long as it does not connect those issues to candidates) and give money to ideological/single issue PACs and advocacy groups that are not connected with candidates or parties. It can also advocate on its members’ behalf. Funds for these activities come from member dues (and agency fees, in states where they are legal).7
How Do We Track Union Political Spending?There are two ways to track union spending on state politics. Candidates and parties file recipient disclosures with their state’s election agency, listing how much money they receive and from whom. Although the details of disclosures vary from state to state, they are a fairly uniform way of both tracking donations (not just from unions but from all individuals and groups) and comparing a union’s share of donations with those from other sources across states. For these reasons, we use recipient disclosures in our calculations. However, the disadvantage is that disclosures capture only direct donations from unions but not all political spending by them. They don’t include independent expenditures by the union-connected PAC, nor do they include spending on member communications, lobbying, or advocacy by the union itself.
A LESSON IN CAMPAIGN FINANCE
6 Some also receive monies from non-public sources, such as grants from philanthropic organizations or private donations—although tracking and comparing these funds among states is difficult (or in some cases, impossible) because of the variation in state accounting policies.
7 Further, the inclusion of sub-indicator 1.3.2 is premised on research showing that strong state teacher unions do help increase district per-pupil expenditures. See Michael Berkman and Eric Plutzer, Ten Thousand Democracies (Washington, D.C.: Georgetown University Press, 2005).

376 HOW STRONG ARE U.S. TEACHER UNIONS? A STATE-BY-STATE COMPARISON.
Appendix A:Detailed Methodology and Rationale
Between 2003 and 2010, parties raised $1.6 billion, nearly equally divided between inside
and outside sources. This inside-outside distinction is important as it applies to our
indicators below.
Indicator 2.1: Direct contributions to candidates and political parties (6.7%)
Sub-indicator 2.1.1: What percentage of total contributions to state candidates was
donated by teacher unions? (3.3%)
Sub-indicator 2.1.2: What percentage of the total contributions to state-level
political parties was donated by teacher unions? (3.3%)
A LESSON IN CAMPAIGN FINANCE
The other way to track union spending on state politics is through expenditure reporting. While these reports give a more complete picture of political spending, they do not allow us to compare unions to other organizations, nor do they allow us to compare unions across states (because precise reporting requirements vary). For example, in forty-four states, individuals and organizations (such as the union-connected PAC) must report independent electioneering expenditures to state election agencies. But what gets reported and when is roughly comparable in only twenty states. The IRS also requires expenditure reporting: Federal tax-exempt nonprofits, state unions included, must file their lobbying expenses (usually spent on advertising, rallies, and consultants) plus donations to ideological/single issue PACs. But these are simply line-items, not traceable to a particular recipient or activity. We also can’t use IRS reports to compare union spending to that of organizations which are not nonprofits. And neither the state-agency reports nor the IRS reports include all types of political spending.
There is one type of expenditure report that does include all political spending: that required by the U.S. Department of Labor. Unfortunately, only unions must file these, so we cannot compare union political spending to that of any other organization in the state. And again, expenditures are line-items, so we cannot trace them to a particular recipient or activity.8
8 The Census Bureau, which collects fiscal data on behalf of NCES, cautions that “the characteristics of elementary-secondary school finance data are influenced by accounting requirements mandated by each state education agency. The level of financial detail that school systems must maintain varies from state to state. Different state financing methods, such as making payments on behalf of school systems to fund teacher retirement, and the use of different accounting handbooks also cause variation.” However, they take great care to make adjustments to improve accuracy and comparability across states. See http://www.census.gov/govs/school/ for further details.
12 The Department of Labor requires unions with more than $250,000 in annual receipts to report donations and lobbying expenditures (the same information that they file with the IRS), plus the cost of member communications and advocacy and any internal expenses associated with political activities—for example, the salaries of union employees who engage in member mobilization or money spent organizing a pro-labor rally. By including member communications and advocacy, these reports capture two crucial ways that unions influence elections and policy writ large. While we cannot compare unions to other organizations, a recent Wall Street Journal report found that donations and lobbying account for only a small share of union political spending compared to member mobilization and advocacy. Even the AFT agreed, arguing that given its mission of organizing and activism, it will naturally spend money on these activities. See: Tom McGinty and Brody Mullins, “Political Spending by Unions Far Exceeds Direct Donations,” Wall Street Journal, July 10, 2012; Jeff Hauser, “Wall Street Journal Compares Union Political Spending to Corporate Donations,” AFL-CIO, July 10, 2012.

377 HOW STRONG ARE U.S. TEACHER UNIONS? A STATE-BY-STATE COMPARISON.
Appendix A:Detailed Methodology and Rationale
For sub-indicators 2.1.1 and 2.1.2, data are drawn from the National Institute
on Money in State Politics, which collects recipient disclosure forms.13 These
forms report direct union-to-candidate and union-to-party donations (including
donations from union-connected PACs), but they do not include other types of
political spending.14 We aggregate union donations for the campaign seasons
between 2003 and 2010, inclusive.15
To calculate 2.1.1, for each state, we combine direct contributions from any
national, state, or local teacher union and their connected PACs to all candidates
running for state office, including those running for governor, legislature, high and
appellate court, state executive (attorney general, treasurer, secretary of state,
etc.), and education leadership positions (state board of education and chief state
school officer). Total union donations to candidates are then divided by the total
contributions to candidates (both inside and outside sources).
To calculate 2.1.2, for each state we combine direct union contributions from any
national, state, or local teacher union and their connected PACs to political parties
in that state. We then divide by the total contributions to parties (both inside and
outside sources).
States are ranked and divided into quintiles; those states in which teacher unions
gave the smallest percentages of all contributions receive “0,” while those in which
teacher unions contributed the largest percentages of all contributions receive “4.”
Rationale: Political giving is a key way that unions support candidates who align
with their interests, handicap candidates who do not, and encourage incumbent
candidates to remain true to their campaign promises. If a significant proportion of
donations to candidates and parties come from teacher unions via their connected
PACs, those unions can act as key political players and possess significant sway.
We include candidate and party donations as separate indicators because states
often strictly limit direct PAC-to-candidate donations. But union-connected PACs
can also support candidates indirectly by donating to parties instead; most state
laws make this an appealing option because PAC-to-party and party-to-candidate
13 The National Institute on Money in State Politics collects campaign finance reports filed by candidates to state (but not to local) office. As such, we could not calculate sub-indicators 2.1.1, 2.1.2, and 2.2.1 for Washington, D.C.
14 Union-connected PACs register their affiliations with state election agencies, and we include donations from them in union-to-candidate and union-to-party contributions. But state unions are free to support any ideological/single-issue PAC they choose, and campaign finance law does not permit us to track those dollars—thus, they are not included here.
15 By including these eight years, we were able to capture two presidential-election seasons—though national-level contributions were not included in our measures, presidential-election seasons tend to be more active politically at the state level—as well as two off-year elections for the majority of states. In some states, state elections occur in odd years, rather than in even years; and in other states, state elections are held every single year. By adding contributions across all eight years and then dividing, we ensured that we did not unfairly weight states with different election cycles.

378 HOW STRONG ARE U.S. TEACHER UNIONS? A STATE-BY-STATE COMPARISON.
Appendix A:Detailed Methodology and Rationale
caps are much less tight than PAC-to-candidate limits.16 Unions may also contribute
to parties for reasons other than indirect candidate support. By including
donations to candidates and parties as two separate measures, we present a more
accurate (although, admittedly, still incomplete) picture of union spending on
elections.
A note on the donors: For these indicators (and 2.2.1, below), we count donations
to state-level candidates and parties from state-level unions and their connected
PACs, plus those from national and local unions. Local unions are affiliated with
their state union, and state unions with their parent national association; as such,
they frequently have similar political interests. Local and national unions may be
motivated to enter state politics to bolster general union interests at the state level
and/or if state issues are of particular importance to local districts.
A note on the recipients: For indicator 2.1.1 (and 2.2.1, below), we include
candidates to all state offices rather than only education positions because every
state leader has a hand in influencing, and in some cases virtually dictating, a
state’s education policy agenda—see the state profiles for countless examples.
Further, in no state are both the board and chief school officer elected. In some
states, the chief school officer is elected; in others, he is appointed by the
governor; and in still others, he is appointed by the board. Likewise, in some states,
the board itself is elected; in others, it is appointed by the governor. By including
contributions to all candidates for state office, we take this into account.
A note on the results: Observers may find that the percentages we report for
these sub-indicators are sometimes dubiously small. In thirty-three states, for
example, unions gave less than 1 percent of the total funds received by candidates
for state office. These small percentages belie the fact that “inside money”—from
the candidate’s party PAC, his own PAC, and his personal funds—accounts for a
significant percentage of candidate and party funds. (Nationally, 64 percent of
candidate campaign funds were inside money, while 36 percent were outside.) We
include inside money in 2.1.1 and 2.1.2 to measure the union’s role in the election
writ large, but we excluded it in 2.2.1, as indicated below.
Finally, due to time and resource limitations, we did not investigate more nuanced
data such as union contributions to winning candidates or union attempts to force
out one candidate by supporting his or her opponent. Rather, these indicators
gauge the unions’ overall presence in state-level political activity.17
16 Parties can donate much more to candidates than can PACs. In twenty-two states, there are no (or virtually no) limits on party-to-candidate donations, and in twenty states, the party-to-candidate limit is at least twice (but up to one hundred times) higher than the PAC-to-candidate limit. PAC-to-candidate and party-to-candidate limits are the same in only eight states. In addition, PACs can easily donate much more to parties than they can to candidates. In twenty-eight states, there is no PAC-to-party limit. In most others, the PAC-to-party limit is two- to five-times higher than the PAC-to-candidate limit.
17 Research shows, however, that teacher union endorsement does increase a candidate’s chance of winning, at least in school board elections. See Terry M. Moe, “Political Control and the Power of the Political Agent,” Journal of Law, Economics, & Organization 22, no. 1 (2006): 1-29.

379 HOW STRONG ARE U.S. TEACHER UNIONS? A STATE-BY-STATE COMPARISON.
Appendix A:Detailed Methodology and Rationale
Indicator 2.2: Industry influence (6.7%)
Sub-indicator 2.2.1: What percentage of the contributions to state candidates from
the ten highest-giving sectors was donated by teacher unions? (6.7%)
Data are drawn from the National Institute on Money in State Politics. As in sub-
indicator 2.1.1, for the campaign seasons between 2003 and 2010 (inclusive), we
combine direct contributions in each state from any national, state, or local teacher
union and their affiliated PACs to state-level candidates. We compare total union
donations with the contributions from the ten highest-giving outside sectors in
the state, where a sector is defined as a group of organizations within the same
donor class—for example, energy producers, attorneys and law firms, construction
unions, chambers of commerce, etc. Sectors are assigned by the National Institute
on Money in State Politics and are closely modeled after designations used by the
federal government for classifying industry groups. Where teacher unions are one
of the top ten sectors in a given state, the eleventh-ranked sector is included as
well.
The highest-giving sectors do not include any source of “inside money” (state
party committees, candidate PACs, and personal candidate funds).
States are ranked and divided into quintiles; those states in which teacher unions
have the smallest contributions relative to the top ten sectors receive “0,” while
those in which teacher unions have the largest relative contributions receive “4.”
Rationale: Here we compare contributions from teacher unions against the
highest-giving sectors in the state. The sectors compete with one another for
resources, benefits, and the attention of policymakers (among other things) at
the state level, hoping that legislators will prioritize their interests and allocate
accordingly. We exclude donations from parties and candidate PACs (whose
purpose is candidate-driven rather than interest-oriented) to measure how
powerful teacher unions are relative to other interest groups. We can also ascertain
whether political activity is concentrated among a few power players in a given
state. As sectors compete over the entire legislative agenda, if unions are big
donors compared to other interests, they can nudge education policy toward the
top of a legislator’s or governor’s agenda; this is a sign of a strong union.
One additional note: In indicators 2.1.1, 2.1.2, and 2.2.1, we do not include
teacher union contributions to ballot measures. Although ballot measures are
an important vehicle through which teacher unions can help enact (or stop)
legislation aligned with their interests, states vary wildly in the way that ballot
measures are proposed, certified, and voted on—and some states do not allow
them at all. Hence, we could not compare this aspect fairly across states, and
we do not include it in the metric. Nor can we include electioneering, member
communications, lobbying, and advocacy expenditures by unions and their PACs,
because campaign finance law prohibits us from tracking and comparing these

380 HOW STRONG ARE U.S. TEACHER UNIONS? A STATE-BY-STATE COMPARISON.
Appendix A:Detailed Methodology and Rationale
data (see sidebar: A Lesson in Campaign Finance). However, we acknowledge that
there are other channels through which unions exert political influence, and in our
state profiles, we note instances in which the unions were particularly involved
in politics (such as supporting a ballot measure, lobbying or electioneering, or
turning to the courts to stop a piece of legislation) in ways not captured by our
indicators.
Indicator 2.3: Status of delegates (6.7%)
Sub-indicator 2.3.1: What percentage of the state’s delegates to the Democratic
and Republican National Conventions were members of teacher unions? (6.7%)
Data are drawn from the Inter-university Consortium for Political and Social
Research’s 2000 Convention Delegate Survey. Democratic and Republican
convention percentages are averaged for each state. States are ranked and divided
into quintiles; those states in which teacher union members represent the smallest
percent of delegates receive “0,” while those in which they represent the largest
percent receive “4.”
At the time of publication, the 2000 Convention Delegate Survey was the most
recent report in which such detailed data were available in forms that met rigorous
standards. The 2000 survey is routinely used by researchers in work similar to
ours. In addition, 2008 data provided by the Democratic National Committee
were highly correlated with the reliable figures from 2000. We did not use the
2008 figures because they did not have information on Republican delegates and
contained some errors and ambiguities. As of yet, no data have been released
regarding delegates to the 2012 conventions. And, to our knowledge, there are
no comparable data on delegates to state-level conventions (which not all states
have).
Rationale: If teacher unions represent a vital constituency to one party (or both),
those unions will have greater sway over public officials—legislators, education
leaders and state school board members, and the governor—and over the
decisions that they make. Examining a state’s proportion of national convention
delegates who are teacher union members is one proxy for measuring how vital
a constituency the unions are to their respective parties in that state; and, in turn,
this measurement can illustrate the influence that unions have over politics in
general, particularly in ways not captured by direct donations (see Indicator 2.1).
Area 3. Scope of Bargaining (20%)
This area links union strength to state laws directly related to collective bargaining. Like
many analysts, we see bargaining status as a measure of union strength: In some states,
teachers are not permitted by law to bargain collectively with their employers. In others,
such bargaining is permitted but not required by state law. In still others, it is mandatory.
We also include the legality of agency fees and other payroll deductions for dues as
measures of unions’ strength—barring unions from collecting agency fees from non-

381 HOW STRONG ARE U.S. TEACHER UNIONS? A STATE-BY-STATE COMPARISON.
Appendix A:Detailed Methodology and Rationale
member teachers and/or from automatically deducting dues from the paychecks of their
members cuts off key sources of union revenue. We examine these areas, as well as the
scope of bargaining and the legality of teacher strikes.
Indicator 3.1: Legal scope of bargaining (6.7%)
Sub-indicator 3.1.1: What is the legal status of collective bargaining? (3.3%)
Data are drawn from the National Council on Teacher Quality’s Teacher Rules,
Roles, and Rights (TR3) database, accessed in February 2012. For the TR3
indicator listed as “legality of collective bargaining,” a state receives “0” for
“collective bargaining is explicitly illegal,” “2” for “collective bargaining is
permissible” (meaning state law either explicitly permits bargaining or implicitly
allows it by not addressing bargaining at all), or “4” for “state requires collective
bargaining.”
Rationale: While it is at the discretion of the teachers in a given district whether
they want to organize, in mandatory-bargaining states, the district must recognize
such an organization as a union and negotiate a binding contract with it per
teachers’ request. (And in mandatory-bargaining states, an average of 75 percent
of districts operate under such contracts.)18 In permitted-bargaining states, the
district can decide whether to recognize the teacher association as a union or
not and then bargain with it; in prohibited states, teachers may still organize into
employee associations, but districts may not recognize them as bargaining units or
negotiate binding contracts with them.
The ability of teacher unions to engage in collective bargaining is an obvious and
powerful gauge of state union strength because mandatory bargaining means
unions at all levels have more resources. Not only is mandatory bargaining apt
to bring increased membership and revenue, it also gives teacher unions status,
which gives weight to their lobbying and advocacy campaigns and increases the
receptivity of state policymakers to their efforts. If teacher unions are a strong
presence in the state in general, they can better use their political muscle to
influence state policy.
18 National Center for Education Statistics Schools and Staffing Survey (SASS) 2007-08, Table 7, http://nces.ed.gov/surveys/sass/tables/sass0708_2009320_d1s_07.asp.

382 HOW STRONG ARE U.S. TEACHER UNIONS? A STATE-BY-STATE COMPARISON.
Appendix A:Detailed Methodology and Rationale
Sub-indicator 3.1.2: How broad is the scope of collective bargaining? (3.3%)
Data are again drawn from the National Council on Teacher Quality’s TR3
database, accessed in February 2012.19 A state’s overall score represents its average
across twenty-one potential elements that could be collectively bargained.
The twenty-one provisions are wages; hours; terms and conditions of employment;
grievance procedures; management rights; probationary period (tenure); transfer/
teacher reassignment; layoffs/reduction in force; dismissal; evaluation process/
instruments; insurance benefits; pension/retirement benefits; fringe benefits;
leave; length of the teacher school year; course content, curriculum, and textbook
selection; class load; class size; length of preparation periods; number of parent
teacher conferences; and extracurricular duties.
Each provision is scored according to its bargaining status. Provisions receive “0”
if bargaining over that provision is explicitly prohibited, meaning that the district
may decide that issue unilaterally without negotiations or the state can impose the
provision on its districts. In states that do not allow collective bargaining at all, all
provisions are scored “0.” Provisions that receive scores of “1,” “2,” or “3” are open
to negotiation between local districts and unions, to varying degrees. Areas are
scored with “1” if “there is no state statute regarding collective bargaining,” and
thus all provisions are implicitly within the scope of bargaining. The area is scored
“2” if bargaining in general is allowed but that specific provision is “not addressed
in state law or administrative code.” The issue receives “3” if it is explicitly a
“permissive subject of bargaining,” meaning districts may (but do not have to)
bargain it. Finally, contract provisions are scored “4” if they are a “mandatory
subject of bargaining,” meaning that a district must negotiate it with its teacher
union.20
Rationale: The fewer items that a state or district can impose unilaterally, the more
leverage the union has. The twenty-one items included here, while not all of equal
importance in the eyes of teacher unions, provide a snapshot of that leverage for
teacher unions across our fifty-one jurisdictions.
19 NCTQ notes, “The data represent a comprehensive analysis of state statutes. We do not systematically include other sources of legal authority, such as case law, attorney general opinions, or decisions made by labor relations boards. Where we know of relevant case law on an issue we include it, but the exhaustive nature of case law precluded a systematic search. References to case law that are found in the database have been generously provided to us by the National Education Association.” As such, NCTQ does not consider policies that cover an entire state which are not enacted into law. The difference between statute and policy is semantic because state leaders must use statute in order to mandate policies at the district level—except in Washington, D.C. There, the state, city, and district are concurrent—and only in recent years has there even been a “state” office of education. As such, education policy can be mandated in one of three ways: via D.C. code (passed by the City Council and approved by the United States Congress); through D.C. Municipal Regulations (rules and regulations from the city’s executive and administrative agencies); and by the chancellor of D.C. Public Schools (the District of Columbia Public Education Reform Amendment Act of 2007, part of D.C. code, states that “The Mayor shall govern the public schools of the District of Columbia” (Section 105.a) and “DCPS shall be administered by a Chancellor” whose duties are outlined in Section 105.c). (Only in Washington, D.C. does municipal code (enacted by the City Council) cover the same geographical area as state code.) Thus, for all indicators in Area 3, as well as Area 4, we consider policy mandates from all three sources, not only those codified by D.C. law. As such, we modified NCTQ’s data for Washington, D.C.; we also made minor changes to their data to correct for errors.
20 If a state prohibits bargaining, or if there is no state statute regarding collective bargaining, we cannot disaggregate the scope of bargaining by provision. This is noted where relevant in the state profiles.

383 HOW STRONG ARE U.S. TEACHER UNIONS? A STATE-BY-STATE COMPARISON.
Appendix A:Detailed Methodology and Rationale
Indicator 3.2: Automatic revenue streams (6.7%)
Sub-indicator 3.2.1: What is the unions’ legal right to automatically collect agency
fees from non-members and/or collect member dues via automatic payroll
deductions? (6.7%)
Data are again drawn from the National Council on Teacher Quality’s TR3
database, accessed in February 2012.
For the TR3 indicator listed as “agency fees permitted,” a state receives “0”
for “no” or “collective bargaining prohibited,” “2” for “neither authorized, nor
prohibited,” or “4” for “yes.”21
Rationale: Automatically collecting revenue is a vital way that a union can build
large reserves of funds and amass dollars to spend on political campaigns and
advocacy. There are two available streams of automatic revenue: agency fees and
member payroll deductions.
In any state, any teacher may decide that he or she does not want to belong to the
local union. Unions argue, however, that they represent all employees in a district
whether those individuals all choose to be union members or not—for example,
all district teachers, not just union members, benefit if the union negotiates for
higher teacher salaries. Unions therefore face a problem: If teachers choose not to
be members (and, therefore, do not have to pay membership dues), they receive
the benefits of union representation without having to pay for such benefits. And
if enough teachers choose not to be members, the union is forced to operate
with little revenue.22 To address this issue, the law in some states permits unions
to automatically charge “agency fees” to non-member teachers. Even if a teacher
opts not to belong to the local union, that union can still deduct the agency fees
from the teacher’s paycheck, thereby securing its revenue.23
State law may also prohibit unions from automatically deducting dues from the
paychecks of teachers who are union members. Instead, members must authorize
such deductions, and reauthorize them periodically as the law requires. Should
a member choose not to authorize those deductions, the union can still charge
them dues, but has no way of actually collecting them. Recently, lawmakers have
enacted (or failed in the attempt to enact) measures prohibiting automatic payroll
deductions as a way to curtail union power in states where agency fees are legal.
21 NCTQ included in its variable for “agency fees permitted” whether or not unions can charge agency fees to non-members and whether they can automatically deduct dues from the paychecks of its own members. The question included in sub-indicator 3.3.1 reflects both of these conditions, although the variable name used by NCTQ does not.
22 This is the classic “free-rider problem,” a familiar concept in labor economics, psychology, and political science.
23 Agency fees are one part of states’ right-to-work legislation. “Right-to-work” specifically means that union membership cannot be a condition of employment. As such, right-to-work status dictates that a union cannot automatically charge all teachers membership dues because not all teachers need be union members. However, there is a legal loophole that would still allow a local union to collect money from all teachers in a district: charge dues to its members, and automatically collect so-called “agency fees” from the paychecks of non-members. Right-to-work states close this loophole by prohibiting agency fees. While right-to-work and prohibiting agency fees are in spirit the same concept (and are often used interchangeably), we refer to agency fees specifically because they are a source of union revenue.

384 HOW STRONG ARE U.S. TEACHER UNIONS? A STATE-BY-STATE COMPARISON.
Appendix A:Detailed Methodology and Rationale
Indicator 3.3: Right to strike (6.7%)
Sub-indicator 3.3.1: What is the legal status of teacher strikes? (6.7%)
Data are drawn from the National Council on Teacher Quality’s TR3 database,
accessed in February 2012. For the TR3 indicator listed as “can teachers strike,” a
state receives “0” for “no,” “2” for “neither authorized, nor prohibited,” or “4” for
“yes.”
Rationale: Where teachers can legally strike, their unions have the benefit of a
straightforward and powerful method of publicly protesting unfavorable policies.
Of course, teachers do sometimes strike in states that do not legally permit
it—which may reflect an even stronger and bolder teacher union. But because
such cases are difficult to evaluate systematically, we limit this sub-indicator to
identifying state-level policies regarding striking. (We recognize another limitation,
too: Some public-employee strike laws pre-date teacher unionization.)
Area 4. State Policies (20%)
This area measures teacher union strength as the degree of alignment between state-
level education policies (as of late 2011) and traditional union interests. The indicators
address two types of policies in which unions have shown considerable interest: teacher
employment rules and charter school laws. The former relate to teacher evaluations,
tenure, layoffs, class size, pensions, and performance pay. The latter include laws related
to the allowable number and types of charter schools, the ease with which they are
authorized, and whether or not charters are exempt from state laws (including teacher
certification requirements), district regulations, and collective bargaining agreements.
The indicators take a neutral stance on the policies themselves; the metric assumes
that teacher unions will take a particular stance on each of them, however, and simply
measures the extent to which an established policy aligns or does not align with that
stance. The indicator does not rank the state policy against a normative standard of
whether it is “good” or “bad.” We’re mindful that not all teacher unions share the same
stance on the same issues at the same time. But while some state unions may take a more
nuanced view toward certain policies, teacher unions exist to act in the interest of their
members; hence, most teacher unions will react to policies in similar ways.
The inclusion of these policies in our metric does not necessarily mean that teacher unions
shaped (or failed to shape) them. Even if union-favored policies are not directly linked
with union activity, a favorable policy climate nevertheless helps to protect the union and
its interests. For example, if state policy constrains charter schools, teacher unions need
not fear that district schools—their members’ principal employers—will lose much market
share to charters. Even if the union did not influence the policy, it and (it presumes) its

385 HOW STRONG ARE U.S. TEACHER UNIONS? A STATE-BY-STATE COMPARISON.
Appendix A:Detailed Methodology and Rationale
members benefit from that policy—and preserving the status quo is generally much easier
than changing it.24
Indicator 4.1: Performance pay (2.9%)
Sub-indicator 4.1.1: Does the state support performance pay? (2.9%)
Data are drawn from the National Council on Teacher Quality’s 2011 State Teacher
Policy Yearbook. Indicator 4-F.2 asks, “Do states support performance pay?” A
state receives “0” for “performance included in salary schedule for all teachers”;
“1” for “performance bonuses required to be available to all teachers”; “2” for
“performance pay permitted/encouraged by the state”; “3” for state-sponsored
performance-pay initiatives offered in select districts”; or “4” for “does not support
performance pay.” The closer the policy is to the typical union position, the higher
the score.
Rationale: Tying teacher pay to student performance is one of the most hotly
contested teacher policies of late, and teacher unions play a significant role in
the debate. Some performance pay systems give teachers bonuses on top of
their base salaries; others tie a portion of a teacher’s base salary to performance
(and give her a raise if she is judged to be effective in the classroom) or prevent
a teacher from receiving automatic yearly salary increases, also called “step
increases,” if she is deemed ineffective.
While education reformers often push districts and states to adopt performance
pay, pushing is sometimes the best they can do. If teacher salaries are mandated
elements of collective bargaining, the state cannot impose a pay scale (unless
the law contains a specific provision that lets the state determine any wages and
bonuses not tied to training and/or experience, as in California, for example).
Where state lawmakers are allowed to enact merit pay, they typically encounter
staunch opposition from teacher unions—the NEA and its affiliates take a
particularly hard line against any policy, merit pay included, which treats teachers
differently on the basis of their performance.25 In the handful of states where merit
pay has become state law, the union was not strong enough to block it.
Indicator 4.2: Retirement (2.9%)
Sub-indicator 4.2.1: What is the employer versus employee contribution rate to the
teacher pension system? (2.9%)
Data are drawn from the National Council on Teacher Quality’s 2011 State
Teacher Policy Yearbook. Indicators 4-H.7 and 4-H.9 list employer and employee
24 The state profiles record several instances in which lawmakers did not pursue reforms—not because of the union, but because they themselves did not want them. This was the case in Vermont, for example, where the state wanted to maintain local district control and therefore eschewed any policies that increased the power of the state at the expense of districts.
25 The NEA’s 2011-12 Policy Handbook, Resolution F-8: “Collective bargaining agreements between education employees…and their employers should contain certain standard contractual concepts. These concepts include (section Q): Salary schedules that are equitable, regardless of the age level of the students being taught, and are based upon preparation, professional growth, and length of service, and that exclude any form of merit pay.” See http://www.nea.org/assets/docs/nea-handbook.pdf.

386 HOW STRONG ARE U.S. TEACHER UNIONS? A STATE-BY-STATE COMPARISON.
Appendix A:Detailed Methodology and Rationale
Our data reflect state-level teacher employment and charter school policies as of December 2011. We’re well aware that this moment in time reflects a good deal of very recent legislation. Many states enacted major reforms in these areas during 2010 and 2011, motivated by the federal Race to the Top competition, changes in state leadership (especially if the occupants of key policy roles changed from one party to the other, as happened in many places in November 2010), and in anticipation of applying for an NCLB waiver. These reforms sometimes altered long-standing policies or provided state officials with greater control over issues that had previously been at the discretion of districts. It’s reason to suppose that some—maybe many—of these recent changes signal that unions are weaker than they once were, or at least weaker than other forces now engaged in state-level education policy. And our deep dives into individual states indicate that in many cases this is correct: Policies are being enacted due to forces other than—or stronger than—the teacher unions.
But our examination also shows that unions typically have a great deal of influence over the design of some reform policies, even if they cannot keep reforms off the policy agenda. Many states, for example, enacted new laws requiring that districts include student achievement data in teacher evaluations. But the design of these laws varies from state to state, and some are significantly more demanding than others. Some laws mandate, for example, that half of the evaluation be based on student test scores—but some require far less, or leave the weighting to individual districts. Some allow for district-created or even teacher-created assessments to be used rather than statewide assessments. And some are only plans or declarations of intent, indicating that at some point in the future, the state will implement a yet-to-be-designed system. Given this reality, we asked not only whether a state had a particular policy such as a statewide evaluation system, but also the degree to which the design of that policy aligns with union interests (e.g., how does it treat the role of student achievement in such evaluations?).
That said, we offer two important caveats. First, our state-level investigations reveal the volatility of state-level education policy circa 2011-12 and a large number of places where it is very much in flux. States are rapidly, and drastically, enacting policies, and our calculations reflect the state of state policies at a certain point in time. Many states are currently altering long-standing policies and some have done so since we gathered our data. (Where possible, we note this in the state profile reports.) Second, the indicators in this metric reflect only the policies codified in state law. We’re mindful that a state’s constitution (and the subsequent interpretation of that document by courts) can also have a significant impact on education laws in that state. In Virginia, for example, the legislature cannot mandate that teacher evaluations include student achievement data or permit entities other than local school boards to authorize charter schools because both actions are prohibited by the state constitution (or at least interpreted as prohibited). (This is not to say that legislatures have not passed laws that are unconstitutional, and that unions have not filed lawsuits to stop them!) However, the state code contains the bulk, if not the entirety, of what is commonly termed “education policy” in each state.
POLICIES IN FLUX
contribution rates, respectively. We use these data to calculate the ratio of
employer-to-employee contribution rates for each state. (For those states in which
teachers participate in Social Security, the flat employer/employee contribution
rate of 6.2 percent is added onto both the state employer and employee
contribution rates before calculating the ratio.) States are ranked and divided into
quintiles; those with the lowest employer-to-employee contribution ratios receive
“0,” while those with the highest ratios receive “4.”
Data were not available for Michigan (which began a new system in 2010 and is not
yet reporting employer contributions) or New Jersey (which reports contributions
as dollar amounts rather than percentages). This indicator was omitted from the
metric calculations for these states.

387 HOW STRONG ARE U.S. TEACHER UNIONS? A STATE-BY-STATE COMPARISON.
Appendix A:Detailed Methodology and Rationale
Rationale: Teacher pensions are a significant avenue through which unions can
boost benefits for their members—and pension policy, with a few exceptions
nationwide, is exclusively the domain of the state.26 At the same time, many states
have massively underfunded pensions, and raising employee contributions is
one way to decrease their liability. However, lawmakers may be reluctant to raise
employee contributions because the repercussions are immediate and tend to
provoke a highly public reaction from the union (and the teachers they represent).
So lawmakers may turn to less visible measures like reducing future benefits, or
choose to do nothing at all, passing the buck to the next generation of legislators
(and taxpayers). Given this context, if a state mandates that districts pay a
significantly greater share of pension contributions than their employees, a strong
labor constituency is likely behind the decision.
Indicator 4.3: Evaluations (2.9%)
Sub-indicator 4.3.1: What is the maximum potential consequence for veteran
teachers who receive unsatisfactory evaluation(s)? (1.4%)
Data are drawn from the National Council on Teacher Quality’s 2011 State Teacher
Policy Yearbook. Indicator 5-B.2 asks, “What are the consequences for veteran
teachers who receive unsatisfactory evaluations?” A state receives “0” for “eligible
for dismissal after multiple unsatisfactory ratings”; “2” for “improvement plan
after a single unsatisfactory rating” or “other consequences” (if not superseded
by “eligible for dismissal after multiple unsatisfactory ratings”); or “4” for “no
articulated consequences.”
Rationale: Teacher evaluations have recently emerged as one of the most hotly
contested teacher policies, especially given the Race to the Top push that
evaluations be used to “remov[e] ineffective tenured and untenured teachers and
principals after they have had ample opportunities to improve” and the No Child
Left Behind waiver application, which requires that evaluations should be used to
inform personnel decisions.27
Teacher unions have played a significant role in these debates. Because their
primary role is to protect members’ jobs, they are particularly concerned with
dismissal rules tied to those evaluations. Standard practice is to remediate
teachers who receive unsatisfactory evaluations, putting them through cycles of
“improvement plans” and offering them multiple channels to appeal poor ratings,
while requiring administrators to gather copious documentation before they can
be dismissed. However, reformers criticize this process as protecting ineffective
teachers and have pushed for more streamlined dismissal procedures—procedures
that teacher unions stoutly resist because they reduce teacher job security (and,
26 In some states, teachers have their own pension funds, and in others they share a fund with all public employees. However, teachers represent a significant proportion of those employees. See Josh Barro and Stuart Buck, “Underfunded Teacher Pension Plans: It’s Worse Than You Think,” Manhattan Institute for Policy Research, 2010, http://www.manhattaninstitute.org/html/cr_61.htm.
27 U.S. Department of Education, “Race to the Top Program Executive Summary,” Section (D)(2)(iv)(d), http://www2.ed.gov/programs/racetothetop/executive-summary.pdf; U.S. Department of Education, “ESEA Flexibility Frequently Asked Questions,” Section 3(6), http://www.ed.gov/esea/flexibility.

388 HOW STRONG ARE U.S. TEACHER UNIONS? A STATE-BY-STATE COMPARISON.
Appendix A:Detailed Methodology and Rationale
they say, threaten due process, leaving teachers vulnerable to baseless firings
by capricious or vindictive administrators). Where reformers have successfully
reduced job protections for ineffective teachers, it has typically been because
teacher unions could not stop them.
Sub-indicator 4.3.2: Is teacher classroom effectiveness included in teacher
evaluations? If so, how is it weighted? (1.4%)
Data are drawn from the National Council on Teacher Quality’s 2011 State Teacher
Policy Yearbook. Indicator 3-B.2 asks, “Do states consider classroom effectiveness
as part of teacher evaluations?” A state receives “0” for “requires that student
achievement/growth is the preponderant criterion in teacher evaluations”; “1” for
“specifies that teacher evaluations are to be significantly informed by student
achievement/growth”; “3” for “requires that teacher evaluations include objective
evidence of student learning”; or “4” for “student achievement data not required.”
Rationale: The Race to the Top competition and the ESEA waiver process
both emphasized evaluating teachers based on their effectiveness. Race to the
Top requires that states “design and implement rigorous, transparent, and fair
evaluation systems for teachers and principals that differentiate effectiveness
using multiple rating categories that take into account data on student growth
as a significant factor.” The criteria for an NCLB waiver are more flexible,
acknowledging the (union-supported) argument that teacher effectiveness can be
measured in multiple ways; as such, the waiver requires that teacher evaluations
“use multiple valid measures in determining performance levels, including as
a significant factor data on student growth for all students (including English
Learners and students with disabilities) and other measures of professional
practice.”28
Reformers generally push for evaluation systems that include objective measures
of student achievement. And not surprisingly, the unions push back. Their
objections are numerous: Districts, rather than the state, should dictate the terms
of teacher evaluations (and teachers themselves should have a hand in developing
the evaluations). Measuring student achievement using standardized measures
(usually scores on state tests, but also by SAT scores or graduation rates) is
unfair—evaluations need to include (and heavily weigh) more subjective measures
like adherence to professional standards and classroom observations. If a state
insists on using test scores to measure student achievement, it should use teacher-
developed assessments, not just standardized exams. Where states require that
teacher evaluations include student achievement data AND that those data are the
preponderant evaluation criteria, teacher unions were typically not strong enough
to keep such policies out of state law.
28 U.S. Department of Education, “Race to the Top Program Executive Summary,” Section (D)(2)(ii), http://www2.ed.gov/programs/racetothetop/executive-summary.pdf; U.S. Department of Education, “ESEA Flexibility,” Section 3(2), http://www.ed.gov/esea/flexibility.

389 HOW STRONG ARE U.S. TEACHER UNIONS? A STATE-BY-STATE COMPARISON.
Appendix A:Detailed Methodology and Rationale
Indicator 4.4: Terms of employment (2.9%)
Sub-indicator 4.4.1: How long before a teacher earns tenure? Is student/teacher
performance considered in tenure decisions? (1.0%)
Data are drawn from the National Council on Teacher Quality’s 2011 State Teacher
Policy Yearbook. Two NCTQ indicators, 3-D.2 and 3-D.3, inform this question.
3-D.2 asks, “How long before a teacher earns tenure?” A state receives “0” for
“state only rewards annual contracts” or “no policy”; “1” for “5 years”; “2” for “4
years”; “3” for “3 years”; or “4” for “2 years” or “1 year.” In other words, once again,
the closer the policy is to what the union would favor, the higher the score.
3-D.3 asks, “How are tenure decisions made?” A state receives “0” for “evidence of
student learning is the preponderant criterion”; “2” for “some evidence of student
learning is considered”; or “4” for “virtually automatically.”
Final scores are the average of the two indicators for each state.
Rationale: As labor organizations, teacher unions focus on job security, and
tenure is the bedrock of that security. Once a teacher earns tenure, it can be
extremely difficult—in some states, according to reformers, all but impossible—to
dismiss them. Thus, reformers normally push for longer pre-tenure probationary
periods (or no tenure at all) to ensure that ineffective teachers are not ushered
into ironclad protection before districts can intervene. They also want districts
to ensure that only effective teachers receive tenure, noting that many existing
systems offer tenure virtually automatically at the end of the probationary period,
without considering teacher performance. Race to the Top also pushed states
to use evaluations when making tenure decisions.29 Where tenure is prohibited
or granted only after a long probationary period and/or tied to measures of
performance, teacher job protection (and union strength, we hypothesize) is
weaker.
Sub-indicator 4.4.2: How are seniority and teacher performance considered in
teacher layoff decisions? (1.0%)
Data are drawn from the National Council on Teacher Quality’s 2011 State Teacher
Policy Yearbook. Two NCTQ indicators, 5-D.3 and 5-D.4, inform this question.
5-D.3 asks, “Do states prevent districts from overemphasizing seniority in layoff
decisions?” A state receives “0” for “yes, seniority cannot be considered”; “1” for
“yes, seniority can be considered among other factors”; “2” for “no, layoff criteria
left to district discretion”; “3” for “no, tenure status must be considered” or “no,
seniority must be considered”; or “4” for “no, seniority is the sole factor.”
29 U.S. Department of Education, “Race to the Top Program Executive Summary,” Section (D)(2)(iv)(c), http://www2.ed.gov/programs/racetothetop/executive-summary.pdf.

390 HOW STRONG ARE U.S. TEACHER UNIONS? A STATE-BY-STATE COMPARISON.
Appendix A:Detailed Methodology and Rationale
5.D-4 asks, “Do districts have to consider performance in determining which
teachers are laid off?” A state receives “0” for “yes” or “4” for “no.”
Final scores are the average of the two indicators for each state.
Rationale: As teacher evaluation and tenure policies have come under scrutiny
nationwide, layoff policies are also under review—and have become more
significant in a time of tight or declining district budgets. Traditionally, when
districts let go teachers for reasons outside of the teachers’ control (for example,
increased class sizes, cuts to programs, school closures, and/or declining
enrollment), they do so using a “last in, first out” system. Probationary teachers
get laid off before tenured teachers. Tenured teachers with less seniority get laid
off before those with more. Unions favor such a system because it is uniform,
but reformers argue that it is completely counterproductive to student interests:
Districts should be able to keep their most effective teachers in the classroom
regardless of tenure/seniority considerations. Layoffs tied to performance
(not seniority) run counter to traditional union interests, however, and if state
lawmakers enact such a policy, it signals that union efforts to stop them were not
enough.
Sub-indicator 4.4.3: What percentage of the teaching workforce was dismissed
due to poor performance? (1.0%)
Dismissal rates for 2007-08 are drawn from the National Center for Education
Statistics’ Schools and Staffing Survey (2009), Table 8, “Average number of public
school teachers who were dismissed in the previous year or did not have their
contracts renewed based on poor performance.” A state’s dismissal rate is the
average number of dismissed teachers per district divided by the average number
of teachers per district. States are ranked and divided into quintiles; those with the
highest dismissal rates receive “0,” while those with the lowest rates receive “4.”
Rationale: Some states have policies requiring that layoffs and dismissals be
based at least in part on teacher performance, as well as on seniority and/or
tenure status. But the policies themselves might not have teeth, perhaps because
lawmakers are disinclined to fight with unions and other stakeholders. Other
states do not have these policies, allowing districts to determine layoff criteria.
A high rate of dismissal due to poor performance may, then, be a sign of a weak
union, one that could not prevent lawmakers from enacting performance-based
employment statutes and/or could not deter districts from using such policies.
Indicator 4.5: Class size (2.9%)
Sub-indicator 4.5.1: Is class size restricted for grades 1-3? If so, is the restriction
limit larger than the national average (20)? (2.9%)

391 HOW STRONG ARE U.S. TEACHER UNIONS? A STATE-BY-STATE COMPARISON.
Appendix A:Detailed Methodology and Rationale
Data on class size restrictions are drawn from the National Council on Teacher
Quality’s TR3 database, accessed in January 2012. For each state, three NCTQ
indicators ask “what is the class size restriction” for grade 1, grade 2, and grade 3,
respectively.
We compare the average class size restriction for grades 1-3 in each state against
the national average class size in elementary school, which is listed as twenty
students per class in 2007-08 by the Digest of Education Statistics (2010). A
state receives “0” if class size “is not addressed in the scope of NCTQ reviewed
documents”; “2” if the average class size restriction for grades 1-3 is larger than
or equal to the national average size, or if the state encourages, but does not
mandate, a policy smaller than the national average class size; or “4” if the average
class size restriction for grades 1-3 is smaller than the national average class size.
Rationale: State-mandated class size restrictions are beneficial to teacher unions
for two reasons: it creates favorable working conditions for their teachers and
it ensures that districts must hire a certain number of teachers. The latter is
especially important in times of fiscal crisis, when one of the first things districts
do to cut costs is increase class sizes (whereupon they do not need to employ
as many teachers). But if the state puts a cap on class size, districts can only
raise class sizes so far. State policies that restrict class size are favorable to union
interests; therefore, we see these policies as an indicator of a strong union.
Indicator 4.6: Charter school structural limitations (2.9%)
Sub-indicator 4.6.1: Is there a cap (limit) placed on the number of charter schools
that can operate in the state (or other jurisdiction) and/or on the number of
students who can attend charter schools? (1.0%)
Data are drawn from the National Alliance for Public Charter School’s Measuring
Up to the Model: A Ranking of State Charter School Laws (2012). The report rates
state charter laws against the standard “No caps: No limits are placed on the
number of public charter schools or students (and no geographic limits); if caps
exist, there is adequate room for growth.” For the report’s “no caps” indicator, each
state is scored as follows:
0 = The state does not have a cap.
1 = The state has a cap with room for ample growth. OR The state does not have a
cap, but allows districts to restrict growth.
2 = The state has a cap with room for adequate growth.
3 = The state has a cap with room for limited growth.
4 = The state has a cap with no room for growth.
N/A = The state does not have a charter school law.
Sub-indicator 4.6.2: Does the state allow a variety of charter schools (start-ups,
conversions, and virtual schools)? (1.0%)

392 HOW STRONG ARE U.S. TEACHER UNIONS? A STATE-BY-STATE COMPARISON.
Appendix A:Detailed Methodology and Rationale
Data are drawn from the National Alliance for Public Charter School’s Measuring
Up to the Model: A Ranking of State Charter School Laws (2012). The report rates
state charter laws against the standard “A variety of public charter schools is
allowed, including new start-ups, public school conversions, and virtual schools.”
For the report’s “a variety of public charter schools allowed” indicator, each state is
scored as follows:
0 = The state allows new start-ups, public school conversions, and virtual schools.
1 = The state allows new start-ups and virtual schools, but not public school
conversions.
2 = The state allows new start-ups and public school conversions, but not virtual
schools. OR The state allows only new start-ups.
4 = The state allows only public school conversions.
N/A = The state does not have a charter school law.
Sub-indicator 4.6.3: How many charter authorizing options exist? How active are
those authorizers? (1.0%)
Data are drawn from the National Alliance for Public Charter School’s Measuring
Up to the Model: A Ranking of State Charter School Laws (2012). The report rates
state charter laws against the standard “Multiple authorizers available: Two or
more viable authorizing options for each applicant with direct application allowed
to each authorizing option.” For the report’s “multiple authorizers available”
indicator, each state is scored as follows:
0 = The state allows two or more viable authorizing options for each applicant.
1 = The state allows two or more viable authorizing options for each applicant,
but requires applicants to get preliminary approval from a state charter school
advisory committee.
2 = The state has only a single viable authorizer option available, and there
is considerable authorizing activity. OR The state allows two or more viable
authorizing options for applicants in some but not all jurisdictions. OR The state
allows two or more viable authorizing options for applicants but the authorizing
activities of such entities is limited.
3 = The state has only a single viable authorizer option available, and there is some
authorizing activity.
4 = The state has only a single viable authorizer option available, and there is no or
almost no authorizing activity.
N/A = The state does not have a charter school law.

393 HOW STRONG ARE U.S. TEACHER UNIONS? A STATE-BY-STATE COMPARISON.
Appendix A:Detailed Methodology and Rationale
Rationale: Teacher unions ordinarily object to policies that encourage the
expansion and autonomy of charter schools.30 A system that fosters charter school
growth and grants these schools significant autonomy threatens union interests for
two reasons. First, a robust charter sector endangers the job security of unionized
teachers because students (and money) leave district schools for charters.
Second, as the number of charters increases, so does the number of public school
teachers who are not unionized, jeopardizing the unions’ near-monopoly on
representing educators. The unions argue that this is bad for teachers—if they
are not working under a union contract, they risk unfair or capricious working
conditions. Choice supporters argue that union opposition has nothing to do with
teachers and everything to do with the union’s self-interest (fewer members mean
less money and less political weight) and that teachers are choosing to work at
charters expressly because they feel that unions protect adults to the detriment of
students.
The three sub-indicators under “charter school structural limitations” measure
charter expansion policies (autonomy is examined below).
With sub-indicator 4.6.1, we ask whether the state caps the number of charters
allowed to operate and whether that cap allows the sector to grow. A high cap,
with ample room underneath it for charter expansion, is counter to union interests;
thus, we see these policies as an indicator of a weak union.
With sub-indicator 4.6.2, we examine the diversity of charters allowed by the state.
Unions prefer that states permit only charters that have been converted from
district schools. The reasoning is pragmatic (allowing only conversions limits the
total number of charters because there are only so many eligible schools) but also
ideological: Conversion implies charters are a last-resort solution rather than a
promising practice that should be encouraged to grow. Unions object to opening
up the sector to include new schools and especially virtual schools—both permit
the sector to grow, but virtual schools are particularly distasteful because they
challenge the traditional role of the teacher and typically operate with fewer (often
non-union) teachers per student. State policies that allow a diversity of charters
are counter to union interests; thus, we see these policies as an indicator of a weak
union.
With sub-indicator 4.6.3, we examine charter school authorizing options. It is
difficult for the sector to grow if would-be charter operators have only one
route to authorize the school. Some states allow only local school boards to
authorize charters, while others permit county and/or state boards, a state
charter commission, colleges and universities, and/or other education agencies
to authorize as well. Likewise, it is difficult for the sector to grow if the available
30 Specifically, that “unions focus their attention on certain clusters of [charter school] provisions,” which include “requiring local school districts to approve charters, adherence to existing district collective bargaining agreements, and preventing charters from hiring/firing teachers without district oversight.” See Francis X. Shen and Kenneth K Wong, “Beyond Weak Law, Strong Law: Political Compromise and Legal Constraints on Charter School Laws” (paper prepared for the annual meeting of the American Political Science Association, Philadelphia, PA) August 31 - September 3, 2006, http://www.fxshen.com/Shen&Wong_APSA-2006_CharterLaws.pdf.

394 HOW STRONG ARE U.S. TEACHER UNIONS? A STATE-BY-STATE COMPARISON.
Appendix A:Detailed Methodology and Rationale
authorizer(s) are not actually active in authorizing schools (usually due to
restrictive authorizing processes, again determined by the state). State policies
that allow for multiple authorizers and permit those entities to be active are
counter to union interests; thus, we see these policies as an indicator of a weak
union.
Indicator 4.7: Charter school exemptions (2.9%)
Sub-indicator 4.7.1: Are charter schools automatically exempt from state laws,
regulations, and teacher certification requirements (except those that safeguard
students and fiscal accountability)? (1.4%)
Data are drawn from the National Alliance for Public Charter School’s Measuring
Up to the Model: A Ranking of State Charter School Laws (2012). The report rates
state charter school laws against the standard “Automatic exemptions from many
state and district laws and regulations: Exemptions from all laws, except those
covering health, safety, civil rights, student accountability, employee criminal
history checks, open meetings, freedom of information, and generally accepted
accounting principles; exemption from state teacher certification requirements.”31
For the report’s “automatic exemptions from many state and district laws and
regulations” indicator, each state is scored as follows:
0 = The state law provides automatic exemptions from many state and district laws
and regulations and does not require any of a school’s teachers to be certified.
1 = The state law provides automatic exemptions from many state and district laws
and regulations and requires some of a school’s teachers to be certified.
2 = The state law provides automatic exemptions from many state and district
laws and regulations and requires all of a school’s teachers to be certified. OR
The state law provides automatic exemptions from many state and district laws
and regulations and requires all of a school’s teachers to be certified for some
charters and requires some of a school’s teachers to be certified for other charters.
OR The state law allows schools to apply for exemptions from state and district
laws and requires some of a school’s teachers to be certified. OR The state law
allows schools to apply for exemptions from state and district laws, including from
certification requirements. OR The state law provides automatic exemptions from
many state and district laws and regulations for some schools but not others and
requires all of a school’s teachers to be certified but provides exceptions. OR The
state law provides some flexibility from state and district laws and regulations for
some schools but less for others and does not require any of a school’s teachers to
be certified.
3 = The state law allows schools to apply for exemptions from state and district
laws and requires all of a school’s teachers to be certified. OR The state law
does not provide automatic exemptions from many state and district laws and
regulations and does not require any of a school’s teachers to be certified. OR The
31 In this sub-indicator, we consider all state laws (including certification) together, while in our state profiles we present exemptions from teacher certification laws separately for clarity.

395 HOW STRONG ARE U.S. TEACHER UNIONS? A STATE-BY-STATE COMPARISON.
Appendix A:Detailed Methodology and Rationale
state law allows schools to apply for exemptions from state and district laws and
requires some of a school’s teachers to be certified.
4 = The state law does not provide automatic exemptions from state and district
laws and regulations, does not allow schools to apply for exemptions, and requires
all of a school’s teachers to be certified.
N/A = The state does not have a charter school law.
Sub-indicator 4.7.2: Are charter schools automatically exempt from collective
bargaining agreements (CBAs)? (1.4%)
Data are drawn from the National Alliance for Public Charter Schools’ Measuring
Up to the Model: A Ranking of State Charter School Laws (2012). The report
ranks state charter laws against the standard “Automatic collective bargaining
exemption: Charter schools authorized by non-local board authorizers are exempt
from participation in district collective bargaining agreements; charter schools
authorized by local boards are exempt from participation in district collective
bargaining agreements.” For the report’s “automatic collective bargaining
exemption” indicator, each state is scored as follows:
0 = The state law does not require any charter schools to be part of district
collective bargaining agreements.
1 = The state law exempts some schools from existing collective bargaining
agreements, but not others (but allows those not exempted to apply for
exemptions).
2 = The state law exempts some schools from existing collective bargaining
agreements, but not others.
3 = The state law requires all charter schools to be part of existing collective
bargaining agreements, but schools can apply for exemptions. OR The state law
requires all charter school staff to be employees of the local school district, but
exempts the staff from state education employment laws.
4 = The state law requires all charter schools to be part of existing collective
bargaining agreements, with no opportunity for exemptions.
N/A = The state does not have a charter school law.
Rationale: These two sub-indicators measure state policies that grant charter
schools autonomy by automatically exempting them from state laws, district
regulations, and collective bargaining agreements.
With sub-indicator 4.7.1, we examine the degree to which state law exempts
charters both from the state’s own regulations (including teacher certification
requirements) and from district regulations, except those relating to student safety
and fiscal accountability. Some states automatically exempt charters from all state
laws and district regulations; some allow all charters to apply for waivers for all of
them; still others permit no exceptions from certain policies but provide automatic
exemptions from others (or allow schools to apply for such exemptions). In other
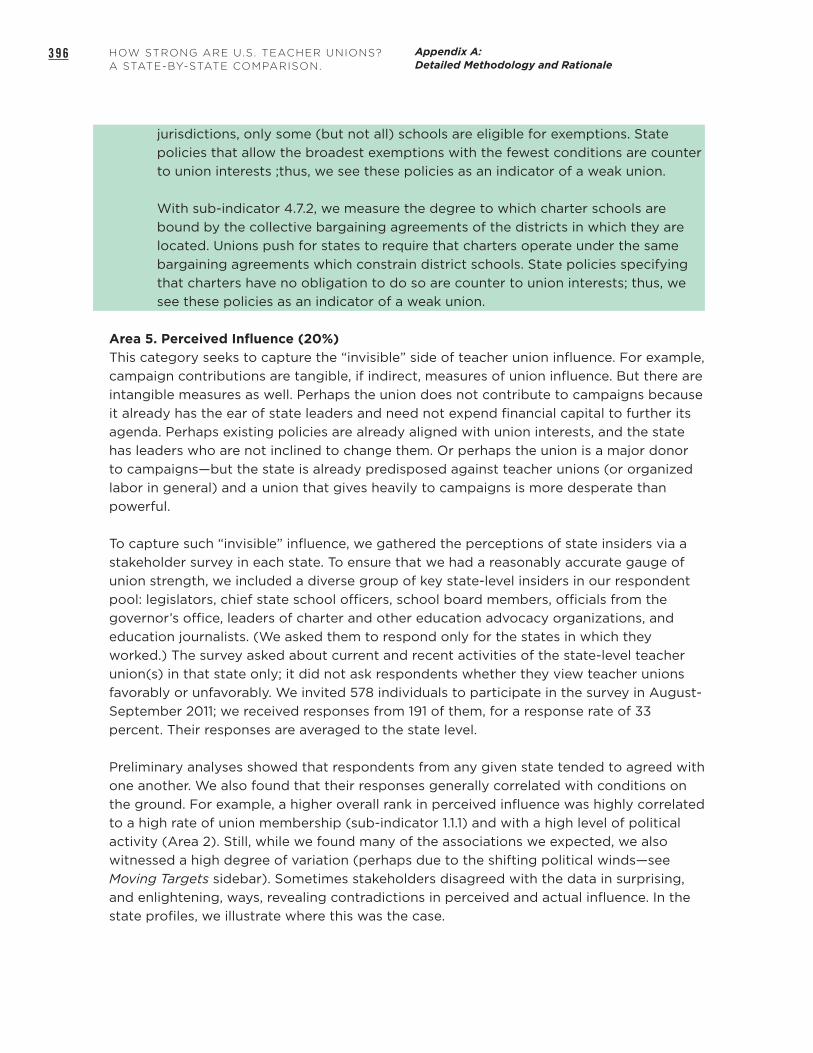
396 HOW STRONG ARE U.S. TEACHER UNIONS? A STATE-BY-STATE COMPARISON.
Appendix A:Detailed Methodology and Rationale
jurisdictions, only some (but not all) schools are eligible for exemptions. State
policies that allow the broadest exemptions with the fewest conditions are counter
to union interests ;thus, we see these policies as an indicator of a weak union.
With sub-indicator 4.7.2, we measure the degree to which charter schools are
bound by the collective bargaining agreements of the districts in which they are
located. Unions push for states to require that charters operate under the same
bargaining agreements which constrain district schools. State policies specifying
that charters have no obligation to do so are counter to union interests; thus, we
see these policies as an indicator of a weak union.
Area 5. Perceived Influence (20%)
This category seeks to capture the “invisible” side of teacher union influence. For example,
campaign contributions are tangible, if indirect, measures of union influence. But there are
intangible measures as well. Perhaps the union does not contribute to campaigns because
it already has the ear of state leaders and need not expend financial capital to further its
agenda. Perhaps existing policies are already aligned with union interests, and the state
has leaders who are not inclined to change them. Or perhaps the union is a major donor
to campaigns—but the state is already predisposed against teacher unions (or organized
labor in general) and a union that gives heavily to campaigns is more desperate than
powerful.
To capture such “invisible” influence, we gathered the perceptions of state insiders via a
stakeholder survey in each state. To ensure that we had a reasonably accurate gauge of
union strength, we included a diverse group of key state-level insiders in our respondent
pool: legislators, chief state school officers, school board members, officials from the
governor’s office, leaders of charter and other education advocacy organizations, and
education journalists. (We asked them to respond only for the states in which they
worked.) The survey asked about current and recent activities of the state-level teacher
union(s) in that state only; it did not ask respondents whether they view teacher unions
favorably or unfavorably. We invited 578 individuals to participate in the survey in August-
September 2011; we received responses from 191 of them, for a response rate of 33
percent. Their responses are averaged to the state level.
Preliminary analyses showed that respondents from any given state tended to agreed with
one another. We also found that their responses generally correlated with conditions on
the ground. For example, a higher overall rank in perceived influence was highly correlated
to a high rate of union membership (sub-indicator 1.1.1) and with a high level of political
activity (Area 2). Still, while we found many of the associations we expected, we also
witnessed a high degree of variation (perhaps due to the shifting political winds—see
Moving Targets sidebar). Sometimes stakeholders disagreed with the data in surprising,
and enlightening, ways, revealing contradictions in perceived and actual influence. In the
state profiles, we illustrate where this was the case.

397 HOW STRONG ARE U.S. TEACHER UNIONS? A STATE-BY-STATE COMPARISON.
Appendix A:Detailed Methodology and Rationale
Indicator 5.1: Relative influence of teacher unions (4.0%)
Sub-indicator 5.1.1: How do you rank the influence of teacher unions compared
with other influential entities in the state? (4.0%)
Participants were asked to “select and rank the five most important entities in
terms of their influence in shaping education policy in your state over the last three
years.” The list we placed before them consisted of business roundtable/chamber
of commerce; parent coalitions; education-reform advocacy organizations/school-
reform political action committees; civil rights groups; state school board/board
of regents; state association of elementary and secondary school principals; state
association of school administrators (superintendents); teacher unions/teacher
associations; textbook companies; state school board association; state charter
school association; and other (write-in).
Each response receives “0” if teacher unions are listed fifth or not at all; “1” if
teacher unions are listed fourth; “2” if listed third; “3” if listed second; or “4” if
listed first. To generate the value of this indicator for each state, we average the
responses from all informants from that state.
Indicator 5.2: Influence over campaign outcomes (4.0%)
Sub-indicator 5.2.1: How often do Democratic candidates need teacher union
support to get elected? (2.0%)
Participants were asked to rank how often “Democrats running for state-level
office (e.g., governor, legislator, etc.) need teacher union/teacher association
support to get elected” on a five-point Likert scale.
Each response receives “0” for “never”; “1” for “rarely”; “2” for “sometimes”; “3” for
“often”; or “4” for “always. To generate the value of this indicator for each state, we
average the responses from all informants from that state.
Sub-indicator 5.2.2: How often do Republican candidates need teacher union
support to get elected? (2.0%)
Participants were asked to rank how often “Republicans running for state-level
office (e.g., governor, legislator, etc.) need teacher-union/teacher-association
support to get elected” on a five-point Likert scale.
Each response receives “0” for “never”; “1” for “rarely”; “2” for “sometimes”; “3” for
“often”; or “4” for “always.” To generate the value of this indicator for each state,
we average the responses from all informants from that state.
Indicator 5.3: Influence over spending (4.0%)
Sub-indicator 5.3.1: To what extent are teacher unions effective in protecting
dollars for education? (2.0%)

398 HOW STRONG ARE U.S. TEACHER UNIONS? A STATE-BY-STATE COMPARISON.
Appendix A:Detailed Methodology and Rationale
Participants were asked (on a five-point Likert scale) whether they agree or
disagree with the following statement: “Even in times of recession and cutbacks,
teacher unions/teacher associations in my state are effective in protecting dollars
for education, whether by preventing or minimizing cuts in the education budget.”
Each response receives “0” for strongly disagree”; “1” for “disagree; “2” for
“neutral”; “3” for “agree”; or “4” for “strongly agree.” To generate the value of this
indicator for each state, we average the responses from all informants from that
state.
Sub-indicator 5.3.2: Do unions generally make concessions to prevent reductions
in pay and benefits, or fight hard to prevent those reductions? (2.0%)
Participants were asked “Which of these two statements best describes teacher
unions/teacher associations in your state?” They chose between the following
responses:
• Given recent budgetary constraints, teacher unions/teacher associations in my
state have conceded from the outset that some budgetary reductions for pay
and benefits are inevitable.
Many of the survey questions asked respondents to characterize teacher union activity over the last three years or during the most recent legislative session. As with the state policies included in Area 4, we recognize that U.S. education policy has undergone significant change of late, particularly given the federal Race to the Top competition, applications for No Child Left Behind (NCLB) waivers, and state elections (in 2010 and 2011) that ushered in many Republicans eager to overhaul particular policies. We asked respondents to focus on teacher union strength in these more recent years, rather than historically, to capture current trends. But given the pace of change over just the last year or two, three years is a moving target. Further, recent changes do in many ways reflect a new weakening of teacher union influence over education policy in some states—weakening that is not apt to be fully reflected in opinions voiced in late summer 2011. (Whether that waning of teacher union strength will last is another question entirely.)
We’re mindful, too, that even when respondents are asked to reflect on recent teacher union influence, what’s in their minds may well reflect their impressions over a longer period of time. Thus teacher unions may be described as influential because historically they were, even if today they’re less so. The converse is also possible.
We also recognize that policy contexts vary greatly across the states. Some states, for example, have cut education spending despite strong union pushback. So our questions address both intent and action. For example, sub-indicators 5.3.1 and 5.3.2 both address budget cuts. While the former gauges union success in fighting budget cuts, the latter probes the extent to which teacher unions were engaged in the debate at all.
MOVING TARGETS

399 HOW STRONG ARE U.S. TEACHER UNIONS? A STATE-BY-STATE COMPARISON.
Appendix A:Detailed Methodology and Rationale
• Given recent budgetary constraints, teacher unions/teacher associations in my
state have fought hard to prevent reductions in pay and benefits (whether or
not their efforts have proven successful).
Each response receives “0” for the former or “4” for the latter. To generate the
value of this indicator for each state, we average the responses from all informants
from that state.
Indicator 5.4: Influence over policy (4.0%)
Sub-indicator 5.4.1: How effectively do teacher unions ward off proposals with
which they disagree? (1.0%)
Participants were asked (on a five-point Likert scale) whether they agree or
disagree with the following statement: “Teacher unions/teacher associations in
my state are effective in warding off education-reform proposals with which they
disagree.”
Each response receives “0” for strongly disagree”; “1” for “disagree; “2” for
“neutral”; “3” for “agree”; or “4” for “strongly agree.” To generate the value of this
indicator for each state, we average the responses from all informants from that
state.
Sub-indicator 5.4.2: How often do existing state education policies reflect teacher
union priorities? (1.0%)
Participants were asked (on a five-point Likert scale) to rank how often “state-
level education policies reflect teacher unions/teacher association priorities.”
Each response receives “0” for “never”; “1” for “rarely”; “2” for “sometimes”; “3” for
“often”; or “4” for “always.” To generate the value of this indicator for each state,
we average the responses from all informants from that state.
Sub-indicator 5.4.3: To what extent were state education policies proposed by
the governor during your state’s latest legislative session in line with teacher union
priorities? (1.0%)
Using a five-point Likert scale, participants were asked to rank “To what extent
were education policies proposed by the governor during your state’s latest
legislative session in line with the priorities held by teacher unions/teacher
associations?”
Responses receive “0” for “not at all in line”; “1” for “mostly not in line”; “2” for
“somewhat in line”; “3” for “mostly in line”; or “4” for “totally in line.” To generate
the value of this indicator for each state, we average the responses from all
informants from that state.

400 HOW STRONG ARE U.S. TEACHER UNIONS? A STATE-BY-STATE COMPARISON.
Appendix A:Detailed Methodology and Rationale
Sub-indicator 5.4.4: To what extent were legislative outcomes of your state’s latest
legislative session in line with teacher union priorities? (1.0%)
Using a five-point Likert scale, participants were asked to rank “To what extent
were legislative outcomes of your state’s latest legislative session in line with the
priorities held by teacher unions/teacher associations?”
Each response receives “0” for “not at all in line”; “1” for “mostly not in line”; “2” for
“somewhat in line”; “3” for “mostly in line”; or “4” for “totally in line.” To generate
the value of this indicator for each state, we average the responses from all
informants from that state.
Indicator 5.5: Influence over key stakeholders (4.0%)
Sub-indicator 5.5.1: How often have the priorities of state education leaders
aligned with teacher union positions in the past three years? (2.0%)
Using a five-point Likert scale, participants were asked to rank “How often have
the priorities of the state board of education or the state education chief aligned
with the positions held by teacher unions/teacher associations in your state in the
last three years?”
Each response receives “0” for “never”; “1” for “rarely”; “2” for “sometimes”; “3” for
“often”; or “4” for “always.” To generate the value of this indicator for each state,
we average the responses from all informants from that state.
Sub-indicator 5.5.2: Do unions typically compromise with policymakers to ensure
that their preferred policies are enacted, or typically need not make concessions?
(2.0%)
Participants were asked, “Some degree of compromise typically occurs in
policymaking. Understanding that, which statement do you think best describes
teacher unions/teacher associations in your state?” They chose between the
following responses:
• Teacher unions/teacher associations in my state typically compromise with
policymakers to ensure that their preferred policies are enacted at the state
level.
• More often than not, teacher unions/teacher associations in my state need not
make concessions to ensure that their preferred policies are enacted at the
state level.
Each response receives “0” for the former or “4” for the latter. To generate the
value of this indicator for each state, we average the responses from all informants
from that state.

401 HOW STRONG ARE U.S. TEACHER UNIONS? A STATE-BY-STATE COMPARISON.
Appendix A:Detailed Methodology and Rationale
Rationale for Area 5: How teacher unions are perceived by informed observers
on the ground offers us a unique window into their influence. Those perceptions
speak to how much influence the union wields behind the scenes and whether
policymakers (some of whom do not support union interests on principal) are
inclined to accede to union demands. All of our questions relate to state policies,
both because this study targets the activity of state level unions and because our
respondents have in-depth knowledge of politics in their jurisdictions. We chose to
query them about comparative influence; the union’s ability to protect and direct
dollars to their cause; and the extent to which existing, proposed, and enacted
policies reflect their priorities, among other areas.

402 HOW STRONG ARE U.S. TEACHER UNIONS? A STATE-BY-STATE COMPARISON.
Appendix B:State Level NEA and AFT Affiliates
APPENDIX B: STATE LEVEL NEAAND AFT AFFILIATES
Every state is home to at least one state-level affiliate of either the National Education
Association (NEA) or the American Federation of Teachers (AFT), often both. (Four
states are home to joint NEA-AFT affiliates: Florida, Montana, Michigan, and New York;
the District of Columbia has only an AFT affiliate.) Below we list these affiliates by
state. In this report, we include data only for these affiliated unions/associations, not for
independent professional associations unaffiliated with either the NEA or AFT.
NATIONAL EDUCATION ASSOCIATION AMERICAN FEDERATION OF TEACHERS
Alabama Education Association n/a
NEA Alaska, Inc. Alaska Public Employees Association AFT
Arizona Education Association Arizona Federation of Teachers Union
Arkansas Education Association n/a
California Teachers Association California Federation of Teachers
Colorado Education Association American Federation of Teachers Colorado
Connecticut Education Association, Inc. American Federation of Teachers CT
Delaware State Education Association, Inc. n/a
n/a Washington Teachers’ Union (District of Columbia)
JOINT: Florida Education Association
Georgia Association of Educators, Inc. Georgia Federation of Teachers
Hawaii State Teachers Association n/a
Idaho Education Association Idaho Federation of Teachers
Illinois Education Association Illinois Federation of Teachers
Indiana State Teachers Association Indiana Federation of Teachers
Iowa State Education Association n/a
Kansas National Education Association AFT Kansas
Kentucky Education Association n/a
Louisiana Association of Educators, Inc. Louisiana Federation of Teachers
Maine Education Association AFT Maine
Maryland State Education Association AFT Maryland
Massachusetts Teachers Association AFT Massachusetts
Michigan Education Association AFT Michigan
JOINT: Education Minnesota
Mississippi Association of Educators AFT Mississippi

403 HOW STRONG ARE U.S. TEACHER UNIONS? A STATE-BY-STATE COMPARISON.
Appendix B:State Level NEA and AFT Affiliates
Missouri National Education Association AFT Missouri, AFL-CIO
JOINT: Montana Education Association-Montana Federation of Teachers
Nebraska State Education Association n/a
Nevada State Education Association n/a
NEA - New Hampshire AFT - New Hampshire
New Jersey Education Association AFT New Jersey, AFL-CIO
National Education Association of New Mexico AFT New Mexico
JOINT: New York State United Teachers
North Carolina Association of Educators, Inc. n/a
North Dakota Education Association North Dakota Public Employees Association
Ohio Education Association Ohio Federation of Teachers
Oklahoma Education Association Oklahoma Federation of Teachers
Oregon Education Association AFT Oregon
Pennsylvania State Education Association AFT Pennsylvania
National Education Association Rhode Island Rhode Island Federation of Teachers
South Carolina Education Association n/a
South Dakota Education Association n/a
Tennessee Education Association n/a
Texas State Teachers Association Texas AFT
Utah Education Association AFT Utah
Vermont - NEA United Professions AFT Vermont
Virginia Education Association n/a
Washington Education Association AFT Washington
West Virginia Education Association AFT West Virginia
Wisconsin Education Association Council AFT Wisconsin
Wyoming Education Association n/a

404 HOW STRONG ARE U.S. TEACHER UNIONS? A STATE-BY-STATE COMPARISON.
Endnotes
ENDNOTES
1 See Terry M. Moe, Special Interest: Teachers Unions and America’s Public Schools (Washington, D.C.: Brookings Institution Press, 2011).
2 See Randi Weingarten, “The states that actually have lots of teachers in teacher unions tend to be the states that have done the best in terms of academic success in this country,” quotation taken from ABC’s This Week, August 29, 2010. See also Diane Ravitch, The Death and Life of the Great American School System: How Testing and Choice Are Undermining Education (New York: Basic Books, 2010).
3 EIA Online, “Official NEA State Affiliate Membership Numbers for 2010-11,” July 11, 2012, accessed September 19, 2012, http://www.eiaonline.com/intercepts/2012/07/11/official-nea-state-affiliate-membership-numbers-for-2010-11/ and “Could AFT Membership Really Be Up?” July 31, 2012, accessed September 19, 2012, http://www.eiaonline.com/intercepts/2012/07/31/could-aft-membership-really-be-up/.
4 Moe, Special Interest. See also the earlier work of Myron Lieberman, who has written prolifically on the topic, including The Teacher Unions: How the NEA and AFT Sabotage Reform and Hold Students, Parents, Teachers, and Taxpayers Hostage to Bureaucracy (Free Press, 1997).
5 See John Chubb and Terry Moe, Politics, Markets, and America’s Schools (Washington, D.C.: Brookings Institution Press, 1990).
6 See Noel Epstein, ed., Who’s in Charge Here? The Tangled Web of School Governance and Policy (Washington, D.C.: Brookings Institution Press, 2004).
7 See, for example, Michael Berkman and Eric Plutzer, Ten Thousand Democracies: Politics and Public Opinion in America’s School Districts (Washington, D.C.: Georgetown University Press, 2005); Henry S. Farber, “Union Membership In The United States: The Divergence Between The Public And Private Sectors,” in Collective Bargaining in Education: Negotiating Change in Today’s Schools, eds. Jane Hannaway and Andrew J. Rotherham (Cambridge: Harvard Education Press, 2006), 27-51; Barry T. Hirsch, David A. Macpherson, and John V. Winters, “Teacher Salaries, State Collective Bargaining Laws, And Union Coverage” (paper presented at the Association for Education Finance and Policy (AEFP) Meetings, Seattle, March 26, 2011); Caroline Minter Hoxby, “How Teachers’ Unions Affect Education Production,” Quarterly Journal of Economics 111, no. 3 (1996): 671-718; and Heather Rose and Jon Sonstelie, “School Board Politics, School District Size, and the Bargaining Power of Teachers Unions,” Journal of Urban Economics 67, no.3 (2010): 438-450.
8 See, for example, studies examining NCLB-style accountability (Bryan Shelly, “Rebels And Their Causes: State Resistance To No Child Left Behind,” Publius: The Journal of Federalism 38, no. 3 (2008): 444-468); factors that led states/districts to embrace charter schools (Michael Mintrom, “Policy Entrepreneurs And The Diffusion Of Innovation,” American Journal of Political Science 41, no. 3 (1997): 738-770; Francis K. Shen and Kenneth K. Wong, “Beyond Weak Law, Strong Law: Political Compromise And Legal Constraints On Charter School Laws” (paper presented at the annual meeting of the American Political Science Association (APSA), Philadelphia, PA, August 31-September 3, 2006); Arnold F. Shober, Paul Manna, and John F. Witte, “Flexibility Meets Accountability: State Charter Laws And Their Influence On The Formation Of Charter Schools In The United States,” Policy Studies Journal 34, no. 4 (2006): 563-587); additional school spending (Berkman and Plutzer, Ten Thousand Democracies: Politics and Public Opinion in America’s School Districts); and teacher merit pay (Dan Goldhaber, Daniel Player, Michael DeArmond, and Hyung-Jai Choi, “Why Do So Few Public School Districts Use Merit Pay?” Journal of Education Finance 33, no. 3 (2008): 262-289).
9 See Ronald J. Hrebenar and Clive S. Thomas, “Interest Groups In The States,” in Politics in the American States, eds. Virginia Gray and Russell L. Hanson (Washington, D.C.: CQ Press, 1996), 100-128.
10 Terry M. Moe, “Political Control And The Power of Agent,” Journal of Law, Economics, and Organization 22, no. 1 (2006): 1-29.
11 R. M. Carini, “Teacher Unions And Student Achievement,” in School Reform Proposals: The Research Evidence, ed. A. Molnar (Information Age Publishing, 2002), 197-216.
12 See Carini, “Teacher Unions And Student Achievement,” 197-216; Randall W. Eberts and Joe A. Stone, Unions and Public Schools: The Effect of Collective Bargaining on American Education (Lexington, MA: Lexington Books, 1984); Robert M. Carini, Brian Powell, and Lala Carr Steelman, “Do Teacher Unions Hinder Educational Performance? Lessons Learned From State SAT And ACT Scores,” Harvard Educational Review 70, no. 4 (2000): 437-466.
13 See Michael Lovenheim, “The Effect Of Teachers’ Unions On Education Production: Evidence From Union Election Certifications In Three Midwestern States,” Journal of Labor Economics 27, no. 4 (2009): 2009; Terry M. Moe, “Collective Bargaining And The Performance Of The Public Schools,” American Journal of Political Science 53, no. 1 (2009): 156-174; Katharine O. Strunk, “Are Teachers’ Unions Really To blame? Collective Bargaining Agreements And Their Relationships With District Resource Allocation And Student Performance In California,” Education Finance and Policy 6, no. 3 (2011): 354-397.
14 See Michael Hartney and Patrick Flavin, “From The Schoolhouse To The Statehouse: Teacher Union Political Activism And The U.S. State Education Reform Policy,:” State Politics and Policy Quarterly 11, no. 3 (2011): 251-258.
15 See William S. Koski and Eileen L. Horng, “Facilitating The Teacher Quality Gap? Collective Bargaining Agreements, Teacher Hiring And Transfer Rules, And Teacher Assignment Among Schools In California,” Education Finance and Policy 2, no. 3 (2007): 262-300.
16 Author’s own calculations, based on revenue data drawn from state-level teacher unions’ 990 forms submitted between July 1, 2009 and June 30, 2010, collected by GuideStar, Inc. at http://www.guidestar.org.
17 Michelle Rhee, “Why StudentsFirst Supports Teachers’ Right To Collective Bargaining,” Huffington Post, March 29, 2011, http://www.huffingtonpost.com/michelle-rhee/why-studentsfirst-support_b_842220.html.
18 Lorraine M. McDonnell, Anthony H. Pascal, “Organized Teachers in American Schools,” RAND Corporation, February 1979, http://www.rand.org/pubs/reports/R2407.html; Andrew P. Kelly, Frederick M. Hess, “Scapegoat, Albatross, Or What?: The Status Quo In Teacher Collective Bargaining,” in Collective Bargaining in Education, ed. Jane Hannaway, et al. (Harvard Education Press, 2006).

405 HOW STRONG ARE U.S. TEACHER UNIONS? A STATE-BY-STATE COMPARISON.
Endnotes
19 Allysia Finley, “Wisconsin’s School Choice,” Wall Street Journal, September 19, 2012, http://professional.wsj.com/article/SB10000872396390443995604578004392726892824.html?lpe=WSJ_PRO&mg=com-wsj.
20 Hrebenar and Thomas.
21 “Who’s Who In A Growing Education Reform Movement,” Final Working Draft, PIE network, September 2012.
22 Emily Cohen, Kate Walsh, RiShawn Biddle, “Invisible Ink In Collective Bargaining: Why Key Issues Are Not Addressed,” National Council on Teacher Quality, July 2008, http://www.nctq.org/p/publications/docs/nctq_invisible_ink_20080801115950.pdf.
23 Allison Kimmel, “A New Politics Of Education? The Enactment And Implementation Of Teacher Effectiveness Legislation,” BA Thesis, Harvard College, March 2012 [advisor: Prof. Martin West].
24 Stuart Buck and Jay P. Greene, “Blocked, Diluted, And Co-Opted,” Education Next, Spring 2011, http://educationnext.org/blocked-diluted-and-co-opted/.
Copyright © 2022 FDOKUMEN