
Unions and the Employment Growth: Panel Data Evidence
31
Unions and Employment Growth: Panel Data Evidence Mark Wooden and Anne Hawke* National Institute of Labour Studies Flinders University of South Australia Correspondence should be addressed to: Professor Mark Wooden National Institute of Labour Studies Flinders University of South Australia GPO Box 2100 Adelaide SA 5001 AUSTRALIA Tel: 61 8 8201 2265 Fax: 61 8 8276 9060 * An earlier version of this paper was presented at the 1997 Conference of Economists, 28 September – 1 October 1997, University of Tasmania, Hobart. The authors are indebted to Robert Drago, David Levine and two anonymous referees for helpful comments and advice.
Transcript of Unions and the Employment Growth: Panel Data Evidence
Unions and Employment Growth: Panel Data Evidence
Mark Wooden and Anne Hawke*
National Institute of Labour Studies
Flinders University of South Australia
Correspondence should be addressed to:
Professor Mark Wooden
National Institute of Labour Studies
Flinders University of South Australia
GPO Box 2100 Adelaide SA 5001
AUSTRALIA
Tel: 61 8 8201 2265
Fax: 61 8 8276 9060
* An earlier version of this paper was presented at the 1997 Conference of Economists,
28 September – 1 October 1997, University of Tasmania, Hobart. The authors are indebted to
Robert Drago, David Levine and two anonymous referees for helpful comments and advice.

Unions and Employment Growth:
Panel Data Evidence
Abstract
This study adds to the small empirical literature on the impact unions exert on employment
growth using data from Australia. Unlike previous studies, the data used are from a panel of
firms surveyed at two points in time, rather than a single cross-section. The results indicate a
negative union effect on employment in private sector firms of about 2.5 per cent per annum
which, despite the very different institutional framework that prevails in Australia, is
consistent with results obtained in North American data.

A number of recent studies confirm what economists have long suspected — that unions
slow jobs growth. Blanchflower, Millward and Oswald (1991), for example, used workplace-
level data collected as part of the British Workplace Industrial Relations Survey in 1984 to
estimate an employment equation that controlled for the effects of union recognition (as well
as a small number of other potentially confounding influences). They concluded that, over the
period 1980 to 1984, employment in unionized establishments in the UK grew by three per
cent less per annum than employment in non-union establishments.1 Strikingly similar
conclusions have been reached in studies employing both US and Canadian data. Using a
sample of 1800 Californian manufacturing plants, Leonard (1992) reported that employment
growth in union plants was between two and four percentage points less than in non-union
plants, while Long (1993), in a study of 510 Canadian firms, estimated a union employment
growth differential of just under four per cent per annum. Somewhat differently, Bronars,
Deere and Tracy (1994), reported that firm-level unionization rates were significantly and
inversely associated with employment growth over the period 1975 to 1982 in a small sample
of publicly-traded US companies, with employment growth estimated to decline by between
one half and one percentage point in response to a ten per cent increase in unionization.
More recently, Blanchflower and Burgess (1996) have reported the results of estimating
employment growth equations using workplace-level data from both the UK and Australia.
While they found that the presence of unions tended to have a restraining effect on
employment growth in the UK sample, they found no evidence of a discernible impact of
unions in the Australian data.
The present study re-examines the issue of employment growth and the role unions in
Australia may have played in either fostering or retarding that process, using data collected as
part of the Australian Workplace Industrial Relations Surveys conducted in 1989/90 and
1995. Consistent with the earlier North American and UK studies, the central feature of the
analysis is the use of regression methods to isolate the union employment effect from other
2

potentially confounding influences. Unlike the earlier studies, however, the data used are
from a panel of firms, surveyed in both 1989/90 and 1995, rather than a single point-in-time
cross-section (where past employment is measured retrospectively). As a result, this study is
able to control not just for the fixed characteristics of firms and workplaces, but also for
changes in the economic environment and in managerial strategy.
Unions and Employment: Theoretical Background
Following Long (1993), at least three routes through which unions reduce employment
growth can be identified. First, through their ability to withhold labor supplies, unions are
presumed to seek and capture a share of monopoly rents for their members. This is reflected
in the presence of a substantial union wage mark-up which, in the US, has typically been
estimated as lying in the range of 10 to 15 per cent (Hirsch and Addison 1986, pp. 152–153).
Given downward sloping demand schedules, unionized firms should, therefore, tend to
employ smaller quantities of labor than comparable non-unionized firms.
Second, unions may make it relatively difficult for firms to put into effect downward
adjustments in the size of their workforce (through, for example, expensive redundancy
packages, and more costly and cumbersome dismissal procedures), which in turn will tend to
discourage firms from expanding their workforce. In a static model, this may not affect long-
run employment growth; a lower propensity to hire should be offset by a lower propensity to
fire. However, if growth is endogenous, then long-run employment outcomes may be
adversely affected.
Third, unions may adversely affect growth in sales which in turn will inhibit employment
growth. This might occur if unions: reduce the incentive for firms to invest in new capital;
reduce the scope for price cutting in an effort to maintain sales, especially when over-capacity
exists; interrupt the reliability of supply (through frequent work stoppages); or impose
restrictive work rules and practices
3
In contrast, there are at least two counter-arguments which suggest the possibility that
unions could actually contribute to higher rates of employment growth. While unions raise
wages, they may also raise worker productivity as a result of ‘voice’ effects. Unions provide a
mechanism for channelling grievances to management with a smaller risk of individual
workers being victimized (Freeman and Medoff 1984). This, it is claimed, can be beneficial
for productivity by: reducing the incidence of costly labor turnover; enhancing the incentives
for both employers and employees to invest in training; improving communication flows; and
raising overall worker morale. Unit labor costs, therefore, may not necessarily be any higher
in the presence of unions.
Finally, if unions and employers bargain simultaneously over wages and employment,
rather than over wages alone, then efficient outcomes are unlikely to lie on the labor demand
curve (e.g., Hall and Lilien 1979; McDonald and Solow 1981). If this is so, the effects of
unions on employment outcomes will be ambiguous. That said, the extent to which efficient
settlements will diverge from the demand curve depends on how much weight unions place
on employment.
The emerging consensus in North America and the UK is that negative union employment
effects outweigh the positive effects. This reflects a combination of:
(i) the presence of a large union wage mark-up;
(ii) growing evidence that any union productivity effect is either negative or very small
(Kaufman and Kaufman 1987; Lovell, Sickles and Warren 1988; Machin 1991; Wilson
and Cable 1991; Mitchell and Stone 1992; Byrne, Dezhbakhsh and King 1996); and
(iii) evidence that unions place a relatively low weight on employment compared to wages
(MaCurdy and Pencavel 1986; Wessels 1991).
4

It cannot, however, be presumed that such conclusions will necessarily carry over to other
economies where labor market institutions and practices may be very different. As noted
earlier, Blanchflower and Burgess (1996) reported an insignificant union effect on
employment in Australian data. While this result may reflect the short period over which
employment change was observed — just one year — there are other good reasons why a
weak union employment effect in Australia might have been expected.
Most importantly, it is not obvious that Australian unions have been able to exert a
significant intra-industry effect on wages. As discussed by Wooden and Baker (1994, p. 405),
employment conditions for most Australian workers have, at least until recently, been
determined largely by industry and occupational ‘awards’ which provide for legally
enforceable minimum rates of pay (as well as a range of minima with respect to other
employment conditions) that apply to both union and non-union workers employed in the
industries and occupations covered by those awards. Moreover, the coverage of these awards
is extensive, with 80 per cent of all employees in Australia in 1990 estimated to have been
covered. It thus follows that union negotiated increases in award rates of pay will affect union
and non-union workers equally.
Within the awards system, however, scope has traditionally existed for unions to engage in
informal ‘over-award’ bargaining, and hence the presence of the awards system per se does
not automatically mean that a union wage premium cannot exist. That said, this was not true
of the period covered by the Blanchflower and Burgess (1996) study — 1988 to 1989. The
centrepiece of federal economic policy during this time was the Accord, a consensual-type
incomes policy in which unions agreed not to pursue additional wage claims outside of those
provided by the centralized industrial tribunals through the awards mechanism (see Chapman
and Gruen 1990). In return, the union movement (and its membership) were to benefit from
improvements in the ‘social wage’ (as a result of the introduction of, and improvement in, a
range of health and social welfare measures), a much enlarged role in policy-making and,
more generally, from the benefits of economic growth that were presumed to follow. In this
5
climate, it follows that union members will not fare any better in terms of wages and other
employment conditions than non-union members who are also covered by the awards system.
This, in turn, implies no difference in employment outcomes.
On the other hand, industrial relations structures in Australia have been undergoing
enormous change during the 1990s, the period covered by the analysis reported in this study.
As documented by Quinlan (1996), Callus (1997) and Hawke and Wooden (1998), the 1990s
has seen both institutional and legislative change facilitating increased scope for more
decentralised forms of bargaining, and especially enterprise-level agreements. Hawke and
Wooden (1998), for example, report that in excess of 1.7 million Australian employees were
covered by enterprise agreements within the federal jurisdiction by September 1996. To this
figure can be added another 800,000 workers covered by enterprise agreements under State
jurisdictions (Joint Governments’ Submission 1997). In total, therefore, around 36 per cent of
Australian employees would appear to have been covered by enterprise agreements by late
1996. In contrast, such arrangements were rare in the 1980s. In this environment it seems
plausible that wage differentials between union and non-union workers might emerge and
union employment effects become more evident.
The Data
The data used in this analysis were collected from Australian workplaces during 1989/90
and 1995 as part of the Australian Workplace Industrial Relations Surveys (AWIRS).
Described in more detail in Callus et al. (1991) and Morehead et al. (1997), the AWIRS
involved a suite of structured questionnaires administered by a variety of methods to
managers, union delegates and (in 1995) employees, at representative samples of Australian
workplaces. The samples for both surveys were randomly selected from the Australian
Bureau of Statistics Business Register, after stratification by location, size and industry. The
survey covered all industry sectors with the exception of Agriculture, forestry and fishing and
Defence. The scope of the survey was also restricted to workplaces with at least five
6
employees, though researchers are often compelled to ignore workplaces with 5 to 19
employees since far less information was collected from the sub-sample of small workplaces.
The 1995 AWIRS also included a panel component. That is, a sample of workplaces from
the 1989/90 ‘main sample’ (2004 workplaces with 20 or more employees) that participated in
the 1989/90 survey were selected to be re-surveyed in 1995.2 The 1989/90 sample was
screened for survivors and 780 workplaces then selected. Interviews were successfully
conducted at 698 of these workplaces, giving a response rate of 89 per cent. Compared with
the cross-section data analysed in previous studies, panel data provide a more accurate
assessment of employment levels at different points in time. Moreover, it better enables the
identification of those influences which are fixed and those that vary over time.
The panel is not, however, a random sample of participants in the first survey for the
obvious reason that it only includes firms that survived from 1989 to 1995 (representing 86
per cent of the original workplace sample). Some analysis of survivors and ‘deaths’ is
provided in Morehead et al. (1997, pp. 48–51) which indicates that ‘deaths’ were more likely
among workplaces that were small, relatively young (less than two years old), part of a larger
organization, part of a Government business enterprise, had not been performing well in
1989/90 (as indicated by low rates of capacity utilization and negative rates of return on
assets) and had already been in the process of downsizing at the time of the 1989/90 survey.
There was, however, no difference in the death rate of workplaces with and without union
members. Further analysis of these data also revealed that there were no significant
differences in the mean level of union density (measured in 1989/90) at surviving workplaces
and at those that had ‘died’.
The employment data used in this analysis come from self-completion questionnaires
which were mailed to participating workplaces prior to interview, and relate to the total
number of employees working at or from the workplace during the pay periods ended on or
before September 30 1989, and on or before 18 August 1995. Respondents were given
7

instructions to include managers, all employees on paid leave and all employees on workers’
compensation, and to exclude contractors, agency workers, and home workers working on a
contract-for-service basis.
Table 1 cross-classifies a selection of workplace characteristics by workplace employment
levels in 1995 relative to employment in 1989. The elements in this table sum horizontally to
100 per cent. Thus, for example, almost 10 per cent of all workplaces declined in size by 50
per cent or more between 1989 and 1995. It can also be seen over this period, the number of
workplaces where employment fell by more than 10 per cent exceeded those where it rose by
more than 10 per cent. These findings are not surprising, and reflect the impact of the
economic downturn on the Australian labor market during the early 1990s.
Table 1 suggests that workplace growth is associated with both workplace size and more
obviously, organization status. Only seven per cent of the smaller workplaces (less than 50
employees) experienced a large fall in employment, compared with 15 per cent of large
workplaces (300 employees or more), while at the other end of the spectrum, small
workplaces were more likely to be growing rapidly, though the difference is not large.
Relationships with overall firm size, as distinct from workplace size, were far less obvious,
suggesting that part of the explanation for the weaker employment growth of large
workplaces may be larger enterprises opting for smaller, more decentralized business units.
The growth experience of private and private sector organizations and, more importantly,
public commercial (i.e., government business enterprises and commercial statutory
authorities) and public non-commercial organizations (e.g., government departments), also
appears to have been very different over the period under examination. Public sector
organizations operating on a commercial basis were much more likely to have downsized and
far less likely to have experienced rapid growth. Public non-commercial organizations, on the
other hand, appear to have avoided large-scale employment reductions.
8
Finally, and of most relevance to this study, Table 1 provides little evidence of any direct
relationship between employment change and unionization levels, especially among the large
majority of workplaces where at least one employee is a union member. Such findings are
consistent with the conclusions reached by Blanchflower and Burgess (1996). It now remains
to see whether this conclusion holds once other influences on employment growth are taken
into account.
Modelling Employment Growth
The statistical analysis revolves around the estimation of a type of reduced-form equation
where, following Blanchflower and Burgess (1996), the dependent variable is growth in
employment, rather than its level. Growth (g) is defined as the change in employment as a
percentage of the average of employment in the two periods. That is:
g = (E95-E89)/[(E89+E95)/2)] x 100
where E denotes employment and the subscripts refer to the year in which employment is
observed.
Unlike the conventional growth measure (change in employment as a percentage of
employment in the first period), this measure is approximately normally distributed (Davis
and Haltiwanger 1992). As indicated in Figure 1, the distribution in the values of g across the
workplaces in the sample (after weighting to account for sample stratification) appears to be
close to symmetric. Further evidence that the distribution is close to normal is provided by an
examination of skewness and kurtosis statistics. Descriptive statistics for both growth
measures are reported in Table 2. An exact normal distribution exists where the skewness
statistic has a value of zero and the kurtosis statistic a value of three. This is clearly not the
case for the conventional growth measure, which is both highly skewed and leptokurtic
(relatively few cases concentrated in the tails of the distribution). In contrast, the preferred
9

growth measure shows no signs of skewness, though a slight playtokurtic tendency (too many
cases concentrated in the tails of the distribution) is apparent.
The effects of unions were modelled, at least initially, with two variables: (i) a simple
dummy variable indicating the presence or absence of union members within the workforce
in 1989; and (ii) the density of union membership within the workplace in 1989. A range of
controls for other influences on employment growth were also tested, with the control
variables included in the specifications reported in this paper being:
(i) workplace employment in 1989;
(ii) a series of dummy variables to control for market demand conditions in 1989 and 1995;
(iii) measures of the degree of autonomy workplace management have from higher levels in
the organization, and change in the level of that autonomy;
(iv) a small number of variables to control for the effects of other firm characteristics; and
(v) dummy variables to control for changes in the workplace location, whether the
workplace was part of a merger during 1989-95, and whether the workplace was
defined differently across the two surveys.
As discussed further below, a control for workplaces where union membership declined to
zero between 1989 and 1995 was also added to the final model specification. A description
and statistical summary of the explanatory variables used is provided in Table 3. Note that
exclusion of all cases with missing observations on any variable of interest resulted in a final
sample size numbering 670 cases.
Experimentation was also undertaken with variables not reported in the paper. Included
here are industry, occupational mix of the workforce, workplace age, firm size (as distinct
from workplace size), foreign ownership, and measures of the degree of product market
competition and changes in the level of that competition. None of these variables exhibited
any significant explanatory power and were subsequently omitted from the analysis.
10

The equations are estimated using ordinary least squares (OLS).
Results
The main OLS results using the total sample are presented in columns (1) and (2) of Table
4. Since there is evidence of heteroskedasticity in all specifications, the t-ratios have been
adjusted accordingly.3
Looking first at the short specification in column (1), the union dummy is found to be
positively signed but insignificant. This result, however, is not of large interest given that
only 12 per cent of workplaces in the sample do not have union members present. More
interesting is the variable, Union Density. Consistent with the North American and UK
research, Union Density is negatively signed and highly significant. Moreover, the estimated
coefficient implies that a workplace with the mean level of union density (63.4%)
experienced a rate of employment growth during 1989-95 which was 15 percentage points
less than that of an otherwise comparable workplace with an almost zero level of union
density, or about two and a half per cent per annum. This result is thus consistent (though at
the lower end of the range) with estimates obtained in North American and UK data.
Column (2) reports the results of estimating a longer specification in which a larger
number of controls are added to the equation. In this specification the coefficient on the
Union Density variable is much smaller (though still sizeable) and is no longer statistically
significant, suggesting that the significant negative union effect on employment growth in
specification (1) may have been due to correlation with relevant omitted variables. Note,
however, that diagnostic testing suggests that the functional form of this specification is
problematic.
The results on the other control variables are, for the most part, in line with expectations.
Mergers between workplaces, of course, by definition, mean increased employment, while
11

the negative sign on Employment 89 indicates that small workplaces grow more rapidly than
large workplaces. The positive sign on Autonomy indicates that workplaces which are tightly
controlled by higher levels within the organization are far less likely to have experienced
employment growth compared with workplaces which are relatively autonomous. This
finding thus suggests that centralized, bureaucratic organizational structures work against
employment growth. Further, the results suggest that employment growth has been affected
not just by the level of managerial autonomy within the workplaces, but also by changes in
that level over the survey period. Finally, large differences were found between the
employment experiences of workplaces that were part of private sector organizations, those
that were part of public commercial enterprises and those that were part of public non-
commercial enterprises. As noted earlier when discussing Table 1, employment growth
appears to have been strongest among the latter (the control group) and weakest (and
typically declining) at workplaces that were part of government-operated commercial
enterprises.
Further analysis revealed that the union variable was particularly sensitive to the inclusion
of the private sector dummy variable, and hence the equations were re-estimated after
splitting the sample into its private sector and public sector components. These results are
reported in columns (3) and (5) respectively, and reveal that the magnitude of the impact of
Union Density on employment is very different in the two sectors. In the public sector sub-
sample there is no evidence of any negative union impact on employment. In contrast, in the
private sector the effect is sizeable (10 percentage points when calculated at the mean),
though still only weakly significant.
Finally, in equations (4) and (6), our specification is augmented with a variable that
isolates workplaces which completely de-unionized over the period under examination. As
noted in Blanchflower et al. (1991), use of OLS ignores the possibility of simultaneity bias —
causation running not only from unions to employment growth, but in the reverse direction.
Like Blanchflower et al., we believe this is unlikely to be a serious problem given the decline
12

in union density in Australia clearly pre-dates declines in employment. Australian Bureau of
Statistics data, for example, indicate that the number of employees who were trade union
members rose by less than four per cent between 1982 and 1990, whereas the number of
employees over this period rose by 27 per cent.4 Indeed, research undertaken in parallel to
that reported here could find no significant role for either workplace size or changes in
workplace size in explaining changes in union density in these data (Wooden forthcoming).
Nevertheless, there are good reasons to expect that in the small number of cases (n=33)
where the workforce had, subsequent to 1989, totally de-unionized (i.e., there were no longer
any union members at the workplace), the change in unionization levels may well have been
a response to falling levels of employment. While this is not necessarily a problem for our
analysis, given the key explanatory variable is measured as a level rather than as a rate of
change, the fact that these de-unionized workplaces typically had relatively low rates of union
density (mean unweighted density was 41.9%) suggests either omitting these cases or holding
their effects constant through inclusion of a dummy variable.
As it transpires, the treatment of these de-unionised workplaces has a major bearing on the
results, at least within the private sector workplaces. Once de-unionized workplaces were
controlled for, the size (in absolute terms) and significance of the coefficient on Union
Density in the private sector increased markedly, with the estimated coefficient again
suggesting an adverse union employment effect of almost two and half per cent per annum.
Comparable results for the public sector are reported in column (6), and again there is no
evidence for any adverse union employment effect in this sector.
A number of different variants of the column (4) specification were estimated and, in the
main, it proved difficult to improve on the specification reported. First, Union Density was
replaced with a unionization variable measured at the industry, rather than workplace, level.
The inclusion of this variable would be justified if the main vehicle for unions obtaining
higher wages for their members was through the system of industry-based awards, and hence
13

any union wage effects would be passed on to all workers in the industry. This variable did
not exhibit any statistically significant association with employment growth.
Second, a number of more direct measures of union activity within the workplace (such as
the number of union delegates per employee, the presence of union delegates who spend the
majority of their work time on union business, the presence of joint consultative committee
arrangements and whether workers would rely on union representations to management when
concerned about work practices) were experimented with. Rarely did the measures examined
achieve any statistical significance, let alone outperform Union Density.
Third, interaction effects between Union Density and the main control variables were
tested for. Weakly significant associations were reported for interactions with both
Employment 89 and Change in Autonomy, with the positive coefficients suggesting that the
negative effects of union membership on employment are somewhat less severe in both large
workplaces and workplaces where the shift towards greater managerial autonomy has been
most pronounced. In addition, a significant negative interaction between union density and
one of the demand variables — Demand6 (identifying workplaces where demand was
contracting in both 1989 and 1995) — was also found. This interaction is not unexpected,
and presumably reflects the ability of unions to restrict lay-offs (a result which is consistent
with other findings reported by Miller and Mulvey 1991). The estimated size of all of these
effects, however, were extremely small and hence can safely be ignored.
Fourth, the issue of whether or not the presence or absence of arrangements supporting
closed union shops exerted any additional effect on employment growth was examined.
Unfortunately, the presence of closed shops is not directly measured in either the 1989/90
AWIRS or in the panel survey. Nevertheless, a dummy variable indicating 100 per cent
unionization among non-managerial employees failed to achieve statistically significant
levels.
14

Fifth, the robustness of the results to outliers was tested for. Specifically, all cases where
the value of the dependent variable was more than two standard deviations from the sample
mean were omitted. This had very little effect on the results. Most importantly, the size and
significance of the coefficient on the union density variable in the private sector equation was
little changed (β = -0.290; se = 0.083).
Finally, the sensitivity of the results to the specification of the dependent variable in terms
of rates of change rather than levels was examined. Specifically, the dependent variable used
here was replaced by log employment. The overall pattern of results was little changed,
though the size of the estimated effect of union density was slightly smaller — 2.2 per cent
per annum within the private sector. A specification in terms of the level of employment,
however, is less attractive since it restricts workplaces of different sizes to growing at the
same rate.
Conclusions
The results presented in this paper confirm conclusions reached in North American and
UK research — unions slow jobs growth. This adverse effect of trade unions on employment
growth in Australia, however, appears to be confined to the private sector. No evidence of
any impact of unions on employment growth in the public sector could be found. Within the
private sector, the union employment effect is quite large, with workplaces with average
levels of union density in 1989/90 estimated to have experienced rates of employment growth
which are close to 2.5 percentage points per annum less than lowly unionized workplaces.
This estimate is consistent with North American and UK research where the union impact on
employment has been estimated to lie in the range of two to four per cent per annum.
Less clear is the mechanism through which unions lower private sector employment
growth in Australia. Three possible explanations lie in the effect unions have upon: (i) wages;
(ii) the cost of adjustments to workforce size; and (iii) sales and output growth. It is argued
15
here that it is the latter route which is the most likely explanation of the negative union
employment effect identified in this paper. That said, it is admitted that this conclusion is
reached not on the basis of any strong supporting evidence in its favour, but because of
evidence suggesting that the alternative explanations are unlikely to be of large importance.
Turning first to the role of union wage effects, it was hypothesised earlier that while the
awards system has historically acted to constrain the emergence of a union wage differential
in Australia, such effects may have diminished during the period covered by this study as a
result of the spread of enterprise-level collective bargaining. Recent empirical evidence,
however, is not consistent with this hypothesis. Miller and Mulvey (1996), for example, in
what is arguably the most well controlled study of union wage effects undertaken in Australia
to date, reported that, after controlling for inter-industry differences, the union wage
differential in 1993 data was insignificant for women and very small for men (around 2.6 per
cent).5 Such conclusions receive further confirmation from an analysis of individual wages
data collected from employees as part of the same data collection employed in this study —
the 1995 AWIRS (Wooden 1998).6 These findings thus suggest that it is difficult to attribute
much of the lower rate of employment growth in unionised firms over the period examined to
differential rates of wage growth.
The second hypothesised route — that unions reduce long-run employment growth by
reducing the ability of firms to lay-off workers — is also contentious, as evidenced by the
recent debate in Australia following the introduction of review processes for unfair dismissals
in the federal jurisdiction as part of the Industrial Relations Reform Act 1993.7 While it is
clear that lay-offs are less common where union density is high (see Miller and Mulvey
1991), it does not necessarily follow that this will translate into lower rates of employment
growth, since reduction in hires should be, at least in part, compensated for by reductions in
firings. The evidence presented in this analysis, while hardly conclusive, provides little
support for the hypothesis that the dampening effect on hiring outweighs its effect on firing.
For example, if union-imposed restrictions on the ability to lay-off workers impact on the
16

employment decisions of firms, then we might expect the impact of demand growth to be
weaker in highly unionised workplaces than in lowly unionised workplaces. However, as
noted earlier, interaction terms between Union Density and the high growth demand variables
(e.g., Demand1) were statistically insignificant when added to our preferred specification.
This thus leaves the impact of unions on sales and output as the only remaining candidate.
Unfortunately, unlike the US, the impact of unions on output measures has not been the
subject of extensive research in Australia. Moreover, what research evidence is available is
mixed. Both Crockett et al. (1992) and Drago and Wooden (1992), for example, have
reported evidence of a (weak) negative union impact on productivity in Australia using
workplace-level data. Phipps and Sheen (1994), on the other hand, analysed aggregate time-
series data pooled across industries and found evidence that high levels of unionization has
been associated with relatively rapid rates of total factor productivity growth.
Overall, it is clear that far more research is required before any firm conclusions can be
reached about the relative importance of the various channels through which unions impede
employment growth.
Another puzzle is the apparent discontinuity in the relationship between union density and
employment growth at zero density rates. Specifically, rates of employment growth were
found to be 15 percentage points less in non-union workplaces than in workplaces with
positive, but very low rates of unionization. This result is very different from overseas
studies. One explanation lies in the unique processes of formalized industrial relations in
Australia. The presence of trade unions at a workplace provides scope for these workplaces to
be ‘roped-in’ to more general industrial relations objectives of the trade union movement.
This ‘union-threat’ is likely to increase with union density. As a result, managers of
workplaces with low levels of unionization may be encouraged to adopt improved human
relations practices which dampen the incentive for other employees to join a trade union.
Workplaces without a trade union presence, on the other hand, may perceive the chance of
17

their workforce becoming unionized as more remote, and hence fail to adopt strategies which
might have enhanced employment growth at the workplace. Such explanations, however, are
highly conjectural.
REFERENCES
Blanchflower, David G. and Simon Burgess. 1996. “New Technology and Jobs: Comparative
Evidence From a Two-Country Study.” Centre for Economic Performance Discussion
Paper No. 285. London: London School of Economics and Political Science.
Blanchflower, David G., Neil Millward and Andrew J. Oswald. 1992. ‘‘Unionism and
Employment Behaviour.’’ Economic Journal 101 (July): 815–834.
Bronars, Stephen G., Donald R. Deere and Joseph S. Tracy. 1994. ‘‘The Effects of Unions on
Firm Behavior: An Empirical Analysis Using Firm-level Data.’’ Industrial Relations 33
(October): 426–451.
Byrne, Dennis, Hashem Dezhbakhsh and Randall King. 1996. ‘‘Unions and Police
Productivity: An Econometric Investigation.’’ Industrial Relations 35 (October): 566–584.
Callus, Ron. 1997. “Enterprise Bargaining and the Transformation of Australian Industrial
Relations.” Asia Pacific Journal of Human Resources 35 (2): 16–25.
Callus, Ron, Alison Morehead, Mark Cully and John Buchanan. 1991. Industrial Relations at
Work: The Australian Workplace Industrial Relations Survey. Canberra: Australian
Government Publishing Service.
18

Chapman, Bruce J. and Fred Gruen. 1990. “An Analysis of the Australian Consensual
Incomes Policy: The Prices and Incomes Accord.” In The Art of Full Employment, edited
by Chris de Neubourg, pp. 475–504. Amsterdam: Elsevier/North Holland.
Crockett, Geoffrey, Peter Dawkins, Paul Miller and Charles Mulvey. 1992. “The Impact of
Unions on Workplace Productivity in Australia.” Australian Bulletin of Labour 18 (June):
119–141.
Davis, Steven J. and John Haltiwanger. 1992. ‘‘Gross Job Creation, Gross Job Destruction,
and Employment Reallocation.’’ Quarterly Journal of Economics 107 (August): 819–863.
Drago, Robert and Mark Wooden. 1992. “The Australian Workplace Industrial Relations
Survey and Workplace Performance.” Australian Bulletin of Labour 18 (June): 142–167.
Freeman, Richard B. 1994. ‘‘American Exceptionalism in the Labor Market: Union–
Nonunion Differentials in the United States and Other Countries.’’ In Labor Economics
and Industrial Relations Markets and Institutions, edited by Clark Kerr and Paul D.
Straddohar, pp. 272–299. Cambridge, MA: Harvard University Press.
Freeman, Richard B. and James L. Medoff. 1984. What Do Unions Do? New York: Basic
Books.
Griffin, Gerard and Stuart Svensen. 1996. ‘‘The Decline of Australian Union Density — A
Survey of the Literature.’’ Journal of Industrial Relations 38 (December): 505–547.
Hall, Robert E. and David M. Lilien. 1979. ‘‘Efficient Wage Bargains Under Uncertain
Supply and Demand.’’ American Economic Review 69 (December): 868–879.
19

Hawke, Anne and Mark Wooden. 1998. “The Changing Face of Australian Industrial
Relations.” The Economic Record 74 (March): 74–88.
Hirsch, Barry T. and John T. Addison. 1986. The Economic Analysis of Unions: New
Approaches and Evidence. Winchester: Allen and Unwin.
Joint Governments’ Submission. 1997. Safety Net Review — Wages: August 1996-January
1997. Canberra: Commonwealth Department of Industrial Relations.
Kaufman, Robert S. and Roger T. Kaufman. 1987. ‘‘Union Effects on Productivity,
Personnel Practices, and Survival in the Automotive Parts Industry.’’ Journal of Labor
Research 8 (Fall): 333–350.
Leonard, Jonathan S. 1992. ‘‘Unions and Employment Growth.’’ Industrial Relations 31
(Winter): 80–94.
Long, Richard J. 1993. ‘‘The Effect of Unionization on Employment Growth of Canadian
Companies.’’ Industrial and Labor Relations Review 46 (July): 691–703.
Lovell, C.A. Knox, Robin C. Sickles and Ronald S. Warren. 1988. ‘‘The Effect of
Unionization on Labor Productivity: Some Additional Evidence.’’ Journal of Labor
Research 9 (Winter): 55–63.
MacDermott, Therese. 1997. “Industrial Legislation in 1996: The Reform Agenda.” Journal
of Industrial Relations 39 (March): 52–76.
Machin, Stephen J. 1991. “The Productivity Effects of Unionisation and Firm Size in British
Engineering Firms.” Economica 58 (November): 479–490.
20

Machin, Stephen J. and Sushil Wadhwani. 1991. ‘‘The Effects of Unions on Organisational
Change and Employment.’’ Economic Journal 101 (July): 835–854.
MaCurdy, Thomas E. and Pencavel, John H. 1986. ‘‘Testing Between Competing Models of
Wage and Employment Determination in Unionized Markets.’’ Journal of Political
Economy 94 (June, pt 2): S3–S39
McDonald, Ian M. and Solow, Robert M. 1981. ‘‘Wage Bargaining and Employment.’’
American Economic Review 71 (December): 896–908.
Miller, Paul W. and Charles Mulvey. 1991. ‘‘Australian Evidence on the Exit/Voice Model
of the Labor Market.’’ Industrial and Labor Relations Review 45 (October): 44–57.
Miller, Paul W. and Charles Mulvey. 1996. ‘‘Unions, Firm Size and Wages.’’ Economic
Record 72 (June): 138–153.
Miller, Paul W., Charles Mulvey and Moi Lan Neo. 1997. “Unions and Wages: A Further
Analysis.” The Centre for Labour Market Research, Discussion Paper 97/1, Curtin
University of Technology, Perth.
Mitchell, Merwin W. and Joe A. Stone. 1992. ‘‘Union Effects on Productivity: Evidence
from Western U.S. Sawmills.’’ Industrial and Labor Relations Review 46 (October): 135–
145.
Morehead, Alison, Mairi Steele, Michael Alexander, Kerry Stephen and Linton Duffin. 1997.
Changes at Work: The 1995 Australian Workplace Industrial Relations Survey. South
Melbourne: Addison Wesley Longman.
21
Phipps, A.J. and J.R. Sheen. 1994. “Unionisation, Industrial Relations and Labour
Productivity Growth in Australia: A Pooled Time-Series / Cross-Section Analysis of TFP
Growth.” Labour Economics and Productivity 6 (March): 54–78.
Quinlan, Michael. 1996. “The Reform of Australian Industrial Relations: Contemporary
Trends and Issues.” Asia Pacific Journal of Human Resources 34 (2): 3–27.
Wessels, Walter J. 1991. ‘‘Do Unions Contract for Added Employment?’’ Industrial and
Labor Relations Review 45 (October): 181–193.
White, Halbert. 1978. ‘‘A Heteroskedasticity Consistent Covariance Matrix and a Direct Test
for Heteroskedasticity.’’ Econometrica 48 (May): 817–838.
Wilson, Nicholas and John R. Cable. 1991. ‘‘Unions, Wages and Productivity: Some
Evidence from UK Engineering Firms.’’ Applied Economics 23 (January): 219–227.
Wooden, Mark. 1998. “Explaining Wage Outcomes: The Role of Firm and Workplace
Characteristics.” Paper presented to the US Census Bureau, International Symposium on
Linked Employer-Employee Data, Arlington, Virginia, 21-22 May.
Wooden, Mark. Forthcoming. “Union Amalgamations and the Decline in Union Density.”
Journal of Industrial Relations.
Wooden, Mark and Meredith Baker. 1994. “Trade Unions and Quits: Australian Evidence.”
Journal of Labor Research 15 (Fall): 403–418.
22
ENDNOTES
1 Machin and Wadhwani (1991) estimated employment equations using the same data
used by Blanchflower et al. (1991) but concluded that any negative impact of unions on
employment was confined to workplaces which reformed working conditions during
the period under consideration (1980 to 1984). These strikingly different conclusions
are the subject of substantial debate within the papers themselves. We are persuaded by
Blanchflower et al. who found, after replacing the simple union recognition dummy
with a union density variable, that unions exert a negative effect on employment
irrespective of whether organisational change occurred. Furthermore, as Blanchflower
et al. (1991, p. 829) noted, the organisational change variable almost certainly captures
part of the transmission mechanism by which unions lead to employment decline. 2 The 1989/90 sample of 2004 workplaces was achieved from 2300 contacts, giving a
response rate of 89 per cent. 3 All equations have been estimated using LIMDEP (version 7.0). The estimated
covariance matrix to correct for heteroskedasticity is based on the estimator devised by
White (1978). 4 For an overview of the decline in union density in Australia and a review of relevant
literature, see Griffin and Svensen (1996). 5 In a more recent paper, Miller, Mulvey and Neo (1997) report evidence of the existence
of a union wage premium in Australia, but only in lowly unionised industries. 6 Freeman (1994) also reported insignificant union wage effects for Australian workers in
his cross-country study of union—nonunion wage differentials. 7 Many of the provisions introduced in this Act were either removed or significantly
watered down as part of the Workplace Relations Act 1996, which became law from
December 31, 1996 (see MacDermott 1997).
23
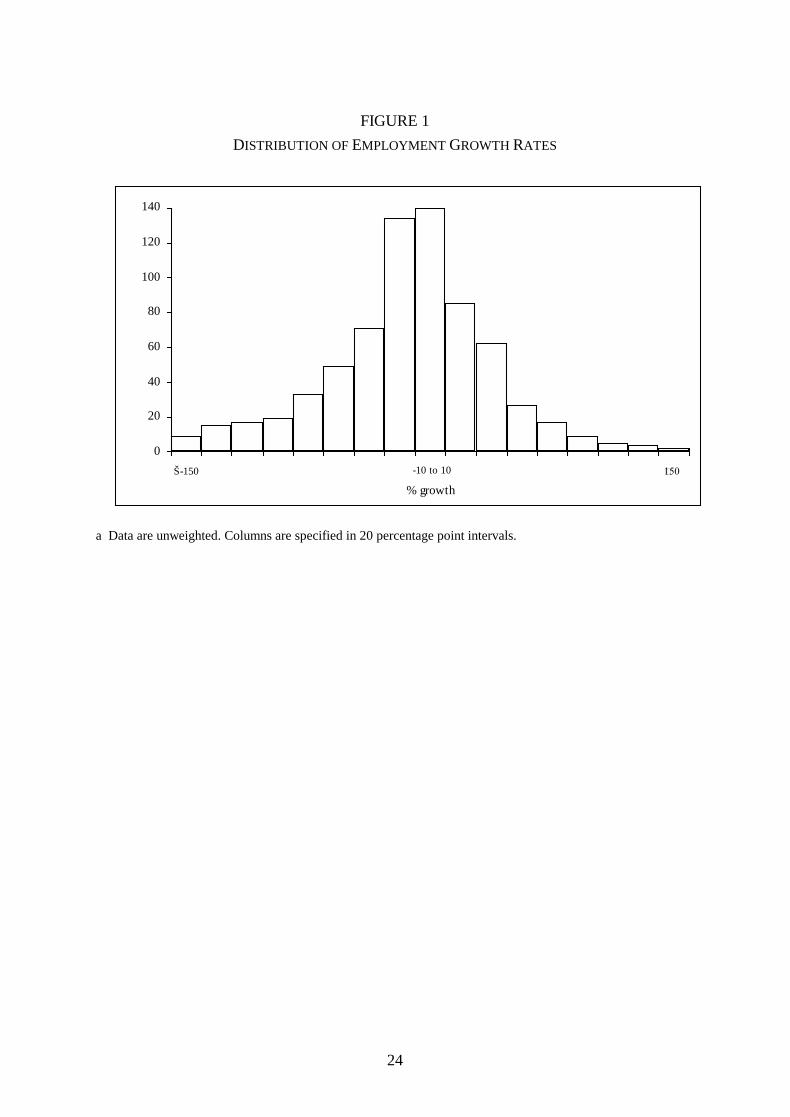
FIGURE 1 DISTRIBUTION OF EMPLOYMENT GROWTH RATES
% growth
0
20
40
60
80
100
120
140
Š-150 �150-10 to 10
a Data are unweighted. Columns are specified in 20 percentage point intervals.
24

TABLE 1 EMPLOYMENT GROWTH OF WORKPLACES, 1989–1995, BY WORKPLACE CHARACTERISTICS
(%) 1995 employment level relative to 1989 level: <50% 50% to
<90% Within 10%
>10% to 50%
higher
>50% higher
Na
All workplaces 9.8 36.5 22.4 19.5 11.8 698
Workplace size, 1989 (no 698 <50 7.4 37.3 21.1 20.9 13.2 50-99 12.3 34.0 24.9 17.3 11.5 100-299 10.9 35.7 23.4 21.1 8.8 300 or more 14.9 43.0 18.5 12.7 10.9
Firm size, 1989/90 (no. of 607 <100 10.3 43.4 9.7 23.6 13.0 100-999 12.4 28.3 24.8 19.3 15.2 1000 or more 9.7 39.2 21.5 18.4 11.1
Organization status 698 Private sector 10.8 38.7 20.6 17.4 12.5 Public commercial 30.9 31.1 20.3 6.5 11.3 Public non-comm. 3.8 33.0 26.5 26.3 10.3
Union density, 1989/90 679 Zero 3.3 37.9 26.8 17.6 14.3 >0% to <50% 12.0 30.6 17.8 26.2 13.4 50% to <75% 11.0 34.8 25.5 18.5 10.2 >75% 12.0 39.6 19.8 18.4 10.1
Source: 1995 Australian Workplaces Industrial Relations Survey, panel component. a While unweighted sample sizes are reported here, the percentages presented in the body of the table are derived after applying sample weights to ensure a representative sample.
25

TABLE 2 EMPLOYMENT GROWTH MEASURES: DESCRIPTIVE STATISTICSa
Descriptive statistic Conventional growth measure
(E95-E89)/E89 x 100 Preferred growth measure
(E95-E89)/[(E89+E95)/2)] x 100
Mean 4.86 -7.66 Standard deviation 70.01 46.01 Skewness 7.79* -0.22 Kurtosis 120.90* 1.25* * Significant at the 0.05 level in a two-tailed test. a Unweighted N=698.
26

TABLE 3 EXPLANATORY VARIABLES: DESCRIPTIONS AND SUMMARY STATISTICSa
Variable name Description Mean (SD) Total
sample Private sector
Public sector
Employment 89 Number of employees at the workplace in 1989
266.28 (512.04)
231.40 (463.78)
310.62 (565.20)
Union A dummy variable for workplaces where, in 1989/90, any union members were present
0.881 (0.325)
0.813 (0.390)
0.966 (0.181)
Union Density Union members in 1989/90 as a percentage of total employment in 1989
63.384 (32.564)
54.897 (35.807)
74.172 (23.944)
Deunionized A dummy variable for workplaces where union membership fell to zero between 1989 and 1995
0.048 (0.213)
0.077 (0.267)
0.010 (0.101)
Demand1 A dummy variable for workplaces where demand for main product was expanding in 1989/90 and in 1995
0.327
(0.469)
0.269
(0.444)
0.400
(0.491) Demand2 A dummy variable for workplaces where
demand for main product was expanding in 1989/90 but stable in 1995
0.196
(0.397)
0.181
(0.386)
0.214
(0.411) Demand3 A dummy variable for workplaces where
demand for main product expanding in 1989/90 but contracting in 1995
0.054
(0.226)
0.061
(0.240)
0.044
(0.206) Demand4 A dummy variable for workplaces where
demand for main product was contracting in 1989/90 but expanding in 1995
0.036
(0.186)
0.037
(0.190)
0.034
(0.181) Demand5 A dummy variable for workplaces where
demand for main product was contracting in 1989/90 but stable in 1995
0.061
(0.240)
0.085
(0.280)
0.031
(0.172) Demand6 A dummy variable for workplaces where
demand for main product was contracting in 1989/90 and in 1995
0.031
(0.174)
0.037
(0.190)
0.024
(0.152) Demand7 A dummy variable for workplaces where
demand for main product was fairly predictable in 1989/90 but largely unpredictable in 1995
0.139
(0.346)
0.152
(0.360)
0.122
(0.328) Autonomy An index of the level of autonomy of the
workplace from higher levels in the organization (scored from 0 to 100), measured in 1989/90b
78.271
(26.752)
87.501
(18.543)
66.537
(30.730)
Change in Autonomy
Change in the level of autonomy between 1989/90 and 1995
0.886 (22.217)
-2.624 (18.330)
5.348 (25.692)
Single Workplace Organization
A dummy variable for single workplace organizations (measured in 1989/90)
0.115 (0.319)
0.163 (0.370)
0.054 (0.227)
27
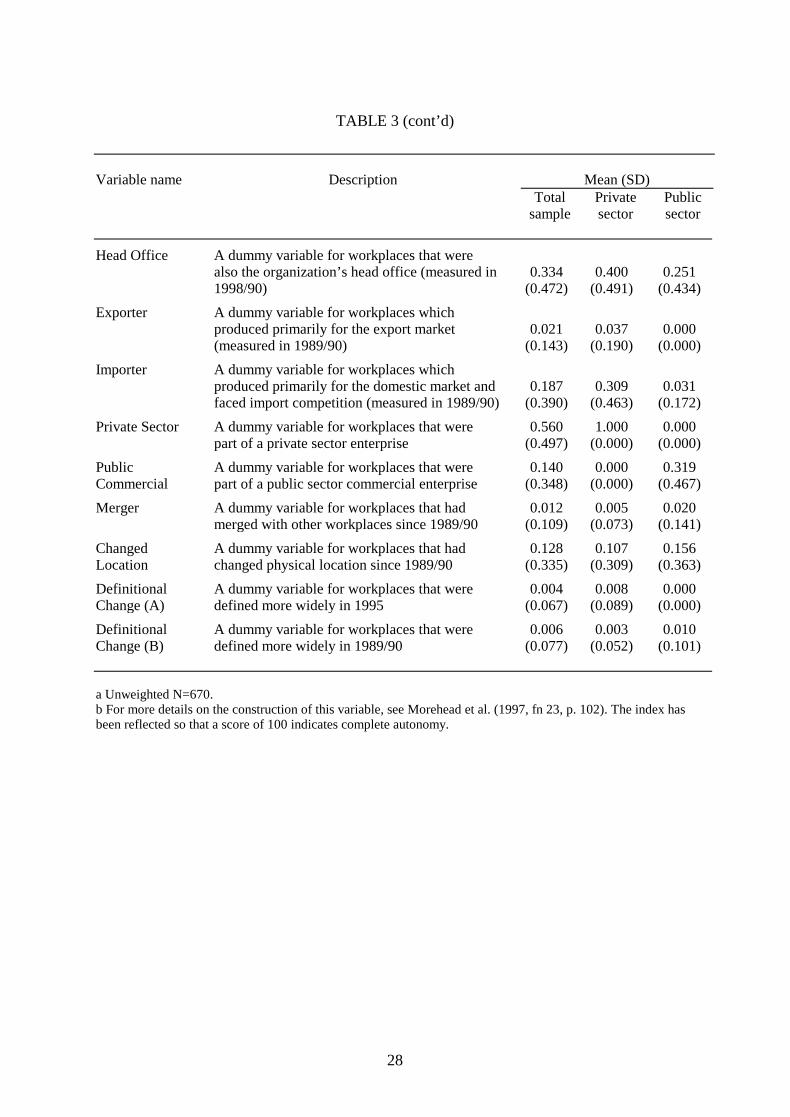
TABLE 3 (cont’d) Variable name Description Mean (SD) Total
sample Private sector
Public sector
Head Office A dummy variable for workplaces that were also the organization’s head office (measured in 1998/90)
0.334
(0.472)
0.400
(0.491)
0.251
(0.434) Exporter A dummy variable for workplaces which
produced primarily for the export market (measured in 1989/90)
0.021
(0.143)
0.037
(0.190)
0.000
(0.000) Importer A dummy variable for workplaces which
produced primarily for the domestic market and faced import competition (measured in 1989/90)
0.187
(0.390)
0.309
(0.463)
0.031
(0.172) Private Sector A dummy variable for workplaces that were
part of a private sector enterprise 0.560
(0.497) 1.000
(0.000) 0.000
(0.000) Public Commercial
A dummy variable for workplaces that were part of a public sector commercial enterprise
0.140 (0.348)
0.000 (0.000)
0.319 (0.467)
Merger A dummy variable for workplaces that had merged with other workplaces since 1989/90
0.012 (0.109)
0.005 (0.073)
0.020 (0.141)
Changed Location
A dummy variable for workplaces that had changed physical location since 1989/90
0.128 (0.335)
0.107 (0.309)
0.156 (0.363)
Definitional Change (A)
A dummy variable for workplaces that were defined more widely in 1995
0.004 (0.067)
0.008 (0.089)
0.000 (0.000)
Definitional Change (B)
A dummy variable for workplaces that were defined more widely in 1989/90
0.006 (0.077)
0.003 (0.052)
0.010 (0.101)
a Unweighted N=670. b For more details on the construction of this variable, see Morehead et al. (1997, fn 23, p. 102). The index has been reflected so that a score of 100 indicates complete autonomy.
28

TABLE 4 EMPLOYMENT GROWTH EQUATIONS: OLS RESULTS
Total sample Private sector Public sector (1) (2) (3) (4) (5) (6)
Employment 89 (coefficient x 100)
-0.82** (2.40)
-1.30*** (3.49)
-1.60*** (3.00)
-1.60*** (2.97)
-1.12** (2.18)
-1.06** (2.08)
Union 11.55 (1.41)
4.95 (0.63)
6.83 (0.77)
15.21* (1.69)
3.05 (0.20)
0.28 (0.02)
Union Density -0.24*** (2.70)
-0.14 (1.47)
-0.18* (1.72)
-0.27** (2.50)
-0.008 (0.05)
0.007 (0.04)
Deunionized
-25.47** (2.12)
45.47 (1.38)
Merger 63.79*** (5.15)
60.06*** (3.69)
31.14 (1.04)
30.20 (0.95)
65.10*** (3.42)
65.34*** (3.43)
Changed Location -9.35 (1.22)
-13.17* (1.76)
-20.23* (1.86)
-18.99* (1.73)
-3.99 (0.40)
-3.40 (0.34)
Definitional Change (A) -14.50 (0.23)
-18.28 (0.28)
-13.38 (0.20)
-12.28 (0.18)
Definitional Change (B) (coefficient / 100)
-1.15*** (5.00)
-1.09*** (3.93)
-1.73*** (20.69)
-1.51*** (10.17)
-0.86** (2.57)
-0.86** (2.57)
Demand1 7.18 (1.50)
3.69 (0.64)
2.26 (0.40)
13.22 (1.65)
13.98* (1.74)
Demand2 7.08 (1.19)
2.92 (0.40)
1.73 (0.24)
16.78* (1.71)
17.24* (1.77)
Demand3 -6.77 (0.83)
-13.29 (1.57)
-14.22* (1.73)
-0.60 (0.04)
0.32 (0.02)
Demand4 -25.40** (2.57)
-36.18** (2.36)
-35.83** (2.46)
-15.88 (1.47)
-15.36 (1.43)
Demand5 -9.35 (0.89)
-18.76* (1.79)
-19.73* (1.94)
14.36 (0.49)
15.01 (0.51)
Demand6 -19.50 (1.43)
4.37 (0.31)
6.90 (0.52)
-65.33*** (3.73)
-64.84*** (3.71)
Demand7 -10.88* (1.90)
-20.72*** (3.08)
-17.95*** (2.83)
2.16 (0.22)
3.11 (0.32)
Autonomy 0.27** (2.40)
0.35** (2.12)
0.35** (2.17)
0.27* (1.69)
0.26 (1.64)
Change in Autonomy 0.45*** (4.07)
0.44*** (2.93)
0.42*** (2.85)
0.51*** (3.12)
0.51*** (3.13)
Single Workplace Organization
-0.82 (0.12)
-6.15 (0.79)
-4.96 (0.63)
1.33 (0.16)
-4.72 (0.36)
29

TABLE 4 (cont’d)
Total sample Private sector Public sector (1) (2) (3) (4) (5) (6)
Head Office -6.11 (1.05)
-5.13 (0.74)
-5.03 (0.74)
-10.74 (1.06)
-10.24 (1.02)
Exporter 2.03 (0.23)
1.70 (0.20)
4.56 (0.51)
Importer -9.99** (2.00)
-11.76** (2.30)
-12.66** (2.52)
Private Sector -6.99 (1.37)
Public Commercial -30.52*** (3.92)
-31.97*** (4.11)
-31.83*** (4.15)
Constant -4.83 (1.00)
-13.18 (1.25)
-19.39 (1.31)
-19.96 (1.38)
-28.44* (1.71)
-27.55* (1.68)
Adjusted R-squared 0.056 0.129 0.125 0.139 0.150 0.153 Diagnostics: Model fit (F) 6.65*** 5.50*** 3.67*** 3.87*** 3.89*** 3.79*** Heteroscedasticity (χ2) 51.89*** 121.22** 105.46*** 121.29*** 45.60*** 43.00*** Functional form (F) 1.35 4.36*** 0.55 1.42 3.80** 4.06*** N 670 670 375 375 295 295
Heteroskedastic consistent t-ratios are in parentheses. * Significant at the 0.10 level in a two-tailed test; ** Significant at the 0.05 level in a two-tailed test; *** Significant at the 0.01 level in a two-tailed test.
30