How Much Semantic Data on Small Devices
11
Open Research Online The Open University’s repository of research publications and other research outputs How much semantic data on small devices? Conference Item How to cite: d’Aquin, Mathieu; Nikolov, Andriy and Motta, Enrico (2010). How much semantic data on small de- vices? In: EKAW 2010, Conference - Knowledge Engineering and Knowledge Management by the Masses, 11-15 Oct 2010, Lisbon, Portugal. For guidance on citations see FAQs . c 2010 EKAW Version: Accepted Manuscript Link(s) to article on publisher’s website: http://ekaw2010.inesc-id.pt/ Copyright and Moral Rights for the articles on this site are retained by the individual authors and/or other copy- right owners. For more information on Open Research Online’s data policy on reuse of materials please consult the policies page. oro.open.ac.uk
Transcript of How Much Semantic Data on Small Devices

Open Research OnlineThe Open University’s repository of research publicationsand other research outputs
How much semantic data on small devices?
Conference ItemHow to cite:
d’Aquin, Mathieu; Nikolov, Andriy and Motta, Enrico (2010). How much semantic data on small de-vices? In: EKAW 2010, Conference - Knowledge Engineering and Knowledge Management by the Masses,11-15 Oct 2010, Lisbon, Portugal.
For guidance on citations see FAQs.
c© 2010 EKAW
Version: Accepted Manuscript
Link(s) to article on publisher’s website:http://ekaw2010.inesc-id.pt/
Copyright and Moral Rights for the articles on this site are retained by the individual authors and/or other copy-right owners. For more information on Open Research Online’s data policy on reuse of materials please consultthe policies page.
oro.open.ac.uk

How much Semantic Data on Small Devices??
Mathieu d’Aquin, Andriy Nikolov, Enrico Motta
Knowledge Media Institute, The Open University, Milton Keynes, UK{m.daquin, a.nikolov, e.motta}@open.ac.uk
Abstract. Semantic tools such as triple stores, reasoners and query en-gines tend to be designed for large-scale applications. However, with therise of sensor networks, smart-phones and smart-appliances, new scenar-ios appear where small devices with restricted resources have to handlelimited amounts of data. It is therefore important to assess how ex-isting semantic tools behave on such small devices, and how much datathey can reasonably handle. There exist benchmarks for comparing triplestores and query engines, but these benchmarks are targeting large-scaleapplications and would not be applicable in the considered scenarios.In this paper, we describe a set of small to medium scale benchmarksexplicitly targeting applications on small devices. We describe the re-sult of applying these benchmarks on three different tools (Jena, Sesameand Mulgara) on the smallest existing netbook (the Asus EEE PC 700),showing how they can be used to test and compare semantic tools inresource-limited environments.
1 Introduction
With the rise of sensor networks, smart-phones and smart-appliances, new sce-narios appear where a number of small devices with restricted resources eachhave to handle limited amounts of data. In particular, the SmartProducts pro-ject [1] is dedicated to the development of “smart products” (namely, cars, air-planes and kitchen appliances) which embed “proactive knowledge” to help cus-tomers, designers, and workers in communicating and collaborating with them.Concretely, Smart Products rely on a platform using small computing devices(such as gumstix1) which process, exploit, and expose knowledge related to theproduct they are attached to through the use of semantic technologies.
While building such a platform, an obvious issue concerns the performance ofsemantic technologies on the considered hardware. Indeed, existing tools are usu-ally designed for large scale applications and data, deployed on high performanceservers, and possibly taking benefit from distributed computing approaches. Afew initiatives have emerged that aim at providing tools dedicated to small de-vices2, but these are not yet mature enough to be employed in the considered? Part of this research has been funded under the EC 7th Framework Programme in
the context of the SmartProducts project (231204).1 http://www.gumstix.com/2 see e.g., MobileRDF (http://www.hedenus.de/rdf/) and microJena
(http://poseidon.elet.polimi.it/ca/?page id=59)

scenarios. On the other hand, it is unclear whether popular systems such asJena3 or Sesame4 could actually be used, how they would perform, and howthey would compare on resource-limited hardware. Of course, it can always beargued that semantic processing can be applied remotely, on a server, so thatthe small device only has to act as an interface to semantic data, without havingto handle it directly. In such cases however, mechanisms have to be put in placeto ensure the availability of this data in all the different environments in whichthe device might be used, while maintaining appropriate levels of security andprivacy. For this reason, one of the main rational underlying this work is to gainthe ability to answer the question, “How much semantic data can we store andprocess on small devices?”, so that we can also evaluate, in a given application,how much of the data have to be processes externally.
Several benchmarks have been devised to assess and compare the perfor-mance of semantic tools (see e.g., [2, 3]). However, here again, the current focuson large-scale applications makes these benchmarks inadequate to answer theabove question. They indeed assume the availability of sufficient resources torun the considered tools on the large amounts of test data they contain. In ad-dition, as they work at large scale, these benchmarks tend to focus only on twocriteria to evaluate performance: the size of the data and the response time.When working at a smaller scale, other characteristics than size (e.g., the dis-tribution of entities in classes, properties and individuals) can have a significantimpact on the tools’ performance. More importantly, to test the ability of aparticular tool to run on a small device, other performance criteria need to beconsidered, which are often assumed to be available in sufficient quantities inlarge-scale benchmarks (namely, memory and disk space).
For these reasons, we created a set of “smaller-scale” benchmarks for toolsimplementing semantic technologies. In practice, each of these benchmarks cor-responds to a set of ontologies (i.e., semantic documents) varying in size and withcommon characteristics (in terms of complexity and distribution of entities). Wealso use a set of eight generic queries of varying complexities to be executed oneach of the ontologies in each of the benchmarks. Therefore, running each bench-mark individually allows us to analyze the behavior of the considered tools inspecific situations (according to particular data characteristics) and comparingthe results of different benchmarks helps in understanding the impact of param-eters other than the size of the ontology on various performance measures.
We experimented with running the created benchmarks on three populartools—Jena, Sesame and Mulgara—with different configurations, on a very lim-ited netbook (the Asus EEE PC 700, also called 2G Surf). This netbook hasspecifications in similar ranges to the kind of devices that are envisaged in theSmartProducts project. Hence, measuring response time, memory consumptionand disk space while running our benchmarks on this device allows us to evaluatethe ability and limitations of each of the tested tools if employed in concrete,small-scale scenarios.
3 http://jena.sourceforge.net/4 http://openrdf.org
2 Benchmarks for small to medium scale semanticapplications
In this section, we propose a new set of benchmarks for small to medium scaleapplications. Each benchmark is made of two components: 1- a set of ontolo-gies (semantic documents) of varying sizes; and 2- a set of queries of varyingcomplexities (common to all the benchmarks).
2.1 Ontology Sets
The sets of ontologies to be used for testing semantic tools have been built fol-lowing two main requirements. First and most obviously, they had to cover ontol-ogy sizes from very small (just a few triples) to medium-scale ones (hundreds ofthousands of triples). As expected, and shown in the next section, medium-scaleontologies represent the limit of what the best performing tools can handle onsmall devices. Second, these sets of ontologies should take into account the factthat, especially at small-scale, size is not the only parameter that might affectthe performance of semantic tools. It is therefore important that, within eachset, the ontologies vary in size, but stay relatively homogeneous with respect tothese other characteristics. In this way, each set can be used to test the behav-ior of semantic tools on a particular type of ontologies (e.g., simple ontologiescontaining a large number of individuals), while comparing the results obtainedwith different ontology sets allows us to assess the impact of certain ontologycharacteristics on the performance of the considered tools. In addition, we alsoconsider that relying on real-life ontologies (i.e., ontologies not automaticallygenerated or composed for the purpose of the benchmark) would lead to moreexploitable results.
In order to fulfill these requirements, we took advantage of the Watson Se-mantic Web search engine5 to retrieve sets of real life ontologies6 of small tomedium sizes. We first devised a script to build sets of ontologies from Wat-son grouping together ontologies having similar characteristics, therefore build-ing homogenous sets with respect to these characteristics. The parameters em-ployed for building these groups are the ratio Number of Properties
Number of Classes , the ratioNumber of Individuals
Number of Classes and the complexity of the ontological description, as ex-pressed by the underlying description logic (e.g., ALH). The 2 first parameterswere allowed a derivation of more or less 50% from the average in the group (on-tologies rarely have exactly the same values for these characteristics). As a resultof this automatic process, we obtained 99 different sets of ontologies. We thenmanually selected amongst these sets the ones to be used for our benchmarks,considering only the sets containing appropriate ranges of sizes (see summary ofthe selected benchmark ontology sets in Table 1).
5 http://watson.kmi.open.ac.uk6 Here we use to word ontology to refer to any semantic document containing RDF
descriptions, including documents containing individuals.

Table 1. Summary of the 10 benchmark ontology sets. The name of each set is givenaccording to its number in the original automatic process. Size is in number of triples.
Name Ontos Size range Ratio prop./class Ratio ind./class DL Expressivity
12 9 9-2742 0.65-1.0 1.0-2.0 ALO37 7 27-3688 0.21-0.48 0.07-0.14 ALH39 79 2-8502 no class no class -
43 56 17-3696 0.66-2.0 4.5-20.5 -
53 21 3208-658808 no property no individual EL54 11 1514-153298 no property no individual ELR+
56 20 8-3657 no class no class -
58 35 7-4959 1.41-4.0 no individual AL66 17 1-2759 no property no class -
93 11 43-5132 1.0-2.0 13.0-22.09 -
2.2 Queries
Since our benchmarks are derived from various, automatically selected ontolo-gies, we needed a set of queries generic enough to give results on most of thesedatasets. We therefore devised eight queries of varying complexities, which arebased on the vocabularies of the RDFS, OWL, and DAML+OIL languages:
1. Select all labels. This is a basic query which returns all rdfs:label datatypevalues.
2. Select all comments. This query returns all rdfs:comment values. Usuallythese values are longer than rdfs:label, but more scarce.
3. Select all labels and comments. This query checks the ability of the tool todeal with OPTIONAL clauses.
4. Select all RDFS classes. This is a basic query which returns RDF resources oftype rdfs:Class. Its results can be different depending on whether reasoningis applied and whether the tool is aware of the subClassOf relation betweenRDFS and OWL classes.
5. Select all classes. This query explicitly searches also for OWL and DAMLclasses in addition to RDFS classes. The query constructs a union of severalclauses.
6. Select all instances of all classes. This query contains the clauses of theprevious query augmented with joint patterns. The set of results for thisquery varies depending on whether reasoning is applied: reasoning producesmore answers to the query because each instance belonging to a subclass isinferred to belong to a superclass as well.
7. Select all properties applied to instances of all classes. This query adds anadditional joint pattern to the previous one.
8. Select all properties by their domain. This query centers on properties and isalso supposed to return different sets of results depending on the reasoningmechanism enabled.
The SPARQL queries corresponding to the descriptions above are also avail-able at http://watson.kmi.open.ac.uk/small-scale-benchmarks.

3 Applying the benchmarks
In our experiments, we focused on two goals: 1- Testing the behaviour of popularsemantic data storage tools on a resource-constrained device; and 2- comparingthe performance ranking of the same tools when processing small and to mediumscale datasets.
As a hardware platform to conduct the experiments we selected the AsusEEE PC 2G Surf netbook (the oldest version of Asus EEE netbooks) with 900MHz CPU, 512 MB RAM and Puppy Linux7 installed. This provides a good ref-erence platform as it has similar specifications to common embedded computingdevices8, as well as to top-of-the-range smart-phones9 while being reasonablyconvenient to use.
We have selected three of the popular semantic data store tools, which pro-vide Java API interface: Jena, Sesame 2, and Mulgara10. We did not test someother storage tools specifically designed for handling large scale datasets suchas Virtuoso or 4store because of their high initial resource requirements (e.g.,Virtuoso installation requires 62MB of disk space). Because Jena and Sesameprovide ontological reasoning capabilities, we tested these tools in two modes:without reasoning and with RDFS reasoning to estimate the additional resourceusage caused by inferencing. The following test system configurations were used:– Jena TDB v0.8.2.– Jena TDB v0.8.2 with the Jena native RDFS reasoner.– Sesame v2.2.4 with the RDF Native SAIL repository.– Sesame v2.2.4 with the RDFS Native SAIL repository (i.e., with reasoning).– Mulgara v2.1.6 (Lite).
Each test consisted of the following steps:1. Creating an empty data store.2. Loading an ontology into the data store.3. Running queries 1-8.4. Measuring the disk space taken by the data store.5. Cleaning the data store (physically deleting the corresponding files).
For each step we measured the time cost and the size of the Java heap spaceused by the virtual machine. Because of the resource limitations of the chosennetbook, we have restricted the maximum heap size to 400 MB.
3.1 Results
Table 2 gives a summary of all the results obtained after running the 5 differenttool configurations described above on our 10 benchmark ontology sets. We candistinguish 2 sets of measures in this table: measures related to the performance7 http://www.puppylinux.com/8 For example, the SmartProduct project employs Overo Air gumstix with 600 MHz
CPU and 256 MB RAM.9 For example, the Apple iPhone 3GS has a 600Mhz CPU and 256 MB of RAM, and
the Sony Ericsson XPeria X10 has 1GHz CPU and 1GB of memory.10 http://www.mulgara.org/

Table 2. Average measures for the different tools using the different benchmark sets.
Benchmark 12 37 39 43 53 54 56 58 66 93
Jena No Reasoning
# of ontologies treated 9 7 78 56 19 11 20 35 17 11
% of overall size processed 100% 100% 80% 100% 43% 100% 100% 100% 100% 100%
Avg. load time/triple (ms) 54 26 48 12 1 2 37 32 271 13
Avg. memory/triple (KB) 267 86 265 80 1 1 180 199 1023 32
Avg. disk space/triple (KB) 9 2 14 3 0.17 0.19 4 5 27 0.93
Avg. time query/Ktriple (ms) 2460 969 1722 604 232 149 1448 1155 8067 442
Avg. # of query results 22 114 0.87 13 3318 2874 7 12 0.97 80
Avg. time/K query result (ms) 6089 4564 601 1297 335272 147 6456 1480 1998 2913
Jena RDFS Reasoning
# of ontologies treated 9 6 78 56 2 1 20 34 17 11
% of overall size processed 100% 39% 80% 100% 0% 0% 100% 44% 100% 100%
Avg. load time/triple (ms) 65 32 50 12 2 6 38 33 254 13
Avg. memory/triple (KB) 284 106 282 85 2 5 191 216 1035 34
Avg. disk space/triple (KB) 7 2 14 3 0.17 0.19 4 5 27 0.93
Avg. time query/Ktriple (ms) 13317 10363 10717 4110 15078 28307 10732 37353 44078 2710
Avg. # of query results 75 113 240 357 551 297 99 130 87 216
Avg. time/K query result (ms) 17403 64531 5606 3144 955122 1381216 13461 79262 23116 6481
Sesame No Reasoning
# of ontologies treated 9 7 78 56 21 11 14 7 17 11
% of overall size processed 100% 100% 80% 100% 100% 100% 9% 1% 100% 100%
Avg. load time/triple (ms) 12 6 7 3 1 1 9 17 38 3
Avg. memory/triple (KB) 32 12 29 10 0.16 0.23 28 62 115 5
Avg. disk space/triple (KB) 0.51 0.24 0.53 0.21 0.1 0.12 0.47 1 1 0.15
Avg. time query/Ktriple (ms) 2334 987 1235 336 43 60 1738 3955 9816 408
Avg. # of query results 22 114 0.87 53 8329 2874 2 1 1 80
Avg. time/K query result (ms) 3899 2905 710 1877 117 272 1984 4587 750 1844
Sesame RDFS Reasoning
# of ontologies treated 9 7 78 56 21 11 14 7 17 11
% of overall size processed 100% 100% 80% 100% 100% 100% 9% 1% 100% 100%
Avg. load time/triple (ms) 16 10 8 4 3 4 11 25 50 5
Avg. memory/triple (KB) 55 17 50 17 0.23 0.34 46 107 160 8
Avg. disk space/triple (KB) 1 0.45 0.96 0.4 0.14 0.18 0.96 2 3 0.25
Avg. time query/Ktriple (ms) 2942 1156 1578 401 122 152 2100 5670 14277 511
Avg. # of query results 58 153 29 102 10617 3882 22 16 53 154
Avg. time/K query result (ms) 3389 3172 1272 610 99367 31836 1405 2685 1585 1322
Mulgara
# of ontologies treated 9 7 78 56 19 11 20 35 17 11
% of overall size processed 100% 100% 80% 100% 43% 100% 100% 100% 100% 100%
Avg. load time/triple (ms) 141 54 132 49 2 2 105 110 595 27
Avg. memory/triple (KB) 139 49 141 41 0.43 0.62 96 101 522 17
Avg. disk space/triple (KB) 3778 1650 6090 2175 32 43 5757 7261 43412 1451
Avg. time query/Ktriple (ms) 9909 5875 5340 2651 1291 1399 4896 4719 27589 2704
Avg. # of query results 22 114 0.87 53 3318 2874 7 12 0.97 80
Avg. time/K query result (ms) 14916 9056 2942 16256 885 1390 3780 6655 4713 5466
of the tools (e.g., loading time) and measures related to their robustness (i.e.,their ability to process large numbers of heterogeneous, real-life ontologies). In-deed, concerning robustness, each benchmark was run automatically for eachtool, processing the ontologies in the corresponding set in an order of size. Whena tool crashed on a particular ontology, unless an obvious error could be cor-rected, the test on the corresponding benchmark was interrupted. As can beseen from Table 2, the different tools tend to break on different benchmarks(with benchmark 39 being commonly problematic to all of them). In addition,while the application of RDFS inferences does not seem to affect the ability ofSesame to process ontologies (it consistently breaks on the same ontologies, andno other), Jena tends to be a lot less robust when reasoning is applied, espe-cially on medium size ontologies, most likely due to the increase in its need forresources. All together, Mulgara and Jena without reasoning appear to be themost robust tools with 8 out of 10 benchmarks being covered at 100% (here, per-centage is expressed with respect to the sum of all the triples in all the ontologiesof the benchmark). The fact that they can process exactly the same number ofontologies can be explained by the fact that Mulgara uses Jena as a parser.
Regarding performance measures, we give more details below on the behaviorof each tool configuration concerning loading time, memory consumption, diskspace and query response time. However, generally, it appears quite clearly thatSesame (without reasoning) tends to outperform the other tools at small-scale.As we will see, this is less true at medium-scale, and other benchmarks haveshown that, at large-scale, the difference between Sesame and Jena tends to beinverted [3]. This can be explained by the fact that Jena and Mulgara generallyallocate larger amounts of resources straight from the start, while an “emptySesame” is very lightweight. In other terms, it seems that the “fixed cost” asso-ciated with processing ontologies with Sesame is significantly lower than the oneof Jena and Mulgara, whereas the “variable cost” appears to be higher. Whilethis turns out to be a disadvantage at large-scale, it certainly makes Sesame astronger candidate in the scenarios we consider here, i.e., small-scale, resource-limited applications.
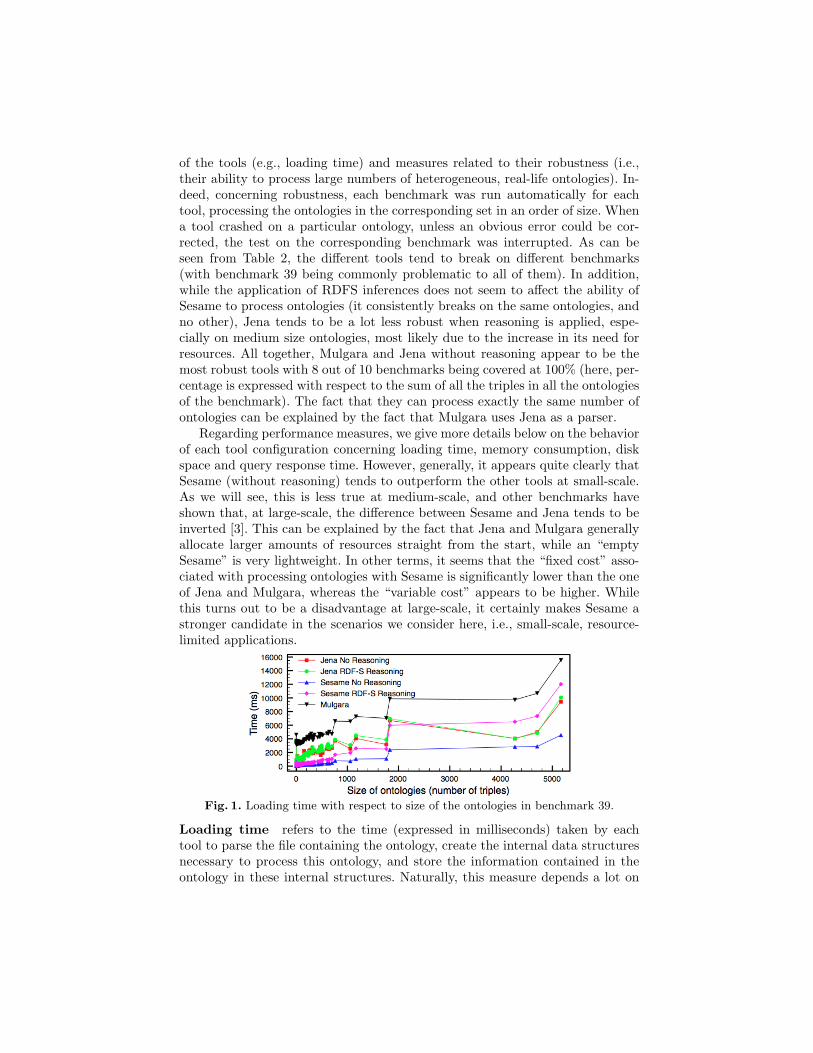
Fig. 1. Loading time with respect to size of the ontologies in benchmark 39.
Loading time refers to the time (expressed in milliseconds) taken by eachtool to parse the file containing the ontology, create the internal data structuresnecessary to process this ontology, and store the information contained in theontology in these internal structures. Naturally, this measure depends a lot on
the storage device employed, but the way each tool represents the ontologiesinternally also has a significant impact. Indeed, as can be seen from Table 2,loading ontologies takes significantly less time for Sesame than for any otherof the tested tool. Mulgara, on the other hand, creates many indexes for thedata, which clearly impacts negatively on this measure. It can be noticed thatapplying RDFS reasoning with Sesame influences loading time, with supposedlysome inferences being drawn already when initializing the ontology model, whileit is not the case for Jena. Figure 1 shows a typical evolution of loading time withrespect to the size of the ontology (using benchmark 39). Here we can see thatSesame was able to load more than 5000 triples in less than 5 seconds withoutreasoning, compared to around 12 seconds with reasoning. Mulgara took almost16 seconds. It is interesting to see also how Jena loads ontologies apparentlyindependently from the use of RDFS reasoning.
Having compared the results obtained for different benchmarks, we can ob-serve that the tools behave consistently with respect to loading time indepen-dently from variables other than size. Sesame with reasoning, however, performsbetter than Mulgara for small ontologies only, and ends up taking longer for on-tologies above a few thousand triples. Also, loading time appears to be slightlyhigher for ontologies with the same number of triples but more expressive de-scription logics. This could be explained by a higher density of description forclasses in these cases.
Memory consumption is described in Table 2 by providing the average mem-ory space required (in kilo-bytes) per triple in each ontology. As for loading time,this is measured right after having loaded the ontology from the file, evaluatingthe amount of memory required to make the model accessible. Here, Sesameappears again to be the best performing tool at small scale, both when applyingreasoning and not. While using reasoning in Sesame add an increment to mem-ory consumption, for Jena reasoning does not have a significant impact on thememory consumption at loading time. Regarding memory consumption, Mul-gara seems to be generally less demanding than Jena (both with reasoning andwithout). While differences appear on average between benchmarks of differentsizes, within benchmarks, no correlation is visible between the size of the ontolo-gies and the memory consumption (due to the use of persistent storage on disk),except for Jena which shows a slight, linear increase of memory consumptionwith size.
Disk space is also measured at loading time, calculating the overall size at thelocation on the local disk where each of the tools keep their stores. Here again,Sesame stands out as being the least demanding when reasoning is not applied,but also, to a smaller extent when reasoning is applied. Since Jena does not storethe results of inferences, there are very little differences in terms of required diskspace when applying RDFS reasoning and when not. While Jena and Sesameperform comparably, Mulgara can be seen as being extremely demanding interms of disk space. Indeed, contrary to Sesame, which almost does not requireany disk space at all when running without any ontology loaded, Mulgara allo-cates a lot of space for storage structures such as indexes at starting time (in our
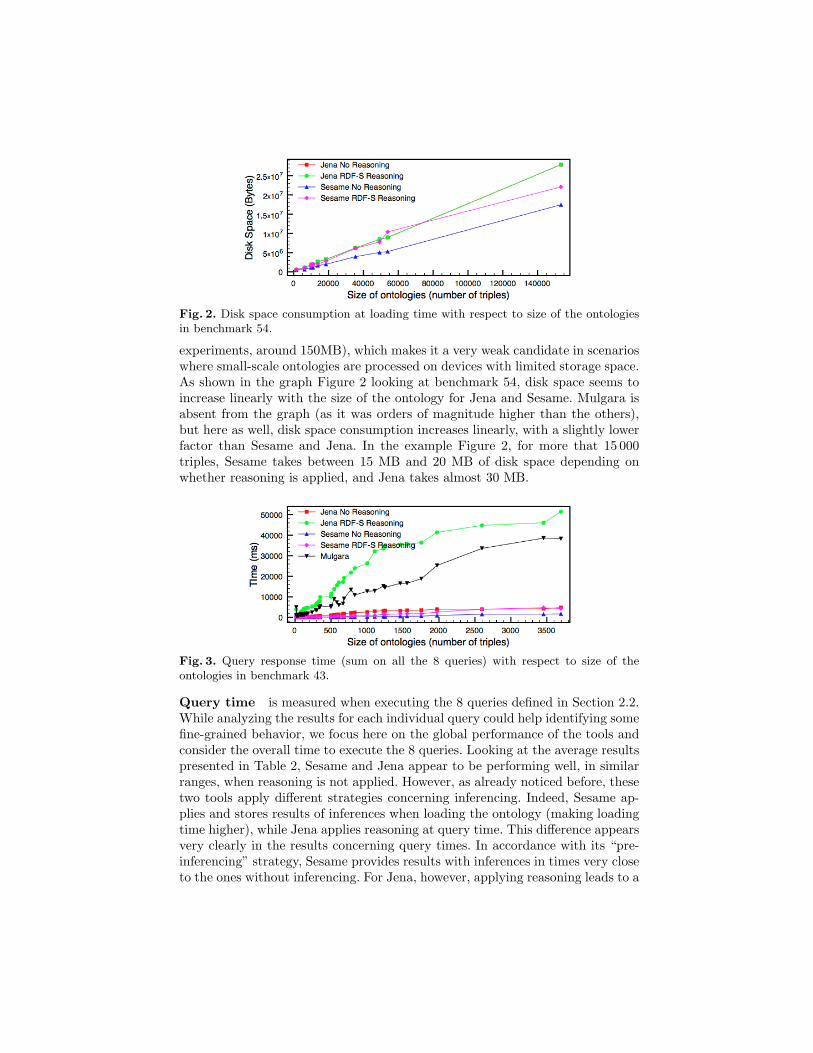
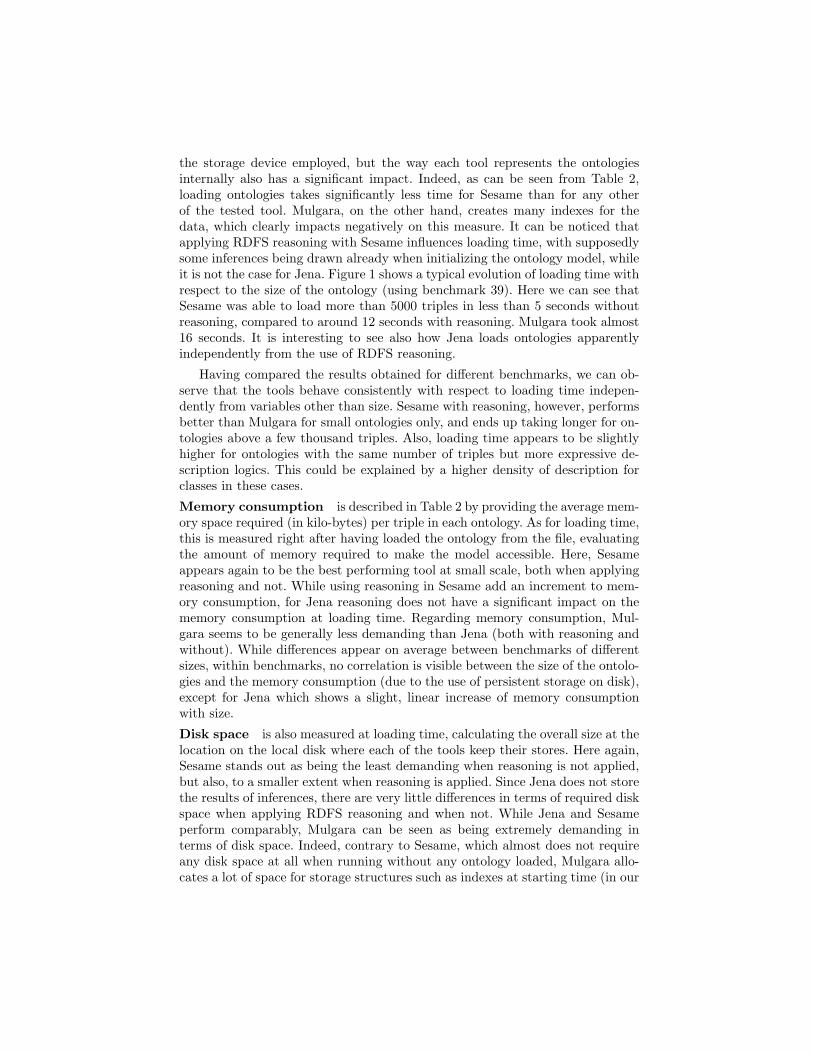
Fig. 2. Disk space consumption at loading time with respect to size of the ontologiesin benchmark 54.
experiments, around 150MB), which makes it a very weak candidate in scenarioswhere small-scale ontologies are processed on devices with limited storage space.As shown in the graph Figure 2 looking at benchmark 54, disk space seems toincrease linearly with the size of the ontology for Jena and Sesame. Mulgara isabsent from the graph (as it was orders of magnitude higher than the others),but here as well, disk space consumption increases linearly, with a slightly lowerfactor than Sesame and Jena. In the example Figure 2, for more that 15 000triples, Sesame takes between 15 MB and 20 MB of disk space depending onwhether reasoning is applied, and Jena takes almost 30 MB.
Fig. 3. Query response time (sum on all the 8 queries) with respect to size of theontologies in benchmark 43.
Query time is measured when executing the 8 queries defined in Section 2.2.While analyzing the results for each individual query could help identifying somefine-grained behavior, we focus here on the global performance of the tools andconsider the overall time to execute the 8 queries. Looking at the average resultspresented in Table 2, Sesame and Jena appear to be performing well, in similarranges, when reasoning is not applied. However, as already noticed before, thesetwo tools apply different strategies concerning inferencing. Indeed, Sesame ap-plies and stores results of inferences when loading the ontology (making loadingtime higher), while Jena applies reasoning at query time. This difference appearsvery clearly in the results concerning query times. In accordance with its “pre-inferencing” strategy, Sesame provides results with inferences in times very closeto the ones without inferencing. For Jena, however, applying reasoning leads to a
very significant increase in query time. This difference in behavior is visible in thegraph Figure 3, showing the sum of the times required to execute our 8 queriesin relation to the size of the ontologies in benchmark 43. As can be seen, evenif it does not include any reasoning facility, Mulgara performs relatively badlycompared to Jena and Sesame. Indeed, while Jena without reasoning, as wellas Sesame both with and without reasoning are able to execute queries in nearreal-time even on such a small device as our netbook, Mulgara and Jena withreasoning would need up to 38 and 50 seconds respectively to provide results foran ontology of less than 4 000 triples.
Another interesting observation concerns the differences in the results of thequeries. Indeed, looking at Table 2, the three tool configurations which do notapply reasoning obtain reasonably consistent results on our set of queries (on thebenchmarks where they all managed to process the same number of ontologies),meaning that they interpret SPARQL queries in very similar ways. However,while analyzing the number of results obtained by the two tools applying rea-soning, significant differences appear. The explanation to this phenomenon isthat, in addition to having different strategies on when to apply reasoning, thesetools implement RDFS inferences differently, with Jena generally obtaining moreresults (i.e., entailing more new statements). Additional investigations would berequired to find out whether this is the result of different interpretations of thesemantics of RDFS, of incomplete results from Sesame, or of incorrect resultsfrom Jena.
4 Conclusion
In this paper, we have established a set of small to medium scale benchmarks totest the performance of semantic tools on small devices with limited resources.Using these benchmarks and through extensive tests we have shown that toolssuch as Sesame, and to a smaller extent Jena, were able to cope reasonably wellwith small-scale ontologies on a very resource limited netbook. These resultsprovided new insights into the behaviour of semantic data management toolsin comparison with large-scale benchmarking tests of the same tools. Of course,the benchmarks we developed can be used to test any other semantic tool onany other platform, providing the availability of the necessary underlying infras-tructure on such a platform. While the results obtained are encouraging, theyalso validate our intuition that existing semantic technologies are developed withlarge-scale applications in mind and that more work is needed to develop seman-tic software infrastructures dedicated to small-scale applications running withlimited hardware resources.
References
1. Sabou, M., Kantorovitch, J., Nikolov, A., Tokmakoff, A., Zhou, X., Motta, E.: Po-sition paper on realizing smart products: Challenges for semantic web technologies.In: Workshop: Semantic Sensor Networks (SSN09), ISWC. (2009)
2. Guo, Y., Pan, Z., Heflin, J.: LUBM: A benchmark for OWL knowledge base systems.Journal of Web Semantics 3(2-3) (2005) 158–182
3. Bizer, C., Schultz, A.: The Berlin SPARQL benchmark. International Journal onSemantic Web and Information Systems 5(2) (2009) 1–24