How do school ‘report cards’ affect school choice decisions
49
How do school ‘report cards’ affect school choice decisions? Jane Friesen, Department of Economics, Simon Fraser University Mohsen Javdani, Simon Fraser University Justin Smith,Wilfrid Laurier University Simon Woodcock, Simon Fraser University September 2010 Abstract We estimate the effect of information about school achievement that is disseminated to the public through websites and school “report cards” on school choice decisions. We find that students are more likely to leave their school when public information reveals poor school-level performance. Some parents’ school choice decisions respond to information soon after it becomes available. Others, including non-English-speaking parents, alter their school choice decisions only in response to information that has been disseminated widely and discussed in the media. Parents in low-income neighborhoods are most likely to alter their school choice decisions in response to new information. JEL codes: I21, D83. Keywords: school report cards, information, school choice. Corresponding author: Jane Friesen, [email protected], 1-778-782-3403
-
Upload
universityofbritishcolumbia -
Category
Documents
-
view
3 -
download
0
Transcript of How do school ‘report cards’ affect school choice decisions
How do school ‘report cards’ affect school choice decisions?
Jane Friesen, Department of Economics, Simon Fraser University
Mohsen Javdani, Simon Fraser University
Justin Smith,Wilfrid Laurier University
Simon Woodcock, Simon Fraser University
September 2010
Abstract
We estimate the effect of information about school achievement that is disseminated to
the public through websites and school “report cards” on school choice decisions. We
find that students are more likely to leave their school when public information reveals
poor school-level performance. Some parents’ school choice decisions respond to
information soon after it becomes available. Others, including non-English-speaking
parents, alter their school choice decisions only in response to information that has been
disseminated widely and discussed in the media. Parents in low-income neighborhoods
are most likely to alter their school choice decisions in response to new information.
JEL codes: I21, D83.
Keywords: school report cards, information, school choice.
Corresponding author: Jane Friesen, [email protected], 1-778-782-3403
1
1 Introduction
Economists have long argued that policies designed to increase competition in markets for
education can improve educational outcomes by increasing disadvantaged students’ access to
high quality schools, and by causing underperforming schools to become more effective or to
shrink as families “vote with their feet” (Friedman 1955, Becker 1995, Hoxby 2003). Recent
evidence shows that providing information about school-level achievement directly to parents
can influence school choice (Hastings and Weinstein 2008). However, it is unknown whether
publicly disseminating information about school achievement through the media has the same
effect.1 On the one hand, widespread dissemination has the potential to influence the choices of
many parents, and may therefore substantially increase the effectiveness of school choice
policies. However, a large increase in the demand for high-achieving schools will not increase
competitive pressure on weaker schools unless preferred schools can actually accommodate more
students. Furthermore, children whose parents have poor access to media, or who are not part of
well-informed social networks, may not benefit from public dissemination strategies. In addition,
if school achievement measures are subject to substantial sampling variation, then parents could
be misled or confused when education authorities update public information about achievement.
Our study addresses these issues by examining the effect of public information about school
achievement on school choice behavior in British Columbia (B.C.). Our estimates are based on
student-level longitudinal data for multiple cohorts of students that span the introduction of
standardized testing and the subsequent wide dissemination of school-level results. We study the
propensity of elementary school students to leave their school in response to new information
about school-level performance on those standardized tests. We also investigate whether the
response to information about school achievement differs among parents who may face higher
costs of accessing the information, such as those with low income or those who do not speak
English at home.
2
School-level achievement measures may be correlated with unmeasured characteristics of
schools that influence parents’ beliefs about school quality and affect student mobility. We
identify parents’ response to new information using two separate identification strategies that
exploit the timing of testing and the release of test results. The first is a difference-in-differences
approach that controls for unobserved factors that jointly determine mobility and test scores by
comparing the relationship between mobility and lagged test scores before and after the public
release of information about test scores. The second is a control function approach (Navarro
2008) that uses current cohort test scores to control for unobserved factors that jointly determine
mobility and test scores. Because test scores are not publicly revealed until the school year
following the exam, the current cohort’s exam results are a valid control for such unobservables,
and new information about the achievement of previous cohorts is a conditionally exogenous
shock to parent’s information about school quality.
We find that publicly disseminated information about school-level achievement has a substantial
effect on the inter-school mobility of some public school students. In general, students are more
likely to leave their school when they learn that their schoolmates have performed relatively
poorly. Families that speak English at home respond strongly to early information releases, and
continue to respond to subsequent releases. Families that speak a language other than English
respond only to the later, more highly publicized information releases. The response is most
pronounced among English-speaking families in low-income neighborhoods. Arguably, these
families may have had poor private information about school quality, and hence valued the new
public information more highly than families in higher-income neighborhoods. The delayed
response of non-English speakers suggests they face high costs of accessing public information.
1.1 Previous literature

3
Hastings and Weinstein (2008) find that parents of children attending low-achieving schools in a
North Carolina school district were more likely to enroll their child in a higher-achieving school
when the district provided them with information about school achievement. They also find that
simplified information sheets distributed randomly to parents in low- and middle-income schools
doubled the estimated preference parameter on school test scores in a school choice model.
Using data from the same school district, Hastings et al. (2009) find that test scores play a small
role in parents’ school choice decisions relative to travel distance and peer composition, and that
parents’ preferences vary substantially with characteristics such as income.
Unlike these studies, we focus on information that is disseminated to all parents, at all schools,
through public media. Public information may have different effects on school choice behavior
compared to the private information strategies studied previously, for several reasons. First,
newly informed parents, especially those of disadvantaged children, may face less competition
for spaces in preferred schools when they are part of a smaller, targeted group. Second, parents
of children who attend low-achieving schools may respond differently to new information than
those of the broader student population. Third, media dissemination may be a less effective way
to inform disadvantaged parents compared to direct communication from schools.
An alternative method for learning about the effect of public information about school-level
achievement on school choice is through its effect on housing prices.2 Figlio and Lucas (2004)
and Fiva and Kirkebøen (2010) find that public information about school-level achievement is
capitalized into housing prices in Florida and Oslo respectively, but the effect diminishes quickly
over time. Kane et al. (2003) find that while housing prices reflect long-run average school-level
test scores, they do not respond to year-to-year fluctuations in a given measure of school quality
or to the introduction of newly framed test score information.
4
Housing price studies only capture the effects of information about school achievement on school
choice decisions that operate through residential choice. However, the link between residential
and school choice decisions in many jurisdictions is weakened by the availability of private
schools, charter and magnet schools and/or open enrolment policies. To the extent that
information affects school choice decisions along these margins, it will not be reflected in
housing prices. Moreover, housing price studies reveal little about the characteristics of the
families whose decisions are affected.
Several studies examine the direct effect of public information about achievement on school
choice decisions. Mizala and Urquiola (2008) find that, when measures of school achievement
are already widely available, receiving a highly publicized SNED award has no effect on
enrollment levels, tuition fees, or socioeconomic composition of Chilean schools. Hussain (2007)
finds that enrollment falls by up to 6 percent in the three years after English schools receive a
public “fail" rating, while enrollment increases by up to 2 percent in schools rated “very good."
Finally, publicly disseminated information in the form of “report cards” or rankings like those
examined here has been shown to affect consumer decisions in other markets. These markets
include health services (Dranove et al. 2003, Dafny and Dranove 2008, Jin and Sorensen 2006)
and restaurant patronage (Jin and Leslie 2003).
2 Institutional Background
2.1 School access and funding in B.C.
As in many other jurisdictions, B.C. students are guaranteed access to their neighborhood
“catchment” public school. B.C.’s provincial education authority (the Ministry of Education)
instituted an official “open boundaries” policy in July 2002 that allows students to attend any
public school that has space and facilities available after catchment area students have enrolled.

5
Provincial legislation requires that school boards give priority to students who reside within the
district; boards may elect to give priority to children whose siblings are already enrolled, and
must establish policies for allocating spaces among students within a priority category. Entry
into most public magnet programs is restricted to students entering Kindergarten or Grade 1, and
space in popular programs is often allocated by lottery. Finally, students may choose a private
school.
Along with capital funding, the B.C. Ministry of Education provides districts with operating
funds in proportion to total district enrolment. Supplementary funding is provided for each
student who is Aboriginal, is gifted or disabled, or who qualifies for English as a Second
Language (ESL) instruction. Public districts are not authorized to raise their own revenue. Private
schools receive per-student operating grants of up to 50% of the base public school rate, and are
responsible for teaching the provincial curriculum and meeting various provincial administrative
requirements (B.C. Ministry of Education 2005).
2.2 Testing and information
Prior to 1999, the BC Ministry of Education administered standardized Provincial Learning
Assessment Program (PLAP) exams, in various subject areas on a rotating schedule, to students
in grades 4, 7, and 10. These were replaced by standardized Foundation Skills Assessment (FSA)
exams in the 1999/2000 school year. The FSAs are administered in the spring of each year to
students in grades 4, 7, and 10 in reading comprehension, writing, and numeracy.3 Neither the
PLAP or FSA exams has any academic consequences, and teachers and schools face no financial
incentives related to students’ exam performance.
PLAP exam results were never disseminated to parents or the public. The Ministry of Education
first released individual and provincial, district, and school-level FSA exam results to schools in

6
fall 2000 (based on the 1999/2000 exam). Schools were instructed to share this information with
parents upon request (B.C. Ministry of Education 2000). School-level results of the 1999/2000
and 2000/2001 FSA exams were first posted on the Ministry’s website in October 2001 (B.C.
Ministry of Education 2001). Subsequent exam results have been posted on the Ministry’s
website in the following fall of each year. Since 2003, schools have been required to share
individual students’ exam results with parents prior to September 30. Note that in each case, FSA
results are released in the school year following the year of the exam.
The Fraser Institute, an independent research and educational organization (Fraser Institute
2008),4 began issuing annual “report cards” on B.C.’s elementary schools in June 2003 (Cowley
and Easton 2003).5 These include school scores and rankings based on FSA results. From the
outset, the school report cards have received widespread media coverage in the province’s print,
radio and television media.6
3 The effect of new information on school choice
3.1 Basic model
We present a highly simplified model of school choice that accounts for uncertainty about school
quality and focuses attention on the effects of new information.7 Assume parent i’s utility (Uis)
depends on the quality (qs) of their child’s school s,
(1) Uis = qs + εis
where εis is a random taste-shifter with mean zero. We interpret qs as an index of school
characteristics that determine parents’ utility, such as teacher experience, peer ability, the state of
technology at the school, the quality of sports programs, and class size.
We assume that parents cannot perfectly observe qs. They consequently form beliefs about each

7
school’s quality based on directly observable school characteristics , such as neighbourhood
income and the demographic composition of the student body. Their prior beliefs are normally
distributed with mean and precision hqi, where β is the vector of weights given to
observable characteristics. Parents are assumed to know hqi. Although prior precision is the
same for all schools, it varies between parents to reflect the idea that some (e.g., new immigrants)
may have less precise beliefs about school quality than others (e.g., a native born individual who
has lived in the area for many years).
Absent any additional information and given a set of available schools Σ, a parent chooses school
s if
(2)
where cis reflects the direct (e.g., tuition) and indirect (e.g., commuting distance) costs of
attending school s. Given our assumed prior beliefs and utility function, this implies that the
average parent chooses school s if
(3) .
Now suppose that parents also observe a noisy signal Ss of each school's quality, such as
standardized test scores aggregated to the school level,
(4) Ss = qs + ηs
where . The noise component ηs has zero mean, implying that test scores provide
unbiased information about school quality. The precision of test scores as a signal of school
quality, , is known but varies across parents. This reflects the possibility that test scores are
more informative signals of school quality for some parents than others.
€
Xs
€
Xsʹ′β
€
E Uis | ʹ′ X sβ[ ]− cis > E Uik | ʹ′ X kβ[ ]− cik ∀k ∈Σ,k ≠ s
€
ʹ′ X sβ − cis > ʹ′ X kβ − cik ∀k ∈Σ,k ≠ s
€
ηs ~ N 0,hηi−1( )
€
hηi

8
Parents are assumed to update their expectations about each school's quality using Bayes’ rule.8
Their posterior beliefs are normally distributed with mean sm and precision iqi hh η+ , where
(5)
€
ms ≡ E qs | ʹ′ X sβ,Ss[ ]=hqi
hηi + hqiʹ′ X sβ+
hηi
hηi + hqi
Ss.
Parents’ updated expectation of school quality is a precision-weighted average of the signal and
their prior expectation. The greater is the precision of test scores relative to prior information, the
greater is the weight that parents will place on test scores. If test scores are very noisy, prior
information will continue to dominate parents’ beliefs about school quality.
Defining as the weight that parents place on test scores, and rearranging
equation (5), we can write the average parent’s expected utility from choosing school s as
(6) .
Define to be the test score “shock,” which represents the new information
acquired from the signal. Parents will choose to enroll their child in school s if
(7) .
Parents choose school s if the information shock is sufficiently good relative to other schools that
it outweighs any relative differences in the schools’ other characteristics and attendance costs.
Conversely, parents will choose school s even if they receive a relatively poor information shock,
provided its characteristics are good enough and attendance costs low enough to outweigh the
“bad news” about school-level test scores. Note also that test score information only affects
school choice if it is sufficiently precise to be useful (θi > 0). Furthermore, θi varies across
individuals because of interpersonal differences in the precision of prior beliefs, and differences
in the precision of test scores as a signal of school quality.
€
θ i = hηi hηi + hqi( )−1
€
E Uis | ʹ′ X sβ,Ss[ ]=θ i Ss − ʹ′ X sβ( )+ ʹ′ X sβ
€
Ss* = Ss − ʹ′ X sβ( )
€
θi
Ss* − Sk
*( )> ʹ′ X k − ʹ′ X s( )β − cik − cis( ) ∀k∈Σ,k ≠ s

9
3.2 Model Dynamics
We now extend the model to accommodate a sequence of signals rather than a one-time event.
Suppose that in each period T, parents observe an unbiased signal of school quality SsT that
conforms to equation (4), such as the results of an annual standardized test that are revealed to
the public in each school year. We define parents’ beliefs about school quality recursively. After
observing T signals, parents’ beliefs are normally distributed with mean sTm and precision
iqi Thh η+ , where
(8)
[ ] ( )
sTiqi
is
iqi
qi
sTiqi
isT
iqi
iqisTsssssT
SThh
ThX
Thhh
SThhh
mThhhTh
SSSXqEm
η
η
η
η
η
η
η
β
β
++ʹ′
+=
++
+
−+=ʹ′= −121
1,,,,| …
and is the average of all observed signals.
From the first line of equation (8) we see that, as in the case of a single signal, parents’ revised
expectations about school quality are a precision-weighted average of the new signal ( sTS ) and
expected quality prior to observing the signal ( 1−sTm ). We also see that each new signal receives
successively smaller weight in parents’ Bayesian update, because the previous T – 1 signals have
already contributed to the precision of their beliefs, and consequently increased the weight
assigned to 1−sTm . From the second line of equation (8), however, we see that the combined
weight assigned to the average of all signals ( iTTθ , where ) increases with
T, and the weight assigned to observable school characteristics Xs consequently decreases.
Defining to be the information shock embodied in the new signal, and
rearranging the first line of equation (8), parents choose school s over school k if
€
S sT = T −1 Sstt =1
T∑
€
θ iT = hηi hqi +Thηi( )−1
€
SsT** = SsT −msT −1( )

10
(9) ( ) ( ) ( )isiksTkTkTsTiT ccmmSS −−−>− −− 11****θ .
The intuition behind this maximization condition is the same as before: parents choose school s if
the information shock contains sufficient “good news” about school quality relative to what was
previously believed and attendance costs.
4 Methodology
4.1 Empirical Model
For tractability and because of data limitations, we treat residential location as exogenous and
examine inter-school mobility conditional on residential choice. Specifically, we model the
probability that a student separates from their current school after September 30 of year t and
enrolls in a new school before September 30 of year t+1, conditional on their residential location.
In terms of our theoretical model, students will separate from their current school s if some
alternative school satisfies equation (9).
The fundamental identification issue is that school-level achievement measures may be correlated
with unmeasured characteristics of schools that influence parents’ beliefs about school quality
and affect student mobility. Our first estimator addresses this problem by comparing the
relationship between lagged school-average test scores and the probability of separating from the
current school, conditional on observable characteristics, before and after lagged test scores were
first released to the public in fall 2000. Under some identifying assumptions described below,
this strategy allows us to estimate the effect of the 1999/2000 test score information on
separations in the year it was released.9 The estimating equation takes the form
(10)
iststsiststitttSt
ttstist CXZdSdSy ευψδβγαααα +++ʹ′+ʹ′+ʹ′++++= =
−=
−2000
132000
2110
11
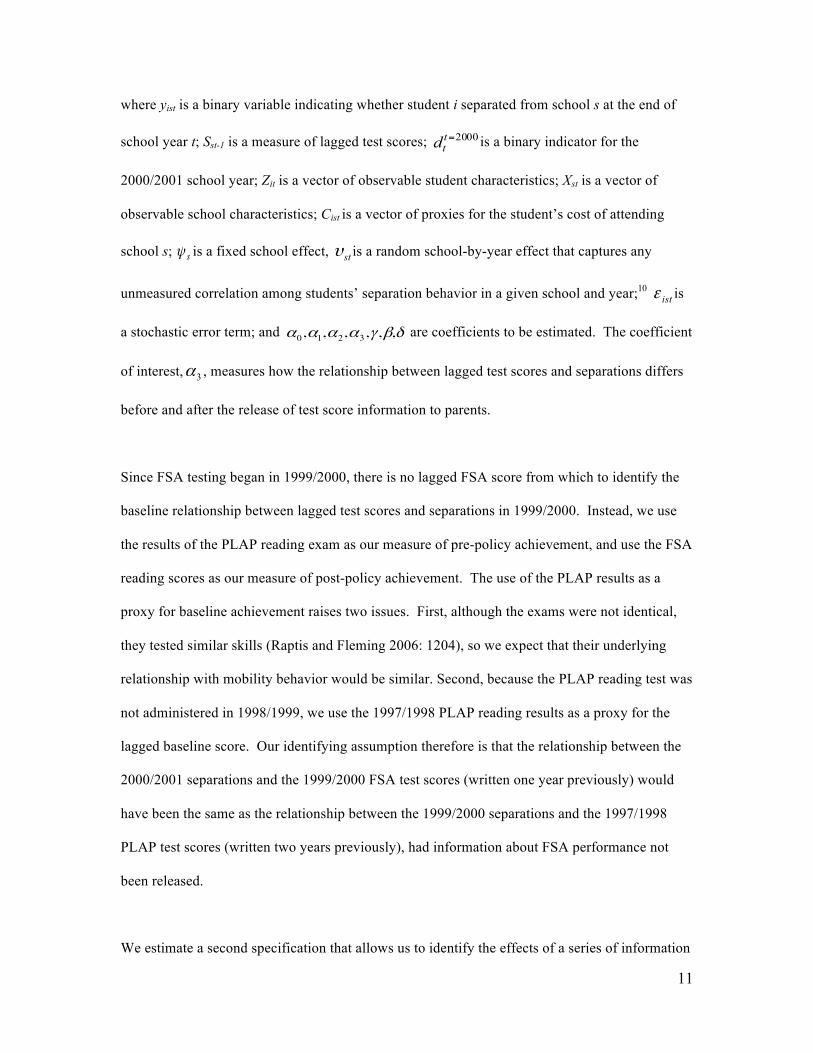
where yist is a binary variable indicating whether student i separated from school s at the end of
school year t; Sst-1 is a measure of lagged test scores; 2000=ttd is a binary indicator for the
2000/2001 school year; Zit is a vector of observable student characteristics; Xst is a vector of
observable school characteristics; Cist is a vector of proxies for the student’s cost of attending
school s; is a fixed school effect, stυ is a random school-by-year effect that captures any
unmeasured correlation among students’ separation behavior in a given school and year;10 istε is
a stochastic error term; and
€
α0,α1,α2,α3,γ,β,δ are coefficients to be estimated. The coefficient
of interest, 3α , measures how the relationship between lagged test scores and separations differs
before and after the release of test score information to parents.
Since FSA testing began in 1999/2000, there is no lagged FSA score from which to identify the
baseline relationship between lagged test scores and separations in 1999/2000. Instead, we use
the results of the PLAP reading exam as our measure of pre-policy achievement, and use the FSA
reading scores as our measure of post-policy achievement. The use of the PLAP results as a
proxy for baseline achievement raises two issues. First, although the exams were not identical,
they tested similar skills (Raptis and Fleming 2006: 1204), so we expect that their underlying
relationship with mobility behavior would be similar. Second, because the PLAP reading test was
not administered in 1998/1999, we use the 1997/1998 PLAP reading results as a proxy for the
lagged baseline score. Our identifying assumption therefore is that the relationship between the
2000/2001 separations and the 1999/2000 FSA test scores (written one year previously) would
have been the same as the relationship between the 1999/2000 separations and the 1997/1998
PLAP test scores (written two years previously), had information about FSA performance not
been released.
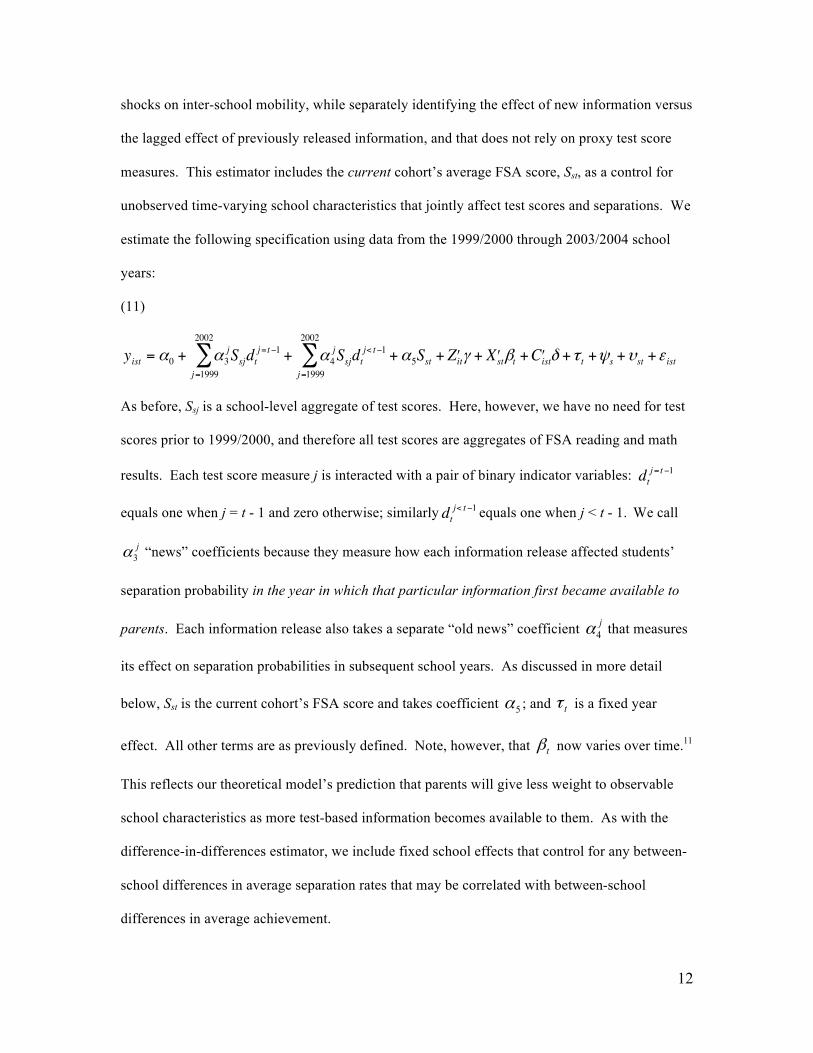
We estimate a second specification that allows us to identify the effects of a series of information
sψ
12
shocks on inter-school mobility, while separately identifying the effect of new information versus
the lagged effect of previously released information, and that does not rely on proxy test score
measures. This estimator includes the current cohort’s average FSA score, Sst, as a control for
unobserved time-varying school characteristics that jointly affect test scores and separations. We
estimate the following specification using data from the 1999/2000 through 2003/2004 school
years:
(11)
€
yist =α0 + α3jSsj
j =1999
2002
∑ dtj =t−1 + α4
jSsjj =1999
2002
∑ dtj< t−1 +α5Sst + ʹ′ Z itγ + ʹ′ X stβt + ʹ′ C istδ +τ t +ψs +υst +ε ist
As before, Ssj is a school-level aggregate of test scores. Here, however, we have no need for test
scores prior to 1999/2000, and therefore all test scores are aggregates of FSA reading and math
results. Each test score measure j is interacted with a pair of binary indicator variables:
€
dtj= t−1
equals one when j = t - 1 and zero otherwise; similarly
€
dtj< t−1 equals one when j < t - 1. We call
j3α “news” coefficients because they measure how each information release affected students’
separation probability in the year in which that particular information first became available to
parents. Each information release also takes a separate “old news” coefficient j4α that measures
its effect on separation probabilities in subsequent school years. As discussed in more detail
below, Sst is the current cohort’s FSA score and takes coefficient 5α ; and tτ is a fixed year
effect. All other terms are as previously defined. Note, however, that tβ now varies over time.11
This reflects our theoretical model’s prediction that parents will give less weight to observable
school characteristics as more test-based information becomes available to them. As with the
difference-in-differences estimator, we include fixed school effects that control for any between-
school differences in average separation rates that may be correlated with between-school
differences in average achievement.
13
We include the current cohort’s FSA score (Sst) in equation (11) to control for unmeasured time-
varying school characteristics that have persistent effects on student achievement and separation
probabilities. Suppose, for example, that a school hires an unusually bad grade 4 teacher in year
t-1 who produces lower FSA results. If her continuing presence at the school negatively
influences parents’ beliefs about school quality in year t, this directly increases students’ year t
separation probability. Absent an adequate control, the bad teacher’s independent effect on year
t-1 FSA scores and year t separations will be confounded with parents’ year t response to
information about year t-1 FSA scores. It is reasonable to assume, however, that if the bad
teacher influences students’ separation probability in t then she also influences students’ FSA
performance in t. Because year t FSA scores are not observed by parents until year t+ 1, they are
a valid control for the “bad teacher effect” in year t, as well as any other school-level
unobservables that jointly affect mobility and performance and have persistent effects over time.
Controlling for the current cohort’s FSA scores (Sst) thus allows us to identify parents’ response
to information from lagged test scores, under the identifying assumption that unobserved time-
varying factors that influenced previous cohorts’ achievement are only correlated with current-
year unmeasured heterogeneity in separations ( stυ and istε ) via their persistent effect on
achievement. When this assumption is satisfied, lagged FSA scores are exogenous in the
separation equation conditional on current FSA scores. The formal proof of identification is
provided in an Appendix.
If parents at low-achieving schools were more constrained by neighborhood enrolment policies
than parents in high-achieving schools, then separations from low-achieving schools might have
increased relative to separations from high-achieving schools when the open boundaries
enrolment policy took effect in 2002/2003. We therefore allow the coefficient on Sst to differ

14
before and after 2002/2003. Under our maintained assumption that unobserved time-varying
factors that influenced previous cohorts’ achievement are only correlated with υst and εist via their
persistent effect on achievement, this identifies the effect of information released in 2002/2003
separately from the effect of the change in enrolment policy.
4.2 Data
Our investigation focuses on B.C.’s Lower Mainland region, a large metropolitan area with a
population of approximately 2.5 million that includes the city of Vancouver and its suburbs. It
encompasses fourteen public school districts with a total annual enrollment of roughly 375,000
students in Kindergarten through Grade 12 (B.C. Ministry of Education 2007:8).12
Our student-level data are based on two administrative databases, integrated via a unique student
identifier: an enrollment database (collected for each student on September 30 of each year), and
an FSA exam database. Our analysis is based on an extract of the enrollment database that
includes all students in the Lower Mainland who entered Kindergarten between 1994/1995 and
2003/2004. We restrict our analysis to public school students who made regular progress through
the grades and remained in the Lower Mainland through grade 5. Our regression estimates are
based on the subset of this population enrolled in grade 4, because the FSA exam is administered
in this grade.13,14 We create our indicator of separations, yist, by comparing the school at which
the student was enrolled on September 30 of their grade 4 year and the school at which they were
enrolled on September 30 of the following year. Because FSA results are released in October, yist
measures separations during or at the completion of the grade 4 year, following the release of
FSA results.
We augment these data with: (1) school-by-grade average student characteristics; (2) selected
characteristics of each student’s neighborhood as measured in the Census of Population; (3)

15
school-average 1997/98 PLAP reading scores; (4) annual Fraser Institute school scores and
rankings for the 1999/2000 through 2003/2004 school years, and a three-year average score
released in 2003; and (5) geographic coordinates associated with each school’s postal code and
each student’s residential postal code.15
The complete set of information shocks and the variables we use to capture them in our control
function specification are summarized in Table 1. In each case, these variables are based on
school-average performance on the FSA reading and numeracy exams. The first set of FSA
results was released by the Ministry at the beginning of the 2000/2001 school year, and a new set
was released in each subsequent year. The Fraser Institute released their first scores and rankings
in June 2003, based on the FSA exams written in 1999/2000, 2000/2001 and 2001/2002. That
release included overall scores (out of 10) for each school in each of the three years, the three-
year average score (also out of 10), and school rankings based on the 2001/2002 score and the
three-year average score.16 The three-year average was arguably the most salient measure, since
schools were ordered on this measure in the ranking published in local newspapers.17 The Fraser
Institute released an additional set of scores and rankings based on the 2002/2003 FSA exams in
spring 2004. We normalize all information shock variables in Table 1 to have mean zero and
variance one over schools in each year.
The specific control variables included in our regressions are listed in the table notes and
described further in a Technical Appendix available from the CJE online archive at
cje.economics.ca..
16
5 Results
5.1 Descriptive statistics
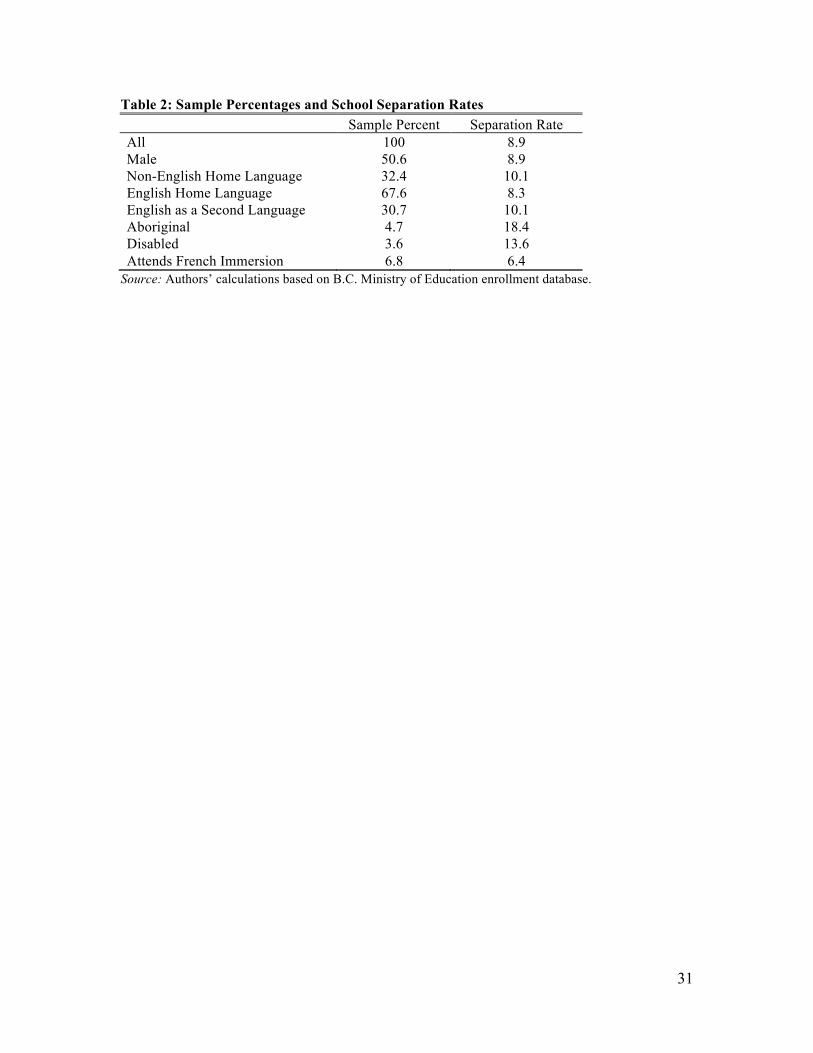
Our estimation sample consists of 65,180 students who attend 361 public elementary schools.22
We report sample means and mean separation rates for some key characteristics in Table 2
(sample means for all control variables are reported in Table OA1 in the Online Appendix).
Almost five percent of students self-report as Aboriginal, and these students have significantly
higher separation rates than average (18.4% vs. 8.9%). Almost one-third of students speak a
language at home other than English, and overall these students have a higher than average
separation rate. Only a small fraction (3.6%) has been diagnosed with disabilities at this early
stage of their education and approximately 7% of students attend a French Immersion program.
The separation rate of disabled students is higher than average (13.6%) and that of French
Immersion students is lower than average (6.4%).
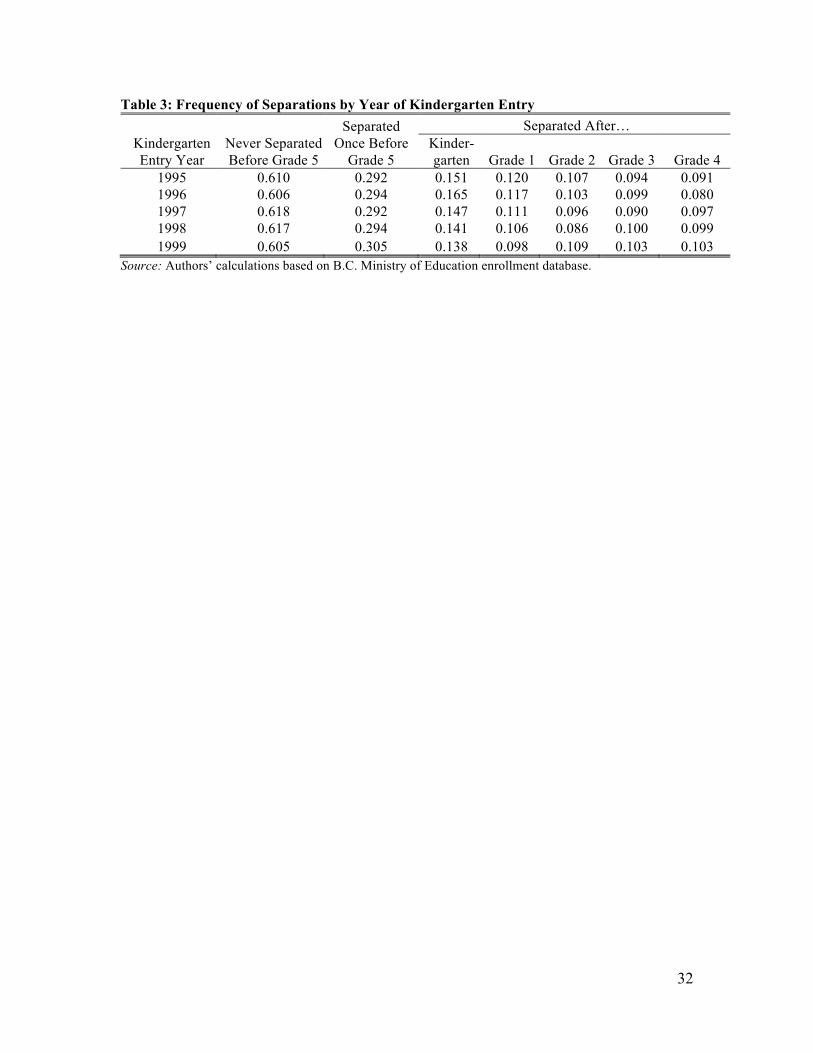
Table 3 shows school separation rates by grade for the five Kindergarten cohorts that we are able
to follow through grade 5. Over 60% of students remain in the same school throughout these
grades, and about 30% separate once. The remaining students experience multiple separations
between Kindergarten and grade 5. The separation rate is highest following Kindergarten, but is
still fairly high (between 8% and 10%) following grade 4.
17
5.2. Econometric estimates
Our theoretical model contains a number of testable implications. Most fundamentally, when
parents observe new information about school quality, they may alter their original school choice
if the information shock makes an alternative school appear more attractive. For this to occur,
the shock must provide new information about school quality rather than simply confirming what
they already know, and the signal cannot be so noisy relative to prior information that parents
ignore it.
5.2.1 Difference-in-differences estimates of response to first information shock
We begin by investigating parents’ response to the first public release of information about
school-level achievement. On the one hand, we expect parents to respond most strongly to this
first shock, since our model predicts that parents’ response to new releases of test score
information gets weaker over time as information accumulates and their beliefs about school
quality become increasingly precise. On the other hand, this first information release was not as
widely publicized as subsequent releases, so its effect may have been muted if some parents did
not absorb and act on this information.
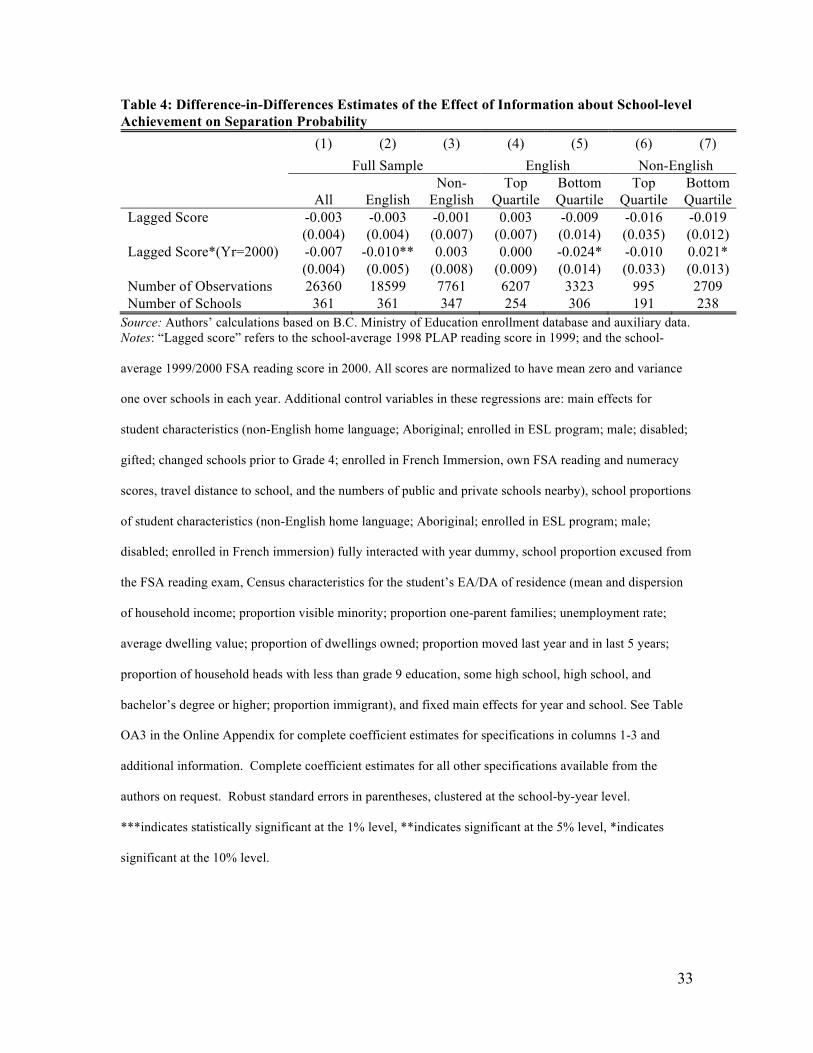
Selected coefficient estimates from our difference-in-differences estimator (eq. 10) are presented
in Table 4.18 Column 1 presents estimates for the full sample of grade 4 students in 1999/2000
and 2000/2001. The estimated coefficient of interest (the lagged test score interacted with an
indicator for the first year test score information was publicly released) is negative. This indicates
that students’ separation probability declined at public schools that received better news (higher
school-average test scores), relative to public schools where the news was worse. However the
estimate is small and imprecise and we cannot reject the null of no effect at conventional levels.
18
The remaining columns of Table 4 explore possible heterogeneity in parents’ response to the first
information release. In columns 2 and 3, we divide the sample into students who report speaking
English at home and those who report speaking another language. Language barriers may impede
some parents’ access to information, reducing the precision of test scores as signals of school
quality.19 Indeed, we find no evidence that non-English speakers responded to the first
information release. In contrast, we observe a substantive and statistically significant response
among parents who speak English at home: all else equal, a one standard deviation improvement
in a school’s average test score reduced students’ separation probability by a full percentage
point on a baseline separation rate of 8.3%.
In the remaining columns of Table 4, we investigate how parents’ responses to the first
information release varied by neighborhood income. Parents who live in disadvantaged
communities may have relatively poor access to private information (i.e., imprecise prior beliefs)
or fewer school choice opportunities, both of which could mediate their response to information
about school achievement. We consequently break out families who reside in Census EA/DAs in
the top (richest) and bottom quartiles of the distribution of average household income. The results
in columns 4 and 6 suggest that parents in top quartile neighborhoods do not respond to test score
information, regardless of home language. Families in high-income neighborhoods may already
have had good access to private information, so that the new public information did not cause
them to update their beliefs about schools in any meaningful way. In contrast, English-speaking
families in low-income neighborhoods responded quite strongly to new information (column 5).
We investigate this further below.
5.2.2 Control function estimates
Our estimates of parents’ response to the first release of school-average test scores suggest that
either this information did not reach certain groups, or the quantity or quality of the news it
19
contained was not sufficient to alter their school choices. Further insight into the factors that
shape parents’ heterogeneous responses can be gained by investigating how they responded to
subsequent releases of test scores, when this information was more widely disseminated. We
consequently turn to estimates for the full series of information shocks, based on our control
function specification. This specification allows us to distinguish between the lingering effects of
previous information releases versus the effect of newly released information. Recall that our
theoretical model predicts that even after new information about school quality is observed, “old
news” continues to influence parents’ beliefs (via ) and hence their choices.
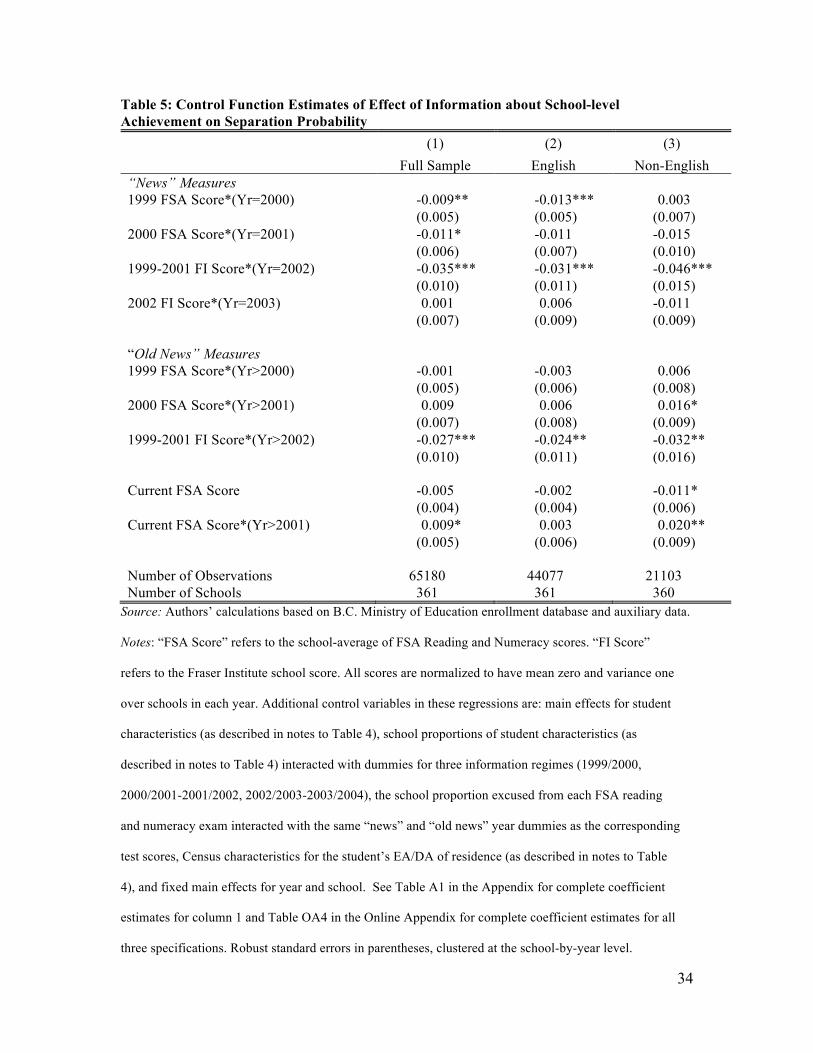
The first column of Table 5 presents selected coefficient estimates for the full sample of grade 4
students.20 We restrict the specification to a single information measure in each year: FSA exam
scores in the first two years (when these were the only information measures available) and
Fraser Institute scores in the latter two years (since these were published in the media, and
therefore are arguably more salient).21 In three of four years, the coefficient estimates are
negative, indicating that students’ separation probability declined at schools where the news was
better. The exception is the second release of Fraser Institute scores, where the coefficient is
effectively zero. The point estimates imply that a one standard deviation increase in the
1999/2000 FSA score relative to other schools reduced students’ separation probability by 0.9
percentage points. This is almost identical to the corresponding point estimate from the
difference-in-differences estimator. The corresponding figure for the 2000/2001 FSA score is 1.1
percentage points, and 3.5 percentage points for the first release of Fraser Institute scores. Only
the latter release had any effect beyond the initial year and, as predicted by our model, the “old
news” effect was smaller than the “news” effect (-0.027 versus -0.035). The estimated “old
news” effects associated with the other information releases are all statistically insignificant, and
the point estimates are small.
€
msT −1
20
The coefficient on the current-year mean FSA score is statistically insignificant, indicating no
systematic relationship between current-year achievement and separations.22 The sign of the
point estimate on the interaction between the current-year mean FSA score and an indicator for
those years that the open enrolment policy was in effect is positive, indicating that if anything
open enrolment increased separations from high-achieving schools relative to low-achieving
schools. Thus we are confident that the estimated negative effect of the first Fraser Institute
release, which coincided with the introduction of open enrolment, captures parents’ response to
the release of the Fraser Institute report cards, and not unobserved heterogeneity that jointly
affects achievement and mobility, or changes in behavior associated with the introduction of
open enrolment. Furthermore, the statistically significant response to FSA scores released by the
Ministry in 2000 and 2001, which predate the introduction of the open boundaries policy,
reinforces the impression that some parents were able to respond to new information about
school-level achievement even absent official open enrolment policies.
As with the difference-in-differences estimates, the point estimates in columns 2 and 3 indicate
that parents of children who speak English at home responded to the first release of FSA exam
scores, while non-English speaking parents did not. The magnitude of the point estimate is
slightly larger than from the difference-in-differences estimator, and implies that when a school
scored one standard deviation higher in the distribution of published school-average FSA scores,
students’ separation probability declined by 1.3 percentage points. On a base separation rate of
about 8.3% per year, this is quite a large response. Parents in this group responded further to the
first release of information by the Fraser Institute in 2002. The magnitude of the point estimate
implies that when a school scored one standard deviation higher in the distribution of Fraser
Institute scores, students’ separation probability declined by 3.1 percentage points. Again, this is
quite a large response.

21
As before, parents of children who report speaking a language other than English at home did not
respond to the release of FSA scores in 2000/01 and 2001/02. However, they did respond to the
release of Fraser Institute scores. The point estimate implies that a one standard deviation
increase in the first Fraser Institute score relative to other schools reduced these students’
separation probability by 4.6 percentage points. Such a large response suggests poor access to
previously released information, rather than resources or preferences, explains these parents’
delayed response to information about school-level achievement.
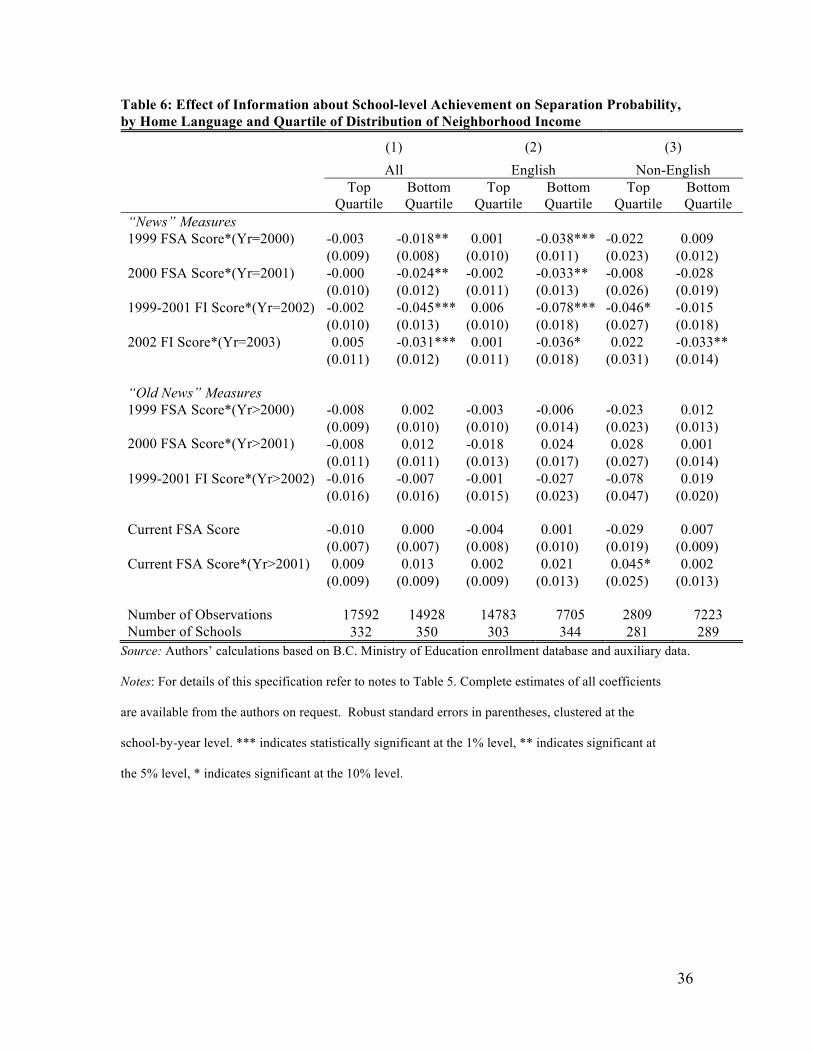
A potential concern is that language barriers may not be the genuine cause of observed
heterogeneity in responses. Rather, heterogeneity could be driven by correlates of language, such
as income. In Table 6, we present estimates broken out by quartiles of the distribution of
neighborhood income. The results follow essentially the same pattern as the difference-in-
difference estimates for the first information release. Parents in top quartile neighborhoods, both
in the full sample and in the English-speaking sub-sample, do not respond to test score
information. In contrast, those in low-income neighborhoods respond strongly. Public
information releases evidently contained substantial news for these parents, leading them to
update their beliefs about school quality and respond substantively. Non-English speaking
parents do not respond to the first or second release of FSA scores by the Ministry, regardless of
neighborhood income. However they do respond to subsequent releases of Fraser Institute
scores, although the timing of the response differs by neighborhood income. Overall, it seems
clear that access to information about test scores, rather than school choice opportunities,
preferences or financial resources, is the essential factor determining how parents respond.
We explore the sensitivity of our results to sample composition and specification in Table OA5 in
the Online Appendix. These robustness checks show that English-language parents’ estimated
response to information is not driven by the behavior of Aboriginal parents or parents of French

22
Immersion students (as shown in Table 2, both of these groups had unconditional separation rates
significantly different from the average student); nor are our estimates sensitive to specifying
information measures based on schools’ Fraser Institute rankings instead of Fraser Institute
scores.
Under our identifying assumptions, our reported estimates can be interpreted as causal. We
cannot test these identifying assumptions directly. We therefore look for contradictory evidence
via two falsification tests for each specification reported in Table 5. In each, we replace our
“news” variables with false information measures based on year t +1 and year t test scores
respectively, and correspondingly update the “oldnews” variables. Parents could not directly
observe these false news measures at the time they were making school choice decisions, and
consequently there should be no systematic relationship between them and separations.
Estimates, reported in Tables OA6 and OA7 in the Online Appendix, confirm this to be true.
6 Conclusion
We find that the public release of information about school-level achievement had a substantial
effect on the inter-school mobility of some public school students in the Lower Mainland of B.C.
A substantial proportion of parents appear to revise their beliefs about the relative quality of their
child’s school in response to this information, and “vote with their feet” by moving their child to
a preferred school. This response is observed primarily among parents who reside in low-income
neighborhoods, and occurs the first time that school-level achievement measures are placed in the
public domain. While both English and non-English language parents respond strongly to public
information about school achievement, non-English parents appear to face higher costs of
accessing school achievement information. They respond strongly to school achievement
information, but only when the media provided widespread coverage to the Fraser Institute’s
school report cards. These results suggest that high-profile dissemination can play a crucial role
23
in ensuring access to publicly provided information in environments with culturally and
linguistically diverse populations.
Jurisdictions that publicize school-level results typically update this information annually, raising
concerns that parents may respond to year-to-year fluctuations that are largely noise (Kane and
Staiger 2002, Mizala, Romaguera and Urquiola 2007). Our results show that English-speaking
parents in low-income neighborhoods respond immediately to the first release of information,
and continue to respond to subsequent releases in later years. Our data provide no way to
determine whether these ongoing responses are a series of reactions to noisy information updates,
or whether they simply reflect the time it takes for information to reach all members of the
community. Likewise, the delayed response of non-English-speaking parents suggests
substantial heterogeneity in parents’ access to public information. Consequently, annual releases
of school achievement information that elicit ongoing media coverage may play an important role
in communicating that information to all segments of the community, including recent
immigrants.
Our results add to a growing body of evidence that information about school-level achievement
affects behavior in ways that may have real consequences for educational outcomes. In addition
to ensuring that all parents are able to access the information provided, educational authorities
should therefore take care to ensure that widely disseminated information brings competitive
pressure to bear on schools that are ineffective, rather than on schools that serve disadvantaged
populations. As a growing literature attests, designing meaningful measures of school
effectiveness continues to be a challenge (Hægeland et al. 2004, Mizala, Romaguera and
Urquiola 2007).
24
References
Altonji, Joseph G., and Charles R. Pierret (2001) ‘Employer learning and statistical
discrimination’, The Quarterly Journal of Economics 116(1): 313-350
Barrow, Lisa (2002) ‘School choice through relocation: evidence from the Washington, D.C.
area’, Journal of Public Economics 86(2): 155-189
Bayer, Patrick, Fernando Ferreira, and Robert McMillan (2004) ‘Tiebout sorting, social
multipliers and the demand for school quality’, NBER Working Paper No. 10871, National
Bureau of Economic Research
Becker, G. S. (1995) ‘Human capital and poverty alleviation’, World Bank Human Resource and
Operation Policy Working Paper Number 52 (Washington, D.C)
Berry, Steven, James Levinsohn, and Ariel Pakes (1995)’ Automobile prices in market
equilibrium’, Econometrica 63(4): 841-890
Black, Sandra E. (1999) ‘Do better schools matter? Parental valuation of elementary education’,
Quarterly Journal of Economics 114(2): 577-599
B.C. Ministry of Education (1999) English as a Second Language Policy Framework (Victoria:
Government of British Columbia)
B.C. Ministry of Education (2002) 2002/03 Operating Grants Manual to British Columbia
School Boards (Victoria: Government of British Columbia

25
B.C. Ministry of Education (2000). Interpreting and communicating Foundation Skills
Assessment Results 2000 (Victoria: Government of British Columbia)
B.C. Ministry of Education (2001) Interpreting and communicating Foundation Skills
Assessment Results 2001 (Victoria: Government of British Columbia)
B.C. Ministry of Education (2005) Overview of Independent Schools in British Columbia
(Victoria: Government of British Columbia)
B.C. Ministry of Education (2007). 2006/07 Summary of Key Information (Victoria: Government
of British Columbia)
Chernew, Michael, Gautam Gowrisankaran, and Dennis P. Scanlon (2008) ‘Learning and the
value of information: Evidence from health plan report cards’, Journal of Econometrics 144 (1):
156-174
Cowley, Peter (2007) Bringing Education into the Market Place: Part 1 - The Report Cards on
Schools (Vancouver, B.C.: The Fraser Institute)
Cowley, Peter and Stephen T. Easton, (2003) Report Card on British Columbia’s Elementary
Schools: 2003 Edition (Vancouver, B.C.: Fraser Institute)
Cowley, Peter, and Stephen T. Easton, (2008) Report Card on British Columbia’s Elementary
Schools: 2008 Edition (Vancouver, B.C.: Fraser Institute)

26
Dafny, Leemore, and David Dranove (2008) ‘Do report cards tell consumers anything they don’t
already know? The case of Medicare HMOs’, RAND Journal of Economics 39(3): 790-821
Downes, T.A., and J.E. Zabel (2002) ‘The impact of school characteristics on house prices:
Chicago 1987-1991’, Journal of Urban Economics 52(1): 1-25
Dranove, David, Daniel Kessler, Mark McClellan, and Mark Satterthwaite (2003) ‘Is more
information better? The effects of “report cards” on health care providers’, Journal of Political
Economy 111(3): 555-588
Erdem, Tulin, and Michael P. Keane (1996) ‘Decision-making under uncertainty: capturing
dynamic brand choice processes in turbulent consumer goods markets’, Marketing Science 15(1):
1-20
Figlio, David N., and Maurice E. Lucas (2004) ‘What's in a grade? School report cards and the
housing market’, American Economic Review 94(3): 591-604
Fiske, E. B., and H. F. Ladd (2000) When Schools Compete: A Cautionary Tale (Washington,
DC: Brookings Institution Press)
Fiva, John F. and Lars J. Kirkebøen (2010) ‘Information shocks and the dynamics of the housing
market’, Scandinavian Journal of Economics 113(3): 525-552.
Fraser Institute (2008). Who We Are. http://www.fraserinstitute.org/aboutus/whoweare/
27
Friedman, M. (1955) ‘The role of government in education’, in Economics and the Public
Interest, ed. Solo (Piscataway, N.J.: Rutgers University Press)
Gibbons, S. and S. Machin (2003) ‘Valuing English primary schools’, Journal of Urban
Economics 53: 197-219
Gibbons, S. and S. Machin (2006) ‘Paying for primary schools: admissions constraints, school
popularity or congestion?’, Economic Journal 116: 77-92
Hanushek, Eric A., Kain, John F., and Rivkin, Steven G. (2002) ‘Inferring program effects for
special populations: Does special education raise achievement for students with disabilities?’,
Review of Economics and Statistics, 84: 584-599
Hastings, Justine S., Thomas J. Kane, and Douglas O. Staiger (2009) ‘Heterogeneous preferences
and the efficacy of public school choice’, mimeo, Yale University
Hasting, J., and J. Weinstein (2008) ‘Information, school choice and academic achievement:
evidence from two experiments’, Quarterly Journal of Economics 123(4): 1373-1414
Hoxby, Caroline M. (2003) ‘School choice and school productivity (or could school choice be a
tide that lifts all boats?’, in The Economics of School Choice, ed. C. Hoxby (Chicago: The
University of Chicago Press)
Hussain, Iftikhar (2007) ‘School choice, information disclosure and sanctions: evidence from an
unusually tough school accountability regime’, mimeo, University College London

28
Ichino, Andrea, and Enrico Moretti (2009) ‘Biological gender differences, absenteeism, and the
earnings gap’, American Economic Journal: Applied Economics 1(1): 183-218
Jin, Ginger Zhe and Phillip Leslie (2003) ‘The effects of information on product quality:
evidence from restaurant hygiene grade cards’, Quarterly Journal of Economics 118(2): 409-451
Jin, Ginger Zhe and Alan T. Sorensen (2006) ‘Information and consumer choice: the value of
publicized health plan ratings’, Journal of Health Economics 25(2): 248-275
Kane, Thomas and Douglas O. Staiger (2002) ‘The promise and pitfalls of using imprecise
school accountability measures’, Journal of Economic Perspectives 16(4): 91-114
Kane, Thomas J., Douglas O. Staiger and Gavin Samms (2003) ‘School accountability ratings
and housing values’, Brookings-Wharton Papers on Urban Affairs: 83-137
Lange, Fabian (2007) ‘The speed of employer learning’, The Journal of Labor Economics 25(1):
1-34
McFadden, Daniel (1978) ‘Modeling the choice of residential location’, in Spatial Interaction
Theory and Planning Models, ed. A. Karlquist et al., (New York: Elsevier North-Holland)
Mizala, Alejandra, Pilar Romaguera and Miguel Urquiola (2007) ‘Socioeconomic status or
noise? Tradeoffs in the generation of school quality information’, Journal of Development
Economics 84: 61-75
29
Mizala, Alejandra and Miguel Urquiola (2008) ‘School markets: the impact of information
approximating school effectiveness’, Working Paper, Columbia University
Moretti, Enrico (2010)’ Social learning and peer effects in consumption: Evidence from movie
sales’, Review of Economic Studies, forthcoming
Navarro, Salvador (2008) ‘Control functions’, in The New Palgrave Dictionary of Economics
Online, ed. Steven N. Durlauf and Lawrence E. Blume, 18 December 2010,
DOI:10.1057/9780230226203.0311 (Palgrave Macmillan)
Raptis, Helen and Thomas Fleming (2006) ‘Large-scale assessment outcomes in British
Columbia’, Canadian Journal of Education 29: 1191-1222
Ries, John and Tsur Somerville (2010) ‘School quality and residential values: Evidence from
Vancouver zoning’, Review of Economics and Statistics 92(4): 928-944
West, Anne and H. Pennell (2000) ‘Publishing school examination results in England: Incentives
and consequences’, Educational Studies 26(4): 423-436
Woodcock, Simon D. (2010) ‘Heterogeneity and learning in labor markets’, The B.E. Journal of
Economic Analysis & Policy (Advances) 10(1): Article 85

30
Table 1: Information Shocks and Information Variables Information Date "News" Variables "Old News" Variables 1999/2000 cohort school mean FSA exam results released to parents on request Oct. 2000
(1999 Mean FSA Score)*(Yr=2000)
(1999 Mean FSA Score)*(Yr>2000)
2000/2001 cohort school mean FSA exam results released on Ministry of Education website Oct. 2001
(2000 Mean FSA Score)*(Yr=2001)
(2000 Mean FSA Score)*(Yr>2001)
2001/2002 cohort school mean FSA exam results released on Ministry of Education website Oct. 2002
(2001 Mean FSA Score)*(Yr=2002)
(2001 Mean FSA Score)*(Yr>2002)
1999/2000, 2000/2001 and 2001/2002 cohort Fraser Institute (FI) scores and rankings released June 2003
(1999-2001 Mean FI Score)*(Yr=2002); (2001 FI Score)*(Yr=2002)
(1999-2001 Mean FI Score)*(Yr>2002); (2001 FI Score)*(Yr>2002)
2002/2003 cohort school mean FSA exam results released on Ministry of Education website Oct. 2003
(2002 Mean FSA Score)*(Yr=2003) out of sample
2002/2003 cohort Fraser Institute scores and rankings released June 2004 (2002 FI Score)*(Yr=2003) out of sample
Sources: see text. Note: Calendar years in “News” and “Old news” variable names refer to the calendar
year in which the school year began. For instance, “2001 FI Score” refers to the Fraser
Institute score based on the FSA exam administered in the 2001/2002 school year. This
measure was released in June 2003, and hence could first affect separations at the end of
the 2002/2003 school year (Yr=2002).
31
Table 2: Sample Percentages and School Separation Rates Sample Percent Separation Rate
All 100 8.9 Male 50.6 8.9 Non-English Home Language 32.4 10.1 English Home Language 67.6 8.3 English as a Second Language 30.7 10.1 Aboriginal 4.7 18.4 Disabled 3.6 13.6 Attends French Immersion 6.8 6.4
Source: Authors’ calculations based on B.C. Ministry of Education enrollment database.
32
Table 3: Frequency of Separations by Year of Kindergarten Entry
Kindergarten Entry Year
Never Separated Before Grade 5
Separated Once Before
Grade 5
Separated After… Kinder- garten Grade 1 Grade 2 Grade 3 Grade 4
1995 0.610 0.292 0.151 0.120 0.107 0.094 0.091 1996 0.606 0.294 0.165 0.117 0.103 0.099 0.080 1997 0.618 0.292 0.147 0.111 0.096 0.090 0.097 1998 0.617 0.294 0.141 0.106 0.086 0.100 0.099 1999 0.605 0.305 0.138 0.098 0.109 0.103 0.103
Source: Authors’ calculations based on B.C. Ministry of Education enrollment database.
33
Table 4: Difference-in-Differences Estimates of the Effect of Information about School-level Achievement on Separation Probability
(1) (2) (3) (4) (5) (6) (7)
Full Sample English Non-English
All English Non-
English Top
Quartile Bottom Quartile
Top Quartile
Bottom Quartile
Lagged Score -0.003 -0.003 -0.001 0.003 -0.009 -0.016 -0.019 (0.004) (0.004) (0.007) (0.007) (0.014) (0.035) (0.012) Lagged Score*(Yr=2000) -0.007 -0.010** 0.003 0.000 -0.024* -0.010 0.021* (0.004) (0.005) (0.008) (0.009) (0.014) (0.033) (0.013) Number of Observations 26360 18599 7761 6207 3323 995 2709 Number of Schools 361 361 347 254 306 191 238
Source: Authors’ calculations based on B.C. Ministry of Education enrollment database and auxiliary data. Notes: “Lagged score” refers to the school-average 1998 PLAP reading score in 1999; and the school-
average 1999/2000 FSA reading score in 2000. All scores are normalized to have mean zero and variance
one over schools in each year. Additional control variables in these regressions are: main effects for
student characteristics (non-English home language; Aboriginal; enrolled in ESL program; male; disabled;
gifted; changed schools prior to Grade 4; enrolled in French Immersion, own FSA reading and numeracy
scores, travel distance to school, and the numbers of public and private schools nearby), school proportions
of student characteristics (non-English home language; Aboriginal; enrolled in ESL program; male;
disabled; enrolled in French immersion) fully interacted with year dummy, school proportion excused from
the FSA reading exam, Census characteristics for the student’s EA/DA of residence (mean and dispersion
of household income; proportion visible minority; proportion one-parent families; unemployment rate;
average dwelling value; proportion of dwellings owned; proportion moved last year and in last 5 years;
proportion of household heads with less than grade 9 education, some high school, high school, and
bachelor’s degree or higher; proportion immigrant), and fixed main effects for year and school. See Table
OA3 in the Online Appendix for complete coefficient estimates for specifications in columns 1-3 and
additional information. Complete coefficient estimates for all other specifications available from the
authors on request. Robust standard errors in parentheses, clustered at the school-by-year level.
***indicates statistically significant at the 1% level, **indicates significant at the 5% level, *indicates
significant at the 10% level.
34
Table 5: Control Function Estimates of Effect of Information about School-level Achievement on Separation Probability
(1) (2) (3)
Full Sample English Non-English
“News” Measures 1999 FSA Score*(Yr=2000) -0.009** -0.013*** 0.003
(0.005) (0.005) (0.007) 2000 FSA Score*(Yr=2001) -0.011* -0.011 -0.015
(0.006) (0.007) (0.010) 1999-2001 FI Score*(Yr=2002) -0.035*** -0.031*** -0.046***
(0.010) (0.011) (0.015) 2002 FI Score*(Yr=2003) 0.001 0.006 -0.011 (0.007) (0.009) (0.009) “Old News” Measures 1999 FSA Score*(Yr>2000) -0.001 -0.003 0.006
(0.005) (0.006) (0.008)
2000 FSA Score*(Yr>2001) 0.009 0.006 0.016* (0.007) (0.008) (0.009)
1999-2001 FI Score*(Yr>2002) -0.027*** -0.024** -0.032** (0.010) (0.011) (0.016)
Current FSA Score -0.005 -0.002 -0.011* (0.004) (0.004) (0.006) Current FSA Score*(Yr>2001) 0.009* 0.003 0.020** (0.005) (0.006) (0.009) Number of Observations 65180 44077 21103 Number of Schools 361 361 360
Source: Authors’ calculations based on B.C. Ministry of Education enrollment database and auxiliary data.
Notes: “FSA Score” refers to the school-average of FSA Reading and Numeracy scores. “FI Score”
refers to the Fraser Institute school score. All scores are normalized to have mean zero and variance one
over schools in each year. Additional control variables in these regressions are: main effects for student
characteristics (as described in notes to Table 4), school proportions of student characteristics (as
described in notes to Table 4) interacted with dummies for three information regimes (1999/2000,
2000/2001-2001/2002, 2002/2003-2003/2004), the school proportion excused from each FSA reading
and numeracy exam interacted with the same “news” and “old news” year dummies as the corresponding
test scores, Census characteristics for the student’s EA/DA of residence (as described in notes to Table
4), and fixed main effects for year and school. See Table A1 in the Appendix for complete coefficient
estimates for column 1 and Table OA4 in the Online Appendix for complete coefficient estimates for all
three specifications. Robust standard errors in parentheses, clustered at the school-by-year level.

35
***indicates statistically significant at the 1% level, **indicates significant at the 5% level, *indicates
significant at the 10% level.
36
Table 6: Effect of Information about School-level Achievement on Separation Probability, by Home Language and Quartile of Distribution of Neighborhood Income
(1) (2) (3) All English Non-English
Top Bottom Top Bottom Top Bottom Quartile Quartile Quartile Quartile Quartile Quartile
“News” Measures 1999 FSA Score*(Yr=2000) -0.003 -0.018** 0.001 -0.038*** -0.022 0.009
(0.009) (0.008) (0.010) (0.011) (0.023) (0.012) 2000 FSA Score*(Yr=2001) -0.000 -0.024** -0.002 -0.033** -0.008 -0.028 (0.010) (0.012) (0.011) (0.013) (0.026) (0.019) 1999-2001 FI Score*(Yr=2002) -0.002 -0.045*** 0.006 -0.078*** -0.046* -0.015 (0.010) (0.013) (0.010) (0.018) (0.027) (0.018) 2002 FI Score*(Yr=2003) 0.005 -0.031*** 0.001 -0.036* 0.022 -0.033** (0.011) (0.012) (0.011) (0.018) (0.031) (0.014) “Old News” Measures 1999 FSA Score*(Yr>2000) -0.008 0.002 -0.003 -0.006 -0.023 0.012 (0.009) (0.010) (0.010) (0.014) (0.023) (0.013) 2000 FSA Score*(Yr>2001) -0.008 0.012 -0.018 0.024 0.028 0.001 (0.011) (0.011) (0.013) (0.017) (0.027) (0.014) 1999-2001 FI Score*(Yr>2002) -0.016 -0.007 -0.001 -0.027 -0.078 0.019 (0.016) (0.016) (0.015) (0.023) (0.047) (0.020) Current FSA Score -0.010 0.000 -0.004 0.001 -0.029 0.007 (0.007) (0.007) (0.008) (0.010) (0.019) (0.009) Current FSA Score*(Yr>2001) 0.009 0.013 0.002 0.021 0.045* 0.002 (0.009) (0.009) (0.009) (0.013) (0.025) (0.013) Number of Observations 17592 14928 14783 7705 2809 7223 Number of Schools 332 350 303 344 281 289
Source: Authors’ calculations based on B.C. Ministry of Education enrollment database and auxiliary data.
Notes: For details of this specification refer to notes to Table 5. Complete estimates of all coefficients
are available from the authors on request. Robust standard errors in parentheses, clustered at the
school-by-year level. *** indicates statistically significant at the 1% level, ** indicates significant at
the 5% level, * indicates significant at the 10% level.

37
Appendix A: Identification via the Control Function Estimator For illustrative purposes, consider a simplified version of equation (11):
(A1) istststtistist SXy ευαβ +++ʹ′= −13 .
We have subsumed all observables, including the constant, fixed school and year effects,
and student characteristics, into Xist. We have also omitted longer lags of test scores for
expositional clarity, and omitted the current test score, Sst, to illustrate the potential
endogeneity problem. We assume observables are exogenous in the sense that Xist and
Xist-1 are uncorrelated with υst and εist.
Consider the projection of school-average test scores onto contemporaneous observables:
(A2) stistst XS χγ +ʹ′=
where χst has mean zero and is orthogonal to Xist by construction. It is helpful to think of
χst as a mean-zero “shock” that represents the effect of teachers and other time-varying
school-specific unobservables on test scores. Equation (A2) implies 111 −−− +ʹ′= stistst XS χγ .
Given exogeneity of Xist-1, lagged test scores are therefore endogenous in (A1) if and only
if past shocks to achievement, χst-1, are correlated with unobserved heterogeneity in
separations (υst or εist).
Suppose that shocks to achievement are correlated with unobserved time-varying school-
specific heterogeneity in separation probabilities. We represent this via the projection:
(A3) ststst ξκχυ +=
38
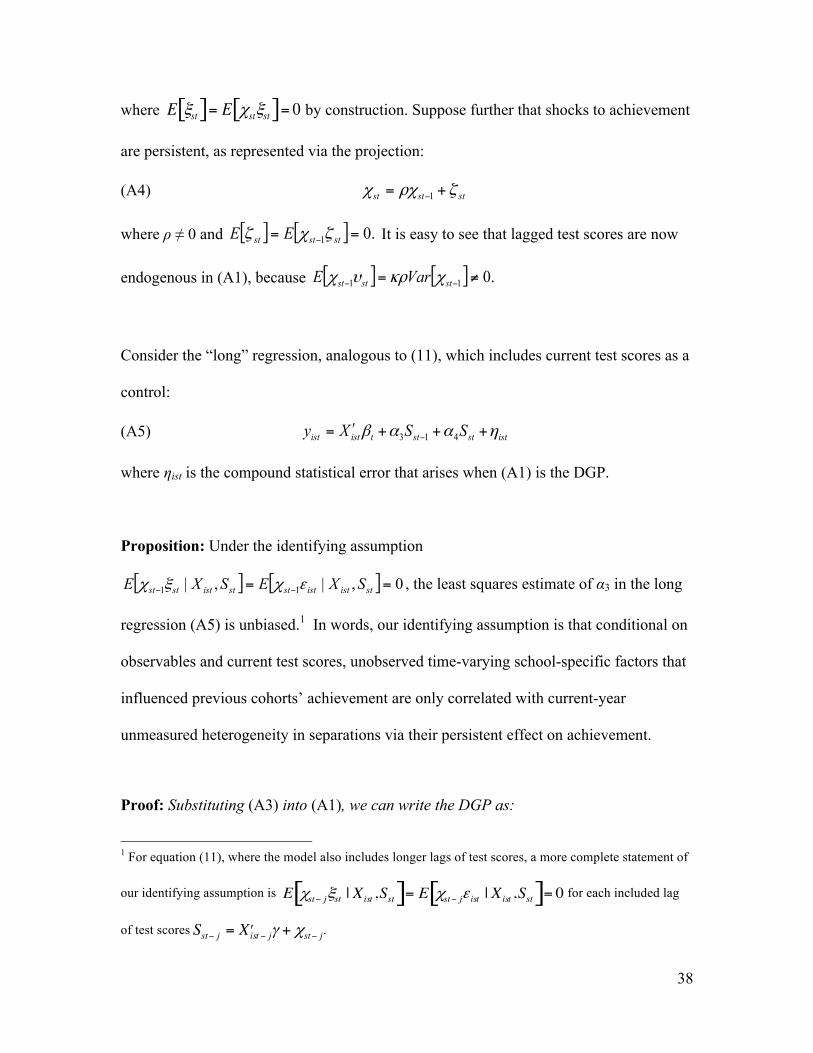
where
€
E ξst[ ]= E χstξst[ ]= 0 by construction. Suppose further that shocks to achievement
are persistent, as represented via the projection:
(A4) ststst ζρχχ += −1
where ρ ≠ 0 and [ ] [ ] .01 == − ststst EE ζχζ It is easy to see that lagged test scores are now
endogenous in (A1), because [ ] [ ] .011 ≠= −− ststst VarE χκρυχ
Consider the “long” regression, analogous to (11), which includes current test scores as a
control:
(A5) istststtistist SSXy ηααβ +++ʹ′= − 413
where ηist is the compound statistical error that arises when (A1) is the DGP.
Proposition: Under the identifying assumption
[ ] [ ] 0,|,| 11 == −− stististststiststst SXESXE εχξχ , the least squares estimate of α3 in the long
regression (A5) is unbiased.1 In words, our identifying assumption is that conditional on
observables and current test scores, unobserved time-varying school-specific factors that
influenced previous cohorts’ achievement are only correlated with current-year
unmeasured heterogeneity in separations via their persistent effect on achievement.
Proof: Substituting (A3) into (A1), we can write the DGP as:
1 For equation (11), where the model also includes longer lags of test scores, a more complete statement of
our identifying assumption is
€
E χst− jξst | Xist ,Sst[ ]= E χst− jε ist | Xist ,Sst[ ]= 0 for each included lag
of test scores
€
Sst− j = ʹ′ X ist − jγ + χst− j.
39
(A6) iststststtistist SXy εξκχαβ ++++ʹ′= −13 .
The least squares estimate of α3 from the long regression (A5) satisfies:
[ ] [ ] [ ] [ ]stististststiststststiststst SXSEVSXSEVSXSEVE ,|,|,|ˆ 11
11
11
33 εξχκαα −−
−−
−− +++=
where [ ]stistst SXSVarV ,|1−= . [ ]stiststst SXSE ,|1χ− is the covariance between Sst-1 and
residuals from the regression of χst on Xist and Sst. These residuals are zero from the
definition of χst in (A2), and hence [ ] 0,|1 =− stiststst SXSE χ also. Similarly,
[ ] ( )[ ] [ ] 0,|,|,| 1111 ==+ʹ′= −−−− stiststststistststiststiststst SXESXXESXSE ξχξχγξ
where the second equality follows from exogeneity of 1−istX , and the final equality is our
identifying assumption. An identical argument gives,
[ ] ( )[ ] [ ] 0,|,|,| 1111 ==+ʹ′= −−−− stististststististstiststististst SXESXXESXSE εχεχγε
and hence [ ] .ˆ 33 αα =E
The intuition underlying this result is straightforward. Since Xist-1 is exogenous, only the
“shock” component of lagged test scores, 1−stχ , is potentially endogenous. Equation (A2)
implies that Sst is a valid control function for χst. Thus the only potential source of
endogeneity in the long regression is conditional covariation between 1−stχ and
unobserved heterogeneity that is orthogonal to current test scores, i.e., stξ and the
component of istε that is orthogonal to Sst. Our identifying assumption rules this out.
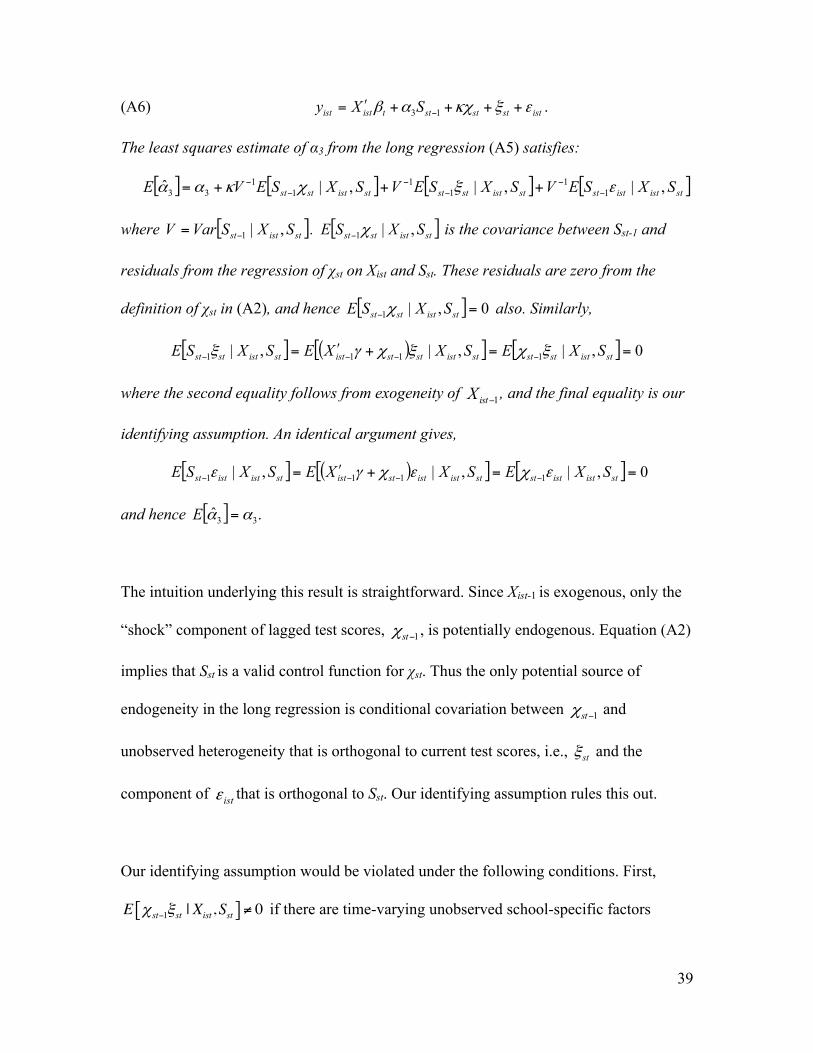
Our identifying assumption would be violated under the following conditions. First,
E ! st!1"st | Xist,Sst[ ] " 0 if there are time-varying unobserved school-specific factors
40
(including school-level policy and teacher quality) that are correlated with lagged test
scores and current separations, but uncorrelated with current test scores (and Xist).
Similarly, E ! st!1"ist | Xist,Sst[ ] " 0 if there are unobserved student characteristics that are
correlated with lagged test scores and current separations, but uncorrelated with current
test scores (and Xist). It is difficult to construct realistic examples where these conditions
would arise. We nevertheless implement several falsification tests (see the Results
section and online Appendix) to assess the validity of our identifying assumption, and
find no systematic evidence to the contrary.
41
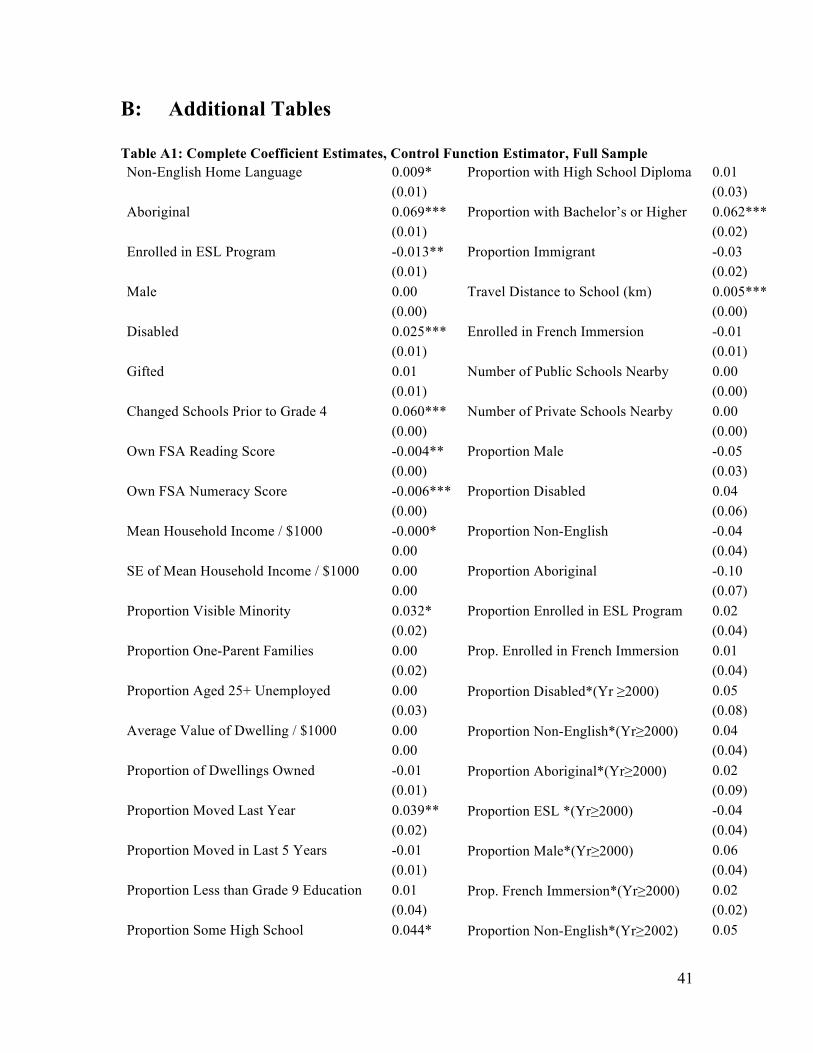
B: Additional Tables
Table A1: Complete Coefficient Estimates, Control Function Estimator, Full Sample Non-English Home Language 0.009* Proportion with High School Diploma 0.01 (0.01) (0.03) Aboriginal 0.069*** Proportion with Bachelor’s or Higher 0.062*** (0.01) (0.02) Enrolled in ESL Program -0.013** Proportion Immigrant -0.03 (0.01) (0.02) Male 0.00 Travel Distance to School (km) 0.005*** (0.00) (0.00) Disabled 0.025*** Enrolled in French Immersion -0.01 (0.01) (0.01) Gifted 0.01 Number of Public Schools Nearby 0.00 (0.01) (0.00) Changed Schools Prior to Grade 4 0.060*** Number of Private Schools Nearby 0.00 (0.00) (0.00) Own FSA Reading Score -0.004** Proportion Male -0.05 (0.00) (0.03) Own FSA Numeracy Score -0.006*** Proportion Disabled 0.04 (0.00) (0.06) Mean Household Income / $1000 -0.000* Proportion Non-English -0.04 0.00 (0.04) SE of Mean Household Income / $1000 0.00 Proportion Aboriginal -0.10 0.00 (0.07) Proportion Visible Minority 0.032* Proportion Enrolled in ESL Program 0.02 (0.02) (0.04) Proportion One-Parent Families 0.00 Prop. Enrolled in French Immersion 0.01 (0.02) (0.04) Proportion Aged 25+ Unemployed 0.00 Proportion Disabled*(Yr ≥2000) 0.05 (0.03) (0.08) Average Value of Dwelling / $1000 0.00 Proportion Non-English*(Yr≥2000) 0.04 0.00 (0.04) Proportion of Dwellings Owned -0.01 Proportion Aboriginal*(Yr≥2000) 0.02 (0.01) (0.09) Proportion Moved Last Year 0.039** Proportion ESL *(Yr≥2000) -0.04 (0.02) (0.04) Proportion Moved in Last 5 Years -0.01 Proportion Male*(Yr≥2000) 0.06 (0.01) (0.04) Proportion Less than Grade 9 Education 0.01 Prop. French Immersion*(Yr≥2000) 0.02 (0.04) (0.02) Proportion Some High School 0.044* Proportion Non-English*(Yr≥2002) 0.05

42
(0.03) (0.05) Proportion Aboriginal*(Yr≥2002) 0.18 Current FSA Score*(Yr>2001) 0.009* (0.13) (0.01) Proportion ESL *(Yr≥2002) -0.06 Prop. Excused 1999 Read.*(Yr=2000) 0.05 (0.04) (0.25) Proportion Male*(Yr≥2002) -0.06 Prop. Excused 2000 Read.*(Yr=2001) 0.00 (0.07) (0.21) Proportion French Immersion*(Yr≥2002) -0.047*** Prop. Excused 2001 Read.*(Yr=2002) -0.234* (0.02) (0.13) Proportion Disabled*(Yr≥2002) -0.04 Prop. Excused 2002 Read.*(Yr=2003) -0.02 (0.10) (0.08) Year = 2000 -0.01 Prop. Excused 1999 Num.*(Yr=2000) -0.05 (0.01) (0.28) Year=2001 -0.04 Prop. Excused 2000 Num.*(Yr=2001) -0.04 (0.02) (0.20) Year=2002 -0.02 Prop. Excused 2001 Num.*(Yr=2002) 0.16 (0.03) (0.11) Year=2003 0.01 Prop. Excused 2002 Num.*(Yr=2003) -0.08 (0.04) (0.11) 1999 FSA Score*(Yr=2000) -0.009** Prop. Excused 1999 Read.*(Yr>2000) 0.05 (0.01) (0.20) 2000 FSA Score*(Yr=2001) -0.011* Prop. Excused 2000 Read.*(Yr>2001) 0.00 (0.01) (0.18) 1999-2001 FI Score*(Yr=2002) -0.035*** Prop. Excused 2001 Read.*(Yr>2002) -0.14
(0.01) (0.12) 2002 FI Score*(Yr=2003) 0.00 Prop. Excused 1999 Num.*(Yr>2000) 0.11
(0.01) (0.23) 1999 FSA Score*(Yr>2000) 0.00 Prop. Excused 2000 Num.*(Yr>2001) -0.06
(0.01) (0.18) 2000 FSA Score*(Yr>2001) 0.01 Prop. Excused 2001 Num.*(Yr>2002) 0.164* (0.01) (0.09) 1999-2001 FI Score*(Yr>2002) -0.027*** Constant 0.088*** (0.01) (0.03) Current FSA Score -0.01
(0.00) Source: Authors’ calculations based on B.C. Ministry of Education enrollment database and auxiliary data.
Notes: This table reports all coefficient estimates for the specifications reported in column 1 of Table 5 in
the main text. “FSA Score” refers to the school-average of FSA reading and numeracy scores. “FI Score”
refers to the Fraser Institute school score. All scores are normalized to have mean zero and variance one
over schools in each year. “Nearby” is defined as a circle with radius equal to the 75th percentile of travel

43
distance to school. Robust standard errors in parentheses, clustered at the school-by-year level.
***indicates statistically significant at the 1% level, **indicates significant at the 5% level, *indicates
significant at the 10% level.

44
Lead footnote: Alfred Kong and Klaus Edenhoffer provided valuable research assistance
and Andreas Ludwig assisted in the collection of school postal codes. The administrative
data used in this research were extracted from the B.C. Ministry of Education’s student
records by Maria Trache at Edudata Canada. We are grateful to Peter Cowley for
providing us with the Fraser Institute’s school scores and rankings in electronic form.
Funding for this project was provided by Simon Fraser University’s Community Trust
Endowment Fund. We thank Abigail Payne, Tom Crossley, Phil DeCicca, Steve Easton,
Andrew Chesher, Jan Brenner, David Card, Enrico Moretti, and Fabian Waldinger and
three anonymous referees for helpful comments and advice.
1 Information about school achievement is publicly disseminated in jurisdictions
including England (West and Pennell 2000), Chile (Urquiola, McEwan and Vegas 2007),
New Zealand (Fiske and Ladd 2000), and many U.S. states (Figlio and Lucas 2004) and
Canadian provinces (Cowley 2007).
2 A large body of literature examines the relationship between school-level achievement
measures and real estate prices, but most studies do not focus on the effect of new
information on prices (e.g. Black 1999; Barrow 2002; Bayer et al. 2004; Gibbons and
Machin 2003, 2006; Ries and Somerville 2010). These studies typically find that
residential property values are higher in neighborhoods with higher-achieving schools.
3 The grade 10 FSA exams were discontinued after the 2002/2003 school year.
4 The authors are not affiliated with the Fraser Institute in any way.
5 The Fraser Institute scores released in 2003 were based on school-average exam results
in reading, writing and numeracy in Grades 4 and 7, and the average gap between male
45
and female scores on the Grade 7 reading and numeracy exams. The scores released in
2004 were constructed using different weights and included the percentage of students
that did not “meet expectations” according to provincial standards (see Cowley and
Easton (2008, p. 96) for details).
6 A ProQuest search of Vancouver’s two most widely-read daily newspapers (the
Vancouver Sun and the Province) returned twelve articles (including editorial content)
published about the Fraser Institute’s first elementary school report cards in June, 2003.
7 The notation is adapted from Moretti (2010), where a similar model is used to study
peer effects in movie consumption.
8 For recent applications of Bayesian learning, see Moretti (2010), Ichino and Moretti
(2009), Erdem and Keane (1996), Altonji and Pierret (2001), Lange (2007), Chernew et
al. (2008), and Woodcock (2010).
9 According to our theoretical model, FSA scores will continue to affect school choice
decisions in subsequent school years, but with a smaller weight. Estimating the effect of
information on separations in years after 1999/2000 in the difference-in-differences
framework therefore would require us to include higher order lags of test scores in our
specification. This approach is not feasible because numeracy and reading exams were
not administered regularly during the 1990s.
10 Stated differently, our reported standard errors account for clustering at the school-by-
year level.
11 Specifically, tβ varies across three information “regimes” that reflect the nature of
information available to parents. During the first regime (1999/2000), parents observed
no formal measures of school-level achievement. Parents could observe school-average
46
FSA exam results during the second regime (2000/2001 and 2001/2002), and they could
observe both school-average FSA exam results and the Fraser Institute scores and
rankings during the third regime (2002/2003 and 2003/2004).
12 The region is geographically isolated from other populated areas by the U.S. border to
the south, the Strait of Georgia to the west, and rugged mountains to the north and east.
13 Our control function approach relies on current cohort FSA scores to control for
unobserved time-varying factors that have persistent effects on FSA scores and
separations. This identification strategy is most credible for those students in the current
FSA cohort (grade 4). Focusing on grade 4 also allows us to control for students’ own
FSA scores.
14 To test the hypothesis that parents’ response to new information might be strongest
upon initial school entry, we have also used a difference-in-differences specification to
estimate how kindergarten enrollment changed in response to the release of FSA test
scores. We do not report these estimates for two reasons. First, they were too imprecise
for us to be able to draw any reliable conclusions. Second, impacts on enrollment levels
(unlike separations) might be muted by capacity constraints, and a full analysis under
such constraints is beyond the scope of this paper.
15 We use these geographic coordinates to calculate measures of distance between the
student’s home and various schools. Details of how we construct these measures are
provided in the Data Appendix available online.
16 Our estimation sample includes only students who attended schools for which a full set
of Fraser Institute scores was released in both 2003 and 2004. See the online Data
Appendix for details.

47
17 See, for example, “Elementary school rankings one useful tool for B.C.,” in The
Province newspaper, June 8, 2003: pg. A.20. Also “Elementary schools get their grades,
by Janet Steffenhagen in The Vancouver Sun newspaper, June 9, 2003: pg. B.1.
22 Students with missing data are excluded. In particular, note that our sample includes
only students who made regular progress through grades K-5 in a Lower Mainland
school. This excludes students who separate and move to a school outside of the
province. See the online Data Appendix for information about the nature and frequency
of missing data.
18 Complete coefficient estimates are given in Online Appendix Table OA3. All else
equal, the probability of separation is higher among disabled students, and is strikingly
higher among Aboriginal students. It is lower among high-achieving students and
students in English as a Second Language programs. Distance to school has a significant
positive effect on separations, but the magnitude is small. Unsurprisingly, prior mobility
is a strong predictor of current separation. Students who live in neighborhoods where a
greater proportion of household heads have a university degree are substantially more
likely to leave their school.
19 Home language may also proxy for preferences or cultural norms.
20 Complete coefficient estimates are given in Appendix Table OA4.
21 Estimates for specifications that include the full set of information measures released
in each year (for those years where multiple measures were released, e.g., 2002/2003
when the Ministry published school-average FSA scores via its website and the Fraser
Institute released their first set of scores and rankings) are available on request. Because
contemporaneous information measures are highly correlated (see Online Appendix

48
Table OA2), estimates from specifications that include multiple information measures for
each year are imprecise and difficult to interpret. Hence we prefer the reported estimates.
22 In other specifications reported below, the coefficient on current-year FSA scores
differs significantly from zero.