Hormonal Activity May Predict Aggressive Behavior in Neuroblastoma
Upload
independentCategory
view
1download
0
1
HORMONAL RESPONSES TO FASTING AND RE-FEEDING IN CHRONIC RENAL FAILURE PATIENTS Sonali Deshmukh1, Bradley Phillips2, Thomas O’Dorisio1, Michael J Flanigan1 and Victoria S Lim1, Department of Medicine, College of Medicine1 and College of Pharmacy2, University of Iowa, Iowa City, Iowa Running head: Fasting and Refeeding in Chronic Renal Failure Patients Address for reprints and other correspondence: VS Lim Division of Nephrology, Department of Medicine T310, GH University of Iowa Hospitals 200 Hawkins Drive Iowa City, Iowa 52242 (E-mail: [email protected]).
Articles in PresS. Am J Physiol Endocrinol Metab (August 10, 2004). 10.1152/ajpendo.00163.2004
Copyright © 2004 by the American Physiological Society.

2
ABSTRACT
To study anorexia in chronic renal failure patients (CRF), we measured appetite-related hormones in 7
CRF patients and 4 controls. Plasma concentrations and fractional changes from baseline (values from
Day 1, 08 hour) are listed as control versus CRF (means±SEM). Leptin, ng/ml, though higher in CRF, 5.6
± 1.7 and 34 ± 17, was suppressed after fasting; decrements were -51 ± 9 % and -55 ± 8 %. Nocturnal
surge present during feeding was abolished upon fasting in both groups. Neuropeptide Y (NPY, pg/ml)
was elevated in CRF, 72 ± 12 versus 304 ± 28 (p=0.0002). NPY rhythm, reciprocal to that of leptin, was
muted in CRF. Basal cortisol, ug/dl, was similar in both groups, 17 ± 3 and 17 ± 2. In the controls,
cortisol peaked in the morning and declined in the evening. CRF showed blunted cortisol suppression.
Decrements were -61 ± 3% and -20 ± 9% at 18 hour, Day 1 (p = 0.008), -61 ± 8% and -26 ± 8% at 20
hour, Day 2 (p = 0.02). Basal ACTH, pg/ml, 25 ± 5 and 54 ± 16, as well as diurnal pattern, were not
statistically different between the groups. Baseline insulin, uU/ml, was 6 ± 1 and 20 ± 9. During fasting,
insulin was suppressed, respectively, to -64 ± 10% and -51 ± 9%. Upon refeeding, increments were 277 ±
96% and 397 ± 75%. Thus, in our CRF patients, anorexia was not due to excess leptin or deficient NPY.
Impaired cortisol suppression should favor eating. Insulin suppression during fasting and secretion after
feeding should enhance both eating and anabolism. The constant high NPY suggests increased tonic
hyper secretion.
Key words: hormones, appetite and uremia

3
INTRODUCTION
Malnutrition is prevalent in chronic renal failure [CRF] patients and anorexia is likely an important
contributing factor (3). It has been reported that food consumption declines as renal function deteriorates
(14). When uremia becomes severe, anorexia is believed to be prevalent, and is characterized by food
aversion, early satiety and, sometimes, nausea and vomiting. Despite the prevalence of these symptoms,
their pathogenesis has never been explained. We hypothesized that uremia-related anorexia may result
from hypothalamic dysfunction. Renal failure patients are known to have a number of hormonal
abnormalities due to hypothalamic disturbances; examples include diminished pulsatile gonadotropin and
growth hormone secretion, lack of positive feedback effect of estrogen on LH secretion, excessive
prolactin production and delayed puberty (18). Because eating is, by and large, a central nervous system-
regulated event (11), we studied some of the appetite-related hormones in response to fasting and re-
feeding in chronic renal failure patients. The results were compared to those obtained from normal
subjects. We wondered if CRF patients may have too much leptin or perhaps their leptin is not suppressed
with food deprivation. We considered that these patients might be deficient in neuropeptide Y, [NPY], a
potent orexigenic peptide that mediates the effect of leptin in the hypothalamus (11). Knowing that
cortisol is essential for eating in the mammals and that corticotropin-releasing hormone is a potent
anorexigenic peptide (30, 12), we decided to profile cortisol and ACTH, the latter as a surrogate to
corticotrophin-releasing hormone. We also studied insulin because serum insulin level tends to be higher
in the CRF patients, and insulin, in the central nervous system, suppresses eating (33).
METHODS
Subjects
Seven renal failure patients and four normal subjects were recruited. Table 1 lists the demography,
nutritional status and baseline hormonal profile of the two study groups. Table 2 includes the clinical
parameters and modality of treatment as well as letpin data individually in the seven CRF patients. The
4
normal controls consist of one woman and three men, ages 32 to 63 years. The CRF group consists of two
pre-dialysis, four hemodialysis, and one peritoneal dialysis patients. There were one woman and six men
aged 31 to 56. The two pre-dialysis patients were initiated into maintenance dialysis because of high
serum creatinine; they did not specifically complain of anorexia. Diagnoses of the CRF patients included
two with hypertensive nephrosclerosis, one Alport’s disease, two with focal segmental glomerulosclerosis
and one each with interstitial nephritis and immunotactoid glomerulopathy. No patients had diabetes or
other concomitant systemic disease. All studies were conducted when the subjects were clinically stable
and without intercurrent illness. Hemodialysis was performed three times weekly using CT190G
dialyzers; KT/V ranged from 1.3 to 1.5. The single PD patient used the Fresenius PD plus system; he did
five exchanges nocturnally plus one exchange during the daytime. His weekly KT/V was 2.75 and
creatinine clearance, 53 L/week.
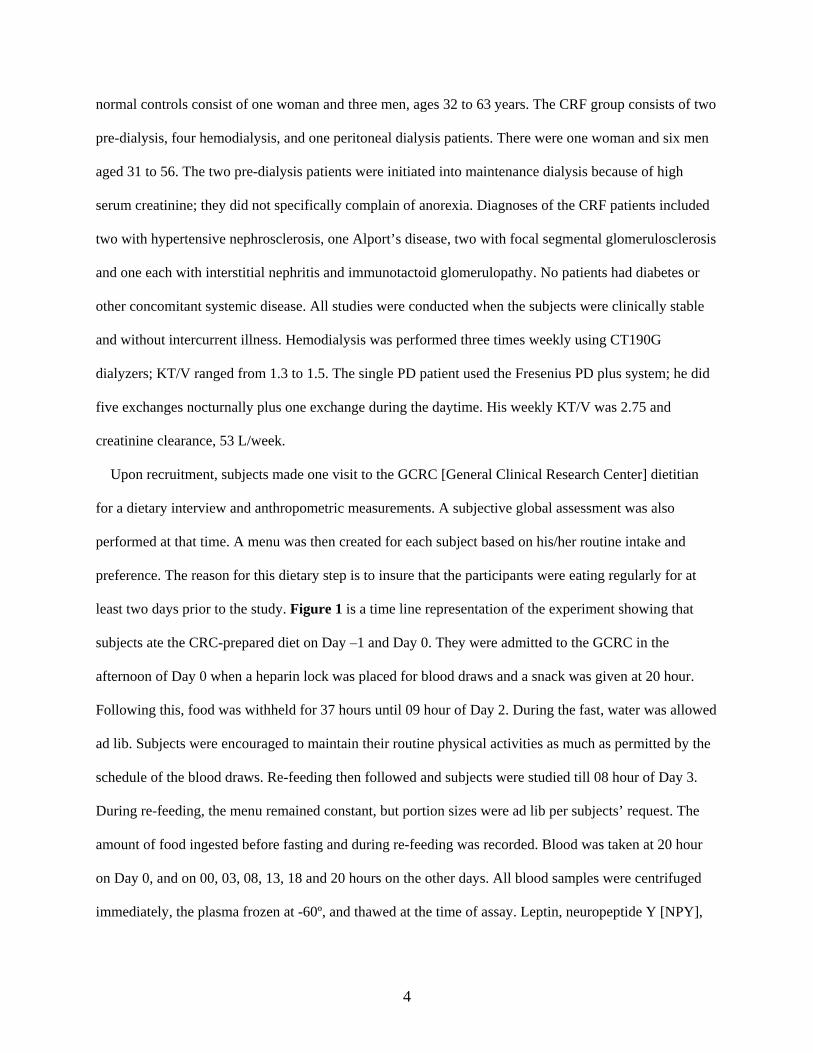
Upon recruitment, subjects made one visit to the GCRC [General Clinical Research Center] dietitian
for a dietary interview and anthropometric measurements. A subjective global assessment was also
performed at that time. A menu was then created for each subject based on his/her routine intake and
preference. The reason for this dietary step is to insure that the participants were eating regularly for at
least two days prior to the study. Figure 1 is a time line representation of the experiment showing that
subjects ate the CRC-prepared diet on Day –1 and Day 0. They were admitted to the GCRC in the
afternoon of Day 0 when a heparin lock was placed for blood draws and a snack was given at 20 hour.
Following this, food was withheld for 37 hours until 09 hour of Day 2. During the fast, water was allowed
ad lib. Subjects were encouraged to maintain their routine physical activities as much as permitted by the
schedule of the blood draws. Re-feeding then followed and subjects were studied till 08 hour of Day 3.
During re-feeding, the menu remained constant, but portion sizes were ad lib per subjects’ request. The
amount of food ingested before fasting and during re-feeding was recorded. Blood was taken at 20 hour
on Day 0, and on 00, 03, 08, 13, 18 and 20 hours on the other days. All blood samples were centrifuged
immediately, the plasma frozen at -60º, and thawed at the time of assay. Leptin, neuropeptide Y [NPY],

5
cortisol and ACTH were measured in all samples, while insulin and glucose only in samples as indicated
in Figure 4. Visual analogue scales assessing appetite and hunger were obtained at designated times
during waking hours as depicted in Figure 5.
Laboratory Procedures
Leptin was measured by radioimmunoassay using the Linco kits [14 Research Park Drive, St Charles,
MO 63304]. The reagent has 100% specificity for human leptin. NPY [Neuropeptide Y] was measured
using RIA kits purchased from Peninsula Laboratories, Inc [San Carlos, CA 94070]. The antibody has a
100% cross reactivity to human NPY. It has 0% and 3% cross-reactivity against human PYY and human
pancreatic polypeptide, respectively. Cortisol and insulin were measured by electro-chemiluminescence
immunoassay using the Elecsys system [Roche Diagnostics Corporation, Indianapolis, IN]. ACTH was
measured by a two-site chemiluminescence immunoassay using both a mouse monoclonal antibody and a
goat polyclonal antibody. The former was labeled with acridinium ester and the latter, biotin.
Streptavidin-coated magnetic particles were added resulting in the formation solid phase particles. The
solid phase magnetic particles were then transported into the system luminometer and quantitated
[Nichols Advantage].
Appetite Assessment
We assessed appetite, hunger and satiety with visual analogue scale [VAS] (27). We utilized five
questions: How hungry do you feel? How full does your stomach feel? Do you feel nauseous? How
strong is your desire to eat? How much food you think you can eat? Under each question is a line of 10
cm length [scale 0-10] with words anchored at each end expressing the most negative sensation on the
left, and the most positive one on the right. For example, if the question is “How hungry do you feel?” not
hungry at all would be a score of 0, and extremely hungry, 10.
Nutritional Assessment
Anthropometry and subjective global assessment were used to assess the nutritional status of each
participant. Anthropometry included height, weight, elbow breadth, midarm circumference, triceps skin

6
fold, supra-iliac skin fold, abdominal skin fold [vertical fold 2 cm lateral from the umbilicus], waist and
hip circumference. Trained nutritionist in the GCRC took these measurements. Percent body fat was
estimated from these measurements. Subjective global assessment is a clinical technique used to assess
nutritional status based on features of the history and physical examination (8) The former includes
weight change, dietary change and gastrointestinal symptoms, and the latter, evidence of subcutaneous fat
loss, muscle wasting and edema or ascites. The scores are: A, well nourished; B, moderately
malnourished; C, severely malnourished.
Institutional Approval
The Committee on Human Research and the Coordinating Council for the General Clinical Research
Center of the University of Iowa College of Medicine approved the entire protocol, and every study
subject signed the consent form.
RESULTS
Table 1 summarizes and compares the demography, nutritional status and baseline hormonal profile of
the two study groups. All values are listed in the sequence of normal subjects and CRF patients, and
statistically significant differences are listed in parenthesis. Age [years] was 47 ± 7 and 42 ± 4, body mass
index [BMI], 23.8 ± 1.0 and 25.7 ± 2.0, and % body fat 20.8 ± 1.6 and 20.9 ± 3.1. Plasma leptin [ng/ml]
was 5.6 ± 1.7 and 34.1 ± 17.4, NPY [pg/ml], 72 ± 12 and 304 ± 28 [p=0.0002], cortisol [ug/dl], 16.6 ± 3.1
and 16.5 ± 1.8, and ACTH [pg/ml], 24.9 ± 5.5 and 54.2 ± 16.2. Plasma insulin [µU/ml] was 6.4 ± 0.9 and
20.0 ± 8.5, and glucose [mg/dl], 94 ± 4 and 99 ± 4.
Not listed in Table 1 are energy [Kcal/kg/day] and protein [g/kg/day] intake of the study subjects.
Energy intake was 31.9 ± 1.8 and 31.2 ± 2.8 before fasting and 35.7 ± 2.5 and 39.7 ± 2.8 after the fast.
Protein intake was 1.24 ± 0.08 and 0.89 ± 0.06 [p=0.006] before the fast, higher in the normal subjects,
and 1.48 ± 0.16 and 1.19 ± 0.11 after the fast. While both study groups increased food intake post fasting,
only in the CRF patients were the differences between pre- and post fast statistically significant; p values
were 0.05 and 0.03, respectively, for calorie and protein intake.

7
While mean leptin, ACTH and insulin values were higher in CRF patients; the differences did not
reach statistical significance. This is because high values were present only in a few CRF patients. As
shown in Tables 1 and 2, higher leptin and insulin values were found in three patients who have higher
% body fat. The highest leptin, 124, was found in a woman with 32 % body fat. In the case of ACTH, all
three high values were found in lean patients. By contrast, NPY was homogenously and markedly
elevated in all CRF patients. Serum creatinine [mg/dl] was 12.4 ± 1.1 and albumin [g/dl], 4.1 ± 0.06 in the
CRF patients.
Leptin/NPY Axis:
Plasma leptin [ng/ml] during the experimental periods are listed in the left half of Table 3. In normal
subjects, on Day 1, 03 hour, leptin peaked to 7.7 ± 2.2, on the same day at 08 hour [baseline], the value
was 5.6 ± 1.7. On Day 3, 03 hour, leptin reached a height of 10.2 ± 3.5. Leptin peaked at nocturnal times
on both days. During the 37 hour fast, nocturnal surge was totally obliterated, and plasma leptin dipped to
a nadir of 2.3 ± 0.4 at 03 hour, Day 2, and remained low at 2.5 ± 0.6 at 09 hour, Day 2 when the fast
ended. In the CRF patients, plasma leptin was higher than that of the controls at all times during the
experiment, but the difference never achieved statistical significance. Baseline leptin was 34.1 ± 17.4.
Nocturnal rise was less prominent compared to the controls. On Day 1, plasma leptin increased slightly to
36.4 ± 17.7 at 00 hour, and on Day 3, the highest nocturnal value was only 30.3 ± 12.0, at 03 hour. During
the 37-hour fast, plasma leptin did fall to 12.7 ± 6.7 at 09 hour on Day 2 and remained low, 10.5 ± 4.9, at
13 hour that same day.
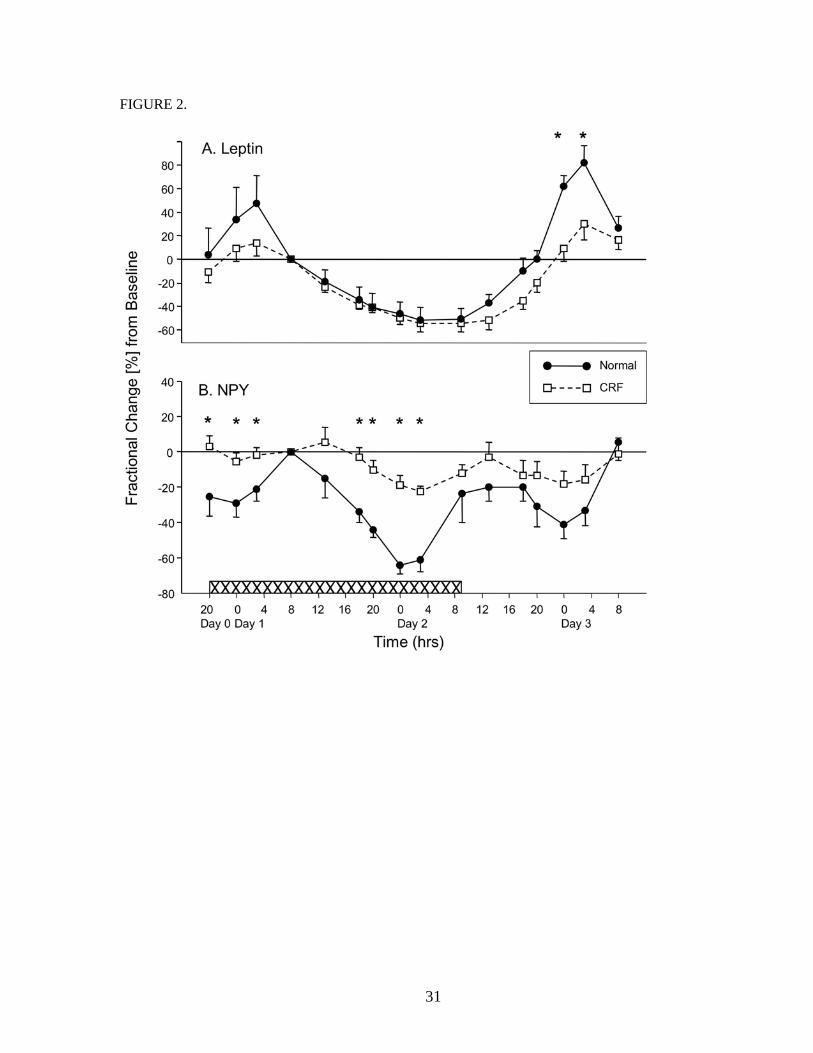
Figure 2 A illustrates the fractional changes of plasma leptin at different experimental times as
compared to the baseline. Baseline values for all the peptides/hormones in this study were the values
obtained on Day 1, 08 hour. In the normal subjects, plasma leptin reached 47 ± 24% above baseline at 03
hour, Day 1. During the re-feeding period, nocturnal surge reached levels of 61 ± 10% and 82 ± 14%
above baseline, respectively, at 00 and 03 hours, Day 3. During fasting, nocturnal surge was totally
abolished, and leptin dropped to a nadir of -53 ± 11% below baseline at 03 hour, Day 2, and was -51 ± 9

8
% of baseline at the end of the fast at 09 hour, Day 2. In the CRF patients, fasting also effectively
suppressed leptin; nadir at the end of the fast was -55 ± 6 % at 09 hour, Day 2. The nocturnal surge during
regular feeding was, however, blunted. On Day 1, the highest leptin increment was 13 ± 11%, noted at 03
hour. On Day 3, during re-feeding, the increments were 9 ± 11% at 00 hour [p=0.01] and 30 ± 14% [p =
0.04] at 03 hour. As we scrutinized the data, it became evident that this blunted nocturnal surge found in
CRF patients was present only in the three CRF patients who had high body mass indices and whose
basal leptins were high. Table 2 lists the CRF patients in accordance to their basal serum leptin levels.
Patients # 1, 3 and 7 had high, whereas patients # 2, 4, 5 and 6, normal basal leptin. During feeding,
nocturnal leptin surge was brisk and unequivocal in those patients with normal leptin, but was blunted in
those with high basal leptin. Fasting, on the other hand, suppressed leptin universally, whether basal
levels were high or normal.
Listed in the right half of Table 3 is plasma NPY [pg/ml] at different times during the experiment. The
values are about five-fold higher in the CRF patients at all times. In the normal subjects, higher values
were found in the morning, between 08 and 09 hours, the values were 72 ± 12 on Day 1, 56 ± 15 on Day
2 and 73 ± 7 on Day 3. The nadir for these three days occurred at 00 hour, and the values were 51 ± 8, 28
± 8 and 44 ± 11, respectively. The nocturnal decline in NPY was exaggerated during fasting, 28 on Day 2
versus 51 and 44 on Days 1 and 3. This NPY circadian rhythm was much muted in the CRF patients.
Corresponding morning values for Days 1, 2 and 3 were, respectively, 304 ± 28, 262 ±23 and 289 ± 23,
and values at 00 hours for the same three days were 286 ± 29, 242 ± 24 and 245 ± 31.
Figure 2 B shows the fractional changes of plasma NPY at different experimental times as compared
to baseline. In the normal subjects, during feeding, NPY diurnal rhythm was opposite to that of leptin,
lowest in the night and reaching peak values in the morning, 08 to 09 hours. The circadian rhythm of the
CRF patients was qualitatively similar, but muted. Fractional decrements of NPY in the controls and CRF
patients were, respectively, -29 ± 7 % and -5 ± 5% [p = 0.02], at 00 hour, Day 1, -41 ± 8 % and -18 ± 8%.
at 00 hour, Day3. During fasting , NPY declined in both gruops, but more sharply in the controls,

9
decrements were -64 ± 5% and -19 ± 6% [p = 0.0005] at 00 hour, and -61 ± 7% and –22 ± 3% [p =
0.0005] at 03 hour, Day 2.
Cortisol/ACTH Axis:
Table 4 details the plasma cortisol [ug/dl] and ACTH [pg/ml] response of the two study groups to
experimental fasting and refeeding. At baseline, on Day 1, 08 hour, plasma cortisols were similar in the
two groups, 17 ± 3 and 17 ± 2. Cortisol levels were higher in the CRF patients during the following
days/times: Day 0, 20 hour, 4.3 ± 0.4 versus 10.8 ± 1.2 [p=0.004]. Day 1, 18 hour, 6.4 ± 1.1 as compared
to 12.3 ± 0.7 [p=0.001] and 20 hour, 5.0 ± 0.6 versus 10.0 ± 1.1 [p=0.01]. Day 2, 18 hour, 6.6 ± 1.3 and
11.4 ± 0.9 [p=0.01] and 20 hour, 6.0 ± 0.9 and 11.8 ± 1.5 [p=0.02]. These data indicate that CRF patients
had a blunted circadian suppression of serum cortisol.
ACTH values were higher in CRF patients at all times, but only that of Day 0, 20 hour reached
statistically significant difference; 9.8 ± 1.1 and 27.8 + 5.5 [p = 0.04]. Particulary, higher values were
present in patients # 2, 4 and 6 who had relatively low body fat content [Table 1]. The diurnal ACTH
concentration pattern is similar in both study groups, levels tend to be higher in the morning hours,
coincided with or shortly before the cortisol peaks. In the normal subjects, peak values were 24.9 ± 5.5 on
Day 1, 08 hour, 38.2 ± 8.8, Day 2, 03 hour, and 17.3 ± 5.7, Day3, 03 hour. Peak values in the CRF
patients were 54.2 ± 16.2, 50.7 ± 18.4 and 42.3 ± 14.1, respectively, on Days 1, 2 and 3; all at 08-09
hours. The peak tended to occur earlier, at 03 hours, in control subjects.
Figures 3 A and B illustrate the circadian rhythm of cortisol and ACTH. In the normal subjects,
plasma cortisol was highest in the morning, 08-09 hours, and lowest in the evening hours. Listed in the
sequence of control versus CRF patients, fractional decrements from baseline were -70 ± 7 % and -29 ±
12 % [p=0.04] on 20 hour, Day 0, -61 ± 3 % and -20 ± 8 % [p=0.008], 18 hour, Day 1, -59 ± 8 % and -26
± 9 % [p=0.03], 18 hour, and -61 ± 8 % and -26 ± 8 % [p=0.02], 20 hour, Day 2. Evening cortisol
suppression was blunted in CRF patients, and fasting did not alter the circadian cycle.

10
As for ACTH, the peaks and troughs coincided or preceded those of plasma cortisol. Diurnal rhythm
was present and not different between controls and CRF patients with one exception, and that was on Day
2, 03 hour during fasting. At that time, plasma ACTH rose by 51 ± 14% above baseline in the normal
subjects, and fell by -34 ± 14 % in the CRF patients [p = 0.002]. This apparent dramatic difference at that
particular time was due to a coincidental combination of earlier onset of morning peak in the normal
subjects, 03 hour as compared to 0900 in the CRF patients, combined with a higher baseline value in CRF
subjects [Table 4]. In the three CRF patients with very high baseline ACTH, their fractional diurnal
changes from baseline were not different from the four patients with normal basal ACTH.
Insulin/glucose Axis:
Table 5 lists the data on insulin and glucose during the experiment. Plasma insulin was higher in the
CRF patients at all times, but none reached statistical significance. Insulin levels were highest in the two
male patients with high leptin, but the female patient with very high leptin and increased body fat content
had normal plasma insulin [Table 1]. Fasting reduced plasma insulin from baseline of 6.4 ± 0.9 to 1.2 ±
0.3 in normal subjects, and 20.0 ± 8.5 to 6.8 ± 3.2 in CRF patients. Post feeding, plasma insulin rose to
23.8 ± 5.9 in the controls and 85.5 ± 44.7 in the CRF patients. Plasma glucose decreased from 94 ± 4 to
77 ± 7 in the controls and 99 ± 4 to 87 ± 5 in the CRF patients during fasting and rose to 119 ± 5 in
controls and 141 ± 9 in CRF patients during refeeding.
Figure 4 illustrates insulin and glucose responses to fasting and feeding in the study groups. In normal
controls, fractional decrements of plasma insulin during fasting were -81 ± 6% and -64 ± 0%,
respectively, at 20 hour of Day 1 and 09 hour of Day 2, corresponding values in the CRF patients were -
52 ± 13% and -51 ± 9%. In the refeeding period, fractional increments of plasma insulin reached peaks of
277 ± 96% and 397 ± 75%, respectively, in the normal and CRF subjects at 20 hour, Day 2. None of these
oscillations were different between the two study groups. As for plasma glucose, the fractional
decrements during fasting were -19 ± 4% in the normal subjects, and -12 ± 4% in the CRF patients at 09
hr on Day 2. Upon refeeding, fractional glucose increments were 26 ± 6% and 44 ± 12%, respectively, in

11
the controls and the CRF patients, on 20 hr, Day 2. The responses were also similar in magnitude in the
two study groups.
To assess whether high intra-individual variation and overlapping values might mask actual
differences in the hormones examined in the two groups, we calculated the intra-individual coefficient of
variations [COV, %] of all the studied hormones. Due to the circadian variation and the physiologic
changes to feeding, we included only appropriate samples for the calculation of the COV. For leptin and
NPY, the values of Day 0, 20 hour [D0-20], Day 1, 08 hour [D1-8], Day 2, 20 hour [D2-20] and Day 3,
08 hour [D3-8] were included, and for cortisol, ACTH and insulin, the values of D1-8 and D3-8 were
used. All values, %, listed below are in the sequence of control versus CRF patients– Leptin: 19.6 + 6.0%
and 21.1 + 3.9%, NPY: 26.5 +7.4% and 16.9 + 3.3%, cortisol: 15.1 + 4.6% and 16.7 + 3.3%, ACTH:
41.1 + 12.2% and 24.8 + 8.0%, and Insulin: 6.9 + 1.5% and 13.4 + 3.8%. The intra-individual COV is not
high. Furthermore, none of the differences between the two groups reached statistical significance.
Nutritional status and appetite assessment-
The BMI and % body fat were comparable in the two study groups [Table 1]. Subjective global
assessment identified all subjects to be well nourished; all participants had a score of A. There were no
adverse gastro-intestinal symptoms and no acute change in body weight. Physical examination did not
detect any acute loss of fat or muscle wasting. All participants were fully functional in their usual
activities. As for appetite assessment, the visual analogue scale showed that nausea was a rare occurrence.
The sensation of feeling hungry and the desire to eat were comparable in both study groups. The sensation
of fullness was appropriately reciprocal to that of hunger. Figure 5 illustrates the hunger scores of the two
study groups during the entire experiment. The hunger score peaked at Day 2, 09 hour [the end of fasting]
in both groups; the scores were 9.8 ± 0.3 and 8.6 ± 0.9, respectively, in the controls and the CRF patients.
The hunger scores were similarly lowest for both groups at 20 hour, Day 0; the scores were 1.0 ± 0.6 and
3.4 ± 0.6, respectively, in the normal subjects and the CRF patients. None of these values were different
between the two groups. The desire to eat scores parallels those of the hunger scores in both groups.

12
DISCUSSIONS
All the hormones studied in this experiment demonstrate either striking changes to fasting and feeding
or some patterns of circadian change. Baseline serum leptin was not statistically different between the two
groups. In normal subjects, there was an unequivocal nocturnal leptin surge and fasting profoundly
suppressed leptin secretion. Sinha et al first reported nocturnal leptin rise in humans by measuring leptin
in one 24-hour cycle (36). Pratley and colleagues did not detect any nocturnal rise when they measured
leptin during a 24-hour fast (26). During a 22-hour fast, Klein et al found a reduction in abdominal wall
subcutaneous leptin production and this was accompanied by a parallel decline in circulating leptin (16).
In the current study, we measured leptin during a 56-hour experiment consisting of pre-fast, fast and
refeeding periods. We not only confirmed the nocturnal surge, but also found that fasting totally abolished
this nocturnal rise. These findings suggest that the observed rise in serum leptin at night is a consequence
of feeding during the day and not simply being linked to a diurnal rhythm. In rats, Saladin et al found ob
gene expression to be related to feeding as well, and gene expression increased during the night when rats
ate. When food was withheld, the nocturnal increase in ob mRNA was abolished (32). In humans, serum
leptin increased at around 00 hour, twenty hours following breakfast and four hours after the evening
snack. In the rats, white adipose tissue ob gene increment also occurs at about 00 hour, 4 hours after
feeding initiation. Sinha et al stated that the discrepancy between man and rat maybe due to species
difference. We hypothesized that the discrepancy in time of onset of leptin peak could be explained by the
lag time between increase in ob gene expression in the white adipose tissue and the rise in circulating
level. The former was measured in the rat and the latter, man.
Qualitatively, the leptin response to fasting and feeding was similar in the two study groups.
Quantitatively, Figure 2 indicates that the nocturnal surge during feeding was diminished in CRF patient,
but as shown in Table 2, this blunting was present only in the three subjects who had excessive body fat
content and high basal leptin. The other 4 patients with normal basal leptin behaved exactly like the
control subjects showing an unequivocal nocturnal surge. We suspect that it is the increase in body fat,

13
and not uremia, that led to the altered post-feeding leptin metabolism in these three obese CRF patients.
In Sinha’s study, nocturnal leptin surge was of milder magnitude in obese subjects (36). Klein and
colleagues similarly found that leptin production from abdominal fat was less marked in obese compared
to lean women (16).
Several investigators reported that circulating leptin, factored for body mass index, was increased in
CRF patients (34, 13). It was suggested that the increased serum leptin is related to ongoing inflammation
and maybe contributing to anorexia (13). Our data do not show disproportionate elevation of leptin
beyond that accounted for by body fat content. And because leptin was so effectively suppressed during
food deprivation, it is unlikely to be the cause of uremic anorexia.
Circulating NPY levels were homogenously and markedly elevated in the CRF patients. This high level
of NPY is unlikely to be due to assay problem as the antibody used was 100 % reactive to human NPY,
and had 0 % and 3 % cross reactivity to, respectively, human PYY and pancreatic polypeptide. The
possibility of impaired renal excretion or degradation leading to high plasma concentration was
considered, but rejected for two reasons: Firstly, despite the fact that kidney contributes to peptide
hormone clearance, 12-40%, mostly by tubular uptake and degradation (21, 15, 34), not all peptides are
increased in renal failure. This is because high plasma concentration should evoke a negative feedback
decline in secretion. Secondly, there is a striking lack of parallel increments in peptide hormones in the
ESRD population. When an increased level is noted, there is usually a component of increased
production; decreased renal excretion or degradation plays a minor role. Examples to support this
contention include the following: Elevation of leptin and insulin is found mostly in patients with high
body fat, high parathyroid hormone in those with renal osteodystrophy, increased gonadotropins in post-
menopausal women, and high TSH in hypothyroid subjects. More pertinently, kinetic study of prolactin,
modestly elevated in CRF patients, illustrated unequivocally increased production (35).
In control subjects, the circadian rhythm of NPY was reciprocal to that of leptin. It peaked between
08 to 09 hour when daily eating began and reached nadir values about 00 to 04 hours when eating had
14
ceased. This pattern is consistent with the current view that high leptin suppresses NPY. In the CRF
patients, circadian NPY variation was remarkably muted; the diurnal curve was almost flat and circulating
NPY levels were constantly elevated. [Table 3 and Figure 2B]. Of interest is the finding that fasting not
only failed to increase NPY peaks, but actually accentuated the 00-04 hour nadir [Figure 2A]. As NPY is
a potent orexigenic peptide, teleologically, one would expect it to rise during fasting (28). In rodents,
fasting does increase NPY gene expression in the central nervous system (5). But NPY is not the only
peptide responsible for increased eating during fast. Other pathways stimulate eating equally well. The
fact that parallel and redundant pathways exist in stimulating food acquisition is well illustrated in NPY
knockout mice that maintain normal eating habit and body weight (9).
NPY is not just an orexigenic peptide, but has far greater physiologic role. It is a vasoactive peptide
that is widely distributed in the central and the peripheral nervous systems. In the central nervous system,
it inhibits sympathetic pre-ganglionic neurons leading to a reduction in thermogenesis of brown adipose
tissue (4, 17). Centrally, NPY stimulates corticosterone secretion in rats, an effect mediated through the
hypothalamus because corticotropin-releasing factor and ACTH secretion are both increased (30). In the
periphery, NPY is co-released with norepinephrine during sympathetic nerve stimulation. It enhances
vasoconstriction and modulates cardiac function (23, 25). Zoccali et al recently reported elevated
circulating NPY in CRF patients, showing a direct relationship between plasma NPY and norepinephrine
and epinephrine (38). More importantly, elevated NPY predicts higher mortality from cardiovascular
events. Chronic renal failure is accompanied by a heightened sympathetic state, and the high serum NPY
may reflect this (7).
Glucocorticoid and insulin have been known for a long time to play important roles in eating and
energy balance. The two hormones have reciprocal effects. In the central nervous system, glucocorticoid
stimulates while insulin inhibits eating, acting through stimulation and inhibition of NPY, respectively
(37). By contrast, in the periphery, glucocorticoid is catabolic, and insulin, anabolic with regard to energy
storage. Adrenalectomy cures obesity of all origins, diet-induced, hypothalamic disorder or genetic
15
aberration (29). This is due to a combination of cortisol deficiency and high corticotripin-releasing
hormone secretion. While cortisol stimulates eating, corticotripin-releasing hormone is an anorexigenic
peptide (12). In our renal failure patients, cortisol physiology was altered. There was a loss of evening
hour cortisol suppression and ACTH tended to be higher; the latter suggests that the apparent
hypercortisol state was hypothalamic in origin. The reason for the higher ACTH is not understood, it
could be related to the high NPY state. In mammals, cortisol and NPY exhibit a positive feedback
relationship (1). As for eating, the hypercortisol state tends to override the effect of high corticotropin-
releasing hormone. With regard to insulin, renal failure patients had higher plasma insulin levels at all
times, but their responses to fasting and feeding were identical to those of normal subjects. Fasting
resulted in insulin suppression, which should stimulate eating. More importantly, feeding led to a
remarkable increase in insulin secretion; the latter, making anabolism possible (19).
A note should be made regarding the lower protein intake in the CRF patients, 0.89 g/kg/day. This
lower intake was due, in part, to impose phosphorus restriction, and is unlikely to cause neuroendocrine
disturbance. In the non-Western World, most population consume less than this amount of protein. It is
important to emphasize that we have shown repeatedly, with whole-body in-vivo amino acid kinetics, that
this amount of protein intake, in the absence of any catabolic event, is perfectly adequate to maintain
nitrogen and protein balance (20).
This work has limitation, most importantly are the small number of study subjects combined with the
heterogenous nature of the CRF group consisting of pre-dialysis, hemodialysis and peritoneal dialysis
patients. Fortunately, the observed responses to the experimental maneuver were qualitatively similar in
most subjects. Quantitatively, any difference noted appeared to be related to body fat mass, and not
uremia or the modality of treatment. Despite the limitations, this study demonstrated that the maneuver of
fasting and refeeding provides a tool that can be used effectively for further study.
In summary, new information derived from this study regarding eating and energy balance in CRF
patients includes: [1] Anorexia, if present, was unlikely to be due to excess leptin or insufficient NPY. [2]
16
Leptin response to fasting and eating were similar in the two study groups; fasting suppressed leptin and
feeding resulted in a nocturnal surge. [3] There was a tonic hypersecretion of NPY in CRF patients,
possibly related to heightened sympathetic state. [4] A hypercorticoid state was present in CRF patients as
evident by impaired cortisol suppression in the evening hours. The high cortisol level should, however,
favor eating. [5] Fasting effectively suppressed and eating briskly stimulated insulin secretion to similar
magnitude in controls and CRF patients. These responses favor eating when energy balance is low and
anabolism when energy intake is abundant. [6] CRF patients responded appropriately to fasting with
hunger and increased desire to eat. Despite the prevailing view that uremic patients are anorexic, we
found that our CRF subjects responded to fasting with appropriate sense of hunger and desire to eat, and,
in fact, ate well after fasting. Another new observation, found in both study groups, was the failure of
NPY to rise during fasting despite marked leptin suppression.
The relatively normal pattern of the appetite-related hormones found in this study may be due to the
fact that we screened our study patients vigorously to exclude those with concomitant illnesses and they
are healthier than the general ESRD population. It should be emphasized that we have not evaluated the
melanocortin pathways; increased α-MSH secretion or enhanced activity of the melanocortin-4 receptor
binding inhibits eating and increases thermogenesis (10, 22). We have also have not studied the gherlin
and PYY [peptide YY] system, the former is secreted by the stomach to stimulate eating, and the latter,
secreted by the large intestine and suppresses appetite (24, 2). We also have not assessed other orexigenic
peptides including the melanin-concentrating hormone, the agouti-related peptide or the newly discovered
orexins (6, 10, 31).
ACKNOWLEDGMENT
This work was supported in part by the National Institute of Health Grants RR55 [General Clinical
Research Center, University of Iowa. We thank Dixie Ecklund and Phyllis Stumbo at the University of

17
Iowa GCRC for their superb assistance, and we appreciate the time and energy input of the subjects who
participated in this study.

18
REFERENCES
1. Akabayashi A, Levin N, Paez X, Alexander JT, Leibowitz SF: Hypothalamic Neuropeptide Y
and Its Gene Expression: Relation to Light/Dark Cycle and Circulating Corticosterone. Molecular
and Cellular Neurosciences 5:210-218,, 1994
2. Batterham RL, Cowley MA, Small CJ, Herzog H, Cohen MA, Dakin CL, Wren AM, Brynes AE,
Low MJ, Ghatei MA, Cone RD, Bloom SR: Gut hormone PYY3-36 physiologically inhibits food
intake. Nature 418:650-654, 2002
3. Bergstrom J: Why are dialysis patients malnourished? Am J Kidney Dis 26:229-241, 1995
4. Billington CJ, Briggs JE, Grace M, Levine AS: Effects of intracerebroventricular injection of
neuropeptide Y on energy metabolism. Am J Physiol 260:R321-R327, 1991
5. Brady LS, Smith MA, Gold PW, Herkenham M: Altered Expression of Hypothalamic
Neuropeptide mRNAs in Food-Restricted and Food-Deprived Rats. Neuroendocrinology 52:441-
447, 1990
6. Chambers J, Ames RS, Bergsma D, Muir A, Fitzgerald LR, Hervieu G, Dytko GM, Foley JJ,
Martin J, Liu W-S, Park J, Ellis C, Ganguly S, Konchar S, Cluderay J, Leslie R, Wilson S, Sarau
HM: Melanin-concentrating hormone is the cognate ligand for the orphan G-protein-coupled
receptor SLC-1. Nature 400:261-264, 1999
7. Converse RL Jr, Jacobsen TN, Toto RD, Jost CM, Cosentino F, Fouad-Tarazi F, Victor RG:
Sympathetic overactivity in patients with chronic renal failure. N Engl J Med 327:1912-1918,
1992
8. Detsky AS, McLaughlin JR, Baker JP, Johnston N, Whittaker S, Mendelson RA, Jeejeebhoy KN:
What is Subjective Global Assessment of Nutritional Status? J Parenteral and Enteral Nutrition
11:8-13, 1987
9. Erickson JC, Clegg KE, Palmiter RD: Sensitivity to leptin and susceptibility to seizures of mice
lacking neuropeptide Y. Nature 381:415-418, 1996

19
10. Fan W, Boston BA, Kesterson RA, Hruby VJ, Cone RD: Role of melanocortinergic neurons in
feeding and the agouti obesity syndrome. Nature 385:165-168, 1997
11. Friedman JM, Halaas JL: Leptin and the regulation of body weight in mammals. Nature 395:763-
770, 1998
12. Gardner JD, Rothwell NJ, Luheshi GN: Leptin affects food intake via CRF-receptor-mediated
pathways. Nature Neuroscience 1(2):103, 1998
13. Heimburger O, Lonnqvist F, Danielsson A, Nordenstrom J, Stenvinkel P: Serum Immunoreactive
Leptin Concentration and its Relation to the Body Fat Content in Chronic Renal Failure. J am Soc
Nephrol 8:1423-1430, 1997
14. Ikizler TA, Greene JH, Wingard RL, Parker RA, Hakim RM: Spontaneous Dietary Protein Intake
During Progression of Chronic Renal Failure. J Am Soc Nephrol 6:1386-1391, 1995
15. Katz AI, Rubenstein AH: Metabolim of Proinsulin, Insulin, and C-Peptide in the Rat. J Clin
Invest 52:1113-1121, 1973
16. Klein S, Horowitz JF, Landt M, Goodrick SJ, Mohamed-Ali V, Coppack SW: Leptin production
during early starvation in lean and obese women. Am J Physiol Endocrinol Metab 278:E280-
E284, 2000
17. Krukoff TL: NPY-containing nerve terminals and fibers in close association with peptidergic
sympathetic preganglionic neurons. Neurosci Lett 77:1-4, 1987
18. Lim VS, Flanigan MJ. Organ and Metabolic Complications – Abnormal Endocrine Function in
Chronic Renal Failure. In: Replacement of Renal Function by Dialysis (4th ed.) edited by C.
Jacobs, C.M. Kjellstrand, K.M. Koch, J.F. Winchester, Dordrecht/Boston/London: Kluwer
Academic Publishers, 1996, p. 1236-1242
19. Lim VS, Yarasheski KE, Crowley JR, Fangman J, Flanigan MJ: Insulin Is Protein-Anabolic in
Chronic Renal Failure Patients. J Am Soc Nephrol 14:2297-2304, 2003

20
20. Lim VS, Yarasheski KE, Flanigan MJ: The effect of uraemia, acidosis, and dialysis treatment on
protein metabolism: a longitudinal leucine kinetic study. Nephrol Dial Transplant 13:1723-1730,
1998
21. Maack T, Johnson V, Kau ST, Figueiredo J, Sigulem D: Renal filtration, transport, and
metabolism of low-molecular-weight proteins: A review. Kidney Int 16, 251-270, 1979
22. Marks DL, Ling N, Cone RD: Role of the Central Melanocortin System in Cachexia. Cancer
Research 61:1432-1438, 2001
23. Morris MJ, Cox HS, Lambert GW, Kaye DM, Jennings GL, Meredith IT, Esler MD: Region-
specific neuropeptide Y overflows at rest and during sympathetic activation in humans.
Hypertension 29:137-143, 1997
24. Nakazato M, Murakami N, DateY, Kojima M, Matsuo H, Kangawa K, Matsukura S: A role for
ghrelin in the central regulation of feeding. Nature 409:194-198, 2001
25. Pedrazzini T, Seydoux J, Kunstner P, Aubert J-F, Grouzmann E, Beermann F, Brunner H-R:
Cardiovascular response, feeding behavior and locomotor activity in mice lacking the NPY Y1
receptor. Nature Medicine 4(6):722-726, 1998
26. Pratley RE, Nicolson M, Bogardus C, Ravussin E: Plasma leptin responses to fasting in Pima
Indians. Am J Physiol 273:E644-E649, 1997
27. Raben A, Tagliabue A, Astrup A: The reproducibility of subjective appetite scores. British J Nutr
73:517-530, 1995
28. Sahu A, Kalra PS, Kalra SP: Food deprivation and ingestion induce reciprocal changes in
neuropeptide Y concentrations in the paraventricular nucleus. Peptides 9:83-86, 1988
29. Sainsbury A, Cusin I, Rohner-Jeanrenaud F, Jeanrenaud B: Adrenalectomy Prevents the Obesity
Syndrome Produced by Chronic Central Neuropeptide Y Infusion in Normal Rats. Diabetes
46:209-214, 1997

21
30. Sainsbury A, Rohner-Jeanrenaud F, Grouzmann E, Jeanrenaud B: Acute Intracerebroventricular
Administration of Neuropeptide Y Stimulates Corticosterone Output and Feeding but Not Insulin
Output in Normal Rats. Neuroendocrinology 63:318-326, 1996
31. Sakurai T, Amemiya A, Ishii M, Matsuzaki I, Chemelli RM, Tanaka H, William SC, Richardson
JA, Kozlowski GP, Wilson S, Arch JRS, Buckingham RE, Haynes AC, Carr SA, Annan RS,
McNulty DE, Liu W-S, Terrett JA, Elshourbagy NA, Bergsma DJ, Yanagisawa M: Orexins and
Orexin Receptors: A Family of Hypothalamic Neuropeptides and G Protein-Coupled Receptors
that Regulate Feeding Behavior. Cell 92:573-585, 1998
32. Saladin R, DeVos P, Guerre-Millo M, Leturque J, Girard B, Staels B, Auwerx J: Transient
increase in obese gene expression after food intake or insulin administration. Nature 377:527-529,
1995
33. Schwartz MW, Sipols AJ, Marks JL, Sanacora G, White JD, Scheurink A, Kahn SE, Baskin DG,
Woods SC, Figlewicz DP, Porte Jr D: Inhibition of Hypothalamic Neuropeptide Y Gene
Expression by Insulin. Endocrinology 130:3608-3616, 1992
34. Sharma K, Considine RV, Michael B, Dunn SR, Weisberg LS, Kurnik BRC, Kurnik PB,
O’Connor J, Sinha M, Caro JF: Plasma leptin is partly cleared by the kidney and is elevated in
hemodialysis patients. Kidney Int 51, 1980-1985, 1997
35. Sievertsen GD, Lim VS, Nakawatase C, Frohman LA: Metabolic Clearance and Secretion Rates
of Human Prolactin in Normal Subjects and in Patients with Chronic Renal Failure. J Clin
Endocrinol Metab 50:846-852, 1980
36. Sinha MK, Ohannesian JP, Heiman ML, Kriauciunas A, Stephens TW, Magosin S, Marco C,
Caro JF: Nocturnal Rise of Leptin in Lean, Obese, and Non-Insulin-dependent Diabetes Mellitus
Subjects. J Clin Invest 97:1344-1347, 1996.
37. Strack AM, Sebastian RJ, Schwartz MW, Dallman MF: Glucocorticoids and insulin: reciprocal
signals for energy balance. Am J Physiol 268:R142-R149, 1995

22
38. Zoccali C, Mallamaci F, Tripepi G, Benedetto FA, Parlongo S, Cutrupi S, Iellamo D, Bonanno G,
Rapisarda F, Fatuzzo P, Seminara G, Cataliotti A, Malatino LS: Prospective Study of
Neuropeptide Y as an Adverse Cardiovascular Risk Factor in End-Stage Renal Disease. J Am Soc
Nephrol 14:2611-2617, 2003

23
Table 1. Demography, Nutritional Status and Baseline Serum Hormone Levels in the Study Subjects Subject Age/sex BMI % fat leptin NPY cortisol ACTH Insulin glucose ng/ml pg/ml ug/dl pg/ml uU/ml mg/dl Normal 1 32/M 25 18 6.2 61 10.2 22.9 5.2 106 2 53/M 25 21 3.6 63 19.9 36.9 5.9 89 3 63/F 21 25 10.0 108 23.4 28.9 8.9 90 4 40/F 24 19 2.5 56 12.9 10.7 5.4 92 mean±sem 47 ± 7 23.8 ± 1 20.8 ± 1.6 5.6 ± 1.7 72 ± 12 16.6 ± 3.1 24.9 ± 5.5 6.4 ± 0.9 94 ± 4 CRF 1 31/M 29 26 66.7 381 13.5 24.1 62.5 105 2 36/M 21 14 4.7 255 9.5 94.4 3.1 88 3 41/F 27 32 124.5 403 19.4 18.8 8.0 100 4 56/M 20 17 3.6 297 20.3 56.5 5.2 89 5 51/M 26 17 5.1 297 12.1 23.0 14.4 90 6 36/M 22 11 4.7 184 21.8 130.0 7.0 120 7 52/M 35 29 29.0 309 18.8 32.5 40.1 102 mean±sem 42 ± 4 25.7 ± 2 20.9 ± 3.1 34.1 ± 17.4 304 ± 28 16.5 ± 1.8 54.2 ± 16.2 20.0 ± 8.5 99 ± 4 p 0.51 0.50 0.98 0.259 0.0002 0.973 0.220 0.267 0.473
Baseline hormone concentrations were obtained from Day 1, 08 hour. CRF patients #1-4 were on maintenance hemodialysis, #5, peritoneal dialysis, and # 6 and 7 were studied few days before maintenance hemodialysis.

24
Table 2. Diagnosis, Treatment Modality, Clinical Parameters, Basal Plasma Leptin and Fractional Changes in the CRF Patients During Fasting and Re-feeding.
Fractional changes [%] Patient Diagnosis Rx Serum Cr
Hb CRP Serum albumin
Basal Leptin fasting feeding
mg/dl g/dl mg/dl g/dl ng/ml Day2, 03hr Day2, 09hr Day3, 00hr Day3, 03hr # 1 HTN HD 14.4 11.0 <0.5 4.3 66.7 -30 -29 -21 -6 # 3 IN HD 9.2 13.4 <0.5 4.2 124.5 -68 -78 -40 -34 # 7 HTN Pre 13.3 10.3 <0.5 3.9 29.0 -80 -84 9 30 # 2 FSGS HD 11.9 10.5 <0.5 3.9 4.7 -44 -45 21 36 # 4 Alport’s HD 8.3 14.6 <0.5 4.3 3.6 -47
-49 45 69
# 5 ITG PD 13.5 10.6 0.7 4.2 5.1 -45 -41 22 67 # 6 FSGS Pre 16.5 9.0 <0.5 4.2 4.7 -55 -56 29 43 Control† -52±11 -51±9 61±10 82±14 Diagnosis: HTN = hypertensive nephrosclerosis, IN = interstitial neprhitis, FSGS = focal segmental glomerulosclerosis, Alport’s = Alport’s disease, and ITG = immunotactoid glomerulopathy. Rx = modality of treatment: HD = hemodialysis, Pre = pre-dialysis and PD = peritoneal dialysis. Cr = creatinine Hb = hemoglobin concentraion. CRP = C reative protein. Basal leptin levels were obtained on Day 2, 08 hour. Fractional changes were derived from these baseline values. Patients #1, 3 and 7 had high basal leptin and their nocturnal surge during feeding was markedly blunted. Patients 2, 4, 5 and 6 had low basal leptin, their nocturnal surge was brisk, similar to those of the controls, represented by †. Fractional decrement during fasting was comparable in all, controls as well as all CRF patients.

25
Table 3. Plasma Leptin and NPY Concentrations in Normal Subjects and CRF patients at Different Days/Times of the Experiment Leptin [ng/ml] NPY[pg/ml]
Day/time Normal CRF P Normal CRF P
0-20 5.3 ± 1.4 24.9 ± 12.1 0.26 54 ± 11 309 ± 29 0.0001 1-00 7.1 ± 2.2 36.4 ± 17.7 0.25 51 ± 8 286 ± 29 0.0002 03 7.7 ± 2.2 32.3 ± 15.5 0.27 55 ± 5 295 ± 26 <0.0001 08* 5.6 ± 1.7 34.1 ± 17.4 0.26 72 ± 12 304 ±28 0.0002 13 4.3 ± 1.1 24.0 ± 11.7 0.24 62 ± 14 309 ± 19 <0.0001 18 3.3 ± 0.7 22.7 ± 12.1 0.27 47 ± 7 288 ± 20 <0.0001 20 2.9 ± 0.6 19.3 ± 9.8 0.25 39 ± 4 267 ± 23 <0.0001 2-00 2.5 ± 0.4 15.6 ± 7.9 0.25 28 ± 8 242 ± 24 0.0001 03 2.3 ± 0.4 14.4 ± 7.5 0.26 29 ± 8 234 ±23 0.0001 09 2.5 ± 0.6 12.7 ± 6.7 0.29 56 ± 15 262 ±23 0.0001 13 3.2 ± 0.8 10.5 ± 4.9 0.31 60 ± 15 286 ± 29 0.0003 18 5.4 ± 2.3 15.5 ± 6.6 0.29 60 ± 16 260 ± 27 0.0007 20 5.8 ± 2.1 19.6 ± 8.3 0.25 53 ± 16 262 ± 36 0.0025 3-00 9.0 ± 3.0 25.9 ± 10.6 0.28 44 ± 11 245 ± 31 0.0011 03 10.2 ± 3.5 30.3 ± 12.0 0.25 49 ± 11 249 ± 28 0.0005 08 6.6 ± 1.7 33.6 ± 14.7 0.21 73 ± 7 289 ± 23 <0.0001
Fasting started from Day 0, 20 hr to Day 2, 09 hr [37 hours], and re-feeding, Day 2, 09 hr to Day3, 08 hr. * denotes baseline levels obtained at 08 hr, Day 1. P = p values comparing normal to CRF subjects derived from Student’s t test.

26
Table 4. Plasma Cortisol and ACTH Concentrations in Normal Subjects and CRF patients at Different Days/Times of the Experiment
Cortisol [ug/ml] ACTH [pg/ml]
Day/time Normal CRF P Normal CRF P 0-20 4.3 ± 0.4 10.8 ± 1.2 0.004† 9.8 ± 1.1 27.8 ± 5.5 0.040‡ 1-00 7.1 ± 3.4 6.4 ± 0.9 0.81 11.2 ± 1.8 19.6 ± 5.1 0.261 03 7.4 ± 2.8 7.4 ± 1.5 0.99 17.4 ± 2.7 27.1 ± 5.4 0.234
08* 16.6 ± 3.0 16.5 ± 1.8 0.97 24.9 ± 5.5 54.2 ± 16.2 0.220 13 8.1± 0.7 13.6 ± 2.1 0.09 17.1 ± 3.0 36.7 ± 9.7 0.176 18 6.4 ± 1.1 12.3 ± 0.7 0.001† 11.9 ± 2.3 32.5 ± 8.4 0.110 20 5.0 ± 0.6 10.0 ± 1.1 0.010† 10.3 ± 1.8 24.2 ± 5.1 0.079 2-00 11.1 ± 4.4 7.7 ± 1.1 0.35 18.8 ± 3.7 26.3 ± 7.7 0.501 03 18.7 ± 5.4 11.6 ± 2.3 0.20 38.2 ± 8.8 28.2 ± 4.8 0.303 09 20.3 ± 5.6 18.0 ± 2.1 0.66 18.9 ± 3.5 50.7 ± 18.4 0.240 13 9.9 ± 1.3 14.7 ± 2.8 0.25 11.9 ± 2.2 31.7 ± 6.8 0.064 18 6.6 ± 1.3 11.4 ± 0.9 0.012† 11.6 ± 2.3 27.2 ± 7.3 0.153 20 6.0 ± 0.9 11.8 ± 1.5 0.024† 10.2 ± 2.0 25.7 ± 6.7 0.123 3-00 3.8 ±0.3 7.7 ± 1.4 0.076 10.1 ± 1.4 20.2 ± 5.0 0.177 03 7.3 ± 1.9 9.3 ± 2.0 0.53 17.3 ± 5.7 30.6 ± 4.9 0.122 08 15.2 ± 0.9 14.9 ± 0.8 0.86 13.7 ± 3.2 42.3 ± 14.1 0.177
Fasting started from Day 0, 20 hr to Day 2, 09 hr [37 hours], and re-feeding, Day 2, 09 hr to Day3, 08 hr. * denotes baseline levels obtained at 08 hr, Day 1. P = p values comparing normal to CRF subjects derived from Student’s t test. † indicates higher cortisol (all in the evening hours) and ‡, higher ACTH in CRF patients.

27
Table 5. Plasma Insulin and Glucose Concentrations in Normal Subjects and CRF patients at Different Days/Times of the Experiment
Insulin [uU/ml] Glucose [mg/dl]
Day/time Normal CRF P Normal CRF P 1- 08* 6.4 ± 0.9 20.0 ± 8.5 0.27 94.3 ± 4.0 99.1 ±4.3 0.47 20 1.2 ± 0.3 12.4 ± 8.0 0.33 79.8 ± 4.7 83.6 ± 3.9 0.56 2- 09 2.3 ± 0.8 6.8 ± 3.2 0.33 77.0 ± 6.8 87.1 ± 4.8 0.25 13 12.3 ± 4.0 21.4 ± 7.1 0.39 107.8 ± 10.4 104.0 ± 7.6 0.78 18 19.0 ± 4.9 37.9 ± 10.0 0.21 107.0 ± 2.7 119.4 ± 11.1 0.43 20 23.8 ± 5.9 85.5 ± 44.7 0.33 118.8 ± 5.1 140.9 ± 8.8 0.11 3- 08 7.0 ± 1.1 20.0 ± 8.6 0.29 97.3 ± 4.9 101.4 ± 4.4 0,56 Fasting started from Day 0, 20 hr to Day 2, 09 hr [37 hours], and re-feeding, Day 2, 09 hr to Day3, 08 hr. * denotes baseline levels obtained at 08 hr, Day 1. P = p values comparing normal to CRF subjects derived from Student’s t test.

28
Figure Legends
Figure 1. Schematic representation of the Experiment: On Day-1 and Day 0, subjects ate a fixed GCRC-
prepared diet. On the afternoon of Day 0, subjects were admitted to the GCRC, a heparin lock was placed
and a snack was given at 20 hour. Fasting started from 20 hour, Day 0 untill 09 hour of Day 2 [total 37
hours]. Re-feeding extended from Day 2, 09 hour to Day 3, 08 hour. Crosshatched bars represent periods
when subjects were not eating. During the study period, blood samples were obtained at 20, 0, 3, 8 [9 on
Day2], 13 and 18 hours. Visual analogues scales for assessing appetite were obtained during the waking
hours.
Figure 2. Circadian variation of plasma leptin and NPY and their changes to fasting and re-feeding:
Fractional changes [%] of plasma leptin [Panel A] and NPY [Panel B] at designated times as compared to
baseline values obtained on Day 1, 08 hour. Values are presented as means ± SEM. Solid lines and filled
circles are derived from normal subjects, while broken lines and open squares, from patients with chronic
renal failure; * indicates p values of <0.05 by Student’s t test comparing the two study groups. Fasting,
represented by the crosshatched bar at the bottom of the figure, began on Day 0, 20 hour and ended on
Day 2, 09 hour. Re-feeding extended from Day 2, 09 hour to Day 3, 08 hour.
Figure 3. Circadian variation of plasma cortisol and ACTH and their changes to fasting and re-feeding:
Fractional changes [%] of plasma cortisol [Panel A] and ACTH [Panel B] at designated times as compared
to baseline values obtained on Day 1, 08 hour. Values are presented as means ± SEM. Solid lines and
filled circles are derived from normal subjects, while broken lines and open squares, from patients with
chronic renal failure; * indicates p values of <0.05 by Student’s t test comparing the two study groups.
Fasting, represented by the crosshatched bar at the bottom of the figure, began on Day 0, 20 hour and
ended on Day 2, 09 hour. Re-feeding from Day 2, 09 hour to Day 3, 08 hour. Shaded areas represent the
magnitude of cortisol and ACTH excess in CRF patients as compared to the normal subjects during the
experiment.
Figure 4. Insulin and glucose response to fasting and refeeding: Fractional changes [%] of plasma insulin
[Panel A] and glucose [Panel B] at designated times as compared to baseline values obtained on Day 1, 08

29
hour. Values are presented as means ± SEM. Solid lines and filled circles are derived from normal subjects
and broken lines and open squares, from patients with chronic renal failure; * indicates p values of <0.05
by Student’s t test comparing the two groups. Fasting, represented by the crosshatched bar at the bottom of
the figure, began on Day 0, 20 hour and ended on Day 2, 09 hour. Re-feeding from Day 2, 09 hour to Day
3, 08 hour.
Figure 5. Visual Analogue Scale illustrating the “hunger” sensation: The scale on the Y-axis is from 0 −
10, 0 being not hungry at all and 10, extremely hungry. Values are presented as mean ± SEM. Solid lines
and filled circles are derived from the normal subjects, while broken lines and open squares, from patients
with chronic renal failure; * indicates p values of <0.05 by Student’s t test comparing the two groups.
Fasting, represented by crosshatched bar at the bottom of the figure, extended from Day 0, 20 hour to Day
3, 09 hour.

30
FIGURE 1.
31
FIGURE 2.

32
FIGURE 3.

33
FIGURE 4.

34
FIGURE 5.
Copyright © 2022 FDOKUMEN