Home range and den characteristics of the brush-tailed rabbit-rat ( Conilurus penicillatus ) in the...
11
Introduction Home range is an important aspect of the ecology of any species, as it provides information on sociality, resource requirements, and mobility, and this information can con- tribute to the prioritisation of conservation management options. Comparison of home-range characteristics between sexes, seasons, and among populations can provide insight into many aspects of the ecology of a species, and differences among species in home-range characteristics may relate to fundamental differences in sociality and ecology. Relatively few home-range studies using radio-tracking have been undertaken on rodents in Australia (but see Bubela et al. 1991; Anstee et al. 1997; Brandle and Moseby 1999; Cox et al. 2000; Moro and Morris 2000), particularly so for rodents in the monsoonal tropics (but see Griffiths et al. 2002; Puckey et al. 2004). The present study concerns the home range and den characteristics of a little-known tropical rodent whose geographical distribution in the Northern Territory appears to have contracted (Woinarski 2000). The brush-tailed rabbit-rat (Conilurus penicillatus) is a nocturnal medium-sized (150 g) rodent species that occurs very patchily in eucalypt forests of northern Australia and southern New Guinea (Menzies and Dennis 1979; Strahan 1998). It is the only extant member of its genus: its sole con- gener, C. albipes, became extinct at the end of the 19th century (Taylor and Horner 1971). Some evidence suggests that C. penicillatus has suffered a recent decline, and it is now listed as Vulnerable in the Northern Territory, where it still occurs on Bathurst and Melville Islands (Tiwi Islands) and Inglis Island off north-east Arnhem Land (Woinarski et al. 1999; Woinarski 2000). The only known mainland populations to persist occur in Garig Gunak Barlu National Park (Cobourg Peninsula) (Taylor and Horner 1971; Frith and Calaby 1974), and in a highly restricted area of Kakadu National Park (Firth 2003; Firth et al. 2005). Little is known about the ecology of C. penicillatus (Bradley et al. 1987; Friend et al. 1992), except that it occurs in tall open eucalypt forest and casuarina woodland, where it Wildlife Research, 2006, 33, 397–407 10.1071/WR05057 1035-3712/06/050397 © CSIRO 2006 Ronald S. C. Firth A,D , John C. Z. Woinarski B and Richard A. Noske C A School of Science and Primary Industries, Charles Darwin University, and CRC for Tropical Savannas Management, Darwin, NT 0909, Australia. B Biodiversity Conservation, Department of Natural Resources, Environment and the Arts, PO Box 496, Palmerston, NT 0831, Australia. C School of Science and Primary Industries, Charles Darwin University, Darwin, NT 0909, Australia. D Corresponding author. Email: [email protected] Abstract. Radio-telemetry was used to investigate the home range and den characteristics of the brush-tailed rabbit-rat (Conilurus penicillatus) from three sites in the monsoonal tropics of the Northern Territory, Australia. Radio-tracking was conducted in a series of discontinuous 4–17-day sessions, over a 2-year period. The home ranges of 61 C. penicillatus were estimated using the minimum convex polygon (MCP) and fixed kernel (K95% and K50%) methods. There were no significant differences in home-range size among the three sites or between wet and dry seasons, which suggests that vegetation structure, floristics and season play relatively little role in movements of C. penicillatus. The mean home-range size was 0.79 ± 0.09 ha (MCP estimate) to 0.97 ± 0.12 ha (K95% estimate). The home ranges of males were larger than those of females (mean MCP estimates of 1.07 ± 0.15 and 0.45 ± 0.06 ha respectively). C. penicillatus denned primarily in fallen logs and in hollows of eucalypts and bloodwoods (Corymbia spp.). Rough-barked trees appeared to be preferred. The diameter at breast height (DBH) of den trees varied significantly between the three sites, being greatest at site C1 (34.5 ± 2.4 cm) and least at site C2 (26.1 ± 1.0 cm). Den trees had larger DBH than randomly selected trees at each site. The diameter at the mid- point (DMP) of both den and randomly selected logs were not significantly different between sites. Many individuals used more than one den site per tracking session. The small home ranges of C. penicillatus and its reliance on hollows in trees and logs suggest that this species is very vulnerable to local extinction following long- term annual and destructive fire regimes and land clearing, even in comparatively small patches. Home range and den characteristics of the brush-tailed rabbit-rat (Conilurus penicillatus) in the monsoonal tropics of the Northern Territory,Australia www.publish.csiro.au/journals/wr CSIRO PUBLISHING
Transcript of Home range and den characteristics of the brush-tailed rabbit-rat ( Conilurus penicillatus ) in the...
IntroductionHome range is an important aspect of the ecology of anyspecies, as it provides information on sociality, resourcerequirements, and mobility, and this information can con-tribute to the prioritisation of conservation managementoptions. Comparison of home-range characteristics betweensexes, seasons, and among populations can provide insightinto many aspects of the ecology of a species, and differencesamong species in home-range characteristics may relate tofundamental differences in sociality and ecology.
Relatively few home-range studies using radio-trackinghave been undertaken on rodents in Australia (but see Bubelaet al. 1991; Anstee et al. 1997; Brandle and Moseby 1999;Cox et al. 2000; Moro and Morris 2000), particularly so forrodents in the monsoonal tropics (but see Griffiths et al.2002; Puckey et al. 2004). The present study concerns thehome range and den characteristics of a little-known tropicalrodent whose geographical distribution in the NorthernTerritory appears to have contracted (Woinarski 2000).
The brush-tailed rabbit-rat (Conilurus penicillatus) is anocturnal medium-sized (150 g) rodent species that occursvery patchily in eucalypt forests of northern Australia andsouthern New Guinea (Menzies and Dennis 1979; Strahan1998). It is the only extant member of its genus: its sole con-gener, C. albipes, became extinct at the end of the 19thcentury (Taylor and Horner 1971). Some evidence suggeststhat C. penicillatus has suffered a recent decline, and it isnow listed as Vulnerable in the Northern Territory, where itstill occurs on Bathurst and Melville Islands (Tiwi Islands)and Inglis Island off north-east Arnhem Land (Woinarskiet al. 1999; Woinarski 2000). The only known mainlandpopulations to persist occur in Garig Gunak Barlu NationalPark (Cobourg Peninsula) (Taylor and Horner 1971; Frithand Calaby 1974), and in a highly restricted area of KakaduNational Park (Firth 2003; Firth et al. 2005).
Little is known about the ecology of C. penicillatus(Bradley et al. 1987; Friend et al. 1992), except that it occursin tall open eucalypt forest and casuarina woodland, where it
Wildlife Research, 2006, 33, 397–407
10.1071/WR05057 1035-3712/06/050397© CSIRO 2006
Ronald S. C. FirthA,D, John C. Z. WoinarskiB and Richard A. NoskeC
ASchool of Science and Primary Industries, Charles Darwin University, andCRC for Tropical Savannas Management, Darwin, NT 0909, Australia.
BBiodiversity Conservation, Department of Natural Resources, Environment and the Arts, PO Box 496, Palmerston, NT 0831, Australia.
CSchool of Science and Primary Industries, Charles Darwin University, Darwin, NT 0909, Australia.DCorresponding author. Email: [email protected]
Abstract. Radio-telemetry was used to investigate the home range and den characteristics of the brush-tailedrabbit-rat (Conilurus penicillatus) from three sites in the monsoonal tropics of the Northern Territory, Australia.Radio-tracking was conducted in a series of discontinuous 4–17-day sessions, over a 2-year period. The homeranges of 61 C. penicillatus were estimated using the minimum convex polygon (MCP) and fixed kernel (K95%and K50%) methods. There were no significant differences in home-range size among the three sites or betweenwet and dry seasons, which suggests that vegetation structure, floristics and season play relatively little role inmovements of C. penicillatus. The mean home-range size was 0.79 ± 0.09 ha (MCP estimate) to 0.97 ± 0.12 ha(K95% estimate). The home ranges of males were larger than those of females (mean MCP estimates of 1.07 ± 0.15and 0.45 ± 0.06 ha respectively). C. penicillatus denned primarily in fallen logs and in hollows of eucalypts andbloodwoods (Corymbia spp.). Rough-barked trees appeared to be preferred. The diameter at breast height (DBH)of den trees varied significantly between the three sites, being greatest at site C1 (34.5 ± 2.4 cm) and least at siteC2 (26.1 ± 1.0 cm). Den trees had larger DBH than randomly selected trees at each site. The diameter at the mid-point (DMP) of both den and randomly selected logs were not significantly different between sites. Manyindividuals used more than one den site per tracking session. The small home ranges of C. penicillatus and itsreliance on hollows in trees and logs suggest that this species is very vulnerable to local extinction following long-term annual and destructive fire regimes and land clearing, even in comparatively small patches.
Home range and den characteristics of the brush-tailed rabbit-rat(Conilurus penicillatus) in the monsoonal tropics
of the Northern Territory, Australia
www.publish.csiro.au/journals/wr
CSIRO PUBLISHING
R. S. C. Firth et al.398 Wildlife Research
forages on the ground for seeds and dens in tree hollows andfallen hollow logs (Firth 2003; Firth et al. 2005). This paperextends from a previous brief report that provided prelimi-nary information on its home range (Firth 2003). Homeranges were compared between sexes, seasons, and amongsites with different vegetation structures. We also identifiedthe types and sizes of den trees used, and compared theircharacteristics with those of other randomly selected trees.
Materials and methods
Study sites
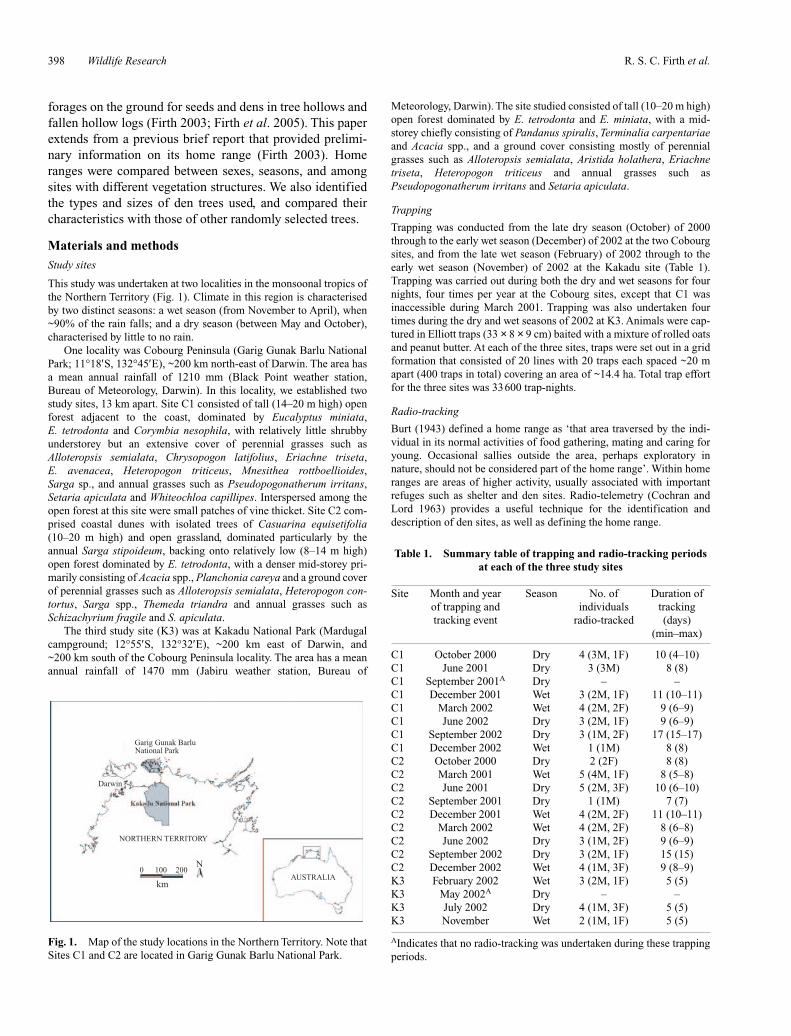
This study was undertaken at two localities in the monsoonal tropics ofthe Northern Territory (Fig. 1). Climate in this region is characterisedby two distinct seasons: a wet season (from November to April), when~90% of the rain falls; and a dry season (between May and October),characterised by little to no rain.
One locality was Cobourg Peninsula (Garig Gunak Barlu NationalPark; 11°18′S, 132°45′E), ~200 km north-east of Darwin. The area hasa mean annual rainfall of 1210 mm (Black Point weather station,Bureau of Meteorology, Darwin). In this locality, we established twostudy sites, 13 km apart. Site C1 consisted of tall (14–20 m high) openforest adjacent to the coast, dominated by Eucalyptus miniata,E. tetrodonta and Corymbia nesophila, with relatively little shrubbyunderstorey but an extensive cover of perennial grasses such asAlloteropsis semialata, Chrysopogon latifolius, Eriachne triseta,E. avenacea, Heteropogon triticeus, Mnesithea rottboellioides,Sarga sp., and annual grasses such as Pseudopogonatherum irritans,Setaria apiculata and Whiteochloa capillipes. Interspersed among theopen forest at this site were small patches of vine thicket. Site C2 com-prised coastal dunes with isolated trees of Casuarina equisetifolia(10–20 m high) and open grassland, dominated particularly by theannual Sarga stipoideum, backing onto relatively low (8–14 m high)open forest dominated by E. tetrodonta, with a denser mid-storey pri-marily consisting of Acacia spp., Planchonia careya and a ground coverof perennial grasses such as Alloteropsis semialata, Heteropogon con-tortus, Sarga spp., Themeda triandra and annual grasses such asSchizachyrium fragile and S. apiculata.
The third study site (K3) was at Kakadu National Park (Mardugalcampground; 12°55′S, 132°32′E), ~200 km east of Darwin, and~200 km south of the Cobourg Peninsula locality. The area has a meanannual rainfall of 1470 mm (Jabiru weather station, Bureau of
Meteorology, Darwin). The site studied consisted of tall (10–20 m high)open forest dominated by E. tetrodonta and E. miniata, with a mid-storey chiefly consisting of Pandanus spiralis, Terminalia carpentariaeand Acacia spp., and a ground cover consisting mostly of perennialgrasses such as Alloteropsis semialata, Aristida holathera, Eriachnetriseta, Heteropogon triticeus and annual grasses such asPseudopogonatherum irritans and Setaria apiculata.
Trapping
Trapping was conducted from the late dry season (October) of 2000through to the early wet season (December) of 2002 at the two Cobourgsites, and from the late wet season (February) of 2002 through to theearly wet season (November) of 2002 at the Kakadu site (Table 1).Trapping was carried out during both the dry and wet seasons for fournights, four times per year at the Cobourg sites, except that C1 wasinaccessible during March 2001. Trapping was also undertaken fourtimes during the dry and wet seasons of 2002 at K3. Animals were cap-tured in Elliott traps (33 × 8 × 9 cm) baited with a mixture of rolled oatsand peanut butter. At each of the three sites, traps were set out in a gridformation that consisted of 20 lines with 20 traps each spaced ~20 mapart (400 traps in total) covering an area of ~14.4 ha. Total trap effortfor the three sites was 33600 trap-nights.
Radio-tracking
Burt (1943) defined a home range as ‘that area traversed by the indi-vidual in its normal activities of food gathering, mating and caring foryoung. Occasional sallies outside the area, perhaps exploratory innature, should not be considered part of the home range’. Within homeranges are areas of higher activity, usually associated with importantrefuges such as shelter and den sites. Radio-telemetry (Cochran andLord 1963) provides a useful technique for the identification anddescription of den sites, as well as defining the home range.
0 100 200N
km
NORTHERN TERRITORY
AUSTRALIA
Darwin
Garig Gunak BarluNational Park
Fig. 1. Map of the study locations in the Northern Territory. Note thatSites C1 and C2 are located in Garig Gunak Barlu National Park.
Table 1. Summary table of trapping and radio-tracking periodsat each of the three study sites
Site Month and year Season No. of Duration of of trapping and individuals tracking tracking event radio-tracked (days)
(min–max)
C1 October 2000 Dry 4 (3M, 1F) 10 (4–10)C1 June 2001 Dry 3 (3M) 8 (8)C1 September 2001A Dry – –C1 December 2001 Wet 3 (2M, 1F) 11 (10–11)C1 March 2002 Wet 4 (2M, 2F) 9 (6–9)C1 June 2002 Dry 3 (2M, 1F) 9 (6–9)C1 September 2002 Dry 3 (1M, 2F) 17 (15–17)C1 December 2002 Wet 1 (1M) 8 (8)C2 October 2000 Dry 2 (2F) 8 (8)C2 March 2001 Wet 5 (4M, 1F) 8 (5–8)C2 June 2001 Dry 5 (2M, 3F) 10 (6–10)C2 September 2001 Dry 1 (1M) 7 (7)C2 December 2001 Wet 4 (2M, 2F) 11 (10–11)C2 March 2002 Wet 4 (2M, 2F) 8 (6–8)C2 June 2002 Dry 3 (1M, 2F) 9 (6–9)C2 September 2002 Dry 3 (2M, 1F) 15 (15)C2 December 2002 Wet 4 (1M, 3F) 9 (8–9)K3 February 2002 Wet 3 (2M, 1F) 5 (5)K3 May 2002A Dry – –K3 July 2002 Dry 4 (1M, 3F) 5 (5)K3 November Wet 2 (1M, 1F) 5 (5)
AIndicates that no radio-tracking was undertaken during these trappingperiods.
Wildlife Research 399
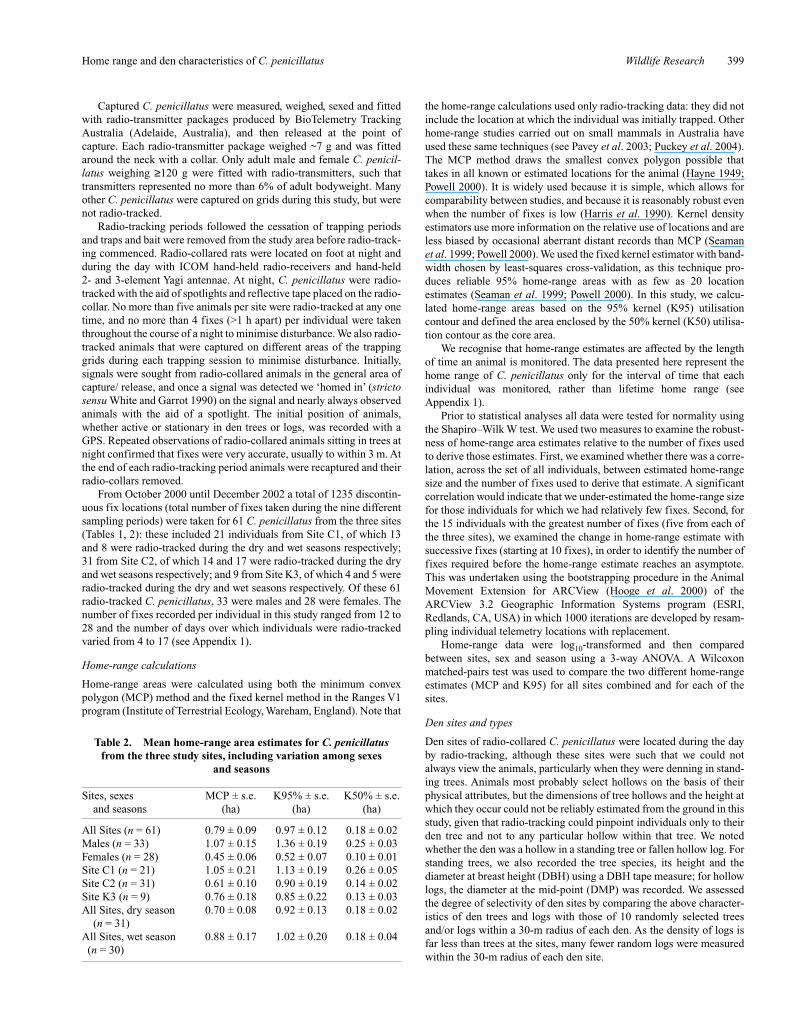
Captured C. penicillatus were measured, weighed, sexed and fittedwith radio-transmitter packages produced by BioTelemetry TrackingAustralia (Adelaide, Australia), and then released at the point ofcapture. Each radio-transmitter package weighed ~7 g and was fittedaround the neck with a collar. Only adult male and female C. penicil-latus weighing ≥120 g were fitted with radio-transmitters, such thattransmitters represented no more than 6% of adult bodyweight. Manyother C. penicillatus were captured on grids during this study, but werenot radio-tracked.
Radio-tracking periods followed the cessation of trapping periodsand traps and bait were removed from the study area before radio-track-ing commenced. Radio-collared rats were located on foot at night andduring the day with ICOM hand-held radio-receivers and hand-held2- and 3-element Yagi antennae. At night, C. penicillatus were radio-tracked with the aid of spotlights and reflective tape placed on the radio-collar. No more than five animals per site were radio-tracked at any onetime, and no more than 4 fixes (>1 h apart) per individual were takenthroughout the course of a night to minimise disturbance. We also radio-tracked animals that were captured on different areas of the trappinggrids during each trapping session to minimise disturbance. Initially,signals were sought from radio-collared animals in the general area ofcapture/ release, and once a signal was detected we ‘homed in’ (strictosensu White and Garrot 1990) on the signal and nearly always observedanimals with the aid of a spotlight. The initial position of animals,whether active or stationary in den trees or logs, was recorded with aGPS. Repeated observations of radio-collared animals sitting in trees atnight confirmed that fixes were very accurate, usually to within 3 m. Atthe end of each radio-tracking period animals were recaptured and theirradio-collars removed.
From October 2000 until December 2002 a total of 1235 discontin-uous fix locations (total number of fixes taken during the nine differentsampling periods) were taken for 61 C. penicillatus from the three sites(Tables 1, 2): these included 21 individuals from Site C1, of which 13and 8 were radio-tracked during the dry and wet seasons respectively;31 from Site C2, of which 14 and 17 were radio-tracked during the dryand wet seasons respectively; and 9 from Site K3, of which 4 and 5 wereradio-tracked during the dry and wet seasons respectively. Of these 61radio-tracked C. penicillatus, 33 were males and 28 were females. Thenumber of fixes recorded per individual in this study ranged from 12 to28 and the number of days over which individuals were radio-trackedvaried from 4 to 17 (see Appendix 1).
Home-range calculations
Home-range areas were calculated using both the minimum convexpolygon (MCP) method and the fixed kernel method in the Ranges V1program (Institute of Terrestrial Ecology, Wareham, England). Note that
the home-range calculations used only radio-tracking data: they did notinclude the location at which the individual was initially trapped. Otherhome-range studies carried out on small mammals in Australia haveused these same techniques (see Pavey et al. 2003; Puckey et al. 2004).The MCP method draws the smallest convex polygon possible thattakes in all known or estimated locations for the animal (Hayne 1949;Powell 2000). It is widely used because it is simple, which allows forcomparability between studies, and because it is reasonably robust evenwhen the number of fixes is low (Harris et al. 1990). Kernel densityestimators use more information on the relative use of locations and areless biased by occasional aberrant distant records than MCP (Seamanet al. 1999; Powell 2000). We used the fixed kernel estimator with band-width chosen by least-squares cross-validation, as this technique pro-duces reliable 95% home-range areas with as few as 20 locationestimates (Seaman et al. 1999; Powell 2000). In this study, we calcu-lated home-range areas based on the 95% kernel (K95) utilisationcontour and defined the area enclosed by the 50% kernel (K50) utilisa-tion contour as the core area.
We recognise that home-range estimates are affected by the lengthof time an animal is monitored. The data presented here represent thehome range of C. penicillatus only for the interval of time that eachindividual was monitored, rather than lifetime home range (seeAppendix 1).
Prior to statistical analyses all data were tested for normality usingthe Shapiro–Wilk W test. We used two measures to examine the robust-ness of home-range area estimates relative to the number of fixes usedto derive those estimates. First, we examined whether there was a corre-lation, across the set of all individuals, between estimated home-rangesize and the number of fixes used to derive that estimate. A significantcorrelation would indicate that we under-estimated the home-range sizefor those individuals for which we had relatively few fixes. Second, forthe 15 individuals with the greatest number of fixes (five from each ofthe three sites), we examined the change in home-range estimate withsuccessive fixes (starting at 10 fixes), in order to identify the number offixes required before the home-range estimate reaches an asymptote.This was undertaken using the bootstrapping procedure in the AnimalMovement Extension for ARCView (Hooge et al. 2000) of theARCView 3.2 Geographic Information Systems program (ESRI,Redlands, CA, USA) in which 1000 iterations are developed by resam-pling individual telemetry locations with replacement.
Home-range data were log10-transformed and then comparedbetween sites, sex and season using a 3-way ANOVA. A Wilcoxonmatched-pairs test was used to compare the two different home-rangeestimates (MCP and K95) for all sites combined and for each of thesites.
Den sites and types
Den sites of radio-collared C. penicillatus were located during the dayby radio-tracking, although these sites were such that we could notalways view the animals, particularly when they were denning in stand-ing trees. Animals most probably select hollows on the basis of theirphysical attributes, but the dimensions of tree hollows and the height atwhich they occur could not be reliably estimated from the ground in thisstudy, given that radio-tracking could pinpoint individuals only to theirden tree and not to any particular hollow within that tree. We notedwhether the den was a hollow in a standing tree or fallen hollow log. Forstanding trees, we also recorded the tree species, its height and thediameter at breast height (DBH) using a DBH tape measure; for hollowlogs, the diameter at the mid-point (DMP) was recorded. We assessedthe degree of selectivity of den sites by comparing the above character-istics of den trees and logs with those of 10 randomly selected treesand/or logs within a 30-m radius of each den. As the density of logs isfar less than trees at the sites, many fewer random logs were measuredwithin the 30-m radius of each den site.
Home range and den characteristics of C. penicillatus
Table 2. Mean home-range area estimates for C. penicillatusfrom the three study sites, including variation among sexes
and seasons
Sites, sexes MCP ± s.e. K95% ± s.e. K50% ± s.e. and seasons (ha) (ha) (ha)
All Sites (n = 61) 0.79 ± 0.09 0.97 ± 0.12 0.18 ± 0.02Males (n = 33) 1.07 ± 0.15 1.36 ± 0.19 0.25 ± 0.03Females (n = 28) 0.45 ± 0.06 0.52 ± 0.07 0.10 ± 0.01Site C1 (n = 21) 1.05 ± 0.21 1.13 ± 0.19 0.26 ± 0.05Site C2 (n = 31) 0.61 ± 0.10 0.90 ± 0.19 0.14 ± 0.02Site K3 (n = 9) 0.76 ± 0.18 0.85 ± 0.22 0.13 ± 0.03All Sites, dry season 0.70 ± 0.08 0.92 ± 0.13 0.18 ± 0.02
(n = 31)All Sites, wet season 0.88 ± 0.17 1.02 ± 0.20 0.18 ± 0.04(n = 30)
R. S. C. Firth et al.400 Wildlife Research
Variation among sites in dimensions of den trees and random treeswas tested with Kruskal–Wallis ANOVA. In each site, Mann–WhitneyU tests were used to compare the DBH and height of den trees withthose of random trees. The dimensions of den logs and random logs atSites C1 and C2 were compared using Mann–Whitney U tests: Site K3had too few den logs for comparison.
The frequency of tree species used for denning was compared withrandomly selected trees at each of the three sites using Chi-square tests.A den selectivity index was also calculated for each type of den treespecies used for each of the sites. The index used was (x–y)/(x+y),where x was the relative frequency of a particular den tree species andy was the relative frequency of the equivalent or random den treespecies. This index can range from –1, when a particular den type wasnot used despite being present at the site (and included in our randomselection of trees at that site), to approaching 1, when no correspondingrandom den type was measured though it was used as a den.
The number of different den sites used by each radio-tracked indi-vidual was square-root-transformed and then compared between sites,sexes and seasons using a 3-way ANOVA. We also examined whetherthere was a correlation, across the set of all individuals, between thenumber of different den sites and the number of radio-tracking days andradio-tracking fixes.
Results
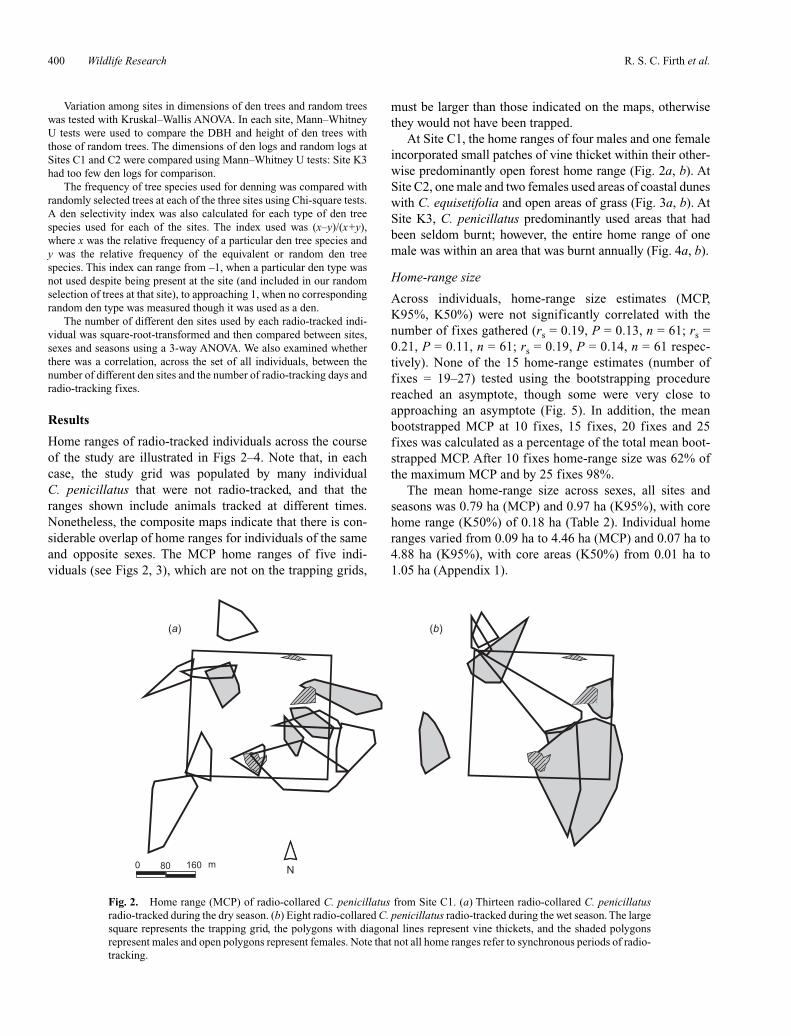
Home ranges of radio-tracked individuals across the courseof the study are illustrated in Figs 2–4. Note that, in eachcase, the study grid was populated by many individualC. penicillatus that were not radio-tracked, and that theranges shown include animals tracked at different times.Nonetheless, the composite maps indicate that there is con-siderable overlap of home ranges for individuals of the sameand opposite sexes. The MCP home ranges of five indi-viduals (see Figs 2, 3), which are not on the trapping grids,
must be larger than those indicated on the maps, otherwisethey would not have been trapped.
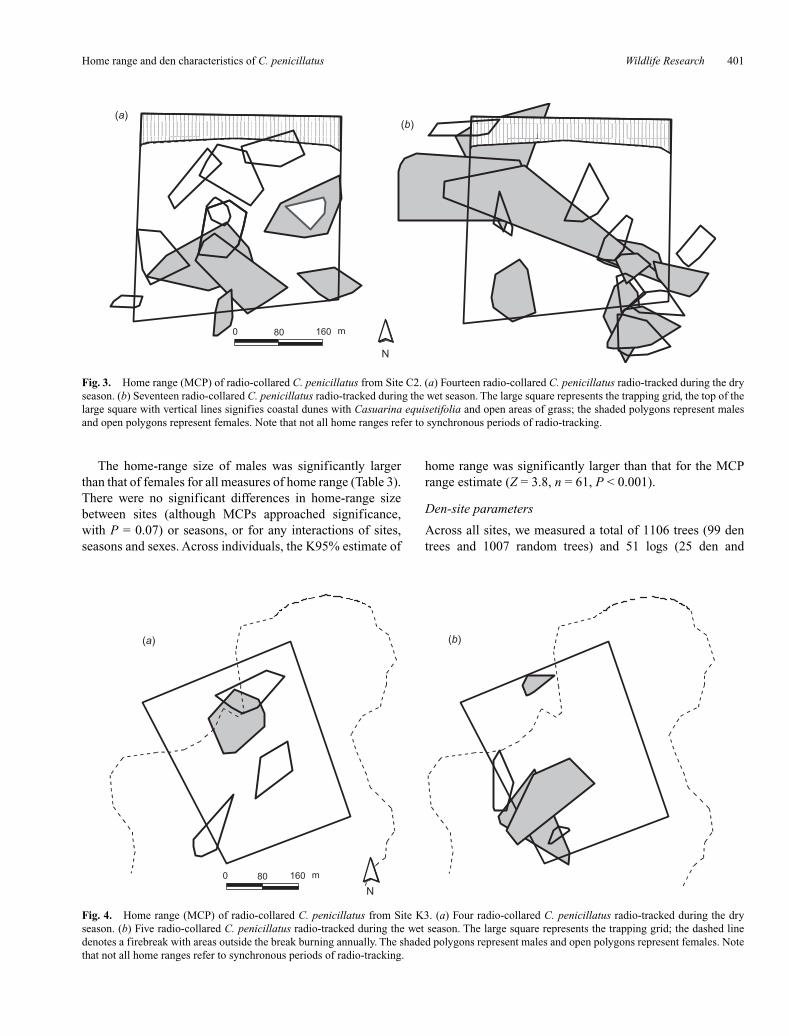
At Site C1, the home ranges of four males and one femaleincorporated small patches of vine thicket within their other-wise predominantly open forest home range (Fig. 2a, b). AtSite C2, one male and two females used areas of coastal duneswith C. equisetifolia and open areas of grass (Fig. 3a, b). AtSite K3, C. penicillatus predominantly used areas that hadbeen seldom burnt; however, the entire home range of onemale was within an area that was burnt annually (Fig. 4a, b).
Home-range size
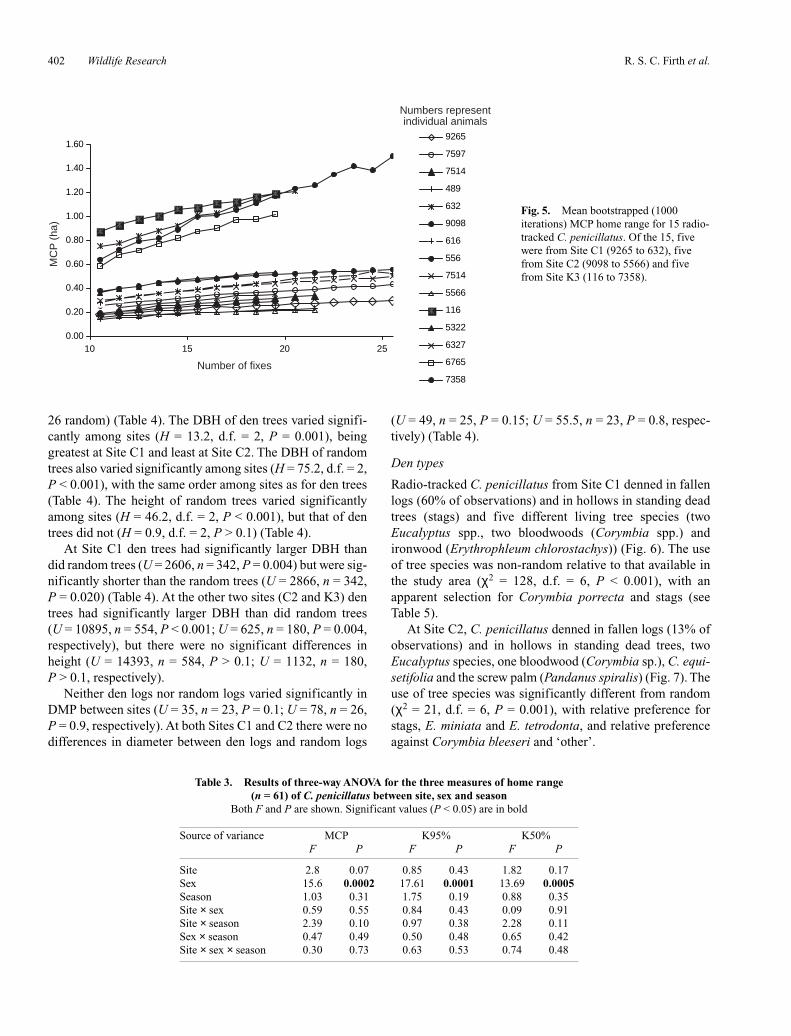
Across individuals, home-range size estimates (MCP,K95%, K50%) were not significantly correlated with thenumber of fixes gathered (rs = 0.19, P = 0.13, n = 61; rs =0.21, P = 0.11, n = 61; rs = 0.19, P = 0.14, n = 61 respec-tively). None of the 15 home-range estimates (number offixes = 19–27) tested using the bootstrapping procedurereached an asymptote, though some were very close toapproaching an asymptote (Fig. 5). In addition, the meanbootstrapped MCP at 10 fixes, 15 fixes, 20 fixes and 25fixes was calculated as a percentage of the total mean boot-strapped MCP. After 10 fixes home-range size was 62% ofthe maximum MCP and by 25 fixes 98%.
The mean home-range size across sexes, all sites andseasons was 0.79 ha (MCP) and 0.97 ha (K95%), with corehome range (K50%) of 0.18 ha (Table 2). Individual homeranges varied from 0.09 ha to 4.46 ha (MCP) and 0.07 ha to4.88 ha (K95%), with core areas (K50%) from 0.01 ha to1.05 ha (Appendix 1).
(a) (b)
N0 80 160 m
Fig. 2. Home range (MCP) of radio-collared C. penicillatus from Site C1. (a) Thirteen radio-collared C. penicillatusradio-tracked during the dry season. (b) Eight radio-collared C. penicillatus radio-tracked during the wet season. The largesquare represents the trapping grid, the polygons with diagonal lines represent vine thickets, and the shaded polygonsrepresent males and open polygons represent females. Note that not all home ranges refer to synchronous periods of radio-tracking.
Wildlife Research 401
The home-range size of males was significantly largerthan that of females for all measures of home range (Table 3).There were no significant differences in home-range sizebetween sites (although MCPs approached significance,with P = 0.07) or seasons, or for any interactions of sites,seasons and sexes. Across individuals, the K95% estimate of
home range was significantly larger than that for the MCPrange estimate (Z = 3.8, n = 61, P < 0.001).
Den-site parameters
Across all sites, we measured a total of 1106 trees (99 dentrees and 1007 random trees) and 51 logs (25 den and
Home range and den characteristics of C. penicillatus
0 80 160 m
N
(a)(b)
Fig. 3. Home range (MCP) of radio-collared C. penicillatus from Site C2. (a) Fourteen radio-collared C. penicillatus radio-tracked during the dryseason. (b) Seventeen radio-collared C. penicillatus radio-tracked during the wet season. The large square represents the trapping grid, the top of thelarge square with vertical lines signifies coastal dunes with Casuarina equisetifolia and open areas of grass; the shaded polygons represent malesand open polygons represent females. Note that not all home ranges refer to synchronous periods of radio-tracking.
(a) (b)
0 80 160 m
N
Fig. 4. Home range (MCP) of radio-collared C. penicillatus from Site K3. (a) Four radio-collared C. penicillatus radio-tracked during the dryseason. (b) Five radio-collared C. penicillatus radio-tracked during the wet season. The large square represents the trapping grid; the dashed linedenotes a firebreak with areas outside the break burning annually. The shaded polygons represent males and open polygons represent females. Notethat not all home ranges refer to synchronous periods of radio-tracking.
R. S. C. Firth et al.402 Wildlife Research
26 random) (Table 4). The DBH of den trees varied signifi-cantly among sites (H = 13.2, d.f. = 2, P = 0.001), beinggreatest at Site C1 and least at Site C2. The DBH of randomtrees also varied significantly among sites (H = 75.2, d.f. = 2,P < 0.001), with the same order among sites as for den trees(Table 4). The height of random trees varied significantlyamong sites (H = 46.2, d.f. = 2, P < 0.001), but that of dentrees did not (H = 0.9, d.f. = 2, P > 0.1) (Table 4).
At Site C1 den trees had significantly larger DBH thandid random trees (U = 2606, n = 342, P = 0.004) but were sig-nificantly shorter than the random trees (U = 2866, n = 342,P = 0.020) (Table 4). At the other two sites (C2 and K3) dentrees had significantly larger DBH than did random trees(U = 10895, n = 554, P < 0.001; U = 625, n = 180, P = 0.004,respectively), but there were no significant differences inheight (U = 14393, n = 584, P > 0.1; U = 1132, n = 180,P > 0.1, respectively).
Neither den logs nor random logs varied significantly inDMP between sites (U = 35, n = 23, P = 0.1; U = 78, n = 26,P = 0.9, respectively). At both Sites C1 and C2 there were nodifferences in diameter between den logs and random logs
(U = 49, n = 25, P = 0.15; U = 55.5, n = 23, P = 0.8, respec-tively) (Table 4).
Den types
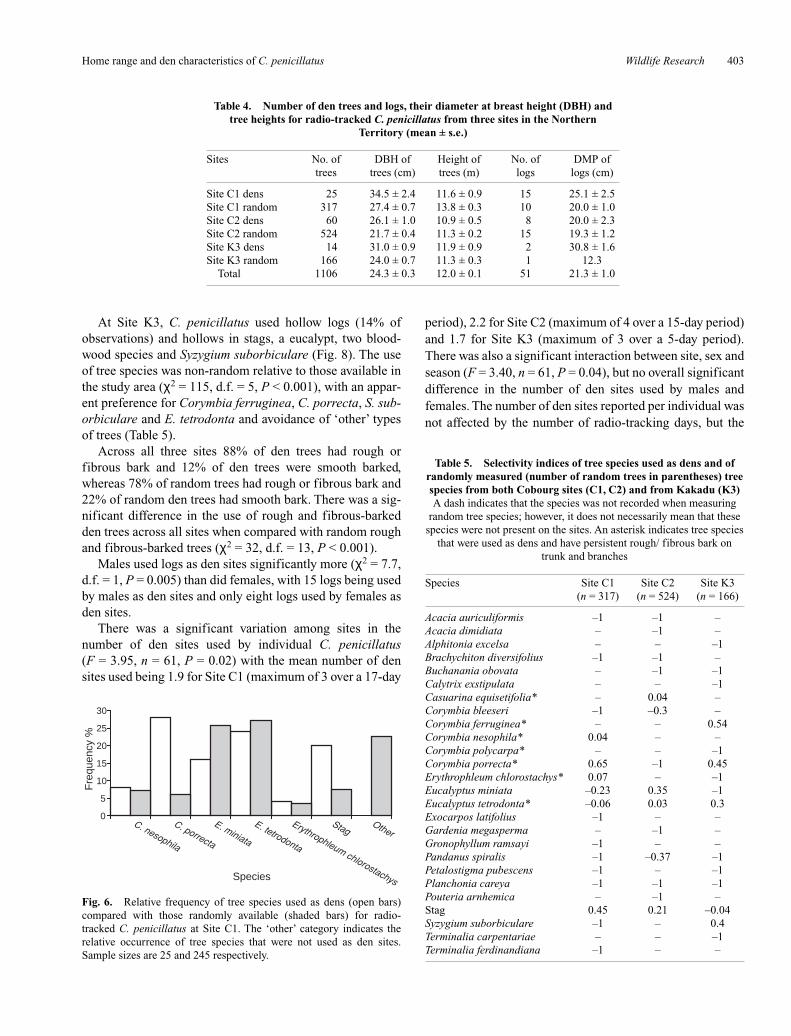
Radio-tracked C. penicillatus from Site C1 denned in fallenlogs (60% of observations) and in hollows in standing deadtrees (stags) and five different living tree species (twoEucalyptus spp., two bloodwoods (Corymbia spp.) andironwood (Erythrophleum chlorostachys)) (Fig. 6). The useof tree species was non-random relative to that available inthe study area (χ2 = 128, d.f. = 6, P < 0.001), with anapparent selection for Corymbia porrecta and stags (seeTable 5).
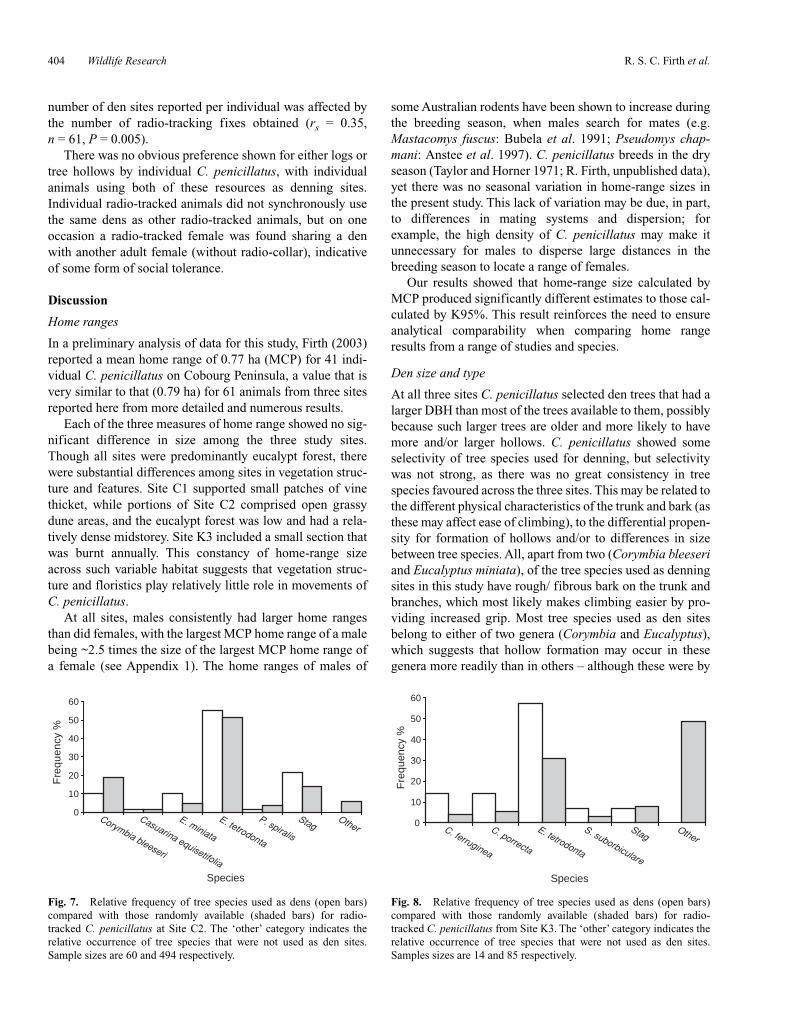
At Site C2, C. penicillatus denned in fallen logs (13% ofobservations) and in hollows in standing dead trees, twoEucalyptus species, one bloodwood (Corymbia sp.), C. equi-setifolia and the screw palm (Pandanus spiralis) (Fig. 7). Theuse of tree species was significantly different from random(χ2 = 21, d.f. = 6, P = 0.001), with relative preference forstags, E. miniata and E. tetrodonta, and relative preferenceagainst Corymbia bleeseri and ‘other’.
0.00
0.20
0.40
0.60
0.80
1.00
1.20
1.40
1.60
10 15 20 25
9265
7597
7514
489
632
9098
616
556
7514
5566
116
5322
6327
6765
7358
Numbers representindividual animals
Number of fixes
MC
P (
ha)
Fig. 5. Mean bootstrapped (1000iterations) MCP home range for 15 radio-tracked C. penicillatus. Of the 15, fivewere from Site C1 (9265 to 632), fivefrom Site C2 (9098 to 5566) and fivefrom Site K3 (116 to 7358).
Table 3. Results of three-way ANOVA for the three measures of home range (n = 61) of C. penicillatus between site, sex and season
Both F and P are shown. Significant values (P < 0.05) are in bold
Source of variance MCP K95% K50% F P F P F P
Site 2.8 0.07 0.85 0.43 1.82 0.17Sex 15.6 0.0002 17.61 0.0001 13.69 0.0005Season 1.03 0.31 1.75 0.19 0.88 0.35Site × sex 0.59 0.55 0.84 0.43 0.09 0.91Site × season 2.39 0.10 0.97 0.38 2.28 0.11Sex × season 0.47 0.49 0.50 0.48 0.65 0.42Site × sex × season 0.30 0.73 0.63 0.53 0.74 0.48
Wildlife Research 403
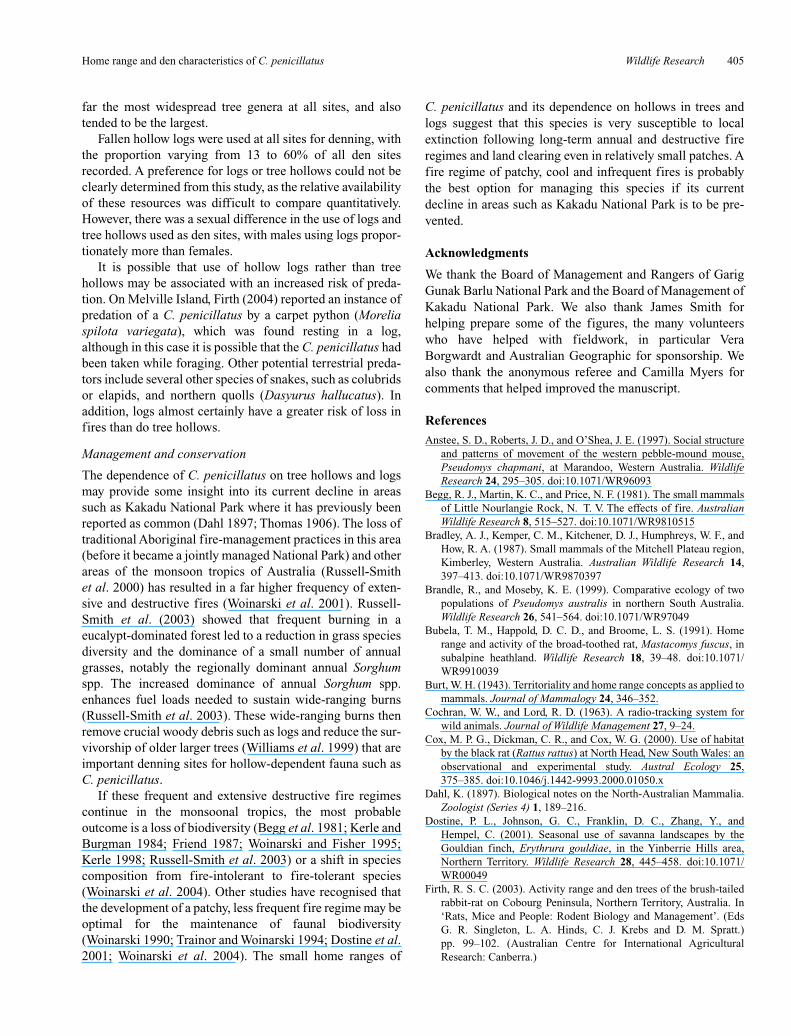
At Site K3, C. penicillatus used hollow logs (14% ofobservations) and hollows in stags, a eucalypt, two blood-wood species and Syzygium suborbiculare (Fig. 8). The useof tree species was non-random relative to those available inthe study area (χ2 = 115, d.f. = 5, P < 0.001), with an appar-ent preference for Corymbia ferruginea, C. porrecta, S. sub-orbiculare and E. tetrodonta and avoidance of ‘other’ typesof trees (Table 5).
Across all three sites 88% of den trees had rough orfibrous bark and 12% of den trees were smooth barked,whereas 78% of random trees had rough or fibrous bark and22% of random den trees had smooth bark. There was a sig-nificant difference in the use of rough and fibrous-barkedden trees across all sites when compared with random roughand fibrous-barked trees (χ2 = 32, d.f. = 13, P < 0.001).
Males used logs as den sites significantly more (χ2 = 7.7,d.f. = 1, P = 0.005) than did females, with 15 logs being usedby males as den sites and only eight logs used by females asden sites.
There was a significant variation among sites in thenumber of den sites used by individual C. penicillatus(F = 3.95, n = 61, P = 0.02) with the mean number of densites used being 1.9 for Site C1 (maximum of 3 over a 17-day
period), 2.2 for Site C2 (maximum of 4 over a 15-day period)and 1.7 for Site K3 (maximum of 3 over a 5-day period).There was also a significant interaction between site, sex andseason (F = 3.40, n = 61, P = 0.04), but no overall significantdifference in the number of den sites used by males andfemales. The number of den sites reported per individual wasnot affected by the number of radio-tracking days, but the
Home range and den characteristics of C. penicillatus
Table 4. Number of den trees and logs, their diameter at breast height (DBH) andtree heights for radio-tracked C. penicillatus from three sites in the Northern
Territory (mean ± s.e.)
Sites No. of DBH of Height of No. of DMP of trees trees (cm) trees (m) logs logs (cm)
Site C1 dens 25 34.5 ± 2.4 11.6 ± 0.9 15 25.1 ± 2.5Site C1 random 317 27.4 ± 0.7 13.8 ± 0.3 10 20.0 ± 1.0Site C2 dens 60 26.1 ± 1.0 10.9 ± 0.5 8 20.0 ± 2.3Site C2 random 524 21.7 ± 0.4 11.3 ± 0.2 15 19.3 ± 1.2Site K3 dens 14 31.0 ± 0.9 11.9 ± 0.9 2 30.8 ± 1.6Site K3 random 166 24.0 ± 0.7 11.3 ± 0.3 1 12.3
Total 1106 24.3 ± 0.3 12.0 ± 0.1 51 21.3 ± 1.0
0
5
10
15
20
25
30
C. nesophila
C. porrecta
E. miniata
E. tetrodonta
Erythrophleum chlorostachys
StagOther
Species
Fre
quen
cy %
Fig. 6. Relative frequency of tree species used as dens (open bars)compared with those randomly available (shaded bars) for radio-tracked C. penicillatus at Site C1. The ‘other’ category indicates therelative occurrence of tree species that were not used as den sites.Sample sizes are 25 and 245 respectively.
Table 5. Selectivity indices of tree species used as dens and ofrandomly measured (number of random trees in parentheses) treespecies from both Cobourg sites (C1, C2) and from Kakadu (K3)A dash indicates that the species was not recorded when measuring
random tree species; however, it does not necessarily mean that thesespecies were not present on the sites. An asterisk indicates tree species
that were used as dens and have persistent rough/ fibrous bark ontrunk and branches
Species Site C1 Site C2 Site K3(n = 317) (n = 524) (n = 166)
Acacia auriculiformis –1 –1 –Acacia dimidiata – –1 –Alphitonia excelsa – – –1Brachychiton diversifolius –1 –1 –Buchanania obovata – –1 –1Calytrix exstipulata – – –1Casuarina equisetifolia* – 0.04 –Corymbia bleeseri –1 –0.3 –Corymbia ferruginea* – – 0.54Corymbia nesophila* 0.04 – –Corymbia polycarpa* – – –1Corymbia porrecta* 0.65 –1 0.45Erythrophleum chlorostachys* 0.07 – –1Eucalyptus miniata –0.23 0.35 –1Eucalyptus tetrodonta* –0.06 0.03 0.3Exocarpos latifolius –1 – –Gardenia megasperma – –1 –Gronophyllum ramsayi –1 – –Pandanus spiralis –1 –0.37 –1Petalostigma pubescens –1 – –1Planchonia careya –1 –1 –1Pouteria arnhemica – –1 –Stag 0.45 0.21 –0.04Syzygium suborbiculare –1 – 0.4Terminalia carpentariae – – –1Terminalia ferdinandiana –1 – –
R. S. C. Firth et al.404 Wildlife Research
number of den sites reported per individual was affected bythe number of radio-tracking fixes obtained (rs = 0.35,n = 61, P = 0.005).
There was no obvious preference shown for either logs ortree hollows by individual C. penicillatus, with individualanimals using both of these resources as denning sites.Individual radio-tracked animals did not synchronously usethe same dens as other radio-tracked animals, but on oneoccasion a radio-tracked female was found sharing a denwith another adult female (without radio-collar), indicativeof some form of social tolerance.
Discussion
Home ranges
In a preliminary analysis of data for this study, Firth (2003)reported a mean home range of 0.77 ha (MCP) for 41 indi-vidual C. penicillatus on Cobourg Peninsula, a value that isvery similar to that (0.79 ha) for 61 animals from three sitesreported here from more detailed and numerous results.
Each of the three measures of home range showed no sig-nificant difference in size among the three study sites.Though all sites were predominantly eucalypt forest, therewere substantial differences among sites in vegetation struc-ture and features. Site C1 supported small patches of vinethicket, while portions of Site C2 comprised open grassydune areas, and the eucalypt forest was low and had a rela-tively dense midstorey. Site K3 included a small section thatwas burnt annually. This constancy of home-range sizeacross such variable habitat suggests that vegetation struc-ture and floristics play relatively little role in movements ofC. penicillatus.
At all sites, males consistently had larger home rangesthan did females, with the largest MCP home range of a malebeing ~2.5 times the size of the largest MCP home range ofa female (see Appendix 1). The home ranges of males of
some Australian rodents have been shown to increase duringthe breeding season, when males search for mates (e.g.Mastacomys fuscus: Bubela et al. 1991; Pseudomys chap-mani: Anstee et al. 1997). C. penicillatus breeds in the dryseason (Taylor and Horner 1971; R. Firth, unpublished data),yet there was no seasonal variation in home-range sizes inthe present study. This lack of variation may be due, in part,to differences in mating systems and dispersion; forexample, the high density of C. penicillatus may make itunnecessary for males to disperse large distances in thebreeding season to locate a range of females.
Our results showed that home-range size calculated byMCP produced significantly different estimates to those cal-culated by K95%. This result reinforces the need to ensureanalytical comparability when comparing home rangeresults from a range of studies and species.
Den size and type
At all three sites C. penicillatus selected den trees that had alarger DBH than most of the trees available to them, possiblybecause such larger trees are older and more likely to havemore and/or larger hollows. C. penicillatus showed someselectivity of tree species used for denning, but selectivitywas not strong, as there was no great consistency in treespecies favoured across the three sites. This may be related tothe different physical characteristics of the trunk and bark (asthese may affect ease of climbing), to the differential propen-sity for formation of hollows and/or to differences in sizebetween tree species. All, apart from two (Corymbia bleeseriand Eucalyptus miniata), of the tree species used as denningsites in this study have rough/ fibrous bark on the trunk andbranches, which most likely makes climbing easier by pro-viding increased grip. Most tree species used as den sitesbelong to either of two genera (Corymbia and Eucalyptus),which suggests that hollow formation may occur in thesegenera more readily than in others – although these were by
0
10
20
30
40
50
60
Corymbia bleeseri
Casuarina equisetifolia
E. miniata
E. tetrodonta
P. spiralis
StagOther
Species
Fre
quen
cy %
Fig. 7. Relative frequency of tree species used as dens (open bars)compared with those randomly available (shaded bars) for radio-tracked C. penicillatus at Site C2. The ‘other’ category indicates therelative occurrence of tree species that were not used as den sites.Sample sizes are 60 and 494 respectively.
0
10
20
30
40
50
60
C. ferruginea
C. porrecta
E. tetrodonta
S. suborbiculare
StagOther
Species
Fre
quen
cy %
Fig. 8. Relative frequency of tree species used as dens (open bars)compared with those randomly available (shaded bars) for radio-tracked C. penicillatus from Site K3. The ‘other’ category indicates therelative occurrence of tree species that were not used as den sites.Samples sizes are 14 and 85 respectively.
Wildlife Research 405
far the most widespread tree genera at all sites, and alsotended to be the largest.
Fallen hollow logs were used at all sites for denning, withthe proportion varying from 13 to 60% of all den sitesrecorded. A preference for logs or tree hollows could not beclearly determined from this study, as the relative availabilityof these resources was difficult to compare quantitatively.However, there was a sexual difference in the use of logs andtree hollows used as den sites, with males using logs propor-tionately more than females.
It is possible that use of hollow logs rather than treehollows may be associated with an increased risk of preda-tion. On Melville Island, Firth (2004) reported an instance ofpredation of a C. penicillatus by a carpet python (Moreliaspilota variegata), which was found resting in a log,although in this case it is possible that the C. penicillatus hadbeen taken while foraging. Other potential terrestrial preda-tors include several other species of snakes, such as colubridsor elapids, and northern quolls (Dasyurus hallucatus). Inaddition, logs almost certainly have a greater risk of loss infires than do tree hollows.
Management and conservation
The dependence of C. penicillatus on tree hollows and logsmay provide some insight into its current decline in areassuch as Kakadu National Park where it has previously beenreported as common (Dahl 1897; Thomas 1906). The loss oftraditional Aboriginal fire-management practices in this area(before it became a jointly managed National Park) and otherareas of the monsoon tropics of Australia (Russell-Smithet al. 2000) has resulted in a far higher frequency of exten-sive and destructive fires (Woinarski et al. 2001). Russell-Smith et al. (2003) showed that frequent burning in aeucalypt-dominated forest led to a reduction in grass speciesdiversity and the dominance of a small number of annualgrasses, notably the regionally dominant annual Sorghumspp. The increased dominance of annual Sorghum spp.enhances fuel loads needed to sustain wide-ranging burns(Russell-Smith et al. 2003). These wide-ranging burns thenremove crucial woody debris such as logs and reduce the sur-vivorship of older larger trees (Williams et al. 1999) that areimportant denning sites for hollow-dependent fauna such asC. penicillatus.
If these frequent and extensive destructive fire regimescontinue in the monsoonal tropics, the most probableoutcome is a loss of biodiversity (Begg et al. 1981; Kerle andBurgman 1984; Friend 1987; Woinarski and Fisher 1995;Kerle 1998; Russell-Smith et al. 2003) or a shift in speciescomposition from fire-intolerant to fire-tolerant species(Woinarski et al. 2004). Other studies have recognised thatthe development of a patchy, less frequent fire regime may beoptimal for the maintenance of faunal biodiversity(Woinarski 1990; Trainor and Woinarski 1994; Dostine et al.2001; Woinarski et al. 2004). The small home ranges of
C. penicillatus and its dependence on hollows in trees andlogs suggest that this species is very susceptible to localextinction following long-term annual and destructive fireregimes and land clearing even in relatively small patches. Afire regime of patchy, cool and infrequent fires is probablythe best option for managing this species if its currentdecline in areas such as Kakadu National Park is to be pre-vented.
Acknowledgments
We thank the Board of Management and Rangers of GarigGunak Barlu National Park and the Board of Management ofKakadu National Park. We also thank James Smith forhelping prepare some of the figures, the many volunteerswho have helped with fieldwork, in particular VeraBorgwardt and Australian Geographic for sponsorship. Wealso thank the anonymous referee and Camilla Myers forcomments that helped improved the manuscript.
References
Anstee, S. D., Roberts, J. D., and O’Shea, J. E. (1997). Social structureand patterns of movement of the western pebble-mound mouse,Pseudomys chapmani, at Marandoo, Western Australia. WildlifeResearch 24, 295–305. doi:10.1071/WR96093
Begg, R. J., Martin, K. C., and Price, N. F. (1981). The small mammalsof Little Nourlangie Rock, N. T. V. The effects of fire. AustralianWildlife Research 8, 515–527. doi:10.1071/WR9810515
Bradley, A. J., Kemper, C. M., Kitchener, D. J., Humphreys, W. F., andHow, R. A. (1987). Small mammals of the Mitchell Plateau region,Kimberley, Western Australia. Australian Wildlife Research 14,397–413. doi:10.1071/WR9870397
Brandle, R., and Moseby, K. E. (1999). Comparative ecology of twopopulations of Pseudomys australis in northern South Australia.Wildlife Research 26, 541–564. doi:10.1071/WR97049
Bubela, T. M., Happold, D. C. D., and Broome, L. S. (1991). Homerange and activity of the broad-toothed rat, Mastacomys fuscus, insubalpine heathland. Wildlife Research 18, 39–48. doi:10.1071/WR9910039
Burt, W. H. (1943). Territoriality and home range concepts as applied tomammals. Journal of Mammalogy 24, 346–352.
Cochran, W. W., and Lord, R. D. (1963). A radio-tracking system forwild animals. Journal of Wildlife Management 27, 9–24.
Cox, M. P. G., Dickman, C. R., and Cox, W. G. (2000). Use of habitatby the black rat (Rattus rattus) at North Head, New South Wales: anobservational and experimental study. Austral Ecology 25,375–385. doi:10.1046/j.1442-9993.2000.01050.x
Dahl, K. (1897). Biological notes on the North-Australian Mammalia.Zoologist (Series 4) 1, 189–216.
Dostine, P. L., Johnson, G. C., Franklin, D. C., Zhang, Y., andHempel, C. (2001). Seasonal use of savanna landscapes by theGouldian finch, Erythrura gouldiae, in the Yinberrie Hills area,Northern Territory. Wildlife Research 28, 445–458. doi:10.1071/WR00049
Firth, R. S. C. (2003). Activity range and den trees of the brush-tailedrabbit-rat on Cobourg Peninsula, Northern Territory, Australia. In‘Rats, Mice and People: Rodent Biology and Management’. (EdsG. R. Singleton, L. A. Hinds, C. J. Krebs and D. M. Spratt.)pp. 99–102. (Australian Centre for International AgriculturalResearch: Canberra.)
Home range and den characteristics of C. penicillatus
R. S. C. Firth et al.406 Wildlife Research
Firth, R. S. C. (2004). Carpet python (Morelia spilota variegata) pre-dation on the brush-tailed rabbit-rat (Conilurus penicillatus meli-bius) on Melville Island, Northern Territory. Herpetofauna 34,105–106.
Firth, R. S. C., Jefferys, E., Woinarski, J. C. Z., and Noske, R. A. (2005).The diet of the brush-tailed rabbit-rat Conilurus penicillatus fromthe monsoonal tropics of the Northern Territory Wildlife Research32, 517–523. doi:10.1071/WR04127
Friend, G. R. (1987). Population ecology of Mesembriomys gouldii(Rodentia: Muridae) in the wet–dry tropics of the NorthernTerritory. Australian Wildlife Research 14, 293–303. doi:10.1071/WR9870293
Friend, G., Kemper, C., and Kerle, A. (1992). Rats of the tree tops.Landscope 8, 10–15.
Frith, H. J., and Calaby, J. H. (1974). Fauna survey of the Port Essingtondistrict, Cobourg Peninsula, Northern Territory of Australia.Technical Paper No. 28. CSIRO Division of Wildlife Research,Canberra.
Griffiths, A. D., Koenig, J., Carrol, F., and Price, O. (2002). Activityarea and day-time tree use of the black-footed tree-ratMesembriomys gouldii. Australian Mammalogy 23, 181–183.
Harris, S., Cresswell, W. J., Forde, P. G., Trewhella, W. J., Woollard, T.,and Wray, S. (1990). Home-range analysis using radio-tracking data– a review of problems and techniques particularly as applied to thestudy of mammals. Mammal Review 20, 97–123.
Hayne, D. W. (1949). Calculation of size of home range. Journal ofMammalogy 30, 1–18.
Hooge, P. N., Solomon, E., and Eichenlaub, B. (2000). ‘AnimalMovement Extension to ArcView.’ (US Geological Survey, AlaskanBiological Science Center: Anchorage.)
Kerle, J. A. (1998). The population dynamics of a tropical possum,Trichosurus vulpecula arhemensis Collett. Wildlife Research 25,171–182. doi:10.1071/WR96113
Kerle, J. A., and Burgman, M. A. (1984). Some aspects of the ecologyof the mammal fauna of the Jabiluka area, Northern Territory.Australian Wildlife Research 11, 207–222. doi:10.1071/WR9840207
Menzies, J. I., and Dennis, E. (1979). ‘Handbook of New GuineaRodents.’ Wau Ecology Institute Handbook No. 6.
Moro, D., and Morris, K. (2000). Movements and refugia of LakelandDowns short-tailed mice, Leggadina lakedownensis, and housemice, Mus domesticus, on Thevenard Island, Western Australia.Wildlife Research 27, 11–20. doi:10.1071/WR99016
Pavey, C. R., Goodship, N., and Geiser, F. (2003). Home range andspatial organisation of a rock-dwelling carnivorous marsupial,Pseudantechinus macdonnellensis. Wildlife Research 30, 135–142.doi:10.1071/WR03005
Powell, R. A. (2000). Animal home ranges and territories and homerange estimators. In ‘Research Techniques In Animal Ecology:Controversies and Consequences’. (Eds L. Boitani and T. K. Fuller.)pp. 65–110. (Columbia University Press: New York.)
Puckey, H., Lewis, M., Hooper, D., and Mitchell, C. (2004). Homerange, movement and habitat utilisation of the Carpentarian rock-rat(Zyzomys palatalis) in an isolated habitat patch. Wildlife Research31, 327–337. doi:10.1071/WR03025
Russell-Smith, J., Allan, G., Thackway, R., Rosling, T., and Smith, R.(2000). Fire management and savanna landscapes in northernAustralia. In ‘Fire and Sustainable Agriculture and ForestryDevelopment in Eastern Indonesia and Northern Australia’. (EdsJ. Russell-Smith, G. Hill, S. Djoeroemana and B. Myers.)pp. 95–101. (Australian Centre for International AgriculturalResearch: Canberra.)
Russell-Smith, J., Whitehead, P. J., Cook, G. D., and Hoare, J. L. (2003).Response of Eucalyptus-dominated savanna to frequent fires:lessons from Munmarlary, 1973–1996. Ecological Monographs 73,349–375.
Seaman, D. E., Millspaugh, J. J., Kernohan, B. J., Brundige, G. C.,Raedeke, K. J., and Gitzen, R. A. (1999). Effects of sample size onkernel home range estimates. Journal of Wildlife Management 63,739-747.
Strahan, R. (1998). ‘The mammals of Australia.’ (Reed New Holland:Sydney.)
Taylor, J. M., and Horner, B. E. (1971). Reproduction in the Australiantree-rat Conilurus penicillatus (Rodentia: Muridae). CSIRO WildlifeResearch 16, 1–9.
Thomas, O. (1906). On a collection of mammals made by Mr J. T.Tunney in Arnhem Land, Northern Territory of South Australia.Novitates Zoologicae 11, 222–229.
Trainor, C. R., and Woinarski, J. C. Z. (1994). Responses of lizards tothree experimental fires in the savanna forests of Kakadu NationalPark. Wildlife Research 21, 131–148. doi:10.1071/WR9940131
White, G. C., and Garrot, R. A. (1990). ‘Analysis of Wildlife Radio-tracking Data.’ (Academic Press: London.)
Williams, R. J., Cook, G. D., Gill, A. M., and Moore, P. H. R. (1999).Fire regime, fire intensity and tree survival in a tropical savanna innorthern Australia. Australian Journal of Ecology 24, 50–59.doi:10.1046/j.1442-9993.1999.00946.x
Woinarski, J. C. Z. (1990). Effects of fire on bird communities of trop-ical woodlands and open forest in northern Australia. AustralianJournal of Ecology 15, 1–22.
Woinarski, J. C. Z. (2000). The conservation status of rodents in themonsoonal tropics of the Northern Territory. Wildlife Research 27,421–435. doi:10.1071/WR97047
Woinarski, J. C. Z., and Fisher, A. (1995). Wildlife of lancewood(Acacia shirleyi) thickets and woodlands in northern Australia. 1.Variation in vertebrate species composition across the environ-mental range occupied by lancewood vegetation in the NorthernTerritory. Wildlife Research 22, 379–411. doi:10.1071/WR9950379
Woinarski, J. C. Z., Palmer, C., Fisher, A., Southgate, R., Masters, P.,and Brennan, K. (1999). Distributional patterning of mammals onthe Wessel and English Company Islands, Arnhem Land, NorthernTerritory, Australia. Australian Journal of Zoology 47, 87–111.doi:10.1071/ZO99004
Woinarski, J. C. Z., Milne, D. J., and Wanganeen, G. (2001). Changes inmammal populations in relatively intact landscapes of KakaduNational Park, Northern Territory, Australia. Austral Ecology 26,360–370. doi:10.1046/j.1442-9993.2001.01121.x
Woinarski, J. C. Z., Risler, J., and Kean, L. (2004). Response of vegeta-tion and vertebrate fauna to 23 years of fire exclusion in a tropicalEucalyptus open forest, Northern Terriotory, Australia. AustralEcology 29, 156–176. doi:10.1111/j.1442-9993.2004.01333.x
Manuscript received 22 June 2005, accepted 19 June 2006
Wildlife Research 407Home range and den characteristics of C. penicillatus
http://www.publish.csiro.au/journals/wr
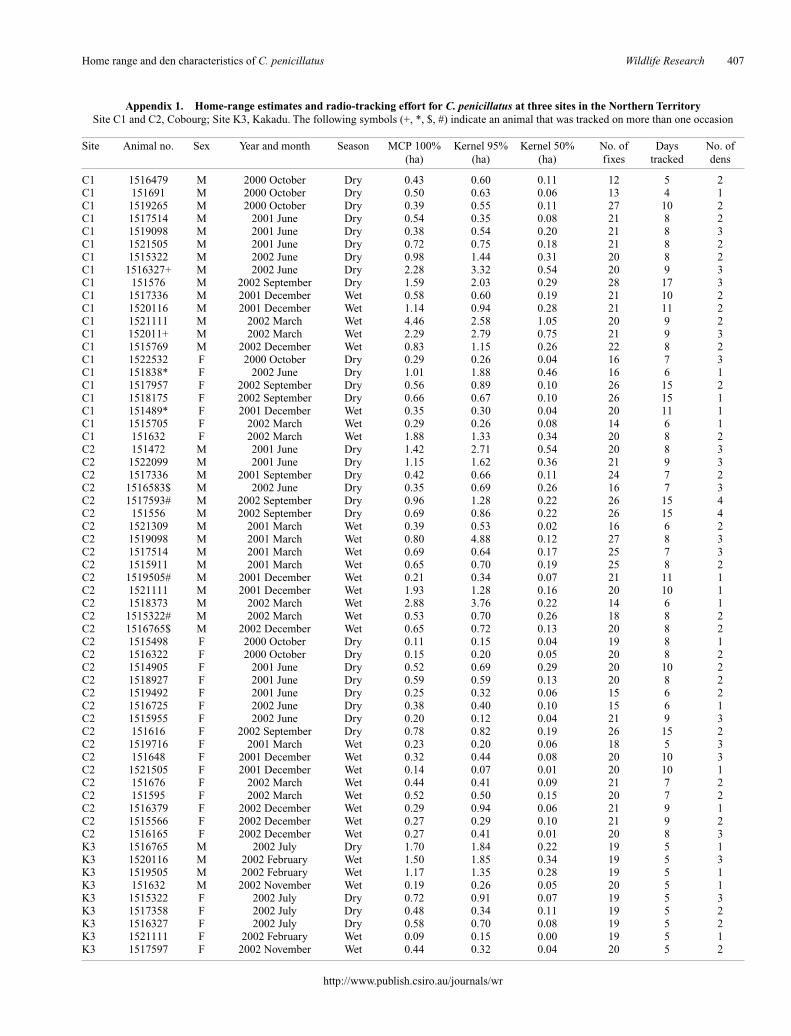
Appendix 1. Home-range estimates and radio-tracking effort for C. penicillatus at three sites in the Northern TerritorySite C1 and C2, Cobourg; Site K3, Kakadu. The following symbols (+, *, $, #) indicate an animal that was tracked on more than one occasion
Site Animal no. Sex Year and month Season MCP 100% Kernel 95% Kernel 50% No. of Days No. of (ha) (ha) (ha) fixes tracked dens
C1 1516479 M 2000 October Dry 0.43 0.60 0.11 12 5 2C1 151691 M 2000 October Dry 0.50 0.63 0.06 13 4 1C1 1519265 M 2000 October Dry 0.39 0.55 0.11 27 10 2C1 1517514 M 2001 June Dry 0.54 0.35 0.08 21 8 2C1 1519098 M 2001 June Dry 0.38 0.54 0.20 21 8 3C1 1521505 M 2001 June Dry 0.72 0.75 0.18 21 8 2C1 1515322 M 2002 June Dry 0.98 1.44 0.31 20 8 2C1 1516327+ M 2002 June Dry 2.28 3.32 0.54 20 9 3C1 151576 M 2002 September Dry 1.59 2.03 0.29 28 17 3C1 1517336 M 2001 December Wet 0.58 0.60 0.19 21 10 2C1 1520116 M 2001 December Wet 1.14 0.94 0.28 21 11 2C1 1521111 M 2002 March Wet 4.46 2.58 1.05 20 9 2C1 152011+ M 2002 March Wet 2.29 2.79 0.75 21 9 3C1 1515769 M 2002 December Wet 0.83 1.15 0.26 22 8 2C1 1522532 F 2000 October Dry 0.29 0.26 0.04 16 7 3C1 151838* F 2002 June Dry 1.01 1.88 0.46 16 6 1C1 1517957 F 2002 September Dry 0.56 0.89 0.10 26 15 2C1 1518175 F 2002 September Dry 0.66 0.67 0.10 26 15 1C1 151489* F 2001 December Wet 0.35 0.30 0.04 20 11 1C1 1515705 F 2002 March Wet 0.29 0.26 0.08 14 6 1C1 151632 F 2002 March Wet 1.88 1.33 0.34 20 8 2C2 151472 M 2001 June Dry 1.42 2.71 0.54 20 8 3C2 1522099 M 2001 June Dry 1.15 1.62 0.36 21 9 3C2 1517336 M 2001 September Dry 0.42 0.66 0.11 24 7 2C2 1516583$ M 2002 June Dry 0.35 0.69 0.26 16 7 3C2 1517593# M 2002 September Dry 0.96 1.28 0.22 26 15 4C2 151556 M 2002 September Dry 0.69 0.86 0.22 26 15 4C2 1521309 M 2001 March Wet 0.39 0.53 0.02 16 6 2C2 1519098 M 2001 March Wet 0.80 4.88 0.12 27 8 3C2 1517514 M 2001 March Wet 0.69 0.64 0.17 25 7 3C2 1515911 M 2001 March Wet 0.65 0.70 0.19 25 8 2C2 1519505# M 2001 December Wet 0.21 0.34 0.07 21 11 1C2 1521111 M 2001 December Wet 1.93 1.28 0.16 20 10 1C2 1518373 M 2002 March Wet 2.88 3.76 0.22 14 6 1C2 1515322# M 2002 March Wet 0.53 0.70 0.26 18 8 2C2 1516765$ M 2002 December Wet 0.65 0.72 0.13 20 8 2C2 1515498 F 2000 October Dry 0.11 0.15 0.04 19 8 1C2 1516322 F 2000 October Dry 0.15 0.20 0.05 20 8 2C2 1514905 F 2001 June Dry 0.52 0.69 0.29 20 10 2C2 1518927 F 2001 June Dry 0.59 0.59 0.13 20 8 2C2 1519492 F 2001 June Dry 0.25 0.32 0.06 15 6 2C2 1516725 F 2002 June Dry 0.38 0.40 0.10 15 6 1C2 1515955 F 2002 June Dry 0.20 0.12 0.04 21 9 3C2 151616 F 2002 September Dry 0.78 0.82 0.19 26 15 2C2 1519716 F 2001 March Wet 0.23 0.20 0.06 18 5 3C2 151648 F 2001 December Wet 0.32 0.44 0.08 20 10 3C2 1521505 F 2001 December Wet 0.14 0.07 0.01 20 10 1C2 151676 F 2002 March Wet 0.44 0.41 0.09 21 7 2C2 151595 F 2002 March Wet 0.52 0.50 0.15 20 7 2C2 1516379 F 2002 December Wet 0.29 0.94 0.06 21 9 1C2 1515566 F 2002 December Wet 0.27 0.29 0.10 21 9 2C2 1516165 F 2002 December Wet 0.27 0.41 0.01 20 8 3K3 1516765 M 2002 July Dry 1.70 1.84 0.22 19 5 1K3 1520116 M 2002 February Wet 1.50 1.85 0.34 19 5 3K3 1519505 M 2002 February Wet 1.17 1.35 0.28 19 5 1K3 151632 M 2002 November Wet 0.19 0.26 0.05 20 5 1K3 1515322 F 2002 July Dry 0.72 0.91 0.07 19 5 3K3 1517358 F 2002 July Dry 0.48 0.34 0.11 19 5 2K3 1516327 F 2002 July Dry 0.58 0.70 0.08 19 5 2K3 1521111 F 2002 February Wet 0.09 0.15 0.00 19 5 1K3 1517597 F 2002 November Wet 0.44 0.32 0.04 20 5 2