Ecological management and sustainable development in the humid tropics of Costa Rica

Renewable Energy 28 (2003) 1755–1778www.elsevier.com/locate/renene
A ventilated courtyard as a passive coolingstrategy in the warm humid tropics
I. Rajapakshaa,∗, H. Nagaib, M. Okumiyac
a Department of Architecture, Graduate School of Engineering, Nagoya University, Furou-cho,Chikusa-Ku, Nagoya 464-8603, Japan
b Division of Environmental Engineering and Architecture, Graduate School of Environmental Studies,Nagoya University, Furou-cho, Chikusa-Ku, Nagoya 464-8603, Japan
c Center for Integrated Research in Science and Engineering, Nagoya University, Furou-cho, Chikusa-Ku, Nagoya 464-8603,Japan
Received 1 February 2002; accepted 27 December 2002
Abstract
The paper investigates the potential of a courtyard for passive cooling in a single storeyhigh mass building in a warm humid climate. The inclusion of an internal courtyard in buildingdesign is attributed to the optimization of natural ventilation in order to minimize indooroverheating conditions. However, the efficiency of this strategy greatly depends on the designdetails of the building composition in providing appropriate airflow pattern to the courtyard.From the results of thermal measurements, a significant correlation between wall surface tem-peratures and indoor air temperatures is evident. A reduction of indoor air temperature belowthe levels of ambient is seen as a function of heat exchange between the indoor air and highthermal mass of the building fabric. However, this behavior is affected by indoor airflowpatterns, which are controlled through the composition between envelope openings and thecourtyard of the building.
From a computational analysis, several airflow patterns are identified. A relatively betterindoor thermal modification is seen when the courtyard acts as an air funnel discharging indoorair into the sky, than the courtyard acts as a suction zone inducing air from its sky opening.The earlier pattern is promoted when the courtyard is ventilated through openings found inthe building envelope. The computational simulation utilizing the standard k-� turbulent modelwith isothermal condition agrees closely with the measurements taken from the field investi-gation. 2003 Elsevier Science Ltd. All rights reserved.
∗ Corresponding author. Fax:+81-617-3219-6629.E-mail addresses: [email protected] (I. Rajapaksha); [email protected] (I.
Rajapaksha).
0960-1481/03/$ - see front matter 2003 Elsevier Science Ltd. All rights reserved.doi:10.1016/S0960-1481(03)00012-0

1756 I. Rajapaksha et al. / Renewable Energy 28 (2003) 1755–1778
Keywords: Airflow pattern; Opening composition; Passive cooling; Tropical courtyard; Warm humidclimate
1. Introduction
The concerns over global warming and the need for reduction of high emissionsof greenhouse gases demand the utilization of passive strategies for indoor climatemodification in promoting comfortable indoor environments. In such systems, theenergy required for indoor climate modification is obtained from natural renewablesources but limitations for its applicability arrive through the prevailing climate [1].
In warm humid tropics, overheated building interiors are common due to solarpenetration through the buildings envelope and windows. Under these conditions,and with the presence of high levels of relative humidity, the utilization of naturalventilation is recommended as a suitable cooling option for the prevention ofoverheating and indoor climate modification. Thus, design strategies to optimizenatural ventilation and maximize its effect with the thermal mass in reducing themaximum of indoor temperature in buildings is of great importance.
In high-mass buildings with windows open and in the shade all day, the indoordaytime temperature is consistently below that of outdoors [2]. Given the propertiesof thermal mass of the building fabric with effectively shaded windows, the airflowpattern to and within the building has an impact on indoor air temperature reduction.Effectiveness of this process is dependent on the optimum exposure of the buildingto the air movement that can enhance a greater surface–air contact [3]. Thus, dealing
Nomenclature
Uin(z) mean wind speed at height zA constant for log lawUh mean wind speed at reference height hUt shear velocityz height above ground leveln kinematic viscosityh reference height� Karman’s constant (0.4)a exponent characteristic of terrain roughnessr densityCm constant for two equation turbulent modelL Length scale� rate of dissipation of turbulence energyy distance from the wall to the first cell of the gridk kinetic energy of turbulence

1757I. Rajapaksha et al. / Renewable Energy 28 (2003) 1755–1778
with wind driven ventilation behavior and its effects on indoor air temperaturebecomes important in such climates. This study aims to illustrate a passive coolingapproach that has been used to exploit the optimum use of wind-driven natural venti-lation in preventing indoor overheating conditions and lowering maximum indoortemperature below the ambient level. The illustration is focused on a particular build-ing type that has an internal courtyard by investigating the performance and effective-ness of design strategies used in a single-storey high mass courtyard house found ina suburb of Colombo, Sri Lanka.
The study investigates the effects of the airflow pattern to the courtyard on theexposure of the building interior to the air movement in enhancing optimum surface–air contact and thus indoor climate modification. The goal is to provide some guide-lines for manipulating courtyard-building compositions to improve indoor air move-ment and lower the maximum indoor air temperatures in warm humid climates.
The monitoring of thermal behavior within the case study building utilized fivedifferent boundary configurations (shown in Table 1). The monitoring was conductedon site from the 12 April to 3 May 2001. Boundary configurations of the buildingwere changed through closing and opening the major airflow access points foundwithin the building envelope. Each boundary configuration (opening composition)showed different levels of indoor air temperature modifications and indoor airflowrates. This paper discusses the results of the thermal performance of the building. Itwas investigated using two identified different boundary configurations that resultedin minimum and maximum indoor air temperature modifications and correspondingairflow rates out of five boundary configurations as mentioned above. Later, theairflow patterns and airflow rates were simulated using computational analysis (CFD)
Table 1Different boundary configurations and corresponding values
Opening composition Air temp modification (�T)
Courtyard Interior zone
Day Night day
Courtyard (case 1) 0.34 �1.38 0.42Op1,2 and Cy (case 2) 1.04 �0.92 1.4Op3,4 and Cy (case 3) 0.68 �1.18 0.52Op1,2,3 and Cy (case 4) 0.96 �0.91 1.5Op1,2,3,4 and Cy (case 5) 0.74 �1.6 0.62
�T � indoor air temperature modification�T � To�Ti
To, daytime mean outdoor ; Ti, daytime mean indoor temperatureTi courtyard � daytime mean of Tcy1
Ti interior zones � daytime mean of 1/9 �9
i=1
(Ta1,Ta2,Tb,Tc,Td,Te1,Te2,Tf1,Tf2, refer Fig. 4A)
(1)

1758 I. Rajapaksha et al. / Renewable Energy 28 (2003) 1755–1778
and simulated airflow rates were compared with the calculated values obtained fromfield investigations.
2. Ambient climate
The building investigated in this study is built within a suburb located 20 km fromColombo, Sri Lanka (then Ceylon), at 6.5 N latitude and about 15 m above sea level.The ambient climate is characterized by high temperatures and relatively high levelsof humidity. The mean monthly temperatures range from 27.2 °C in November to30.3 °C in April; relative humidity varies from 70–80% during a typical year.
While seasonal variations through temperature do not exist, there are two recogniz-able seasons due to wind and rainfall. The northeast monsoon occurs from June toAugust and southwest monsoon occurs from December to February. The remaininginter-monsoon represents the dry season while heavy rainfall is observed in monsoonperiods. Clear and fine weather with tropical thunderstorms brings slight daytimewind and rain in the late afternoons. Also, the daily pattern of the dry season hasdiurnal temperature ranges of 7–8 °C.
3. Comfort temperature and required design strategies
3.1. Ambient climatic conditions in relation to Givoni’s bioclimatic chart forColombo
Fig. 1 shows Givoni’s bio-climatic chart for Colombo. The chart represents thetypical mean daily maximum and mean daily minimum values of relative humidity
Fig. 1. Givoni’s building bio-climatic chart applied to Colombo, Sri-Lanka.
1759I. Rajapaksha et al. / Renewable Energy 28 (2003) 1755–1778
and temperature for different months of the year, 2001. To extend the comfort zonefor higher humidity and higher temperatures, higher air velocities are required. Thisis quiet extensive given the relative humidity around 70–80%.
3.2. Neutrality temperatures in relation to dry bulb temperatures for a typicalyear (2001)
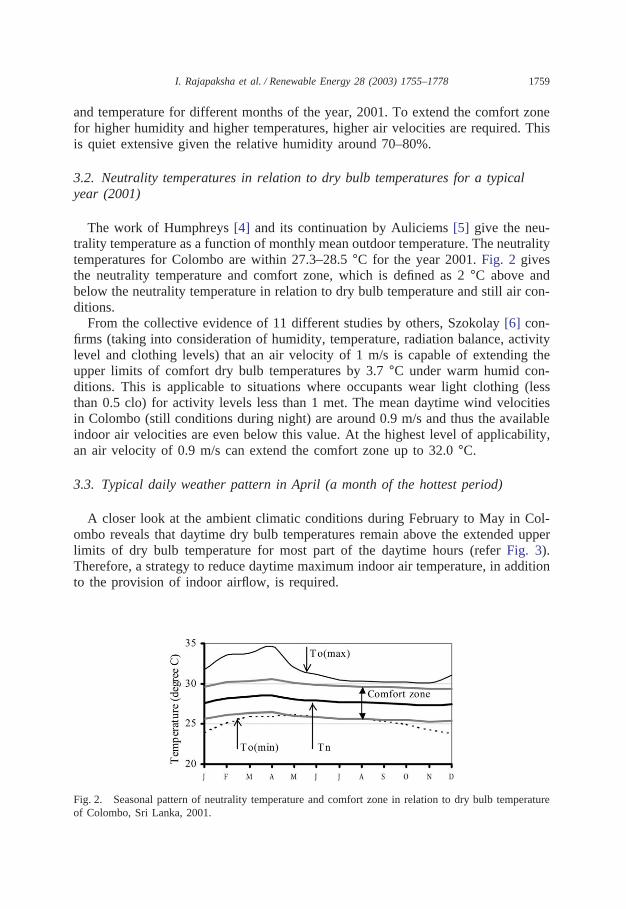
The work of Humphreys [4] and its continuation by Auliciems [5] give the neu-trality temperature as a function of monthly mean outdoor temperature. The neutralitytemperatures for Colombo are within 27.3–28.5 °C for the year 2001. Fig. 2 givesthe neutrality temperature and comfort zone, which is defined as 2 °C above andbelow the neutrality temperature in relation to dry bulb temperature and still air con-ditions.
From the collective evidence of 11 different studies by others, Szokolay [6] con-firms (taking into consideration of humidity, temperature, radiation balance, activitylevel and clothing levels) that an air velocity of 1 m/s is capable of extending theupper limits of comfort dry bulb temperatures by 3.7 °C under warm humid con-ditions. This is applicable to situations where occupants wear light clothing (lessthan 0.5 clo) for activity levels less than 1 met. The mean daytime wind velocitiesin Colombo (still conditions during night) are around 0.9 m/s and thus the availableindoor air velocities are even below this value. At the highest level of applicability,an air velocity of 0.9 m/s can extend the comfort zone up to 32.0 °C.
3.3. Typical daily weather pattern in April (a month of the hottest period)
A closer look at the ambient climatic conditions during February to May in Col-ombo reveals that daytime dry bulb temperatures remain above the extended upperlimits of dry bulb temperature for most part of the daytime hours (refer Fig. 3).Therefore, a strategy to reduce daytime maximum indoor air temperature, in additionto the provision of indoor airflow, is required.
Fig. 2. Seasonal pattern of neutrality temperature and comfort zone in relation to dry bulb temperatureof Colombo, Sri Lanka, 2001.

1760 I. Rajapaksha et al. / Renewable Energy 28 (2003) 1755–1778
Fig. 3. Daily pattern of dry bulb temperature and relative humidity of Colombo, Sri Lanka (during thevery hot month of April).
4. Field investigation
4.1. The investigated building
The case study building presented in this study employs a number of passivedesign strategies to modify the warm ambient climate in order to minimize thermaldiscomfort from overheating conditions. The inclusion of a courtyard, high massbuilding fabric, high timber ceilings and wide roof eaves are of significant impor-tance.
The 230m2 rectangular ‘building form’ that is designed for a single family accom-modates a central rectangular courtyard measuring 3.7 and 8.1 m as the main designstrategy. The use of an internal central courtyard is a dominating feature in traditionalbuildings found in Sri Lanka. The courtyard occupies approximately one tenth ofthe building’s footprint, is bounded by a living area to the west and bedrooms tothe east. It can be visually opened to the outdoor environment through two axespassages, which are perpendicular to each other.
By locating the rectangular courtyard at the center, the plan depth of the surround-ing indoor spaces is minimized for better cross ventilation potential. With four majoropenings (Op1, Op2, Op3 and Op4 shown in Fig. 4A and Fig. 5) placed in theenvelope, the courtyard maintains direct contacts with the external environment. Thisenhances cross ventilation to the building and thus the exposure of high mass brickwalls to the incoming air movement. Opening 1, which is located at the north endof the longitudinal axis, acts as the main entrance to the house.
The louvered door measuring 4.3 m2 at this opening can promote slight ventilationeven if the door is closed during the night. The other opening on the south end ofthe longitudinal axis is a large vertical grill measuring 3.6 m2 (opening 2), whichpromotes permanent ventilation during the day. In addition, openings 3 and 4 (eachmeasuring 3.6 m2) are located on the east and west ends of the cross axis. One thirdof the courtyard floor is covered with water. Though there are other openings on thebuilding envelope (doors and windows), they remained closed during the study per-iod. The courtyard dominates within the building section and is the tallest space

1761I. Rajapaksha et al. / Renewable Energy 28 (2003) 1755–1778
Fig. 4. The enclosed courtyard house and measurement points in the field investigation.
Fig. 5. 3D form of the building showing opening composition.
within it (Fig. 4B). Having introduced openings at relatively lower levels within theenvelope, the potential for airflow due to stack effect during the night is encouraged.The high-mass brick building has high internal walls with low external walls (22-cm thickness including cement and lime plaster) to the east and west. Through thisdesign, east and west orientations are provided with shaded verandahs. Wide roofeaves on all four sides protect all the windows and doors (openings) from solarradiation throughout the day. The floor of the building is finished with clay terracottatiles while the roof is covered with half round clay tiles (Thermal Conductivity:8.6 × 10�5 Wcm�1 C�1, Absorptivity: 0.65–0.74, [7]) with a timber ceiling under-neath. Insulation is not found throughout the building.

1762 I. Rajapaksha et al. / Renewable Energy 28 (2003) 1755–1778
4.2. Experimental setup
4.2.1. Surrounding environmentThe building is located on a large plot of land with tall trees. The immediate
surroundings of the building have not been affected by any other building. Uneventerrain conditions with canopies of tall trees create a 0.25 terrain roughness similarto that of a typical semi-urban type condition.
4.3. Boundary configurations (opening composition)
The courtyard building was monitored for 10 days from 12 April to 3 May 2001with five different boundary configurations with regard to composition of majoropenings found within the building’s envelope (shown in Table 1). Each boundaryconfiguration was investigated for two different days. However, this paper aims topresent the thermal performance of the building under the two of most significantboundary configurations that demonstrated the worst and the best indoor climatemodification.
The rest of the boundary configurations also exhibited different levels of climatemodifications, but varied within the results of the two most significant casespresented in this paper. The two cases that are presented in this paper are referredto as case 1 and case 2. Case 1 was conducted on the 22 April and case 2 on the18 April 2001.
In case 1 during the daytime, openings in the external envelope were kept closedand the building was allowed to ventilate only from the courtyard top. In case 2,the openings found at the end of longitudinal axis were kept open allowing daytimeventilation through opening 1 and 2 in addition to the courtyard’s top.
During nighttime in both cases, opening composition remained similar with open-ing 2 and courtyard’s top open, while opening 1 was closed.
4.4. Data collection
Under each boundary configuration air temperature and humidity measurementswere taken at 5-min intervals using sensors, which recorded day and night (daytime9:00 to 18:00, nighttime 18:00 to 9:00). Indoor wind velocities were taken at 1-ssampling time and 1 min intervals using hot wire anemometers. Wall temperatureswere measured at 5-min intervals day and night using 0.5 mm copper constant ther-mocouples glued to the wall surfaces and covered with paper tapes.
Meteorological conditions were recorded at a weather station built on the siteusing temperature and humidity sensors with recorders protected with 12 plate radi-ation shields, cup anemometer and a vane with a data logger. Measurements werelater averaged for hourly values.
4.5. Instrumentation
Tabai Espec data logger with RS 10/11 sensors were used for air temperature andrelative humidity measurements. The accuracy for temperature measurements was
1763I. Rajapaksha et al. / Renewable Energy 28 (2003) 1755–1778
stated as ±0.3 °C from 5–45 °C and ±3% over 10–90% relative humidity. Further,sensors were shielded against direct and reflected solar radiation from surroundingsurfaces using Campbell Scientific Gill 41004, multi plate (12 plates) radiation shi-elds.
Kanomax model 6511 Hot-wire anemometers were used for indoor air velocitymeasurements. These were sensitive to air velocities down to 0.05 m/s. CampbellScientific 03001 cup anemometer and wind vane (Young’s wind sentry wind set)coupled with CR 21X data logger was used for outdoor wind speed and directionmeasurements. The outdoor cup anemometers were initially calibrated in the windtunnel using hot-wire anemometer probes. High correlation (r = 0.99) was observed.Eto denki EF 5020A Thermodac data logger with type-T thermocouples (with anaccuracy of ±0.2 °C over 0–50 °C range) was used for wall surface temperatures.All equipments were recommended with research-grade accuracy.
4.6. Measurement locations
Measurements were recorded in the courtyard and selected indoor spaces. Airtemperature, relative humidity and wind velocities were measured at 1.1 m(Tcy1),2.5 m(Tcy2) and 3.5 m(Tcy3) heights at the center of the courtyard (refer Fig. 4B).Indoor spaces were measured for air temperature and humidity at human body level:1.1 m from the floor level (Fig. 4A).
Wall temperatures were measured at the center of the main exterior surfaces ofthe building (W6 �W10) and the five interior wall surfaces that surround the court-yard (W3, W4), longitudinal axis (W1, W2) and the family living (W5) at 1.1 m fromthe ground (refer Fig. 4A).
Wind velocity measurements were recorded at 0.6 m(V1), 1.2 m(V2) and 1.8 m(V3)heights at each exterior opening of the longitudinal axis (Op.1 and 2, refer Fig. 4C).
The weather station installed on the site recorded climatic conditions at three lev-els: 1.1, 5.5 and 10 m ensuring freeness from wind shadows due to built or naturalstructures (refer Fig. 14A).
4.7. Criteria for the assessment of data
The assessment of measurements is mainly concerned with the effectiveness ofthe courtyard in lowering the air temperatures of its own and surrounding indoorspaces below the level of daytime ambient temperature.
4.8. Ambient site climate
The ambient weather pattern was observed as similar throughout the study periodand even several days before the study. The maximum ambient temperature of 32.8°C was recorded between 13:00–15:00 h, while the minimum temperature of 25.5°C was recorded in the morning at 4:00–7:00 h. Daytime humidity remained between60–70% with nighttime humidity at 99%.
Prevailing winds were from the southwest during the daytime and from the nor-

1764 I. Rajapaksha et al. / Renewable Energy 28 (2003) 1755–1778
theast and east at nighttime. Mean daytime wind speeds were of 1.2 and 1.5 m/s at5 and 10 m heights, respectively, with almost still wind conditions (or 0.2 m/s)at night.
5. Results and discussion of thermal investigation
Table 1 shows the average values of the modified measured air temperatures inthe courtyard and interior zones. The mean daytime modification of all interior zonesis presented as a single value. A positive value represents a reduction of air tempera-ture below the ambient level while a negative value represents an overheated con-dition.
In each case, the results indicate a variation of air temperature modification in thecourtyard as well as in the interior zones. The difference is not correlated with theuniformity of the ambient weather condition. Therefore, the best performance resultsfrom case 2, and the worst performance results from case 1 with regard to coolingare assessed in the following discussion.
5.1. Courtyard air temperature
The hourly air temperatures (TCy1) at the body level within the courtyard weremonitored and compared with the ambient values. Fig. 6 shows the air temperaturepatterns within the courtyard for the two different boundary configurations togetherwith ambient temperature patterns.
Temperature pattern within the courtyard has followed the ambient pattern. Areduction of courtyard air temperature below the ambient level is observed in bothcases 1 and 2 as expected in high-mass night ventilated buildings, yet, a clear vari-ation in the values and pattern in case 1 and 2 was seen.
The maximum courtyard air temperature of 32 °C was recorded with the maximumambient temperature of 32.7 °C at the same time by 14:00 h in case 1. The modifi-cation of air temperature is only 0.7 °C. During case 2, courtyard maximum air
Fig. 6. Ambient temperatures and courtyard air temperatures (Tcy1) at 1.1 m in case 1 and case 2.Daytime maximum temperature in case 2 is lower by 2 °C and seen 2 h later the maximum ambientrecorded.

1765I. Rajapaksha et al. / Renewable Energy 28 (2003) 1755–1778
temperature decreased 2 °C below the ambient maximum by 15:00 h, 2 h later thanthe ambient maximum was recorded.
These results indicate a clear reduction of courtyard air temperatures during thedaytime in case 2.
The time lag between ambient and courtyard maximum values indicates an effectof exposure of high mass brick walls to the airflow. The ambient weather conditions(air temperature, wind direction, wind velocity, humidity and rainfall) remained simi-lar in both cases. These results indicate that a relatively greater reduction of airtemperatures in case 2 correlate with the daytime indoor ventilation pattern (the onlydifference in these two cases).
In Case 1 during the early nighttime, courtyard temperatures remained 0.5–2.0 °Cabove the ambient levels. The nighttime temperature difference in case 2 is only0.5–1.0 °C. These results indicate that maximum nighttime temperature in case 2 islower by 0.8 °C than in case1 at 19:00 h. In both cases, the early daytime courtyardtemperatures closely followed the ambient between 8:00 and 9:00 h.
5.2. Vertical temperature profile
Fig. 7 shows the vertical temperature profile in the courtyard for case 1 and 2.Results indicate a similar pattern of stratification during day and night in both cases.Nevertheless, maximum daytime temperature (33.4 °C) at the top level in the court-yard increased above the ambient in case 1, while the maximum temperature at thetop-level remained below the maximum ambient in case 2.
Also, the differences representing lowering of air temperatures (below the ambient)at the bottom and middle levels in the courtyard are greater in case 2 than in case1. A density difference due to air temperature is essential for stack effect to takeplace. Results obtained for vertical thermal stratification indicate that temperaturesin the courtyard are below the temperature levels at the major openings found in theexternal envelope during daytime. Thus, the density levels at the openings (1 and
Fig. 7. Vertical temperature profile in the courtyard in case 1 and case 2. Thermal stratification is shownin both case 1 and 2. Maximum temperature at the top level is higher than the maximum ambient in case1. Relatively lower levels of air temperatures recorded in the courtyard in case 2.

1766 I. Rajapaksha et al. / Renewable Energy 28 (2003) 1755–1778
2) are lower than the courtyard preventing the potential for stack effect during thedaytime.
Vertical temperature profile indicates a heat gain from the courtyard’s top in case1 and 2. However, relatively lower levels of air temperatures at bottom, middle andthe top levels in case 2 indicate that the effect of heat gain from the top opening ismoderated due to the potential of upwind forced ventilation in the case 2, as com-pared to case 1 (refer Section 8 for the airflow pattern).
5.3. Wall surface temperature
The hourly internal wall surface temperatures in the three main areas (area nextto opening 1, courtyard and family living on the west) were compared against eachother and the external wall surface temperatures (north-W7, south-W10, east-W8 andW9, and west-W6 walls) at the human body level.
All internal walls in each area were monitored and later averaged for a meanvalue. Fig. 8, shows that mean surface temperatures of the courtyard walls (W3 andW4) and the axis walls (W1 and W2) remained above against each other dependingon the airflow pattern. The mean surface temperatures in the living area remainedconstant with the airflow patterns.
External surface temperatures remained constant on both days while daytimeinternal wall surface temperatures (W5) decreased by 1 to 3.4 °C well below theexternal values. Nevertheless, relatively higher surface temperatures (W3 and W4) inthe courtyard in case 1 indicate heat absorption and thus the availability of incomingoutdoor air from the courtyard. On the other hand, higher surface temperatures inthe axis walls in case 2 exhibit heat absorption, and thus the availability of incomingair through the axis.
In case 1, the maximum value of 29.8 °C in the courtyard was recorded at 14:00h without showing a time lag with the mean maximum of the external walls. Contraryto this behavior, in case 2, a time lag for the courtyard surface temperature was seen.The maximum courtyard surface temperature of 28.8 °C was below the value
Fig. 8. Wall surface temperatures of three main areas (courtyard, axis and adjoining living) at bodylevel.
1767I. Rajapaksha et al. / Renewable Energy 28 (2003) 1755–1778
recorded in case 1 by 1 °C, and recorded at 18:00 h with a time lag of 4 h. Suchresults indicate a better interaction between high mass and airflow in case 2 in lower-ing the courtyard’s surface temperatures.
5.4. Indoor air temperatures and thermal comfort
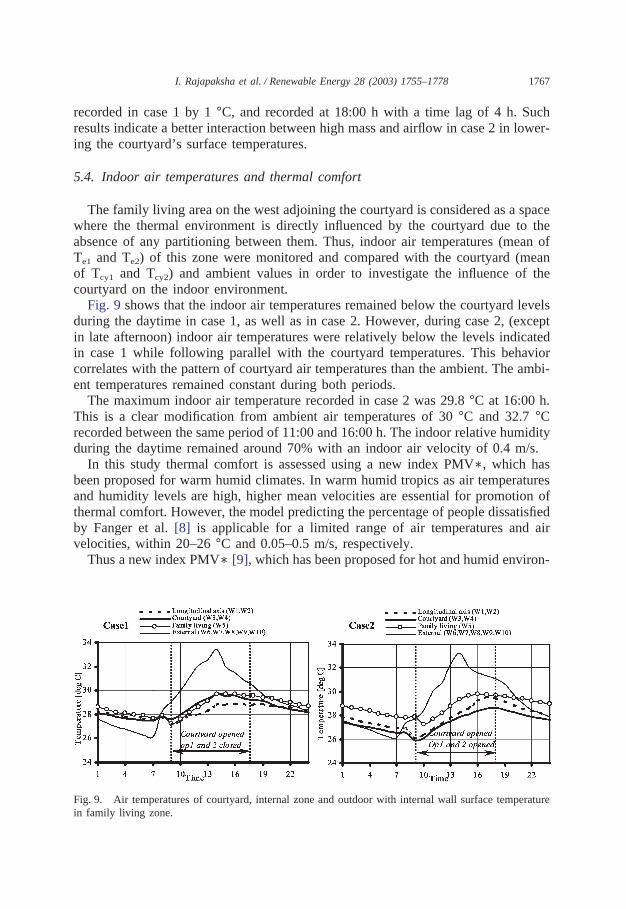
The family living area on the west adjoining the courtyard is considered as a spacewhere the thermal environment is directly influenced by the courtyard due to theabsence of any partitioning between them. Thus, indoor air temperatures (mean ofTe1 and Te2) of this zone were monitored and compared with the courtyard (meanof Tcy1 and Tcy2) and ambient values in order to investigate the influence of thecourtyard on the indoor environment.
Fig. 9 shows that the indoor air temperatures remained below the courtyard levelsduring the daytime in case 1, as well as in case 2. However, during case 2, (exceptin late afternoon) indoor air temperatures were relatively below the levels indicatedin case 1 while following parallel with the courtyard temperatures. This behaviorcorrelates with the pattern of courtyard air temperatures than the ambient. The ambi-ent temperatures remained constant during both periods.
The maximum indoor air temperature recorded in case 2 was 29.8 °C at 16:00 h.This is a clear modification from ambient air temperatures of 30 °C and 32.7 °Crecorded between the same period of 11:00 and 16:00 h. The indoor relative humidityduring the daytime remained around 70% with an indoor air velocity of 0.4 m/s.
In this study thermal comfort is assessed using a new index PMV∗, which hasbeen proposed for warm humid climates. In warm humid tropics as air temperaturesand humidity levels are high, higher mean velocities are essential for promotion ofthermal comfort. However, the model predicting the percentage of people dissatisfiedby Fanger et al. [8] is applicable for a limited range of air temperatures and airvelocities, within 20–26 °C and 0.05–0.5 m/s, respectively.
Thus a new index PMV∗ [9], which has been proposed for hot and humid environ-
Fig. 9. Air temperatures of courtyard, internal zone and outdoor with internal wall surface temperaturein family living zone.

1768 I. Rajapaksha et al. / Renewable Energy 28 (2003) 1755–1778
ment, replacing the operating temperature (To) of Fanger’s comfort equation withstandard effective temperature (SET∗) is used in the assessment of thermal comfort.
Activity levels are taken as 1.1 met (Fig. 16) (55 W/m2 for sedentary activity),with tropical clothing of 0.4 clo. Mean radiant wall surfaces and indoor air velocity athuman body height of the family living area was considered as parameters of PMV∗.
Case 1 with a PMV∗ vote of 2.2 was found as having the worst thermal conditionswith warm unpleasant indoor environment throughout the daytime. Contrary, the bestthermal conditions with comfortable (PMV∗ vote of 0.2) indoor environment werefound in case 2. More details are published elsewhere [10]. However, the real prob-lem occurs when the relative humidity moves to higher levels during the earlynighttime where indoor air temperatures remain around 28–29 °C. This necessitatesthe need for a slight breeze during night for comfort.
5.5. Airflow due to stack effect at night
Typical ambient weather data for Colombo indicates almost still wind conditionsduring the night. Within this context, areas between the courtyard and axis openings(1 and 2) were monitored for air movement. These measurements indicate the avail-ability of ventilation between 0.2–0.4 m/s in areas close to the openings during nighthours in case 2, where the building was allowed to ventilate through the envelopeopening in addition to the courtyard. Air movement during the night was notobserved in case 1.
Fig. 10 presents the average air temperatures in the courtyard and areas close toopenings 1 and 2 in the envelope. A variation of pressure distribution due to tempera-ture difference of more than 1 °C is visible during the nighttime in case 2. Relativelylower temperatures at the openings can enhance a slight breeze due to stack effectonly in the night. This is evident with indoor air velocities recorded against almoststill ambient wind conditions in the nighttime in case 2 (Fig. 11). The benefit ofsuch airflow is important for thermal comfort in the early night hours along withrelatively higher levels of humidity. It was also found that such differences of tem-peratures needed to activate stack airflow are not visible when the building is venti-lated from the courtyard only. The indoor areas show an overheated condition minim-
Fig. 10. Air temperatures in the courtyard and at openings 1 and 2.

1769I. Rajapaksha et al. / Renewable Energy 28 (2003) 1755–1778
Fig. 11. Air velocities at openings 1 and 2 compared with ambient and courtyard at body level in case1 and case 2.
izing the temperature differences with the courtyard and thus minimizing thepotential for stack effect.
5.6. Airflow rates during daytime
Table 2 shows airflow rates calculated for the daytime using measured daytimeair velocities at the openings of each opening composition, together with correspond-ing air volumes. The volumetric airflow rate is proportionate to the area of openings.
The airflow rate that corresponds with case 2 (the best thermal modification) isaround 1.5 air changes per h. Similar thermal behavior was evident in case 4, inwhich the rectangular courtyard is ventilated through three openings including Op1and Op 2 of the longitudinal axis. Thus, the effective airflow range is from 1.5 to2.0 air changes h�1 [11].
Relatively higher airflow rates and higher air volumes are visible when the build-ing is ventilated through all four openings during the daytime. However, the airtemperature modification is relatively low in this case when compared to the casesdiscussed above.
Table 2Different boundary configurations with corresponding daytime mean airflow rates and air volumes
Opening composition Air volume (m3/h) Flow rate, air changes h�1
Courtyard (case 1) 84 0.2Op1, 2 and Cy (case 2) 630 1.5Op3 and 4 (case 3) 535 1.2Op1, 2 and 3 (case 4) 714 1.7Op1, 2, 3 and 4 (case 5) 1050 2.5
Volume of the building, 420m3.

1770 I. Rajapaksha et al. / Renewable Energy 28 (2003) 1755–1778
6. Computational fluid dynamics (CFD) analysis
Results obtained from the thermal investigation indicate that modification ofindoor air temperatures in a naturally ventilated high mass courtyard building isaffected by the pattern of airflow within the building. The pattern of indoor airflowwas allowed by manually changing the opening composition. The maximumreduction of courtyard and indoor air temperatures is seen in case 2 where the court-yard is ventilated through openings 1 and 2 found in the building envelope. Thefollowing section investigates the indoor airflow patterns and rates using numeri-cal simulation.
Although there are varieties of turbulence models, the use of ‘k-� two equationturbulence model’ [12] in predicting airflow properties is commonplace because itis based on the assumption of isotropic turbulence. Other turbulence models withanistropic properties are superior to k-� model [13], but their utilization as a designtool in predicting airflow characteristics is not always appropriate due to complexity.Thus in this study the flow analysis package ‘a-Flow’ [14] and the standard k-� twoequation model was implemented to evaluate the turbulent flow. This software solvesthe Navier–Stokes equations based on finite difference method for three-dimensionalturbulent airflow.
Results taken from the k-� model for daytime airflow pattern and rates were com-pared with the results taken from the field measurements to demonstrate the applica-bility of the boundary configurations in airflow predictions for design purposes.
6.1. Limitations and purpose
Ventilation occurs when openings are available at points exposed to different lev-els of air pressure [15]. Temperature difference between indoors and outdoors is themain force, which generates a pressure gradient for thermal buoyancy influencedventilation. Conventional wisdom suggests that for airflow to be induced by thermalbuoyancy there must be two sets of openings at a vertical distance or apart, anappreciable difference between indoor and outdoor temperatures and it is necessarythat the indoor temperatures are higher than the outdoor temperatures.
Computer fluid dynamics analysis used in this paper investigates daytime airflowpatterns and airflow rates of two thermal situations: a significant cool condition inthe courtyard and a slightly cool condition in the courtyard. In the first condition,the courtyard and attached indoor spaces show relatively lower temperature than theoutdoor temperatures. In the second condition, the openings found in the externalenvelope remain closed during the daytime. Thus, there is least tendency for daytimeventilation due to thermal buoyancy influence and the CFD simulation aims to modelindoor daytime airflow patterns due to wind driven boundary conditions.
In residential buildings of warm humid climates, pressure differences due to windpressure are normally much larger than those due to stack effect and have a dominanteffect on airflow rates [16]. The airflow rates due to buoyancy influence is rathersmall under summer conditions, in comparison with the flow which can be inducedin a naturally ventilated building even by a very light wind [15]. Therefore, the

1771I. Rajapaksha et al. / Renewable Energy 28 (2003) 1755–1778
simulation aims to calculate daytime airflow rates due to wind-forced ventilationonly, assuming the results from wind pressure boundary conditions give a reasonableaccuracy. In selecting a program for the use in the simulation, a reasonable compu-tation time and cost were also considered as an initial criterion.
CFD simulation in respect to multizone complex buildings (for example the casestudy appears in this paper) using either temperature or wind pressure zones as theboundary conditions is extensively time-consuming and costly. Therefore, the simul-ation is performed within the limitations of wind pressure boundary conditions.
6.2. Grid system
The grid system used in this study is an orthogonal grid based on the Cartesiancoordinate system (x, y, z coordinate axes), with non-uniform spacing. Applicationof the fine grid was limited to the openings, courtyard void and boundary surfaces.
Dimensions of the cube surrounding the centrally placed building model were with350 m each for x and y coordinate axes (plan area = 122 500 m2) and 60 m for zcoordinate axis. The surrounding environment is approximately 20 times the planarea and 12 times the height of the building model. Larger surrounding geometrywas utilized to minimize calculation errors.
The grid is composed with 119 × 129 × 60 cells in x, y and z coordinate axes,respectively. Thus there are 92 1060 total cells of which 40% of the cells are incor-porated in the building model (88 × 102 × 40 cells along x, y and z axes,respectively). Geometry of the grid is shown in Fig. 12. Minimum and maximumcell sizes vary in 0.11 to 0.3m, 0.15 to 0.3 and 0.12 to 0.16m in x, y and z co-ordinate axes, respectively. Dimensions of the grid and cells on x, y, and z coordinateaxes are given in Table 3.
Table 4 shows the governing equations specified for surrounding and wall bound-aries [14]. Figs. 13 and 14 show the boundaries of inlet, outlet and sky. With refer-ence to the wind direction (southwest) obtained from the field investigation, the south
Fig. 12. Orthogonal Cartesian grid with centrally placed building model.

1772 I. Rajapaksha et al. / Renewable Energy 28 (2003) 1755–1778
Table 3Grid and cell dimensions
Grid characteristics Coordinate axes
x y z
Surrounding grid 350 350 60Total No. of cells 119 129 60Bldg model cells 88 102 40Cell dimensions Min. 0.11 Min. 0.15 Min. 0.12
Max. 0.3 Max. 0.3 Max. 0.16
Table 4Boundary conditions
Inlet boundary Uin(z) = Uh(z /h)1/4
Kin(z) = 1/2(0.05·Uin(z))2
ein(z) = Cmk3/2in(z) /L
L = h/2; h = 5.0m; Uh = 1.5m/sOutlet boundary Free slipSky Free slipWall boundary (log law) U/Ut = 1 /�log(Uty /n) + A
K = U2t /C1/2
m ; e = U2t /�y
Ut = (t /r)1/2; � = 0.4; A = 5.5
Fig. 13. Simulated building model. (a) Plan with wind direction and specified Inlet and outlet boundaries;(b) Three-dimensional form.

1773I. Rajapaksha et al. / Renewable Energy 28 (2003) 1755–1778
Fig. 14. (a) Vertical profile of wind speed at inlet boundary in relation to the building model withsurrounding boundary condition. (b) Wind velocity measurement points of the field investigation.
and west sides act as inlet boundaries. The corresponding wind profile was derivedfrom power-law formula. Log-law was used to model the wall boundary conditions.
6.3. Building model
Fig. 13 illustrates the plan and 3D form of the simulated building model. Thegeometry of the building was realistically modeled, utilizing the dimensions of theexperimented building (refer Fig. 4A). The 3D model incorporates an open centralcourtyard, internal layout with two axes perpendicular to each other, floor levels,gable roofs and main axial openings. The dimensions of the building were, length:18.6 m, width: 12.2 m and height: 4.8 m. Opening 1 was 4.3 m2 and other axialopenings (Op.2, 3,4) had an area of 3.6 m2 each, the courtyard opening was 18 m2.The internal spaces were arranged at two ground levels differed by 0.9 m. Thus,openings 2 and 4 are placed at 0.9 m above the ground level where openings 1 and3 are found. For simulation purposes, walls, roofs and the ground of the buildingwere considered as impermeable.
6.3.1. Simulated casesThe building was simulated for indoor airflow behavior under five different bound-
ary-opening compositions as shown in Table 1. This paper presents the airflow ratesof all cases and detailed airflow analysis of the two cases related to the thermalinvestigation presented above.
6.4. Natural wind profile
Turbulence characteristics and vertical profile of wind speed are influenced by thetype of terrain and are a function of terrain roughness. The measurements taken withrespect to ambient wind during the field investigation (Fig. 14B) were used in deriv-

1774 I. Rajapaksha et al. / Renewable Energy 28 (2003) 1755–1778
ing the terrain roughness. Average velocity was recorded at 5 and 10 m heights fromthe ground and was 1.5 and 1.8 m/s, respectively. The vertical profile of wind speedwas given by power law according to the following formula (refer Fig. 14A):
Uin (z) /Uh � (Z /h)a (2)
Thus, the investigated site represents a terrain roughness (a) of 0.25 with a turbu-lent intensity of 5%. In the presence of different boundary conditions from open flatcountry to cities, the terrain roughness varies from 0.16 to 0.33, respectively. Terrainroughness of 0.25 represents an urban characteristic [17]. Daytime wind directionwas observed from the southwest direction at an angle of 45° to the building facade(Fig. 13A).
7. Results and discussion of the computational analysis
7.1. Comparison of airflow rates
Daytime airflow rates calculated from the results of the field investigation werecompared with CFD. The comparison is made for all cases mentioned in the sectionof flow rates from field investigations. Fig. 15 shows the correlation between thevalues calculated from the numerical simulation and the field investigations. Thecorrelation coefficient obtained was 0.96, indicating a reasonable accuracy of CFD.
7.2. Airflow pattern
When the 3D building model is allowed to ventilate through openings 1 and 2 asfound in the building envelope and located with the courtyard on the longitudinalaxis, it was found that the courtyard functions as a low pressure zone. In addition,other openings in the envelope function as suction zones inducing airflow and thusoptimizing the exposure of high mass walls with incoming air. The air entering from
Fig. 15. Comparison of daytime airflow rates.

1775I. Rajapaksha et al. / Renewable Energy 28 (2003) 1755–1778
Fig. 16. Simulated airflow patterns (horizontal distribution) at human body height (1.1 m).
the openings 1 and 2 travels through the indoor spaces and finally discharges intothe sky through the courtyard (Fig. 17, case 2). It is also seen that a portion of airtravels into the adjoining living space before it discharges through the courtyard.The results show that the courtyard does not admit any airflow from its sky openingbut acts as an ‘upwind air funnel’ to discharge the indoor airflow into the sky.
When the 3D building model is allowed to ventilate from the courtyard whileother openings in the envelope remain closed, the courtyard acts as a suction zoneand admits airflow from the free flow above the building model (Fig. 17, case 1).Detailed results indicate that air entering through the courtyard tries to get dischargedback into the sky through the same opening, creating a vortex within its top section.A part of the air travels into the adjoining spaces but stagnates as openings in theenvelope are closed. However, intensity of this airflow within the indoor spaces islower than that of the previous case.
The above results clearly indicate two different airflow patterns within thecourtyard/building and the differences are correlated to the opening compositions.A detailed presentation of airflow patterns can be found elsewhere [18].
Fig. 17. Vertical distribution of the simulated airflow patterns, case 1 with ‘A top vortex’ ; case 2 withan ‘Up wind air funnel’ .

1776 I. Rajapaksha et al. / Renewable Energy 28 (2003) 1755–1778
7.3. Wind velocities
Wind velocities through the full height of the courtyard were Wind velocitiesthrough the full height of the courtyard were calculated using mean values of 3Dcells available in the courtyard. The courtyard was simulated with 12 000 such cellswith each level being composed of 300 cells.
An increase of air velocity is seen with the height of the courtyard in case 2 wherethe courtyard acts as an upwind air funnel. Fig. 18, shows the calculated full verticalwind velocity profile compared with the measured wind velocities (daytime mean)at three levels. Calculated values of 0.32, 0.37 and 0.43 m/s at three levels (1.1 m;Vc1, 2.5 m; Vc2, 3.5 m; Vc3) where field measurements were taken show a closeagreement with the measured values.
Also, a sudden increase of velocity is visible at 0.9 m where the bottom level ofopening 2 is designed. Such behavior indicates the combined effect of both openings1 and 2. Calculated velocities at the openings indicate higher values at opening 2(Fig. 19). Thus, the increase of air velocities at 0.9 m and levels above 2.5 m exhibitthe effect of opening 2 on the air velocities. Furthermore, the calculated and meas-ured velocities at each opening demonstrate a close agreement between the values(Fig. 19).
The vertical wind velocity profile in case 1 indicates a static behavior up to 3.5m. The velocities below this level are lower than 0.2 m/s and relatively lower thanin case 2. The increase of velocities (Fig. 18) above 3.5 m indicates the effect of
Fig. 18. Simulated and measured daytime vertical wind velocity profile within the courtyard for case 1and 2.

1777I. Rajapaksha et al. / Renewable Energy 28 (2003) 1755–1778
Fig. 19. Simulated and measured daytime wind velocity profile at opening 1 and 2.
‘vortex’ type airflow from the courtyard’s top opening. However, its effect on middleand lower levels is relatively low.
8. Conclusion
The computational simulation utilizing the standard k-� turbulent model with iso-thermal condition agrees closely with the measurements taken from the field investi-gation.
The results obtained from the thermal investigation and the computational (CFD)analysis explores the potential of a courtyard for passive cooling in a single storeyhigh mass residential building located in a warm humid climate. The effect of thecourtyard for mass-air heat exchange and thus lowering the daytime indoor air tem-peratures below the corresponding levels of shade ambient temperature is correlatedwith the indoor airflow pattern. This correlation indicates that the potential of thecourtyard to act as a passive cooling strategy is a function of the indoor airflowpattern. Thus, relatively better indoor thermal modification is seen when the court-yard acts as an air funnel discharging indoor air into the sky, rather than the courtyardacts as a suction zone inducing air from its sky opening, as suggested by conven-tional knowledge.
Although the airflow rates are proportionate to the opening areas, the levels ofindoor thermal modifications are not proportionate to airflow rates. The maximumairflow rate does not give the optimum thermal modification. The optimum airflowrate that corresponds with the best thermal modification of more than 1 °C below

1778 I. Rajapaksha et al. / Renewable Energy 28 (2003) 1755–1778
the ambient level is found between 1.5–2.0 ACH. Given the ambient wind climate,and when the measured effective ventilation rate is established, CFD simulationscould be used as an appropriate design tool in deriving the corresponding openingcomposition.
The implication of this conclusion on architectural design gives useful guidelinesin designing naturally ventilated high mass residential buildings with internal court-yards in warm humid climates. Thus, the potential of courtyards to act as passivecooling can be correlated with a building composition in terms of airflow rate andpattern.
References
[1] Givoni B. Passive and low energy cooling of buildings. New York: Van Nostrand Reinhold, 1994.[2] Givoni B. Effectiveness of mass and night ventilation in lowering the indoor daytime temperatures
Part I: 1993 experimental periods. Energy and Building 1993;1993(28):25–32.[3] Boutet T. Controlling air movement. USA: McGraw Hill, 1987.[4] Humphreys MH. Outdoor temperatures and comfort indoors. Building Research and Practice
1978;6(2):92–105.[5] Auliciemes A. In: ANZAAS Conference. Global differences in indoor thermal requirements. 1997.[6] Szokolay SU. Thermal comfort in warm humid tropics. ANZAScA 1997:7–11.[7] Haccoun A, Barcohen A. Thermal properties of building materials: A compilation. Division of Desert
Engineering, Ben-Gurion University of the Negev, Research and Development Authority, 1974.[8] Fanger PO, Melikov AK, Hanazawa H et al. Turbulence and draft: the turbulence of airflow has a
significant impact on the sensation of draft. ASHRAE Journal 1989;31(7):18–23.[9] Kindangen J. Window and roof configurations for comfort ventilation. Building Research and Infor-
mation 1997;25(4):218–25.[10] Rajapaksha I, Nagai H, Okumiya M. Indoor airflow behavior for thermal comfort in a courtyard
house in warm humid tropics. In: Proceedings ‘ Indoor Air 2002’ , Monterey, USA. 2002. p. 1072–7.[11] Rajapaksha I, Nagai H, Okumiya M. Indoor thermal modification of a ventilated courtyard house
in the tropics. International Journal of Architectural Institute of Japan, Journal of Asian Architectureand Building Engineering 2002;1(1):84–97.
[12] Launder BE, Spalding JL. Mathematical models of turbulence. New York: Academic Press, 1972.[13] Heiselberg P, Murakami S, Roulet C. Ventilation of large enclosures in buildings, Energy conser-
vation in buildings and community systems: Annex 26. Denmark: Kolding, 1998.[14] Alfa flow user’s guide, Fujitsu Corporation, Japan, 1992[15] Givoni B. Man climate and architecture. London: Applied Science Publishers, 1976.[16] Aynsley RM. Tropical housing comfort by natural airflow. Building Research and Practice
1980;8(4):242–52.[17] Awbi HB. Ventilation of buildings. London: Spon, 1991.[18] Rajapaksha I. Passive cooling design strategies for tropical courtyard buildings, Doctoral thesis,
Department of Architecture, Nagoya University, Japan.
Copyright © 2022 FDOKUMEN