HO x concentrations and OH reactivity observations in New York City during PMTACS-NY2001
11
Atmospheric Environment 37 (2003) 3627–3637 HO x concentrations and OH reactivity observations in New York City during PMTACS-NY2001 Xinrong Ren*, Hartwig Harder 1 , Monica Martinez 1 , Robert L. Lesher, Angelique Oliger, Terry Shirley, Jennifer Adams, James B. Simpas, William H. Brune Department of Meteorology, Pennsylvania State University, University Park, PA 16802, USA Received 6 March 2003; accepted 27 May 2003 Abstract Hydroxyl (OH) and hydroperoxy (HO 2 ) radicals (collectively called HO x ) were measured by a laser-induced fluorescence instrument during the PMTACS-NY (PM2.5 Technology Assessment and Characterization Study–New York) intensive campaign in New York City in summer 2001. Measurement results for OH and HO 2 are presented for the month-long study. The detection limits were about 3.0 10 5 cm 3 for OH and 2.5 10 6 cm 3 (B0.1 ppt) for HO 2 with a 1-min integration time and a 2s confidence level. The daytime maximum concentrations were 5–20 10 6 cm 3 for OH and 0.4–6 10 8 cm 3 (2–24 pptv) for HO 2 , usually appearing later than the peak of ozone photolysis frequency, J(O 1 D). Relative high OH and HO 2 persisted into early evening and were frequently observed during nighttime. The ratios of HO 2 to OH were typically between 5 and 40, which are smaller than those obtained in relatively clean environments. The OH reactivity, measured by an instrument named total OH loss rate measurement was on average 1973s 1 in this urban environment. It was the highest in the morning and the lowest in the afternoon. The comparison of measured OH and HO 2 with model calculations is given in a companion paper (OH and HO 2 chemistry in the urban atmosphere of New York City, Atmospheric Environment (2003a) this issue). r 2003 Elsevier Ltd. All rights reserved. Keywords: Hydroxyl radical; Hydroperoxy radical; Measurement; Urban environment; Nighttime hydroxyl 1. Introduction The hydroxyl radical (OH) and hydroperoxy radical (HO 2 ), collectively called HO x , play key roles in many environmental issues such as ozone production, acid rain and fine particle formation. In polluted urban environments, high levels of anthropogenic NO x and volatile organic compounds (VOCs) cause rapid HO x cycling and termination. Understanding the sources, propagation, and sinks of HO x is as important to creating effective pollution control as understanding the gaseous and particulate emissions and the meteorology that determines the transport and mixing of these emissions and their oxidation products. Under the polluted conditions that typically occur in urban areas, the HO x production from photolysis of some oxygen-containing species, such as formaldehyde (HCHO), nitrous acid (HONO) and hydrogen peroxide (H 2 O 2 ), can be as important as ozone photolysis following by reaction of O( 1 D) with water vapor (Eisele et al., 1997). However, these are not the only HO x sources. Recent studies show that O 3 can react with alkenes to produce significant amounts of OH and HO 2 (Paulson and Orlando, 1996; Donahue et al., 1998; Kroll et al., 2001). Because these sources require no photolysis, they would produce OH and HO 2 , both day and night. Nighttime HO x can be also produced directly from the ARTICLE IN PRESS AE International – North America *Corresponding author. Fax: 1-814-865-3663. E-mail address: [email protected] (X. Ren). 1 Now at Max-Planck-Institut f . ur Chemie, D-55116 Mainz, Germany. 1352-2310/03/$ - see front matter r 2003 Elsevier Ltd. All rights reserved. doi:10.1016/S1352-2310(03)00460-6
Transcript of HO x concentrations and OH reactivity observations in New York City during PMTACS-NY2001

Atmospheric Environment 37 (2003) 3627–3637
HOx concentrations and OH reactivity observationsin New York City during PMTACS-NY2001
Xinrong Ren*, Hartwig Harder1, Monica Martinez1, Robert L. Lesher,Angelique Oliger, Terry Shirley, Jennifer Adams, James B. Simpas,
William H. Brune
Department of Meteorology, Pennsylvania State University, University Park, PA 16802, USA
Received 6 March 2003; accepted 27 May 2003
Abstract
Hydroxyl (OH) and hydroperoxy (HO2) radicals (collectively called HOx) were measured by a laser-induced
fluorescence instrument during the PMTACS-NY (PM2.5 Technology Assessment and Characterization Study–New
York) intensive campaign in New York City in summer 2001. Measurement results for OH and HO2 are presented for
the month-long study. The detection limits were about 3.0� 105 cm�3 for OH and 2.5� 106 cm�3 (B0.1 ppt) for HO2
with a 1-min integration time and a 2s confidence level. The daytime maximum concentrations were 5–20� 106 cm�3
for OH and 0.4–6� 108 cm�3 (2–24 pptv) for HO2, usually appearing later than the peak of ozone photolysis frequency,
J(O1D). Relative high OH and HO2 persisted into early evening and were frequently observed during nighttime. The
ratios of HO2 to OH were typically between 5 and 40, which are smaller than those obtained in relatively clean
environments. The OH reactivity, measured by an instrument named total OH loss rate measurement was on average
1973 s�1 in this urban environment. It was the highest in the morning and the lowest in the afternoon. The comparison
of measured OH and HO2 with model calculations is given in a companion paper (OH and HO2 chemistry in the urban
atmosphere of New York City, Atmospheric Environment (2003a) this issue).
r 2003 Elsevier Ltd. All rights reserved.
Keywords: Hydroxyl radical; Hydroperoxy radical; Measurement; Urban environment; Nighttime hydroxyl
1. Introduction
The hydroxyl radical (OH) and hydroperoxy radical
(HO2), collectively called HOx, play key roles in many
environmental issues such as ozone production, acid
rain and fine particle formation. In polluted urban
environments, high levels of anthropogenic NOx and
volatile organic compounds (VOCs) cause rapid HOx
cycling and termination. Understanding the sources,
propagation, and sinks of HOx is as important to
creating effective pollution control as understanding the
gaseous and particulate emissions and the meteorology
that determines the transport and mixing of these
emissions and their oxidation products.
Under the polluted conditions that typically occur in
urban areas, the HOx production from photolysis of
some oxygen-containing species, such as formaldehyde
(HCHO), nitrous acid (HONO) and hydrogen peroxide
(H2O2), can be as important as ozone photolysis
following by reaction of O(1D) with water vapor (Eisele
et al., 1997). However, these are not the only HOx
sources. Recent studies show that O3 can react with
alkenes to produce significant amounts of OH and HO2
(Paulson and Orlando, 1996; Donahue et al., 1998; Kroll
et al., 2001). Because these sources require no photolysis,
they would produce OH and HO2, both day and night.
Nighttime HOx can be also produced directly from the
ARTICLE IN PRESS
AE International – North America
*Corresponding author. Fax: 1-814-865-3663.
E-mail address: [email protected] (X. Ren).1Now at Max-Planck-Institut f .ur Chemie, D-55116 Mainz,
Germany.
1352-2310/03/$ - see front matter r 2003 Elsevier Ltd. All rights reserved.
doi:10.1016/S1352-2310(03)00460-6

NO3 reaction with HCHO or indirectly from the
conversion to HO2 of organic peroxy radicals (RO2)
that are produced by NO3 reactions with VOCs (Bey
et al., 2001). The chemically diverse urban environment
provides an interesting and important context for
studying HOx production and loss.
OH and HO2 have been successfully measured in
relatively clean atmosphere on the surface ground
(Hofzumahaus et al., 1996; Mount et al., 1997; Mather
et al., 1997; Holland et al., 1999; Creasey et al., 2001,
2002; Kanaya et al., 2001; Faloona et al., 2001) and on
the aircraft (Brune et al., 1998; Mauldin et al., 1999; Tan
et al., 2001a; Hanisco et al., 2002) in recent intensive
field campaigns. The measurements of OH and HO2 in
polluted urban environments are more limited. The
urban areas where OH and/or HO2 have been measured
include Portland, Oregon (Hard et al., 1984, 1986, 1992),
London, UK (Abram et al., 2000), Los Angeles, CA
(George et al., 1999), Nashville, TN (Martinez et al.,
2003), Houston, TX (Martinez et al., 2002), and Berlin,
Germany (Holland et al., 2003).
For most studies, simultaneous measurements of
chemicals that influence HOx were used in models to
calculate HOx, which could be compared to the HOx
measurements. While measured and expected HO2 often
agreed to within a factor of 2, measured HO2 tended to
be higher than expected HO2 when NO was high or
when the solar zenith angle (SZA) was large, including at
night. Measured and expected OH levels were sometimes
in agreement to within combined uncertainties, roughly
a factor of 1.5, but in some environments, measured and
modeled OH differed by a factor of two or even more. If
these differences are real, then the current understanding
of oxidation chemistry may need modification. More
intensive field campaigns that include HOx measure-
ments are needed to test these observed discrepancies.
This paper presents the measurements of OH, HO2
and OH reactivity during the PM2.5 Technology
Assessment and Characterization Study—New York
(PMTACS-NY) intensive in summer 2001. One purpose
of this study was to determine the concentrations of OH
and HO2 and to substantiate our understanding of the
chemistry controlling these chemicals in this highly
polluted environment. Measurements of HOx concen-
trations and OH reactivity both day and night are
presented. The comparison of measured OH and HO2
with model calculations and a discussion of HOx budget
are given in a companion paper (Ren et al., 2003a).
2. Experimental description
2.1. Site description
The PMTACS-NY 2001 intensive campaign took
place at a US EPA host site on the campus of Queens
College (40�4401500N, 73�4901800W) in the Borough of
Queens, New York City. The campaign occurred from
the end of June to the beginning of August. The site was
in a parking lot that overlooks a running track and
soccer field to the west. The instruments were located on
a scaffolding tower near a string of air-conditioned
trailer laboratories. West winds usually brought the
polluted air from Manhattan Island to the site, while
east winds brought relatively clean air from the Atlantic
Ocean. The air at the site was characterized by relatively
high levels of NOx and anthropogenic VOCs.
2.2. HOx measurements
2.2.1. HOx instrument description
Our technique for measuring OH and HO2 is laser-
induced fluorescence (LIF) at low pressure (often called
FAGE) (Hard et al., 1984; Stevens et al., 1994; Mather
et al., 1997). In this technique, the air sample is drawn
into a low-pressure chamber with a vacuum pump. As
the air passes through a laser beam, OH is excited by a
laser that was tuned to the wavelength of an A2Sþðv0 ¼0Þ-X 2Pðv00 ¼ 0Þ OH transition near 308 nm and is
detected by the resulting fluorescence near 308 nm.
Collisional quenching of the excited state is slow enough
at the chamber pressure that the weak OH fluorescence
extends beyond the prompt scattering (Rayleigh, Mie
and wall scattering) and is detected with time-gated
microchannel plate (MCP) detectors. HO2 is detected
when NO, added to the low-pressure air stream, reacts
with HO2 to form OH, which is then detected by LIF.
During this campaign, OH and HO2 measurements
were made with the Penn State ground-based tropo-
spheric hydrogen oxides sensor (GTHOS). GTHOS had
three main subsystems: the detection module, the laser
system, and the electronics. The detection module
consisted of two detection axes in series that were
mounted on the top of a scaffolding tower (Fig. 1). The
sampled air was pulled by a vacuum pump through a
1.0mm-diameter inlet, down a 20-cm long, 5-cm-
diameter tube, into the low-pressure (4.7 hPa) detection
axes. The first detection axis was for OH; the second
one, 20 cm downstream of the first, was for HO2. In each
detection axis, the air stream, laser beam, and detector
field-of-view intersected. The laser beam was passed
through the air stream 32–36 times at each detection axis
with a White cell. An injector loop positioned between
the axes was used to add Ascarite-filtered NO for
converting HO2 to OH. Because of the two-axis
arrangement, the detection of OH and HO2 was
simultaneous.
The laser was a spectra-physics T40-X30S-532Q
diode-pumped frequency-doubled Nd:YAG laser
(532 nm, 3 kHz repetition rate, 25 ns pulse width, 3W
average power) that pumped a Harvard-modified
Chromatix frequency-doubled dye laser (Wennberg
ARTICLE IN PRESSX. Ren et al. / Atmospheric Environment 37 (2003) 3627–36373628

et al., 1994). The dye used was Pyrromethene 597
(Lambda Physik) in 2-propanol. This dye laser had an
intracavity etalon that both narrowed the laser line
width to 3.5GHz, which was about the OH line width,
and allowed for tuning the laser on and off the OH
resonance. The OH transition used was the Q1(2) line
near 308 nm. The total UV laser power was 15–20mW.
A reference cell containing OH, which was made on a
hot filament, indicated times when the laser wavelength
coincided with the OH transition, called on-line, and
when it did not, called off-line (Stevens et al., 1994).
Each hour, a spectral scan was taken of the OH
fluorescence line and the surrounding background to
ensure the identity of the excitation transition and to test
for spectral interferences.
A schematic view of the GTHOS instrument during
the PMTACS-NY2001 campaign (Fig. 1) shows the
arrangement of its components. The laser system,
controlling units, and the data acquisition system were
in a rack that was housed inside the trailer. The
detection module of GTHOS was mounted on top of
the construction scaffolding that was erected beside the
trailer. The GTHOS inlet was 6.4m above the ground.
The vacuum pump was situated under the trailer near
the tower and was connected to the detection cell with a
7.5 cm-diameter vacuum hose. Electrical cables con-
nected the equipment in the trailer to the detection
module on the scaffolding. The UV laser beam was
delivered from the trailer to OH and HO2 axes by two
8m-long, 0.20mm-diameter optical fibers (ThorLabs,
Newton, NJ). The UV power was about 5.0mW in the
OH axis and about 2.0mW in the HO2 axis. The
detection module was housed in a thin sheet-metal
enclosure that was purged with dry nitrogen, thus
minimizing water condensation on the optics when
temperature dropped at night.
The OH fluorescence and background signals were
determined when the laser was tuned on and off
resonance with the OH transition every 10 s. Collection
optics gathered about 8% of the fluorescence and sent it
to detectors behind narrow-band 308 nm interference
filters. The MCP-PMT detectors (Hamamatsu) were
gated on for approximately 300 ns to detect the OH
fluorescence about 60 ns after each laser pulse had
cleared the detection cells. Two counter gates were used
for each detector: one counted the OH fluorescence
signal; a second counted the Rayleigh and chamber
scattering. With the detector gain gate off, and thus the
detector gain several orders of magnitude smaller, the
second counter gate was opened for 50 ns during
the laser pulse to measure the Rayleigh and chamber
scattering. All signals were recorded 5 times a second.
A time series shows the actual detector signals
collected during this campaign (Fig. 2). The high and
low reference cell signals in Fig. 2(c) correspond to
periods when the laser wavelength coincided with the
Q1(2) OH absorption at 307.9951 nm and when it did
not. The off-line position alternated between wave-
lengths that were longer or shorter than the wavelength
of the on-line position. An on-line dithering routine
continually tested for the largest reference cell signal and
adjusted the on-line position. The measured OH and
HO2 signals, shown in Fig. 2(a) and (b), respectively,
track the signal in the OH reference cell. The scattering
signals in the detection cells (Fig. 2(a) and (b)), which
were proportional to the OH sensitivity, indicated the
stability of GTHOS detection sensitivity.
2.2.2. HOx instrument calibration
GTHOS was calibrated before, during, and after the
field measurements. To determine the instrument’s
sensitivity, C, known amounts of OH and HO2 were
generated through the photolysis of water vapor at
184.9 nm with the subsequent reaction with O2
H2Oþ hn ðl ¼ 184:9 nmÞ þO2-OHþHO2: ðR1Þ
The calibration system was carried to the top of the
scaffolding tower to perform the calibration. Ultra zero
air was run at a flow rate of 50 SLPM from the base of
the tower up to the calibration system. A small portion
was passed through a bubbler that contained HPLC-
grade water. Adjusting the fraction of air through the
bubbler produced a range of different water mixing
ARTICLE IN PRESS
Fig. 1. Schematic diagram of the GTHOS instrument for OH
and HO2 measurements and the TOHLM instrument for OH
reactivity measurements during the PMTACS-NY 2001 cam-
paign. The laser system and data acquisition system were in the
trailer and the detection module was mounted on top of a
scaffolding tower, with sample inlet height of about 6.4m above
ground level. The detection module was connected with the
vacuum pump that was located under the trailer.
X. Ren et al. / Atmospheric Environment 37 (2003) 3627–3637 3629

ratios from 0% to 2%. The water concentration was
detected by a LICOR LI-6262 H2O/CO2 instrument
(LICOR Instruments, Lincoln, NE), which was cali-
brated against a chilled mirror hygrometer. A low-
pressure Hg lamp generated the 184.9-nm actinic flux in
a 1.3� 3.8 cm2 irradiation region near the outlet of the
calibration system. The UV flux at 184.9 nm was
measured with a solar-blind Cs–I photomultiplier tube
calibrated against a NIST-calibrated photodiode at the
University of Colorado. The resulting OH and HO2
concentrations were then calculated with knowledge of
the following parameters: the air flow rate, from which
the exposure time, t, could be calculated; the mixing
ratio of water vapor in the air, wH2O; the absolute crosssection of water vapor, sH2O (7.2� 10�20 cm2, Cantrell
et al., 1997); the quantum yield of OH, FOH (1.0,
DeMore et al., 1997); and the integrated actinic flux,
Fl¼184:9 nm: Thus,
wOH ¼ wHO2¼ wH2OsH2OFOHFl¼184:9 nmt: ð1Þ
The upper-limit of the absolute calibration uncertainty
was estimated at 732% (at the 95% confidence level).
The sensitivity of instrument (C) was then obtained from
C ¼DS
wOHP; ð2Þ
where DS is the difference between on-line and off-line
signals (counts s�1), wOH is the calculated volume mixing
ratio from Eq. (1) (pptv), and P is the laser power
monitored at the output of the White cell (mW). The
ambient measurements of wOH were then calculated from
simply inverting Eq. (2). The minimum detectable wOHcan be defined from twice the standard deviation of the
background signal
wOHmin¼
ðS=NÞC
ffiffiffiffiffiffiffi2sb
t
r: ð3Þ
The detection limits (with 2s confidence and 1-min
integration time) were estimated to be in the order of
0.012 pptv (B3� 105 cm�3) for OH and 0.1 pptv
(B2.5� 106 cm�3) for HO2.
2.2.3. Interference tests
The interference of photolytic production of OH
within the detection cell from ozone and water (Smith
and Crosley, 1990) has been overcome in more recent
techniques by using low-pressure detection, low laser
energy per pulse, and 308 nm excitation. The inter-
ference has been found to be negligible for this technique
(Stevens et al., 1994; Zeng et al., 1998), confirmed by
laboratory experiments in which no significant OH
signal was observed when ozone and water vapor were
admitted to the instrument. However, other chemical
interferences might bias the measurement results.
We carried out the interference studies during the
campaign and in the laboratory after the campaign.
ARTICLE IN PRESS
0 20 40 60 80 100 120 1400
500
1000
1500
307.95307.96307.97307.98307.99308.00308.01
-40
0
40
80
120
0
50
100-20
0
20
40
60
0
50
100
150
200
250
Ref
. cel
l sig
nal (
cps)
Elapsed time (s)
Wav
elen
gth
(nm
)
HO
2 sig
nal
(cps
)
Sca
tterin
g si
gnal
at H
O2 c
ell (
cps)
OH
sig
nal
(cps
)
(a)
(b)
(c)
Sca
tterin
g si
gnal
at O
H c
ell (
cps)
Fig. 2. Typical data acquisition cycles recorded at the starting time of 15:36 eastern daylight time (EDT) on 9 July 2001 during the
PMTACS-NY2001 campaign: (a) OH fluorescence signal (solid line, left axis) in counts s�1 (cps, where 1 cps corresponds to
B2.8� 105 cm�3) and Rayleigh scattering (dotted line, right axis) from OH cell; (b) HO2 fluorescence signal (solid line, left axis) in
counts s�1 (cps, where 1 cps corresponds to B1.0� 106 cm�3 or 0.04 pptv) and Rayleigh scattering (dotted line, right axis) from HO2
cell. (c) Signal from reference cell (solid line, left axis) and excitation laser wavelength (dotted line, right axis).
X. Ren et al. / Atmospheric Environment 37 (2003) 3627–36373630

During the field measurements, an automatic procedure
was run every hour on the half-hour to check instrument
performance. Spectral scans showed that there was little
spectral interference from other atmospheric species and
that the laser was alternating wavelengths properly
between the on-line and off-line positions. For HO2, the
reagent NO flows were varied to ensure that the peak
OH signal was obtained from the NO addition.
Occasionally turning off the NO and measuring OH
for two days prior to turning on the NO to measure HO2
showed that NO addition did not affect the observed
OH signals in the first axis. We also occasionally tested
the background signal by internal addition of perfluor-
opropylene (C3F6), by sampling zero air, and by
sampling through a glass-wool filter to remove OH
radicals. Results from this diagnosis also indicated the
lack of interferences. In addition, the OH signal
decreased proportionally with the UV laser power,
whereas a quadratic decrease is expected if OH is both
generated and excited by the laser. All of these tests
indicated that the observed OH signal was not generated
internally and was not produced by the laser beam.
Possible interfering chemical species tested in the
laboratory include formaldehyde (HCHO), hydrogen
peroxide (H2O2), nitrous acid (HONO), nitrite acid
(HNO3) and acetone. Ozone and the alkenes—ethene,
propene and isoprene—were added together just outside
of the inlet or internally to test for possible dark
reactions that produce HOx. All these tests provide
evidence that GTHOS had no significant interferences
(Ren et al., 2003b).
When NO is added to the HO2 axis, ambient RO2
might react with NO to form RO, which then reacts with
O2 to produce HO2, as in the following mechanism:
RO2 þNO-ROþNO2; ðR2Þ
ROþO2-R0CHOþHO2; ðR3Þ
HO2 þNO-OHþNO2: ðR4Þ
Calculations indicate that at the levels of NO used in the
instrument, about 1000 ppmv, the reaction RO+
NO+M-RONO+M is competitive with reaction
(R3) due to the low O2 number density inside the
detection cell. Calculations show that RO2 contributes
less than a 2% interference (Tan et al., 2001b). In
addition, the RO2 interference was examined in the
laboratory, where several different RO2 species at the
levels of B20–100 pptv were produced by photolysis
of air/Cl2/hydrocarbon mixtures. RO2 was produced
from methane (CH4), ethane (C2H6), propane (C3H8)
and n-butane (n-C4H10). The signals from the
generated RO2 were not measurable; the upper limit to
the RO2 interference in the HO2 signal was less than
0.1 pptv.
2.3. OH reactivity measurements
The OH reactivity, kOH, was measured with a new
instrument named the total OH loss-rate measurement
(TOHLM), which is described in detail in Kovacs and
Brune (2001) and Kovacs et al. (2003). Basically,
ambient air was pulled by a blower down a tube and
past a HOx detection axis. HOx was detected in the same
way that ambient HOx was detected with GTHOS. OH
was mixed into the ambient flow through a movable
injector and was detected by the HOx detection axis. As
the injector was pulled back, the decay in the OH signal
was measured. The injector was pulled back in steps,
allowing the OH signal to be monitored as it decayed.
The decay rate was determined by the equation
ktotal ¼ �lnSOH=SOH initial
distance=velocity
� �þ kwall; ð4Þ
where distance/velocity = time of reaction and the wall
loss, kwall, was determined by looking at the OH decay
in zero air (kwallB1.571.0 s�1). The HOx detection
sensitivity does not need to be absolutely calibrated, but
we calibrated it to ensure that the OH mixing ratio
was not too large. Typical OH mixing ratios were
10–30 pptv, large enough to provide strong signals and
avoid possible interferences from ambient oxidants, but
small enough that OH reactants are not depleted.
To calibrate TOHLM, known amounts of CO and
hydrocarbons were added either to the ambient flow or
to ultra zero air. Calibrated OH decays agreed on
average to within 10% of OH decays determined from
knowledge of the ambient flow velocity, step distance,
and kwall. Ambient decays maintained linearity to within
10% for ambient NO of o1 ppbv, but decays could be
corrected for much greater values of NO, although the
uncertainty increases as NO increases. Ambient NO
recycles HO2 into OH, causing curvature in the OH
decays. The absolute accuracy of the TOHLM measure-
ment was 715%, with 2s confidence and a71.0 s�1
uncertainty in the zero air offset.
The instrument was placed on the same top of the
scaffolding tower, about 2m away from the HOx LIF
instrument (Fig. 1).
3. Results of HOX and OH reactivity measurements
During the campaign the weather in New York City
was typical for summer—mostly clear and sunny or
sunny with some clouds. There were occasional rain
showers on 8, 17, and 26 July, and thick clouds on
26 July. The temperature was as high as 35�C during
daytime, with an average of 24�C throughout the
campaign. The average of the relative humility was 55%.
HOx mixing ratios and OH reactivity were continu-
ously measured for about 1 month during the field
ARTICLE IN PRESSX. Ren et al. / Atmospheric Environment 37 (2003) 3627–3637 3631

campaign; more than 600 h of 1-min averaged OH and
HO2 data were obtained.
3.1. OH measurements
OH was measured on 34 days, from 30 June to 2
August. The time series of OH measurements is
presented as 1-min measurements in Fig. 3. Gaps in
the data are due to the instrument calibrations and
maintenance. As can be seen from Fig. 3, the distinct
diurnal variation of OH had daytime peak values
between 2� 106 and 20� 106 cm�3. The observed OH
concentrations are comparable to those measured by
George et al. (1999) and Martinez et al. (2000) in the
similar urban environments.
The composite diurnal variation of OH is shown in
Fig. 4(a). For this figure, data are averaged for 10min.
For reference, also shown in Fig. 4(a) are the median
diurnal variation of OH and the average diurnal
variation of O3 photolysis frequency, J(O1D), which
was calculated from the photolysis frequency expression
by Jenkin et al. (1997) and was scaled to the measured
UV radiation (see the companion paper). On average the
maximum OH concentration was B7� 106 cm�3 and
occurred in the afternoon. Both the OH peak and the
whole shape are shifted from those of J(O1D) by about
2 h. This shift was also found by Kanaya et al. (2001)
and Creasey et al. (2002) in the marine boundary layer.
In the late afternoon and early evening, J(O1D)
decreased to zero, but OH concentration remained at
significant level, about 2� 106 cm�3 on an average.
The correlation coefficient, R2, between OH and
J(O1D) was only 0.35 during this campaign. This poor
correlation contrasts with the good relationship that has
been observed in clean marine and polluted rural
atmosphere (Eisele et al., 1997; Holland et al., 1999;
Ehhalt and Rohrer, 2000).
Two dominant factors controlling the OH and HO2
amounts are NOx and HOx production rate, P(HOx).
According to the expected behavior, as NOx is
increased, OH first increases and then, when NOx is
about 1–2 ppbv, OH decreases due to reactions such as
OH+NO2+M-HNO3+M. For greater P(HOx), OH
is higher and the peak OH moves to greater NOx
(McKeen et al., 1997; Carslaw et al., 2001). These
observed OH dependences in PMTACS-NY agree
qualitatively with the expected behavior, as shown in
Fig. 5(a).
3.2. HO2 measurements
HO2 was measured on 32 days, from 2 July to 2
August (Fig. 6). During daytime, typical peak HO2
concentrations observed were B0.5� 108–2� 108 cm�3
(2–8 pptv) with levels reaching as high as 6� 108 cm�3
(24 pptv) on 25 July. Fig. 4(b) shows the diurnal median
variation of HO2 over the entire campaign, together
with the corresponding average J(O1D) values. The
average maximum HO2 concentration during daytime
ARTICLE IN PRESS
Jun 30 Jul 1 Jul 2 Jul 3 Jul 4 Jul 5 Jul 6 Jul 7 Jul 8 Jul 9 Jul 10 Jul 11 0
10
20x 10
6
Jul 12 Jul 13 Jul 14 Jul 15 Jul 16 Jul 17 Jul 18 Jul 19 Jul 20 Jul 21 Jul 22 0
10
20x 10
6
Jul 23 Jul 24 Jul 25 Jul 26 Jul 27 Jul 28 Jul 29 Jul 30 Jul 31 Aug 1 g 2 Au 0
10
20x 10
6
Date of 2001 (EDT)
OH
(cm
-3)
OH
(cm
-3)
OH
(cm
-3)
Fig. 3. Time series of all the 1-min average OH data (small dots) during the PMTACS-NY2001 field campaign. Local daylight time
(EDT) was used.
X. Ren et al. / Atmospheric Environment 37 (2003) 3627–36373632
was about 1.0� 108 cm�3 (4 pptv), which is much
lower than that obtained in the marine boundary
layer (Holland et al, 1999; Kanaya et al., 2001;
Creasey et al., 2002) and the forest sites (Tan et al.,
2001b; Creasey et al., 2001). This low value is due to
high NO concentrations in this urban area, which
can quickly convert HO2 to OH. The average NO
concentration over the campaign was 10.2 ppbv
while its level in the morning rush hour was as high as
200 ppbv.
Similar to the OH peak, the HO2 peak is shifted
behind the peak of J(O1D) by about 2 h (Fig. 4(b)). The
HO2 profile shows that the HO2 concentration increased
slowly in the morning while it remained as high as
2� 107–4� 107 cm�3 (0.8–1.6 pptv) in the early evening
and was about 1� 107 cm�3 (0.4 pptv) at night. This
significant amount of HO2 acts as the dominant source
of OH (Geyer et al., 2003).
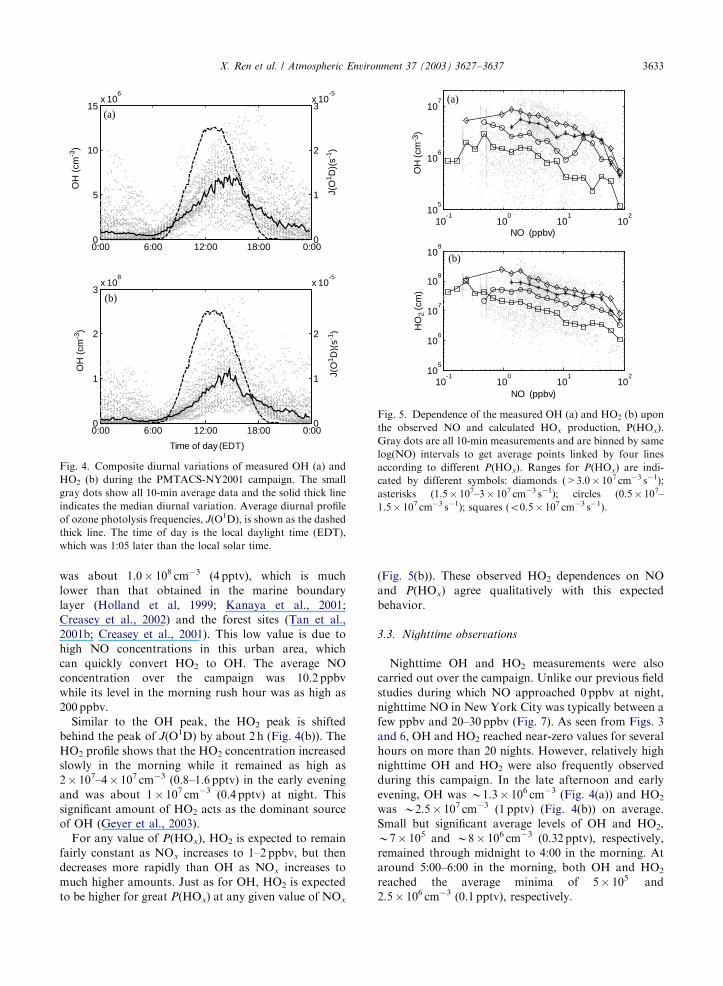
For any value of P(HOx), HO2 is expected to remain
fairly constant as NOx increases to 1–2 ppbv, but then
decreases more rapidly than OH as NOx increases to
much higher amounts. Just as for OH, HO2 is expected
to be higher for great P(HOx) at any given value of NOx
(Fig. 5(b)). These observed HO2 dependences on NO
and P(HOx) agree qualitatively with this expected
behavior.
3.3. Nighttime observations
Nighttime OH and HO2 measurements were also
carried out over the campaign. Unlike our previous field
studies during which NO approached 0 ppbv at night,
nighttime NO in New York City was typically between a
few ppbv and 20–30 ppbv (Fig. 7). As seen from Figs. 3
and 6, OH and HO2 reached near-zero values for several
hours on more than 20 nights. However, relatively high
nighttime OH and HO2 were also frequently observed
during this campaign. In the late afternoon and early
evening, OH was B1.3� 106 cm�3 (Fig. 4(a)) and HO2
was B2.5� 107 cm�3 (1 pptv) (Fig. 4(b)) on average.
Small but significant average levels of OH and HO2,
B7� 105 and B8� 106 cm�3 (0.32 pptv), respectively,
remained through midnight to 4:00 in the morning. At
around 5:00–6:00 in the morning, both OH and HO2
reached the average minima of 5� 105 and
2.5� 106 cm�3 (0.1 pptv), respectively.
ARTICLE IN PRESS
10-1
100
101
102
105
106
107
NO (ppbv)
10-1
100
101
102
105
106
107
108
109
NO (ppbv)
HO
2 (c
m)
OH
(cm
-3)
(a)
(b)
Fig. 5. Dependence of the measured OH (a) and HO2 (b) upon
the observed NO and calculated HOx production, P(HOx).
Gray dots are all 10-min measurements and are binned by same
log(NO) intervals to get average points linked by four lines
according to different P(HOx). Ranges for P(HOx) are indi-
cated by different symbols: diamonds (>3.0� 107 cm�3 s�1);
asterisks (1.5� 107–3� 107 cm�3 s�1); circles (0.5� 107–
1.5� 107 cm�3 s�1); squares (o0.5� 107 cm�3 s�1).
0:00 6:00 12:00 18:00 0:000
5
10
15x 10
6
0
1
2
3x 10
-5
0:00 6:00 12:00 18:00 0:000
1
2
3x 10
8
0
1
2
x 10-5
OH
(cm
-3)
OH
(cm
-3)
J(O
1 D)(
s-1)
J(O
1 D)(
s-1)
Time of day (EDT)
(a)
(b)
Fig. 4. Composite diurnal variations of measured OH (a) and
HO2 (b) during the PMTACS-NY2001 campaign. The small
gray dots show all 10-min average data and the solid thick line
indicates the median diurnal variation. Average diurnal profile
of ozone photolysis frequencies, J(O1D), is shown as the dashed
thick line. The time of day is the local daylight time (EDT),
which was 1:05 later than the local solar time.
X. Ren et al. / Atmospheric Environment 37 (2003) 3627–3637 3633

OH and HO2 increased after midnight on several
days, especially on 17 and 18 July. O3 also increased,
perhaps as a result of transport. The correlation between
O3 and HOx makes sense; O3 can react with alkenes and
directly produce OH and HO2. Meanwhile NO3 can be
produced by the O3 reaction with NO2. Relatively high
NO2 existed throughout the whole campaign, normally
around 20–30 ppbv. NO3 can react with HCHO and
alkenes to produce HO2 and b-nitrooxy-peroxy radicals.The nitrooxy-peroxy radicals can react with NO
producing alkoxy radicals, which can produce HO2
through the reaction with O2. Details about nighttime
HOx observations after the midnights of 16/17 and 17/18
July are described in a separate paper (Ren et al., 2003c).
Results indicate that nighttime OH and HO2 were
primarily produced via the reactions of ozone with
alkenes, while the nighttime NO3 reactions were not
important due to its low concentrations. The relatively
high observed OH and HO2 suggest that HOx chemistry
can play an important role in the nighttime oxidation
processes in the polluted atmosphere.
3.4. Observed HO2/OH ratios
The HO2/OH ratio reflects the interconversion be-
tween OH and HO2, thus it is a very useful parameter to
test the fast cycling between OH and HO2 (Stevens et al.,
1997). For this campaign, most HO2/OH ratios were
between 5 and 40 and the average ratio was B15
(Fig. 7). These measured ratios are much lower than
those obtained in relatively clean atmosphere (Stevens
et al., 1997; Carslaw et al., 2001; Tan et al., 2001b;
Kanaya et al., 2001). One reason for these lower HO2/
OH ratios is the high NO concentrations in this urban
atmosphere which can accelerate the exchange rate from
HO2 to OH. The diurnal profile indicates that the lower
ARTICLE IN PRESS
Jul 2 Jul 3 Jul 4 Jul 5 Jul 6 Jul 7 Jul 8 Jul 9 Jul 10 Jul 11 Jul 120
1
2
x 108
Jul 13 Jul 14 Jul 15 Jul 16 Jul 17 Jul 18 Jul 19 Jul 20 Jul 21 Jul 22 Jul 230
1
2
x 108
Jul 24 Jul 25 Jul 26 Jul 27 Jul 28 Jul 29 Jul 30 Jul 31 Aug 1 Aug 2 0
2
4
6x 10
8
Date of 2001 (EDT)
HO
2 (c
m-3)
HO
2 (c
m-3)
HO
2 (c
m-3)
Fig. 6. Time series of 1-min average HO2 measurements (small dots) during the PMTACS-NY2001 campaign. Time is in local daylight
time (EDT), which is 1:05 later than the local solar time.
0:00 6:00 12:00 18:00 0:000
10
20
30
40
Time of day (EDT)
0
10
20
30
40
HO
2/O
H r
atio
NO
(pp
bv)
Fig. 7. Composite diurnal variation of measured HO2/OH
ratios during the PMTACS-NY2001 campaign. The small dots
show all 10-min average data and the solid circles indicate the
median diurnal variation of HO2/OH ratios in 1 h intervals.
Average diurnal profile of measured NO is shown as the thick
line.
X. Ren et al. / Atmospheric Environment 37 (2003) 3627–36373634

HO2/OH ratios appeared in the early morning at around
4:00–10:00 when the NO concentrations were usually
high. In the afternoon, NO was lower than in the
morning, leading to the higher HO2/OH ratios.
3.5. OH reactivity measurements
As discussed by Kovacs et al. (2003), an important
consideration for the OH reactivity measurements in
polluted environments is the recycling of the HO2 by
reaction (R4), which slows the OH decay. The kinetic
rate equation for OH thus becomes
d½OHdt
¼ �ktotal½OH þ kNOþHO2½NO½HO2: ð5Þ
Inverting this equation to get the corrected OH
reactivity, k0OH; in the equation
k0OH ¼ kOH þ kNOþHO2
½NOSHO2
SOH; ð6Þ
where SHO2=SOH ¼ ½HO2=½OH; since the detector
calibrations for OH and HO2 are the same. HO2 signal
decays were measured by adding pure NO downstream
of the inlet in the lower pressure sampling tube upstream
of the detection axis. The average of SHO2=SOH was
about 4.971.5. Using the measured NO concentrations,
the observed kOH values were corrected. For the kOH of
10 s�1 and NO o1.0 ppbv, k0OH was less than 1.10 times
kOH; when NO was 5 ppbv, k0OH was 1.48 times kOH; and
when NO was 10 ppbv, k0OH was 1.97 times kOH. Recent
laboratory studies show that, within the NO range of
0–25 ppbv, which includes 90% of the measurements in
New York City, the agreement between the calculated
and corrected measured OH reactivity is better than
B10% when SHO2=SOH is measured, while in the higher
NO range (25–100 ppbv), the discrepancy increased to
about 15–50%.
During this campaign, the OH reactivity was typically
20 s�1, with a maximum of B25 s�1 at morning rush
hour and a minimum in the mid-afternoon of B15 s�1
(Fig. 8). These values are about twice those found in
Nashville in 1999 (Kovacs et al., 2003). As in Nashville,
the scatter of OH reactivity measurements is greater at
night than during the day and is smallest in the mid-
afternoon. The OH reactivity correlates well with
measured NOx, with the highest values in the morning
when NOx was higher and the lowest in the afternoon
while NOx was lower. OH lifetime in this environment is
very short, about 0.05 s due to the high concentrations
of pollutants. As shown in the companion paper (Ren
et al., 2003a), the measured OH reactivity agrees to
within 10% with the OH reactivity that is calculated
from the sum of the individual OH reactants and their
rate coefficients.
4. Summary
OH and HO2 radicals were measured during the
PMTACS-NY2001 intensive field campaign by a laser-
induced fluorescence instrument. Average diurnal varia-
tions show that the maximum concentrations of OH and
HO2 were about 7� 106 and 1� 108 cm�3 (4 pptv),
respectively, which usually appeared in the afternoon.
The relationships between OH and NO, HO2 and NO,
and HO2/OH ratio and NO were qualitatively consistent
with our understanding of atmospheric HOx chemistry.
HO2/OH ratios found in this polluted environment are
lower than those obtained in relatively clean atmosphere
due to the relatively high NO concentrations in New
York City. Small but significant OH and HO2 were
frequently observed at night, indicating that OH and
HO2 may play important roles in the nighttime
chemistry of the polluted urban atmosphere. OH
reactivity measurements show that due to high concen-
trations of pollutants, the OH lifetime in this urban
environment was only about 0.05 s. A modeling paper
will describe the comparison of these results with theory
and models.
Acknowledgements
The authors would like to thank Kenneth Demerjian
for asking us to participate in PMTACS-NY2001. We
also thank all the other researchers for their kind
cooperation during this field campaign. Two anonymous
reviewers are acknowledged for providing insightful
comments and suggestions. This work was supported by
NSF (ATM-9974335), the New York State Energy
ARTICLE IN PRESS
0:00 6:00 12:00 18:00 0:000
10
20
30
40
50
Time of day (EDT)
-20
0
20
40
60
80
NO
x (
ppbv
)
OH
rea
ctiv
ity (
s-1 )
Fig. 8. Diurnal variation of OH reactivity measured by
TOHLM. The gray points show all measured values and the
solid circles are the median values in 1-h intervals. Error bars
on circles indicate the absolute uncertainties (1s) of the hourlyaverages. Also shown in the figure as a thick line is the average
diurnal variation of NOx during the campaign.
X. Ren et al. / Atmospheric Environment 37 (2003) 3627–3637 3635

Research and Development Authority (NYSERDA)
(contract x 4918ERTERES99), the US Environmental
Protection Agency (EPA) (cooperative agreement x
R828060010), and New York State Department of
Environmental Conservation (NYS DEC) (contract x
C004210). Although the research described in this article
has been funded in part by the US Environmental
Protection Agency, it has not been subjected to the
Agency’s required peer and policy review and, therefore,
does not necessary reflect the views of the Agency and
no official endorsement should be inferred.
References
Abram, J.P., Creasey, D.J., Heard, D.E., Lee, J.D., Pilling,
M.J., 2000. Hydroxyl radical and ozone measurements in
England during the solar eclipse of 11 August 1999.
Geophysical Research Letters 27, 3437–3440.
Bey, I., Aumont, B., Toupance, G., 2001. A modeling study of
the nighttime radical chemistry in the lower continental
troposphere 1. Development of a detailed chemical mechan-
ism including nighttime chemistry. Journal of Geophysical
Research 106, 9959–9990.
Brune, W.H., Faloona, I.C., Tan, D., Weinheimer, A.J.,
Campos, T., Ridley, B.A., Vay, S.A., Collins, J.E., Sachse,
G.W., Jaegl!e, L., Jacob, D.J., 1998. Airborne in situ OH
and HO2 observations in the cloud-free troposphere and
lower stratosphere during SUCCESS. Geophysical Re-
search Letters 25, 1701–1704.
Cantrell, C.A., Zimmer, A., Tyndall, G.S., 1997. Absorption
cross sections for water vapor from 183 to 193 nm.
Geophysical Research Letters 24, 2195–2198.
Carslaw, N., Creasey, D.J., Harrison, D., Heard, D.E., Hunter,
M.C., Jacobs, P.J., Jenkin, M.E., Lee, J.D., Lewis, A.C.,
Pilling, M.J., Saunders, S.M., Seakins, P.W., 2001. OH and
HO2 radical chemistry in a forested region of north-western
Greece. Atmosphere Environment 35, 4725–4737.
Creasey, D.J., Heard, D.E., Lee, J.D., 2001. OH and HO2
measurements in a forested region of north-western Greece.
Atmosphere Environment 35, 4713–4724.
Creasey, D.J., Heard, D.E., Lee, J.D., 2002. Eastern
atlantic spring experiment 1997 (EASE97) 1. Measurements
of OH and HO2 concentrations at Mace Head, Ireland.
Journal of Geophysical Research 107, 4091, doi:10.1029/
2001JD000892.
DeMore, W.B., Sander, S.P., Golden, D.M., Hampson, R.F.,
Kurylo, M.J., Howard, C.J., Ravishankara, A.R., Kolb,
C.E., Molina, M.J., 1997. Chemical kinetics and photo-
chemical data for use in stratospheric modeling, evaluation
number 12. JPL Publication 97-4, NASA Jet Propulsion
Laboratory, Pasadena, CA.
Donahue, N.M., Kroll, J.H., Anderson, J.G., 1998. Direct
observation of OH production from the ozonolysis of
olefins. Geophysical Research Letters 25, 59–162.
Ehhalt, D.H., Rohrer, F., 2000. Dependence of the OH
concentration on solar UV. Journal of Geophysical
Research 105, 3565–3571.
Eisele, F.L., Mount, G.H., Tanner, D., Jefferson, A., Shetter,
R., Harder, J.W., Williams, E.J., 1997. Understanding the
production and interconversion of the hydroxyl radical
during the tropospheric OH photochemistry experiment.
Journal of Geophysical Research 102, 6457–6465.
Faloona, I., Tan, D., Brune, W., Hurst, J., Barket Jr., D.,
Couch, T.L., Shepson, P., Apel, E., Riemer, D., Thornber-
ry, T., Carroll, M.A., Sillman, S., Keeler, G.J., Sagady, J.,
Hopper, D., Paterson, K., 2001. Nighttime observations of
anomalously high levels of hydroxyl radicals above a
deciduous forest canopy. Journal of Geophysical Research
106, 24315–24333.
George, L.A., Hard, T.M., O’Brien, R.J., 1999. Measurement
of free radicals OH and HO2 in Los Angeles Smog. Journal
of Geophysical Research 104, 11643–11655.
Geyer, A., B.achmann, K., Hofzumahaus, A., Holland, F.,
Konrad, S., Kl .upfel, T., P.atz, H.-W., Perner, D., Mihelcic,
D., Sch.afer, H.-J., Volz-Thomas, A., Platt, U., 2003.
Nighttime formation of peroxy and hydroxyl radicals
during the BERLIOZ campaign: observations and modeling
studies. Journal of Geophysical Research 108, 8249,
doi:10.1029/2001JD000656.
Hanisco, T.F., Smith, J.B., Stimpfle, R.M., Wilmouth, D.M.,
Anderson, J.G., Richard, E.C., Bui, T.P., 2002. In situ
observations of HO2 and OH obtained on the NASA ER-2
in the high-ClO conditions of the 1999/2000 Arctic polar
vortex. Journal of Geophysical Research 107, 8283,
doi:10.1029/2001JD001024.
Hard, T.M., O’Brien, R.J., Chan, C.Y., Mehrabzadeh, A.A.,
1984. Tropospheric free radical determination by FAGE.
Environmental Science and Technology 18, 768–777.
Hard, T.M., Chan, C.Y., Mehrabzadeh, A.A., Pan, W.H.,
O’Brien, R.J., 1986. Diurnal cycle of tropospheric OH.
Nature 322, 617–620.
Hard, T.M., Chan, C.Y., Mehrabzadeh, A.A., O’Brien, R.J.,
1992. Diurnal HO2 cycles at clean air and urban sites
in the troposphere. Journal of Geophysical Research 97,
9785–9794.
Hofzumahaus, A., Aschmutat, U., HeXling, M., Holland, F.,
Ehhalt, D.H., 1996. The measurement of tropospheric OH
radicals by laser-induced fluorescence spectroscopy during
the POPCORN field campaign. Geophysical Research
Letters 23, 2541–2544.
Holland, F., Hofzumahaus, A., Sedlacek, M., Weber, M., 1999.
Measurements of OH and HO2 radicals in clean marine air
during the ALBATROSS campaign. Abstract A11B-15,
AGU Fall Meeting, EOS Transactions, San Francisco,
California, USA.
Holland, F., Hofzumahaus, A., Sch.afer, J., Kraus, A., P.atz, H.,
2003. Measurements of OH and HO2 radical con-
centrations and photolysis frequencies during BERLIOZ.
Journal of Geophysical Research 108, 8246, doi:10.1029/
2001JD001393.
Jenkin, M.E., Saunders, S.M., Pilling, M.J., 1997. The tropo-
spheric degradation of volatile organic compounds: a
protocol for mechanism development. Atmospheric Envir-
onment 31, 81–104.
Kanaya, Y., Sadanaga, Y., Nakamura, K., Akimoto, H., 2001.
Behavior of OH and HO2 radicals during the ob-
servations at a remote island of Okinawa (ORION99) field
campaign 1. Observation using a laser-induced fluore-
scence instrument. Journal of Geophysical Research 106,
24197–24208.
ARTICLE IN PRESSX. Ren et al. / Atmospheric Environment 37 (2003) 3627–36373636

Kovacs, T.A., Brune, W.H., 2001. Total OH loss rate
measurement. Journal of Atmospheric Chemistry 39,
105–122.
Kovacs, T.A., Brune, W.H., Harder, H., Martinez, M., Simpas,
J.B., Frost, G.J., Williams, E., Jobson, T., Stroud, C.,
Young, V., Fried, A., Wert, B., 2003. Direct measurements
of urban OH reactivity during Nashville SOS in summer
1999. Journal of Environmental Monitoring 5, 68–74,
doi:10.1039/b204339d.
Kroll, J.H., Clarke, J.S., Donahue, N.M., Anderson, J.G.,
Demerjian, K.L., 2001. Mechanism of HOx formation in the
gas-phase ozone–alkene reaction. 1. Direct, pressure-depen-
dent measurements of prompt OH yields. Journal of
Physical Chemistry A 105, 1554–1560.
Martinez, M., Harder, H., Kovacs, T.A., Simpas, J.B., Bassis,
J., Lesher, R., Brune, W.H., Williams, E.J., Stroud, C.A.,
Frost, G., Hall, S.R., Shetter, R.E., Wert, B., Fried, A.,
Alicke, B., Stutz, J., 2003. OH and HO2 concentrations,
production and loss rates during the Southern Oxidant
Study in Nashville, TN, summer 1999. Journal of Geophy-
sical Research, submitted for publication.
Martinez, M., Harder, H., Simpas, J.B., Brune, W.H.,
Williams, E.J., Hall, S.E., Shetter, R.E., 2000. OH and
HO2 variations during summertime Nashville Southern
Oxidant Study in 1999. Abstract A71E-10, AGU Fall
Meeting, EOS Transactions, San Francisco, California,
USA.
Martinez, M., Harder, H., Brune, W., Di Carlo, P., Williams,
E., Hereid, D., Jobson, T., Kuster, W., Roberts, J., Trainer,
M., Fehsenfeld, F.C., Hall, S., Shetter, R., Apel, E., Riemer,
D., Geyer, A., 2002. The behavior of the hydroxyl and
hydroperoxyl radicals during TexAQS2000. Abstract
A12D-0174, AGU Fall Meeting, EOS Transactions, San
Francisco, California, USA.
Mather, J.H., Stevens, P.S., Brune, W.H., 1997. OH and HO2
measurements using laser-induced fluorescence. Journal of
Geophysical Research 102, 6427–6436.
Mauldin III, R.L., Tanner, D.J., Eisele, F.L., 1999. Measure-
ments of OH during PEM-Tropics A. Journal of Geophy-
sical Research 104, 5817–5827.
McKeen, S.A., Mount, G., Eisele, F., Williams, E., Harder, J.,
Goldan, P., Kuster, W., Liu, S.C., Baumann, K., Tanner,
D., Fried, A., Sewell, S., Cantrell, C., Shetter, R., 1997.
Photochemical modeling of hydroxyl and its relationship to
other species during the Tropospheric OH Photo-
chemistry Experiment. Journal of Geophysical Research
102, 6467–6493.
Mount, G.H., Brault, J.W., Johnston, P.V., Marovich, E.,
Jakoubek, R.O., Volpe, C.J., Harder, J., Oslon, J., 1997.
Measurement of tropospheric OH by long-path laser
absorption at Fritz Peak Observatory, Colorado, during
the OH photochemistry experiment, fall 1993. Journal of
Geophysical Research 102, 6393–6413.
Paulson, S.E., Orlando, J.J., 1996. The reaction of ozone with
alkenes: an important source of HOx in the boundary layer.
Geophysical Research Letters 23, 3727–3730.
Ren, X., Harder, H., Martinez, M., Lesher, R.L., Oliger, A.,
Simpas, J.B., Brune, W.H., Schwab, J.J., Demerjian, K.L.,
He, Y., Zhou, X., Gao, H., 2003a. OH and HO2 Chemistry
in the urban atmosphere of New York City. Atmospheric
Environment, this issue, X-ref: doi:10.1016/S1352-
2310(03)00459-X.
Ren, X., Harder, H., Martinez, M., Faloona, I., Tan, D.,
Lesher, R.L., Dicarlo, P., Simpas, J.B., Brune, W.H., 2003b.
Interference testing for atmospheric HOx measurements by
laser-induced fluorescence. Manuscript in preparation.
Ren, X., Harder, H., Martinez, M., Lesher, R.L., Brune, W.H.,
2003c. Nighttime observations of OH and HO2 radicals in
New York City. Manuscript in preparation.
Smith, G.P., Crosley, D.R., 1990. A photochemical model of
ozone interference effects in laser detection of tropospheric
OH. Journal of Geophysical Research 95, 16427–16442.
Stevens, P.S., Mather, J.H., Brune, W.H., 1994. Measurement
of tropospheric OH and HO2 by laser-induced fluore-
scence at low pressure. Journal of Geophysical Research 99,
3543–3557.
Stevens, P.S., Mather, J.H., Brune, W.H., 1997. HO2/OH and
RO2/HO2 ratios during the tropospheric OH photochem-
istry experiment: measurement and theory. Journal of
Geophysical Research 102, 6379–6391.
Tan, D., Faloona, I., Simpas, J.B., Brune, W., Olson, J.,
Crawford, J., Avery, M., Sachse, G., Vay, S., Sandholm, S.,
Guan, H.-W., Vaughn, T., Mastromarino, J., Heikes, B.,
Snow, J., Podolske, J., Singh, H., 2001a. OH and HO2 in the
tropical pacific: results from PEM-Tropics B. Journal of
Geophysical Research 106, 32667–32681.
Tan, D., Faloona, I., Simpas, J.B., Brune, W., Shepson, P.B.,
Couch, T.L., Sumner, A.L., Carroll, M.A., Thornberry, T.,
Apel, E., Riemer, D., Stockwell, W., 2001b. HOx budgets in
a deciduous forest: results from the PROPHET summer
1998 campaign. Journal of Geophysical Research 106,
24407–24427.
Wennberg, P.O., Cohen, R.C., Hazen, N.L., Lapson, L.B.,
Allen, N.T., Hanisco, T.F., Oliver, J.F., Lanham, N.W.,
Demusz, J.N., Anderson, J.G., 1994. Aircraft-borne, laser-
induced fluorescence instrument for the in situ detection of
hydroxyl and hydroperoxyl radicals. Review of Scientific
Instruments 65, 1858–1876.
Zeng, G., Heard, D.E., Pilling, M.J., Robertson, S.H., 1998. A
master equation study of laser-generated interference in the
detection of hydroxyl radicals using laser-induced fluores-
cence. Geophysical Research Letters 25, 4497–4500.
ARTICLE IN PRESSX. Ren et al. / Atmospheric Environment 37 (2003) 3627–3637 3637