
OH and HO 2 measurements using laser-induced fluorescence
10
JOURNAL OF GEOPHYSICAL RESEARCH, VOL. 102, NO. D5, PAGES 6427-6436, MARCH 20, 1997 OH and HO: measurements using laser-induced fluorescence James H. Mather,Philip S. Stevens, 1 andWilliam H. Brune Department of Meteorology, Pennsylvania State University,University Park Abstract. During Augustand September 1993a laser-induced fluorescence (LIF) instrument was used to observe OH and HO• as part of the Tropospheric OH Photochemistry Experiment (TOHPE) in the mountains west of Boulder, Colorado. A prototype version of this instrumenthas been described previously. Modifications were made to the instrument for TOHPE, including the integration of a new dye laser. The instrument was calibrated by producing known amounts of OH and HO• above the instrument inlet. HO• was measuredon 19 days during TOHPE, while OH was measured on 5 days. Although poor laserperformance limited the detection limit to 1 to 2x 10 • cm -• for an integration time of 300s anda signal-to-noise ratio of 1, OH concentrations were observed to reach 3 to 7x10 c cm -• near midday. HO• typically peaked near1x10 s cm -•. HO• consistently reached its maximum near local noon. Observations made with the LIF instrument are compared with observations made with an ion-assisted technique. Introduction The hydroxylradical (OH) is the mostimportant ox- idant in the atmosphere. It is involved in nearly every aspectof atmospheric chemistrythrough reactions with CO, CH4, 03, NO2, SO2, and numerous nonmethane hydrocarbons [Crosley, this issue; Thompson, 1992; Lo- gan et al., 1981; Crutzen, 1974; Levy, 1971). Conse- quently, measurements of OH are necessary to verify the understandingof many atmospheric chemistry pro- cesses. Because OH is very reactive, however, its am- bient concentration is very low (typically <0.3 ppt), so measurements of OH have proven to be very di•cult. We have developed an instrument that measuresOH usinglaser-induced fluorescence (LIF) [Baardsen and Terhune, 1972; Wang et al., 1975; Wang and Davis, 1974; Hard et al., 1992, 1986, 1984; Chan et al., 1990; Holland et al., 1995]. A description of this instrument along with the results of early measurements are re- portedby Stevens et al. [1994, hereinafter SMB]. Mea- surements were also made with the instrument dur- ing the Rural Oxidants in the SouthernEnvironment II (ROSE II) experiment in June 1992. Results from ROSE II are described by Mather [1994]. Early LIF techniques experienced di•culties, includ- ing a laser-generated OH interference and saturation of the OH electronic transition[Smithand Crosley, 1990; 1Now at School of Public and EnvironmentalAffairs, In- diana University, Bloomington. Copyright 1997 by the American Geophysical Union. Paper number 96JD01702. 0148-0227 / 97 / 96 JD-01702 $09.00 Ortgies, 1981]. Theseissues are minimized in our sys- tem by usinga high repetitionrate (10 kHz) laserand exciting OH in the A•E+(v"=0) - X•I/+(v'=0) transi- tion at 308 nm. The high repetition rate allows for a high average laserpowerwhile maintaining low energy in eachpulse. Exciting OH at 308 nm substantially re- duces the laser-generated OH interference becausethe production of O(1D) from the photolysis of ozone is substantially less there than at 282 nm where early ex- periments wereperformed (SMB). In addition to measuringOH, our instrument detects HO• by convertingit to OH through the reaction HO2 q- NO -• OH + NO2. (1) Calculations indicate that the ratio of [HO2] to [OH] is very sensitive to the localphotochemistry [Stevens et al., this issue]. Because of the sensitivity of this ratio to the environment the simultaneous measurement of OH and HO2 is an important component of a photochem- istry study. This paper describes our participation in the Tropo- sphericOH Photochemistry Experiment (TOHPE) in the mountains west of Boulder, Colorado, as well as modifications made to the instrument for this experi- ment. TOHPE was held in August 1993 through Oc- tober 1993 and provided a good test for several OH measurement techniques, including our laser-induced fluorescence (LIF) instrument, a long-path absorption technique [Mount et al., this issue] and an ion-assisted chemical technique [Tanneret al., this issue]. This ex- periment also provided an opportunity to test the pho- tochemistry of OH by measuringnumerous important tracespecies andmeteorological parameters [Mountand Williams, this issue]. 6427
-
Upload
independent -
Category
Documents
-
view
2 -
download
0
Transcript of OH and HO 2 measurements using laser-induced fluorescence
JOURNAL OF GEOPHYSICAL RESEARCH, VOL. 102, NO. D5, PAGES 6427-6436, MARCH 20, 1997
OH and HO: measurements using laser-induced fluorescence
James H. Mather, Philip S. Stevens, 1 and William H. Brune Department of Meteorology, Pennsylvania State University, University Park
Abstract. During August and September 1993 a laser-induced fluorescence (LIF) instrument was used to observe OH and HO• as part of the Tropospheric OH Photochemistry Experiment (TOHPE) in the mountains west of Boulder, Colorado. A prototype version of this instrument has been described previously. Modifications were made to the instrument for TOHPE, including the integration of a new dye laser. The instrument was calibrated by producing known amounts of OH and HO• above the instrument inlet. HO• was measured on 19 days during TOHPE, while OH was measured on 5 days. Although poor laser performance limited the detection limit to 1 to 2x 10 • cm -• for an integration time of 300 s and a signal-to-noise ratio of 1, OH concentrations were observed to reach 3 to 7x10 c cm -• near midday. HO• typically peaked near 1x10 s cm -•. HO• consistently reached its maximum near local noon. Observations made with the LIF instrument are compared with observations made with an ion-assisted technique.
Introduction
The hydroxyl radical (OH) is the most important ox- idant in the atmosphere. It is involved in nearly every aspect of atmospheric chemistry through reactions with CO, CH4, 03, NO2, SO2, and numerous nonmethane hydrocarbons [Crosley, this issue; Thompson, 1992; Lo- gan et al., 1981; Crutzen, 1974; Levy, 1971). Conse- quently, measurements of OH are necessary to verify the understanding of many atmospheric chemistry pro- cesses. Because OH is very reactive, however, its am- bient concentration is very low (typically <0.3 ppt), so measurements of OH have proven to be very di•cult.
We have developed an instrument that measures OH using laser-induced fluorescence (LIF) [Baardsen and Terhune, 1972; Wang et al., 1975; Wang and Davis, 1974; Hard et al., 1992, 1986, 1984; Chan et al., 1990; Holland et al., 1995]. A description of this instrument along with the results of early measurements are re- ported by Stevens et al. [1994, hereinafter SMB]. Mea- surements were also made with the instrument dur-
ing the Rural Oxidants in the Southern Environment II (ROSE II) experiment in June 1992. Results from ROSE II are described by Mather [1994].
Early LIF techniques experienced di•culties, includ- ing a laser-generated OH interference and saturation of the OH electronic transition [Smith and Crosley, 1990;
1Now at School of Public and Environmental Affairs, In- diana University, Bloomington.
Copyright 1997 by the American Geophysical Union.
Paper number 96JD01702. 0148-0227 / 97 / 96 JD- 01702 $09.00
Ortgies, 1981]. These issues are minimized in our sys- tem by using a high repetition rate (10 kHz) laser and exciting OH in the A•E+(v"=0) - X•I/+(v'=0) transi- tion at 308 nm. The high repetition rate allows for a high average laser power while maintaining low energy in each pulse. Exciting OH at 308 nm substantially re- duces the laser-generated OH interference because the production of O(1D) from the photolysis of ozone is substantially less there than at 282 nm where early ex- periments were performed (SMB).
In addition to measuring OH, our instrument detects HO• by converting it to OH through the reaction
HO2 q- NO -• OH + NO2. (1)
Calculations indicate that the ratio of [HO2] to [OH] is very sensitive to the local photochemistry [Stevens et al., this issue]. Because of the sensitivity of this ratio to the environment the simultaneous measurement of OH
and HO2 is an important component of a photochem- istry study.
This paper describes our participation in the Tropo- spheric OH Photochemistry Experiment (TOHPE) in the mountains west of Boulder, Colorado, as well as modifications made to the instrument for this experi- ment. TOHPE was held in August 1993 through Oc- tober 1993 and provided a good test for several OH measurement techniques, including our laser-induced fluorescence (LIF) instrument, a long-path absorption technique [Mount et al., this issue] and an ion-assisted chemical technique [Tanner et al., this issue]. This ex- periment also provided an opportunity to test the pho- tochemistry of OH by measuring numerous important trace species and meteorological parameters [Mount and Williams, this issue].
6427
6428 MATHER ET AL.: OH AND HO2 MEASUREMENTS USING LIF
TOHPE was our first opportunity to compare with other OH instruments. In addition, the extensive set of supporting measurements described throughout this issue provide an excellent data set to study the [HO2]/[OH] ratio. The TOHPE site was particularly well suited for the study of this ratio because of the presence of two distinct meteorological flow regimes [Olson et al., this issue; Baumann et al., this issue] producing relatively clean and polluted conditions.
Instrument Description The version of the instrument used for TOHPE was
similar to the one described in SMB; however, sev- eral significant modifications have been made, includ- ing the replacement of the dye laser. Previous versions of the instrument used a Lambda Physik FL-3001 dye laser, but this was replaced with a prism-tuned dye laser that was designed and built at Harvard Univer- sity [Wennberg et al., 1994]. This laser is very compact and all the optics are housed in a sealed enclosure, so the system can be kept at a constant temperature and pressure. Thus the Harvard laser is better suited to field use than the Lambda Physik laser.
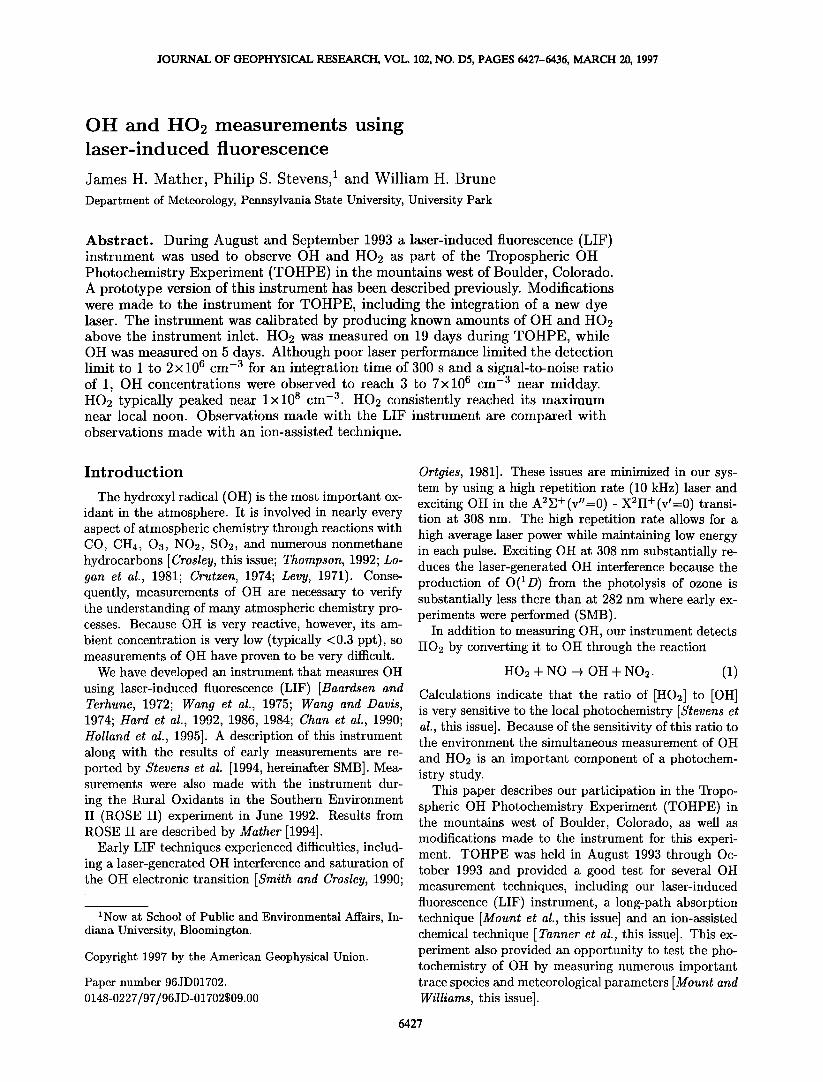
A schematic of the instrument is shown in Figure 1. The lasers were mounted on an optical bench in a trailer
Inlel
Deleclion cell While cell
Trailer
UV beam
Dye laser OH Relerence cell
Cu-vapor laser
lo pump
Figure 1. Schematic of the OH/HO2 laser-induced flu- orescence (LIF) instrument. The lasers were mounted on an optical bench in a trailer for the Tropospheric OH Photochemistry Experiment (TOHPE). The detec- tion cell was mounted on a tower that was rigidly at- tached to the trailer with the inlet located 1.9 m above
the dye laser optical axis. The laser beam was steered through a quartz window in the roof and into the detec- tion cell. Three mechanical vacuum pumps drew ambi- ent air through the detection cell.
for TOHPE. To determine when the laser is on the OH
absorption line, the UV beam is passed through an OH reference cell after exiting the dye laser en route to the detection cell. In the reference cell, a high concentra- tion of OH is generated by passing ambient air at a pressure of 1-2 hPa over a 25-W alumel filament which induces the formation of OH from water vapor. A pho- tomultiplier tube (Hamamatsu 760) with a UG-11 filter and an interference filter is then used to detect fluo-
rescence. Typical signals are 1000-3000 counts/s on a background of 200-500 counts/s. The reference cell is used to observe OH absorption lines by scanning the laser wavelength.
After exiting the reference cell, the beam is steered into the detection cell with a series of tiltable mirrors.
A quartz window was fitted into the roof of the trailer to allow the UV beam to pass through the roof and enter the detection chamber. The detection cell utilizes
a 24-pass White cell [White, 1942; Pickett et al. 1970]. Ambient air enters the detection chamber via a 1.0-
mm orifice above the laser multipass region. Typically, three pumps (Leybold D25B) were operated in paral- lel to give a volume flow rate of 24 L/s at 5-7 hPa, approximately 30% lower than for the prototype in- strument. At this operating pressure the fluorescence lifetime of OH is 100-200 ns. This extended lifetime
provides an opportunity for separating OH fluorescence from the prompt laser scatter that occurs at the same wavelength. The laser scatter is removed with temporal filtering by turning on a microchannel plate photomulti- plier tube (MCP-PMT) detector after the scattering has dropped to or below OH signal levels. The MCP-PMT (Hamamatsu R2024) can be turned on in less than I ns by applying a 10-V pulse to a gate behind the cathode. The ratio of the gain in the "on" state versus the "off" state is 9000; however, for typical discriminator levels in the photon-counting electronics the actual signal atten- uation in the off state is a factor of 1000. The detector
was typically turned on 30-50 ns after the leading edge of the laser pulse exited the White cell and was turned off 300 ns later.
Despite the use of temporal filtering a background signal remained which had to be subtracted from the OH fluorescence. The background resulted from laser scattering from air in the detection cell and from the cell walls, the slow decay of the dye laser pulse, and solar scattering. One of two methods are used to determine the background signal (SMB). First, the signal is chem- ically modulated by adding a reagent to the main flow which selectively removes OH leaving only the back- ground. We chose hexafiuoropropylene (CF2CFCF3) to remove OH because it reacts quickly with OH, but it contains no hydrogen and thus cannot act as an OH source [Mcllroy and Tully, 1993; Dubey et al., 1996]. During TOHPE a flow of 0.8 cm 3 STP/s CF2CFCF3 was used.
The second technique used to determine the back- ground is spectral modulation. This method involves

MATHER ET AL.' OH AND HO2 MEASUREMENTS USING LIF 6429
tuning the dye laser on and off an OH absorption line. OH lines in the A-X band are very narrow with widths of about 0.1 cm -1. The background signal has no spec- tral features on this scale, so when tuning the laser across an OH line, the background does not change. Thus either adding CF2CFCF3 to the flow or tuning off the absorption line reduces the signal to its background component.
This instrument detects HO2 by converting it to OH through the addition of NO to the sample flow. An HO2 signal is obtained by alternately turning on and off a 0.02 cm 3 STP/s NO flow. The difference in the OH sig- nal for the two cases is due to converted H O2. Figure 2 shows raw data from a HO2 detection period. The three peaks correspond to periods when NO was being added. The lower level of 40-50 counts/s is due primarily to the background signal described above. The transition between HO2 detection and background states is very sharp, indicating that the NO is rapidly purged from the detection cell.
Instrument Calibration
The relationship between the MCP-PMT output and the OH concentration can be described by an equation of the form
So. = Co. [0}•]. (2)
where Sou is the measured fluorescence and Co}• is the sensitivity coefficient. Co}• depends on a number of sys- tem parameters, including the ratio of the air density in
150
lOO
5o
11:28 11'30 11:32 11'34 11:36
Time (MST) Figure 2. A segment of 1-s integrated HO2 data from September 12, 1993. The UV laser power for this series was 0.6-0.7 mW. This series illustrates the typical noise level experienced during TOHPE. The three peaks cor- respond to periods of NO addition and are due to OH converted from HO2.
Table 1. The Ranges and Uncertainties Associated With Each Term in the Calibration Equation
Calibration Term Parameter Value Uncertainty
[H20], cm -3 4x 10¹⁶-2x 10¹⁷ 10% CrH20, cm 2 5.5x10 -2ø 10% T, ms 55-65 40% •185, photons cm-2s -1 1.O-1.5xlO 12 20%
the detection cell to the density of the ambient air and the fraction of excited OH radicals that decay through fluorescence (SMB). Coil can be calculated from known system parameters; however, in practice, such a calcu- lation is not sufficient and Coil must be calibrated by measuring known concentrations of OH.
The instrument was calibrated both in the laboratory and in the field to determine Coil. To make OH, a flow of H20 in N2 was irradiated with 185-nm light from a mercury lamp which photodissociated the water into H + OH. Because the hydrogen quickly reacts with trace 02 in the flow to form HO2, this source produces equal amounts of OH and HO2. The amount of OH produced is given by the equation
[OH]- [H20 ] O-H20 t •)185, (3)
where rr}•.o is the absorption cross section of water at 185 nm, t is the time the stream is exposed to the mer- cury lamp flux, and •bx85 is the flux at 185 nm. The cross section of water at 185 nm is 5.5x10 -2ø cm 2 [DeMote et al., 1992]. (Several ongoing studies indicate that this value for the cross section of water may have to be re- vised. A change in this parameter would directly affect the instrument sensitivity calculation.) The water va- por concentration was measured with a Licor CO2/H20 analyzer (model 6262). The exposure time was deter- mined by measuring the mass flow through the OH source. The UV flux was measured with a Hamamatsu
Rl187 phototube, calibrated against a NIST standard photodiode. The range of values for [H20], t, and •b used during calibration along with the uncertainty as- sociated with each term is shown in Table 1. The re-
sulting uncertainty in [OH] and, consequently, in the absolute calibration is +50%. The precision of the cali- bration measurements was limited to approximately 1% of the sensitivity coefficient for [OH] > lx 108 cm -3 by the water vapor measurement.
The OH source, shown in Figure 3, mounts over the detection cell inlet. Before entering the source, a flow of approximately 600 cm 3 STP/s of N2 (liquid N2 boil off) is passed through a hopcalite filter to remove CO and is then humidified by bubbling it through distilled water. In the source chamber the flow is diffused by a stack of screens and then enters the photolysis region. By varying the water vapor concentration, the source can produce OH in the range of 1.0x10⁷ to 8.0x10⁸
--3 cm .

6430 MATHER ET AL.' OH AND HO2 MEASUREMENTS USING LIF
N 2 with H20
25 cm
Screen Stack
Photodiode
Flow Diffuser
A•rture
Mercury Lamp
Detection Cell Inlet
Figure 3. OH source for calibration. A flow of N2- containing water vapor is exposed to a mercury lamp beam. The UV light photolyzes H20 in the flow to form OH and H. The UV flux is measured with a calibrated
photodiode. Knowing the UV flux, the H20 concen- tration, and the exposure time, the OH concentration produced by the source is calculated.
Figure 4 shows the laboratory calibration results. These data were obtained during eleven separate tests over a period of 5 weeks. Each point represents an av- erage of 100 15-s measurements. The downward trend in Coil with increasing OH is mainly due to quenching by H20. Other contributing processes are now being investigated [Hofzurnahaus et al., 1996]. Extrapolat- ing these data to [OH] - 0 cm -3 (and thus [H20]-0 cm -3) gives the sensitivity coefficient in N2, Coil(N2) = 2.4x10 -6 (counts/s)/(cm -3 roW). To convert this value to the sensitivity for TO HPE, two factors have to be considered. First, the internal to external den- sity ratio increased from roughly 0.007 in the lab to 0.0095 during TOHPE. Second, quenching was higher during TOHPE than during the calibration because the measurements were performed in air. Taking these fac- tors into account, the corrected calibration for TOHPE conditions was 2.1x10 -6 (counts/s)/(cm -3 roW)in dry air. Quenching by water at the levels present during TO HPE can decrease this figure by a few percent. A calibration with the same OH source was performed in the field during TOHPE. Accounting for the effects of quenching, this calibration yielded a value for Coil of 2.2x10 -6 (counts/s)/(cm -3 mW)in dry air. The laboratory-derived sensitivity coefficient was applied to all TO HPE measurements. For each measurement the
coefficient was scaled to account for changes in the am- bient air density and water vapor concentration.
A problem with the new dye laser was discovered which has required that a correction be made to the calibration. By observing the output of the laser with a spectrometer, it was discovered that the laser slipped in and out of a multimode state. In this multimode state, more than one wavelength was present in the UV beam. This effect has important consequences for determining the instrument calibration. The calibration depends on the laser power at the excitation wavelength, but the UV monitor measures the power associated with all las- ing modes. We have compensated for this problem with the help of the OH reference cell.
Because the reference cell measures OH fluorescence, the reference signal is roughly proportional to that part of the laser beam responsible for exciting OH. Figure 5 shows the reference cell signal plotted against measured laser power for a series of calibration experiments. The mean ratio of the reference cell signal to laser power is 8000 (arbitrary units) with a standard deviation of 1100. The ratio obtained during the TOHPE calibra- tion was higher by a factor equal to the ratio of the
0 4-1 0 '06 .
H20 Concentration (cm '3) 5.1016 1.1017 1.5.10 •7
' ' i .... i .... i ß
3-1 0 '06
2-1 0 '06
1 * 1 0 '06
Figure 4.
+
+++ +
+ ++++'++ + +++ -t- +++ 4- +
MATHER ET AL.' OH AND HO2 MEASUREMENTS USING LIF 6431
25OO
2OOO
1500
1000
5OO
.... i .... i .... i .... i .... i ....
0.05 0.1 0.15 0.2 0.25 0.3
Laser Power (arbitrary units)
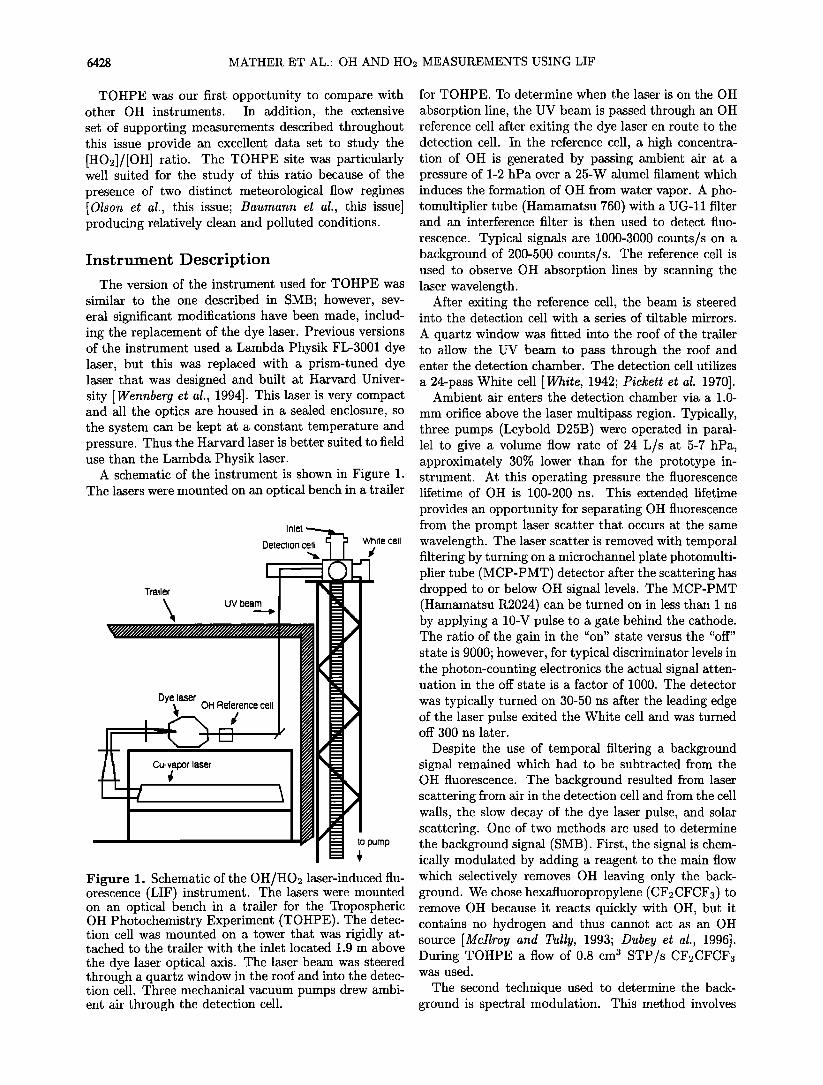
Figure 5. Relationship of the reference cell signal to laser power for the laboratory calibration. This rela- tionship was used to correct for the multimode laser operation. Each point is the average reference signal plotted against the average laser power for a given cali- bration experiment. The error bars represent the stan- dard deviation of the reference signal for each measure- ment. The mean reference cell signal to laser power ratio is 8000 with a standard deviation of 1100.
ambient pressure of the two sites. The TOHPE ratio was used as a benchmark to monitor the lasing mode. If the ratio deviated by more than 25% from the ref- erence value, the laser power was adjusted to achieve the correct ratio. This adjustment introduces an addi- tional uncertainty of approximately a factor of 2 in the absolute calibration.
The actual system sensitivity obtained during TOHPE was considerably less than anticipated be- cause of two laser issues. First, the laser power was very low throughout the experiment ranging from about 0.2 to 3.0 mW of UV. The multimode condition further
reduced the power available to excite OH. Optimum instrument performance requires 10 to 15 mW of UV so the instrument 's sensitivity was degraded consider- ably. Furthermore, the background signal per unit laser power was much higher than had been previously ob- served. This background was apparently due to a long decay time of the UV laser pulse exiting the dye laser. The high background degraded the instrument 's signal to noise ratio which necessitated long integration times to extract OH concentrations. These problems did not affect the detection of HO2 during the day because sig- nals were comfortably above the noise; however, they did make it difficult to observe the decay of HO2 after sunset. The minimum detectable concentration of OH
or HO2 (denoted [X]rnin)is given by:
[X]min - (CoH) kg (4)
where S/N is the signal-to-noise ratio, Coil is the sen- sitivity coefficient, rYbkg is the standard deviation of the background signal, and t is the integration time in sec- onds. For the analysis of the TOHPE data, a signal- to-noise ratio of 1 was used. The minimum detectable
signal during TO HPE for integration times of 300s was 1-2x 106 cm -3.
If there are no reactive impurities in the flow, the calibration source produces equal amounts of OH and H O2. Consequently, it can also be used to measure the HO2 to OH conversion efficiency, an additional un- certainty in the H O2 measurement. To determine the conversion efficiency, a 10 cm 3 STP/s flow of CO (12 ppm in N2) was added to the flow upstream of the mer- cury lamp. Adding the CO converted 75% of the OH to H O2 through the reactions
OH+CO -• H+CO2 (5) H+02+M -• HO2+M. (6)
Inside the cell, NO was added to the flow to convert HO2 to OH. Because we observe no inlet losses, the conver- sion efficiency is given by the ratio of the increased HO2 measured after adding CO to the decrease in the mea- sured OH. Measurements made in the laboratory using this technique indicate that the conversion efficiency is 93+5%.
The high conversion efficiency is supported by field tests with the calibration source (Figure 6). The top panel in Figure 6 indicates periods when CF2CFCF3 or NO were added. The source should produce equal amounts of OH and HO2 and nearly equal amounts of OH and HO2 were observed. Thus if the conversion ef- ficiency was significantly less than 1, this loss was bal- anced by losses of OH to reactions with impurities and losses on the inlet. The conclusion of these tests is that
the conversion efficiency of HO2 to OH is close to 1. With the conversion efficiency known, the same cali- bration applies to both OH and HO2. Consequently, the ratio of [HO2] to [OH] can be measured more ac- curately than the concentration of either OH or HO2 taken separately.
Measurements
During TOHPE, HO2 concentrations were measured on 19 days from August 24 (day number 236) to Septem- ber 20 (day number 263). Figure 7 shows a time series of H O2 measurements for September. The diurnal sig- nature of HO2 is evident in these data. As shown in
Figure 8, concentrations rise rapidly in the morning, peak near local noon, and decay slowly in the after- noon. OH data were obtained on five days between September 10 and September 20. Prior to September 10 a small leak in the NO gas handling system con- taminated OH measurements. The following discussion concentrates on two days on which OH was measured free of contamination, September 12 and 20.
6432 MATHER ET AL.' OH AND HO2 MEASUREMENTS USING LIF
2OO
150
100
5O
C3F6 • NO
/oo ? 0000 0000000 0000 0000
--- signal
o--o gas status .,,--'"' - HO2=49 cts s -•
OH=47 cts s '•
Background ,,,""' I I I I ß ß I ß ß ß I ß ß ß I ß ß ß I ß ß ß I ß ß ß I ß ß
11'10 11'12 11'14 11:16
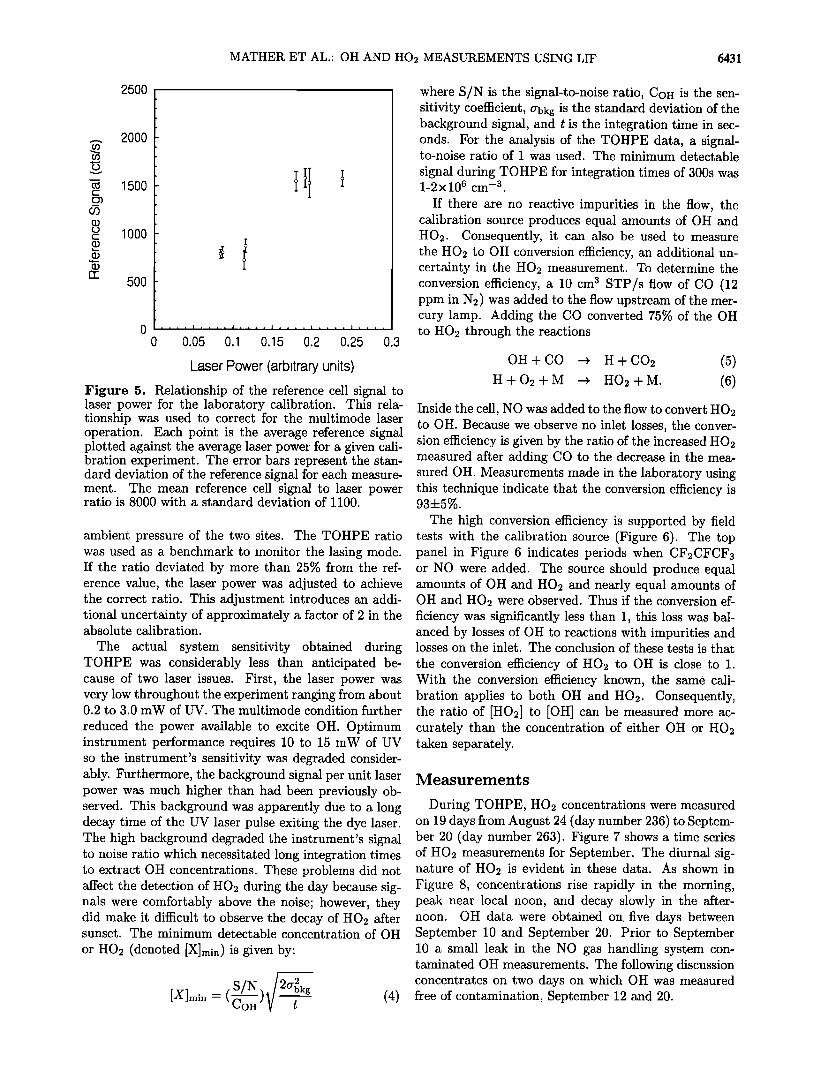
Time (MST) Figure 6. Raw data series from the September 16 field calibration. The OH source should produce equal quan- tities of OH and H02. These data show that equal amounts of OH and H02 are observed. The top trace indicates whether NO, CF2CFCF3 or neither is being added to the flow. The bottom trace is the raw data. For periods when no gas was added, the signal is due to the combination of OH fluorescence and background. The addition of CF2CFCF3 reduces the signal to the background alone, while the addition of NO converts H02 to OH so the signal is due to OH, H02, and back- ground.
2O
15
10 • ß 5 :
ß
243 244 245
20
I . , i , I ß . ß i i i
246 247 248 249 250
15
ß ß
10 ,, 'i' .;; •'., 5 '. '•1 'i "
, , i i , . - • . . . i . . . i ß ß ß i . . . i . . 250 251 252 253 254 255 256 257
20
15
•0 ß !
'"' i , , , i , i ß ß i ß ß i . , ß i . . ß i ß
257 258 259 260 261 262 263 264
Day of Year (MST) Figure 7. HO2 data for 3 weeks of TOHPE from Au- gust 31 to September 20. The data shown are 1-min averages. In a typical chemical modulation cycle, NO was added for 1 min then was turned off for 1 min to
obtain the background. Detection of HO2 near sunrise and sunset was hampered during TOHPE by a mini- mum detection limit of 1-2x106 cm -3.
15
10
o o
o
o o o o
o
o o o
o ' 0 0
o ø o u u • 0 0 'O
5 o o o 0o
o o
o o o
0.2 0.3 0.4 0.5 0.6 0.7
o o
0.8 o.g
Fractional Day (MST) Figure 8. A composite of HO2 data from eight days during TO HPE. Although there is scatter in the data, a diurnal signature with a peak near local noon is evident.
255.3 255.5 255.7
255.3 255.5 255.7
Day of Year (MST)
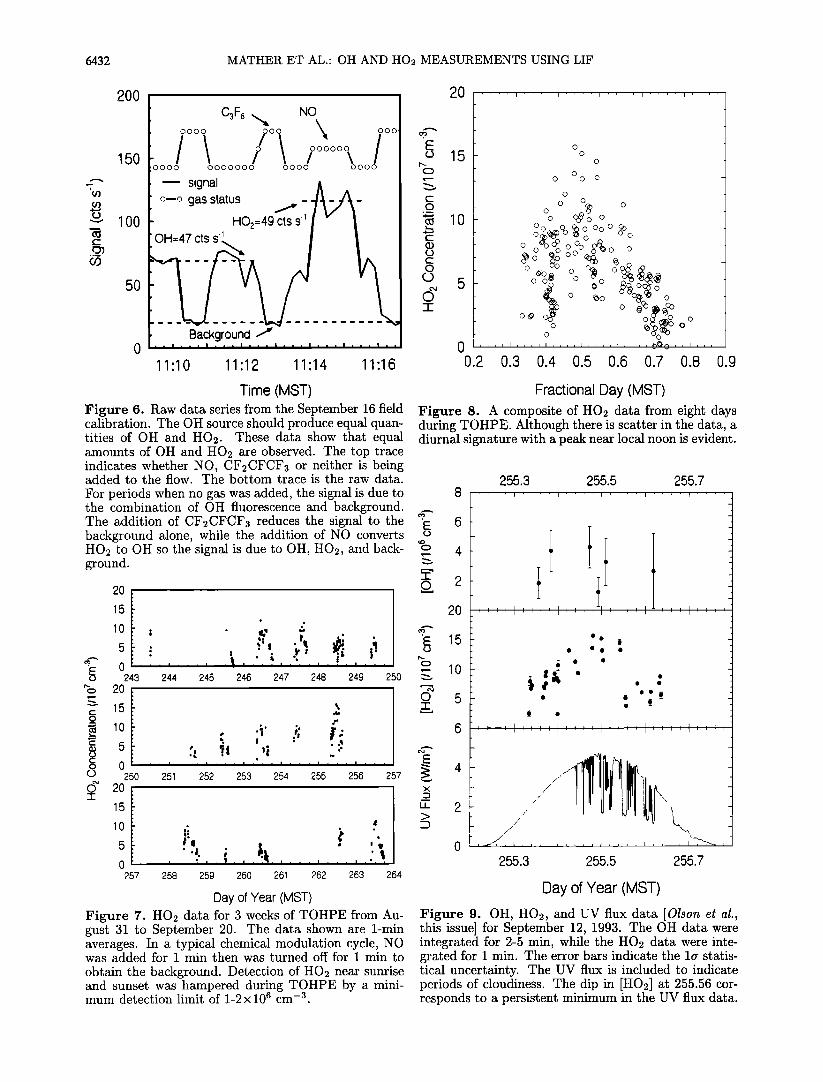
Figure 9. OH, HO2, and UV flux data [Olson et al., this issue] for September 12, 1993. The OH data were integrated for 2-5 min, while the HO2 data were inte- grated for 1 min. The error bars indicate the la statis- tical uncertainty. The UV flux is included to indicate periods of cloudiness. The dip in [HO2] at 255.56 cor- responds to a persistent minimum in the UV flux data.
MATHER ET AL.' OH AND HO2 MEASUREMENTS USING LIF 6433
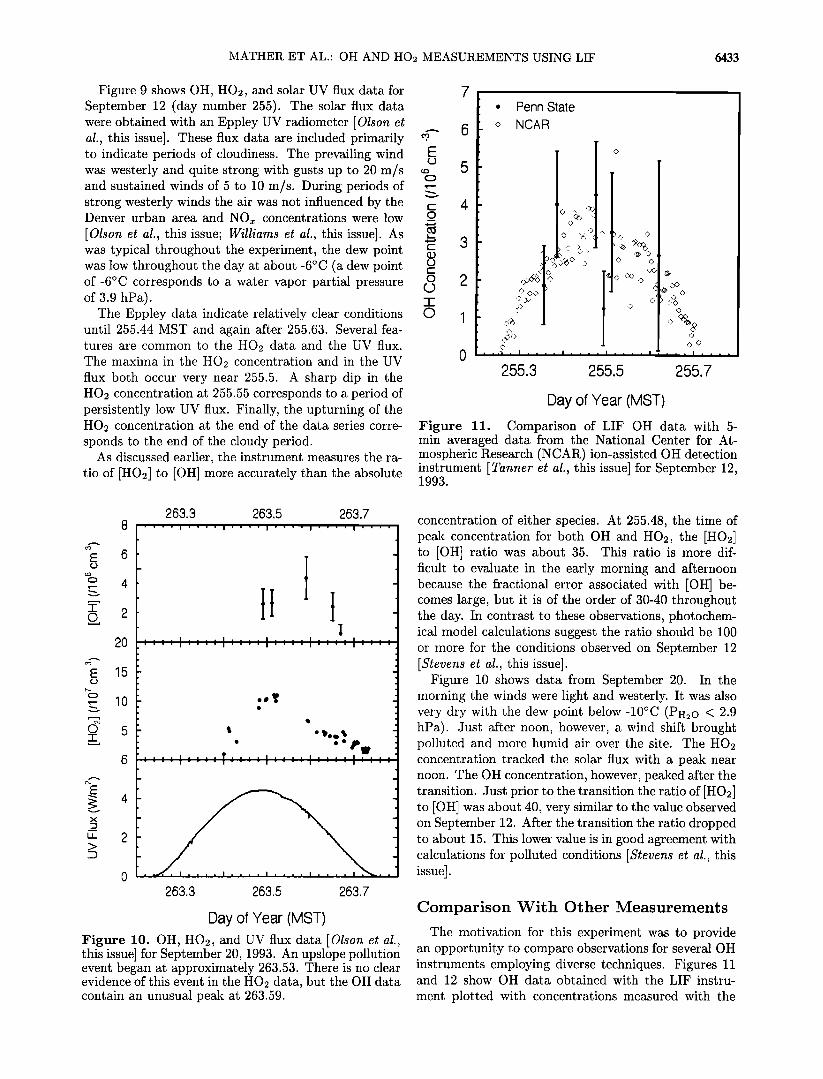
Figure 9 shows OH, HO2, and solar UV flux data for September 12 (day number 255). The solar flux data were obtained with an Eppley UV radiometer [Olson et al., this issue]. These flux data are included primarily to indicate periods of cloudiness. The prevailing wind was westerly and quite strong with gusts up to 20 m/s and sustained winds of 5 to l0 m/s. During periods of strong westerly winds the air was not influenced by the Denver urban area and NOx concentrations were low
[Olson et al., this issue; Williams et al., this issue]. As was typical throughout the experiment, the dew point was low throughout the day at about -6øC (a dew point of-6øC corresponds to a water vapor partial pressure of 3.9 hPa).
The Eppley data indicate relatively clear conditions until 255.44 MST and again after 255.63. Several fea- tures are common to the HO2 data and the UV flux. The maxima in the HO2 concentration and in the UV flux both occur very near 255.5. A sharp dip in the HO2 concentration at 255.55 corresponds to a period of persistently low UV flux. Finally, the upturning of the HO2 concentration at the end of the data series corre- sponds to the end of the cloudy period.
As discussed earlier, the instrument measures the ra- tio of [HO2] to [OH] more accurately than the absolute
ß Penn State
o NCAR
255.3 255.5 255.7
Day of Year (MST)
Figure 11. Comparison of LIF OH data with 5- min averaged data from the National Center for At- mospheric Research (NCAR) ion-assisted OH detection instrument [Tanner et al., this issue] for September 12, 1993.
2O
15
10
5
263.3 263.5 263.7 .... I .... I .... I .... I .... I ....
263.3 263.5 263.7
Day of Year (MST) Figure 10. OH, HO2, and UV flux data [Olson et al., this issue] for September 20, 1993. An upslope pollution event began at approximately 263.53. There is no clear evidence of this event in the HO2 data, but the OH data contain an unusual peak at 263.59.
concentration of either speciesß At 255.48, the time of peak concentration for both OH and HO2, the [HO2] to [OH] ratio was about 35. This ratio is more dif- ficult to evaluate in the early morning and afternoon because the fractional error associated with [OH] be- comes large, but it is of the order of 30-40 throughout the day. In contrast to these observations, photochem- ical model calculations suggest the ratio should be 100 or more for the conditions observed on September 12 [Stevens et al., this issue].
Figure 10 shows data from September 20. In the morning the winds were light and westerly. It was also very dry with the dew point below-10øC (PH2o < 2.9 hPa). Just after noon, however, a wind shift brought polluted and more humid air over the site. The HO2 concentration tracked the solar flux with a peak near noon. The OH concentration, however, peaked after the transition. Just prior to the transition the ratio of [HO2] to [OH] was about 40, very similar to the value observed on September 12. After the transition the ratio dropped to about 15. This lower value is in good agreement with calculations for polluted conditions [Stevens et al., this issue].
Comparison With Other Measurements
The motivation for this experiment was to provide an opportunity to compare observations for several OH instruments employing diverse techniques. Figures 11 and 12 show OH data obtained with the LIF instru-
ment plotted with concentrations measured with the

6434 MATHER ET AL.' OH AND HO2 MEASUREMENTS USING LIF
Penn State
NCAR
.... i .... i .... i .... i .... I
263.3 263.5 263.7
Day of Year (MST)
Figure 12. Comparison of LIF OH data with 5-rain av- eraged data from the NCAR ion-assisted OH detection instrument [Tanner et al., this issue] for September 20, 1993. The two sets of measurements agree well under the clean conditions in the morning and the polluted upslope conditions in the afternoon. The last LIF ob- servation is likely affected by a poor lasing mode.
ion-assisted technique [Tanner et al., this issue]. These plots show that concentrations observed using the two techniques overlap in many cases. In particular, the two techniques agree very well through the transition from unpolluted to polluted conditions on September 20 (Figure 12). The last OH observation for the LIF instrument on September 20 is considerably lower than the corresponding ion-assisted measurement. This situ- ation was also observed for data obtained on September 17. This discrepancy appears to be the result of a par- ticularly poor multimode lasing condition.
Figure 13 shows all of our OH data plotted against 30-s averaged concentrations from the ion-assisted in- strument, including the best fit line which has a slope of 0.73. The correlation coefficient for this fit is 0.26.
The nonunity slope may be due to the instrument cali- brations. A shift in the calibration of either instrument
could change the slope to 1. Alternatively, the calibra- tion may be off for a few LIF observations made with the laser in a particularly poor mode. This condition would drive down the sensitivity of the affected points which could again shift the slope toward one. Of course, the low slope may simply be due to the limited data set and the scatter in the data. The low correlation co-
efficient is driven, in part, by the precision of the LIF measurement.
The precision of the LIF measurement is limited to 1-2x106 cm -3 by the fluctuations of the background signal. To test the impact of the precision on the
correlation coefficient, simulated data sets were con- structed with the following properties. The ion-assisted measurements were used as shown in Figure 13. The LIF measurements were simulated by first setting them equal to the associated ion-assisted observation then adding a random error to each point based on the in- strument's precision. The mean correlation coefficient for 1000 such simulations was 0.59, while the minimum coefficient obtained was 0.11. While this test explains much of the spread in the data, it is likely that multi- mode effects also contributed to the scatter.
Another test of the instrument involved a field mea-
surement of RO2. RO2 represents any of a number of organic peroxy radicals and is produced through the oxidation of hydrocarbons by OH [Trainer et al., 1987]. RO2 is converted to HO2 through a reaction with NO. At the low pressure in the LIF detection cell, this con- version rate is negligible (SMB). At ambient pressure, however, these reactions proceed rapidly. To estimate the concentration of RO2, therefore, NO was added just outside the detection cell inlet. Figure 14 shows the re- suits of a kinetics model simulation of this experiment. For these calculations, CHaO2 was used for
CH302 q- NO -+ CH30 + NO2 (7)
CH30 q- 02 --• CH20 + HO2. (8)
Rate constants were taken from DeMote et al.
[1992]. Initially, [RO2] - 4x108 cm -a and [HO2] - lx108 cm -a. The maximum conversion efficiency of HO2+RO2 to OH is 32%. This limit is due to the
? 6 E
ß OO ß ß
ß OO
0 2 4 6
NCAR OH (/106 cm -3) Figure 13. Scatterplot of Penn State and NCAR OH data including all of the LIF measurements. The error bars indicate the 1• uncertainty in the LIF measure- ments. The line is the best fit to these data with a
correlation coefficient of 0.26 and a slope of 0.73.

MATHER ET AL' OH AND HO2 MEASUREMENTS USING LIF 6435
5,10 ø•
4,10 oe
'• 3,10oe
•- 2,10oe o (D
=D 1,10 øe
.!
\RO2
ß I ' ' ' I ' ' ' I ' ß
NO = 10•4 cm_3 P = 670 mb
T= 285 K
0.002 0.004 0.006 0.008 0.01
Reaction Time (s)
Figure 14. Kinetics model simulation of the LIF in- strument's RO2 measurement chemistry. The rate con- stant used for RO2+NO was that of CH302+NO [De- More et al., 1992]. The maximum conversion efficiency of RO2+HO2 to OH is 32%.
subsequent conversion of OH to HONO and to the fact that some of the CH30 reacts with NO to form CH30NO. The effect of alternate pathways such as the reaction of CH30 with NO will vary with R. The mix- ing of the added NO outside of the detection cell may not be complete, so the RO2 concentrations obtained with this technique should be viewed as a lower limit.
An RO2 measurement was performed at 263.60 MST. Assuming that the conversion efficiency to OH was 32%, the concentration of RO2+HO2 was 22 ppt. The ac- tual conversion efficiency was probably less than 32%, so the concentration may have been higher. [HO2] was measured to be 5 pptv immediately following this test, so [RO2] _>17 ppt. The sum of HO2+RO2 was mea- sured independently by a chemical amplifier technique [Canttell et al., this issue]. At the time of the test, the chemical amplifier reported an HO2+R02 concen- tration of 50 pptv. Although this is about a factor of 2 more than observed with the LIF instrument, the LIF instrument is reporting a lower limit.
Although the conversion of RO2 to HO2 is very slow at low pressure, the question of whether this conver- sion could interfere with HO2 measurements should be addressed. A limit can be placed on the conversion of RO2 to HO2 within the instrument by examining co- incident observations of HO2 with observations of RO2 by Cantrell et al. In the evening the ratio of [HO2] to [RO2] was typically less than 0.1. At 1800 MST on September 3 the ratio dropped to 0.06. Thus at most, 6% of the R02 is converted to HO2 within the LIF in- strument. On the afternoon of September 20 during the pollution event, this ratio dropped to about 0.02. How-
ever, the RO2 data were scattered during this period and the RO2 measurements may have been perturbed by high concentrations of peroxyacetyl nitrate (PAN) [Canttel! et al., this issue]. While these examples do not rule out the possibility of an R02 interference in the HO2 measurement, they do put a significant upper limit of less than 10% on such an interference.
Summary
During the period from August 24 to September 20 we measured OH concentrations on 5 days and HO2 concentrations on 19 days. The small amount of OH data was due to a high detection limit of 1-2x 106 cm -3 and a problem with the gas-handling system early in the experiment. Our OH observations compare reasonably well with the ion-assisted technique of Tanner et al. [this issue] on several days; however, the large error bars on our measurements make a rigorous comparison difficult.
Daytime HO2 concentrations were in the range of 107 to 108 cm -3. Consequently, we were able to ob- tain diurnal data series of HO2 throughout the exper- iment. These measurements show HO2 concentrations lower than predicted by model calculations [Trainer et al., 1987]. Calculations of the HO2 to OH ratio from the TOHPE measurements are in good agreement with model calculations from polluted (high N Ox) days but tend to be lower than model calculations for clean (low NOx) days [Stevens et al., this issue].
These results bring up the issue of the HO2 conver- sion efficiency in our instrument. We have performed two independent tests which show that more than 90% of the HO2 is converted to OH. These tests give us confi- dence that we are measuring the true HO2 to OH ratio. The uncertainty in this ratio is dictated by the statis- tical uncertainty associated with separating OH from the background. The uncertainties in the calibration do not affect this ratio because they affect the OH and HO2 measurements equally.
The data obtained during the TOHPE experiment as well as the tests described in SMB demonstrate the via-
bility of LIF for OH and HO2 detection. The challenge for the next version of the instrument is to resolve sev-
eral important laser issues that diminished the quality of these data. We are presently developing the next version and are focusing on these issues.
Acknowledgments. This work was supported by National Science Foundation grant ATM-9217748 and by NASA grant NAG-l-1057.
References
Baardson, E.L., and R.W. Terhune, Detection of OH in the atmosphere using a dye laser, Appl. Phys. Left., 21,209- 211, 1972.
Baumann, K., E.J. Williams, J.A. Olson, J.W. Harder, and F.C. Fehsenfeld, Meteorological characteristics and spa-

6436 MATHER ET AL.: OH AND HO2 MEASUREMENTS USING LIF
tial extent of upslope events during the 1993 Tropospheric OH Photochemistry Experiment, J. Geophys. Res. this issue.
Canttell, C.A., et al., Peroxy radicals from photostationary state deviations and steady state calculations during the Tropospheric OH Photochemistry Experiment at Idaho Hill, Colorado, 1993, J. Geophys. Res., this issue.
Chan, C.Y., T.M. Hard, A.A. Mehrabzadeh, L.A. George, and R.J. O'Brien, Third-generation FAGE instrument for tropospheric hydroxyl radical measurement, J. Geophys. Res., 95, 18,569-18,576, 1990.
Crosley, D., The 1993 Tropospheric OH Photochemistry Ex- periment: A summary and perspective, J. Geophys. Res., this issue.
Crutzen, P.J., Photochemical reactions initiated by and in- fluencing ozone in unpolluted tropospheric air, Tellus, 26, 47, 1974.
DeMore, W.B., S.P. Sander, D.M. Golden, R.F. Hampson, M.J. Kurylo, C.J. Howard, A.R. Ravishankara, C.E. Kolb, M.J. Molina, Chemical kinetics and photochemical data for use in stratospheric modeling, in Evaluation 10, JPL Publ. 92-20, Jet Propul. Lab., Pasadena, Calif., 1992.
Dubey, M.K., T.F. Hanisco, P.O. Wennberg, and J.G. Anderson, Monitoring potential photochemical inter- ference in laser-induced fluorescence measurements of atmospheric OH, Geophys. Res. Left., 23, 3215, 1996.
ment of tropospheric OH by long path laser absorption at Fritz Peak Observatory, Colorado, during the OH Photo- chemistry Experiment, Fall 1993, J. Geophys. Res., this issue.
Olson, J., K. Baumann, E. Williams, C.J. Volpe, J. Harder, E.J. Williams, and G. Mount, Meteorological overview of the 1993 OH Photochemistry Experiment, J. Geophys. Res., this issue.
Ortgies, G., K.H. Gericke, and F.J. Comes, Optical mea- surements of tropospheric hydroxyl with lasers, Z. Natur- forsch, 36a, 177, 1981.
Pickett, H.M., G.M. Bradley, and H.L. Strauss, A new White type multi-pass absorption cell, Appl. Opt., 9, 2397-2398, 1970.
Smith, G.P., and D.R. Crosley, A photochemical model of ozone interference effects in laser detection of tropospheric OH, J. Geophys. Res., 95, 16427-16442, 1990.
Stevens, P.S., J.H. Mather, and W.H. Brune, Measurement of OH and HO2 by laser-induced fluorescence at low pres- sure, J. Geophys. Res., 99, 3543-3557, 1994.
Stevens, P.S., et al., HO2/OH and RO2/HO2 ratios during the tropospheric OH photochemistry experiment: Mea- surement and theory, J. Geophys. Res., this issue.
Tanner, D., F.L. Eisele, and A. Jefferson, Selected ion chem- ical ionization mass spectrometric measurements of OH, J. Geophys. Res., this issue.
Hard, T.M., R.J. O'Brien, C.Y. Chan, and A.A. Mehrabzadeh, Thompson, A.M., The oxidizing capacity of the Earth's at- Tropospheric free radical determination by FAGE, Envi- ron. Sci. Technol., 18, 768, 1984.
Hard, T.M., C.Y. Chan, A.A. Mehrabzadeh, W.H. Pan, and R.J. O'Brien, Diurnal cycle of tropospheric OH, Nature, 322, 617, 1986.
Hard, T.M., A.A. Mehrabzadeh, C.Y. Chan, and R.J. O'Brien, FAGE Measurements of tropospheric HO with measurements and model of interferences, J. Geophys. Res., 97, 9795-9817, 1992.
Hofzumahaus, A., U. Aschmutat, M. Heftling, F. Holland, and D.H. Ehhalt, The measurement of tropospheric OH radicals by laser-induced fluorescence spectroscopy during the POPCORN field campaign, Geophys. Res. Left., 23, 2541-2544, 1996.
Holland, F., M. Heftling, and A. Hofzumahaus, In situ mea- surement of tropospheric OH radicals by laser-induced flu- orescence, a description of the KFA instrument, J. Atmos. Sci., 52, 3393, 1995.
Levy, H., Normal atmospheric large radical and formalde- hyde concentrations predicted, Science, 173, 141, 1971.
Logan, J.A., M.J. Prather, S.C. Wofsy, and M.B. McElroy, Tropospheric chemistry: A global perspective, J. Geo- phys. Res., 86, 7210-7254, 1981.
Mather, J.H., Measurement of tropospheric OH and HO2 by laser-induced fluorescence, Ph.D. thesis, Penn. State Univ., 1994.
McIlroy, A., and F.P. Tully, Kinetic study of OH reactions with perfiuoropropene and perfiuorobenzene, J. Phys. Chem., 97, 610, 1993.
Mount, G.H., and E.J. Williams, Overview of the tropospheric OH Photochemistry Experiment, Fritz Peak/Idaho Hill, Colorado, Fall 1993, J. Geophys. Res., this issue.
Mount, G.H., J.W. Brault, P.V. Johnston, E. Marovich, R. Jakoubek, C.J. Volpe, J. Harder, and J. Olson, Measure-
mosphere: Probable past and future changes, Science, 256, 1157-1165, 1992.
Trainer, M., E.Y. Hsie, S.A. McKeen, R. Tallamraju, D.D. Parrish, F.C. Fehsenfeld, and S.C. Liu, Impact of natural hydrocarbons on hydroxyl and peroxy radicals at a remote site, J. Geophys. Res., 92, 11,879-11,894, 1987.
Wang, C.C. and L.I. Davis Jr., Measurement of hydroxyl concentrations in air using a tunable UV laser beam, Phys. Rev. Left., 32 349-352, 1974.
Wang, C.C, L.I. Davis, C.H. Wu, S. Japar, H. Niki, and B. Weinstock, Hydroxyl radical concentrations measured in ambient air, Science, 189, 797-800, 1975.
Wennberg, P.O., R.C. Cohen, N.L. Hazen, L.B. Lapson, N.T. Allen, T.F. Hanisco, J.F. Oliver, N.W. Lanham, J.N. Demusz, and J.G. Anderson, An Aircraft-borne, laser- induced fluorescence instrument for the in-situ detection
of hydroxyl and hydroperoxyl radicals, Rev. Sci. In- strum., 65, 1858, 1994.
White, J.U., Long path optics of large aperture, J. Opt. Soc. Am., 32, 285-288, 1942.
Williams, E.J., J.M. Roberts, K. Baumann, S.B. Bertman, S. Buhr, R.B. Norton, and F.C. Fehsenfeld, Variations in NOy composition at Idaho Hill, Colorado, J. Geophys. Res., this issue.
W.H. Brune and J.H. Mather (corresponding author), Department of Meteorology, Pennsylvania State University, 503 Walker Building, University Park, PA 16802. (e-mail: [email protected]; [email protected])
P.S. Stevens, School of Public and Environmental Af- fairs, Indiana University, Bloomington, IN 47405. (e-mail: [email protected])
(Received July 8, 1995; revised February 25, 1996; accepted May 27, 1996.)