Measuring and processing in-cylinder distributions of NO and OH obtained by laser-induced...
12
Paper 1092, 13th Int Symp on Applications of Laser Techniques to Fluid Mechanics Lisbon, Portugal, 26-29 June, 2006 - 1 - Measuring and processing in-cylinder distributions of NO and OH obtained by laser-induced fluorescence in a diesel rapid compression machine Romain Demory 1 , Cyril Crua 1 , Martin R. Gold 2 , Morgan R. Heikal 1 1: ICEG, School of Engineering, University of Brighton, UK, [email protected] 2: Ricardo UK, Shoreham-by-Sea, UK, [email protected] Abstract In-cylinder concentrations of nitric oxide (NO) and hydroxyl radicals (OH) were measured qualitatively by laser-induced fluorescence (LIF) in a rapid compression machine at conditions representative of a modern diesel passenger vehicle. In order to take into account the effects of collisional quenching and population (Boltzmann) distribution on the NO-LIF measurements, a phenomenological model was developed, based on high speed videos of the flame, the analysis of the heat release rate, and the flame structure information drawn from OH-LIF. The fluorescence signal was also corrected for broadband interferences and laser pulse energy variations. The formation of NO started with the onset of the diffusion flame, no fluorescence being recorded during the pre-mixed phase. The peak signal was recorded after the end of heat release, 1.5 to 2 ms after the peak mixing-controlled heat release rate. Whereas conditions on the lean side of the diffusion flame are ideal for the formation of NO, only a small portion of the NO fluorescence originated from this region. The model showed that the fluorescence signal level is hindered during the combustion by high levels of collisional quenching and, on a smaller scale, broader population distributions. To estimate the location and extent of the diffusion flame, the NO results were correlated with planar LIF measurements of OH. The measured OH distributions compared favourably with results from simulations using the KIVA 3V release 2 code. The OH radicals are shown to be mainly present in the mixing controlled phase, distributed in a thin layer around the vapour fuel in the jet, within the diffusion flame location. OH radicals could be seen as early as 0.4 ms before the pre-mixed heat-release spike and until the end of apparent heat release. In the conditions studied, the diffusion flame therefore spans most of the combustion process, starting very soon after auto-ignition. Finally, high-speed videos of the flame luminosity were used to monitor the evolution of the flame and form the basis of corrections to the NO-LIF distributions. The first visible signs of combustion (carbon oxidation) matched the time and the location of the onset of the diffusion flame. 1. Introduction The favoured way of dealing with engine pollution is the use of after treatments or filters in the exhaust line. Although fairly simple and hence successful for gasoline engines, this approach is more challenging in the case of the Diesel engine because of its lean combustion and high rate of particulate matter formation. An alternative way of dealing with these pollutants is to act directly on their formation in the engine chamber. By addressing the formation of pollutants, the need for complex and costly after-treatment can be minimised (Cooper et al., 2004). Different design factors can have significant effects on the combustion process. These factors can include the chamber geometry, injection system or intake air content. There are two strategies commonly employed to introduce such beneficial factors. The strategy that has been – and still is – overwhelmingly employed could be termed the “black box” strategy or calibration. The influencing components of the engine are parameterised and series of tests are run in order to identify the configuration yielding the best output (in terms of fuel efficiency, power output, pollutant formation…). Although this approach is successful it lacks the detailed understanding of fundamental processes, and hence a limited ability to offer direct translation to other applications. The second strategy is not as straight forward and implies understanding the physical phenomena taking place in the engine. By
Transcript of Measuring and processing in-cylinder distributions of NO and OH obtained by laser-induced...

Paper 1092, 13th Int Symp on Applications of Laser Techniques to Fluid Mechanics Lisbon, Portugal, 26-29 June, 2006
- 1 -
Measuring and processing in-cylinder distributions of NO and OH obtained by
laser-induced fluorescence in a diesel rapid compression machine
Romain Demory1, Cyril Crua
1, Martin R. Gold
2, Morgan R. Heikal
1
1: ICEG, School of Engineering, University of Brighton, UK, [email protected]
2: Ricardo UK, Shoreham-by-Sea, UK, [email protected] Abstract In-cylinder concentrations of nitric oxide (NO) and hydroxyl radicals (OH) were measured qualitatively by laser-induced fluorescence (LIF) in a rapid compression machine at conditions representative of a modern diesel passenger vehicle. In order to take into account the effects of collisional quenching and population (Boltzmann) distribution on the NO-LIF measurements, a phenomenological model was developed, based on high speed videos of the flame, the analysis of the heat release rate, and the flame structure information drawn from OH-LIF. The fluorescence signal was also corrected for broadband interferences and laser pulse energy variations. The formation of NO started with the onset of the diffusion flame, no fluorescence being recorded during the pre-mixed phase. The peak signal was recorded after the end of heat release, 1.5 to 2 ms after the peak mixing-controlled heat release rate. Whereas conditions on the lean side of the diffusion flame are ideal for the formation of NO, only a small portion of the NO fluorescence originated from this region. The model showed that the fluorescence signal level is hindered during the combustion by high levels of collisional quenching and, on a smaller scale, broader population distributions. To estimate the location and extent of the diffusion flame, the NO results were correlated with planar LIF measurements of OH. The measured OH distributions compared favourably with results from simulations using the KIVA 3V release 2 code. The OH radicals are shown to be mainly present in the mixing controlled phase, distributed in a thin layer around the vapour fuel in the jet, within the diffusion flame location. OH radicals could be seen as early as 0.4 ms before the pre-mixed heat-release spike and until the end of apparent heat release. In the conditions studied, the diffusion flame therefore spans most of the combustion process, starting very soon after auto-ignition. Finally, high-speed videos of the flame luminosity were used to monitor the evolution of the flame and form the basis of corrections to the NO-LIF distributions. The first visible signs of combustion (carbon oxidation) matched the time and the location of the onset of the diffusion flame.
1. Introduction
The favoured way of dealing with engine pollution is the use of after treatments or filters in the exhaust line. Although fairly simple and hence successful for gasoline engines, this approach is more challenging in the case of the Diesel engine because of its lean combustion and high rate of particulate matter formation. An alternative way of dealing with these pollutants is to act directly on their formation in the engine chamber. By addressing the formation of pollutants, the need for complex and costly after-treatment can be minimised (Cooper et al., 2004). Different design factors can have significant effects on the combustion process. These factors can include the chamber geometry, injection system or intake air content. There are two strategies commonly employed to introduce such beneficial factors. The strategy that has been – and still is – overwhelmingly employed could be termed the “black box” strategy or calibration. The influencing components of the engine are parameterised and series of tests are run in order to identify the configuration yielding the best output (in terms of fuel efficiency, power output, pollutant formation…). Although this approach is successful it lacks the detailed understanding of fundamental processes, and hence a limited ability to offer direct translation to other applications. The second strategy is not as straight forward and implies understanding the physical phenomena taking place in the engine. By

Paper 1092, 13th Int Symp on Applications of Laser Techniques to Fluid Mechanics Lisbon, Portugal, 26-29 June, 2006
- 2 -
investigating the complex process of combustion in situ, the effects of various factors can be assessed. In this case, more innovative and radical designs can be imagined. This strategy was applied to the study of nitric oxide formation in a modern diesel engine. The investigation presented here aims at an improved understanding of the formation of nitric oxide. Although the latest in situ studies on nitric oxide revealed part of the details of this mechanism, some questions remain unanswered. The mixing-controlled phase has been identified as the main source of nitric oxide. Within this phase the periphery of the diffusion flame has been hypothesised as the main region of formation (Dec, 1997; Nakagawa et al., 1997; Stoffels, 1999). Indeed, this region combines elevated temperatures and high concentrations of oxygen, nevertheless, this zone does not clearly stand out in the published nitric oxide distributions. Most of the nitric oxide is produced after the peak of heat release rate, when temperatures have started to decrease. The diffusion flame time and spatial evolution can be analysed by the study of hydroxyl radicals (OH) distributions. These radicals have been shown to be mainly present in the mixing controlled phase, distributed in a thin layer around the flame plume, where the diffusion flame takes place (Allen et al., 1995; Dec and Coy, 1996; Kosaka et al., 1996; Nakagawa et al., 1997). If the hypothesis of a high production of nitric oxide in the diffusion flame is correct, the distributions of hydroxyl radicals and nitric oxide should match. To access the necessary OH and NO distributions, the planar laser-induced fluorescence technique (LIF) was selected and applied to a combusting spray at diesel conditions in a rapid compression machine. LIF is, in its commonly used form, a qualitative technique; and to legitimately exploit its output, its limitations have to be known.
2. LIF signal processing
In an idealised case, the measured fluorescence radiant power F subsequent to an excitation is proportional to the quantity of absorbed laser power (Eckbreth, 1996):
επ
νν ⋅
Ω⋅
⋅⋅⋅⋅⋅=
40
12010
cc
c
hBVNIF (1)
where 0νI is the laser irradiance at 0ν , 0
1N is the population density of the probed molecule in
state 1 prior to laser excitation, VC is the probed volume, B12 is the Einstein coefficient for stimulated absorption from state 1 to state 2, h is Planck’s constant, 0ν is the optical frequency of
the transition, CΩ is the solid angle of the collection optics, ε is the efficiency of the collection optics (includes the detection electronic gain, the quantum efficiency of the detector and any loss of signal due to the optics). Several factors potentially influencing the signal level have to be considered:
• The laser and fluorescence light is not only absorbed by nitric oxide but also by a number of broadband absorbers as well as by hot CO2 (Hildenbrand and Schulz, 2001). The signal will therefore be naturally stronger where the laser and the fluorescence travels are shorter, yielding asymmetrical distributions.
• Although no time dependency explicitly appears in Equation (1), the fluorescence process is not instantaneous and its intensity follows an exponential pattern. The length of this decay is directly related to the fluorescence yield. In the case of low fluorescence yield – e.g. high
Paper 1092, 13th Int Symp on Applications of Laser Techniques to Fluid Mechanics Lisbon, Portugal, 26-29 June, 2006
- 3 -
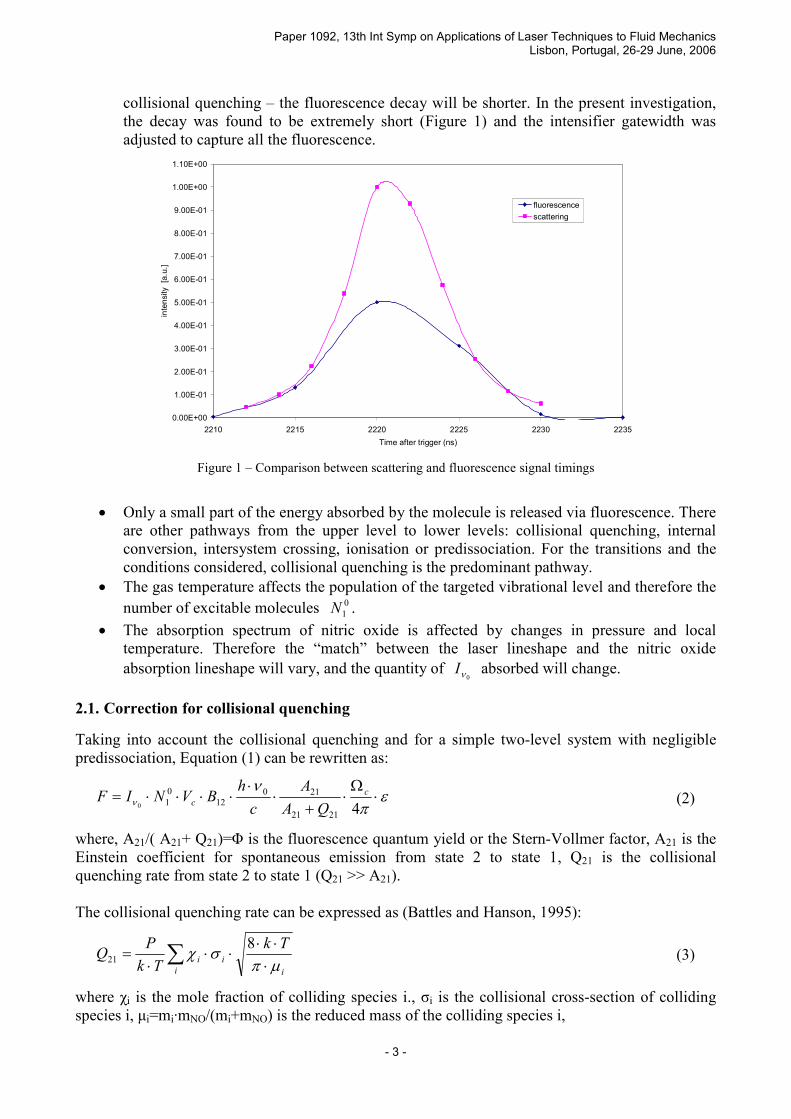
collisional quenching – the fluorescence decay will be shorter. In the present investigation, the decay was found to be extremely short (Figure 1) and the intensifier gatewidth was adjusted to capture all the fluorescence.
0.00E+00
1.00E-01
2.00E-01
3.00E-01
4.00E-01
5.00E-01
6.00E-01
7.00E-01
8.00E-01
9.00E-01
1.00E+00
1.10E+00
2210 2215 2220 2225 2230 2235
Time after trigger (ns)
intensity [a.u.]
fluorescence
scattering
Figure 1 – Comparison between scattering and fluorescence signal timings
• Only a small part of the energy absorbed by the molecule is released via fluorescence. There
are other pathways from the upper level to lower levels: collisional quenching, internal conversion, intersystem crossing, ionisation or predissociation. For the transitions and the conditions considered, collisional quenching is the predominant pathway.
• The gas temperature affects the population of the targeted vibrational level and therefore the
number of excitable molecules 01N .
• The absorption spectrum of nitric oxide is affected by changes in pressure and local temperature. Therefore the “match” between the laser lineshape and the nitric oxide absorption lineshape will vary, and the quantity of
0νI absorbed will change.
2.1. Correction for collisional quenching
Taking into account the collisional quenching and for a simple two-level system with negligible predissociation, Equation (1) can be rewritten as:
επ
νν ⋅
Ω⋅
+⋅
⋅⋅⋅⋅⋅=
42121
21012
010
c
cQA
A
c
hBVNIF (2)
where, A21/( A21+ Q21)=Φ is the fluorescence quantum yield or the Stern-Vollmer factor, A21 is the Einstein coefficient for spontaneous emission from state 2 to state 1, Q21 is the collisional quenching rate from state 2 to state 1 (Q21 >> A21). The collisional quenching rate can be expressed as (Battles and Hanson, 1995):
∑ ⋅
⋅⋅⋅⋅
⋅=
i i
ii
Tk
Tk
PQ
µπσχ
821 (3)
where χi is the mole fraction of colliding species i., σi is the collisional cross-section of colliding species i, µi=mi·mNO/(mi+mNO) is the reduced mass of the colliding species i,

Paper 1092, 13th Int Symp on Applications of Laser Techniques to Fluid Mechanics Lisbon, Portugal, 26-29 June, 2006
- 4 -
Since in our case A21<<Q21, the fluorescence yield Φ is proportional to:
∑⋅
⋅∝Φi i
iiPTµ
σχ (4)
Due to the high pressure environment (up to 8 MPa), the signal will be strongly affected by collisional quenching. The possible colliding species in a diesel-like combustion are CO2, H2O, O2, N2, fuel molecules, combustion intermediates and radicals. Paul et al. (1994) found CO2, H2O and O2 to be the main quenching species. The cross-sections were found almost constant within the range 1000-3000 K: [σCO2]1000-3000 K≈55 Å
2, [σH2O]1000-3000 K≈28 Å2, σO2≈25.1 Å
2 For proper qualitative comparisons of signal strength, one needs to know the local temperature and gas composition in order to evaluate collisional quenching. This information is however not easily available hence only few publications include a correction for collisional quenching. Barlow et al. (1990), for instance, calculated the local temperature and gas composition from Raman scattering data while many others bracketed these values between a perfectly homogeneous and an heterogeneous combustion process (Dec and Canaan, 1998; Fissenewert et al., 2005; Stoffels, 1999). The temperature gradients can be very high during the mixing-controlled phase. Flynn et al. (1999) for instance report temperatures inside the flame plume of 1600 K, compared to 2700 K for the diffusion flame. In both their modelling of heptane and oxygenated fuel chemistry, although the heat release rate of the pre-mixed phase is not negligible, the amount of H2O and especially CO2 produced during this phase is not as proportionally important since mainly intermediate species are formed. On the other hand, concentrations of CO2 and H2O are expected to be high in the vicinity of the diffusion flame.
2.2. Correction for population distribution
Whereas at low temperature only the low energy states are populated, at high temperature the population is spread over a larger number of states. For a constant total number of molecules, as the laser technique relies on the absorption of only one state (A2Σ+(v’’=0) in the case of NO), the pool of excitable molecules is lower at high temperature. Therefore an additional factor, the ratio of excitable molecules over total number of molecules fB is often included in Equation (1).
2.3. Correction for broadening and shift
Because molecules travelling at a certain velocity do not “see” the incoming radiation wave at the same frequency as an immobile molecule, the range of radiation frequencies absorbed by the pool of molecules is increasing with temperature. This effect is called Doppler broadening and affects the transition full width at half maximum (FWHM). Similarly, collisions with neighbouring molecules lead to a line broadening known as collision or collisional broadening, and a small shift of the lineshape. The correlations reported by Lee et al. (1993) and Davidson et al. (1996) have been used in the present investigation. The broadening of the absorption lineshape affects the amount of laser light absorbed. Because laser lineshapes are often very narrow, if the absorption lineshape is too broad, some of the molecules may have their absorption bandwidth out of the laser bandwidth. Moreover, the small amount of molecules within the laser bandwidth may saturate and the hypothesis of linear fluorescence would become void. The quality of the match between laser lineshape and absorption lineshape is expressed by their overlap integral (Battles and Hanson, 1995):
Paper 1092, 13th Int Symp on Applications of Laser Techniques to Fluid Mechanics Lisbon, Portugal, 26-29 June, 2006
- 5 -
∫+∞
∞−
⋅∆⋅∆∆+= ννννφννννφ dg laslasabsshiftabs ),,(),,( 00 (5)
where ν0 are the centre frequencies of the absorption and laser lineshapes, ∆νabs and ∆νlas are the spectral FWHM of the absorption and laser lineshapes In the current experiments ∆νD << ∆νC, so the absorption lineshape is Lorentzian and ∆νabs can be replaced by ∆νC in Equation (5). Taking into account the broadening and shifting effects cited above, a series of spectra were obtained at specified pressures with the LIFBASE software. The overlap integral was then calculated assuming the laser pulse to be of Gaussian lineshape with a FWHM of 0.002 nm (manufacturer’s specifications). The results show that the overlap can be considered constant over the pressure range of interest. Indeed the absorption peaks of NO and OH are already very broad at the minimum encountered pressure. The review of the necessary signal corrections presented above shows that the local temperature and molar fractions of CO2, H2O and O2 must be known in order to correct for quenching and population distribution. Because these values are not easily measurable, it was decided to build a phenomenological model based on the high speed videos of the combustion and the heat release rate.
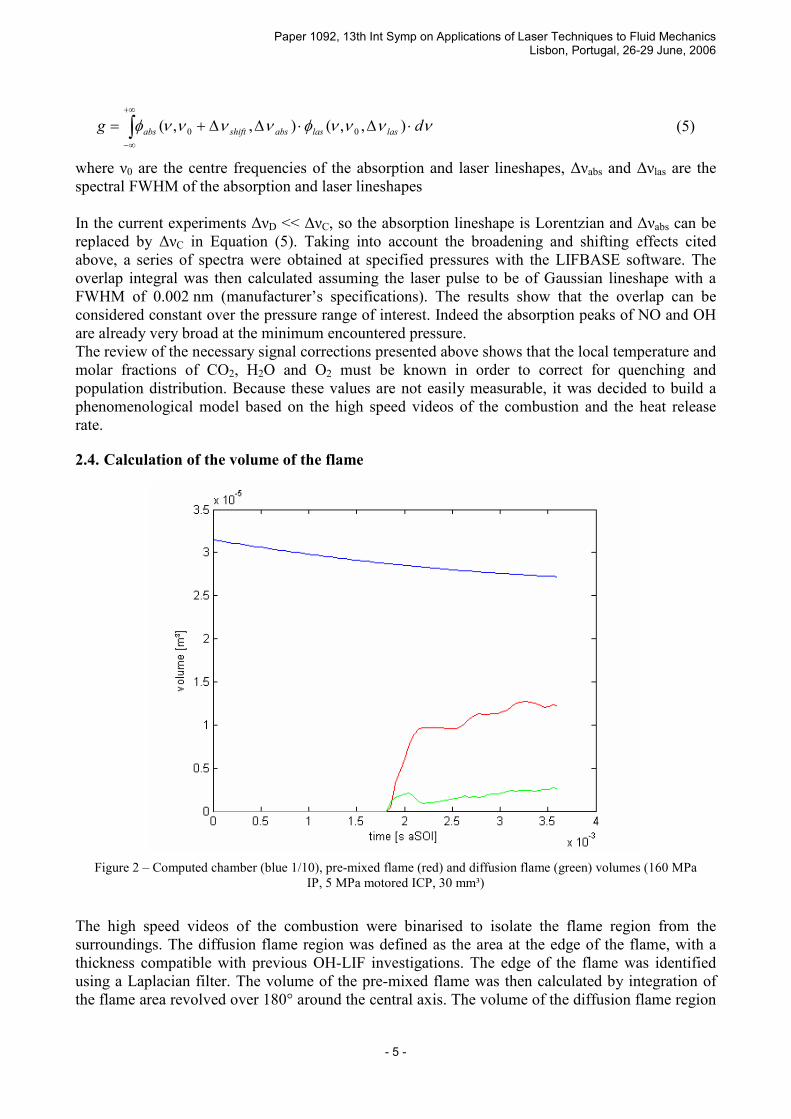
2.4. Calculation of the volume of the flame
Figure 2 – Computed chamber (blue 1/10), pre-mixed flame (red) and diffusion flame (green) volumes (160 MPa
IP, 5 MPa motored ICP, 30 mm³) The high speed videos of the combustion were binarised to isolate the flame region from the surroundings. The diffusion flame region was defined as the area at the edge of the flame, with a thickness compatible with previous OH-LIF investigations. The edge of the flame was identified using a Laplacian filter. The volume of the pre-mixed flame was then calculated by integration of the flame area revolved over 180° around the central axis. The volume of the diffusion flame region

Paper 1092, 13th Int Symp on Applications of Laser Techniques to Fluid Mechanics Lisbon, Portugal, 26-29 June, 2006
- 6 -
was derived similarly (Figure 2).
2.5. Calculation of the temperature
The heat release rate was derived from the first law of thermodynamics and the pressure measurements (Heywood, 1988):
dt
dPV
dt
dVP
dt
dQn ⋅⋅−
+⋅⋅−
=1
1
1 γγγ
(6)
where the value of the constant γ , the ratio of specific heats v
p
c
c , was computed from the analysis
of the pressure evolution during the compression stroke. The heat release rate was then processed to separate the pre-mixed and the mixing-controlled peaks. The density of the chamber contents, calculated for each time step, was assumed uniform. The fuel mass was neglected. From the heat capacity of the gases and the heat release rate, a temperature evolution for each of the two flame regions could be calculated.
2.6. Calculation of the molar fractions
Based of the investigation of heptane and oxygenated fuel combustion by Flynn et al. (1999), it was assumed that respectively ~10% and ~40% of the total produced CO2 and H2O were formed during the pre-mixed phase. The total amount of CO2 and H2O produced was deduced from the quantity of fuel injected. It was then assumed that within the pre-mixed and mixing-controlled phases, the rate of production of CO2 and H2O could be scaled by the heat release rate. The O2 molar fraction was uniformly set to 0.2 at the start of combustion and decreased gradually to zero in the pre-mixed phase.
2.7. Mixing
The optical chamber was designed to achieve a near quiescent air motion at TDC. However, the heat transfer and molecular diffusion within the chamber cannot be neglected and a Gaussian type mixing was introduced.
2.8. Limitations
Since parts of the optical chamber are hidden to the camera, regions of the late combustion cannot be seen and the calculated flame volume may therefore be underestimated (Figure 3). This is not an issue for the early stages of combustion. Indeed, the autoignition site and the early flame are always within the field of view of the camera.
Figure 3 – Individual frames of flame high speed video, 1.9 ms aSOI (left) and 2.4 ms aSOI (right), the frames were included into a background representing the complete chamber volume (160 MPa IP, 5 MPa motored ICP, 30 mm³)

Paper 1092, 13th Int Symp on Applications of Laser Techniques to Fluid Mechanics Lisbon, Portugal, 26-29 June, 2006
- 7 -
The flame luminosity is linked to the oxidation of soot. Whereas most publications report a production of soot throughout the combustion zone, the release of heat and the oxidation of soot do not perfectly match in time. In particular, the very early stages of combustion are not associated with soot oxidation. The method used to compute the heat release rate is based on several assumptions: the crevice flow is neglected, the gases are supposed ideal and at a constant temperature, and the heat of vaporisation of the fuel is not considered. Furthermore a constant value of the ratio of the specific heats
vp cc=γ derived from the analysis of the pressure curve was used.
3. Experimental set-up
3.1. Rapid-compression machine
Diesel-like conditions were reproduced in the optical chamber of the Proteus rapid compression machine (RCM), otherwise described by Crua (2002). The RCM was run at a speed of 500 rpm with a motored TDC pressure and temperature of 5 MPa and 700 K. A single fuel spray was injected vertically in the chamber without any impingement on the walls. The chamber was designed to obtain near-quiescent conditions at TDC so that the effects of air flow on the spray and flame development could be neglected. The fuel-injection equipment consisted of a second generation common rail system with a special VCO Ø0.2 single hole nozzle at nominal cone angle of 135°. The total volume of fuel injected per fired cycle was kept constant at 30 mm³. Because the soot and PAH laden combustion of a standard diesel fuel drastically lowers the LIF signal to noise ratio, an oxygenated fuel (80% Tri-propylene glycol mono-methyl ether, 20% heptamethyl nonane) selected from the screening by Gonzalez et al. (2001) was used. The qualitative trends in OH radicals distributions are not expected to change with the decrease of soot formation as concluded by Kosaka et al. (1996). Likewise, Dec and Canaan (1998) have reported a general agreement between the NO images from the combustion of a Phillips No.2 standard diesel fuel and their oxygenated, low-sooting fuel.
3.2. Optical set-up
A Nd:YAG capable of delivering pulses of 300 mJ at 532 nm (155 mJ at 355 nm) at a frequency of 10 Hz laser was used to pump a 3-stage dye laser. The laser pulses were spatially and temporally Gaussian with a beam diameter of 8.7 mm and pulse length of 6-7 ns at FWHM. In order to reach the desired UV wavelength for the LIF investigations, the dye laser was equipped with a second harmonic generator (BBO). A small fraction (up to 4%) of the beam energy was directed to an energy monitor and a pulse energy trace was associated with each recorded picture. The collection system was composed of filters, lenses and an intensified CCD camera
3.3. LIF and collection set-up
The dye laser wavelength was tuned to the A2Σ+-X2Π(1,0) transition of OH at 283.96 nm (283.86 nm off-line) and to the A2Σ+-X2Π(0,0) transition of NO at 226.0 nm (227.5 nm off-line). The mean laser pulse energies were 10 mJ for OH and 2 mJ for NO. Figure 4 shows that the experimentally determined and simulated spectra of OH and NO are in good agreement. A skip-fire strategy was applied and the laser pulses were synchronised with the injection timing. The two main purposes of the skip-fire strategy were to ensure full scavenging of burnt gases and to reduce window fouling. Series of 30 and 10 images were acquired with the dye laser tuned on-peak and off-peak, respectively. The background noise was subtracted and the image intensities were individually

Paper 1092, 13th Int Symp on Applications of Laser Techniques to Fluid Mechanics Lisbon, Portugal, 26-29 June, 2006
- 8 -
normalised by the laser pulse energy. The off-peak signal was subtracted from the on-peak signal to free the results from potential interferences. The results presented here are based on the ensemble averaged data over 30 cycles.
4. Results and discussion
4.1. Phenomenological model
While the discrepancy in the fluorescence signal due to population distribution variations was found to be lower than 15%, collisional quenching could be affecting the signal by as much as an order of magnitude. In particular, the signal originating from regions where high concentrations of combustion products can be found will be significantly quenched.
4.2. Hydroxyl radicals distributions
Planar distributions of OH radicals were captured for a number of injection and in-cylinder pressures. With low injection pressures (60 and 100 MPa), as observed by Dec and Coy (1996), the pre-mixed phase chemistry did not involve OH radicals, resulting in a very low OH-LIF signal. However, at higher injection pressures (140 and 160 MPa), a very sharp concentration peak was recorded before the first sight of a diffusion flame (i.e. the appearance of an established flame front). The unexpected presence of OH radicals in the pre-mixed burn can be explained by the leaner mixture obtained with longer fuel vapour penetrations and air entrainment from the associated enhanced atomisation. The diffusion flame was visible as early as 0.4 ms before the pre-mixed heat-release spike and started at the tip of the fuel evaporation zone, downstream of the liquid fuel maximum penetration. It progressed downstream with the spray expansion and evolved into a thick ellipsoidal flame front. After the peak heat-release, the flame front on the sides of the spray became fairly static while keeping a substantial thickness and exhibiting uneven ripples. In contrast, the flame front moving along the spray axis became smooth and thin until no clear structure could be discriminated in the OH radicals distributions. Thus, for the main part of the mixing-controlled phase, the diffusion flame was composed of a rippled tube-like structure with high concentrations of OH radicals on its edges, and, downstream of this tube, a wider combustion zone with little OH and no discernable structure. The injection duration mainly affected the persistence of this combustion pattern as injections were always long enough to reach a stable diffusion flame. The fluorescence intensity slowly decreased along this phase. The influence of the injection pressure on the diffusion flame development was consistent with
Figure 4 – Comparison between the measured OH (right) and NO (left) fluorescence signals and a LIFBASE
simulated spectrum (Luque and Crosley, 1999)

Paper 1092, 13th Int Symp on Applications of Laser Techniques to Fluid Mechanics Lisbon, Portugal, 26-29 June, 2006
- 9 -
what could be deduced from the heat release rate and the flame videos: a decrease in injection pressure resulted in a shorter penetration of the fuel vapour and a delayed flame development (Figure 5). Apart from their timing, the sequence of patterns identified above was not considerably affected by the injection pressure. The instantaneous fluorescence intensities were slightly stronger for the high injection pressures, in accordance with higher heat-release rates.
Figure 5 – Evolution of OH radicals distribution with time for four injection pressures. The white arrows indicate the
liquid fuel penetration, as observed from high-speed videos
Figure 6 – Comparison of the measured OH and NO distributions with the natural flame luminosity and OH
distributions from a three-dimensional CFD simulation Some distributions were recorded at a higher in-cylinder motored peak pressure of 7 MPa. Results showed that while the combustion started earlier, it followed the same development as described for

Paper 1092, 13th Int Symp on Applications of Laser Techniques to Fluid Mechanics Lisbon, Portugal, 26-29 June, 2006
- 10 -
5 MPa in-cylinder pressure, but with an overall weaker fluorescence signal, which attributed to a stronger collisional quenching. The experiment was reproduced in a numerical simulation, implementing the shell model defined by Halstead et al. (1977), in KIVA 3V release 2. Although the results cannot be quantitatively compared, the general trends of development and the associated distribution characteristics are in good agreement. Notably, the onset of the diffusion flame and its early development satisfactorily match the measured distributions (Figure 6). In particular the timing, spatial distributions and temporal evolution of the predicted OH concentrations agreed with the experimental OH-LIF data.
4.3. Nitric oxide distributions
In all cases there was no visible NO fluorescence during the very short pre-mixed flame. The signal increased gradually during the diffusion phase i.e. when OH distributions showed a clear flame front structure. Although the NO distributions moved downstream as the diffusion flame developed, no structured pattern was detected during the stabilised diffusion flame (Figure 6). In particular, the flame front, with its combination of high temperatures and oxygen content did not clearly stand out in the distributions, in agreement with the investigations of Nakagawa et al. (1997), Dec and Canaan (1998) and Stoffels (1999). After the collapse of the diffusion flame, the fluorescence signal started to decrease in most parts of the sampled zone. This is explained by the decreasing temperatures, the gradual diffusion of NO and, on a smaller scale, the oxidation of NO into nitrogen dioxide (NO2). The tip of the flame retained rather high concentrations of NO, indicating the local presence of high temperatures after the end of the visible diffusion flame.
4.4. High-speed videos of the flame
-0.1
0
0.1
0.2
0.3
0.4
0.5
0.6
0.7
0.8
0.9
1
1.1
1 2 3 4 5 6 7 8 9 10 11
time [ms aSOI]
average fluorescence / luminosity [a.u.]
-0.1
0
0.1
0.2
0.3
0.4
1 2 3 4 5 6 7 8 9 10 11
heat release rate [MJ/s]
NO-LIF signal OH-LIF signal Flame luminosity Heat release rate
injection pressure: 100 MPa
injected volume: 30 mm³
in-cylinder pressure: 5 MPa
in-cylinder temperature: 630 K
Figure 7 – Spatially averaged luminosity, OH and NO signal compared to the heat release rate
As for the OH radicals and NO distributions, no information on the pre-mixed phase could be extracted from the natural luminosity of the flame. The first appearance of soot matched the early development of a diffusion flame front (Figure 6). Furthermore, the first soot appeared in the vicinity of OH radicals at the tip of the evaporated fuel zone in agreement with the LII measurements performed by Crua (2002). By the time of the collapse of the diffusion flame, the natural luminosity had become particularly high at the tip of the spray. In this region, some luminosity is still visible in the very late combustion, when the heat release rate tends to zero and the OH radicals are no longer detectable.

Paper 1092, 13th Int Symp on Applications of Laser Techniques to Fluid Mechanics Lisbon, Portugal, 26-29 June, 2006
- 11 -
A series of high-speed videos were captured with an additional side lighting of the spray, in order to record the liquid fuel penetration as well as the combustion event. A change in the spray luminosity was noticed just before the onset of the diffusion flame. A substantial part of the tip of the spray almost disappeared 0.2ms before the first visible soot oxidation. This was associated with the pre-mixed phase, pre-combustion chemistry and a fast evaporation of the tip of the spray. In their chemical kinetic analysis of pre-mixed diesel combustion, Flynn et al. (1999) reported timescales of the same order for the autoignition and early chemistry of their oxygenated fuel (40% n-heptane and 60% dimethyl ether).
5. Conclusions
This investigation demonstrates that the laser-induced fluorescence technique can be successfully applied to the qualitative measurement of OH radicals and NO measurement in a diesel combusting spray at in-cylinder pressures as high as 7 MPa. The two-dimensional phenomenological model introduced indicated that the accuracy of a quantitative interpretation of the LIF distributions would be rather low if the proper corrections were not applied. When comparing the LIF results, the flame videos and the heat release rates, it was found that the pre-mixed phase was very short and mostly invisible to the optical techniques employed. This was due to the absence of soot oxidation and, in most cases, OH radicals during this phase. It was therefore impossible to conclude on the exact location of the pre-mixed autoignition, and the heat release rate remained the best indicator of the beginning of the combustion chemistry. The diffusion flame however could be more methodically described. The flame videos and the distributions of OH radicals suggested a varying but sometimes very early start of the diffusion flame. In the explored conditions, a substantial part of the first spike in the heat release rate could be attributed to the diffusion flame, although traditionally termed “pre-mixed spike”. Likewise, the actual peak of the pre-mixed heat-release rate is earlier than the so-called pre-mixed spike. The first soot oxidation was observed just after this early peak, matching a sudden decrease in the oxygen content of the spray. Whereas the flame front is rather stable downstream of the evaporation zone, the combustion near the tip of the spray is more chaotic and becomes increasingly richer, possibly leading to high concentrations of soot in the late part of the combustion.
Acknowledgements
The authors would like to thank Walid Abdelghaffar for providing the results of the KIVA simulation, Kourosh Karimi for the useful discussions on spray penetration, Benoit Oger for assisting with the experiments and the data processing, as well as Eric Domingues (CORIA, France) for his valuable suggestions and for providing some optical filters. The authors also wish to acknowledge the EPSRC Instrument Loan Pool for supplying a high-speed video camera.
References
Allen MG, McManus KR, Sonnenfroh DM, Paul PH (1995) Planar Laser-Induced Fluorescence Imaging Measurements of OH and Hydrocarbon Fuel Fragments in High-Pressure Spray-Flame Combustion. Applied Optics 34:6287-6300
Barlow RS, Dibble RW, Chen J-Y, Lucht RP (1990) Effect of Damköhler Number on Superequilibrium OH Concentration in Turbulent Non-premixed Jet Flames. Combustion and Flame 82:235-251

Paper 1092, 13th Int Symp on Applications of Laser Techniques to Fluid Mechanics Lisbon, Portugal, 26-29 June, 2006
- 12 -
Battles BE, Hanson RK (1995) Laser-Induced Fluorescence Measurements of NO and OH Mole Fraction in Fuel-Lean, High-Pressure (1-10 atm) Methane Flames: Fluorescence Modeling and Experimental Validation. J Quant Spectrosc Radiat Transfer 54:521-537
Cooper B, Jackson N, Beasley M (2004) Technology Development to Meet the Future Demand for Passenger Car Diesel Engines with Lower Emissions and Higher Performance. SIA International Congress, The Diesel Engine: Today and Tomorrow, Ecole Centrale de Lyon, France, 12-13 May 2004
Crua C (2002) Combustion Processes in a Diesel Engine. PhD thesis, University of Brighton, Brighton, UK, www.crua.net/thesis
Davidson DF, Roehrig M, Petersen EL, Rosa MDD, Hanson RK (1996) Measurements of the OH A-X(0,0) 306 nm Absorption Bandhead at 60 atm and 1735 K. J Quant Spectrosc Radiat Transfer 55:755-762
Dec JE (1997) Conceptual model of DI diesel combustion based on laser-sheet imaging. SAE paper no 970873 SAE Special Publications 1244:223-252
Dec JE, Canaan RE (1998) PLIF Imaging of NO Formation in a DI Diesel Engine. SAE paper no 980147 SAE Transactions 1348:79-105
Dec JE, Coy EB (1996) OH Radical Imaging in a DI Diesel Engine and the Structure of the Early Diffusion Flame. SAE Paper No 960831
Eckbreth AC (1996) Laser Diagnostics for Combustion Temperature and Species. Gordon and Breach Publishers
Fissenewert U, Sick V, Pucher H (2005) Charaterization of combustion and NO formation in a spray-guided gasoline direct-injection engine using chemiluminescence imaging, NO-PLIF, and fast NO exhaust gas analysis. SAE 2005-01-2089
Flynn PF, Durett RP, Hunter GL, zur Loye AO, Akinyemi OC, Dec JE, Westbrook CK (1999) Diesel Combustion: An Integrated View Combining Laser Diagnostics, Chemical Kinetics, And Empirical Validation. SAE paper no 1999-01-0509
Gonzalez MA, Piel W, Asmus T, Clark W, Garbak J, Liney E, Natarajan M, Naegeli DW, Yost D, Frame EA, III JPW (2001) Oxygenates Screening for Advanced Petroleum-Based Diesel Fuels: Part 2. The Effect of Oxygenate Blending Compounds on Exhaust Emissions. SAE Paper No 2001-01-3632
Halstead MP, Kirsch LJ, Quinn CP (1977) The autoignition of hydrocarbon fuels at high temperatures and pressures--Fitting of a mathematical model. Combustion and Flame 30:45-60
Heywood JB (1988) Internal Combustion Engines Fundamentals. McGraw-Hill Book Company Hildenbrand F, Schulz C (2001) Measurements and simulations of in-cylinder UV-absorption in
spark ignition and Diesel engines. Appl Phys B 73:165-172 Kosaka H, Nishigaki T, Kamimoto T, Sano T, Matsutani A, Harada S (1996) Simultaneous 2-D
Imaging of OH-Radicals and Soot in a Diesel Flame by Laser Sheet Techniques. SAE Paper No 960834
Lee MP, McMillin BK, Hanson RK (1993) Temperature measurements in gases by use of planar laser-induced fluorescence imaging of NO. Applied Optics 32:5379-5396
Luque J, Crosley DR (1999) LIFBASE, Database and spectral simulation for diatomic molecules (v 1.6). SRI International Report MP-99-009
Nakagawa H, Endo H, Deguchi Y, Noda M, Oikawa H, Shimada T (1997) NO measurement in Diesel Spray Flame using Laser Induced Fluorescence. SAE Paper No 970874
Paul PH, Gray JA, Durant JL, Thoman JW (1994) Collisional Quenching Corrections for Laser-Induced Fluorescence Measurements of NO A2Σ+. AIAA 32:1670-1675
Stoffels GGM (1999) Nitric oxide in a diesel engine: laser-based detection and interpretation. PhD thesis, Katholieke Universiteit Nijmegen,