HIV-1 infection accelerates age according to the epigenetic clock
29
Accepted Manuscript 1 © The Author 2015. Published by Oxford University Press on behalf of the Infectious Diseases Society of America. This is an Open Access article distributed under the terms of the Creative Commons Attribution- NonCommercial-NoDerivs licence (http://creativecommons.org/licenses/by-nc-nd/4.0/), which permits non-commercial reproduction and distribution of the work, in any medium, provided the original work is not altered or transformed in any way, and that the work is properly cited. For commercial re-use, please contact [email protected]. HIV-1 infection accelerates age according to the epigenetic clock Steve Horvath 1,2,* , Andrew J. Levine 3 1 Human Genetics, David Geffen School of Medicine, University of California Los Angeles, Los Angeles, CA 90095 2 Biostatistics, School of Public Health, University of California Los Angeles, Los Angeles, California, USA 90095 3 Department of Neurology, David Geffen School of Medicine at the University of California, Los Angeles Correspondence: Email: [email protected]. Address. Steve Horvath. Department of Human Genetics, Gonda Research Center, UCLA 695 Charles E. Young Drive South, Box 708822, Los Angeles, CA 90095-7088, USA Journal of Infectious Diseases Advance Access published May 12, 2015 by guest on March 21, 2016 http://jid.oxfordjournals.org/ Downloaded from
-
Upload
independent -
Category
Documents
-
view
1 -
download
0
Transcript of HIV-1 infection accelerates age according to the epigenetic clock

Acce
pted M
anus
cript
1
© The Author 2015. Published by Oxford University Press on behalf of the Infectious Diseases Society of America. This is an Open Access article distributed under the terms of the Creative Commons Attribution-NonCommercial-NoDerivs licence (http://creativecommons.org/licenses/by-nc-nd/4.0/), which permits non-commercial reproduction and distribution of the work, in any medium, provided the original work is not altered or transformed in any way, and that the work is properly cited. For commercial re-use, please contact [email protected].
HIV-1 infection accelerates age according to the epigenetic clock
Steve Horvath1,2,*, Andrew J. Levine3
1Human Genetics, David Geffen School of Medicine, University of California Los Angeles, Los
Angeles, CA 90095
2Biostatistics, School of Public Health, University of California Los Angeles, Los Angeles,
California, USA 90095
3Department of Neurology, David Geffen School of Medicine at the University of California,
Los Angeles
Correspondence: Email: [email protected]. Address. Steve Horvath. Department of
Human Genetics, Gonda Research Center, UCLA 695 Charles E. Young Drive South, Box
708822, Los Angeles, CA 90095-7088, USA
Journal of Infectious Diseases Advance Access published May 12, 2015 by guest on M
arch 21, 2016http://jid.oxfordjournals.org/
Dow
nloaded from

Acce
pted M
anus
cript
2
ABSTRACT
Background: Infection with the Human Immunodeficiency Virus-1 (HIV) is associated with
clinical symptoms of accelerated aging, as evidenced by increased incidence and diversity of
age-related illnesses at relatively young ages that is supported by findings of organ and cellular
pathology. But it has been difficult to detect an accelerated aging effect on a molecular level.
Methods: Here, we applied an epigenetic biomarker of aging based on host DNA methylation
levels to study accelerated aging effects due to HIV infection. DNA from brain and blood tissue
was assayed via the Illumina Infinium Methylation 450K platform.
Results: Using six novel DNA methylation data sets, we show that HIV leads to an increase in
epigenetic age both in brain (7.4 years) and blood (5.2 years) tissue. While the observed
accelerated aging effects in blood may reflect changes in blood cell composition (notably
exhausted cytotoxic T cells), it is less clear what explains the observed accelerated aging effects
in brain tissue.
Conclusions: Overall, our results demonstrate that the epigenetic clock is a useful biomarker for
detecting accelerated aging effects due to HIV infection. This tool can be used to accurately
determine the extent of age acceleration in individual tissue and cells.
by guest on March 21, 2016
http://jid.oxfordjournals.org/D
ownloaded from

Acce
pted M
anus
cript
3
INTRODUCTION
While antiretroviral therapy for HIV infection is highly effective at preventing AIDS-related
complications, treated patients are at a significant risk for a number of diseases typically
associated with older age, including cardiovascular disease, osteoporosis, cancer, neurocognitive
impairment, and frailty [1-11]. Among the aging HIV+ population, it has become evident that the
incidence of HIV-Associated Non-AIDS conditions is increasing [12]. In recent years the
Working Group on HIV and Aging published a report to the National Institutes of Health Office
of AIDS Research, in which it is stated that the cause of this increasing incidence is unclear, but
proposed that it may be due to an accelerated aging process [13]. In order to show that HIV
infection is associated with accelerated normal aging, one first needs to understand what is meant
by normal aging and to find a way of measuring it. Due to its modest accuracy, telomere length
will probably have to be supplemented by additional biomarkers of aging when it comes to
understanding and measuring normal aging. DNA methylation levels are particularly promising
biomarkers of aging since chronological age (i.e. the calendar years that have passed since birth)
has a profound effect on DNA methylation levels in most human tissues and cell types [14-23].
Several recent studies support measuring accelerated aging effects using DNA methylation levels
[24, 25]. The noteworthy aspect of our recently developed "epigenetic clock" (based on 353
dinucleotide markers known as Cytosine phosphate Guanines or CpGs) is its broad applicability
to most human cell types, tissues, and organs [25]. Predicted age, referred to as DNA
methylation age, correlates with chronological age in sorted cell types (CD4 T cells, monocytes,
B cells, glial cells, neurons), tissues and organs including whole blood, brain, breast, kidney,
liver, lung, saliva [25].
by guest on March 21, 2016
http://jid.oxfordjournals.org/D
ownloaded from

Acce
pted M
anus
cript
4
The epigenetic clock is an attractive biomarker of aging because a) it is more strongly correlated
with chronological age than previous biomarkers including telomere length [26, 27], b) it is
prognostic of all-cause mortality in later life [28], and c) it correlates with measures of physical
and mental fitness in older age [29]. The utility of the method has been demonstrated in recent
case studies, e.g. to show that obesity accelerates epigenetic aging in liver tissue [27]. Further,
trisomy 21 (Down syndrome) accelerates epigenetic aging in blood and brain tissue [30].
Although HIV appears to lower the age at which infected individuals develop age-related
illnesses, it is not yet known whether DNA methylation age is a biologically meaningful
biomarker of accelerated aging in the context of HIV infection. Here we use both blood and
brain tissue from HIV+ subjects and uninfected controls to show that HIV infection is
significantly associated with increased age acceleration according to the epigenetic clock.
MATERIALS AND METHODS
DNA methylation data sets
An overview of the 11 Illumina DNA methylation data sets used in this article is provided in
Table 1. We generated 6 novel DNA methylation data sets and used 5 publicly available data
sets. Our 6 novel data sets are available from Gene Expression Omnibus super-series GSE67752.
Details on the individual data sets can be found in Table 1 and Supplement 1. The three brain
data sets came from the National NeuroAIDS Tissue Consortium (NNTC)[31]. Informed consent
and all study procedures were approved by the IRBs at the four individual sites comprising the
NNTC.
by guest on March 21, 2016
http://jid.oxfordjournals.org/D
ownloaded from

Acce
pted M
anus
cript
5
Novel data set 1 (various brain regions from HIV+ and HIV- subjects)
We generated Illumina Infinium 450K data from 130 fresh frozen brain samples from 84
different subjects (71 HIV+ versus 13 HIV- subjects). Specifically, we considered cerebellum
(20 HIV+ samples and 4 controls), frontal lobe (2 cases, 4 controls), hippocampus (4 controls),
medial frontal cortex (18 cases), occipital cortex (59 cases, 13 controls), temporal cortex (4
controls). For the HIV+ samples, the median year of death was 2005 (ranging from 1999 to
2013). Additional details can be found in Table 2. In total, there were 99 samples from HIV+
subjects and 31 samples from HIV- controls of similar ages. DNA methylation data from HIV+
cases and HIV- controls were generated at the same time and randomized across plates and
chips. HIV viral load information was available for blood (measured at the last blood draw prior
to death) and for cerebrospinal fluid (CSF).
The protein abundance levels of the IBA1 marker were assessed as follows: 5 µm-thick
formalin-fixed paraffin-embedded brain sections were immunostained with mouse monoclonal
antibody against Iba-1 (Wako), as previously described [32]. The DAB-stained sections were
digitally scanned using a microscopy slide scanner (Aperio ScanScope GL, Leica, Vista, CA)
equipped with a 20x objective lens (yielding the resolution of 0.5 µm/pixel). Anatomical areas of
interest were digitally delineated and the immunoreactivity signals quantified within each of
these areas using the Image-Pro Analyzer software (Version 6.3, MediaCybernetics, Bethesda,
MD), as previously described in detail [33].
Novel data set 2 (frontal lobe from HIV+ and HIV- subjects)
Fresh frozen frontal lobe samples from 8 HIV+ and 25 HIV- subjects. The 8 HIV+ subjects had a
mean age of 44 (ranging from 27 to 64). Years of death ranged from 2000-2013. Years of HIV
by guest on March 21, 2016
http://jid.oxfordjournals.org/D
ownloaded from

Acce
pted M
anus
cript
6
diagnosis ranged from 1989 to 1996. The mean number of years living with HIV (until death)
was 12 years (ranging from 1 to 19).
Novel data set 3 (cerebellum from HIV+ and HIV- subjects)
Fresh frozen cerebellar samples from 8 HIV+ and 12 HIV- subjects. The 8 HIV+ subjects
correspond to the subjects used in data set 2.
Novel data set 4 (blood from HIV+ and HIV- subjects)
Peripheral blood mononuclear cells (PBMCs) isolated from 92 subjects. The 24 HIV+ subjects
had a mean age of 49 years (ranging from 29 to 67). The HIV+ samples were obtained from the
National Neurological AIDS Bank study or Multicenter AIDS Cohort Study in Los Angeles.
Informed consent and all study procedures were approved by the UCLA Medical IRB. The 68
HIV- control subjects had a mean age of 36 years (ranging from 18 to 74). The control samples
are non-medicated subjects from a previously published study (GSE41169) [19]. DNA
methylation data from HIV+ cases and HIV- controls were generated by the same core facility at
the same time.
Novel data set 5 (blood from HIV+ and HIV- subjects)
PBMC samples were obtained from the National Neurological AIDS Bank study or Multicenter
AIDS Cohort Study in Los Angeles. The 23 HIV+ subjects had a mean age of 45 years (ranging
from 24 to 68). The 69 HIV- control subjects had a mean age of 51 years (ranging from 35 to
64).
by guest on March 21, 2016
http://jid.oxfordjournals.org/D
ownloaded from

Acce
pted M
anus
cript
7
Data set 6 (HIV+ men, novel data)
PBMC samples were obtained from 109 HIV+ men in order to study the relationship between
viral load, blood cell counts, and epigenetic age acceleration. This data set did not contain any
HIV- controls. Participant samples were recruited from the National Neurological AIDS Bank
study or Multicenter AIDS Cohort Study in Los Angeles. The mean age was 52 years (ranging
from 31 to 68 years). The following measured blood cell count data were available: CD8 T cell
(percentage): mean=46% (ranging from 19 to 79), CD4 T cell (perc): mean=30% (ranging from
2 to 54.0), granulocyte (perc): mean=56 (ranging from 20 to 77.0), CD14 monocyte (perc):
mean=8.10 (ranging from 4 to 24.0).
Data set 7 (Whole Blood from controls from GSE42861 [34])
Here we only used the 335 control samples from [34] (i.e. from subjects without rheumatoid
arthritis). The cell proportions for each individual were estimated by Dr. Yun Liu [34] using the
Houseman method [35].
Data set 8 (sorted leukocyte cells from GSE39981 [36])
The authors isolated PMBCs by magnetic-activated cell sorting (MACS; Miltenyi Biotec Inc.)
and confirmed purity by FACS [36]. We focused here on data from 4 individuals for whom
complete data on monocytes, neutrophils, B cells, pan T cells, CD4 T, natural killer and
granulocyte data were available.
by guest on March 21, 2016
http://jid.oxfordjournals.org/D
ownloaded from

Acce
pted M
anus
cript
8
Data set 9 (blood cell type data from GSE35069 [37])
The authors analyzed sorted blood cells (CD4+ T cells, CD8+ T cells, CD56+ NK cells, CD19+
B cells, CD14+ monocytes, neutrophils, and eosinophils) from 6 healthy male blood donors, age
38 ± 13.6 years.
Data set 10 (CD4+T cells and CD14+monocytes from GSE20242 [16])
The authors applied the Illumina Infinium 27K array to CD4+ T-cells and CD14+ monocytes
from the same individuals. We restricted the analysis to the 23 healthy subjects for whom both
cell types were available.
Data set 11 (sorted blood cells from 6 subjects from E−ERAD−179 [38])
The authors measured DNA methylation levels from PBMCs and cell subsets (CD4, CD8, CD14,
CD19, CD16 and whole PBMCs) from 6 healthy volunteers.
DNA methylation age and the epigenetic clock
The epigenetic clock is defined as a prediction method of age based on the linear combination of
the DNA methylation levels of 353 CpGs dinucleotides [25]. Predicted age, referred to as DNA
methylation age, correlates with chronological age in sorted cell types (CD4 T cells, monocytes,
B cells, glial cells, neurons) and tissues and organs including whole blood, brain, breast, kidney,
liver, lung, saliva [25]. By construction, the epigenetic clock (and software) applies to data
generated using either the Illumina 450K or the 27K platform. Mathematical details and software
tutorials for the epigenetic clock can be found in the Additional files of [25]. An online age
calculator can be found at our webpage: http://labs.genetics.ucla.edu/horvath/dnamage/ .
by guest on March 21, 2016
http://jid.oxfordjournals.org/D
ownloaded from

Acce
pted M
anus
cript
9
Blood cell count estimates
Flow cytometry measures of blood cell counts were assessed by the Multicenter AIDS Cohort
Study in Los Angeles as described in [39]. For data sets involving HIV- subjects (e.g. data set 7)
blood cell proportions (CD8 T, CD4 T, natural killer, B cells, granulocytes) were estimated using
Houseman's estimation method [35], which is based on DNA methylation signatures from
purified leukocyte samples. The percentage of exhausted CD8 T cells (defined as CD28-
CD45RA-) and the number (count) of naïve CD8+ T cells (defined as (CD45RA+CCR7+) were
estimated using the advanced analysis option of the epigenetic clock software [25].
RESULTS
Brain tissue from HIV+ and HIV- subjects
Using the first brain data set, we observe a strong correlation between DNA methylation age and
chronological age in all brain regions (Figure 1A-D). Regression lines through samples from
HIV+ subjects only (orange lines in Figure 1A-C) and HIV- subjects only (black lines) suggests
that HIV+ subjects have a DNA methylation age that is older than that of HIV- controls.
To carry out a formal statistical analysis, we defined a measure of epigenetic age acceleration as
the difference between the observed DNAm age value and that predicted by a linear model in
HIV- individuals. A positive value indicates that DNA methylation age is higher than that
predicted from the linear model for HIV- subjects of the same age. On average, brain samples
from HIV+ subjects exhibit significant age acceleration effects (p=8.0x10⁻⁸, Figure 1E) but these
effects depend on brain region: significant age acceleration effects can be observed in the
occipital cortex (p=9.6x10⁻⁵, Figure 1F) and the cerebellum (p=0.036, Figure 1G) but not in the
frontal lobe (Figure 1H). We caution the reader that differences in age acceleration effects may
by guest on March 21, 2016
http://jid.oxfordjournals.org/D
ownloaded from

Acce
pted M
anus
cript
10
reflect low sample sizes or technical variability. But the difference between the cerebellum and
frontal lobe is reproducible in independent data sets. Using brain data set 3, we observe again a
significant age acceleration effect in the cerebellum (p=0.031 Figure 2C, 7.4 years Supplement
1). But we do not observe an accelerated aging effect in the second frontal lobe data set (data set
2, Figure 2D), which is congruent with our findings in data set 1 (Figure 1H). Future research
will need to clarify why HIV infection seems to accelerate the age of some brain regions (e.g.
occipital lobe, cerebellum) but not that of others (e.g. frontal lobe). To estimate the effect of age
acceleration in terms of years, we used a linear regression model that regressed DNA
methylation age on chronological age and viral load status (see Supplement 1). The analysis
suggests that brain regions of HIV+ subjects are on average 7.4 years older than those of HIV-
controls. The estimated acceleration effect is 9.3 years in occipital cortex, 5 years in cerebellum,
and 0.1 years in frontal lobe.
Overall, HIV viral load in the cerebrospinal fluid of HIV+ subjects is not significantly correlated
with age acceleration in the brain samples (Figure 1I-K) but there is a marginally significant
effect in the frontal lobe (r=0.42, p=0.065 Figure 1L). Since viral load was not ascertained in
brain tissue, we could not correlate it with epigenetic age acceleration in the respective brain
regions.
More detailed examination is required in order to determine the cellular and histopathological
correlates of age acceleration in HIV+ brains. Table 2 provides clinical information about the
patients from whom autopsy brain samples were analyzed. Unfortunately, cause of death is not
collected by the NNTC, and in any event is often times unreliable due to the multiple
comorbidities of the participants. However, and more relevant considering that we have
examined brain DNA, the NNTC conducts neuropathological examination according to a
by guest on March 21, 2016
http://jid.oxfordjournals.org/D
ownloaded from

Acce
pted M
anus
cript
11
standard protocol. While the brain pathologies from HIV+ subjects do not necessarily translate to
specific diseases or clinical syndromes, and further are not uncommon in individuals with
advanced HIV, these data indicate that of the 31 individuals with noted brain pathology, several
had more than one type. All subjects were diagnosed as either neurocognitively normal or with
HIV-Associated Neurocognitive Disorder (according to [40]) within one year prior to death. We
also included in Table 2 virologic and clinical variables. Note that in some instances this
information was not collected. According to the autopsy results, 8 cases had HIV encephalitis.
Greater number of perivascular macrophages are found in the brains of patients with HIV
encephalitis (as reviewed in [41]). While, we cannot rule out that the observed age acceleration
effects reflect changes in cellular composition (e.g., increased numbers of perivascular
macrophages), we could not find a significant relationship between epigenetic age acceleration
effects in brain samples from HIV+ subjects and a marker of activated macrophages: namely
ionized calcium-binding adapter molecule 1 (IBA1) which is encoded by the gene Allograft
Inflammatory Factor 1 (AIF-1). The IBA1 marker was assessed using immunohistochemical
staining of paraffin embedded tissue as described in Methods.
Blood from HIV+ and HIV- subjects
Using two independent blood data sets, we observe that HIV+ subjects exhibit a significant age
acceleration effect (p=0.0048 and p=0.00036 in Figure 3C,D). A linear model analysis reveals
that the DNA methylation age of HIV+ subjects is on average 5.2 years older than that of HIV-
subjects (3.7 years in blood data set 4 and 6.7 years in blood data set 5, Supplement 1). Since we
analyzed whole blood (as opposed to sorted blood cells), we cannot rule out that the observed
epigenetic age acceleration effects are mediated by changes in blood cell composition.
by guest on March 21, 2016
http://jid.oxfordjournals.org/D
ownloaded from

Acce
pted M
anus
cript
12
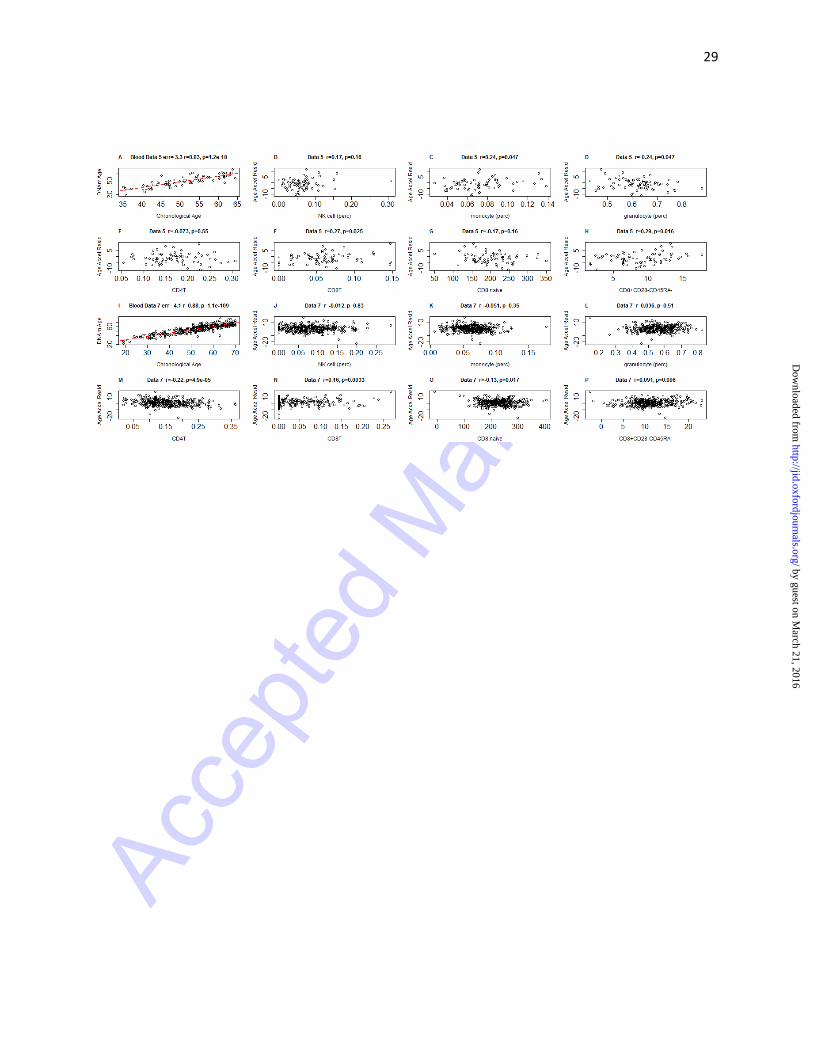
Epigenetic age acceleration versus blood cell counts in HIV+ men
We used PBMCs from 109 HIV+ men (data set 6) to study the relationship between epigenetic
age, HIV viral load, and blood cell counts.
DNA methylation age is closely related with chronological age in these HIV+ subjects (r=0.80,
median error=3.9 years, Figure 4A). We defined a measure of epigenetic age acceleration as the
residual from a linear regression line (red line in Figure 4A). A multivariate regression analysis
suggests that HIV+ subjects with detectable viral load (more than 35 copies per mL) have a DNA
methylation age that is on average 3.6 years older than that of HIV+ men with non-detectable
viral load but the association is only marginally significant (p=0.033) and requires further
validation studies. About 92% of our HIV+ subjects are on antiretroviral therapy but we are
unable to assess who is actually taking their medications. Thus, detectable viral load could be
due to a lack of adherence or due to treatment failure. Epigenetic age acceleration correlates with
several cell count measures in these HIV+ subjects including natural killer cells (r=0.33, p=4x10-
4, Figure 4B), monocytes (r=0.2, p=0.05, Figure 4C), granulocytes (r=-0.37, p=0.00019, Figure
4D), CD4+ T cells (r=-0.23, p=0.023, Figure 4E), CD8+ T cells (r=0.24, p=0.017, Figure 4F),
exhausted (CD28-CD45RA-) CD8+ T cells (r=0.36, p=1.0x10⁻⁴, Figure 4H) and the number of
naïve (CD45RA+CCR7+) CD8T cells (r=-0.26, p=0.0059, Figure 4G).
Epigenetic age acceleration versus blood cell counts in HIV- subjects
In contrast to our findings for HIV+ subjects, epigenetic age acceleration exhibits weaker
correlations with blood cell count measures in HIV- subjects (Figure 5). The highest correlation
can be observed for the percentage of exhausted CD8 T cells in the HIV- controls from blood
data set 5 (r=0.29, p=0.016, Figure 5H) but this finding does not validate in an independent data
by guest on March 21, 2016
http://jid.oxfordjournals.org/D
ownloaded from

Acce
pted M
anus
cript
13
set (data set 7, Figure 5P). These findings are congruent with the fact that sorted blood cells
appear to have similar DNA methylation ages (Supplement 2). The relatively small sample sizes
provided by data sets 8-11 do not provide sufficient statistical power for detecting significant
differences in DNA methylation age between blood cells (B cells, CD4 T cells, CD8 T cells,
eosinophils, granulocytes, monocytes, natural killer cells, neutrophils) isolated from the same
HIV- subjects (Supplement 2).
DISCUSSION
In the following, we discuss several models that could explain the relationship between HIV
status and epigenetic age acceleration.
Model 1 (HIV infection-> telomere length -> epigenetic age acceleration)
This model assumes that changes in telomere length mediate the effect of HIV infection on
epigenetic age acceleration. This model is probably incorrect because a) there seems to be at best
a very weak correlation between leukocyte telomere length and epigenetic age acceleration [42]
and b) it is difficult to adapt this model to explain age acceleration effects in brain tissue.
Model 2 (HIV infection-> exhausted/senescent T cells-> age acceleration)
Model 2 posits that the effect of HIV viral load on age acceleration is mediated by increases in
the amount of senescent or exhausted T cells, e.g. (CD28-CD45RA-) CD8+ T cells. Our blood
data support this model to some extent: we find that the amount of exhausted CD8 T cells
correlates with epigenetic age acceleration in HIV+ subjects (Figure 4H) and to a lesser extent in
HIV- subjects (Figure 5H, 5P). But it is difficult to use this model for explaining accelerated
aging effects in brain tissue due to the blood-brain barrier.
by guest on March 21, 2016
http://jid.oxfordjournals.org/D
ownloaded from

Acce
pted M
anus
cript
14
Model 3: (exhausted/senescent T cells<- HIV infection -> age acceleration)
Model 3 is the independent model, in which HIV infection causes increases in exhausted T cell
counts and age acceleration independently. In other words, HIV infection confounds the
relationship between exhausted T cell count and age acceleration. This is a plausible model but it
leaves us with the question: How does HIV infection lead to epigenetic age acceleration? At this
point, it is difficult to address this question since it is unknown what is being measured by DNA
methylation age. Several lines of indirect evidence suggest that DNA methylation age might
measure the cumulative work done by an epigenomic maintenance system [25]. In support of this
hypothesis, we mention HIV-1 infection is known to induce double-strand breaks of
chromosomal DNA [43] and to induce chromosomal DNA damage responses by activating
Rad3-related or ataxia-telangiectasia mutated proteins and by promoting phosphorylation of their
downstream substrates [44, 45]. If one assumes that viral integration into the host genome leads
to epigenomic instability (related to genetic instability) then the observed accelerated aging
effects could reflect the protective actions of the epigenomic maintenance system.
Our study has several limitations including the following. First, we analyzed relatively few HIV-
subjects in our brain data sets (n=13 in data set 1) because it is difficult to obtain brain samples
from relatively young, deceased subjects. Second, our observational study may be biased by
hidden confounders that distinguish HIV- from HIV+ subjects. Third, we are not able to assess
whether detectable viral load in HIV+ subjects is due to treatment failure or due to lack of
adherence to the treatment. The weak association between age acceleration and viral load may
reflect the fact that viral load does not capture the history of viral load burden. Controlled in vitro
studies would be helpful for understanding the relationship between viral load and age
acceleration.
by guest on March 21, 2016
http://jid.oxfordjournals.org/D
ownloaded from

Acce
pted M
anus
cript
15
In conclusion, we demonstrate that HIV infection is associated with a significant increase in
DNA methylation age in brain and blood tissue. Our results are consistent with the reported
clinical manifestations of accelerated aging effects among HIV+ adults, despite apparent viral
control. Future studies will need to explore whether the epigenetic clock can serve as a useful
tool for the study of, and/or inform therapeutic strategies aimed at preventing, HIV-Associated
Non-AIDS conditions such as cardiovascular disease and HIV-Associated Neurocognitive
Disorder [6, 46].
Footnote page
Potential conflicts of interest.
All authors: No reported conflicts.
Author contributions
SH conceived of the study and carried out the statistical analysis. SH and AJL wrote the article.
AJL provided the blood and brain data and assisted with the clinical interpretation.
Financial support
SH was primarily funded by NIA/NIH 5R01AG042511-02. Additional funding from the UCLA
AIDS Institute, UCLA Center for AIDS Research (AI28697), the UCLA Clinical and
Translational Science Institute, NCRR and NCATS (UL1TR000124). In addition, the National
Institute for Drug Abuse grant R01DA030913 (Levine & Horvath), the Los Angeles site of the
Multicenter AIDS Cohort Study is funded the National Institute of Allergy and Infectious
by guest on March 21, 2016
http://jid.oxfordjournals.org/D
ownloaded from

Acce
pted M
anus
cript
16
Disease grant U01-AI-35040 (Detels), and the National NeuroAIDS Tissue Consortium, which
consists of National Neurological AIDS Bank (U01-MH08021 and R24-NS38841 - Singer),
Texas NeuroAIDS Research Center (U01-MH083507 and R24-NS45491 - Gelman), Manhattan
HIV Brain Bank (U01-MH083501 and R24-MH59724 - Morgello), and California NeuroAIDS
Tissue Network (U01-MH083506 and R24-MH59745 - Grant)
REFERENCES
1. Fausto A, Bongiovanni M, Cicconi P, et al. Potential predictive factors of osteoporosis in HIV-positive subjects. Bone 2006; 38:893-7. 2. Triant VA, Lee H, Hadigan C, Grinspoon SK. Increased Acute Myocardial Infarction Rates and Cardiovascular Risk Factors among Patients with Human Immunodeficiency Virus Disease. J Clin Endocrinol Metab 2007; 92:2506-12. 3. Lucas GM, Mehta SH, Atta MG, et al. End-stage renal disease and chronic kidney disease in a cohort of African-American HIV-infected and at-risk HIV-seronegative participants followed between 1988 and 2004. AIDS 2007; 21:2435-43. 4. Silverberg M, Chao C, Leyden W, et al. HIV infection and the risk of cancers with and without a known infectious cause. AIDS 2009; 23:2337-45. 5. Martin J, Volberding P. HIV and Premature Aging: A Field Still in Its Infancy. Ann Intern Med 2010; 153:477-9. 6. Deeks SG. HIV Infection, Inflammation, Immunosenescence, and Aging. Annu Rev Med 2011; 62:141-55. 7. Desquilbet L, Jacobson LP, Fried LP, et al. A Frailty-Related Phenotype Before HAART Initiation as an Independent Risk Factor for AIDS or Death After HAART Among HIV-Infected Men. J Gerontol A Biol Sci Med Sci 2011; 66A:1030-8. 8. Silverberg MJ, Chao C, Leyden WA, et al. HIV Infection, Immunodeficiency, Viral Replication, and the Risk of Cancer. Cancer Epidemiol Biomarkers Prev 2011; 20:2551-9. 9. Womack JA, Goulet JL, Gibert C, et al. Increased Risk of Fragility Fractures among HIV Infected Compared to Uninfected Male Veterans. PLoS ONE 2011; 6:e17217. 10. Wendelken L, Valcour V. Impact of HIV and aging on neuropsychological function. J Neurovirol 2012; 18:256-63. 11. Kirk GD, Mehta SH, Astemborski J, et al. HIV, Age, and the Severity of Hepatitis C Virus–Related Liver DiseaseA Cohort Study. Ann Intern Med 2013; 158:658-66. 12. Greene M, Justice A, Lampiris H, Valcour V. Management of human immunodeficiency virus infection in advanced age. JAMA 2013; 309:1397-405. 13. High KP, Brennan-Ing M, Clifford DB, et al. HIV and aging: state of knowledge and areas of critical need for research. A report to the NIH Office of AIDS Research by the HIV and Aging Working Group. J Acquir Immune Defic Syndr 2012; 60 Suppl 1:S1-18.
by guest on March 21, 2016
http://jid.oxfordjournals.org/D
ownloaded from

Acce
pted M
anus
cript
17
14. Christensen B, Houseman E, Marsit C, et al. Aging and Environmental Exposures Alter Tissue-Specific DNA Methylation Dependent upon CpG Island Context. PLoS Genet 2009; 5:e1000602. 15. Bollati V, Schwartz J, Wright R, et al. Decline in genomic DNA methylation through aging in a cohort of elderly subjects. Mech Ageing Dev 2009; 130:234-9. 16. Rakyan VK, Down TA, Maslau S, et al. Human aging-associated DNA hypermethylation occurs preferentially at bivalent chromatin domains. Genome research 2010; 20:434-9. 17. Teschendorff AE, Menon U, Gentry-Maharaj A, et al. Age-dependent DNA methylation of genes that are suppressed in stem cells is a hallmark of cancer. Genome research 2010; 20:440-6. 18. Vivithanaporn P, Heo G, Gamble J, et al. Neurologic disease burden in treated HIV/AIDS predicts survival. Neurology 2010; 75:1150-8. 19. Horvath S, Zhang Y, Langfelder P, et al. Aging effects on DNA methylation modules in human brain and blood tissue. Genome Biol 2012; 13:R97. 20. Numata S, Ye T, Hyde Thomas M, et al. DNA Methylation Signatures in Development and Aging of the Human Prefrontal Cortex. Am J Hum Genet 2012; 90:260-72. 21. Alisch RS, Barwick BG, Chopra P, et al. Age-associated DNA methylation in pediatric populations. Genome Res 2012; 22:623-32. 22. Johansson A, Enroth S, Gyllensten U. Continuous Aging of the Human DNA Methylome Throughout the Human Lifespan. PLoS One 2013; 8:e67378. 23. Day K, Waite L, Thalacker-Mercer A, et al. Differential DNA methylation with age displays both common and dynamic features across human tissues that are influenced by CpG landscape. Genome Biol 2013; 14:R102. 24. Bocklandt S, Lin W, Sehl ME, et al. Epigenetic predictor of age. PLoS ONE 2011; 6:e14821. 25. Horvath S. DNA methylation age of human tissues and cell types. Genome Biol 2013; 14. 26. Boks MP, Derks EM, Weisenberger DJ, et al. The Relationship of DNA Methylation with Age, Gender and Genotype in Twins and Healthy Controls. PLoS ONE 2009; 4:e6767. 27. Horvath S, Erhart W, Brosch M, et al. Obesity accelerates epigenetic aging of human liver. Proc Natl Acad Sci U S A 2014; 111:15538-43. 28. Marioni R, Shah S, McRae A, et al. DNA methylation age of blood predicts all-cause mortality in later life. Genome Biol 2015; 16:25. 29. Marioni RE, Shah S, McRae AF, et al. The epigenetic clock is correlated with physical and cognitive fitness in the Lothian Birth Cohort 1936. Int J Epidemiol 2015. 30. Horvath S, Garagnani P, Bacalini M, et al. Accelerated Epigenetic Aging in Down Syndrome. Aging Cell 2015; 14. 31. Morgello S, Gelman B, Kozlowski P, et al. The National NeuroAIDS Tissue Consortium: a new paradigm in brain banking with an emphasis on infectious disease. Neuropathol Appl Neurobiol 2001; 27:326-35. 32. Soontornniyomkij V, Soontornniyomkij B, Moore DJ, et al. Antioxidant sestrin-2 redistribution to neuronal soma in human immunodeficiency virus-associated neurocognitive disorders. J Neuroimmune Pharmacol 2012; 7:579-90. 33. Soontornniyomkij V, Risbrough VB, Young JW, et al. Short-term recognition memory impairment is associated with decreased expression of FK506 binding protein 51 in the aged mouse brain. Age (Dordr) 2010; 32:309-22. 34. Liu Y, Aryee MJ, Padyukov L, et al. Epigenome-wide association data implicate DNA methylation as an intermediary of genetic risk in rheumatoid arthritis. Nat Biotech 2013; 31:142-7. 35. Houseman E, Accomando W, Koestler D, et al. DNA methylation arrays as surrogate measures of cell mixture distribution. BMC Bioinformatics 2012; 13:86. 36. Accomando WP, Wiencke JK, Houseman EA, et al. Decreased NK Cells in Patients with Head and Neck Cancer Determined in Archival DNA. Clin Cancer Res 2012; 18:6147-54.
by guest on March 21, 2016
http://jid.oxfordjournals.org/D
ownloaded from

Acce
pted M
anus
cript
18
37. Reinius LE, Acevedo N, Joerink M, et al. Differential DNA Methylation in Purified Human Blood Cells: Implications for Cell Lineage and Studies on Disease Susceptibility. PLoS ONE 2012; 7:e41361. 38. Zilbauer M, Rayner TF, Clark C, et al. Genome-wide methylation analyses of primary human leukocyte subsets identifies functionally important cell-type-specific hypomethylated regions. Blood 2013; 122:e52-60. 39. Ibarrondo FJ, Yang OO, Chodon T, et al. Natural Killer T Cells in Advanced Melanoma Patients Treated with Tremelimumab. PLoS ONE 2013; 8:e76829. 40. Clinical confirmation of the American Academy of Neurology algorithm for HIV-1-associated cognitive/motor disorder. The Dana Consortium on Therapy for HIV Dementia and Related Cognitive Disorders. Neurology 1996; 47:1247-53. 41. Levine AJ, Panos SE, Horvath S. Genetic, transcriptomic, and epigenetic studies of HIV-associated neurocognitive disorder. J Acquir Immune Defic Syndr 2014; 65:481-503. 42. Boks MP, Mierlo HCv, Rutten BPF, et al. Longitudinal changes of telomere length and epigenetic age related to traumatic stress and post-traumatic stress disorder. Psychoneuroendocrinology 2014; S0306. 43. Tachiwana H, Shimura M, Nakai-Murakami C, et al. HIV-1 Vpr Induces DNA Double-Strand Breaks. Cancer Res 2006; 66:627-31. 44. Lau A, Swinbank KM, Ahmed PS, et al. Suppression of HIV-1 infection by a small molecule inhibitor of the ATM kinase. Nat Cell Biol 2005; 7:493-500. 45. Zimmerman ES, Chen J, Andersen JL, et al. Human Immunodeficiency Virus Type 1 Vpr-Mediated G2 Arrest Requires Rad17 and Hus1 and Induces Nuclear BRCA1 and γ-H2AX Focus Formation. Mol Cell Biol 2004; 24:9286-94. 46. Nath AA. HIV and aging. J Neurovirol 2012; 18:245-6. 47. Heaton R, Kirson D, Velin R, Grant I, Martin A. The utility of clinical ratings for detecting cognitive change in HIV infection. . New York: Oxford University Press, 1994 (Grant I, Martin A, eds. Neuropsychology of HIV infection). 48. Antinori A, Arendt G, Becker JT, et al. Updated research nosology for HIV-associated neurocognitive disorders. Neurology 2007; 69:1789-99.
by guest on March 21, 2016
http://jid.oxfordjournals.org/D
ownloaded from

Acce
pted M
anus
cript
19
TABLES
Table 1: Overview of the DNA methylation data sets
The rows correspond to the Illumina data sets used in this article. Columns report the DNA
source, Illumina platform, number of Illumina arrays, number of HIV+ subjects, relevant citation
(first author and publication year), and public availability (either Gene Expression Omnibus
identifier or ArrayExpress identifier).
Data
set
DNA
origin
Description Illumina
Platform
n no.
HIV+
Citation Availability
1 Brain
tissue
various brain
regions from
HIV+ and
HIV-
450K 130 99 Novel
data
GSE59457
2 Brain
tissue
frontal lobe
from HIV+
and HIV-
450K 33 8 Novel
data
GSE67749
3 Brain
tissue
cerebellum
from HIV+
and HIV-
450K 20 8 Novel
data
GSE67748
4 Whole
blood
HIV+/- 450K 92 24 Novel
data
GSE53841
5 Whole
blood
HIV+/- 450K 92 23 Novel
data
GSE67751
6 PBMC HIV+ men 450K 109 109 Novel GSE53840
by guest on March 21, 2016
http://jid.oxfordjournals.org/D
ownloaded from

Acce
pted M
anus
cript
20
data
7 Whole
blood
Healthy
controls
450K 335 0 Liu 2013 GSE42861
8 Blood
Cell
Types
4 healthy
subjects
27K 28 0 Accomand
o 2012
GSE39981
9 Blood
Cell
Types
6 healthy men 450K 60 0 Reinius
2012
GSE35069
10 CD4 T
cells +
monocytes
23 healthy
subjects
27K 46 0 Rakyan
2010
GSE20242
11 Blood
Cell
Types
6 healthy
subjects
450K 42 0 Zilbauer
2013
E−ERAD−1
79
by guest on March 21, 2016
http://jid.oxfordjournals.org/D
ownloaded from

Acce
pted M
anus
cript
21
Table 2: Clinical Characteristics of the brain data set from the National NeuroAIDS Tissue
Consortium. Global neurocognitive clinical rating was assessed as described in [47]. HIV
related neurocognitive disorder was assessed as described in [40, 48].
Variable N Mean (SD)
Age at Death (years) 71 45.9 (9.1)
Duration of Infection (years) 65 13 (6.9)
Nadir CD4 (CD4 count) 71 27.7 (33.2)
Plasma Viral Load at Diagnosis (logarithm with base 10 count of viral copies)
70 3.75 (1.35)
CSF Viral Load (log base 10 count) 48 2.75 (1.37)
CD4 at Death (CD4 count) 70 114 (141)
Global Neurocognitive Clinical Rating (Heaton 1994)
71 5.3 (2)
% of available cases (actual number)
HIV-related neurocognitive disorder (Antinori 2007, Dana Consortium)
71 73%
Taking combined antiretroviral therapy 65 80%
Neuropathological Findings 31 44%
Alzheimer's Type 2 Gliosis 10% (7)
Aseptic leptomeningitis 6% (4)
Focal infarct 6% (4)
Hemorrhage 3% (2)
HIV Encephalitis 11% (8)
Hypoxic/ischemic damage 4% (3)
Microglial nodule encephalitis 13% (9)
Lymphoma 1.5% (1)
Other non-infectious path 6% (4)
Other Infections 3% (2)
Tuberculosis 1.5% (1)
by guest on March 21, 2016
http://jid.oxfordjournals.org/D
ownloaded from

Acce
pted M
anus
cript
22
Figure Legends
Figure 1: Discovery brain data from HIV+ and HIV- subjects
A-D) DNA methylation age (y-axis) versus chronological age in A) all brain samples, B)
occipital cortex, C) cerebellum, D) frontal lobe. Red squares and black triangles in the scatter
plot denote samples from HIV+ and HIV- subjects, respectively. The orange line depicts a linear
regression line through HIV+ samples. Similarly, the black solid line corresponds to a regression
line of DNA methylation age on chronological age in HIV- samples. For each subject (point),
age acceleration is defined as the vertical distance to the black regression line (i.e. DNA
methylation age minus the expected value based on HIV- samples). E) Mean age acceleration (y-
axis) versus HIV- status in all brain samples. Each bar plot depicts one standard error around the
mean value and reports the Kruskal Wallis (non-parametric) group comparison test p-value.
Analogous results can be obtained when restricting the analysis to occipital cortex (B,F) or
cerebellar samples (C,G) but not for samples from the frontal lobe (D,G). E-H) The group
comparisons in (E-H) involved a total of n=130, 72, 24, 24, samples respectively. The number of
samples in each group is reported by the rotated number under each bar. I-L) HIV viral load (log
base 10 transformed) in cerebrospinal fluid (x-axis) of HIV+ subjects versus age acceleration (y-
axis) in all brain samples (I), occipital cortex (J), cerebellum (K), and frontal lobe (L).
by guest on March 21, 2016
http://jid.oxfordjournals.org/D
ownloaded from

Acce
pted M
anus
cript
23
Figure 2: Validation brain data from HIV+ and HIV- subjects
Analogous to Figure 1, we used an independent data sets (data 2 and 3) to relate HIV status to
epigenetic age acceleration in the frontal lobe and cerebellum of HIV+ and HIV-subjects. DNA
methylation age versus chronological age in A) cerebellum and B) frontal lobe samples. Points
(subjects) are colored by HIV status: HIV+ subjects correspond to red squares. The orange and
black lines depict regression lines through HIV+ and HIV- samples, respectively. The measure
of age acceleration is the same as used in Figure 1. Age acceleration (y-axis) versus HIV status
in C) cerebellum and D) frontal lobe. Each bar plot reports the Kruskal Wallis (non-parametric)
group comparison test p-value and one standard error around the mean.
Figure 3: Epigenetic age in blood tissue versus HIV status
(pdf file Figure3HIVdataAgeAcceleration.pdf). The first column (panels A,C) and second
column (B,D) report findings for blood data sets 4 and 5, respectively. A,B) DNA methylation
age (y-axis) versus chronological age (x-axis). HIV+ samples (points) are colored in red. The
black solid line and the orange line correspond to regression lines through HIV- samples and
HIV+ samples, respectively. For each subject (point), age acceleration is defined as the vertical
distance to the black regression line. C,D) Mean age acceleration (y-axis) versus HIV status. The
rotated numbers on the x-axis report the group sizes. The barplots report 1 standard error and a
Kruskal Wallis test p-value.
by guest on March 21, 2016
http://jid.oxfordjournals.org/D
ownloaded from

Acce
pted M
anus
cript
24
Figure 4: Age acceleration versus blood cell counts in HIV+ subjects.
(pdf file Figure4HIVBloodcount.pdf)
Here we use DNA methylation data from PBMCs of HIV+ subjects (data set 6). A) DNA
methylation age versus age. The red line indicates the regression line. The black line corresponds
to y=x. Epigenetic age acceleration (defined as residual) versus the percentage of B) natural
killer cells, C) monocytes, D) granulocytes, E) CD4 T cells, F) CD8 T cells, G) naïve CD8 T
cells, and H) exhausted (CD28-CD45RA-) CD8 T cells.
Figure 5: Age acceleration versus blood cell counts in HIV- control subjects
(pdf file Figure5controlBloodCount.pdf)
The first two rows (A-H) and the last two rows (I-P) present results for HIV- control subjects
from blood data sets 5 and 7, respectively. A, I) DNA methylation age versus chronological age
(x-axis). Age acceleration was defined as residual resulting from the regression line (red line).
Age acceleration versus B, J) natural killer cells, C, K) CD14+ monocytes, D, L) granulocytes,
E, M) CD4 T cells, F, N) CD8 T cells, G, O) naive CD8 T cells, H, P) exhausted (CD28-
CD45RA-) CD8 T cells. The blood cell abundance measures were estimated based on the DNA
methylation data (Methods).
by guest on March 21, 2016
http://jid.oxfordjournals.org/D
ownloaded from

Acce
pted M
anus
cript
25
by guest on March 21, 2016
http://jid.oxfordjournals.org/D
ownloaded from

Acce
pted M
anus
cript
26
by guest on March 21, 2016
http://jid.oxfordjournals.org/D
ownloaded from

Acce
pted M
anus
cript
27
by guest on March 21, 2016
http://jid.oxfordjournals.org/D
ownloaded from

Acce
pted M
anus
cript
28
by guest on March 21, 2016
http://jid.oxfordjournals.org/D
ownloaded from
Acce
pted M
anus
cript
29
by guest on March 21, 2016
http://jid.oxfordjournals.org/D
ownloaded from