High-Throughput Analysis of Antimalarial Susceptibility Data by the WorldWide Antimalarial...
10
High-Throughput Analysis of Antimalarial Susceptibility Data by the WorldWide Antimalarial Resistance Network (WWARN) In Vitro Analysis and Reporting Tool Charles J. Woodrow, a,b Sabina Dahlström, c Richard Cooksey, a Jennifer A. Flegg, a Hervé Le Nagard, d France Mentré, d Claribel Murillo, e Didier Ménard, f François Nosten, g Kanlaya Sriprawat, g Lise Musset, h Neils B. Quashie, i,j Pharath Lim, k,l Rick M. Fairhurst, k Sam L. Nsobya, m Veronique Sinou, n Harald Noedl, o Bruno Pradines, p,q,r Jacob D. Johnson, s Philippe J. Guerin, a Carol H. Sibley, a,t Jacques Le Bras c,u,v WorldWide Antimalarial Resistance Network (WWARN), Centre for Tropical Medicine, Nuffield Department of Clinical Medicine, University of Oxford, Churchill Hospital, Oxford, United Kingdom a ; Mahidol-Oxford Tropical Medicine Research Unit, Faculty of Tropical Medicine, Mahidol University, Bangkok, Thailand b ; WorldWide Antimalarial Resistance Network (WWARN) In Vitro Module, Hôpital Bichat-Claude Bernard, Paris, France c ; INSERM, Université Paris Diderot, UMR-S 738, Paris, France d ; International Center for Medical Research and Training (CIDEIM), Cali, Colombia e ; Malaria Molecular Epidemiology Unit, Institut Pasteur in Cambodia, Phnom Penh, Cambodia f ; Shoklo Malaria Research Unit, Mae Sod, Tak, Thailand g ; Laboratoire de Parasitologie, Centre National de Référence de la Chimiorésistance du Paludisme pour la Région Antilles- Guyane, Institut Pasteur de la Guyane, Cayenne, French Guiana h ; Centre for Tropical Clinical Pharmacology and Therapeutics, University of Ghana Medical School, i and Epidemiology Department, Noguchi Memorial Institute for Medical Research, University of Ghana, j Accra, Ghana; Laboratory of Malaria and Vector Research, National Institute of Allergy and Infectious Diseases, National Institutes of Health, Bethesda, Maryland, USA k ; National Center for Parasitology, Entomology and Malaria Control, Phnom Penh, Cambodia l ; Department of Medicine, Makerere University, Kampala, Uganda m ; Aix-Marseille Université, UMR-MD3, Marseille, France n ; Institute of Specific Prophylaxis and Tropical Medicine, Medical University of Vienna, Vienna, Austria o ; Unité de Parasitologie, Institut de Recherche Biomédicale des Armées, Marseille, France p ; Aix Marseille Université, URMITE, UM63, CNRS 7278, IRD 198, INSERM 1095, Marseille, France q ; Centre National de Référence du Paludisme, Marseille, France r ; U.S. Army Medical Research Unit—Kenya, Walter Reed Project, Kisumu, Kenya s ; Department of Genome Sciences, University of Washington, Seattle, Washington, USA t ; Université Paris Descartes (Paris 5), Paris, France u ; Institut de Recherche pour le Développement (IRD), UMR 216, Paris, France v Assessment of in vitro susceptibility is a fundamental component of antimalarial surveillance studies, but wide variations in the measurement of parasite growth and the calculation of inhibitory constants make comparisons of data from different laborato- ries difficult. Here we describe a Web-based, high-throughput in vitro analysis and reporting tool (IVART) generating inhibitory constants for large data sets. Fourteen primary data sets examining laboratory-determined susceptibility to artemisinin deriva- tives and artemisinin combination therapy partner drugs were collated from 11 laboratories. Drug concentrations associated with half-maximal inhibition of growth (IC 50 s) were determined by a modified sigmoid E max model-fitting algorithm, allowing standardized analysis of 7,350 concentration-inhibition assays involving 1,592 isolates. Examination of concentration-inhibition data revealed evidence of apparent paradoxical growth at high concentrations of nonartemisinin drugs, supporting amendment of the method for calculating the maximal drug effect in each assay. Criteria for defining more-reliable IC 50 s based on estimated confidence intervals and growth ratios improved correlation coefficients for the drug pairs mefloquine-quinine and chloro- quine-desethylamodiaquine in 9 of 11 and 8 of 8 data sets, respectively. Further analysis showed that maximal drug inhibition was higher for artemisinins than for other drugs, particularly in ELISA (enzyme-linked immunosorbent assay)-based assays, a finding consistent with the earlier onset of action of these drugs in the parasite life cycle. This is the first high-throughput analyt- ical approach to apply consistent constraints and reliability criteria to large, diverse antimalarial susceptibility data sets. The data also illustrate the distinct biological properties of artemisinins and underline the need to apply more sensitive approaches to assessing in vitro susceptibility to these drugs. T he mission of the WorldWide Antimalarial Resistance Net- work (WWARN) is to enhance the quality, quantity, and geo- graphic extent of drug susceptibility data available to the malaria control community via a global data repository. Laboratory-based assessment of parasites in culture (“in vitro”) enables measure- ment of the intrinsic drug susceptibility of Plasmodium falciparum without the confounding effects of host pharmacokinetics, immu- nity, and genetics (1). Parasites with reduced antimalarial suscep- tibilities can be established in continuous culture, allowing the investigation of molecular mechanisms of resistance as well as the assessment of susceptibility to other antimalarial agents (2). In an era when artemisinin combination therapies (ACTs) are recom- mended treatment for falciparum malaria worldwide, additional considerations apply. While the use of a combination is beneficial in therapeutic terms, resistance to either partner alone can de- velop without an immediate reduction in clinical treatment effi- cacy. Assessment of drug susceptibility in parasites isolated di- rectly from patients provides an opportunity to detect resistance to each individual drug at a relatively early stage, potentially al- lowing appropriate action before clinically relevant drug failure occurs (1). Received 21 November 2012 Returned for modification 27 December 2012 Accepted 18 April 2013 Published ahead of print 22 April 2013 Address correspondence to Charles J. Woodrow, [email protected]. Supplemental material for this article may be found at http://dx.doi.org/10.1128 /AAC.02350-12. Copyright © 2013, American Society for Microbiology. All Rights Reserved. doi:10.1128/AAC.02350-12 July 2013 Volume 57 Number 7 Antimicrobial Agents and Chemotherapy p. 3121–3130 aac.asm.org 3121
Transcript of High-Throughput Analysis of Antimalarial Susceptibility Data by the WorldWide Antimalarial...
High-Throughput Analysis of Antimalarial Susceptibility Data by theWorldWide Antimalarial Resistance Network (WWARN) In VitroAnalysis and Reporting Tool
Charles J. Woodrow,a,b Sabina Dahlström,c Richard Cooksey,a Jennifer A. Flegg,a Hervé Le Nagard,d France Mentré,d Claribel Murillo,e
Didier Ménard,f François Nosten,g Kanlaya Sriprawat,g Lise Musset,h Neils B. Quashie,i,j Pharath Lim,k,l Rick M. Fairhurst,k
Sam L. Nsobya,m Veronique Sinou,n Harald Noedl,o Bruno Pradines,p,q,r Jacob D. Johnson,s Philippe J. Guerin,a Carol H. Sibley,a,t
Jacques Le Brasc,u,v
WorldWide Antimalarial Resistance Network (WWARN), Centre for Tropical Medicine, Nuffield Department of Clinical Medicine, University of Oxford, Churchill Hospital,Oxford, United Kingdoma; Mahidol-Oxford Tropical Medicine Research Unit, Faculty of Tropical Medicine, Mahidol University, Bangkok, Thailandb; WorldWide AntimalarialResistance Network (WWARN) In Vitro Module, Hôpital Bichat-Claude Bernard, Paris, Francec; INSERM, Université Paris Diderot, UMR-S 738, Paris, Franced; InternationalCenter for Medical Research and Training (CIDEIM), Cali, Colombiae; Malaria Molecular Epidemiology Unit, Institut Pasteur in Cambodia, Phnom Penh, Cambodiaf; ShokloMalaria Research Unit, Mae Sod, Tak, Thailandg; Laboratoire de Parasitologie, Centre National de Référence de la Chimiorésistance du Paludisme pour la Région Antilles-Guyane, Institut Pasteur de la Guyane, Cayenne, French Guianah; Centre for Tropical Clinical Pharmacology and Therapeutics, University of Ghana Medical School,i andEpidemiology Department, Noguchi Memorial Institute for Medical Research, University of Ghana,j Accra, Ghana; Laboratory of Malaria and Vector Research, NationalInstitute of Allergy and Infectious Diseases, National Institutes of Health, Bethesda, Maryland, USAk; National Center for Parasitology, Entomology and Malaria Control,Phnom Penh, Cambodial; Department of Medicine, Makerere University, Kampala, Ugandam; Aix-Marseille Université, UMR-MD3, Marseille, Francen; Institute of SpecificProphylaxis and Tropical Medicine, Medical University of Vienna, Vienna, Austriao; Unité de Parasitologie, Institut de Recherche Biomédicale des Armées, Marseille,Francep; Aix Marseille Université, URMITE, UM63, CNRS 7278, IRD 198, INSERM 1095, Marseille, Franceq; Centre National de Référence du Paludisme, Marseille, Francer; U.S.Army Medical Research Unit—Kenya, Walter Reed Project, Kisumu, Kenyas; Department of Genome Sciences, University of Washington, Seattle, Washington, USAt;Université Paris Descartes (Paris 5), Paris, Franceu; Institut de Recherche pour le Développement (IRD), UMR 216, Paris, Francev
Assessment of in vitro susceptibility is a fundamental component of antimalarial surveillance studies, but wide variations in themeasurement of parasite growth and the calculation of inhibitory constants make comparisons of data from different laborato-ries difficult. Here we describe a Web-based, high-throughput in vitro analysis and reporting tool (IVART) generating inhibitoryconstants for large data sets. Fourteen primary data sets examining laboratory-determined susceptibility to artemisinin deriva-tives and artemisinin combination therapy partner drugs were collated from 11 laboratories. Drug concentrations associatedwith half-maximal inhibition of growth (IC50s) were determined by a modified sigmoid Emax model-fitting algorithm, allowingstandardized analysis of 7,350 concentration-inhibition assays involving 1,592 isolates. Examination of concentration-inhibitiondata revealed evidence of apparent paradoxical growth at high concentrations of nonartemisinin drugs, supporting amendmentof the method for calculating the maximal drug effect in each assay. Criteria for defining more-reliable IC50s based on estimatedconfidence intervals and growth ratios improved correlation coefficients for the drug pairs mefloquine-quinine and chloro-quine-desethylamodiaquine in 9 of 11 and 8 of 8 data sets, respectively. Further analysis showed that maximal drug inhibitionwas higher for artemisinins than for other drugs, particularly in ELISA (enzyme-linked immunosorbent assay)-based assays, afinding consistent with the earlier onset of action of these drugs in the parasite life cycle. This is the first high-throughput analyt-ical approach to apply consistent constraints and reliability criteria to large, diverse antimalarial susceptibility data sets. Thedata also illustrate the distinct biological properties of artemisinins and underline the need to apply more sensitive approachesto assessing in vitro susceptibility to these drugs.
The mission of the WorldWide Antimalarial Resistance Net-work (WWARN) is to enhance the quality, quantity, and geo-
graphic extent of drug susceptibility data available to the malariacontrol community via a global data repository. Laboratory-basedassessment of parasites in culture (“in vitro”) enables measure-ment of the intrinsic drug susceptibility of Plasmodium falciparumwithout the confounding effects of host pharmacokinetics, immu-nity, and genetics (1). Parasites with reduced antimalarial suscep-tibilities can be established in continuous culture, allowing theinvestigation of molecular mechanisms of resistance as well as theassessment of susceptibility to other antimalarial agents (2). In anera when artemisinin combination therapies (ACTs) are recom-mended treatment for falciparum malaria worldwide, additionalconsiderations apply. While the use of a combination is beneficialin therapeutic terms, resistance to either partner alone can de-velop without an immediate reduction in clinical treatment effi-
cacy. Assessment of drug susceptibility in parasites isolated di-rectly from patients provides an opportunity to detect resistanceto each individual drug at a relatively early stage, potentially al-lowing appropriate action before clinically relevant drug failureoccurs (1).
Received 21 November 2012 Returned for modification 27 December 2012Accepted 18 April 2013
Published ahead of print 22 April 2013
Address correspondence to Charles J. Woodrow, [email protected].
Supplemental material for this article may be found at http://dx.doi.org/10.1128/AAC.02350-12.
Copyright © 2013, American Society for Microbiology. All Rights Reserved.
doi:10.1128/AAC.02350-12
July 2013 Volume 57 Number 7 Antimicrobial Agents and Chemotherapy p. 3121–3130 aac.asm.org 3121
One challenge facing the in vitro field is that culture-basedassessment of parasite susceptibility has undergone a natural evo-lution since techniques for studying chloroquine (CQ) resistancewere established more than 4 decades ago (3). The basic measure-ment of drug susceptibility is the growth of parasites in the pres-ence of a range of concentrations of a given drug, expressed as theconcentration of the drug needed to suppress growth to 50% ofthat observed in the absence of the drug (50% inhibitory concen-tration [IC50]). A wide variety of readout methods for assessingparasite growth have been described (4, 5), including microscopicassessment (6), incorporation of radiolabeled hypoxanthine (7),production of the highly expressed P. falciparum proteins lactatedehydrogenase (LDH) (8, 9) and histidine-rich protein 2 (HRP2)(10), and methods involving DNA detection, such as SYBR greenfluorescence (11, 12) and flow cytometry (13). This variety oftechniques reflects practical and financial considerations that de-fine a specific need for different assays in different settings.
All methods for phenotyping parasite responses outside thehost are to some degree surrogates for in vivo phenomena, andalthough each new technique has been validated against a stan-dard (generally hypoxanthine incorporation), differences be-tween the methods clearly exist. Longitudinal estimates from thesame lab measured consistently over time are still informative (2,4), but the comparison of data from different laboratories remainsa major challenge. The use of control reference clones holds thepotential to reduce this problem (2) but has rarely been achievedover a substantive time frame.
Differences in computational methods also compromise thecomparison of results from different laboratories. Investigatorscalculate inhibitory constants by a variety of means, includingalgorithms within software packages and freely available toolsbased on log probit (14), polynomial (10), and sigmoid inhibition(15) models. In addition, some assays exhibiting poor growth aremisleading and should not be used as a basis for defining drugresistance (4, 15). Standardized methods to address these issueshave been reported on occasion (16), but in general, the classifi-
cation of concentration-inhibition curves remains a time-con-suming and potentially subjective process involving visual inspec-tion of individual curves. The need to examine parasites isolateddirectly from patients precludes repeated studies of individualparasite isolates, further compounding these difficulties.
This work describes the development of an in vitro analysis andreporting tool (IVART) capable of producing inhibitory constantsfor large in vitro data sets in a rapid, automated manner via a Webinterface. We first sought biological evidence to better define keyelements of this tool and therefore collated a wide-ranging collec-tion of raw data obtained in a variety of global locations, generat-ing perhaps the most diverse data set of this type so far assembled.Systematic examination of concentration-inhibition data fromthis range of different assay readouts and drugs informed thechoice of appropriate constraints for use in curve fitting. Criteriafor defining a core subset of more-reliable assays were tested byexamining correlation coefficients for IC50s from pairs of drugs.The data also yielded biological insights into the distinct proper-ties of artemisinin derivatives.
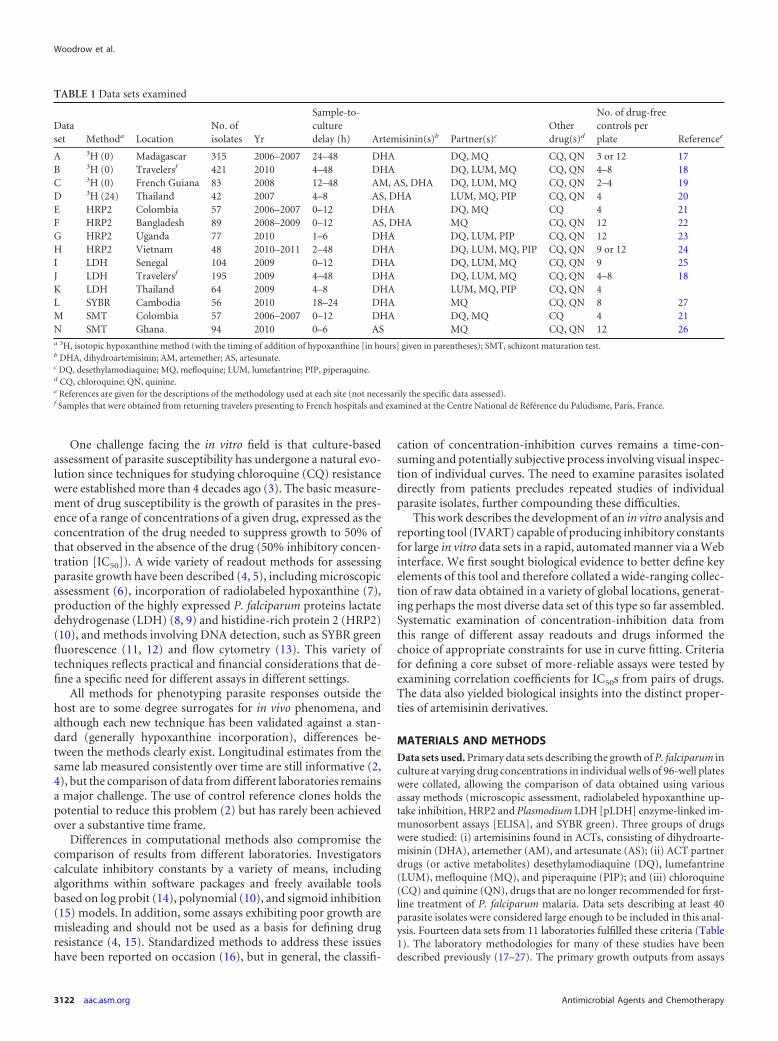
MATERIALS AND METHODSData sets used. Primary data sets describing the growth of P. falciparum inculture at varying drug concentrations in individual wells of 96-well plateswere collated, allowing the comparison of data obtained using variousassay methods (microscopic assessment, radiolabeled hypoxanthine up-take inhibition, HRP2 and Plasmodium LDH [pLDH] enzyme-linked im-munosorbent assays [ELISA], and SYBR green). Three groups of drugswere studied: (i) artemisinins found in ACTs, consisting of dihydroarte-misinin (DHA), artemether (AM), and artesunate (AS); (ii) ACT partnerdrugs (or active metabolites) desethylamodiaquine (DQ), lumefantrine(LUM), mefloquine (MQ), and piperaquine (PIP); and (iii) chloroquine(CQ) and quinine (QN), drugs that are no longer recommended for first-line treatment of P. falciparum malaria. Data sets describing at least 40parasite isolates were considered large enough to be included in this anal-ysis. Fourteen data sets from 11 laboratories fulfilled these criteria (Table1). The laboratory methodologies for many of these studies have beendescribed previously (17–27). The primary growth outputs from assays
TABLE 1 Data sets examined
Dataset Methoda Location
No. ofisolates Yr
Sample-to-culturedelay (h) Artemisinin(s)b Partner(s)c
Otherdrug(s)d
No. of drug-freecontrols perplate Referencee
A 3H (0) Madagascar 315 2006–2007 24–48 DHA DQ, MQ CQ, QN 3 or 12 17B 3H (0) Travelersf 421 2010 4–48 DHA DQ, LUM, MQ CQ, QN 4–8 18C 3H (0) French Guiana 83 2008 12–48 AM, AS, DHA DQ, LUM, MQ CQ, QN 2–4 19D 3H (24) Thailand 42 2007 4–8 AS, DHA LUM, MQ, PIP CQ, QN 4 20E HRP2 Colombia 57 2006–2007 0–12 DHA DQ, MQ CQ 4 21F HRP2 Bangladesh 89 2008–2009 0–12 AS, DHA MQ CQ, QN 12 22G HRP2 Uganda 77 2010 1–6 DHA DQ, LUM, PIP CQ, QN 12 23H HRP2 Vietnam 48 2010–2011 2–48 DHA DQ, LUM, MQ, PIP CQ, QN 9 or 12 24I LDH Senegal 104 2009 0–12 DHA DQ, LUM, MQ CQ, QN 9 25J LDH Travelersf 195 2009 4–48 DHA DQ, LUM, MQ CQ, QN 4–8 18K LDH Thailand 64 2009 4–8 DHA LUM, MQ, PIP CQ, QN 4L SYBR Cambodia 56 2010 18–24 DHA MQ CQ, QN 8 27M SMT Colombia 57 2006–2007 0–12 DHA DQ, MQ CQ 4 21N SMT Ghana 94 2010 0–6 AS MQ CQ, QN 12 26a 3H, isotopic hypoxanthine method (with the timing of addition of hypoxanthine [in hours] given in parentheses); SMT, schizont maturation test.b DHA, dihydroartemisinin; AM, artemether; AS, artesunate.c DQ, desethylamodiaquine; MQ, mefloquine; LUM, lumefantrine; PIP, piperaquine.d CQ, chloroquine; QN, quinine.e References are given for the descriptions of the methodology used at each site (not necessarily the specific data assessed).f Samples that were obtained from returning travelers presenting to French hospitals and examined at the Centre National de Référence du Paludisme, Paris, France.
Woodrow et al.
3122 aac.asm.org Antimicrobial Agents and Chemotherapy
were formatted as uniform 12-by-8 96-well plate layouts in spreadsheetsto facilitate automated processing and analysis.
Analysis of constraints for curve fitting. The levels of uninhibited andmaximally inhibited growth are key parameters in IC50 calculations. Forexample, in the sigmoid Emax model, these levels represent the upper andlower asymptotes of the concentration-inhibition curve, where Emax isdefined as the difference between these two measures of growth. Theconcentration-inhibition curve can be left unconstrained at its upper andlower ends (i.e., a 4-parameter model), particularly with large numbers ofpoints, but for antimalarial susceptibility studies, this is frequently notpractical, since the small number of drug concentrations used (in manycases, only 7) can produce highly unstable estimates. The upper (baselinegrowth without the drug) and lower (minimum growth) values weretherefore constrained prior to modeling. Given the variability in experi-mental design and plate layout in the data sets examined, the uppergrowth constraint for each set of drug concentration-growth data [i.e., thebaseline level of uninhibited growth, G(C0)] (see Table S1 in the supple-mental material) was defined as the average growth in all drug-free wellson the same plate.
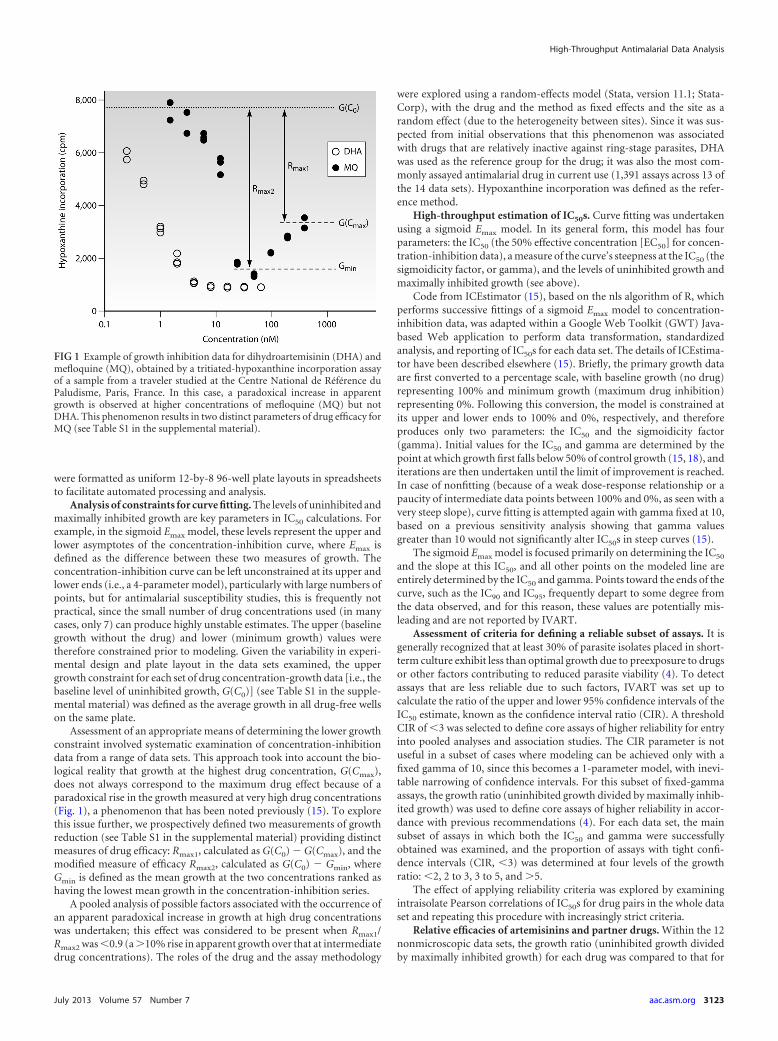
Assessment of an appropriate means of determining the lower growthconstraint involved systematic examination of concentration-inhibitiondata from a range of data sets. This approach took into account the bio-logical reality that growth at the highest drug concentration, G(Cmax),does not always correspond to the maximum drug effect because of aparadoxical rise in the growth measured at very high drug concentrations(Fig. 1), a phenomenon that has been noted previously (15). To explorethis issue further, we prospectively defined two measurements of growthreduction (see Table S1 in the supplemental material) providing distinctmeasures of drug efficacy: Rmax1, calculated as G(C0) � G(Cmax), and themodified measure of efficacy Rmax2, calculated as G(C0) � Gmin, whereGmin is defined as the mean growth at the two concentrations ranked ashaving the lowest mean growth in the concentration-inhibition series.
A pooled analysis of possible factors associated with the occurrence ofan apparent paradoxical increase in growth at high drug concentrationswas undertaken; this effect was considered to be present when Rmax1/Rmax2 was �0.9 (a �10% rise in apparent growth over that at intermediatedrug concentrations). The roles of the drug and the assay methodology
were explored using a random-effects model (Stata, version 11.1; Stata-Corp), with the drug and the method as fixed effects and the site as arandom effect (due to the heterogeneity between sites). Since it was sus-pected from initial observations that this phenomenon was associatedwith drugs that are relatively inactive against ring-stage parasites, DHAwas used as the reference group for the drug; it was also the most com-monly assayed antimalarial drug in current use (1,391 assays across 13 ofthe 14 data sets). Hypoxanthine incorporation was defined as the refer-ence method.
High-throughput estimation of IC50s. Curve fitting was undertakenusing a sigmoid Emax model. In its general form, this model has fourparameters: the IC50 (the 50% effective concentration [EC50] for concen-tration-inhibition data), a measure of the curve’s steepness at the IC50 (thesigmoidicity factor, or gamma), and the levels of uninhibited growth andmaximally inhibited growth (see above).
Code from ICEstimator (15), based on the nls algorithm of R, whichperforms successive fittings of a sigmoid Emax model to concentration-inhibition data, was adapted within a Google Web Toolkit (GWT) Java-based Web application to perform data transformation, standardizedanalysis, and reporting of IC50s for each data set. The details of ICEstima-tor have been described elsewhere (15). Briefly, the primary growth dataare first converted to a percentage scale, with baseline growth (no drug)representing 100% and minimum growth (maximum drug inhibition)representing 0%. Following this conversion, the model is constrained atits upper and lower ends to 100% and 0%, respectively, and thereforeproduces only two parameters: the IC50 and the sigmoidicity factor(gamma). Initial values for the IC50 and gamma are determined by thepoint at which growth first falls below 50% of control growth (15, 18), anditerations are then undertaken until the limit of improvement is reached.In case of nonfitting (because of a weak dose-response relationship or apaucity of intermediate data points between 100% and 0%, as seen with avery steep slope), curve fitting is attempted again with gamma fixed at 10,based on a previous sensitivity analysis showing that gamma valuesgreater than 10 would not significantly alter IC50s in steep curves (15).
The sigmoid Emax model is focused primarily on determining the IC50
and the slope at this IC50, and all other points on the modeled line areentirely determined by the IC50 and gamma. Points toward the ends of thecurve, such as the IC90 and IC95, frequently depart to some degree fromthe data observed, and for this reason, these values are potentially mis-leading and are not reported by IVART.
Assessment of criteria for defining a reliable subset of assays. It isgenerally recognized that at least 30% of parasite isolates placed in short-term culture exhibit less than optimal growth due to preexposure to drugsor other factors contributing to reduced parasite viability (4). To detectassays that are less reliable due to such factors, IVART was set up tocalculate the ratio of the upper and lower 95% confidence intervals of theIC50 estimate, known as the confidence interval ratio (CIR). A thresholdCIR of �3 was selected to define core assays of higher reliability for entryinto pooled analyses and association studies. The CIR parameter is notuseful in a subset of cases where modeling can be achieved only with afixed gamma of 10, since this becomes a 1-parameter model, with inevi-table narrowing of confidence intervals. For this subset of fixed-gammaassays, the growth ratio (uninhibited growth divided by maximally inhib-ited growth) was used to define core assays of higher reliability in accor-dance with previous recommendations (4). For each data set, the mainsubset of assays in which both the IC50 and gamma were successfullyobtained was examined, and the proportion of assays with tight confi-dence intervals (CIR, �3) was determined at four levels of the growthratio: �2, 2 to 3, 3 to 5, and �5.
The effect of applying reliability criteria was explored by examiningintraisolate Pearson correlations of IC50s for drug pairs in the whole dataset and repeating this procedure with increasingly strict criteria.
Relative efficacies of artemisinins and partner drugs. Within the 12nonmicroscopic data sets, the growth ratio (uninhibited growth dividedby maximally inhibited growth) for each drug was compared to that for
FIG 1 Example of growth inhibition data for dihydroartemisinin (DHA) andmefloquine (MQ), obtained by a tritiated-hypoxanthine incorporation assayof a sample from a traveler studied at the Centre National de Référence duPaludisme, Paris, France. In this case, a paradoxical increase in apparentgrowth is observed at higher concentrations of mefloquine (MQ) but notDHA. This phenomenon results in two distinct parameters of drug efficacy forMQ (see Table S1 in the supplemental material).
High-Throughput Antimalarial Data Analysis
July 2013 Volume 57 Number 7 aac.asm.org 3123
DHA by using the Mann-Whitney test (with Bonferroni’s correction forthe number of drugs). The relative proportions of growth inhibition byDHA and MQ for individual parasite isolates, as illustrated in Fig. 1, wereassessed by the Wilcoxon signed-rank test.
RESULTSConstraints for curve fitting. The 14 data sets contained 7,350individual drug inhibition assays. Analysis of growth inhibitioncharacteristics revealed that 1,334 (18.1% of total) assays showedevidence of paradoxical growth at high concentrations (a rise inapparent growth of �10% over that at intermediate concentra-tions). Both the nature of the drug being tested and the readoutmethodology were clearly associated with this behavior. The fourACT partners (DQ, LUM, MQ, and PIP) were associated with arisk 2- to 3-fold greater (P, �0.001 in all cases) than that for thereference drug, DHA, while CQ and QN showed paradoxical ef-fects at an intermediate level (P, �0.001 in both cases) (see TableS2 in the supplemental material). The phenomenon was seen lesscommonly with AS than with DHA. The assay method was alsorelevant; by using hypoxanthine incorporation as the referencegroup, a paradoxical increase in growth was most commonly en-countered in assays based on LDH quantification by ELISA (oddsratio [OR], 1.27; P, 0.007). There was also a trend toward less-frequent occurrence in HRP2 and SYBR green assays that did notreach statistical significance. The issue was not encountered at allin assays assessing schizont maturation by microscopy.
These findings indicate that a paradoxical increase in growthmeasured at high drug concentrations reflects biological proper-ties of antimalarial drugs rather than being simply an experimen-tal artifact due to equipment or human error. For this reason, itwas decided to amend the lower constraint of the sigmoid Emax
model to Gmin in order to provide a more accurate measure ofmaximum inhibition, avoiding underestimation of overall drugefficacy and spuriously low IC50s.
Reliability criteria. The default criteria for defining a subset ofmore-reliable assays consisted of one main criterion, an IC50 con-fidence interval ratio (CIR) of �3. In the subset of curves with afixed gamma (1,427 assays [19.4% of the total]), a growth ratioindicating a satisfactory signal/background ratio was used to as-sess reliability. As expected, there was a clear relationship betweenthe growth ratio and the CIR in the 80.6% of assays where gammawas derived by modeling (i.e., 2-parameter models) (see Fig. S1 inthe supplemental material). Growth ratios of 3 to 5 and �5 wereassociated with very high levels of assays with tight confidenceinterval ratios (across the 12 nonmicroscopic data sets, the medianproportions with CIRs of �3 were 91.3% for a growth ratio of 3 to5 and 95.3% for a growth ratio of �5). In contrast, a growth ratioof �2 was associated with relatively high proportions (median,33.9%) of assays with uncertain IC50 estimates (CIR, �3). Agrowth ratio of 2 to 3 was generally associated with high levels ofassays with tight confidence intervals (median proportion,86.8%), but there did appear to be greater potential for less-reli-able IC50 estimates to be accepted at this growth ratio level inhypoxanthine incorporation assays (see Fig. S1 in the supplemen-tal material, data sets A and C).
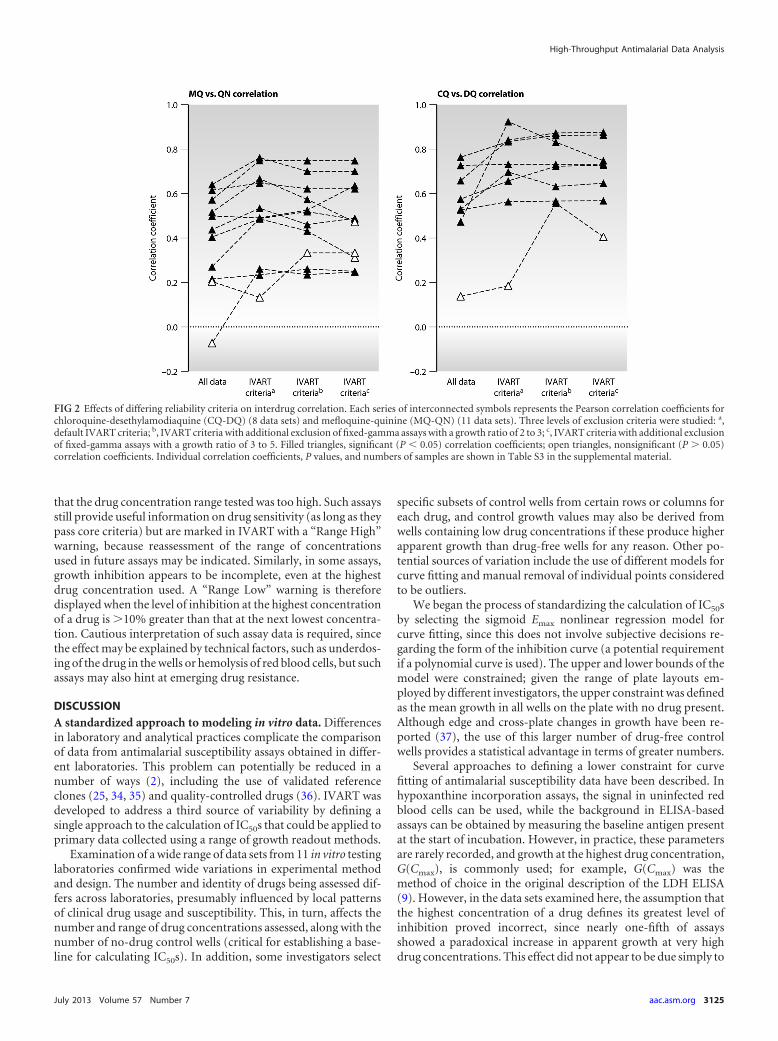
The effect of applying reliability criteria was assessed by calcu-lating the correlation between IC50s for drug pairs within eachdata set, since it was predicted that application of increasinglystrict criteria might improve correlation coefficients. MQ-QN andCQ-DQ provided the most powerful test cases given the number
of data sets assessing each drug pair (11 and 8, respectively) andthe strong, consistently documented associations between IC50sfor these drug pairs in field studies (20, 28–33). Exclusion of assayswith CIRs of �3 and growth ratios of �2 (for assays with a fixedgamma) led to stronger correlations in 9/11 data sets for MQ-QNand in all 8 data sets for CQ-DQ (Fig. 2; see also Table S3 in thesupplemental material). Statistical significance was generallymaintained or strengthened in the more-reliable subset despitethe reduction in sample size.
Increasingly strict classification of the fixed-gamma subset ofassays, involving the exclusion of additional assays with growthratios of �3 or �5 generally led to relatively small and inconsis-tent improvements in correlation (Fig. 2; see also Table S3 in thesupplemental material). For hypoxanthine assays, where there wasconcern that unreliable assays might be accepted with growth ra-tios of 2 to 3 (see above), the mean proportion of additional iso-lates excluded in this range ranged from 1.8 to 5.1% in the fourdata sets (examining all drug pairs). The effects of various levels ofexclusion criteria in hypoxanthine assays (drug pairs MQ-QN andCQ-DQ) are illustrated in Fig. S2 in the supplemental material.
IVART was therefore set to apply a default growth ratio of 2 toclassify the subset of curves with a fixed gamma. When this defaultgrowth ratio was combined with the main criterion of a CIR of�3, 6,158 of 7,350 curves (83.8%) met the IVART core criteria.
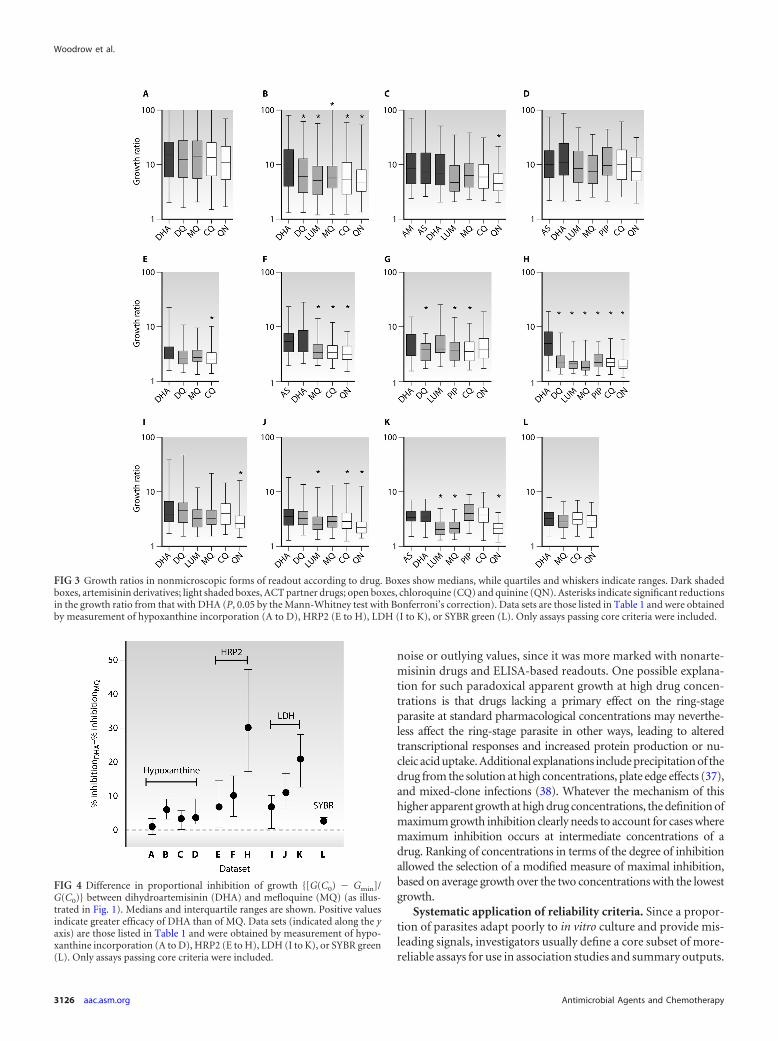
Relative efficacies of artemisinins and partner drugs. Usingonly data that conformed to the default IVART reliability criteria(see above), it was possible to discern clear patterns in terms of thegrowth ratio depending on the assay and the drug (Fig. 3). Forexample, hypoxanthine-based assays showed the highest growthratios (typically 5- to 15-fold reductions in growth), while pro-tein-based and SYBR green assays had substantially lower growthratios (i.e., relatively higher background values). Furthermore,nonartemisinin drugs tended to show lower growth ratios thanartemisinin derivatives, an effect more marked with ELISA-basedassays.
This issue was explored in more detail by examining the pro-portion of growth that could be inhibited {[G(C0) � Gmin]/G(C0)}(Fig. 1) by DHA compared to MQ for individual parasite isolatesfor which both assays passed the core criteria. In all 11 data setswith data for both drugs, MQ inhibited growth significantly lessthan DHA (P, �0.01 by the Wilcoxon signed-rank test), but theextent of this effect ranged from 1.0 to 30.2% (median values)across data sets (Fig. 4). ELISA-based assays showed substantiallygreater differences than those based on hypoxanthine incorpora-tion or SYBR green fluorescence.
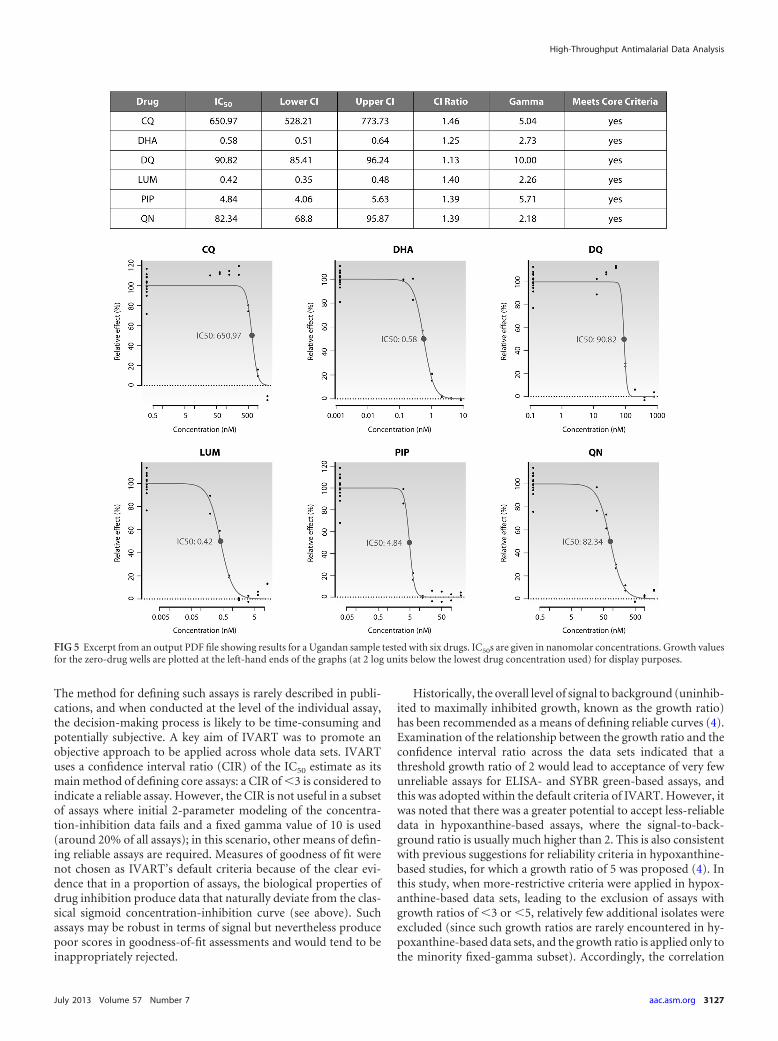
IVART online. The modeling approaches, constraints, andcore criteria described above were adopted within an online ver-sion of IVART that is now available for external use at http://www.wwarn.org/toolkit/data-management/ivart. After a one-time reg-istration process, users have access to the tool via a personalizedinterface that provides secure upload and storage of primary datain a 96-well plate format. IVART incorporates a “Plate Assistant”function to verify data layout and drug concentration informationand then undertakes a single-pass analysis that produces graphical(Fig. 5) and spreadsheet reports for each individual assay, alongwith summaries of reliable-assay subsets by drug and year ofstudy.
The range of drug concentrations in tests can also affect thecalculated IC50. In some data sets, the lowest concentration of thedrug tested demonstrated more than 50% inhibition, suggesting
Woodrow et al.
3124 aac.asm.org Antimicrobial Agents and Chemotherapy
that the drug concentration range tested was too high. Such assaysstill provide useful information on drug sensitivity (as long as theypass core criteria) but are marked in IVART with a “Range High”warning, because reassessment of the range of concentrationsused in future assays may be indicated. Similarly, in some assays,growth inhibition appears to be incomplete, even at the highestdrug concentration used. A “Range Low” warning is thereforedisplayed when the level of inhibition at the highest concentrationof a drug is �10% greater than that at the next lowest concentra-tion. Cautious interpretation of such assay data is required, sincethe effect may be explained by technical factors, such as underdos-ing of the drug in the wells or hemolysis of red blood cells, but suchassays may also hint at emerging drug resistance.
DISCUSSIONA standardized approach to modeling in vitro data. Differencesin laboratory and analytical practices complicate the comparisonof data from antimalarial susceptibility assays obtained in differ-ent laboratories. This problem can potentially be reduced in anumber of ways (2), including the use of validated referenceclones (25, 34, 35) and quality-controlled drugs (36). IVART wasdeveloped to address a third source of variability by defining asingle approach to the calculation of IC50s that could be applied toprimary data collected using a range of growth readout methods.
Examination of a wide range of data sets from 11 in vitro testinglaboratories confirmed wide variations in experimental methodand design. The number and identity of drugs being assessed dif-fers across laboratories, presumably influenced by local patternsof clinical drug usage and susceptibility. This, in turn, affects thenumber and range of drug concentrations assessed, along with thenumber of no-drug control wells (critical for establishing a base-line for calculating IC50s). In addition, some investigators select
specific subsets of control wells from certain rows or columns foreach drug, and control growth values may also be derived fromwells containing low drug concentrations if these produce higherapparent growth than drug-free wells for any reason. Other po-tential sources of variation include the use of different models forcurve fitting and manual removal of individual points consideredto be outliers.
We began the process of standardizing the calculation of IC50sby selecting the sigmoid Emax nonlinear regression model forcurve fitting, since this does not involve subjective decisions re-garding the form of the inhibition curve (a potential requirementif a polynomial curve is used). The upper and lower bounds of themodel were constrained; given the range of plate layouts em-ployed by different investigators, the upper constraint was definedas the mean growth in all wells on the plate with no drug present.Although edge and cross-plate changes in growth have been re-ported (37), the use of this larger number of drug-free controlwells provides a statistical advantage in terms of greater numbers.
Several approaches to defining a lower constraint for curvefitting of antimalarial susceptibility data have been described. Inhypoxanthine incorporation assays, the signal in uninfected redblood cells can be used, while the background in ELISA-basedassays can be obtained by measuring the baseline antigen presentat the start of incubation. However, in practice, these parametersare rarely recorded, and growth at the highest drug concentration,G(Cmax), is commonly used; for example, G(Cmax) was themethod of choice in the original description of the LDH ELISA(9). However, in the data sets examined here, the assumption thatthe highest concentration of a drug defines its greatest level ofinhibition proved incorrect, since nearly one-fifth of assaysshowed a paradoxical increase in apparent growth at very highdrug concentrations. This effect did not appear to be due simply to
FIG 2 Effects of differing reliability criteria on interdrug correlation. Each series of interconnected symbols represents the Pearson correlation coefficients forchloroquine-desethylamodiaquine (CQ-DQ) (8 data sets) and mefloquine-quinine (MQ-QN) (11 data sets). Three levels of exclusion criteria were studied: a,default IVART criteria; b, IVART criteria with additional exclusion of fixed-gamma assays with a growth ratio of 2 to 3; c, IVART criteria with additional exclusionof fixed-gamma assays with a growth ratio of 3 to 5. Filled triangles, significant (P � 0.05) correlation coefficients; open triangles, nonsignificant (P � 0.05)correlation coefficients. Individual correlation coefficients, P values, and numbers of samples are shown in Table S3 in the supplemental material.
High-Throughput Antimalarial Data Analysis
July 2013 Volume 57 Number 7 aac.asm.org 3125
noise or outlying values, since it was more marked with nonarte-misinin drugs and ELISA-based readouts. One possible explana-tion for such paradoxical apparent growth at high drug concen-trations is that drugs lacking a primary effect on the ring-stageparasite at standard pharmacological concentrations may neverthe-less affect the ring-stage parasite in other ways, leading to alteredtranscriptional responses and increased protein production or nu-cleic acid uptake. Additional explanations include precipitation of thedrug from the solution at high concentrations, plate edge effects (37),and mixed-clone infections (38). Whatever the mechanism of thishigher apparent growth at high drug concentrations, the definition ofmaximum growth inhibition clearly needs to account for cases wheremaximum inhibition occurs at intermediate concentrations of adrug. Ranking of concentrations in terms of the degree of inhibitionallowed the selection of a modified measure of maximal inhibition,based on average growth over the two concentrations with the lowestgrowth.
Systematic application of reliability criteria. Since a propor-tion of parasites adapt poorly to in vitro culture and provide mis-leading signals, investigators usually define a core subset of more-reliable assays for use in association studies and summary outputs.
FIG 3 Growth ratios in nonmicroscopic forms of readout according to drug. Boxes show medians, while quartiles and whiskers indicate ranges. Dark shadedboxes, artemisinin derivatives; light shaded boxes, ACT partner drugs; open boxes, chloroquine (CQ) and quinine (QN). Asterisks indicate significant reductionsin the growth ratio from that with DHA (P, 0.05 by the Mann-Whitney test with Bonferroni’s correction). Data sets are those listed in Table 1 and were obtainedby measurement of hypoxanthine incorporation (A to D), HRP2 (E to H), LDH (I to K), or SYBR green (L). Only assays passing core criteria were included.
FIG 4 Difference in proportional inhibition of growth {[G(C0) � Gmin]/G(C0)} between dihydroartemisinin (DHA) and mefloquine (MQ) (as illus-trated in Fig. 1). Medians and interquartile ranges are shown. Positive valuesindicate greater efficacy of DHA than of MQ. Data sets (indicated along the yaxis) are those listed in Table 1 and were obtained by measurement of hypo-xanthine incorporation (A to D), HRP2 (E to H), LDH (I to K), or SYBR green(L). Only assays passing core criteria were included.
Woodrow et al.
3126 aac.asm.org Antimicrobial Agents and Chemotherapy
The method for defining such assays is rarely described in publi-cations, and when conducted at the level of the individual assay,the decision-making process is likely to be time-consuming andpotentially subjective. A key aim of IVART was to promote anobjective approach to be applied across whole data sets. IVARTuses a confidence interval ratio (CIR) of the IC50 estimate as itsmain method of defining core assays: a CIR of �3 is considered toindicate a reliable assay. However, the CIR is not useful in a subsetof assays where initial 2-parameter modeling of the concentra-tion-inhibition data fails and a fixed gamma value of 10 is used(around 20% of all assays); in this scenario, other means of defin-ing reliable assays are required. Measures of goodness of fit werenot chosen as IVART’s default criteria because of the clear evi-dence that in a proportion of assays, the biological properties ofdrug inhibition produce data that naturally deviate from the clas-sical sigmoid concentration-inhibition curve (see above). Suchassays may be robust in terms of signal but nevertheless producepoor scores in goodness-of-fit assessments and would tend to beinappropriately rejected.
Historically, the overall level of signal to background (uninhib-ited to maximally inhibited growth, known as the growth ratio)has been recommended as a means of defining reliable curves (4).Examination of the relationship between the growth ratio and theconfidence interval ratio across the data sets indicated that athreshold growth ratio of 2 would lead to acceptance of very fewunreliable assays for ELISA- and SYBR green-based assays, andthis was adopted within the default criteria of IVART. However, itwas noted that there was a greater potential to accept less-reliabledata in hypoxanthine-based assays, where the signal-to-back-ground ratio is usually much higher than 2. This is also consistentwith previous suggestions for reliability criteria in hypoxanthine-based studies, for which a growth ratio of 5 was proposed (4). Inthis study, when more-restrictive criteria were applied in hypox-anthine-based data sets, leading to the exclusion of assays withgrowth ratios of �3 or �5, relatively few additional isolates wereexcluded (since such growth ratios are rarely encountered in hy-poxanthine-based data sets, and the growth ratio is applied only tothe minority fixed-gamma subset). Accordingly, the correlation
FIG 5 Excerpt from an output PDF file showing results for a Ugandan sample tested with six drugs. IC50s are given in nanomolar concentrations. Growth valuesfor the zero-drug wells are plotted at the left-hand ends of the graphs (at 2 log units below the lowest drug concentration used) for display purposes.
High-Throughput Antimalarial Data Analysis
July 2013 Volume 57 Number 7 aac.asm.org 3127
coefficients for MQ-QN and CQ-DQ did not, on the whole, im-prove with these more-stringent criteria.
IVART was not designed with assays based on microscopicassessment in mind, since the use of microscopy-based methodsto assess growth is decreasing. For all the drugs described here,growth inhibition should be complete at high drug concentra-tions, so the issues of determining maximal inhibition and the useof the growth ratio (usually infinity in schizont maturation exper-iments) to define reliable assays under certain circumstances donot apply. Nevertheless, the tool may be useful to laboratoriescontinuing to use this methodology provided these issues are ap-preciated.
Distinctive properties of artemisinin derivatives. The high-throughput nature of IVART provided a unique opportunity toundertake a systematic examination of growth characteristicsacross a range of drugs and readout methods. As well as informingthe design of IVART itself, this process provided additional bio-logical insights informative for the future design and interpreta-tion of in vitro antimalarial susceptibility studies. There was clearevidence that artemisinin derivatives show higher efficacy (i.e.,inhibition of growth) than ACT partner drugs; for example, DHAinhibited a significantly greater proportion of growth than MQ inall sets of assays. This finding is consistent with the earlier onset ofaction of artemisinins, at the ring stage of parasite development(39–41), but the fact that this property is substantially greater inELISA-based readouts had not been documented previously. Themost likely reason for this is that both LDH and HRP2 are pro-duced in significant quantities by ring-stage parasites (42), whilehypoxanthine and SYBR green signals accumulate only at more-mature stages of asexual parasite development. There also ap-peared to be an effect of site, possibly reflecting the critical role ofthe timing of drug exposure in relation to the parasite stage. Inlocations with substantial delays between the removal of the sam-ple from the patient and the setup of in vitro culture, parasites aremore likely to first encounter the drug at mature stages, when theyare susceptible to a wider range of compounds.
These observations prompt a reevaluation of how resistance ismeasured for different classes of antimalarial drugs. In the ACTera, assessment may require different approaches for artemisinins,which act rapidly against both the ring and mature stages, andACT partner drugs, which act only against the more-mature stagesof parasite development. The timing and duration of parasite-drug contact have been identified as important determinants ofantimalarial susceptibility in the laboratory (2, 43), and specificmethodologies and analyses for different applications are likely toprovide more relevant information than a single method alone.Both the microscopic and hypoxanthine methods were developedin the era of slower-acting antimalarials with longer half-lives (CQand MQ) (44); in these assays, ring-stage parasites contribute littlesignal (indeed, ring-stage growth is not assessed at all if hypoxan-thine is added only after 24 h of incubation). In contrast, forms ofartemisinin resistance reported from Southeast Asia (27, 45, 46)have been proposed to be confined to ring-stage parasites (47) andwould not be predicted to influence susceptibility at the tropho-zoite or schizont stage. Short pulses of a drug during ring-stagegrowth have lasting growth-inhibitory effects (39–41, 48–52), andring-stage pulse assays (in which relatively high concentrations ofartemisinins are applied for relatively short periods) have beendescribed recently (53, 54), providing the first clear view of ring-stage artemisinin resistance in parasites from western Cambodia
(53). The need to remove a drug or to quantify ring-stage growthusing a specific marker may present a challenge for widespreadfield use of this technique.
Summary and future work. IVART provides high-through-put, rapid, single pass analysis of in vitro sensitivity data, avoidinga variety of manual and potentially subjective processing stepscurrently in use. The tool can be applied to data sets obtained by avariety of methods and defines a subgroup of core IC50s of greaterreliability for pooled analyses and association studies. Its advan-tages, therefore, relate to consistency of approach and conve-nience.
The criteria suggested for accurate identification of a reliablesubset of assays for use in association studies appear to be wellsuited to the signal-to-background properties of data sets fromELISA and SYBR green assays (methods increasingly used by invitro testing laboratories); this is evidenced by substantially im-proved correlation scores for interdrug comparisons upon the ap-plication of these criteria. Nevertheless, ongoing monitoring ofthe tool’s operation will be important in order to confirm pro-spectively that the approaches described are appropriate for fur-ther data sets from a variety of laboratories and methods. Thehandling of assays with sparse data around the IC50, and conse-quently steep falls in growth between two drug concentrations, isa particular challenge for high-throughput approaches. Future in-corporation of an additional algorithm that is better able to fit2-parameter models to such data may provide a further advance,although this will require careful validation on a similarly repre-sentative data set. Large data sets of the type described here mayalso be used to develop mixed-effects modeling approaches to theanalysis of concentration-inhibition data, involving a Bayesianframework for assessing whether individual P. falciparum isolatesare resistant to a given drug.
ACKNOWLEDGMENTS
WWARN is supported by a Bill and Melinda Gates Foundation grant. Thiswork was supported in part by the Intramural Research Program ofNIAID, NIH.
We thank Carole Mackosso, Jeff Smith, Delia Bethell, and Ball Ekapi-rat for assistance with data acquisition and management, Sean Collins andAlberto Olliaro (WWARN) for design and programming of the IVARTinterface, Kasia Stepniewska (WWARN) and Sue Lee for statistical advice,and Bill Watkins and Ric Price for discussions.
REFERENCES1. Laufer MK, Djimde AA, Plowe CV. 2007. Monitoring and deterring
drug-resistant malaria in the era of combination therapy. Am. J. Trop.Med. Hyg. 77:160 –169.
2. Bacon DJ, Jambou R, Fandeur T, Le Bras J, Wongsrichanalai C, FukudaMM, Ringwald P, Sibley CH, Kyle DE. 2007. World Antimalarial Resis-tance Network (WARN) II: in vitro antimalarial drug susceptibility. Ma-lar. J. 6:120. doi:10.1186/1475-2875-6-120.
3. Rieckmann KH, McNamara JV, Frischer H, Stockert TA, Carson PE,Powell RD. 1968. Effects of chloroquine, quinine, and cycloguanil uponthe maturation of asexual erythrocytic forms of two strains of Plasmodiumfalciparum in vitro. Am. J. Trop. Med. Hyg. 17:661– 671.
4. Basco LK. 2007. Field application of in vitro assays for the sensitivity ofhuman malaria parasites to antimalarial drugs. WHO, Geneva, Switzer-land.
5. Noedl H, Wongsrichanalai C, Wernsdorfer WH. 2003. Malaria drug-sensitivity testing: new assays, new perspectives. Trends Parasitol. 19:175–181.
6. Rieckmann KH, Campbell GH, Sax LJ, Mrema JE. 1978. Drug sensitivityof Plasmodium falciparum. An in-vitro microtechnique. Lancet i:22–23.
7. Desjardins RE, Canfield CJ, Haynes JD, Chulay JD. 1979. Quantitative
Woodrow et al.
3128 aac.asm.org Antimicrobial Agents and Chemotherapy
assessment of antimalarial activity in vitro by a semiautomated microdi-lution technique. Antimicrob. Agents Chemother. 16:710 –718.
8. Piper R, Le Bras J, Wentworth L, Hunt-Cooke A, Houze S, Chiodini P,Makler M. 1999. Immunocapture diagnostic assays for malaria usingPlasmodium lactate dehydrogenase (pLDH). Am. J. Trop. Med. Hyg. 60:109 –118.
9. Druilhe P, Moreno A, Blanc C, Brasseur PH, Jacquier P. 2001. Acolorimetric in vitro drug sensitivity assay for Plasmodium falciparumbased on a highly sensitive double-site lactate dehydrogenase antigen-capture enzyme-linked immunosorbent assay. Am. J. Trop. Med. Hyg.64:233–241.
10. Noedl H, Wernsdorfer WH, Miller RS, Wongsrichanalai C. 2002. His-tidine-rich protein II: a novel approach to malaria drug sensitivity testing.Antimicrob. Agents Chemother. 46:1658 –1664.
11. Bennett TN, Paguio M, Gligorijevic B, Seudieu C, Kosar AD, DavidsonE, Roepe PD. 2004. Novel, rapid, and inexpensive cell-based quantifica-tion of antimalarial drug efficacy. Antimicrob. Agents Chemother. 48:1807–1810.
12. Smilkstein M, Sriwilaijaroen N, Kelly JX, Wilairat P, Riscoe M. 2004.Simple and inexpensive fluorescence-based technique for high-throughput antimalarial drug screening. Antimicrob. Agents Chemother.48:1803–1806.
13. Malleret B, Claser C, Ong AS, Suwanarusk R, Sriprawat K, HowlandSW, Russell B, Nosten F, Renia L. 2011. A rapid and robust tri-color flowcytometry assay for monitoring malaria parasite development. Sci. Rep.1:118. doi:10.1038/srep00118.
14. Grab B, Wernsdorfer WH. 1983. Evaluation of in vitro tests for drugsensitivity in Plasmodium falciparum: probit analysis of logdose/responsetest from 3– 8 points assay. WHO, Geneva, Switzerland.
15. Le Nagard H, Vincent C, Mentre F, Le Bras J. 2011. Online analysis ofin vitro resistance to antimalarial drugs through nonlinear regression.Comput. Methods Programs Biomed. 104:10 –18.
16. Simpson JA, Watkins ER, Price RN, Aarons L, Kyle DE, White NJ. 2000.Mefloquine pharmacokinetic-pharmacodynamic models: implicationsfor dosing and resistance. Antimicrob. Agents Chemother. 44:3414 –3424.
17. Andriantsoanirina V, Ratsimbasoa A, Bouchier C, Jahevitra M, Rabea-rimanana S, Radrianjafy R, Andrianaranjaka V, Randriantsoa T, RasonMA, Tichit M, Rabarijaona LP, Mercereau-Puijalon O, Durand R,Menard D. 2009. Plasmodium falciparum drug resistance in Madagascar:facing the spread of unusual pfdhfr and pfmdr-1 haplotypes and the de-crease of dihydroartemisinin susceptibility. Antimicrob. Agents Che-mother. 53:4588 – 4597.
18. Kaddouri H, Nakache S, Houze S, Mentre F, Le Bras J. 2006. Assessmentof the drug susceptibility of Plasmodium falciparum clinical isolates fromAfrica by using a Plasmodium lactate dehydrogenase immunodetectionassay and an inhibitory maximum effect model for precise measurementof the 50-percent inhibitory concentration. Antimicrob. Agents Che-mother. 50:3343–3349.
19. Legrand E, Volney B, Meynard JB, Mercereau-Puijalon O, Esterre P.2008. In vitro monitoring of Plasmodium falciparum drug resistance inFrench Guiana: a synopsis of continuous assessment from 1994 to 2005.Antimicrob. Agents Chemother. 52:288 –298.
20. Brockman A, Price RN, van Vugt M, Heppner DG, Walsh D, Sookto P,Wimonwattrawatee T, Looareesuwan S, White NJ, Nosten F. 2000.Plasmodium falciparum antimalarial drug susceptibility on the north-western border of Thailand during five years of extensive use of artesu-nate-mefloquine. Trans. R. Soc. Trop. Med. Hyg. 94:537–544.
21. Aponte SL, Diaz G, Pava Z, Echeverry DF, Ibarguen D, Rios M, MurciaLM, Quelal C, Murillo C, Gil P, Bjorkman A, Osorio L. 2011. Sentinelnetwork for monitoring in vitro susceptibility of Plasmodium falciparumto antimalarial drugs in Colombia: a proof of concept. Mem. Inst.Oswaldo Cruz 106(Suppl 1):123–129.
22. Attlmayr B, Thriemer K, Haque R, Wagatsuma Y, Abdus Salam M,Akhter S, Fukuda M, Schaecher K, Miller RS, Noedl H. 2006. In vitroantimalarial drug resistance in Southeastern Bangladesh. Wien Klin.Wochenschr 118:58 – 61. (In German.)
23. Nsobya SL, Kiggundu M, Nanyunja S, Joloba M, Greenhouse B,Rosenthal PJ. 2010. In vitro sensitivities of Plasmodium falciparum todifferent antimalarial drugs in Uganda. Antimicrob. Agents Chemother.54:1200 –1206.
24. Sinou V, Quang LH, Pelleau S, Huong VN, Huong NT, Tai LM,Bertaux L, Desbordes M, Latour C, Long LQ, Thanh NX, Parzy D.2011. Polymorphism of Plasmodium falciparum Na�/H� exchanger is in-
dicative of a low in vitro quinine susceptibility in isolates from Viet Nam.Malar. J. 10:164. doi:10.1186/1475-2875-10-164.
25. Fall B, Diawara S, Sow K, Baret E, Diatta B, Fall KB, Mbaye PS, Fall F,Dieme Y, Rogier C, Wade B, Bercion R, Pradines B. 2011. Ex vivo suscep-tibility of Plasmodium falciparum isolates from Dakar, Senegal, to seven stan-dard anti-malarial drugs. Malar. J. 10:310. doi:10.1186/1475-2875-10-310.
26. Quashie NB, Duah NO, Abuaku B, Koram KA. 2007. The in-vitrosusceptibilities of Ghanaian Plasmodium falciparum to antimalarial drugs.Ann. Trop. Med. Parasitol. 101:391–398.
27. Amaratunga C, Sreng S, Suon S, Phelps ES, Stepniewska K, Lim P, ZhouC, Mao S, Anderson JM, Lindegardh N, Jiang H, Song J, Su XZ, WhiteNJ, Dondorp AM, Anderson TJ, Fay MP, Mu J, Duong S, Fairhurst RM.2012. Artemisinin-resistant Plasmodium falciparum in Pursat province,western Cambodia: a parasite clearance rate study. Lancet Infect. Dis. 12:851– 858.
28. Ringwald P, Bickii J, Basco LK. 1996. In vitro activity of antimalarialsagainst clinical isolates of Plasmodium falciparum in Yaounde, Cameroon.Am. J. Trop. Med. Hyg. 55:254 –258.
29. Lim P, Chim P, Sem R, Nemh S, Poravuth Y, Lim C, Seila S, TsuyuokaR, Denis MB, Socheat D, Fandeur T. 2005. In vitro monitoring ofPlasmodium falciparum susceptibility to artesunate, mefloquine, quinineand chloroquine in Cambodia: 2001–2002. Acta Trop. 93:31– 40.
30. Sidhu AB, Uhlemann AC, Valderramos SG, Valderramos JC, Krishna S,Fidock DA. 2006. Decreasing pfmdr1 copy number in Plasmodium falcip-arum malaria heightens susceptibility to mefloquine, lumefantrine, halo-fantrine, quinine, and artemisinin. J. Infect. Dis. 194:528 –535.
31. Childs GE, Boudreau EF, Milhous WK, Wimonwattratee T, PooyindeeN, Pang L, Davidson DE, Jr. 1989. A comparison of the in vitro activitiesof amodiaquine and desethylamodiaquine against isolates of Plasmodiumfalciparum. Am. J. Trop. Med. Hyg. 40:7–11.
32. Basco LK, Le Bras J. 1993. In vitro activity of monodesethylamodiaquineand amopyroquine against African isolates and clones of Plasmodium fal-ciparum. Am. J. Trop. Med. Hyg. 48:120 –125.
33. Ringwald P, Bickii J, Basco LK. 1999. In vitro activity of dihydroartemis-inin against clinical isolates of Plasmodium falciparum in Yaounde, Cam-eroon. Am. J. Trop. Med. Hyg. 61:187–192.
34. Pascual A, Basco LK, Baret E, Amalvict R, Travers D, Rogier C,Pradines B. 2011. Use of the atmospheric generators for capnophilic bac-teria Genbag-CO2 for the evaluation of in vitro Plasmodium falciparumsusceptibility to standard anti-malarial drugs. Malar. J. 10:8. doi:10.1186/1475-2875-10-8.
35. Rutvisuttinunt W. 2012. Optimizing the HRP-2 in vitro malaria drugsusceptibility assay using a reference clone to improve comparisons ofPlasmodium falciparum field isolates. Malar. J. 11:325. doi:10.1186/1475-2875-11-325.
36. Lourens C, Watkins WM, Barnes KI, Sibley CH, Guerin PJ, White NJ,Lindegardh N. 2010. Implementation of a reference standard and profi-ciency testing programme by the World Wide Antimalarial ResistanceNetwork (WWARN). Malar. J. 9:375. doi:10.1186/1475-2875-9-375.
37. Johnson JD, Dennull RA, Gerena L, Lopez-Sanchez M, Roncal NE,Waters NC. 2007. Assessment and continued validation of the malariaSYBR green I-based fluorescence assay for use in malaria drug screening.Antimicrob. Agents Chemother. 51:1926 –1933.
38. Willet GP, Milhous WK, Gerena L, Oduola AM. 1991. Mixed popula-tion dynamics in human malaria parasite cultures. Trans. R. Soc. Trop.Med. Hyg. 85:33–34.
39. Geary TG, Divo AA, Jensen JB. 1989. Stage specific actions of antima-larial drugs on Plasmodium falciparum in culture. Am. J. Trop. Med. Hyg.40:240 –244.
40. Skinner TS, Manning LS, Johnston WA, Davis TM. 1996. In vitrostage-specific sensitivity of Plasmodium falciparum to quinine and arte-misinin drugs. Int. J. Parasitol. 26:519 –525.
41. ter Kuile F, White NJ, Holloway P, Pasvol G, Krishna S. 1993. Plasmo-dium falciparum: in vitro studies of the pharmacodynamic properties ofdrugs used for the treatment of severe malaria. Exp. Parasitol. 76:85–95.
42. Otto TD, Wilinski D, Assefa S, Keane TM, Sarry LR, Bohme U,Lemieux J, Barrell B, Pain A, Berriman M, Newbold C, Llinas M. 2010.New insights into the blood-stage transcriptome of Plasmodium falcipa-rum using RNA-Seq. Mol. Microbiol. 76:12–24.
43. Wein S, Maynadier M, Tran Van Ba C, Cerdan R, Peyrottes S, FraisseL, Vial H. 2010. Reliability of antimalarial sensitivity tests depends ondrug mechanisms of action. J. Clin. Microbiol. 48:1651–1660.
44. Murphy S, Watkins WM, Bray PG, Lowe B, Winstanley PA, Peshu N,
High-Throughput Antimalarial Data Analysis
July 2013 Volume 57 Number 7 aac.asm.org 3129
Marsh K. 1995. Parasite viability during treatment of severe falciparummalaria: differential effects of artemether and quinine. Am. J. Trop. Med.Hyg. 53:303–305.
45. Dondorp AM, Nosten F, Yi P, Das D, Phyo AP, Tarning J, Lwin KM,Ariey F, Hanpithakpong W, Lee SJ, Ringwald P, Silamut K, Imwong M,Chotivanich K, Lim P, Herdman T, An SS, Yeung S, Singhasivanon P,Day NP, Lindegardh N, Socheat D, White NJ. 2009. Artemisinin resis-tance in Plasmodium falciparum malaria. N. Engl. J. Med. 361:455– 467.
46. Phyo AP, Nkhoma S, Stepniewska K, Ashley EA, Nair S, McGready R,ler Moo C, Al-Saai S, Dondorp AM, Lwin KM, Singhasivanon P, DayNP, White NJ, Anderson TJ, Nosten F. 2012. Emergence of artemisinin-resistant malaria on the western border of Thailand: a longitudinal study.Lancet 379:1960 –1966.
47. Saralamba S, Pan-Ngum W, Maude RJ, Lee SJ, Tarning J, LindegardhN, Chotivanich K, Nosten F, Day NP, Socheat D, White NJ, DondorpAM, White LJ. 2011. Intrahost modeling of artemisinin resistance inPlasmodium falciparum. Proc. Natl. Acad. Sci. U. S. A. 108:397– 402.
48. Alin MH, Bjorkman A. 1994. Concentration and time dependency ofartemisinin efficacy against Plasmodium falciparum in vitro. Am. J. Trop.Med. Hyg. 50:771–776.
49. Maerki S, Brun R, Charman SA, Dorn A, Matile H, Wittlin S. 2006. Invitro assessment of the pharmacodynamic properties and the partitioningof OZ277/RBx-11160 in cultures of Plasmodium falciparum. J. Antimi-crob. Chemother. 58:52–58.
50. Natalang O, Bischoff E, Deplaine G, Proux C, Dillies MA, Sismeiro O,Guigon G, Bonnefoy S, Patarapotikul J, Mercereau-Puijalon O, CoppeeJY, David PH. 2008. Dynamic RNA profiling in Plasmodium falciparumsynchronized blood stages exposed to lethal doses of artesunate. BMCGenomics 9:388. doi:10.1186/1471-2164-9-388.
51. Klonis N, Crespo-Ortiz MP, Bottova I, Abu-Bakar N, Kenny S,Rosenthal PJ, Tilley L. 2011. Artemisinin activity against Plasmodiumfalciparum requires hemoglobin uptake and digestion. Proc. Natl. Acad.Sci. U. S. A. 108:11405–11410.
52. Deplaine G, Lavazec C, Bischoff E, Natalang O, Perrot S, Guillotte-Blisnick M, Coppee JY, Pradines B, Mercereau-Puijalon O, David PH.2011. Artesunate tolerance in transgenic Plasmodium falciparum parasitesoverexpressing a tryptophan-rich protein. Antimicrob. Agents Che-mother. 55:2576 –2584.
53. Witkowski B, Khim N, Chim P, Kim S, Ke S, Kloeung N, Chy S, DuongS, Leang R, Ringwald P, Dondorp AM, Tripura R, Benoit-Vical F, BerryA, Gorgette O, Ariey F, Barale JC, Mercereau-Puijalon O, Menard D.2013. Reduced artemisinin susceptibility of Plasmodium falciparum ringstages in western Cambodia. Antimicrob. Agents Chemother. 57:914 –923.
54. Klonis N, Xie SC, McCaw JM, Crespo-Ortiz MP, Zaloumis SG, Simp-son JA, Tilley L. 2013. Altered temporal response of malaria parasitesdetermines differential sensitivity to artemisinin. Proc. Natl. Acad. Sci.U. S. A. 110:5157–5162.
Woodrow et al.
3130 aac.asm.org Antimicrobial Agents and Chemotherapy