high resolution sequence stratigraphic and reservoir - CORE
112
HIGH RESOLUTION SEQUENCE STRATIGRAPHIC AND RESERVOIR CHARACTERIZATION STUDIES OF D-07, D-08 AND E-01 SANDS, BLOCK 2 MEREN FIELD, OFFSHORE NIGER DELTA A Thesis by ADEGBENGA OLUWAFEMI ESAN Submitted to the Office of Graduate Studies of Texas A&M University in partial fulfillment of the requirements for the degree of MASTER OF SCIENCE December 2002 Major Subject: Geology
-
Upload
khangminh22 -
Category
Documents
-
view
4 -
download
0
Transcript of high resolution sequence stratigraphic and reservoir - CORE

HIGH RESOLUTION SEQUENCE STRATIGRAPHIC AND RESERVOIR
CHARACTERIZATION STUDIES OF D-07, D-08 AND E-01 SANDS, BLOCK 2
MEREN FIELD, OFFSHORE NIGER DELTA
A Thesis
by
ADEGBENGA OLUWAFEMI ESAN
Submitted to the Office of Graduate Studies of Texas A&M University
in partial fulfillment of the requirements for the degree of
MASTER OF SCIENCE
December 2002
Major Subject: Geology

HIGH RESOLUTION SEQUENCE STRATIGRAPHIC AND RESERVOIR
CHARACTERIZATION STUDIES OF D-07, D-08 AND E-01 SANDS, BLOCK 2
MEREN FIELD, OFFSHORE NIGER DELTA
A Thesis
by
ADEGBENGA OLUWAFEMI ESAN
Submitted to Texas A&M University
in partial fulfillment of the requirements for the degree of
MASTER OF SCIENCE
Approved as to style and content by:
______________________________ _____________________________ Steven L Dorobek Jerry Jensen
(Co-Chair of Committee) (Co-Chair of Committee)
______________________________ _____________________________ Philip D. Rabinowitz Brian Willis (Member) (Member)
__________________________________
Andrew Hajash (Head of Department)
December 2002
Major Subject: Geology

iii
ABSTRACT
High Resolution Sequence Stratigraphic and Reservoir Characterization Studies
of D-07, D-08 and E-01 Sands, Block 2 Meren Field, Offshore Niger Delta.
(December 2002)
Adegbenga Oluwafemi Esan, B.Sc. (Honors), University of Ibadan, Nigeria;
M.Sc., University of Ibadan, Nigeria;
M.B.A., Lagos State University, Lagos, Nigeria
Co-Chairs of Advisory Committee: Dr. Steven L. Dorobek Dr. Jerry Jensen
Meren field, located offshore Niger Delta, is one of the most prolific oil-
producing fields in the Niger Delta. The upper Miocene D-07, D-08 and E-01 oil sands
comprise a series of stacked hydrocarbon reservoirs in Block 2 of Meren field. These
reservoir sandstones were deposited in offshore to upper shoreface environments.
Seven depositional facies were identified in the studied interval, each with
distinct lithology, sedimentary structures, trace fossils, and wire- line log character. The
dominant lithofacies are (1) locally calcite-cemented highly-bioturbated, fine-grained
sandstones, (middle to lower shoreface facies); (2) cross-bedded, fine- to medium-
grained well-sorted sandstones (upper shoreface facies); (3) horizontal to sub-horizontal
laminated, very-fine- to fine-grained sandstone (delta front facies); (4) massive very-
fine- to fine-grained poorly-sorted sandstone (delta front facies); (5) muddy silt-to fine-
grained wavy-bedded sandstone (lower shoreface facies); (6) very-fine- to fine-grained
iv
sandy mudstone (lower shoreface facies); and (7) massive, silty shales (offshore marine
facies).
Lithofacies have distinct mean petrophysical properties, although there is overlap
in the range of values. The highest quality reservoir deposits are cross-bedded sands that
were deposited in high-energy upper shoreface environments. Calcite cements in lower
shoreface facies significantly reduce porosity and permeability. Integration of core and
wire- line log data allowed porosity and permeability to be empirically determined from
bulk density. The derived equation indicated that bulk density values could predict 80%
of the variance in core porosity and permeability values.
Three parasequence sets were interpreted, including one lower progradational
and two upper retrogradational parasequence sets. The progradational parasequence set
consists of upward-coarsening delta front to upper shoreface facies, whereas the upward-
fining retrogradational parasequence sets are composed of middle to lower shoreface
deposits overlain by offshore marine shales.
The limited amount of core data and the relatively small area of investigation
place serious constraints on stratigraphic interpretations. Two possible sequence
stratigraphic interpretations are presented. The first interpretation suggests the deposits
comprise a highstand systems tract overlain by a transgressive systems tract. A lowstand
systems tract is restricted to an incised valley fill at the southeastern end of the study
area. The alternate interpretation suggests the deposits comprise a falling stage systems
tract overlain by transgressive systems tract.

v
DEDICATION
To ’Sikemi and ’Nifemi, the greatest kids in the world.

vi
ACKNOWLEDGEMENTS
I will like to thank Dr. Steve Dorobek, co-chair of my thesis committee, for his
assistance and constructive criticism of this work. His guidance was invaluable in the
completion of this research. I also express my sincere thanks to Dr. Jerry Jensen, co-
chair of my thesis committee, for his time and help, especially in the reservoir
characterization aspect of this thesis. Special thanks to Dr. Brian Willis for offering
insight and suggestions: His door was always open for help during this research. Finally
my gratitude goes to Dr. Philip Rabinowitz for serving on my committee and for
reviewing the manuscript and making suggestions for its improvement.
Special thanks goes to Chevron Nigeria Limited for providing a scholarship and
the data for this study. I thank my mentor Mr. Segun Akinwale for his moral support and
wonderful suggestions. His help, assistance and care transcend the call of duty. Many
thanks to my colleagues in the North Offshore Asset Team, Chevron Nigeria Limited for
gathering the data used in this study. Thanks also to the members of the Earth modeling
team in Chevron Petroleum Technology Center (CPTC), Houston for their help during
my summer in Houston.
I thank my family for their visits, unfailing love and unwavering support during
this and other endeavors. Finally I thank my wife, Taiwo, for her support and
encouragement and for taking good care of the home front.

vii
TABLE OF CONTENTS
Page
ABSTRACT ...............................................................................................................iii
DEDICATION .............................................................................................................v
ACKNOWLEDGEMENTS ........................................................................................vi
TABLE OF CONTENTS ..........................................................................................vii
LIST OF FIGURES ....................................................................................................ix
LIST OF TABLES .....................................................................................................xii
INTRODUCTION .......................................................................................................1
Objectives.....................................................................................................4 Location .......................................................................................................6 Previous Work..............................................................................................6
REGIONAL STRATIGRAPHY, STRUCTURE AND PETROLEUM GEOLOGY OF THE NIGER DELTA ........................................................................9
Introduction..................................................................................................9 Tectonic Framework ..................................................................................10 Stratigraphy................................................................................................12 Structure .....................................................................................................14 Hydrocarbon Occurrence ...........................................................................17 Source Rocks..............................................................................................20
METHODOLOGY ....................................................................................................24
Log Analysis .............................................................................................24 Core Analysis .............................................................................................25 Sequence Stratigraphic Analysis................................................................25 Petrophysical Analysis ...............................................................................26
LITHOFACIES AND SEDIMENTOLOGY ............................................................27
Overview of Meren Field ...........................................................................27 Lithofacies and Depositional Interpretation...............................................27 Depositional Model....................................................................................44 Depositional Trends ...................................................................................46

viii
Page
Reservoir Properties .................................................................................. 46 Description of Reservoir Intervals ........................................................... 47
SEQUENCE STRATIGRAPHY.............................................................................. 51
Introduction.............................................................................................. 51 Stratigraphic Architecture of Reservoir Units ......................................... 54 Sequence Stratigraphic Interpretation ..................................................... 64
RESERVOIR PROPERTIES AND PERFORMANCE ........................................... 74
Porosity and Permeability Distribution.................................................... 74 Regression Analysis ................................................................................. 78
CONCLUSIONS ..................................................................................................... 90
REFERENCES CITED ........................................................................................... 93
VITA ............................................................................................................... 100

ix
LIST OF FIGURES
FIGURE Page
1 Map of Niger Delta showing Chevron Nigeria Limited’s producing fields with Meren field highlighted......................................................... 2
2 Typical log responses for D-07, D-08 and E-01 intervals in the study
area .......................................................................................................... 3 3 Base map of block 2 Meren field showing well distribution....................5 4 Map of Niger Delta showing Province outline (maximum petroleum
system); and key structural features........................................................11 5 Stratigraphic column showing the three formations of the Niger Delta 15 6 Diagrammatic east west (A-A’) and southwest northeast (B-B’) cross-
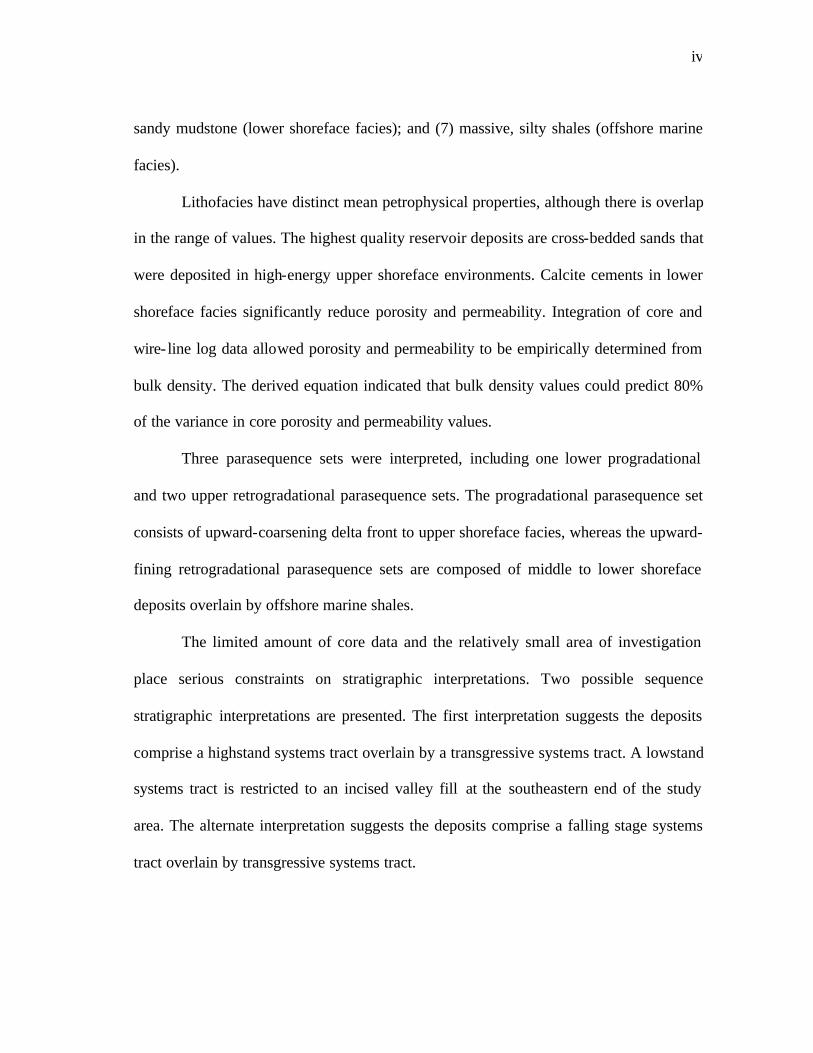
sections through the Niger Delta........................................................... 16 7 Examples of Niger Delta oil filed structures and associated trapping
styles...................................................................................................... 18
8 Map showing the petroleum province trend of Niger Delta ...................21
9 Generalized sequence stratigraphic model for the Niger Delta showing the relation of source rock, migration pathways, and
hydrocarbon traps related to growth faults .............................................21
10a Correlation of gamma-ray log and interpreted core taken through the D-07 interval in Meren 77 well ...........................................29
10b Correlation of gamma-ray log and interpreted core section through the D-08 and E-01 intervals in Meren 75 well ..........................30
11 Core photos of cross–bedded sandstone (upper shoreface facies) ..........32 12 Core photos of massive to poorly stratified sandstone facies (lower Delta front facies).......................................................................34
13 Core photos of laminated sandstone (Delta front facies) ........................35

x
FIGURE Page
14 Core photos bioturbated sandstone (lower shoreface facies) in the D-07 interval in MER-77 well .........................................................................37
15 Core photos of muddy sandstone (lower shoreface facies) in MER-77. 40 16 Core photos of sandy mudstone (offshore transition facies) ..................41 17 Core photos of shale (shelfal facies).......................................................43 18 Depositional model of wave dominated delta/strand plain system.........45 19 Idealized facies succession within a progradational siliciclastic
parasequence comprised of offshore to foreshore facies ........................52 20 Typical genetic sequence composed of systems tracts ...........................56
21 Base map showing the study area and the location of the correlation
panels ......................................................................................................58 22 Strike-oriented stratigraphic cross-section (A-A’ section) .....................59 23 Strike-oriented stratigraphic cross-section (C-C’ section)......................60 24 Dip-oriented stratigraphic cross-section D-D’........................................61 25 Dip-oriented stratigraphic cross-section F-F’ .........................................62 26 Depositional strike-oriented stratigraphic cross-section of the E-01 to
D-07 sands...............................................................................................67
27 Depositional dip-oriented stratigraphic cross-section of the E-01 to D-07 intervals ..............................................................................................68
28 Strike-oriented stratigraphic cross-section of the E-01 to D-07 sands ...72
29 Dip-oriented stratigraphic cross-section of the E-01 to D-07 sands .......73 30 (A) Core porosity vs. permeability plot as a function of lithofacies in
the E-01 interval. (B) Core porosity vs. permeability plot in the D-07 interval . ..................................................................................................77

xi
FIGURE Page
31 (A) Cross plot of core porosity and permeability from the D-07 interval in MER-77 well. (B) Log derived permeability and core permeability the D-07 interval in MER-77 well .........................................................79
32 (A) Plot of core and log-derived effective porosity versus depth in the D-07 interval with gamma ray as the discriminator. (B) Plot of core and log-derived effective porosity versus depth in the D-07 interval with NPHI as the discriminator .................................................80
33 Log-derived porosity and core porosity in the D-07 interval in MER-77 well...........................................................................................81 34 (A) Cross-plot of core porosity and permeability with bulk density as the discriminator. (B) Cross-plot of PHIE and core porosity ................85 35 (A) Cross-plot of PHIE and core permeability. (B) Cross-plot of RHOB
and core porosity.....................................................................................86
36 (A) Cross-plot of core porosity and log-derived porosity. (B) Cross-plot of log-derived permeability from RHOB and core permeability ............................................................................................87
37 Log of Meren 75 well showing the different petrophysical properties of the intervals.........................................................................................88
38 Log of MER-77 well showing the different petrophysical properties of the intervals.........................................................................................89

xii
LIST OF TABLES
TABLE Page
1 Lithofacies within the E-01 to D-07 intervals at Meren Field and their typical petrophysical properties ................................................... 28
2 Typical nearshore marine facies characteristics.......................................... 44

1
INTRODUCTION
Meren field, offshore Niger delta with reserves of over 2.2 billion barrels of oil is
one of the most prolific oil fields in Niger Delta (Figure 1). The upper Miocene D-07, D-
08 and E-01 oil sands are stacked hydrocarbon-producing reservoirs in Block 2 of Meren
field (Figure 2). Meren field is in a hanging-wall rollover anticline; bounded to the
northeast by a northwest-southeast trending growth fault that was active during the late
Miocene. Other minor faults segment the field into six fault-bounded blocks.
Cumulative production from the D-07, D-08 and E-01 sandstones is in excess of
30 million barrels of oil. Although the field has been in production since 1968,
completion of the “low resistivity” D-07 reservoir did not occur until 1997 because of an
initial pessimistic estimate of reservoir properties in this interval. Core data from the
MER-77 well drilled in 1997, suggested that reservoir quality of the D-07 reservoir and
production from the MER-82 horizontal well completed in the D-07 interval peaked at
about 3,000 bopd in 1998. A more accurate method of estimating porosity and
permeability and ultimately reservoir performance for these and other shaly sand
intervals is therefore desirable in order to maximize the value of a given well or field.
______________
This thesis follows the style and format of the American Association of Petroleum Geologists Bulletin.

2
Figure 1. Map of Niger Delta showing Chevron Nigeria Limited’s producing fields with Meren field highlighted. Insert shows the different fault blocks in Meren field. This study focused on Block 2

3
Figure 2. Typical log responses for D-07, D-08 and E-01 intervals in the study area. Log is from the Meren 75 well.
Reservoir Interval
(ft)
D-0
7
E-0
1 D
-08

4
This study combined core and log data from 30 wells at Meren field (Figure 3) to
define lithofacies, interpreted depositional origins, trend and construct stratigraphic
framework of the upper Miocene sands. The distributions of petrophysical properties
within the reservoir sandstones were then related to this sedimentologic and stratigraphic
framework. Integration of core and log measurements within a sequence stratigraphic
framework provided a basis for estimating porosity and permeability from well- log
measurements. These equations were useful for evaluating petrophysical properties in
uncored wells and provided an alternative to using gamma-ray logs for estimating
reservoir potential.
Gamma-ray log is the most commonly used log to estimate reservoir property
(net/gross). It is known that gamma-ray log can and often do underestimate reservoir
quality in heterolitic intervals like the D-07 and the D-08 intervals. An alternative log-
based measurement for estimating reservoir quality is therefore desirable. Such method
may lead to a renewed interest in similar shaly sand reservoirs in Meren field and other
fields in the Niger Delta that have been considered marginal.
OBJECTIVES
This is a high-resolution sequence stratigraphic study and reservoir
characterization investigation of the D-07 to E-01 reservoirs at Meren field. The specific
objectives of the study include:

5
Figure 3. Base map of Block 2 Meren field showing well distribution. Core data from wells Meren 75 and 77 were used in this study.
N 4 54 00 E 4 55 00 E
5 46 00 N MER-75
500 m
Well trajectory
Cored wells
5 46 00 N

6
1. Define and identify the origin, trend, continuity and quality of reservoirs.
2. Determine depositional facies within a sequence stratigraphic framework.
3. Define the distribution of basic reservoir properties within the sandstone
intervals.
4. Determine relationships between lithofacies, depositional facies, and
petrophysical properties.
5. Estimate porosity and permeability from log.
LOCATION
Meren field is located about 175 km southeast of Lagos, Nigeria (Figure 1). The
field, which is in Oil Mining Lease (OML) 95, was discovered in 1965 by the Meren-1
well and is located under approximately 45 ft. of water. The study area is located
between 5°46’40” & 5°43’30” North and 4°54’ & 4°56’30” East.
PREVIOUS WORK
Extensive studies of the Niger Delta have been concluded in association with
petroleum exploration and exploitation, but most remain proprietary. Most previous
studies, focused on local stratigraphic and structural relationships within individual oil
fields and concessions. The petroleum geology of the Niger Delta has been described by
Tuttle et al. (1999), Doust and Omatsola (1990), Evamy et al. (1978), Weber and
Daukoru (1975) and Short and Stauble (1967). Allen (1965) described the recent
depositional environments of the Niger Delta. He distinguished four “super

7
environments” and a number of environments and sub-environments that are typical of
shelf-delta systems. Oomkens (1974) also described the recent sedimentation and
physiography of the delta.
The stratigraphic evolution of the Tertiary Niger Delta and the underlying
Cretaceous section was analyzed by Weber (1971). Stacher (1995), using a sequence
stratigraphic approach, developed a hydrocarbon habitat model for the Niger Delta. The
model, constructed from data in the central part of the Niger Delta related the deposition
of the Akata and Agbada formations to sea-level changes. Pre-Miocene Akata Shale was
deposited in deep water environments during sea level lowstands and is overlain by
Miocene Agbada strata. The Agbada Formation, deposited on a shallow siliciclastic
ramp, comprise highstand (hydrocarbon-bearing sandstones) and transgressive (sealing
shale) systems tracts. Third-order lowstand systems tracts apparently did not develop.
Syndepositional faulting in the Agbada Formation provided migration pathways and
formed structural traps, whereas shales in transgressive system tracts provided excellent
seals.
Poston et al. (1981) presented the geology and reservoir characteristics at Meren
field. They noted evidence for syn-depositional displacement on growth faults across the
field. Poston et al. (1981) also suggested combining well- log interpretations and
laboratory analyses of sidewall cores to aid in the determination of the spatial variation
of porosity and permeability within particular reservoir intervals.
McHargue et al. (1993), working on Chevron's acreage in the northwestern Niger
delta, used 3-D seismic data to map sequence-bounding unconformities, based on the

8
presence of a submarine canyon near the paleoshelf edge. The recognition of a sequence
boundary was based on: (1) truncation of underlying reflections, (2) drape, dip
discordance, or onlap of younger reflections over topography on the sequence boundary,
(3) contrast in seismic attributes across the sequence boundary, and (4) termination of
faults at the sequence boundary.
Cook et al. (1999) did an integrated sequence stratigraphic study of the E-
01/MER-05 interval in Block 1, which is adjacent to the study area (Figure 1). The study
provided a detailed geologic model that was then used in a reservoir simulation model
and also defined the sequence stratigraphy of the reservoir interval.

9
REGIONAL STRATIGRAPHY, STRUCTURE AND PETROLUEM GEOLOGY
OF THE NIGER DELTA
INTRODUCTION
The Niger Delta complex is one of the most prolific hydrocarbon provinces in the
world (Fig. 4). The Delta is an arcuate, wave- and tide- influenced progradational deltaic
system. The Niger Delta is constructive in its center and destructive on either flank. The
modern delta covers 75,000 km2 and extends over 300 km from apex to mouth. Deposits
of the Niger Delta system are a progradational clastic wedge that reaches a maximum
thickness of about 10 km. Current production is estimated to be about 2.0 million barrels
of oil and 165,000 barrels of condensate per day. Estimated recoverable reserves are
about 43.5 billion barrels of oil and 1240 trillion cubic feet (tcf) of gas.
The Niger Delta complex developed as a regressive sequence during Cenozoic
time and built out across the onshore Anambra basin and Cross River margins and
eventually extended into the Late Cretaceous margin. The Niger Delta complex is
deformed by well-developed growth faults and large mud diapirs. The growth faults are
closely associated to development of the diapirs. Some of the growth faults can be traced
for tens of kms laterally and trend almost parallel to the positions of paleo-delta fronts.
This indicates an intimate relationship between sedimentation and syn-depositional
deformation.

10
The structure and stratigraphy of the delta are primarily controlled by the
interplay between rates of sediment supply and local accommodation patterns that are
strongly influenced by the growth faults. Eustatic sea- level changes and climatic
variation in the hinterland probably determined the mean rate of sedimentation, whereas
initial basement morphology and differential sediment loading on unstable marine shale
probably controlled subsidence patterns.
TECTONIC FRAMEWORK
The Niger Delta is situated at the intersection of an Early Cretaceous triple
junction. The southern and northern arms, the South Atlantic and the Gulf of Guinea
arms, respectively, developed into the seafloor spreading axes that caused separation of
South America from Africa. The third arm, the Benue Trough, failed during Late
Cretaceous time and became an aulacogen that extends northwards into the interior of
Nigeria.
The basic surface geology of southern Nigeria is highlighted in Figure 4. Initial
depocenters during pre-Santonian time included the Benue and Abakaliki troughs.
During Santonian time, the Abakaliki Trough was inverted into the Abakaliki “Fold
Belt”, with consequent downwarping of the adjacent Afikpo syncline and Anambra
Basin.

11
Figure 4. Map of Niger Delta showing Province outline (maximum petroleum system); and key structural features. Minimum petroleum system as defined by oil and gas field center points (data from Petroconsultants, 1996); 200, 2,000, 3,000, and 4,000 m bathymetric contours shown by dotted contours; and 2 and 4 km sediment isopach shown by dashed lines (From Tuttle et al., 1999).

12
During Campanian-Maastrichian time, a thick regressive "proto Niger Delta"
sequence was deposited within the Anambra Basin. Following a major late Maastrichtian
to Paleocene transgression, the thick Tertiary progradational sequence was deposited
across the subsiding passive margin and built out onto oceanic crust that is now buried
beneath outer parts of the Niger Delta.
STRATIGRAPHY
Three main formations have been recognized in the subsurface of the Niger Delta
(Frankl and Cordy, 1967; Short and Stauble, 1967; Weber and Daukoru, 1975; Avbovbo,
1978; Knox and Omatsola, 1989; Tuttle et al., 1999). These are the Benin, Agbada and
Akata formations. These formations were deposited in continental, transitional and
marine environments, respectively; together they form a thick, overall progradational
passive-margin wedge (Figure 5). This general tripartite lithostratigraphic succession is
documented in all deep wells across the Niger Delta (Figures 5, 6).
Akata Formation
The Oligocene to Recent Agbada Formation is the basal unit of the Niger Delta
complex and is composed mainly of dark gray marine shales with some silty beds. It is
especially sandy or silty where it grades into the overlying Agbada Formation. Thin
Akata sands are possibly of turbiditic origin and were deposited in delta-front to deep
marine environments. The formation is believed to be the main source rock within the

13
iger Delta complex. The thickness ranges from 2,000 to 20,000 ft (600 to 6,000 m) (Jev
et al., 1993).
Agbada Formation
The Eocene to Recent Agbada Formation contains most of the petroleum
reservoirs in the Niger Delta and consists mainly of alternating sandstone, siltstone and
shale. The poorly sorted sandstones are very-fine grained to very-coarse grained and
most are unconsolidated to only slightly cemented. Lignite streaks are common, and
shell fragments and glauconite are also present. Shales are gray in color and shaliness
increases with depth. These facies were deposited in various delta-front, delta-topset,
and fluvio-deltaic environments. The thickness ranges from 9,600 to 14,000 ft (3,000 to
4,200 m) (Avbovbo, 1978).
Benin Formation
The Oligocene to Recent Benin Formation largely consists of non-marine sands
with a few shaly intercalations. Shale content increases towards the base of the
formation. Sand intervals are fine to coarse grained. Quartz grains are subangular to well
rounded and are white or may be stained brown by limonitic coats. Hematite and
feldspar grains are also common. Benin shales are grayish brown, sandy to silty and
contain plant remains and dispersed lignite. The Benin Formation was deposited in
alluvial or coastal plain environments following a southward shift of deltaic
environments. The Formation is up to 1,000 feet (300 m) thick (Avbovbo, 1978).

14
Subdivision of the three Cenozoic formations that comprise the Niger Delta is
informal, especially in the hydrocarbon producing Agbada Formation, with each oil
company having its own nomenclature. Within Chevron Nigeria, only petroleum bearing
intervals are named. These units are named alphabetically (from top to bottom) then
numerically, followed by the well number in which the interval was first discovered as
containing petroleum. For example, the designation “D-07/MR-22” means well number
22 was first to encounter petroleum in the D-07 sand in the Meren field. The “07”
however does not mean that this is the 7th ‘D’ sand. Convention within Chevron has been
to leave gaps in the second level designation in order to accommodate later discoveries.
STRUCTURE
The Niger Delta complex is cut by numerous approximately East-West trending
synsedimentary faults and folds. These structures are related to growth faults and were
initiated by differential loading of the underlying undercompacted Akata shales. The
growth faults flatten with depth into a master detachment plane near the top of the
overpressured Akata shale sequence. Most of the faults are listric normal faults, although
other types include; crestal faults, flank faults, counter-regional faults and antithetic
faults (Figure 7).

15
Figure 5. Stratigraphic column showing the three formations of the Niger Delta (Tuttle et al. (1999). Modified from Doust and Omatsola (1990).
Approximate position of study interval Extent of erosional truncation

16
Figure 6. Diagrammatic east west (A-A’) and southwest northeast (B-B’) cross-sections through the Niger Delta. Isopach intervals shown on location map are total sediment thickness in kilometers (Kaplan et al., 1994). Stippled pattern in A-A’ indicates continental basement. Cross-section A-A’ and B-B’ are modified from Whiteman, 1982.

17
HYDROCARBON OCCURRENCE
Virtually all the petroleum in the Niger Delta is found in paralic sands. The
hydrocarbons are trapped in rollover anticlines or against growth faults, especially along
footwall (Figure 7). Minor stratigraphic traps also occur in some fields due to lateral
facies changes or in association with clay-filled channels (Orife and Avbovbo, 1981).
The Niger Delta is comprised of five offlapping siliciclastic sedimentation cycles These
cycles or depobelts as they are more typically called, grade 250 kilometers
southwestward over oceanic crust that underlies the Gulf of Guinea (Stacher, 1995). The
depobelts are defined by synsedimentary fault trends that formed in response to different
rates of subsidence and sediment supply (Doust and Omatsola, 1990). As the delta
prograded, when local subsidence diminished greatly, the focus of sediment deposition
was forced to shift seaward, forming a new depobelt (Doust and Omatsola, 1990). Each
depobelt is a separate unit that corresponds to a break in regional dip of the delta and is
bounded landward by growth faults and seaward by large counter-regional faults or the
growth fault of the next depobelt seaward (Evamy et al., 1978; Doust and Omatsola,
1990). Five major depobelts (Figure 8) are generally recognized, each with its own
sedimentation, deformation, and petroleum history (Tuttle et al., 1999).
18
Figure 7. Examples of Niger Delta oil filed structures and associated trapping styles. Modified from Doust and Omatsola (1990) and Stacher (1995).

19
Although there is petroleum accumulation throughout the Agbada Formation,
there are several directional trends that form an "oil-rich belt" where the largest oil
accumulations are found (Ejedawe, 1981; Evamy et al., 1978; Doust and Omatsola,
1990). This belt extends offshore from northwest to southeast and roughly corresponds
to the transition between continental and oceanic crust. The oil- rich Agbada belt is also
located within the axis of maximum sedimentary thickness (see isopach map in Figure
6a). This hydrocarbon distribution was originally attributed to timing of trap formation
relative to petroleum accumulation. Evamy et al. (1978), however, showed that there
was no relationship between the growth of particular faults and the distribution of
petroleum. Weber (1986) suggested that the oil-rich belt ("golden lane") coincides with a
concentration of rollover structures across depobelts having short southern flanks and
minor paralic sequences to the south. Doust and Omatsola (1990) suggested that the
distribution of petroleum is likely related to heterogeneity of source rock type and/or
segregation due to remigration. Haack et al. (1997) and Tuttle et al. (1999) suggested
that the accumulation of these source rocks was controlled by pre-Tertiary structural
sub-basins related to basement structures.
Stacher (1995), used sequence stratigraphic concepts to develop a hydrocarbon
habitat model for the Niger Delta (Fig. 9). This model, constructed for the central part of
the Niger Delta, relates deposition of the Akata and Agbada formations to relative sea-
level changes. Pre-Miocene Akata shale was deposited in deep water during lowstands
and is overlain by progradational Miocene Agbada strata. The Agbada Formation in the
central portion of the delta was deposited on a shallow ramp as mainly highstand

20
(hydrocarbon-bearing sands) and transgressive (sealing shale) systems tracts; third order
lowstand system tracts are not easily recognizable within the Agbada Formation.
Faulting in the Agbada Formation provided migration pathways and formed structural
traps, whereas shales in the transgressive system tracts provide excellent seals.
SOURCE ROCKS
The source rock for the petroleum accumulations in the Niger Delta has been a
controversial subject. Some workers favor the shales of the Agbada Formation as the
main source rock (Short and Stauble, 1967; Lambert-Aikionbare (1982), whereas others
believe the main source to be the marine Akata Formation (Weber and Daukoru 1975;
Ekweozor and Daukoru, 1984).
Short and Stauble (1967) and Frankl and Cordy (1967) were the first to propose
an origin from the Agbada Formation, but were challenged by Weber and Daukoru
(1975) and Ekweozor and Daukoru (1984) who claimed that in most parts of the delta,
the Agbada Formation is immature. They sought a source within the Akata shales, which
they expected would be a better quality source because there were deeper and more
mature than the Agbada shales (Doust and Omatsola, 1990).

21
Figure 8. Map showing the petroleum province trend of Niger Delta. Modified from Ejedawe (1981) and Reijers and et al (1997).
Figure 9. Generalized sequence stratigraphic model for the Niger Delta showing the relation of source rock, migration pathways, and hydrocarbon traps related to growth faults. Figure modified from Stacher (1995).

22
The main source rock in the Niger Delta is related to the position of the oil
generative window (OGW) over time (Evamy et al., 1978; Ejedawe, 1981). In the central
part of the delta where the OGW is very deep, Akata shale is believed to be mainly gas
generating, while Agbada shale is the main oil source. In the western delta, the OGW
lies within the Agbada Formation and it is considered to be the main oil source, whereas
the underlying Akata shale is the main gas source. In the eastern delta, however, the
Agbada Formation is relatively thin and the top of the OGW lies well within the Akata
shales, which are considered to be the main source of hydrocarbons in this area.
Although the kerogen is a mixture of type 2 and type 3 (Bustin, 1988), which generates
light oil and gas respectively, Ejedawe et al. (1984) suggested that thermal conditions
rather than kerogen type is the main factor influencing oil and gas occurrence in the
Niger Delta. Tissot et al. (1987) also supported this conclusion.
In general, migration of generated hydrocarbon postdates the cessation of
sedimentation and structural deformation. In some places, migration is very local and
occurred from the paralic shales into the sands. Weber et al (1978) proposed that when
the overpressure shales on the upthrown side of a fault are juxtaposed against hydrostatic
pressured sands on the down thrown side, cross fault migration takes place due to
pressure differential (Figure 9).
A number of trends ca be observed from the Niger Delta hydrocarbon
distribution map (Figure 6):

23
1. Most of the oil accumulations occur in either an arcuate belt that extends across the
delta from the northwest to southeast offshore in the east, or along a number of more
linear trends in the coastal swamp.
2. The central, easternmost and northernmost part of the delta are characterized by very
high gas-oil ratios and low-gravity biodegraded oils with very low gas-oil-ratios.
3. Prolific north-south trends are present in the Port Harcourt and Egbema areas. These
are thought to be related to the distribution of the fluvial-deltaic systems in the sequence.
4. In individual depobelts, the gas to oil ratio increases seaward and along-strike, away
from maximum sediment accumulations. Each depobelt seems, therefore, to represent a
separate hydrocarbon system.
5. Most commercial accumulations are in the structurally highest part of any given large-
scale structure, despite variable trapping conditions (Doust and Omatsola, 1990).

24
METHODOLOGY
LOG ANALYSIS
Chevron Nigeria Limited provided well log suites (usually including gamma-ray,
resistivity, effective porosity, neutron porosity and bulk density) from 30 wells and core
data from two wells. The study area well locations are shown in Figure 3.
Gamma-ray logs were used for correlation and sequence stratigraphic analysis
because they are high-resolution indicators of lithofacies changes, and they are typically
less susceptible to borehole effects than other logging methods. Gamma-ray log
characteristics were calibrated to core descriptions from the D-07 and the E-01 intervals
in the MER 77 and MER 75 wells.
The relatively high sedimentation rates and high accommodation in the Niger
Delta, including the area around Meren field, enhance the utility of gamma-ray logs for
documenting abrupt accommodation changes. Flooding surfaces were mainly picked by
their gamma-ray log signatures. Most flooding surfaces could be easily correlated across
the study area.
Well logs were calibrated with the available cores. Core-to-log depth shifts were
applied where necessary to correct for cable stretching and gaps in the core. This was
done to enable an accurate matching of core-defined lithofacies to the proper log
responses. The correlation panels were consistently hung on a shale marker below the E-
01 reservoir, which is believed to be a reliable datum that was nearly flat at the time of
deposition.

25
Strike-and dip-oriented cross-sections were made to help in determining the
geometry and trend of sand bodies within the studied interval. Well picks, correlation
and cross-section were made using WellPix and Stratworks. Structure maps were
constructed using Zmap .
CORE ANALYSIS
Core data from two wells were used in this study (Figure 3). These data include
core descriptions, core photographs and core-plug porosity and permeability
measurements. Core photographs were taken under both white light and ultraviolet light,
with the ultraviolet images providing indications of oil staining. Detailed core
descriptions and photographs were used to identify lithofacies. Depositional
environments were then interpreted from the lithofacies descriptions, based on grain
size, sorting, clay content, sedimentary structures, and trace fossil assemblages.
The three intervals examined in this study were subdivided into lithofacies based
on lithology, grain size, clay content, physical and sedimentary structures and trace fossil
abundance. The lithofacies that are probable flow units were identified using a
combination of physical properties (e.g., grain size, sorting, primary depositional
layering, and core-plug porosity and permeability measurements).
SEQUENCE STRATIGRAPHIC ANALYSIS
Sequence stratigraphic analysis of the studied intervals was done using pattern
recognition of log signatures such as coarsening upward and fining upward patterns.

26
After correlating the core descriptions with their equivalent well- log signatures,
facies stacking patterns then were largely determined using gamma-ray log patterns.
Parasequence boundaries were picked based on the contacts of the depositional
environments. Sediments that are genetically related obeys Walther’s rule, a break in the
law suggest the presence of a parasequence boundary. These surfaces denote sharp
contacts between relatively shallow-water faces lying directly above deeper-water facies
(and vice versa).
Isolith maps were constructed to represent the thickness of stratigraphic intervals
between successive flooding surfaces and to show the geometry of individual sand
intervals. Cross-sections drawn across the study area were color-coded with the gamma-
ray values from wells along the line of section to reveal changes in lithofacies across the
study area.
PETROPHYSICAL ANALYSIS
Regression analysis was performed to establish the relationship between core-
plug permeability and porosity and the log measurements. Cross-plots of different log
measurements (neutron porosity (NPHI), gamma-ray (GR), bulk density (RHOB) and
effective porosity (PHIE)) vs. core-plug porosity and permeability measurements were
generated using PrismTM to assess which log measurements best predicted core
observations R-square (R2) as defined by correlation coefficients of regression equation
fit to each cross plot. The regression equation might then be used to predict permeability
and porosity for uncored wells.

27
LITHOFACIES AND SEDIMENTOLOGY
OVERVIEW OF MEREN FIELD
An interval of late Miocene paralic sandstone of the Agbada Formation were
examined during this study (including D-07/MER-22 through E-01/MER 26 sandstones,
shown in Figure 2). Previous depositional models for this interval suggested that
deposits formed in close proximity to fluvial channel mouths and were transported by
tidal and along-shore currents. They were later deposited in lower energy tidal- flat,
barrier-bar, and shoreface to offshore environments.
LITHOFACIES AND DEPOSITIONAL INTERPRETATION
Lithofacies Description
Seven lithofacies were defined in cored wells through the Agbada Formation at
Meren Field. A summary of the lithofacies, (defined by their dominant grain size,
primary sedimentary structures, bioturbation intensity, fossil content), well log signature
and petrophysical properties is presented in Table 1. These facies types correlate well to
the interpreted depositional environments, reservoir properties and gamma-ray log
signatures (Figures 9, 10).

28
Table 1.Lithofacies within the E-01 to D-07 intervals at Meren Fieldand their typical petrophysical properties
Lithofacies DescriptionDepositional Environment Petrophysical Properties
Cross-stratified Sandstone Fine- to coarse-grained sandstone. Loose to friable. Well sorted to very well sorted. Rare bioturbation cross-bedded.
Upper Shoreface Gamma ray = 60-80 API Porosity = 29-36% Permeability = 300-5,000 md
Laminated Sandstone Very fine - fine , mm-scale laminated sandstone. Well sorted. Horizontal to low angle laminations.
Delta Front Gamma ray = 60-80 API Porosity = 29-36% Permeability = 300-2,000md
Massive sandstone Fine to medium- grained massive to fluidized to coarse grained sandstone. Poorly cemented.
Upper Delta Front Gamma ray = 30-60 API Porosity = 24-32% Permeability = 20-1,870 md
Bioturbated Sandstone Very fine to fine grained bioturbated sandstone. Densely bioturbated by Cruziana, Planolites. Primary structures virtually destroyed.
Lower Shoreface Lower Delta frontGamma ray = 60-85 API Porosity = 21-35% Permeability = 10-1000 md
Muddy Sandstone Silt to fine grained wavy- bedded muddy sandstone, commonly bioturbated. Basal part of the unit sandier, size and diversity of burrows increases upwards.
Lower Shoreface Lower Delta Front
Gamma ray = 70-80 API Porosity = 22-32% Permeability = 15-2,000 md
Sandy Mudstone Sandy mudstone /Mud - dominant . Lower Shoreface Gamma ray = 60-80 API Porosity = 29-36% Permeability = 300-2,000 md
Mudstone/Shale Bedded or massive mudsone with thin laminations of very fine sands and silts. Little or no bioturbation.
Shelf Gamma ray = 90-100 API Porosity = 16-30% Permeability = 10-40 md

29
Figure 10a. Correlation of gamma-ray log and interpreted core taken through the D-07 interval in Meren 77 well.
Gamma-ray Lithofacies Core Description Core Section Depositional Environment
20 120
API
C S S
C C C
S
Shale
Shale
Shelf
Shelf
Muddy Sandstone
Lower Shoreface
Very fine - to fine grained bioturbated sandstone. Primary structures almost entirely destroyed due to intense bioturbation
Mudstone with thin sand laminations. Little or no bioturbation
Silt to fine grained wavy -bedded sandstone. Basal part of the core section is sandier, bioturbation intensity increases upwards
Mudstone with thin sand laminations. Little or no bioturbation
FS
FS
FS
FS
D-07 Top
D-07 Base
Depth (ft)
C = Calcite
S = Siderite
FS = Flooding Surface

30
Figure 10b. Correlation of gamma-ray log and interpreted core section through the D-08 and E-01 intervals in Meren 75 well.
Gamma-ray Lithofacies Core Description Core Section Depositional Environment
20 120
API
s s s
Pl, Te s
Oph, Te C
Silt to fine grained wavy -bedded sandstone. Basal part of the core section is sandier. Planolites and Techinus present
Silt to fine grained muddy sandstone with evidence of soft sediment deformation
Very fine - to fine grained horizontal to low angle laminated sandstone
Fine- to medium grained cross trough cross-bedded sandstone
Ravinement surface
Fine- to medium grained massive fluidized sandstone
No core recovered
D-08 Base
E-01 Base
D-08 Top
E-01 Top
Muddy Sandstone
Laminated Sandstone
Lower Shoreface
Cross-bedded Sandstone
Muddy Sandstone Massive Sandstone Upper
Delta Front Lower Delta Front
Sandy Mudstone
Upper Shoreface Lower Delta Front Lower- Mid Shoreface
Depth (ft)
Sandy mudstone.
FS
FS
FS
Pl= Planolites Te= Teichichinus Oph = Opiomophia
FS

31
Cross–bedded Sandstone
Description: These very-fine to medium-grained, well-sorted, and poorly-
cemented sandstones contains centimeters-thick sets of trough cross-bedding. Shell
fragments are locally found on bedding planes. Individual bedsets are 15 – 60 cm (0.5 to
2 feet) thick and locally stack to form multistory sandstone bodies that are up to about 4
m (14 feet) thick. Individual sandstone units generally have sharp bases and locally
coarsen upward. Some foresets of planar cross-beds locally show evidence of soft-
sediment deformation (Figure 11). Trace fossils present in the interval are the relatively
low diversity vertical dwelling structures Ophiomophia and Skolitos of the Skolitos
ichnofacies.
Interpretation: The trough cross-stratification found in migrating dunes and on
nearshore bars, whereas the nearly horizontal planar laminae probably reflect deposition
on the crest and seaward slope of longshore bars in an upper shoreface environment.
Thus, these facies are interpreted as wave- and storm-dominated upper shoreface
deposits. The cross bedding suggest deposition in response to fluctuating flow velocities.
The relatively high energy conditions did not allow for the proliferation of burrowing
organisms. This facies has relatively low gamma ray, porosity ranges from 24 to 36 %,
and permeability is on the order of 300 to over 5,000 md.

32
Figure 11. Core photos of cross–bedded sandstone (upper shoreface facies). Subhorizontal to low-angle, cross-bedded fine- to medium grained sandstone. Carbonate materials locally found on bedding planes (arrow). Relatively high depositional energy did not allow for much burrowing. Photo (a) was taken with ultraviolet light and (b) with white light.
(a) (b)

33
Massive to Poorly-stratified Sandstone
Description: Massive to poorly stratified sandstone consists of fine-to medium-
grained, poorly-cemented sandstone with faint primary layering and common evidence
of fluidization or soft-sediment deformation. This lithofacies is found only in the E-01
interval. These sandstones are generally poorly sorted with locally common clay clasts
and carbonaceous debris. Massive to poorly stratified sandstone generally separates
muddy sandstone below from clean, cross-bedded sandstone above (Figure 12).
Interpretation: The poor stratification probably reflects rapid deposition either by
very high-density turbidity currents or very fluid sand-rich debris flows. Chaotically
bedded to massive, poorly sorted sandstone layers record very rapid deposition and rapid
"freezing" of concentrated sediment gravity flows. Because of the very poor sorting and
soft sediment deformation in this facies, an upper delta front environment close to an
area of active slumping is suggested.
Laminated Sandstone
Description: These well-sorted, very-fine to fine-grained sandstones with have
well-developed horizontal to subhorizontal lamination. Fine carbonaceous material and
mica flakes are commonly concentrated along discreet laminae. Laminated sandstone is
found as thin isolated units, usually less than 0.46 m (1.5 feet) thick that are interbedded
with other clean sandstone or muddy sandstone

34
Figure 12. Core photos of massive to poorly stratified sandstone facies (lower Delta front facies). Facies consists of fine- to medium grained poorly cemented massive sandstone. Note evidence for disturbed layering (arrows).
3 inches
(a) (b)

35
Figure 13. Core photos of laminated sandstone (Delta front facies). Facies consists of very fine- to fine-grained laminated sandstone.
3 inches
(a) (b)

36
lithofacies. Laminated sandstone is only found in the upper portion of the E-01 interval
(Figure 10b, 13).
Interpretation: Laminated sandstones are alternating storm-deposited sands and
fair weather mud layers deposited on the delta front. Mud layers settled out of
suspension between storms. Primary sedimentary structures are preserved due to limited
bioturbation. The relatively minor bioturbation in the delta front facies probably reflects
the harsh ecological conditions produced by significantly increased water turbidity and
rapidly fluctuating rates of suspension sedimentation in this setting (Moslow and
Pemberton, 1988).
Bioturbated Sandstone
Description: In these of very-fine-to fine-grained, poorly cemented, poorly-
sorted sandstones intense bioturbation have left little evidence of the primary
stratification (Figure 14). Trace fossils, characteristic of the Cruziana ichnofacies, as
include abundant Cruziana, Teichinus and Planolites trace fossils dominate the D-07 and
D-08 intervals. Clay content ranges from 10-30%. Whole and broken bioclasts (mostly
shell fragments) are locally common. Bioturbated sandstone is typically associated with
thin wavy laminated sandstone; contacts between these facies are typically gradational.
Individual beds range from < 0.30 m

Figure 14. Core photos bioturbated sandstone (lower shoreface facies) in the D-07 interval in MER-77 well. This facies consists of very fine-to-fine grained highly bioturbated sandstone. The sandstone appears mottled due to extensive bioturbation. The lower depositional energy allowed burrowing organisms to completely rework the sandstone. Primary sedimentary structures almost completely destroyed.
(a) (b) 37

38
(< 1 foot) to a maximum of 7.6 m (25 ft). Gamma-ray logs through this facies in Mer-77
well indicate a fining upward character. This log pattern is repeated in the D-07 interval
in many wells.
Bioturbated sandstone facies can be calcite-cemented or poorly cemented.
Calcite cements has significant effects on reservoir properties, generally reducing the
porosity and permeability.
Interpretation: Bioturbated sandstone was probably deposited in shallow shelf
settings that were intermittently within storm wave base and where bottom water was
still oxygenated. The finer grained intervals were probably deposited from suspension
while the sandier portions were deposited by storm events. The storm-deposited sands
were later intensely bioturbated and mixed with hemipelagic mud to form the mottled
appearance. The Cruziana ichnofacies indicates deposition in shallow shelf conditions.
Core data suggest that bioturbation seems to increase overall reservoir porosity and
permeability through the destruction of the hemipelagic clay layers, which could have
been flow baffles and barriers.
The diverse Cruziana ichnofacies assemblage is common in lower shoreface
facies that were deposited below normal wave base but above storm wave base in
relatively low to moderate energy settings.
Muddy Sandstone
Description: These poor-to moderately-cemented, very-fine to fine-grained,
poorly-sorted sandstones have 10-50% admixed and interlaminated clay. Flaser bedding,

39
which consists of millimeter-thick clay laminae that drape cm-scale rippled sand layers,
is common. Fluidization structures and local vertical and horizontal burrows commonly
disrupt primary lamination. Muddy sandstone beds are 0.30 to 1.5 m (1-5 feet) thick and
are typically associated with sandy mudstone lithofacies (Figure 15).
Interpretation: The sandstone and admixed clay suggest an alternation of storm-
deposited sand layers and clay layers deposited during low energy, fair weather
conditions. Local, but limited bioturbation suggests environments that were only
intermittently oxygenated. A lower shoreface to offshore transition depositional
environment is suggested.
Sandy Mudstone
Description: Sandy mudstone consists of dominantly mudstone or shale with 10 -
50% admixed and interlaminated sand and silt. This lithofacies is characterized by
millimeter-scale rippled lenses of sand and silt within a matrix of mud. Local centimeter-
scale siderite nodules are common in the coarser-grained layers. Weak fluidization and a
variety of small-scale burrows of indeterminate origin commonly.

40
Figure 15. Core photos of muddy sandstone (lower shoreface facies) in MER-77. This facies consists of very fine- to fine grained poorly sorted sandstone. Laminated sands (arrow) probably deposited during storm events. The apparent dip of the bed is due to the deviated nature of the well.
(a) (b)
3 inches

41
Figure 16. Core photos of sandy mudstone (offshore transition facies). This facies consists of very fine- to fine-grained bedded to massive sandstone.
(a) (b)

42
disrupt the internal lamination. Individual units are commonly 0.30 –0.60 m (1 -2 ft)
thick and are interbedded with muddy sandstone lithofacies (Figure 16).
Interpretation: Sandy mudstone lithofacies were deposited in low energy lower
shoreface environments. Presence of ripple laminations within a muddy matrix suggests
variable and fluctuating depositional energy
Mudstone/Shale
Description: Mudstone / shale has less than 10% admixed sands or silts and is
dark gray to black in color. Fissile shale has well-developed millimeter-scale parallel
lamination and common centimeter-scale siderite nodules. Mudstone /shale comprises
the interval that separates the D-07 and D-08 sand-dominated intervals (figure 17). This
interval consists of dark gray, laminated to massive mudstone. The laminations in
mudstone/shale interval are wavy to planar. Scattered cm-scale siderites nodules are also
present. Small-scale internal truncation surfaces suggest either intermittent erosion by
rare bottom currents or wave activity. These marine deposits serve as seals that separate
the sandstone intervals into reservoir units.
Interpretation: This lithofacies represents the lowest ene rgy, most offshore facies
in all the studied intervals. Mudstone/shale was deposited from suspension fallout,
probably in anoxic to dysoxic shelfal environments, as indicated by the dark color and
well preserved laminations.

43
Figure 17. Core photos of shale (shelfal facies). This facies serve as seals that separate the reservoir units. Note the laminations (arrow).
3 inches

44
DEPOSITIONAL MODEL
A depositional model for the wave-and tide influenced Niger Delta is presented in Figure
18 whereas a summary of the facies characteristics is presented in Table 2.
Table 2. Typical nearshore marine facies characteristics (Boyle and Scott, 1981; Moslow and Tillman, 1986)
Facies Lithology Sequence Features Sedimentary Structures
Biogenic Structures
Foreshore Fine- to medium- grained sandstone (250 µm)
Caps coarsening-upward shelf- shoreface sequence or overlies delta plain sequence
Cross-bedded (subhorizontal to low angle planar); truncation surfaces; inverse grading
Burrows rare to absent
Upper Shoreface
Fine-to medium grained sandstone (150 µm)
Interbedded with foreshore facies; highly variable thickness (3.8 ft to 38 ft0; low reservoir potential
Cross-bedded (low-angle troughs); trough sets symmetrical; truncations surfaces
Burrows rare (Ophiomorpha, Asterosoma)
Lower Shoreface
Silty sandstone to shaly sandstone
Gradational upper and lower contacts
Alternating layers of burrowed siltstone and cross-bedded to ripple sandstone; cross-hummocky stratification rare
Burrows and bioturbation moderate; includes (Teichichnus and Ophiomo rpa)
Shelf-Shoreface Transition
Fine- grained sandstone (200 µm) to silty shale and mudstone
Lithologically diverse; rare thin (<1 ft thick) storm -deposited sandstones
Bedding reworked to soft sediment deformed; ripple bedding and horizontal laminations rare
Burrows and bioturbation common
Inner Shelf Silty fine- grained sandstone (200 µm)
Percent sand increases upwards; base of overall shelf-shoreface coarsening upward sequence
Ripple and wavy bedding rare; rare, thin units of horizontally laminated sandstone (storm deposits)
60% to 80% bioturbated; high diversity of burrow types; includes (Zoophycos, Asterosoma and Ophiomorpha)

Figure 18. Depositional model of wave dominated delta/strand plain system. These systems are composed of shoreface (left of diagram) and deltaic facies (center of diagram). Cyclic patterns on logs are result of transgressive / regressive cycles of shoreface/delta deposition (modified from Oomkens, 1974).
Wave- and tide influenced Niger Delta
45

46
DEPOSITIONAL TRENDS
The depositional trends of the sand bodies in the studied intervals are linked to the major
growth fault that bounds the northern side of Meren field (Fig 1). Depositional strike at
Meren field during late Miocene time was NW-SE, which is more or less parallel to the
bounding growth fault along the NE side of Meren field. The incremental and long-term
increase in subsidence across the hanging wall of growth fault would have been greatest
next to the fault. Dip-oriented NE-SW cross-sections show a decrease in both sand
quality and sand thickness away from this growth fault. The increase in thickness
towards the bounding fault can be attributed to the syndepositional nature of the growth
fault with more accommodation space being created by the displacement along growth
faults.
RESERVOIR PROPERTIES
Distribution of the seven identified lithofacies determines the production
performance of the reservoirs. Lithofacies have distinct mean petrophysical properties,
although there is overlap in the range of values. (Table1). Petrophysical properties of
the interval include porosity, permeability, resistivity and radioactivity.
Adjacent lithofacies with contrasting petrophysical properties influence fluid
flow in the reservoir. Shales and shaly intervals will act as barriers to fluid flow. The
best reservoir sands, found in the upper part of the E-01interval, and consist of high-
energy upper shoreface facies with porosity as high as 36% and permeability is as high
as 5 Darcy.

47
DESCRIPTION OF RESERVOIR INTERVALS
Upper Miocene sand intervals examined during this study are part of a
succession of petroleum-producing reservoirs in Block 2 of Meren field. The sand
intervals are discussed in ascending stratigraphic order below:
E-01 Sand
The E-01 reservoir is made up of the D-08 and the E-01 intervals. Isolith maps
indicate that these sand intervals are separated by a 1-2.4 m (3 to 8 ft) thick porous and
permeable silt interval (Figures 3, 10b),. These two lobes are treated as a single reservoir
unit because they are in pressure communication. Thus, these sand intervals are
designated by Chevron Nigeria as the “E-01 reservoir”. In the two cores studied, there is
no permeability measurement from the silty interval separating the two lobes, however,
log porosity is as high as 30%.
The E-01 interval consists of an upward coarsening succession, and is capped by
the D-08 interval, which is an overall fining-upward retrogradational parasequence set.
The thickness of the E-01 interval ranges from about 18-24 m (60 to 80 ft). Grain size
ranges from very fine to medium sand. The E-01 interval is a relatively high quality
reservoir interval with permeability as high as 5,400 md and porosity between 29 and
36%. The E-01 sands were deposited in delta-front to upper shoreface environments
(McAfee, 1994). The best quality reservoir sands are found in the shoreface facies.

48
The D-08 Interval
The D-08 interval us made up very-fine- to fine-grained, slightly cemented to
unconsolidated, bioturbated sand. The D-08 interval varies from 7.6-12 m (25 to 40 ft)
thick with thickness increasing towards the NW-SE trending growth fault along the
north side of the field (Figure 1). Bioturbation intensity increases with decreasing clay
content. Permeability is significantly improved in this reservoir interval due to the
pervasive bioturbation within the sands, which has destroyed the primary depositional
layering and mixed the clay with the sand, making the interval more homogeneous.
The D-08 interval is an upward-fining succession (Figures 2, 10b). This interval
consists of lower shoreface bioturbated sand and offshore marine shale (Figure 10b). The
log signature and overall fining upward character of the interval suggest a progressive
decrease in depositional energy. The finer grained intervals are probably hemipelagic
deposits, whereas the sandier portions were deposited by storm events. Primary
depositional layering was largely destroyed by bioturbation during quiet periods between
storms.
The D-08 interval grades upwards into a 6-9 m (20 – 30 ft) shale that separates it
from the overlying D-07 interval. The intervening shale is an effective flow barrier,
because well tests indicate that the D-08 and D-07 intervals are not in pressure
communication.

49
D-07 Interval
The D-07 interval is one of the reservoirs in Meren field that is regarded as a
low-resistivity low-contrast pay sand. This interval and others like it have previously
been considered to be unproductive. The successful completion and production from the
D-07 interval by the Meren-82 well, however, show that this interval and others like it
have the potential of being good producers.
The D-07 interval exhibits less than 4.0-ohm resistivity on open hole logs. This
log response is due a combination of factors, including the shaly character of these sandy
sediments and the presence of conductive siderite nodules.
The D-07 interval consists of very fine laminated to fine non- laminated sand with
10-15% clay at the base. Clay content increases towards the middle of the interval to
about 20% clay and then decreases up to fine laminated sand with about 10% clay at the
top of the interval. The interval is intensively bioturbated and appears mottled, with only
rare sedimentary structures (Figure 14). The D-07 interval ranges from 32 to 45 ft (10-
14 m) thick, with thicker sand toward the bounding growth fault on the north side of
Block 2, suggesting syndepositional faulting.
The D-07 interval, like the underlying the D-08 interval, consists of marine shale
and bioturbated lower shoreface sand. The trace fossils are characteristic Cruziana,
ichnofacies.
The upward fining and then upward coarsening signature of the D-07 interval
suggests varying depositional energy. Sands layers were deposited by storm events in

50
shallower water lower shoreface settings, whereas the mud rich portions were deposited
by suspension fallout in deeper parts of the lower shoreface to offshore environments.
Overall, the D-07 interval contains a higher percentage of sand, has more
primary wave–generated sedimentary structures, and lower bioturbation intensity than
the underlying D-08 interval, which suggests that the D-07 interval represents a
parasequence set that prograded farther seaward than the D-08 interval.

51
SEQUENCE STRATIGRAPHY
INTRODUCTION
Posamentier and Vail (1988), Van Wagoner et al. (1990) and Mitchum and Van
Wagoner (1991) have demonstrated that high-resolution sequence stratigraphic analysis
is possible using well- log data. Facies stacking patterns identified in well logs provide a
powerful tool for field-wide stratigraphic correlation.
Van Wagoner et al. (1990) defined a parasequence as a “relatively conformable
succession of genetically related bed or bed sets bounded by marine flooding surfaces
and their correlative surfaces.” It represents a single episode of progradation, that is, the
seaward movement of a shoreline. An ideal progradational parasequence of siliciclastic
facies deposited in shoreface settings might begin with offshore mudstone that grades
upward into bioturbated lower shoreface sandstone beds, followed by lower shoreface
storm deposits and ultimately grade upward into trough cross-bedded upper shoreface
and foreshore deposits (Fig. 19).
Flooding surfaces, which bound parasequences, are commonly used as primary
correlation horizons. Flooding surfaces record an abrupt increase in water depth, which
is also usually accompanied by evidence for non-deposition or minor erosion along the
flooding surfaces. Flooding surfaces that separate offshore to shoreface parasequences
are commonly expressed as a sharp contact between relatively shallow-water facies at
the top of the underlying parasequence. Thus, the abrupt facies change across a flooding

52
surface represents a rapid increase in accommodation (sensu Jervey, 1988), which is
defined as “the space made available for potential sediment accumulation”
Flooding surfaces are excellent horizons for high-resolution sequence
stratigraphic correlation because they are easily recognized on well logs and in cores.
They also closely approximate time lines especially along low-gradient siliciclastic
shoreline and shelf profiles that are rapidly flooded during the abrupt increases in
accommodation.
Fig 19. A. Idealized facies succession within a progradational siliciclastic parasequence comprised of offshore to foreshore facies. Note upward coarsening trend in grain size. The parasequence is interpreted to have formed on a sandy, wave-dominated shoreline setting (B) Idealized facies succession within a progradational tide- dominated shoreline parasequence. This type of parasequence is interpreted to form in tidal flat to subtidal environments on a muddy, tide-dominated shoreline. Modified from Van Wagoner et al., 1990.

53
In many stratigraphic successions, parasequences are believed to represent 104 to
106 yr time scales (Van Wagoner et al., 1990). In this study, however, there is no high-
resolution biostratigraphic data that might precisely constrain the ages and duration of
the parasequences that comprise the larger scale depositional packages.
A parasequence set is a succession of genetically related parasequences that form
a distinct stacking pattern and are bounded by major marine-flooding surfaces and their
correlative surfaces (Van Wagoner et al., 1990). Successive parasequence in sets display
trends in facies compositions and thickness and these sets may be progradational,
aggradationa l or retrogradational parasequence sets. The stacking pattern reflects the
interplay between relative changes in sea level (accommodation) and sediment supply
rates (Posamentier et al., 1988). Parasequence set boundaries separate distinctive
parasequence-stacking patterns and these may coincide with sequence boundaries and
may be downlap surfaces and boundaries of systems tracts (Van Wagoner et al., 1990).
Sequence boundaries are generated by relative fall in sea level, which may be
produced by changes in the rate of tectonic subsidence or by falling eustatic sea level, as
long as these changes result in a net accommodation loss. Sequence boundaries are
recognized in well logs by: (1) an abrupt basinward shift in facies, (2) sharp facies
boundaries, which indicates erosional truncation along the sequence boundary, and (3)
vertical changes in parasequence stacking patterns from progradational to
retrogradational.
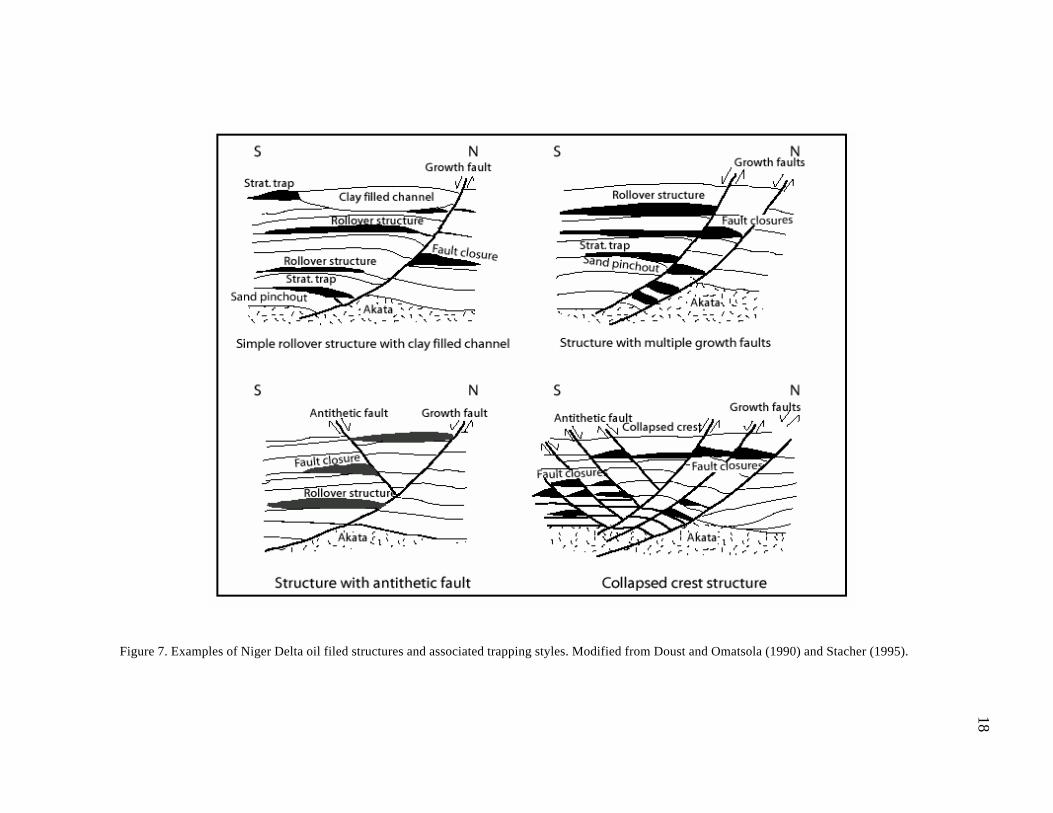
A depositional sequence is defined as a relatively conformable succession of
genetically related strata bounded by unconformities or their correlative conformities

54
(Mitchum, 1977). A depositional sequence records one complete cycle of relative sea
level change. Sequences are made up of parasequences and parasequence sets and they
can be divided into systems tracts based on the types of bounding surfaces and the
distribution of parasequence sets within the sequence (Posamentier et al., 1988; Van
Wagoner et al., 1988). Systems tracts are defined as a linkage of contemporaneous
depositional systems (Brown and Fisher, 1977); depositional systems are defined as
three-dimensional assemblages of lithofacies (Fisher and McGowen, 1967). In a
complete vertical succession, the depositional sequence comprises four systems tracts
with distinct stratal stacking patterns (Figure 20). The highstand systems tract (HST)
forms during late relative sea-level rise, when the sedimentation rate exceeds the rate of
relative rise in the shoreline area (normal regression). The falling stage systems tracts
(FSST) form during relative fall. The lowstand systems tract (LST) forms during early
relative rise, when the sedimentation rate exceeds the rate of relative rise in the shoreline
area (normal regression). The transgressive systems tract (TST) forms when the rate of
relative sea- level rise in the shoreline area exceeds the sedimentation rate (Catuneanu et
al., 1998).
STRATIGRAPHIC ARCHITECTURE OF RESERVOIR UNITS
The general stratigraphic architecture of the intervals studied has been deduced
from correlation of well logs across the Meren Block 2 (Figures 21-25). Some of the
stratigraphic successions recognized during this study are similar to those recognized by

55
Cook et al. (1999) in their study of the D-08 to E-02 intervals in the adjacent Block 1 of
Meren field.
Individual parasequences are defined largely on the physical characteristics of
gamma-ray logs and their relationships with the overlying and underlying
parasequences.
Cored intervals from two wells (Meren 75 and 77) provide the only direct lithologic
calibration of well logs through the reservoir intervals. Parasequence sets were identified
within the E-01 to D-07 interval at Meren field and are shown in Figure 22-25. Three
progradational parasequences form the parasequence set that comprises the basal E-01
interval and two retrogradational parasequence sets comprise the D-08 and D-07
interval.
Each parasequence set varies in thickness from about 40-70 ft (13-24 m). Individual
parasequences at Meren field consist of various elements of the idealized parasequences
that form in wave- and tide influenced shoreline environment as described by Van
Wagoner et al. (1990). The retrogradational successions are made up of lower shoreface
deposits overlain by marine shales, whereas the progradational parasequences are made
up of offshore marine shales, delta front sands and lower to upper shoreface deposits.
The parasequences at Meren field are interpreted to have formed in tide- and wave-
influenced offshore to upper shoreface environments.
56
Figure 20. Typical genetic sequence composed of systems tracts. The sinusoidal curves illustrate relative sea- level changes in the shoreline area (after Catuneanu et. al., 1998).

57
E-01 Interval: A Progradational Parasequence Set
The E-01 interval consists of two or three generally symmetrical parasequences
that comprise the overall progradational parasequence set (Figure 22-25). Each
symmetrical parasequence within the E-01 interval is 15 – 25 ft (5-8 m) thick and in
general, each successive parasequence is thinner than the previous parasequence. In
addition, there is a progressive increase in the proportion of shallower-water facies that
make up successive parasequences. This lithologic interpretation based on a single core
through the E-01 interval from the Meren 75 well, can be interpolat3ed through similar
gamma-ray log patterns across the study area. This log based stacking patterns suggest
that the E-01 interval is a progradational parasequence set.
The progradational signature of the E-01 interval suggests that accommodation
space across the study area was being filled more rapidly than it was being created. Dip-
oriented cross-sections show a decrease in sand thickness and an increase in mud content
basinward within each parasequence and in the entire E-01 interval.
Cook et al. (1999), working on the adjacent Block 1, inferred a possible sequence
boundary at the top of the progradational parasequence set that comprises the E-01
interval. General criteria for the recognition of sequence boundaries include:
1) Evidence of erosional truncation along the sequence boundary.
2) Basinward shift in facies and environments across the sequence boundary.
3) Changes in the parasequence stacking patterns in shallow shelf settings from
progradational parasequences below to the sequence boundary to retrogradational
parasequences above (Taylor and Lovell, 1995; Van Wagoner et al., 1990).

58
Figure 21. Base map showing the study area and the location of the correlation panels
4 54 00 E 4 55 00 E
5 46 00 N MER-75
N A
A’
B
B’ C’
C
D
D’
E’
E’
F’
F
Line of section
Well trajectory
500 m
5 46 00 N
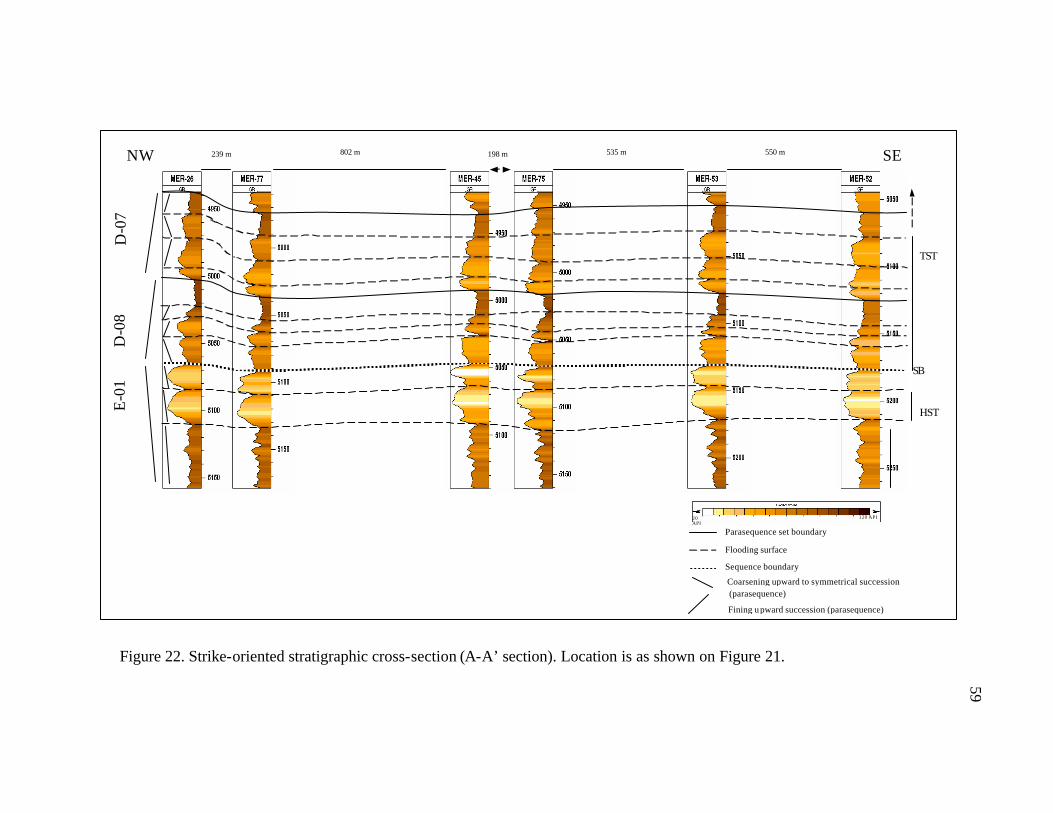
59
Figure 22. Strike-oriented stratigraphic cross-section (A-A’ section). Location is as shown on Figure 21.
HST
SB
TST
802 m 239 m 198 m 535 m 550 m NW SE D
-07
D-0
8 E
-01
20 API 120 API
Parasequence set boundary
Flooding surface
Sequence boundary
Coarsening upward to symmetrical succession (parasequence)
Fining u pward succession (parasequence)

60
Figure 23. Strike-oriented stratigraphic cross-section (C-C’ section). Legend as in Figure 22
NW SE 774 m 906 m 358 m
E-0
1 D
-08
D-0
7
SB
HST
TST

61
Figure 24. Dip-oriented stratigraphic cross-section D-D’. Fining upward parasequences (decreasing gamma-ray) record lower shoreface sandstone overlain by offshore marine shales. Coarsening-upward parasequence (increasing gamma-ray) consists of delta front to upper shoreface sands. Location of wells is shown in Figure 20. Legend as in Figure 22.
853 m 267 m 550 m NE SW E
-01
D
-07
D-0
8
SB
HST
TST

62
Figure 25. Dip-oriented stratigraphic cross-section F-F’.
267 m NE S 480 m
SB
HST
TST
E
-01
D-0
7 D
-08

Because there are no core at the contact between the progradational
parasequences of the E-01 interval and the overlying retrogradational parasequences, the
presence of erosional truncation could not be confirmed. The sequence boundary is based
mainly on the change in stacking patterns from progradational to retrogradational.
D-08 and D-07 Intervals: Retrogradational Parasequence Sets
The overlying D-08 and D-07 intervals are made up of a series of 8 – 10 ft (2.6-3.4
m) thick, succession that consist of lower shoreface sands that fine upward into marine
shale. These upward deepening successions do not follow strict definition of
parasequences (sensu Van Wanoger et al., 1988). Instead, logs through these successions
suggest they have sharp bases that are overlain by sandy intervals that gradually deepen
upwards into marine shale.
Overall, the sandier portions of these fining upward successions are characterized by
very fine- to fine-grained, bioturbated lower shoreface sand facies. Bioturbation intensity
increases upward, as shown in the single core through the D-07 interval from the Meren
77 well (Figure 10a). Overall, the sandier facies in the D-08/D-07 interval have poorer
reservoir quality compared to the coarsening upward progradational parasequences of the
E-01 interval.
Dip oriented correlation panels in Figures 24, 25 shows that the sand intervals
become thinner and shalier distally. The reservoir quality also follows this trend with
more proximal wells penetrating better-developed and higher quality sands in the D-08
and D-07 intervals.
63

SEQUENCE STRATIGRAPHIC INTERPRETATION
Two possible sequence stratigraphic interpretations are presented for the E-01 to
D-07 interval. The limited amount of core data and the relatively small area of
investigation (5 km by 2 km) place serious constraints on stratigraphic interpretations.
Interpretation 1: Falling Stage Systems Tract (FSST) to Transgressive Systems Tract (TST)
Falling Stage Systems Tract (FSST)
In this interpretation, the E-01 interval is interpreted as a falling stage systems
tract (or FSST; Posamentier and Morris, 2000). The falling stage systems tract is the
same as the forced regressive wedge or forced regressive systems tract (Hunt and Tucker,
1992). These deposits are also referred to as being part of the late highstand systems tract
(Van Wagoner, 1995).
The falling stage systems tract forms during eustatic sea level fall (forced
regression) and is characterized by a high-rate of progradation, as possibly represented by
the coarsening upward succession of shoreface and delta front facies in the E-01 interval.
Gamma-ray logs from the E-01 interval indicate that the stack of parasequences locally
coarsens upward and each successive parasequence becomes thinner upward. The larger
overall grain size in the E-01 relative to the transgressive D-08 to D-07 intervals may be
due to cannibalization and winnowing of the earlier deposited highstand strata and
potentially increased gradients updip, which would have allowed fluvial systems to
64

deliver coarser sediments during falling sea- level to the Meren field location (Figures 26,
27). (Posamentier and Morris, 2000).
Sequence Boundary
If the E-01 interval represents a falling stage systems tract, then a conventional
sequence stratigraphic approach demands that a sequence boundary should be found
above it. The sequence boundary may represent a surface of subaerial exposure in updip
areas. Marine deposits above the sequence boundary record the transgressive deposits, or
transgressive systems tract, of the next depositional sequence.
A sequence boundary is inferred at the top of the E-01 interval (Figures 26, 27) based
largely on gamma-ray log patterns, because no cores have been cut across this contact.
Thus, the upward-shallowing facies trends and thinning upward stratal patterns that
suggest the E-01 interval is a falling stage systems tract can also be used to infer a
sequence boundary exits at the top of this progradational package. The abrupt transition
to shaly facies above the E-01 interval may record the basal deposits of the overlying
transgressive systems tract (TST).
Transgressive Systems Tract (TST)
The transgressive systems tract is interpreted to form during the maximum rate of
relative of sea- level rise. With each successive parasequence, the shoreline backsteps in a
landward direction until the point of maximum marine flooding is reached. After the
formation of the maximum flooding surface, the first parasequence of the overlying
65

highstand systems tract begins to prograde seaward and downlap across the maximum
flooding surface (Vail, 1987).
For most locations that are generally in a mid-shelf position, parasequence-stacking
pattern in transgressive systems tracts should record an overall fining and thinning
upward trend on gamma-ray logs. Individual parasequences may coarsen upward.
Deposition of the D-08 interval marks the onset of a longer-term increase in
accommodation that followed the deposition of the E-01 interval. As accommodation
increased, the D-08 and D-07 intervals (and additional sands above them, up to the base
of the D-06B interval) were deposited as a series of large-scale retrogradational
parasequence sets. These intervals consist of offshore shale and shoreface sands with
relatively poor sorting compared to the underlying highstand sands of the E-01 interval.
There is also a progressive increase in shaliness within the later deposits of the
transgressive systems tract. This is evident in the lower resistivity readings from the D-07
interval and overlying D-06 and D_06B sands relative to the E-01 interval.
66

Figure 26. Depositional strike-oriented stratigraphic cross-section of the E-01 to D-07 sands. The E-01 interval have a progradational
stacking pattern and are interpreted as falling stage systems tract. A sequence boundary exists at the top of the E-01 sand and is overlain by upward-fining transgressive systems tract.
625 m 546 m 654 m 527 m 476m NW SE
SB
Lower shoreface / Deltaic
Offshore marine
Upper shoreface
Sequence Boundary Parasequence Set Boundary
FSST
TST
E-0
1 D
-08
D-0
7
400 m 50 ft
67

Figure 27. Depositional dip-oriented stratigraphic cross-section of the E-01 to D-07 intervals. The lower two parasequences have a progradational stacking pattern and are interpreted as highstand systems tract. A sequence boundary exists near the top of the E-01 sand and is overlain by upward fining transgressive systems tract
Lower shoreface / Deltaic Offshore marine Upper shoreface Sequence Boundary Parasequence Set Boundary
662 m 290 m 435 m
SB
FSST
TST
SSE NNE
E-0
1 D
-08
D-0
7
400 m
50 ft
68

69
Interpretation 2: Highstand Systems Tract (HST) to Transgressive Systems Tract
(TST)
Highstand Systems Tract (HST)
Highstand systems tracts associated with siliciclastic shelf settings are
characterized by progradational parasequences (Van Wagoner et al., 1987). This systems
tract is interpreted to form when the rate of relative sea- level rise is decreasing rapidly
and beginning to turn around.
The E-01 interval is made up of two parasequences (three towards the
southeastern end of the study area). The lower part of the E-01 can be interpreted as a
highstand systems tract (HST) because it consists of stacked, coarsening upward
progradational parasequences that prograded to the southwest. Gamma-ray logs from
this interval indicate that the stack of parasequences locally coarsens upward and each
successive parasequence becomes thinner upward. Both of these characteristics are
indicative of highstand systems tracts from shallow shelf settings.
Sequence Boundary and Possible Incised Valley Fill
If the lower part of the E-01 interval represents a highstand systems tract, then a
conventional sequence stratigraphic approach demands that a sequence boundary should
be found above it. The sequence boundary may represent a surface of subaerial exposure
in updip areas. Local incised valleys can develop along the sequence boundary in updip
areas as base- level falls and fluvial systems can then cut downward into the underlying

70
strata of the previous highstand systems tract (Van Wagoner et al., 1990). Marine
deposits above the sequence boundary record the transgressive deposits, or transgressive
systems tract, of the next depositional sequence.
A sequence boundary at the base of the upper parasequence in the E-01 interval
(Figures 28, 29) is inferred based largely on gamma-ray log patterns and the presence of
a ravinement surface in the core through this interval in MER-75 well. The shallowing
upward facies trends and thinning upward stratal patterns the below this surface in the E-
01 interval can also be used to infer a sequence boundary exits at the top of this
progradational package. The abrupt transition to shaly facies above this surface may
record the basal deposits of the overlying transgressive systems tract (TST).
Although no direct evidence for subaerial exposure or fluvial incision along the
sequence boundary is available, two wells (Meren 46 and 52) penetrated a lower E-01
sandy unit with a “blocky” gamma-ray log character. This log signature suggests the
presence of possible valley-fill deposits, which might be lowstand fluvial or
transgressive valley-fill deposits in incised valleys that were cut into the underlying E-01
highstand systems tract. If this interpretation is correct, the sequence boundary in these
wells should underlie these valley fill sands (Figures 28, 29).
Transgressive Systems Tract (TST)
Similar to the first possible interpretation, the D-08 and D-07 intervals are part of a transgressive
systems tract; however in this interpretation the upper parasequence in the E-01 interval is considered part
of the transgressive systems tract.

71
Implications for Reservoir Performance
Though two possible sequence stratigraphic models have been presented, no
significant difference in reservoir behavior is expected due to the sand on sand
juxtaposition between the highstand and transgressive systems tracts deposits.
The sequence stratigraphic interpretation has highlighted the control sea level on
reservoir rock distribution and quality. The best quality sands are found in the highstand
E-01 interval deposited during rising sea level. The sediments form a progradational
parasequence set that display upward trends of parasequence thinning and increase in
percentage of sand within parasequences. There is a decrease in bedset thickness and
relative sand content form proximal to distal. The transgressive systems tract deposits as
expected have relatively poorer reservoir quality.

72
Figure 28. Strike-oriented stratigraphic cross-section of the E-01 to D-07 sands. Below the sequence boundary the E-01 interval have a progradational stacking pattern and is interpreted as a highstand systems tract and is overlain by fining upwards-transgressive systems tract. Incised valley fill is interpreted in well Mer-46 and thus represents the lowstand systems tract.
E-0
1 D
-08
D-0
7
HST
TST
625 m 546 m 654 m 527 m 476 m NW SE
SB
Lower shoreface / Deltaic
Offshore marine
Upper shoreface
Sequence Boundary Parasequence Set Boundary
50 ft
400 m
IVF

73
Figure 29. Dip-oriented stratigraphic cross-section of the E-01 to D-07 sands. Below the sequence boundary the E-01 interval have a progradational stacking pattern and is interpreted as a highstand systems tract and is overlain by fining upwards-transgressive systems tract. Incised valley fill is interpreted in well Mer-46 and thus represents the lowstand systems tract.
400 m
SB
662 m 290m 435 m
Lower shoreface / Deltaic Offshore marine Upper shoreface
Sequence Boundary Parasequence Set Boundary
Incised Valley
NNE SSE
HST
TST
E-0
1 D
-08
D-0
7
IVF
50 ft

74
RESERVOIR PROPERTIES AND PERFORMANCE
Within the study area, the distributions of specific depositional facies as they fit into
a sequence stratigraphic framework and the amount of cementation control the reservoir
properties.
The available core data were used to calibrate the log data and this provided a
basis for correlation and construction of a sequence stratigraphic framework. The core
and log data were then combined with published data (Poston et al., 1983; Cook et al.,
1999) to interpret the depositional environments for the study intervals. The sandstones
and the associated shales were mapped to evaluate the spatial distribution of reservoir
properties especially as they relate to lateral and vertical changes in facies.
The core data for wells MER-75 and 77 were used as the basis for lithofacies
characterization. The core data were then matched with the log signatures. In some
cases, sandy lithofacies with low gamma-ray value were not the best reservoirs because
of extensive calcite cementation, which is not reflected in the gamma-ray logs.
POROSITY AND PERMEABILITY DISTRIBUTION
The upper shoreface cross-bedded sands have the best porosity and permeability
values measured in any lithofacies at Meren field. The measured porosity ranges
between 29 and 36% and the permeability between 305 and 5,041 md. The porosity and
permeability values reflect better grain sorting, limited amounts of clay within pore

75
throats and spaces, fewer mudstone layers and other permeability barriers, and absence
of calcite cementation in this facies.
Lower shoreface fine-grained calcite-cemented bioturbated sandstone (lower
shoreface facies) have the poorest porosity and permeability with measured porosity
values between 19 to 32% and permeabilities as low as 19.5 md. Calcite cements in
bioturbated sandstone facies, especially in the top 10 ft of the D-07 interval, have
significantly reduced the porosity and permeability of these facies.
Factors affecting sandstone reservoir heterogeneity include (cf. from Weber, 1986;
Schenk, 1988, 1992):
1. The geometry of the sandstone bodies (e.g., lens-shaped, tabular, lobate).
2. Mudstone layers and other low-permeability baffles that direct or obstruct flow of
fluids through the sandstone bodies.
3. Vertical and lateral distribution of permeable and impermeable facies and the
interlayering of these facies
4. Primary sedimentary structures that affect small-scale permeability structure in
larger-scale sand bodies.
5. Effects of post-depositional processes, such as compaction, cementation, and mineral
dissolution, on porosity and permeability preservation, destruction, and
enhancement.
Reservoir quality in the Meren sands is a product of original depositional process,
stratigraphic architecture, and diagenesis. This section discusses the relative influences

76
of these factors on porosity and permeability distribution and development within the E-
01 to D-07 intervals.
Many of the sandy lithofacies within the E-01 to D-07 intervals are flow units.
Ebanks (1987) defined a flow unit as "a volume of rock subdivided according to
geological and petrophysical properties that influence the flow of fluids through it."
Porosity vs. permeability cross-plots (Fig 30) for various lithofacies at Meren field
shows the considerable range of petrophysical values for the E-01 to D-07 intervals.
Porosity and permeability measurement for the D-07 interval was taken at about every
foot while there are selective measurements in the E-01 interval. This selective sampling
in the E-01 interval may also cause an increase in the average porosity and permeability
values in this interval if the cleaner portions of the interval were sampled.

77
Figure 30. (A). Core porosity vs. permeability plot as a function of lithofacies in the E-01 interval. (B) Core porosity vs. permeability plot in the D-07 interval. Note the effect of calcite cementation on porosity and permeability.
MER 75 E-01 IntervalCore Porosity vs Permeability
15.0
20.0
25.0
30.0
35.0
40.0
1 10 100 1000 10000
Permeability
Poro
sity
Laminated sandstone
Cross-bedded sandstone
Massive sandstone
Muddy sandstone
MER 77 D-07 IntervalPorosity vs Permeability
15.0
20.0
25.0
30.0
35.0
40.0
10 100 1000 10000
Permeability
Poro
sity Poorly cemented bioturbated
sandstoneMuddy Sandstone
Calcite Cemented Bioturbatedsandstone

78
REGRESSION ANALYSIS
The integration of core and log data enables the development of an algorithm to
relate core porosity and permeability to log measurements. Core-to-log shift were
applied, a 4 ft shift was applied in the MER-77 well while a 14 ft shift was applied in
MER-75. Cross-plots of core measurements and various log measurements were
constructed to determine which log measurement correlates best to the core porosity and
permeability measurements. Regression analysis was used to determine the relationship
between the core measurements and log data. The goodness of fit, R2 was determined
with higher values indicating that the model fits the data better. R2 is computed from the
sum of the squares of the distances of the points from the best- fit curve determined by
nonlinear regression.
A cross-plot of core porosity and core permeability for the D-07 interval reveals
an excellent correlation between these two parameters (Figure 31) with a goodness of fit,
R2 value of 0.92. Log-derived effective porosity (PHIE), gamma-ray and bulk density
logs were cross-plotted against the core data to determine which of the log properties
relate best to the actual core measurements (Figure 32, 33). The bulk density
measurements were found to correlate best with the core measurements, with a R2 value
of over 0.85. The regression line equation was used to derive porosity and permeability
from bulk density measurements. The derived porosity and permeability values correlate
well with the actual core data (Figures 32, 33).

79
Figure 31. (A) Cross plot of core porosity and permeability from the D-07 interval in MER-77 well. There is excellent correlation between core porosity and permeability. R2 = 0.92. (B). Log derived permeability and core permeability the D-07 interval in MER-77 well. Data show very good fit between log-derived permeability and core permeability. R2 = 0.82

80
Figure 32. (A) Plot of core and log-derived effective porosity versus depth in the D-07 interval with gamma ray as the discriminator (B) Plot of core and log-derived effective porosity versus depth in the D-07 interval with RHOBI as the discriminator. The log-derived PHIE consistently under-predic ts the porosity by as much as 9 porosity units. There is wide scatter in porosity in intervals with gamma ray ranging between 56 and 88 ° API units. R2= 0.87. RHOB correlates well with porosity.

81
Figure 33. Log-derived porosity and core porosity in the D-07 interval in MER-77 well. Data shows very good fit between log-derived porosity and core porosity. R2 = 0.88.

82
The same procedure was carried out on the E-01 interval (Figures 34 - 36). Again
the bulk density log correlated best with the core measurements. The goodness of fit (R2)
between the core-derived porosity and permeability and core measurements were greater
than 0.8 in both cases.
The gamma-ray is not a reliable indicator of porosity and permeability. This is
mainly because the gamma-ray log is unable to detect calcite cementation in the sands,
which have significant effects on porosity and permeability. Gamma-ray logs are also
poor indicators of porosity and permeability in shaly sands, especially in the bioturbated
sandstone lithofacies, where extensive bioturbation has destroyed all primary
sedimentary structures and completely mixed the clay with the sands. The neutron
porosity log also is an unreliable indicator of porosity and permeability. The PHIE log
also gave pessimistic porosity estimates especially in the shaly D-08 and D-07 intervals
probably because the shale effect was not properly corrected for in the intervals.
An algorithm was developed to obtain porosity and permeability from bulk
density readings. A comparism of the different log measurements, core and log porosity
and the bulk-density derived porosity and permeability for the MER-75 and MER-77
wells are shown in Figures 37and 38.
The equation for the derivation of porosity from RHOB log measurements is of
the form y= a + bx
Where a = 135; b = 50 and x = rhob value
A plot of the measured porosity vs predicted porosity gave a R2 value of 0.87 in
MER-77 (D-07 interval) and 0.83 in the MER-75 (E-01 interval).

83
The equation for deriving permeability using RHOB is
y = a10^ (bx)
Where a = 6x10¹⁵; b = -6.2 and x = rhob value
A plot of the measured porosity vs predicted porosity gave a R2 value of 0.84 in
MER-77 (D-07 interval) and 0.87 in the MER-75 (E-01 interval).
The bulk density values were used directly in the derivation of porosity. The more
traditional method of first calculating density porosity from bulk density using the
equation,
φdensity = (ρma - ρb) / (ρma - ρf)
where φdensity is density porosity (decimal percent),
ρma is matrix density (grams per cubic centimeter; g/cc),
ρb is bulk density (g/cc), and
ρf is fluid density (g/cc).
was not used so that a single equation can be used irrespective of the matrix and fluid
densities.
Porosity derived from bulk density correlates better with core porosity than the
effective porosity, especially in the shaly D-08 and D-07 intervals as effective porosity is
derived using a combination of neutron and density readings. The density tool is much
more accurate and usually less affected by borehole conditions than the neutron tool
(Alfred et al., 2002). It is also especially useful in intervals with calcite cementation, as
the density tool is able to detect the presence of calcite cement that significantly reduces

84
porosity and permeability. The excellent correlation between core porosity and
permeability allows the derivation of permeability also form bulk density.
The same equation works well for both the E-01 and the D-07 intervals. R2 from
plots of core measurements vs. derived measurements is over 0.83. The limitations to the
application of the porosity and permeability predictor includes: (1) drastic change in
fluid density and (2) non- linear relationship between porosity and permeability.

85
Figure 34. (A) Cross-plot of core porosity and permeability with bulk density as the discriminator. R2 = 0.95. (B) Cross-plot of PHIE and core porosity; R2 = 0.62.

86
Figure 35. (A) Cross-plot of PHIE and core permeability. R2 = 0.77. (B). Cross-plot of RHOB and core porosity. R2 = 0.82 indicating very high correlation between porosity and bulk density.

87
Figure 36. (A). Cross-plot of core porosity and log-derived porosity. R2 = 0.85. (B). Cross-plot of log-derived permeability from RHOB and core permeability. R2 = 0.85
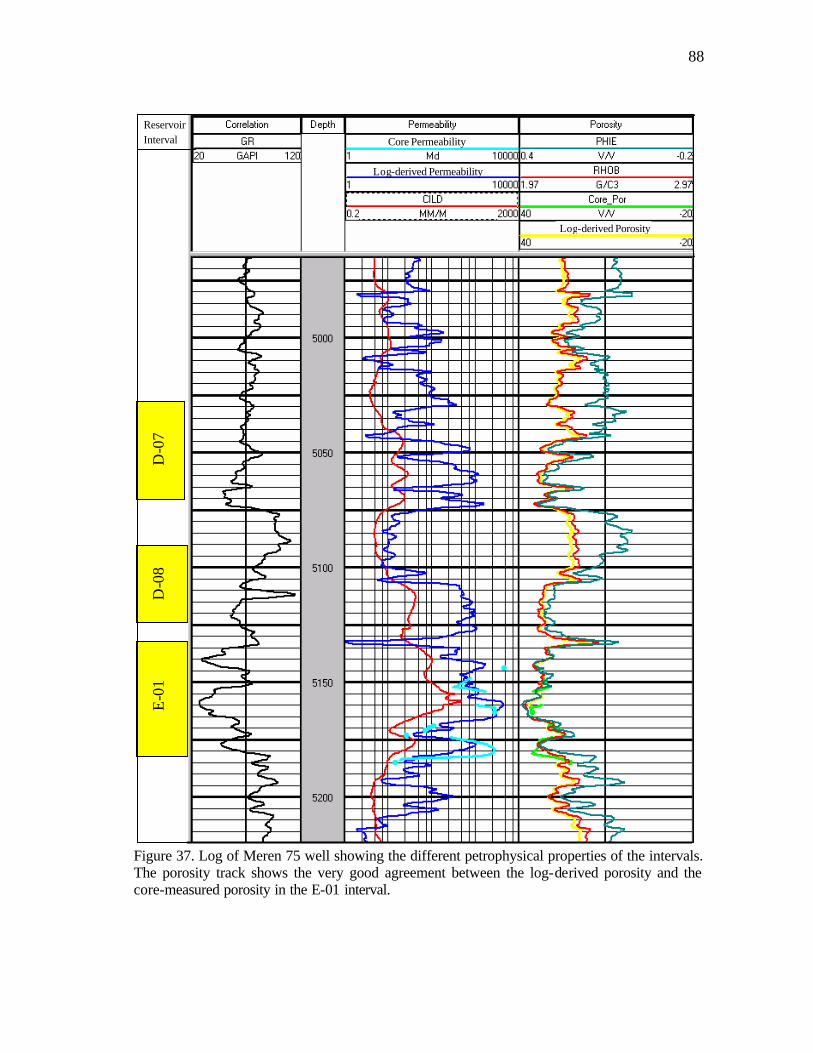
88
Figure 37. Log of Meren 75 well showing the different petrophysical properties of the intervals. The porosity track shows the very good agreement between the log-derived porosity and the core-measured porosity in the E-01 interval.
E
-01
D
-08
D-0
7
Reservoir Interval Core Permeability
Log-derived Permeability
Log-derived Porosity

89
Figure 38. Log of MER-77 well showing the different petrophysical properties of the intervals. Note the excellent correlation between the core measurements and the log-derived porosity and permeability in the D-07 interval.
Reservoir Interval
D
-07
D -0
8
E-0
1 Core Permeability
Log-derived Permeability

90
CONCLUSIONS
In this study, geological information was combined with petrophysical data to
carry out the sequence stratigraphic interpretation and reservoir characterization of the
D-07, D-08 and E-01 intervals in Block 2 Meren field, Niger Delta. Conclusions from
this study are:
1. Seven depositional facies were identified in the studied interval, based on
lithology, sedimentary structures, trace fossils, and wireline log character. The most
abundant lithofacies are: (1) locally calcite-cemented highly-bioturbated, fine-grained
sandstones, locally calcite-cemented (middle to lower shoreface facies); (2) cross-
bedded, fine- to medium-grained well-sorted sandstones (upper shoreface facies); (3)
horizontal to sub-horizontal laminated, very-fine-to fine-grained sandstone (delta front
facies); (4) massive very-fine-to fine-grained poorly-sorted sandstone (delta front
facies); (5) muddy silt-to fine-grained wavy-bedded sandstone (lower shoreface facies);
(6) very-fine- to fine-grained sandy mudstone sandstone (lower shoreface facies); and
(7) massive, silty shales (offshore marine facies). Depositional environment for all
lithofacies facies ranges from upper shoreface to offshore marine.
2. There is a strong relationship between lithofacies, depositional environment,
and petrophysical properties. The lithofacies with the highest measured core porosity
and permeability values is the cross-bedded, well-sorted, upper-shoreface sands with
average porosity and permeability of 32% and >1,500 md, respectively. The poorest
quality reservoir sands are those of the calcite-cemented lower shoreface facies with
average porosity and permeability of 25 and 100 md.

91
3. The study interval is made up of one progradational parasequence set (the E-
01 interval) and two retrogradational parasequence sets (the D-08 and D-07 intervals).
The upward shallowing progradational parasequence set was deposited in delta front to
upper shoreface environments whereas the fining upward retrogradational parasequences
sets are made up of very-fine-to fine-grained sands and shale deposited in middle
shoreface to offshore marine depositional environments. Log correlations show that the
parasequence sets are identifiable across the entire block and probably into adjacent
blocks.
4. Two possible sequence stratigraphic interpretations are suggested. In the first
interpretation, the E-01 interval is inferred to be a highstand systems tract, and the D-08
and D-07 intervals to be the basal part of the transgressive systems tract in the next
depositional sequence. The second interpretation suggests that the E-01 interval is a
falling stage systems tract. More regional well control is necessary to validate either of
these interpretations
5. The best reservoir quality sands are found in the progradational E-01 interval.
6. Comparison of core porosity and effective porosity (PHIE) log values for the
D-07 and D-08 intervals shows that the PHIE log grossly underestimates the actual
porosity values by as much as nine porosity units. Bulk density logs are the best
predictor of petrophysical property with R2 values greater than of 0.8. The gamma-ray
log, while indicative of the amount of shaliness and depositional energy, is unable to
capture the post-depositional processes that affect reservoir quality.

92
The relatively low resistivity readings in the D-07 and the D-08 intervals are due
to a combination of clay content and the presence of conductive siderite nodules.
Though the gamma-ray log suggests high shale/clay content, extensive bioturbation in
these lower shoreface reservoirs have actually created an increase in the porosity and
permeability through the homogenization of the clay and sand laminations.
7. An algorithm was developed to estimate porosity and permeability from log
measurements. Various logs were investigated, but the bulk density log was shown to be
the best predictor of porosity and permeability. This has particular application in un-
cored wells and provides an alternative to gamma-ray logs for estimating reservoir
potential. Shaly reservoirs such as the D-08 and D-07 intervals could be more accurately
evaluated at Meren field and possibly elsewhere in the Niger Delta using this bulk
density/ porosity-permeability relationship to determine the productivity of these
reservoirs.

93
REFERENCES CITED
Alfred, D., Putra. E. and Schechter D. S., 2002, Transcending conventional log interpretation-a more effective approach for the Spraberry trend area: 2002 Naturally Fractured Reservoir Conference, Oklahoma City, Oklahoma, 3-4 June 2002, 8p.
Allen, J. R. L., 1965, Late Quaternary Niger Delta, and adjacent areas-sedimentary environments and lithofacies: AAPG Bulletin, v. 49, p. 547-600.
Avbovbo, A.A., 1978, Tertiary lithostratigraphy of Niger Delta: AAPG Bulletin, v. 62, p. 295-306. Boyles, J.M. and A. J. Scott, 1981, Depositional systems, Upper Cretaceous Mancos
Shale and Mesaverde Group, northwestern Colorado: Field trip guidebook, Rocky Mountain Section of SEPM, Part I, p. 1-82.
Brown, L.F., and W.L. Fisher, 1977, Seismic-stratigraphy interpretation of depositional systems: examples from Brazil rift and pull-apart basins, in C. E. Payton, ed., Seismic stratigraphy-applications to hydrocarbon exploration: AAPG Memoir 26, p. 213-248.
Bustin, R.M., 1988, Sedimentology and characteristics of dispersed organic matter in Tertiary Niger Delta: origin of source rocks in a deltaic environment: AAPG Bulletin, v. 72, p. 277-298.
Catuneanu, O., Willis, A.J., and Miall, A.D., 1998. Temporal significance of sequence boundaries: Sedimentary Geology, v 121, p. 157–178.
Cole, R.D. and C.E. Mullen, 1992, Sedimentological reservoir characteristics of Tensleep Sandstone: Wyoming Geological Association 4th Annual Field Conference guidebook, p. 121-137.
Coleman, J.M., and Prior D.B., 1981, Deltaic environments of deposition, in Scholle, P. A., and Spearing, D., eds., Sandstone depositional environments: AAPG Memoir 31, p. 139-178.
Cook G., A. Chawathé, D. Larue, H. Legarre, and E. Ajayi, 1999, SPE 51892 Incorporating sequence stratigraphy in reservoir simulation: An integrated study of the Meren E-01/MR-05 sands in the Niger Delta, 1999 SPE Reservoir Simulation Symposium, Houston, Texas, 14–17 February 1999.

94
Doust, H., and E. Omatsola, 1990, Niger Delta, in J.D. Edwards and P.A. Santagrossi, Eds., Divergent/passive margin basins: AAPG Memoir 45, p. 201-238.
Ebanks, W.J., Jr., 1987. Flow unit concept - integrated approach to reservoir description for engineering projects (abs.): AAPG 1987 Annua l Meeting, Los Angeles, CA.
Ejedawe, J.E. 1981, Patterns of incidence of oil reserves in Niger Delta basin: AAPG Bulletin, v. 65, p. 1574-1585.
Ejedawe, J.E., Coker, S.J.L., Lambert-Aikhionbare, D.O., Alofe, K.B., and Adoh, F.O., 1984, Evolution of oil-generative window and oil and gas
occurrence in Tertiary Niger Delta Basin: AAPG, v. 68, p. 1744-1751. Ekweozor, C.M., and E.M. Daukoru, 1984, Petroleum source-bed evaluation of Tertiary
Niger Delta-reply: AAPG Bulletin, v.68, p. 390-394.
Evamy, B.D., J. Haremboure, P. Kamerling, W.A. Knaap, F.A. Molloy, and P.H. Rowlands, 1978, Hydrocarbon habitat of Tertiary Niger Delta: AAPG Bulletin, v. 64, p. 59-66.
Fisher, W. L., and J. H. McGowen, 1967, Depositional systems in the Wilcox Group of
Texas and their relationship to occurrence of oil and gas: Transactions of the Gulf Coast Association of Geological Societies, v. 17, p. 105-125.
Frankl, E.J., and E.A. Cordy, 1967, The Niger Delta oil province- recent developments
onshore and offshore: Mexico City, 7th World Petroleum Congress Proceedings, v. 1B, p. 195-209.
Frey R. W and Pemberton S. G., 1984, Trace fossil facies models in R.G. Walker ed., Facies models; Geoscience Canada, p. 189-208.
Galloway, W.E., 1998, Siliciclastic slope and base-of-slope depositional systems:
component facies, stratigraphic architecture, and classification: AAPG Bulletin, v. 82, p. 569-595.
Haack, R.C., Sundararaman, P., and Dahl, J., 1997, Niger Delta petroleum system, in, extended abstracts, AAPG/ABGP Hedberg Research Symposium, Petroleum Systems of the South Atlantic Margin, November 16-19, 1997, Rio de Janeiro, Brazil.
Higley, D. K., Micheal P.P., R.M. Slatt, 1997, 3-D Reservoir characterization of the House Creek Oil Field, Powder River Basin, Wyoming. (V1.00) United States Department of the Interior, USGS DDS-33.

95
Hunt, D.W. and Tucker, M.E. (1992). Stranded parasequences and the forced regressive wedge systems tract: deposition during base- level fall: Sedimentary Geology 81, p. 1-9.
Jervey, M.T., 1988, Quantitative geological modeling of siliciclastic rock sequences and
their seismic expression: in Wilgus, et al, eds., Sea- level changes: An integrated approach, SEPM Special Publication No. 42, p. 47-69.
Jev B. I., C., H. Kaars-Sijpesteijn, M. P. A. M. Peters, N. L. Watts and J. T. Wilkie,
1993, Akaso Field, Nigeria : Use of integrated 3-D seismic, fault slicing, clay smearing, and RFT pressure data on fault trapping and dynamic leakage. AAPG Bulletin, v. 77, p 1389-1404.
Kaplan, A., Lusser, C.U., Norton, I.O., 1994, Tectonic map of the world, panel 10, scale 1:10,000,000: AAPG, Tulsa, Oklahoma.
Kerans C and S.W. Tinker, 1997, Sequence Stratigraphy and Characterization of
Carbonate Reservoirs: SEPM Short Course Notes No. 40 129p.
Knox, G.J., and E.M. Omatsola, 1989, Development of the Cenozoic Niger delta in terms of the “escalator regression” model and impact on hydrocarbon distribution, in W.J.M. van der Linden et al., eds., 1987, Proceedings, KNGMG Symposium on Coastal Lowlands, Geology, Geotechnology: Dordrecht, Kluwer Academic Publishers, p. 181-202.
Lambert-Aikhionbare, D.O. 1982, Relationship between diagenesis and pore fluid
chemistry in Niger delta oil-bearing sands: Journal of Petroleum Geology, v. 4, p. 287-298.
McAfee 1994: Sedimentological analysis of core from Well Meren-75 Nigerian Niger Delta Complex. Chevron Nigeria Limited, Lagos, Nigeria, Unpublished.
McCubbin, D.G., 1982. Barrier Island and strand-plain facies. in P.A. Scholle and D. Spearing eds., Sandstone depositional environments. AAPG Memoir 31, p. 247-279.
McHargue, T., Diedjomahor J., Arowolo I., Hobbet R., and V. Onyia, 1993, Abstract, Application of sequence stratigraphy to neritic sediments of the Niger Delta, AAPG International Conference, The Hague, Netherlands October 17-20, 1993 p. 1647.
Mitchum, R.M. & Van Wagoner, J.C., 1991. High frequency sequences and their stacking patterns: sequence stratigraphy evidence of high frequency eustatic cycles: Sedimentary Geology, v. 70, p. 131-170.

96
Mitchum, R.M. Jr., 1977, Seismic stratigraphy and global changes of sea- level, Part II Glossary of terms used in seismic stratigraphy. in C.E. Clayton ed., Seismic stratigraphy -application to hydrocarbon exploration: AAPG Memoir 26, p. 49-212.
Moslow, T. F., and Pemberton, S. G., 1988, An integrated approach to the
sedimentological analysis of some Lower Cretaceous shoreface and delta front sandstone sequences, in D. P. James, and D. A. Leckie, eds., Sequences, stratigraphy, sedimentology: surface and subsurface: Canadian Society of Petroleum Geologists Memoir, v. 15, p. 373-386.
Moslow, T. F., and Tillman, R. W., 1986, Sedimentary facies and reservoir characteristics of Frontier Formation sandstones, southwestern Wyoming, in C. W. Spencer and R. F. Mast, eds., Geology of tight gas reservo irs: AAPG Studies in Geology 24, p. 271-311.
Nadon, G.C., J.A. Simo, R.H. Dott, Jr., and C.W. Byers, 2000, High-resolution sequence stratigraphic analysis of the St. Peter Sandstone and Glenwood Formation (Middle Ordovician), Michigan Basin, U.S.A. AAPG Bulletin, v. 84, p. 975–996.
NEDECO (Netherlands Engineering consultants), 1959, River studies and recommendations on improvement of Niger and Benue. North-Holland Publishing Co., Amsterdam.
Oomkens, E., 1974, Lithofacies relations in late Quaternary Niger Delta complex: Sedimentology, v. 21, p. 195-222.
Orife, J.M., and A. A. Avbovbo, 1981, Stratigraphic and unconformity traps in the Niger delta (abs.): AAPG Bulletin, v. 65, p. 967.
Petroconsultants, 1996, Petroleum exploration and production database: Houston, Texas, Petroconsultants, Inc., [database available from Petroconsultants, Inc., P.O. Box 740619, Houston, TX 77274-0619].
Plint, A.G. & Nummedal, D., 2000 The falling stage systems tract: Recognition and importance in sequence stratigraphic analysis; in D. Hunt and R.L.G. Gawthorpe eds., Sedimentary responses to forced regressions, Geological Society of London, Special Publication, v. 172, p. 1-17.

97
Posamentier, H.W., Jervey, M.T., and Vail, P.R., 1988. Eustatic controls on clastic deposition, I. Conceptual framework; in Wilgus, C.K., Hastings, B.S., Ross, C.A., Posamentier, H.W., Van Wagoner, J., and Kendall, C.G.St.C. eds., Sea-level changes-An integrated approach: Society of Economic Paleontologists and Mineralogists Special Publication 42, p. 109-124.
Posamentier, H.W., and Vail, P.R., 1988, Eustatic controls on clastic deposition II— sequence and systems tract models, in Wilgus, C.K., Hastings, B.S., Kendall, C.G.S.C., Posamentier, H.W., Ross, C.A., and Van Wagoner, J.C., eds., Sea- level changes-An integrated approach: Society of Economic Paleontologists and Mineralogists Special Publication 42: Tulsa, Oklahoma, , p. 125-154.
Posamentier, H.W., and Allen, G.P., 1999, Siliciclastic sequence stratigraphy: Concepts and applications: SEPM Concepts in Sedimentology and Paleontology #7, Tulsa Oklahoma.
Posamentier H.W., and W.R. Morris, 2000, Aspects of the strata architecture of forced regressive deposits, in Hunt, D. And Gawthorpe, R.L., eds., Sedimnentary Responses to Forced Regressions. Geological Society, London, Special Publications, v. 172, p. 19-46.
Poston, S.W., P. Berry, and F.W. Molokwu, 1983, Meren Field- the geology and reservoir characteristics of a Nigerian offshore field: Journal of Petroleum Technology, v. 35, p. 2095-2104.
Reijers, T.J.A., Petters, S.W., and Nwajide, C.S., 1997, The Niger Delta Basin, in Selley, R.C., ed., African basins-sedimentary basins of the world 3: Amsterdam, Elservier Science, p. 151 172.
Scheihing M. H. and C.D. Atkinson, 1992, Lithofacies and environmental analysis of clastic depositional systems: Part 6. Geological methods in ME 10: Development geology reference manual, 1992 AAPG Special Publication, p. 263 – 268.
Schenk, C.J., 1988, Sandstone reservoirs, in Magoon, L.B., ed., Petroleum systems of the United States: U.S. Geological Survey Bulletin 1870, p. 41-43.
Schenk, C.J., 1992, Facies, permeability, and heterogeneity in sandstone reservoirs, in Magoon, L.B., ed., The petroleum system-status of research and methods: U.S. Geological Survey Bulletin 2007, p. 35-39.
Short, K.C., and A.J. Stauble, 1967, Outline of geology of Niger Delta: AAPG Bulletin, v.51, p. 761-779.

98
Slatt R. M. and Galloway W. E., 1992, Geological Heterogeneities: Part 6. Geological methods in ME 10: Development geology reference manual, 1992 AAPG Special Publication, p. 278-281
Stacher, P., 1995, Present understanding of the Niger Delta hydrocarbon habitat, in Oti, M.N., and Postma, G., eds., Geology of Deltas: Rotterdam, A.A. Balkema, p. 257-267.
Tanean, H., 1991, Multiscale reservoir characteristics of the Tensleep Formation, South Casper Creek field, Natrona County, Wyoming: M.S. Thesis (T-3827), Colorado School of Mines, Golden, Colorado, 372p.
Taylor D.R. and R.W.W. Lovell, 1995, High-Frequency sequence stratigraphy and paleogeography of the Kenilworth Member, Blackhawk Formation, Book Cliffs, Utah, U.S.A., in Hodgett et al., eds., M 64: Sequence stratigraphy of foreland basin deposits 1995 AAPG Special Publication, p. 257 – 275.
Tissot, B., Pelet, R., and Ungerer, P. (1987). Thermal history of sedimentary basins, maturation indices, and kinetics of oil and gas generation. AAPG Bulletin, v. 71, p. 1445-1466.
Tuttle M.L.W., Charpentier R.R. and Brownfield M.E., 1999, The Niger Delta petroleum system: Niger Delta Province, Nigeria Cameroon, and Equatorial Guinea, Africa, USGS Open-File Report 99-50-H.
Vail, P.R., Audemard, F., Bowman, S.A., Eisner, P.N. and Perez-Cruz, G. 1991, The stratigraphic signatures of tectonics, eustacy and sedimentation: An overview, in A. Seilacher and G. Eisner, eds., Cycles and events in stratigraphy, II, Tubingen: Springer-Verlag.
Van Wagoner, J. C., Mitchum, R. M., and Posamentier H.W: 1987, Seismic
interpretation using sequence stratigraphy: Part 2: Key definitions of sequence stratigraphy in SG 27: Altas of seismic stratigraphy v. 1. 1987 AAPG Special Publication, p. 11-14.
Van Wagoner, J. C., Mitchum, R. M., Campion, K. M., and Rahmanian, V. D.: 1990,
Siliciclastic sequence stratigraphy in well logs, cores and outcrops, AAPG Methods in Exploration Series, 7, AAPG Tulsa, OK.
Van Wagoner, J. C., 1995, Overview of sequence stratigraphy of foreland basin
deposits: Terminology, summary of papers, and glossary of sequence stratigraphy in M 64: Sequence stratigraphy of foreland basin deposits 1995 AAPG Special Publication, p. iii – xxi.
99
Weber, K. J., 1971, Sedimentological aspects of oil fields in the Niger Delta: Geologie en Mijnbouw, v. 50, no. 3, p. 559-576.
Weber, K.J., and E.M. Daukoru, 1975, Petroleum geology of the Niger Delta: Proceeding of the Ninth World Petroleum Congress, Tokyo, v.2, p. 209-221
Weber, K.J., 1986, How heterogeneity affects oil recovery, in Lake, L.W., and Carroll, Jr., H.B., eds., Reservoir characterization: New York, Academic Press, p. 487-544.
Whiteman, A., 1982, Nigeria- its petroleum geology, resources and potential: London, Graham and Trotman, p. 394.
100
VITA NAME : Adegbenga Oluwafemi Esan EDUCATION:
Texas A & M University College Station, Texas M.S., Geology, 2002 Lagos State University Lagos, Nigeria M.B.A., 2000 University of Ibadan Ibadan, Nigeria M.Sc, Mineral Exploration, 1997
University of Ibadan Ibadan, Nigeria B.Sc., Geology, 1991
PROFESSIONAL EXPERIENCE: Chevron Petroleum Technology Center (CPTC) Houston, Texas Research Attaché, June 2001-September 2001
Chevron Nigeria Limited
Lagos, Nigeria Earth Scientist, 1997-Till Date
Ade Sobande & Associates Lagos, Nigeria Environmental Geologist, 1995-1997
Chevron Nigeria Limited Lagos, Nigeria Geologist Trainee, 1991-1992 PERMANENT ADDRESS: 6001 Bollinger Canyon Rd (Chevron Lagos Pouch) San Ramon, California 94583