High-frequency multibeam echo-sounder measurements of ...
10
3 doi:10.3723/ut.30.003 International Journal of the Society for Underwater Technology, Vol 30, No 1, pp 3–12, 2011 Technical Paper High-frequency multibeam echo-sounder measurements of seafloor backscatter in shallow water: Part 1 – Data acquisition and processing Iain M Parnum and Alexander N Gavrilov Centre for Marine Science and Technology, Curtin University, Perth, Western Australia, Australia Abstract Methods for processing multibeam echo-sounder (MBES) bathymetry data are well established, how- ever, there is no universal and established approach to processing and interpretation of MBES backscatter data. The aim of this paper is to (1) detail the different backscatter logging methods implemented in modern high-frequency MBES systems used primarily in shallow water; (2) describe and suggest appropriate methods of data processing; and (3) discuss likely errors and artefacts expected from MBES backscatter processing. These issues are illustrated using data collected with a Reson SeaBat MBES in coastal shelf areas of Australia, although the methods and errors discussed are relevant to other high-frequency shallow-water MBES systems. Production of backscatter mosaics and analysis of backscatter for seafloor classification using MBES data are considered in Part 2 – Mosaic production, analysis and classification (Parnum and Gavrilov, 2011), published alongside this paper. Keywords: multibeam echo-sounder, seafloor back- scatter, remote sensing 1. Introduction Multibeam echo-sounder (MBES) systems have been recognised as one of the most effective tools available to map the sea floor (Kenny et al., 2003). MBES systems are capable of collecting bathymetry and seafloor backscatter data simultaneously from a wide swath of the sea floor at a high spatial resolu- tion. This allows cost-effective mapping of the sea floor including discrimination and classification of different seafloor types (e.g. Hughes Clarke, 1994; Canepa and Pace, 2000; Preston et al., 2001; Bentrem et al., 2006). De Moustier (1986), inter alia, was one of the first to demonstrate the potential of seafloor backscat- ter data collected by MBES systems for seafloor characterisation. Other research works (Kleinrock, 1992; Hughes Clarke et al., 1993; Talukdar et al., 1995; Augustin et al., 1996; Mitchell, 1996) have further developed the methods for processing MBES backscatter data. These methods were developed for, and examined with, primarily low-frequency MBES systems (less than 100kHz), which were most common at that time. Although the basic princi- ples of measuring the seafloor backscatter strength are similar at low and high frequencies, the meas- urement geometry and physical conditions – such as the ratio of insonification and footprint areas compared to the seafloor roughness scale and Rayleigh parameter – are significantly different. More recently, processing and analysis methods pur- posely designed for some modern high-frequency narrow-beam MBES systems have been proposed (Beaudoin et al., 2002; Hellequin et al., 2003; Augustin and Lurton, 2005; Parnum, 2007; Le Bas and Huvenne, 2009; Brown and Blondel, 2009; Kloser et al., 2010). While various methods for processing MBES bathymetry data are well established and imple- mented in the software provided by the sonar man- ufacturers, there is no universal, standard approach to processing and interpreting MBES backscatter data. This is largely due to the different ways modern MBES systems measure and log backscatter data (Beaudoin et al., 2002). Confusion over the different collection methods can lead to processing back- scatter measurements incorrectly. Producing seafloor backscatter characteristics that are not distorted by sonar parameters and/or the way backscatter data are collected is essential for inferring geomorphological and physical prop- erties of the seafloor surface (de Moustier, 1986; Talukdar et al., 1995; Fonseca and Mayer, 2007). Therefore, it is important to know all sonar param- eters relevant to backscatter measurements and the data logging method used in order to apply an appropriate method of backscatter data processing.
-
Upload
khangminh22 -
Category
Documents
-
view
0 -
download
0
Transcript of High-frequency multibeam echo-sounder measurements of ...

3
doi103723ut30003 International Journal of the Society for Underwater Technology Vol 30 No 1 pp 3ndash12 2011
Technic
al P
aper
High-frequency multibeam echo-sounder measurements of seafloor backscatter in shallow water Part 1 ndash Data acquisition and processing
Iain M Parnum and Alexander N GavrilovCentre for Marine Science and Technology Curtin University Perth Western Australia Australia
AbstractMethods for processing multibeam echo-sounder (MBES) bathymetry data are well established how-ever there is no universal and established approach to processing and interpretation of MBES backscatter data The aim of this paper is to (1) detail the different backscatter logging methods implemented in modern high-frequency MBES systems used primarily in shallow water (2) describe and suggest appropriate methods of data processing and (3) discuss likely errors and artefacts expected from MBES backscatter processing These issues are illustrated using data collected with a Reson SeaBat MBES in coastal shelf areas of Australia although the methods and errors discussed are relevant to other high-frequency shallow-water MBES systems Production of backscatter mosaics and analysis of backscatter for seafloor classification using MBES data are considered in Part 2 ndash Mosaic production analysis and classification (Parnum and Gavrilov 2011) published alongside this paper
Keywords multibeam echo-sounder seafloor back-scatter remote sensing
1 IntroductionMultibeam echo-sounder (MBES) systems have been recognised as one of the most effective tools available to map the sea floor (Kenny et al 2003) MBES systems are capable of collecting bathymetry and seafloor backscatter data simultaneously from a wide swath of the sea floor at a high spatial resolu-tion This allows cost-effective mapping of the sea floor including discrimination and classification of different seafloor types (eg Hughes Clarke 1994 Canepa and Pace 2000 Preston et al 2001 Bentrem et al 2006)
De Moustier (1986) inter alia was one of the first to demonstrate the potential of seafloor backscat-ter data collected by MBES systems for seafloor
characterisation Other research works (Kleinrock 1992 Hughes Clarke et al 1993 Talukdar et al 1995 Augustin et al 1996 Mitchell 1996) have further developed the methods for processing MBES backscatter data These methods were developed for and examined with primarily low-frequency MBES systems (less than 100kHz) which were most common at that time Although the basic princi-ples of measuring the seafloor backscatter strength are similar at low and high frequencies the meas-urement geometry and physical conditions ndash such as the ratio of insonification and footprint areas compared to the seafloor roughness scale and Rayleigh parameter ndash are significantly different More recently processing and analysis methods pur-posely designed for some modern high-frequency narrow-beam MBES systems have been proposed (Beaudoin et al 2002 Hellequin et al 2003 Augustin and Lurton 2005 Parnum 2007 Le Bas and Huvenne 2009 Brown and Blondel 2009 Kloser et al 2010)
While various methods for processing MBES bathymetry data are well established and imple-mented in the software provided by the sonar man-ufacturers there is no universal standard approach to processing and interpreting MBES backscatter data This is largely due to the different ways modern MBES systems measure and log backscatter data (Beaudoin et al 2002) Confusion over the different collection methods can lead to processing back-scatter measurements incorrectly
Producing seafloor backscatter characteristics that are not distorted by sonar parameters andor the way backscatter data are collected is essential for inferring geomorphological and physical prop-erties of the seafloor surface (de Moustier 1986 Talukdar et al 1995 Fonseca and Mayer 2007) Therefore it is important to know all sonar param-eters relevant to backscatter measurements and the data logging method used in order to apply an appropriate method of backscatter data processing
Parnum and Gavrilov High-frequency multibeam echo-sounder measurements of seafloor backscatter in shallow water Part 1
4
This paper details the different backscatter logging methods implemented in modern high-frequency MBES systems used primarily in shallow water or carried by remotely operated vehicles (ROVs) or autonomous underwater vehicles (AUVs) It then explains appropriate methods of data processing and discusses likely errors and artefacts expected from MBES backscatter processing The issues to be considered in this paper were investi-gated using several datasets collected with different MBES systems such as the Reson SeaBat 8101 8125 8111 and 7125 and Kongsberg-Simrad EM 3002 over different seafloor types in ten coastal shelf areas around Australia as well as coastal shelves in Italy (De Falco et al 2010) and in China This paper is focused on the methods of backscatter data collec-tion and processing common for those MBES sys-tems rather than seafloor backscatter properties measured in the surveyed areas Therefore two datasets obtained with the Reson SeaBat 8125 from Cockburn Sound and Esperance Bay in Western Australia have been chosen to illustrate the consid-ered issues
2 Operation of multibeam echo-sounder systemsMBESs are usually mounted underneath a vessel or an ROVAUV and emit acoustic pulses of a short length Transmission of the acoustic energy to the sea floor is governed by the beam pattern of the sonar transmit array that is wide across-track (typically 120ndash150deg) and narrow along-track (of the order of 1deg for high-frequency systems)
The receive array is directed perpendicularly to the transmit array and forms a large number of receive beams that are narrow across-track and are steered simultaneously in different across-track directions by a beamforming process Thus the system performs spatial filtering of acoustic sig-nals backscattered from different discrete areas of the sea floor along the swath referred to as lsquobeam footprintsrsquo This provides co-located bathymetry and backscatter measurements made from each beam
Although only one bathymetry measurement is usually made from each sonar ping and beam sev-eral samples of the backscatter intensity can be recorded within the beam The seafloor area that each individual backscatter sample represents is termed the lsquoinsonification arearsquo in this paper Modern shallow-water MBES systems (such as Kongsberg-Simrad EM 3000 and 3002 and Reson SeaBat 8125 and 7125) operate at hundreds of kHz transmit short pulses of several tens of micro-seconds and form hundreds of beams usually less
than 1deg wide MBES systems with such parameters are capable of resolving small features from a few centimetres to a few decimetres wide in the sea-floor relief
The geometry of MBES measurements is illus-trated in Fig 1 Projections of the transmit and receive beams (main lobes of the beam patterns) onto the sea floor are shown by shadowed areas The sonar footprint on the sea floor is formed by the intersection of the two areas The dashed lines show bounds of the seafloor area insonified by a rectangular sonar pulse at a specific time
Fig 1 shows the projection of a single receive beam Within each particular receive beam the echo-sounder observes a seafloor area limited by the intersection of the transmit and receive beam projections ndash ie the beam footprint The area insonified simultaneously on the seafloor that scat-ters the sonar signal back to the receive array is limited by the length of the transmitted pulse It has a ring form with the external and internal radii (r1 and r2 respectively) These radii change with the time (tr) elapsed from the transmission time as shown in Equation 1
r1 = [(Ctr2)2 - D2]12
r2 = Re[(Ctr2 - CT2)2 - D2]12 (1)
where D is the sonar elevation above the sea floor C is the sound speed and T is the transmitted pulse length The insonification area is a circle at tr le 2DC + T when r2 = 0
According to Medwin and Clay (1998) the instantaneous intensity of the backscattered signal can be numerically predicted if the sonar transmit
θ
θ
ϕ
r
R
ϕ
D
x
y
r2
r1
ΦR|z = 0ΦT|z = 0
prime
prime
Fig 1 Geometry of backscatter measurements by an MBES system The shadowed areas illustrate projections of the transmit and receive beams onto the sea floor (only one receive beam is shown)
5
Vol 30 No 1 2011
(FT(θprime ϕprime)) and receive (FR(θprime ϕprime)) beam patterns are known using Equation 2
I tI R R
RrS
r
r
bs
( )=minus( )
( )
times ( )minusintint 0
2
42
22
2
1exp βθ
σ θ θπ
π
ΦT2 primeprime prime prime prime R
2ϕ θ ϕ ϕ( ) ( )Φ rdrd (2)
where sbs(θ) is the surface backscatter coefficient depending on incidence angle (θ) IS is the trans-mitted signal intensity at R0 = 1m from the sonar head and b is the attenuation coefficient of sound in water At relatively short sonar pulses (typically of a few tens of microseconds for high-frequency MBESs) and oblique steering angles the insonifica-tion area is a portion of the beam footprint limited by r1 and r2 as illustrated in Fig 1 For a narrow-beam MBES system with the typical beam width of a few degrees it can be assumed that sbs(θ) and R do not change significantly within the insonifica-tion area Using this assumption Equation 2 can be simplified as shown in Equation 3
I tI R R
R tS tr
S C
C rbs ins r( )
exp( )( )
( )=minus0
2
4
2βσ (3)
where Sins is the insonification area and RC is the slant range to its centre moving with time This approximate equation is commonly used to derive the seafloor backscatter coefficient from the back-scatter intensity measured in each beam of an MBES system
σβbs
r C r
S C ins r
I t R tI R R S t
=( ) ( )
( ) ( )
4
02 2exp
(4)
where lang rang signifies averaging over a series of meas-urements For estimating sbs(θ) the time (tr) is usu-ally chosen so that it corresponds with the two-way travel time of the sonar signal to the centre of the insonification area as estimated from the measure-ment geometry (beam steering angle with vesselrsquos roll offset) and sea depth The insonification area is commonly approximated by a rectangular shape A simple and commonly used equation for calcu-lating the insonification area approximated by a rectangular shape as given in Hellequin et al (2003) is as follows
S = minRϕlTCsin(θ) R 2ϕl sin θt cos θ (5)
where ϕl is the longitudinal (along-track) width of the transmit beam θt is the transverse (across-track) width of the receive beam as specified by the sonar manufacturer and θ is the beam steering angle The minimum function is applied to take into account the case when the footprint transverse width is smaller than r1 - r2 Parnum (2007) suggests a
more complex equation for the insonification area which is more accurate than Equation 5 at near-vertical steering angles of receive beams
S = R 2 ϕl mincos(θ)tan[arc cos(cos θ(1 + TC2R))] - sin(|θ|) sin θt cos θ (6)
The backscatter energy can be calculated by integrating the backscatter intensity (I ) over the duration of the echo signal which is equivalent to integration over the footprint transverse width Consequently the backscatter energy can also be approximated by a simple equation similar to Equation 3
EE R R
RSS C
Cbs FP=
minus02
4
2exp( )βσ (7)
where ES is the energy of the transmitted pulse(a product of the transmitted signal intensity and pulse length) and SFP = R 2ϕl sin θt cos θ is the area of intersection of the beam footprint The seafloor backscatter coefficient (sbs) can be derived from the backscatter energy as in Equation 8
σβbs
C
S C FP
ERE R R S
=4
02 2exp( )
(8)
In practice the acoustic backscatter from the sea floor is commonly characterised in the logarithmic scale by the seafloor backscatter strength (BS =10 log sbs)
3 Methods of logging MBES backscatter dataAll backscatter data collected by MBES systems are derived from the backscatter intensity (I) (Equation 2) or its square root which is an instan-taneous amplitude commonly referred to as a lsquobackscatter envelopersquo To obtain estimates of the seafloor backscatter coefficient and its angular dependence it is essential to know whether it is the backscatter intensity or the amplitude that is logged by the echo-sounder At present there are gener-ally four possible methods for logging backscatter data adopted in the Reson MBES and some other modern MBES systems (eg Kongsberg EM 120 300 and 3000 series) In decreasing data logging size these methods are
bull the whole echo signal (either backscatter enve-lope or intensity) from each beam including the signal backscattered in the water column
bulla fragment of the whole backscatter envelope centred around the bottom detection time in each beam (referred to here as the lsquoseafloor backscatter envelopersquo)
Parnum and Gavrilov High-frequency multibeam echo-sounder measurements of seafloor backscatter in shallow water Part 1
6
bull two sidescan-like time series of backscatter amplitudes created by combining the backscat-ter intensity or envelope from the port and starboard beams (referred to here as lsquosidescan datarsquo) and
bullone backscatter value per beam from within each seafloor backscatter envelope Some of the mod-ern Reson MBES systems log the peak amplitude of the seafloor backscatter envelopes received in each beam while some other MBES systems record other derivatives from the backscatter envelopes
This section explains the differences between these methods and discusses the selection of the most appropriate logging method for specific surveys
31 Whole backscatter envelopeRecording of the whole backscatter envelope is implemented in several modern MBES systems such as the Reson 8125 and 7125 (these data are called lsquosnapshotsrsquo in the Reson data collection soft-ware) Logging of the whole echo signal for each beam including both the amplitude (shown in Fig 2) and phase is useful for some applications related to the water column such as fisheries acous-tics (Parsons et al 2006) the study of internal waves (Trevorrow 2005) and sediment transport (Best et al 2010) However for seafloor mapping it is not necessary to log the whole of the backscatter echo
Moreover the amount of data to be logged increases significantly when recording the echo sig-nal from both the water column and the sea floor which may result in a considerable reduction of the maximum possible ping rate For instance the
Reson 8125 system was capable of logging the whole backscatter envelope only from one of every five sonar pings (Parsons et al 2006) Recent improve-ments in data logging and computer processing speed allow this problem to be overcome in some state-of-the-art MBES systems such as the Reson 7125 (Parsons et al 2007)
32 Seafloor backscatter envelopesSeafloor backscatter envelopes which are called lsquosnippetsrsquo in the Reson data collection software are fragments of the whole backscatter envelope that are selected to contain the echo from the sea floor in each beam (Fig 3) The start sample of each sea-floor backscatter envelope in the whole backscatter echo (the lsquofragment offsetrsquo) and the length of each fragment are predetermined by the sonar processor based on the bottom detection range and estimates of the slant range to the inner and outer edges of the beam footprint on the sea floor (Reson 2002) This is usually done assuming a flat bottom model for each individual sonar ping Occasionally the length of the fragments chosen by the MBES hard-ware is not large enough to contain the whole echo from the sea floor Inadequate fragment length occurs more in the outermost beams than the inner beams as the seafloor echo length gets longer as incidence angle increases (Parnum 2007)
33 Sidescan dataWhen recording in the sidescan mode the MBES system combines backscatter signals received along
Sea floor
Fish school
Seafloor backscatterfrom beam side-lobes
Fig 2 An example of a whole backscatterenvelope from one sonar ping of a Reson Seabat 8125 MBES The backscatter level is shown in dB via a reference signal level in sonar analog-to-digital converter (ADC) units (ie not corrected for full MBES system gain)
(a)
(b)
750 800 850
05
1
15
2
25 x 104
Am
plitu
de
750 800 850
05
1
15
2
25 x 104
Sample number
Am
plitu
de
Beam 21Beam 22Beam 23Beam 24
Beam 21Beam 22Beam 23Beam 24Sidescan
Complete beam time series frombeams 21ndash24 and sidescan
Seafloor backscatter envelopes frombeams 21ndash24
Fig 3 Comparison of different backscatterdata logged by MBES systems (a) 100 sample fragments of the whole backscatter envelopes and a sidescan-like trace synthesised from these envelopes and (b) seafloor backscatter envelopes cut out from the whole echo
7
Vol 30 No 1 2011
adjacent beams by stitching them together to form two (port and starboard) sidescan-like time series of backscatter amplitude (Fig 3) The major prob-lem in combining signals from different beams to form sidescan traces is that samples from adjacent beams coinciding in time generally have different amplitudes because the backscatter envelopes are distorted by the receive beam pattern The most appropriate way to treat overlapping samples is to correct accurately the backscatter envelopes for the beam pattern in order to equalise the overlapping samples However this is not easy to implement because it supposes the angular dependence of the backscatter amplitude within the beam pattern to be correctly projected into the time domain which requires knowing the bottom relief within the footprint
Several semi-empirical approaches to deal with overlapping samples from adjacent beams for syn-thesising a sidescan trace are implemented in some recent MBES systems For instance for the Reson 8125 the operator can substitute the overlapping samples with either their root-mean-square (RMS) or average value (Reson 2002)
There is no standard approach to combining overlapping backscatter envelopes in different beams The beam combining method can differ between MBES systems and is not known for some of them Moreover the sidescan traces synthesised by the MBES hardware are not directly linked up in the spatial domain to the MBES bathymetric data which makes it problematic to produce co-located maps of bathymetry and seafloor backscatter strength
If sidescan traces are to be collected with an MBES system it is advantageous to create them from the backscatter envelopes linked to the hori-zontal coordinates on the sea floor with corre-sponding bathymetry measured for each beam (Beaudoin et al 2002) In this case the user can choose the most appropriate algorithm for com-bining overlapping echoes from different beams eg the method based on correction for the beam pattern
34 One backscatter value per beamTo reduce the amount of data to be logged some MBES systems implement a data logging mode where a single backscatter value is recorded for each beam It can be either a single backscatter intensityenvelope sample selected by the MBES hardware or some average value calculated by the sonar processor For instance when the Reson 8125 is set in the RI-Theta (range intensity beam angle) mode the sonar processor finds the maximum amplitude of each seafloor backscatter envelope
and stores it in a separate dataset referred to as backscatter lsquointensityrsquo (even though it is amplitude and not intensity)
However using the maximum backscatter enve-lope or intensity leads to considerable and system-atic overestimation of the seafloor backscatter strength measured with the outer beams of oblique steering angles when the beam footprint is much larger than the insonification area (Gavrilov and Parnum 2010) A more physically reasonable approach which does not lead to noticeable sys-tematic errors of backscatter strength estimates would be to take the backscatter envelope sample that corresponds (or is closest) to the beam centre which is not necessarily the highest one
As shown in Gavrilov and Parnum (2010) indi-vidual samples of backscatter envelopes selected from different beams commonly have large fluctua-tions due to the stochastic nature of acoustic scat-tering which results in noisy backscatter mosaics of the sea floor Calculating the backscatter energy (ie the integral of the squared envelope) received by each beam significantly reduces the resulting fluctuations and consequently the noise in sea-floor backscatter mosaics
According to Penrose et al (2008) the system-atic error of estimating the seafloor backscatter strength from individual samples of the backscatter envelope using the approximation of the insoni-fication area by a rectangular shape given by Equations 4 and 6 is greater than that from the backscatter energy (Equation 8) Moreover in con-trast to the backscatter energy the error of back-scatter strength estimates made from individual samples of the backscatter envelope varies consid-erably with incidence angle (beam number)
35 Selection of logging methodThe method selected to log backscatter with an MBES system will be dependent on the particular objectives of a study or seafloor survey Recording the whole echo signal retains the most flexibility for post-processing and allows the backscatter signal from the water column to be stored as well However for seafloor studies it is best to maintain the highest possible ping rate and hence maximum along-track resolution If this cannot be done for the whole echo with a particular MBES system because of its limited data communicationlogging speed then recording the seafloor backscatter envelopes should be considered instead
The seafloor backscatter envelopes can be used to derive sidescan traces andor to calculate the seafloor backscatter strength for each beam The sidescan trace is useful for imaging the sea floor whereas the backscatter intensity and energy values
Parnum and Gavrilov High-frequency multibeam echo-sounder measurements of seafloor backscatter in shallow water Part 1
8
derived from each beam are more suitable for measuring the seafloor backscatter strength and examining its angular dependence Even if only one backscatter value per beam is sufficient for these purposes it is better to derive this value from the seafloor backscatter envelopes rather than to simply exploit single backscatter values logged by the system as it gives the most control to selection of the value to be used
4 Processing seafloor backscatter dataMethods for processing sonar signals backscattered from the water column are given by Cochrane et al (2003) If the whole echo signals are logged by an MBES and used for processing then seafloor back-scatter envelopes need to be located using the bathymetry measurements and extracted for calcu-lating the seafloor backscatter characteristics
Before processing the backscatter data the x y z position of the footprint centre of each beam is usually determined for each sonar ping This proce-dure is well described in the literature (eg Lurton et al 1994 US Army Corps of Engineers 2002) and commonly implemented in the bathymetry processing software provided by the sonar manu-facturer There are two approaches to processing seafloor backscatter data One is to calculate the surface backscatter coefficient (or seafloor back-scatter strength) for each beam (see Section 41) The other is to produce a sidescan trace for the port and starboard beams either from the sidescan data synthesised by the MBES or from the seafloor backscatter envelopes (discussed in detail in Beau-doin et al 2002) To produce backscatter mosaics of the seafloor from overlapping MBES swaths the effect of the incidence angle on backscatter strength needs to be taken into account and com-pensated Some of the current approaches to this problem are presented in Part 2 ndash Mosaic produc-tion analysis and classification (Parnum and Gavrilov 2011) published alongside this paper
41 Surface backscatter coefficient The surface backscatter coefficient (sbs) and the seafloor backscatter strength (BS = 10 log sbs) are calculated using either Equation 4 or Equation 8 for the backscatter intensity and energy respec-tively Before using these equations to calculate sbs the transmitted signal intensity (IS) and energy (ES) must be determined from the power and pulse length settings of the echo-sounder In addition the received signal intensity (I ) recorded by the MBES system must be corrected for total system gain to get absolute values in mPa2 The transmitted signal intensity (IS) can vary significantly with angle
within the transmit beam For example the trans-mit power of the Reson 8101 is known to vary across beams (Foote et al 2005) This should be taken into account and corrected
The total gain of an MBES system can be expressed as follows
Gtotal = G0 GA GTVG (9)
where G0 is a fixed receive system gain (including the acoustic sensitivity of the receive array and con-stant processing gain) GA is additional adjustable gain selected by the operator and GTVG is time var-ied gain (TVG) This is introduced in the sonar hardware to equalise to a certain extent the ampli-tude of echo signals received at different angles and hence different slant ranges (R) from the bottom It is commonly expressed in dBs in the fol-lowing equation
10 log GTVG = Sp log R + 2aR (10)
where the spreading coefficient (Sp) and absorption loss coefficient (a[dBm]) are set by the sonar operator These settings are usually inadequate to compensate the actual transmission loss accurately (Lurton 2002) Therefore it is highly recom-mended to remove TVG from the backscatter sig-nals recorded by the MBES system and calculate the seafloor backscatter coefficient using either Equation 4 or 8 The spreading loss (1R 4) and absorption loss (exp(-2 bR)) determined from the measurement geometry (slant range R) and the acoustic absorption coefficient (b) in water must also be determined The dependence of the acous-tic absorption coefficient on frequency water tem-perature salinity and depth can be found in Fisher and Simmons (1977)
The fixed gain (G 0) can vary for different receive beams of some MBES systems To determine this gain the MBES system must be properly calibrated for each beam For example calibration of a Reson 8125 MBES was made in a large swimming pool using a rectangular aluminium plate of known acoustic reflectivity (Parnum 2007) The plate was 40 times 40cm wide which was large enough to make sure that it reflected the sonar signal from the whole footprint of the sonar beams at the distance of about 65m The calibration results showed that this particular model had a fixed receive system gain of 186 times 10-5 analog-to-digital converter (ADC) unit per mPa that was reasonably uniform across all beams Foote et al (2005) have outlined protocols for calibrating the beam varying sensitivity using target spheres
If an MBES system is not calibrated and G0 is not known estimates of the seafloor backscatter strength can be made only in relative units Even in this case
9
Vol 30 No 1 2011
the adjustable gain (GA) TVG and settings of the transmit power and pulse length should be cor-rected to obtain measurement results independent of the system settings
Correction for the insonification (Sins) and foot-print (SFP) areas applied to the backscatter intensity and energy results respectively in relatively small systematic errors if these areas are approximated by a rectangular shape (discussed in Section 2) As shown in Penrose et al (2008) for a narrow-beam MBES system the systematic error is independent of incidence angle and equals approximately 06dB for the estimates of seafloor backscatter strength derived from the backscatter energy
The error of backscatter strength estimates from the backscatter intensity varies with incidence angles It decreases from about 06dB at vertical incidence to about -06dB at moderate angles where the transverse width of the area insonified by the transmit array is comparable to the footprint area of the receive beam As the incidence angle further increases the systematic error of the seafloor backscatter strength tends to be a value of approxi-mately 03dB The transition angle of maximum negative error depends on sea depth and transmit-ted pulse length
Fig 4(a) shows the angular dependence of the seafloor backscatter strength measured from sand using the Reson 8125 (which operates at a fre-quency of 455kHz) using the backscatter energy (solid line) the peak intensity (dashed line) and the intensity at the beam centre (dotted line) The estimates derived from the energy reveal a gradual decrease in the backscatter strength with incidence angle and are consistent with modelling predic-tions for sand The estimates made from the back-scatter intensity measured at the centre of receive beams (dotted line) are generally similar to those derived from the backscatter energy except for the angles around the transition angle where the dif-ference is expected to be about 12dB from the error prediction made by Penrose et al (2008)
The transition takes place at the angle when the footprint area of receive beams becomes larger than the insonification area as illustrated in Fig 4(b) There is also a noticeable difference at the most oblique angles where the estimates of the backscatter strength from the backscatter energy are lower This is most likely due to an insufficient length of the seafloor backscatter envelopes (snip-pets) recorded by the Reson 8125 system in the outermost beams
The angular dependence of the seafloor back-scatter strength derived from the peak intensity (dashed line in Fig 4(a)) reveals considerable over-estimation of the backscatter strength at angles
that are much larger than the transition angle This effect is explained in detail in Gavrilov and Parnum (2010) based on the theory of extreme value statistics
There are some additional factors related to some specific MBES models that may affect the measure-ments of seafloor backscatter For example in a series of experiments with the Reson SeaBat 8111 and 8160 MBES systems Fonseca et al (2006) found that the seafloor backscatter strength (BS ) measured from the received backscatter intensity increased gradually with the transmitted pulse length This occurred even after correction for the insonification area which is the only variable in Equation 4 that depends on pulse length
A similar effect was also observed by Parnum (2007) which examined the effects of system set-ting on the seafloor backscatter measurements made with the Reson 8125 over a flat seafloor area covered with sand The mean BS values measured at different pulse lengths are shown in Fig 5(b) as a function of incidence angle When the pulse length was longer than 73ms the BS measurements were
003
004
005
006
007
Are
a (m
2 )
0 10 20 30 40 50 60
Incidence angle (deg)
ndash8
Bac
ksca
tter
stre
ngth
(dB
)
Transition anglendash22
ndash20
ndash18
ndash16
ndash14
ndash12
ndash10EnergyPeak intensityCentre beam intensity
(a)
(b)
Beam footprintTransmit insonification areaBeam insonification area
Fig 4 (a) Angular dependence of seafloorbackscatter strength derived from MBES data collected over flat sand in Cockburn Sound in 2005 The seafloor backscatter strength was estimated from the backscatter energy (solid line) intensity at the beam centre (dotted line) and peak intensity (dashed line) (b) Relationship between the area insonified by the transmit array and the footprint area of the receive beam
Parnum and Gavrilov High-frequency multibeam echo-sounder measurements of seafloor backscatter in shallow water Part 1
10
adequately corrected for changes in the pulse length while the BS values for shorter sonar pulses were underestimated The cause of this effect was found after calibration of this MBES (Parnum 2007)
The frequency bandwidth of the sonar transmit-ter was apparently not wide enough to transmit short pulses without amplitude distortion The amplitude of sonar pulses reflected from an alu-minium plate and received by the echo-sounder corresponded to the sonar power setting and experiment setup only when the pulse length was 151ms or larger (Fig 5(b)) The peak amplitude was slightly lower at 101ms pulse length and dropped almost by half at 51ms Consequently longer sonar pulses should be chosen to get accurate seafloor backscatter measurements that are independent of sonar system parameters If shorter pulses are pre-ferred to get the maximum bathymetry resolution
then the effect of limited frequency bandwidth should be taken into account
5 DiscussionBackscatter data logging and processing methods along with possible errors associated with them are considered in this paper using characteristics of the Reson SeaBat 8125 MBES hardware The older Reson high-frequency MBESs such as the SeaBat 8101 collect backscatter data in a similar way as the Reson 8125 so that the processing methods and errors discussed are directly applicable to them The most recent Reson MBES of the 7K series such as the SeaBat 7125 are capable of collecting the whole backscatter echo in each beam with every ping This means that seafloor backscatter character-istics can be derived directly from the backscatter signals that are not distorted by the limited length of snippet data
According to the latest instruction manual for datagram format (Kongsberg Maritime 2010) the Kongsberg-Simrad MBES systems of the EM series store two types of backscatter data seafloor back-scatter strength in dB calculated by the sonar system for vertical and oblique incidence (only two values per ping) and envelopes of the echo signals recorded in each beam and referred to as lsquoseabed image datarsquo by Kongsberg The seafloor backscatter strength is calculated according to the method described in Hammerstad (2000)
The seabed image data (echo envelopes) stored in a logarithmic scale (in dB) are centred around the bottom detection time and limited by those in the adjacent beams Therefore these backscatter data from the Simrad MBESs can be regarded as analogues to snippet data and processed similarly to the Reson snippet data to measure seafloor back-scatter characteristics Unfortunately the length of the seabed image data in individual beams is not much especially in near-vertical beams where it consists of a few samples so that it does not repre-sent the whole envelope of the signal backscattered from the bottom Consequently the energy of backscatter cannot be accurately measured
To obtain absolute values of the seafloor back-scatter strength it is necessary to know the total system gain common for all beams and inter-beam variations of the system gain that are affected by the sonar geometry and beamforming Kongsberg claims that its recent MBES systems are fully cali-brated which apparently means the seabed imaging data are represented in dB re 1mPa Reson usually does not provide calibration data for its MBES sys-tems Therefore a calibration procedure similar to that described in Parnum (2007) is required to
0 5 10 15 20 25 30 35 40 45 50 55 60
ndash22
ndash20
ndash18
ndash16
ndash14
ndash12
ndash10
ndash8(a)
(b)Incidence angle (deg)
Bac
ksca
tter
stre
ngth
(dB
)
31micros
40micros
51micros
73micros
101micros
141micros
11 12 13 14 15 16 170
2000
4000
6000
8000
10000
12000
14000
16000
Time (ms)
Am
plitu
de
51micros 101micros 152micros 292micros
Fig 5 (a) Mean backscatter strength versus incidence angle measured with the Reson Seabat 8125 MBES from an area of flat sand for a range of pulse lengths from 31ms to 292ms (b) Envelopes of sonar pulses reflected from an aluminium plate as measured by the Reson 8125 with the same power setting but different pulse lengths
11
Vol 30 No 1 2011
determine the overall system gain and its inter-beam variations if the absolute values of the seafloor backscatter strength are to be measured
Almost all modern MBES systems produce sidescan-like data of seafloor backscatter To gain an understanding of how these data are related to the actual backscatter properties of the sea floor including statistics (eg the mean value and disper-sion) it is important to know how these sidescan data are produced by an MBES system Acoustic backscattering from the sea floor is a stochastic process with a certain distribution which depends mainly on sonar frequency seafloor roughness and incidence angle (eg Lyons and Abraham 1999 Gavrilov and Parnum 2010)
As discussed in Section 4 the geometry of back-scatter measurements by an MBES system can distort the measured values and their statistics Moreover processing of backscatter samples implemented in the sonar hardware may also affect the measured values in an unexpected way Some MBES systems such as the Reson SeaBat echo-sounders produce sidescan data via averaging overlapping backscatter samples from adjacent beams Such processing dis-torts the backscatter distribution and consequently its mean and dispersion (Gavrilov and Parnum 2010) Therefore the most appropriate way to syn-thesise sidescan data from the MBES backscatter envelopes is to correct the amplitude of envelope samples for the beam pattern in each beam so as to equalise the overlapping samples and then stitch together all backscatter envelopes
6 ConclusionsIt has been shown that backscatter data collected with MBES systems under different experimental conditions can be corrected for beam geometry transmission loss and system settings However there can still be residual artefacts persisting due to either approximation of the backscattering area by a rectangle or inappropriate selection of system settings Therefore it is important to take account of the possible effects of the system settings and parameters on the measurements of seafloor back-scatter strength In particular the following should be considered
bullCalibration of the MBES system is desirable especially to determine the overall systemrsquos gain including inter-beam variations the transducerrsquos frequency band and the shape of transmit and receive beam patterns Ideally calibration is to be performed in a controlled environment with known targets and an accurate and well-controlled alignment of the sonar head and targets
bullTo obtain accurate measurements of the seafloor backscatter strength and its angular dependence using MBES data it is important to know (1) what kind of acoustical characteristics of backscatter signals (eg backscatter envelope or intensity or level in dB) is actually logged by the sonar hard-ware and (2) what kind of processing (eg aver-aging) is applied to the backscatter signal by the sonar hardware before data logging The algorithm for backscatter measurements dis-cussed in Section 2 should be adjusted accord-ing to the backscatter characteristic recorded by the MBES
bullWhen collecting backscatter data power gain and pulse length settings should be chosen appropriately so that the actual signal character-istics correspond to the expectations from the settings and system parameters
If these recommendations are followed back-scatter measurements should only be dependent on the seafloor properties incidence angle and sonar frequency In this case the measured back-scatter data can be used to discriminate between different seafloor types
ReferencesAugustin J-M and Lurton X (2005) Image amplitude cali-
bration and processing for seafloor mapping sonars In IEEE Oceans 2005 Conference Proc Brest 698ndash701
Augustin J-M Le Suave R Lurton X Voisset M Dugelay S and Satra C (1996) Contribution of multibeam acoustic imagery to the exploration of the sea bottom Marine Geo-physical Researches 18 459ndash486
Beaudoin JD Hughes Clarke JE Van Den Ameele EJ and Gardner JV (2002) Geometric and radiometric correc-tion of multibeam backscatter derived from Reson 8101 systems In Proceedings of the Canadian Hydrographic Con-ference 2002 Canadian Hydrographic Association Ottawa Ontario Summer CD-ROM 8pp
Bentrem FW Avera WE and Sample J (2006) Estimating surface sediments using multibeam sonar Sea Technology 47 37ndash40
Best J Simmons S Parsons D Oberg K Czuba J and Mal-zone C (2010) A new methodology for the quantitative visualization of coherent flow structures in alluvial chan-nels using multibeam echo-sounding (MBES) Geophysi-cal Research Letters 37 L06405 6pp
Brown CJ and Blondel P (2009) Developments in the appli-cation of multibeam sonar backscatter for seafloor habi-tat mapping Applied Acoustics 70 1242ndash1247
Canepa G and Pace NG (2000) Seafloor segmentation from multibeam bathymetric sonar In Chevret P and Zakharia ME (eds) Proceedings of the Fifth European Confer-ence on Underwater Acoustics Lyon France 361ndash366
Cochrane NA Li Y and Melvin GD (2003) Quantifications of a multibeam sonar for fisheries assessment applications Journal of the Acoustical Society of America 114 745ndash758
De Falco G Tonielli R Di Martino G Innangi S Simeone S and Parnum IM (2010) Relationships between multibeam
Parnum and Gavrilov High-frequency multibeam echo-sounder measurements of seafloor backscatter in shallow water Part 1
12
backscatter sediment grain size and Posidonia ocean-ica seagrass distribution Continental Shelf Research 30 1941ndash1950
de Moustier CP (1986) Beyond bathymetry Mapping acous-tic backscattering from the deep seafloor with Sea Beam Journal of the Acoustical Society of America 79 316ndash331
Fisher FH and Simmons VP (1977) Sound absorption in seawater The Journal of the Acoustical Society of America 62 558ndash564
Fonseca L and Mayer L (2007) Remote estimation of surficial seafloor properties through the application of angular range analysis to multibeam sonar data Marine Geophysical Researches 28 119ndash126
Fonseca L Calder B and Wetzler M (2006) Experiments for Multibeam Backscatter Adjustments on the NOAA Ship Fairweather In Oceans 2006 Boston IEEE 1ndash4
Foote KG Chu D Baldwin KC Mayer LA McLeod A Hufnagle LC Jr Jech JM and Michaels J (2005) Protocols for calibrating multibeam sonar Journal of the Acoustical Society of America 117 2013ndash2027
Gavrilov AN and Parnum IM (2010) Fluctuations of sea-floor backscatter data from multibeam sonar systems IEEE Journal of Oceanic Engineering 35 209ndash219
Hammerstad E (2000) EM Technical Note Backscattering and Seabed Image Reflectivity Horten Norway Kongs-berg Maritime AS 5pp
Hellequin L Boucher JM and Lurton X (2003) Processing of high-frequency multibeam echo sounder data for seafloor characterization IEEE Journal of Oceanic Engi-neering 28 78ndash89
Hughes Clarke JE (1994) Towards remote seafloor classifica-tion using the angular response of acoustic backscattering a case study from multiple overlapping GLORIA data IEEE Journal of Oceanic Engineering 19 112ndash127
Hughes Clarke JE Mayer LA Mitchell NC Godin A and Costello G (1993) Processing and interpretation of 95 kHz backscatter data from shallow-water multibeam sonars In Oceans 93 Engineering in Harmony with Ocean Victoria BC Canada 437ndash442
Kenny AJ Cato I Desprez M Fader G Schuttenhelm RTE and Side J (2003) An overview of seabed-mapping tech-nologies in the context of marine habitat classification ICES Journal of Marine Science 60 411ndash418
Kleinrock MC (1992) Capabilities of some systems used to survey the deep-sea floor In Geyer R (ed) CRC hand-book of geophysical exploration at sea 2nd edition vol 2 Hard Minerals Boca Raton FL CRC Press 35ndash86
Kloser RJ Penrose JD and Butler AJ (2010) Multi-beam backscatter measurements used to infer seabed habitats Continental Shelf Research 30 1772ndash1782
Kongsberg Maritime (2010) EM Series Multibeam Echo Sounders Datagram Format Instruction Manual Report No 850-160692N
Le Bas T and Huvenne V (2009) Acquisition and process-ing of backscatter data for habitat mapping ndash compari-son of multibeam and sidescan systems Applied Acoustics 70 1248ndash1257
Lurton X (2002) An introduction to underwater acoustics Principles and applications London Springer 347pp
Lurton X Dugelay S and Augustin JM (1994) Analysis of multibeam echo-sounder signals from the deep sea-floor In Proceedings of OCEANS rsquo94 lsquoOceans Engineering for Todayrsquos Technology and Tomorrowrsquos Preservation Brest France 213ndash218
Lyons A and Abraham D (1999) Statistical characterization of high-frequency shallow-water sea-floor backscatter Journal of the Acoustical Society of America 106 1307ndash1315
Medwin H and Clay CS (1998) Fundamentals of Acoustical Oceanography Boston Academic Press 712pp
Mitchell NC (1996) Processing and analysis of Simrad multibeam sonar data Marine Geophysical Researches 18 729ndash739
Parnum IM (2007) Benthic habitat mapping using multi-beam sonar systems PhD thesis Curtin University Perth Australia 208pp
Parnum IM and Gavrilov AN (2011) High-frequency multi-beam echo-sounder measurements of seafloor backscat-ter in shallow water Part 2 ndash Mosaic production analysis and classification Underwater Technology 30 13ndash26
Parsons MJG McCauley RD Mackie M and Siwabessy PJW (2006) Evaluation of acoustic backscatter data collected from Samson Fish (Seriola hippos) spawning aggregations in Western Australia Presented at 8th European Confer-ence on Underwater Acoustics Carvoeiro Portugal 19ndash22 November
Parsons MJG Parnum IM Siwabessy PJW McCauley RD and Mackie M (2007) Multi-beam visualisation of Samson Fish (Seriola hippos) aggregations and spawning habitats in Western Australia In Papadakis JS and Bjorno L (eds) Proceedings of the Second International Conference lsquoUnderwater Acoustic Measurements Technologies and Resultsrsquo Crete Greece 684ndash692 Available at wwwuam-conferences orgindexphppast-proceedings accessed on 5 May 2011
Penrose JD Gavrilov AN and Parnum IM (2008) Statistics of seafloor backscatter measured with multibeam sonar systems In Proceedings of the 9th European Conference on Underwater Acoustics 2008 Paris France 617ndash622
Preston JM Christney AC Bloomer SF and Beaudet IL (2001) Seabed classification of multibeam sonar images In MTSIEEE Oceans 2001 Conference Honolulu Hawaii 2616ndash2623
Reson (2002) SeaBat 8125 operatorrsquos manual version 302 Goleta California Reson Inc
Talukdar KK Tyce RC and Clay CS (1995) Interpretation of Sea Beam backscatter data collected at the Laurentian fan off Nova Scotia using acoustic backscatter theory Journal of the Acoustical Society of America 97 1545ndash1558
Trevorrow MV (2005) Volumetric multibeam sonar meas-urements of fish zooplankton and turbulence In Pro-ceedings of the International Conference lsquoUnderwater Acoustic Measurements Technologies and Resultsrsquo Crete Greece Available at wwwuam-conferencesorgindexphppast-proceedings accessed on 5 May 2011
US Army Corps of Engineers (2002) Chapter 11 Acoustic multibeam survey systems for deep-draft navigation projects In Engineering and Design ndash Hydrographic Surveying Washington DC US Army Corps of Engineers 33pp

Parnum and Gavrilov High-frequency multibeam echo-sounder measurements of seafloor backscatter in shallow water Part 1
4
This paper details the different backscatter logging methods implemented in modern high-frequency MBES systems used primarily in shallow water or carried by remotely operated vehicles (ROVs) or autonomous underwater vehicles (AUVs) It then explains appropriate methods of data processing and discusses likely errors and artefacts expected from MBES backscatter processing The issues to be considered in this paper were investi-gated using several datasets collected with different MBES systems such as the Reson SeaBat 8101 8125 8111 and 7125 and Kongsberg-Simrad EM 3002 over different seafloor types in ten coastal shelf areas around Australia as well as coastal shelves in Italy (De Falco et al 2010) and in China This paper is focused on the methods of backscatter data collec-tion and processing common for those MBES sys-tems rather than seafloor backscatter properties measured in the surveyed areas Therefore two datasets obtained with the Reson SeaBat 8125 from Cockburn Sound and Esperance Bay in Western Australia have been chosen to illustrate the consid-ered issues
2 Operation of multibeam echo-sounder systemsMBESs are usually mounted underneath a vessel or an ROVAUV and emit acoustic pulses of a short length Transmission of the acoustic energy to the sea floor is governed by the beam pattern of the sonar transmit array that is wide across-track (typically 120ndash150deg) and narrow along-track (of the order of 1deg for high-frequency systems)
The receive array is directed perpendicularly to the transmit array and forms a large number of receive beams that are narrow across-track and are steered simultaneously in different across-track directions by a beamforming process Thus the system performs spatial filtering of acoustic sig-nals backscattered from different discrete areas of the sea floor along the swath referred to as lsquobeam footprintsrsquo This provides co-located bathymetry and backscatter measurements made from each beam
Although only one bathymetry measurement is usually made from each sonar ping and beam sev-eral samples of the backscatter intensity can be recorded within the beam The seafloor area that each individual backscatter sample represents is termed the lsquoinsonification arearsquo in this paper Modern shallow-water MBES systems (such as Kongsberg-Simrad EM 3000 and 3002 and Reson SeaBat 8125 and 7125) operate at hundreds of kHz transmit short pulses of several tens of micro-seconds and form hundreds of beams usually less
than 1deg wide MBES systems with such parameters are capable of resolving small features from a few centimetres to a few decimetres wide in the sea-floor relief
The geometry of MBES measurements is illus-trated in Fig 1 Projections of the transmit and receive beams (main lobes of the beam patterns) onto the sea floor are shown by shadowed areas The sonar footprint on the sea floor is formed by the intersection of the two areas The dashed lines show bounds of the seafloor area insonified by a rectangular sonar pulse at a specific time
Fig 1 shows the projection of a single receive beam Within each particular receive beam the echo-sounder observes a seafloor area limited by the intersection of the transmit and receive beam projections ndash ie the beam footprint The area insonified simultaneously on the seafloor that scat-ters the sonar signal back to the receive array is limited by the length of the transmitted pulse It has a ring form with the external and internal radii (r1 and r2 respectively) These radii change with the time (tr) elapsed from the transmission time as shown in Equation 1
r1 = [(Ctr2)2 - D2]12
r2 = Re[(Ctr2 - CT2)2 - D2]12 (1)
where D is the sonar elevation above the sea floor C is the sound speed and T is the transmitted pulse length The insonification area is a circle at tr le 2DC + T when r2 = 0
According to Medwin and Clay (1998) the instantaneous intensity of the backscattered signal can be numerically predicted if the sonar transmit
θ
θ
ϕ
r
R
ϕ
D
x
y
r2
r1
ΦR|z = 0ΦT|z = 0
prime
prime
Fig 1 Geometry of backscatter measurements by an MBES system The shadowed areas illustrate projections of the transmit and receive beams onto the sea floor (only one receive beam is shown)
5
Vol 30 No 1 2011
(FT(θprime ϕprime)) and receive (FR(θprime ϕprime)) beam patterns are known using Equation 2
I tI R R
RrS
r
r
bs
( )=minus( )
( )
times ( )minusintint 0
2
42
22
2
1exp βθ
σ θ θπ
π
ΦT2 primeprime prime prime prime R
2ϕ θ ϕ ϕ( ) ( )Φ rdrd (2)
where sbs(θ) is the surface backscatter coefficient depending on incidence angle (θ) IS is the trans-mitted signal intensity at R0 = 1m from the sonar head and b is the attenuation coefficient of sound in water At relatively short sonar pulses (typically of a few tens of microseconds for high-frequency MBESs) and oblique steering angles the insonifica-tion area is a portion of the beam footprint limited by r1 and r2 as illustrated in Fig 1 For a narrow-beam MBES system with the typical beam width of a few degrees it can be assumed that sbs(θ) and R do not change significantly within the insonifica-tion area Using this assumption Equation 2 can be simplified as shown in Equation 3
I tI R R
R tS tr
S C
C rbs ins r( )
exp( )( )
( )=minus0
2
4
2βσ (3)
where Sins is the insonification area and RC is the slant range to its centre moving with time This approximate equation is commonly used to derive the seafloor backscatter coefficient from the back-scatter intensity measured in each beam of an MBES system
σβbs
r C r
S C ins r
I t R tI R R S t
=( ) ( )
( ) ( )
4
02 2exp
(4)
where lang rang signifies averaging over a series of meas-urements For estimating sbs(θ) the time (tr) is usu-ally chosen so that it corresponds with the two-way travel time of the sonar signal to the centre of the insonification area as estimated from the measure-ment geometry (beam steering angle with vesselrsquos roll offset) and sea depth The insonification area is commonly approximated by a rectangular shape A simple and commonly used equation for calcu-lating the insonification area approximated by a rectangular shape as given in Hellequin et al (2003) is as follows
S = minRϕlTCsin(θ) R 2ϕl sin θt cos θ (5)
where ϕl is the longitudinal (along-track) width of the transmit beam θt is the transverse (across-track) width of the receive beam as specified by the sonar manufacturer and θ is the beam steering angle The minimum function is applied to take into account the case when the footprint transverse width is smaller than r1 - r2 Parnum (2007) suggests a
more complex equation for the insonification area which is more accurate than Equation 5 at near-vertical steering angles of receive beams
S = R 2 ϕl mincos(θ)tan[arc cos(cos θ(1 + TC2R))] - sin(|θ|) sin θt cos θ (6)
The backscatter energy can be calculated by integrating the backscatter intensity (I ) over the duration of the echo signal which is equivalent to integration over the footprint transverse width Consequently the backscatter energy can also be approximated by a simple equation similar to Equation 3
EE R R
RSS C
Cbs FP=
minus02
4
2exp( )βσ (7)
where ES is the energy of the transmitted pulse(a product of the transmitted signal intensity and pulse length) and SFP = R 2ϕl sin θt cos θ is the area of intersection of the beam footprint The seafloor backscatter coefficient (sbs) can be derived from the backscatter energy as in Equation 8
σβbs
C
S C FP
ERE R R S
=4
02 2exp( )
(8)
In practice the acoustic backscatter from the sea floor is commonly characterised in the logarithmic scale by the seafloor backscatter strength (BS =10 log sbs)
3 Methods of logging MBES backscatter dataAll backscatter data collected by MBES systems are derived from the backscatter intensity (I) (Equation 2) or its square root which is an instan-taneous amplitude commonly referred to as a lsquobackscatter envelopersquo To obtain estimates of the seafloor backscatter coefficient and its angular dependence it is essential to know whether it is the backscatter intensity or the amplitude that is logged by the echo-sounder At present there are gener-ally four possible methods for logging backscatter data adopted in the Reson MBES and some other modern MBES systems (eg Kongsberg EM 120 300 and 3000 series) In decreasing data logging size these methods are
bull the whole echo signal (either backscatter enve-lope or intensity) from each beam including the signal backscattered in the water column
bulla fragment of the whole backscatter envelope centred around the bottom detection time in each beam (referred to here as the lsquoseafloor backscatter envelopersquo)
Parnum and Gavrilov High-frequency multibeam echo-sounder measurements of seafloor backscatter in shallow water Part 1
6
bull two sidescan-like time series of backscatter amplitudes created by combining the backscat-ter intensity or envelope from the port and starboard beams (referred to here as lsquosidescan datarsquo) and
bullone backscatter value per beam from within each seafloor backscatter envelope Some of the mod-ern Reson MBES systems log the peak amplitude of the seafloor backscatter envelopes received in each beam while some other MBES systems record other derivatives from the backscatter envelopes
This section explains the differences between these methods and discusses the selection of the most appropriate logging method for specific surveys
31 Whole backscatter envelopeRecording of the whole backscatter envelope is implemented in several modern MBES systems such as the Reson 8125 and 7125 (these data are called lsquosnapshotsrsquo in the Reson data collection soft-ware) Logging of the whole echo signal for each beam including both the amplitude (shown in Fig 2) and phase is useful for some applications related to the water column such as fisheries acous-tics (Parsons et al 2006) the study of internal waves (Trevorrow 2005) and sediment transport (Best et al 2010) However for seafloor mapping it is not necessary to log the whole of the backscatter echo
Moreover the amount of data to be logged increases significantly when recording the echo sig-nal from both the water column and the sea floor which may result in a considerable reduction of the maximum possible ping rate For instance the
Reson 8125 system was capable of logging the whole backscatter envelope only from one of every five sonar pings (Parsons et al 2006) Recent improve-ments in data logging and computer processing speed allow this problem to be overcome in some state-of-the-art MBES systems such as the Reson 7125 (Parsons et al 2007)
32 Seafloor backscatter envelopesSeafloor backscatter envelopes which are called lsquosnippetsrsquo in the Reson data collection software are fragments of the whole backscatter envelope that are selected to contain the echo from the sea floor in each beam (Fig 3) The start sample of each sea-floor backscatter envelope in the whole backscatter echo (the lsquofragment offsetrsquo) and the length of each fragment are predetermined by the sonar processor based on the bottom detection range and estimates of the slant range to the inner and outer edges of the beam footprint on the sea floor (Reson 2002) This is usually done assuming a flat bottom model for each individual sonar ping Occasionally the length of the fragments chosen by the MBES hard-ware is not large enough to contain the whole echo from the sea floor Inadequate fragment length occurs more in the outermost beams than the inner beams as the seafloor echo length gets longer as incidence angle increases (Parnum 2007)
33 Sidescan dataWhen recording in the sidescan mode the MBES system combines backscatter signals received along
Sea floor
Fish school
Seafloor backscatterfrom beam side-lobes
Fig 2 An example of a whole backscatterenvelope from one sonar ping of a Reson Seabat 8125 MBES The backscatter level is shown in dB via a reference signal level in sonar analog-to-digital converter (ADC) units (ie not corrected for full MBES system gain)
(a)
(b)
750 800 850
05
1
15
2
25 x 104
Am
plitu
de
750 800 850
05
1
15
2
25 x 104
Sample number
Am
plitu
de
Beam 21Beam 22Beam 23Beam 24
Beam 21Beam 22Beam 23Beam 24Sidescan
Complete beam time series frombeams 21ndash24 and sidescan
Seafloor backscatter envelopes frombeams 21ndash24
Fig 3 Comparison of different backscatterdata logged by MBES systems (a) 100 sample fragments of the whole backscatter envelopes and a sidescan-like trace synthesised from these envelopes and (b) seafloor backscatter envelopes cut out from the whole echo
7
Vol 30 No 1 2011
adjacent beams by stitching them together to form two (port and starboard) sidescan-like time series of backscatter amplitude (Fig 3) The major prob-lem in combining signals from different beams to form sidescan traces is that samples from adjacent beams coinciding in time generally have different amplitudes because the backscatter envelopes are distorted by the receive beam pattern The most appropriate way to treat overlapping samples is to correct accurately the backscatter envelopes for the beam pattern in order to equalise the overlapping samples However this is not easy to implement because it supposes the angular dependence of the backscatter amplitude within the beam pattern to be correctly projected into the time domain which requires knowing the bottom relief within the footprint
Several semi-empirical approaches to deal with overlapping samples from adjacent beams for syn-thesising a sidescan trace are implemented in some recent MBES systems For instance for the Reson 8125 the operator can substitute the overlapping samples with either their root-mean-square (RMS) or average value (Reson 2002)
There is no standard approach to combining overlapping backscatter envelopes in different beams The beam combining method can differ between MBES systems and is not known for some of them Moreover the sidescan traces synthesised by the MBES hardware are not directly linked up in the spatial domain to the MBES bathymetric data which makes it problematic to produce co-located maps of bathymetry and seafloor backscatter strength
If sidescan traces are to be collected with an MBES system it is advantageous to create them from the backscatter envelopes linked to the hori-zontal coordinates on the sea floor with corre-sponding bathymetry measured for each beam (Beaudoin et al 2002) In this case the user can choose the most appropriate algorithm for com-bining overlapping echoes from different beams eg the method based on correction for the beam pattern
34 One backscatter value per beamTo reduce the amount of data to be logged some MBES systems implement a data logging mode where a single backscatter value is recorded for each beam It can be either a single backscatter intensityenvelope sample selected by the MBES hardware or some average value calculated by the sonar processor For instance when the Reson 8125 is set in the RI-Theta (range intensity beam angle) mode the sonar processor finds the maximum amplitude of each seafloor backscatter envelope
and stores it in a separate dataset referred to as backscatter lsquointensityrsquo (even though it is amplitude and not intensity)
However using the maximum backscatter enve-lope or intensity leads to considerable and system-atic overestimation of the seafloor backscatter strength measured with the outer beams of oblique steering angles when the beam footprint is much larger than the insonification area (Gavrilov and Parnum 2010) A more physically reasonable approach which does not lead to noticeable sys-tematic errors of backscatter strength estimates would be to take the backscatter envelope sample that corresponds (or is closest) to the beam centre which is not necessarily the highest one
As shown in Gavrilov and Parnum (2010) indi-vidual samples of backscatter envelopes selected from different beams commonly have large fluctua-tions due to the stochastic nature of acoustic scat-tering which results in noisy backscatter mosaics of the sea floor Calculating the backscatter energy (ie the integral of the squared envelope) received by each beam significantly reduces the resulting fluctuations and consequently the noise in sea-floor backscatter mosaics
According to Penrose et al (2008) the system-atic error of estimating the seafloor backscatter strength from individual samples of the backscatter envelope using the approximation of the insoni-fication area by a rectangular shape given by Equations 4 and 6 is greater than that from the backscatter energy (Equation 8) Moreover in con-trast to the backscatter energy the error of back-scatter strength estimates made from individual samples of the backscatter envelope varies consid-erably with incidence angle (beam number)
35 Selection of logging methodThe method selected to log backscatter with an MBES system will be dependent on the particular objectives of a study or seafloor survey Recording the whole echo signal retains the most flexibility for post-processing and allows the backscatter signal from the water column to be stored as well However for seafloor studies it is best to maintain the highest possible ping rate and hence maximum along-track resolution If this cannot be done for the whole echo with a particular MBES system because of its limited data communicationlogging speed then recording the seafloor backscatter envelopes should be considered instead
The seafloor backscatter envelopes can be used to derive sidescan traces andor to calculate the seafloor backscatter strength for each beam The sidescan trace is useful for imaging the sea floor whereas the backscatter intensity and energy values
Parnum and Gavrilov High-frequency multibeam echo-sounder measurements of seafloor backscatter in shallow water Part 1
8
derived from each beam are more suitable for measuring the seafloor backscatter strength and examining its angular dependence Even if only one backscatter value per beam is sufficient for these purposes it is better to derive this value from the seafloor backscatter envelopes rather than to simply exploit single backscatter values logged by the system as it gives the most control to selection of the value to be used
4 Processing seafloor backscatter dataMethods for processing sonar signals backscattered from the water column are given by Cochrane et al (2003) If the whole echo signals are logged by an MBES and used for processing then seafloor back-scatter envelopes need to be located using the bathymetry measurements and extracted for calcu-lating the seafloor backscatter characteristics
Before processing the backscatter data the x y z position of the footprint centre of each beam is usually determined for each sonar ping This proce-dure is well described in the literature (eg Lurton et al 1994 US Army Corps of Engineers 2002) and commonly implemented in the bathymetry processing software provided by the sonar manu-facturer There are two approaches to processing seafloor backscatter data One is to calculate the surface backscatter coefficient (or seafloor back-scatter strength) for each beam (see Section 41) The other is to produce a sidescan trace for the port and starboard beams either from the sidescan data synthesised by the MBES or from the seafloor backscatter envelopes (discussed in detail in Beau-doin et al 2002) To produce backscatter mosaics of the seafloor from overlapping MBES swaths the effect of the incidence angle on backscatter strength needs to be taken into account and com-pensated Some of the current approaches to this problem are presented in Part 2 ndash Mosaic produc-tion analysis and classification (Parnum and Gavrilov 2011) published alongside this paper
41 Surface backscatter coefficient The surface backscatter coefficient (sbs) and the seafloor backscatter strength (BS = 10 log sbs) are calculated using either Equation 4 or Equation 8 for the backscatter intensity and energy respec-tively Before using these equations to calculate sbs the transmitted signal intensity (IS) and energy (ES) must be determined from the power and pulse length settings of the echo-sounder In addition the received signal intensity (I ) recorded by the MBES system must be corrected for total system gain to get absolute values in mPa2 The transmitted signal intensity (IS) can vary significantly with angle
within the transmit beam For example the trans-mit power of the Reson 8101 is known to vary across beams (Foote et al 2005) This should be taken into account and corrected
The total gain of an MBES system can be expressed as follows
Gtotal = G0 GA GTVG (9)
where G0 is a fixed receive system gain (including the acoustic sensitivity of the receive array and con-stant processing gain) GA is additional adjustable gain selected by the operator and GTVG is time var-ied gain (TVG) This is introduced in the sonar hardware to equalise to a certain extent the ampli-tude of echo signals received at different angles and hence different slant ranges (R) from the bottom It is commonly expressed in dBs in the fol-lowing equation
10 log GTVG = Sp log R + 2aR (10)
where the spreading coefficient (Sp) and absorption loss coefficient (a[dBm]) are set by the sonar operator These settings are usually inadequate to compensate the actual transmission loss accurately (Lurton 2002) Therefore it is highly recom-mended to remove TVG from the backscatter sig-nals recorded by the MBES system and calculate the seafloor backscatter coefficient using either Equation 4 or 8 The spreading loss (1R 4) and absorption loss (exp(-2 bR)) determined from the measurement geometry (slant range R) and the acoustic absorption coefficient (b) in water must also be determined The dependence of the acous-tic absorption coefficient on frequency water tem-perature salinity and depth can be found in Fisher and Simmons (1977)
The fixed gain (G 0) can vary for different receive beams of some MBES systems To determine this gain the MBES system must be properly calibrated for each beam For example calibration of a Reson 8125 MBES was made in a large swimming pool using a rectangular aluminium plate of known acoustic reflectivity (Parnum 2007) The plate was 40 times 40cm wide which was large enough to make sure that it reflected the sonar signal from the whole footprint of the sonar beams at the distance of about 65m The calibration results showed that this particular model had a fixed receive system gain of 186 times 10-5 analog-to-digital converter (ADC) unit per mPa that was reasonably uniform across all beams Foote et al (2005) have outlined protocols for calibrating the beam varying sensitivity using target spheres
If an MBES system is not calibrated and G0 is not known estimates of the seafloor backscatter strength can be made only in relative units Even in this case
9
Vol 30 No 1 2011
the adjustable gain (GA) TVG and settings of the transmit power and pulse length should be cor-rected to obtain measurement results independent of the system settings
Correction for the insonification (Sins) and foot-print (SFP) areas applied to the backscatter intensity and energy results respectively in relatively small systematic errors if these areas are approximated by a rectangular shape (discussed in Section 2) As shown in Penrose et al (2008) for a narrow-beam MBES system the systematic error is independent of incidence angle and equals approximately 06dB for the estimates of seafloor backscatter strength derived from the backscatter energy
The error of backscatter strength estimates from the backscatter intensity varies with incidence angles It decreases from about 06dB at vertical incidence to about -06dB at moderate angles where the transverse width of the area insonified by the transmit array is comparable to the footprint area of the receive beam As the incidence angle further increases the systematic error of the seafloor backscatter strength tends to be a value of approxi-mately 03dB The transition angle of maximum negative error depends on sea depth and transmit-ted pulse length
Fig 4(a) shows the angular dependence of the seafloor backscatter strength measured from sand using the Reson 8125 (which operates at a fre-quency of 455kHz) using the backscatter energy (solid line) the peak intensity (dashed line) and the intensity at the beam centre (dotted line) The estimates derived from the energy reveal a gradual decrease in the backscatter strength with incidence angle and are consistent with modelling predic-tions for sand The estimates made from the back-scatter intensity measured at the centre of receive beams (dotted line) are generally similar to those derived from the backscatter energy except for the angles around the transition angle where the dif-ference is expected to be about 12dB from the error prediction made by Penrose et al (2008)
The transition takes place at the angle when the footprint area of receive beams becomes larger than the insonification area as illustrated in Fig 4(b) There is also a noticeable difference at the most oblique angles where the estimates of the backscatter strength from the backscatter energy are lower This is most likely due to an insufficient length of the seafloor backscatter envelopes (snip-pets) recorded by the Reson 8125 system in the outermost beams
The angular dependence of the seafloor back-scatter strength derived from the peak intensity (dashed line in Fig 4(a)) reveals considerable over-estimation of the backscatter strength at angles
that are much larger than the transition angle This effect is explained in detail in Gavrilov and Parnum (2010) based on the theory of extreme value statistics
There are some additional factors related to some specific MBES models that may affect the measure-ments of seafloor backscatter For example in a series of experiments with the Reson SeaBat 8111 and 8160 MBES systems Fonseca et al (2006) found that the seafloor backscatter strength (BS ) measured from the received backscatter intensity increased gradually with the transmitted pulse length This occurred even after correction for the insonification area which is the only variable in Equation 4 that depends on pulse length
A similar effect was also observed by Parnum (2007) which examined the effects of system set-ting on the seafloor backscatter measurements made with the Reson 8125 over a flat seafloor area covered with sand The mean BS values measured at different pulse lengths are shown in Fig 5(b) as a function of incidence angle When the pulse length was longer than 73ms the BS measurements were
003
004
005
006
007
Are
a (m
2 )
0 10 20 30 40 50 60
Incidence angle (deg)
ndash8
Bac
ksca
tter
stre
ngth
(dB
)
Transition anglendash22
ndash20
ndash18
ndash16
ndash14
ndash12
ndash10EnergyPeak intensityCentre beam intensity
(a)
(b)
Beam footprintTransmit insonification areaBeam insonification area
Fig 4 (a) Angular dependence of seafloorbackscatter strength derived from MBES data collected over flat sand in Cockburn Sound in 2005 The seafloor backscatter strength was estimated from the backscatter energy (solid line) intensity at the beam centre (dotted line) and peak intensity (dashed line) (b) Relationship between the area insonified by the transmit array and the footprint area of the receive beam
Parnum and Gavrilov High-frequency multibeam echo-sounder measurements of seafloor backscatter in shallow water Part 1
10
adequately corrected for changes in the pulse length while the BS values for shorter sonar pulses were underestimated The cause of this effect was found after calibration of this MBES (Parnum 2007)
The frequency bandwidth of the sonar transmit-ter was apparently not wide enough to transmit short pulses without amplitude distortion The amplitude of sonar pulses reflected from an alu-minium plate and received by the echo-sounder corresponded to the sonar power setting and experiment setup only when the pulse length was 151ms or larger (Fig 5(b)) The peak amplitude was slightly lower at 101ms pulse length and dropped almost by half at 51ms Consequently longer sonar pulses should be chosen to get accurate seafloor backscatter measurements that are independent of sonar system parameters If shorter pulses are pre-ferred to get the maximum bathymetry resolution
then the effect of limited frequency bandwidth should be taken into account
5 DiscussionBackscatter data logging and processing methods along with possible errors associated with them are considered in this paper using characteristics of the Reson SeaBat 8125 MBES hardware The older Reson high-frequency MBESs such as the SeaBat 8101 collect backscatter data in a similar way as the Reson 8125 so that the processing methods and errors discussed are directly applicable to them The most recent Reson MBES of the 7K series such as the SeaBat 7125 are capable of collecting the whole backscatter echo in each beam with every ping This means that seafloor backscatter character-istics can be derived directly from the backscatter signals that are not distorted by the limited length of snippet data
According to the latest instruction manual for datagram format (Kongsberg Maritime 2010) the Kongsberg-Simrad MBES systems of the EM series store two types of backscatter data seafloor back-scatter strength in dB calculated by the sonar system for vertical and oblique incidence (only two values per ping) and envelopes of the echo signals recorded in each beam and referred to as lsquoseabed image datarsquo by Kongsberg The seafloor backscatter strength is calculated according to the method described in Hammerstad (2000)
The seabed image data (echo envelopes) stored in a logarithmic scale (in dB) are centred around the bottom detection time and limited by those in the adjacent beams Therefore these backscatter data from the Simrad MBESs can be regarded as analogues to snippet data and processed similarly to the Reson snippet data to measure seafloor back-scatter characteristics Unfortunately the length of the seabed image data in individual beams is not much especially in near-vertical beams where it consists of a few samples so that it does not repre-sent the whole envelope of the signal backscattered from the bottom Consequently the energy of backscatter cannot be accurately measured
To obtain absolute values of the seafloor back-scatter strength it is necessary to know the total system gain common for all beams and inter-beam variations of the system gain that are affected by the sonar geometry and beamforming Kongsberg claims that its recent MBES systems are fully cali-brated which apparently means the seabed imaging data are represented in dB re 1mPa Reson usually does not provide calibration data for its MBES sys-tems Therefore a calibration procedure similar to that described in Parnum (2007) is required to
0 5 10 15 20 25 30 35 40 45 50 55 60
ndash22
ndash20
ndash18
ndash16
ndash14
ndash12
ndash10
ndash8(a)
(b)Incidence angle (deg)
Bac
ksca
tter
stre
ngth
(dB
)
31micros
40micros
51micros
73micros
101micros
141micros
11 12 13 14 15 16 170
2000
4000
6000
8000
10000
12000
14000
16000
Time (ms)
Am
plitu
de
51micros 101micros 152micros 292micros
Fig 5 (a) Mean backscatter strength versus incidence angle measured with the Reson Seabat 8125 MBES from an area of flat sand for a range of pulse lengths from 31ms to 292ms (b) Envelopes of sonar pulses reflected from an aluminium plate as measured by the Reson 8125 with the same power setting but different pulse lengths
11
Vol 30 No 1 2011
determine the overall system gain and its inter-beam variations if the absolute values of the seafloor backscatter strength are to be measured
Almost all modern MBES systems produce sidescan-like data of seafloor backscatter To gain an understanding of how these data are related to the actual backscatter properties of the sea floor including statistics (eg the mean value and disper-sion) it is important to know how these sidescan data are produced by an MBES system Acoustic backscattering from the sea floor is a stochastic process with a certain distribution which depends mainly on sonar frequency seafloor roughness and incidence angle (eg Lyons and Abraham 1999 Gavrilov and Parnum 2010)
As discussed in Section 4 the geometry of back-scatter measurements by an MBES system can distort the measured values and their statistics Moreover processing of backscatter samples implemented in the sonar hardware may also affect the measured values in an unexpected way Some MBES systems such as the Reson SeaBat echo-sounders produce sidescan data via averaging overlapping backscatter samples from adjacent beams Such processing dis-torts the backscatter distribution and consequently its mean and dispersion (Gavrilov and Parnum 2010) Therefore the most appropriate way to syn-thesise sidescan data from the MBES backscatter envelopes is to correct the amplitude of envelope samples for the beam pattern in each beam so as to equalise the overlapping samples and then stitch together all backscatter envelopes
6 ConclusionsIt has been shown that backscatter data collected with MBES systems under different experimental conditions can be corrected for beam geometry transmission loss and system settings However there can still be residual artefacts persisting due to either approximation of the backscattering area by a rectangle or inappropriate selection of system settings Therefore it is important to take account of the possible effects of the system settings and parameters on the measurements of seafloor back-scatter strength In particular the following should be considered
bullCalibration of the MBES system is desirable especially to determine the overall systemrsquos gain including inter-beam variations the transducerrsquos frequency band and the shape of transmit and receive beam patterns Ideally calibration is to be performed in a controlled environment with known targets and an accurate and well-controlled alignment of the sonar head and targets
bullTo obtain accurate measurements of the seafloor backscatter strength and its angular dependence using MBES data it is important to know (1) what kind of acoustical characteristics of backscatter signals (eg backscatter envelope or intensity or level in dB) is actually logged by the sonar hard-ware and (2) what kind of processing (eg aver-aging) is applied to the backscatter signal by the sonar hardware before data logging The algorithm for backscatter measurements dis-cussed in Section 2 should be adjusted accord-ing to the backscatter characteristic recorded by the MBES
bullWhen collecting backscatter data power gain and pulse length settings should be chosen appropriately so that the actual signal character-istics correspond to the expectations from the settings and system parameters
If these recommendations are followed back-scatter measurements should only be dependent on the seafloor properties incidence angle and sonar frequency In this case the measured back-scatter data can be used to discriminate between different seafloor types
ReferencesAugustin J-M and Lurton X (2005) Image amplitude cali-
bration and processing for seafloor mapping sonars In IEEE Oceans 2005 Conference Proc Brest 698ndash701
Augustin J-M Le Suave R Lurton X Voisset M Dugelay S and Satra C (1996) Contribution of multibeam acoustic imagery to the exploration of the sea bottom Marine Geo-physical Researches 18 459ndash486
Beaudoin JD Hughes Clarke JE Van Den Ameele EJ and Gardner JV (2002) Geometric and radiometric correc-tion of multibeam backscatter derived from Reson 8101 systems In Proceedings of the Canadian Hydrographic Con-ference 2002 Canadian Hydrographic Association Ottawa Ontario Summer CD-ROM 8pp
Bentrem FW Avera WE and Sample J (2006) Estimating surface sediments using multibeam sonar Sea Technology 47 37ndash40
Best J Simmons S Parsons D Oberg K Czuba J and Mal-zone C (2010) A new methodology for the quantitative visualization of coherent flow structures in alluvial chan-nels using multibeam echo-sounding (MBES) Geophysi-cal Research Letters 37 L06405 6pp
Brown CJ and Blondel P (2009) Developments in the appli-cation of multibeam sonar backscatter for seafloor habi-tat mapping Applied Acoustics 70 1242ndash1247
Canepa G and Pace NG (2000) Seafloor segmentation from multibeam bathymetric sonar In Chevret P and Zakharia ME (eds) Proceedings of the Fifth European Confer-ence on Underwater Acoustics Lyon France 361ndash366
Cochrane NA Li Y and Melvin GD (2003) Quantifications of a multibeam sonar for fisheries assessment applications Journal of the Acoustical Society of America 114 745ndash758
De Falco G Tonielli R Di Martino G Innangi S Simeone S and Parnum IM (2010) Relationships between multibeam
Parnum and Gavrilov High-frequency multibeam echo-sounder measurements of seafloor backscatter in shallow water Part 1
12
backscatter sediment grain size and Posidonia ocean-ica seagrass distribution Continental Shelf Research 30 1941ndash1950
de Moustier CP (1986) Beyond bathymetry Mapping acous-tic backscattering from the deep seafloor with Sea Beam Journal of the Acoustical Society of America 79 316ndash331
Fisher FH and Simmons VP (1977) Sound absorption in seawater The Journal of the Acoustical Society of America 62 558ndash564
Fonseca L and Mayer L (2007) Remote estimation of surficial seafloor properties through the application of angular range analysis to multibeam sonar data Marine Geophysical Researches 28 119ndash126
Fonseca L Calder B and Wetzler M (2006) Experiments for Multibeam Backscatter Adjustments on the NOAA Ship Fairweather In Oceans 2006 Boston IEEE 1ndash4
Foote KG Chu D Baldwin KC Mayer LA McLeod A Hufnagle LC Jr Jech JM and Michaels J (2005) Protocols for calibrating multibeam sonar Journal of the Acoustical Society of America 117 2013ndash2027
Gavrilov AN and Parnum IM (2010) Fluctuations of sea-floor backscatter data from multibeam sonar systems IEEE Journal of Oceanic Engineering 35 209ndash219
Hammerstad E (2000) EM Technical Note Backscattering and Seabed Image Reflectivity Horten Norway Kongs-berg Maritime AS 5pp
Hellequin L Boucher JM and Lurton X (2003) Processing of high-frequency multibeam echo sounder data for seafloor characterization IEEE Journal of Oceanic Engi-neering 28 78ndash89
Hughes Clarke JE (1994) Towards remote seafloor classifica-tion using the angular response of acoustic backscattering a case study from multiple overlapping GLORIA data IEEE Journal of Oceanic Engineering 19 112ndash127
Hughes Clarke JE Mayer LA Mitchell NC Godin A and Costello G (1993) Processing and interpretation of 95 kHz backscatter data from shallow-water multibeam sonars In Oceans 93 Engineering in Harmony with Ocean Victoria BC Canada 437ndash442
Kenny AJ Cato I Desprez M Fader G Schuttenhelm RTE and Side J (2003) An overview of seabed-mapping tech-nologies in the context of marine habitat classification ICES Journal of Marine Science 60 411ndash418
Kleinrock MC (1992) Capabilities of some systems used to survey the deep-sea floor In Geyer R (ed) CRC hand-book of geophysical exploration at sea 2nd edition vol 2 Hard Minerals Boca Raton FL CRC Press 35ndash86
Kloser RJ Penrose JD and Butler AJ (2010) Multi-beam backscatter measurements used to infer seabed habitats Continental Shelf Research 30 1772ndash1782
Kongsberg Maritime (2010) EM Series Multibeam Echo Sounders Datagram Format Instruction Manual Report No 850-160692N
Le Bas T and Huvenne V (2009) Acquisition and process-ing of backscatter data for habitat mapping ndash compari-son of multibeam and sidescan systems Applied Acoustics 70 1248ndash1257
Lurton X (2002) An introduction to underwater acoustics Principles and applications London Springer 347pp
Lurton X Dugelay S and Augustin JM (1994) Analysis of multibeam echo-sounder signals from the deep sea-floor In Proceedings of OCEANS rsquo94 lsquoOceans Engineering for Todayrsquos Technology and Tomorrowrsquos Preservation Brest France 213ndash218
Lyons A and Abraham D (1999) Statistical characterization of high-frequency shallow-water sea-floor backscatter Journal of the Acoustical Society of America 106 1307ndash1315
Medwin H and Clay CS (1998) Fundamentals of Acoustical Oceanography Boston Academic Press 712pp
Mitchell NC (1996) Processing and analysis of Simrad multibeam sonar data Marine Geophysical Researches 18 729ndash739
Parnum IM (2007) Benthic habitat mapping using multi-beam sonar systems PhD thesis Curtin University Perth Australia 208pp
Parnum IM and Gavrilov AN (2011) High-frequency multi-beam echo-sounder measurements of seafloor backscat-ter in shallow water Part 2 ndash Mosaic production analysis and classification Underwater Technology 30 13ndash26
Parsons MJG McCauley RD Mackie M and Siwabessy PJW (2006) Evaluation of acoustic backscatter data collected from Samson Fish (Seriola hippos) spawning aggregations in Western Australia Presented at 8th European Confer-ence on Underwater Acoustics Carvoeiro Portugal 19ndash22 November
Parsons MJG Parnum IM Siwabessy PJW McCauley RD and Mackie M (2007) Multi-beam visualisation of Samson Fish (Seriola hippos) aggregations and spawning habitats in Western Australia In Papadakis JS and Bjorno L (eds) Proceedings of the Second International Conference lsquoUnderwater Acoustic Measurements Technologies and Resultsrsquo Crete Greece 684ndash692 Available at wwwuam-conferences orgindexphppast-proceedings accessed on 5 May 2011
Penrose JD Gavrilov AN and Parnum IM (2008) Statistics of seafloor backscatter measured with multibeam sonar systems In Proceedings of the 9th European Conference on Underwater Acoustics 2008 Paris France 617ndash622
Preston JM Christney AC Bloomer SF and Beaudet IL (2001) Seabed classification of multibeam sonar images In MTSIEEE Oceans 2001 Conference Honolulu Hawaii 2616ndash2623
Reson (2002) SeaBat 8125 operatorrsquos manual version 302 Goleta California Reson Inc
Talukdar KK Tyce RC and Clay CS (1995) Interpretation of Sea Beam backscatter data collected at the Laurentian fan off Nova Scotia using acoustic backscatter theory Journal of the Acoustical Society of America 97 1545ndash1558
Trevorrow MV (2005) Volumetric multibeam sonar meas-urements of fish zooplankton and turbulence In Pro-ceedings of the International Conference lsquoUnderwater Acoustic Measurements Technologies and Resultsrsquo Crete Greece Available at wwwuam-conferencesorgindexphppast-proceedings accessed on 5 May 2011
US Army Corps of Engineers (2002) Chapter 11 Acoustic multibeam survey systems for deep-draft navigation projects In Engineering and Design ndash Hydrographic Surveying Washington DC US Army Corps of Engineers 33pp
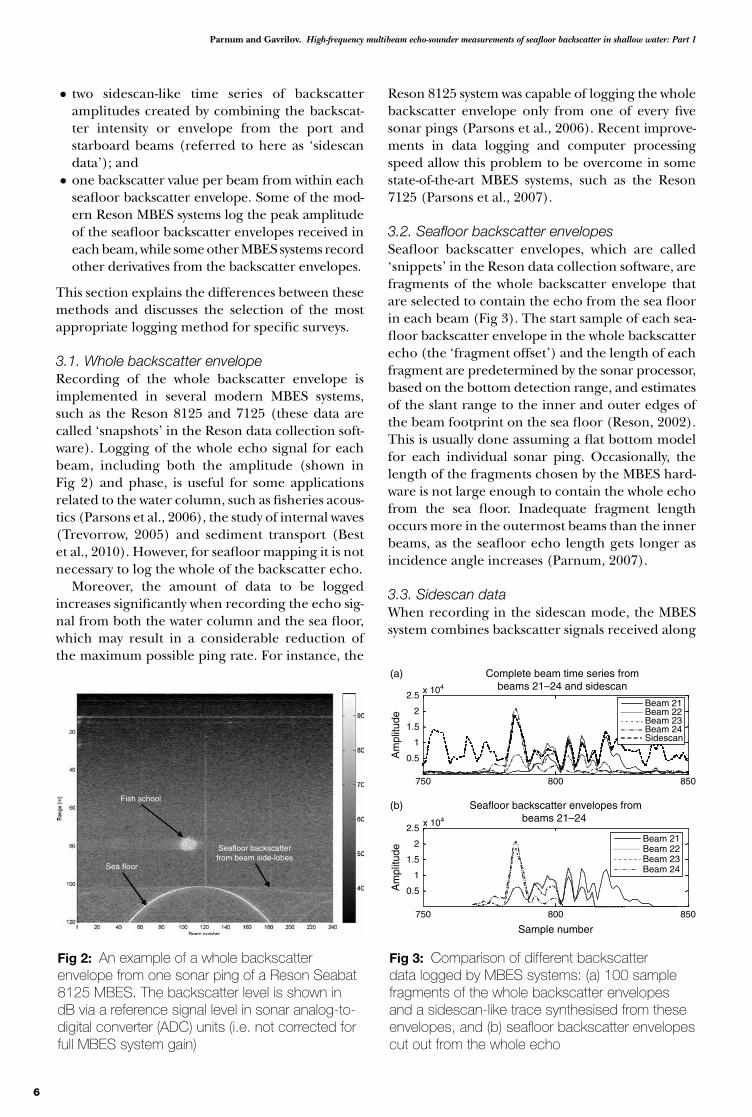
Parnum and Gavrilov High-frequency multibeam echo-sounder measurements of seafloor backscatter in shallow water Part 1
6
bull two sidescan-like time series of backscatter amplitudes created by combining the backscat-ter intensity or envelope from the port and starboard beams (referred to here as lsquosidescan datarsquo) and
bullone backscatter value per beam from within each seafloor backscatter envelope Some of the mod-ern Reson MBES systems log the peak amplitude of the seafloor backscatter envelopes received in each beam while some other MBES systems record other derivatives from the backscatter envelopes
This section explains the differences between these methods and discusses the selection of the most appropriate logging method for specific surveys
31 Whole backscatter envelopeRecording of the whole backscatter envelope is implemented in several modern MBES systems such as the Reson 8125 and 7125 (these data are called lsquosnapshotsrsquo in the Reson data collection soft-ware) Logging of the whole echo signal for each beam including both the amplitude (shown in Fig 2) and phase is useful for some applications related to the water column such as fisheries acous-tics (Parsons et al 2006) the study of internal waves (Trevorrow 2005) and sediment transport (Best et al 2010) However for seafloor mapping it is not necessary to log the whole of the backscatter echo
Moreover the amount of data to be logged increases significantly when recording the echo sig-nal from both the water column and the sea floor which may result in a considerable reduction of the maximum possible ping rate For instance the
Reson 8125 system was capable of logging the whole backscatter envelope only from one of every five sonar pings (Parsons et al 2006) Recent improve-ments in data logging and computer processing speed allow this problem to be overcome in some state-of-the-art MBES systems such as the Reson 7125 (Parsons et al 2007)
32 Seafloor backscatter envelopesSeafloor backscatter envelopes which are called lsquosnippetsrsquo in the Reson data collection software are fragments of the whole backscatter envelope that are selected to contain the echo from the sea floor in each beam (Fig 3) The start sample of each sea-floor backscatter envelope in the whole backscatter echo (the lsquofragment offsetrsquo) and the length of each fragment are predetermined by the sonar processor based on the bottom detection range and estimates of the slant range to the inner and outer edges of the beam footprint on the sea floor (Reson 2002) This is usually done assuming a flat bottom model for each individual sonar ping Occasionally the length of the fragments chosen by the MBES hard-ware is not large enough to contain the whole echo from the sea floor Inadequate fragment length occurs more in the outermost beams than the inner beams as the seafloor echo length gets longer as incidence angle increases (Parnum 2007)
33 Sidescan dataWhen recording in the sidescan mode the MBES system combines backscatter signals received along
Sea floor
Fish school
Seafloor backscatterfrom beam side-lobes
Fig 2 An example of a whole backscatterenvelope from one sonar ping of a Reson Seabat 8125 MBES The backscatter level is shown in dB via a reference signal level in sonar analog-to-digital converter (ADC) units (ie not corrected for full MBES system gain)
(a)
(b)
750 800 850
05
1
15
2
25 x 104
Am
plitu
de
750 800 850
05
1
15
2
25 x 104
Sample number
Am
plitu
de
Beam 21Beam 22Beam 23Beam 24
Beam 21Beam 22Beam 23Beam 24Sidescan
Complete beam time series frombeams 21ndash24 and sidescan
Seafloor backscatter envelopes frombeams 21ndash24
Fig 3 Comparison of different backscatterdata logged by MBES systems (a) 100 sample fragments of the whole backscatter envelopes and a sidescan-like trace synthesised from these envelopes and (b) seafloor backscatter envelopes cut out from the whole echo
7
Vol 30 No 1 2011
adjacent beams by stitching them together to form two (port and starboard) sidescan-like time series of backscatter amplitude (Fig 3) The major prob-lem in combining signals from different beams to form sidescan traces is that samples from adjacent beams coinciding in time generally have different amplitudes because the backscatter envelopes are distorted by the receive beam pattern The most appropriate way to treat overlapping samples is to correct accurately the backscatter envelopes for the beam pattern in order to equalise the overlapping samples However this is not easy to implement because it supposes the angular dependence of the backscatter amplitude within the beam pattern to be correctly projected into the time domain which requires knowing the bottom relief within the footprint
Several semi-empirical approaches to deal with overlapping samples from adjacent beams for syn-thesising a sidescan trace are implemented in some recent MBES systems For instance for the Reson 8125 the operator can substitute the overlapping samples with either their root-mean-square (RMS) or average value (Reson 2002)
There is no standard approach to combining overlapping backscatter envelopes in different beams The beam combining method can differ between MBES systems and is not known for some of them Moreover the sidescan traces synthesised by the MBES hardware are not directly linked up in the spatial domain to the MBES bathymetric data which makes it problematic to produce co-located maps of bathymetry and seafloor backscatter strength
If sidescan traces are to be collected with an MBES system it is advantageous to create them from the backscatter envelopes linked to the hori-zontal coordinates on the sea floor with corre-sponding bathymetry measured for each beam (Beaudoin et al 2002) In this case the user can choose the most appropriate algorithm for com-bining overlapping echoes from different beams eg the method based on correction for the beam pattern
34 One backscatter value per beamTo reduce the amount of data to be logged some MBES systems implement a data logging mode where a single backscatter value is recorded for each beam It can be either a single backscatter intensityenvelope sample selected by the MBES hardware or some average value calculated by the sonar processor For instance when the Reson 8125 is set in the RI-Theta (range intensity beam angle) mode the sonar processor finds the maximum amplitude of each seafloor backscatter envelope
and stores it in a separate dataset referred to as backscatter lsquointensityrsquo (even though it is amplitude and not intensity)
However using the maximum backscatter enve-lope or intensity leads to considerable and system-atic overestimation of the seafloor backscatter strength measured with the outer beams of oblique steering angles when the beam footprint is much larger than the insonification area (Gavrilov and Parnum 2010) A more physically reasonable approach which does not lead to noticeable sys-tematic errors of backscatter strength estimates would be to take the backscatter envelope sample that corresponds (or is closest) to the beam centre which is not necessarily the highest one
As shown in Gavrilov and Parnum (2010) indi-vidual samples of backscatter envelopes selected from different beams commonly have large fluctua-tions due to the stochastic nature of acoustic scat-tering which results in noisy backscatter mosaics of the sea floor Calculating the backscatter energy (ie the integral of the squared envelope) received by each beam significantly reduces the resulting fluctuations and consequently the noise in sea-floor backscatter mosaics
According to Penrose et al (2008) the system-atic error of estimating the seafloor backscatter strength from individual samples of the backscatter envelope using the approximation of the insoni-fication area by a rectangular shape given by Equations 4 and 6 is greater than that from the backscatter energy (Equation 8) Moreover in con-trast to the backscatter energy the error of back-scatter strength estimates made from individual samples of the backscatter envelope varies consid-erably with incidence angle (beam number)
35 Selection of logging methodThe method selected to log backscatter with an MBES system will be dependent on the particular objectives of a study or seafloor survey Recording the whole echo signal retains the most flexibility for post-processing and allows the backscatter signal from the water column to be stored as well However for seafloor studies it is best to maintain the highest possible ping rate and hence maximum along-track resolution If this cannot be done for the whole echo with a particular MBES system because of its limited data communicationlogging speed then recording the seafloor backscatter envelopes should be considered instead
The seafloor backscatter envelopes can be used to derive sidescan traces andor to calculate the seafloor backscatter strength for each beam The sidescan trace is useful for imaging the sea floor whereas the backscatter intensity and energy values
Parnum and Gavrilov High-frequency multibeam echo-sounder measurements of seafloor backscatter in shallow water Part 1
8
derived from each beam are more suitable for measuring the seafloor backscatter strength and examining its angular dependence Even if only one backscatter value per beam is sufficient for these purposes it is better to derive this value from the seafloor backscatter envelopes rather than to simply exploit single backscatter values logged by the system as it gives the most control to selection of the value to be used
4 Processing seafloor backscatter dataMethods for processing sonar signals backscattered from the water column are given by Cochrane et al (2003) If the whole echo signals are logged by an MBES and used for processing then seafloor back-scatter envelopes need to be located using the bathymetry measurements and extracted for calcu-lating the seafloor backscatter characteristics
Before processing the backscatter data the x y z position of the footprint centre of each beam is usually determined for each sonar ping This proce-dure is well described in the literature (eg Lurton et al 1994 US Army Corps of Engineers 2002) and commonly implemented in the bathymetry processing software provided by the sonar manu-facturer There are two approaches to processing seafloor backscatter data One is to calculate the surface backscatter coefficient (or seafloor back-scatter strength) for each beam (see Section 41) The other is to produce a sidescan trace for the port and starboard beams either from the sidescan data synthesised by the MBES or from the seafloor backscatter envelopes (discussed in detail in Beau-doin et al 2002) To produce backscatter mosaics of the seafloor from overlapping MBES swaths the effect of the incidence angle on backscatter strength needs to be taken into account and com-pensated Some of the current approaches to this problem are presented in Part 2 ndash Mosaic produc-tion analysis and classification (Parnum and Gavrilov 2011) published alongside this paper
41 Surface backscatter coefficient The surface backscatter coefficient (sbs) and the seafloor backscatter strength (BS = 10 log sbs) are calculated using either Equation 4 or Equation 8 for the backscatter intensity and energy respec-tively Before using these equations to calculate sbs the transmitted signal intensity (IS) and energy (ES) must be determined from the power and pulse length settings of the echo-sounder In addition the received signal intensity (I ) recorded by the MBES system must be corrected for total system gain to get absolute values in mPa2 The transmitted signal intensity (IS) can vary significantly with angle
within the transmit beam For example the trans-mit power of the Reson 8101 is known to vary across beams (Foote et al 2005) This should be taken into account and corrected
The total gain of an MBES system can be expressed as follows
Gtotal = G0 GA GTVG (9)
where G0 is a fixed receive system gain (including the acoustic sensitivity of the receive array and con-stant processing gain) GA is additional adjustable gain selected by the operator and GTVG is time var-ied gain (TVG) This is introduced in the sonar hardware to equalise to a certain extent the ampli-tude of echo signals received at different angles and hence different slant ranges (R) from the bottom It is commonly expressed in dBs in the fol-lowing equation
10 log GTVG = Sp log R + 2aR (10)
where the spreading coefficient (Sp) and absorption loss coefficient (a[dBm]) are set by the sonar operator These settings are usually inadequate to compensate the actual transmission loss accurately (Lurton 2002) Therefore it is highly recom-mended to remove TVG from the backscatter sig-nals recorded by the MBES system and calculate the seafloor backscatter coefficient using either Equation 4 or 8 The spreading loss (1R 4) and absorption loss (exp(-2 bR)) determined from the measurement geometry (slant range R) and the acoustic absorption coefficient (b) in water must also be determined The dependence of the acous-tic absorption coefficient on frequency water tem-perature salinity and depth can be found in Fisher and Simmons (1977)
The fixed gain (G 0) can vary for different receive beams of some MBES systems To determine this gain the MBES system must be properly calibrated for each beam For example calibration of a Reson 8125 MBES was made in a large swimming pool using a rectangular aluminium plate of known acoustic reflectivity (Parnum 2007) The plate was 40 times 40cm wide which was large enough to make sure that it reflected the sonar signal from the whole footprint of the sonar beams at the distance of about 65m The calibration results showed that this particular model had a fixed receive system gain of 186 times 10-5 analog-to-digital converter (ADC) unit per mPa that was reasonably uniform across all beams Foote et al (2005) have outlined protocols for calibrating the beam varying sensitivity using target spheres
If an MBES system is not calibrated and G0 is not known estimates of the seafloor backscatter strength can be made only in relative units Even in this case
9
Vol 30 No 1 2011
the adjustable gain (GA) TVG and settings of the transmit power and pulse length should be cor-rected to obtain measurement results independent of the system settings
Correction for the insonification (Sins) and foot-print (SFP) areas applied to the backscatter intensity and energy results respectively in relatively small systematic errors if these areas are approximated by a rectangular shape (discussed in Section 2) As shown in Penrose et al (2008) for a narrow-beam MBES system the systematic error is independent of incidence angle and equals approximately 06dB for the estimates of seafloor backscatter strength derived from the backscatter energy
The error of backscatter strength estimates from the backscatter intensity varies with incidence angles It decreases from about 06dB at vertical incidence to about -06dB at moderate angles where the transverse width of the area insonified by the transmit array is comparable to the footprint area of the receive beam As the incidence angle further increases the systematic error of the seafloor backscatter strength tends to be a value of approxi-mately 03dB The transition angle of maximum negative error depends on sea depth and transmit-ted pulse length
Fig 4(a) shows the angular dependence of the seafloor backscatter strength measured from sand using the Reson 8125 (which operates at a fre-quency of 455kHz) using the backscatter energy (solid line) the peak intensity (dashed line) and the intensity at the beam centre (dotted line) The estimates derived from the energy reveal a gradual decrease in the backscatter strength with incidence angle and are consistent with modelling predic-tions for sand The estimates made from the back-scatter intensity measured at the centre of receive beams (dotted line) are generally similar to those derived from the backscatter energy except for the angles around the transition angle where the dif-ference is expected to be about 12dB from the error prediction made by Penrose et al (2008)
The transition takes place at the angle when the footprint area of receive beams becomes larger than the insonification area as illustrated in Fig 4(b) There is also a noticeable difference at the most oblique angles where the estimates of the backscatter strength from the backscatter energy are lower This is most likely due to an insufficient length of the seafloor backscatter envelopes (snip-pets) recorded by the Reson 8125 system in the outermost beams
The angular dependence of the seafloor back-scatter strength derived from the peak intensity (dashed line in Fig 4(a)) reveals considerable over-estimation of the backscatter strength at angles
that are much larger than the transition angle This effect is explained in detail in Gavrilov and Parnum (2010) based on the theory of extreme value statistics
There are some additional factors related to some specific MBES models that may affect the measure-ments of seafloor backscatter For example in a series of experiments with the Reson SeaBat 8111 and 8160 MBES systems Fonseca et al (2006) found that the seafloor backscatter strength (BS ) measured from the received backscatter intensity increased gradually with the transmitted pulse length This occurred even after correction for the insonification area which is the only variable in Equation 4 that depends on pulse length
A similar effect was also observed by Parnum (2007) which examined the effects of system set-ting on the seafloor backscatter measurements made with the Reson 8125 over a flat seafloor area covered with sand The mean BS values measured at different pulse lengths are shown in Fig 5(b) as a function of incidence angle When the pulse length was longer than 73ms the BS measurements were
003
004
005
006
007
Are
a (m
2 )
0 10 20 30 40 50 60
Incidence angle (deg)
ndash8
Bac
ksca
tter
stre
ngth
(dB
)
Transition anglendash22
ndash20
ndash18
ndash16
ndash14
ndash12
ndash10EnergyPeak intensityCentre beam intensity
(a)
(b)
Beam footprintTransmit insonification areaBeam insonification area
Fig 4 (a) Angular dependence of seafloorbackscatter strength derived from MBES data collected over flat sand in Cockburn Sound in 2005 The seafloor backscatter strength was estimated from the backscatter energy (solid line) intensity at the beam centre (dotted line) and peak intensity (dashed line) (b) Relationship between the area insonified by the transmit array and the footprint area of the receive beam
Parnum and Gavrilov High-frequency multibeam echo-sounder measurements of seafloor backscatter in shallow water Part 1
10
adequately corrected for changes in the pulse length while the BS values for shorter sonar pulses were underestimated The cause of this effect was found after calibration of this MBES (Parnum 2007)
The frequency bandwidth of the sonar transmit-ter was apparently not wide enough to transmit short pulses without amplitude distortion The amplitude of sonar pulses reflected from an alu-minium plate and received by the echo-sounder corresponded to the sonar power setting and experiment setup only when the pulse length was 151ms or larger (Fig 5(b)) The peak amplitude was slightly lower at 101ms pulse length and dropped almost by half at 51ms Consequently longer sonar pulses should be chosen to get accurate seafloor backscatter measurements that are independent of sonar system parameters If shorter pulses are pre-ferred to get the maximum bathymetry resolution
then the effect of limited frequency bandwidth should be taken into account
5 DiscussionBackscatter data logging and processing methods along with possible errors associated with them are considered in this paper using characteristics of the Reson SeaBat 8125 MBES hardware The older Reson high-frequency MBESs such as the SeaBat 8101 collect backscatter data in a similar way as the Reson 8125 so that the processing methods and errors discussed are directly applicable to them The most recent Reson MBES of the 7K series such as the SeaBat 7125 are capable of collecting the whole backscatter echo in each beam with every ping This means that seafloor backscatter character-istics can be derived directly from the backscatter signals that are not distorted by the limited length of snippet data
According to the latest instruction manual for datagram format (Kongsberg Maritime 2010) the Kongsberg-Simrad MBES systems of the EM series store two types of backscatter data seafloor back-scatter strength in dB calculated by the sonar system for vertical and oblique incidence (only two values per ping) and envelopes of the echo signals recorded in each beam and referred to as lsquoseabed image datarsquo by Kongsberg The seafloor backscatter strength is calculated according to the method described in Hammerstad (2000)
The seabed image data (echo envelopes) stored in a logarithmic scale (in dB) are centred around the bottom detection time and limited by those in the adjacent beams Therefore these backscatter data from the Simrad MBESs can be regarded as analogues to snippet data and processed similarly to the Reson snippet data to measure seafloor back-scatter characteristics Unfortunately the length of the seabed image data in individual beams is not much especially in near-vertical beams where it consists of a few samples so that it does not repre-sent the whole envelope of the signal backscattered from the bottom Consequently the energy of backscatter cannot be accurately measured
To obtain absolute values of the seafloor back-scatter strength it is necessary to know the total system gain common for all beams and inter-beam variations of the system gain that are affected by the sonar geometry and beamforming Kongsberg claims that its recent MBES systems are fully cali-brated which apparently means the seabed imaging data are represented in dB re 1mPa Reson usually does not provide calibration data for its MBES sys-tems Therefore a calibration procedure similar to that described in Parnum (2007) is required to
0 5 10 15 20 25 30 35 40 45 50 55 60
ndash22
ndash20
ndash18
ndash16
ndash14
ndash12
ndash10
ndash8(a)
(b)Incidence angle (deg)
Bac
ksca
tter
stre
ngth
(dB
)
31micros
40micros
51micros
73micros
101micros
141micros
11 12 13 14 15 16 170
2000
4000
6000
8000
10000
12000
14000
16000
Time (ms)
Am
plitu
de
51micros 101micros 152micros 292micros
Fig 5 (a) Mean backscatter strength versus incidence angle measured with the Reson Seabat 8125 MBES from an area of flat sand for a range of pulse lengths from 31ms to 292ms (b) Envelopes of sonar pulses reflected from an aluminium plate as measured by the Reson 8125 with the same power setting but different pulse lengths
11
Vol 30 No 1 2011
determine the overall system gain and its inter-beam variations if the absolute values of the seafloor backscatter strength are to be measured
Almost all modern MBES systems produce sidescan-like data of seafloor backscatter To gain an understanding of how these data are related to the actual backscatter properties of the sea floor including statistics (eg the mean value and disper-sion) it is important to know how these sidescan data are produced by an MBES system Acoustic backscattering from the sea floor is a stochastic process with a certain distribution which depends mainly on sonar frequency seafloor roughness and incidence angle (eg Lyons and Abraham 1999 Gavrilov and Parnum 2010)
As discussed in Section 4 the geometry of back-scatter measurements by an MBES system can distort the measured values and their statistics Moreover processing of backscatter samples implemented in the sonar hardware may also affect the measured values in an unexpected way Some MBES systems such as the Reson SeaBat echo-sounders produce sidescan data via averaging overlapping backscatter samples from adjacent beams Such processing dis-torts the backscatter distribution and consequently its mean and dispersion (Gavrilov and Parnum 2010) Therefore the most appropriate way to syn-thesise sidescan data from the MBES backscatter envelopes is to correct the amplitude of envelope samples for the beam pattern in each beam so as to equalise the overlapping samples and then stitch together all backscatter envelopes
6 ConclusionsIt has been shown that backscatter data collected with MBES systems under different experimental conditions can be corrected for beam geometry transmission loss and system settings However there can still be residual artefacts persisting due to either approximation of the backscattering area by a rectangle or inappropriate selection of system settings Therefore it is important to take account of the possible effects of the system settings and parameters on the measurements of seafloor back-scatter strength In particular the following should be considered
bullCalibration of the MBES system is desirable especially to determine the overall systemrsquos gain including inter-beam variations the transducerrsquos frequency band and the shape of transmit and receive beam patterns Ideally calibration is to be performed in a controlled environment with known targets and an accurate and well-controlled alignment of the sonar head and targets
bullTo obtain accurate measurements of the seafloor backscatter strength and its angular dependence using MBES data it is important to know (1) what kind of acoustical characteristics of backscatter signals (eg backscatter envelope or intensity or level in dB) is actually logged by the sonar hard-ware and (2) what kind of processing (eg aver-aging) is applied to the backscatter signal by the sonar hardware before data logging The algorithm for backscatter measurements dis-cussed in Section 2 should be adjusted accord-ing to the backscatter characteristic recorded by the MBES
bullWhen collecting backscatter data power gain and pulse length settings should be chosen appropriately so that the actual signal character-istics correspond to the expectations from the settings and system parameters
If these recommendations are followed back-scatter measurements should only be dependent on the seafloor properties incidence angle and sonar frequency In this case the measured back-scatter data can be used to discriminate between different seafloor types
ReferencesAugustin J-M and Lurton X (2005) Image amplitude cali-
bration and processing for seafloor mapping sonars In IEEE Oceans 2005 Conference Proc Brest 698ndash701
Augustin J-M Le Suave R Lurton X Voisset M Dugelay S and Satra C (1996) Contribution of multibeam acoustic imagery to the exploration of the sea bottom Marine Geo-physical Researches 18 459ndash486
Beaudoin JD Hughes Clarke JE Van Den Ameele EJ and Gardner JV (2002) Geometric and radiometric correc-tion of multibeam backscatter derived from Reson 8101 systems In Proceedings of the Canadian Hydrographic Con-ference 2002 Canadian Hydrographic Association Ottawa Ontario Summer CD-ROM 8pp
Bentrem FW Avera WE and Sample J (2006) Estimating surface sediments using multibeam sonar Sea Technology 47 37ndash40
Best J Simmons S Parsons D Oberg K Czuba J and Mal-zone C (2010) A new methodology for the quantitative visualization of coherent flow structures in alluvial chan-nels using multibeam echo-sounding (MBES) Geophysi-cal Research Letters 37 L06405 6pp
Brown CJ and Blondel P (2009) Developments in the appli-cation of multibeam sonar backscatter for seafloor habi-tat mapping Applied Acoustics 70 1242ndash1247
Canepa G and Pace NG (2000) Seafloor segmentation from multibeam bathymetric sonar In Chevret P and Zakharia ME (eds) Proceedings of the Fifth European Confer-ence on Underwater Acoustics Lyon France 361ndash366
Cochrane NA Li Y and Melvin GD (2003) Quantifications of a multibeam sonar for fisheries assessment applications Journal of the Acoustical Society of America 114 745ndash758
De Falco G Tonielli R Di Martino G Innangi S Simeone S and Parnum IM (2010) Relationships between multibeam
Parnum and Gavrilov High-frequency multibeam echo-sounder measurements of seafloor backscatter in shallow water Part 1
12
backscatter sediment grain size and Posidonia ocean-ica seagrass distribution Continental Shelf Research 30 1941ndash1950
de Moustier CP (1986) Beyond bathymetry Mapping acous-tic backscattering from the deep seafloor with Sea Beam Journal of the Acoustical Society of America 79 316ndash331
Fisher FH and Simmons VP (1977) Sound absorption in seawater The Journal of the Acoustical Society of America 62 558ndash564
Fonseca L and Mayer L (2007) Remote estimation of surficial seafloor properties through the application of angular range analysis to multibeam sonar data Marine Geophysical Researches 28 119ndash126
Fonseca L Calder B and Wetzler M (2006) Experiments for Multibeam Backscatter Adjustments on the NOAA Ship Fairweather In Oceans 2006 Boston IEEE 1ndash4
Foote KG Chu D Baldwin KC Mayer LA McLeod A Hufnagle LC Jr Jech JM and Michaels J (2005) Protocols for calibrating multibeam sonar Journal of the Acoustical Society of America 117 2013ndash2027
Gavrilov AN and Parnum IM (2010) Fluctuations of sea-floor backscatter data from multibeam sonar systems IEEE Journal of Oceanic Engineering 35 209ndash219
Hammerstad E (2000) EM Technical Note Backscattering and Seabed Image Reflectivity Horten Norway Kongs-berg Maritime AS 5pp
Hellequin L Boucher JM and Lurton X (2003) Processing of high-frequency multibeam echo sounder data for seafloor characterization IEEE Journal of Oceanic Engi-neering 28 78ndash89
Hughes Clarke JE (1994) Towards remote seafloor classifica-tion using the angular response of acoustic backscattering a case study from multiple overlapping GLORIA data IEEE Journal of Oceanic Engineering 19 112ndash127
Hughes Clarke JE Mayer LA Mitchell NC Godin A and Costello G (1993) Processing and interpretation of 95 kHz backscatter data from shallow-water multibeam sonars In Oceans 93 Engineering in Harmony with Ocean Victoria BC Canada 437ndash442
Kenny AJ Cato I Desprez M Fader G Schuttenhelm RTE and Side J (2003) An overview of seabed-mapping tech-nologies in the context of marine habitat classification ICES Journal of Marine Science 60 411ndash418
Kleinrock MC (1992) Capabilities of some systems used to survey the deep-sea floor In Geyer R (ed) CRC hand-book of geophysical exploration at sea 2nd edition vol 2 Hard Minerals Boca Raton FL CRC Press 35ndash86
Kloser RJ Penrose JD and Butler AJ (2010) Multi-beam backscatter measurements used to infer seabed habitats Continental Shelf Research 30 1772ndash1782
Kongsberg Maritime (2010) EM Series Multibeam Echo Sounders Datagram Format Instruction Manual Report No 850-160692N
Le Bas T and Huvenne V (2009) Acquisition and process-ing of backscatter data for habitat mapping ndash compari-son of multibeam and sidescan systems Applied Acoustics 70 1248ndash1257
Lurton X (2002) An introduction to underwater acoustics Principles and applications London Springer 347pp
Lurton X Dugelay S and Augustin JM (1994) Analysis of multibeam echo-sounder signals from the deep sea-floor In Proceedings of OCEANS rsquo94 lsquoOceans Engineering for Todayrsquos Technology and Tomorrowrsquos Preservation Brest France 213ndash218
Lyons A and Abraham D (1999) Statistical characterization of high-frequency shallow-water sea-floor backscatter Journal of the Acoustical Society of America 106 1307ndash1315
Medwin H and Clay CS (1998) Fundamentals of Acoustical Oceanography Boston Academic Press 712pp
Mitchell NC (1996) Processing and analysis of Simrad multibeam sonar data Marine Geophysical Researches 18 729ndash739
Parnum IM (2007) Benthic habitat mapping using multi-beam sonar systems PhD thesis Curtin University Perth Australia 208pp
Parnum IM and Gavrilov AN (2011) High-frequency multi-beam echo-sounder measurements of seafloor backscat-ter in shallow water Part 2 ndash Mosaic production analysis and classification Underwater Technology 30 13ndash26
Parsons MJG McCauley RD Mackie M and Siwabessy PJW (2006) Evaluation of acoustic backscatter data collected from Samson Fish (Seriola hippos) spawning aggregations in Western Australia Presented at 8th European Confer-ence on Underwater Acoustics Carvoeiro Portugal 19ndash22 November
Parsons MJG Parnum IM Siwabessy PJW McCauley RD and Mackie M (2007) Multi-beam visualisation of Samson Fish (Seriola hippos) aggregations and spawning habitats in Western Australia In Papadakis JS and Bjorno L (eds) Proceedings of the Second International Conference lsquoUnderwater Acoustic Measurements Technologies and Resultsrsquo Crete Greece 684ndash692 Available at wwwuam-conferences orgindexphppast-proceedings accessed on 5 May 2011
Penrose JD Gavrilov AN and Parnum IM (2008) Statistics of seafloor backscatter measured with multibeam sonar systems In Proceedings of the 9th European Conference on Underwater Acoustics 2008 Paris France 617ndash622
Preston JM Christney AC Bloomer SF and Beaudet IL (2001) Seabed classification of multibeam sonar images In MTSIEEE Oceans 2001 Conference Honolulu Hawaii 2616ndash2623
Reson (2002) SeaBat 8125 operatorrsquos manual version 302 Goleta California Reson Inc
Talukdar KK Tyce RC and Clay CS (1995) Interpretation of Sea Beam backscatter data collected at the Laurentian fan off Nova Scotia using acoustic backscatter theory Journal of the Acoustical Society of America 97 1545ndash1558
Trevorrow MV (2005) Volumetric multibeam sonar meas-urements of fish zooplankton and turbulence In Pro-ceedings of the International Conference lsquoUnderwater Acoustic Measurements Technologies and Resultsrsquo Crete Greece Available at wwwuam-conferencesorgindexphppast-proceedings accessed on 5 May 2011
US Army Corps of Engineers (2002) Chapter 11 Acoustic multibeam survey systems for deep-draft navigation projects In Engineering and Design ndash Hydrographic Surveying Washington DC US Army Corps of Engineers 33pp

Parnum and Gavrilov High-frequency multibeam echo-sounder measurements of seafloor backscatter in shallow water Part 1
8
derived from each beam are more suitable for measuring the seafloor backscatter strength and examining its angular dependence Even if only one backscatter value per beam is sufficient for these purposes it is better to derive this value from the seafloor backscatter envelopes rather than to simply exploit single backscatter values logged by the system as it gives the most control to selection of the value to be used
4 Processing seafloor backscatter dataMethods for processing sonar signals backscattered from the water column are given by Cochrane et al (2003) If the whole echo signals are logged by an MBES and used for processing then seafloor back-scatter envelopes need to be located using the bathymetry measurements and extracted for calcu-lating the seafloor backscatter characteristics
Before processing the backscatter data the x y z position of the footprint centre of each beam is usually determined for each sonar ping This proce-dure is well described in the literature (eg Lurton et al 1994 US Army Corps of Engineers 2002) and commonly implemented in the bathymetry processing software provided by the sonar manu-facturer There are two approaches to processing seafloor backscatter data One is to calculate the surface backscatter coefficient (or seafloor back-scatter strength) for each beam (see Section 41) The other is to produce a sidescan trace for the port and starboard beams either from the sidescan data synthesised by the MBES or from the seafloor backscatter envelopes (discussed in detail in Beau-doin et al 2002) To produce backscatter mosaics of the seafloor from overlapping MBES swaths the effect of the incidence angle on backscatter strength needs to be taken into account and com-pensated Some of the current approaches to this problem are presented in Part 2 ndash Mosaic produc-tion analysis and classification (Parnum and Gavrilov 2011) published alongside this paper
41 Surface backscatter coefficient The surface backscatter coefficient (sbs) and the seafloor backscatter strength (BS = 10 log sbs) are calculated using either Equation 4 or Equation 8 for the backscatter intensity and energy respec-tively Before using these equations to calculate sbs the transmitted signal intensity (IS) and energy (ES) must be determined from the power and pulse length settings of the echo-sounder In addition the received signal intensity (I ) recorded by the MBES system must be corrected for total system gain to get absolute values in mPa2 The transmitted signal intensity (IS) can vary significantly with angle
within the transmit beam For example the trans-mit power of the Reson 8101 is known to vary across beams (Foote et al 2005) This should be taken into account and corrected
The total gain of an MBES system can be expressed as follows
Gtotal = G0 GA GTVG (9)
where G0 is a fixed receive system gain (including the acoustic sensitivity of the receive array and con-stant processing gain) GA is additional adjustable gain selected by the operator and GTVG is time var-ied gain (TVG) This is introduced in the sonar hardware to equalise to a certain extent the ampli-tude of echo signals received at different angles and hence different slant ranges (R) from the bottom It is commonly expressed in dBs in the fol-lowing equation
10 log GTVG = Sp log R + 2aR (10)
where the spreading coefficient (Sp) and absorption loss coefficient (a[dBm]) are set by the sonar operator These settings are usually inadequate to compensate the actual transmission loss accurately (Lurton 2002) Therefore it is highly recom-mended to remove TVG from the backscatter sig-nals recorded by the MBES system and calculate the seafloor backscatter coefficient using either Equation 4 or 8 The spreading loss (1R 4) and absorption loss (exp(-2 bR)) determined from the measurement geometry (slant range R) and the acoustic absorption coefficient (b) in water must also be determined The dependence of the acous-tic absorption coefficient on frequency water tem-perature salinity and depth can be found in Fisher and Simmons (1977)
The fixed gain (G 0) can vary for different receive beams of some MBES systems To determine this gain the MBES system must be properly calibrated for each beam For example calibration of a Reson 8125 MBES was made in a large swimming pool using a rectangular aluminium plate of known acoustic reflectivity (Parnum 2007) The plate was 40 times 40cm wide which was large enough to make sure that it reflected the sonar signal from the whole footprint of the sonar beams at the distance of about 65m The calibration results showed that this particular model had a fixed receive system gain of 186 times 10-5 analog-to-digital converter (ADC) unit per mPa that was reasonably uniform across all beams Foote et al (2005) have outlined protocols for calibrating the beam varying sensitivity using target spheres
If an MBES system is not calibrated and G0 is not known estimates of the seafloor backscatter strength can be made only in relative units Even in this case
9
Vol 30 No 1 2011
the adjustable gain (GA) TVG and settings of the transmit power and pulse length should be cor-rected to obtain measurement results independent of the system settings
Correction for the insonification (Sins) and foot-print (SFP) areas applied to the backscatter intensity and energy results respectively in relatively small systematic errors if these areas are approximated by a rectangular shape (discussed in Section 2) As shown in Penrose et al (2008) for a narrow-beam MBES system the systematic error is independent of incidence angle and equals approximately 06dB for the estimates of seafloor backscatter strength derived from the backscatter energy
The error of backscatter strength estimates from the backscatter intensity varies with incidence angles It decreases from about 06dB at vertical incidence to about -06dB at moderate angles where the transverse width of the area insonified by the transmit array is comparable to the footprint area of the receive beam As the incidence angle further increases the systematic error of the seafloor backscatter strength tends to be a value of approxi-mately 03dB The transition angle of maximum negative error depends on sea depth and transmit-ted pulse length
Fig 4(a) shows the angular dependence of the seafloor backscatter strength measured from sand using the Reson 8125 (which operates at a fre-quency of 455kHz) using the backscatter energy (solid line) the peak intensity (dashed line) and the intensity at the beam centre (dotted line) The estimates derived from the energy reveal a gradual decrease in the backscatter strength with incidence angle and are consistent with modelling predic-tions for sand The estimates made from the back-scatter intensity measured at the centre of receive beams (dotted line) are generally similar to those derived from the backscatter energy except for the angles around the transition angle where the dif-ference is expected to be about 12dB from the error prediction made by Penrose et al (2008)
The transition takes place at the angle when the footprint area of receive beams becomes larger than the insonification area as illustrated in Fig 4(b) There is also a noticeable difference at the most oblique angles where the estimates of the backscatter strength from the backscatter energy are lower This is most likely due to an insufficient length of the seafloor backscatter envelopes (snip-pets) recorded by the Reson 8125 system in the outermost beams
The angular dependence of the seafloor back-scatter strength derived from the peak intensity (dashed line in Fig 4(a)) reveals considerable over-estimation of the backscatter strength at angles
that are much larger than the transition angle This effect is explained in detail in Gavrilov and Parnum (2010) based on the theory of extreme value statistics
There are some additional factors related to some specific MBES models that may affect the measure-ments of seafloor backscatter For example in a series of experiments with the Reson SeaBat 8111 and 8160 MBES systems Fonseca et al (2006) found that the seafloor backscatter strength (BS ) measured from the received backscatter intensity increased gradually with the transmitted pulse length This occurred even after correction for the insonification area which is the only variable in Equation 4 that depends on pulse length
A similar effect was also observed by Parnum (2007) which examined the effects of system set-ting on the seafloor backscatter measurements made with the Reson 8125 over a flat seafloor area covered with sand The mean BS values measured at different pulse lengths are shown in Fig 5(b) as a function of incidence angle When the pulse length was longer than 73ms the BS measurements were
003
004
005
006
007
Are
a (m
2 )
0 10 20 30 40 50 60
Incidence angle (deg)
ndash8
Bac
ksca
tter
stre
ngth
(dB
)
Transition anglendash22
ndash20
ndash18
ndash16
ndash14
ndash12
ndash10EnergyPeak intensityCentre beam intensity
(a)
(b)
Beam footprintTransmit insonification areaBeam insonification area
Fig 4 (a) Angular dependence of seafloorbackscatter strength derived from MBES data collected over flat sand in Cockburn Sound in 2005 The seafloor backscatter strength was estimated from the backscatter energy (solid line) intensity at the beam centre (dotted line) and peak intensity (dashed line) (b) Relationship between the area insonified by the transmit array and the footprint area of the receive beam
Parnum and Gavrilov High-frequency multibeam echo-sounder measurements of seafloor backscatter in shallow water Part 1
10
adequately corrected for changes in the pulse length while the BS values for shorter sonar pulses were underestimated The cause of this effect was found after calibration of this MBES (Parnum 2007)
The frequency bandwidth of the sonar transmit-ter was apparently not wide enough to transmit short pulses without amplitude distortion The amplitude of sonar pulses reflected from an alu-minium plate and received by the echo-sounder corresponded to the sonar power setting and experiment setup only when the pulse length was 151ms or larger (Fig 5(b)) The peak amplitude was slightly lower at 101ms pulse length and dropped almost by half at 51ms Consequently longer sonar pulses should be chosen to get accurate seafloor backscatter measurements that are independent of sonar system parameters If shorter pulses are pre-ferred to get the maximum bathymetry resolution
then the effect of limited frequency bandwidth should be taken into account
5 DiscussionBackscatter data logging and processing methods along with possible errors associated with them are considered in this paper using characteristics of the Reson SeaBat 8125 MBES hardware The older Reson high-frequency MBESs such as the SeaBat 8101 collect backscatter data in a similar way as the Reson 8125 so that the processing methods and errors discussed are directly applicable to them The most recent Reson MBES of the 7K series such as the SeaBat 7125 are capable of collecting the whole backscatter echo in each beam with every ping This means that seafloor backscatter character-istics can be derived directly from the backscatter signals that are not distorted by the limited length of snippet data
According to the latest instruction manual for datagram format (Kongsberg Maritime 2010) the Kongsberg-Simrad MBES systems of the EM series store two types of backscatter data seafloor back-scatter strength in dB calculated by the sonar system for vertical and oblique incidence (only two values per ping) and envelopes of the echo signals recorded in each beam and referred to as lsquoseabed image datarsquo by Kongsberg The seafloor backscatter strength is calculated according to the method described in Hammerstad (2000)
The seabed image data (echo envelopes) stored in a logarithmic scale (in dB) are centred around the bottom detection time and limited by those in the adjacent beams Therefore these backscatter data from the Simrad MBESs can be regarded as analogues to snippet data and processed similarly to the Reson snippet data to measure seafloor back-scatter characteristics Unfortunately the length of the seabed image data in individual beams is not much especially in near-vertical beams where it consists of a few samples so that it does not repre-sent the whole envelope of the signal backscattered from the bottom Consequently the energy of backscatter cannot be accurately measured
To obtain absolute values of the seafloor back-scatter strength it is necessary to know the total system gain common for all beams and inter-beam variations of the system gain that are affected by the sonar geometry and beamforming Kongsberg claims that its recent MBES systems are fully cali-brated which apparently means the seabed imaging data are represented in dB re 1mPa Reson usually does not provide calibration data for its MBES sys-tems Therefore a calibration procedure similar to that described in Parnum (2007) is required to
0 5 10 15 20 25 30 35 40 45 50 55 60
ndash22
ndash20
ndash18
ndash16
ndash14
ndash12
ndash10
ndash8(a)
(b)Incidence angle (deg)
Bac
ksca
tter
stre
ngth
(dB
)
31micros
40micros
51micros
73micros
101micros
141micros
11 12 13 14 15 16 170
2000
4000
6000
8000
10000
12000
14000
16000
Time (ms)
Am
plitu
de
51micros 101micros 152micros 292micros
Fig 5 (a) Mean backscatter strength versus incidence angle measured with the Reson Seabat 8125 MBES from an area of flat sand for a range of pulse lengths from 31ms to 292ms (b) Envelopes of sonar pulses reflected from an aluminium plate as measured by the Reson 8125 with the same power setting but different pulse lengths
11
Vol 30 No 1 2011
determine the overall system gain and its inter-beam variations if the absolute values of the seafloor backscatter strength are to be measured
Almost all modern MBES systems produce sidescan-like data of seafloor backscatter To gain an understanding of how these data are related to the actual backscatter properties of the sea floor including statistics (eg the mean value and disper-sion) it is important to know how these sidescan data are produced by an MBES system Acoustic backscattering from the sea floor is a stochastic process with a certain distribution which depends mainly on sonar frequency seafloor roughness and incidence angle (eg Lyons and Abraham 1999 Gavrilov and Parnum 2010)
As discussed in Section 4 the geometry of back-scatter measurements by an MBES system can distort the measured values and their statistics Moreover processing of backscatter samples implemented in the sonar hardware may also affect the measured values in an unexpected way Some MBES systems such as the Reson SeaBat echo-sounders produce sidescan data via averaging overlapping backscatter samples from adjacent beams Such processing dis-torts the backscatter distribution and consequently its mean and dispersion (Gavrilov and Parnum 2010) Therefore the most appropriate way to syn-thesise sidescan data from the MBES backscatter envelopes is to correct the amplitude of envelope samples for the beam pattern in each beam so as to equalise the overlapping samples and then stitch together all backscatter envelopes
6 ConclusionsIt has been shown that backscatter data collected with MBES systems under different experimental conditions can be corrected for beam geometry transmission loss and system settings However there can still be residual artefacts persisting due to either approximation of the backscattering area by a rectangle or inappropriate selection of system settings Therefore it is important to take account of the possible effects of the system settings and parameters on the measurements of seafloor back-scatter strength In particular the following should be considered
bullCalibration of the MBES system is desirable especially to determine the overall systemrsquos gain including inter-beam variations the transducerrsquos frequency band and the shape of transmit and receive beam patterns Ideally calibration is to be performed in a controlled environment with known targets and an accurate and well-controlled alignment of the sonar head and targets
bullTo obtain accurate measurements of the seafloor backscatter strength and its angular dependence using MBES data it is important to know (1) what kind of acoustical characteristics of backscatter signals (eg backscatter envelope or intensity or level in dB) is actually logged by the sonar hard-ware and (2) what kind of processing (eg aver-aging) is applied to the backscatter signal by the sonar hardware before data logging The algorithm for backscatter measurements dis-cussed in Section 2 should be adjusted accord-ing to the backscatter characteristic recorded by the MBES
bullWhen collecting backscatter data power gain and pulse length settings should be chosen appropriately so that the actual signal character-istics correspond to the expectations from the settings and system parameters
If these recommendations are followed back-scatter measurements should only be dependent on the seafloor properties incidence angle and sonar frequency In this case the measured back-scatter data can be used to discriminate between different seafloor types
ReferencesAugustin J-M and Lurton X (2005) Image amplitude cali-
bration and processing for seafloor mapping sonars In IEEE Oceans 2005 Conference Proc Brest 698ndash701
Augustin J-M Le Suave R Lurton X Voisset M Dugelay S and Satra C (1996) Contribution of multibeam acoustic imagery to the exploration of the sea bottom Marine Geo-physical Researches 18 459ndash486
Beaudoin JD Hughes Clarke JE Van Den Ameele EJ and Gardner JV (2002) Geometric and radiometric correc-tion of multibeam backscatter derived from Reson 8101 systems In Proceedings of the Canadian Hydrographic Con-ference 2002 Canadian Hydrographic Association Ottawa Ontario Summer CD-ROM 8pp
Bentrem FW Avera WE and Sample J (2006) Estimating surface sediments using multibeam sonar Sea Technology 47 37ndash40
Best J Simmons S Parsons D Oberg K Czuba J and Mal-zone C (2010) A new methodology for the quantitative visualization of coherent flow structures in alluvial chan-nels using multibeam echo-sounding (MBES) Geophysi-cal Research Letters 37 L06405 6pp
Brown CJ and Blondel P (2009) Developments in the appli-cation of multibeam sonar backscatter for seafloor habi-tat mapping Applied Acoustics 70 1242ndash1247
Canepa G and Pace NG (2000) Seafloor segmentation from multibeam bathymetric sonar In Chevret P and Zakharia ME (eds) Proceedings of the Fifth European Confer-ence on Underwater Acoustics Lyon France 361ndash366
Cochrane NA Li Y and Melvin GD (2003) Quantifications of a multibeam sonar for fisheries assessment applications Journal of the Acoustical Society of America 114 745ndash758
De Falco G Tonielli R Di Martino G Innangi S Simeone S and Parnum IM (2010) Relationships between multibeam
Parnum and Gavrilov High-frequency multibeam echo-sounder measurements of seafloor backscatter in shallow water Part 1
12
backscatter sediment grain size and Posidonia ocean-ica seagrass distribution Continental Shelf Research 30 1941ndash1950
de Moustier CP (1986) Beyond bathymetry Mapping acous-tic backscattering from the deep seafloor with Sea Beam Journal of the Acoustical Society of America 79 316ndash331
Fisher FH and Simmons VP (1977) Sound absorption in seawater The Journal of the Acoustical Society of America 62 558ndash564
Fonseca L and Mayer L (2007) Remote estimation of surficial seafloor properties through the application of angular range analysis to multibeam sonar data Marine Geophysical Researches 28 119ndash126
Fonseca L Calder B and Wetzler M (2006) Experiments for Multibeam Backscatter Adjustments on the NOAA Ship Fairweather In Oceans 2006 Boston IEEE 1ndash4
Foote KG Chu D Baldwin KC Mayer LA McLeod A Hufnagle LC Jr Jech JM and Michaels J (2005) Protocols for calibrating multibeam sonar Journal of the Acoustical Society of America 117 2013ndash2027
Gavrilov AN and Parnum IM (2010) Fluctuations of sea-floor backscatter data from multibeam sonar systems IEEE Journal of Oceanic Engineering 35 209ndash219
Hammerstad E (2000) EM Technical Note Backscattering and Seabed Image Reflectivity Horten Norway Kongs-berg Maritime AS 5pp
Hellequin L Boucher JM and Lurton X (2003) Processing of high-frequency multibeam echo sounder data for seafloor characterization IEEE Journal of Oceanic Engi-neering 28 78ndash89
Hughes Clarke JE (1994) Towards remote seafloor classifica-tion using the angular response of acoustic backscattering a case study from multiple overlapping GLORIA data IEEE Journal of Oceanic Engineering 19 112ndash127
Hughes Clarke JE Mayer LA Mitchell NC Godin A and Costello G (1993) Processing and interpretation of 95 kHz backscatter data from shallow-water multibeam sonars In Oceans 93 Engineering in Harmony with Ocean Victoria BC Canada 437ndash442
Kenny AJ Cato I Desprez M Fader G Schuttenhelm RTE and Side J (2003) An overview of seabed-mapping tech-nologies in the context of marine habitat classification ICES Journal of Marine Science 60 411ndash418
Kleinrock MC (1992) Capabilities of some systems used to survey the deep-sea floor In Geyer R (ed) CRC hand-book of geophysical exploration at sea 2nd edition vol 2 Hard Minerals Boca Raton FL CRC Press 35ndash86
Kloser RJ Penrose JD and Butler AJ (2010) Multi-beam backscatter measurements used to infer seabed habitats Continental Shelf Research 30 1772ndash1782
Kongsberg Maritime (2010) EM Series Multibeam Echo Sounders Datagram Format Instruction Manual Report No 850-160692N
Le Bas T and Huvenne V (2009) Acquisition and process-ing of backscatter data for habitat mapping ndash compari-son of multibeam and sidescan systems Applied Acoustics 70 1248ndash1257
Lurton X (2002) An introduction to underwater acoustics Principles and applications London Springer 347pp
Lurton X Dugelay S and Augustin JM (1994) Analysis of multibeam echo-sounder signals from the deep sea-floor In Proceedings of OCEANS rsquo94 lsquoOceans Engineering for Todayrsquos Technology and Tomorrowrsquos Preservation Brest France 213ndash218
Lyons A and Abraham D (1999) Statistical characterization of high-frequency shallow-water sea-floor backscatter Journal of the Acoustical Society of America 106 1307ndash1315
Medwin H and Clay CS (1998) Fundamentals of Acoustical Oceanography Boston Academic Press 712pp
Mitchell NC (1996) Processing and analysis of Simrad multibeam sonar data Marine Geophysical Researches 18 729ndash739
Parnum IM (2007) Benthic habitat mapping using multi-beam sonar systems PhD thesis Curtin University Perth Australia 208pp
Parnum IM and Gavrilov AN (2011) High-frequency multi-beam echo-sounder measurements of seafloor backscat-ter in shallow water Part 2 ndash Mosaic production analysis and classification Underwater Technology 30 13ndash26
Parsons MJG McCauley RD Mackie M and Siwabessy PJW (2006) Evaluation of acoustic backscatter data collected from Samson Fish (Seriola hippos) spawning aggregations in Western Australia Presented at 8th European Confer-ence on Underwater Acoustics Carvoeiro Portugal 19ndash22 November
Parsons MJG Parnum IM Siwabessy PJW McCauley RD and Mackie M (2007) Multi-beam visualisation of Samson Fish (Seriola hippos) aggregations and spawning habitats in Western Australia In Papadakis JS and Bjorno L (eds) Proceedings of the Second International Conference lsquoUnderwater Acoustic Measurements Technologies and Resultsrsquo Crete Greece 684ndash692 Available at wwwuam-conferences orgindexphppast-proceedings accessed on 5 May 2011
Penrose JD Gavrilov AN and Parnum IM (2008) Statistics of seafloor backscatter measured with multibeam sonar systems In Proceedings of the 9th European Conference on Underwater Acoustics 2008 Paris France 617ndash622
Preston JM Christney AC Bloomer SF and Beaudet IL (2001) Seabed classification of multibeam sonar images In MTSIEEE Oceans 2001 Conference Honolulu Hawaii 2616ndash2623
Reson (2002) SeaBat 8125 operatorrsquos manual version 302 Goleta California Reson Inc
Talukdar KK Tyce RC and Clay CS (1995) Interpretation of Sea Beam backscatter data collected at the Laurentian fan off Nova Scotia using acoustic backscatter theory Journal of the Acoustical Society of America 97 1545ndash1558
Trevorrow MV (2005) Volumetric multibeam sonar meas-urements of fish zooplankton and turbulence In Pro-ceedings of the International Conference lsquoUnderwater Acoustic Measurements Technologies and Resultsrsquo Crete Greece Available at wwwuam-conferencesorgindexphppast-proceedings accessed on 5 May 2011
US Army Corps of Engineers (2002) Chapter 11 Acoustic multibeam survey systems for deep-draft navigation projects In Engineering and Design ndash Hydrographic Surveying Washington DC US Army Corps of Engineers 33pp
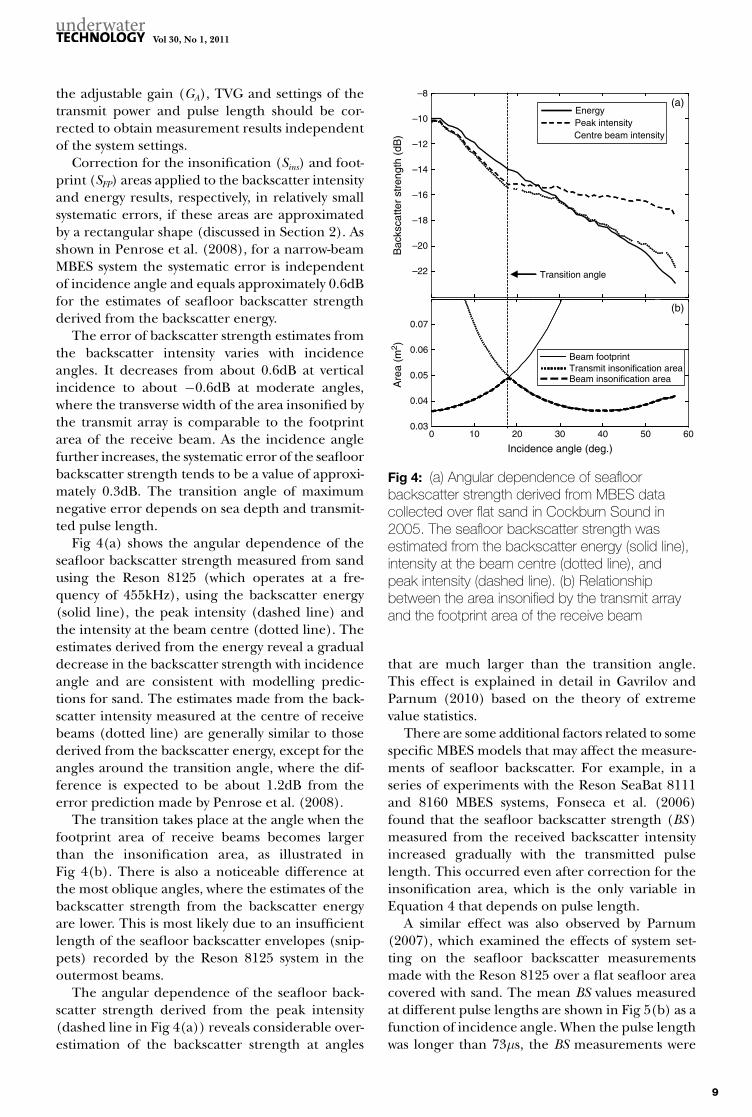

Parnum and Gavrilov High-frequency multibeam echo-sounder measurements of seafloor backscatter in shallow water Part 1
10
adequately corrected for changes in the pulse length while the BS values for shorter sonar pulses were underestimated The cause of this effect was found after calibration of this MBES (Parnum 2007)
The frequency bandwidth of the sonar transmit-ter was apparently not wide enough to transmit short pulses without amplitude distortion The amplitude of sonar pulses reflected from an alu-minium plate and received by the echo-sounder corresponded to the sonar power setting and experiment setup only when the pulse length was 151ms or larger (Fig 5(b)) The peak amplitude was slightly lower at 101ms pulse length and dropped almost by half at 51ms Consequently longer sonar pulses should be chosen to get accurate seafloor backscatter measurements that are independent of sonar system parameters If shorter pulses are pre-ferred to get the maximum bathymetry resolution
then the effect of limited frequency bandwidth should be taken into account
5 DiscussionBackscatter data logging and processing methods along with possible errors associated with them are considered in this paper using characteristics of the Reson SeaBat 8125 MBES hardware The older Reson high-frequency MBESs such as the SeaBat 8101 collect backscatter data in a similar way as the Reson 8125 so that the processing methods and errors discussed are directly applicable to them The most recent Reson MBES of the 7K series such as the SeaBat 7125 are capable of collecting the whole backscatter echo in each beam with every ping This means that seafloor backscatter character-istics can be derived directly from the backscatter signals that are not distorted by the limited length of snippet data
According to the latest instruction manual for datagram format (Kongsberg Maritime 2010) the Kongsberg-Simrad MBES systems of the EM series store two types of backscatter data seafloor back-scatter strength in dB calculated by the sonar system for vertical and oblique incidence (only two values per ping) and envelopes of the echo signals recorded in each beam and referred to as lsquoseabed image datarsquo by Kongsberg The seafloor backscatter strength is calculated according to the method described in Hammerstad (2000)
The seabed image data (echo envelopes) stored in a logarithmic scale (in dB) are centred around the bottom detection time and limited by those in the adjacent beams Therefore these backscatter data from the Simrad MBESs can be regarded as analogues to snippet data and processed similarly to the Reson snippet data to measure seafloor back-scatter characteristics Unfortunately the length of the seabed image data in individual beams is not much especially in near-vertical beams where it consists of a few samples so that it does not repre-sent the whole envelope of the signal backscattered from the bottom Consequently the energy of backscatter cannot be accurately measured
To obtain absolute values of the seafloor back-scatter strength it is necessary to know the total system gain common for all beams and inter-beam variations of the system gain that are affected by the sonar geometry and beamforming Kongsberg claims that its recent MBES systems are fully cali-brated which apparently means the seabed imaging data are represented in dB re 1mPa Reson usually does not provide calibration data for its MBES sys-tems Therefore a calibration procedure similar to that described in Parnum (2007) is required to
0 5 10 15 20 25 30 35 40 45 50 55 60
ndash22
ndash20
ndash18
ndash16
ndash14
ndash12
ndash10
ndash8(a)
(b)Incidence angle (deg)
Bac
ksca
tter
stre
ngth
(dB
)
31micros
40micros
51micros
73micros
101micros
141micros
11 12 13 14 15 16 170
2000
4000
6000
8000
10000
12000
14000
16000
Time (ms)
Am
plitu
de
51micros 101micros 152micros 292micros
Fig 5 (a) Mean backscatter strength versus incidence angle measured with the Reson Seabat 8125 MBES from an area of flat sand for a range of pulse lengths from 31ms to 292ms (b) Envelopes of sonar pulses reflected from an aluminium plate as measured by the Reson 8125 with the same power setting but different pulse lengths
11
Vol 30 No 1 2011
determine the overall system gain and its inter-beam variations if the absolute values of the seafloor backscatter strength are to be measured
Almost all modern MBES systems produce sidescan-like data of seafloor backscatter To gain an understanding of how these data are related to the actual backscatter properties of the sea floor including statistics (eg the mean value and disper-sion) it is important to know how these sidescan data are produced by an MBES system Acoustic backscattering from the sea floor is a stochastic process with a certain distribution which depends mainly on sonar frequency seafloor roughness and incidence angle (eg Lyons and Abraham 1999 Gavrilov and Parnum 2010)
As discussed in Section 4 the geometry of back-scatter measurements by an MBES system can distort the measured values and their statistics Moreover processing of backscatter samples implemented in the sonar hardware may also affect the measured values in an unexpected way Some MBES systems such as the Reson SeaBat echo-sounders produce sidescan data via averaging overlapping backscatter samples from adjacent beams Such processing dis-torts the backscatter distribution and consequently its mean and dispersion (Gavrilov and Parnum 2010) Therefore the most appropriate way to syn-thesise sidescan data from the MBES backscatter envelopes is to correct the amplitude of envelope samples for the beam pattern in each beam so as to equalise the overlapping samples and then stitch together all backscatter envelopes
6 ConclusionsIt has been shown that backscatter data collected with MBES systems under different experimental conditions can be corrected for beam geometry transmission loss and system settings However there can still be residual artefacts persisting due to either approximation of the backscattering area by a rectangle or inappropriate selection of system settings Therefore it is important to take account of the possible effects of the system settings and parameters on the measurements of seafloor back-scatter strength In particular the following should be considered
bullCalibration of the MBES system is desirable especially to determine the overall systemrsquos gain including inter-beam variations the transducerrsquos frequency band and the shape of transmit and receive beam patterns Ideally calibration is to be performed in a controlled environment with known targets and an accurate and well-controlled alignment of the sonar head and targets
bullTo obtain accurate measurements of the seafloor backscatter strength and its angular dependence using MBES data it is important to know (1) what kind of acoustical characteristics of backscatter signals (eg backscatter envelope or intensity or level in dB) is actually logged by the sonar hard-ware and (2) what kind of processing (eg aver-aging) is applied to the backscatter signal by the sonar hardware before data logging The algorithm for backscatter measurements dis-cussed in Section 2 should be adjusted accord-ing to the backscatter characteristic recorded by the MBES
bullWhen collecting backscatter data power gain and pulse length settings should be chosen appropriately so that the actual signal character-istics correspond to the expectations from the settings and system parameters
If these recommendations are followed back-scatter measurements should only be dependent on the seafloor properties incidence angle and sonar frequency In this case the measured back-scatter data can be used to discriminate between different seafloor types
ReferencesAugustin J-M and Lurton X (2005) Image amplitude cali-
bration and processing for seafloor mapping sonars In IEEE Oceans 2005 Conference Proc Brest 698ndash701
Augustin J-M Le Suave R Lurton X Voisset M Dugelay S and Satra C (1996) Contribution of multibeam acoustic imagery to the exploration of the sea bottom Marine Geo-physical Researches 18 459ndash486
Beaudoin JD Hughes Clarke JE Van Den Ameele EJ and Gardner JV (2002) Geometric and radiometric correc-tion of multibeam backscatter derived from Reson 8101 systems In Proceedings of the Canadian Hydrographic Con-ference 2002 Canadian Hydrographic Association Ottawa Ontario Summer CD-ROM 8pp
Bentrem FW Avera WE and Sample J (2006) Estimating surface sediments using multibeam sonar Sea Technology 47 37ndash40
Best J Simmons S Parsons D Oberg K Czuba J and Mal-zone C (2010) A new methodology for the quantitative visualization of coherent flow structures in alluvial chan-nels using multibeam echo-sounding (MBES) Geophysi-cal Research Letters 37 L06405 6pp
Brown CJ and Blondel P (2009) Developments in the appli-cation of multibeam sonar backscatter for seafloor habi-tat mapping Applied Acoustics 70 1242ndash1247
Canepa G and Pace NG (2000) Seafloor segmentation from multibeam bathymetric sonar In Chevret P and Zakharia ME (eds) Proceedings of the Fifth European Confer-ence on Underwater Acoustics Lyon France 361ndash366
Cochrane NA Li Y and Melvin GD (2003) Quantifications of a multibeam sonar for fisheries assessment applications Journal of the Acoustical Society of America 114 745ndash758
De Falco G Tonielli R Di Martino G Innangi S Simeone S and Parnum IM (2010) Relationships between multibeam
Parnum and Gavrilov High-frequency multibeam echo-sounder measurements of seafloor backscatter in shallow water Part 1
12
backscatter sediment grain size and Posidonia ocean-ica seagrass distribution Continental Shelf Research 30 1941ndash1950
de Moustier CP (1986) Beyond bathymetry Mapping acous-tic backscattering from the deep seafloor with Sea Beam Journal of the Acoustical Society of America 79 316ndash331
Fisher FH and Simmons VP (1977) Sound absorption in seawater The Journal of the Acoustical Society of America 62 558ndash564
Fonseca L and Mayer L (2007) Remote estimation of surficial seafloor properties through the application of angular range analysis to multibeam sonar data Marine Geophysical Researches 28 119ndash126
Fonseca L Calder B and Wetzler M (2006) Experiments for Multibeam Backscatter Adjustments on the NOAA Ship Fairweather In Oceans 2006 Boston IEEE 1ndash4
Foote KG Chu D Baldwin KC Mayer LA McLeod A Hufnagle LC Jr Jech JM and Michaels J (2005) Protocols for calibrating multibeam sonar Journal of the Acoustical Society of America 117 2013ndash2027
Gavrilov AN and Parnum IM (2010) Fluctuations of sea-floor backscatter data from multibeam sonar systems IEEE Journal of Oceanic Engineering 35 209ndash219
Hammerstad E (2000) EM Technical Note Backscattering and Seabed Image Reflectivity Horten Norway Kongs-berg Maritime AS 5pp
Hellequin L Boucher JM and Lurton X (2003) Processing of high-frequency multibeam echo sounder data for seafloor characterization IEEE Journal of Oceanic Engi-neering 28 78ndash89
Hughes Clarke JE (1994) Towards remote seafloor classifica-tion using the angular response of acoustic backscattering a case study from multiple overlapping GLORIA data IEEE Journal of Oceanic Engineering 19 112ndash127
Hughes Clarke JE Mayer LA Mitchell NC Godin A and Costello G (1993) Processing and interpretation of 95 kHz backscatter data from shallow-water multibeam sonars In Oceans 93 Engineering in Harmony with Ocean Victoria BC Canada 437ndash442
Kenny AJ Cato I Desprez M Fader G Schuttenhelm RTE and Side J (2003) An overview of seabed-mapping tech-nologies in the context of marine habitat classification ICES Journal of Marine Science 60 411ndash418
Kleinrock MC (1992) Capabilities of some systems used to survey the deep-sea floor In Geyer R (ed) CRC hand-book of geophysical exploration at sea 2nd edition vol 2 Hard Minerals Boca Raton FL CRC Press 35ndash86
Kloser RJ Penrose JD and Butler AJ (2010) Multi-beam backscatter measurements used to infer seabed habitats Continental Shelf Research 30 1772ndash1782
Kongsberg Maritime (2010) EM Series Multibeam Echo Sounders Datagram Format Instruction Manual Report No 850-160692N
Le Bas T and Huvenne V (2009) Acquisition and process-ing of backscatter data for habitat mapping ndash compari-son of multibeam and sidescan systems Applied Acoustics 70 1248ndash1257
Lurton X (2002) An introduction to underwater acoustics Principles and applications London Springer 347pp
Lurton X Dugelay S and Augustin JM (1994) Analysis of multibeam echo-sounder signals from the deep sea-floor In Proceedings of OCEANS rsquo94 lsquoOceans Engineering for Todayrsquos Technology and Tomorrowrsquos Preservation Brest France 213ndash218
Lyons A and Abraham D (1999) Statistical characterization of high-frequency shallow-water sea-floor backscatter Journal of the Acoustical Society of America 106 1307ndash1315
Medwin H and Clay CS (1998) Fundamentals of Acoustical Oceanography Boston Academic Press 712pp
Mitchell NC (1996) Processing and analysis of Simrad multibeam sonar data Marine Geophysical Researches 18 729ndash739
Parnum IM (2007) Benthic habitat mapping using multi-beam sonar systems PhD thesis Curtin University Perth Australia 208pp
Parnum IM and Gavrilov AN (2011) High-frequency multi-beam echo-sounder measurements of seafloor backscat-ter in shallow water Part 2 ndash Mosaic production analysis and classification Underwater Technology 30 13ndash26
Parsons MJG McCauley RD Mackie M and Siwabessy PJW (2006) Evaluation of acoustic backscatter data collected from Samson Fish (Seriola hippos) spawning aggregations in Western Australia Presented at 8th European Confer-ence on Underwater Acoustics Carvoeiro Portugal 19ndash22 November
Parsons MJG Parnum IM Siwabessy PJW McCauley RD and Mackie M (2007) Multi-beam visualisation of Samson Fish (Seriola hippos) aggregations and spawning habitats in Western Australia In Papadakis JS and Bjorno L (eds) Proceedings of the Second International Conference lsquoUnderwater Acoustic Measurements Technologies and Resultsrsquo Crete Greece 684ndash692 Available at wwwuam-conferences orgindexphppast-proceedings accessed on 5 May 2011
Penrose JD Gavrilov AN and Parnum IM (2008) Statistics of seafloor backscatter measured with multibeam sonar systems In Proceedings of the 9th European Conference on Underwater Acoustics 2008 Paris France 617ndash622
Preston JM Christney AC Bloomer SF and Beaudet IL (2001) Seabed classification of multibeam sonar images In MTSIEEE Oceans 2001 Conference Honolulu Hawaii 2616ndash2623
Reson (2002) SeaBat 8125 operatorrsquos manual version 302 Goleta California Reson Inc
Talukdar KK Tyce RC and Clay CS (1995) Interpretation of Sea Beam backscatter data collected at the Laurentian fan off Nova Scotia using acoustic backscatter theory Journal of the Acoustical Society of America 97 1545ndash1558
Trevorrow MV (2005) Volumetric multibeam sonar meas-urements of fish zooplankton and turbulence In Pro-ceedings of the International Conference lsquoUnderwater Acoustic Measurements Technologies and Resultsrsquo Crete Greece Available at wwwuam-conferencesorgindexphppast-proceedings accessed on 5 May 2011
US Army Corps of Engineers (2002) Chapter 11 Acoustic multibeam survey systems for deep-draft navigation projects In Engineering and Design ndash Hydrographic Surveying Washington DC US Army Corps of Engineers 33pp