
Heterogeneous Chemistry of Iron at the Liquid/Solid and Air ...
181
Wilfrid Laurier University Wilfrid Laurier University Scholars Commons @ Laurier Scholars Commons @ Laurier Theses and Dissertations (Comprehensive) 2019 Heterogeneous Chemistry of Iron at the Liquid/Solid and Air/Solid Heterogeneous Chemistry of Iron at the Liquid/Solid and Air/Solid Interfaces Interfaces Mohammad Aminur Rahman Wilfrid Laurier University, [email protected] Follow this and additional works at: https://scholars.wlu.ca/etd Recommended Citation Recommended Citation Rahman, Mohammad Aminur, "Heterogeneous Chemistry of Iron at the Liquid/Solid and Air/Solid Interfaces" (2019). Theses and Dissertations (Comprehensive). 2200. https://scholars.wlu.ca/etd/2200 This Dissertation is brought to you for free and open access by Scholars Commons @ Laurier. It has been accepted for inclusion in Theses and Dissertations (Comprehensive) by an authorized administrator of Scholars Commons @ Laurier. For more information, please contact [email protected].
-
Upload
khangminh22 -
Category
Documents
-
view
1 -
download
0
Transcript of Heterogeneous Chemistry of Iron at the Liquid/Solid and Air ...
Wilfrid Laurier University Wilfrid Laurier University
Scholars Commons @ Laurier Scholars Commons @ Laurier
Theses and Dissertations (Comprehensive)
2019
Heterogeneous Chemistry of Iron at the Liquid/Solid and Air/Solid Heterogeneous Chemistry of Iron at the Liquid/Solid and Air/Solid
Interfaces Interfaces
Mohammad Aminur Rahman Wilfrid Laurier University, [email protected]
Follow this and additional works at: https://scholars.wlu.ca/etd
Recommended Citation Recommended Citation Rahman, Mohammad Aminur, "Heterogeneous Chemistry of Iron at the Liquid/Solid and Air/Solid Interfaces" (2019). Theses and Dissertations (Comprehensive). 2200. https://scholars.wlu.ca/etd/2200
This Dissertation is brought to you for free and open access by Scholars Commons @ Laurier. It has been accepted for inclusion in Theses and Dissertations (Comprehensive) by an authorized administrator of Scholars Commons @ Laurier. For more information, please contact [email protected].
Heterogeneous Chemistry of Iron at the Liquid/Solid
and Air/Solid Interfaces
by
Mohammad Aminur Rahman
Bachelor of Science, Honors in Chemistry, Jahangirnagar University, 2004
Master of Science, Chemistry, Memorial University of NL, 2014
DISSERTATION
Submitted to the Biological and Chemical Sciences Program
Faculty of Science
In partial fulfilment of the requirements for the
Doctor of Philosophy in Biological and Chemical Sciences
Wilfrid Laurier University
2019
Mohammad Aminur Rahman 2019 ©
ii
Abstract
Hematite (-Fe2O3) is one of the common and stable phases of iron oxide that is
ubiquitous in nature. It is involved in many heterogeneous reactions through liquid-solid and
gas-solid interfacial interactions in aquatic geochemical systems. Moreover, the interfacial
chemistry of metal-oxide and organic matter plays a significant role in the mobility and
bioavailability of iron and other components such as arsenic in the soil and aquatic systems.
The interactions of organic matter with metal oxide surfaces occur through several mechanisms
in aquatic environment. Chapter 2 of this thesis describes the interactions of low molecular
weight model organics that include citric acid (CA), oxalic acid (OA) and pyrocatechol (PC)
on hematite nanoparticles that have been investigated and characterized by in situ attenuated
total internal reflectance Fourier transform infrared spectroscopy (ATR-FTIR) measurements.
H2O/D2O (H/D) exchange experiments were performed to observe the effect of hydration. It
was found that strong hydration influenced the spectra for both CA and OA whereas less in the
case of PC. Chapter 3 illustrates the initial binding kinetics of arsenicals such as dimethyl
arsinate (DMA) onto hematite nanoparticles pre-exposed to low molecular weight organics
such as OA and PC. These kinetic experiments were conducted using ATR-FTIR with an
emphasis on the role that electrolytes (KCl, NaCl, and KBr) play in the adsorption process. It
was concluded that the rate of adsorption for the arsenical onto pre-exposed model organic-
hematite surface was found greater in the presence of electrolytes, based on the initial kinetic
rate of adsorption for arsenical. Chapter 4 focuses on the investigation of the hygroscopic
properties of organic and organometallic polymeric particles, namely polycatechol,
polyguaiacol, Fe-polyfumarte, and Fe-polymuconate. These particles are efficiently formed in
iron-catalyzed reactions with aromatic and aliphatic dicarboxylic acid compounds detected in
field-collected Secondary Organic Aerosol (SOA). The structure of surface water was studied
using diffuse reflectance infrared Fourier transform spectroscopy (DRIFTS), and the uptake of
iii
gas water was quantified using quartz crystal microbalance (QCM) as a function of relative
humidity. Spectroscopic data show that water bonding with organic functional groups acting
as hydrogen bond acceptors causes shifts in their vibrational modes. Analysis of the hydroxyl
group stretching region revealed weak and strong hydrogen bonding networks that suggest
cluster formation reflecting water-water and water-organics interactions, respectively. A
modified Type II multilayer Brunauer-Emmett-Teller (BET) adsorption model described the
adsorption isotherm on the nonporous materials, polycatechol, polyguaiacol, and Fe-
polymuconate. However, water adsorption on porous Fe-polyfumarate was best described
using a Type V adsorption model, namely the Langmuir-Sips model that accounts for
condensation in pores. It was found that the organic polymers are more hydrophobic then the
Fe-containing organometallic polymers. In Chapter 5, the efficiency of iron-containing
materials such as Fe-BTC (BTC = 1,3,5-benzenetricarboxylate) metal-organic frameworks
(MOFs) and CoFe2O4 nanomaterials were examined to explore their performance in reducing
NOx in NH3-SCR (Selective Catalytic Reduction) by DRIFTS. Urea was used as an in situ
production of NH3(g) as a reductant agent for NO(g). It appeared that the rate of conversion of
NO(g) in the presence of CoFe2O4 nanomaterials (2.3±0.03 ppm·meter-2·min-1) is better than
that of Fe-BTC MOFs (0.22±0.04 ppm·meter-2·min-1).
iv
Declaration of Co-authorship
Chapter 2
This chapter contains my contribution to the paper that was published in Environmental
Science: Nano, by Royal Society of Chemistry (RSC) and can be found online at the following
link:
https://pubs.rsc.org/en/content/articlelanding /2016/en/c6en0 0132g#!divAbstract.
DOI:10.1039/C6EN00132G
Spectral Characterization and Surface Complexation Modeling of Organics on Hematite
Nanoparticles: Role of Electrolytes in the Binding Mechanism. Situm, A.; Rahman, M. A. and
Al-Abadleh, H. A. Environmental Science: Nano, 2016, 3, 910-926. I am the second author of
this paper and contributed through running experiments, analyzing data and writing.
Chapter 3
This chapter describes my contribution to the paper that was published in the Journal of
Physical Chemistry A, by American Chemical Society (ACS) and can be found online at the
following link:
https://pubs.acs.org/doi/abs/10.1021/acs.jpca.7b03426.
DOI: 10.1021/acs.jpca.7b03426
ATR-FTIR and Flow Microcalorimetry Studies on the Initial Binding Kinetics of Arsenicals at
the Organic-Hematite Interface. Situm, A.; Rahman, M. A.; Allen, N.; Kabengi, N. and Al-
Abadleh, H. A. Journal of Physical Chemistry A, 2017, 121, 5569-5579. I am the second author
of this paper and contributed through running experiments, analyzing data and writing.
Chapter 4
This chapter has been reproduced from entire paper that was published in ACS Omega, by
American Chemical Society (ACS) and can be found online at the following link:
https://pubs.acs.org/doi/10.1021/acsomega.8b02066

v
DOI: 10.1021/acsomega.8b02066
Surface Water Structure and Hygroscopic Properties from Gas Phase Water Uptake on Light
Absorbing Secondary Organic Polymers of Atmospheric Relevance. Rahman, M. A. and Al-
Abadleh, H. A. ACS Omega, 2018, 3, 15519-15529. I am the first author of this paper and
contributed through running experiments, analyzing data and writing.
vi
Acknowledgements
I would like to express my heartiest thanks to Dr. Hind A. Al-Abadleh, my supervisor for
giving me the opportunity to join her research group and for her constant guidance, supervision,
encouragements and thoughtful input provided throughout the duration of this research work.
I would like to thank Dr. Vladimir Kitaev and Dr. Scott Smith, for being my committee
member and for all their guidance, direction and advice with regards to all aspects of my
research.
Thanks to all the group members from the Dr. Al-Abadleh’s lab for their help and
cooperation. Special thanks to Arthur Situm, for his time spent in introducing me with the lab
experiments and other related activities. Thanks to Sabur for his valuable suggestions every
now and then during my entire program. I would also like to thank Sara, Antony, and Aseel for
their support.
I would like to thank the Graduate and Postdoctoral Studies and Department of Chemistry
and Biochemistry, Wilfrid Laurier University, for their financial support. Also, thanks to
Ontario Government for OGS scholarship and MS2Discovery for the financial award.
I want to express my heartiest thanks to my wife, Lubna for her encouragement, patience
and care she has shown during the course of my study. I am also grateful to my family members
specially, to my parents and mother-in-law for their moral support during my study. I would
like to express deepest gratitude to my sisters, sister-in-law, brothers-in-law and all the family
members for their inspiration, support and encouragement throughout my whole journey.
Finally, thanks to Allah for his blessing.
vii
Table of Contents
Page No
List of Tables ………………………………………………………………….. xi
List of Figures and Illustrations……………………………………………….. xii
List of Abbreviations…………………………………………………………... xx
Chapter 1 General Introduction
1.1 Introduction……………………………………………………….. 1
1.2 Iron in soil and water…………………………………………….. 2
1.3 Iron in the atmosphere…………………………………………... 4
1.4 Iron as a remedial material in heterogeneous catalysis……... 6
1.5 Surface Sensitive Techniques 8
1.6 Research questions and objectives…………………………….
10
1.7 Thesis organization………………………………………………
11
1.8
References……………………………………………………….. 14
Chapter 2 Spectral Characterization of Surface Organics on Hematite Nanoparticles, H/D Exchange Experiments
2.1
Abstract…………………………………………………………… 19
2.2 Introduction………………………………………………………..
19
2.3 Objectives………………………………………………………… 25
2.4 Experimental……………………………………………………… 25
2.3.1 Chemicals………………………………………………... 25
2.3.2 Electrode preparation and calibration of pD meter…..
26
2.3.3 Preparation of film on ZnSe ATR crystal……………... 27
2.3.4 ATR-FTIR spectroscopy experiments…………………
28
2.3.5 H/D exchange experiments……………………………. 28
viii
2.5 Results and discussion………………………………………….. 29
2.5.1 Spectral characterization of surface organics as a function of pD…………………………………………….
29
2.6 Conclusions……………………………………………………... 34
2.7 References……………………………………………………….. 34
Chapter 3 ATR-FTIR Studies on the Initial Binding Kinetics of Arsenicals at the
Organic-Hematite Interface
3.1 Abstract…………………………………………………………… 37
3.2 Introduction………………………………………………………. 37
3.3 Objectives………………………………………………………… 44
3.4 Experimental……………………………………………………… 46
3.4.1 Chemicals………………………………………………... 46
3.4.2 Preparation of film on ZnSe ATR crystal……………… 46
3.4.3 ATR-FTIR spectroscopy experiments………………… 46
3.4.4 Adsorption kinetics……………………………………… 47
3.4.5 Kinetic modeling (Adsorption)…………………………. 47
3.4.6 Desorption kinetics……………………………………… 49
3.4.7 Kinetic modeling (Desorption)…………………………. 49
3.5 Results and discussion………………………………………….. 50
3.5.1 Adsorption kinetics……………………………………… 50
(a) Adsorption kinetics of model organics on hematite nanoparticle…………………………………………..
50
(b) Adsorption kinetics of arsenicals on hematite nanoparticle…………………………………………..
57
(c) Adsorption of arsenicals on hematite containing model organics……………………………………….
60
3.5.2 Desorption Kinetics of model organic matter on hematite…………………………………………………..
63
ix
3.6 Conclusions……………………………………………………...
65
3.7 References………………………………………………………
66
Chapter 4 Surface Water Structure and Hygroscopic Properties of Light
Absorbing Secondary Organic Polymers of Atmospheric Relevance
4.1
Abstract…………………………………………………………… 71
4.2 Introduction………………………………………………………. 72
4.3 Objectives………………………………………………………… 74
4.4 Experimental……………………………………………………… 74
4.4.1 DRIFT experiments……………………………………...
76
4.4.2 QCM experiments……………………………………….
77
4.5 Results and discussion 78
4.5.1 Structure of surface water on polycatechol and polyguaiacol………………………………………………
78
4.5.2 Structure of surface water on Fe-polyfumarate and Fe-polymuconate………………………………………...
85
4.5.3 Adsorption thermodynamics…………………………… 88
4.6 Conclusions……………………………………………………... 95
4.7 References……………………………………………………….. 97
Chapter 5 Iron-containing Metal-Organic Frameworks (MOFs) in Enhancing the
Selective Catalytic Reduction (SCR) of NOx to Nitrogen Gas
5.1 Abstract……………………………………………………….. 105
5.2 Introduction……………………………………………………….. 105
5.3 Objectives………………………………………………………… 112
5.4 Experimental……………………………………………………… 112
5.4.1 Chemicals……………………………………………….. 112
5.4.2 DRIFTS experiments…………………………………… 113
x
5.5 Results and discussion………………………………………….. 115
5.5.1 In situ production of ammonia (NH3) from urea (NH2CONH2)……………………………………………..
115
5.5.2 Thermal decomposition of Fe-BTC under dry conditions…………………………………………………
118
5.5.3 Thermal decomposition of Fe-BTC/8%urea mixture under dry conditions……………………………………..
119
5.5.4 Thermal decomposition of Fe-BTC/8%urea mixture
under humid conditions………………………………….
121
5.5.5 Reaction of NO with either Fe-BTC or 8%urea under
dry conditions…………………………………………….
122
5.5.6 Reaction of NO with Fe-BTC/8%urea mixture under
dry conditions…………………………………………….
125
5.5.7 Reaction of NO with Fe-BTC/8%urea mixture under
humid conditions…………………………………………
126
5.5.8 Reaction of NO with CoFe2O4 under dry conditions.
127
5.5.9 Reaction of NO with CoFe2O4/8%urea mixture under
dry conditions…………………………………………….
128
5.6 Conclusions…………………………………………………….
130
5.7 References……………………………………………………….
130
Chapter 6 Conclusions and Significance…………………………………..
135
Appendix 1 Data analysis using Macros and OMNIC Software………….. 139
Appendix 2 Procedure for BET instrument………………………………….
147
Appendix 3 United State Environmental Protection Agency data
Base (EPA)……………………………………………………….
158
xi
List of Tables
Page No
Table 2.1 Amount of buffer powder in each capsule………………….
27
Table 2.2 Amount of buffer power taken for preparation of buffer
solution…………………………………………………………
27
Table 3.1 Types of arsenic compounds………………………………..
38
Table 3.2 Linearized first order observed adsorption rates (min-1) at
various ionic strength conditions of model organics
(oxalate and pyrocatechol) on hematite film……………….
56
Table 3.3 DMA initial adsorption rate on different surfaces, with and
without electrolytes at pH 7 at 2 mL/min flow rate…………
62
Table 4.1 Assignment of features observed in the DRIFTS
normalized difference absorbance spectra during gas
phase water adsorption on organic polymers/diamond
samples………………………………………………………..
82
Table 4.2 Best Fit Parameters for Gas Phase Water Adsorption on
Polymeric Organic Films at 298 K Shown in Figure 4.9a...
92
Table 5.1 Properties of Fe-BTC…………………………………………
111
Table 6.1 Molar absorptivity obtained for NO, NO2, N2O, NH3 and
HNCO from EPA database…………………………………..
159
xii
List of Figure and Illustrations
Page No
Figure 1.1 Structure of (a) hematite and (b) magnetite…………………
1
Figure 1.2 Pictorial presentation of environmental processes (both
natural and anthropogenic sources of gases and particles in
the atmosphere and their consequence) that occurs on the
earth……………………………………………………………..
5
Figure 1.3 Organic linkers and metal ions or cluster combine to
synthesize metal-organic framework materials……………..
7
Figure 1.4 Surface sensitive techniques normally used to study
environmental interfaces………………………………………
8
Figure 2.1 Mechanisms for the interaction of organics with metal oxide
or mineral surfaces…………………………………………......
20
Figure 2.2 Outer-sphere and inner-sphere complexes for citrate with
goethite…………………………………………………………..
23
Figure 2.3 Citrate complexes on goethite surface (Outer-sphere and
inner-sphere) ……………………………………………………
23
Figure 2.4 ATR-FTIR absorption spectra of adsorbed citrate on
hematite nanoparticles after flowing 10-4 M solutions
prepared in D2O after 10 min flow as a function of
decreasing pD from 8 to 4. The electrolyte concentration
was 0.01 M KCl………………………………………………….
29
Figure 2.5 Possible structures for the surface complexation of citrate
(CA) (out-sphere and inner-sphere) onto hematite
nanoparticles. Arrow shows the direction of decreasing pH
or pD and the corresponding surface complexes under
acidic (right) versus basic (left) conditions……………………
30
Figure 2.6 ATR-FTIR absorption spectra of adsorbed oxalate on
hematite nanoparticles after flowing 10-4 M solutions
prepared in D2O after 10 min flow as a function of
decreasing pD from 8 to 4. The electrolyte concentration
was 0.01 M KCl………………………………………………….
31
Figure 2.7 Possible structures for the surface complexation of oxalate
(OA) (out-sphere and inner-sphere) onto hematite
nanoparticles. Arrow shows the direction of decreasing pH
32
xiii
or pD and the corresponding surface complexes under
acidic (right) versus basic (left) conditions………………….
Figure 2.8 ATR-FTIR absorption spectra of adsorbed pyrocatechol on
hematite nanoparticles after flowing 10-4 M solutions
prepared in D2O after 10 min flow as a function of
decreasing pD from 9 to 6. The electrolyte concentration
was 0.01 M KCl………………………………………………..
33
Figure 2.9 Possible structures for the surface complexation of
pyrocatechol (PC) (inner-sphere) onto hematite
nanoparticles. Arrow shows the direction of decreasing pH
or pD and the corresponding surface complexes under
acidic (right) versus basic (left) conditions…………………..
33
Figure 3.1 Flow diagram of As in the global cycle………………………
39
Figure 3.2 The Challenger pathway for biomethylation, followed by
sequential reduction and oxidative methylation of arsenic.
40
Figure 3.3 Influence of dissolved natural organic matter (DOM) on
oxidation and hydrolysis of contaminants by mineral
surfaces…………………………………………………………
41
Figure 3.4 Hypothetical molecular structure of humic acid, showing
important functional groups………………………………….
42
Figure 3.5 Schematic diagram of arsenicals (arsenate or DMA)
adsorption onto hematite nano particles pre-exposed to
model organics citrate (CA), oxalate (OA) and pyrocatechol
(PC)……………………………………………………………..
44
Figure 3.6 Absorbance spectra of oxalate (1.0 mM) onto a clean
hematite (6 mg) film at pH 7, I = 10 mM (a) NaCl (b) KCl (c)
KBr and (d) H2O at room temperature. ATR-FTIR
absorbance spectra of adsorbed oxalate were collected as
a function of time………………………………………………
51
Figure 3.7 Adsorption kinetic curves generated from the baseline-
corrected ATR-FTIR absorbances for oxalate adsorbed on
to a clean hematite (6 mg) film at pH 7 with H2O and three
different electrolytes (I = 10 mM for KCl, NaCl and KBr) and
a 2 mL/min flow rate at room temperature………………….
52
Figure 3.8 Linearized adsorption kinetics curves of oxalate on 6 mg
hematite film with at pH 7 with H2O and three different
electrolytes (I = 10 mM for KCl, NaCl and KBr). ln(1-
52
xiv
Abs(Org)/Abs(OrgMax) with Abs(Org) corresponding the
band measured for oxalate…………………………………..
Figure 3.9 Adsorption kinetic curves (left) generated from the baseline-
corrected ATR-FTIR absorbances for oxalate adsorbed on
to a clean hematite (6 mg) film at pH 7, I = 10 mM NaCl, and
a 2 mL/min flow rate at room temperature. Linearized
adsorption kinetic curve of oxalate
(right)…………………………………………………. ………..
53
Figure 3.10 Adsorption of pyrocatechol (1.0 mM) onto a clean hematite
(6 mg) film at pH 7, I = 10 mM H2O (left) and KCl (right) at
room temperature. ATR-FTIR absorbance spectra of
adsorbed oxalate were collected as a function of
time………………………………………………………………
54
Figure 3.11 Adsorption kinetic curves generated from the baseline-
corrected ATR-FTIR absorbances for pyrocatechol
adsorbed on to a clean hematite (6 mg) film at pH 7 with a
2 mL/min flow rate at room temperature……………………
55
Figure 3.12 Linearized adsorption kinetics of pyrocatechol on 6 mg
hematite film with at pH 7. ln(1-Abs(Org)/Abs(OrgMax) with
Abs(Org) corresponding the band measured for
pyrocatechol…………………………………………………..
55
Figure 3.13 ATR-FTIR absorbance spectra of 1.0 mM DMA on to a
clean, hematite (6 mg) film at pH 7, I = 10 mM (a) NaCl (b)
KBr and (c) H2O with a 2 mL/min flow rate at room
temperature……………………………………………………..
57
Figure 3.14 Baseline-corrected adsorption kinetics of 1.0 mM DMA onto
to a clean, hematite (6 mg) film at pH 7 with a 2 mL/min flow
rate at room temperature………………………………………
58
Figure 3.15 Linearized adsorption kinetics of DMA on 6 mg hematite film
with at pH 7. ln(1-Abs(As)/Abs(AsMax) with Abs(As)
corresponding the band measured for DMA…………………
58
Figure 3.16 Baseline-corrected adsorption kinetics of 1.0 mM DMA onto
to a clean, hematite (6 mg) film at pH 7 with a 2 mL/min flow
rate at room temperature. Data points represent the
average of two experiments…………………………………..
59
Figure 3.17 Linearized adsorption kinetics of 1.0 mM DMA on 6 mg
hematite film with at pH 7 in NaCl (0.01 M). ln(1-Abs(As)
59
xv
/Abs(AsMax) with Abs(As) corresponding the band
measured for DMA……………………………………………..
Figure 3.18 ATR-FTIR absorbance spectra of 1.0 mM DMA on to
hematite (6 mg) film pre-exposed to oxalate at pH 7, I = 10
Mm (a) NaCl (b) KBr and (c) H2O and (d) 1.0 mM PC onto
hematite in KCl solution with a 2 mL/min flow rate at room
temperature……………………………………………………..
60
Figure 3.19 Kinetic curve of 1.0 mM DMA on to hematite (6 mg) film pre-
exposed to OA at pH 7, I = 10 Mm (a) NaCl (b) KBr and (c)
H2O with a 2 mL/min flow rate at room temperature………..
61
Figure 3.20 Linearized adsorption kinetics of 1.0 mM DMA on 6 mg
hematite film with at pH 7. ln(1-Abs(As)/Abs(AsMax) with
Abs(As) corresponding the band measured for DMA……….
62
Figure 3.21 ATR-FTIR absorbance spectra correspond to the oxalate
desorption from hematite (6 mg) film at pH 7 in 10 mM (a)
NaCl (b) KBr and (c) H2O at room temperature, by the
flowing of 1.0 mM DMA………………………………………..
63
Figure 3.22 Desorption kinetic curve generated from the baseline-
corrected ATR-FTIR absorbances of oxalate from hematite
(6 mg) nanoparticles at pH 7 in H2O and a 2 mL/min flow
rate at room temperature, by 1.0 mM DMA………………….
64
Figure 3.23 Linearized desorption kinetic curve for oxalate on the
hematite film at pH 7 in H2O. The figure shows
ln(A(organics)/Amax(Organic) with A(Organic) corresponds
to absorbance at 1658 cm-1 for oxalate……………………..
65
Figure 4.1 Represents the interactions of H2O molecules with model
organic and organometallic particles…………………………
74
Figure 4.2 Representative DRIFTS absorbance spectra of solid
organic polymers mixed with diamond powder after
overnight drying at a flow of dry air: (a) 2% wt/wt
polycatechol, (b) 2% wt/wt polyguaiacol, (c) 6% wt/wt Fe-
polyfumarate, and (d) 7% wt/wt Fe-polymuconate. A
spectrum of dry diamond powder only was used as the
reference to generate these absorbance spectra. See
reference 46 in main manuscript for assignment……………
79
Figure 4.3 Selected DRIFTS absorbance spectra of surface water
collected as a function of increasing % RH on (a)
polycatechol and (b) polyguaiacol (solid lines) in ca. 2% w/w
81
xvi
organic material/diamond powder. The dotted lines are
control spectra collected on diamond particles only (no
organic material) at the same % RH values. Data in (c,d)
show the difference in normalized absorbance spectra as a
function of RH obtained by subtracting the normalized
diamond spectrum from that collected with organic materials
at each % RH with a factor 1. The normalization of all
spectra was done relative to the peak at 3421 cm-1. The “*”
denotes residual features observed only in the control
spectra………………………………………………………….
Figure 4.4 Selected DRIFTS absorbance spectra of surface water
collected as a function of increasing % RH on a 2% w/w
polyguaiacol/diamond sample. The solid lines are spectra
collected using gas phase D2O. The dotted lines are the
same spectra shown in Figure 4.3b collected using gas
phase H2O at 5.5, 25, 41, and 86% RH……………………..
83
Figure 4.5 Selected DRIFTS absorbance spectra of surface water
collected as a function of increasing %RH on a 2% wt/wt
polyguaiacol/diamond sample. The solid lines are spectra
collected using gas phase D2O. The dashed lines are the
same spectra shown in Figure 1b collected using gas phase
H2O at 5.5, 25, 41 and 86% RH. The ‘*’ donates incomplete
subtraction of gas phase water lines…………………………
84
Figure 4.6 Selected DRIFTS absorbance spectra of surface water
collected as a function of increasing % RH on (a) Fe-
polyfumarate and (b) Fe-polymuconate (solid lines) in ca.
7% w/w organic material/diamond particles. The dotted lines
are control spectra collected on diamond particles only (no
organic material) at the same % RH values. Data in (c,d)
show the difference in normalized absorbance spectra as a
function of RH obtained by subtracting the normalized
diamond spectrum from that collected with organic materials
at each RH with a factor of 1. The normalization of all
spectra was done relative to the peak at 3421 cm-1. The “*”
denotes residual features observed only in the control
spectra…………………………………………………………..
86
Figure 4.7 Raw QCM data showing change in frequency, F, as a
function of increasing relative humidity (%RH, numbers
between vertical dashed lines) relative to signal recorded
while flowing dry air on (a) polycatechol (0.3 mg), and (b)
polyguaiacol (0.1 mg) thin films. Photos to the right show
representative samples prior to starting the water uptake
experiments…………………………………………………….
89
xvii
Figure 4.8 Raw QCM data showing change in frequency, F, as a
function of increasing relative humidity (%RH, numbers
between vertical dashed lines) relative to signal recorded
while flowing dry air on (a) Fe-polyfumarate (0.037 mg), and
(b) Fe-polymuconate (0.11 mg) thin films. Photos to the right
show representative samples prior to starting the water
uptake experiments……………………………………………
90
Figure 4.9 Water adsorption isotherms at 298 K constructed from the
data shown in Figures 4.7 and 4.8 for (a) polycatechol (0.3
mg), (b) polyguaiacol (0.1 mg), (c) Fe-polyfumarate (0.037
mg), and (d) Fe-polymuconate (0.1 mg) using the equation
Δm = −ΔF/Cf, where Δm is the change in mass due to
adsorbed water (left axis). ΔF was multiplied by the
geometrical area of the deposited films. The right axes were
calculated by converting Δm to water mass (g) per surface
area (m2) of the organic film deposited. The lines through
the data represent least squares best fits to the
experimental data. The best fit parameters are listed in
Table 4.2. The outermost right axis was obtained by dividing
water coverage in gm-2 by that at the monolayer coverage
obtained from the best-fit parameters. The error bars
represent the standard deviation (±σ) from the average data
of 3−4 water isotherm experiments, each on a freshly
prepared organic film………………………………………….
91
Figure 4.10 Adsorption isotherm of N2 gas on Fe-polyfumarate at 77 oK
confirming the porous structure of this organometallic
material………………………………………………………….
94
Figure 4.11 High resolution transmission electron microscopy (HR-
TEM) images for Fe-polyfumarate showing the pore
structure of this material……………………………………….
94
Figure 5.1 Mechanism of NO conversion to N2 on the surface of
FexCoyCezOm supported on activated carbon……………….
108
Figure 5.2 The structure of Fe-BTC (carbon atoms gray, oxygen atoms
red, and iron atoms light-blue).………………………………..
110
Figure 5.3 Structure of CoFe2O4 (43 m2/g)……………………………….
112
Figure 5.4 Experimental setup for DRIFTS experiments. a) for surface
species characterization b) for gas phase species
characterization…………………………………………………
113
xviii
Figure 5.5 Thermal decomposition of urea only under dry and humid
conditions (a) Gas phase spectra as a function of time (t)
8% urea/diamond, dry air, at 115 oC, then with heating to
180 oC. (b) Gas phase spectra as function of time (t) 8%
urea/diamond, humid air (%RH 10-12), at 115 oC, then with
heating to 180 oC……………………………………………….
116
Figure 5.6 (a) Kinetic curve of [NH3] vs time (min) for data in figure
5.5(a). (b) Kinetic curve of [NH3] versus time (min) for data
in figure 5.5(b)…………………………………………………..
117
Figure 5.7 Thermal decomposition of Fe-BTC only under dry
conditions (a) Gas phase spectra as a function of time and
temperature, dry condition. (b) DRIFTS spectra of Fe-BTC
only as a function of time and temperature-dry (brown) and
humid (blue) conditions………………………………………..
118
Figure 5.8 Thermal decomposition of Fe-BTC/8%urea mixture under
dry conditions and quantification of gas phase products. (a)
Gas phase spectra as a function of time (min) and
temperature (oC) under dry air. (b) Kinetic curve of [NH3] vs
time (min) for data in figure 5.8(a)…………………………….
120
Figure 5.9 Thermal decomposition of Fe-BTC/8%urea mixture under
humid conditions and quantification of gas phase products
(a) Gas phase spectra as a function of time (min) and
temperature (oC) under humid condition, (%RH 10-12). (b)
Kinetic curve of [NH3] vs time (min) for data in figure 5.9(a)..
121
Figure 5.10 Reaction of NO with either Fe-BTC or 8%urea under dry
conditions. (a) Gas phase spectra of reaction between NO
and Fe-BTC only as a function of time (min) and
temperature (oC) under dry air. (b) Kinetic curve of [NO] vs
time (min) for data in figure 5.10(a). (c) Gas phase spectra
of reaction between NO and diamond/8%urea as a function
of time (min) and temperature (oC) under dry condition. (d)
Kinetic curve of [NO]/[NH3]/[HNCO] vs time (min) for data in
figure5.10(c)……………………………………………………..
123
Figure 5.11 Reaction of NO with Fe-BTC/8%urea mixture under dry
conditions. (a) Gas phase spectra of reaction between NO
and Fe-BTC/8%urea as a function of time (min) and
temperature (oC) under dry air. (b) Kinetic curve of
[NO]/[NH3]/[HNCO] vs time (min) for data in figure 5.11(a)….
125
Figure 5.12 Reaction of NO with Fe-BTC/8%urea mixture under humid
conditions. (a) Gas phase spectra of reaction between NO
126
xix
and Fe-BTC/8%urea as a function of time (min) and
temperature (oC) under humid condition (%RH 10-12). (b)
Kinetic curve of [NO]/[NH3] vs time (min) for data in figure
5.12(a)……………………………………………………………
Figure 5.13 (a) Gas phase spectra of reaction between NO and
CoFe2O4 only as a function of time (min) and temperature
(oC) under dry air. (b) Kinetic curve of [NO] vs time (min) for
data in figure 5.13(a)……………………………………………
127
Figure 5.14 (a) Gas phase spectra of reaction between NO and
CoFe2O4/8%urea as a function of time (min) and
temperature (oC) under dry air. (b) Kinetic curve of
[NO]/[NH3]/[HNCO] vs time (min) for data in figure 5.14(a)…
128
Figure 5.15 Proposed mechanism for the reaction of urea and Fe-
BTC/CoFe2O4 with NO(g) under dry condition……………….
129
xx
List of Abbreviations
ATR-FTIR Attenuated Total Reflectance Fourier Transform Infrared Spectroscopy
As Arsenic
ALW Aerosol Liquid Water
ACF Actual Carbon Filter
BET Brunauer-Emmett-Teller
BTC
1,3,5-benzenetricarboxylate
CA Citric Acid
CCN Cloud Condensation Nuclei
DMA
Dimethyl Arsinate
DRIFT Diffuse Reflectance Infrared Fourier Transform
Spectroscopy
HVC High Vacuum Chamber
HULIS Humic-Like Substance
H/D H2O/D2O
ICN Ice Condensation Nuclei
I Ionic Strength
MCT Mercury Cadmium Telluride
MOFs Metal-Organic Frame Works
MFC
Mass Flow Controller
MFCR
Mass Flow Channel Reader
OA Oxalic Acid
POA Primary Organic Aerosol
PC Pyrocatechol

xxi
QCM Quartz Crystal Microbalance
RH
Relative Humidity
SOA
Secondary Organic Aerosol
SCR Selective Catalytic Reduction
TC
Thermocouple
VOC Volatile Organic Carbon
WB
Water Bubbler
Chapter 1
1
Chapter 1 General Introduction
1.1 Introduction
Iron (Fe) is one of the most important elements in our natural environment and plays a significant
role in many chemical reactions. It is an indispensable element for entire living forms.1 It is
placed as the 4th most abundant element in the Earth’s crust after oxygen, silicon and aluminum.
However, the 10th in the universe and the most in building up the earth (34.5% by mass). It is
a very reactive transition-metal and exists as two major series of compounds such as the ferrous,
containing Fe2+ and the ferric, containing iron (III) Fe3+.2
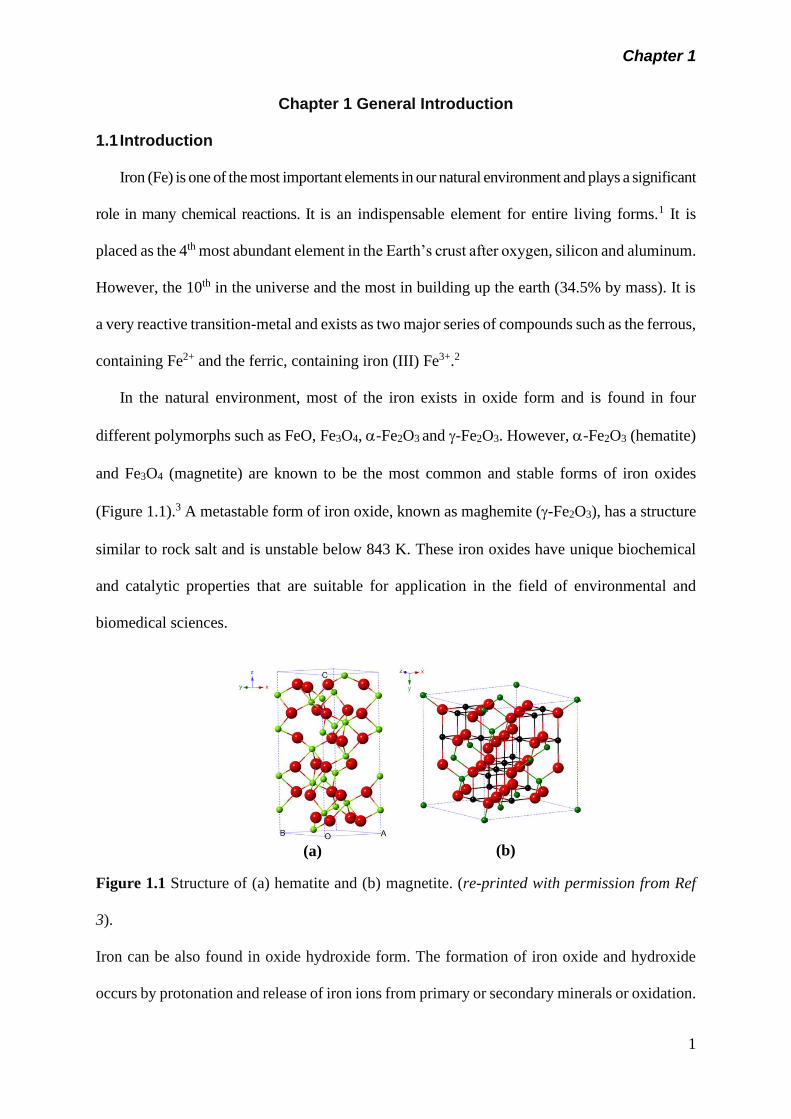
In the natural environment, most of the iron exists in oxide form and is found in four
different polymorphs such as FeO, Fe3O4, -Fe2O3 and -Fe2O3. However, -Fe2O3 (hematite)
and Fe3O4 (magnetite) are known to be the most common and stable forms of iron oxides
(Figure 1.1).3 A metastable form of iron oxide, known as maghemite (-Fe2O3), has a structure
similar to rock salt and is unstable below 843 K. These iron oxides have unique biochemical
and catalytic properties that are suitable for application in the field of environmental and
biomedical sciences.
Figure 1.1 Structure of (a) hematite and (b) magnetite. (re-printed with permission from Ref
3).
Iron can be also found in oxide hydroxide form. The formation of iron oxide and hydroxide
occurs by protonation and release of iron ions from primary or secondary minerals or oxidation.
(a) (b)
Chapter 1
2
Ferrihydrite (5Fe2O3·9H2O) is a common iron oxide found in soils. It has poorly ordered
structure not like crystalline hematite and is considered an amorphous iron hydroxide.4
Iron is naturally introduced into the aquatic systems through many processes such as
weathering, water-rock interactions, biodegradation of organic matters, atmospheric deposition
and volcanic eruption. Anthropogenic addition of iron into surface water and the Earth’s
atmosphere is also significant.5 The presence of iron in mineral dust, rocks and soils
emphasizes its involvement in various environmental processes such as heterogeneous
atmospheric chemistry, aqueous geochemistry and environmental catalysis and remediation.
As detailed below, our goal is to explore the chemistry of iron that is involved at the liquid-
solid and gas-solid interface in environmental systems. For liquid-solid interfacial studies,
hematite (−Fe2O3) nanoparticles have been chosen for the solid phase along with organic
molecules (such as citrate, oxalate and pyrocatechol) and arsenic compounds as a liquid phase.
In the case of the air-solid interfacial investigation, iron 1,3,5 benzenetricarboxylate, (Fe-BTC)
has been chosen as a solid phase with nitrogen oxides (NOx, x = 1 or 2) in the gaseous phase.
1.2 Iron in soil and water
The form of iron oxide surface in bulk aqueous environments or in surface water is
reliant on pH of the solution as shown in Scheme 1.1.
Scheme 1.1 Change the surface of iron oxide charge as a function of pH.
Surface charge in aqueous environments is a vital factor in determining the chemistry at the
interface. The surface possesses charge depending on the pH of the aqueous media. The pH
point at the which the surface possess zero ionic charge is defined as the point of zero charge
(pHpzc). This pHpzc is equivalent to the solution isoelectric point (pHisep), when the
concentration of positively charged species equals that of negatively charged ones. However,
Chapter 1
3
actual values of pHpzc and pHisep for the same metal cation are different due to differences in
the solvation of surface species contrasted with those in solution and differences in the
coordination shell around the metal in each case. Typically, the adsorption of the anion occurs
at pH equal or below the pHpzc while cation adsorption is more favored at or above the pHpzc.
Also, dissolution rates of oxides increase below pHpzc with decreasing pH and increase with
increasing pH in alkaline media. The interactions of organic matter with iron oxides surfaces
are important and have an influence over the degradation and photochemical decay rate of
iron.6 In aqueous geochemistry, these interactions occur via several mechanisms that alter the
charge and functional groups of the metal oxide surface. In addition, there are changes in water
structure and hydrophobic behavior at the interface. The adhesion strength and dissolution of
metal oxide is also influenced by the interactions of organic matter and the metal oxide surface.
Thus, dissolution due to interaction of the iron oxide surface with organic matter leads to the
enhancement of bioavailable iron as a nutrient and turns to the food source for microbes. These
molecular-level changes play a vital role in the mobility and bioavailability of iron and other
pollutants in soil and aqueous environment.7 Among these pollutants are arsenic (As)
compounds, which are the species of focus of this thesis.
As is known as a lethal element and considered a carcinogenic for the human being.8 It
can be found in rocks and minerals in the form of arsenopyrite (FeAsS). Also, it can be often
found as an associate member with the transition metals Cd, Pb, Ag, Au, Sb, P, W and Mo.8,9
Two types of arsenical compounds are found in the environment: inorganic arsenic and organic
arsenic compounds. Inorganic arsenic includes arsenite [As (III)] and arsenate [As (V)]. These
arsenic compounds are more toxic than organic arsenic such as methylated ones such as,
monomethylarsonate [MMA] or dimethylarsinate [DMA]. As has been spotted into the
atmosphere and the source of As release includes anthropogenic activities as well as natural
processes. Anthropogenic sources of As (mostly arsine gas, AsH3) into the atmosphere include
Chapter 1
4
industrial smelting, combustion fossil fuel, and mining, followed by their discharged waste
products that include fly ash and mine wastes. Volcanic eruption is known as the main natural
source of As.10 Also, As exists as arsenic trioxide (As2O3) in the atmosphere. Strong oxidizing
agents such O3 and HNO3 can oxidize As2O3 to yield arsenic pentoxide (As2O5) or the
corresponding triprotic arsenic acid (H3AsO4). After several chemical processes in the
atmosphere As is transported into the aquatic system through wet deposition as arsenic
H3AsO4. It has been found that under neutral soil and water condition inorganic arsenite
As(III), exists as a neutral species (pKa: 9.23, 12.1) while arsenate [As (V)] exists as an anion
(pKa 2.22, 6.98 and 11.53).11 The mobility of As in soil can be influenced by mineral and
organic matter contents in soil and occurs in three different ways. Firstly, reductive dissolution
of iron-oxide or direct oxidation-reduction reactions that result in the formation of As(III) and
As(V) species. Secondly, competition may take place between organic matter and arsenical for
binding sites on metal-oxide/mineral surface. Thirdly, a ternary iron bridged complex (As-Fe-
Org) can be formed where iron is bridged between As and organic matter. Thus, organic matter
in soil and water play a vital role in the mobility of As species as well as iron as nutrient.12–15
Considering the importance of organic–metal oxide interfacial interactions, their consequence
on the mobility of As in environment, investigations are needed to mimic real systems and
conditions. Knowledge is required to explore the kinetics of adsorption and desorption of
organic matter to or from metal oxides and how the surface complexation impacts the
adsorption kinetics of inorganic and organic arsenical compounds.
1.3 Iron in the atmosphere
Hematite (-Fe2O3) is one of the common oxides in mineral dust aerosols in the
atmosphere.16 These iron-containing aerosols can provide reactive adsorption sites for a variety
of trace gases and plays a dynamic role in numerous chemical transformations in heterogeneous
atmospheric chemistry. Moreover, surface water plays an important role in several
Chapter 1
5
heterogeneous reactions of mineral dust particles with gas phase species (For examples: OH,
O3, SO2, NO2, and HNO3).16 Mineral dust is one of the primary types of aerosols that are
directly emitted into the atmosphere by natural processes like dust storms or other wind-driven
processes. After several chemical transformations in the atmosphere, iron is added to the ocean
surface through deposition of mineral dust. As a result, iron undergoes dissolution in aqueous
solution and forms complexes with organic matter. On the other hand, secondary organic
aerosols (SOA) originating from the photochemical reactions of gas-phases organic species,
directly emitted into the atmosphere. These gas-phase organics can go through an oxidation
processes and narrow down in volatility and thus can create new particles or can be condensed
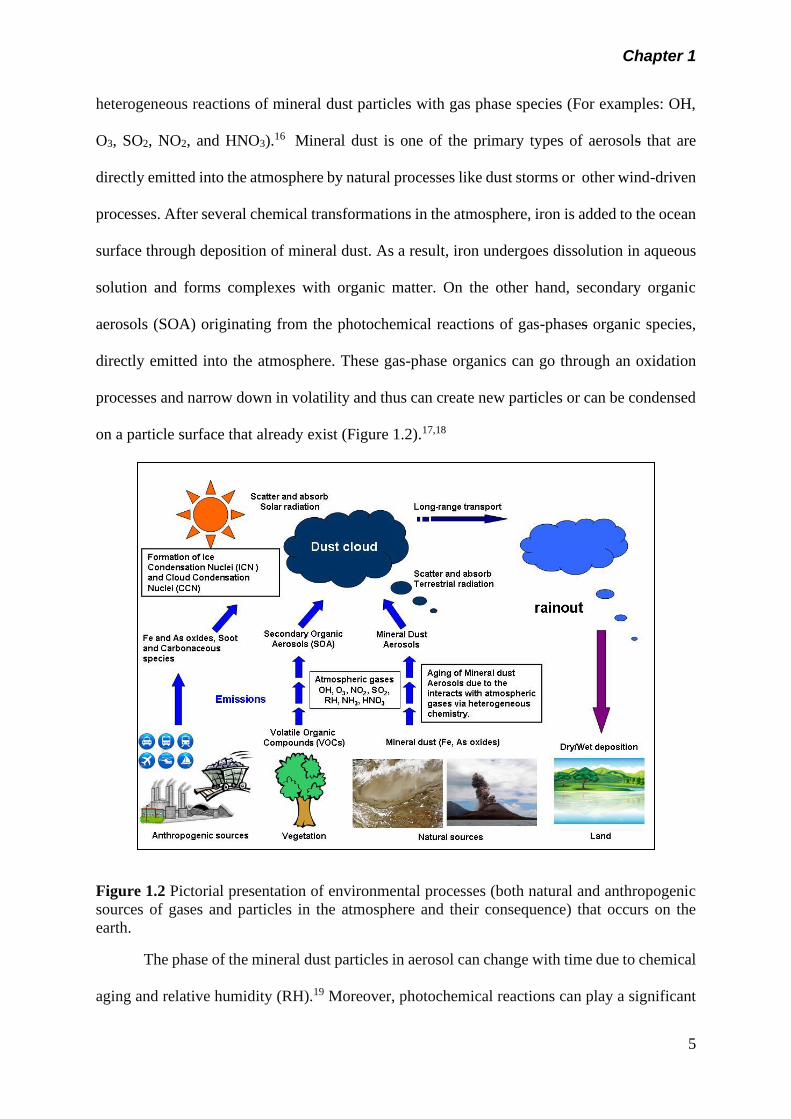
on a particle surface that already exist (Figure 1.2).17,18
Figure 1.2 Pictorial presentation of environmental processes (both natural and anthropogenic
sources of gases and particles in the atmosphere and their consequence) that occurs on the
earth.
The phase of the mineral dust particles in aerosol can change with time due to chemical
aging and relative humidity (RH).19 Moreover, photochemical reactions can play a significant
Chapter 1
6
role in changing the composition of dust aerosols due to the presence of chromophores (For
example: humic-like substances (HULIS), nitrite, nitrate etc.) and transition-metals such as iron
(Fe).20 Aerosol particles that include mineral dust and SOA can perform as a cloud
condensation nuclei (CCN) as well as ice condensation nuclei (ICN), followed by the formation
of cloud droplets and atmospheric ice particles, respectively. Consequently, these particles can
exert a considerable effect on the microphysical properties of water and ice clouds that
eventually allows the formation of precipitations such as rain, snow, and storm. Mineral dust
aerosols can change the energy balance of the earth as well as influence climate both directly
and indirectly.21–23 This occurs directly through light absorption, scattering and terrestrial
radiation and indirectly by providing surfaces for reaction and modifying cloud formation and
lifetime. Thus, dust particles can reduce visibility and cause harmful effect on human health.15
However, the role of iron in the transformation of organic species in atmospherically related
surfaces is still unexplored and a subject of further investigation.17 Moreover, little is known
about the chemistry involved in multicomponent atmospheric aerosol systems containing
surface water, organic matter, iron and halides.
1.4 Iron as a remedial material in heterogeneous catalysis
Heterogeneous reactions that occur in the atmosphere due to the presence of particles and
gases, have a harmful effect on the local and global environment. For a better and more
sustainable environment, it is important to remove or reduce the harmful atmospheric gases to
minimum concentration level such as nitrogen oxides (NOx, x = 1 or 2). NOx is generated by
anthropogenic activities (such as diesel engine, coal combustion, and incineration power
plants) and are involved in the processes that produce photochemical smog and acid rain.
Moreover, NOx has a rich chemistry in the atmosphere due to its high reactivity.16 Considering
the harmful effect of NOx, it has become an important environmental concern to control and
remove NOx from the air.16 The technology that is currently used in the removal of NOx is
Chapter 1
7
selective catalytic reduction (SCR) that facilitate conversion NOx into nitrogen and water.24
The materials that have been used so far for the removal of NOx are activated carbon, activated
carbon fiber (ACFs), slugged derived adsorbent and zeolites. Nevertheless, the selective
catalytic reduction (SCR) of NOx with NH3 has been documented as one of the most effective
methods that converts NO into N2.25 Catalysts play an important role in this conversion that
determine the NO removal efficiency. V2O5-WO3/TiO2 or V2O5-MoO3/TiO2 honeycomb
monolith catalyst are commonly used in industrial applications. However, these catalysts have
shown some drawbacks and found to be deactivated during application mainly due to high
temperature and large quantity of dust.26 Various approaches have been taken to overcome
these problems while several groups investigating with other materials to develop efficient
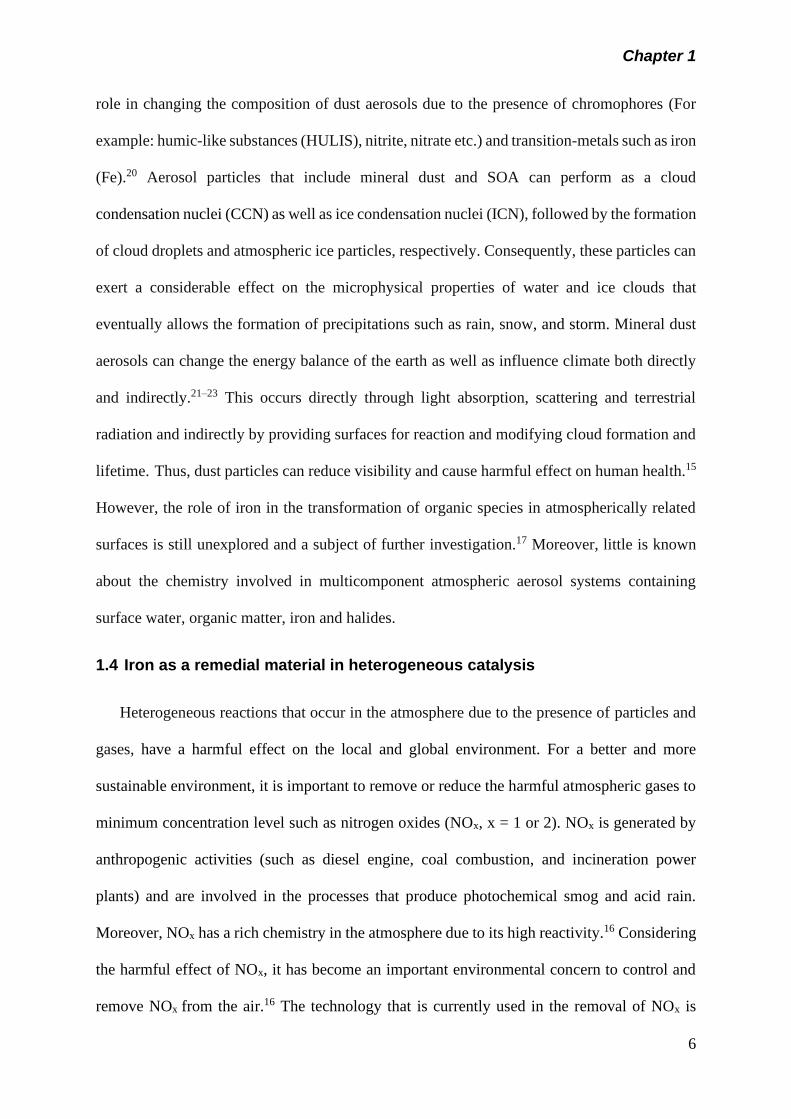
catalyst for NH3-SCR for NOx removal.27 Recently, metal-organic frameworks (MOFs) have
emerged as a new class of useful materials.28,29 They are unique materials having metal building
unit together with coordinated organic linkers to form extended regular one, two- or three-
dimensional structure (Figure 1.3).30
Figure 1.3 Organic linkers and metal ions or clusters combine to synthesize metal-organic
framework materials (re-printed with permission from Ref 30).
Iron-containing materials have been used as environmental catalyst and for remediation
on a number of occasions due to their stability, low cost and environment-friendly.31 Iron-
containing MOF can be employed in this regard. Fe-based structures are known as the most
promising type of MOFs due to their high thermal stability, low cost, high biocompatibility
Chapter 1
8
and low toxicity.32 Fe-BTC (BTC: 1,3,5-benzenetricarboxy- late) is one of the MOFs that has
been commercialized by BASF under the name of Basolite.33
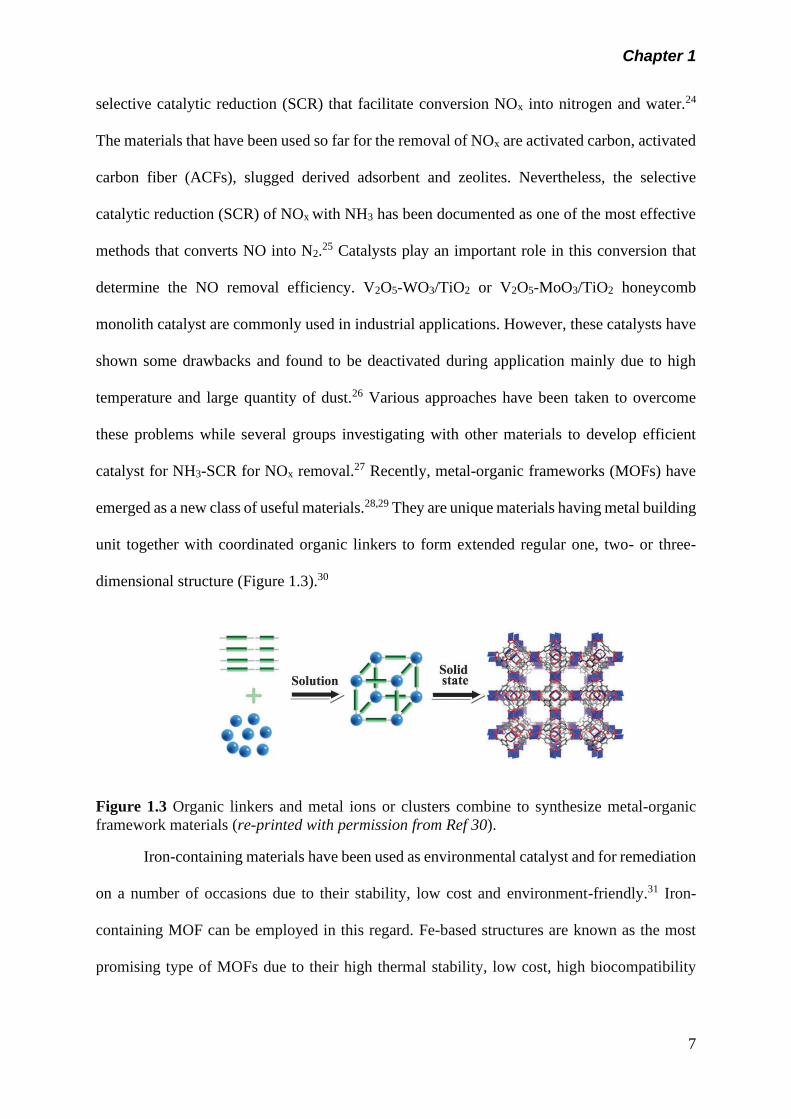
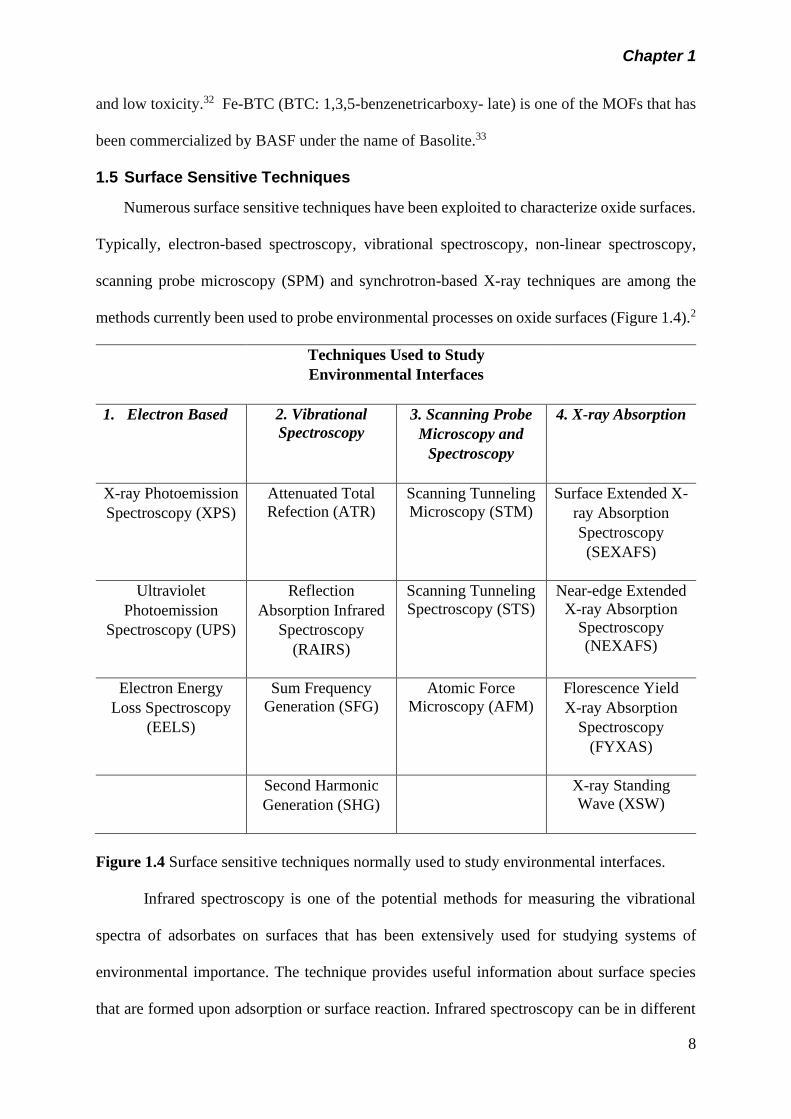
1.5 Surface Sensitive Techniques
Numerous surface sensitive techniques have been exploited to characterize oxide surfaces.
Typically, electron-based spectroscopy, vibrational spectroscopy, non-linear spectroscopy,
scanning probe microscopy (SPM) and synchrotron-based X-ray techniques are among the
methods currently been used to probe environmental processes on oxide surfaces (Figure 1.4).2
Techniques Used to Study
Environmental Interfaces
1. Electron Based 2. Vibrational
Spectroscopy
3. Scanning Probe
Microscopy and
Spectroscopy
4. X-ray Absorption
X-ray Photoemission
Spectroscopy (XPS)
Attenuated Total
Refection (ATR)
Scanning Tunneling
Microscopy (STM)
Surface Extended X-
ray Absorption
Spectroscopy
(SEXAFS)
Ultraviolet
Photoemission
Spectroscopy (UPS)
Reflection
Absorption Infrared
Spectroscopy
(RAIRS)
Scanning Tunneling
Spectroscopy (STS)
Near-edge Extended
X-ray Absorption
Spectroscopy
(NEXAFS)
Electron Energy
Loss Spectroscopy
(EELS)
Sum Frequency
Generation (SFG)
Atomic Force
Microscopy (AFM)
Florescence Yield
X-ray Absorption
Spectroscopy
(FYXAS)
Second Harmonic
Generation (SHG)
X-ray Standing
Wave (XSW)
Figure 1.4 Surface sensitive techniques normally used to study environmental interfaces.
Infrared spectroscopy is one of the potential methods for measuring the vibrational
spectra of adsorbates on surfaces that has been extensively used for studying systems of
environmental importance. The technique provides useful information about surface species
that are formed upon adsorption or surface reaction. Infrared spectroscopy can be in different
Chapter 1
9
forms such as reflection absorption infrared spectroscopy (RAIRS), diffuse reflectance infrared
spectroscopy (DRIFTS), transmission Fourier transform infrared (FT-IR) spectroscopy, and
multiple internal reflection (MIR) spectroscopy. These techniques are based on the linear optics
where the bulk signal is much more intense than the signal derived from the interface. Surface
reactions are mainly monitored by proper subtraction of the bulk contribution that can often
cause anomalous errors. Another infrared-based technique developed for in situ investigations
of liquid/solid interfaces is attenuated total reflection Fourier transform infrared (ATR FT-IR)
spectroscopy. This technique differs from traditional transmission IR techniques in that very
short effective path lengths on the order of tens microns can be achieved. This criterion makes
ATR techniques powerful tools for measuring IR spectra of liquid solutions with strong IR
absorber solvents such as water. The internal reflection element (IRE) is usually a high
refractive index crystal such as Ge and ZeSe. When the IR beam enters the crystals, it is
internally reflected several times until it exits. The probe radiation at the reflection point is an
exponentially decaying wave (evanescent wave) on the order of a micron and less. Here, the
reflectivity is a measure of the interaction of the evanescent wave with the sample, thus the
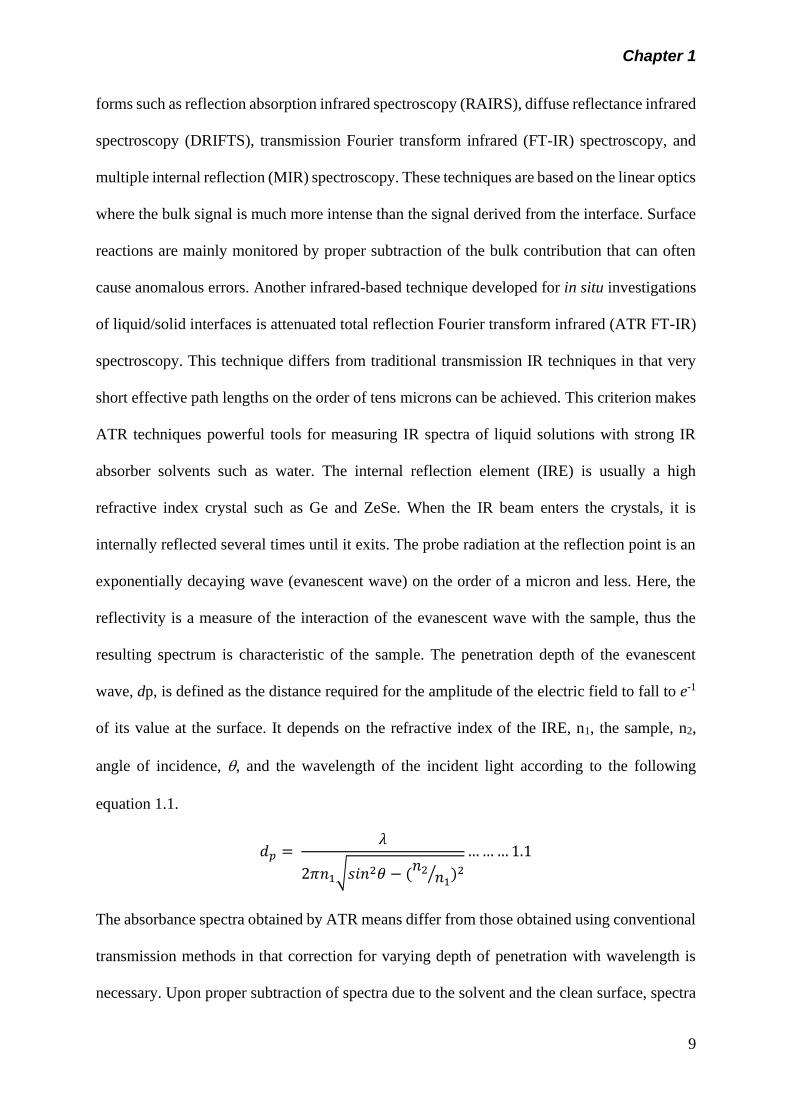
resulting spectrum is characteristic of the sample. The penetration depth of the evanescent
wave, dp, is defined as the distance required for the amplitude of the electric field to fall to e-1
of its value at the surface. It depends on the refractive index of the IRE, n1, the sample, n2,
angle of incidence, , and the wavelength of the incident light according to the following
equation 1.1.
𝑑𝑝 = 𝜆
2𝜋𝑛1√𝑠𝑖𝑛2𝜃 − (𝑛2
𝑛1⁄ )2
… … … 1.1
The absorbance spectra obtained by ATR means differ from those obtained using conventional
transmission methods in that correction for varying depth of penetration with wavelength is
necessary. Upon proper subtraction of spectra due to the solvent and the clean surface, spectra
Chapter 1
10
due to the interfacial region can be easily obtained. ATR techniques have been employed for
studying different environmental systems at the molecular level such as surface complexation
and dissolution of minerals and water structure in many aqueous environments. In this PhD
research both ATR-FTIR and DRIFTS, have been extensively applied to characterized surface
species for both solid-liquid and air-solid interaction reactions.
1.6 Research questions and objectives
Currently, the environmental problems and concerns are increasing gradually. Therefore,
it is important to study and understand the environmental processes on a molecular level. As
mentioned earlier, iron plays a vital role in numerous environmental processes such as aqueous
geochemistry, heterogeneous atmospheric chemistry and environmental catalysis and
remediation, it requires high level of investigation in these three distinctly separated areas. In
these studies, we set our goal on finding the answers to the following questions in these three
distinct areas:
a. How organic matter (particularly -OH and -COOH containing organic matter) interacts
with iron oxide surfaces in water?
b. What types of surface complexes are formed during these interactions of organic matter
and iron oxide surface? How are these interactions effected by the changes in pH and
electrolytic conditions?
c. In aquatic systems, how does organic matter on oxide surface, affects the binding kinetics
of pollutants such as Arsenic (As)?
d. How does gas-phase water interact with iron-containing secondary organic polymers that
exist in the atmosphere? And last but not the least,
e. How can iron containing materials be used as a useful remediation material to reduce NOx,
one of the main pollutants in the air?
Chapter 1
11
In these studies, the above questions have been covered and described one by one, on a
molecular level under different environmental conditions. However, the main purposes of this
thesis are as follows:
1. Investigate the role of iron oxide in mobility and bioavailability of arsenic and effect of
organic matter in soil and water.
2. Explore the role of iron oxide in the secondary formation due to interactions with model
organic compounds containing C2-C6 dicarboxylic acids and
3. Study the effectiveness of Fe-MOF materials in the catalytic reaction of nitrogen oxides
(NOx, x = 1 or 2).
1.7 Thesis organization
This thesis contains six different chapters. Chapter 1 highlights the introductory description on
iron and its role in different environmental processes. Chapter 2 to Chapter 5 come up with
four distinct projects. Each of these chapters has been divided into six parts such as
introduction; objectives; experiments; results and discussion; conclusion and references.
Finally, Chapter 6 contains the overall conclusions and significance followed by appendices.
The content for each chapter of my thesis is stated below:
Chapter 1 General Introduction
Chapter 1 describes the general introduction of my thesis and sets the tone for the
remaining chapters. This chapter talks about the iron (Fe), how it exists in the natural
environment; its introduction to the soil and water; its role in the atmospheric chemistry and
finally usefulness of iron as a remediation material in a concise manner. In addition, this chapter
contains the research questions and objectives together with the organization of overall thesis.
Chapter 1
12
Chapter 2 Spectral Characterization of Organics on Hematite Nanoparticles, H/D Exchange
Experiments
Chapter 2 illustrates the H/D exchange experiments that were completed to address the
questions raised during publishing the paper in “Environmental Nano, 2016, 3, (4), 910-926”.
This paper highlights the spectral characterization of low molecular weight organics on
hematite nanoparticles and the role of electrolytes in the binding mechanisms. In order to
complement the experiments completed by Arthur Situm, a former student member from our
group, H/D exchange experiments were performed. He completed the experiments that were
associated with spectral characterization of surface organics (citrate, oxalate and pyrocatechol)
as a function of pH onto hematite nanoparticle in H2O. However, my contribution to the paper
are the experiments associated with spectral characterization of surface organics (citrate,
oxalate and pyrocatechol) as a function of pD onto hematite nanoparticles in D2O. These
experiments were performed to study the effect of H/D exchange on the structure of organic
complexes on hematite nanoparticles, particularly to investigate the possible association of
protons with the organics surface complex by Attenuated total internal reflectance Fourier
transform infrared spectroscopy (ATR-FTIR).
Chapter 3 ATR-FTIR Studies on the Initial Binding Kinetics of Arsenicals at the Organic-
Hematite Interface
Chapter 3 describes the initial binding kinetics of arsenicals at the organic-hematite
interface by ATR-FTIR. These experiments were done to complement the experiments
completed by Arthur Situm, a former student member from our group, in order to publish
“Journal of Physical Chemistry (A), 2017, 121, 5569-5579”. Here, the adsorption kinetics of
dimethayl arsenic acid (DMA) and arsenate with hematite nanoparticles, preloaded to three
different types of organics such as citrate, oxalate and pyrocatechol, were studied by in situ
Chapter 1
13
ATR-FTIR. As mentioned earlier, Arthur completed the experiments of arsenate and DMA
with hematite pre-exposed to citrate, in different electrolytes such as NaCl, KCl and KBr. My
contribution to the paper is the experiments of arsenate and DMA with hematite pre-exposed
to oxalate and pyrocatechol, in different electrolytes such as NaCl, KCl and KBr. Chapter 3
contains an in detail study of the experiments that I contributed to the JPC (A) paper.
Chapter 4 Surface Water Structure and Hygroscopic Properties of Light Absorbing Secondary
Organic Polymers of Atmospheric Relevance
Chapter 4 demonstrates the structure of surface water onto light absorbing organic and
organometallic polymeric particles, such as polycatechol, polyguaiacol, Fe-polyfumarte, and
Fe-polymuconate. Also, the hygroscopic properties of these organic and organometallic
polymeric particles were investigated. This work was published in “ACS Omega, 2018, 3,
15519-15529”. I am the first author of this paper and contributed by all the experiments, trouble
shooting and data analysis, associated with this paper. It has been found that these particles are
formed in iron-catalyzed reactions that contain aromatic and aliphatic dicarboxylic acid
compounds and spotted in field-collected SOA. The structural characterization of surface water
was done by diffuse reflectance infrared Fourier transform spectroscopy (DRIFTS). In
addition, the gas-phase water uptake behavior of the particles was quantified using quartz
crystal microbalance (QCM) as a function of relative humidity.
Chapter 5 Application of Metal-Organic Frameworks (MOFs) to Enhance the Selective
Catalytic Reduction of NOx to Nitrogen Gas
Chapter 5 focuses on the elucidation of the performance of the metal-organic
frameworks (MOFs) for the selective catalytic reduction of NOx by NH3 as a reductant. Here,
Fe-BTC MOFs and CoFe2O4 nanomaterials have been chosen for the NH3-SCR to examine
their performance as catalysts. I am the first author of this work and did all the experiments,
Chapter 1
14
trouble shooting and data analysis, associated with this project. The surface and gas phase
species were characterized and quantified separately by DRIFTS and gas flow IR, respectively.
Chapter 6 Conclusions and Significance
Chapter 6 highlights the overall concluding remarks and significance that is related to
the three distinct areas of our environment. In these studies, we reported the interactions of
organic matter with iron oxide surface accompanied by the initial binding kinetics of arsenicals
with hematite nanoparticles preloaded to the organics, which are ubiquitous in nature and
represents the environmental processes associated to the aquatic geochemistry. One the other
hand, study of the characterization of surface water structure onto organic and organometallic
polymeric particles, reflects the chemical processes that occur in the atmospheric system.
Moreover, iron-containing MOFs as a catalyst can be useful to purify our environment and
remove harmful gases, have been discussed to highlight the role iron plays as a remediation
material. Chapter 6 has extended discussion on the conclusion and significance of this thesis
followed by appendices.
1.8 References
(1) Xing, W.; Liu, G. Iron Biogeochemistry and Its Environmental Impacts in Freshwater
Lakes. Fresenius Environ. Bull. 2011, 20 (6), 1339–1345.
(2) Al-Abadleh, H. A.; Grassian, V. H. Oxide Surfaces as Environmental Interfaces. Surf.
Sci. Rep. 2003, 52 (3–4), 63–161.
(3) Wu, W.; Wu, Z.; Yu, T.; Jiang, C.; Kim, W. S. Recent Progress on Magnetic Iron Oxide
Nanoparticles: Synthesis, Surface Functional Strategies and Biomedical Applications.
Sci. Technol. Adv. Mater. 2015, 16 (2), 23501.
(4) Das, S.; Hendry, J. M.; Essilfie-Dughan, J. Supplementary Information For: The
Transformation Of 2-Line Ferrihydrite To Goethite And Hematite As A Function of pH

Chapter 1
15
And Temperature. Environ. Sci. Technol. 2011, 45 (1), 268–275.
(5) Matsui, H.; Mahowald, N. M.; Moteki, N.; Hamilton, D. S.; Ohata, S.; Yoshida, A.;
Koike, M.; Scanza, R. A.; Flanner, M. G. Anthropogenic Combustion Iron as a Complex
Climate Forcer. Nat. Commun. 2018, 9 (1), 1–10.
(6) Situm, A.; Rahman, M. A.; Goldberg, S.; Al-Abadleh, H. A. Spectral Characterization
and Surface Complexation Modeling of Low Molecular Weight Organics on Hematite
Nanoparticles: Role of Electrolytes in the Binding Mechanism. Environ. Sci. Nano 2016,
3 (4), 910–926.
(7) Kleinert, S.; Muehe, E. M.; Posth, N. R.; Dippon, U.; Daus, B.; Kappler, A. Biogenic
Fe(III) Minerals Lower the Efficiency of Iron-Mineral-Based Commercial Filter
Systems for Arsenic Removal. Environ. Sci. Technol. 2011, 45 (17), 7533–7541.
(8) Mudhoo, A.; Sharma, S. K.; Garg, V. K.; Tseng, C.-H. Arsenic: An Overview of
Applications, Health, and Environmental Concerns and Removal Processes. Crit. Rev.
Environ. Sci. Technol. 2011, 41 (5), 435–519.
(9) Sánchez-Rodas, D.; Sánchez de la Campa, A. M.; de la Rosa, J. D.; Oliveira, V.; Gómez-
Ariza, J. L.; Querol, X.; Alastuey, A. Arsenic Speciation of Atmospheric Particulate
Matter (PM10) in an Industrialised Urban Site in Southwestern Spain. Chemosphere
2007, 66 (8), 1485–1493.
(10) Wai, K. M.; Wu, S.; Li, X.; Jaffe, D. A.; Perry, K. D. Global Atmospheric Transport and
Source-Receptor Relationships for Arsenic. Environ. Sci. Technol. 2016, 50 (7), 3714–
3720.
(11) Mikutta, C.; Kretzschmar, R. Spectroscopic Evidence for Ternary Complex Formation
between Arsenate and Ferric Iron Complexes of Humic Substances. Environ. Sci.
Chapter 1
16
Technol. 2011, 45, 9550–9557.
(12) Redman, A. D.; Macalady, D.; Ahmann, D. Natural Organic Matter Affects Arsenic
Speciation and Sorption onto Hematite. Environ. Sci. Technol. 2002, 36 (13), 2889–
2896.
(13) Bauer, M.; Blodau, C. Mobilization of Arsenic by Dissolved Organic Matter from Iron
Oxides, Soils and Sediments. Sci. Total Environ. 2006, 354 (2–3), 179–190.
(14) Ko, I.; Kim, J. Y.; Kim, K. W. Arsenic Speciation and Sorption Kinetics in the As-
Hematite-Humic Acid System. Colloids Surfaces A Physicochem. Eng. Asp. 2004, 234
(1–3), 43–50.
(15) Weng, L.; Van Riemsdijk, W. H.; Hiemstra, T. Effects of Fulvic and Humic Acids on
Arsenate Adsorption to Goethite: Experiments and Modeling. Environ. Sci. Technol.
2009, 43 (19), 7198–7204.
(16) Hixson, B. C.; Jordan, J. W.; Wagner, E. L.; Bevsek, H. M. Reaction Products and
Kinetics of the Reaction of NO2 with γ-Fe2O3. J. Phys. Chem. A 2011, 115 (46), 13364–
13369.
(17) Prather, K. A.; Hatch, C. D.; Grassian, V. H. Analysis of Atmospheric Aerosols. Annu.
Rev. Anal. Chem. 2008, 1 (1), 485–514.
(18) Goldstein, A. H.; Galbally, I. E. Known and Unexplored Organic Constituents in the
Earth’s Atmosphere. Environ. Sci. Technol. 2007, 41 (5), 1514–1521.
(19) Benner, R. Loose Ligands and Available Iron in the Ocean. Proc. Natl. Acad. Sci. 2011,
108 (3), 893–894.
(20) Tofan-Lazar, J.; Al-Abadleh, H. A. Surface Water Enhances the Uptake and
Photoreactivity of Gaseous Catechol on Solid Iron(III) Chloride. Environ. Sci. Technol.
Chapter 1
17
2014, 48 (1), 394–402.
(21) Stevens, B.; Feingold, G. Untangling Aerosol Effects on Clouds and Precipitation in a
Buffered System. Nature 2009, 461 (7264), 607–613.
(22) Carslaw, K. S.; Lee, L. A.; Reddington, C. L.; Pringle, K. J.; Rap, A.; Forster, P. M.;
Mann, G. W.; Spracklen, D. V.; Woodhouse, M. T.; Regayre, L. A.; et al. Large
Contribution of Natural Aerosols to Uncertainty in Indirect Forcing. Nature 2013, 503
(7474), 67–71.
(23) Madl, A. K.; Plummer, L. E.; Carosino, C.; Pinkerton, K. E. Nanoparticles, Lung Injury,
and the Role of Oxidant Stress. Annu. Rev. Physiol. 2013, 76 (1), 447–465.
(24) Dhakshinamoorthy, A.; Alvaro, M.; Horcajada, P.; Gibson, E.; Vishnuvarthan, M.;
Vimont, A.; Grenèche, J. M.; Serre, C.; Daturi, M.; Garcia, H. Comparison of Porous
Iron Trimesates Basolite F300 and MIL-100(Fe) as Heterogeneous Catalysts for Lewis
Acid and Oxidation Reactions: Roles of Structural Defects and Stability. ACS Catal.
2012, 2 (10), 2060–2065.
(25) Roy, S.; Hegde, M. S.; Madras, G. Catalysis for NOx Abatement. Appl. Energy 2009,
86 (11), 2283–2297.
(26) Shang, X.; Hu, G.; He, C.; Zhao, J.; Zhang, F.; Xu, Y.; Zhang, Y.; Li, J.; Chen, J.
Regeneration of Full-Scale Commercial Honeycomb Monolith Catalyst (V2O5 -
WO3/TiO2) Used in Coal-Fired Power Plant. J. Ind. Eng. Chem. 2012, 18 (1), 513–519.
(27) Cheng, X.; Bi, X. T. A Review of Recent Advances in Selective Catalytic NOx
Reduction Reactor Technologies. Particuology 2014, 16, 1–18.
(28) Zhou, H.-C. “Joe”; Kitagawa, S. Metal–Organic Frameworks (MOFs). Chem. Soc. Rev.
2014, 43 (16), 5415–5418.
Chapter 1
18
(29) Czaja, A. U.; Trukhan, N.; Müller, U. Industrial Applications of Metal–organic
Frameworks. Chem. Soc. Rev. 2009, 38 (5), 1284.
(30) Furukawa, H.; Ko, N.; Go, Y. B.; Aratani, N.; Choi, S. B.; Choi, E.; Yazaydin, a O.;
Snurr, R. Q.; O’Keeffe, M.; Kim, J.; et al. Ultrahigh Porosity in Meta-Organic
Frameworks. Science. 2010, 329 (5990), 424.
(31) Youn, H. K.; Kim, J.; Ahn, W. S. MWCNT Synthesis over Fe-BTC as a Catalyst/Carbon
Source via CVD. Mater. Lett. 2011, 65 (19–20), 3055–3057.
(32) Chaemchuen, S.; Kabir, N. A.; Zhou, K.; Verpoort, F. Metal–organic Frameworks for
Upgrading Biogas via CO2 Adsorption to Biogas Green Energy. Chem. Soc. Rev. 2013,
42 (24), 9304.
(33) Hu, X.; Lou, X.; Li, C.; Ning, Y.; Liao, Y.; Chen, Q.; Mananga, E. S.; Shen, M.; Hu, B.
Facile Synthesis of the Basolite F300-like Nanoscale Fe-BTC Framework and Its
Lithium Storage Properties. RSC Adv. 2016, 6 (115), 114483–114490.
Chapter 2
19
Chapter 2 Spectral Characterization of Surface Organics on Hematite
Nanoparticles, H/D Exchange Experiments
2.1 Abstract
This chapter describes the spectral characterization of model organics such as CA, OA and
PC onto hematite nanoparticles. ATR-FTIR absorption spectra of adsorbed CA, OA and PC
were collected in D2O as a function of pD from 9-5. These experiments were performed in D2O
in order to interpret the results obtained from the pH envelope experiments for those model
organics on hematite nanoparticles. The results from pD experiment show that the existence of
a higher degree of outer-sphere complexation for OA than CA, whereas for PC bidentate-
binuclear complexes dominates.
2.2 Introduction
Understanding the interactions of organic matter (OM) with metal oxide or minerals at the
interfaces of solid-water and surface-controlled reactions is a pre-condition to preserve the
organic matter (OM) as well as the stability and transport of both organic and inorganic species
in the subsurface soil environments.1 Interactions between organics and metal oxides/mineral
interface are a subject of current interest as they have many important applications in
environmental, biological and medical systems.2,3 However, due to the complex nature of both
organic matters and metal oxides/mineral surfaces, multiple interaction mechanisms have been
proposed in the literature. There are several mechanisms through which the interactions of
organic matters and metal oxides/mineral interface may take place (Figure 2.1). These
interaction mechanisms are well recognized and can be attributed to the characteristic nature
of the heterogeneous OM and metal oxides surfaces, their interfacial properties, and the
surrounding environmental conditions, particularly, pH and ionic strength. The most common
mechanisms involved are ligand exchange, electrostatic interaction, H-bonding, cation
bridging, chelation, hydrophobic and van der Waals interactions. All these interactions result
Chapter 2
20
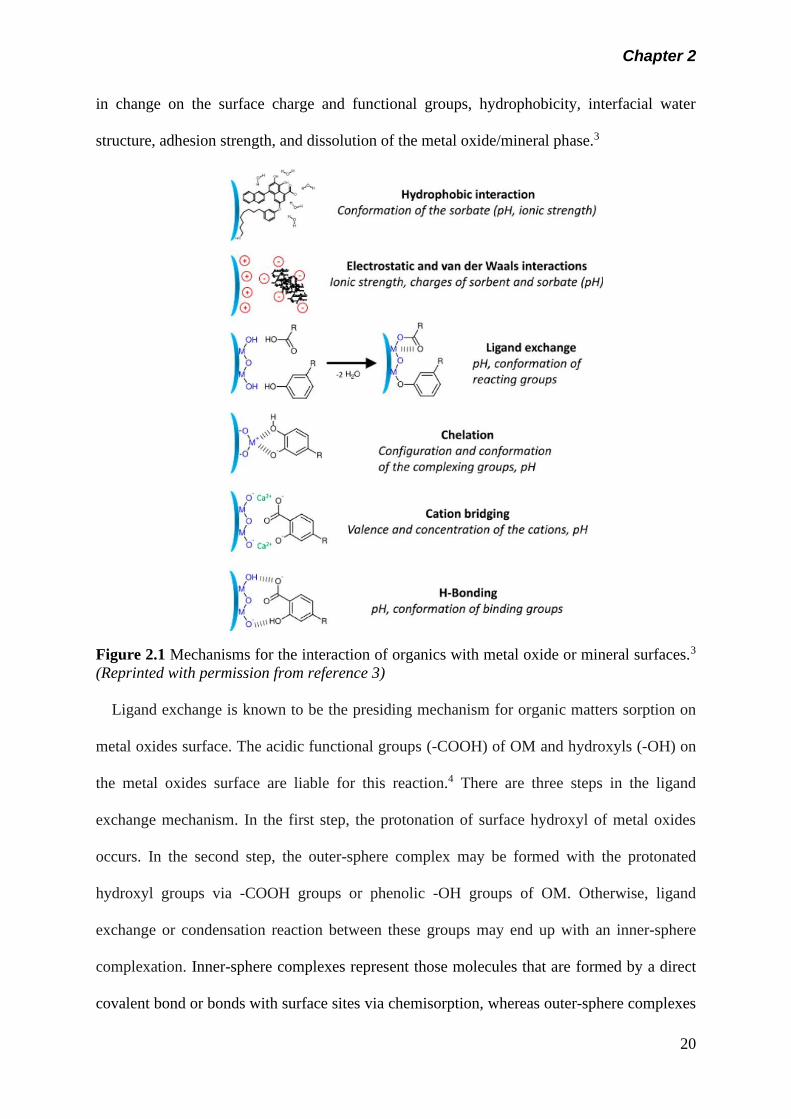
in change on the surface charge and functional groups, hydrophobicity, interfacial water
structure, adhesion strength, and dissolution of the metal oxide/mineral phase.3
Figure 2.1 Mechanisms for the interaction of organics with metal oxide or mineral surfaces.3
(Reprinted with permission from reference 3)
Ligand exchange is known to be the presiding mechanism for organic matters sorption on
metal oxides surface. The acidic functional groups (-COOH) of OM and hydroxyls (-OH) on
the metal oxides surface are liable for this reaction.4 There are three steps in the ligand
exchange mechanism. In the first step, the protonation of surface hydroxyl of metal oxides
occurs. In the second step, the outer-sphere complex may be formed with the protonated
hydroxyl groups via -COOH groups or phenolic -OH groups of OM. Otherwise, ligand
exchange or condensation reaction between these groups may end up with an inner-sphere
complexation. Inner-sphere complexes represent those molecules that are formed by a direct
covalent bond or bonds with surface sites via chemisorption, whereas outer-sphere complexes
Chapter 2
21
are formed through electrostatic or weak van der Waals interactions with the surface, typically
known as physisorption.5
Electrostatic interaction is considered as a vital sorption mechanism, particularly for metal
oxides with the point of zero charge (PZC). At this point the pH remains higher than the
environmental pH. It is well documented that most of organic matter is negatively charged
under typical ambient conditions in the natural environment, and the net charge increases with
higher pH due to the protonation of carboxylic and phenolic groups of OM. On the other hand,
the solvated metal oxide surfaces or the addition of electrolytes can make the surface charged.
Thus, electrostatic interaction between OM and metal oxide surfaces are expected. As the metal
oxide surface is positively charged, it can react with negatively charged OM by electrostatic
attraction. However, it has been reported that negatively charged surface can also adsorb
negatively charged OM through other interactions.5
Hydrogen bonding is most likely to be formed in presence of organic adsorbate and metal
oxide surface containing the functional groups like -COOH, -OH and -NH2. In such a system,
the polar functional groups like -COOH and -OH in OM act as a hydrogen bonding donor,
whereas benzene rings serve as a hydrogen bonding acceptor. However, hydrogen bonding is
usually not considered as a driving force of a reaction due to the weakness of the bonding.
Moreover, the reduction of hydrogen bonding donors is found to be responsible for the much
weaker hydrogen-bond interaction.
Cation bridging is another kind of interaction that occurs through divalent or multivalent
metal ions (such as Ca2+ or Mg2+) to the oxygen-containing functional groups (e.g., -COOH
and -OH groups) of metal oxides surface and OM, which facilitates the OM sorption. Cation
bridging has influence over the interactions between OM and the metal oxides surface. In
addition, this effect can be extended to the adjacent OM interfaces that may form multilayer
adsorption of OM onto metal oxides surfaces. However, hydrophobicity of OM and
Chapter 2
22
compression of the electric double layer can enhance the adsorption of OM on the surface.
Hydrophobic or van der Waals force interactions are mostly favored by surfaces containing
hydrophobic materials such as carbon nanomaterials. It has been found that, the aromatic
moieties of OM, having -COOH or OH, are more hydrophobic, relative to that of aliphatic OM
and found to strongly bound on surfaces by hydrophobic effects.6 Ionization of functional
groups can higher the solubility of OM and thus decreases hydrophobic effects. The
hydrophobic interactions in related to pH and found to be decreased with higher pH.
Hydrophobic interaction between OM and metal oxide surface exist at pH above the PZC of
metal oxide. However, hydrophobic and van der Waals force interactions are relatively weak
and not worthy to report for the adsorption of OM on metal oxides surface.
Several studied have been reported on the interaction of organic matters and metal oxide
and mineral particulates which are ex-situ batch measurements. However, in-situ experiments
are rare and still needed to be addressed with importance to understand the molecular-level
details.7 In this study, hematite nanoparticles have been choose as metal oxide surface whereas
citric (CA) and oxalic (OA) acids and pyrocatechol (PC) as organics. In the literature, the
structure of surface organic molecules on iron-(oxyhydr)oxides and iron containing clays and
oxides (mostly goethite and ferrihydrite) has been examine by using of transmission and ATR-
FTIR spectroscopy. Kubicki et al.8 studied that chemisorption of OA and CA onto clays.
However, the chemisorption of OA and CA onto clays was limited without the presence of Fe-
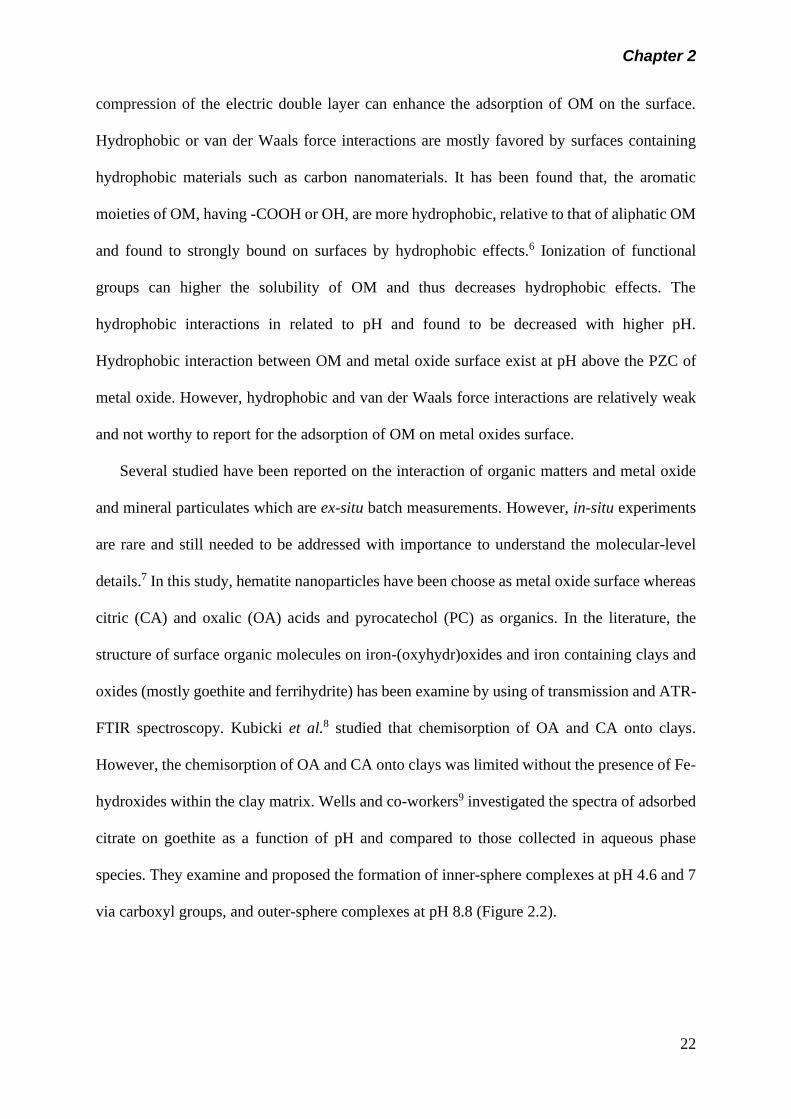
hydroxides within the clay matrix. Wells and co-workers9 investigated the spectra of adsorbed
citrate on goethite as a function of pH and compared to those collected in aqueous phase
species. They examine and proposed the formation of inner-sphere complexes at pH 4.6 and 7
via carboxyl groups, and outer-sphere complexes at pH 8.8 (Figure 2.2).
Chapter 2
23
Figure 2.2 Outer-sphere and inner-sphere complexes for citrate with goethite
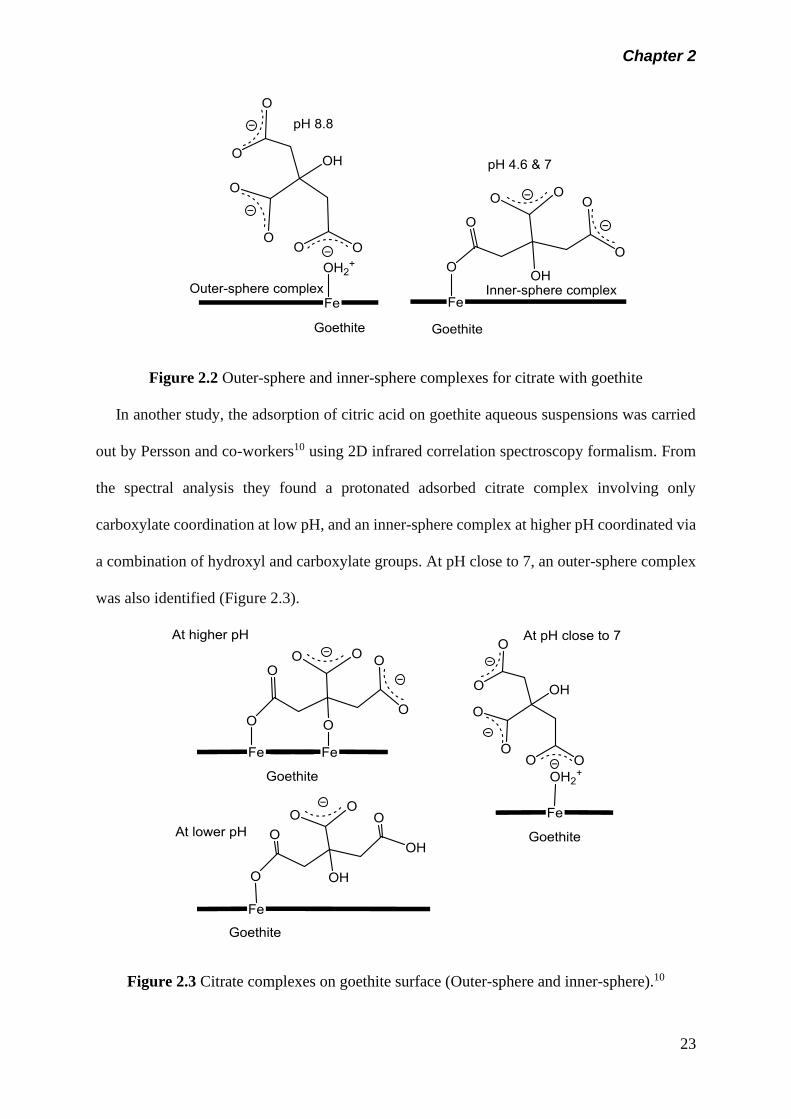
In another study, the adsorption of citric acid on goethite aqueous suspensions was carried
out by Persson and co-workers10 using 2D infrared correlation spectroscopy formalism. From
the spectral analysis they found a protonated adsorbed citrate complex involving only
carboxylate coordination at low pH, and an inner-sphere complex at higher pH coordinated via
a combination of hydroxyl and carboxylate groups. At pH close to 7, an outer-sphere complex
was also identified (Figure 2.3).
Figure 2.3 Citrate complexes on goethite surface (Outer-sphere and inner-sphere).10
Chapter 2
24
Filius et al.11 reported inner-sphere bidentate binuclear for oxalate on goethite. However,
the amounts adsorbed were found to be suppressed upon increasing ionic strength by Mesuere
and Fish.12
In another investigation, Persson and co-workers,13 coupled ATR-FTIR with extended x-
ray absorption fine structure spectroscopy (EXAFS) to examine the water-goethite interface
upon oxalate complexation as a function of pH. Similar conclusions were made by Cwiertny
et al.14 for the adsorption of oxalic acid on goethite micro- and nanorods at pH 3. The
adsorption of aqueous phase pyrocatechol on hematite and goethite particles at neutral to basic
pH was studied using ATR-FTIR and batch experiments.
Gulley-Stahl et al.15 found that adsorbed pyrocatechol promoted dissolution of Fe2O3 under
neutral and basic conditions, compared to proton-driven dissolution that is significant under
acidic conditions (pH<5). As mentioned earlier organic matters are important considering their
role in many types of chemical and biological reactions. They are involved in many types of
interaction with metal oxide and mineral surfaces and thus play a vital role in changing the
surface properties.
Recently, we published a paper that reports16 in situ spectral characterization of low
molecular weight organics complexes on hematite nanoparticle and the role of electrolytes in
their binding mechanism. The organics that were investigated are citric (CA) and oxalic (OA)
acids and pyrocatechol (PC). These organics were chosen as they are the representative of
modest aliphatic and aromatic compounds that may influence the charge and hydrophilicity of
the interface significantly upon adsorption. The structure of the surface organics on iron-
(oxyhydr) oxides was investigated using in situ attenuated total internal reflectance Fourier
transform infrared spectroscopy (ATR-FTIR). Two types of experiments were performed using
ATR-FTIR such as the adsorption pH envelopes experiments (range 9-5) and H/D exchange
experiments (range 9-4). The adsorption pH envelopes experiments were performed by former
Chapter 2
25
group member Arthur Situm whereas I contributed through running the H/D exchange
experiments. This chapter will highlight the H/D experiments that were conducted to explore
the answer of the questions raised from pH envelopes experiments.
2.3 Objectives
Interaction of organic matter with metal oxide/mineral surface is ubiquitous in natural
environment. It is importance to understand the molecular level details and reaction pathways
for organic matter and metal oxide surface that exist in nature. In this study, the effect of low
molecular weight organic compounds on the charge and hydrophilicity of the interface upon
adsorption onto hematite nanoparticles by ATR-FTIR. This chapter will aim to discuss my
contribution through performing the experiments for the spectral characterization of surface
organics (citrate, oxalate and pyrocatechol) as a function of pD onto hematite nanoparticle.
The purposes of these experiments are as follows:
i) Spectral characterization of surface organics as a function of pD.
ii) Study the effect of H/D exchange on the structure of organic complexes on hematite
nanoparticles.
iii) Compare the results obtained by spectral characterization of surface organics as a
function of pH.
iv) To find the answer to the question regarding possible association of protons with the
organics surface complex.
2.4 Experimental
2.4.1 Chemicals
Solutions were made by dissolving respective compounds in 0.01 KCl (potassium chloride,
ACS grade, 99.0%+, EMD) solution prepared fresh in D2O (deuterium oxide, 99.9 atom %D,
Sigma-Aldrich) and finally adjusted to the desired concentration and pD by using concentrated
(40 wt.% solution) NaOD (Sodium deuteroxide, 99.5%, Sigma-Aldrich). Powder of organic
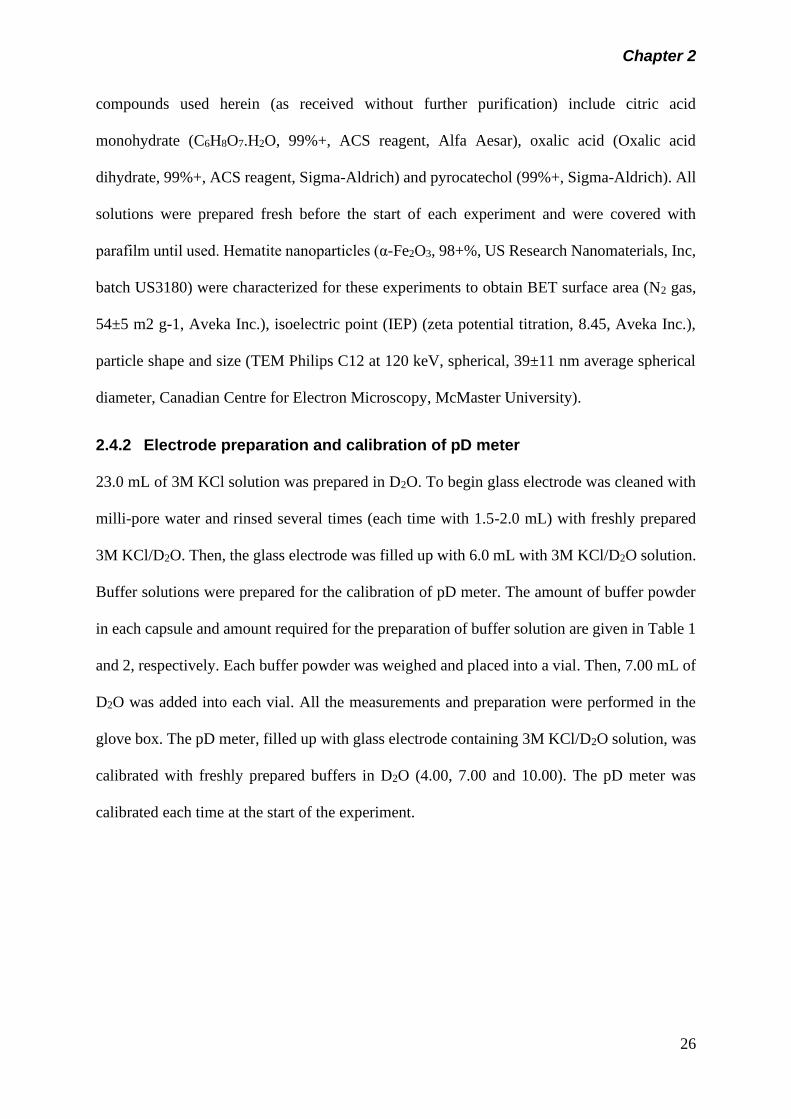
Chapter 2
26
compounds used herein (as received without further purification) include citric acid
monohydrate (C6H8O7.H2O, 99%+, ACS reagent, Alfa Aesar), oxalic acid (Oxalic acid
dihydrate, 99%+, ACS reagent, Sigma-Aldrich) and pyrocatechol (99%+, Sigma-Aldrich). All
solutions were prepared fresh before the start of each experiment and were covered with
parafilm until used. Hematite nanoparticles (α-Fe2O3, 98+%, US Research Nanomaterials, Inc,
batch US3180) were characterized for these experiments to obtain BET surface area (N2 gas,
54±5 m2 g-1, Aveka Inc.), isoelectric point (IEP) (zeta potential titration, 8.45, Aveka Inc.),
particle shape and size (TEM Philips C12 at 120 keV, spherical, 39±11 nm average spherical
diameter, Canadian Centre for Electron Microscopy, McMaster University).
2.4.2 Electrode preparation and calibration of pD meter
23.0 mL of 3M KCl solution was prepared in D2O. To begin glass electrode was cleaned with
milli-pore water and rinsed several times (each time with 1.5-2.0 mL) with freshly prepared
3M KCl/D2O. Then, the glass electrode was filled up with 6.0 mL with 3M KCl/D2O solution.
Buffer solutions were prepared for the calibration of pD meter. The amount of buffer powder
in each capsule and amount required for the preparation of buffer solution are given in Table 1
and 2, respectively. Each buffer powder was weighed and placed into a vial. Then, 7.00 mL of
D2O was added into each vial. All the measurements and preparation were performed in the
glove box. The pD meter, filled up with glass electrode containing 3M KCl/D2O solution, was
calibrated with freshly prepared buffers in D2O (4.00, 7.00 and 10.00). The pD meter was
calibrated each time at the start of the experiment.
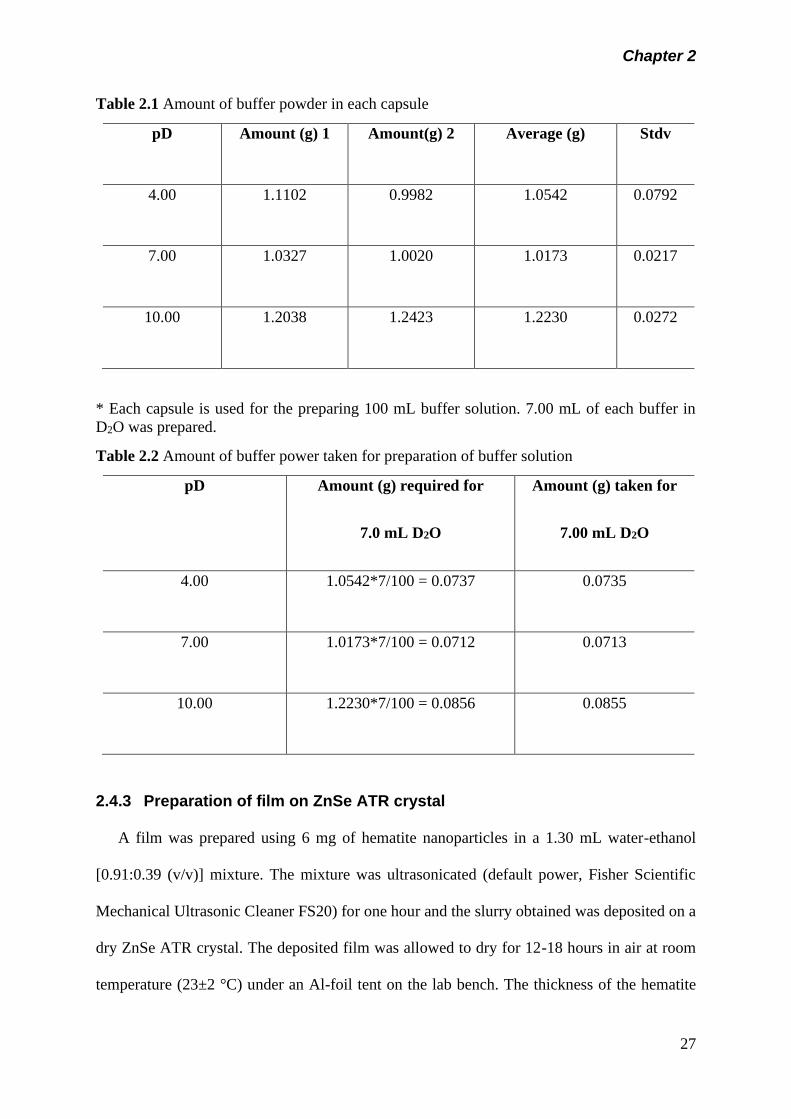
Chapter 2
27
Table 2.1 Amount of buffer powder in each capsule
pD Amount (g) 1
Amount(g) 2 Average (g) Stdv
4.00 1.1102
0.9982 1.0542 0.0792
7.00 1.0327
1.0020 1.0173 0.0217
10.00 1.2038 1.2423 1.2230 0.0272
* Each capsule is used for the preparing 100 mL buffer solution. 7.00 mL of each buffer in
D2O was prepared.
Table 2.2 Amount of buffer power taken for preparation of buffer solution
pD Amount (g) required for
7.0 mL D2O
Amount (g) taken for
7.00 mL D2O
4.00 1.0542*7/100 = 0.0737
0.0735
7.00 1.0173*7/100 = 0.0712
0.0713
10.00 1.2230*7/100 = 0.0856
0.0855
2.4.3 Preparation of film on ZnSe ATR crystal
A film was prepared using 6 mg of hematite nanoparticles in a 1.30 mL water-ethanol
[0.91:0.39 (v/v)] mixture. The mixture was ultrasonicated (default power, Fisher Scientific
Mechanical Ultrasonic Cleaner FS20) for one hour and the slurry obtained was deposited on a
dry ZnSe ATR crystal. The deposited film was allowed to dry for 12-18 hours in air at room
temperature (23±2 °C) under an Al-foil tent on the lab bench. The thickness of the hematite
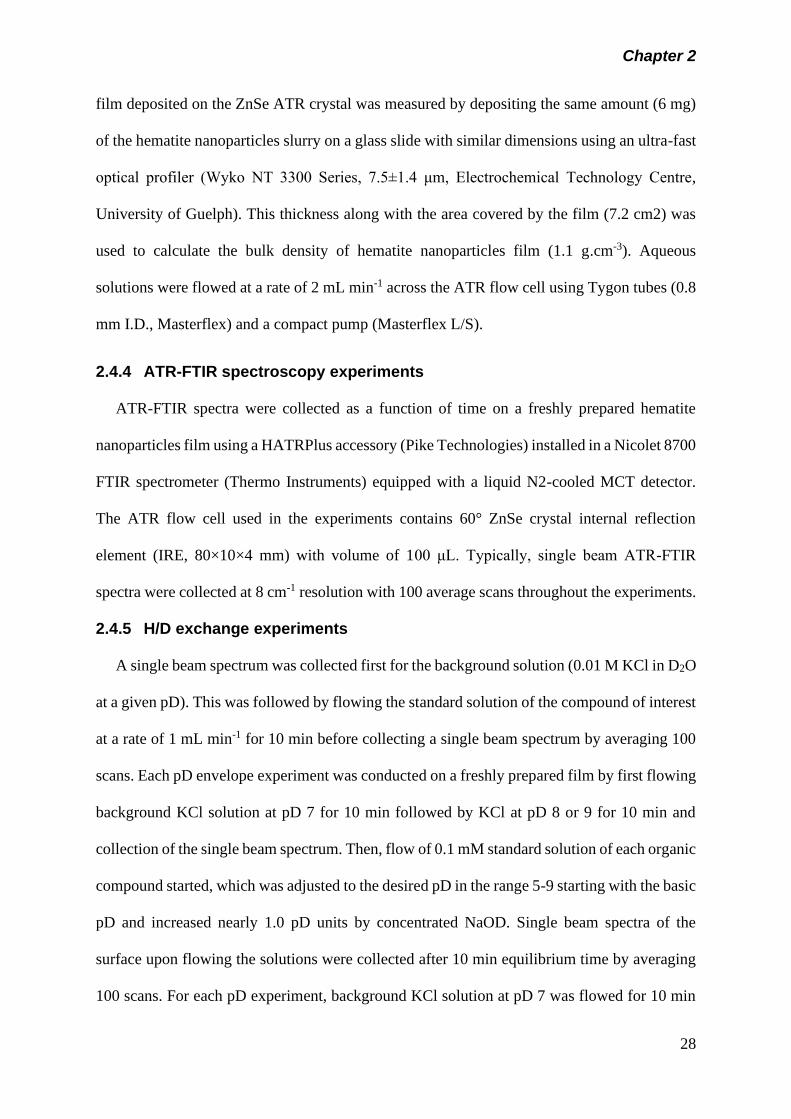
Chapter 2
28
film deposited on the ZnSe ATR crystal was measured by depositing the same amount (6 mg)
of the hematite nanoparticles slurry on a glass slide with similar dimensions using an ultra-fast
optical profiler (Wyko NT 3300 Series, 7.5±1.4 μm, Electrochemical Technology Centre,
University of Guelph). This thickness along with the area covered by the film (7.2 cm2) was
used to calculate the bulk density of hematite nanoparticles film (1.1 g.cm-3). Aqueous
solutions were flowed at a rate of 2 mL min-1 across the ATR flow cell using Tygon tubes (0.8
mm I.D., Masterflex) and a compact pump (Masterflex L/S).
2.4.4 ATR-FTIR spectroscopy experiments
ATR-FTIR spectra were collected as a function of time on a freshly prepared hematite
nanoparticles film using a HATRPlus accessory (Pike Technologies) installed in a Nicolet 8700
FTIR spectrometer (Thermo Instruments) equipped with a liquid N2-cooled MCT detector.
The ATR flow cell used in the experiments contains 60° ZnSe crystal internal reflection
element (IRE, 80×10×4 mm) with volume of 100 μL. Typically, single beam ATR-FTIR
spectra were collected at 8 cm-1 resolution with 100 average scans throughout the experiments.
2.4.5 H/D exchange experiments
A single beam spectrum was collected first for the background solution (0.01 M KCl in D2O
at a given pD). This was followed by flowing the standard solution of the compound of interest
at a rate of 1 mL min-1 for 10 min before collecting a single beam spectrum by averaging 100
scans. Each pD envelope experiment was conducted on a freshly prepared film by first flowing
background KCl solution at pD 7 for 10 min followed by KCl at pD 8 or 9 for 10 min and
collection of the single beam spectrum. Then, flow of 0.1 mM standard solution of each organic
compound started, which was adjusted to the desired pD in the range 5-9 starting with the basic
pD and increased nearly 1.0 pD units by concentrated NaOD. Single beam spectra of the
surface upon flowing the solutions were collected after 10 min equilibrium time by averaging
100 scans. For each pD experiment, background KCl solution at pD 7 was flowed for 10 min
Chapter 2
29
at a 1 mL/min flow rate, followed by KCl at pD 8 or 9 for 10 min and collection of the single
beam spectrum. Then, flow of 0.1 mM standard solution of each organic compound at basic
pD 4.02, 3.78 or 6.78 started for 10 min, followed by solutions adjusted to pD 5, 7, 8 or 9,
respectively, each for 10 min at a 1 mL/min flow rate.
2.5 Results and discussion
2.5.1 Spectral characterization of surface organics as a function of pD
As stated earlier, ATR-FTIR absorbance spectra of adsorbed citrate, oxalate and
pyrocatechol on hematite nanoparticles as a function of decreasing pH in the range 9-5 were
obtained by our former group member, Arthur Situm. However, the spectral range reported17
for these pH experiments (2000-1000 cm-1), contains the band assigned to the bending mode
of water, (H2O), at 1639 cm-1.
Figure 2.4 ATR-FTIR absorption spectra of adsorbed citrate on hematite nanoparticles after
flowing 10-4 M solutions prepared in D2O after 10 min flow as a function of decreasing pD
from 8 to 4. The electrolyte concentration was 0.01 M KCl.
This bending mode shifted to 1206 cm-1 in liquid D2O. In order to obtain the actual
spectra for the organic complexation, this feature was subtracted by spectral referencing to the
background spectrum collected prior to introduce the organic solution. In addition, the spectral
range contains (CO2-) and (CO) functional groups, sensitive to protonation and binding to
metal oxides. Therefore, to explore the possible association of protons with the organics surface
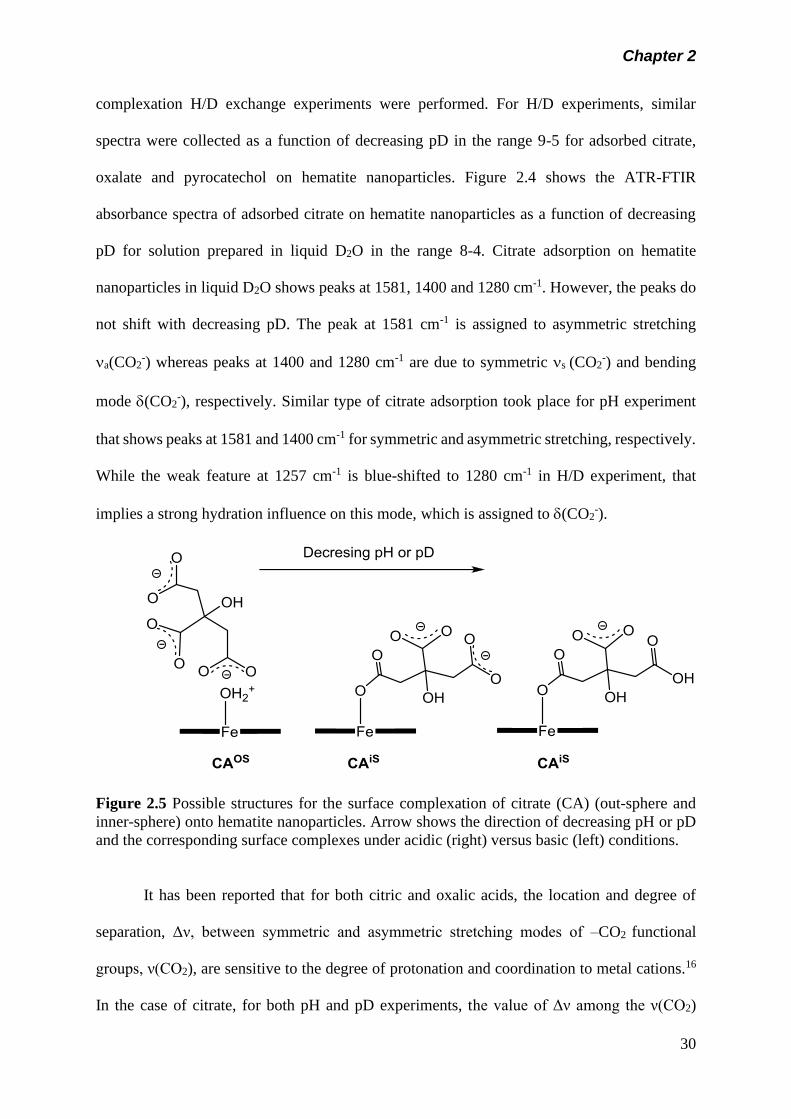
Chapter 2
30
complexation H/D exchange experiments were performed. For H/D experiments, similar
spectra were collected as a function of decreasing pD in the range 9-5 for adsorbed citrate,
oxalate and pyrocatechol on hematite nanoparticles. Figure 2.4 shows the ATR-FTIR
absorbance spectra of adsorbed citrate on hematite nanoparticles as a function of decreasing
pD for solution prepared in liquid D2O in the range 8-4. Citrate adsorption on hematite
nanoparticles in liquid D2O shows peaks at 1581, 1400 and 1280 cm-1. However, the peaks do
not shift with decreasing pD. The peak at 1581 cm-1 is assigned to asymmetric stretching
a(CO2-) whereas peaks at 1400 and 1280 cm-1 are due to symmetric s (CO2
-) and bending
mode (CO2-), respectively. Similar type of citrate adsorption took place for pH experiment
that shows peaks at 1581 and 1400 cm-1 for symmetric and asymmetric stretching, respectively.
While the weak feature at 1257 cm-1 is blue-shifted to 1280 cm-1 in H/D experiment, that
implies a strong hydration influence on this mode, which is assigned to (CO2-).
Figure 2.5 Possible structures for the surface complexation of citrate (CA) (out-sphere and
inner-sphere) onto hematite nanoparticles. Arrow shows the direction of decreasing pH or pD
and the corresponding surface complexes under acidic (right) versus basic (left) conditions.
It has been reported that for both citric and oxalic acids, the location and degree of
separation, Δν, between symmetric and asymmetric stretching modes of –CO2 functional
groups, ν(CO2), are sensitive to the degree of protonation and coordination to metal cations.16
In the case of citrate, for both pH and pD experiments, the value of Δν among the ν(CO2)
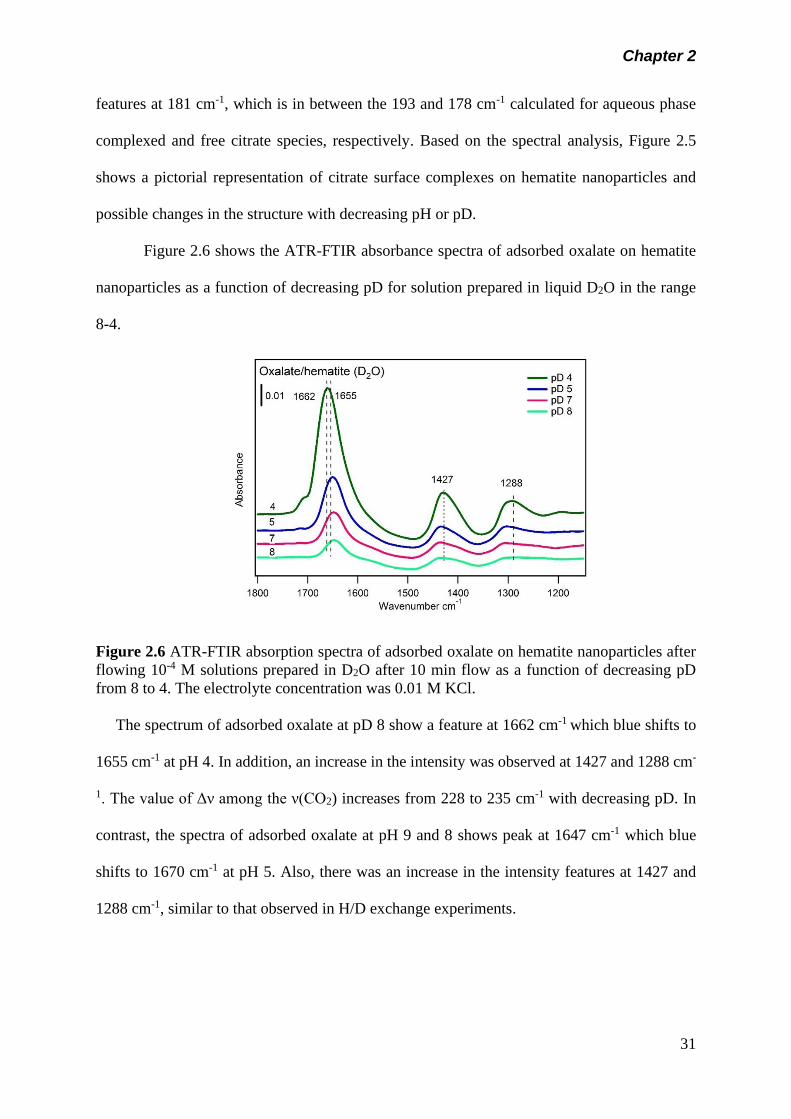
Chapter 2
31
features at 181 cm-1, which is in between the 193 and 178 cm-1 calculated for aqueous phase
complexed and free citrate species, respectively. Based on the spectral analysis, Figure 2.5
shows a pictorial representation of citrate surface complexes on hematite nanoparticles and
possible changes in the structure with decreasing pH or pD.
Figure 2.6 shows the ATR-FTIR absorbance spectra of adsorbed oxalate on hematite
nanoparticles as a function of decreasing pD for solution prepared in liquid D2O in the range
8-4.
Figure 2.6 ATR-FTIR absorption spectra of adsorbed oxalate on hematite nanoparticles after
flowing 10-4 M solutions prepared in D2O after 10 min flow as a function of decreasing pD
from 8 to 4. The electrolyte concentration was 0.01 M KCl.
The spectrum of adsorbed oxalate at pD 8 show a feature at 1662 cm-1 which blue shifts to
1655 cm-1 at pH 4. In addition, an increase in the intensity was observed at 1427 and 1288 cm-
1. The value of Δν among the ν(CO2) increases from 228 to 235 cm-1 with decreasing pD. In
contrast, the spectra of adsorbed oxalate at pH 9 and 8 shows peak at 1647 cm-1 which blue
shifts to 1670 cm-1 at pH 5. Also, there was an increase in the intensity features at 1427 and
1288 cm-1, similar to that observed in H/D exchange experiments.
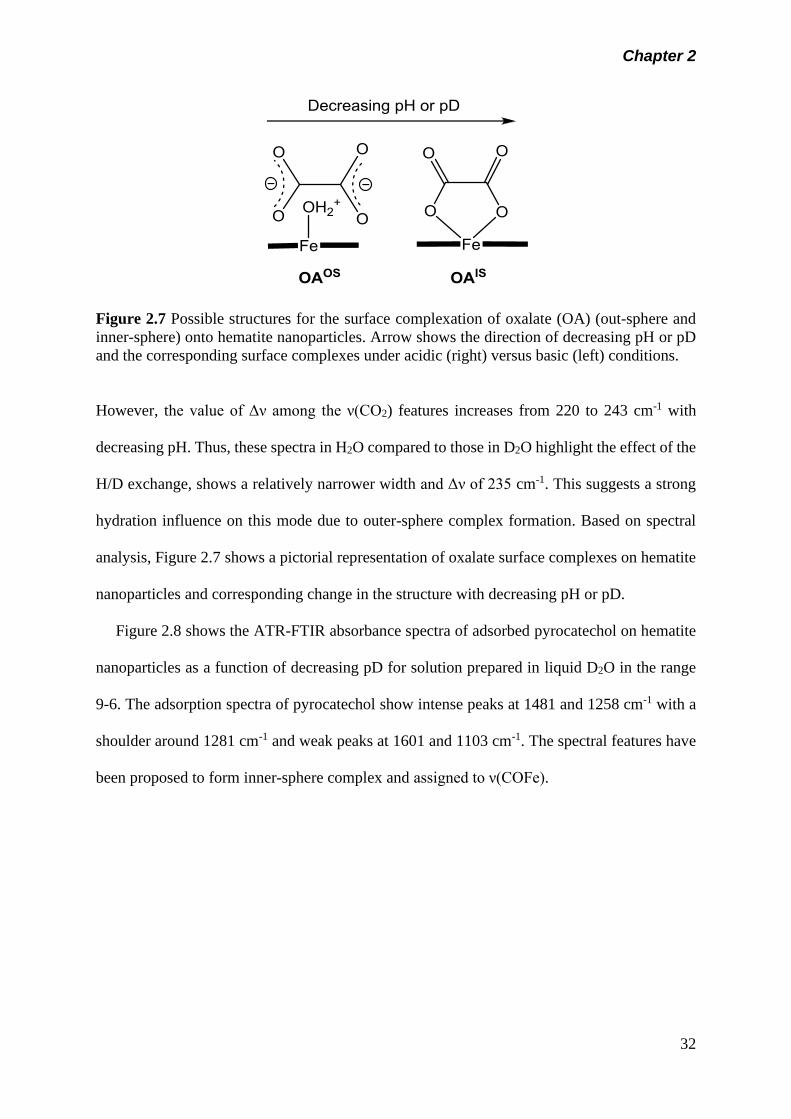
Chapter 2
32
Figure 2.7 Possible structures for the surface complexation of oxalate (OA) (out-sphere and
inner-sphere) onto hematite nanoparticles. Arrow shows the direction of decreasing pH or pD
and the corresponding surface complexes under acidic (right) versus basic (left) conditions.
However, the value of Δν among the ν(CO2) features increases from 220 to 243 cm-1 with
decreasing pH. Thus, these spectra in H2O compared to those in D2O highlight the effect of the
H/D exchange, shows a relatively narrower width and Δν of 235 cm-1. This suggests a strong
hydration influence on this mode due to outer-sphere complex formation. Based on spectral
analysis, Figure 2.7 shows a pictorial representation of oxalate surface complexes on hematite
nanoparticles and corresponding change in the structure with decreasing pH or pD.
Figure 2.8 shows the ATR-FTIR absorbance spectra of adsorbed pyrocatechol on hematite
nanoparticles as a function of decreasing pD for solution prepared in liquid D2O in the range
9-6. The adsorption spectra of pyrocatechol show intense peaks at 1481 and 1258 cm-1 with a
shoulder around 1281 cm-1 and weak peaks at 1601 and 1103 cm-1. The spectral features have
been proposed to form inner-sphere complex and assigned to ν(COFe).
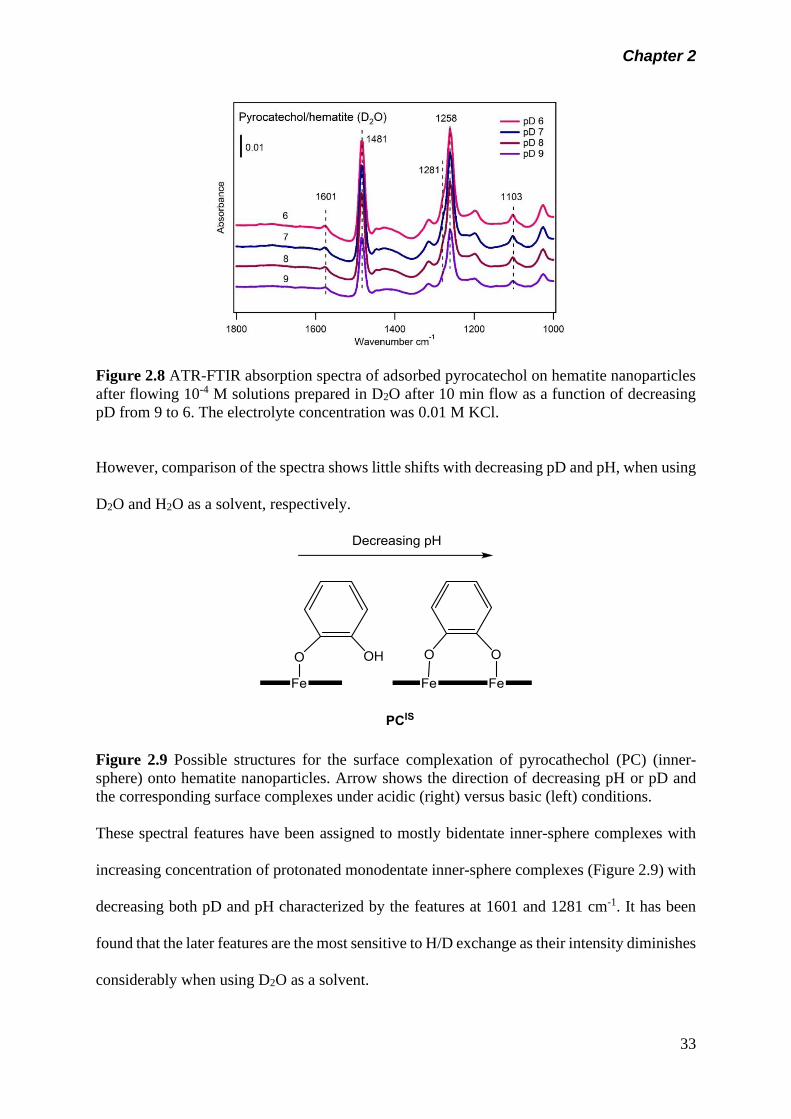
Chapter 2
33
Figure 2.8 ATR-FTIR absorption spectra of adsorbed pyrocatechol on hematite nanoparticles
after flowing 10-4 M solutions prepared in D2O after 10 min flow as a function of decreasing
pD from 9 to 6. The electrolyte concentration was 0.01 M KCl.
However, comparison of the spectra shows little shifts with decreasing pD and pH, when using
D2O and H2O as a solvent, respectively.
Figure 2.9 Possible structures for the surface complexation of pyrocathechol (PC) (inner-
sphere) onto hematite nanoparticles. Arrow shows the direction of decreasing pH or pD and
the corresponding surface complexes under acidic (right) versus basic (left) conditions.
These spectral features have been assigned to mostly bidentate inner-sphere complexes with
increasing concentration of protonated monodentate inner-sphere complexes (Figure 2.9) with
decreasing both pD and pH characterized by the features at 1601 and 1281 cm-1. It has been
found that the later features are the most sensitive to H/D exchange as their intensity diminishes
considerably when using D2O as a solvent.
Chapter 2
34
2.6 Conclusions
In summary, in situ ATR-FTIR absorption spectra of adsorbed citrate, oxalate, and
pyrocatechol on hematite nanoparticles were collected after flowing 10-4 M solutions prepared
in D2O as a function of decreasing pD from 9 to 5 in H/D exchange experiments. ATR-FTIR
spectroscopy has been known as a powerful surface sensitive technique that is capable of in
situ characterization of the liquid–solid interface to examine surface adsorption on nanoparticle
surfaces in both environmental and biological systems.18 However, there are some limitations
for ATR-FTIR spectroscopy. One of the major challenges is the correct subtraction of the
contribution from water. Conducting experiments in D2O is the best solution to address this
limitation. In this study, it was observed that strong hydration influenced the spectra for both
citrate and oxalate whereas less in case of pyrocatechol. Thus, spectroscopic data analysis from
pH experiments and the results from H/D exchange experiments reveal the existence of a higher
degree of outer-sphere complexation for oxalate than citrate, which is dominated by inner-
sphere monodentate complexes. Whereas, for pyrocatechol bidentate-binuclear inner-sphere
complexes dominates.
2.7 References
(1) Grillo, R.; Rosa, A. H.; Fraceto, L. F. Engineered Nanoparticles and Organic Matter: A
Review of the State-of-the-Art. Chemosphere 2015, 119, 608–619.
(2) Mudunkotuwa, I. A.; Grassian, V. H. Biological and Environmental Media Control
Oxide Nanoparticle Surface Composition: The Roles of Biological Components
(Proteins and Amino Acids), Inorganic Oxyanions and Humic Acid. Environ. Sci. Nano
2015, 2 (5), 429–439.
(3) Philippe, A.; Schaumann, G. E. Interactions of Dissolved Organic Matter with Natural
and Engineered Inorganic Colloids: A Review. Environ. Sci. Technol. 2014, 48 (16),
8946–8962.
Chapter 2
35
(4) Sun, D. D.; Lee, P. F. TiO2 Microsphere for the Removal of Humic Acid from Water:
Complex Surface Adsorption Mechanisms. Sep. Purif. Technol. 2012, 91, 30–37.
(5) Vindedahl, A. M.; Strehlau, J. H.; Arnold, W. A.; Penn, R. L. Organic Matter and Iron
Oxide Nanoparticles: Aggregation, Interactions, and Reactivity. Environ. Sci. Nano
2016, 3 (3), 494–505.
(6) Sun, Q.; Xie, H. Bin; Chen, J.; Li, X.; Wang, Z.; Sheng, L. Molecular Dynamics
Simulations on the Interactions of Low Molecular Weight Natural Organic Acids with
C60. Chemosphere 2013, 92 (4), 429–434.
(7) Blesa, M. A.; Weisz, A. D.; Morando, P. J.; Salfity, J. A.; Magaz, G. E.; Regazzoni, A.
E. The Interaction of Metal Oxide Surfaces with Complexing Agents Dissolved in
Water. Coord. Chem. Rev. 2000, 196 (1), 31–63.
(8) Kubicki, J. D.; Schroeter, L. M.; Itoh, M. J.; Nguyen, B. N.; Apitz, S. E. Attenuated
Total Reflectance Fourier-Transform Infrared Spectroscopy of Carboxylic Acids
Adsorbed onto Mineral Surfaces. Geochim. Cosmochim. Acta 1999, 63 (18), 2709–
2725.
(9) Lackovic, K.; Johnson, B. B.; Angove, M. J.; Wells, J. D. Modeling the Adsorption of
Citric Acid onto Muloorina Illite and Related Clay Minerals. J. Colloid Interface Sci.
2003, 267 (1), 49–59.
(10) Lindegren, M.; Loring, J. S.; Persson, P. Molecular Structures of Citrate and
Tricarballylate Adsorbed on α-FeOOH Particles in Aqueous Suspensions. Langmuir
2009, 25 (18), 10639–10647.
(11) Filius, J. D.; Hiemstra, T.; Van Riemsdijk, W. H. Adsorption of Small Weak Organic
Acids on Goethite: Modeling of Mechanisms. J. Colloid Interface Sci. 1997, 195 (2),
368–380.
(12) Karel, M.; William, F. Chromate and Oxalate Adsorption on Goethite. Calibration of
Chapter 2
36
Surface Complexation Models. Environ. Sci. Technol. 1992, 26 (12), 2357–2364.
(13) Karlsson, T.; Persson, P. Complexes with Aquatic Organic Matter Suppress Hydrolysis
and Precipitation of Fe(III). Chem. Geol. 2012, 322–323, 19–27.
(14) Cwiertny, D. M.; Hunter, G. J.; Pettibone, J. M.; Scherer, M. M.; Grassian, V. H. Surface
Chemistry and Dissolution of # -FeOOH Nanorods and Microrods : Environmental
Implications of Size-Dependent Interactions with Oxalate. Society 2009, No. Ii, 2175–
2186.
(15) Gulley-Stahl, H.; Hogan, P. A.; Schmidt, W. L.; Wall, S. J.; Buhrlage, A.; Bullen, H. A.
Surface Complexation of Catechol to Metal Oxides: An ATR-FTIR, Adsorption, and
Dissolution Study. Environ. Sci. Technol. 2010, 44 (11), 4116–4121.
(16) Situm, A.; Rahman, M. A.; Goldberg, S.; Al-Abadleh, H. A. Spectral Characterization
and Surface Complexation Modeling of Low Molecular Weight Organics on Hematite
Nanoparticles: Role of Electrolytes in the Binding Mechanism. Environ. Sci. Nano 2016,
3 (4), 910–926.
(17) Lappi, S. E.; Smith, B.; Franzen, S. Infrared Spectra of H216O, H2
18O and D2O in the
Liquid Phase by Single-Pass Attenuated Total Internal Reflection Spectroscopy.
Spectrochim. Acta - Part A Mol. Biomol. Spectrosc. 2004, 60 (11), 2611–2619.
(18) Mudunkotuwa, I. A.; Minshid, A. Al; Grassian, V. H. ATR-FTIR Spectroscopy as a
Tool to Probe Surface Adsorption on Nanoparticles at the Liquid-Solid Interface in
Environmentally and Biologically Relevant Media. Analyst 2014, 139 (5), 870–881.
Chapter 3
37
Chapter 3 ATR-FTIR studies on the Initial Binding Kinetics of
Arsenicals at the Organic-Hematite Interfaces
3.1 Abstract
This chapter investigates the initial adsorption kinetics of arsenicals binding such as DMA
to pre-exposed organics (OA and PC) on the surface of hematite nanoparticles by using ATR-
FTIR spectroscopy for real time and in situ data collection in the flow mode in different
electrolytes such as KCl, NaCl and KBr. The results show that the rate of adsorption of DMA
was enhanced in the presence of different electrolytes onto hematite nanoparticles surface.
3.2 Introduction
As is a naturally occurring element in our environment and reported as 20th most abundant
element in the earth crust.1 In recent decades, As has drawn much attention due to its
contamination of ground, surface and drinking water that has harmful effects on human health.2
It is a toxic element and known as a carcinogen.3 In many parts of the world, such as the
Gangetic Delta region in Bangladesh and India, As in drinking water is a great concern. Reports
on substantial As contamination in these locations have drawn media attention. More than 100
million individual’s health were at a health risk due to As contamination in drinking water.4,5
Considering the toxicity of As, in 2006, the U.S. Environmental Protection Agency (EPA)
dropped the maximum contaminant limit (MCL) of As in drinking water from 50 ppb to 10
ppb.6 Hence, it is important to minimize the As levels in the environment.
As compounds can be released from both anthropogenic and natural activities into the
environment. Anthropogenic sources of As include the smelting of metals and other industrial
processes, the combustion of fossil fuels, and the use of pesticides in agriculture. While, the
natural emissions of As include weathering processes (both chemical and physical), biological
activity and volcanic emissions. Also, incorporation from soil dust and atmospheric deposition
contribute to As exposure. However, human activities are mainly responsible for the emissions
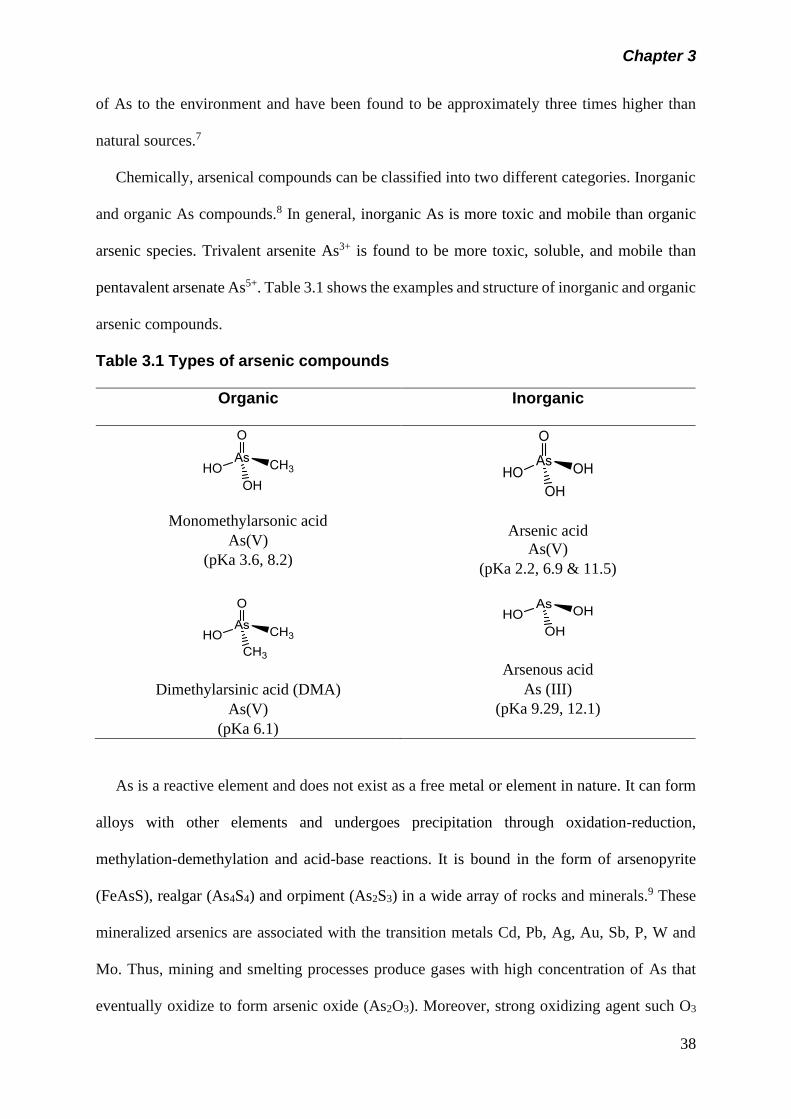
Chapter 3
38
of As to the environment and have been found to be approximately three times higher than
natural sources.7
Chemically, arsenical compounds can be classified into two different categories. Inorganic
and organic As compounds.8 In general, inorganic As is more toxic and mobile than organic
arsenic species. Trivalent arsenite As3+ is found to be more toxic, soluble, and mobile than
pentavalent arsenate As5+. Table 3.1 shows the examples and structure of inorganic and organic
arsenic compounds.
Table 3.1 Types of arsenic compounds
Organic Inorganic
Monomethylarsonic acid
As(V)
(pKa 3.6, 8.2)
Arsenic acid
As(V)
(pKa 2.2, 6.9 & 11.5)
Dimethylarsinic acid (DMA)
As(V)
(pKa 6.1)
Arsenous acid
As (III)
(pKa 9.29, 12.1)
As is a reactive element and does not exist as a free metal or element in nature. It can form
alloys with other elements and undergoes precipitation through oxidation-reduction,
methylation-demethylation and acid-base reactions. It is bound in the form of arsenopyrite
(FeAsS), realgar (As4S4) and orpiment (As2S3) in a wide array of rocks and minerals.9 These
mineralized arsenics are associated with the transition metals Cd, Pb, Ag, Au, Sb, P, W and
Mo. Thus, mining and smelting processes produce gases with high concentration of As that
eventually oxidize to form arsenic oxide (As2O3). Moreover, strong oxidizing agent such O3
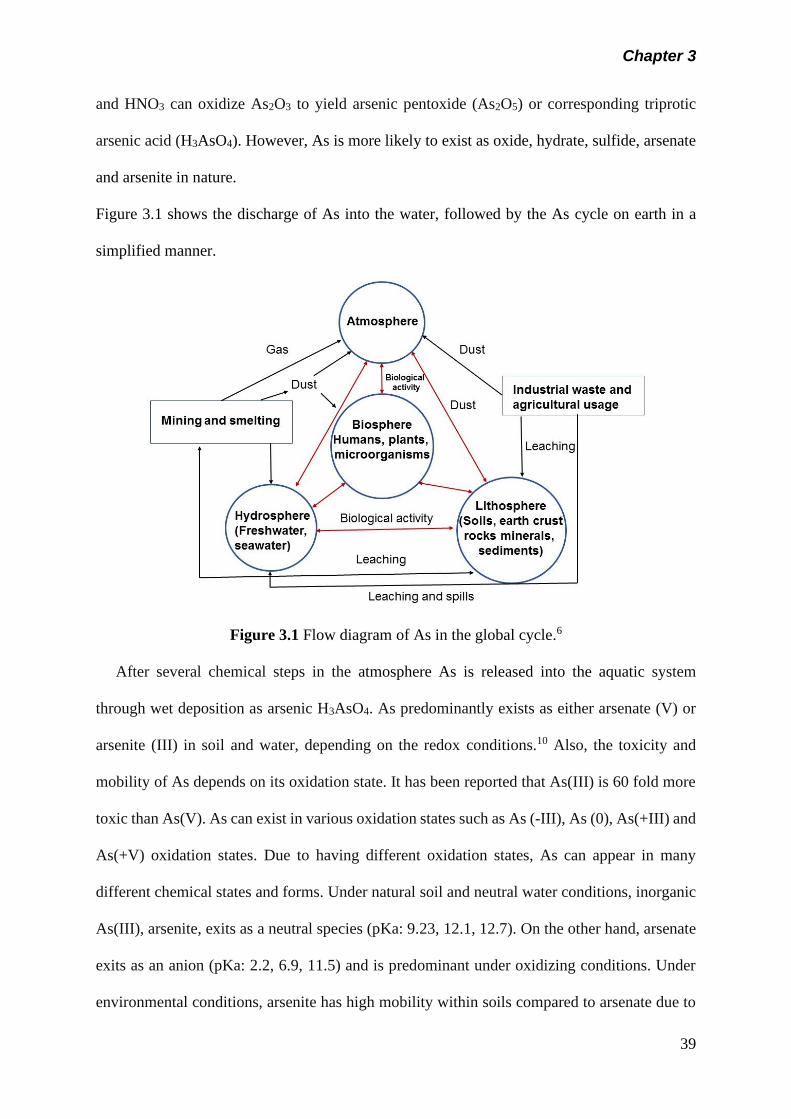
Chapter 3
39
and HNO3 can oxidize As2O3 to yield arsenic pentoxide (As2O5) or corresponding triprotic
arsenic acid (H3AsO4). However, As is more likely to exist as oxide, hydrate, sulfide, arsenate
and arsenite in nature.
Figure 3.1 shows the discharge of As into the water, followed by the As cycle on earth in a
simplified manner.
Figure 3.1 Flow diagram of As in the global cycle.6
After several chemical steps in the atmosphere As is released into the aquatic system
through wet deposition as arsenic H3AsO4. As predominantly exists as either arsenate (V) or
arsenite (III) in soil and water, depending on the redox conditions.10 Also, the toxicity and
mobility of As depends on its oxidation state. It has been reported that As(III) is 60 fold more
toxic than As(V). As can exist in various oxidation states such as As (-III), As (0), As(+III) and
As(+V) oxidation states. Due to having different oxidation states, As can appear in many
different chemical states and forms. Under natural soil and neutral water conditions, inorganic
As(III), arsenite, exits as a neutral species (pKa: 9.23, 12.1, 12.7). On the other hand, arsenate
exits as an anion (pKa: 2.2, 6.9, 11.5) and is predominant under oxidizing conditions. Under
environmental conditions, arsenite has high mobility within soils compared to arsenate due to
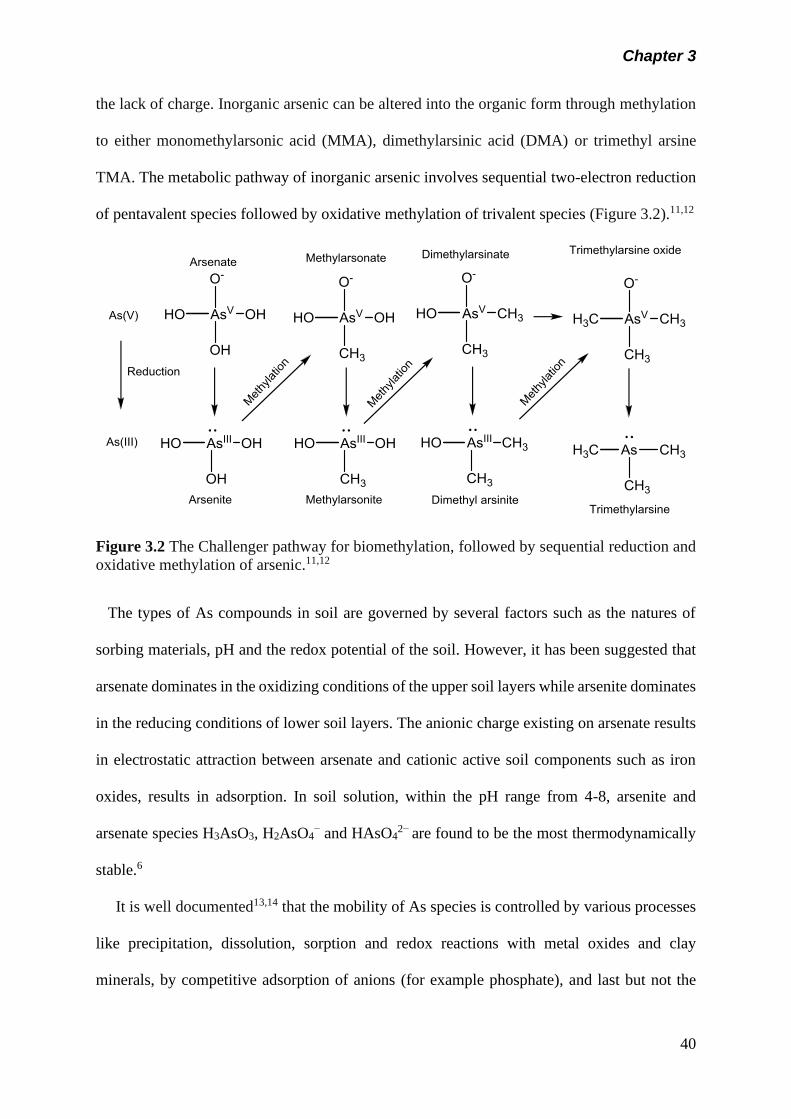
Chapter 3
40
the lack of charge. Inorganic arsenic can be altered into the organic form through methylation
to either monomethylarsonic acid (MMA), dimethylarsinic acid (DMA) or trimethyl arsine
TMA. The metabolic pathway of inorganic arsenic involves sequential two-electron reduction
of pentavalent species followed by oxidative methylation of trivalent species (Figure 3.2).11,12
Figure 3.2 The Challenger pathway for biomethylation, followed by sequential reduction and
oxidative methylation of arsenic.11,12
The types of As compounds in soil are governed by several factors such as the natures of
sorbing materials, pH and the redox potential of the soil. However, it has been suggested that
arsenate dominates in the oxidizing conditions of the upper soil layers while arsenite dominates
in the reducing conditions of lower soil layers. The anionic charge existing on arsenate results
in electrostatic attraction between arsenate and cationic active soil components such as iron
oxides, results in adsorption. In soil solution, within the pH range from 4-8, arsenite and
arsenate species H3AsO3, H2AsO4− and HAsO4
2− are found to be the most thermodynamically
stable.6
It is well documented13,14 that the mobility of As species is controlled by various processes
like precipitation, dissolution, sorption and redox reactions with metal oxides and clay
minerals, by competitive adsorption of anions (for example phosphate), and last but not the
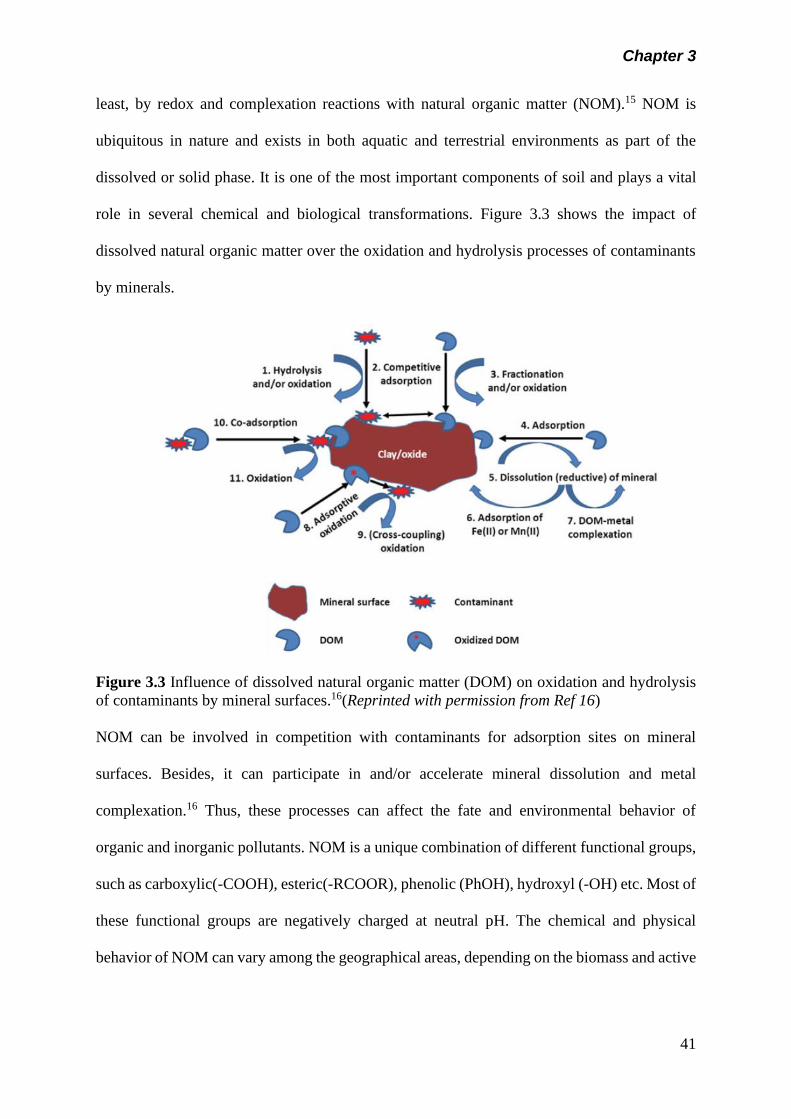
Chapter 3
41
least, by redox and complexation reactions with natural organic matter (NOM).15 NOM is
ubiquitous in nature and exists in both aquatic and terrestrial environments as part of the
dissolved or solid phase. It is one of the most important components of soil and plays a vital
role in several chemical and biological transformations. Figure 3.3 shows the impact of
dissolved natural organic matter over the oxidation and hydrolysis processes of contaminants
by minerals.
Figure 3.3 Influence of dissolved natural organic matter (DOM) on oxidation and hydrolysis
of contaminants by mineral surfaces.16(Reprinted with permission from Ref 16)
NOM can be involved in competition with contaminants for adsorption sites on mineral
surfaces. Besides, it can participate in and/or accelerate mineral dissolution and metal
complexation.16 Thus, these processes can affect the fate and environmental behavior of
organic and inorganic pollutants. NOM is a unique combination of different functional groups,
such as carboxylic(-COOH), esteric(-RCOOR), phenolic (PhOH), hydroxyl (-OH) etc. Most of
these functional groups are negatively charged at neutral pH. The chemical and physical
behavior of NOM can vary among the geographical areas, depending on the biomass and active
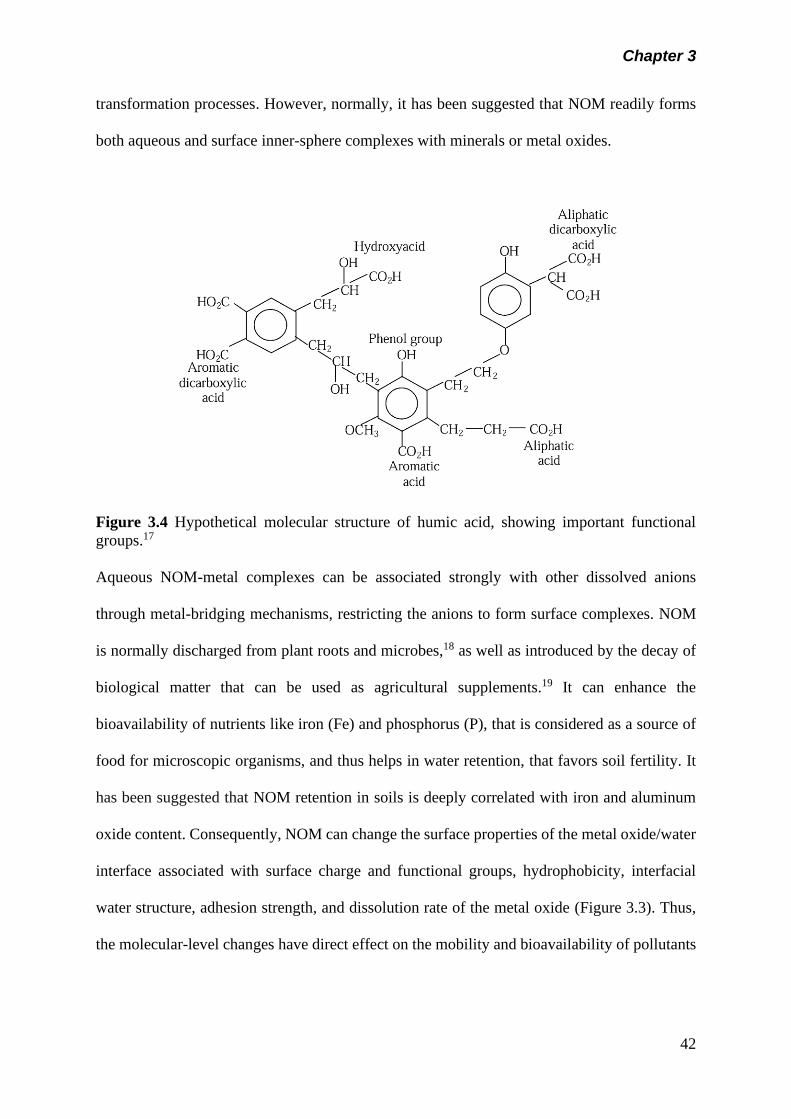
Chapter 3
42
transformation processes. However, normally, it has been suggested that NOM readily forms
both aqueous and surface inner-sphere complexes with minerals or metal oxides.
Figure 3.4 Hypothetical molecular structure of humic acid, showing important functional
groups.17
Aqueous NOM-metal complexes can be associated strongly with other dissolved anions
through metal-bridging mechanisms, restricting the anions to form surface complexes. NOM
is normally discharged from plant roots and microbes,18 as well as introduced by the decay of
biological matter that can be used as agricultural supplements.19 It can enhance the
bioavailability of nutrients like iron (Fe) and phosphorus (P), that is considered as a source of
food for microscopic organisms, and thus helps in water retention, that favors soil fertility. It
has been suggested that NOM retention in soils is deeply correlated with iron and aluminum
oxide content. Consequently, NOM can change the surface properties of the metal oxide/water
interface associated with surface charge and functional groups, hydrophobicity, interfacial
water structure, adhesion strength, and dissolution rate of the metal oxide (Figure 3.3). Thus,
the molecular-level changes have direct effect on the mobility and bioavailability of pollutants
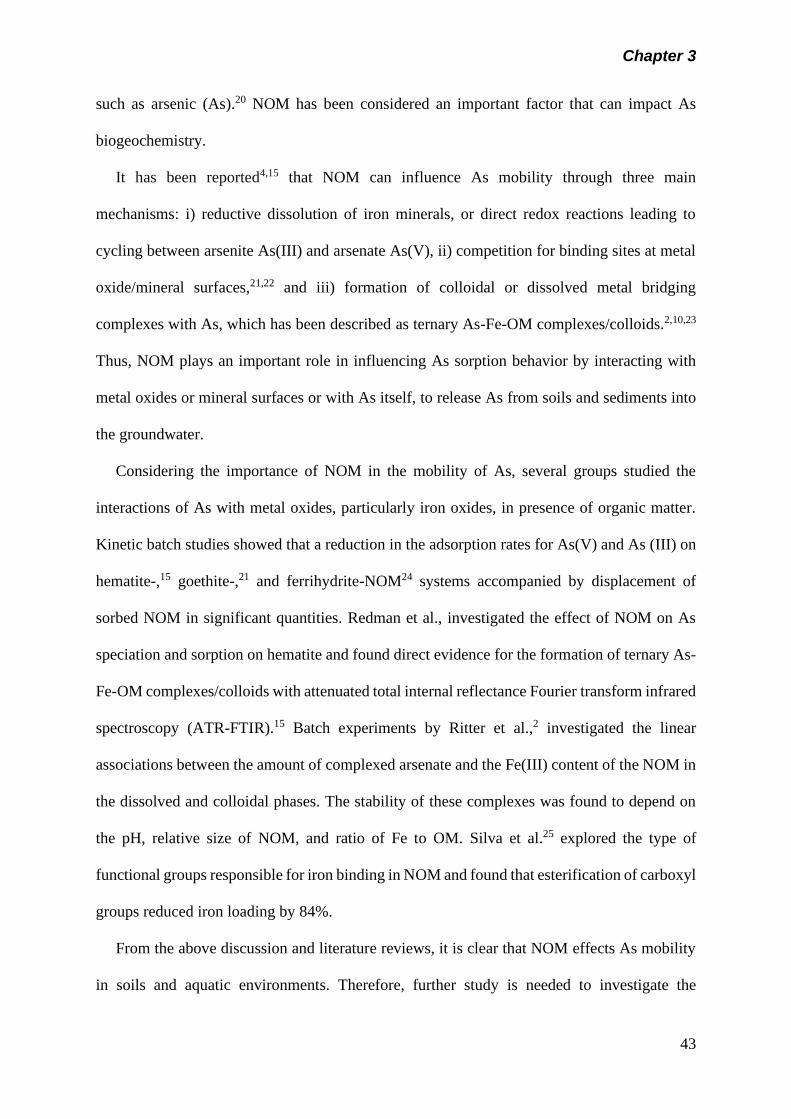
Chapter 3
43
such as arsenic (As).20 NOM has been considered an important factor that can impact As
biogeochemistry.
It has been reported4,15 that NOM can influence As mobility through three main
mechanisms: i) reductive dissolution of iron minerals, or direct redox reactions leading to
cycling between arsenite As(III) and arsenate As(V), ii) competition for binding sites at metal
oxide/mineral surfaces,21,22 and iii) formation of colloidal or dissolved metal bridging
complexes with As, which has been described as ternary As-Fe-OM complexes/colloids.2,10,23
Thus, NOM plays an important role in influencing As sorption behavior by interacting with
metal oxides or mineral surfaces or with As itself, to release As from soils and sediments into
the groundwater.
Considering the importance of NOM in the mobility of As, several groups studied the
interactions of As with metal oxides, particularly iron oxides, in presence of organic matter.
Kinetic batch studies showed that a reduction in the adsorption rates for As(V) and As (III) on
hematite-,15 goethite-,21 and ferrihydrite-NOM24 systems accompanied by displacement of
sorbed NOM in significant quantities. Redman et al., investigated the effect of NOM on As
speciation and sorption on hematite and found direct evidence for the formation of ternary As-
Fe-OM complexes/colloids with attenuated total internal reflectance Fourier transform infrared
spectroscopy (ATR-FTIR).15 Batch experiments by Ritter et al.,2 investigated the linear
associations between the amount of complexed arsenate and the Fe(III) content of the NOM in
the dissolved and colloidal phases. The stability of these complexes was found to depend on
the pH, relative size of NOM, and ratio of Fe to OM. Silva et al.25 explored the type of
functional groups responsible for iron binding in NOM and found that esterification of carboxyl
groups reduced iron loading by 84%.
From the above discussion and literature reviews, it is clear that NOM effects As mobility
in soils and aquatic environments. Therefore, further study is needed to investigate the
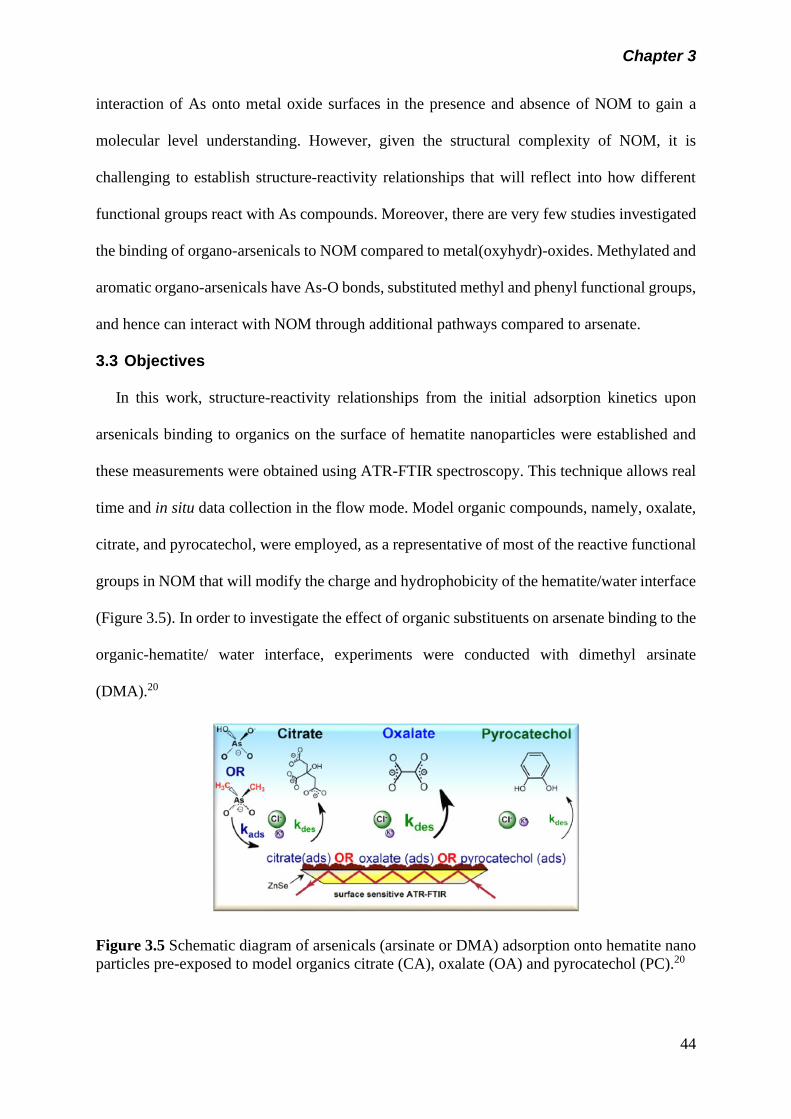
Chapter 3
44
interaction of As onto metal oxide surfaces in the presence and absence of NOM to gain a
molecular level understanding. However, given the structural complexity of NOM, it is
challenging to establish structure-reactivity relationships that will reflect into how different
functional groups react with As compounds. Moreover, there are very few studies investigated
the binding of organo-arsenicals to NOM compared to metal(oxyhydr)-oxides. Methylated and
aromatic organo-arsenicals have As-O bonds, substituted methyl and phenyl functional groups,
and hence can interact with NOM through additional pathways compared to arsenate.
3.3 Objectives
In this work, structure-reactivity relationships from the initial adsorption kinetics upon
arsenicals binding to organics on the surface of hematite nanoparticles were established and
these measurements were obtained using ATR-FTIR spectroscopy. This technique allows real
time and in situ data collection in the flow mode. Model organic compounds, namely, oxalate,
citrate, and pyrocatechol, were employed, as a representative of most of the reactive functional
groups in NOM that will modify the charge and hydrophobicity of the hematite/water interface
(Figure 3.5). In order to investigate the effect of organic substituents on arsenate binding to the
organic-hematite/ water interface, experiments were conducted with dimethyl arsinate
(DMA).20
Figure 3.5 Schematic diagram of arsenicals (arsinate or DMA) adsorption onto hematite nano
particles pre-exposed to model organics citrate (CA), oxalate (OA) and pyrocatechol (PC).20
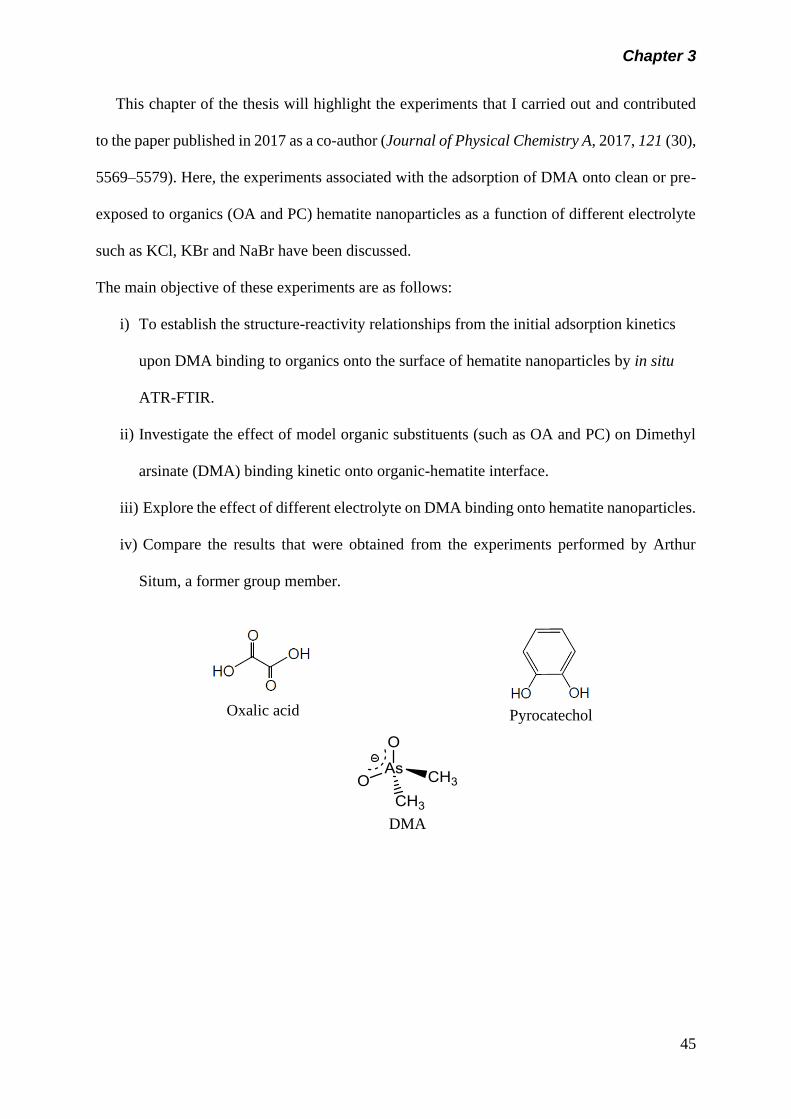
Chapter 3
45
This chapter of the thesis will highlight the experiments that I carried out and contributed
to the paper published in 2017 as a co-author (Journal of Physical Chemistry A, 2017, 121 (30),
5569–5579). Here, the experiments associated with the adsorption of DMA onto clean or pre-
exposed to organics (OA and PC) hematite nanoparticles as a function of different electrolyte
such as KCl, KBr and NaBr have been discussed.
The main objective of these experiments are as follows:
i) To establish the structure-reactivity relationships from the initial adsorption kinetics
upon DMA binding to organics onto the surface of hematite nanoparticles by in situ
ATR-FTIR.
ii) Investigate the effect of model organic substituents (such as OA and PC) on Dimethyl
arsinate (DMA) binding kinetic onto organic-hematite interface.
iii) Explore the effect of different electrolyte on DMA binding onto hematite nanoparticles.
iv) Compare the results that were obtained from the experiments performed by Arthur
Situm, a former group member.
Oxalic acid
Pyrocatechol
DMA
Chapter 3
46
3.4 Experimental
3.4.1 Chemicals
The solutions were prepared by dissolving the desired organic compound in 0.01 M KCl
(ACS grade, 99.0%+, EMD) solution prepared fresh in 18 MΩ-cm Millipore water and adjusted
to pH 7 by using dilute and concentrated HCl (6 N, Ricca Chemical Company) and NaOH (GR
ACS, 99.0-100%, EMD) solutions. The concentration of KCl varied for ionic-strength-
dependent studies. 0.01 M NaCl and KBr were also used for the ionic-strength-dependent
studies. Powder of organic compounds used herein (as received without further purification)
include oxalic acid (Oxalic acid dihydrate, 99%+, ACS reagent, Sigma-Aldrich), catechol
(99%+, Sigma-Aldrich), and DMA (sodium cacodylate trihydrate, C2H6AsO2Na.3H2O, 98%,
Sigma-Aldrich, used as received). All the solutions were prepared freshly before the start of
each experiment and were covered with parafilm until used. Hematite nanoparticles (α-Fe2O3,
98+%, US Research Nanomaterials, Inc, batch US3180) were characterized for these
experiments to obtain BET surface area (N2 gas, 54±5 m2/g, Aveka Inc.), isoelectric point (IEP)
(zeta potential titration, 8.45, Aveka Inc.), particle shape and size (TEM Philips C12 at 120
keV, spherical, 39±11 nm average diameter, Canadian Centre for Electron Microscopy,
McMaster University).
3.4.2 Preparation of film on ZnSe ATR crystal
The film on ZnSe ATR crystal was prepared according to the procedure mentioned in
section 2.3.3 of Chapter 2, page 11.
3.4.3 ATR-FTIR spectroscopy experiments
The ATR-FTIR spectroscopy experiments were performed according to the procedure
mentioned in section 2.3.4 of Chapter 2, page 11.
Chapter 3
47
3.4.4 Adsorption kinetics
All solutions were flowed at a rate of 2 mL/min through the hematite film using Tygon tubes
(0.8 mm I.D., Masterflex) and a compact pump (Masterflex L/S). Single beam ATR-FTIR
spectra were collected at 8 cm-1 resolution all through the experiments. Background spectra
were collected with 100 average scans by running 0.01 M KCl/KBr/NaCl solutions or Mili-Q
H2O for 90 minutes at pH 7. Then, solutions of OA or PC of known concentrations were passed
through the film at the same pH for 80 min. Data were collected as soon as the solution entered
the ATR flow cell with spectral averaging of 5 scans for 5 minutes with 0.1 min interval. The
adsorption spectra were collected automatically by using a custom-written macros in OMNIC
for first 5 min. For rest of the time data were collected manually at 5 min interval with 100
average scans up to 80 min. The software was installed on a PC computer with the following
specifications: Dell Optiplex GX620, Intel, ACPI Multiprocessor, and Premium 4 CPU 3.20
GHz with 1 GB RAM. The collection acquisition times were calculated from the time saved
by the computer in the file names. Each single beam spectrum was referenced to the last
recorded background solution to obtain the absorbance spectrum reported herein. To determine
the uncertainty in the measurements, the experiments were repeated at least two times on
freshly prepared films under identical conditions
3.4.5 Kinetic modeling (Adsorption) Macros Basic software was used to obtain a base-line corrected peak height of ATR absorbance
spectra. Baseline-corrected peak height measurements were performed to surface complexes,
at the wavenumber of specific spectral features, were used as an accurate measurement of
surface coverage. The reaction to be analyzed was between aqueous analyte species and empty
reactive sites on the surface of the geosorbent film, shown in reaction 3.1.

Chapter 3
48
where [MO] is the concentration of the model organics, kads is the adsorption rate constant, and
kdes is the desorption rate constant. The Langmuir adsorption model can be employed to analyze
the kinetics and thermodynamics of reaction 3.1. The assumptions within the Langmuir
adsorption model describes that a homogeneous surface that is formed is identical with the
reactive surface sites. The Langmuir model for adsorption kinetics, shown in equation 3.2, was
used to analyze the collected peak heights in order to generate time dependent adsorption
kinetic curves.
𝜃(𝑡) = 𝑏(1 − 𝑒−𝑟𝑜𝑏𝑠.𝑡)……………..(3.2)
Here, (t) is the measure of surface coverage which is related to the absorbance as equation
3.3. Expansion of term in equation 3.3 can be obtained by using the measurements of surface
coverage that produces equation 4 that provides a measurement of baseline-corrected peak
height absorbance.
𝐴 = 𝑏′(1 − 𝑒−𝑟𝑜𝑏𝑠.𝑡)……………..(3.4)
Equation 3.4 can be obtained then linearized to produce equation 3.5 with b being a collection
of constants equal to the absorbance in the plateau region of the adsorption kinetic curve.
By using equation 3.5, robs is equal to the slope of the least-squared fit of ln(1- A/b) plotted
against time (min) of adsorption. Thus, the Langmuir adsorption kinetic model allows for the
plotting of robs against aqueous analyte concentration to extract kads using equation 3.6.
Chapter 3
49
However, using equation 3.2, some of the experimental data resulted in poor fit. In order
to get better fit, the following equation 3.7, a two-exponential, 2-site model was used that
suggested the best fit for two kinetic regions for the adsorption of DMA.31
𝜃(𝑡𝑜𝑡𝑎𝑙)𝑡 = 𝑏1(1 − 𝑒−𝑟𝑜𝑏𝑠1.𝑡) + 𝑏2(1 − 𝑒−𝑟𝑜𝑏𝑠2.𝑡) … … . . (3.7)
3.4.6 Desorption kinetics
DMA and Sodium Arsenate were used as a desorbing agent for all the desorption part of the
experiments. Collection of spectra started as the solution of the desorbing agent entered the
ATR flow all containing the same hematite film previously exposed to OA or PC solutions for
80 min. Initially, spectra were collected automatically by using a custom written macros in
OMNIC for 10 min with 0.25 min interval and 25 scans. Then the data were collected manually
at 5 min interval with 100 average scans up to 80 min. Single beam ATR spectra were collected
and reprocessed against the last spectrum collected for the background solution for obtaining
the absorbance spectra as described in the previous section for the adsorption experiments.
Since desorption of surface arsenicals due to flowing aqueous hydrogen phosphate would occur
concurrently with the adsorption of phosphate species, the control experiments were carried
out for the adsorption of aqueous hydrogen phosphate on freshly prepared films at pH 7.
3.4.7 Kinetic modeling (Desorption)
Desorption of model organics from the surface by the adsorption of aqueous arsenic species
can be shown as reaction 3.8 and described by the Langmuir kinetic desorption model shown
in equation 3.9.
(t) and o are converted to absorbance values and linearized to obtained equation 3.10.
……. (3.9) 𝜃(𝑡) = 𝜃𝑜 𝑒−𝑘′
𝑑𝑒𝑠.𝑡
Chapter 3
50
Here, Ao is the initial absorbance before the start of desorption. The initial observed desorption
rate can be extracted by plotting ln(A/Ao) vs desorption time (min) with the initial observed
desorption being equal to the slope of the least-squared fit.
Using equation 3.9, the experimental data resulted in poor fit for desorption kinetics since
the equation does not consider the possibility of readsorption of DMA. However, when the
possibility for readsorption is involved in the derivation, the modified Langmuir desorption
model becomes as equation 3.11.31
𝜃(𝑡) = (𝑘𝑑𝑒𝑠
, . 𝜃0 − 𝑘𝑎𝑑𝑠, ). 𝑒−𝑘𝑑𝑒𝑠
, .𝑡 + 𝑘𝑎𝑑𝑠,
𝑘𝑑𝑒𝑠, … … … (3.11)
where 𝑘𝑑𝑒𝑠,
= kdes·[A(aq)] and 𝑘𝑑𝑒𝑠,
= kads·[DMA(aq)]
3.5 Results and discussion
The results discussed herein have been divided into two categories: Adsorption and
Desorption Kinetics. Section 3.4.1 focuses on adsorption kinetics of three different types of
experiments. (a) Adsorption kinetics of model organics on hematite nanoparticle; (b)
Adsorption kinetics of arsenicals on hematite nanoparticle; and (c) Adsorption of arsenicals on
hematite containing model organics. Section 3.4.2 will be highlighting desorption kinetics of
model organics by arsenicals.
3.5.1 Adsorption kinetics
(a) Adsorption kinetics of model organics on hematite nanoparticle
Adsorption kinetic experiments were performed using oxalate (OA) and pyrocatechol (PC)
onto unreacted hematite films at pH 7 in H2O, as well as with three different electrolytes such
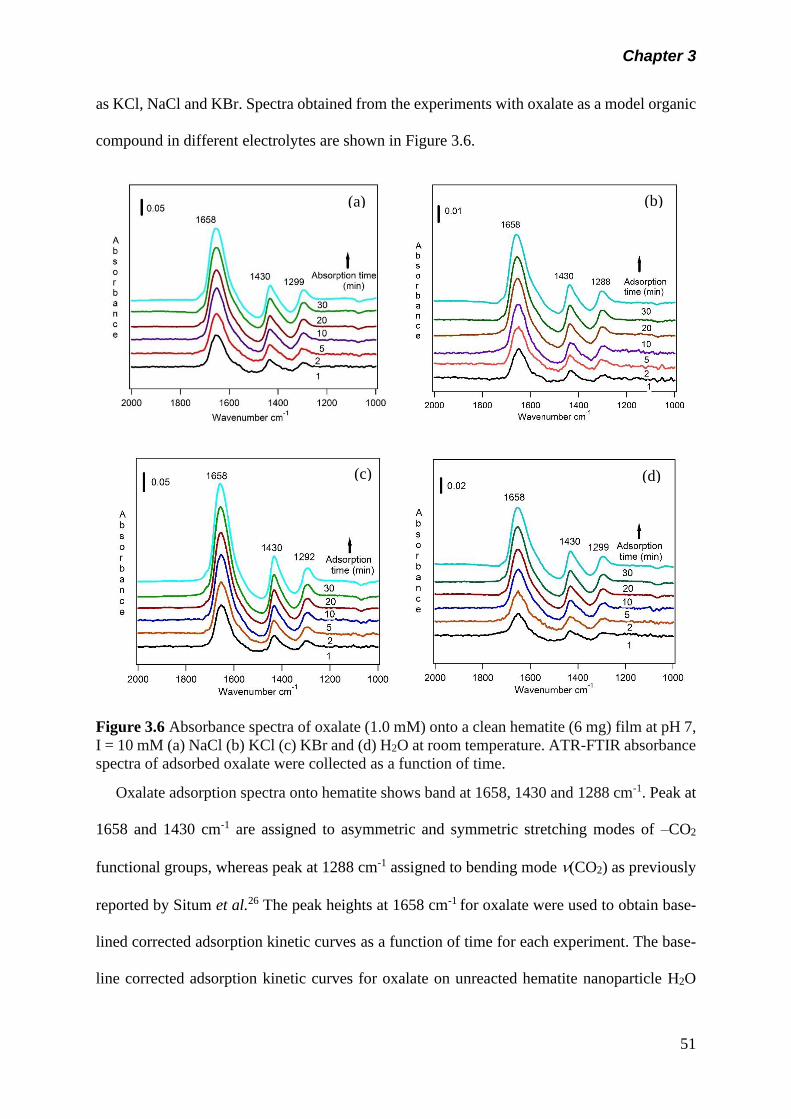
Chapter 3
51
as KCl, NaCl and KBr. Spectra obtained from the experiments with oxalate as a model organic
compound in different electrolytes are shown in Figure 3.6.
Figure 3.6 Absorbance spectra of oxalate (1.0 mM) onto a clean hematite (6 mg) film at pH 7,
I = 10 mM (a) NaCl (b) KCl (c) KBr and (d) H2O at room temperature. ATR-FTIR absorbance
spectra of adsorbed oxalate were collected as a function of time.
Oxalate adsorption spectra onto hematite shows band at 1658, 1430 and 1288 cm-1. Peak at
1658 and 1430 cm-1 are assigned to asymmetric and symmetric stretching modes of –CO2
functional groups, whereas peak at 1288 cm-1 assigned to bending mode (CO2) as previously
reported by Situm et al.26 The peak heights at 1658 cm-1 for oxalate were used to obtain base-
lined corrected adsorption kinetic curves as a function of time for each experiment. The base-
line corrected adsorption kinetic curves for oxalate on unreacted hematite nanoparticle H2O
(a) (b)
v
(c) (d)
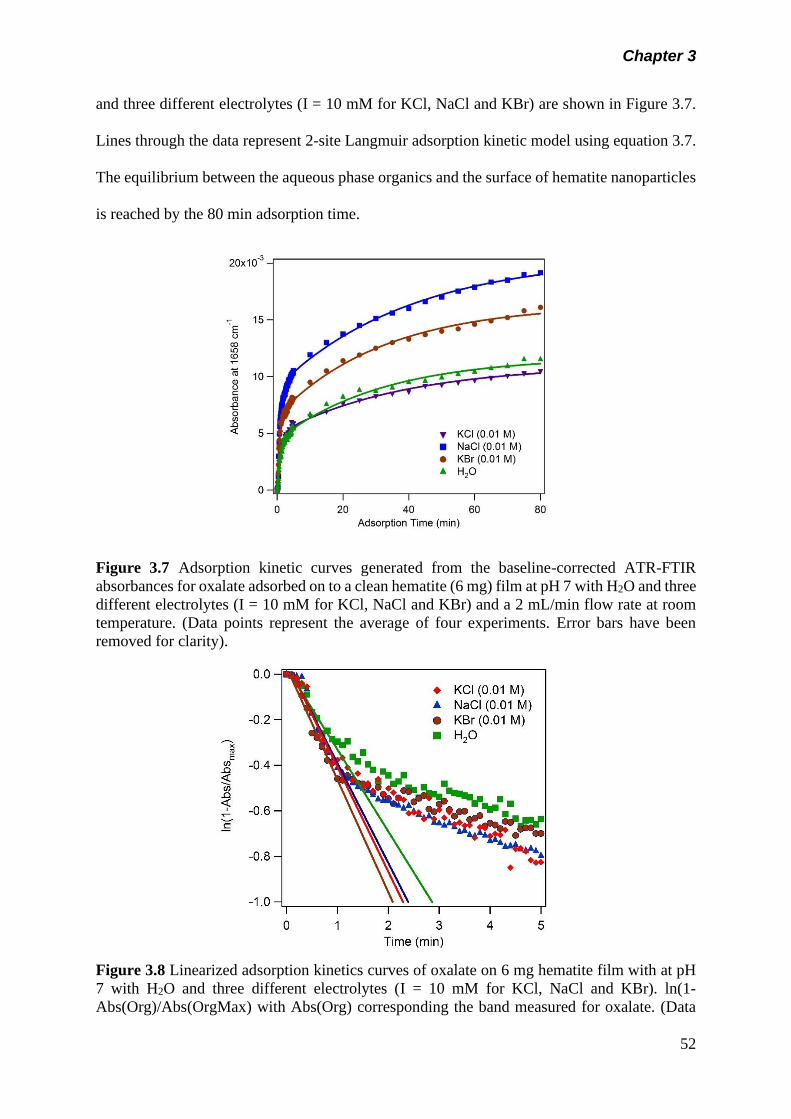
Chapter 3
52
and three different electrolytes (I = 10 mM for KCl, NaCl and KBr) are shown in Figure 3.7.
Lines through the data represent 2-site Langmuir adsorption kinetic model using equation 3.7.
The equilibrium between the aqueous phase organics and the surface of hematite nanoparticles
is reached by the 80 min adsorption time.
Figure 3.7 Adsorption kinetic curves generated from the baseline-corrected ATR-FTIR
absorbances for oxalate adsorbed on to a clean hematite (6 mg) film at pH 7 with H2O and three
different electrolytes (I = 10 mM for KCl, NaCl and KBr) and a 2 mL/min flow rate at room
temperature. (Data points represent the average of four experiments. Error bars have been
removed for clarity).
Figure 3.8 Linearized adsorption kinetics curves of oxalate on 6 mg hematite film with at pH
7 with H2O and three different electrolytes (I = 10 mM for KCl, NaCl and KBr). ln(1-
Abs(Org)/Abs(OrgMax) with Abs(Org) corresponding the band measured for oxalate. (Data
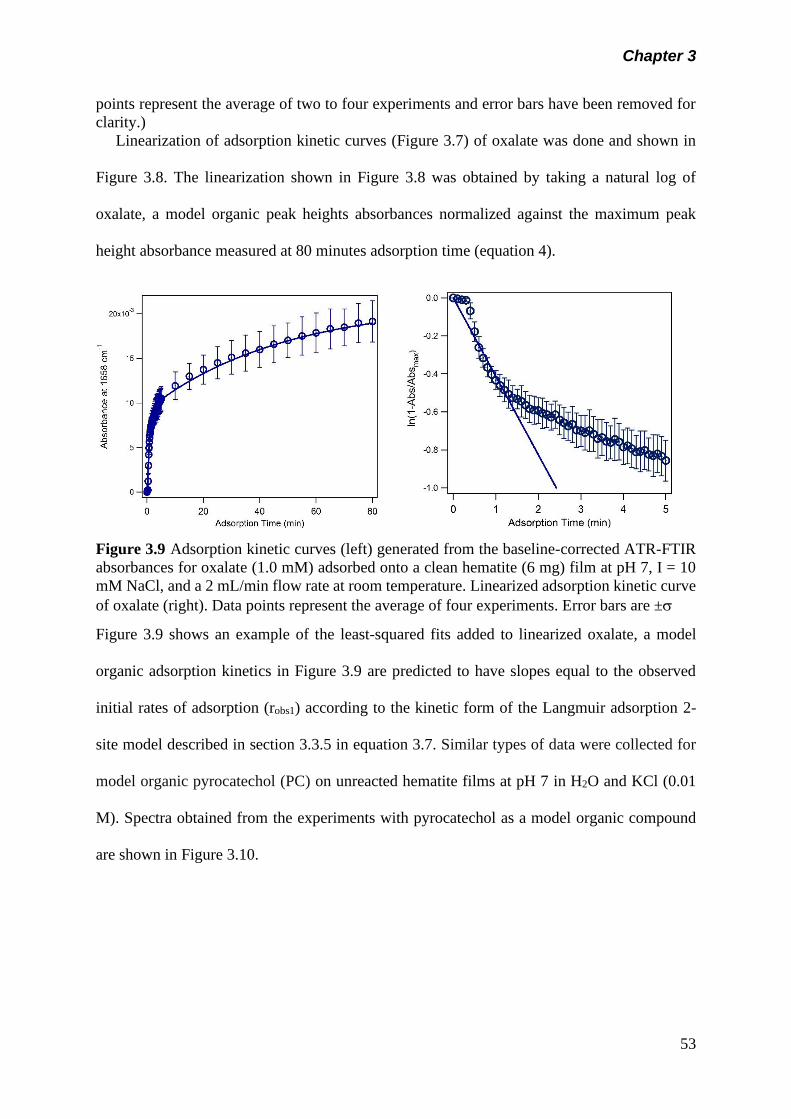
Chapter 3
53
points represent the average of two to four experiments and error bars have been removed for
clarity.)
Linearization of adsorption kinetic curves (Figure 3.7) of oxalate was done and shown in
Figure 3.8. The linearization shown in Figure 3.8 was obtained by taking a natural log of
oxalate, a model organic peak heights absorbances normalized against the maximum peak
height absorbance measured at 80 minutes adsorption time (equation 4).
Figure 3.9 Adsorption kinetic curves (left) generated from the baseline-corrected ATR-FTIR
absorbances for oxalate (1.0 mM) adsorbed onto a clean hematite (6 mg) film at pH 7, I = 10
mM NaCl, and a 2 mL/min flow rate at room temperature. Linearized adsorption kinetic curve
of oxalate (right). Data points represent the average of four experiments. Error bars are ±
Figure 3.9 shows an example of the least-squared fits added to linearized oxalate, a model
organic adsorption kinetics in Figure 3.9 are predicted to have slopes equal to the observed
initial rates of adsorption (robs1) according to the kinetic form of the Langmuir adsorption 2-
site model described in section 3.3.5 in equation 3.7. Similar types of data were collected for
model organic pyrocatechol (PC) on unreacted hematite films at pH 7 in H2O and KCl (0.01
M). Spectra obtained from the experiments with pyrocatechol as a model organic compound
are shown in Figure 3.10.
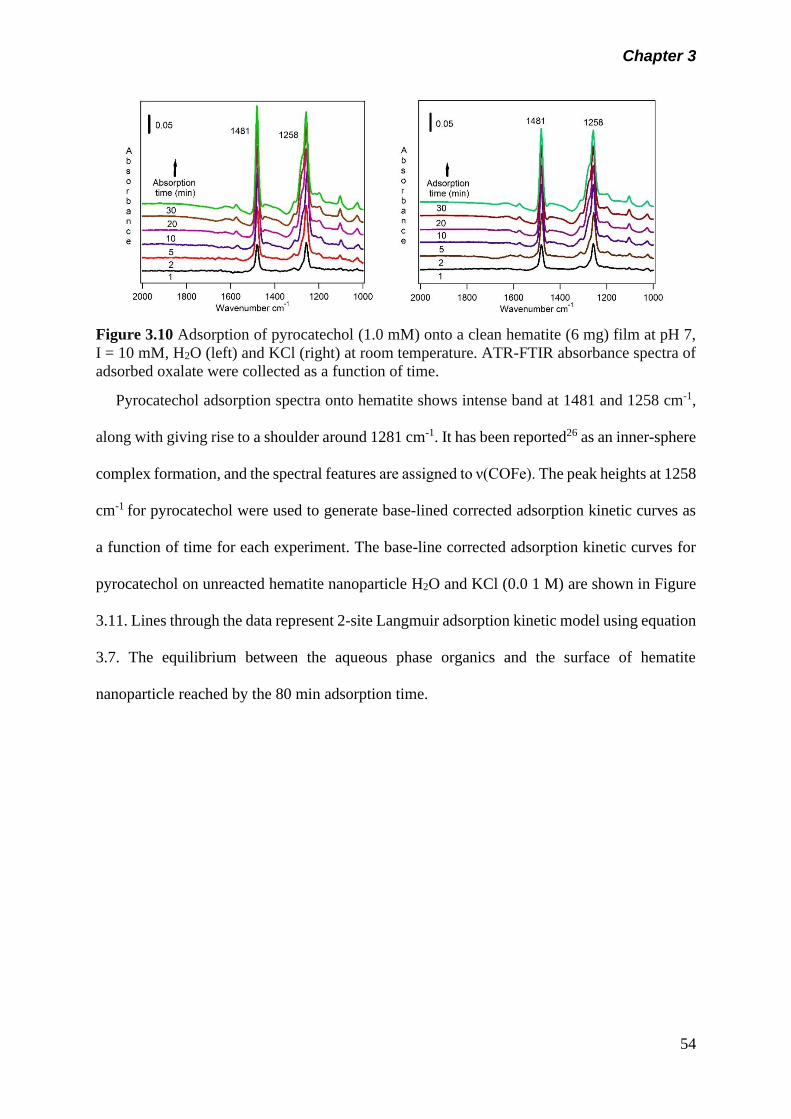
Chapter 3
54
Figure 3.10 Adsorption of pyrocatechol (1.0 mM) onto a clean hematite (6 mg) film at pH 7,
I = 10 mM, H2O (left) and KCl (right) at room temperature. ATR-FTIR absorbance spectra of
adsorbed oxalate were collected as a function of time.
Pyrocatechol adsorption spectra onto hematite shows intense band at 1481 and 1258 cm-1,
along with giving rise to a shoulder around 1281 cm-1. It has been reported26 as an inner-sphere
complex formation, and the spectral features are assigned to ν(COFe). The peak heights at 1258
cm-1 for pyrocatechol were used to generate base-lined corrected adsorption kinetic curves as
a function of time for each experiment. The base-line corrected adsorption kinetic curves for
pyrocatechol on unreacted hematite nanoparticle H2O and KCl (0.0 1 M) are shown in Figure
3.11. Lines through the data represent 2-site Langmuir adsorption kinetic model using equation
3.7. The equilibrium between the aqueous phase organics and the surface of hematite
nanoparticle reached by the 80 min adsorption time.

Chapter 3
55
Figure 3.11 Adsorption kinetic curves generated from the baseline-corrected ATR-FTIR
absorbances for pyrocatechol adsorbed on to a clean hematite (6 mg) film at pH 7 with a 2
mL/min flow rate at room temperature. (Data points represent the average of four experiments.
Error bars have been removed for clarity)
Linearization of adsorption kinetic curves (Figure 3.10) of pyrocatechol was obtained and
shown in Figure 3.12.
Figure 3.12 Linearized adsorption kinetics of pyrocatechol on 6 mg hematite film with at pH
7. ln(1-Abs(Org)/Abs(OrgMax) with Abs(Org) corresponding the band measured for
pyrocatechol. (Data points represent the average of two experiments and error bars have been
removed for clarity.)
The linearized adsorption kinetic curves in Figure 3.12 was obtained by taking a natural log of
pyrocatechol, a model organic peak heights absorbances normalized against the maximum peak
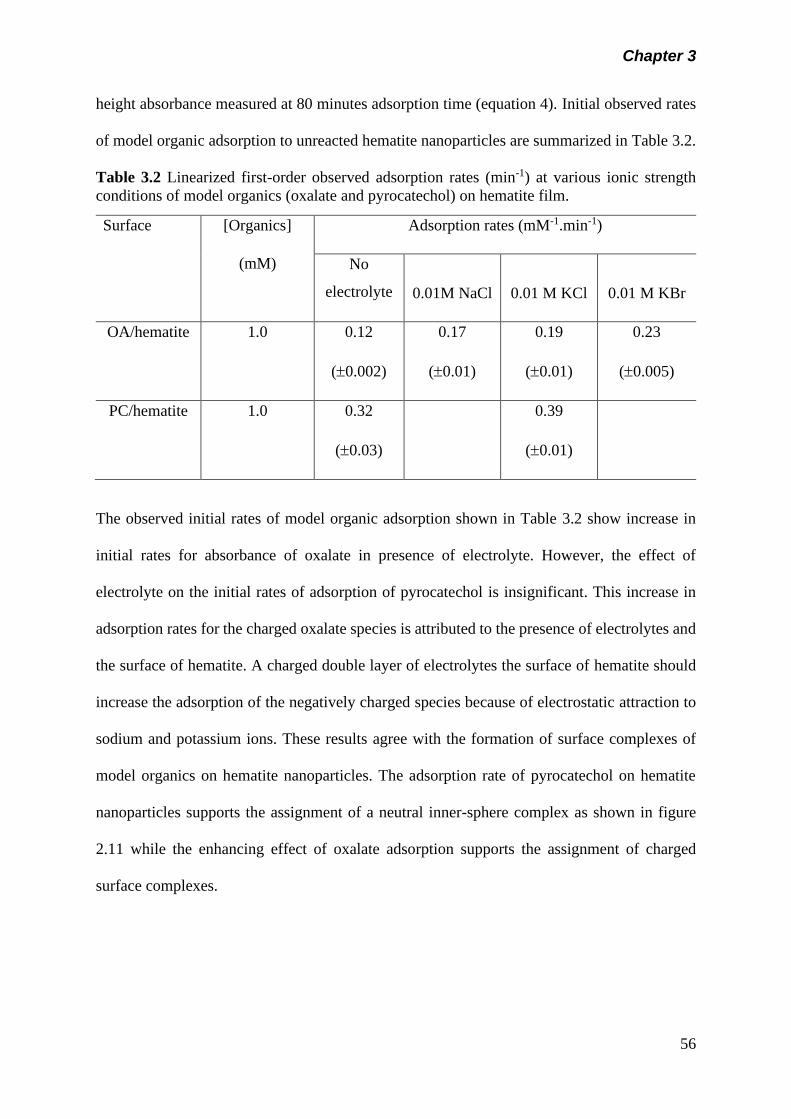
Chapter 3
56
height absorbance measured at 80 minutes adsorption time (equation 4). Initial observed rates
of model organic adsorption to unreacted hematite nanoparticles are summarized in Table 3.2.
Table 3.2 Linearized first-order observed adsorption rates (min-1) at various ionic strength
conditions of model organics (oxalate and pyrocatechol) on hematite film.
Surface [Organics]
(mM)
Adsorption rates (mM-1.min-1)
No
electrolyte
0.01M NaCl
0.01 M KCl
0.01 M KBr
OA/hematite 1.0 0.12
(0.002)
0.17
(0.01)
0.19
(0.01)
0.23
(0.005)
PC/hematite 1.0 0.32
(0.03)
0.39
(0.01)
The observed initial rates of model organic adsorption shown in Table 3.2 show increase in
initial rates for absorbance of oxalate in presence of electrolyte. However, the effect of
electrolyte on the initial rates of adsorption of pyrocatechol is insignificant. This increase in
adsorption rates for the charged oxalate species is attributed to the presence of electrolytes and
the surface of hematite. A charged double layer of electrolytes the surface of hematite should
increase the adsorption of the negatively charged species because of electrostatic attraction to
sodium and potassium ions. These results agree with the formation of surface complexes of
model organics on hematite nanoparticles. The adsorption rate of pyrocatechol on hematite
nanoparticles supports the assignment of a neutral inner-sphere complex as shown in figure
2.11 while the enhancing effect of oxalate adsorption supports the assignment of charged
surface complexes.
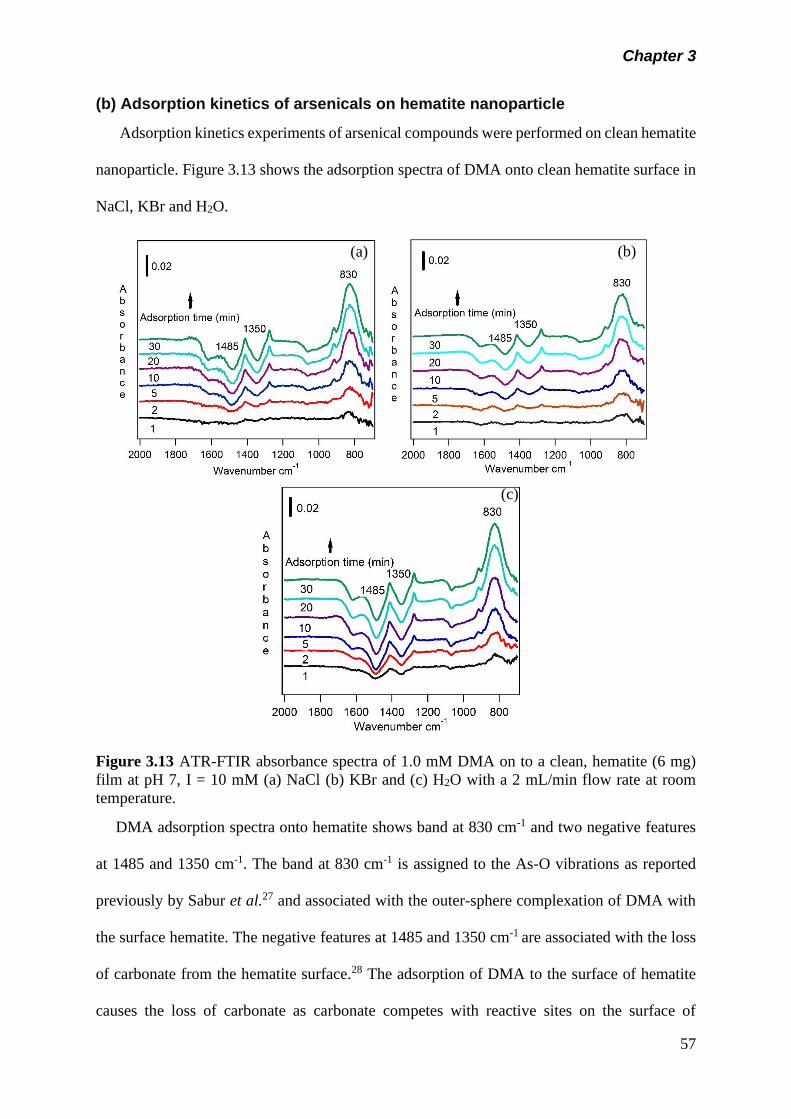
Chapter 3
57
(b) Adsorption kinetics of arsenicals on hematite nanoparticle
Adsorption kinetics experiments of arsenical compounds were performed on clean hematite
nanoparticle. Figure 3.13 shows the adsorption spectra of DMA onto clean hematite surface in
NaCl, KBr and H2O.
Figure 3.13 ATR-FTIR absorbance spectra of 1.0 mM DMA on to a clean, hematite (6 mg)
film at pH 7, I = 10 mM (a) NaCl (b) KBr and (c) H2O with a 2 mL/min flow rate at room
temperature.
DMA adsorption spectra onto hematite shows band at 830 cm-1 and two negative features
at 1485 and 1350 cm-1. The band at 830 cm-1 is assigned to the As-O vibrations as reported
previously by Sabur et al.27 and associated with the outer-sphere complexation of DMA with
the surface hematite. The negative features at 1485 and 1350 cm-1 are associated with the loss
of carbonate from the hematite surface.28 The adsorption of DMA to the surface of hematite
causes the loss of carbonate as carbonate competes with reactive sites on the surface of
(a) (b)
(c)
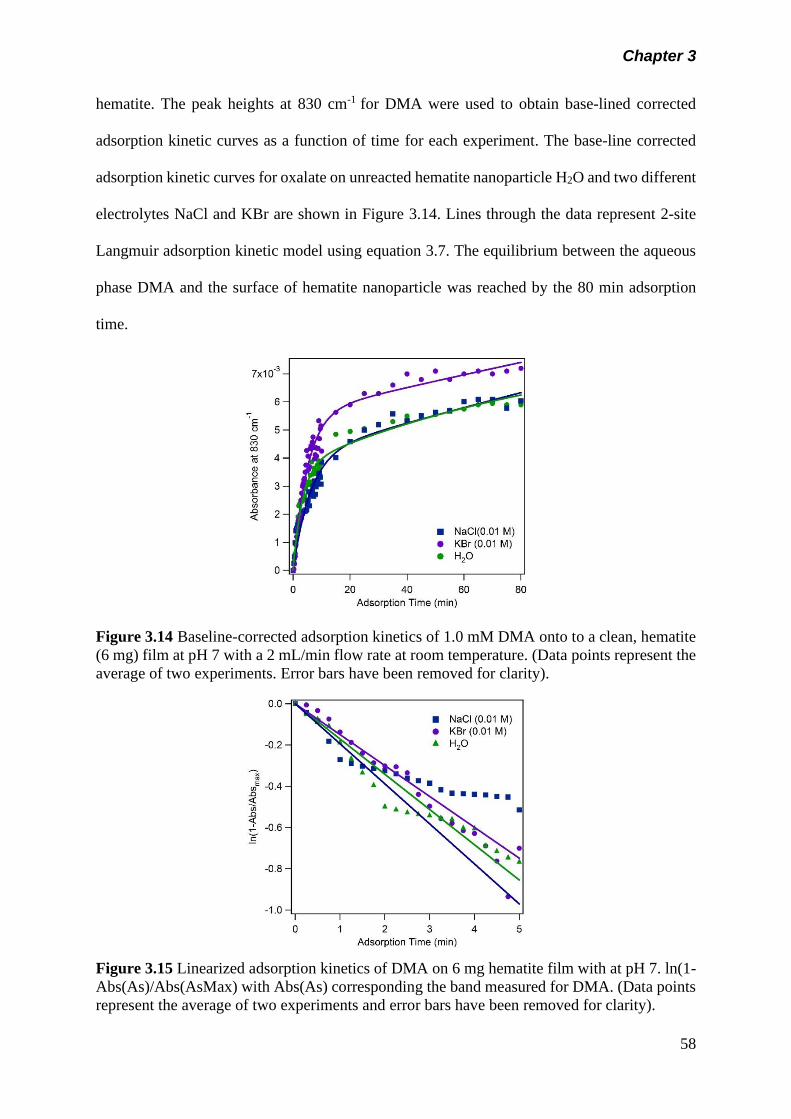
Chapter 3
58
hematite. The peak heights at 830 cm-1 for DMA were used to obtain base-lined corrected
adsorption kinetic curves as a function of time for each experiment. The base-line corrected
adsorption kinetic curves for oxalate on unreacted hematite nanoparticle H2O and two different
electrolytes NaCl and KBr are shown in Figure 3.14. Lines through the data represent 2-site
Langmuir adsorption kinetic model using equation 3.7. The equilibrium between the aqueous
phase DMA and the surface of hematite nanoparticle was reached by the 80 min adsorption
time.
Figure 3.14 Baseline-corrected adsorption kinetics of 1.0 mM DMA onto to a clean, hematite
(6 mg) film at pH 7 with a 2 mL/min flow rate at room temperature. (Data points represent the
average of two experiments. Error bars have been removed for clarity).
Figure 3.15 Linearized adsorption kinetics of DMA on 6 mg hematite film with at pH 7. ln(1-
Abs(As)/Abs(AsMax) with Abs(As) corresponding the band measured for DMA. (Data points
represent the average of two experiments and error bars have been removed for clarity).
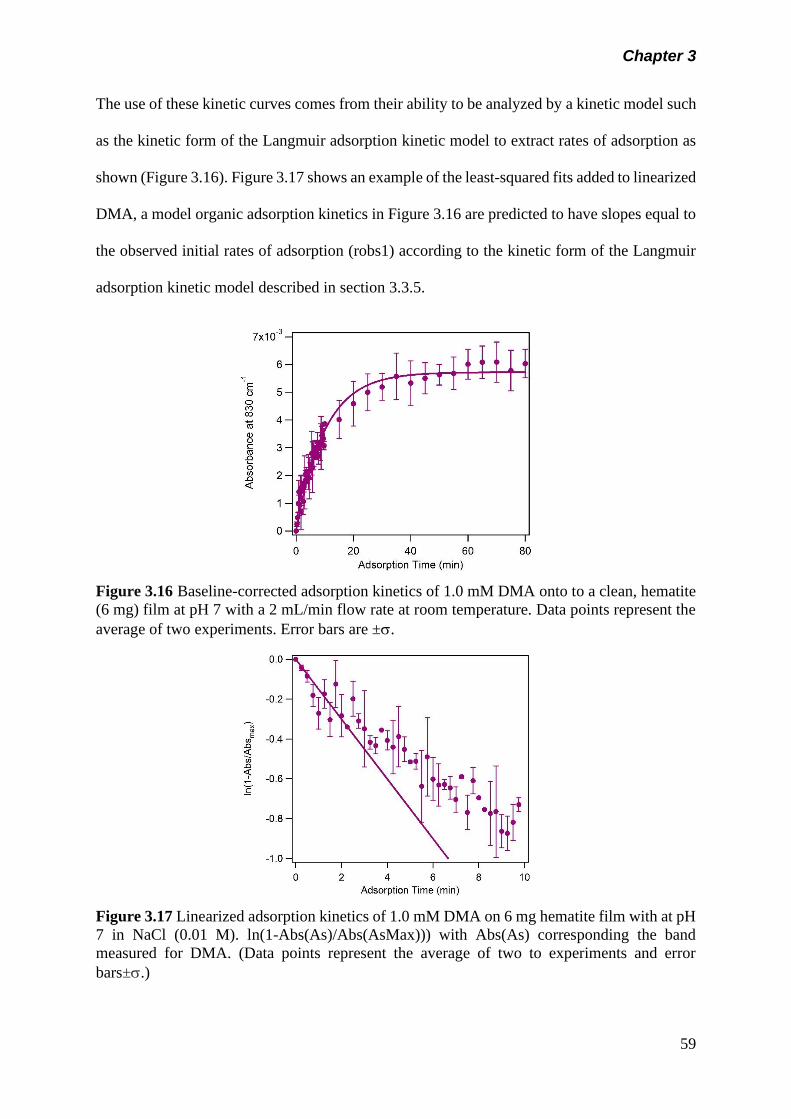
Chapter 3
59
The use of these kinetic curves comes from their ability to be analyzed by a kinetic model such
as the kinetic form of the Langmuir adsorption kinetic model to extract rates of adsorption as
shown (Figure 3.16). Figure 3.17 shows an example of the least-squared fits added to linearized
DMA, a model organic adsorption kinetics in Figure 3.16 are predicted to have slopes equal to
the observed initial rates of adsorption (robs1) according to the kinetic form of the Langmuir
adsorption kinetic model described in section 3.3.5.
Figure 3.16 Baseline-corrected adsorption kinetics of 1.0 mM DMA onto to a clean, hematite
(6 mg) film at pH 7 with a 2 mL/min flow rate at room temperature. Data points represent the
average of two experiments. Error bars are ±.
Figure 3.17 Linearized adsorption kinetics of 1.0 mM DMA on 6 mg hematite film with at pH
7 in NaCl (0.01 M). ln(1-Abs(As)/Abs(AsMax))) with Abs(As) corresponding the band
measured for DMA. (Data points represent the average of two to experiments and error
bars±.)
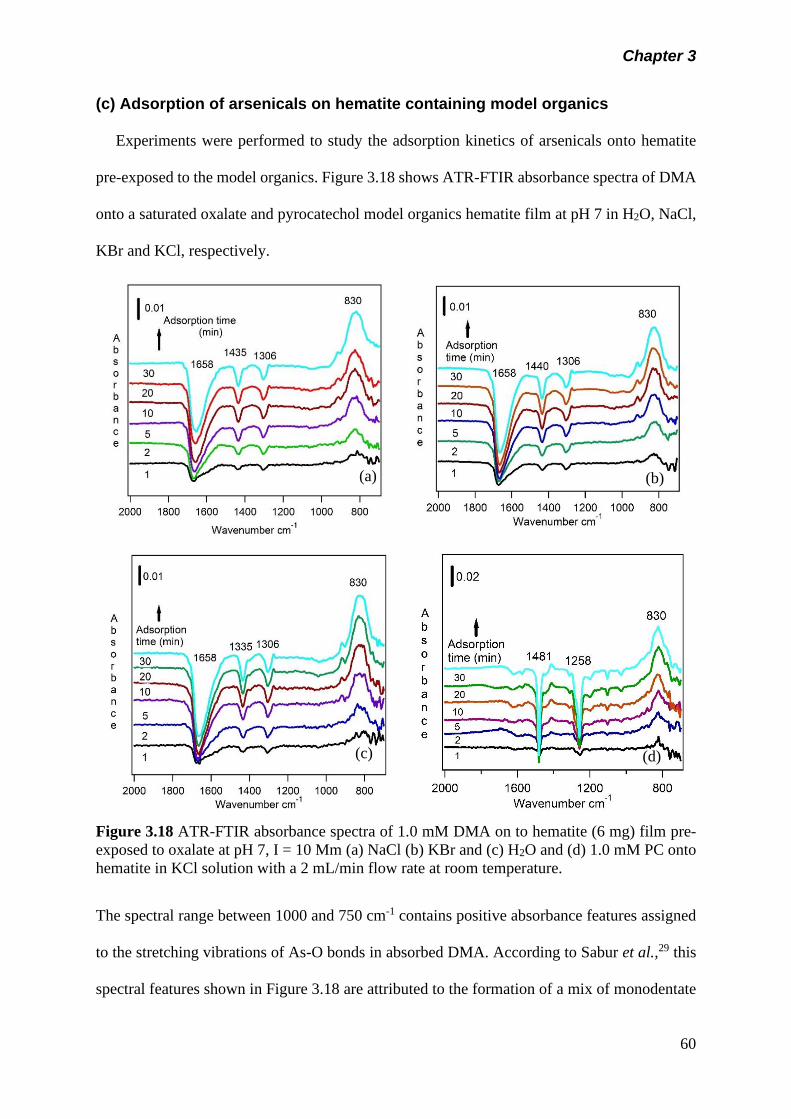
Chapter 3
60
(c) Adsorption of arsenicals on hematite containing model organics
Experiments were performed to study the adsorption kinetics of arsenicals onto hematite
pre-exposed to the model organics. Figure 3.18 shows ATR-FTIR absorbance spectra of DMA
onto a saturated oxalate and pyrocatechol model organics hematite film at pH 7 in H2O, NaCl,
KBr and KCl, respectively.
Figure 3.18 ATR-FTIR absorbance spectra of 1.0 mM DMA on to hematite (6 mg) film pre-
exposed to oxalate at pH 7, I = 10 Mm (a) NaCl (b) KBr and (c) H2O and (d) 1.0 mM PC onto
hematite in KCl solution with a 2 mL/min flow rate at room temperature.
The spectral range between 1000 and 750 cm-1 contains positive absorbance features assigned
to the stretching vibrations of As-O bonds in absorbed DMA. According to Sabur et al.,29 this
spectral features shown in Figure 3.18 are attributed to the formation of a mix of monodentate
(a)
cv (b)
(c) (d)
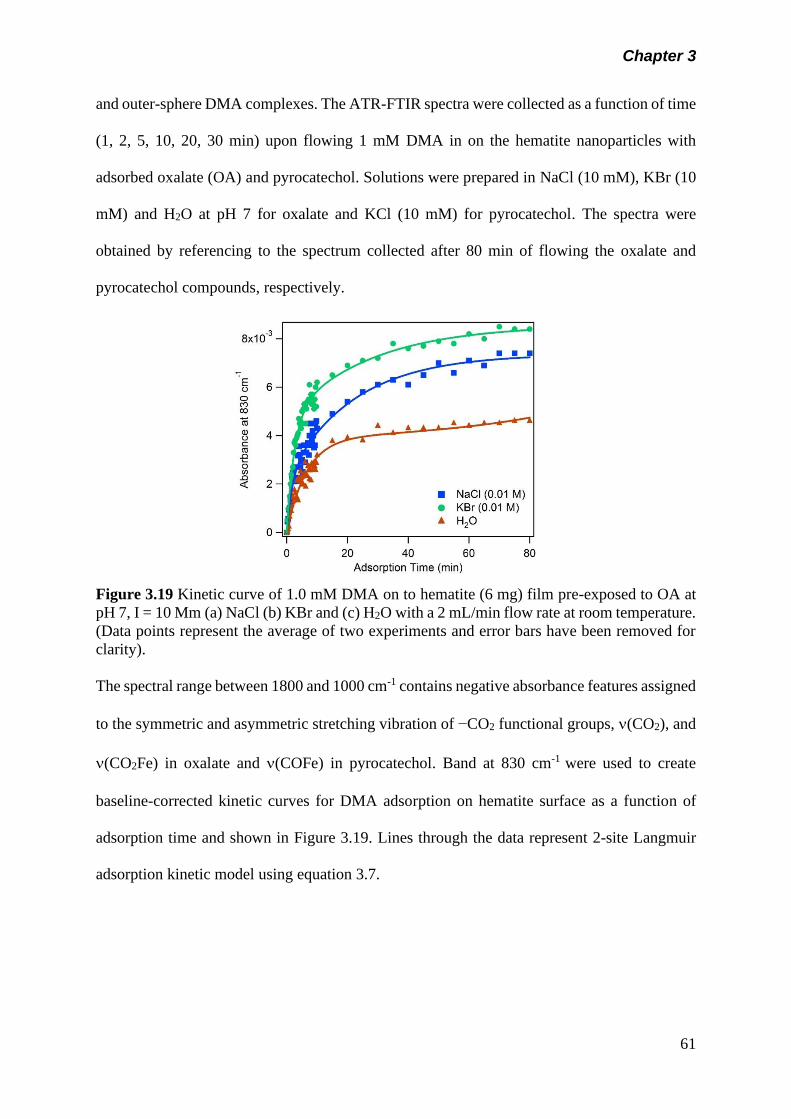
Chapter 3
61
and outer-sphere DMA complexes. The ATR-FTIR spectra were collected as a function of time
(1, 2, 5, 10, 20, 30 min) upon flowing 1 mM DMA in on the hematite nanoparticles with
adsorbed oxalate (OA) and pyrocatechol. Solutions were prepared in NaCl (10 mM), KBr (10
mM) and H2O at pH 7 for oxalate and KCl (10 mM) for pyrocatechol. The spectra were
obtained by referencing to the spectrum collected after 80 min of flowing the oxalate and
pyrocatechol compounds, respectively.
Figure 3.19 Kinetic curve of 1.0 mM DMA on to hematite (6 mg) film pre-exposed to OA at
pH 7, I = 10 Mm (a) NaCl (b) KBr and (c) H2O with a 2 mL/min flow rate at room temperature.
(Data points represent the average of two experiments and error bars have been removed for
clarity).
The spectral range between 1800 and 1000 cm-1 contains negative absorbance features assigned
to the symmetric and asymmetric stretching vibration of −CO2 functional groups, (CO2), and
(CO2Fe) in oxalate and (COFe) in pyrocatechol. Band at 830 cm-1 were used to create
baseline-corrected kinetic curves for DMA adsorption on hematite surface as a function of
adsorption time and shown in Figure 3.19. Lines through the data represent 2-site Langmuir
adsorption kinetic model using equation 3.7.
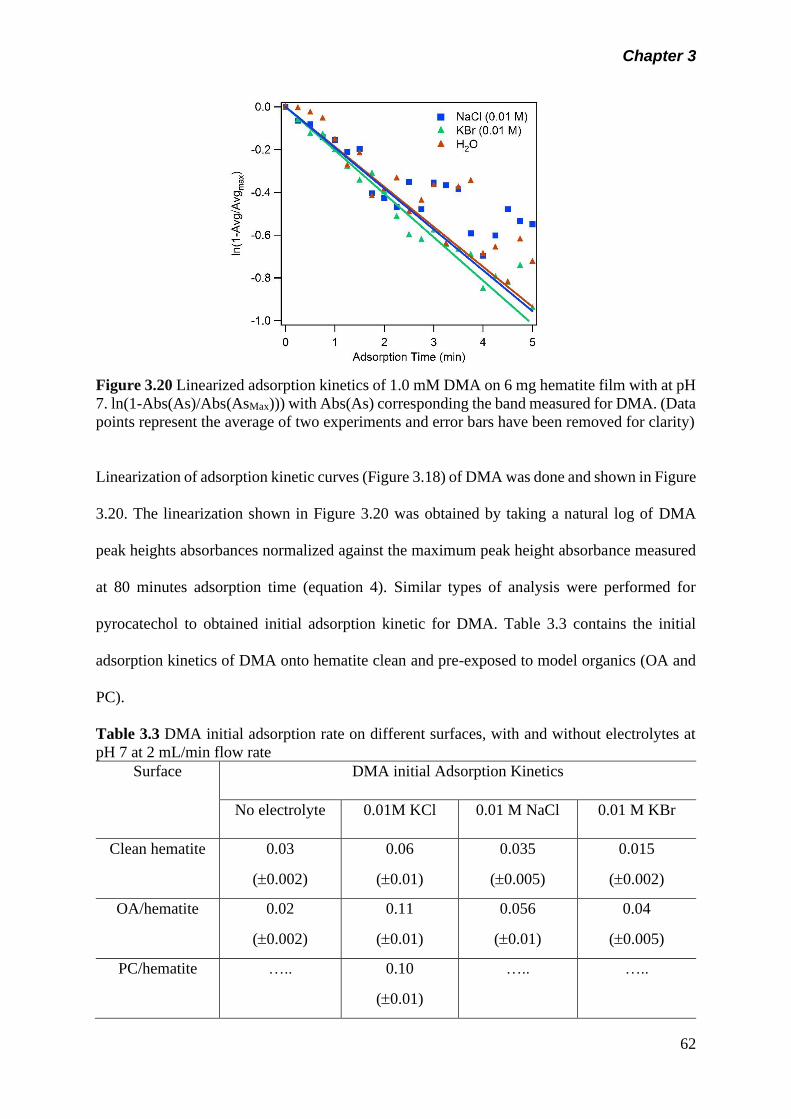
Chapter 3
62
Figure 3.20 Linearized adsorption kinetics of 1.0 mM DMA on 6 mg hematite film with at pH
7. ln(1-Abs(As)/Abs(AsMax))) with Abs(As) corresponding the band measured for DMA. (Data
points represent the average of two experiments and error bars have been removed for clarity)
Linearization of adsorption kinetic curves (Figure 3.18) of DMA was done and shown in Figure
3.20. The linearization shown in Figure 3.20 was obtained by taking a natural log of DMA
peak heights absorbances normalized against the maximum peak height absorbance measured
at 80 minutes adsorption time (equation 4). Similar types of analysis were performed for
pyrocatechol to obtained initial adsorption kinetic for DMA. Table 3.3 contains the initial
adsorption kinetics of DMA onto hematite clean and pre-exposed to model organics (OA and
PC).
Table 3.3 DMA initial adsorption rate on different surfaces, with and without electrolytes at
pH 7 at 2 mL/min flow rate
Surface DMA initial Adsorption Kinetics
No electrolyte 0.01M KCl 0.01 M NaCl 0.01 M KBr
Clean hematite 0.03
(0.002)
0.06
(0.01)
0.035
(0.005)
0.015
(0.002)
OA/hematite 0.02
(0.002)
0.11
(0.01)
0.056
(0.01)
0.04
(0.005)
PC/hematite ….. 0.10
(0.01)
….. …..
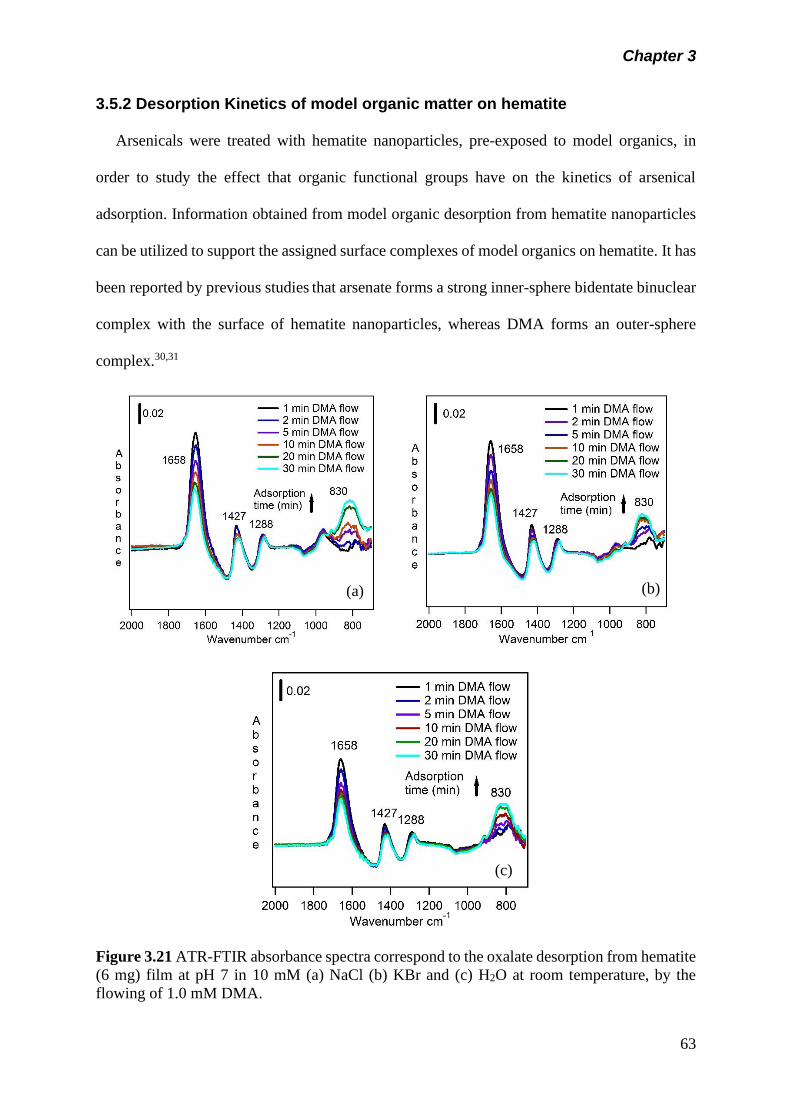
Chapter 3
63
3.5.2 Desorption Kinetics of model organic matter on hematite
Arsenicals were treated with hematite nanoparticles, pre-exposed to model organics, in
order to study the effect that organic functional groups have on the kinetics of arsenical
adsorption. Information obtained from model organic desorption from hematite nanoparticles
can be utilized to support the assigned surface complexes of model organics on hematite. It has
been reported by previous studies that arsenate forms a strong inner-sphere bidentate binuclear
complex with the surface of hematite nanoparticles, whereas DMA forms an outer-sphere
complex.30,31
Figure 3.21 ATR-FTIR absorbance spectra correspond to the oxalate desorption from hematite
(6 mg) film at pH 7 in 10 mM (a) NaCl (b) KBr and (c) H2O at room temperature, by the
flowing of 1.0 mM DMA.
(a) (b)
(c)
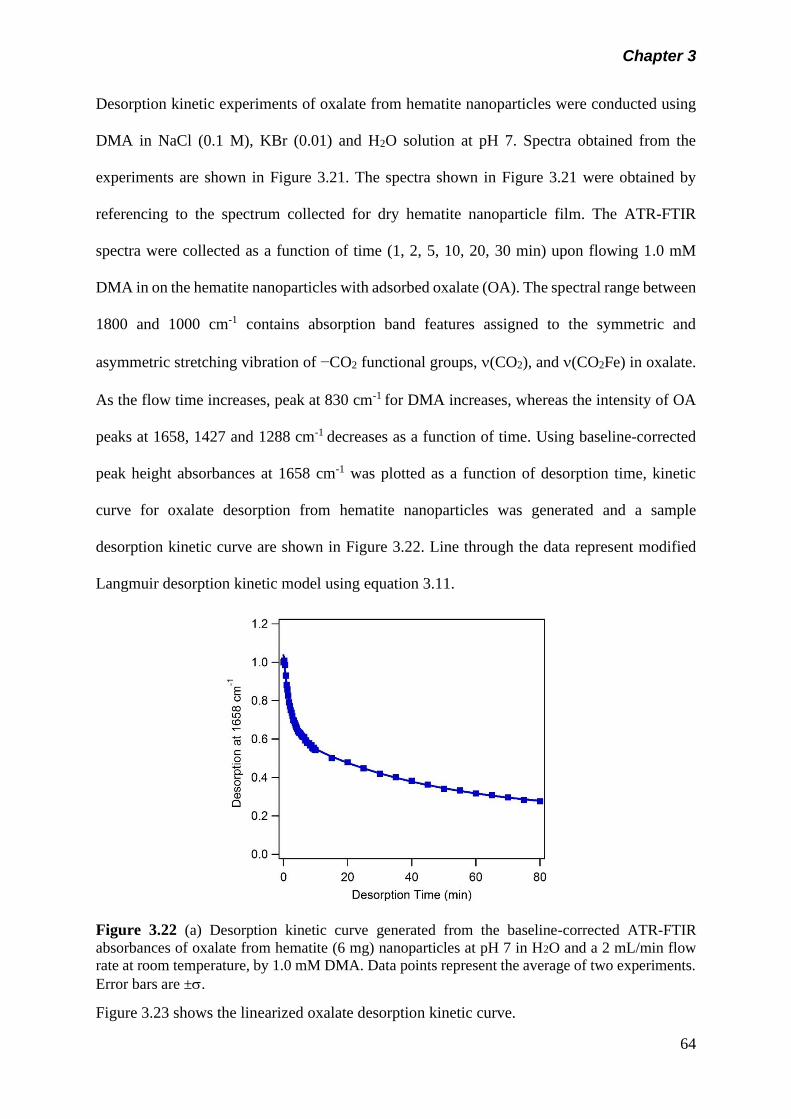
Chapter 3
64
Desorption kinetic experiments of oxalate from hematite nanoparticles were conducted using
DMA in NaCl (0.1 M), KBr (0.01) and H2O solution at pH 7. Spectra obtained from the
experiments are shown in Figure 3.21. The spectra shown in Figure 3.21 were obtained by
referencing to the spectrum collected for dry hematite nanoparticle film. The ATR-FTIR
spectra were collected as a function of time (1, 2, 5, 10, 20, 30 min) upon flowing 1.0 mM
DMA in on the hematite nanoparticles with adsorbed oxalate (OA). The spectral range between
1800 and 1000 cm-1 contains absorption band features assigned to the symmetric and
asymmetric stretching vibration of −CO2 functional groups, (CO2), and (CO2Fe) in oxalate.
As the flow time increases, peak at 830 cm-1 for DMA increases, whereas the intensity of OA
peaks at 1658, 1427 and 1288 cm-1 decreases as a function of time. Using baseline-corrected
peak height absorbances at 1658 cm-1 was plotted as a function of desorption time, kinetic
curve for oxalate desorption from hematite nanoparticles was generated and a sample
desorption kinetic curve are shown in Figure 3.22. Line through the data represent modified
Langmuir desorption kinetic model using equation 3.11.
Figure 3.22 (a) Desorption kinetic curve generated from the baseline-corrected ATR-FTIR
absorbances of oxalate from hematite (6 mg) nanoparticles at pH 7 in H2O and a 2 mL/min flow
rate at room temperature, by 1.0 mM DMA. Data points represent the average of two experiments.
Error bars are ±.
Figure 3.23 shows the linearized oxalate desorption kinetic curve.
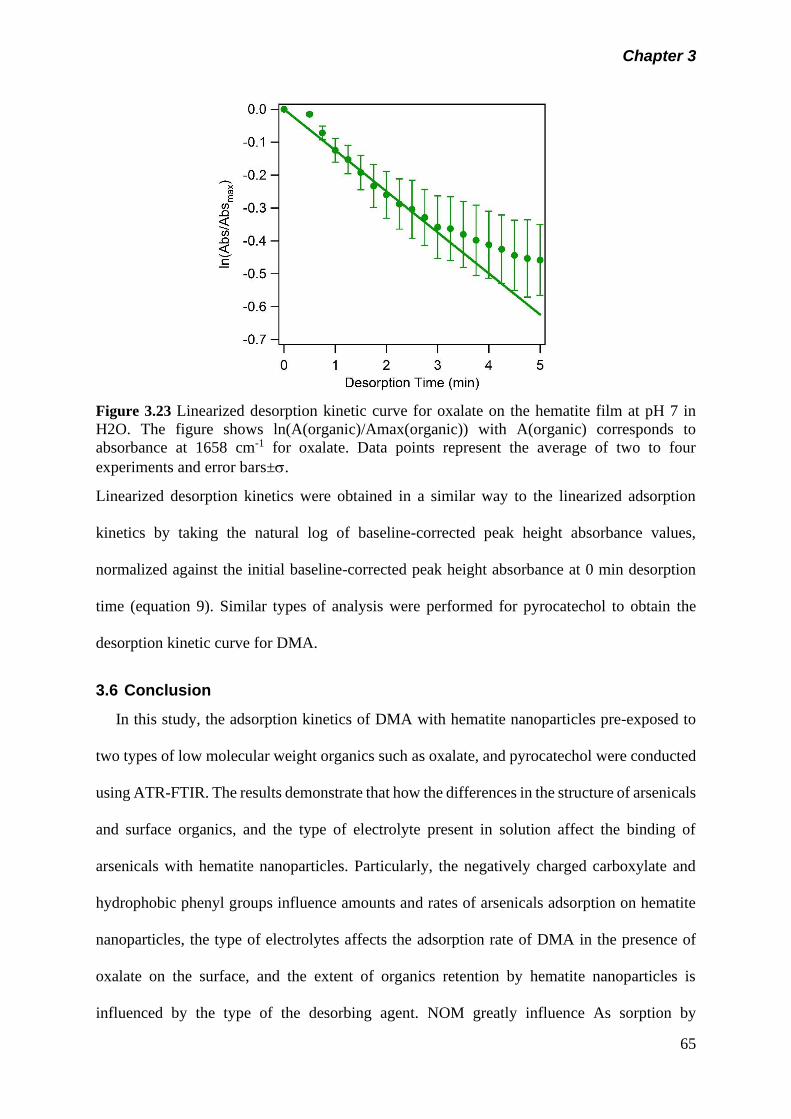
Chapter 3
65
Figure 3.23 Linearized desorption kinetic curve for oxalate on the hematite film at pH 7 in
H2O. The figure shows ln(A(organic)/Amax(organic)) with A(organic) corresponds to
absorbance at 1658 cm-1 for oxalate. Data points represent the average of two to four
experiments and error bars±.
Linearized desorption kinetics were obtained in a similar way to the linearized adsorption
kinetics by taking the natural log of baseline-corrected peak height absorbance values,
normalized against the initial baseline-corrected peak height absorbance at 0 min desorption
time (equation 9). Similar types of analysis were performed for pyrocatechol to obtain the
desorption kinetic curve for DMA.
3.6 Conclusion
In this study, the adsorption kinetics of DMA with hematite nanoparticles pre-exposed to
two types of low molecular weight organics such as oxalate, and pyrocatechol were conducted
using ATR-FTIR. The results demonstrate that how the differences in the structure of arsenicals
and surface organics, and the type of electrolyte present in solution affect the binding of
arsenicals with hematite nanoparticles. Particularly, the negatively charged carboxylate and
hydrophobic phenyl groups influence amounts and rates of arsenicals adsorption on hematite
nanoparticles, the type of electrolytes affects the adsorption rate of DMA in the presence of
oxalate on the surface, and the extent of organics retention by hematite nanoparticles is
influenced by the type of the desorbing agent. NOM greatly influence As sorption by
Chapter 3
66
interacting with mineral surfaces and consequently may play a significant role in the release of
As from soils into the groundwater. The presence of NOM can enhance As release mainly
through competition for available adsorption sites, forming aqueous complexes, and changing
the redox chemistry of site surfaces and As species. Instead, organics can also reduce As
mobility by serving as a binding agent and by forming insoluble complexes, especially when
saturated with metal cations. These findings are important in advancing the understanding of
the fate and transport cycle of As in the environment, and give insights for the control of As
mobility. Given the ubiquity of organic-metal oxide interfaces in environmental systems, these
results are significant since these studies highlight that in situ flow mode and time dependent
spectroscopic experiments can amplify trends and molecular-level processes otherwise missed
in bulk batch adsorption experiments.
3.7 References
(1) Martin, R.; Dowling, K.; Pearce, D.; Sillitoe, J.; Florentine, S. Health Effects Associated
with Inhalation of Airborne Arsenic Arising from Mining Operations. Geosciences
2014, 4 (3), 128–175.
(2) Ritter, K.; Aiken, G. R.; Ranville, J. F.; Bauer, M.; Macalady, D. L. Evidence for the
Aquatic Binding of Arsenate by Natural Organic Matter - Suspended Fe(III) - Environ.
Sci. Technol., 2006, 40 (17), 5380–5387.
(3) Sánchez-Rodas, D.; Sánchez de la Campa, A. M.; de la Rosa, J. D.; Oliveira, V.; Gómez-
Ariza, J. L.; Querol, X.; Alastuey, A. Arsenic Speciation of Atmospheric Particulate
Matter (PM10) in an Industrialised Urban Site in Southwestern Spain. Chemosphere
2007, 66 (8), 1485–1493.
(4) Bauer, M.; Fulda, B.; Blodau, C. Groundwater Derived Arsenic in High Carbonate
Wetland Soils: Sources, Sinks, and Mobility. Sci. Total Environ. 2008, 401 (1–3), 109–
Chapter 3
67
120.
(5) Simeoni, M. A.; Batts, B. D.; McRae, C. Effect of Groundwater Fulvic Acid on the
Adsorption of Arsenate by Ferrihydrite and Gibbsite. Appl. Geochemistry 2003, 18 (10),
1507–1515.
(6) Mudhoo, A.; Sharma, S. K.; Garg, V. K.; Tseng, C.-H. Arsenic: An Overview of
Applications, Health, and Environmental Concerns and Removal Processes. Crit. Rev.
Environ. Sci. Technol. 2011, 41 (5), 435–519.
(7) Yang, G.; Ma, L.; Xu, D.; Li, J.; He, T.; Liu, L.; Jia, H.; Zhang, Y.; Chen, Y.; Chai, Z.
Levels and Speciation of Arsenic in the Atmosphere in Beijing, China. Chemosphere
2012, 87 (8), 845–850.
(8) Dobran, S.; Zagury, G. J. Arsenic Speciation and Mobilization in CCA-Contaminated
Soils: Influence of Organic Matter Content. Sci. Total Environ. 2006, 364 (1–3), 239–
250.
(9) Lin, H. T.; Wang, M. C.; Li, G. C. Complexation of Arsenate with Humic Substance in
Water Extract of Compost. Chemosphere 2004, 56 (11), 1105–1112.
(10) Mikutta, C.; Kretzschmar, R. Spectroscopic Evidence for Ternary Complex Formation
between Arsenate and Ferric Iron Complexes of Humic Substances. Environ. Sci.
Technol. 2011, 45, 9550–9557.
(11) Chilakapati, J.; Wallace, K.; Ren, H.; Fricke, M.; Bailey, K.; Ward, W.; Creed, J.;
Kitchin, K. Genome-Wide Analysis of BEAS-2B Cells Exposed to Trivalent Arsenicals
and Dimethylthioarsinic Acid. Toxicology 2010, 268 (1–2), 31–39.
(12) Dombrowski, P. M.; Long, W.; Farley, K. J.; Mahony, J. D.; Capitani, J. F.; Di Toro, D.
M. Thermodynamic Analysis of Arsenic Methylation. Environ. Sci. Technol. 2005, 39
Chapter 3
68
(7), 2169–2176.
(13) Borch, T.; Larese-casanova, P.; Kappler, A. Redox Transformation of Arsenic by Fe(
II)- Activated Goethite ( -FeOOH ) Redox Transformation of Arsenic by Fe(II)-
Activated Goethite (-FeOOH ). 2010, 44, 102–108.
(14) Dixit, S.; Hering, J. G. Comparison of Arsenic(V) and Arsenic(III) Sorption onto Iron
Oxide Minerals: Implications for Arsenic Mobility. Environ. Sci. Technol. 2003, 37
(18), 4182–4189.
(15) Redman, A. D.; Macalady, D. L.; Ahmann, D. Natural Organic Matter Affects Arsenic
Speciation and Sorption onto Hematite. Environ. Sci. Technol. 2002, 36 (13), 2889–
2896.
(16) Polubesova, T.; Chefetz, B. DOM-Affected Transformation of Contaminants on Mineral
Surfaces: A Review. Crit. Rev. Environ. Sci. Technol. 2014, 44 (3), 223–254.
(17) Duan, J.; Gregory, J. Coagulation by Hydrolysing Metal Salts. Adv. Colloid Interface
Sci. 2003, 100–102, 475–502.
(18) Kalbitz, K.; Kaiser, K. Contribution of Dissolved Organic Matter to Carbon Storage in
Forest Mineral Soils. J. Plant Nutr. Soil Sci. 2008, 171 (1), 52–60.
(19) Lalonde, K.; Mucci, A.; Ouellet, A.; Gélinas, Y. Preservation of Organic Matter in
Sediments Promoted by Iron. Nature 2012, 483 (7388), 198–200.
(20) Situm, A.; Rahman, M. A.; Allen, N.; Kabengi, N.; Al-Abadleh, H. A. ATR-FTIR and
Flow Microcalorimetry Studies on the Initial Binding Kinetics of Arsenicals at the
Organic-Hematite Interface. J. Phys. Chem. A 2017, 121 (30), 5569–5579.
(21) Weng, L.; Van Riemsdijk, W. H.; Hiemstra, T. Effects of Fulvic and Humic Acids on
Arsenate Adsorption to Goethite: Experiments and Modeling. Environ. Sci. Technol.
Chapter 3
69
2009, 43 (19), 7198–7204.
(22) Mladenov, N.; Zheng, Y.; Simone, B.; Bilinski, T. M.; McKnight, D. M.; Nemergut, D.;
Radloff, K. A.; Rahman, M. M.; Ahmed, K. M. Dissolved Organic Matter Quality in a
Shallow Aquifer of Bangladesh: Implications for Arsenic Mobility. Environ. Sci.
Technol. 2015, 49 (18), 10815–10824.
(23) Sharma, P.; Ofner, J.; Kappler, A. Formation of Binary and Ternary Colloids and
Dissolved Complexes of Organic Matter, Fe and As. Environ. Sci. Technol. 2010, 44
(12), 4479–4485.
(24) Mikutta, R.; Lorenz, D.; Guggenberger, G.; Haumaier, L.; Freund, A. Properties and
Reactivity of Fe-Organic Matter Associations Formed by Coprecipitation versus
Adsorption: Clues from Arsenate Batch Adsorption. Geochim. Cosmochim. Acta 2014,
144, 258–276.
(25) Silva, G. C.; Vasconcelos, I. F.; De Carvalho, R. P.; Dantas, M. S. S.; Ciminelli, V. S.
T. Molecular Modeling of Iron and Arsenic Interactions with Carboxy Groups in Natural
Biomass. Environ. Chem. 2009, 6 (4), 350–356.
(26) Situm, A.; Rahman, M. A.; Goldberg, S.; Al-Abadleh, H. A. Spectral Characterization
and Surface Complexation Modeling of Low Molecular Weight Organics on Hematite
Nanoparticles: Role of Electrolytes in the Binding Mechanism. Environ. Sci. Nano 2016,
3 (4), 910–926.
(27) Sabur, M. A.; Al-Abadleh, H. A. Surface Interactions of Monomethylarsonic Acid with
Hematite Nanoparticles Studied Using ATR-FTIR: Adsorption and Desorption Kinetics.
Can. J. Chem. 2015, 93 (11), 1297–1304.
(28) Brechbühl, Y.; Christl, I.; Elzinga, E. J.; Kretzschmar, R. Competitive Sorption of
Chapter 3
70
Carbonate and Arsenic to Hematite: Combined ATR-FTIR and Batch Experiments. J.
Colloid Interface Sci. 2012, 377 (1), 313–321.
(29) Sabur, M. A.; Goldberg, S.; Gale, A.; Kabengi, N.; Al-Abadleh, H. A. Temperature-
Dependent Infrared and Calorimetric Studies on Arsenicals Adsorption from Solution
to Hematite Nanoparticles. Langmuir 2015, 31 (9), 2749–2760.
(30) Arts, D.; Abdus Sabur, M.; Al-Abadleh, H. A. Surface Interactions of Aromatic
Organoarsenical Compounds with Hematite Nanoparticles Using ATR-FTIR: Kinetic
Studies. J. Phys. Chem. A 2013, 117 (10), 2195–2204.
(31) Tofan-Lazar, J.; Al-Abadleh, H. A. ATR-FTIR Studies on the Adsorption/Desorption
Kinetics of Dimethylarsinic Acid on Iron-(Oxyhydr)Oxides. J. Phys. Chem. A 2012, 116
(6), 1596–1604.
Chapter 4
71
Chapter 4 Surface Water Structure and Hygroscopic Properties of Light
Absorbing Secondary Organic Polymers of Atmospheric Relevance
This chapter of the thesis contains the following publication, reproduced from Rahman,
M. A. and Al-Abadleh, H. A. ACS Omega, 2018, 3, 15519-15529, licensed under an ACS
AuthorChoice and accessible online at: https://pubs.acs.org/doi/10.1021/acsomega.8b02066 with
supplementary information accessible online at: https://pubs.acs.org/doi/suppl/10.1021/
acsomega.8b02066 /su pplfile /ao8b02066_si_001.pdf.
4.1 Abstract
Hygroscopic properties and chemical reactivity of secondary organic aerosols (SOA)
influence their overall contribution to the indirect effect on the climate. In this study, we
investigate the hygroscopic properties of organic and organometallic polymeric particles,
namely polycatechol, polyguaiacol, Fe-polyfumarate, and Fe-polymuconate. These particles
efficiently form in iron-catalyzed reactions with aromatic and aliphatic dicarboxylic acid
compounds detected in field-collected SOA. The structure of surface water was studied using
diffuse reflectance infrared Fourier transform spectroscopy (DRIFTS), and the uptake of
gaseous water was quantified using quartz crystal microbalance (QCM) as a function of relative
humidity. Spectroscopic data show that water bonding with organic functional groups acting
as hydrogen bond acceptors cause shifts in their vibrational modes. Analysis of the hydroxyl
group stretching region revealed weak and strong hydrogen bonding networks that suggest
cluster formation reflecting water−water and water-organics interactions, respectively. A
modified Type II multilayer Brunauer-Emmett-Teller adsorption model described the
adsorption isotherm on the nonporous materials, polycatechol, polyguaiacol, and Fe-
polymuconate. However, water adsorption on porous Fe-polyfumarate was best described
using a Type V adsorption model, namely the Langmuir-Sips model that accounts for
condensation in pores. The data revealed that organometallic polymers are more hygroscopic
Chapter 4
72
than organic polymers. The implications of these investigations are discussed in the context of
the chemical reactivity of these particles relative to known SOA.
4.2 Introduction
Water is the solvent that affects the chemical reactivity and physical properties of
atmospheric aerosols. There are molecular level differences in the structure of water between
bulk and interfacial environments in atmospherically relevant systems.1-3 These differences
originate mainly from the number and strength of hydrogen bonds among water molecules and
acceptor/donor groups.4-7 Reactions in liquid droplets that mimic chemistry in clouds were
found to proceed at relatively lower rates than surface reactions because of solvent cage
effects.8-10 Surface water in sea spray, ammonium sulfate, and mineral dust particles were
shown to enhance ionic mobility, alter reaction pathways and surface speciation, and influence
the hygroscopic properties of particles and their ability to form clouds.11-14 In primary and
secondary organic aerosol systems (POA and SOA), lab studies showed that temperature,
relative humidity (RH), and molecular composition affect the size, viscosity, and phase state
of these aerosols, which in turn affect the relative importance of bulk versus surface
reactions.15,16 In multicomponent aerosol systems containing organics, inorganic salts, and
water, changes in RH affect the aerosol liquid water ALW content and pH.17,18 As a result, the
morphology and mixing state in the systems that can undergo deliquescence, efflorescence,
and liquid-liquid phase separation are directly dependent on ALW content.19,20 Hence,
measurements of water uptake as a function of RH are the first step toward understanding the
reactivity of atmospheric aerosols. This is because water uptake curves provide crucial
information on the solute to solvent ratio and surface area to volume ratio, which can be used
to infer the surface chemical composition and determine the reactivity of the particles. One of
the active areas of investigation in atmospheric chemistry is particle nucleation and growth via
secondary pathways in the atmosphere. Processes that include atmospheric oxidation of volatile
Chapter 4
73
organic compounds (VOCs) from biogenic and anthropogenic sources, gas-particle
partitioning, and multiphase/heterogenous reactions contributed to our understanding of SOA
formation21-24 and better parameterization of global climate models.25 Following SOA
formation, a number of chemical and photochemical aging processes lead to the formation of
light absorbing soluble and insoluble components collectively known as “brown carbon”.26 The
role of transition metals such as iron in the formation and aging of SOA is not well
understood.27 Iron is a ubiquitous component of mineral dust, fly ash, and marine aerosols with
speciation that varies by the aerosol source.28-32 Uptake of acidic gases on iron-containing
particles during long-range transport enhances the fraction of soluble iron in particles.32-34 Also,
the concentration of dissolved iron was found to be affected by cycling between wet aerosols
characterized by highly acidic conditions with a few layers of adsorbed water and cloud
droplets characterized by more pH-neutral conditions.35 Hence, given their rich chemistry, iron
cations in (ALW) can catalyze a number of reactions with the organic content of aerosols. We
recently reported that Fe(III) in solution leads to the formation of light absorbing secondary
brown carbon via oxidative polymerization of polyphenols and metal-catalyzed polymerization
of dicarboxylic acids.36,37 Polycatechol and polyguaiacol particles were formed from the
reaction with semi-volatile phenolic precursors catechol and guaiacol emitted from biomass
burning and produced by photooxidation of aromatic VOCs.38 The reactions with Fe(III) were
carried out under high solute/solvent ratio that mimic reactions in adsorbed water, with mass
yields approaching 50% relative to the concentration of the organic precursor.36 Also, the
reaction of soluble Fe(III) with fumaric (trans-butenedioic) and muconic (trans,trans-2,4-
hexadienedioic) acids, known photooxidation products of benzene, formed brightly colored
organometallic nanoparticles with nearly 30% Fe (w/w) and 90% mass yields relative to the
concentration of the acids.37 The mass-normalized absorption coefficients of Fe-polyfumarate
and Fe-polymuconate particles in the near UV light between 350 and 400 nm ranged from 1 to
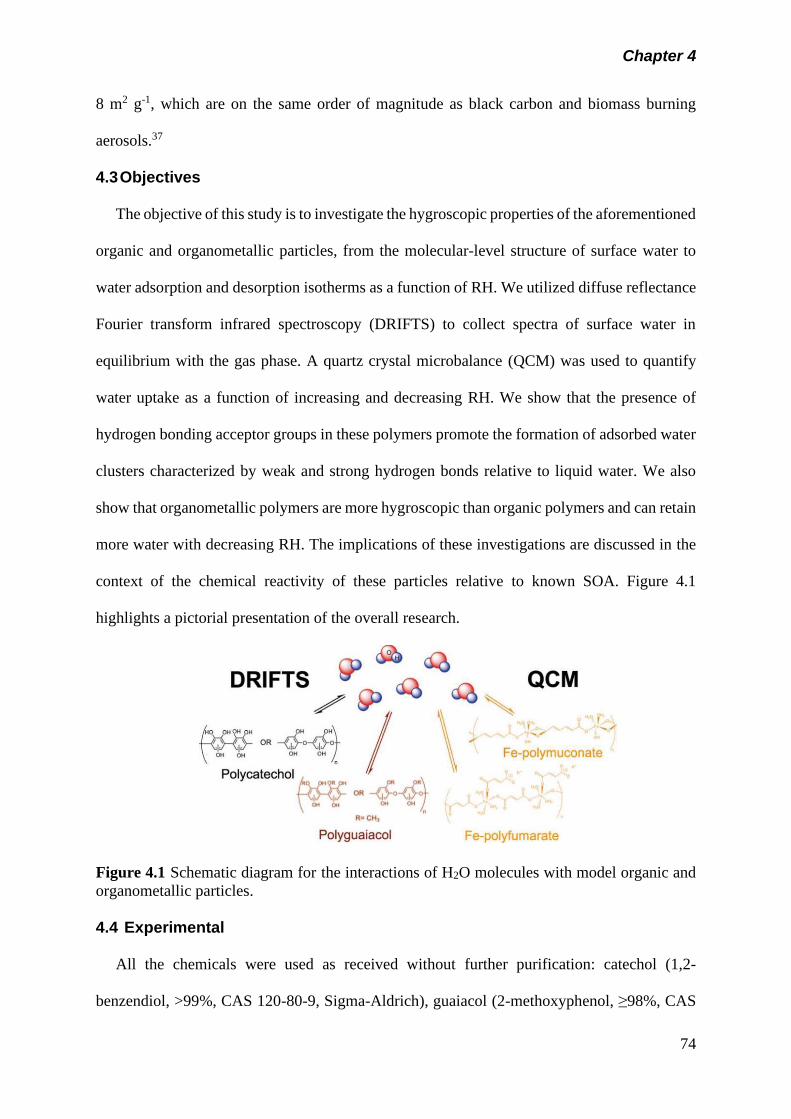
Chapter 4
74
8 m2 g-1, which are on the same order of magnitude as black carbon and biomass burning
aerosols.37
4.3 Objectives
The objective of this study is to investigate the hygroscopic properties of the aforementioned
organic and organometallic particles, from the molecular-level structure of surface water to
water adsorption and desorption isotherms as a function of RH. We utilized diffuse reflectance
Fourier transform infrared spectroscopy (DRIFTS) to collect spectra of surface water in
equilibrium with the gas phase. A quartz crystal microbalance (QCM) was used to quantify
water uptake as a function of increasing and decreasing RH. We show that the presence of
hydrogen bonding acceptor groups in these polymers promote the formation of adsorbed water
clusters characterized by weak and strong hydrogen bonds relative to liquid water. We also
show that organometallic polymers are more hygroscopic than organic polymers and can retain
more water with decreasing RH. The implications of these investigations are discussed in the
context of the chemical reactivity of these particles relative to known SOA. Figure 4.1
highlights a pictorial presentation of the overall research.
Figure 4.1 Schematic diagram for the interactions of H2O molecules with model organic and
organometallic particles.
4.4 Experimental
All the chemicals were used as received without further purification: catechol (1,2-
benzendiol, >99%, CAS 120-80-9, Sigma-Aldrich), guaiacol (2-methoxyphenol, ≥98%, CAS
Chapter 4
75
90-05-1, Sigma-Aldrich), fumaric acid (FA, trans-butenedioic acid, ≥99%, CAS: 110-17-8,
Sigma-Aldrich), muconic acid (MA, trans, trans-2,4-hexadienedioic acid, 98%, CAS: 3588-
17- 8, Sigma-Aldrich), iron(III) chloride hexahydrate (FeCl3· 6H2O, 97%, CAS: 10025-77-1,
Sigma-Aldrich), and diamond powder (5 ± 2 μm, Lands Superabrasives LST600T). The
synthesis procedure of polycatehcol and polyguaiacol is reported in reference 36, and that for
Fe-polyfumarate and Fe-polymuconate. Briefly, aqueous phase standard solutions of iron
chloride, catechol, and guaiacol were prepared by dissolving the chemicals in Milli-Q water
(18.2 MΩ cm) with the solutions’ ionic strength adjusted to 0.01 M by adding potassium
chloride (KCl powder, 99.5%, EM Science) in order to stabilize the pH. The pH was adjusted
using stock solutions of hydrochloric acid (HCl 6 N, Ricca Chemical Company) and sodium
hydroxide (NaOH pellets, 99−100%, EMD). The concentration of the organic precursors was
1 mM in 100 mL, to which 2 mL of the iron chloride solution was added to start the reaction
in the dark for 2 h. To get the maximum yield, the initial pH was adjusted to 3 for experiments
with catechol and guaiacol, and 5 for experiments with fumaric and muconic acids. The
resulting iron to organic molar ratio after mixing is 2:1. The reaction solution was then filtered
on nylon membrane filters (0.2 μm pore size, 47 mm dia., EMD Millipore) using a suction
filtration system (VWR). After filtration, the products were air dried overnight. The filters were
weighed before and after filtration to measure the mass of the product. The organic polymers
were then scratched from the filter using a spatula into a clean vial for future use. Some of the
material collected on the filters was analyzed for Brunauer-Emmett-Teller (BET) surface area
using N2 gas in a Nova 2200e multigas surface area analyzer (Quantachrome Instruments). The
surface area values were found to be 4 ± 0.6, 14 ± 2, 36 ± 5, 6 ± 1 m2g-1 for polycatechol,
polyguaiacol, Fe-polyfumarate, and Fe-polymuconate, respectively.
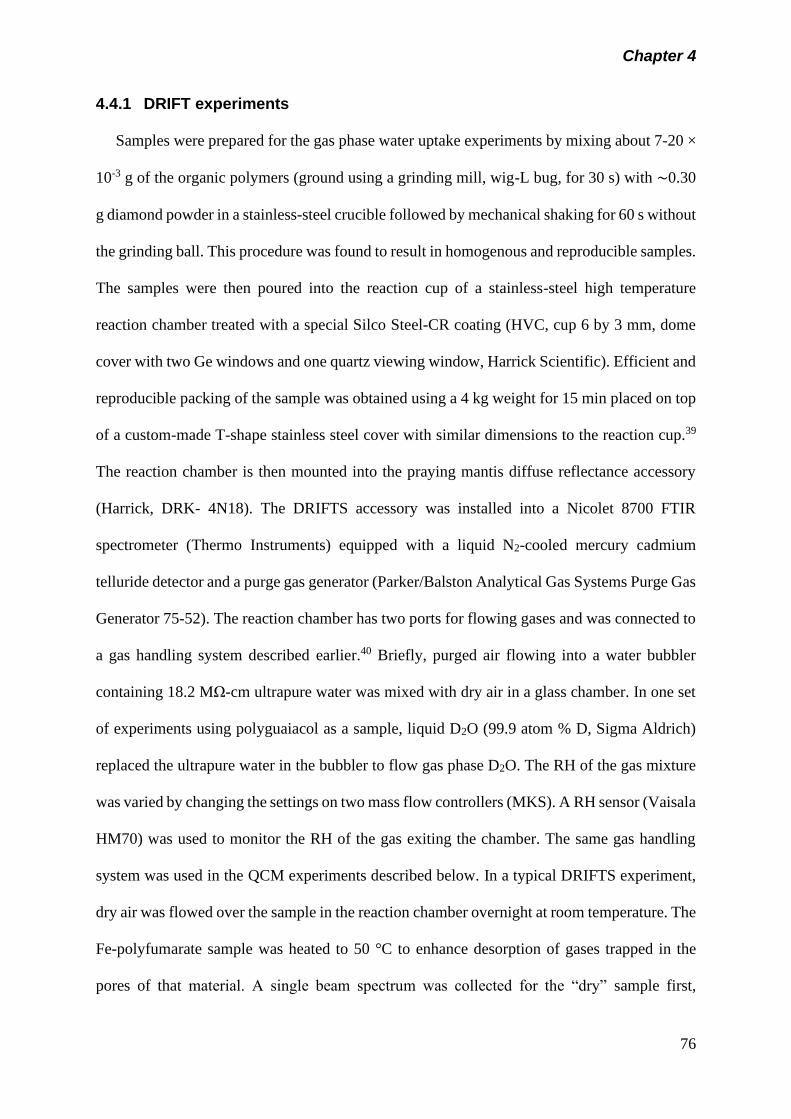
Chapter 4
76
4.4.1 DRIFT experiments
Samples were prepared for the gas phase water uptake experiments by mixing about 7-20 ×
10-3 g of the organic polymers (ground using a grinding mill, wig-L bug, for 30 s) with ∼0.30
g diamond powder in a stainless-steel crucible followed by mechanical shaking for 60 s without
the grinding ball. This procedure was found to result in homogenous and reproducible samples.
The samples were then poured into the reaction cup of a stainless-steel high temperature
reaction chamber treated with a special Silco Steel-CR coating (HVC, cup 6 by 3 mm, dome
cover with two Ge windows and one quartz viewing window, Harrick Scientific). Efficient and
reproducible packing of the sample was obtained using a 4 kg weight for 15 min placed on top
of a custom-made T-shape stainless steel cover with similar dimensions to the reaction cup.39
The reaction chamber is then mounted into the praying mantis diffuse reflectance accessory
(Harrick, DRK- 4N18). The DRIFTS accessory was installed into a Nicolet 8700 FTIR
spectrometer (Thermo Instruments) equipped with a liquid N2-cooled mercury cadmium
telluride detector and a purge gas generator (Parker/Balston Analytical Gas Systems Purge Gas
Generator 75-52). The reaction chamber has two ports for flowing gases and was connected to
a gas handling system described earlier.40 Briefly, purged air flowing into a water bubbler
containing 18.2 MΩ-cm ultrapure water was mixed with dry air in a glass chamber. In one set
of experiments using polyguaiacol as a sample, liquid D2O (99.9 atom % D, Sigma Aldrich)
replaced the ultrapure water in the bubbler to flow gas phase D2O. The RH of the gas mixture
was varied by changing the settings on two mass flow controllers (MKS). A RH sensor (Vaisala
HM70) was used to monitor the RH of the gas exiting the chamber. The same gas handling
system was used in the QCM experiments described below. In a typical DRIFTS experiment,
dry air was flowed over the sample in the reaction chamber overnight at room temperature. The
Fe-polyfumarate sample was heated to 50 °C to enhance desorption of gases trapped in the
pores of that material. A single beam spectrum was collected for the “dry” sample first,
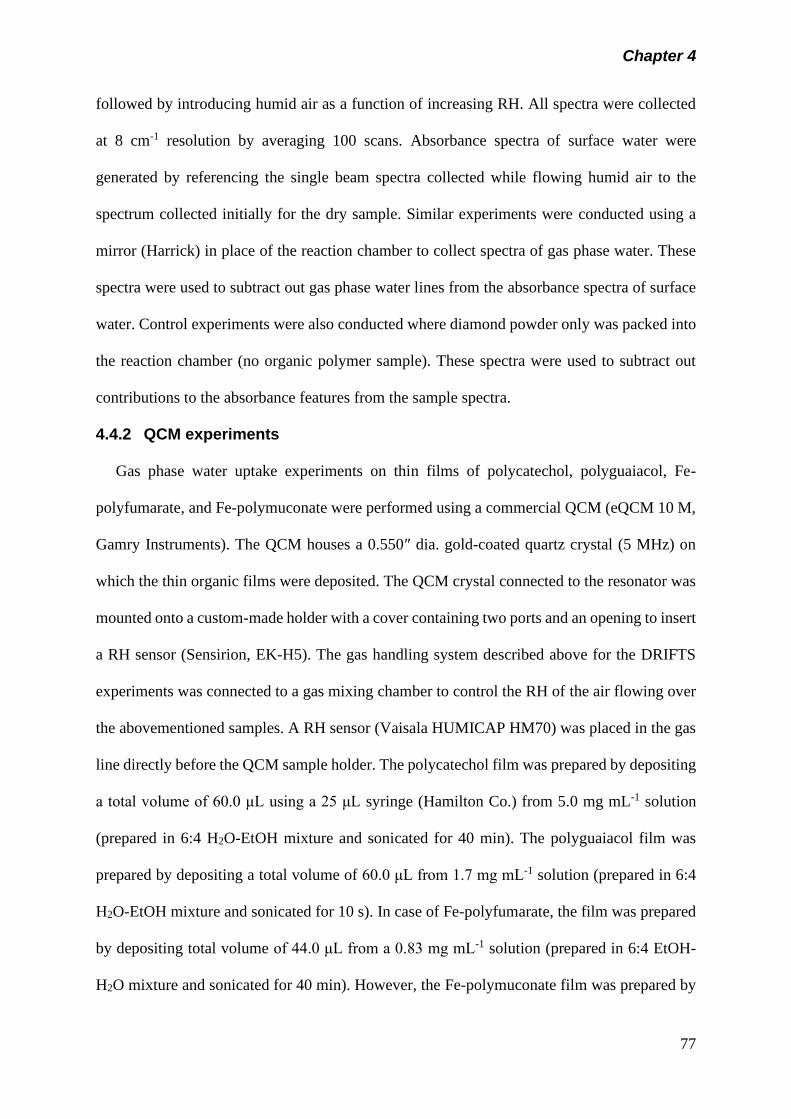
Chapter 4
77
followed by introducing humid air as a function of increasing RH. All spectra were collected
at 8 cm-1 resolution by averaging 100 scans. Absorbance spectra of surface water were
generated by referencing the single beam spectra collected while flowing humid air to the
spectrum collected initially for the dry sample. Similar experiments were conducted using a
mirror (Harrick) in place of the reaction chamber to collect spectra of gas phase water. These
spectra were used to subtract out gas phase water lines from the absorbance spectra of surface
water. Control experiments were also conducted where diamond powder only was packed into
the reaction chamber (no organic polymer sample). These spectra were used to subtract out
contributions to the absorbance features from the sample spectra.
4.4.2 QCM experiments
Gas phase water uptake experiments on thin films of polycatechol, polyguaiacol, Fe-
polyfumarate, and Fe-polymuconate were performed using a commercial QCM (eQCM 10 M,
Gamry Instruments). The QCM houses a 0.550″ dia. gold-coated quartz crystal (5 MHz) on
which the thin organic films were deposited. The QCM crystal connected to the resonator was
mounted onto a custom-made holder with a cover containing two ports and an opening to insert
a RH sensor (Sensirion, EK-H5). The gas handling system described above for the DRIFTS
experiments was connected to a gas mixing chamber to control the RH of the air flowing over
the abovementioned samples. A RH sensor (Vaisala HUMICAP HM70) was placed in the gas
line directly before the QCM sample holder. The polycatechol film was prepared by depositing
a total volume of 60.0 μL using a 25 μL syringe (Hamilton Co.) from 5.0 mg mL-1 solution
(prepared in 6:4 H2O-EtOH mixture and sonicated for 40 min). The polyguaiacol film was
prepared by depositing a total volume of 60.0 μL from 1.7 mg mL-1 solution (prepared in 6:4
H2O-EtOH mixture and sonicated for 10 s). In case of Fe-polyfumarate, the film was prepared
by depositing total volume of 44.0 μL from a 0.83 mg mL-1 solution (prepared in 6:4 EtOH-
H2O mixture and sonicated for 40 min). However, the Fe-polymuconate film was prepared by
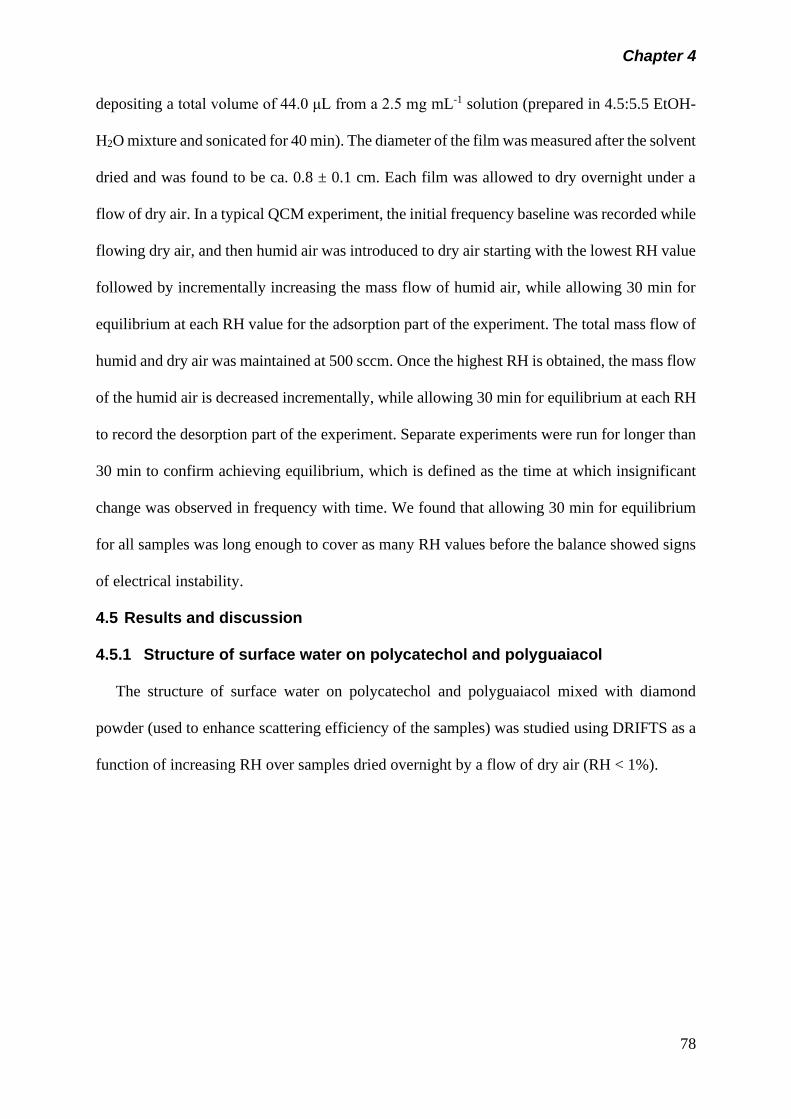
Chapter 4
78
depositing a total volume of 44.0 μL from a 2.5 mg mL-1 solution (prepared in 4.5:5.5 EtOH-
H2O mixture and sonicated for 40 min). The diameter of the film was measured after the solvent
dried and was found to be ca. 0.8 ± 0.1 cm. Each film was allowed to dry overnight under a
flow of dry air. In a typical QCM experiment, the initial frequency baseline was recorded while
flowing dry air, and then humid air was introduced to dry air starting with the lowest RH value
followed by incrementally increasing the mass flow of humid air, while allowing 30 min for
equilibrium at each RH value for the adsorption part of the experiment. The total mass flow of
humid and dry air was maintained at 500 sccm. Once the highest RH is obtained, the mass flow
of the humid air is decreased incrementally, while allowing 30 min for equilibrium at each RH
to record the desorption part of the experiment. Separate experiments were run for longer than
30 min to confirm achieving equilibrium, which is defined as the time at which insignificant
change was observed in frequency with time. We found that allowing 30 min for equilibrium
for all samples was long enough to cover as many RH values before the balance showed signs
of electrical instability.
4.5 Results and discussion
4.5.1 Structure of surface water on polycatechol and polyguaiacol
The structure of surface water on polycatechol and polyguaiacol mixed with diamond
powder (used to enhance scattering efficiency of the samples) was studied using DRIFTS as a
function of increasing RH over samples dried overnight by a flow of dry air (RH < 1%).
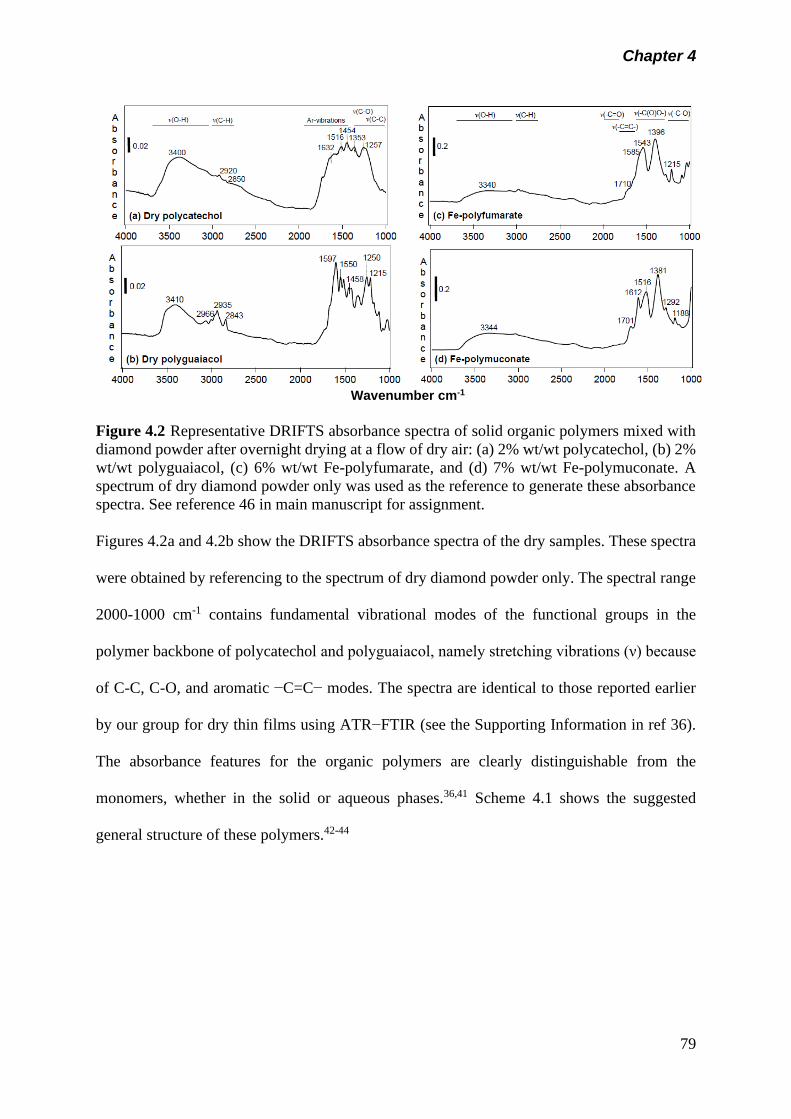
Chapter 4
79
Wavenumber cm-1
Figure 4.2 Representative DRIFTS absorbance spectra of solid organic polymers mixed with
diamond powder after overnight drying at a flow of dry air: (a) 2% wt/wt polycatechol, (b) 2%
wt/wt polyguaiacol, (c) 6% wt/wt Fe-polyfumarate, and (d) 7% wt/wt Fe-polymuconate. A
spectrum of dry diamond powder only was used as the reference to generate these absorbance
spectra. See reference 46 in main manuscript for assignment.
Figures 4.2a and 4.2b show the DRIFTS absorbance spectra of the dry samples. These spectra
were obtained by referencing to the spectrum of dry diamond powder only. The spectral range
2000-1000 cm-1 contains fundamental vibrational modes of the functional groups in the
polymer backbone of polycatechol and polyguaiacol, namely stretching vibrations (ν) because
of C-C, C-O, and aromatic −C=C− modes. The spectra are identical to those reported earlier
by our group for dry thin films using ATR−FTIR (see the Supporting Information in ref 36).
The absorbance features for the organic polymers are clearly distinguishable from the
monomers, whether in the solid or aqueous phases.36,41 Scheme 4.1 shows the suggested
general structure of these polymers.42-44
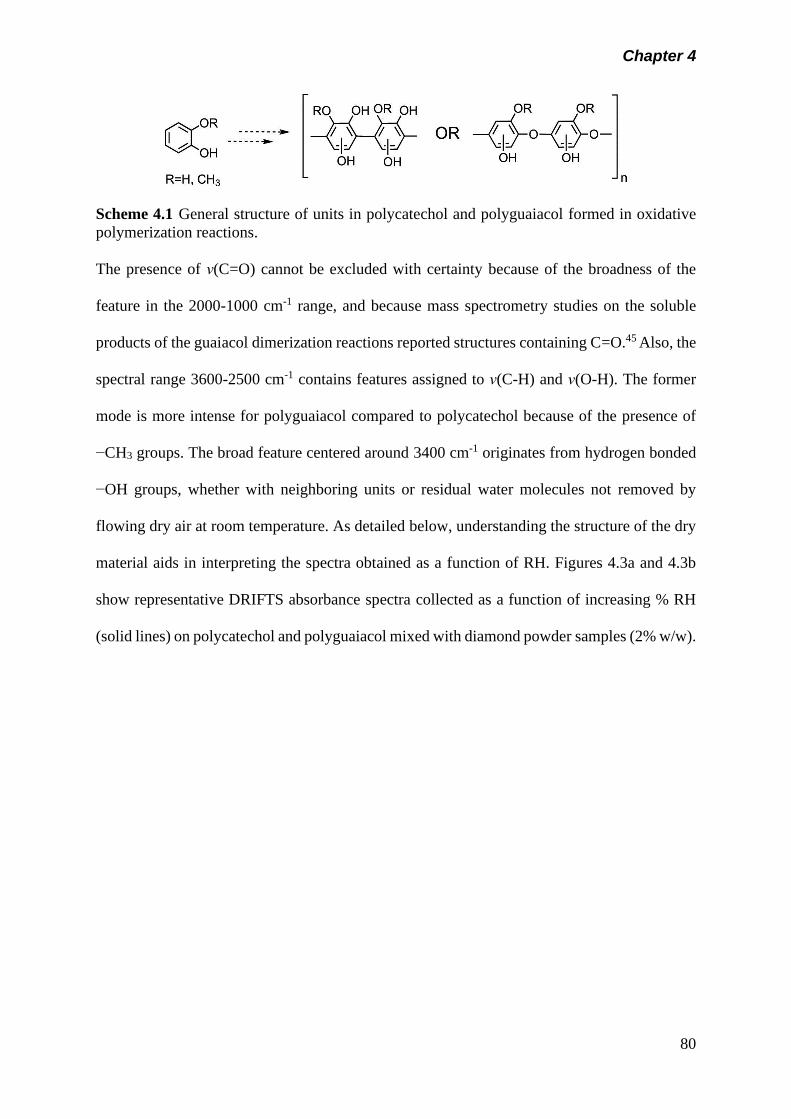
Chapter 4
80
Scheme 4.1 General structure of units in polycatechol and polyguaiacol formed in oxidative
polymerization reactions.
The presence of ν(C=O) cannot be excluded with certainty because of the broadness of the
feature in the 2000-1000 cm-1 range, and because mass spectrometry studies on the soluble
products of the guaiacol dimerization reactions reported structures containing C=O.45 Also, the
spectral range 3600-2500 cm-1 contains features assigned to ν(C-H) and ν(O-H). The former
mode is more intense for polyguaiacol compared to polycatechol because of the presence of
−CH3 groups. The broad feature centered around 3400 cm-1 originates from hydrogen bonded
−OH groups, whether with neighboring units or residual water molecules not removed by
flowing dry air at room temperature. As detailed below, understanding the structure of the dry
material aids in interpreting the spectra obtained as a function of RH. Figures 4.3a and 4.3b
show representative DRIFTS absorbance spectra collected as a function of increasing % RH
(solid lines) on polycatechol and polyguaiacol mixed with diamond powder samples (2% w/w).
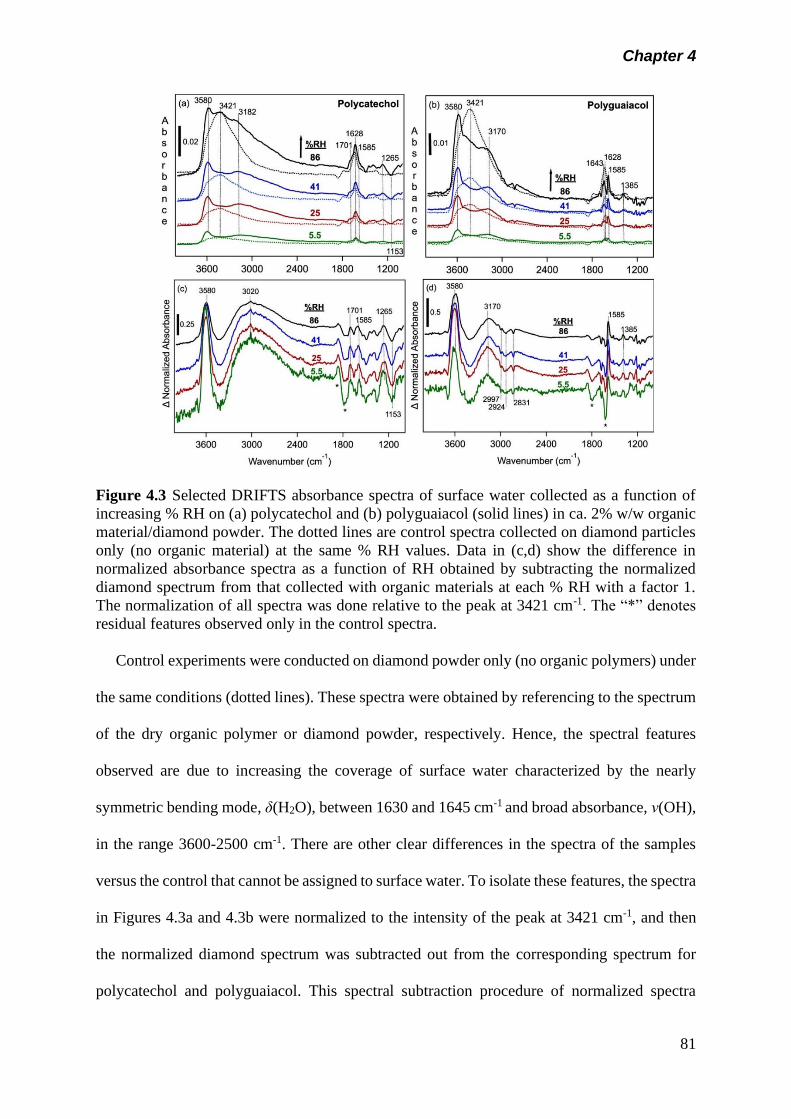
Chapter 4
81
Figure 4.3 Selected DRIFTS absorbance spectra of surface water collected as a function of
increasing % RH on (a) polycatechol and (b) polyguaiacol (solid lines) in ca. 2% w/w organic
material/diamond powder. The dotted lines are control spectra collected on diamond particles
only (no organic material) at the same % RH values. Data in (c,d) show the difference in
normalized absorbance spectra as a function of RH obtained by subtracting the normalized
diamond spectrum from that collected with organic materials at each % RH with a factor 1.
The normalization of all spectra was done relative to the peak at 3421 cm-1. The “*” denotes
residual features observed only in the control spectra.
Control experiments were conducted on diamond powder only (no organic polymers) under
the same conditions (dotted lines). These spectra were obtained by referencing to the spectrum
of the dry organic polymer or diamond powder, respectively. Hence, the spectral features
observed are due to increasing the coverage of surface water characterized by the nearly
symmetric bending mode, δ(H2O), between 1630 and 1645 cm-1 and broad absorbance, ν(OH),
in the range 3600-2500 cm-1. There are other clear differences in the spectra of the samples
versus the control that cannot be assigned to surface water. To isolate these features, the spectra
in Figures 4.3a and 4.3b were normalized to the intensity of the peak at 3421 cm-1, and then
the normalized diamond spectrum was subtracted out from the corresponding spectrum for
polycatechol and polyguaiacol. This spectral subtraction procedure of normalized spectra
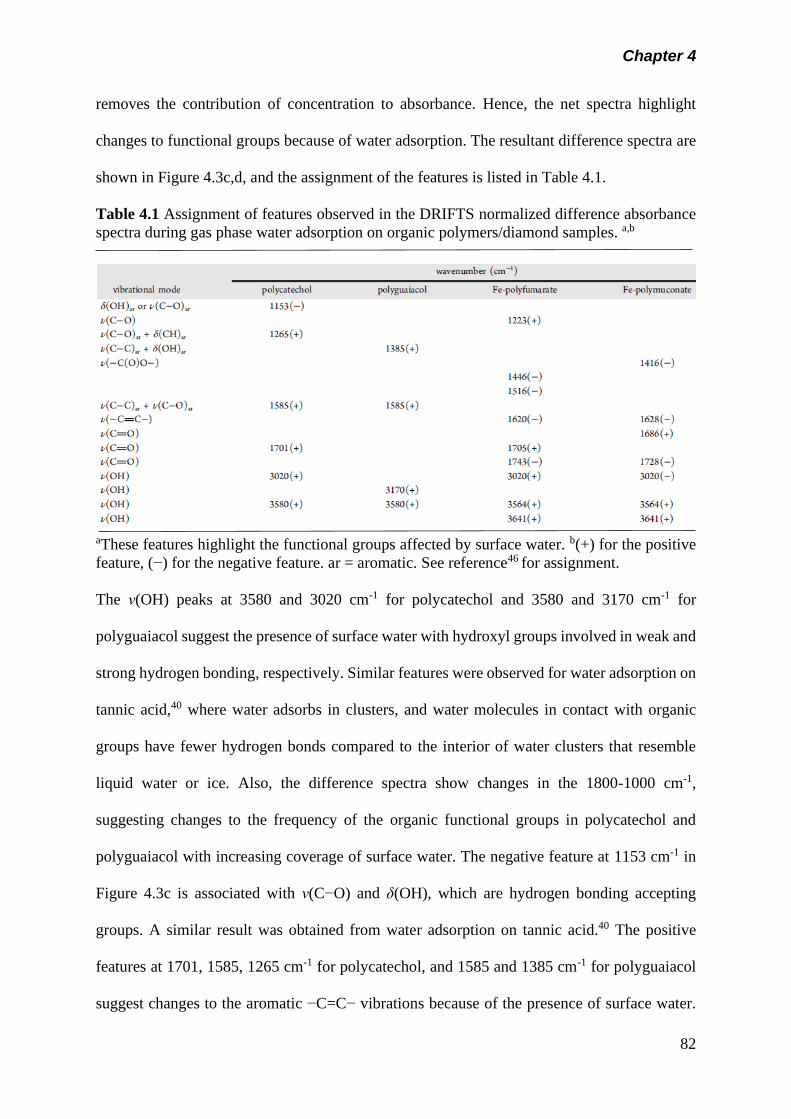
Chapter 4
82
removes the contribution of concentration to absorbance. Hence, the net spectra highlight
changes to functional groups because of water adsorption. The resultant difference spectra are
shown in Figure 4.3c,d, and the assignment of the features is listed in Table 4.1.
Table 4.1 Assignment of features observed in the DRIFTS normalized difference absorbance
spectra during gas phase water adsorption on organic polymers/diamond samples. a,b
aThese features highlight the functional groups affected by surface water. b(+) for the positive
feature, (−) for the negative feature. ar = aromatic. See reference46 for assignment.
The ν(OH) peaks at 3580 and 3020 cm-1 for polycatechol and 3580 and 3170 cm-1 for
polyguaiacol suggest the presence of surface water with hydroxyl groups involved in weak and
strong hydrogen bonding, respectively. Similar features were observed for water adsorption on
tannic acid,40 where water adsorbs in clusters, and water molecules in contact with organic
groups have fewer hydrogen bonds compared to the interior of water clusters that resemble
liquid water or ice. Also, the difference spectra show changes in the 1800-1000 cm-1,
suggesting changes to the frequency of the organic functional groups in polycatechol and
polyguaiacol with increasing coverage of surface water. The negative feature at 1153 cm-1 in
Figure 4.3c is associated with ν(C−O) and δ(OH), which are hydrogen bonding accepting
groups. A similar result was obtained from water adsorption on tannic acid.40 The positive
features at 1701, 1585, 1265 cm-1 for polycatechol, and 1585 and 1385 cm-1 for polyguaiacol
suggest changes to the aromatic −C=C− vibrations because of the presence of surface water.
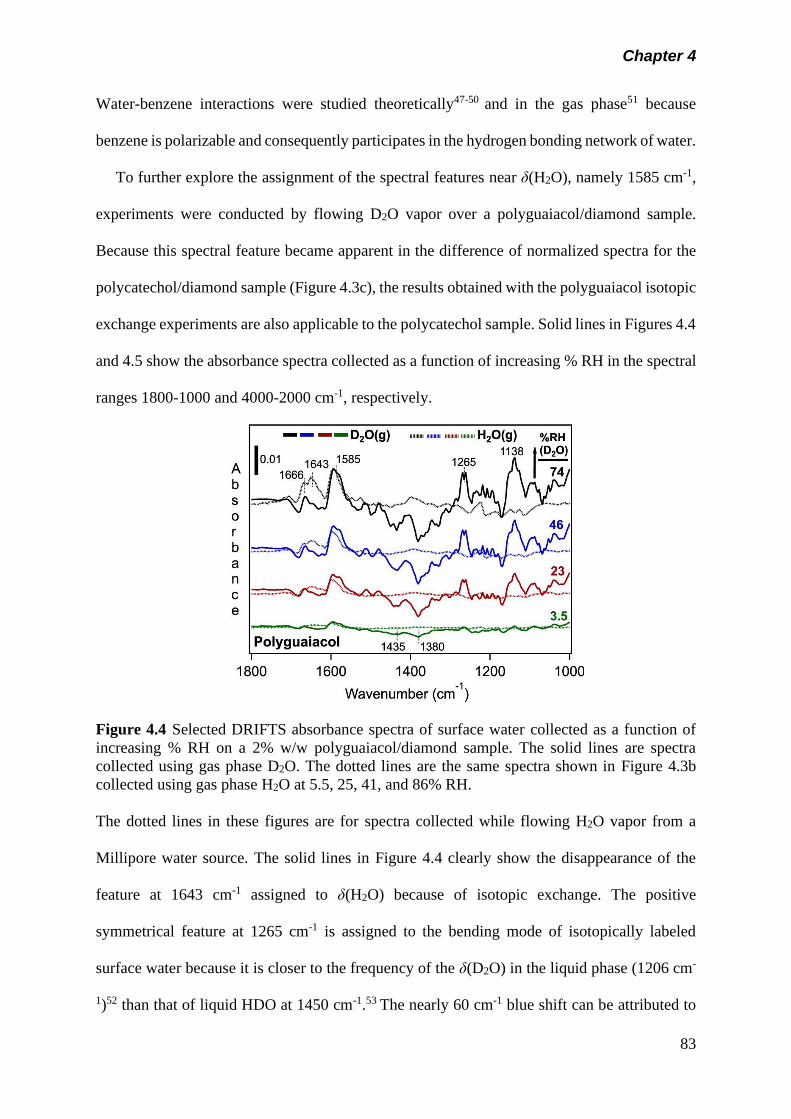
Chapter 4
83
Water-benzene interactions were studied theoretically47-50 and in the gas phase51 because
benzene is polarizable and consequently participates in the hydrogen bonding network of water.
To further explore the assignment of the spectral features near δ(H2O), namely 1585 cm-1,
experiments were conducted by flowing D2O vapor over a polyguaiacol/diamond sample.
Because this spectral feature became apparent in the difference of normalized spectra for the
polycatechol/diamond sample (Figure 4.3c), the results obtained with the polyguaiacol isotopic
exchange experiments are also applicable to the polycatechol sample. Solid lines in Figures 4.4
and 4.5 show the absorbance spectra collected as a function of increasing % RH in the spectral
ranges 1800-1000 and 4000-2000 cm-1, respectively.
Figure 4.4 Selected DRIFTS absorbance spectra of surface water collected as a function of
increasing % RH on a 2% w/w polyguaiacol/diamond sample. The solid lines are spectra
collected using gas phase D2O. The dotted lines are the same spectra shown in Figure 4.3b
collected using gas phase H2O at 5.5, 25, 41, and 86% RH.
The dotted lines in these figures are for spectra collected while flowing H2O vapor from a
Millipore water source. The solid lines in Figure 4.4 clearly show the disappearance of the
feature at 1643 cm-1 assigned to δ(H2O) because of isotopic exchange. The positive
symmetrical feature at 1265 cm-1 is assigned to the bending mode of isotopically labeled
surface water because it is closer to the frequency of the δ(D2O) in the liquid phase (1206 cm-
1)52 than that of liquid HDO at 1450 cm-1.53 The nearly 60 cm-1 blue shift can be attributed to
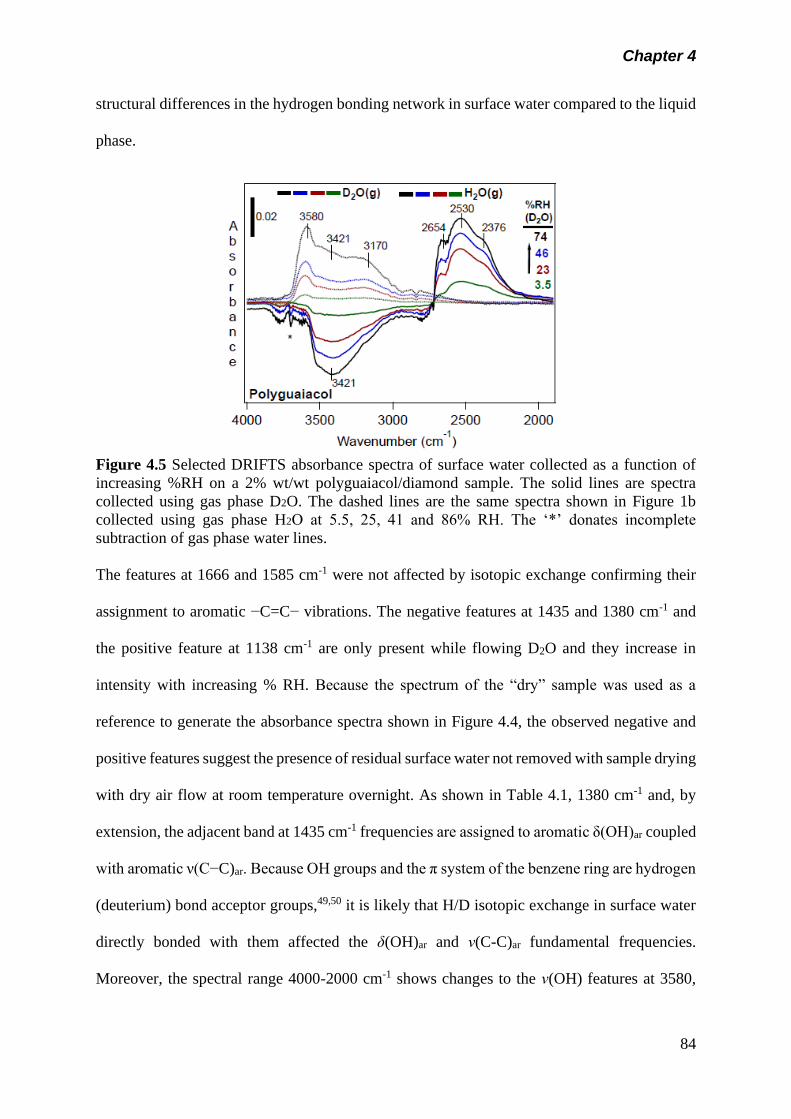
Chapter 4
84
structural differences in the hydrogen bonding network in surface water compared to the liquid
phase.
Figure 4.5 Selected DRIFTS absorbance spectra of surface water collected as a function of
increasing %RH on a 2% wt/wt polyguaiacol/diamond sample. The solid lines are spectra
collected using gas phase D2O. The dashed lines are the same spectra shown in Figure 1b
collected using gas phase H2O at 5.5, 25, 41 and 86% RH. The ‘*’ donates incomplete
subtraction of gas phase water lines.
The features at 1666 and 1585 cm-1 were not affected by isotopic exchange confirming their
assignment to aromatic −C=C− vibrations. The negative features at 1435 and 1380 cm-1 and
the positive feature at 1138 cm-1 are only present while flowing D2O and they increase in
intensity with increasing % RH. Because the spectrum of the “dry” sample was used as a
reference to generate the absorbance spectra shown in Figure 4.4, the observed negative and
positive features suggest the presence of residual surface water not removed with sample drying
with dry air flow at room temperature overnight. As shown in Table 4.1, 1380 cm-1 and, by
extension, the adjacent band at 1435 cm-1 frequencies are assigned to aromatic δ(OH)ar coupled
with aromatic ν(C−C)ar. Because OH groups and the π system of the benzene ring are hydrogen
(deuterium) bond acceptor groups,49,50 it is likely that H/D isotopic exchange in surface water
directly bonded with them affected the δ(OH)ar and ν(C-C)ar fundamental frequencies.
Moreover, the spectral range 4000-2000 cm-1 shows changes to the ν(OH) features at 3580,
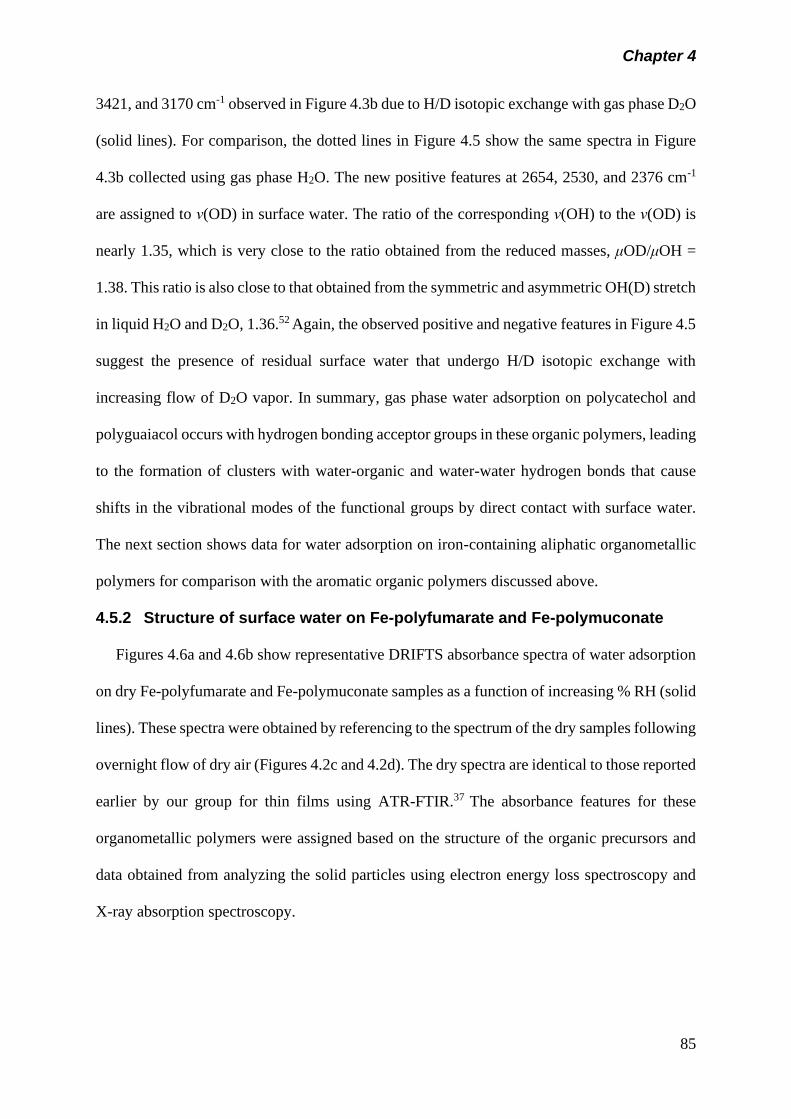
Chapter 4
85
3421, and 3170 cm-1 observed in Figure 4.3b due to H/D isotopic exchange with gas phase D2O
(solid lines). For comparison, the dotted lines in Figure 4.5 show the same spectra in Figure
4.3b collected using gas phase H2O. The new positive features at 2654, 2530, and 2376 cm-1
are assigned to ν(OD) in surface water. The ratio of the corresponding ν(OH) to the ν(OD) is
nearly 1.35, which is very close to the ratio obtained from the reduced masses, μOD/μOH =
1.38. This ratio is also close to that obtained from the symmetric and asymmetric OH(D) stretch
in liquid H2O and D2O, 1.36.52 Again, the observed positive and negative features in Figure 4.5
suggest the presence of residual surface water that undergo H/D isotopic exchange with
increasing flow of D2O vapor. In summary, gas phase water adsorption on polycatechol and
polyguaiacol occurs with hydrogen bonding acceptor groups in these organic polymers, leading
to the formation of clusters with water-organic and water-water hydrogen bonds that cause
shifts in the vibrational modes of the functional groups by direct contact with surface water.
The next section shows data for water adsorption on iron-containing aliphatic organometallic
polymers for comparison with the aromatic organic polymers discussed above.
4.5.2 Structure of surface water on Fe-polyfumarate and Fe-polymuconate
Figures 4.6a and 4.6b show representative DRIFTS absorbance spectra of water adsorption
on dry Fe-polyfumarate and Fe-polymuconate samples as a function of increasing % RH (solid
lines). These spectra were obtained by referencing to the spectrum of the dry samples following
overnight flow of dry air (Figures 4.2c and 4.2d). The dry spectra are identical to those reported
earlier by our group for thin films using ATR-FTIR.37 The absorbance features for these
organometallic polymers were assigned based on the structure of the organic precursors and
data obtained from analyzing the solid particles using electron energy loss spectroscopy and
X-ray absorption spectroscopy.
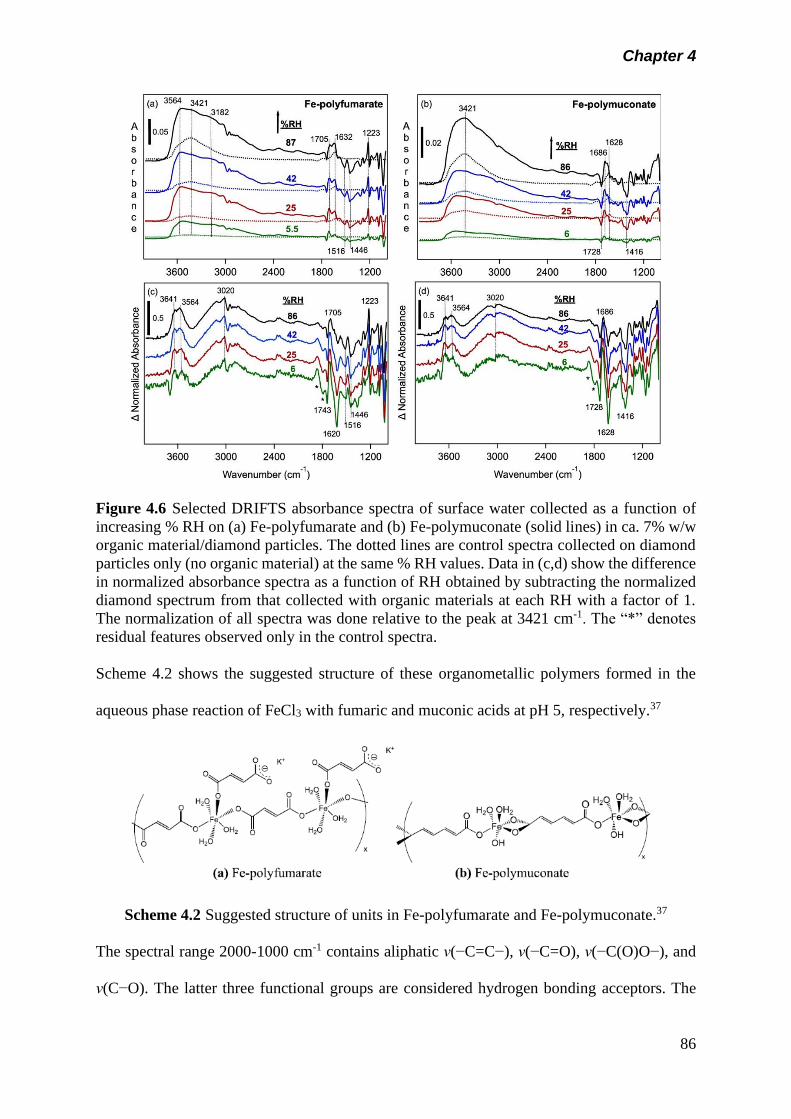
Chapter 4
86
Figure 4.6 Selected DRIFTS absorbance spectra of surface water collected as a function of
increasing % RH on (a) Fe-polyfumarate and (b) Fe-polymuconate (solid lines) in ca. 7% w/w
organic material/diamond particles. The dotted lines are control spectra collected on diamond
particles only (no organic material) at the same % RH values. Data in (c,d) show the difference
in normalized absorbance spectra as a function of RH obtained by subtracting the normalized
diamond spectrum from that collected with organic materials at each RH with a factor of 1.
The normalization of all spectra was done relative to the peak at 3421 cm-1. The “*” denotes
residual features observed only in the control spectra.
Scheme 4.2 shows the suggested structure of these organometallic polymers formed in the
aqueous phase reaction of FeCl3 with fumaric and muconic acids at pH 5, respectively.37
Scheme 4.2 Suggested structure of units in Fe-polyfumarate and Fe-polymuconate.37
The spectral range 2000-1000 cm-1 contains aliphatic ν(−C=C−), ν(−C=O), ν(−C(O)O−), and
ν(C−O). The latter three functional groups are considered hydrogen bonding acceptors. The
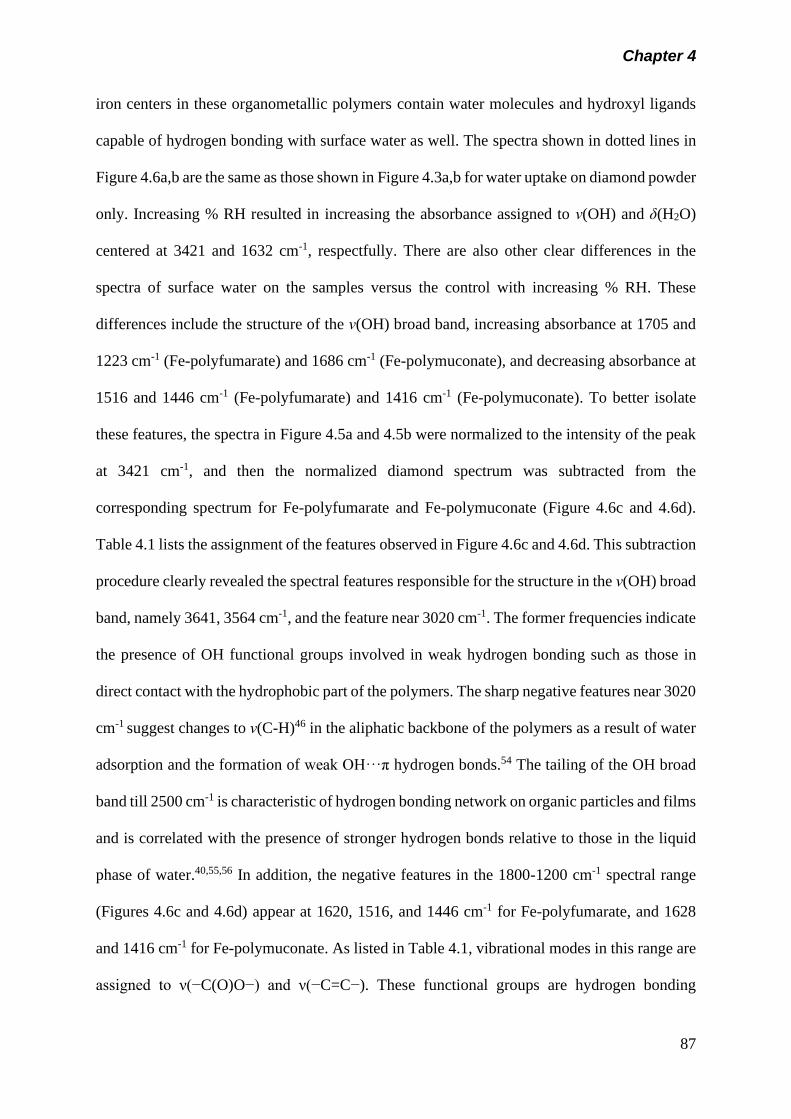
Chapter 4
87
iron centers in these organometallic polymers contain water molecules and hydroxyl ligands
capable of hydrogen bonding with surface water as well. The spectra shown in dotted lines in
Figure 4.6a,b are the same as those shown in Figure 4.3a,b for water uptake on diamond powder
only. Increasing % RH resulted in increasing the absorbance assigned to ν(OH) and δ(H2O)
centered at 3421 and 1632 cm-1, respectfully. There are also other clear differences in the
spectra of surface water on the samples versus the control with increasing % RH. These
differences include the structure of the ν(OH) broad band, increasing absorbance at 1705 and
1223 cm-1 (Fe-polyfumarate) and 1686 cm-1 (Fe-polymuconate), and decreasing absorbance at
1516 and 1446 cm-1 (Fe-polyfumarate) and 1416 cm-1 (Fe-polymuconate). To better isolate
these features, the spectra in Figure 4.5a and 4.5b were normalized to the intensity of the peak
at 3421 cm-1, and then the normalized diamond spectrum was subtracted from the
corresponding spectrum for Fe-polyfumarate and Fe-polymuconate (Figure 4.6c and 4.6d).
Table 4.1 lists the assignment of the features observed in Figure 4.6c and 4.6d. This subtraction
procedure clearly revealed the spectral features responsible for the structure in the ν(OH) broad
band, namely 3641, 3564 cm-1, and the feature near 3020 cm-1. The former frequencies indicate
the presence of OH functional groups involved in weak hydrogen bonding such as those in
direct contact with the hydrophobic part of the polymers. The sharp negative features near 3020
cm-1 suggest changes to ν(C-H)46 in the aliphatic backbone of the polymers as a result of water
adsorption and the formation of weak OH···π hydrogen bonds.54 The tailing of the OH broad
band till 2500 cm-1 is characteristic of hydrogen bonding network on organic particles and films
and is correlated with the presence of stronger hydrogen bonds relative to those in the liquid
phase of water.40,55,56 In addition, the negative features in the 1800-1200 cm-1 spectral range
(Figures 4.6c and 4.6d) appear at 1620, 1516, and 1446 cm-1 for Fe-polyfumarate, and 1628
and 1416 cm-1 for Fe-polymuconate. As listed in Table 4.1, vibrational modes in this range are
assigned to ν(−C(O)O−) and ν(−C=C−). These functional groups are hydrogen bonding
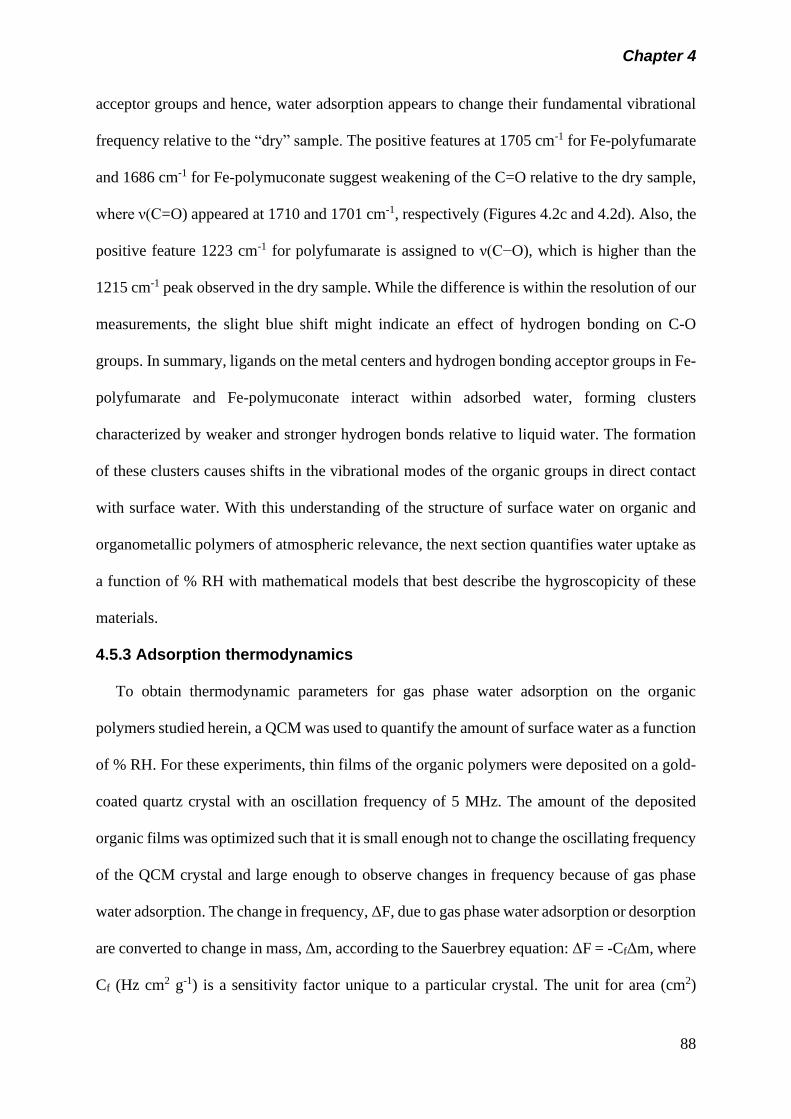
Chapter 4
88
acceptor groups and hence, water adsorption appears to change their fundamental vibrational
frequency relative to the “dry” sample. The positive features at 1705 cm-1 for Fe-polyfumarate
and 1686 cm-1 for Fe-polymuconate suggest weakening of the C=O relative to the dry sample,
where ν(C=O) appeared at 1710 and 1701 cm-1, respectively (Figures 4.2c and 4.2d). Also, the
positive feature 1223 cm-1 for polyfumarate is assigned to ν(C−O), which is higher than the
1215 cm-1 peak observed in the dry sample. While the difference is within the resolution of our
measurements, the slight blue shift might indicate an effect of hydrogen bonding on C-O
groups. In summary, ligands on the metal centers and hydrogen bonding acceptor groups in Fe-
polyfumarate and Fe-polymuconate interact within adsorbed water, forming clusters
characterized by weaker and stronger hydrogen bonds relative to liquid water. The formation
of these clusters causes shifts in the vibrational modes of the organic groups in direct contact
with surface water. With this understanding of the structure of surface water on organic and
organometallic polymers of atmospheric relevance, the next section quantifies water uptake as
a function of % RH with mathematical models that best describe the hygroscopicity of these
materials.
4.5.3 Adsorption thermodynamics
To obtain thermodynamic parameters for gas phase water adsorption on the organic
polymers studied herein, a QCM was used to quantify the amount of surface water as a function
of % RH. For these experiments, thin films of the organic polymers were deposited on a gold-
coated quartz crystal with an oscillation frequency of 5 MHz. The amount of the deposited
organic films was optimized such that it is small enough not to change the oscillating frequency
of the QCM crystal and large enough to observe changes in frequency because of gas phase
water adsorption. The change in frequency, ΔF, due to gas phase water adsorption or desorption
are converted to change in mass, Δm, according to the Sauerbrey equation: ΔF = -CfΔm, where
Cf (Hz cm2 g-1) is a sensitivity factor unique to a particular crystal. The unit for area (cm2)
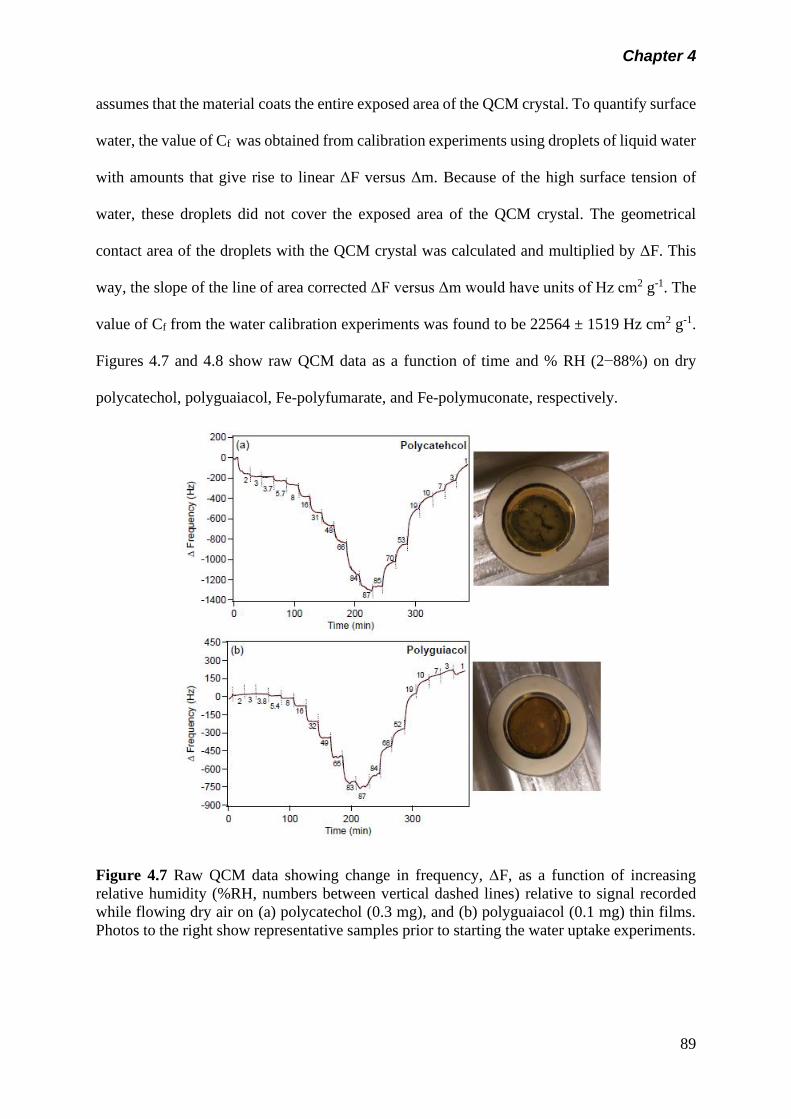
Chapter 4
89
assumes that the material coats the entire exposed area of the QCM crystal. To quantify surface
water, the value of Cf was obtained from calibration experiments using droplets of liquid water
with amounts that give rise to linear ΔF versus Δm. Because of the high surface tension of
water, these droplets did not cover the exposed area of the QCM crystal. The geometrical
contact area of the droplets with the QCM crystal was calculated and multiplied by ΔF. This
way, the slope of the line of area corrected ΔF versus Δm would have units of Hz cm2 g-1. The
value of Cf from the water calibration experiments was found to be 22564 ± 1519 Hz cm2 g-1.
Figures 4.7 and 4.8 show raw QCM data as a function of time and % RH (2−88%) on dry
polycatechol, polyguaiacol, Fe-polyfumarate, and Fe-polymuconate, respectively.
Figure 4.7 Raw QCM data showing change in frequency, F, as a function of increasing
relative humidity (%RH, numbers between vertical dashed lines) relative to signal recorded
while flowing dry air on (a) polycatechol (0.3 mg), and (b) polyguaiacol (0.1 mg) thin films.
Photos to the right show representative samples prior to starting the water uptake experiments.
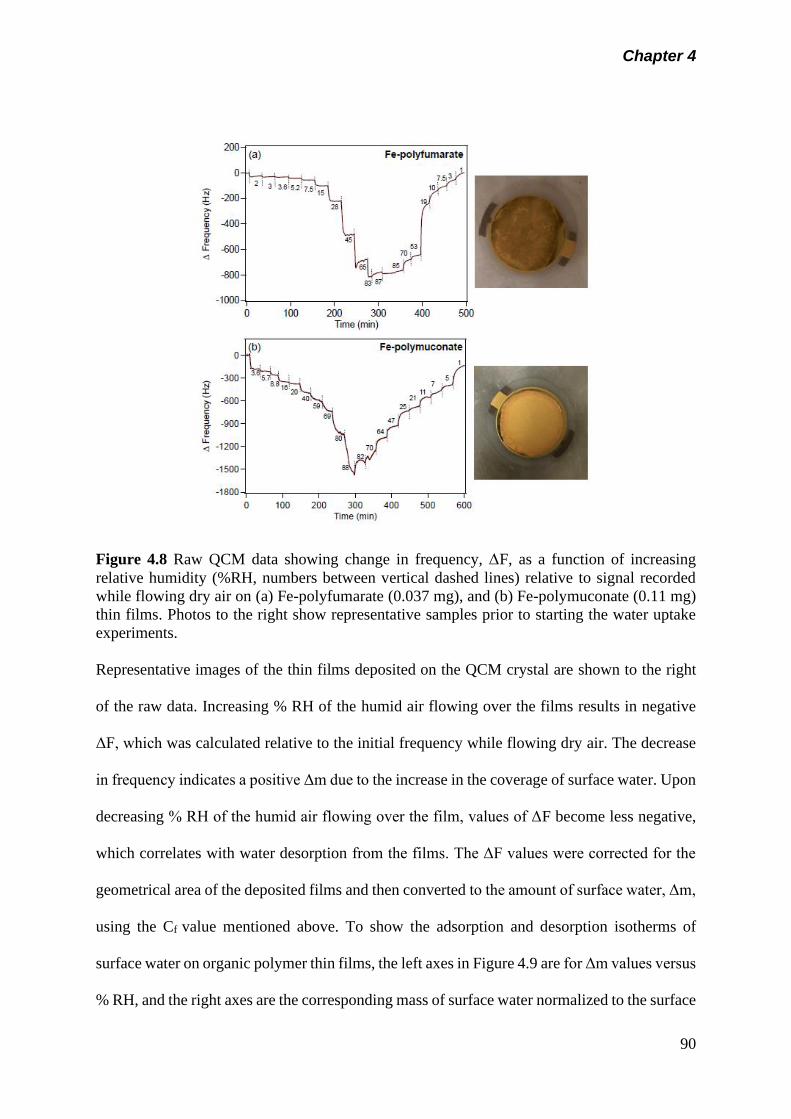
Chapter 4
90
Figure 4.8 Raw QCM data showing change in frequency, F, as a function of increasing
relative humidity (%RH, numbers between vertical dashed lines) relative to signal recorded
while flowing dry air on (a) Fe-polyfumarate (0.037 mg), and (b) Fe-polymuconate (0.11 mg)
thin films. Photos to the right show representative samples prior to starting the water uptake
experiments.
Representative images of the thin films deposited on the QCM crystal are shown to the right
of the raw data. Increasing % RH of the humid air flowing over the films results in negative
ΔF, which was calculated relative to the initial frequency while flowing dry air. The decrease
in frequency indicates a positive Δm due to the increase in the coverage of surface water. Upon
decreasing % RH of the humid air flowing over the film, values of ΔF become less negative,
which correlates with water desorption from the films. The ΔF values were corrected for the
geometrical area of the deposited films and then converted to the amount of surface water, Δm,
using the Cf value mentioned above. To show the adsorption and desorption isotherms of
surface water on organic polymer thin films, the left axes in Figure 4.9 are for Δm values versus
% RH, and the right axes are the corresponding mass of surface water normalized to the surface
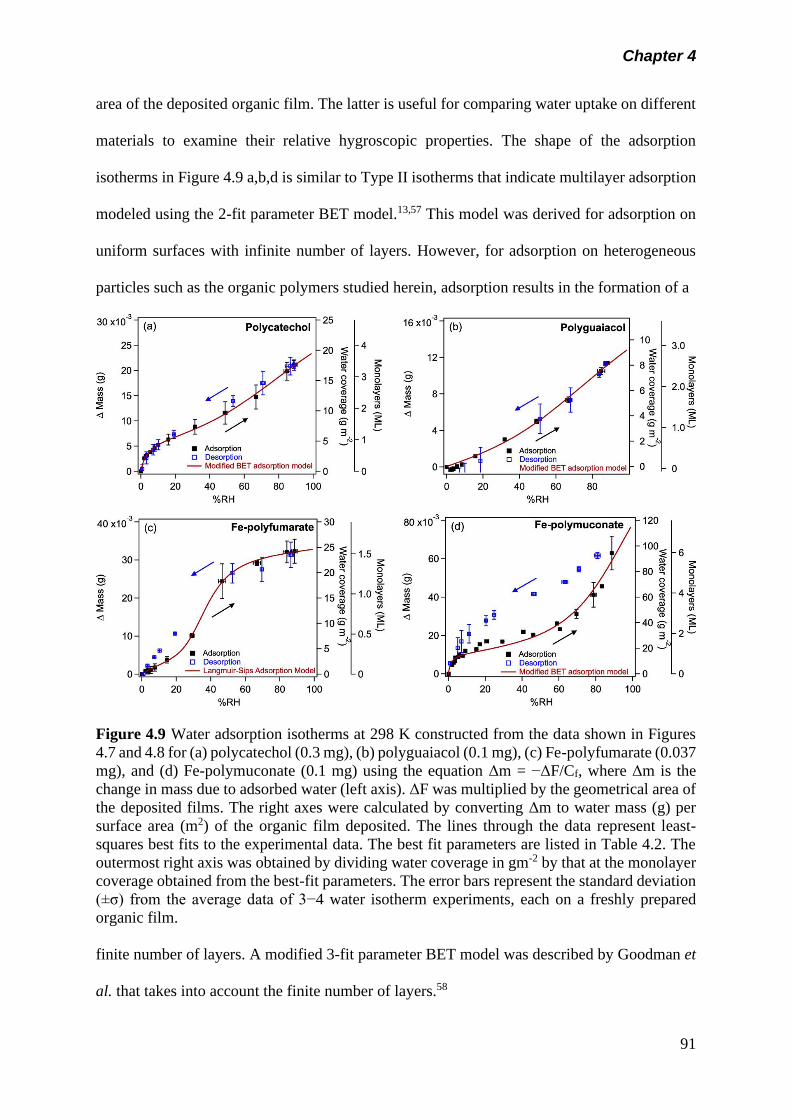
Chapter 4
91
area of the deposited organic film. The latter is useful for comparing water uptake on different
materials to examine their relative hygroscopic properties. The shape of the adsorption
isotherms in Figure 4.9 a,b,d is similar to Type II isotherms that indicate multilayer adsorption
modeled using the 2-fit parameter BET model.13,57 This model was derived for adsorption on
uniform surfaces with infinite number of layers. However, for adsorption on heterogeneous
particles such as the organic polymers studied herein, adsorption results in the formation of a
Figure 4.9 Water adsorption isotherms at 298 K constructed from the data shown in Figures
4.7 and 4.8 for (a) polycatechol (0.3 mg), (b) polyguaiacol (0.1 mg), (c) Fe-polyfumarate (0.037
mg), and (d) Fe-polymuconate (0.1 mg) using the equation Δm = −ΔF/Cf, where Δm is the
change in mass due to adsorbed water (left axis). ΔF was multiplied by the geometrical area of
the deposited films. The right axes were calculated by converting Δm to water mass (g) per
surface area (m2) of the organic film deposited. The lines through the data represent least-
squares best fits to the experimental data. The best fit parameters are listed in Table 4.2. The
outermost right axis was obtained by dividing water coverage in gm-2 by that at the monolayer
coverage obtained from the best-fit parameters. The error bars represent the standard deviation
(±σ) from the average data of 3−4 water isotherm experiments, each on a freshly prepared
organic film.
finite number of layers. A modified 3-fit parameter BET model was described by Goodman et
al. that takes into account the finite number of layers.58

Chapter 4
92
………….. 4.1
where m is the surface coverage of water (gm-2), mML is the monolayer surface coverage of
water (gm-2), c is a unitless temperature-dependent constant related to the enthalpies of
adsorption of the first, ΔH1°, and subsequent layers (expressed as the standard enthalpy for
water vapor condensation, ΔHcond° = -44 kJ mol-1), c = exp(-[ΔH1
° − ΔHcond° ]/RT), and n is a
unitless fitting parameter that represents the maximum number of layers of adsorbed species
and is related to the pore size and properties of the adsorbent, R is the gas constant and T is
temperature in K. The best fit parameters using the modified BET adsorption model to the data
shown in Figure 4.9 a,b,d are listed in Table 4.2. The outermost right axis in these figures shows
water coverage in monolayers calculated relative to mML obtained from the fits.
Table 4.2 Best Fit Parameters for Gas Phase Water Adsorption on Polymeric Organic Films at
298 K Shown in Figure 4.9a
asat = saturation surface coverage.
The trend in the values of the best-fit parameters: mML, n, and c for water adsorption of
polycatechol, polyguaiacol, and Fe-polymuconate reflects their affinity to water based on their
chemical structure. Both polycatechol and polyguaiacol are more hydrophobic than Fe-
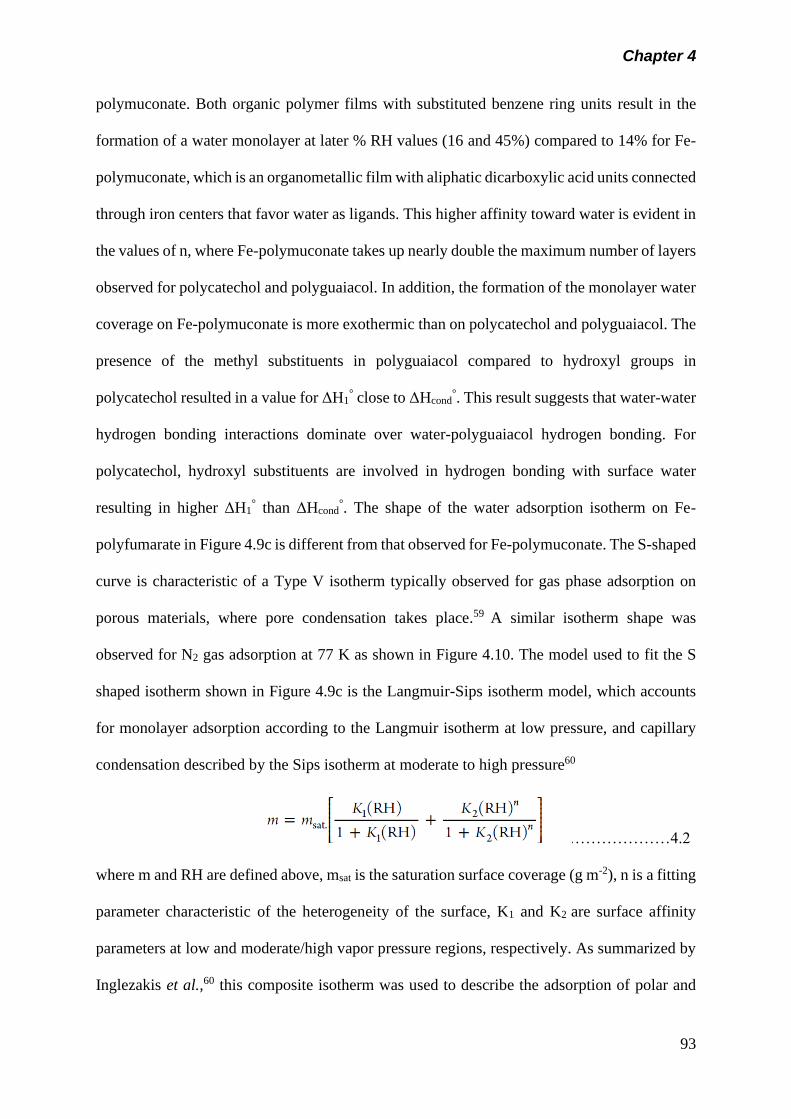
Chapter 4
93
polymuconate. Both organic polymer films with substituted benzene ring units result in the
formation of a water monolayer at later % RH values (16 and 45%) compared to 14% for Fe-
polymuconate, which is an organometallic film with aliphatic dicarboxylic acid units connected
through iron centers that favor water as ligands. This higher affinity toward water is evident in
the values of n, where Fe-polymuconate takes up nearly double the maximum number of layers
observed for polycatechol and polyguaiacol. In addition, the formation of the monolayer water
coverage on Fe-polymuconate is more exothermic than on polycatechol and polyguaiacol. The
presence of the methyl substituents in polyguaiacol compared to hydroxyl groups in
polycatechol resulted in a value for ΔH1° close to ΔHcond
°. This result suggests that water-water
hydrogen bonding interactions dominate over water-polyguaiacol hydrogen bonding. For
polycatechol, hydroxyl substituents are involved in hydrogen bonding with surface water
resulting in higher ΔH1° than ΔHcond
°. The shape of the water adsorption isotherm on Fe-
polyfumarate in Figure 4.9c is different from that observed for Fe-polymuconate. The S-shaped
curve is characteristic of a Type V isotherm typically observed for gas phase adsorption on
porous materials, where pore condensation takes place.59 A similar isotherm shape was
observed for N2 gas adsorption at 77 K as shown in Figure 4.10. The model used to fit the S
shaped isotherm shown in Figure 4.9c is the Langmuir-Sips isotherm model, which accounts
for monolayer adsorption according to the Langmuir isotherm at low pressure, and capillary
condensation described by the Sips isotherm at moderate to high pressure60
…………………4.2
where m and RH are defined above, msat is the saturation surface coverage (g m-2), n is a fitting
parameter characteristic of the heterogeneity of the surface, K1 and K2 are surface affinity
parameters at low and moderate/high vapor pressure regions, respectively. As summarized by
Inglezakis et al.,60 this composite isotherm was used to describe the adsorption of polar and
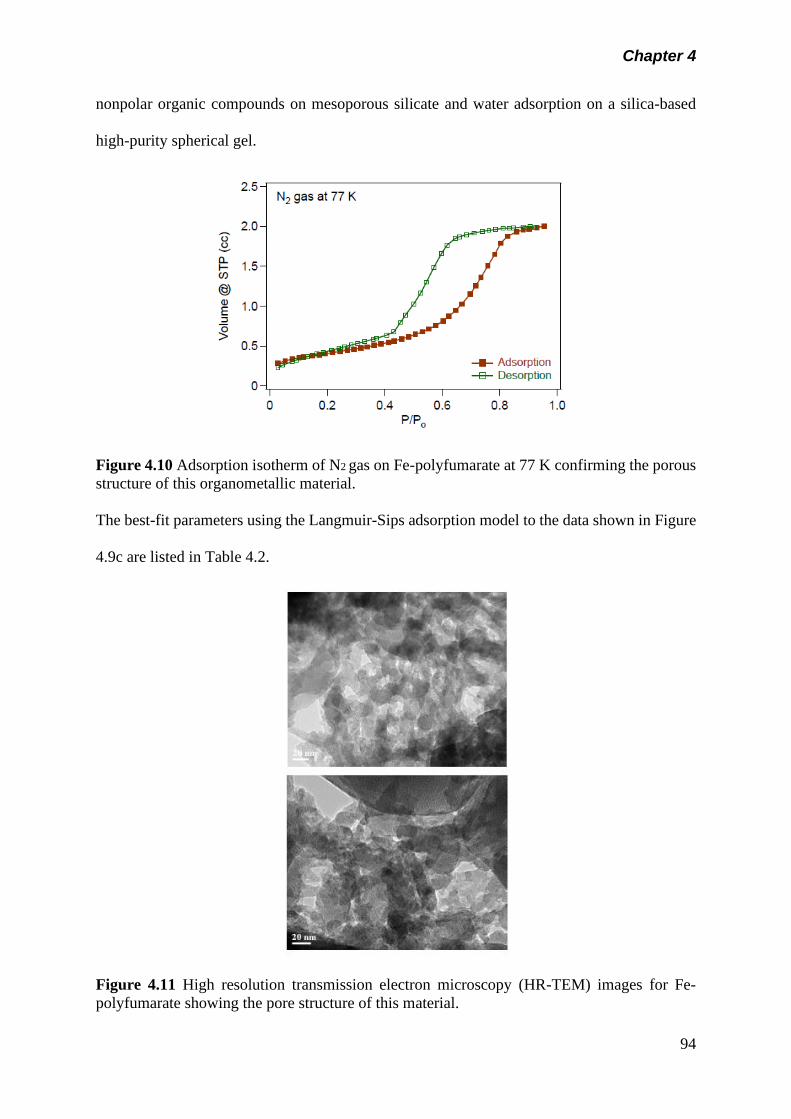
Chapter 4
94
nonpolar organic compounds on mesoporous silicate and water adsorption on a silica-based
high-purity spherical gel.
Figure 4.10 Adsorption isotherm of N2 gas on Fe-polyfumarate at 77 K confirming the porous
structure of this organometallic material.
The best-fit parameters using the Langmuir-Sips adsorption model to the data shown in Figure
4.9c are listed in Table 4.2.
Figure 4.11 High resolution transmission electron microscopy (HR-TEM) images for Fe-
polyfumarate showing the pore structure of this material.
Chapter 4
95
The outermost right axis in this figure shows water coverage in monolayers calculated relative
to msat., obtained from the fit. The S-shaped isotherm is a direct consequence of the porous
structure of Fe-polyfumarate, which is apparent in the high-resolution transmission electron
microscopy images shown in Figure 4.11. The value msat. (corresponding to 1 ML) occurred at
43% RH indicating complete condensation of water in the pores. The values of K1 and K2
suggest that water−water interactions due to condensation in the pores at moderate to high %
RH are more favorable than water-polyfumarate interactions at low % RH. Also shown in
Figure 4.9 is the extent of water desorption as a result of decreasing % RH from the highest
value reached during adsorption. Within the uncertainty and over the time frame of the
measurements, there is no hysteresis observed in the case of polycatechol and polyguaiacol
because of weak adsorbate-adsorbent and adsorbate-adsorbate interactions. The Fe-
polyfumarate sample shows no hysteresis above 50% RH, and water retention at RH values
below 40% RH. The largest hysteresis is observed in the case of Fe-polymuconate, where at
30% RH, for example, the sample contains nearly double the amount of water in the desorption
part relative to the adsorption part of the experiment. This suggests that the desorption kinetics
are slower than adsorption kinetics over the 30 min allowed for equilibrium at % RH. Such
behavior would have consequences on the chemical and physical properties of aerosols
containing organometallic polymers.
4.6 Conclusion
In this study, the hygroscopic properties of organic and organometallic polymeric particles
formed in iron catalyzed reactions with aromatic and aliphatic dicarboxylic acid compounds
detected in field-collected SOA, were investigated. The structure of surface water was studied
using DRIFTS revealed that water bonding with organic functional groups acting as hydrogen
bond acceptors caused shifts in their vibrational modes. There was also evidence for weak and
strong hydrogen bonding networks that suggest cluster formation with water-water and water-
Chapter 4
96
organics interactions, respectively. In addition, gas phase water adsorption and desorption
isotherms collected as a function of RH was best modeled using a modified Type II multilayer
BET adsorption model on nonporous materials, namely polycatechol, polyguaiacol, and Fe-
polymuconate. Water adsorption on porous Fe-polyfumarate was best described using a Type
V adsorption model, namely the Langmuir-Sips model that accounts for condensation in pores.
The results presented herein are significant because global climate models25 need better
parametrization of the hygroscopic properties and chemical reactivity of SOA. Of the organic
and organometallic polymeric particles studied here, the shape of the adsorption isotherm of
water on polyguaiacol is similar to particle growth factor curves (ranging from 1.1 to 1.2)
obtained for SOA formed by oxidation of cycloalkenes, monoterpenes, and sesquiterpenes.61
Gas phase water adsorption isotherms on the other polymers, polycatechol and Fe-
polymuconate, show that they have higher affinity for water, particularly below 20% RH
relative to other SOA. The hygroscopic behavior of Fe-polyfumarate is the most unique given
its porous structure, and the shape of the adsorption isotherm has not been observed before for
atmospheric aerosols. This adsorption isotherm resembles those obtained from water uptake on
metal-organic frameworks owing to their extensive network of pores.62 As mentioned in the
introduction, water structure and hygroscopic properties are the first step to understanding the
surface chemistry of atmospheric aerosols. The organic polymers studied have chemical
structures (unsaturated bonds, benzene rings, iron centers) that cause their light absorbing
properties to appear in the UV-visible region. The fact that these materials can adsorb water
even at low % RH suggests that water will play a role in their photo reactivity and electron
transfer processes, whether at the surface or in the pores as in the case of Fe-polyfumarate.
Hence, these reactions will impact their aging, atmospheric residence time, and impact on gas
phase composition.
Chapter 4
97
4.7 References
(1) Fairbrother, H.; Geiger, F. M.; Grassian, V. H.; Hemminger, J. C. Physical chemistry of
environmental interfaces. J. Phys. Chem. C 2009, 113, 2035.
(2) Signorell, R.; Bertram, A. K. Physical chemistry of aerosols. Phys. Chem. Chem. Phys.
2009, 11, 7741-8104.
(3) Finlayson-Pitts, B. J. Reactions at surfaces in the atmosphere: Integration of experiments
and theory as necessary (but not necessarily sufficient) for predicting the physical
chemistry of aerosols. Phys. Chem. Chem. Phys. 2009, 11, 7760-7779.
(4) Jeffrey, G. An introduction to hydrogen bonding; Oxford University Press: New York,
1997.
(5) Allen, H. C.; Casillas-Ituarte, N. N.; Sierra-Hernandez, M. R.; Chen, X.; Tang, C. Y.
Shedding light on water structure at air-aqueous interfaces: Ions, lipids, and hydration.
Phys. Chem. Chem. Phys. 2009, 11, 5538-5549.
(6) Hore, D. K.; Walker, D. S.; Richmond, G. L. Water at hydrophobic surfaces: When
weaker is better. J. Am. Chem. Soc. 2008, 130, 1800-1801.
(7) Moussa, S. G.; McIntire, T. M.; Szori, M.; Roeselova, M.; Tobias, D. J.; Grimm, R. L.;
Hemminger, J. C.; Finlayson-Pitts, B. J. Experimental and Theoretical Characterization
of Adsorbed Water on Self-Assembled Monolayers: Understanding the Interaction of
Water with Atmospherically Relevant Surfaces. J. Phys. Chem. A 2009, 113, 2060-2069.
(8) Nissenson, P.; Dabdub, D.; Das, R.; Maurino, V.; Minero, C.; Vione, D. Evidence of the
water-cage effect on the photolysis of NO3- and FeOH2
+. Implications of this effect and
of H2O2 surface accumulation on photochemistry at the air-water interface of
atmospheric droplets. Atmos. Environ. 2010, 44, 4859-4866.
(9) Kameel, F. R.; Riboni, F.; Hoffmann, M. R.; Enami, S.; Colussi, A. J. Fenton oxidation
of gaseous isoprene on aqueous surfaces. J. Phys. Chem. C 2014, 118, 29151-29158.
Chapter 4
98
(10) Nissenson, P.; Knox, C. J. H.; Finlayson-Pitts, B. J.; Phillips, L. F.; Dabdub, D.
Enhanced photolysis in aerosols: Evidence for important surface effects. Phys. Chem.
Chem. Phys. 2006, 8, 4700-4710.
(11) Rubasinghege, G.; Grassian, V. H. Role(s) of adsorbed water in the surface chemistry
of environmental interfaces. Chem. Commun. 2013, 49, 3071-3094.
(12) Trainic, M.; Abo Riziq, A.; Lavi, A.; Rudich, Y. Role of Interfacial Water in the
Heterogeneous Uptake of Glyoxal by Mixed Glycine and Ammonium Sulfate Aerosols.
J. Phys. Chem. A 2012, 116, 5948−5957.
(13) Tang, M.; Cziczo, D. J.; Grassian, V. H. Interactions of water with mineral dust aerosol:
Water adsorption, hygroscopicity, cloud condensation, and ice nucleation. Chem. Rev.
2016, 116, 4205−4259.
(14) Ibrahim, S.; Romanias, M. N.; Alleman, L. Y.; Zeineddine, M. N.; Angeli, G. K.;
Trikalitis, P. N.; Thevenet, F. Water interaction with mineral dust aerosol: Particle size
and hygroscopic properties of dust. ACS Earth Space Chem. 2018, 2, 376-386.
(15) Kuwata, M.; Martin, S. T. Phase of atmospheric secondary organic material affects its
reactivity. Proc. Natl. Acad. Sci. U.S.A. 2012, 109, 17354-17359.
(16) Shiraiwa, M.; Ammann, M.; Koop, T.; Poschl, U. Gas uptake and chemical aging of
semisolid organic aerosol particles. Proc. Natl. Acad. Sci. U.S.A. 2011, 108, 11003-
11008.
(17) Nguyen, T. K. V.; Zhang, Q.; Jimenez, J. L.; Pike, M.; Carlton, A. G. Liquid water:
Ubiquitous contributor to aerosol mass. Environ. Sci. Technol. Lett. 2016, 3, 257-263.
(18) Guo, H.; Xu, L.; Bougiatioti, A.; Cerully, K. M.; Capps, S. L.; Hite, J. R.; Carlton, A.
G.; Lee, S.-H.; Bergin, M. H.; Ng, N. L.; Nenes, A.; Weber, R. J. Fine-particle water
and pH in the southeastern united states. Atmos. Chem. Phys. 2015, 15, 5211-5228.
Chapter 4
99
(19) Freedman, M. A. Phase separation in organic aerosol. Chem. Soc. Rev. 2017, 46, 7694-
7705.
(20) Song, M.; Marcolli, C.; Krieger, U. K.; Lienhard, D. M.; Peter, T. Morphologies of
mixed organic/inorganic/aqueous aerosol droplets. Faraday Discuss. 2013, 165, 289-
316.
(21) Zhang, R.; Khalizov, A.; Wang, L.; Hu, M.; Xu, W. Nucleation and growth of
nanoparticles in the atmosphere. Chem. Rev. 2012, 112, 1957-2011.
(22) Poschl, U. Atmospheric Aerosols: Composition, Transformation, Climate and Health
Effects. Angew. Chem. 2005, 44, 7520-7540.
(23) Farmer, D. K.; Cappa, C. D.; Kreidenweis, S. M. Atmospheric processes and their
controlling influence on cloud condensation nuclei activity. Chem. Rev. 2015, 115,
4199-4217.
(24) Ziemann, P. J.; Atkinson, R. Kinetics, products, and mechanisms of secondary organic
aerosol formation. Chem. Soc. Rev. 2012, 41, 6582-6605.
(25) Kanakidou, M.; Seinfeld, J. H.; Pandis, S. N.; Barnes, I.; Dentener, F. J.; Facchini, M.
C.; Van Dingenen, R.; Ervens, B.; Nenes, A.; Nielsen, C. J.; et al. Organic aerosol and
global climate modelling: A review. Atmos. Chem. Phys. 2005, 5, 1053-1123.
(26) Swietlicki, A.; Laskin, J.; Nizkorodov, S. A. Chemistry of atmospheric brown carbon.
Chem. Rev. 2015, 115, 4335-4382.
(27) Al-Abadleh, H. A. Review of the bulk and surface chemistry of iron in atmospherically
relevant systems containing humic-like substances. RSC Adv. 2015, 5, 45785−45811.
(28) Ito, A. Atmospheric processing of combustion aerosols as a source of bioavailable iron.
Environ. Sci. Technol. Lett. 2015, 2, 70-75.
(29) Oakes, M.; Weber, R. J.; Lai, B.; Russell, A.; Ingall, E. D. Characterization of iron
speciation in urban and rural single particles using xanes spectroscopy and micro x-ray
Chapter 4
100
fluorescence measurements: Investigating the relationship between speciation and
fractional iron solubility. Atmos. Chem. Phys. 2012, 12, 745-756.
(30) Ault, A. P.; Peters, T. M.; Sawvel, E. J.; Casuccio, G. S.; Willis, R. D.; Norris, G. A.;
Grassian, V. H. Single-particle sem-edx analysis of iron-containing coarse particulate
matter in an urban environment: Sources and distribution of iron within Cleveland, Ohio.
Environ. Sci. Technol. 2012, 46, 4331−4339.
(31) Guasco, T. L.; Cuadra-Rodriguez, L. A.; Pedler, B. E.; Ault, A. P.; Collins, D. B.; Zhao,
D.; Kim, M. J.; Ruppel, M. J.; Wilson, S. C.; Pomeroy, R. S.; Grassian, V. H.; Azam,
F.; Bertram, T. H.; Prather, K. A. Transition metal associations with primary biological
particles in sea spray aerosol generated in a wave channel. Environ. Sci. Technol. 2014,
48, 1324-1333.
(32) Li, W.; Shao, L.; Shi, Z.; Chen, J.; Yang, L.; Yuan, Q.; Yan, C.; Zhang, X.; Wang, Y.;
Sun, J.; Zhang, Y.; Shen, X.; Wang, Z.; Wang, W. Mixing state and hygroscopicity of
dust and haze particles before leaving asian continent. J. Geophys. Res.: Atmos. 2014,
119, 1044-1059.
(33) Wang, V. H. L.; Edwards, R.; Bowie, A. R.; Keywood, M.; Williams, A. G.; Chambers,
S. D.; Selleck, P. W.; Desservettaz, M.; Mallet, M. D.; Paton-Walsh, C. Dry season
aerosol iron solubility in tropical northern australia. Atmos. Chem. Phys. 2016, 16,
12829-12848.
(34) Shi, Z.; Krom, M. D.; Jickells, T. D.; Bonneville, S.; Carslaw, K. S.; Mihalopoulos, N.;
Baker, A. R.; Benning, L. G. Impacts on iron solubility in the mineral dust by processes
in the source region and the atmosphere: A review. Aeolian Res. 2012, 5, 21-42.
(35) Shi, Z.; Krom, M. D.; Bonneville, S.; Benning, L. G. Atmospheric processing outside
clouds increases soluble iron in mineral dust. Environ. Sci. Technol. 2015, 49, 1472-
1477.
Chapter 4
101
(36) Slikboer, S.; Grandy, L.; Blair, S. L.; Nizkorodov, S. A.; Smith, R. W.; Al-Abadleh, H.
A. Formation of light absorbing soluble secondary organics and insoluble polymeric
particles from the dark reaction of catechol and guaiacol with Fe(III). Environ. Sci.
Technol. 2015, 49, 7793-7801.
(37) Tran, A.; Williams, G.; Younus, S.; Ali, N. N.; Blair, S. L.; Nizkorodov, S. A.; Al-
Abadleh, H. A. Efficient formation of lightabsorbing polymeric nanoparticles from the
reaction of soluble Fe(III) with C4 and C6 dicarboxylic acids. Environ. Sci. Technol.
2017, 51, 9700-9708.
(38) Ofner, J.; Kruger, H.-U.; Grothe, H.; Schmitt-Kopplin, P.; Whitmore, K.; Zetzsch, C.
Physico-chemical characterization of SOA derived from catechol and guaiacol - a model
substance for the aromatic fraction of atmospheric HULIS. Atmos. Chem. Phys. 2011,
11, 1−15.
(39) Cowen, S. Heterogeneous photodegradation of tannic acid studied by diffuse reflectance
FTIR. MSc Thesis, University of Guelph, Guelph, ON, Canada, 2009.
(40) Cowen, S.; Al-Abadleh, H. A. DRIFTS studies on the photodegradation of tannic acid
as a model for HULIS in atmospheric aerosols. Phys. Chem. Chem. Phys. 2009, 11,
7838-7847.
(41) Tofan-Lazar, J.; Situm, A.; Al-Abadleh, H. A. DRIFTS studies on the role of surface
water in stabilizing catechol-iron(III) complexes at the gas/solid interface. J. Phys.
Chem. A 2013, 117, 10368-10380.
(42) Kobayashi, S.; Makino, A. Enzymatic polymer synthesis: An opportunity for green
polymer chemistry. Chem. Rev. 2009, 109, 5288-5353.
(43) Faure, E.; Falentin-Daudre, C.; Jerome, C.; Lyskawa, J.; Fournier, D.; Woisel, P.;
Detrembleur, C. Catechols as versatile platforms in polymer chemistry. Prog. Polym.
Sci. 2013, 38, 236-270.
Chapter 4
102
(44) Dubey, S.; Singh, D.; Misra, R. A. Enzymatic synthesis and various properties of
poly(catechol). Enzyme Microb. Technol. 1998, 23, 432-437.
(45) Doerge, D. R.; Divi, R. L.; Churchwell, M. I. Identification of the colored guaiacol
oxidation product produced by peroxidases. Anal. Biochem. 1997, 250, 10-17.
(46) Silverstein, R. M.; Webster, F. X. Spectrometric identification of organic compounds,
6th ed.; Wiley: New York, 1998.
(47) Slipchenko, L. V.; Gordon, M. S. Water-Benzene Interactions: An Effective Fragment
Potential and Correlated Quantum Chemistry Study. J. Phys. Chem. A 2009, 113, 2092-
2102.
(48) Wang, H.; Agmon, N. Protonated water dimer on benzene: Standing eigen or crouching
Zundel? J. Phys. Chem. A 2015, 119, 2658-2667.
(49) Gierszal, K. P.; Davis, J. G.; Hands, M. D.; Wilcox, D. S.; Slipchenko, L. V.; Ben-
Amotz, D. π-Hydrogen Bonding in Liquid Water. J. Phys. Chem. Lett. 2011, 2, 2930-
2933.
(50) Gomez-Zaleta, B.; Gomez-Balderas, R.; Hernandez-Trujillo, J. Theoretical analysis of
hydrogen bonding in catechol-n(H2O) clusters (n = 0...3). Phys. Chem. Chem. Phys.
2010, 12, 4783−4790.
(51) Cheng, T. C.; Bandyopadhyay, B.; Mosley, J. D.; Duncan, M. A. IR Spectroscopy of
Protonation in Benzene-Water Nanoclusters: Hydronium, Zundel, and Eigen at a
Hydrophobic Interface. J. Am. Chem. Soc. 2012, 134, 13046-13055.
(52) Lappi, S. E.; Smith, B.; Franzen, S. Infrared spectra of H2 16O, H218O and D2O in the
liquid phase by single-pass attenuated total internal reflection spectroscopy.
Spectrochim. Acta, Part A 2004, 60, 2611-2619.
Chapter 4
103
(53) Walrafen, G. E. Raman and infrared spectral investigations of water structure. In Water
a Comprehensive Treatise; Franks, F., Ed.; Plenum Press: New York, 1972; Vol. 1, pp
151-214.
(54) Heger, M.; Mata, R. A.; Suhm, M. A. Soft hydrogen bonds to alkenes: the methanol-
ethene prototype under experimental and theoretical scrutiny. Chem. Sci. 2015, 6, 3738-
3745.
(55) Nichols, B. R.; Rapa, C.; Costa, V.; Hinrichs, R. Z. Heterogeneous and Photochemical
Reactions of Solid Benzophenone-Catechol Films with NO2. J. Phys. Chem. C 2009,
113, 2111-2119.
(56) Wentworth, G. R.; Al-Abadleh, H. A. DRIFTS studies on the photosensitized
transformation of gallic acid by iron(III) chloride as a model for HULIS in atmospheric
aerosols. Phys. Chem. Chem. Phys. 2011, 13, 6507-6516.
(57) Atkins, P. W.; de Paula, J. Physical Chemistry, 7th ed.; W. H. Freeman and Company:
New York, 2008.
(58) Goodman, A. L.; Bernard, E. T.; Grassian, V. H. Spectroscopic study of nitric acid and
water adsorption on oxide particles: Enhanced nitric acid uptake kinetics in the presence
of adsorbed water. J. Phys. Chem. A 2001, 105, 6443-6457.
(59) Sing, K. S. W. Reporting physisorption data for gas/solid systems with special reference
to the determination of surface area and porosity (Provisional). Pure Appl. Chem. 1982,
54, 2201-2218.
(60) Inglezakis, V. J.; Poulopoulos, S. G.; Kazemian, H. Insights into the S-shaped sorption
isotherms and their dimensionless forms. Microporous Mesoporous Mater. 2018, 272,
166-176.
(61) Varutbangkul, V.; Brechtel, F. J.; Bahreini, R.; Ng, N. L.; Keywood, M. D.; Kroll, J. H.;
Flagan, R. C.; Seinfeld, J. H.; Lee, A.; Goldstein, A. H. Hygroscopicity of secondary

Chapter 4
104
organic aerosols formed by oxidation of cycloalkenes, monoterpenes, sesquiterpenes,
and related compounds. Atmos. Chem. Phys. 2006, 6, 2367-2388.
(62) Furukawa, H.; Gandara, F.; Zhang, Y.-B.; Jiang, J.; Queen, W. L.; Hudson, M. R.;
Yaghi, O. M. Water Adsorption in Porous Metal-Organic Frameworks and Related
Materials. J. Am. Chem. Soc. 2014, 136, 4369-4381.

Chapter 5
105
Chapter 5 Iron-containing Metal-Organic Frameworks (MOFs) in Enhancing the
Selective Catalytic Reduction (SCR) of NOx to Nitrogen Gas
5.1 Abstract
This chapter describes systematic investigation on the reactivity of Fe-BTC and CoFe2O4 with
urea as the in situ source of ammonia gas as a reductant to reduce NO(g) by DRIFTS. It was
found that the rate of conversion of NO(g) in the presence of CoFe2O4/8%urea was 2.3±0.03
ppm m-2 min -1, whereas in the presence of Fe-BTC//8%urea, the rate of conversion of NO(g)
was 0.22±0.04 ppm m-2 min -1.
5.2 Introduction
Recently, there has been increasing environmental awareness due to the “air pollution” that
have harmful effect on living beings, plants and materials.1 It has been found that the major
contribution to this pollution are anthropogenic and occurs due to the burning of fossil fuels
(such as coal, petroleum and natural gas), vehicles and other ignition processes. Nitrogen
oxides (NOx, mainly NO and NO2) are one of the key components of air contaminants,
generated from combustion processes. NOx are known as primary pollutant in the atmosphere
and react to form photochemical smog and acid rain as well as take part in ozone layer
depletion.2,3 Moreover, they are harmful for human health and can cause damage to the
respiratory systems. Considering the toxicity, it has become an important environmental
concern to control or remove NOx from the air. Though NOx emission occurs from various
anthropogenic activities, industrial sources such as power plants and mobile engines are
considered mainly responsible for the release of NOx into the atmosphere. Nitrogen oxides are
highly reactive and complete removal of these gases is barely possible. However, NOx
emanation can be controlled and classified into three categories such as pre-combustion
treatment, combustion modification and post-combustion treatment. It appears that pre-
combustion as well as combustion modification can make significant reduction of NOx.
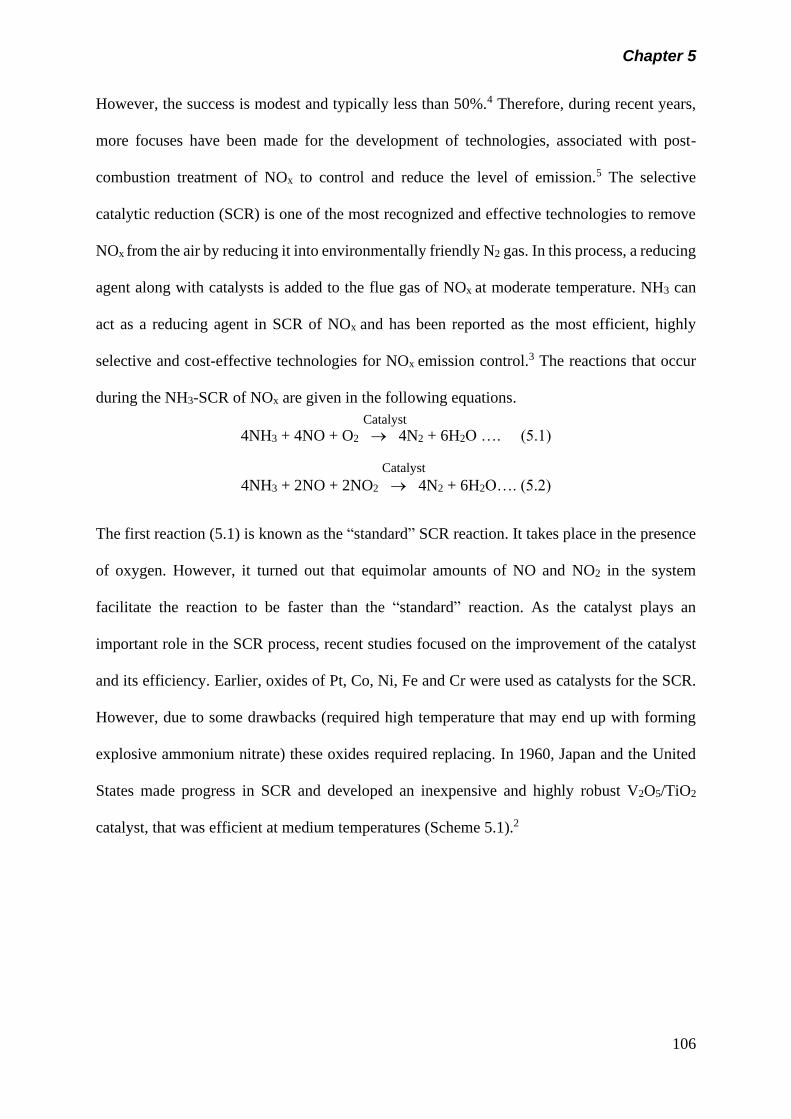
Chapter 5
106
However, the success is modest and typically less than 50%.4 Therefore, during recent years,
more focuses have been made for the development of technologies, associated with post-
combustion treatment of NOx to control and reduce the level of emission.5 The selective
catalytic reduction (SCR) is one of the most recognized and effective technologies to remove
NOx from the air by reducing it into environmentally friendly N2 gas. In this process, a reducing
agent along with catalysts is added to the flue gas of NOx at moderate temperature. NH3 can
act as a reducing agent in SCR of NOx and has been reported as the most efficient, highly
selective and cost-effective technologies for NOx emission control.3 The reactions that occur
during the NH3-SCR of NOx are given in the following equations.
4NH3 + 4NO + O2 → 4N2 + 6H2O …. (5.1)
4NH3 + 2NO + 2NO2 → 4N2 + 6H2O…. (5.2)
The first reaction (5.1) is known as the “standard” SCR reaction. It takes place in the presence
of oxygen. However, it turned out that equimolar amounts of NO and NO2 in the system
facilitate the reaction to be faster than the “standard” reaction. As the catalyst plays an
important role in the SCR process, recent studies focused on the improvement of the catalyst
and its efficiency. Earlier, oxides of Pt, Co, Ni, Fe and Cr were used as catalysts for the SCR.
However, due to some drawbacks (required high temperature that may end up with forming
explosive ammonium nitrate) these oxides required replacing. In 1960, Japan and the United
States made progress in SCR and developed an inexpensive and highly robust V2O5/TiO2
catalyst, that was efficient at medium temperatures (Scheme 5.1).2
Catalyst
Catalyst
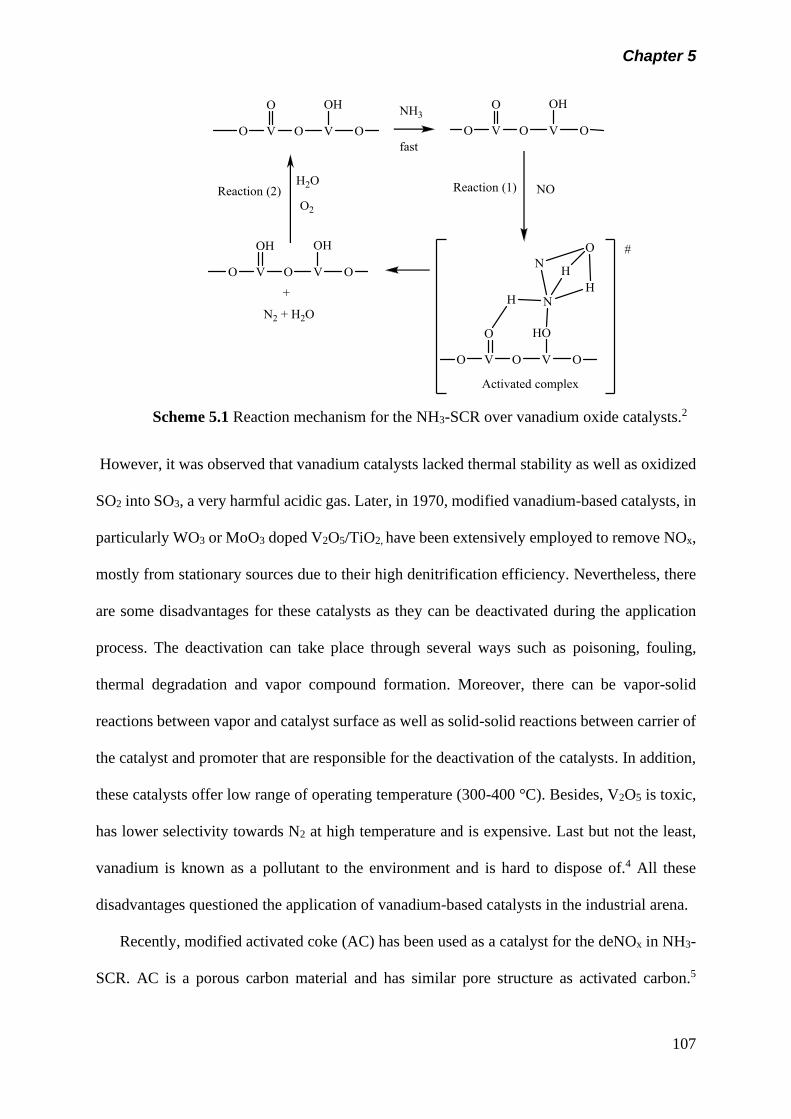
Chapter 5
107
Scheme 5.1 Reaction mechanism for the NH3-SCR over vanadium oxide catalysts.2
However, it was observed that vanadium catalysts lacked thermal stability as well as oxidized
SO2 into SO3, a very harmful acidic gas. Later, in 1970, modified vanadium-based catalysts, in
particularly WO3 or MoO3 doped V2O5/TiO2, have been extensively employed to remove NOx,
mostly from stationary sources due to their high denitrification efficiency. Nevertheless, there
are some disadvantages for these catalysts as they can be deactivated during the application
process. The deactivation can take place through several ways such as poisoning, fouling,
thermal degradation and vapor compound formation. Moreover, there can be vapor-solid
reactions between vapor and catalyst surface as well as solid-solid reactions between carrier of
the catalyst and promoter that are responsible for the deactivation of the catalysts. In addition,
these catalysts offer low range of operating temperature (300-400 °C). Besides, V2O5 is toxic,
has lower selectivity towards N2 at high temperature and is expensive. Last but not the least,
vanadium is known as a pollutant to the environment and is hard to dispose of.4 All these
disadvantages questioned the application of vanadium-based catalysts in the industrial arena.
Recently, modified activated coke (AC) has been used as a catalyst for the deNOx in NH3-
SCR. AC is a porous carbon material and has similar pore structure as activated carbon.5
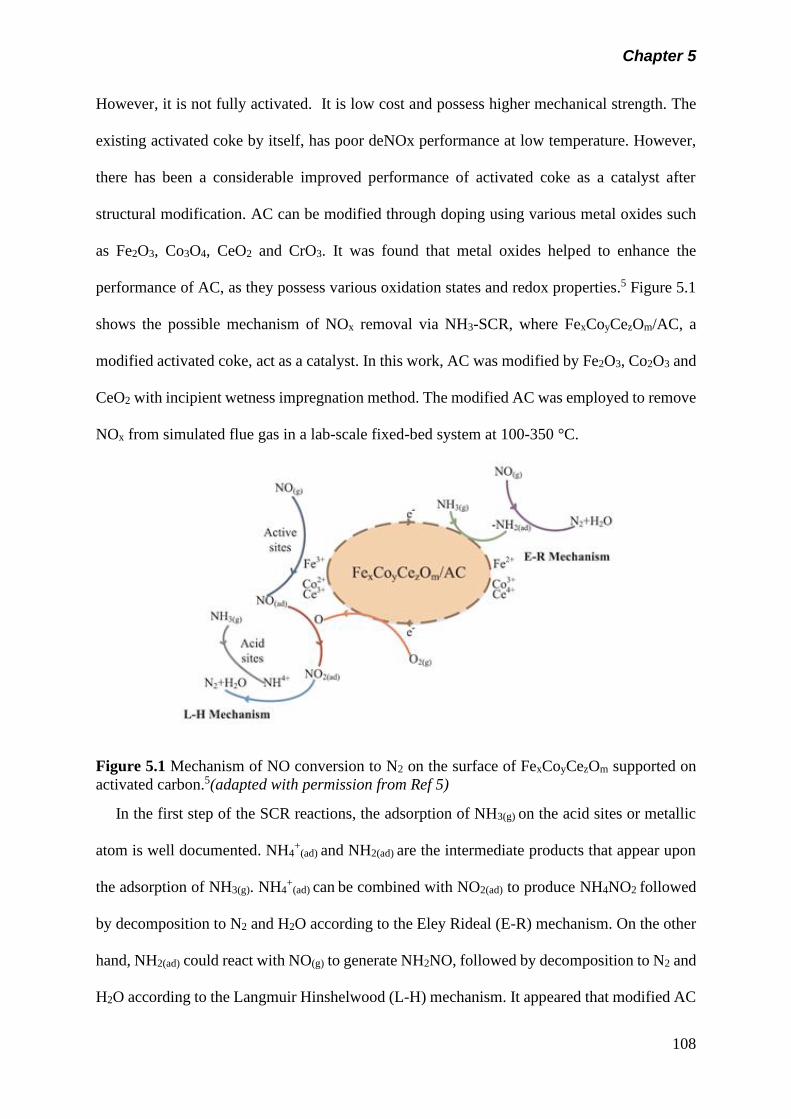
Chapter 5
108
However, it is not fully activated. It is low cost and possess higher mechanical strength. The
existing activated coke by itself, has poor deNOx performance at low temperature. However,
there has been a considerable improved performance of activated coke as a catalyst after
structural modification. AC can be modified through doping using various metal oxides such
as Fe2O3, Co3O4, CeO2 and CrO3. It was found that metal oxides helped to enhance the
performance of AC, as they possess various oxidation states and redox properties.5 Figure 5.1
shows the possible mechanism of NOx removal via NH3-SCR, where FexCoyCezOm/AC, a
modified activated coke, act as a catalyst. In this work, AC was modified by Fe2O3, Co2O3 and
CeO2 with incipient wetness impregnation method. The modified AC was employed to remove
NOx from simulated flue gas in a lab-scale fixed-bed system at 100-350 °C.
Figure 5.1 Mechanism of NO conversion to N2 on the surface of FexCoyCezOm supported on
activated carbon.5(adapted with permission from Ref 5)
In the first step of the SCR reactions, the adsorption of NH3(g) on the acid sites or metallic
atom is well documented. NH4+
(ad) and NH2(ad)
are the intermediate products that appear upon
the adsorption of NH3(g). NH4+
(ad) can be combined with NO2(ad) to produce NH4NO2 followed
by decomposition to N2 and H2O according to the Eley Rideal (E-R) mechanism. On the other
hand, NH2(ad) could react with NO(g) to generate NH2NO, followed by decomposition to N2 and
H2O according to the Langmuir Hinshelwood (L-H) mechanism. It appeared that modified AC
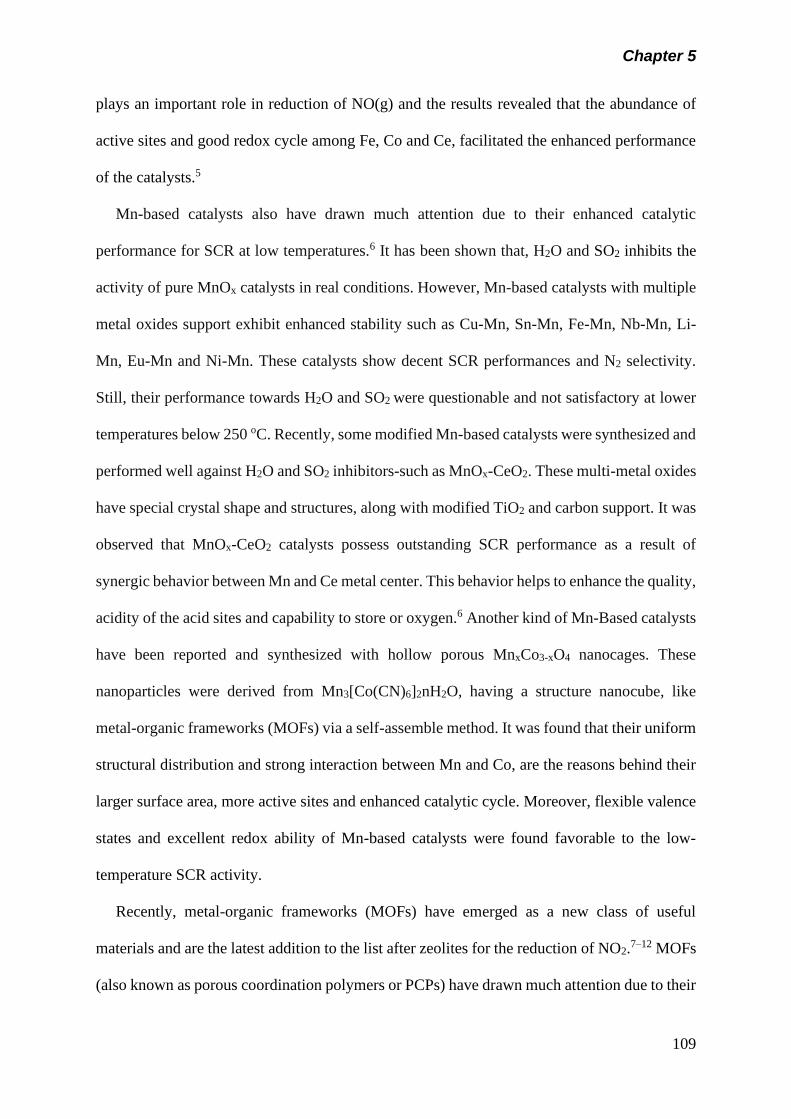
Chapter 5
109
plays an important role in reduction of NO(g) and the results revealed that the abundance of
active sites and good redox cycle among Fe, Co and Ce, facilitated the enhanced performance
of the catalysts.5
Mn-based catalysts also have drawn much attention due to their enhanced catalytic
performance for SCR at low temperatures.6 It has been shown that, H2O and SO2 inhibits the
activity of pure MnOx catalysts in real conditions. However, Mn-based catalysts with multiple
metal oxides support exhibit enhanced stability such as Cu-Mn, Sn-Mn, Fe-Mn, Nb-Mn, Li-
Mn, Eu-Mn and Ni-Mn. These catalysts show decent SCR performances and N2 selectivity.
Still, their performance towards H2O and SO2 were questionable and not satisfactory at lower
temperatures below 250 oC. Recently, some modified Mn-based catalysts were synthesized and
performed well against H2O and SO2 inhibitors-such as MnOx-CeO2. These multi-metal oxides
have special crystal shape and structures, along with modified TiO2 and carbon support. It was
observed that MnOx-CeO2 catalysts possess outstanding SCR performance as a result of
synergic behavior between Mn and Ce metal center. This behavior helps to enhance the quality,
acidity of the acid sites and capability to store or oxygen.6 Another kind of Mn-Based catalysts
have been reported and synthesized with hollow porous MnxCo3-xO4 nanocages. These
nanoparticles were derived from Mn3[Co(CN)6]2nH2O, having a structure nanocube, like
metal-organic frameworks (MOFs) via a self-assemble method. It was found that their uniform
structural distribution and strong interaction between Mn and Co, are the reasons behind their
larger surface area, more active sites and enhanced catalytic cycle. Moreover, flexible valence
states and excellent redox ability of Mn-based catalysts were found favorable to the low-
temperature SCR activity.
Recently, metal-organic frameworks (MOFs) have emerged as a new class of useful
materials and are the latest addition to the list after zeolites for the reduction of NO2.7–12 MOFs
(also known as porous coordination polymers or PCPs) have drawn much attention due to their
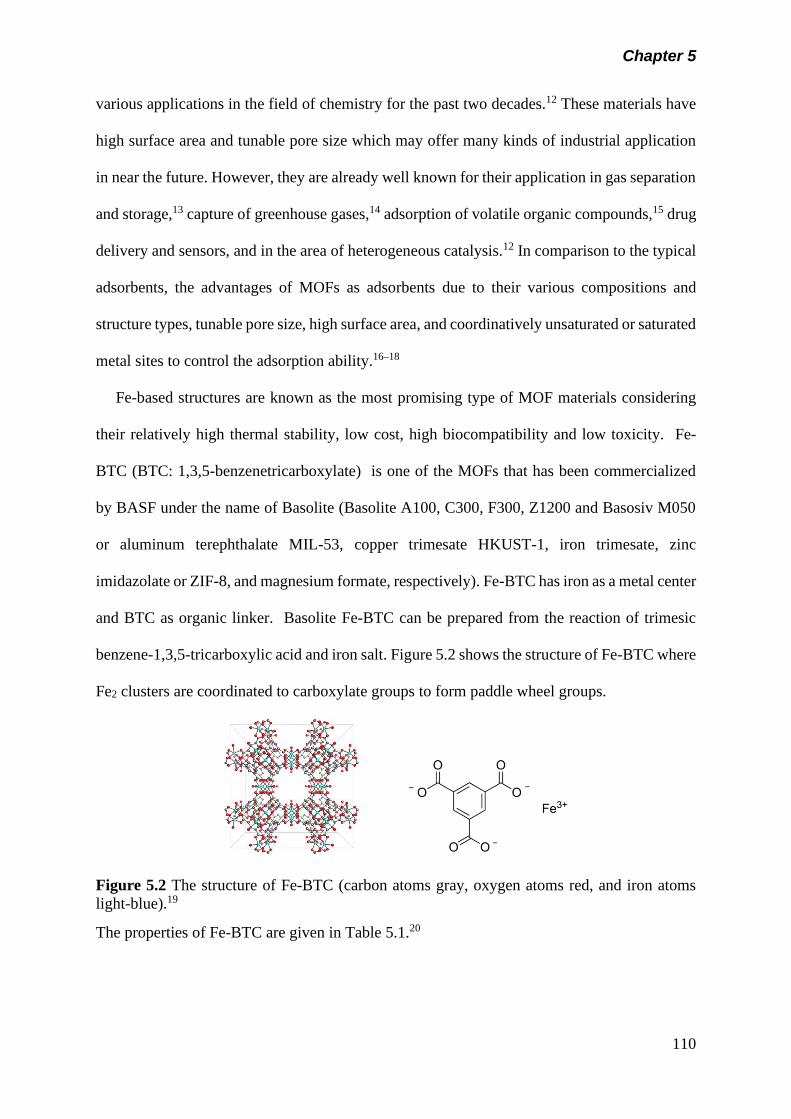
Chapter 5
110
various applications in the field of chemistry for the past two decades.12 These materials have
high surface area and tunable pore size which may offer many kinds of industrial application
in near the future. However, they are already well known for their application in gas separation
and storage,13 capture of greenhouse gases,14 adsorption of volatile organic compounds,15 drug
delivery and sensors, and in the area of heterogeneous catalysis.12 In comparison to the typical
adsorbents, the advantages of MOFs as adsorbents due to their various compositions and
structure types, tunable pore size, high surface area, and coordinatively unsaturated or saturated
metal sites to control the adsorption ability.16–18
Fe-based structures are known as the most promising type of MOF materials considering
their relatively high thermal stability, low cost, high biocompatibility and low toxicity. Fe-
BTC (BTC: 1,3,5-benzenetricarboxylate) is one of the MOFs that has been commercialized
by BASF under the name of Basolite (Basolite A100, C300, F300, Z1200 and Basosiv M050
or aluminum terephthalate MIL-53, copper trimesate HKUST-1, iron trimesate, zinc
imidazolate or ZIF-8, and magnesium formate, respectively). Fe-BTC has iron as a metal center
and BTC as organic linker. Basolite Fe-BTC can be prepared from the reaction of trimesic
benzene-1,3,5-tricarboxylic acid and iron salt. Figure 5.2 shows the structure of Fe-BTC where
Fe2 clusters are coordinated to carboxylate groups to form paddle wheel groups.
Figure 5.2 The structure of Fe-BTC (carbon atoms gray, oxygen atoms red, and iron atoms
light-blue).19
The properties of Fe-BTC are given in Table 5.1.20
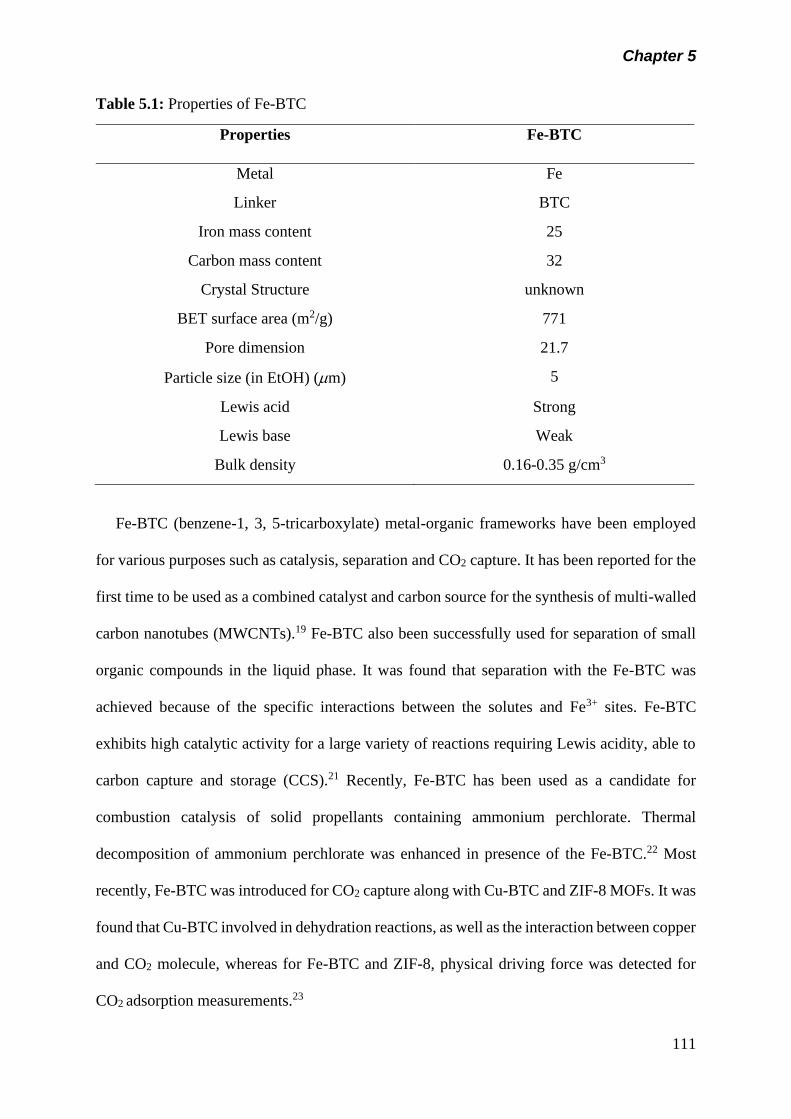
Chapter 5
111
Table 5.1: Properties of Fe-BTC
Properties Fe-BTC
Metal Fe
Linker BTC
Iron mass content 25
Carbon mass content 32
Crystal Structure unknown
BET surface area (m2/g) 771
Pore dimension 21.7
Particle size (in EtOH) (m) 5
Lewis acid Strong
Lewis base Weak
Bulk density 0.16-0.35 g/cm3
Fe-BTC (benzene-1, 3, 5-tricarboxylate) metal-organic frameworks have been employed
for various purposes such as catalysis, separation and CO2 capture. It has been reported for the
first time to be used as a combined catalyst and carbon source for the synthesis of multi-walled
carbon nanotubes (MWCNTs).19 Fe-BTC also been successfully used for separation of small
organic compounds in the liquid phase. It was found that separation with the Fe-BTC was
achieved because of the specific interactions between the solutes and Fe3+ sites. Fe-BTC
exhibits high catalytic activity for a large variety of reactions requiring Lewis acidity, able to
carbon capture and storage (CCS).21 Recently, Fe-BTC has been used as a candidate for
combustion catalysis of solid propellants containing ammonium perchlorate. Thermal
decomposition of ammonium perchlorate was enhanced in presence of the Fe-BTC.22 Most
recently, Fe-BTC was introduced for CO2 capture along with Cu-BTC and ZIF-8 MOFs. It was
found that Cu-BTC involved in dehydration reactions, as well as the interaction between copper
and CO2 molecule, whereas for Fe-BTC and ZIF-8, physical driving force was detected for
CO2 adsorption measurements.23
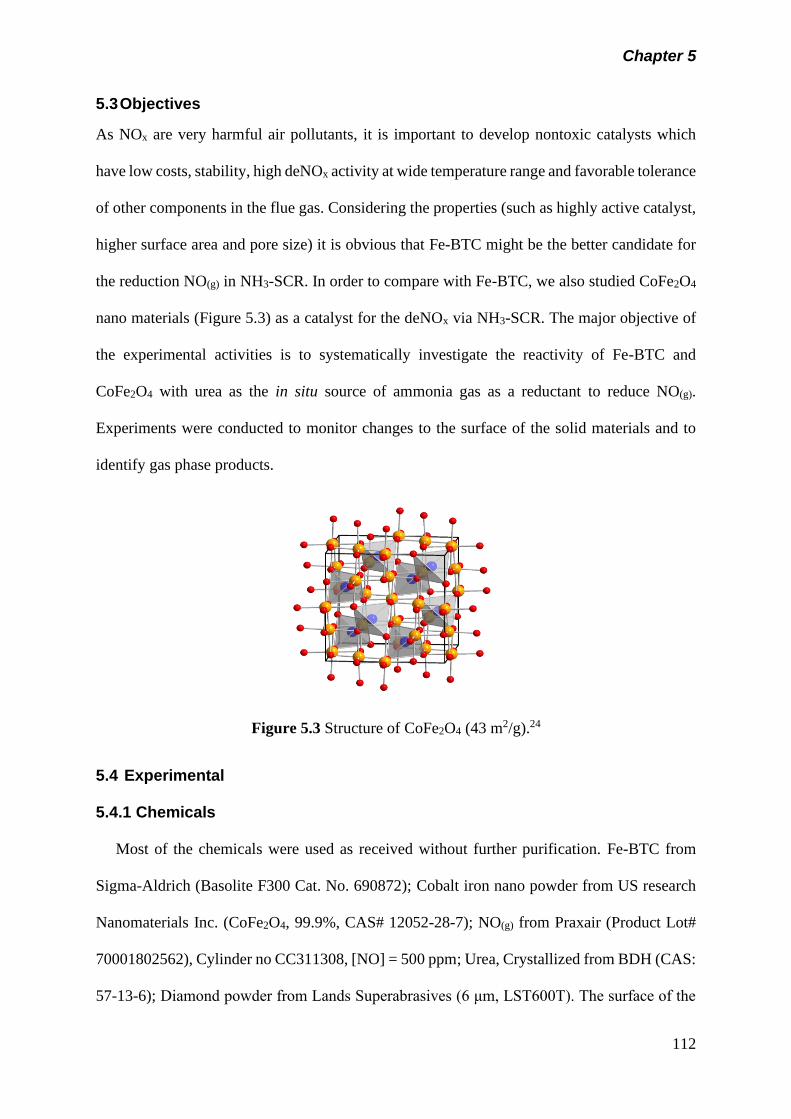
Chapter 5
112
5.3 Objectives
As NOx are very harmful air pollutants, it is important to develop nontoxic catalysts which
have low costs, stability, high deNOx activity at wide temperature range and favorable tolerance
of other components in the flue gas. Considering the properties (such as highly active catalyst,
higher surface area and pore size) it is obvious that Fe-BTC might be the better candidate for
the reduction NO(g) in NH3-SCR. In order to compare with Fe-BTC, we also studied CoFe2O4
nano materials (Figure 5.3) as a catalyst for the deNOx via NH3-SCR. The major objective of
the experimental activities is to systematically investigate the reactivity of Fe-BTC and
CoFe2O4 with urea as the in situ source of ammonia gas as a reductant to reduce NO(g).
Experiments were conducted to monitor changes to the surface of the solid materials and to
identify gas phase products.
Figure 5.3 Structure of CoFe2O4 (43 m2/g).24
5.4 Experimental
5.4.1 Chemicals
Most of the chemicals were used as received without further purification. Fe-BTC from
Sigma-Aldrich (Basolite F300 Cat. No. 690872); Cobalt iron nano powder from US research
Nanomaterials Inc. (CoFe2O4, 99.9%, CAS# 12052-28-7); NO(g) from Praxair (Product Lot#
70001802562), Cylinder no CC311308, [NO] = 500 ppm; Urea, Crystallized from BDH (CAS:
57-13-6); Diamond powder from Lands Superabrasives (6 μm, LST600T). The surface of the
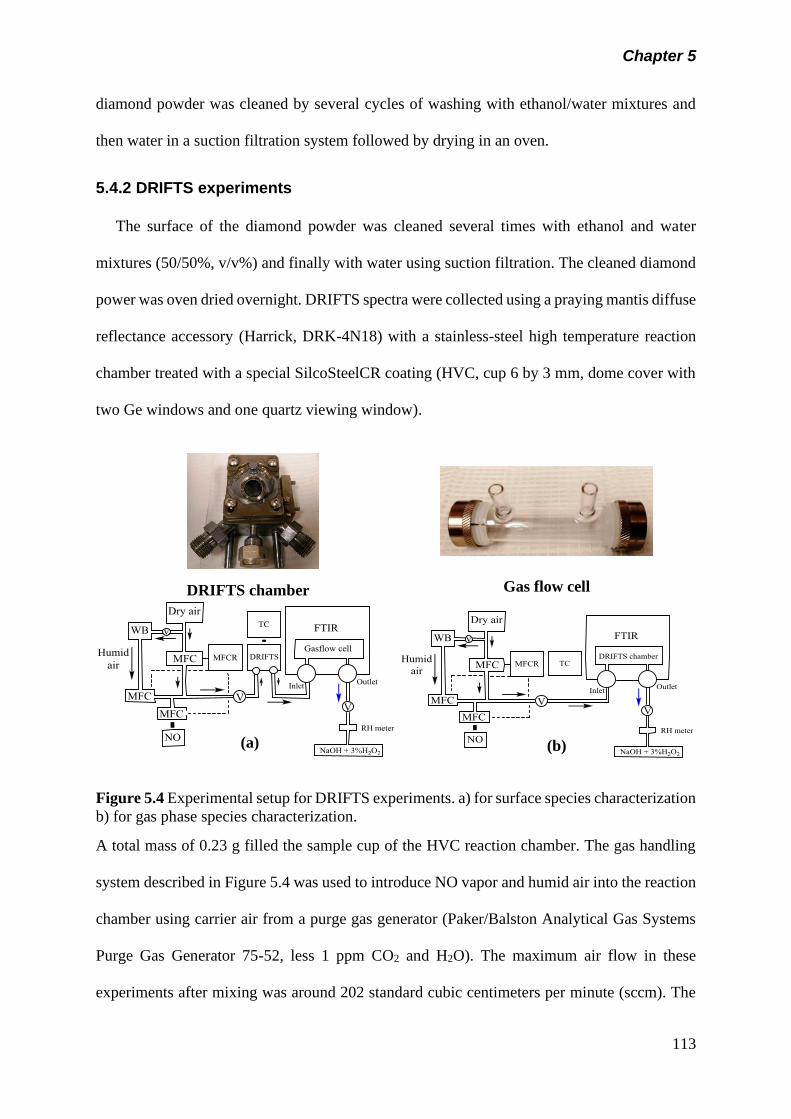
Chapter 5
113
diamond powder was cleaned by several cycles of washing with ethanol/water mixtures and
then water in a suction filtration system followed by drying in an oven.
5.4.2 DRIFTS experiments
The surface of the diamond powder was cleaned several times with ethanol and water
mixtures (50/50%, v/v%) and finally with water using suction filtration. The cleaned diamond
power was oven dried overnight. DRIFTS spectra were collected using a praying mantis diffuse
reflectance accessory (Harrick, DRK-4N18) with a stainless-steel high temperature reaction
chamber treated with a special SilcoSteelCR coating (HVC, cup 6 by 3 mm, dome cover with
two Ge windows and one quartz viewing window).
DRIFTS chamber
Gas flow cell
Figure 5.4 Experimental setup for DRIFTS experiments. a) for surface species characterization
b) for gas phase species characterization.
A total mass of 0.23 g filled the sample cup of the HVC reaction chamber. The gas handling
system described in Figure 5.4 was used to introduce NO vapor and humid air into the reaction
chamber using carrier air from a purge gas generator (Paker/Balston Analytical Gas Systems
Purge Gas Generator 75-52, less 1 ppm CO2 and H2O). The maximum air flow in these
experiments after mixing was around 202 standard cubic centimeters per minute (sccm). The
(a) (b)
Chapter 5
114
DRIFTS accessory was installed into a Nicolet 8700 FTIR spectrometer (Thermo Instruments)
equipped with a purge gas generator and a liquid N2 cooled MCT detector. Each experiment
started by preparing a fresh sample containing 8% (wt/wt) urea in Fe-BTC, CoFe2O4 or
diamond powder. Mechanical mixing of these chemicals was achieved using a wig-L-bug (no
ball) for 1 min or manually until the sample became completely homogeneous. Efficient and
reproducible packing of the sample was obtained using a 4 kg weight for 10 min. For DRIFTS
experiments conducted under dry conditions, the sample was prepared and kept under dry air
flow (350 MFC) at 115 oC for about 12 h prior to flowing NO(g). A single beam spectrum was
first collected, and then NO(g) was introduced. All spectra up to this point were collected by
averaging 100 scans at 8 cm−1 resolution. The relative humidity (RH) of the air was measured
by a humidity sensor (Vaisala HUMICAP HM70, ±2% RH uncertainty) located at the exit of
the DRIFTS reaction chamber.
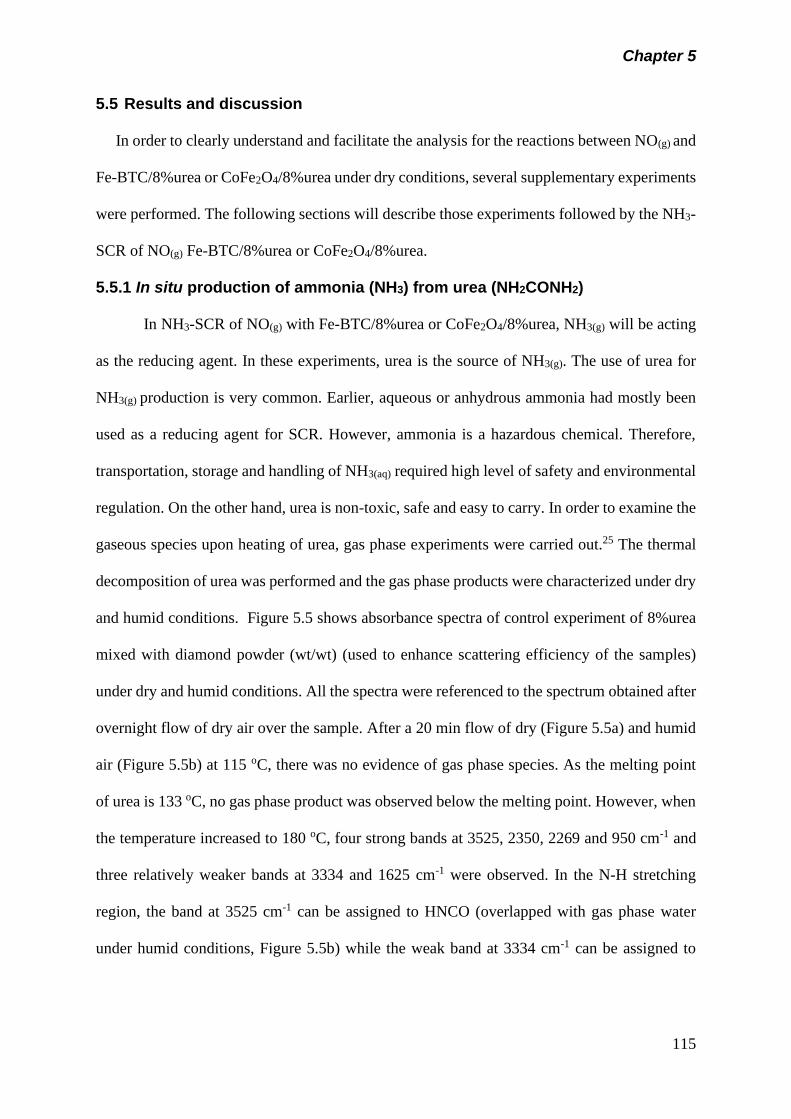
Chapter 5
115
5.5 Results and discussion
In order to clearly understand and facilitate the analysis for the reactions between NO(g) and
Fe-BTC/8%urea or CoFe2O4/8%urea under dry conditions, several supplementary experiments
were performed. The following sections will describe those experiments followed by the NH3-
SCR of NO(g) Fe-BTC/8%urea or CoFe2O4/8%urea.
5.5.1 In situ production of ammonia (NH3) from urea (NH2CONH2)
In NH3-SCR of NO(g) with Fe-BTC/8%urea or CoFe2O4/8%urea, NH3(g) will be acting
as the reducing agent. In these experiments, urea is the source of NH3(g). The use of urea for
NH3(g) production is very common. Earlier, aqueous or anhydrous ammonia had mostly been
used as a reducing agent for SCR. However, ammonia is a hazardous chemical. Therefore,
transportation, storage and handling of NH3(aq) required high level of safety and environmental
regulation. On the other hand, urea is non-toxic, safe and easy to carry. In order to examine the
gaseous species upon heating of urea, gas phase experiments were carried out.25 The thermal
decomposition of urea was performed and the gas phase products were characterized under dry
and humid conditions. Figure 5.5 shows absorbance spectra of control experiment of 8%urea
mixed with diamond powder (wt/wt) (used to enhance scattering efficiency of the samples)
under dry and humid conditions. All the spectra were referenced to the spectrum obtained after
overnight flow of dry air over the sample. After a 20 min flow of dry (Figure 5.5a) and humid
air (Figure 5.5b) at 115 oC, there was no evidence of gas phase species. As the melting point
of urea is 133 oC, no gas phase product was observed below the melting point. However, when
the temperature increased to 180 oC, four strong bands at 3525, 2350, 2269 and 950 cm-1 and
three relatively weaker bands at 3334 and 1625 cm-1 were observed. In the N-H stretching
region, the band at 3525 cm-1 can be assigned to HNCO (overlapped with gas phase water
under humid conditions, Figure 5.5b) while the weak band at 3334 cm-1 can be assigned to
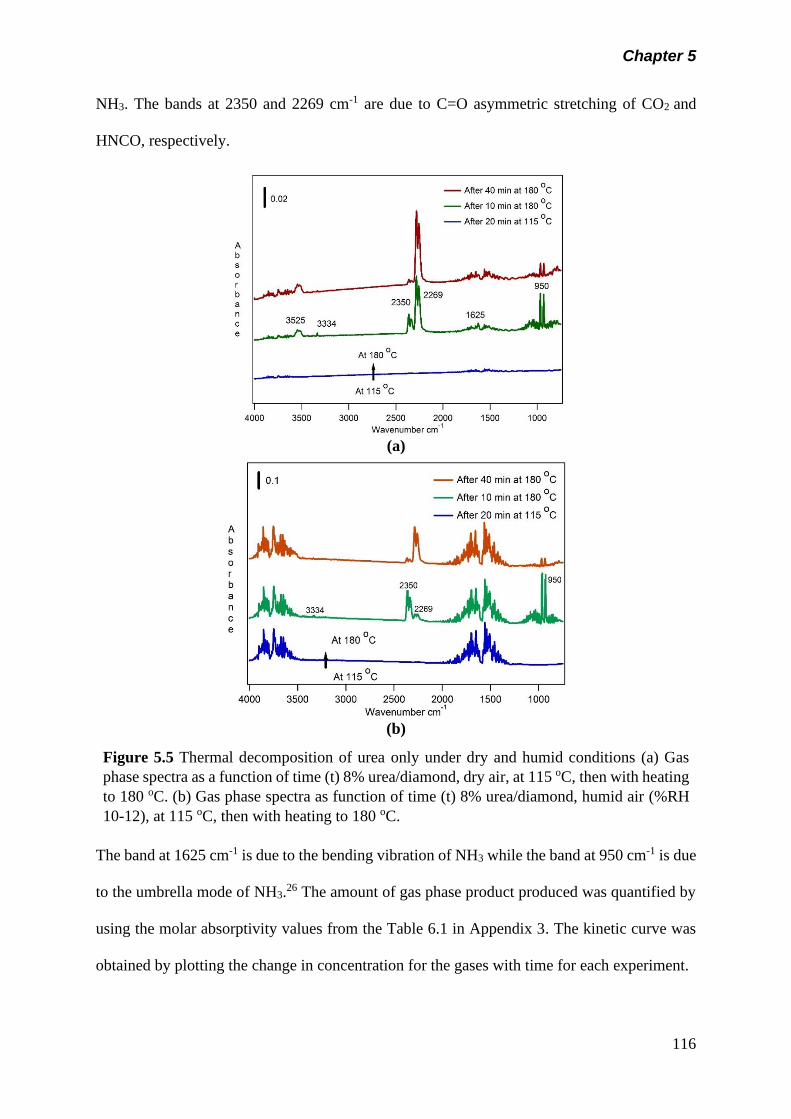
Chapter 5
116
NH3. The bands at 2350 and 2269 cm-1 are due to C=O asymmetric stretching of CO2 and
HNCO, respectively.
(a)
(b)
Figure 5.5 Thermal decomposition of urea only under dry and humid conditions (a) Gas
phase spectra as a function of time (t) 8% urea/diamond, dry air, at 115 oC, then with heating
to 180 oC. (b) Gas phase spectra as function of time (t) 8% urea/diamond, humid air (%RH
10-12), at 115 oC, then with heating to 180 oC.
The band at 1625 cm-1 is due to the bending vibration of NH3 while the band at 950 cm-1 is due
to the umbrella mode of NH3.26 The amount of gas phase product produced was quantified by
using the molar absorptivity values from the Table 6.1 in Appendix 3. The kinetic curve was
obtained by plotting the change in concentration for the gases with time for each experiment.

Chapter 5
117
Figure 5.6 shows kinetic curves for both NH3 and HNCO as a function of time for data in
Figure 5.5a,b.
(a) (b)
Figure 5.6(a) Kinetic curve of [NH3] vs time for data in figure 5.5(a). (b) Kinetic curve of
[NH3] vs time (min) for data in Figure 5.5(b).
The data implies that under both dry and humid condition, the production of NH3 is fast, within
10 min, and hardly observed with the span of time by 60 min. The kinetic data shows the effect
of humidity on the production of NH3. The amount of NH3(g) produced under humid condition
(2233 ppm) is 1.6 times greater than the dry condition (1387 ppm). Reactions on the thermal
decomposition of urea are given below. Urea firstly decomposes into equimolar products of
NH3(g) and HNCO(g) (R1). However, water vapor existing in the system may further react with
HNCO(g) to form additional NH3(g) and CO2(g) via hydrolysis according to the following
reaction (R2).25
Under dry condition R1 is a standard reaction that occurs. However, R2 dominates under humid
conditions.
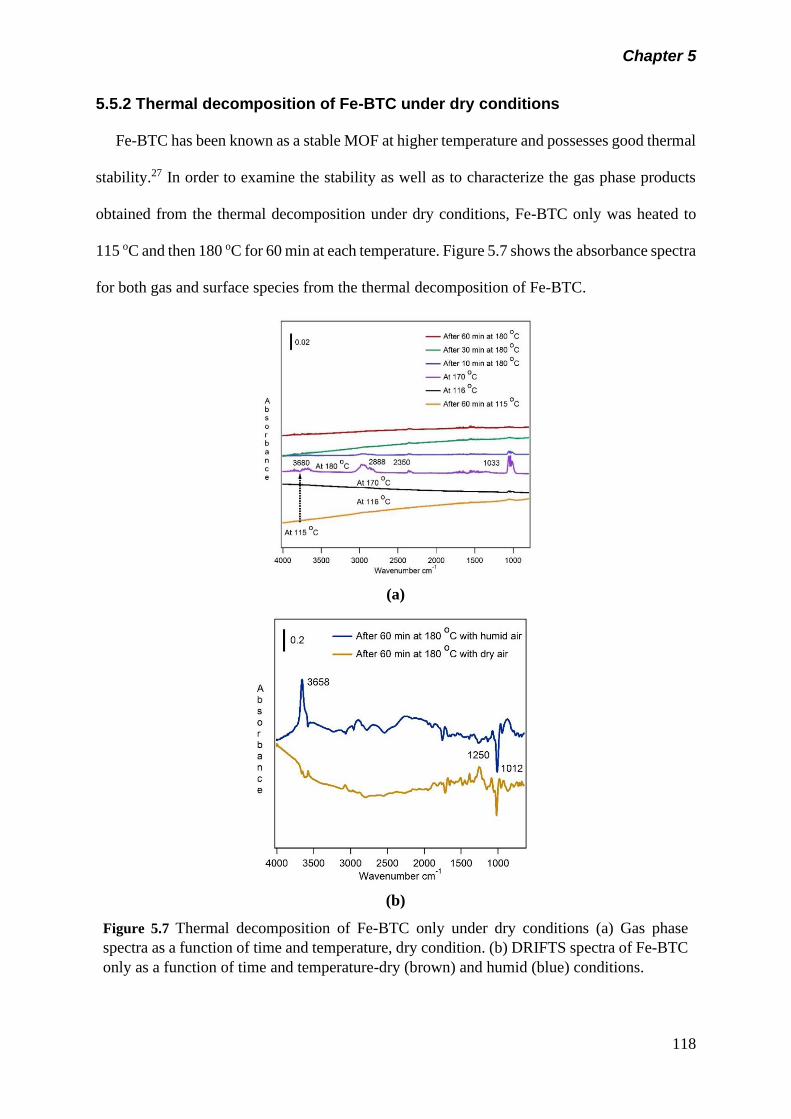
Chapter 5
118
5.5.2 Thermal decomposition of Fe-BTC under dry conditions
Fe-BTC has been known as a stable MOF at higher temperature and possesses good thermal
stability.27 In order to examine the stability as well as to characterize the gas phase products
obtained from the thermal decomposition under dry conditions, Fe-BTC only was heated to
115 oC and then 180 oC for 60 min at each temperature. Figure 5.7 shows the absorbance spectra
for both gas and surface species from the thermal decomposition of Fe-BTC.
(a)
(b)
Figure 5.7 Thermal decomposition of Fe-BTC only under dry conditions (a) Gas phase
spectra as a function of time and temperature, dry condition. (b) DRIFTS spectra of Fe-BTC
only as a function of time and temperature-dry (brown) and humid (blue) conditions.
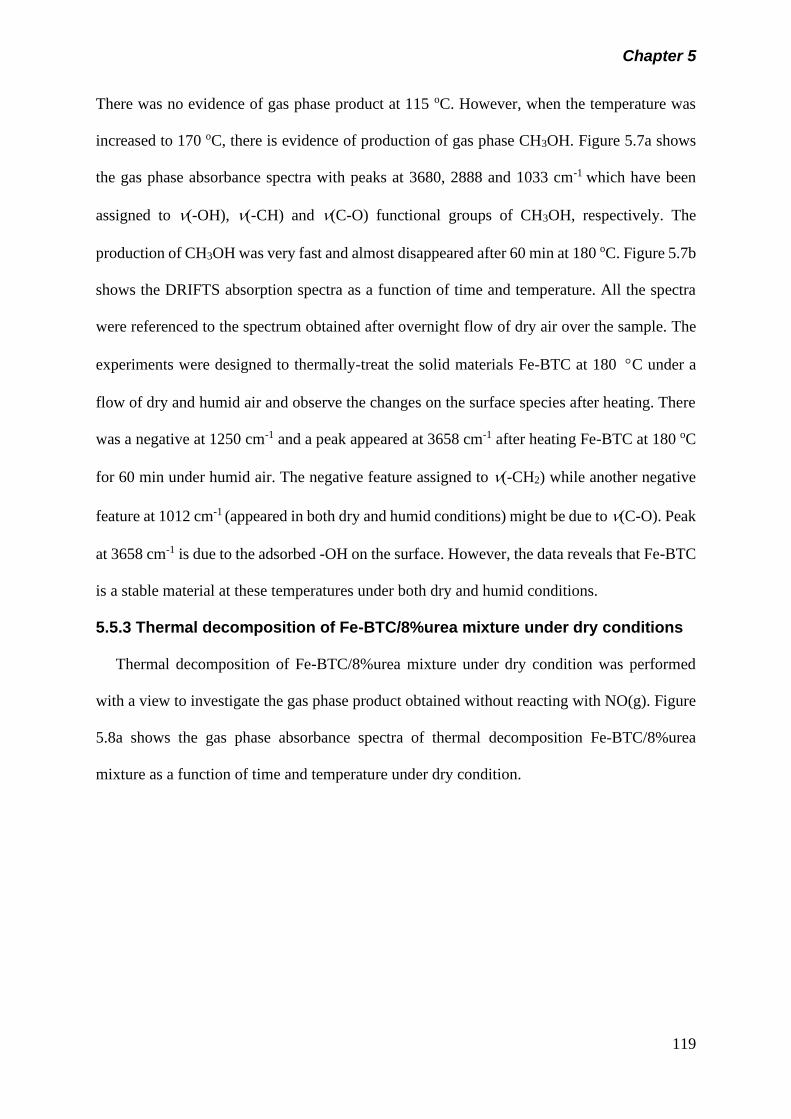
Chapter 5
119
There was no evidence of gas phase product at 115 oC. However, when the temperature was
increased to 170 oC, there is evidence of production of gas phase CH3OH. Figure 5.7a shows
the gas phase absorbance spectra with peaks at 3680, 2888 and 1033 cm-1 which have been
assigned to (-OH), (-CH) and (C-O) functional groups of CH3OH, respectively. The
production of CH3OH was very fast and almost disappeared after 60 min at 180 oC. Figure 5.7b
shows the DRIFTS absorption spectra as a function of time and temperature. All the spectra
were referenced to the spectrum obtained after overnight flow of dry air over the sample. The
experiments were designed to thermally-treat the solid materials Fe-BTC at 180 C under a
flow of dry and humid air and observe the changes on the surface species after heating. There
was a negative at 1250 cm-1 and a peak appeared at 3658 cm-1 after heating Fe-BTC at 180 oC
for 60 min under humid air. The negative feature assigned to (-CH2) while another negative
feature at 1012 cm-1 (appeared in both dry and humid conditions) might be due to (C-O). Peak
at 3658 cm-1 is due to the adsorbed -OH on the surface. However, the data reveals that Fe-BTC
is a stable material at these temperatures under both dry and humid conditions.
5.5.3 Thermal decomposition of Fe-BTC/8%urea mixture under dry conditions
Thermal decomposition of Fe-BTC/8%urea mixture under dry condition was performed
with a view to investigate the gas phase product obtained without reacting with NO(g). Figure
5.8a shows the gas phase absorbance spectra of thermal decomposition Fe-BTC/8%urea
mixture as a function of time and temperature under dry condition.
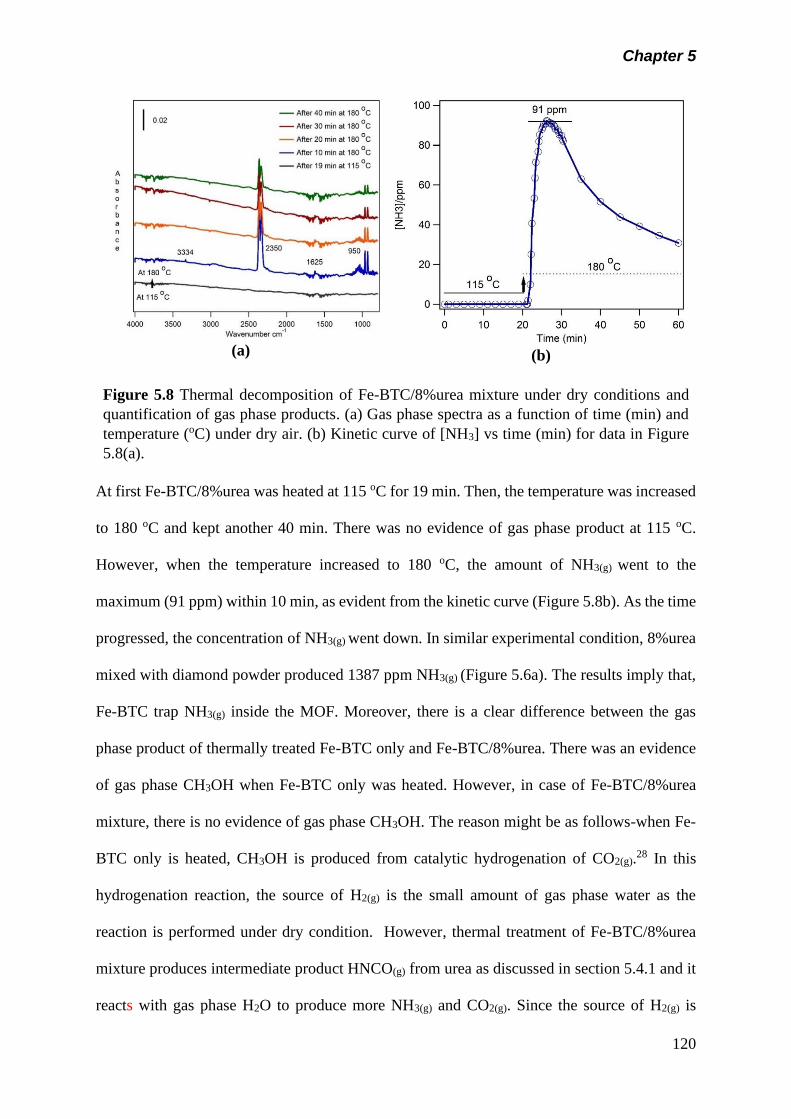
Chapter 5
120
(a)
(b)
Figure 5.8 Thermal decomposition of Fe-BTC/8%urea mixture under dry conditions and
quantification of gas phase products. (a) Gas phase spectra as a function of time (min) and
temperature (oC) under dry air. (b) Kinetic curve of [NH3] vs time (min) for data in Figure
5.8(a).
At first Fe-BTC/8%urea was heated at 115 oC for 19 min. Then, the temperature was increased
to 180 oC and kept another 40 min. There was no evidence of gas phase product at 115 oC.
However, when the temperature increased to 180 oC, the amount of NH3(g) went to the
maximum (91 ppm) within 10 min, as evident from the kinetic curve (Figure 5.8b). As the time
progressed, the concentration of NH3(g) went down. In similar experimental condition, 8%urea
mixed with diamond powder produced 1387 ppm NH3(g) (Figure 5.6a). The results imply that,
Fe-BTC trap NH3(g) inside the MOF. Moreover, there is a clear difference between the gas
phase product of thermally treated Fe-BTC only and Fe-BTC/8%urea. There was an evidence
of gas phase CH3OH when Fe-BTC only was heated. However, in case of Fe-BTC/8%urea
mixture, there is no evidence of gas phase CH3OH. The reason might be as follows-when Fe-
BTC only is heated, CH3OH is produced from catalytic hydrogenation of CO2(g).28 In this
hydrogenation reaction, the source of H2(g) is the small amount of gas phase water as the
reaction is performed under dry condition. However, thermal treatment of Fe-BTC/8%urea
mixture produces intermediate product HNCO(g) from urea as discussed in section 5.4.1 and it
reacts with gas phase H2O to produce more NH3(g) and CO2(g). Since the source of H2(g) is
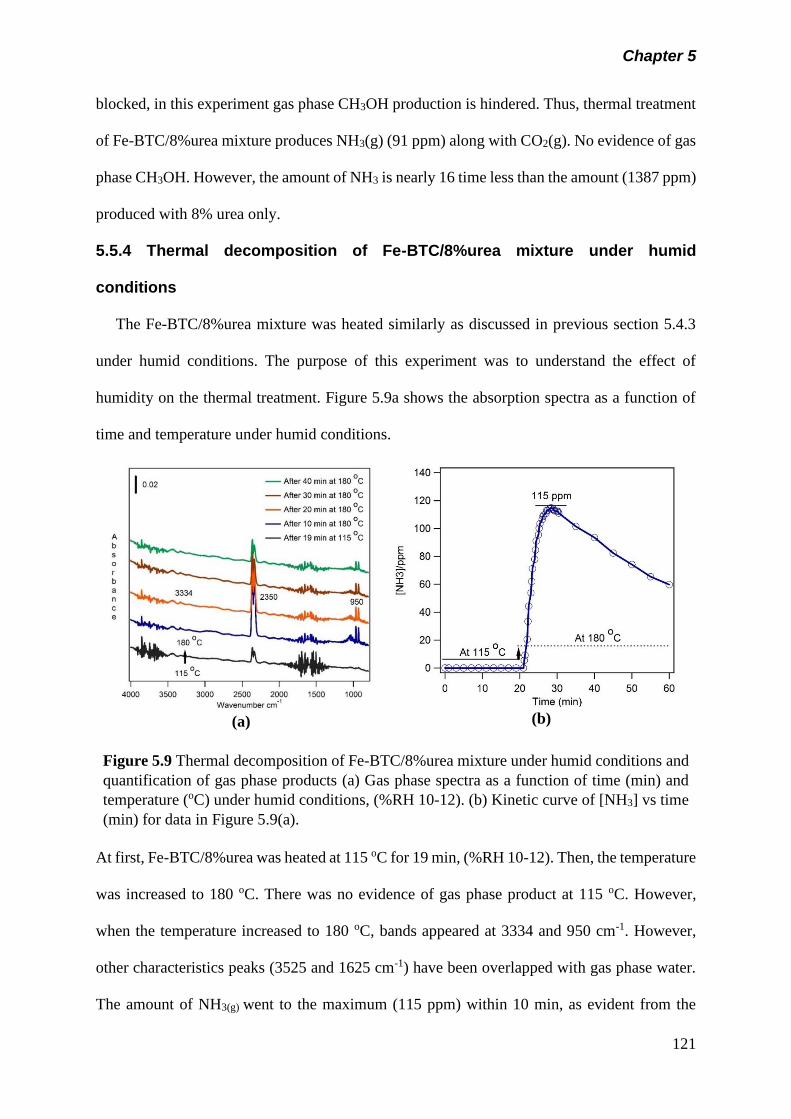
Chapter 5
121
blocked, in this experiment gas phase CH3OH production is hindered. Thus, thermal treatment
of Fe-BTC/8%urea mixture produces NH3(g) (91 ppm) along with CO2(g). No evidence of gas
phase CH3OH. However, the amount of NH3 is nearly 16 time less than the amount (1387 ppm)
produced with 8% urea only.
5.5.4 Thermal decomposition of Fe-BTC/8%urea mixture under humid
conditions
The Fe-BTC/8%urea mixture was heated similarly as discussed in previous section 5.4.3
under humid conditions. The purpose of this experiment was to understand the effect of
humidity on the thermal treatment. Figure 5.9a shows the absorption spectra as a function of
time and temperature under humid conditions.
(a)
(b)
Figure 5.9 Thermal decomposition of Fe-BTC/8%urea mixture under humid conditions and
quantification of gas phase products (a) Gas phase spectra as a function of time (min) and
temperature (oC) under humid conditions, (%RH 10-12). (b) Kinetic curve of [NH3] vs time
(min) for data in Figure 5.9(a).
At first, Fe-BTC/8%urea was heated at 115 oC for 19 min, (%RH 10-12). Then, the temperature
was increased to 180 oC. There was no evidence of gas phase product at 115 oC. However,
when the temperature increased to 180 oC, bands appeared at 3334 and 950 cm-1. However,
other characteristics peaks (3525 and 1625 cm-1) have been overlapped with gas phase water.
The amount of NH3(g) went to the maximum (115 ppm) within 10 min, as evident from the
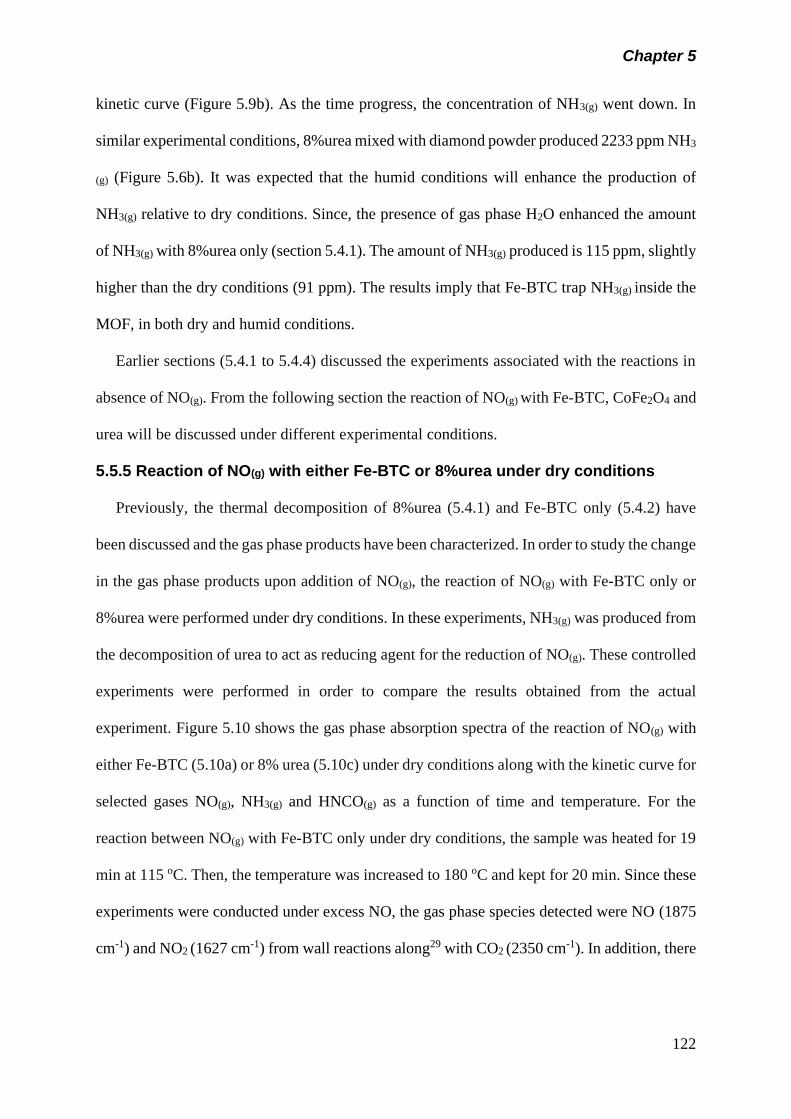
Chapter 5
122
kinetic curve (Figure 5.9b). As the time progress, the concentration of NH3(g) went down. In
similar experimental conditions, 8%urea mixed with diamond powder produced 2233 ppm NH3
(g) (Figure 5.6b). It was expected that the humid conditions will enhance the production of
NH3(g) relative to dry conditions. Since, the presence of gas phase H2O enhanced the amount
of NH3(g) with 8%urea only (section 5.4.1). The amount of NH3(g) produced is 115 ppm, slightly
higher than the dry conditions (91 ppm). The results imply that Fe-BTC trap NH3(g) inside the
MOF, in both dry and humid conditions.
Earlier sections (5.4.1 to 5.4.4) discussed the experiments associated with the reactions in
absence of NO(g). From the following section the reaction of NO(g) with Fe-BTC, CoFe2O4 and
urea will be discussed under different experimental conditions.
5.5.5 Reaction of NO(g) with either Fe-BTC or 8%urea under dry conditions
Previously, the thermal decomposition of 8%urea (5.4.1) and Fe-BTC only (5.4.2) have
been discussed and the gas phase products have been characterized. In order to study the change
in the gas phase products upon addition of NO(g), the reaction of NO(g) with Fe-BTC only or
8%urea were performed under dry conditions. In these experiments, NH3(g) was produced from
the decomposition of urea to act as reducing agent for the reduction of NO(g). These controlled
experiments were performed in order to compare the results obtained from the actual
experiment. Figure 5.10 shows the gas phase absorption spectra of the reaction of NO(g) with
either Fe-BTC (5.10a) or 8% urea (5.10c) under dry conditions along with the kinetic curve for
selected gases NO(g), NH3(g) and HNCO(g) as a function of time and temperature. For the
reaction between NO(g) with Fe-BTC only under dry conditions, the sample was heated for 19
min at 115 oC. Then, the temperature was increased to 180 oC and kept for 20 min. Since these
experiments were conducted under excess NO, the gas phase species detected were NO (1875
cm-1) and NO2 (1627 cm-1) from wall reactions along29 with CO2 (2350 cm-1). In addition, there
Chapter 5
123
was an evidence of gas phase CH3OH ((-C-H) 2888 and (-C-O) 1033 cm-1) when the
temperature is increased to 180 oC.
(a)
(b)
(c)
(d)
Figure 5.10 Reaction of NO with either Fe-BTC or 8%urea under dry conditions. (a) Gas phase
spectra of reaction between NO and Fe-BTC only as a function of time (min) and temperature
(oC) under dry air. (b) Kinetic curve of [NO] vs time (min) for data in figure 5.10(a). (c) Gas phase
spectra of reaction between NO and diamond/8%urea as a function of time (min) and temperature
(oC) under dry conditions. (d) Kinetic curve of [NO]/[NH3]/[HNCO] vs time (min) for data in
Figure 5.10(c).
Figure 5.10b shows kinetic curve of NO(g) in a control gas phase experiment of Fe-BTC with
NO(g). The data show that there was no significant change in the concentration of NO(g)
throughout the reaction time. The concentration of NO(g) was steady even as the temperature
increased to 180 oC from 115 oC. The maximum concentration of NO(g) was 295 ppm.
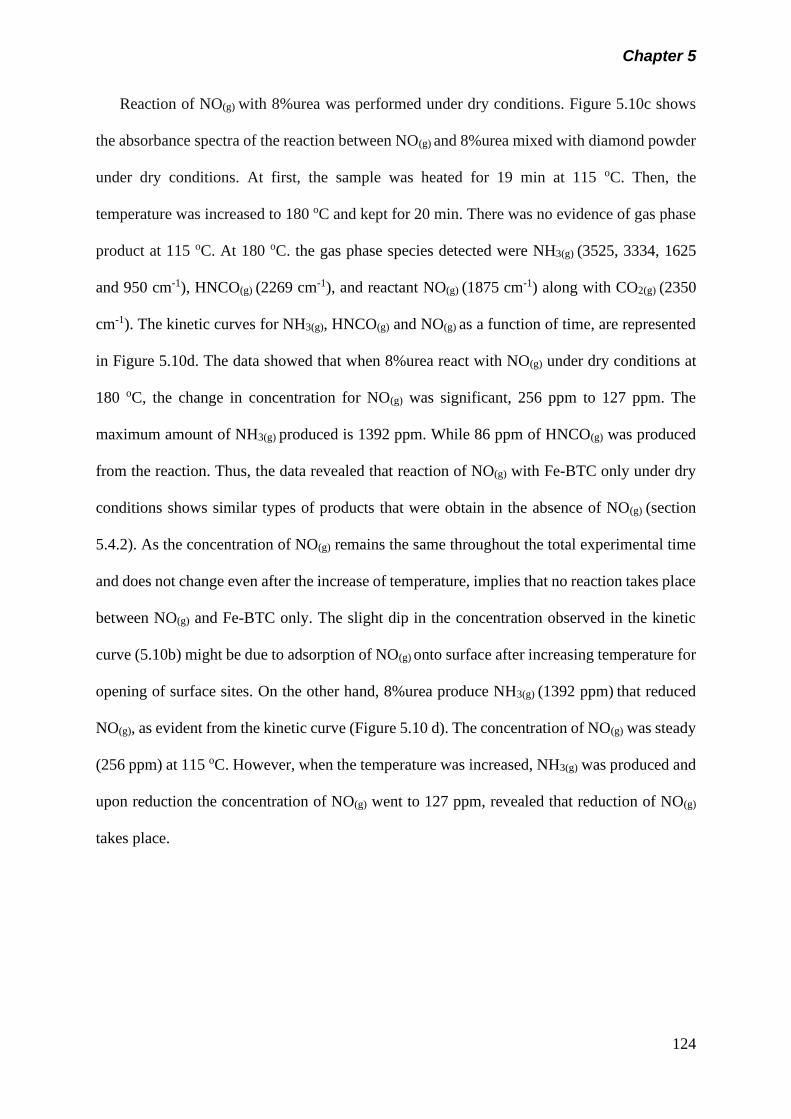
Chapter 5
124
Reaction of NO(g) with 8%urea was performed under dry conditions. Figure 5.10c shows
the absorbance spectra of the reaction between NO(g) and 8%urea mixed with diamond powder
under dry conditions. At first, the sample was heated for 19 min at 115 oC. Then, the
temperature was increased to 180 oC and kept for 20 min. There was no evidence of gas phase
product at 115 oC. At 180 oC. the gas phase species detected were NH3(g) (3525, 3334, 1625
and 950 cm-1), HNCO(g) (2269 cm-1), and reactant NO(g) (1875 cm-1) along with CO2(g) (2350
cm-1). The kinetic curves for NH3(g), HNCO(g) and NO(g) as a function of time, are represented
in Figure 5.10d. The data showed that when 8%urea react with NO(g) under dry conditions at
180 oC, the change in concentration for NO(g) was significant, 256 ppm to 127 ppm. The
maximum amount of NH3(g) produced is 1392 ppm. While 86 ppm of HNCO(g) was produced
from the reaction. Thus, the data revealed that reaction of NO(g) with Fe-BTC only under dry
conditions shows similar types of products that were obtain in the absence of NO(g) (section
5.4.2). As the concentration of NO(g) remains the same throughout the total experimental time
and does not change even after the increase of temperature, implies that no reaction takes place
between NO(g) and Fe-BTC only. The slight dip in the concentration observed in the kinetic
curve (5.10b) might be due to adsorption of NO(g) onto surface after increasing temperature for
opening of surface sites. On the other hand, 8%urea produce NH3(g) (1392 ppm) that reduced
NO(g), as evident from the kinetic curve (Figure 5.10 d). The concentration of NO(g) was steady
(256 ppm) at 115 oC. However, when the temperature was increased, NH3(g) was produced and
upon reduction the concentration of NO(g) went to 127 ppm, revealed that reduction of NO(g)
takes place.
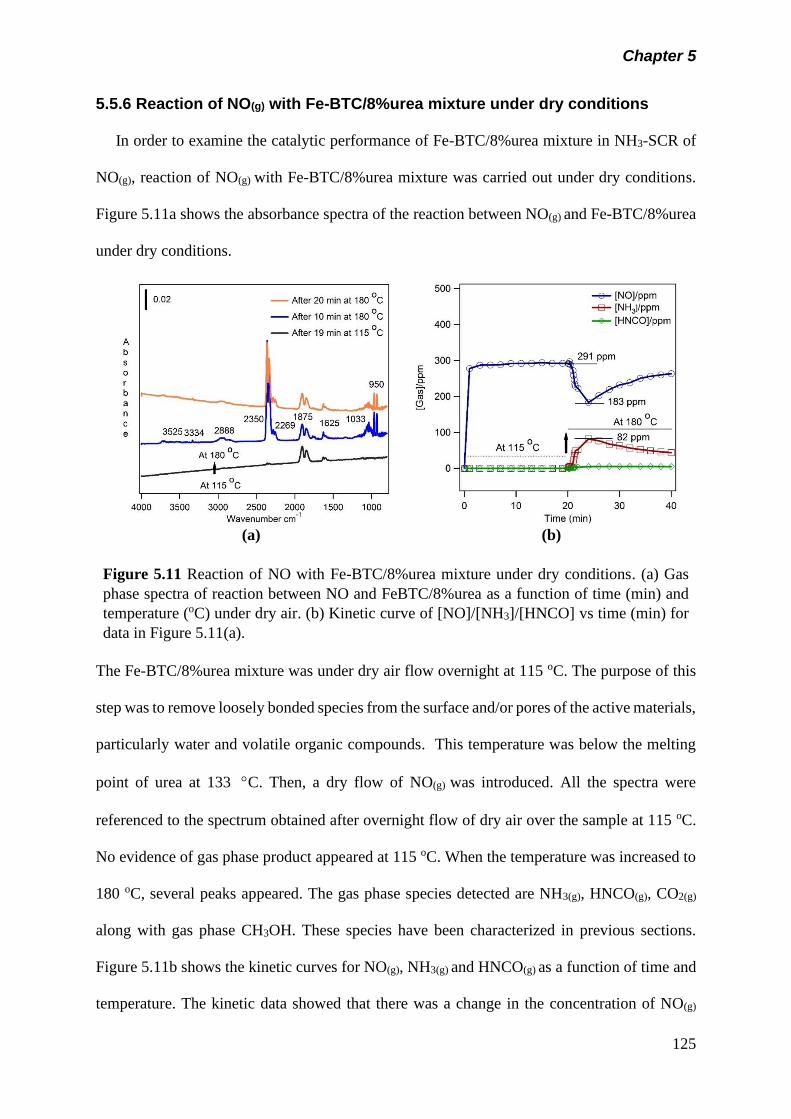
Chapter 5
125
5.5.6 Reaction of NO(g) with Fe-BTC/8%urea mixture under dry conditions
In order to examine the catalytic performance of Fe-BTC/8%urea mixture in NH3-SCR of
NO(g), reaction of NO(g) with Fe-BTC/8%urea mixture was carried out under dry conditions.
Figure 5.11a shows the absorbance spectra of the reaction between NO(g) and Fe-BTC/8%urea
under dry conditions.
(a)
(b)
Figure 5.11 Reaction of NO with Fe-BTC/8%urea mixture under dry conditions. (a) Gas
phase spectra of reaction between NO and FeBTC/8%urea as a function of time (min) and
temperature (oC) under dry air. (b) Kinetic curve of [NO]/[NH3]/[HNCO] vs time (min) for
data in Figure 5.11(a).
The Fe-BTC/8%urea mixture was under dry air flow overnight at 115 oC. The purpose of this
step was to remove loosely bonded species from the surface and/or pores of the active materials,
particularly water and volatile organic compounds. This temperature was below the melting
point of urea at 133 C. Then, a dry flow of NO(g) was introduced. All the spectra were
referenced to the spectrum obtained after overnight flow of dry air over the sample at 115 oC.
No evidence of gas phase product appeared at 115 oC. When the temperature was increased to
180 oC, several peaks appeared. The gas phase species detected are NH3(g), HNCO(g), CO2(g)
along with gas phase CH3OH. These species have been characterized in previous sections.
Figure 5.11b shows the kinetic curves for NO(g), NH3(g) and HNCO(g) as a function of time and
temperature. The kinetic data showed that there was a change in the concentration of NO(g)
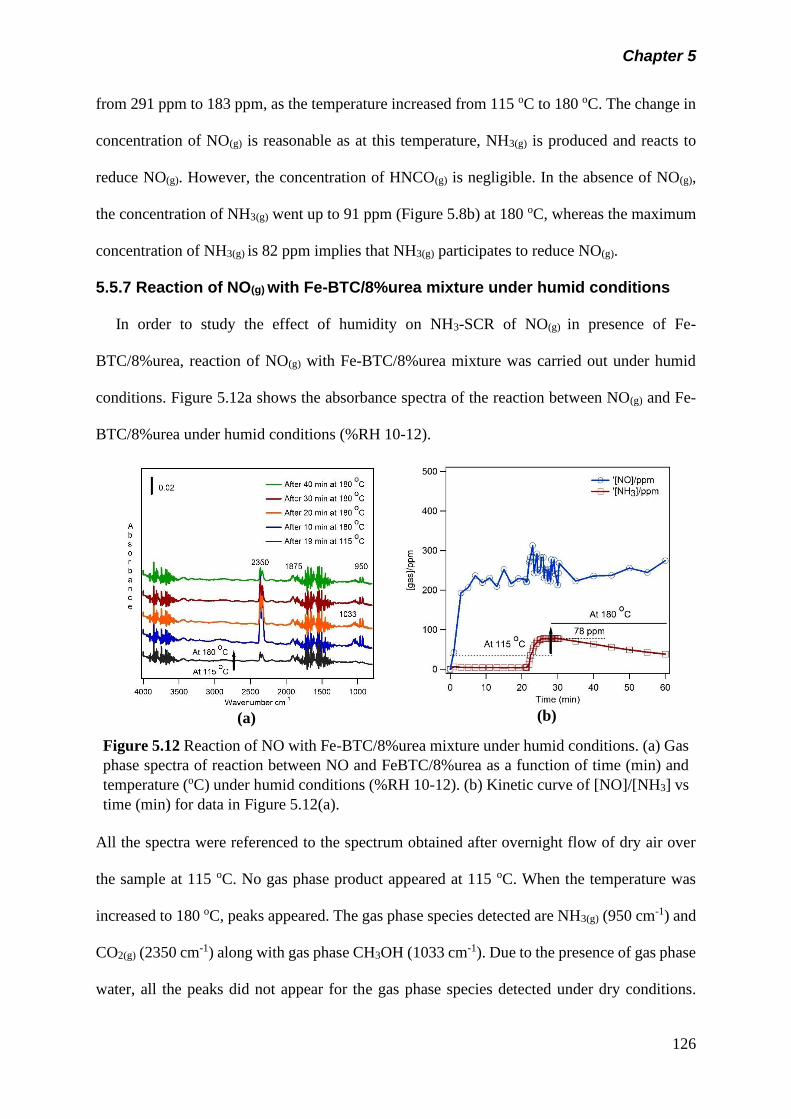
Chapter 5
126
from 291 ppm to 183 ppm, as the temperature increased from 115 oC to 180 oC. The change in
concentration of NO(g) is reasonable as at this temperature, NH3(g) is produced and reacts to
reduce NO(g). However, the concentration of HNCO(g) is negligible. In the absence of NO(g),
the concentration of NH3(g) went up to 91 ppm (Figure 5.8b) at 180 oC, whereas the maximum
concentration of NH3(g) is 82 ppm implies that NH3(g) participates to reduce NO(g).
5.5.7 Reaction of NO(g) with Fe-BTC/8%urea mixture under humid conditions
In order to study the effect of humidity on NH3-SCR of NO(g) in presence of Fe-
BTC/8%urea, reaction of NO(g) with Fe-BTC/8%urea mixture was carried out under humid
conditions. Figure 5.12a shows the absorbance spectra of the reaction between NO(g) and Fe-
BTC/8%urea under humid conditions (%RH 10-12).
(a) (b)
Figure 5.12 Reaction of NO with Fe-BTC/8%urea mixture under humid conditions. (a) Gas
phase spectra of reaction between NO and FeBTC/8%urea as a function of time (min) and
temperature (oC) under humid conditions (%RH 10-12). (b) Kinetic curve of [NO]/[NH3] vs
time (min) for data in Figure 5.12(a).
All the spectra were referenced to the spectrum obtained after overnight flow of dry air over
the sample at 115 oC. No gas phase product appeared at 115 oC. When the temperature was
increased to 180 oC, peaks appeared. The gas phase species detected are NH3(g) (950 cm-1) and
CO2(g) (2350 cm-1) along with gas phase CH3OH (1033 cm-1). Due to the presence of gas phase
water, all the peaks did not appear for the gas phase species detected under dry conditions.
Chapter 5
127
These species have been characterized in previous sections. Figure 5.12d shows the kinetic
curve for NO(g) and NH3(g). The trend of NO(g) concentration fluctuated due to the presence of
gas phase water. However, the average concentration of NO(g) was around 250 ppm. The
maximum amount of NH3(g) product is 78 ppm, less than the amount obtained from the dry
conditions at 180 oC. On the other hand, comparison with the experiment of Fe-BTC/8%urea
in the absence of NO(g) (Figure 5.9b), shows that the concentration of NH3(g) is higher (115
ppm) than in presence of NO(g) under humid conditions at 180 oC. However, the kinetic data
reveals that reduction of NO(g) did not take place under humid conditions.
5.5.8 Reaction of NO(g) with CoFe2O4 under dry conditions
Reaction of NO(g) with CoFe2O4 nanoparticles were investigated in order to compare the
results obtained from the reaction of NO(g) and Fe-BTC. Figure 5.13a show the absorbance
spectra of the reaction between NO(g) and CoFe2O4 as a function of time and temperature.
(a) (b)
Figure 5.13 (a) Gas phase spectra of reaction between NO and CoFe2O4 only as a function
of time (min) and temperature (oC) under dry air. (b) Kinetic curve of [NO] vs time (min)
for data in Figure 5.13(a).
At 115 oC, the spectrum shows peak at 1875 and 1616 cm-1 due to the NO(g) and NO2(g),
respectively. However, when the temperature is increased to 180 oC, CO2(g) show up at 2350
cm-1. Figure 5.13b shows the kinetic curve for NO(g) as a function of time and temperature. The
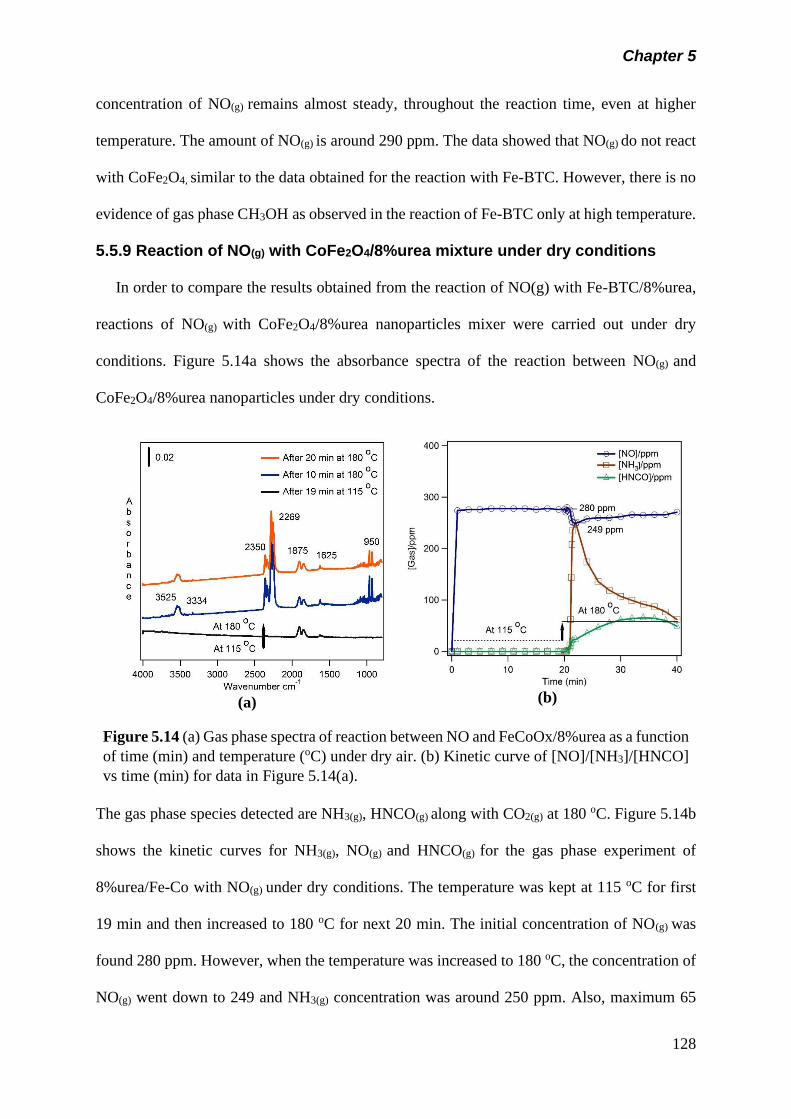
Chapter 5
128
concentration of NO(g) remains almost steady, throughout the reaction time, even at higher
temperature. The amount of NO(g) is around 290 ppm. The data showed that NO(g) do not react
with CoFe2O4, similar to the data obtained for the reaction with Fe-BTC. However, there is no
evidence of gas phase CH3OH as observed in the reaction of Fe-BTC only at high temperature.
5.5.9 Reaction of NO(g) with CoFe2O4/8%urea mixture under dry conditions
In order to compare the results obtained from the reaction of NO(g) with Fe-BTC/8%urea,
reactions of NO(g) with CoFe2O4/8%urea nanoparticles mixer were carried out under dry
conditions. Figure 5.14a shows the absorbance spectra of the reaction between NO(g) and
CoFe2O4/8%urea nanoparticles under dry conditions.
(a)
(b)
Figure 5.14 (a) Gas phase spectra of reaction between NO and FeCoOx/8%urea as a function
of time (min) and temperature (oC) under dry air. (b) Kinetic curve of [NO]/[NH3]/[HNCO]
vs time (min) for data in Figure 5.14(a).
The gas phase species detected are NH3(g), HNCO(g) along with CO2(g) at 180 oC. Figure 5.14b
shows the kinetic curves for NH3(g), NO(g) and HNCO(g) for the gas phase experiment of
8%urea/Fe-Co with NO(g) under dry conditions. The temperature was kept at 115 oC for first
19 min and then increased to 180 oC for next 20 min. The initial concentration of NO(g) was
found 280 ppm. However, when the temperature was increased to 180 oC, the concentration of
NO(g) went down to 249 and NH3(g) concentration was around 250 ppm. Also, maximum 65
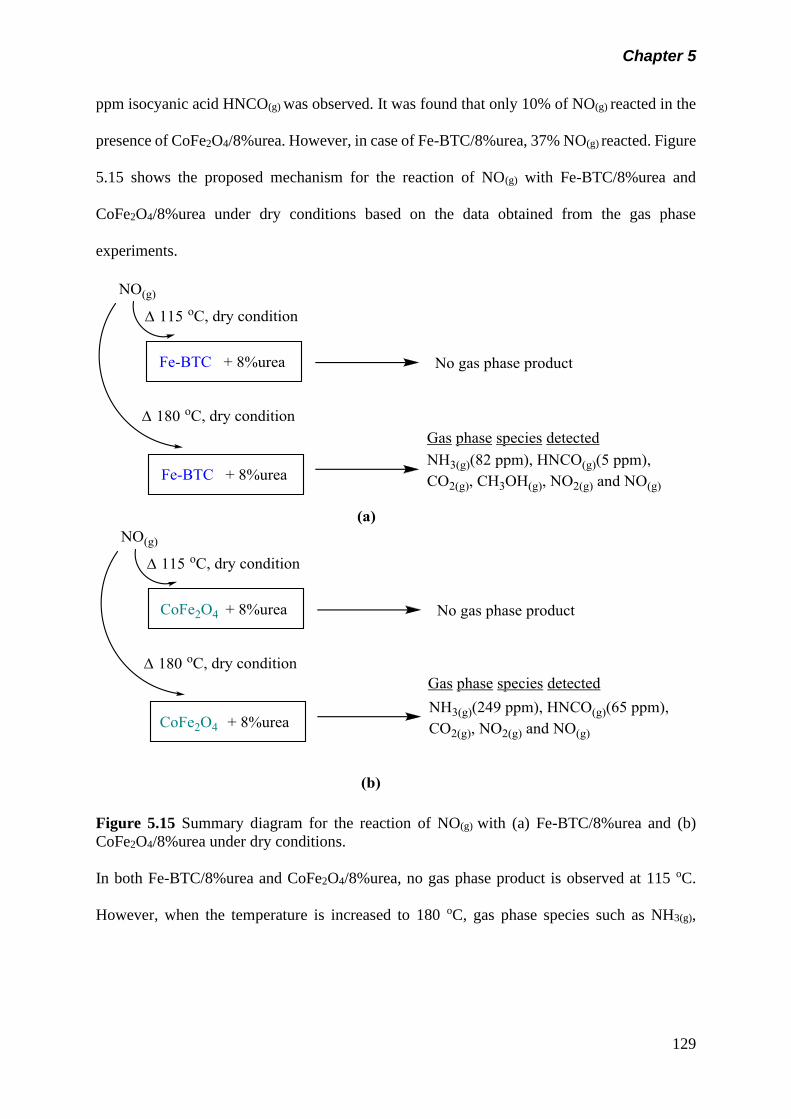
Chapter 5
129
ppm isocyanic acid HNCO(g) was observed. It was found that only 10% of NO(g) reacted in the
presence of CoFe2O4/8%urea. However, in case of Fe-BTC/8%urea, 37% NO(g) reacted. Figure
5.15 shows the proposed mechanism for the reaction of NO(g) with Fe-BTC/8%urea and
CoFe2O4/8%urea under dry conditions based on the data obtained from the gas phase
experiments.
Figure 5.15 Summary diagram for the reaction of NO(g) with (a) Fe-BTC/8%urea and (b)
CoFe2O4/8%urea under dry conditions.
In both Fe-BTC/8%urea and CoFe2O4/8%urea, no gas phase product is observed at 115 oC.
However, when the temperature is increased to 180 oC, gas phase species such as NH3(g),
Chapter 5
130
HNCO(g), CO2(g), NO2(g) and NO(g) was detected. In addition, gas phase CH3OH was observed
in case Fe-BTC/8%urea due to catalytic hydrogenation of CO2(g).
5.6 Conclusion
In summary the presence of urea appears to change the type of surface functional groups
on Fe-BTC and CoFe2O4. The reaction of NO(g) with Fe-BTC/8%urea and CoFe2O4/8%urea
end up producing gas phase products such as NH3, HNCO and CO2. In addition, gas phase
CH3OH is observed from catalytic hydrogenation in presence of Fe-BTC. The data reveals that
8%urea with diamond mixed produced the maximum amount of NH3(g) 1392 ppm under dry
conditions. This amount increased to 2233 ppm in the present of humid air. However, in the
case of 8%urea mixed with Fe-BTC and CoFe2O4, the results were completely different. Humid
conditions did not favor the production of NH3(g) as demonstrated by the data analysis.
However, CoFe2O4 nanoparticle showed better performance compared to Fe-BTC MOFs,
considering the rate of conversion of NO(g), which are 2.3±0.03 ppm·m-2·min-1 and 0.22±0.04
ppm·m-2·min-1, respectively. This is expected, since the conversion rate depends on the
concentration of the NH3(g) produced during the reaction. The data reveals that NH3(g) produced
from the decomposition of Fe-BTC/8%urea is trapped into the pores of Fe-BTC MOFs, results
in a lower concentration of NH3(g) in the system. In contrast, decomposition of
CoFe2O4/8%urea releases more NH3(g), increasing the conversion of NO(g).
5.7 References
(1) Xu, J.; Chen, G.; Guo, F.; Xie, J. Development of Wide-Temperature Vanadium-Based
Catalysts for Selective Catalytic Reducing of NOx with Ammonia: Review. Chem. Eng.
J. 2018, 353, 507–518.
(2) Roy, S.; Hegde, M. S.; Madras, G. Catalysis for NOx Abatement. Appl. Energy 2009, 86
(11), 2283–2297.
Chapter 5
131
(3) Ma, L.; Cheng, Y.; Cavataio, G.; McCabe, R. W.; Fu, L.; Li, J. In Situ DRIFTS and
Temperature-Programmed Technology Study on NH3-SCR of NOx over Cu-SSZ-13
and Cu-SAPO-34 Catalysts. Appl. Catal. B Environ. 2014, 156–157, 428–437.
(4) Cheng, X.; Bi, X. T. A Review of Recent Advances in Selective Catalytic NOx
Reduction Reactor Technologies. Particuology 2014, 16, 1–18.
(5) Lu, P.; Li, R.; Xing, Y.; Li, Y.; Zhu, T.; Yue, H.; Wu, W. Low Temperature Selective
Catalytic Reduction of NOX with NH3 by Activated Coke Loaded with Fe x Coy CezO
M : The Enhanced Activity, Mechanism and Kinetics. Fuel 2018, 233 (January), 188–
199.
(6) Gao, F.; Tang, X.; Yi, H.; Zhao, S.; Li, C.; Li, J.; Shi, Y.; Meng, X. A Review on
Selective Catalytic Reduction of NOx by NH3 over Mn–Based Catalysts at Low
Temperatures: Catalysts, Mechanisms, Kinetics and DFT Calculations; 2017; Vol. 7.
(7) Zhou, H.-C. “Joe”; Kitagawa, S. Metal–Organic Frameworks (MOFs). Chem. Soc. Rev.
2014, 43 (16), 5415–5418.
(8) Furukawa, H.; Ko, N.; Go, Y. B.; Aratani, N.; Choi, S. B.; Choi, E.; Yazaydin, a O.;
Snurr, R. Q.; O’Keeffe, M.; Kim, J.; et al. Ultrahigh Porosity in Meta-Organic
Frameworks. Science. 2010, 329 (5990), 424.
(9) Czaja, A. U.; Trukhan, N.; Müller, U. Industrial Applications of Metal–Organic
Frameworks. Chem. Soc. Rev. 2009, 38 (5), 1284.
(10) Wang, Q.; Luo, J.; Zhong, Z.; Borgna, A. CO2 Capture by Solid Adsorbents and Their
Applications: Current Status and New Trends. Energy Environ. Sci. 2011, 4 (1), 42–55.
(11) Chaemchuen, S.; Kabir, N. A.; Zhou, K.; Verpoort, F. Metal–Organic Frameworks for
Upgrading Biogas via CO2 Adsorption to Biogas Green Energy. Chem. Soc. Rev. 2013,
Chapter 5
132
42 (24), 9304.
(12) Furukawa, H.; Cordova, K. E.; O’Keeffe, M.; Yaghi, O. M. The Chemistry and
Applications of Metal-Organic Frameworks. Science.. 2013, 341 (6149).
(13) Zou, L.; Zhou, H. C. Hydrogen Storage in Metal-Organic Frameworks. Nanostructured
Mater. Next-Generation Energy Storage Convers. Hydrog. Prod. Storage, Util. 2017,
143–170.
(14) Sumida, K.; Rogow, D. L.; Mason, J. A.; McDonald, T. M.; Bloch, E. D.; Herm, Z. R.;
Bae, T.-H.; Long, J. R. Carbon Dioxide Capture in Metal–Organic Frameworks. Chem.
Rev. 2012, 112 (2), 724–781.
(15) Huang, C. Y.; Song, M.; Gu, Z. Y.; Wang, H. F.; Yan, X. P. Probing the Adsorption
Characteristic of Metal-Organic Framework MIL-101 for Volatile Organic Compounds
by Quartz Crystal Microbalance. Environ. Sci. Technol. 2011, 45 (10), 4490–4496.
(16) Dutta, A.; Wong-Foy, A. G.; Matzger, A. J. Coordination Copolymerization of Three
Carboxylate Linkers into a Pillared Layer Framework. Chem. Sci. 2014, 5 (10), 3729–
3734.
(17) Li, J. R.; Kuppler, R. J.; Zhou, H. C. Selective Gas Adsorption and Separation in Metal-
Organic Frameworks. Chem. Soc. Rev. 2009, 38 (5), 1477–1504.
(18) Zhao, X.; Wang, Y.; Li, D. S.; Bu, X.; Feng, P. Metal–Organic Frameworks for
Separation. Adv. Mater. 2018, 30 (37), 869–932.
(19) Youn, H. K.; Kim, J.; Ahn, W. S. MWCNT Synthesis over Fe-BTC as a Catalyst/Carbon
Source via CVD. Mater. Lett. 2011, 65 (19–20), 3055–3057.
(20) Dhakshinamoorthy, A.; Alvaro, M.; Horcajada, P.; Gibson, E.; Vishnuvarthan, M.;
Vimont, A.; Grenèche, J. M.; Serre, C.; Daturi, M.; Garcia, H. Comparison of Porous
Chapter 5
133
Iron Trimesates Basolite F300 and MIL-100(Fe) as Heterogeneous Catalysts for Lewis
Acid and Oxidation Reactions: Roles of Structural Defects and Stability. ACS Catal.
2012, 2 (10), 2060–2065.
(21) Shahid, S.; Nijmeijer, K. High Pressure Gas Separation Performance of Mixed-Matrix
Polymer Membranes Containing Mesoporous Fe(BTC). J. Memb. Sci. 2014, 459, 33–
44.
(22) Yang, Y.; Bai, Y.; Zhao, F.; Yao, E.; Yi, J.; Xuan, C.; Chen, S. Effects of Metal Organic
Framework Fe-BTC on the Thermal Decomposition of Ammonium Perchlorate. RSC
Adv. 2016, 6, 67308–67314.
(23) Du, M.; Li, L.; Li, M.; Si, R. Adsorption Mechanism on Metal Organic Frameworks of
Cu-BTC, Fe-BTC and ZIF-8 for CO2 Capture Investigated by X-Ray Absorption Fine
Structure. RSC Adv. 2016, 6 (67), 62705–62716.
(24) No Title https://commons.wikimedia.org/wiki/File:CoFe2O4.png.
(25) Wang, D.; Hui, S.; Liu, C. Mass Loss and Evolved Gas Analysis in Thermal
Decomposition of Solid Urea. Fuel 2017, 207 (2), 268–273.
(26) Wang, H.; Agmon, N. Complete Assignment of the Infrared Spectrum of the Gas-Phase
Protonated Ammonia Dimer. J. Phys. Chem. A 2016, 120 (19), 3117–3135.
(27) Yang, Y.; Bai, Y.; Zhao, F.; Yao, E.; Yi, J.; Xuan, C.; Chen, S. Effects of Metal Organic
Framework Fe-BTC on the Thermal Decomposition of Ammonium Perchlorate. RSC
Adv. 2016, 6 (71), 67308–67314.
(28) Bukhtiyarova, M.; Lunkenbein, T.; Kähler, K.; Schlögl, R. Methanol Synthesis from
Industrial CO2 Sources: A Contribution to Chemical Energy Conversion. Catal. Letters
2017, 147 (2), 416–427.

Chapter 5
134
(29) Gadzhiev, O. B.; Ignatov, S. K.; Gangopadhyay, S.; Masunov, A. E.; Petrov, A. I.
Mechanism of Nitric Oxide Oxidation Reaction (2NO+ O2 → 2NO2) Revisited. J. Chem.
Theory Comput. 2011, 7 (7), 2021–2024.
Chapter 6
135
Chapter 6 Conclusion and Significance
Iron is ubiquitous in nature and the presence of iron in the aquatic environment, mineral
dust, rocks and soils emphasizes its involvement in various environmental processes. The
chapters of this thesis highlight the chemistry of iron-containing materials and their role in
three different environmental arenas such as aqueous geochemistry, heterogenous atmospheric
chemistry and environmental catalysis and remediation.
The interactions of organic matter with metal oxide surfaces occurs through several
mechanisms in aquatic environment. In this study, the interactions of low molecular weight
organics that include citric acid, oxalic acid and pyrocatechol on hematite nanoparticles have
been studied from in situ measurements (please see details in chapter 2). Spectroscopic data
have been analyzed for the structure of surface complexes and binding strength using ATR-
FTIR. ATR-FTIR absorption spectra of adsorbed citrate, oxalate, and pyrocatechol on hematite
nanoparticles were collected after flowing 10-4 M solutions prepared in D2O as a function of
decreasing pD from 9 to 5. H/D exchange experiment spectral analyses revealed the existence
of a higher degree of outer-sphere complexation for oxalate than citrate, which is dominated
by inner-sphere monodentate complexes. In the case of pyrocatechol bidentate-binuclear
complexes dominate. Moreover, experiments were performed for the adsorption kinetics of
dimethylarsinic acid (DMA) and sodium arsenate with hematite nanoparticles pre-exposed to
low molecular weight organics such as oxalate and pyrocatechol (please see details in chapter
3). These studies were conducted using ATR-FTIR with an emphasis on the role that
electrolytes (KCl, NaCl, and KBr) play in the adsorption process. The results showed that the
adsorption rates, obtained from the Langmuir adsorption kinetic model for model organics onto
hematite surface were enhanced in the presence of electrolytes. The rate of adsorption for the
arsenicals onto pre-exposed model organic hematite surface were greater in the presence of
electrolytes. Experiments on the desorption of model organics from the surface of hematite
Chapter 6
136
nanoparticles were also carried out to obtain initial rates of desorption using the Langmuir
desorption kinetic model. These data reveal that arsenate is an effective desorbing agent for the
model organics. The results obtained from these studies are significant and give a better
understanding of how different functional groups (such as -OH and -COOH) affect the binding
of organic matter onto iron oxide surface. Besides, the study highlights that in situ flow mode
experiments can amplify trends otherwise missed in bulk batch adsorption experiments.
Considering the ubiquity of organic–metal oxide interfaces in environment, mechanistic details
at the molecular level are best elucidated from experimental procedures that mimic real systems
and conditions. Moreover, kinetics and thermodynamic parameters obtained from these
investigations will aid in the development of models to understand the transport and mobility
of organics and other associated constituents (such as Fe, As) in soil and aquatic system.
In addition, the hygroscopic properties and chemical reactivity of SOA influence their
overall contribution to the heterogenous atmospheric chemistry. In this study, the hygroscopic
properties of organic and organometallic polymeric particles, namely polycatechol,
polyguaiacol, Fe-polyfumarte, and Fe-polymuconate were investigated (please see details in
Chapter 4). It has been found that these particles are efficiently formed in iron-catalyzed
reactions with aromatic and aliphatic dicarboxylic acid compounds detected in field-collected
SOA. The structure of surface water was studied using DRIFTS, and the uptake of gaseous
water was quantified using QCM as a function of relative humidity. Spectroscopic data show
that water bonding with organic functional groups acting as hydrogen bond acceptors causes
shifts in their vibrational modes. Analysis of the hydroxyl group stretching region exhibited
weak and strong hydrogen bonding networks that suggest cluster formation reflecting water-
water and water-organics interactions, respectively. The results obtained from this study are
significant because water plays a vital role in reactions with the pollutant gases. Moreover, the
radiative balance of the atmosphere depends on the chemical composition, physical state (such
Chapter 6
137
as solid or liquid) and the size of the particles. Besides, the results presented herein are
important since global climate models need better parametrization of the hygroscopic
properties and chemical reactivity of SOA.
On the chemistry of iron in heterogeneous remediation, iron-containing materials have been
used as a catalyst in various systems. Here, Fe-BTC MOFs and CoFe2O4 nanomaterials have
been studied as catalysts to explore their performance in reducing NOx in NH3-SCR by
DRIFTS (please see details in Chapter 5). From the spectroscopic data analysis, it was found
that both Fe-BTC and CoFe2O4 contributed to the reduction of NOx, in presence of urea, the
source of in situ ammonia (NH3) and experienced structural change in the surface functional
groups. For both materials, gas phase products were observed at 180 C. From the data analysis
and kinetic studies, it was found that CoFe2O4/8%urea has the better rate for the conversion of
NO(g), compared to Fe-BTC/8%urea. The proposed mechanism and kinetic study show that at
115 oC, no gas phase product is observed. However, increase of the temperature to 180 oC
produced gases such as NH3(g), HCNO(g) and CO2(g). In addition, gas phase CH3OH was
observed for the decomposition of Fe-BTC only. The concentration of NH3(g) after
decomposition of CoFe2O4/8%urea, was much better than that of Fe-BTC/8%urea, that results
in better conversion rate of NO(g) for CoFe2O4 compared to Fe-BTC. Even though, the surface
area of Fe-BTC (771 m2/g) is larger than that of CoFe2O4 (43 m2/g). The results of these
experiments are significant, as extensive studies are underway to develop NH3-SCR catalysts
with high activity and stability in the low-temperature range, for the removal of NOx from both
flue and stationary sources. Introducing Fe-BTC metal-organic frameworks (MOFs) and
CoFe2O4 nanomaterials to NH3-SCR as a catalyst is very significant in this regard.
In brief, the main focuses of this thesis are to explore iron in understanding soil chemistry
in the presence of organic matter, mineral dust chemistry, and designing environmental
remediation technologies. Taking into account the intensive studies in these three branches of

Chapter 6
138
environment, it can be concluded that the impact of this research in heterogeneous chemistry
of iron at the liquid-solid and gas-solid interface will bridge the knowledge gaps in the
chemistry of transition-metal in multicomponent atmospheric aerosol systems containing
organic matter as well as remediating environmental pollutants.
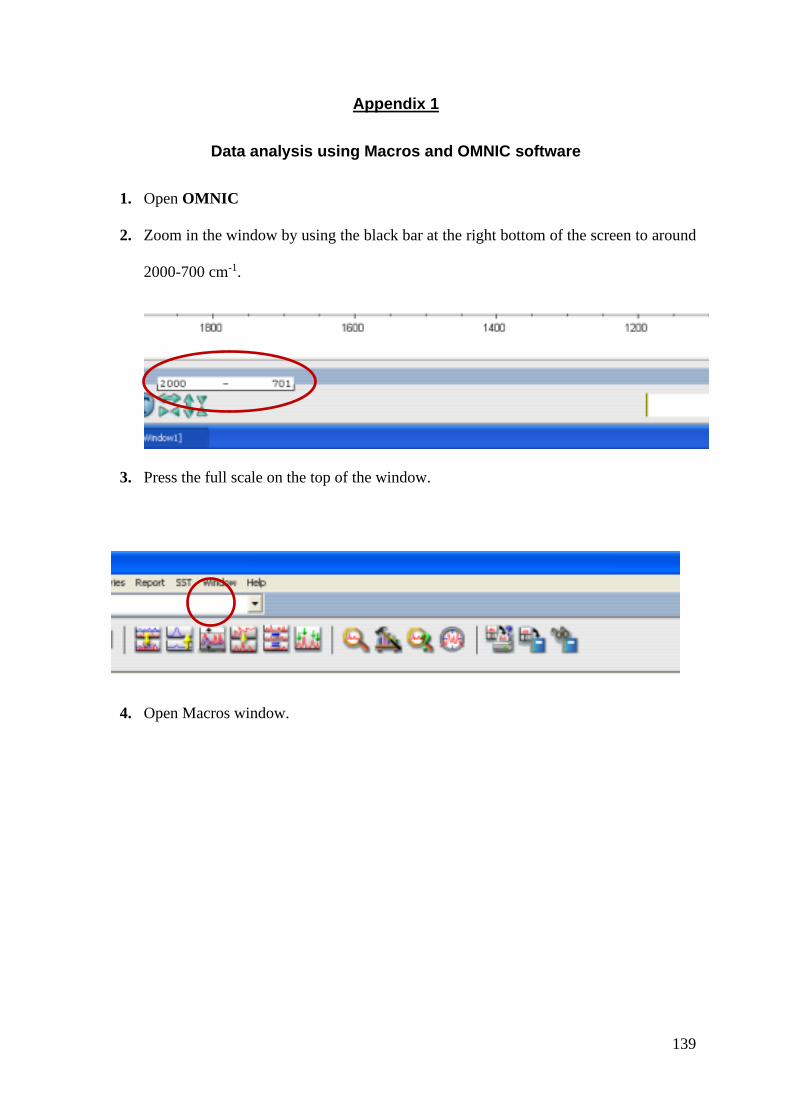
139
Appendix 1
Data analysis using Macros and OMNIC software
1. Open OMNIC
2. Zoom in the window by using the black bar at the right bottom of the screen to around
2000-700 cm-1.
3. Press the full scale on the top of the window.
4. Open Macros window.
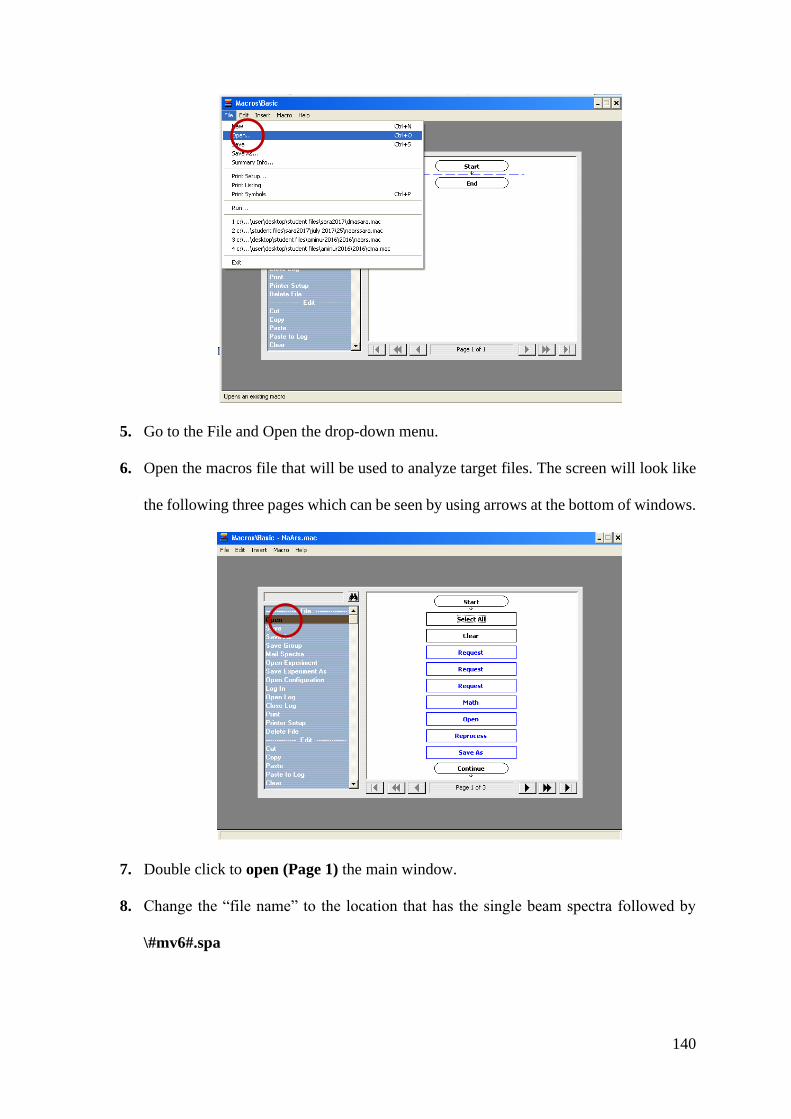
140
5. Go to the File and Open the drop-down menu.
6. Open the macros file that will be used to analyze target files. The screen will look like
the following three pages which can be seen by using arrows at the bottom of windows.
7. Double click to open (Page 1) the main window.
8. Change the “file name” to the location that has the single beam spectra followed by
\#mv6#.spa

141
9. The link of the location of the folder can be found in the top left corner of the windows
when the folder is opened.
10. Press ok to proceed.
11. Double click the “Reprocess” (page 1) after open button.
12. Click browse to select the reference spectrum. The other setting should show up as
displayed above.
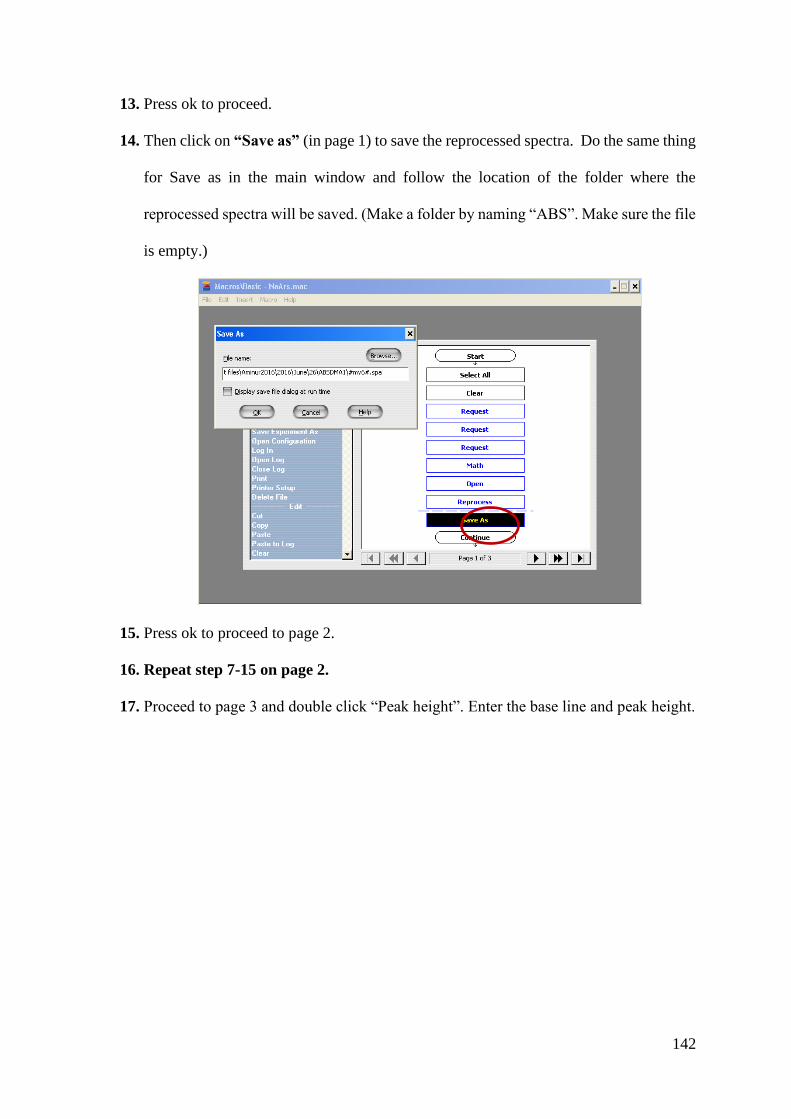
142
13. Press ok to proceed.
14. Then click on “Save as” (in page 1) to save the reprocessed spectra. Do the same thing
for Save as in the main window and follow the location of the folder where the
reprocessed spectra will be saved. (Make a folder by naming “ABS”. Make sure the file
is empty.)
15. Press ok to proceed to page 2.
16. Repeat step 7-15 on page 2.
17. Proceed to page 3 and double click “Peak height”. Enter the base line and peak height.
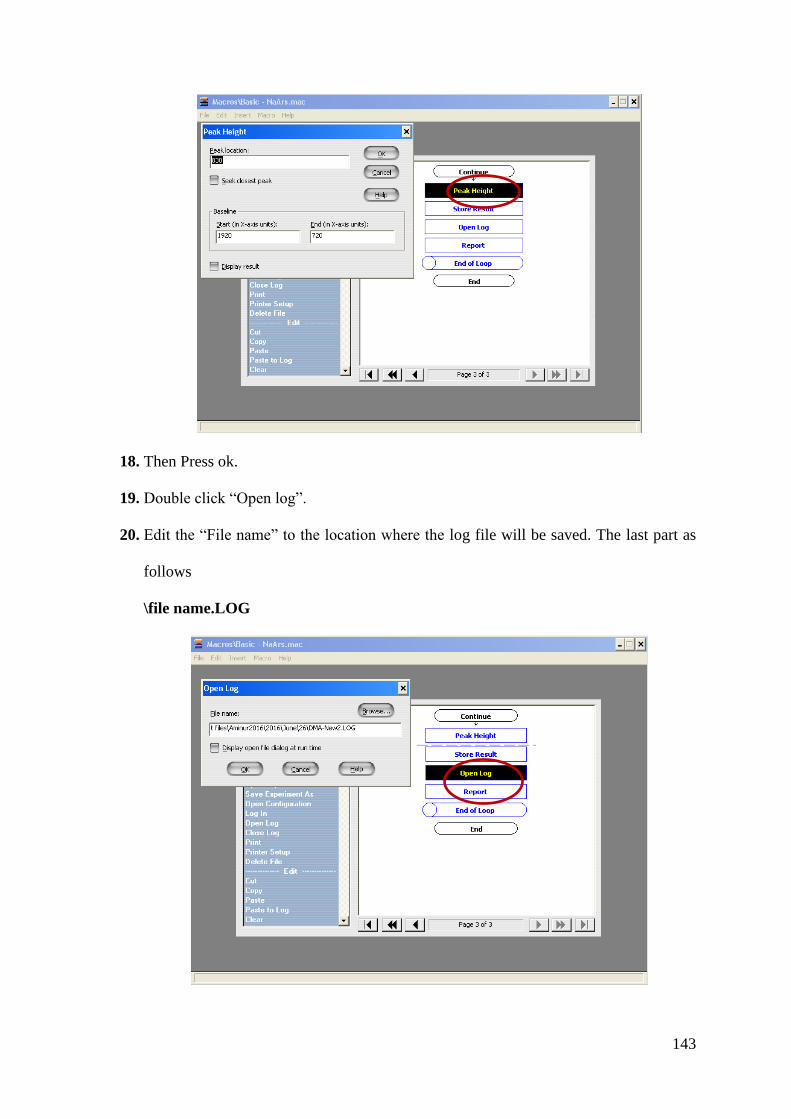
143
18. Then Press ok.
19. Double click “Open log”.
20. Edit the “File name” to the location where the log file will be saved. The last part as
follows
\file name.LOG
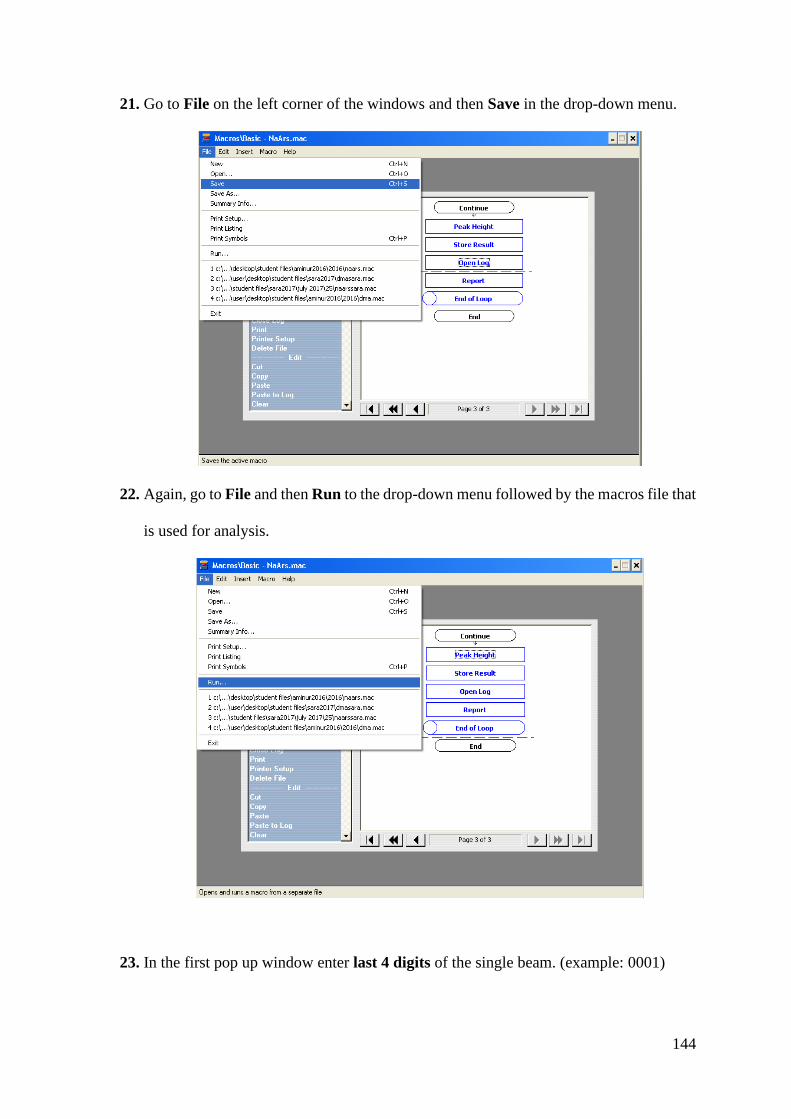
144
21. Go to File on the left corner of the windows and then Save in the drop-down menu.
22. Again, go to File and then Run to the drop-down menu followed by the macros file that
is used for analysis.
23. In the first pop up window enter last 4 digits of the single beam. (example: 0001)
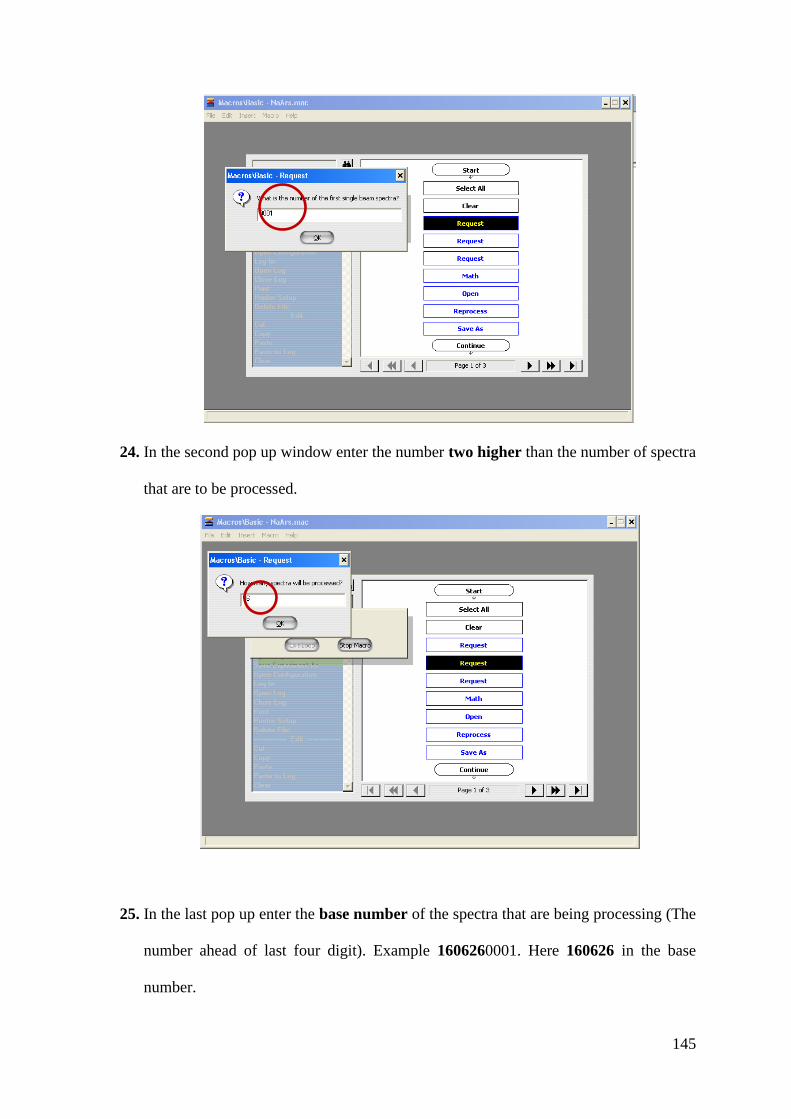
145
24. In the second pop up window enter the number two higher than the number of spectra
that are to be processed.
25. In the last pop up enter the base number of the spectra that are being processing (The
number ahead of last four digit). Example 1606260001. Here 160626 in the base
number.
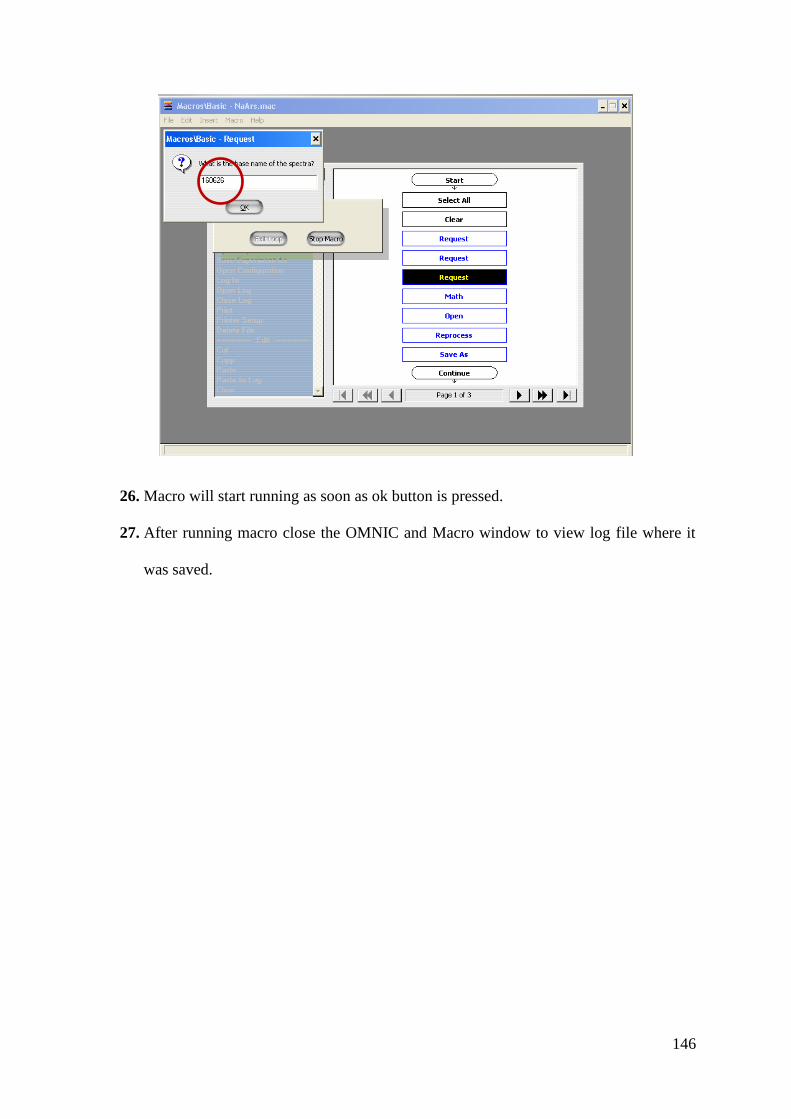
146
26. Macro will start running as soon as ok button is pressed.
27. After running macro close the OMNIC and Macro window to view log file where it
was saved.

147
Appendix 2
Procedure for BET instrument
Step 1 Calibration of Cell with Rod
1. Turn on pump
2. Open the Nitrogen Gas cylinder by turning knob on pump
3. Calibration:
a. Monthly Calibration of Manifold
i. Select Calibration Menu on the Instrument
ii. Select Manifold calibration
iii. Select (4) – Measure
iv. When prompted:
1. Enter Vrod as listed on calibration sheet and press enter
2. Insert the cell with the spring without the rod into station A (right
chamber) using the nut and screw to secure the cell. Then press
enter.
3. Remove the cell and insert the rod into the cell. Then re-insert the
cell into station A and press enter.
4. Manually record the Measured Volume after each repeat
v. Repeat Step iv. 5 times. After the 5th time, select repeat and then select
option (2). When prompted, enter the average of the 3 middle volumes
obtained.
b. Sample Cell Calculation (needs to be completed once)
i. Refer to the log to see if the cell/filling rod combination that will be used
has been calibrated

148
ii. Power on the machine and the vacuum while ensuring that the pressure of
the nitrogen is at 10psi.
iii. On the instrument select the calibration menu
iv. Select sample cell calibration menu
v. Select adsorbate (e.g. Nitrogen)
vi. Select Calculate at run time (exception – if P0 was calculated recently and
is a known value)
vii. When prompted, select which analysis station is the cell attached to.
viii. Enter a cell number (be careful to NOT overwrite another cell number)
ix. Select the type of cell that will be calibrated (e.g. 9mm for long cell with
large bulb)
x. Place the cell in the station that has been selected for calibration
xi. Fill the Dewar ~2/3 with Liquid Nitrogen
xii. Enter 600 sec for thermal equilibrium
Step 2: Evacuation/degassing of sample
1. Ensure that the vacuum is on and that the gas cylinder is at ~10psi
2. Press 3 on the BET instrument (Control Panel)
3. Press 2 on the BET instrument (Degas Station)
4. Press 1 on the BET instrument (Yes [load the degasser])
5. Press 1 on the BET instrument (Vacuum degas)
6. When prompted to, load cells into the degasser or plug degas stations with grey bolt.
7. Press any key on the BET instrument when completed
8. Wait sufficient time for water to be removed from the cell (~10min)
9. Press 2 on the BET instrument (Degas Station), then press 1 on the BET instrument (Yes
[unload the degasser])

149
10. When prompted to, unload the degasser and cover the cells with parafilm. Remember to
plug the degas station with the bolt.
11. Press any key on the BET instrument when completed
12. Obtain the mass of an empty cell and place the sample into the cells using the black funnel
13. Press 2 on the BET instrument (Degas Station)
14. Press 1 on the BET instrument (Yes [load the degasser])
15. Press 1 on the BET instrument (Vacuum)
16. When prompted to, load the degasser and then press any key on the BET instrument
17. Obtain the mass of the cell including the sample
Step 3: Begin analysis using BET instrument
1. Press 1 on the BET instrument (Analysis Menu) and then press 1 again (Run)
2. When prompted to, type in the user ID and hit enter
3. When prompted to, type in load analysis stations
4. Ensure the dewar is filled to the marker (2/3 full) with liquid nitrogen
5. Press 1 on the BET instrument (Continue) and then press 1 or 2 depending on the analysis
station being used. Afterwards press enter
6. Type in number for the set up being used (see white binder for set ups) and press enter
7. Type in number of cell being used (see cell or white binder for cell specs) and press enter
8. Type in number of cell being used (see white binder) and press enter
9. Type in sample ID and press enter
10. Press 1 to add notes or press 2 for no notes
11. Enter the sample mass onto the BET instrument and press enter
12. Press 1 on the BET instrument to begin analysis.
Step 4: Open Novawin software
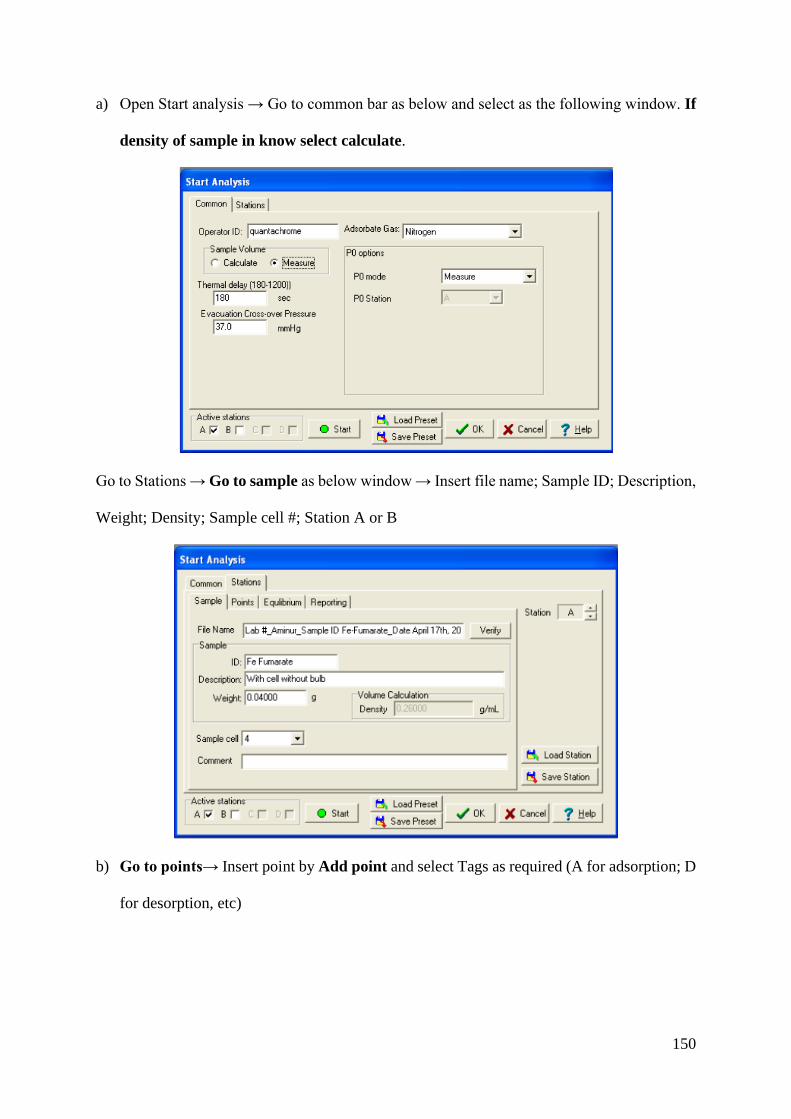
150
a) Open Start analysis → Go to common bar as below and select as the following window. If
density of sample in know select calculate.
Go to Stations → Go to sample as below window → Insert file name; Sample ID; Description,
Weight; Density; Sample cell #; Station A or B
b) Go to points→ Insert point by Add point and select Tags as required (A for adsorption; D
for desorption, etc)
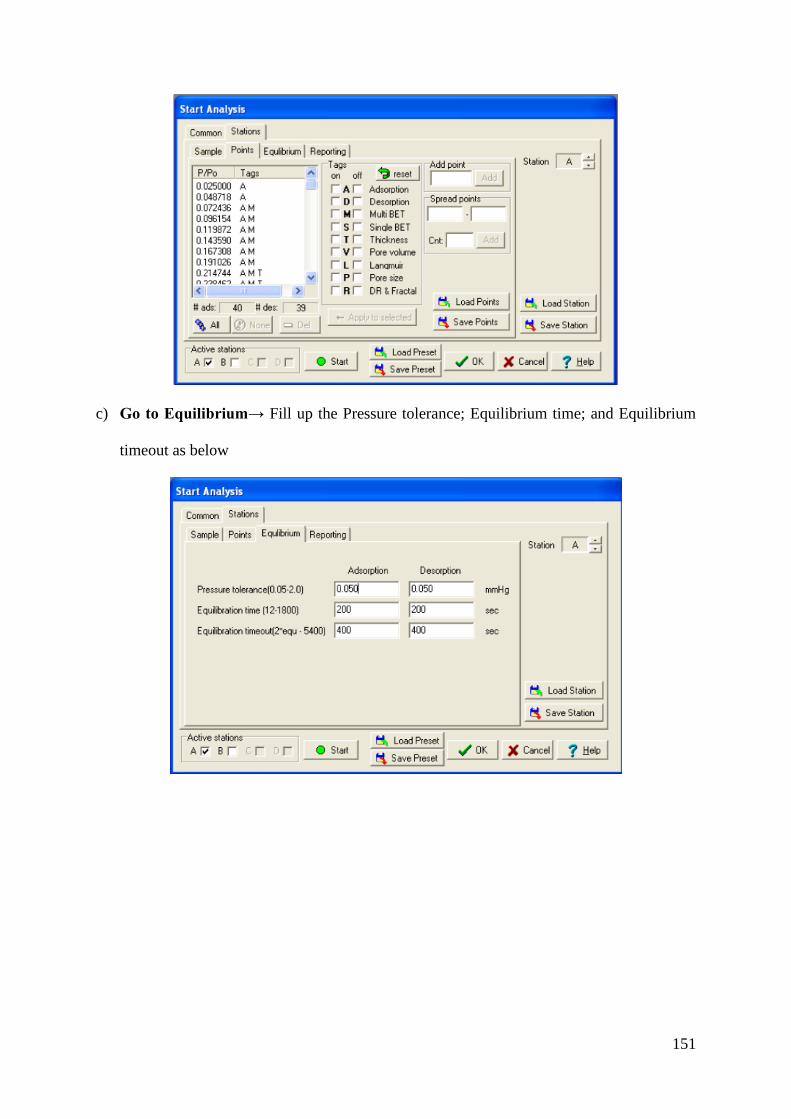
151
c) Go to Equilibrium→ Fill up the Pressure tolerance; Equilibrium time; and Equilibrium
timeout as below
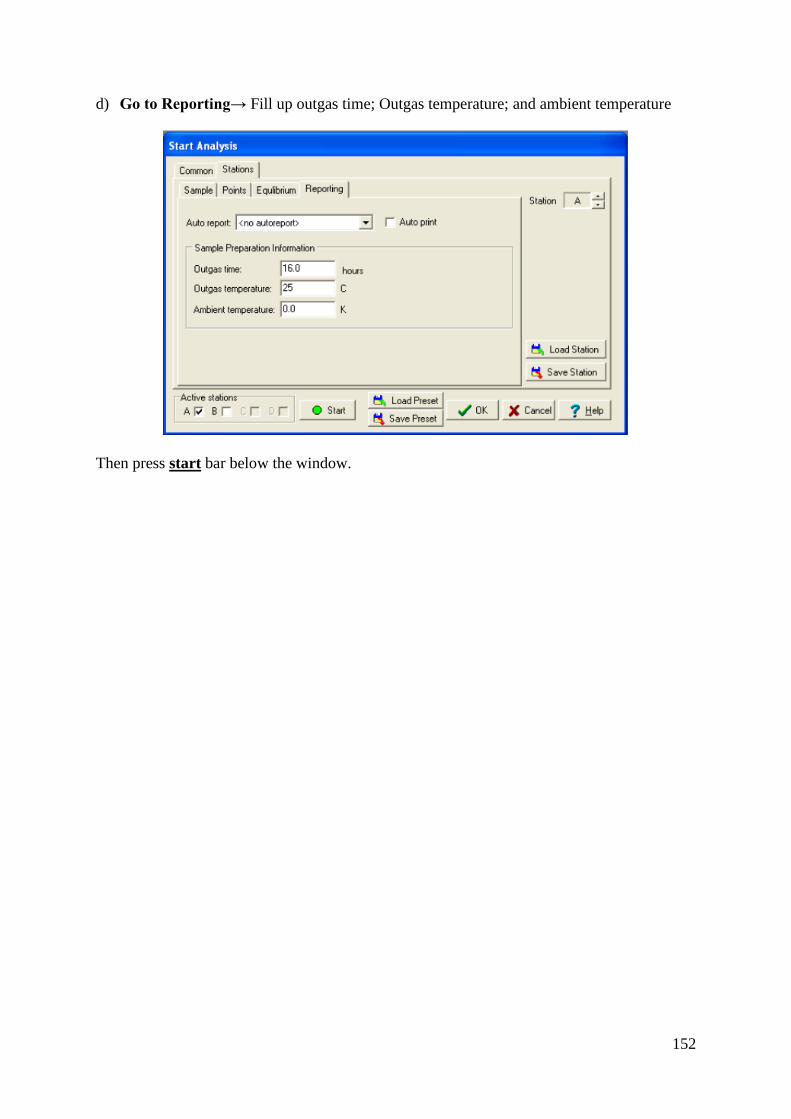
152
d) Go to Reporting→ Fill up outgas time; Outgas temperature; and ambient temperature
Then press start bar below the window.
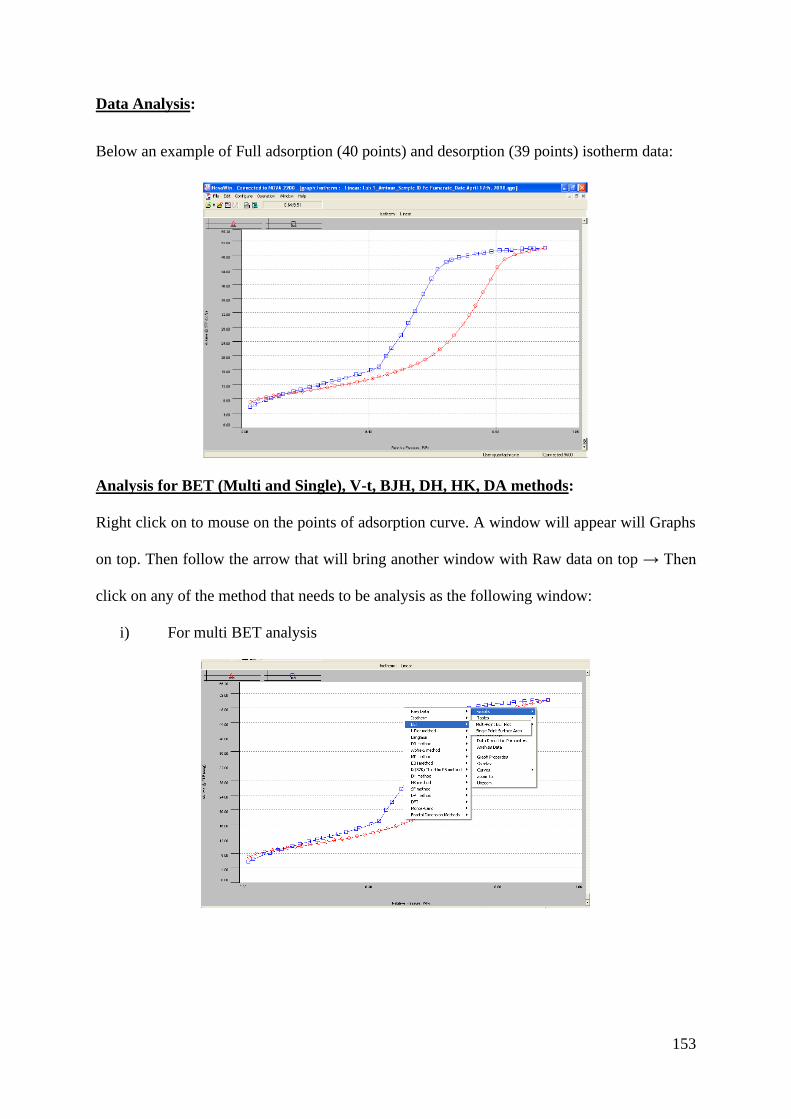
153
Data Analysis:
Below an example of Full adsorption (40 points) and desorption (39 points) isotherm data:
Analysis for BET (Multi and Single), V-t, BJH, DH, HK, DA methods:
Right click on to mouse on the points of adsorption curve. A window will appear will Graphs
on top. Then follow the arrow that will bring another window with Raw data on top → Then
click on any of the method that needs to be analysis as the following window:
i) For multi BET analysis
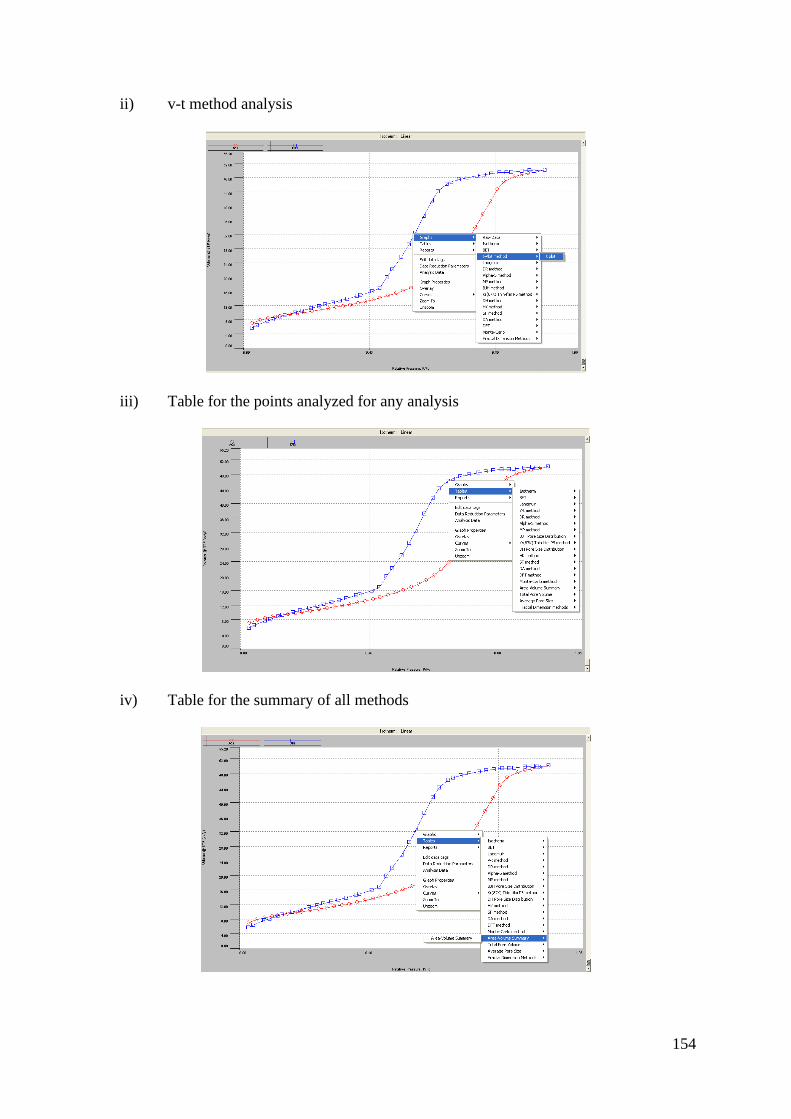
154
ii) v-t method analysis
iii) Table for the points analyzed for any analysis
iv) Table for the summary of all methods
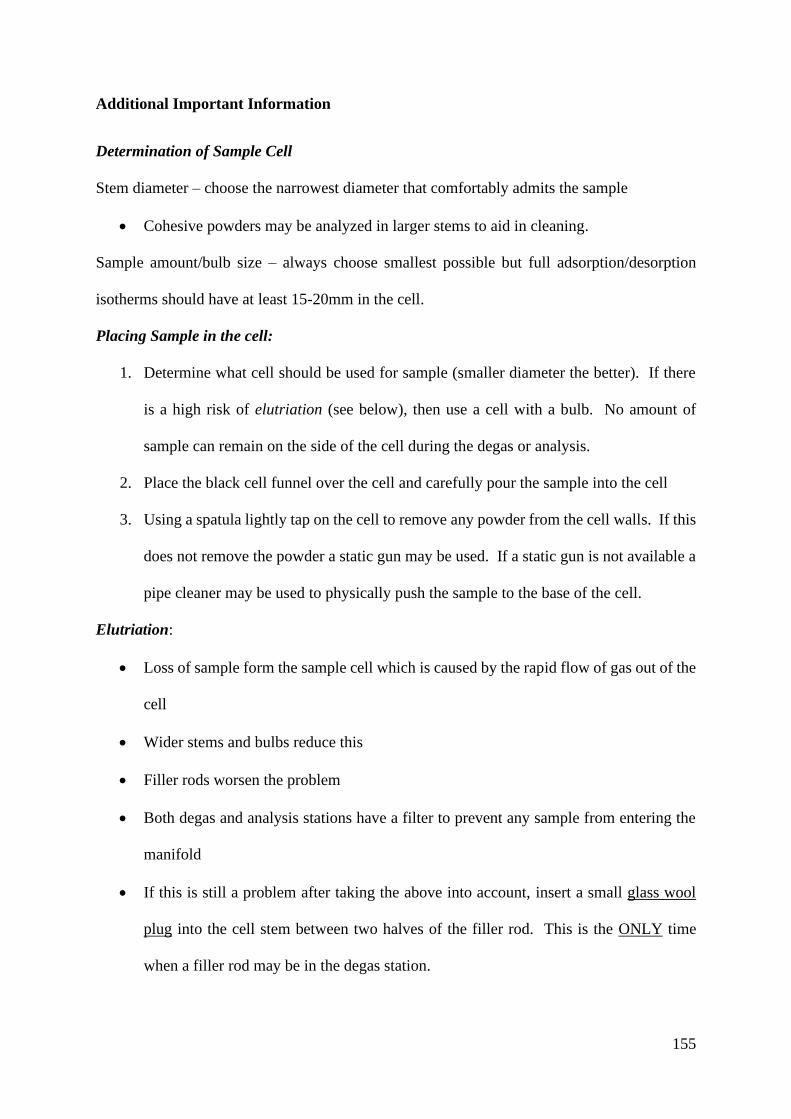
155
Additional Important Information
Determination of Sample Cell
Stem diameter – choose the narrowest diameter that comfortably admits the sample
• Cohesive powders may be analyzed in larger stems to aid in cleaning.
Sample amount/bulb size – always choose smallest possible but full adsorption/desorption
isotherms should have at least 15-20mm in the cell.
Placing Sample in the cell:
1. Determine what cell should be used for sample (smaller diameter the better). If there
is a high risk of elutriation (see below), then use a cell with a bulb. No amount of
sample can remain on the side of the cell during the degas or analysis.
2. Place the black cell funnel over the cell and carefully pour the sample into the cell
3. Using a spatula lightly tap on the cell to remove any powder from the cell walls. If this
does not remove the powder a static gun may be used. If a static gun is not available a
pipe cleaner may be used to physically push the sample to the base of the cell.
Elutriation:
• Loss of sample form the sample cell which is caused by the rapid flow of gas out of the
cell
• Wider stems and bulbs reduce this
• Filler rods worsen the problem
• Both degas and analysis stations have a filter to prevent any sample from entering the
manifold
• If this is still a problem after taking the above into account, insert a small glass wool
plug into the cell stem between two halves of the filler rod. This is the ONLY time
when a filler rod may be in the degas station.

156
Heating the Cell: The amount of heat that is required for the sample depends on the identity
of the sample and its ability to tolerate heat without disrupting the samples structure. Heating
must be done carefully so that water is safely removed from the sample.
Example: fumed silica heated to 300℃
• Remove the grey plug from the degas station
• Seat the thermostat to 40℃ but do not turn on heating mantle
• Push 3 – control panel menu
• Push 2 – degas station
• Degas the sample (WITHOUT ROD) until a good vacuum is established
• Turn on the heating station
• Wait until the temperature reaches 40℃ and hold for 15min
• Increase the thermostat to 80℃, once the temperature reaches this point wait 15 min
then increase to 120℃, again wait until the sample reaches this temperature hold for 15
min, and finally set the thermostat to its final temperature of 300℃ and leave the sample
for 3 hours.
• Return the grey plug to the degas station
To weigh sample:
1. Place sample in the cell
2. Place the cell into the degas station and degas the cell.
3. Backfill the cell with nitrogen and remove the cell from the degas station.
4. Place parafilm/septum cap over the mouth of the cell and weight the cell to the 4th
decimal place (e.g. 0.0001g)
5. Remove the parafilm and replace the cell into the degas station
6. Heat the cell as needed
7. Allow the cell to cool and remove the cell from the degas station

157
8. Replace the parafilm/septum cap and reweight the sample
Equation for mass:
𝑚𝑠𝑎𝑚𝑝𝑙𝑒 = 𝑚𝑐𝑒𝑙𝑙 𝑤𝑖𝑡ℎ 𝑛𝑖𝑡𝑟𝑜𝑔𝑒𝑛 − 𝑚ℎ𝑒𝑎𝑡𝑒𝑑 𝑐𝑒𝑙𝑙
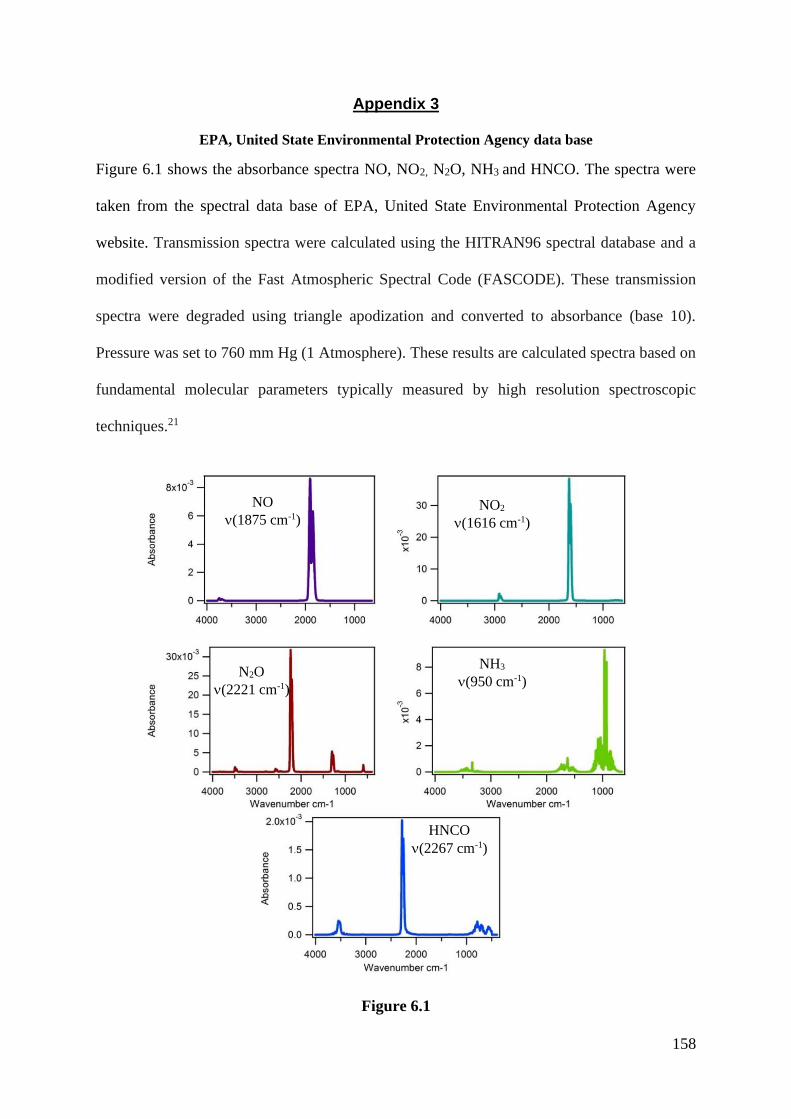
158
Appendix 3
EPA, United State Environmental Protection Agency data base
Figure 6.1 shows the absorbance spectra NO, NO2, N2O, NH3 and HNCO. The spectra were
taken from the spectral data base of EPA, United State Environmental Protection Agency
website. Transmission spectra were calculated using the HITRAN96 spectral database and a
modified version of the Fast Atmospheric Spectral Code (FASCODE). These transmission
spectra were degraded using triangle apodization and converted to absorbance (base 10).
Pressure was set to 760 mm Hg (1 Atmosphere). These results are calculated spectra based on
fundamental molecular parameters typically measured by high resolution spectroscopic
techniques.21
Figure 6.1
NO
(1875 cm-1) NO2
(1616 cm-1)
N2O
(2221 cm-1)
NH3
(950 cm-1)
HNCO
(2267 cm-1)
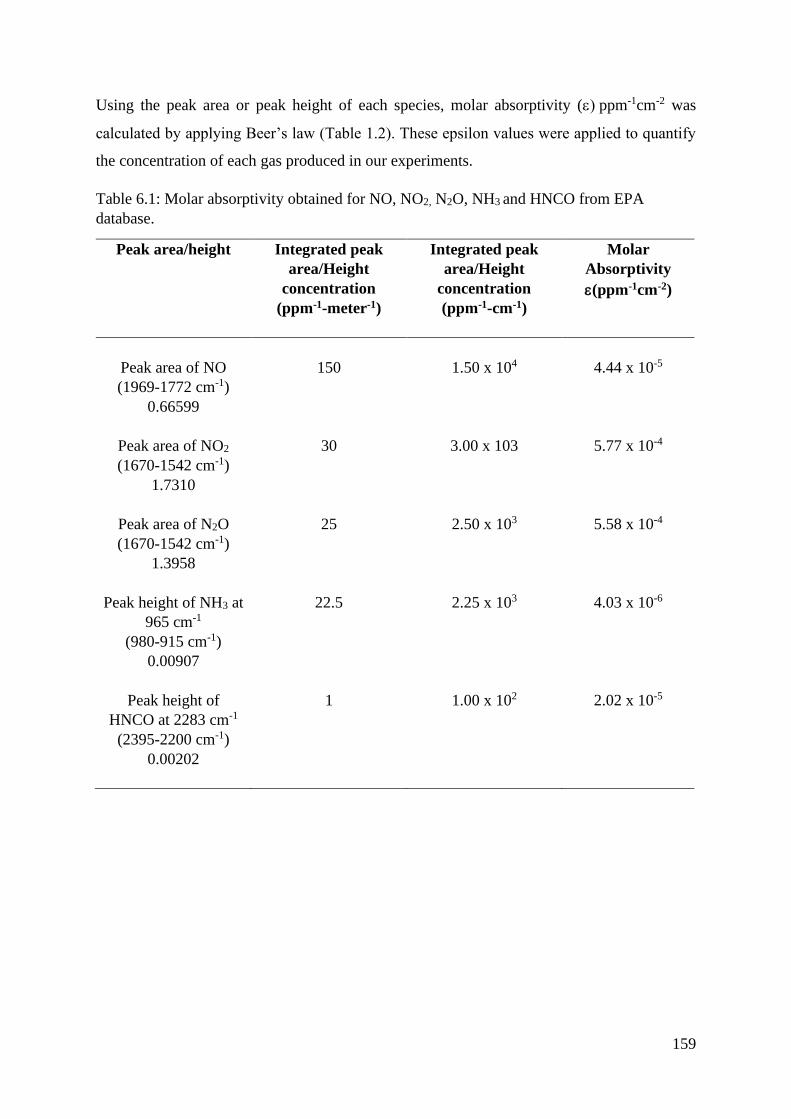
159
Using the peak area or peak height of each species, molar absorptivity () ppm-1cm-2 was
calculated by applying Beer’s law (Table 1.2). These epsilon values were applied to quantify
the concentration of each gas produced in our experiments.
Table 6.1: Molar absorptivity obtained for NO, NO2, N2O, NH3 and HNCO from EPA
database.
Peak area/height Integrated peak
area/Height
concentration
(ppm-1-meter-1)
Integrated peak
area/Height
concentration
(ppm-1-cm-1)
Molar
Absorptivity
(ppm-1cm-2)
Peak area of NO
(1969-1772 cm-1)
0.66599
150
1.50 x 10⁴
4.44 x 10⁻⁵
Peak area of NO2
(1670-1542 cm-1)
1.7310
30 3.00 x 10³ 5.77 x 10⁻⁴
Peak area of N2O
(1670-1542 cm-1)
1.3958
25 2.50 x 10³ 5.58 x 10⁻⁴
Peak height of NH3 at
965 cm-1
(980-915 cm-1)
0.00907
22.5 2.25 x 10³ 4.03 x 10⁻⁶
Peak height of
HNCO at 2283 cm-1
(2395-2200 cm-1)
0.00202
1 1.00 x 10² 2.02 x 10⁻⁵