
PhD Thesis: CFD Simulation of Silica Gel and Water Adsorbent Beds Used in Adsorption Cooling System
Upload
independentCategory
view
2download
0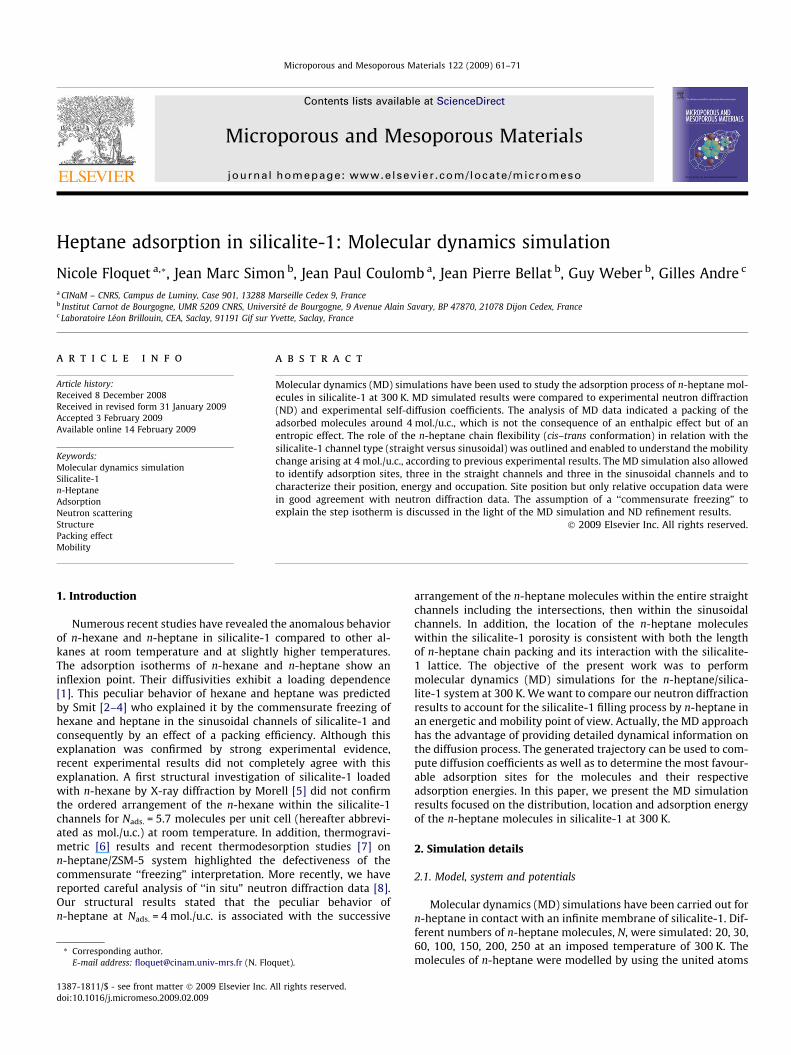
Microporous and Mesoporous Materials 122 (2009) 61–71
Contents lists available at ScienceDirect
Microporous and Mesoporous Materials
journal homepage: www.elsevier .com/locate /micromeso
Heptane adsorption in silicalite-1: Molecular dynamics simulation
Nicole Floquet a,*, Jean Marc Simon b, Jean Paul Coulomb a, Jean Pierre Bellat b, Guy Weber b, Gilles Andre c
a CINaM – CNRS, Campus de Luminy, Case 901, 13288 Marseille Cedex 9, Franceb Institut Carnot de Bourgogne, UMR 5209 CNRS, Université de Bourgogne, 9 Avenue Alain Savary, BP 47870, 21078 Dijon Cedex, Francec Laboratoire Léon Brillouin, CEA, Saclay, 91191 Gif sur Yvette, Saclay, France
a r t i c l e i n f o a b s t r a c t
Article history:Received 8 December 2008Received in revised form 31 January 2009Accepted 3 February 2009Available online 14 February 2009
Keywords:Molecular dynamics simulationSilicalite-1n-HeptaneAdsorptionNeutron scatteringStructurePacking effectMobility
1387-1811/$ - see front matter � 2009 Elsevier Inc. Adoi:10.1016/j.micromeso.2009.02.009
* Corresponding author.E-mail address: [email protected] (N. Flo
Molecular dynamics (MD) simulations have been used to study the adsorption process of n-heptane mol-ecules in silicalite-1 at 300 K. MD simulated results were compared to experimental neutron diffraction(ND) and experimental self-diffusion coefficients. The analysis of MD data indicated a packing of theadsorbed molecules around 4 mol./u.c., which is not the consequence of an enthalpic effect but of anentropic effect. The role of the n-heptane chain flexibility (cis–trans conformation) in relation with thesilicalite-1 channel type (straight versus sinusoidal) was outlined and enabled to understand the mobilitychange arising at 4 mol./u.c., according to previous experimental results. The MD simulation also allowedto identify adsorption sites, three in the straight channels and three in the sinusoidal channels and tocharacterize their position, energy and occupation. Site position but only relative occupation data werein good agreement with neutron diffraction data. The assumption of a ‘‘commensurate freezing” toexplain the step isotherm is discussed in the light of the MD simulation and ND refinement results.
� 2009 Elsevier Inc. All rights reserved.
1. Introduction
Numerous recent studies have revealed the anomalous behaviorof n-hexane and n-heptane in silicalite-1 compared to other al-kanes at room temperature and at slightly higher temperatures.The adsorption isotherms of n-hexane and n-heptane show aninflexion point. Their diffusivities exhibit a loading dependence[1]. This peculiar behavior of hexane and heptane was predictedby Smit [2–4] who explained it by the commensurate freezing ofhexane and heptane in the sinusoidal channels of silicalite-1 andconsequently by an effect of a packing efficiency. Although thisexplanation was confirmed by strong experimental evidence,recent experimental results did not completely agree with thisexplanation. A first structural investigation of silicalite-1 loadedwith n-hexane by X-ray diffraction by Morell [5] did not confirmthe ordered arrangement of the n-hexane within the silicalite-1channels for Nads. = 5.7 molecules per unit cell (hereafter abbrevi-ated as mol./u.c.) at room temperature. In addition, thermogravi-metric [6] results and recent thermodesorption studies [7] onn-heptane/ZSM-5 system highlighted the defectiveness of thecommensurate ‘‘freezing” interpretation. More recently, we havereported careful analysis of ‘‘in situ” neutron diffraction data [8].Our structural results stated that the peculiar behavior ofn-heptane at Nads. = 4 mol./u.c. is associated with the successive
ll rights reserved.
quet).
arrangement of the n-heptane molecules within the entire straightchannels including the intersections, then within the sinusoidalchannels. In addition, the location of the n-heptane moleculeswithin the silicalite-1 porosity is consistent with both the lengthof n-heptane chain packing and its interaction with the silicalite-1 lattice. The objective of the present work was to performmolecular dynamics (MD) simulations for the n-heptane/silica-lite-1 system at 300 K. We want to compare our neutron diffractionresults to account for the silicalite-1 filling process by n-heptane inan energetic and mobility point of view. Actually, the MD approachhas the advantage of providing detailed dynamical information onthe diffusion process. The generated trajectory can be used to com-pute diffusion coefficients as well as to determine the most favour-able adsorption sites for the molecules and their respectiveadsorption energies. In this paper, we present the MD simulationresults focused on the distribution, location and adsorption energyof the n-heptane molecules in silicalite-1 at 300 K.
2. Simulation details
2.1. Model, system and potentials
Molecular dynamics (MD) simulations have been carried out forn-heptane in contact with an infinite membrane of silicalite-1. Dif-ferent numbers of n-heptane molecules, N, were simulated: 20, 30,60, 100, 150, 200, 250 at an imposed temperature of 300 K. Themolecules of n-heptane were modelled by using the united atoms

62 N. Floquet et al. / Microporous and Mesoporous Materials 122 (2009) 61–71
(UA) model proposed by Ryckaert and Bellemans [9]. Each methyl(CH3) and methylene (CH2) group was simulated as one centre offorce.
A flexible atomic model [10] was used to simulate the zeolite.The size of the crystal was 18 unit cells (1728 atoms of siliconand 3456 atoms of oxygen) and the crystallographic structurewas orthorhombic (Pnma) [11]. The dimensions of the crystal wereLa = 3a; Lb = 2b and Lc = 3c, with a, b, c the crystallographic param-eters, a = 20.022 Å; b = 19.899 Å and c = 13.383 Å. The crystallo-graphic structure was orientated such that b followed thedirection of the straight channels [010] and a [100] and c [001]were in the plane of the sinusoidal channels. The initial atomicpositions were given from crystallographic experimental data[11]. Periodic boundary conditions were applied in the three direc-tions at the crystallographic limits of the crystal in the b and cdirections, and at a distance of 110 Å from the centre of the crystalin the a direction as to create a gaseous phase around the crystal.By neglecting the surface volume, the crystal volume Vzeo and thegaseous volume Vgas were, respectively, 95.98 and 255.5 nm3. Theexternal surfaces, perpendicular to the a direction, exhibited halfstraight channels, with the pore opening at the bottom of the halfchannels. In agreement with previous simulations [12] we reason-ably assumed that the details of this surface do not act on the equi-librium adsorption properties of the crystal. To compute the self-diffusion coefficients in the three directions of space, additionalsimulations were produced with external surfaces oriented in thetwo other directions and with no surface at all. These simulationsconfirmed that the properties of the equilibrium adsorbed phasewere independent on the orientation of the surface and on its pres-ence itself. For clarity, the presented results, except the self-diffu-sion coefficients, were computed with a surface perpendicular tothe a direction.
The dynamics of the atoms of both the silicalite-1 and the n-heptane molecules was governed by inter- and intramolecularinteraction potentials. A truncated Lennard-Jones (LJ) potential,with a cutoff radius, rc, of 9.9 Å, was used to mimic the intermolec-ular interactions between the atoms of the n-heptane and the zeo-lite and between different n-heptane molecules. The LJ parameterswere taken from Smirnov et al. [13] for the oxygen and siliconatoms and from Vlugt et al. [14] for the methyl and methylenegroup, Lorentz–Berthelot mixing rules were used for the calcula-tion of the interaction parameters between different species. TheLJ potential was also used inside each n-heptane molecule betweenatoms separated by more than three bonds. Stretching, bendingand torsional [14] potentials were applied between the atoms ofthe n-heptane molecules. For zeolite, the ab initio Generalized Va-lence Force Field (GVFF) developed by Ermoshin et al. [10] wasused, it includes stretching, bending terms and their couplings.This potential was developed on the basis of ab initio quantumchemical calculations of molecular models, it gives access both tovibrational and dynamical properties of the crystal in good agree-ment with experiment. For the details about these potentials(expressions, parameters) the reader is referred to Ref. [12]. In thisarticle [12], the equilibrium properties of the n-butane- silicalite-1
Fig. 1. Initial configuration of a silicalite-1 in contact with a gas of 100 molecules n-heptainterpretation of the references to colour in this figure legend, the reader is referred to
system were simulated. The choice of these interaction potentialsallowed obtaining adsorption isotherm and heat of adsorption ingood agreement with the experimental data for the n-butane di-rectly from MD simulations [12,15]. It exists in the literature pop-ular force fields which were developed to well reproduce thethermodynamics properties of adsorbed phase in rigid silica zeo-lite, we can mention for example the force field of Dubbeldamet al. [16] and Pascual et al. [17]. Our goal is to study with the sameforce field both the properties under equilibrium and out of equi-librium and particularly the phenomena that occurs at the externalsurface of the zeolite like the barrier effect at the entry of the poresduring the adsorption. We clearly showed [15,18,19] that it cannotbe done properly without simulating explicitly the internaldynamics of the zeolite itself. The choice of the force field of Ermo-shin et al. [10], which is well adapted to simulate the internaldynamics of the silicalite-1, imposes to use another force field thatthose of Dubbeldam et al. [16] and Pascual et al. [17]. However, thevery good agreement we obtained on n-butane on both the dynam-ical and the thermodynamical properties indicates that the forcefield we use is not unphysical although it can be improved in thefuture.
2.2. Simulation procedure
For each system the first configurations were obtained follow-ing the same procedure described in details in Ref. [12]. A gas ofn-heptane molecules and the membrane of silicalite-1 were firstthermalized separately at a fixed temperature of 300 K. N mole-cules of n-heptane from the gaseous configuration were then dis-tributed randomly around the empty crystal of zeolite in thegaseous volume, Vgas (Fig. 1). To avoid overlapping, excluded vol-umes were defined around each molecule and in the vicinity ofthe external surface. These configurations with different numbersof n-heptane in the gas phase were our starting point to studythe adsorption properties of the systems.
By integrating Newton’s equation of motion the system evolved,the n-heptane molecules crossed the gas phase to the crystal exter-nal surface and then entered the crystal pores until equilibrium isreached. This procedure was used previously to mimic uptakegravimetric and manometric adsorption experiments [12].Although the time and length scales were much smaller than inexperiments it gives the possibility to study both the kinetics ofadsorption and the equilibrium properties of the same system. Asexample, the uptake curve with 100 molecules of n-heptane showsthat the equilibrium state is reached within 2000 ps. Because of thelarge enthalpy of adsorption, the kinetics is associated with largethermal effects [18,19] that can govern the kinetics but has noinfluence on the equilibrium state. The aim of this paper is to focuson the equilibrium state we thus applied a general thermostat onthe whole system during this transient period to shorten it [19].
The equations of motion were integrated for each atom usingthe well-known velocity Verlet algorithm [20]. Trajectories of7 ns were generated using a time step of 0.001 ps. A simple ther-mostat based on the rescaling velocity was applied on the whole
ne. In grey the methyl or methylene, in red the oxygen and in yellow the silicon. (Forthe web version of this article.)

∂lnN
ads/∂
lnP
=Γ
-1
0
0.2
0.4
0.6
0.8
1
0 1 2 3 4 5 6 7 8N
ads (mol./u.c.)
Dual Langmuir (Pascual et al.) Our results Experiment (Sun et al.) Dual Langmuir (Jobic et al.)
Fig. 2. Values of the inverse of the thermodynamic factor C�1 obtained from Eq. (2)as a function of the loading ( ) and compared with experimental data calculatedfrom Sun et al. [23] ( ) and with dual site Langmuir obtained from simulation bothby Pascual et al. [17] ( ), and Jobic et al. [1] ( ).
Table 1Distribution maxima of the total adsorption energy and of its three componentscalculated for the n-heptane molecules in the silicalite-1 at 300 K as a function of theloading Nads.
Nads
(mol./u.c.)Energy (kJ mol-1)
Heptaneintramolecular
Heptane-heptaneinteraction
Heptane-silicaliteinteraction
Totaladsorption
1.4 20.0 �1.8 �98.9 �79.12.1 20.6 �2.0 �98.2 �79.53.7 20.8 �3.6 �97.2 �79.35.9 24.1 �10.4 �97.8 �80.8
N. Floquet et al. / Microporous and Mesoporous Materials 122 (2009) 61–71 63
system [21] during the first 2000 ps. The remaining equilibriumperiod was then simulated under microcanonical conditions, i.e.constant total energy, volume and number of atoms; the analysisof the system was performed on this period.
2.3. Calculated properties
2.3.1. TemperatureThe temperature, T, was obtained from the theorem of the equi-
partition of the kinetic energy, K:
K ¼ 12ð3Nat � 6Þ
N0Rg T ¼ 1
2
XNat
i¼1
mi vi � hvið Þ2D E
;
where Nat is the total number of atom of the system, Rg the gas con-stant, N0 the Avogadro number, mi and vi the mass and the instan-taneous velocity of particle i and hvi the averaged velocity of thesystem. The symbol h i means an averaging over the particles andover the time.
2.3.2. LoadingTo define if a molecule of n-heptane is adsorbed inside the crys-
tal pore we used an energetic criteria, the value if its potentialinteraction energy with the zeolite has to be lower than �85 kJ/mol. Molecules located at the external surface of the zeolite werenot taken into account. In a unit cell of silicalite-1, 12 adsorptionsites are identified in the straight and zigzag channels and at theirintersection. In the simulated membrane, discarding the externalsurface, we counted 168 adsorption sites, divided by 12 it corre-sponds to 14 bulk-like unit cells. The total number of adsorbedmolecules Ntads was then in a block of 14 unit cells (Ncell = 14).The total loading Nads per unit cell was then Nads = Ntads/14.
2.3.3. Isosteric heat of adsorptionThe isosteric heat of adsorption Qst is calculated using the fluc-
tuation expression proposed by Nicholson and Parsonage [22]:
Q st ¼ RgT �Ec
interNcads
� �� Ec
inter
� �Nc
ads
� �Nc
ads
� �2 � Ncads
� �2 ; ð1Þ
where Ecinter and Nc
ads are the intermolecular interaction energy inthe adsorbed phase and the number of adsorbed molecules in oneunit cell. This expression is valid in the grand canonical ensemble.By definition each unit cell is an open system with a fixed volume,it is then reasonable to consider that all the states of the cell belongsto the grand canonical ensemble. To avoid heterogeneous effects re-lated to the external surface, we applied the expression to the sixdifferent unit cells inside the membrane which are not in directcontact with the gas phase. The six results were then averaged;the statistical uncertainty was in each case lower than 1%. As toget a coherent zero energy level between the gas phase and the ad-sorbed phase, Qst was calculated from additional simulations with ashifted and truncated LJ potential. Since the force is the derivative ofthe potential, the shifting procedure did not change the dynamics ofthe system.
2.3.4. Thermodynamic relationIn the grand canonical ensemble the fluctuations of the number
of molecule [22] give a direct access to the derivative of the pres-sure with the loading or the thermodynamic factor C�1 withoutany knowledge of the isotherm itself:
Ncads
� �2 � Ncads
� �2
Ncads
� � ¼kBT@ Nc
ads
� �Nc
ads
� �@lc
ads
!T
¼@ ln Nc
ads
� �@ ln Pgas
� �T
¼ C�1: ð2Þ
In this expression we used the fact that the gas pressure Pgas isideal. kB is the Boltzmann’s constant and lc
ads is the chemical po-tential of the adsorbed phase.
2.3.5. Self-diffusion coefficientThe self-diffusion coefficients Da were calculated from the Ein-
stein law:
limðt!1Þ
raðt þ t0Þ � raðt0Þ½ �2D E
¼ 2Dat; a ¼ x; y; z; ð3Þ
with ra(t0) and ra(t + t0) the a component of the position of the cen-ter of mass of a n-heptane molecule at a reference initial time, t0
and after a time delay of t. Each a component of the diffusion coef-ficient was calculated with membranes exhibiting surfaces parallelto the direction a.
3. Results
For clarity, only MD data obtained at 20, 30, 60 and 100 mole-cules were presented, except for self- diffusion coefficients andthe thermodynamic factor (Eq. (2)) where the results of the sevensimulations were shown. The corresponding loadings wereNads. = 1.4, 2.1, 3.7 and 5.9 mol./u.c., respectively. The higher load-ing data obtained with 150, 200 and 250 molecules exhibited prop-erties in agreement with the data obtained at 100 molecules. Theycorresponded to loadings Nads = 7.5, 7.6 and 7.6 mol./u.c., respec-tively, which agrees with the experimental saturation limit [23],7.4 molecules per unit cell.
It is important to underline that we did not get a direct access tothe isotherm. The number of gaseous molecule (the pressure) atequilibrium is due to the balance between the dynamics of adsorp-tion and desorption [24]. The n-heptane molecule strongly inter-acts with the silicalite-1 and then hardly desorbs. It was notpossible using our procedure to observe such event at low densi-ties. The isotherm has then to be computed using other methodsmore appropriate like the Grand Canonical Monte Carlo method
64 N. Floquet et al. / Microporous and Mesoporous Materials 122 (2009) 61–71
[25] or by integrating the thermodynamic relation mentionedabove (Eq. (2)). The values of C�1 obtained from Eq. (2) are plottedon Fig. 2 as a function of the loading and compared with experi-
Fig. 3. Time distribution of the center of mass of n-heptane in the silicalite-1porosity, at whatever calculated loading: in the sinusoidal channels (light blue line),in the straight channels (light grey line), in the intersections (green, orange and greylines). The density maxima of the time distribution are pointed by different marksin the straight channels (S1 ( ), S2 (j)) and in the intersections (S3 (h)) and in thesinusoidal channels (Z1 ( ), Z2 (N), Z3 (d)). (For interpretation of the references tocolour in this figure legend, the reader is referred to the web version of this article.)
mental data calculated from Sun et al. [23] and with dual site Lang-muir obtained from simulation both by Pascual et al. [17], and Jobicet al. [1] The results are in good agreement with the previous data,confirming the presence of an inflexion point in the isothermaround 4 mol./u.c. At high loading, at saturation, the values shouldhowever be null, the observed discrepancy comes from statisticaluncertainties inherent to the method itself.
3.1. Adsorption energy
The values of the isosteric heat of adsorption were calculated atdifferent loading using Eq. (1). A simple extrapolation of the values
0
0.1
0.2
0.3
Mol
ecul
e / u
nit c
ell
cell parameter (Å)
0 5 10 15 20
0 5 10 15 20
0
0.2
0.4
0.6
Mol
ecul
e / u
nit c
ell
a
b
cell parameter (Å)
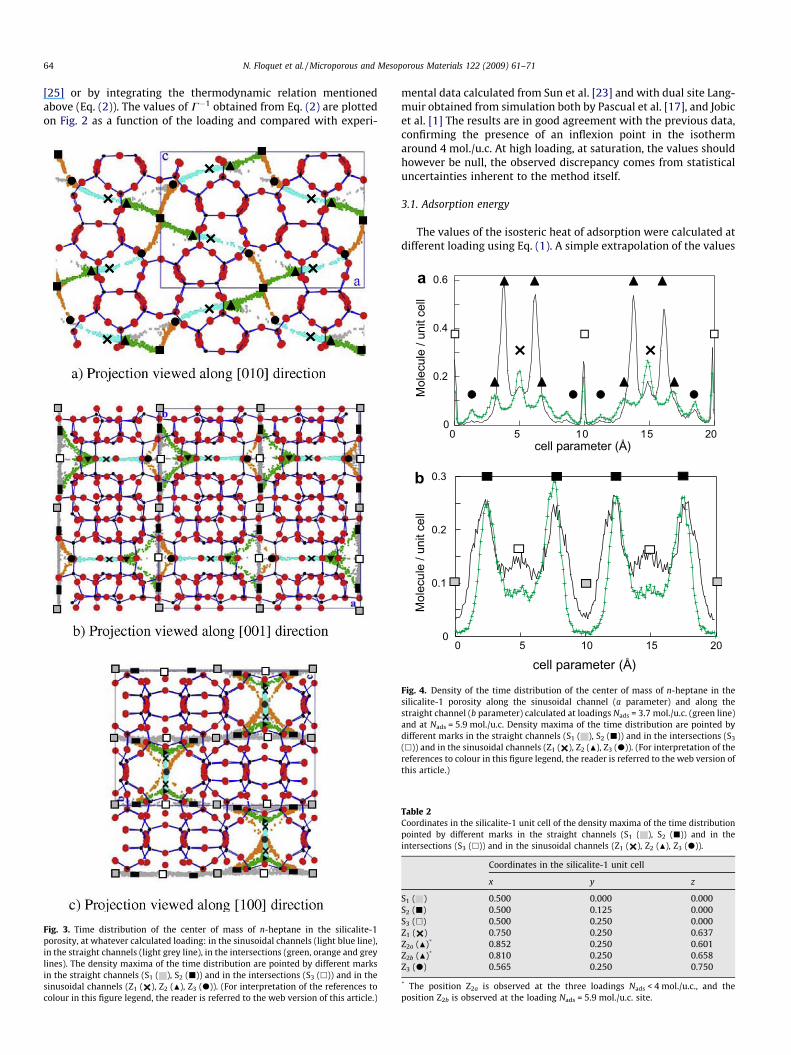
Fig. 4. Density of the time distribution of the center of mass of n-heptane in thesilicalite-1 porosity along the sinusoidal channel (a parameter) and along thestraight channel (b parameter) calculated at loadings Nads = 3.7 mol./u.c. (green line)and at Nads = 5.9 mol./u.c. Density maxima of the time distribution are pointed bydifferent marks in the straight channels (S1 ( ), S2 (j)) and in the intersections (S3
(h)) and in the sinusoidal channels (Z1 ( ), Z2 (N), Z3 (d)). (For interpretation of thereferences to colour in this figure legend, the reader is referred to the web version ofthis article.)
Table 2Coordinates in the silicalite-1 unit cell of the density maxima of the time distributionpointed by different marks in the straight channels (S1 ( ), S2 (j)) and in theintersections (S3 (h)) and in the sinusoidal channels (Z1 ( ), Z2 (N), Z3 (d)).
Coordinates in the silicalite-1 unit cell
x y z
S1 ( ) 0.500 0.000 0.000S2 (j) 0.500 0.125 0.000S3 (h) 0.500 0.250 0.000Z1 ( ) 0.750 0.250 0.637Z2a (N)* 0.852 0.250 0.601Z2b (N)* 0.810 0.250 0.658Z3 (d) 0.565 0.250 0.750
* The position Z2a is observed at the three loadings Nads < 4 mol./u.c., and theposition Z2b is observed at the loading Nads = 5.9 mol./u.c. site.
c
a
(a) Projection viewed along [010] direction
(b) Projection viewed along [001] direction
a
b
Fig. 5. Illustration of the n-heptane molecules within the silicalite-1 porositylocated at the positions of the density maxima of the time distribution: in thestraight channels (S1 ( ), S2 (j)) and in the intersections (S3 (h)) and in thesinusoidal channels (Z1 ( ), Z2 (N), Z3 (d)). (a) View along the [010] direction. (b)View along the [001] direction.
N. Floquet et al. / Microporous and Mesoporous Materials 122 (2009) 61–71 65
at zero loading following the procedure described by Sun et al. [23]gave a value of 92 kJ/mol. For n-heptane Sun et al. gave two exper-imental values obtained from two different analytical procedures,83.4 kJ/mol using fits on isotherm and around 95 kJ/mol by extrap-
0
40
80
0 2 4 6 8
N site (
mol
/u.c
.)*10
0/N
ads.
Nads.
(mol./u.c.)
a
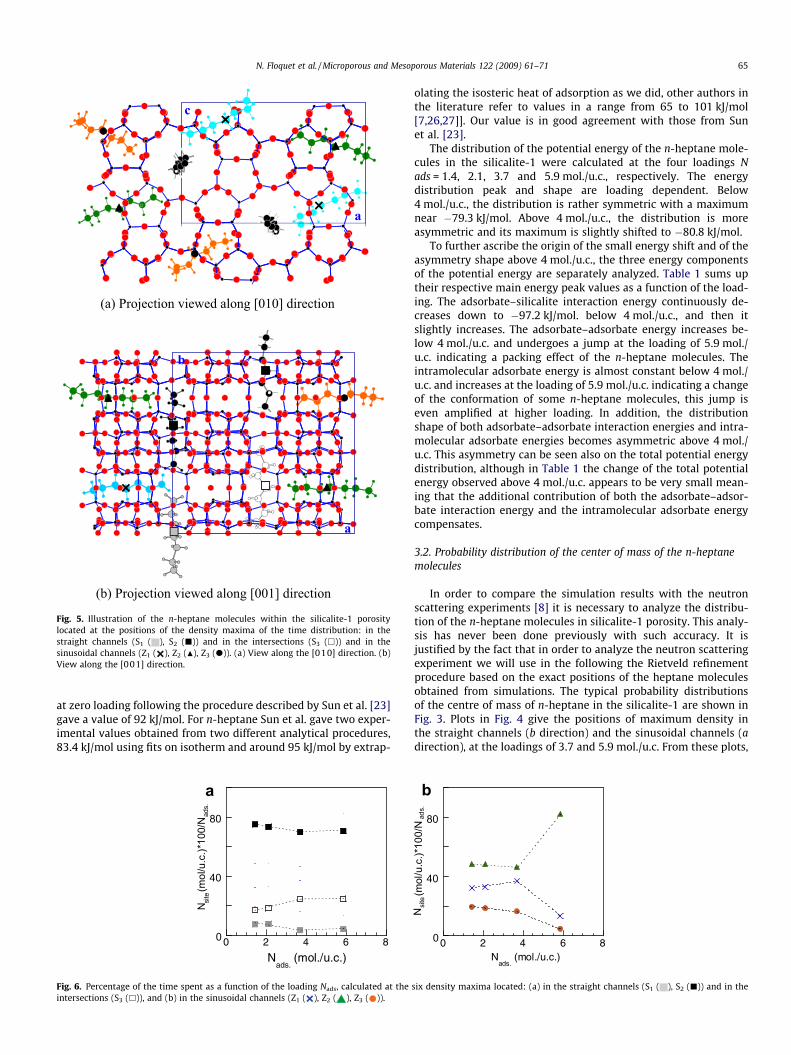
Fig. 6. Percentage of the time spent as a function of the loading Nads, calculated at theintersections (S3 (h)), and (b) in the sinusoidal channels (Z1 ( ), Z2 ( ), Z3 ( )).
olating the isosteric heat of adsorption as we did, other authors inthe literature refer to values in a range from 65 to 101 kJ/mol[7,26,27]]. Our value is in good agreement with those from Sunet al. [23].
The distribution of the potential energy of the n-heptane mole-cules in the silicalite-1 were calculated at the four loadings Nads = 1.4, 2.1, 3.7 and 5.9 mol./u.c., respectively. The energydistribution peak and shape are loading dependent. Below4 mol./u.c., the distribution is rather symmetric with a maximumnear �79.3 kJ/mol. Above 4 mol./u.c., the distribution is moreasymmetric and its maximum is slightly shifted to �80.8 kJ/mol.
To further ascribe the origin of the small energy shift and of theasymmetry shape above 4 mol./u.c., the three energy componentsof the potential energy are separately analyzed. Table 1 sums uptheir respective main energy peak values as a function of the load-ing. The adsorbate–silicalite interaction energy continuously de-creases down to �97.2 kJ/mol. below 4 mol./u.c., and then itslightly increases. The adsorbate–adsorbate energy increases be-low 4 mol./u.c. and undergoes a jump at the loading of 5.9 mol./u.c. indicating a packing effect of the n-heptane molecules. Theintramolecular adsorbate energy is almost constant below 4 mol./u.c. and increases at the loading of 5.9 mol./u.c. indicating a changeof the conformation of some n-heptane molecules, this jump iseven amplified at higher loading. In addition, the distributionshape of both adsorbate–adsorbate interaction energies and intra-molecular adsorbate energies becomes asymmetric above 4 mol./u.c. This asymmetry can be seen also on the total potential energydistribution, although in Table 1 the change of the total potentialenergy observed above 4 mol./u.c. appears to be very small mean-ing that the additional contribution of both the adsorbate–adsor-bate interaction energy and the intramolecular adsorbate energycompensates.
3.2. Probability distribution of the center of mass of the n-heptanemolecules
In order to compare the simulation results with the neutronscattering experiments [8] it is necessary to analyze the distribu-tion of the n-heptane molecules in silicalite-1 porosity. This analy-sis has never been done previously with such accuracy. It isjustified by the fact that in order to analyze the neutron scatteringexperiment we will use in the following the Rietveld refinementprocedure based on the exact positions of the heptane moleculesobtained from simulations. The typical probability distributionsof the centre of mass of n-heptane in the silicalite-1 are shown inFig. 3. Plots in Fig. 4 give the positions of maximum density inthe straight channels (b direction) and the sinusoidal channels (adirection), at the loadings of 3.7 and 5.9 mol./u.c. From these plots,
0
40
80
0 2 4 6 8N
ads. (mol./u.c.)
Nsi
te (m
ol/u
.c.)*
100/
Nad
s.
b
six density maxima located: (a) in the straight channels (S1 ( ), S2 (j)) and in the

66 N. Floquet et al. / Microporous and Mesoporous Materials 122 (2009) 61–71
it is apparent that the molecules have sites of preferential resi-dence. Six preferential sites are highlighted; three are located inthe straight channels (named S1, S2 and S3) and three in the sinu-soidal channels (named Z1, Z2 and Z3). Table 2 gives their respectivepositions in the silicalite-1 unit cell. Within the straight channels,S1 is located at the middle, S2 is in between S1 and S3, 2.49 Å apart,S3 being at the intersection. Within the sinusoidal channels, Z1 is atthe middle, Z2 and Z3 are displaced away on both sides toward theintersections, of 2.1 and 4.0 Å, respectively. Fig. 5 illustrates the n-heptane molecules centred at these sites within the silicalite-1porosity. Whatever the loading, the sites are not equally occupied.Very few n-heptane molecules reside on site S1, but they are essen-
0
2 103
4 103
6 103
8 103
-105 -100 -95 -90 -85
His
togr
am
Heptane-silicalite interaction energy (kJ.mol-1)
a
0
1 103
2 103
3 103
-16 -14 -12 -10 -8 -6 -4 -2
His
togr
am
Heptane-heptane interaction energy (kJ.mol-1)
00 10 20 30 40 50 60
His
togr
am
Heptane intramolecular energy (kJ.mol-1)
0-120 -100 -80 -60 -40 -20 0
His
togr
am
Total adsorption energy (kJ.mol-1)
4 103
2 103
1 103
1 103
a
a
a
Fig. 7. Distribution of the three energy components and of the potential energy at T = 30(j)) and in the intersections (S3 (h)) and in the sinusoidal channels (Z1 ( ), Z2 ( ), Z3
tially located at site S2 in the straight channels and at site Z2 in thesinusoidal channels. The probability distributions on each site ex-hibit a loading dependence whose slope is changing above4 mol./u.c. as shown in Fig. 6. The positions of the sites are pre-served except for Z2 located in the sinusoidal channels, whichmoves 1.14 Å toward the sinusoidal centre Z1 above 4 mol./u.c.
To further examine the n-heptane distribution behavior withinthe silicalite-1 porosity at increasing loading, we calculated thethree energy components of the potential energy for each preferen-tial adsorption sites. The respective distributions of the adsorbate–silicalite interaction energy, the adsorbate–adsorbate interactionenergy and the intramolecular potential energy are plotted in
0-105 -100 -95 -90 -85
Heptane-silicalite interaction energy (kJ.mol-1)
0
1 104
-16 -14 -12 -10 -8 -6 -4 -2
His
togr
am
Heptane-heptane interaction energy(kJ.mol-1)
00 20 40 60 80 100
His
togr
am
Heptane intramolecular energy (kJ.mol-1)
0-120 -100 -80 -60 -40 -20 0
His
togr
am
Total adsorption energy (kJ.mol-1)
2 103
2 103
1 103
1 103
2 103
4 103
6 103
8 103
His
togr
am
2 103
4 103
6 103
8 103
b
b
b
b
0 K calculated at the six density maxima located in the straight channels (S1 ( ), S2
( )) at (a) Nads = 3.7 mol./u.c. and (b) Nads = 5; 9 mol./u.c.
5 7 9 11 13 15 17 19
0
1
2
3
4
5
6
Rad
ial D
istri
butio
n Fu
nctio
n
Distance ( Å )
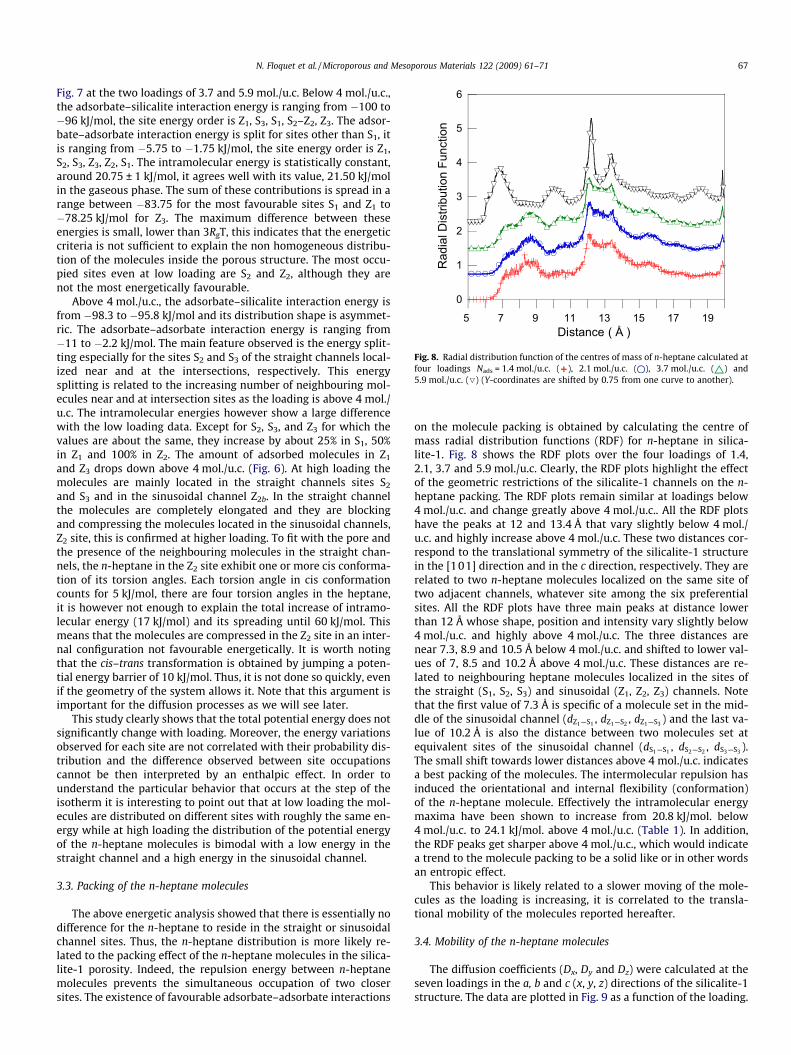
Fig. 8. Radial distribution function of the centres of mass of n-heptane calculated atfour loadings Nads = 1.4 mol./u.c. ( ), 2.1 mol./u.c. ( ), 3.7 mol./u.c. ( ) and5.9 mol./u.c. (O) (Y-coordinates are shifted by 0.75 from one curve to another).
N. Floquet et al. / Microporous and Mesoporous Materials 122 (2009) 61–71 67
Fig. 7 at the two loadings of 3.7 and 5.9 mol./u.c. Below 4 mol./u.c.,the adsorbate–silicalite interaction energy is ranging from �100 to�96 kJ/mol, the site energy order is Z1, S3, S1, S2–Z2, Z3. The adsor-bate–adsorbate interaction energy is split for sites other than S1, itis ranging from �5.75 to �1.75 kJ/mol, the site energy order is Z1,S2, S3, Z3, Z2, S1. The intramolecular energy is statistically constant,around 20.75 ± 1 kJ/mol, it agrees well with its value, 21.50 kJ/molin the gaseous phase. The sum of these contributions is spread in arange between �83.75 for the most favourable sites S1 and Z1 to�78.25 kJ/mol for Z3. The maximum difference between theseenergies is small, lower than 3RgT, this indicates that the energeticcriteria is not sufficient to explain the non homogeneous distribu-tion of the molecules inside the porous structure. The most occu-pied sites even at low loading are S2 and Z2, although they arenot the most energetically favourable.
Above 4 mol./u.c., the adsorbate–silicalite interaction energy isfrom �98.3 to �95.8 kJ/mol and its distribution shape is asymmet-ric. The adsorbate–adsorbate interaction energy is ranging from�11 to �2.2 kJ/mol. The main feature observed is the energy split-ting especially for the sites S2 and S3 of the straight channels local-ized near and at the intersections, respectively. This energysplitting is related to the increasing number of neighbouring mol-ecules near and at intersection sites as the loading is above 4 mol./u.c. The intramolecular energies however show a large differencewith the low loading data. Except for S2, S3, and Z3 for which thevalues are about the same, they increase by about 25% in S1, 50%in Z1 and 100% in Z2. The amount of adsorbed molecules in Z1
and Z3 drops down above 4 mol./u.c. (Fig. 6). At high loading themolecules are mainly located in the straight channels sites S2
and S3 and in the sinusoidal channel Z2b. In the straight channelthe molecules are completely elongated and they are blockingand compressing the molecules located in the sinusoidal channels,Z2 site, this is confirmed at higher loading. To fit with the pore andthe presence of the neighbouring molecules in the straight chan-nels, the n-heptane in the Z2 site exhibit one or more cis conforma-tion of its torsion angles. Each torsion angle in cis conformationcounts for 5 kJ/mol, there are four torsion angles in the heptane,it is however not enough to explain the total increase of intramo-lecular energy (17 kJ/mol) and its spreading until 60 kJ/mol. Thismeans that the molecules are compressed in the Z2 site in an inter-nal configuration not favourable energetically. It is worth notingthat the cis–trans transformation is obtained by jumping a poten-tial energy barrier of 10 kJ/mol. Thus, it is not done so quickly, evenif the geometry of the system allows it. Note that this argument isimportant for the diffusion processes as we will see later.
This study clearly shows that the total potential energy does notsignificantly change with loading. Moreover, the energy variationsobserved for each site are not correlated with their probability dis-tribution and the difference observed between site occupationscannot be then interpreted by an enthalpic effect. In order tounderstand the particular behavior that occurs at the step of theisotherm it is interesting to point out that at low loading the mol-ecules are distributed on different sites with roughly the same en-ergy while at high loading the distribution of the potential energyof the n-heptane molecules is bimodal with a low energy in thestraight channel and a high energy in the sinusoidal channel.
3.3. Packing of the n-heptane molecules
The above energetic analysis showed that there is essentially nodifference for the n-heptane to reside in the straight or sinusoidalchannel sites. Thus, the n-heptane distribution is more likely re-lated to the packing effect of the n-heptane molecules in the silica-lite-1 porosity. Indeed, the repulsion energy between n-heptanemolecules prevents the simultaneous occupation of two closersites. The existence of favourable adsorbate–adsorbate interactions
on the molecule packing is obtained by calculating the centre ofmass radial distribution functions (RDF) for n-heptane in silica-lite-1. Fig. 8 shows the RDF plots over the four loadings of 1.4,2.1, 3.7 and 5.9 mol./u.c. Clearly, the RDF plots highlight the effectof the geometric restrictions of the silicalite-1 channels on the n-heptane packing. The RDF plots remain similar at loadings below4 mol./u.c. and change greatly above 4 mol./u.c.. All the RDF plotshave the peaks at 12 and 13.4 Å that vary slightly below 4 mol./u.c. and highly increase above 4 mol./u.c. These two distances cor-respond to the translational symmetry of the silicalite-1 structurein the [101] direction and in the c direction, respectively. They arerelated to two n-heptane molecules localized on the same site oftwo adjacent channels, whatever site among the six preferentialsites. All the RDF plots have three main peaks at distance lowerthan 12 Å whose shape, position and intensity vary slightly below4 mol./u.c. and highly above 4 mol./u.c. The three distances arenear 7.3, 8.9 and 10.5 Å below 4 mol./u.c. and shifted to lower val-ues of 7, 8.5 and 10.2 Å above 4 mol./u.c. These distances are re-lated to neighbouring heptane molecules localized in the sites ofthe straight (S1, S2, S3) and sinusoidal (Z1, Z2, Z3) channels. Notethat the first value of 7.3 Å is specific of a molecule set in the mid-dle of the sinusoidal channel (dZ1—S1 , dZ1—S2 , dZ1—S3 ) and the last va-lue of 10.2 Å is also the distance between two molecules set atequivalent sites of the sinusoidal channel (dS1—S1 , dS2—S2 , dS3—S3 ).The small shift towards lower distances above 4 mol./u.c. indicatesa best packing of the molecules. The intermolecular repulsion hasinduced the orientational and internal flexibility (conformation)of the n-heptane molecule. Effectively the intramolecular energymaxima have been shown to increase from 20.8 kJ/mol. below4 mol./u.c. to 24.1 kJ/mol. above 4 mol./u.c. (Table 1). In addition,the RDF peaks get sharper above 4 mol./u.c., which would indicatea trend to the molecule packing to be a solid like or in other wordsan entropic effect.
This behavior is likely related to a slower moving of the mole-cules as the loading is increasing, it is correlated to the transla-tional mobility of the molecules reported hereafter.
3.4. Mobility of the n-heptane molecules
The diffusion coefficients (Dx, Dy and Dz) were calculated at theseven loadings in the a, b and c (x, y, z) directions of the silicalite-1structure. The data are plotted in Fig. 9 as a function of the loading.

1 10 100 1000 10000time / (ps)
1
10
100
1000
10000
MSD
y / (
Å2)
1.4 mol./u.c.2.1 mol./u.c.3.7 mol./u.c.5.9 mol./u.c.7.6 mol./u.c.y = xy = x0.5
Fig. 10. The mean square displacement (MSD) as a function of the time (t) in alogarithmic scale for five loadings 1.4, 2.1, 3.7, 5.9 and 7.6 mol./u.c. along the y axis.After the ballistic regime which lasts about 5 ps, the profile at low loading shows aclassical dependence in t while at high loading it exists an intermediate regime int0.5 characteristic of a single file diffusion.
0.001
0.01
0.1
1
10
0 2 4 6 8
D (1
0-9m
2 /s)
Nads.
(mol./u.c.)
Fig. 9. Self diffusion coefficients along sinusoidal channel Dx ( ), straight channelDy ( ), z direction Dz ( ) and total diffusion coefficient Dtotal (d) in units10�9 m2 s�1 of the n-heptane molecules in the silicalite-1 at 300 K as a function ofthe loading Nads (mol./u.c.).
68 N. Floquet et al. / Microporous and Mesoporous Materials 122 (2009) 61–71
The statistical uncertainties obtained from the fitted procedure arelower that 15%. However, for loadings equal to or higher than3.7 mol./u.c. the molecules hardly moved in the x and z directions
0.5 1 1
Cou
nts
(arb
itrar
y un
it)
a
0.5 1 1.
Cou
nts
(arb
itrar
y un
it)
Q (
Q (
b
Fig. 11. Neutron diffraction patterns at the loading a) Nads = 3.85 C7D16/u.c. experimenstraight channels at the sites S1 ( ), S2 (j), S3 (h), and 2.11 C7D16/u.c. in the sinusoidal ch(+) and calculated pattern (�) corresponding to 2.17 C7D16/u.c. located in the straight chaat the sites Z1 ( ), Z2 ( ), Z3 ( ).
and the simulation conditions were not fulfilled to get reliable dif-fusion coefficients in those directions. We consider that under suchloadings only the order of magnitude of Dx and Dz are correct. Theaveraged diffusion coefficients in the three directions are in agree-ment with previous MD results using different force fields[1,28,29]. The diffusion anisotropy of n-heptane is very high be-
.5 2 2.5
Nads.
= 3.85 mol./u.c.
experimental
calculated
5 2 2.5
Å-1 )
Å-1 )
Nads.
= 5.09 mol./u.c.
experimental
calculated
tal (+) and calculated pattern (�) corresponding to 1.74 C7D16/u.c. located in theannels at the sites Z1 ( ), Z2 ( ), Z3 ( ) and (b) Nads = 5.09 C7D16/u.c. experimental
nnels at the sites S1 ( ), S2 (j), S3 (h) and 2.92 C7D16/u.c. in the sinusoidal channels

N. Floquet et al. / Microporous and Mesoporous Materials 122 (2009) 61–71 69
tween the two types of channels. The mobility of the molecules ismuch faster in the straight channels (y direction) than in the sinu-soidal channels (x, z directions). The diffusion coefficients of mole-cules in the straight channels (Dy) are about one order ofmagnitude larger than those in the sinusoidal channels (Dx, Dz).The diffusion coefficients decrease to a minimum as the loading in-creases up to 4 mol./u.c. above this loading they increase in x and zdirections and more significantly in the y direction. This effect ismainly due to the increase of the loading in the straight channels.As it was mentioned above, at high loading the molecules locatedin the Z2 sites are compressed and exhibit cis conformation ofone or more torsion angles. Under this configuration the moleculesfit well with the wall of the zeolite but with a large internal ener-getic cost. When the intersection is free the intramolecular confor-mation of the compressed molecule does not have time to relax(like a cis–trans) and occupy the intersection before a new mole-cule from the straight channel fills the intersection. Under theseconditions the compressed conformation of the n-heptane mole-cule in the sinusoidal channel is maintained and the moleculehardly escapes. The order in the system is high. This configurationfavours also the diffusion in the straight channel (see below). Atlow loading all the molecules have a low intramolecular energymeaning that they are in general elongated and not stressed bythe presence of other molecules. The molecules move in all direc-tions, with the limitation of the presence of other molecules, thediffusion coefficient then decreases as the loading increases, thesystem is less ordered than at higher loading. In Fig. 10, the meansquare displacement (MSD) along the y axis is plotted as a functionof the time (t) in a logarithmic scale for five different loadings from
0.5 1 1.5
Cou
nts
(arb
itrar
y un
it)
Q ( Å
a
0.5 1 1.5
Cou
nts
(arb
itrar
y un
it)
Q ( Å
b
Fig. 12. Experimental neutron diffraction pattern (+) at the loading (a) Nads = 3.85 C7D16/straight channels at the sites S1 ( ), S2 (j), S3 (h), and 0.8 C7D16/u.c. in the sinusoidal chaC7D16/u.c. (Rietveld refinement pattern (�) corresponding to 3.59 C7D16/u.c. located insinusoidal channels at the sites Z1 ( ), Z2 ( ), Z3 ( ), and difference pattern (�)).
1.4 mol./u.c. to saturation. After the ballistic regime that lastsabout 5 ps, the profile at low loading shows a classical dependencein t, the diffusional regime. At higher loadings there is an interme-diate regime close to a dependence in t0.5 characteristic of singlefile diffusion. This regime seems to last much longer time as thesystem goes closer to the step zone (about 800 ps at 3.7 mol./u.c.), this then can be considered as a characteristic of this stepzone. For higher loadings the dependence in t0.5 is much shorter(lower than 50 ps). It is worth noting that the distance travelledby molecules in this intermediate regime is limited in space, ofthe size of the length of the straight channel in one unit cell (about10 Å) and lower. This observation was also mentioned by Leroyet al. [30]. In the same article they investigated the effect of theflexibility of the frameworks on the diffusion coefficient on n-al-kanes and they did not noticed any differences for large n-alkaneslike n-heptane. They also suspected the effect of the intramolecularpotential to play a large role in the diffusion coefficients but notthe ORTHO/MONO phase transition of the zeolite for linear alkanes.
3.5. Comparison with neutron diffraction results
The inflexion behavior of n-hexane at a loading of 4 mol./u.c. insilicalite-1 was experimentally observed by isotherm adsorption[23,31,32], by quasi elastic neutron scattering [1] and in our previ-ous neutron diffraction experiments [8]. In view of the herein MDsimulation results, the combination of energetic, probability distri-bution and mobility features are shown to be present at this criticalloading of 4 mol./u.c. There is a clear tendency for the n-heptanemolecules to preferentially reside on the site S2 in the straight
2 2.5-1 )
Nads.
= 3.85 mol./u.c.
2 2.5-1 )
Nads.
= 5.09 mol./u.c.
u.c. (Rietveld refinement pattern (�) corresponding to 3.05 C7D16/u.c. located in thennels at the sites Z1 ( ), Z2 ( ), Z3 ( , and difference pattern (�)) and (b) Nads = 5.09the straight channels at the sites S1 ( ), S2 (j), S3 (h) and 1.50 C7D16/u.c. in the

Table 3Comparison of the occupation percentage of the sites in the straight channels S1 ( ), S2 (j) and in the intersections S3 (h), in the sinusoidal channels Z1 ( ), Z2 ( ), Z3 ( ) and inthe straight and sinusoidal channels obtained from molecular dynamic simulation and from Rietveld refinement of our neutron diffraction patterns [8].
Site S1 ( ) (%) S2 (j) (%) S3 (h) (%) Z1 ( ) (%) Z2 ( ) (%) Z3 ( ) (%) Straight channelS1 + S2 + S3 (%)
Sinusoidal channelZ1 + Z2 + Z3 (%)
Molecular Dynamic Nads. = 3.85 mol./u.c. 2 32 11 20 26 9 45 55Neutron diffraction 0 44 35 10 5 6 79 21
�S2 (67)* �S3 (16)* Between Z1 and Z3 (17)* (83)* (17)*
Molecular dynamic Nads. = 5.09 mol./u.c. 2 30 11 8 47 2 43 57Neutron diffraction 0 33 37 8 11 11 70 30
�S2 (74)* Between Z1 and Z3 (26)* (74)* (26)*
* Occupation percentage of closely located sites obtained from previous Rietveld refinement of our neutron diffraction patterns performed with only 3 independentmolecules [8].
0
40
80
0 2 4 6 8
N site (m
ol/u
.c.)*
100/
Nad
s.
Nads.
(mol./u.c.)
a
0
40
80
0 2 4 6 8N
ads. (mol./u.c.)
N site (m
ol/u
.c.)*
100/
Nad
s.
b
Fig. 13. Occupation as a function of the loading Nads, (a) in the straight channels (S1 ( ), S2 (j)) and in the intersections (S3 (h)) and (b) in the sinusoidal channels (Z1 ( ), Z2
( ), Z3 ( ) as a result of ND refinement.
70 N. Floquet et al. / Microporous and Mesoporous Materials 122 (2009) 61–71
channels and on the sites Z1 and Z2a in the sinusoidal channels be-low 4 mol./u.c., then only on the sites S2 and Z2b above 4 mol./u.c.
To further clarify the meaning of these MD simulation results,they are compared to our recent neutron diffraction results ob-tained at similar loadings during the adsorption process. Recallthat, for this first structural analysis [8], the diffraction patternswere refined using only three independent molecule locations(two molecules in the straight channel (sites S1 and S3) and onemolecule in the sinusoidal channel (site Z1)) and the refinementsconverged to relatively high correlation R-factors Rwp � 20%. Atany loading, the refined positions of the molecules were shiftedfrom the channel centers (S1 and Z1) and intersections (S3), sothe molecules were found in between channels and intersections.More precisely, the molecules converged near the site S2 in thestraight channel and between the sites Z1 and Z3 in the sinusoidalchannel. The site occupancy was function of the loading: 100% ofthe molecules were at the sites S2 of the straight channel at lowloadings Nads = 0.61, 1.87 C7D16/u.c., then only 83% and 74% at load-ings Nads = 3.85 and 5.09 C7D16/u.c., respectively. Starting from thesix molecules positions and occupancies defined from herein MDsimulation results, new and better refinements of our diffractionpatterns were expected. Fig. 11 shows the experimental patternsrecorded at Nads = 3.85 and 5.09 C7D16/u.c. and simulated patternsobtained with the C7D16 positions and occupation numbers as de-fined by the time distribution reported in Fig. 6. The simulated pat-terns do not fit the experimental patterns. It is very visible on thefirst two peaks at 3.85 C7D16/u.c., meaning that the occupation ofthe sites in the straight channels (45%) and in the sinusoidal chan-nels (55%) is largely incorrect and should be closer to our previousresults (83% in the straight channels). Therefore, a Rietveld refine-ment was performed to determine the best occupation factors ofthe sites in the straight (S1, S2 and S3) and sinusoidal (Z1, Z2 and
Z3) channels. Fig. 12 and Table 3 give the resulting patterns anddata obtained from these refinements and the previous ones re-called above.
The first result is that starting with six instead of only threeindependent molecule locations, does not improved the correlationR-factors of the refinements (Rwp are still about 20%). This refine-ment feature was expected as discussed in our previous study[8]. The occupation number is a more important factor than the po-sition of the site in a channel especially when the size of the ad-sorbed molecule fits more or less the channel length.
The second result is that the refined occupation factors are inagreement with previous diffraction pattern refinements. The totaldistribution in each channel is slightly shifted: (i) 83% instead of79% in the straight channels below 4 mol./u.c. and (ii) 74% insteadof 70% in the straight channels above 4 mol./u.c. It should also bepointed out that the distribution at each site is not far from theprevious one: no molecules were found at site S1, but were locatednear the site S2 in the straight channel and between Z1 and Z3 inthe sinusoidal channel. Moreover, both MD simulation and NDexperiments are in agreement to evidence a n-heptane redistribu-tion occurring in straight and sinusoidal channels near 4 mol./u.c.(Fig. 13).
In conclusion, MD simulations allowed determining valid sitepositions but were unsuccessful to give the site occupation factorin agreement with ND experiments.
4. Conclusive discussion
Previous and present refinement results of our neutron diffrac-tion patterns could not be explained by energetic consideration inview of the adsorption energy and its components results reportedin Table 1 and Fig. 7. As well, the molecular dynamics probability

N. Floquet et al. / Microporous and Mesoporous Materials 122 (2009) 61–71 71
distributions of the n-heptane molecules in the pores show a ratherhomogeneous distribution between the straight and sinusoidalchannels at whatever loading in agreement with the energetic re-sults. However, it appears that the distribution of the moleculechanges in the straight channels near 4 mol./u.c. and increases by12% in the sinusoidal channels above 4 mol./u.c. Note that thistrend is in agreement with the diffraction refinement results ashighlighted in Fig. 13.
Approaching 4 mol./u.c., the n-heptane molecules begin to fillthe sinusoidal channels and the molecules are redistributed inthe straight channels (Fig. 6). This process appears to be in agree-ment with the packing effect deduced from the RDF plots (Fig. 8).A periodic arrangement of the n-heptane molecules within thesinusoidal channels begins above 4 mol./u.c. This effect on the cen-ter of mass of the molecule is also associated with a change in theintramolecular conformation of the molecule in the sinusoidalchannels but not in the straight channel, this is confirmed by alarge increase of the intramolecular energy. These findings indicatethat the step-like isotherm of n-heptane/silicalite-1 system shouldnot be ascribed to an enthalpy effect but to an entropy change ofthe system approaching 4 mol./u.c. in agreement with the resultsof Smit et al. [2]. However these new results shed a new light onthe origin of the inflexion behavior of n-heptane at a loading of4 mol./u.c. in silicalite-1. They confirmed previous results givenby Smit et al., a commensurate locking of the molecule in the sinu-soidal channel. In their interpretation of this phenomenon Smitet al. used the terms locking and freezing, by reference to the com-mensurate–incommensurate transition of noble gas on graphite.The commensurate phase is observed at low loading and low tem-perature on the graphite, where the adsorbed molecules are lo-cated preferentially on favourable energetic sites on the graphite.The molecules can be seen as frozen on it, this is a result of theinteraction between the substrate and the fluid. At the contrary,this commensurate locking appears at high loading in the silica-lite-1. It is not the only result of the interaction between silica-lite-1 and n-heptane but as shown in this paper also theconsequence of a cooperative behavior between the adsorbed mol-ecules: molecules located in the straight channel block the inter-section and consequently compress the molecule in thesinusoidal channel. Based on this new analysis, the use of the termcommensurate locking seems more appropriate than commensu-rate freezing. The existence of a monoclinic–orthorhombic phasetransition of silicalite-1 [26] near 4 mol./u.c. should not accountfor the presence of a step in the isotherm as previously observedin the case of many other molecules adsorbed in silicalite-1.
In conclusion, this MD simulation study clearly shows that theinflexion behavior of n-hexane at a loading of 4 mol./u.c. in silica-lite-1 is related to both the molecule mobility enhanced in thestraight channels (Fig. 9), and the packing of these linear moleculeswithin the straight and sinusoidal channels (Fig. 8) correlated withan increased filling of the sinusoidal channel (Figs. 6 and 12). Atlow loading, the molecules are free to move in all directions, then-heptane molecules preferentially occupy the straight channelswhere they could adopt a free linear conformation. Up to a loadingof 4 mol./u.c., the molecules filling the sinusoidal channel are com-pressed, exhibiting a cis conformation of one or more torsion angle.They hardly escaped from their sinusoidal sites that favour the dif-fusion in the straight channel.
Obviously, our MD simulation of n-heptane in silicalite-1 resultswere in agreement with previous molecular simulation results andfailed to fully explain our diffraction results since the population ofstraight and sinusoidal sites differs largely at each loading. In orderto understand why molecular simulation results did not convergeon our diffraction data, we could first improved our MD simulationby using all-atoms model instead of united atoms model, by refin-ing the energy and size parameter of the Lennard-Jones potential,etc. . .. Secondly, we could try to investigate a similar system, theadsorption of n-heptane in silicalite-2. Thus, Makowski and Majda[7] observed a two-step adsorption of n-heptane in ZSM-11 (MELtype zeolite) and two thermodesorption peaks (also observed byAshtekar et al. [33]). MEL has a pore system and size very similarto MFI except that the sinusoidal channels in MEL are straight.The investigation on this system should clarify the role of the sinu-soidal channel typical of silicalite-1 for the transition to occur andconsequently give some clue to get more reliable modelisation ofthis particular n-heptane/silicalite-1 system.
References
[1] H. Jobic, N. Laloué, C. Laroche, J.M. van Baten, R. Krishna, J. Phys. Chem. B 110(2006) 2195.
[2] B. Smit, T.L.M. Maesen, Nature 374 (1995) 42.[3] T.J.H. Vlugt, R. Krishna, B. Smit, J. Phys. Chem. B 103 (1999) 1102.[4] B. Smit, T.L.M. Maesen, Chem. Rev. 108 (2008) 4125.[5] H. Morell, K. Angermund, A.R. Lewis, D.H. Brouwer, C.A. Fyfe, H. Gies, Chem.
Mater. 14 (2002) 2192.[6] D.M. Bibby, N.B. Milestone, L.P. Aldridgen, Nature 280 (1979) 664.[7] W. Makowski, D. Majda, Appl. Surf. Sci. 252 (2005) 707.[8] N. Floquet, J.P. Coulomb, J.P. Bellat, J.M. Simon, G. Weber, G. Andre, J. Phys.
Chem. C 111 (2007) 18182.[9] J.P. Ryckaert, A. Bellemans, Faraday Disc. Chem. Soc. 66 (1978) 95.
[10] V.A. Ermoshin, K.S. Smirnov, D. Bougeard, Chem. Phys. 202 (1996) 53.[11] H. Van Koningsveld, H. Van Bekkum, J.C. Jansen, Acta Crystallogr. B 43 (1987)
127.[12] J.M. Simon, A. Decrette, J.P. Bellat, J.M. Salazar, Mol. Simulat. 30 (2004) 621.[13] K.S. Smirnov, B.J. van de Graaf, Chem. Faraday Trans. 92 (1996) 2475.[14] T.J.H. Vlugt, C. Dellago, B. Smit, J. Phys. Chem. B 113 (2000) 8791.[15] I. Inzoli, J.M. Simon, D. Bedeaux, S. Kjelstrup, J. Phys. Chem. B 112 (2008)
14937.[16] D. Dubbeldam, S. Calero, T.J.H. Vlugt, R. Krishna, T.L.M. Maesen, B.J. Smit, Phys.
Chem. B 108 (2004) 12301.[17] P. Pascual, P. Ungerer, B. Tavitian, P. Pernot, A. Boutin, Phys. Chem. Chem. Phys.
5 (2003) 3684.[18] J.M. Simon, I. Inzoli, S. Kjelstrup, D. Bedeaux, Mol. Simulat. 33 (2007) 839.[19] I. Inzoli, J.M. Simon, S. Kjelstrup, D. Bedeaux, J. Colloid Interf. Sci. 313 (2007)
563.[20] M.P. Allen, D.J. Tildesley, Computer Simulation of Liquids, Oxford University
Press, Oxford, 1987.[21] J.M. Haile, Molecular Dynamics Simulation – Elementary Methods, John
Whiley and Sons Inc., New York, 1992.[22] D. Nicholson, N.G. Parsonage, Computer Simulation and the Statistical
Mechanics of Adsorption, Academic Press, London, 1982.[23] M.S. Sun, O. Talu, D.B. Shah, J. Phys. Chem. 100 (1996) 17276.[24] J.M. Simon, J.P. Bellat, S. Vasenkov, J.J. Kärger, Phys. Chem. B 109 (2004) 13523.[25] D. Frenkel, B. Smit, Understanding Molecular Simulation: From Algorithms to
Applications, Academic Press, San Diego, 2002.[26] F.J. Eder, A. Lercher, Zeolites 18 (1997) 75.[27] B. Millot, A. Methivier, H. Jobic, J. Phys. Chem. 102 (1998) 3210.[28] R.C. Runnebaum, J.J. Maginn, Phys. Chem. B 101 (1997) 6394.[29] R. Krishna, J.M. van Baten, Chem. Phys. Lett. 407 (2005) 159.[30] F. Leroy, B. Rousseau, A.H. Fuchs, Phys. Chem. Chem. Phys. 6 (2004) 775.[31] G.U. Rakhmatkariev, Kh.R. Zhalalov, K.S. Akhmedov, Uzb. Khim. Zh. 3 (1998)
68.[32] M.M. Dubinin, G.U. Rakhmatkariev, A.A. Isirikyan, Izv. Akad. Nauk SSSR, Ser.
Khim. 10 (1989) 2333.[33] S. Ashtekar, A.S. McLeod, M.D. Mantle, P.J. Barrie, L.F. Gladden, J. Phys. Chem. B
104 (2000) 5281.
Copyright © 2022 FDOKUMEN