Hazaribagh, District Census Handbook, Bihar - Linguistic ...
272
Z (5 0 .., :a -I .,. :: .,. ::t .,. '" .,. 0 i € k f it !' ... (;) ,; i J:: Ov c V\ HUm < . ... . ;: . C!l » I I '" (- .il" l' C. < {If J<' > J - g- o ! ., '" z o " '" c 0 • .. .. '" ... c '!. 0 c -; ¥ 11 :I f S2 '" VI -I ;lO 0 R m -I Z VI I =i » -< <; N » 3: ;;; » OJ " :0: " » ;;; C'l ;!; I if G' l -1 o 3 D /y 3 -1 s "v '" z a 11 -'I
-
Upload
khangminh22 -
Category
Documents
-
view
0 -
download
0
Transcript of Hazaribagh, District Census Handbook, Bihar - Linguistic ...

Z (5 0 .., :a -I
.,. :: .,. ::t .,. '" .,. 0
~ i ~ € ':~ k f ~ it ~
!' ... (;) ,;
i ~ ~ ~ ~ fI-~;'~ci'o
~~i~~s. J:: Ov c V\ ~
HUm ~: < . ... . ~
;: .
C!l » I I
'" (- .il"
l'
C.
<
{If J<' > J - g-o
! ~ ~ ., '" z o " '" c
0 • .. .. ~ '" ... c ~ '!. 0 c
-; ~ ¥
~~ 11
:I
f S2 '" ~ VI -I ;lO
0 R m -I Z
VI
I ~ =i » -< <; N » 3:
;;; ~ » OJ " :0:
" » ~ ;;; C'l
;!; I if
G'
l
-1
~ o 3
D
/y
~ 3
-1
s "v ~
'" z a 11
-'I

CENSUS 1961
BIHAR
DISTRICT CENSUS HANDBOOK
14
HAZARIBAGH PART I-INTRODUCTORY NOTE, CENSUS TABLES AND OFFICIAL STATISTICS
-::-_'" ---..... .. )t:' ,'t" -r;~
'\ ... .,.-. --~--~ - .... .._,. /" , . • <":'?¥~" '
\ ........ ~
'-.. "III' ,_ _ _. ~
~~!_~ w , ':: '~'~. --- _-s. D. PRASAD
0 .. THE IlQ)IAJr AD:uJlIfISTBA'X'lVB SEBVlOE
Supwtnundent 01 Oen.ua Operatio1N, B'h4r
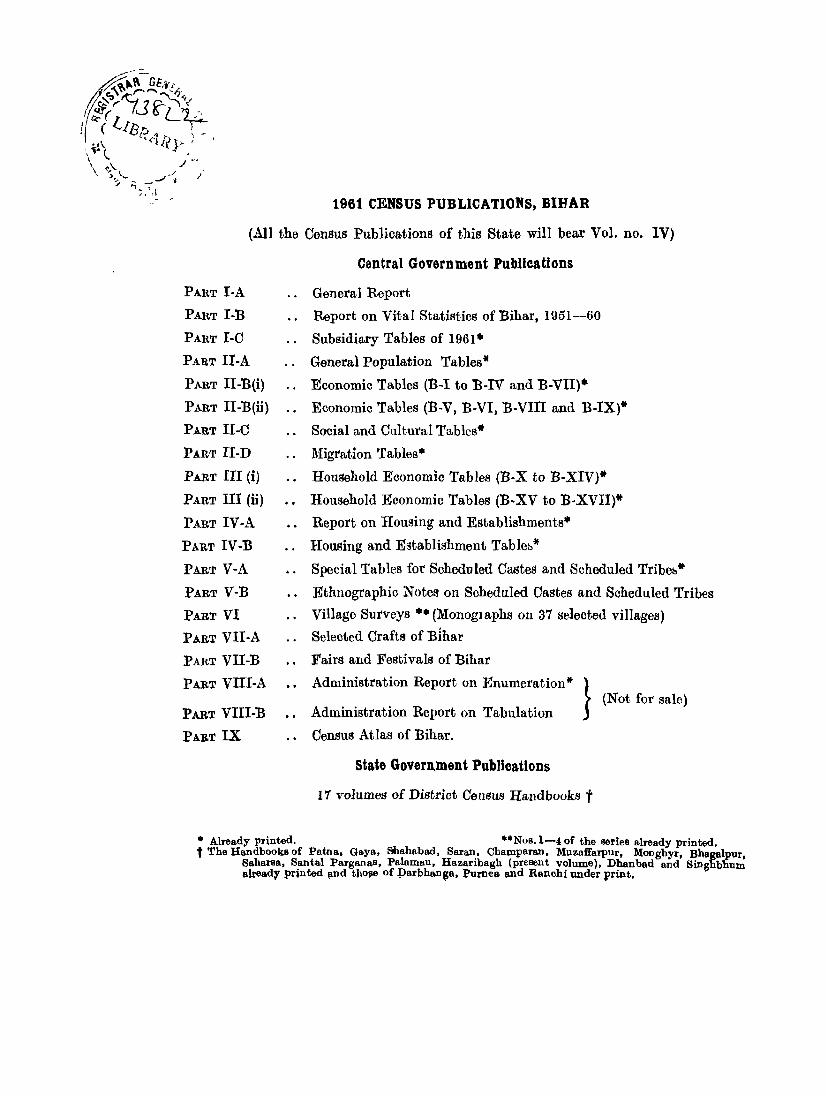
1961 CENSUS PUBLICATIONS, BIHAR
(All the Census Publications of this State will bear Vol. no. IV)
Central Government Publications
PART I-A
PART I-B
PART I-C
PART II-A
PART II-B(i)
PAR't II-B(ii)
PART II-C
PART II-D
PART III (i)
PART III (ii)
PART IV-A
PART IV-B
PART V-A
PART V-B
PART VI
PART VII-A
PART VII-B
PART VIII-A
PART VIII-B
PART IX
General Report
Report on Vital Statistics of Bihar, 1951-60
Subsidiary Tables of 1961.
General Population Tables·
Economic Tables (B-1 to B-IV and B-VU)·
Economic Tables (B-V, B-VI, B-VIII and B-IX)*
Social and Cultural Tables*
Migration Tables·
Household Economic Tables (B-X to B-XIV)*
Household Economic Tables (B-XV to B-XVII)*
Report on Housing and Establishments·
Housing and Establishment Table:,*
Special Tables for Scheduled Castes and Scheduled Tribe&*
Ethnographic Notes on Scheduled Castes and Scheduled Tribes
Village Surveys •• (Monoglaphs on 37 selected villages)
Selected Crafts of Bihar
Fairs and Festivals of Bihar
Administration Report on Enumeration * } (Not for sale)
Administration Report on Tabulation
Census Atlas of Bihar.
State Govern.lnent Publications
11 volumes of District Census Handbooks t
• Already printed. **Nos.1-4 of the series already printed. t The Handbooks of Patna. Gaya. Shahabad. Baran. Champaran, Muzaffarpur. Monghyr, Bbagalpur,
Baharsa, Bantal Parganas , Palamau, Hazaribagh (present volume). Dbanbad and Binghbbum ~1read1 printed !')ld tpolle of parbhan~a. Purnea and Ranchi under vrint.

CONTENTS CENSUS TABLES AND OFFICIAL STATISTICS
PREFACE
INTRODU CIN'G THE DISTRICT
Census Tablet-Note
A-SERIEs-GEN'ERML POPULATION TABLBS-
.. PAGE
i i
3
Explanatory Note Ii Table A-I-Area, Houses and Population 7 Appendix I to Table A-I l()
Annexure I to Appendix I to Table A-I 11
Annexure II to Appendix I to Table A-I 14 Appendix II to Table A-I .. 16 Table A-IV-Towns (and Town-groups) classified by Population in 1961 16
with variation since 1941. Appendix to Table A-IV 18
Explanatory Note A to Appendix to Table A-IV 19 Special Appendix to Table A-IV-
Part A 19 Part B 21
B-SERI,ES-GEN'ERAL AND HOUSEHOLD ECONOMIC TABLEs-
Explanatory Note 23 Table B-I~Workers and Non-workers classified by Sex and Broad Age- 28
groups. Table B-UI Part A-Industrial Classification of Workers and Non- 28
workers by Educational Levels in Urban Areas only. Table B-III Part B-Industrial Classification of Workers and Non- 30
workers by Educational Levels in Rural Areas only. Table B-VIII Part A-Persons unemployed aged 15 and above by Sex, 44
Broad Age-groups and Educational Levels in Urban Areas only. Table B-YIII Part B-Persons unemployed aged 15 and above by Sex 45
and Educational Levels in Rural Areas only 1.
Table B-IX-Persons not at work classified by Sex, Broad Age-groups 46 and Type of Activity.
Table B-X-Sample Households (i) Engaged neither in Cultivation nor in 58 Household Industry, (ii) Engaged either in Cultivation or Household Industry but not in both and (iii) Engaged both in Cultivation and Household Industry for All Areas.
Table B-XI-Sample Households engaged in Cultivation classified by Ii9 interest in land and si7Je of land cultivated in Rural and Urban Areas separately. •
Table B-XVU-8ample Households classified by (i) Number of male and 65 female members by size of Households and (ii) Engagement (a) neither in CuI ivation nor in Industry, (b) in Household Industry only and (c) in Cultivation sub-classified by size of land cultivated.
C-SERIES-SOCIAL A~D CULTURAL TAB'LEs-
Explanatory Note 66 Ta.ble C-I-Composition of Sample Households by relationship to head 68
of family classified by size of land cultivated. Table C-U-Age and Marital Statue 69

ii
PAGE
Table C-III Part B-Age, Sex and Education in Urban Areas only 72 Table C-III Part C-Age, Sex and Education in Rural Areas only 73 Table C-V-Mother-tongue 74 Table C~VII-Religion 86 Table C-VIII Part A-Classification by Literacy and Industrial Category 90
of Workers and Non-workers among Scheduled Castes. Table C-VIII Part B-Classification by Literacy and Industrial Category 92
of Workers and Non-workers a:mong Scheduled Tribes. SCT-SERIES- SPECIAL TABLES FOR SCHEDULED CASTES AND SCHEDULED
TRIBES-
Explanatory Note 94: Table SCT-I Part A-Industrial Classification of Persons at Work and 96
Non-workers by Sex for Scheduled Castes. Table SCT-I Part B-Industrial Classification of Persons at Work and 100
Non-workers by Sex for Scheduled Tribes. Appendix to Table SCT-I 104 Table SC-I-Persons not at Work classified by Sex, Type of Activity 105
and Educational Lev-els for Scheduled Castes. Table ST-I-Mother-tongue and Bilingualism for Scheduled Tribes 108 Table ST-II-Persons not at Work classified by Sex and Type of Activity 123
for Scheduled Tribes. TABLES BjASED ON DATA OBTAINED FROM THE HO'USELIST-
Explanatory Note 128 Annexure-Standard Industrial Classification 129 Classification of Rural Population living in villages of various silles 132 Villagewise Industrial Data . . 133
Official sta tistics-Explanatory Note 146
VITAL STATISTIdS-
Table VS-I-Registered Births and Deaths with mid-year rates 151 Table VS-I1-Deaths and Death rates due to selected causes 152 Supplement to Table VS-II . . 153
AGRICP"LTURAL STATISTICS-
Table AS-I-Rainfall 154 Table AS-II-Highest and Lowest Temperatures 157 Table AS-UI-Land Utilisation and Area unuer different crops 158 Table AS-IV-Gross Area irrigated by crops 159 Table AS-V-Gross Area irrigated by sources 159 Table AS-VI-Yield rates of principal crops 160 Table AS,.. VII-Statistics of skilled and unskilled Agricultural labourers .. 161 Table AS-VIII-;-Monthly ruling wholesale prices of staple foodgrains 162
Table AS-III. I-Land Utilisation 163 Table AS-III.2-Progress of Cultivation during the last three decades 163 Table AS-III.3-Co:mponents of Land Area, Cultivable and Cultivated 164
Area per hundred persons during the last three decades. Table AS-InA-Cropping Pattern 164 Table AS-III.5-Density of Total/Rural Population per hundred acres 165
of Area under foodgrains and net Area sown.

' .. Ul
Table AS-I1I.6-Density of Cultivators and Agricultural labourers per hundred acres of net Area sown in 1951 and 1961.
Table AS-I1I.7-RainfaU, Area sown and irrigated, Density, etc. LIVESTOPK-
Table LVT-I-Government Veterinary 'Facilities Table LVT-II-Livestock and Poultry ..
INDUSTRIES-
Table IND-I-Employment in Textile and Non-textile Industries Table IND-II-Name of Industry with number of Households and
persons empldyed in Rural Areas only. Supplement to Table IND-II
ADMINISTRA~ION-
166
167 168
169 170
174
Table ADM-I-General results of trial of Criminal Cases 174 Table ADM-II-Punishments inflicted in Criminal Cases 175
Table ADM-III-Strength of Police 175 'Table ADM-IV-Places of confinement and distribution of convicts by 17'6
Age-groups and Literacy. Table ADM-V-Co-operative Societies 178
Table ADM-VI-Receipts of Excise Revenue, Sales Tax, Entertainment 179 Tax, Motor-Spirit Tax, Stamps, etc.
Table ADM.-VII-Land Revenue/Rent.. 180
Table ADM-VIII-Number of registered documents and value of pro- 181 perties transferred.
Table ADM-IX-Sale and discharge under Small Savings Scheme 181
Table ADM-X-List of Banks 182 Table ADM-Xl-Progress of Life Insurance 182 Table ADM-XlI-Number of Motor Vehicles 182
EDUOATION-
Table EDN-I-Educational Institutions and Pupils, 1960-61 183 Table EDN -II-List of Educational Institutions 1;85
Table EDN-III-Press and Journals 186 Table EDN-IV-List of Cinema Houses 186
PUBLIC HEALTlI-
Table PH-I-Medical 'Facilities 186
COMMUNICATIONS-
Table CMN-I-Mileage of extra municipal roads maintained by Public 187 Authorities.
Table CMN-II-List of InspectionJDak Bungalows 188
Table CMN-III-Polymetric Table of distances (in miles) 195
MAPS AND DIAGRAMS
1. Map of Hazaribagh showing density 2. Map of Hazatib.lgh showing Administrative Divisions ..
•. Facing Inner Title Facing page i
3. Map of Hazaribagh showing percentage variation in population .. xiv xxv
xxvi xli
4. Diagram showing litern.cy and educational levels 5. Map of Hl.zaribagh .showing percentage of literacy 6. Diagram showing Anchalwise distribution of workers ..
I wish to place on record my grateful appreciation of the useful services rendered by the following members of my staff in the preparation of this volume:
1. Sri R. N. Misra
2. Sri U. P. Shrivastava
3. Sri K. K. Chakravorty
4. Sri R. B. Singh
5. Sri R. B. Pandey
6. Sri Maheshwar Prasad
7. Sri M. Abbas
8. Sri SheD Prasad
9. Sri Md. Noor Khan
10. Sri Shaft Ahmad
ll. Sri A. K. Mathur
12. Sri R. K. Sinha
1 Deputy Superintendent of I Cansus Operations.
)
} Tabulation Officer
Statistical Assistant
Senior Cartographer
Proof Reader
Supervisor, Anchal Map Section
Draughtsman
Artist
Investigator

PREFACE
Though compiled in the Census Office, District Census Handbooks are actually State Government publications. They were published for the first time in the '1951 Census. So varied have been their uses and so great their value that there Can be little doubt that the Handbooks have come to stay as a regula.r feature of every census. In 1961, while the tradition has been continued, efforts have been made to enlarge the scope and enrich the contents of the Handbook in several ways. Much of it is, of course, due to the able guidance and inspiration from Shd Asok Mitra, the Registrar General of India, to whom no words of gratitude can really do full justice.
The main attraction of the District Census Handbook lies in the portion relating I
to Village Statistics which presents primary census data for each village in the district. To facilitate reference, this table has been supplemented by a Village Directory which, apart from cataloguing some additional information, gives an alphabetical list of villages in each Anchal. The arrangement of villages in the Village Statistics portion is according to the jurisdiction of Panchayats and Anchals. No authentio list of villages comprised in each Panchayat or Anchal was readily available before the Census of 1961. Much pioneering effort had, therefore, to be made in the preparation of these lists. It is possible that some errors, particularly in the delineation of Panchayat jurisdiction, might have crept in because of these limitations or subsequent modifications in boundaries. It may be noted also that the statistios reproduced here are generally related to March, 1961 unless otherwise indicated.
The Anchal mapS are a special feature of the Handbook this time. They have been prepared from 1"=1 mile Anchal maps which were traced from the old Rev~nue Thana maps. Though revenue thanas had long ceased to be of much significance in day-to-day administration no attempt appears to have been made in the past, to prepare police station or anchal maps delineating the village boundaries. The Census of 1961 in Bihar can justly claim the preparation of these anchal maps, both on 1"=1 mile scale as well as on the reduced scale in which they are presented in this book, among its maj or achievements. Of course this WaS made possible mainly because of the keen interest and helpful attitude of the State Government which not only placed the relevant materials at my disposal but also agreed to meet the entire cost of the scheme. For all this I amgreatly indebted to Shri S. J. Majumdar, the then Chief Secretary, Shri S. K. Chakravorty, the then Revenue Secre~ary, and Shri J. P. Shrivastava, the then Director of L,and Records, Bihar. lowe a special debt of gratitude to Shri M. P. Singh, Deputy Director of Surveys, Bihar, who not only helped with some of his experienced staff but also provided valuable technical supervision from time to time.
The Village Statistics and the Village Directory, together with the Anchal maps, should provide a complete index and statistical guide to each village in the district. Among other items of interest, mention may be made of the note introducing the
'district, brief gazetteer of places, glossary of ancient monuments and official statistics. These are, of course, in addition to the census tables for the district. It is regretted that paucity of space stood in the way of reproducing a good many of the other census tables in the Handboolk. Forinstanoe, Migration and Housing Tables have been excluded oompletely. These may be looked for, ifnecGSSary, in the relevant State volumes.

ii
Like the Santal Parganas, the district of Hlilzaribagh also presented a special difficulty. With over 7,000 villages, it is next only to the Santal Parganas in the number of villages. This has resulted in the splitting up of thjs Handbook also into two parts. Part I contains the Introductory Note, the Census Tables and Official Statistics. Part II has the Village Directory, Village and Town Statistics and the Anchal Maps. It is admitted that this arrangement is by no means condl cive to easy referencing, but there was no escape from it.
This Handbook is the product of h~rd toil and patient labour of several persons and agencies. No list can really be comprehensive enough to include them all. An acknowledgement appears elsewhere mentioning some of those who were associated with this work in the Census Office. Outside sources and agencies have been mentioned as far as practicable, at appropriate places in the book itself.
Last, but far from least, my special thanks are due to Shri S. N. Chatterjee, Superintendent, Secretariat Press, Patna and his staff for the fine printing and get-up of this Handbook.
PATNA =
March 15, 1967
S. D.PRASAD Superintendent of Oen8U8 Operations,
Bihar.


INTRODUCING THE DISTRICT 1. GENERAL
Situated between north latitude 23°25' and 24°48' and east longitude 84°29' and 86°38', the district of Hazaribagh lies in the northeastern portion of the Chotanagpur division in Bihar State. It is bounded on the north by Gaya and Monghyr districts, on the east by the Santal Parganas and Dhanbad, on the south by Ranchi, and on the west by Palamau and Gaya. It contains three subdivisions, viz., Hazaribagh Sadar, Chatra and Giridih, the headquarters of which are located in towns bearing the name of the respective subdivisions. Hazaribagh town, situated at an elevation of a.bout 2,000 feet, is the a.dministrative headquarters and principal town of the district.
The district derives its name from itl'l headquarters and principal town. Hazaribagh literally means the place with I'a thousand gardens". A village named. Hazari (Thana no. 141) is oomprised within the Hazaribagh municipality.
There are 42 anchal-cum-community development blocks and 33 police stations in the district. They are distributed in the three subdivisions as indicated below:
HU'lDber 01 ancball and. ponce stations In Hazarlbagh dlstrlot. 1961
Subdivision
Hazaribagh Sadar Chatra Giridib
TOrAIJ
Number of ,.....__....._-....
Anohals Police Pations
22/' 14 6 6
14 13
42 33 .
The following police stations comprise two or more anchals each :
Police station
1. Barhi
2. Hazlll"ibagh
3. Mandu
5. Peterbar
6. Kodarma
7. GlIowan
8. Barkagaon
Anchllola
(a) Barhi (b) Barkatha
Ca} Haza.ribagh (b) KlIotkamsandi
(a) Mandu (6) Nagri (Churchu)
(a) Ramgarh (6) Patratu
(a) Peterbar (6) Kumar
(a) Kodarma (b) Markaoho
(a) Gawan (6) Tisri
•• (a) Bark,agaon (6) Keredari (c) Tandwa
Of the total number of '7,101 mauzas or revenue villages in the district, 6,162 are inhabited. 52 mauzas are wholly included in towns and 7 maUZa8 partly so. The number of towns in the district is 10.
2. HISTORY
Fifteen years after the grant of Diwani for Bengal, Bihar and Orissa to the East India Company, a district known as Ramgarh Hill Tract was oonstituted in 1780. It had its headquarters alternately at Chatra (in Hazaribagh distriot) and Sherghati (in Gaya district). The present district of Hazaribagh formed part of the Ramgarh Hill Tra.ct till 1833. Following the Kol rising in 1833 a Non-regulation Agency called the South-West Frontier Agency was created with headquarters at Lohardagga. It corresp onded virtually to the whole of the
present Chotanagpur division, and was placed under the charge of the Agent to the GovemorGeneral. At about the same time, Hazaribagh. Manbhum and in 1836 ~inghbhum were oarved out into separate districts under Principal Assistants to the Agent. The designation of Agent to the Governor-General of the SouthWest Frontier Agency was changed to Commissioner of the Chotanagpur division in 1854. From 1861 Principal Assistant to Commissioner was redesignat~ as Deput! Com~~~sioner.

Early History
The entire territory of Chotanagpur, known as Jharkhand (meaning forest territory), was presumably beyond the pale of direct Hindu influence in ancient India. However, Jarasandh, the mighty emperor of Rajgriha in the Mahabharat period, may have exercised some kind of loose supervision over the area. Similarly, Mahapadmanand Ugrasen of Magadh, who subdued the entire country up to Orissa, may have gained some control over Jharkhand as well. Possibly, the area was included in the Magadh Empire in the reign of Asoka (273-232 B.C.).
Parsvanath: the twenty-third Tirthankar of the Jains attained nirvan on the summit of the Parasnath Hill sometime in the eighth century B.C. '
With the decline of Mauryan power, King Kharavela of Kalinga led an army through Jharkhand and ransacked Rajgriha and Pataliputra. Later, Samudra Gupta (335-380 A.D.) must have passed through the area on his expedition to the Deccan. The Chinese traveller Itsing is believed to have journeyed through the Chotanagpur plateau on his travels to Nalanda and Bodh Gaya.
The Chotanagpur Raj is believed to have been set up in fifth century A.D., after the fall of the imperial Guptas. Phanimukut was elected the first king. It is said that he -was found by the side of a tank under the protection of a Nag (snake). Hence the dynasty founded by him was, therefore, named the Nag dynasty.
Muslim Period
The entire Chotanagpur plateau was referred to as Jharkhand by the Muhammedan historians. Throughout the Turko-Afghan period (up to 1526), the area remained virtually free from external influence. It is only with the accession of Akbar to the throne of Delhi in 1556 that Muslim influence penetrated Jharkkand, then known to the Mughals as Kokrah. In 1585 Akbar sent a force under th& command of Sha~baz Khan to reduce the Raja of Chotanagpur to the po.sition of a tribu~ary. Kokrah was included 111 the Subak of BIhar, as mentioned in the Ain-i-.A.kbari.
Mter the death of Akbar in 1605, the area vresumably Fegained its independence, This
ii
necessitated an expedition in 1616 by Ibrahim Khan Fateh Jang, Governor of Bihar and brother of Queen Noorjehan. Ibrahim Khan defeated and captured Durjan Sal, the 46th Raja of Chotanagpur. He was imprisoned for 12 years but released and reinstated on the throne after he had shown his ability in distinguishing a real diamond from a fake one. The annual tribute to be paid by him was fixed at Rs. 6,000.
In 1632 Chotanagpur was given as jagir to the Governor at Patna for annual payment of Rs. 136,000.
In the reign of Muhammad Shah (1719-1748), Sarballand Khan, the Governor of Bihar, marched against the Raja of Chotanagpur and obtained his submission. Another expedition was led by Fakhruddoula, Governor of Bihar, in 1731. He came to terms with the Raja of Ramgarh who owed allegiance to the Raja of Chotanagpur. In 1735 Alivardi Khan had some difficulty in enforcing the payment of the annual tribute of Rs. 12,000 from the Raja of Ramgarh, as agreed to by the latter according to the ter:tn~ settled with Fakhruddoula. This continued until the occupation of the country by the British.
During the Muslim period, main estates in the district were: (1) Ramgarh, (2) Kunda, (3) Kendi, (4) Chai and (5) Kharagdiha. A brief account of their origin may be useful in placing the history of the district in that period in proper perspective.
The Ramgarh Raj was founded by Shri Bagdeo Singh, who was in the service of the Raja of Chotanagpur. Bagdeo Singh became Raja of over 21 parganas in 1368 with Sisia as his capital. Hemant Singh, the sixth Raja of the dynasty, transferred his headquarters to Badam and ruins of his palace still eocist there. It was built in 1642. The capital was transferred to Ramgarh, 30 miles east in 1670. Later, it was transferred to Ichak and finally to Padma.
The Kunda estate was founded by Shri Ram Singh, a servant of Emperor Aurangzeb. He was granted a. fFbanaaari jagir by Daud Khan in 1669.
The early history of Kendi and Chai is not known. In 1770 A.D. Kendi was reduced by

the Muhammadans to the position of a zamindari. Chai was taken possession of by Mukund Singh, Raja of Ramgarh in 1770 A.D.
Kharagdiha was founded by Hansraj Bhutdeb in the 15th century A.D. In 1765 Raja Modenarayan Deb was expelled by Akbar Ali Khan, son of Kamgar Khan. But Modenarayan's grandson, Girwar :Narayan Deb assisted the British in expelling Akbar Ali in 1774.
iii
In 1740 Alivardi Khan, Su bedar of Bengal, :Bihar and Orissa, sent an expedition under Hidayat Ali Khan to subjugate the Raja of Ramgarh. He was successful in doing so.
British Period
The Diwani of Bengal, Bihar and Orissa was grant6d by Emperor Shah Alam II to the East India Company in 1765. This Diwani included Chotanagpur as a part of Bihar. Hence, the East India Company derived the right to oollect revenue or tribute. The British came into contact with Hazaribagh for the first time in 1769 when Capt. Camac visited Hazaribagh to establish some sort of order in the 'jungleterry' district. The importance of Ramgarh increased with the rise of Maratha power in 1761-62 under Madhav Rao. Capt. Camac first subdued the chiefs of Kharagdiha and Kunda. In 1771 he Was made the Military Collector of Ramgarh district. Besides the area of the district as presently constituted. it also included :N agpur (Ran chi ), Palamau and Chakai (now in Monghyr). He had his headquarters at Chatra. Raja Dhiraj :Narayan Si~gh of Kunda, fourth in the line of succession from Shri RalU Singh, rendered service to the British, and Oapt. Oamac renewed the old agreement according to which he was exempted from paying land revenue.
Ai; that time Mukund Singh was the Raja of Ramgarh. During the operations of Capt. Camac against the Palamau Raja, Dhupnath Shahi of Chotanagpur rendered useful service to Capt. Camac. On the other hand, Raja Mukund Singh of Ramgarh, instead of rendering assistance, worked to thwart the British designs. Earlier, the tribute of the Raja of Chotanagpur was being paid through the Raja of Ramgarh. But this was discontinued and since the British were dissatisfied by Mukund Singh, they supported one Tej Singh, a claimant to the Ramgarh Gadai. The forces sent
under Lt. Goddard defeated Mukund Singh. Tej Singh was then installed as first as Musatagir and ultimately became Raja. He transferred his capital to Ichak.
Capt. Camac Was succeeded, in 1780, by Chapman, the first civilian administrator of Chotanagpur. The so-called "conquered provinces" were formed into a district which comprised Ramgarh, Kendi, Kunda and Kharagdiha (which together constituted the present district of Hazaribagh), the whole of Palamau, Chakai, Pachet and the area around Sherghati. The present district of Ranchi was added under the designation of tributary Mahal of Chotanagpur. Chapman waS at the same'time the Judge and the Magistrate and Collector of the district and held his court alternately at Sherghati and Chatra. The Ramgarh battalion comprising of Indian infantrymen was raised in his time and stationed at Hazaribagh.
Subs(quent to the Kol rising in 1831 which, however, did not seriously affect Hazaribagh, the administrative structure of the territory was changed. The pargana,'j Ramgarh, Kharagdiha, Kendi and Kunda became part of the South-West Frontier Agency and were formed into a division named Hazaribagh, with Hazaribagh as the administrative headquarters. In 1854 the designation of the South-West Frontier Agency was changed to Chutia Nagpur and it began to be administered as a Non:regulation Province under the Lieutenant GoV'ernor of Bihar. In ] 855-56 there was the great uprise of the Santals against the British but it was brutally suppressed.
:1857
Hazaribagh played an important role in the movement of 1857. The Ramgarh battalion at Hazaribagh rosa in revolt on the 30th July. The Deputy Qommissioner, Capt. Simpson, along with some other Europeans fled on foot to rehak. Capt. Dalton, the Commissioner of Ranchi, sent Lt. Graham with a detachment of the Ramgarh Light Infantry to disarm the regiment at H;:Lzaribagh. But this detachment also mutinied and hurried back to Ranchi. Meanwhile, the Hazaribagh mutineers also started proceeding to Ranchi by the road via Badam. Capt. Dalton evacuated the Europeans of Ranchi to Hazaribagh and thence to Bagodar. When Davis took charge of Hazaribagh on 4th August, he found the treasury empty and the records partially destroyed. However I

iv
Hazaribagh was reoccupied by Dalton with the help of the Sikh regiment under Col. Rattray. The insurgents did not receive much support in Hazaribagh and very little in Ranchi. Hence, they started out to join Kuer Singh but they were attacked and defeated on the' 2nd October, 1857 at Chatra under a British force commanded by Major English. The movement in Hazaribagh was thus crushed, over 150 mutineers having been killed. Sporadic risings of the Santa-Is in the wake of their earlier efforts were also checked ruthlessly.
Municipalities were established at Hazaribagh and Chatra on 1st Ap~il, 1869. Giridih subdivision was established in 1870, with headquarters at Karhabari which Was subsequently shifted to Giridih in 1881. The railway line from Madhupur to Giridih WaS constructed in 1871. The Chatra subdivision was formed in 1914.
The ~ on -co -operation Movement jn 1920 influenced Hazaribagh district. Many students gave up their studies, and some lawyers their practice, to join the movement. A District Congress Committee was formed. Dr. Rajendra Prasad visited Hazaribagh in 1921 and addressed public meetings. Shri K.B. Sahay was elected to the Provincial Legislative Council in 1923 as a candidate of the Swaraj Party. Mahatma Gandhi visited the district in 1925. A large p.umber of people participated in Civil Disobedience Movement of 1930. In the 1937 elections, the Congress Party swept the polls in the district. The 53rd annual session of the Indian National Congress was held at Ramgarh in 1940. In tIle movement of 1942 also, there was large-scale participation by the people. 'The Kodarma Railway Station was set on fire. Many persons took part in organising processions and destroying communications.
3. PHYSICAL FEATURES
Natural Divisions
The district may be divided into three broad natural divisions, viz. :
(i) the central plateau, (ii) the lower plateaus, and
(iii) the Damodar valley.
The central plateau, averaging 2,000 feet high, is situated in the centre of the diskict and contains the town of Hazaribagh. It extends over about 30 milel'l from east to west 'and 20 miles from north to south.
central plateau to 2,816 and 3,057 feet above the mean sea-level. To the south of the central plateau lies the Sugu hill rising to 3,203 feet and separated from the Jilinga by riverBokaro. Marang Buru hill lies south of the Damodar valley between Hazaribagh and Ranchi districts, attaining a height of 3,445 feet.
I
On the eastern border of the district is the Parasnath hill. It has the distinction of having the highest peak in the State, with an altitude of 4,479 feet above the mean sea-level.
The hills along the northern border of the district are, in reality, the face of the plateau.
Around the central plateau are the lower .' plateaus on all sides except the west on which RIvers side a high ridge connects the central plateau to the Palamau district.. The lOwer plateaus average 1,300 feet in height, their surface being undUlating. In the north and north-west, the lower plateaus form fairly level table-lands until they reaoh the ghatB when they drop to about 700 feet. On the east, the general elevation is lower and the descent gradual. Along the southern part of the district is the. Domodar valley in which the town of Ramgarh is 1,000 feet lower than Hazaribagh.
TopographY and Hills
The- chief hills in central Hazaribagh are Chandwara and Jilinga which ri~ above the
The district is divided into three main waterheads. One is served by the Damodar and its tributaries, viz., Haharo, Naikari and Bhera. River Konar drains the eastern part of the central plateau and is fed by the Siwani and the Bokaro. The Barakar serves the areas north of the Grand Trunk road.- The rivers Damodar and Barakar drain about two-thirds of the district. The remaining portion of the district is drained by rivera running to the north, the principal among them being the Morhar. Lilajan, Tilaiya.and Sakri.
The Damodar rises in the Kharampat hill in PalaPlau and flows for 90 miles in the dis-
trict. It is joined by the Garhi or Tandwtt river near its entrance to the district wherl3 its bed is 1,326 feet above sea-level. Furthet' east, the Haharo, which drains the Karnapurtt valley, joins the Damodar to the east of Mahudi hill. The Naikari, with drainage from the Ranchi plateau and further down the Bhera, joins the Damodar. The Rajrappa falls are situated nea.! the conflnence of the Damodar and the Bhera-. From here the Damodar turns north and is joined by Bokaro and Konar near Bermo. Bokaro and Konar rivers drain the eastern portion of the central plateau.
The Bokaro runs through a shallow valley. The Konar audits tributary, theSiwani, rise in cultivated fields and meander till they meet 15 miles east of Hazaribagh. The BokarOKona;r riven enter the "Bokaro coal-neldl."o. Below the junction of the Damodar with Konar, the tributary Khaujo comes from the souW. The last river to join the Damodar is Jamunia which forms the boundary of the district with Dhanbad.
v
The Barakar rises in cultivated fields nejll' Iehak, 7 miles north of Hazaribagh. It flO"\f"s in eastern direction till it joins the Damodttr in the eastern part of Dhanbad district.
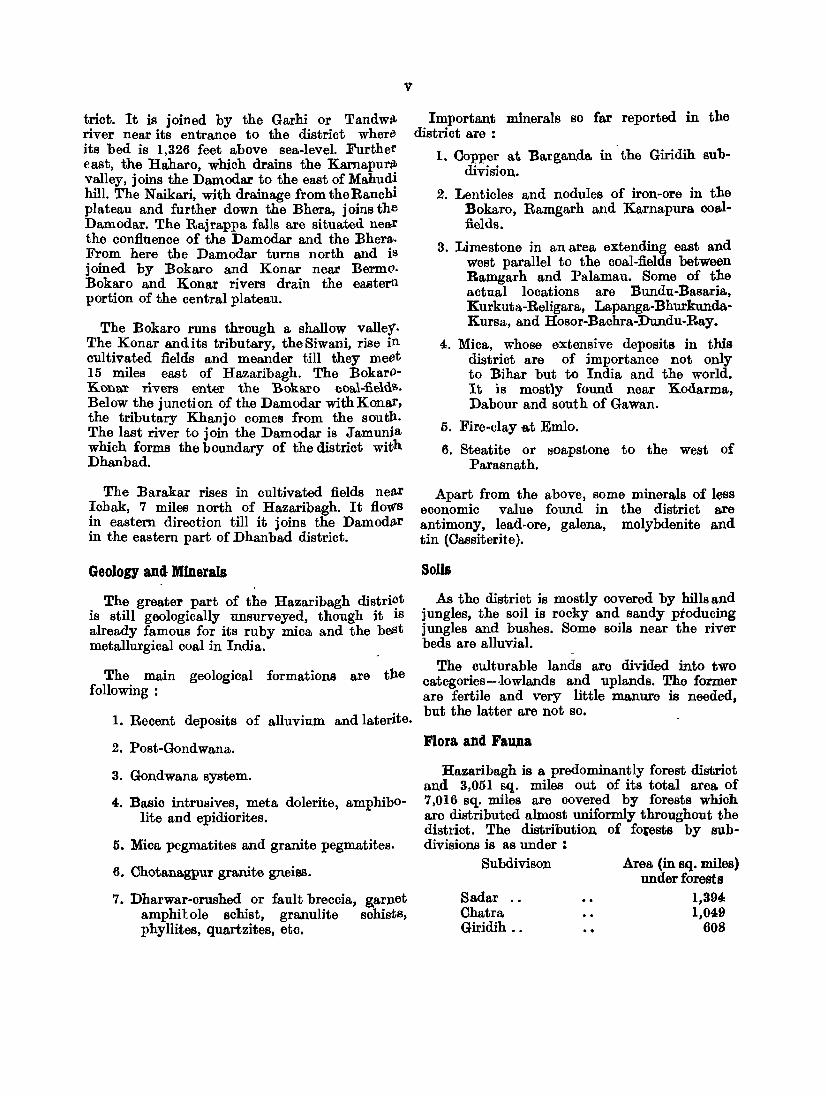
Geology and· Minerals
The greater part of the Hazaribagh distri~t is still geologically unsurveyed, though it IS
already famous for its ruby mica and the best metallurgical coal in India.
The main geological formations are tlle following:
1. Recent deposits of alluvium and laterite.
2. Post-Gondwana.
3. Gondwana system.
4. Basio intrusives, meta dolerite, amphibO-lite and epidiorites.
5. Mica pegmatites and granite pegmatites.
6. Chotanagpur granite gneiSS.
7. Dharwar-crushed or fault breccia, garnet amphilole schist, granulite schists, phyllites, quartzites, etc.
Important minerals so far reported in the district are :
1. Copper at. 'Barganda in' the Giridih subdivision.
2. Lenticles and nodules of iron-ore in the Bokaro, Ramgarh and Karnapura coalfields.
3. Limestone in an-area extending east and west parallel to the coal-fields between Ramgarh and Palamau. Some of the actual locations are Bundu-Basaria, Kurkuta-Religara, Lapanga-BhurkundaKursa, and Hosor-Bachra-Dundu-Ray.
4. Mica, whose extensive deposits in this district are of importance not only to Bihar but to India and the world. It is mostly found near Kodarma, Dabour and south of Gawan.
o. Fire-clay il.t Emlo.
6. Steatite or soapstone to the west of Parasnath.
Apart from the above, some minerals of less economic value found in the district are antimony, lead-ore, galena, molybdenite and tin (Cassiterite).
Solll
As the district is mostly covered by hills and jungles, the soil is rocky and sandy producing jungles and bushes. Some soils near the riv-er beds are alluvial.
The culturable lands are divided into two categories-lowlands and uplands. The former are fertile and very little manure is needed, but the latter are not so.
Flora and FaU,D.a
Hazaribagh is a predominantly forest district and 3,051 sq. miles out of its total area of 7,016 sq. miles are covered by forests which are distributed almost uniformly throughout the district. The distribution of fotests by subdivisions is as under :
Subdivison
Sadar •. Chatra Giridih ..
Area (in sq. miles) under forests
1,394 1,049
608

vi
#0,1 (Shorea robusta) is the most famous and predominent speoies of trees in the jungles of the district. Among other common speoies are, bamboo (Dendra calamus strietus) , Khair (Acacia catechu), Salai (Boswellia serrato,) , Simu l (Salmalia malabarica), Mahua (Bassia lati/oUa) , Palas (Buteo, Jrondosa), KU8um (Schleichera trijuga), Ke'rld (Diosyro8 melanoxylon) , Asan (Perminalia tomentosa) , Piar (Buchanania lat~rolia) and Bhelwa (Semecarpus anacardium).
Tigers are rarely found, but leopards are fairly oommon in most looalities of the distriot. Bears, hyenas, jackals, foxes, pigs and hares are also oommon. Sambkar, spotted deer, hog-deer, four-horn deer and ravine deer are also found. Snakes and lizards are quite common. The district is famous for 205 varieties of breeding birds and 61 types of birds which visit the district in the cold weather only. The district has a National Game Sanctuary about 12 miles north
of Hazaribagh town on the main road from Patna.
cumate and Rainfall
The district comes within the tropical monsoon region. It is cold during the winter but not very hot during the summer. The mean daily maximum temperature is 99.4°F in May and the mean daily minimum temperature 50°F in December. The highest temperature recorded so far was 1ll'F on 18th May, 1897 and the lowest 36cF on the 16th January, 1933. The mean annual humidity is 60 per cent and the average velocity of wind is 5.7 miles per hour.
The mean annual rainfall at Hazaribagh is 53.04 inches. Rains set in during June and last till the middle of September. Occasional winter rains between November and middle of February. though scanty, Cause severe cold spells.
4. COMMUNICATIONS
Roads
The district is well served by a network of good roads. It has 155 miles of National Highways, 233 miles of State Highways, and 921 miles of roads managed by the District Board. Moreover, there. are 66 miles of roads under the Hazaribagh Mines Board, 330 miles under the Forest Department and some small roads maintained by the Damodar Valley Corporation.
The Grand Trunk road (National Highway no. 2) runs for 75 miles in the district, some important 'places on it being Chauparall, Barhi, Bagodar and Dumri. The Barhi-Hazaribagh road (22.5 miles) is a part of N. H. 33 j and the Barhi-Rajauli road (31.4 miles) a part of N.H. 31. The Dumri-Giridih road (31.1 miles) is a temporary National Highway.
~'he following are the State Highways :
Road
1. Hazaribagh-Ro.uchi 2. Hazaribagh-Bagodar-Saraiya 3. Giridih-Jo.mua-Sarwau 4. Jamua-Kodarma 5. Gomia-Chatra-Gosaindih 6. HazlU"ibagh-Simaria 7.0tbers
Mileage
... 38.60
40.50 14.50 43.00 42.50
36.00 18.42
Among important District Board roads are the following :
Road
1. Chatra..Chauparan 2. Hazaribagh-Simaria-Chatra. 3. Razaribagh-Katkamsaudi.Chatra 4. Bishungarh-Peterbar 5. Razaribagh-Tandwa-Simaria 6. Ramgarh-Daka.garha 7. Saraiya-Dhanwar 8. Putridih.Govindpur 9. Gaya.Deoghar
Mileage
30.50 42.00 35.50 31.50 45.00 28.00 18.50 37.00 47.50
Even unmetalled gravelled roads are open to vehicular traffic throughout the year except on unbridged sections during the rains.
Railways
The district headqu~rters at Ifazaribagh is not directly connected by rail. The following four different routes of railways pass through the district;
(i) the Madhupur-Giridih branch with a route mileage of 15.83 and track mileage of 20.98. Only Mahesmunda and Giridih stations on this route fall within the district;

(ii). the Grand Chord section covering e. route mileage of 61.12 and tracI.: mileage of 137.77, having three important railway stations namely, Parasnath, Hazaribagh Road ane! Kodarma in the district ;
(iii) the Gomoh-Barkakana-Barwadih sec-tion having route mileage of 81.92 ami track mileage of 137.52, and containin~ 17 stations in the district ; and
(iv) the Barkakana-Ramgarh town-Muri section.
Airways
There are two ·landing air strips for small planes in the district ; one is at Hazaribagh and the other at Giridih.
RiverwaYfi
All rivers in the district are shallow. Mostly they dry up in summer though they are in high floods during the monsoon. For these reasons, there is not much of river traffic in the district.
6. DISTRICT ADMINISTRATION
General Administration
The Deputy Commissioner is in charge of the civil, revenue and criminal administration ofthe district. He is also the chief pilot of aU development and welfare activities in the district. The Commissioner, Ranchi division, having his
-headquarters at Ranchi, exercises general super-vision and control over him. The Deputf Commissioner is assisted by an Additional Collector and a District Development Officet, both of Additional District Magistrate's ran];:· A number of Deputy Collectors, Sub-Deput;f Collectors and other officers are posted at the district headquarters to aSBist the Collector.
For administrative purposes, Hazaribagb jS divided into three subdivisions, each in charge of a Subdivisional Officer drawn from the Indian Administrative Service or the Bihar Civil Service. The Sub divisional Officer works under the direct control of the Collectot· He is assisted by a number of Deputy and SubDeputy Collectors.
Each subdivision is divided into a number of Anchal-cum-Development blocks. The distriot has 42 such blocks, each in charge of an Anchi11 Adhikari who is also designated as the Bloc~ Development Officer. These officers belong either to the Bihar Civil Service or the Bihar Junior Civil Service. The Anchal Adhikari-cumBlock Development Officer is incharge of a1l revenue, development and welfare activitieS in the area and works under the direct control of the Subdivisional Officer. His services as it
Magistrate are utilised only when a law and order situation arises. He has a team ofworkers drawn from different departments of Govern~ent to assist him in development works: AS Anchal Adhikari, he is also the chief revenue
officer at the Anchallevel and collects rent, cess and other misnellaneous dues of Government._
Judicial Administration
There is no separation of executive from judiciary in the district. The District Judge, who is also the Sessions Judge for the Sessions Divisions of Hazaribagh, heads the judiciary. Besides the'District and Sessions Judge, there are Subordinate Judges and Munsifs posted at the subdivisional headquarters for administration of civil justice. The Subordinate Judges are also vested with powers of Assistant Sessions Judge. Additional Judges, Subordinate Judges and Munsifs are posted when cases accumulate.
Pollee Administration
The Superintendent of Police is the head of the police force in the district. He has his headquarters at Hazaribagh and works under the Deputy Inspector-General of Police, Southem Range, Ranchi.. He is assisted by a number of Deputy or Assistant Superintendents of Police, Police Inspectors, Sergeants-Major, Police Sub-Inspectors and Prosecuting Inspectors. In every subdivision, there is a Deputy or Assistant Superintendent of Police and . ' under hIm, Inspectors and Sub-Inspectors of Police incharge of circles and police stations respectively. The total number. of the police stations in the district is 33. The Officer-incharge of a police station is assisted in his work by a team of sub-inspectors, assistant sub-inspectors, literate constables and ordinary constables. Dafadars and Chowkidars constitute the rural police force. Their duties consist of night patrol, watch over the movement of strangers and suspects, and reporting of crimes.

viii
6. AREA, VILLAGES AND TOWNS
Area
The area of Hazaribagh district is 6,986 sq. miles (or 18,094 sq. kms.) according to the Bihar Survey and 7,016 sq. miles (or 18,17l sq. kms.) according to the Surveyor General of India. The small difference of 30 sq. miles is attributable to the different methods of computation adopted by the two agencies.
The area of Hazaribagh is almost twice the average area. of a district (3,937 sq. miles) in Bihar. In fact, it accounts for 10.44 per cent of the State's area and is next only to Ranchi district (7,035 sq. miles) in area. Among 328 districts in the country, Hazaribagh ranks 22nd in area. Its area is more than that of Nagaland (16,488 sq. kms.), nearly double that of Tripura (10,660 sq. kms.) and a little less than two and a lialftimes that of Sikkim (7,299 sq. kms.). Compared to some countries of the world, it is about two-thirds the area of Albania (28,748 sq. kms.) and double that of Cyprus (9,251 sq. kms.).
Villages
The term 'village' has the sa me meaning in census as a revenue mauza. The Code of Oensus Procedure, 1961 defined it as follows:
"A mauza means a parcel of land which as a rule is partly built over but mostly cultivated and waste_ with a definite position and area, the boundaries of which were defined eithel.' at the time of cadastral surveyor at the time of the revenue survey. It may contain no houses at all or, on the other hand, several hamlets each bearing a different name."
There are 6,162 inhabited and 887 uninhabited mauzas in the district. 52 villages are wholly included and 7 villages partly included in towns which number 10 in the district. Among the districts of Cho: anagpur division,. Hazaribagh has the largest number of villages. In Bihar, however, it is next only to Santal Parganas in the number of villages.
The average area of a mama in the Hazaribagq district is 0.98 sq. mile which is higher
than the average for the State (0.85 sq. mile), but lower than the averages in the districts of Ranchi (1.80 sq. miles), Saharsa (1.55 sq. miles), Palamau (1.36 sq. miles), Champaran (1.24 sq. miles) and Singhbhum (1.10 sq. miles).
The average population per mauza in the district is 337 persons which is much below the State average of 588 persons. Compared to other districts of the State, the average in Hazaribagh is lower than other districts except Palamau (330) and Santal Parganas (218). These averages have been worked out by taking into account all the villages-inhabited, uninhabited or wholly included in towns.
The following statement shows for the district and the State the distribution of 1,000 inhabited villages by different size classes of population and the proportion of population in each size class per 1,000 of rural population:
VUlages In Hazarlbagh district and Bihar Stat. olasallied by population Sizes, 1961
Villages containing
1
Less thau 500 persons ••
500-999 persons
1,000-1,999 persons
2,000-4,999 persons
5,000-9,999 persons
10,000 persons and above
PROl'ORnON FER 1,000 ~ ~--------~ Hazaribagh dis. Bihar State
trict ,,-..---A---.. Villages Popu.
lation
2 3
803 413
129 249
53 199
14 111
1 28
,_____.J",--. Villages Popu.
lation
4 5
627 216
204 228
113 247
49 228
6 68
1 13
(Detailed figures upto anchal level are given in Table A-III. *)
It follows that nearly two-thirds (66.2 per cent) of the rural population of Hazaribagh district live in small villages having less than 1,000 persons in each. The corresponding proportion for the State is much lower (44.4 per cent). Even in regard to number, the proportion of small size villages in Hazaribagh (93.2 per cent) is higher than that in the State (83.1 per cent). The incidence of medium size ·Census of India. 1961, Bihar, VOl. IV, Part II.A
Geueral Yopulation Tables. '

villages (population 1,000 to 1,999) is lower il1 Hazaribagh both in number and proportion of population in them than the State. The same is true of large size villages (having 2,000 persons or more). Hazaribagh has not a single village with population 10,000 or more. The following is a list of villages (arranged in descending order of population) in Hazaribagh district having population of 5,000 or more:
Name of village Anchal Thana Poptl· no. latio#l
, IX
1. Saunda Patratu 24 9,3.21
2. Deoria·Barganwa Patratu ~8 8.913
3. Chitarpur Ramgarh 147 7.132
4. Domchanch Kodarma 68 6.761
o. Barughutu Mandu 118 6.746
6. Sara.m Omnia. 122 6.24.8
7. Kodarma Kodarma 333 5,132
8. Alchaja.mu Bishungarh 229 5.~99
9. Pihra Oawan 371 5.~58
Towns
According to the definition adopted at the 1961 Census, a 'town' includes-
(i) every municipality or notified area ; (ii) all civil lines not included within
municipa1limits; (iii) every cantonment; and (iv) such other places which have (a) a
population of not less than 5,000, (b) density not less than 1,000 persons per sq. mile, (c) at least three-fourths of the adult male population engaged in non-agricultural livelihood and (d) which have been declared to be town for
census purposes by the Superintendent of Census Operations.
Towns are usually divided into six size classes according to their population. The district of Hazaribagh has ten towns in all. These are distributed into the six size classes as under: Towns in Haz.arlbagh dIStrict cJassliled by their population
sllIe eJass.1961
Cla.ss Population range
1 2
I 100.000 or more
II 50.000-99.999
Towns
3
III 20.000-49,999 (1) Hazaribagh . (2) Giridih \'b) ~ailm.'n. Y>_ (4) Jhumri TiIaiya
Population
4.
(5) Ramgarh Cantonment IV 10.000-19.999 (6) Bermo
40,958 36.881 'b),mio 21,777 20.041 13,813 12,507 (7) Chatra
V 0.000-9.999 (8) Kargali
VI Below 5,000
(9) Barki Sa.ra.iya (10) Boka.ro
9.384 8,812 5.406 , ..
Jaridih Bazar and Barki Saraiya have been treated as towns for the first time in 1961. Hazaribagh, Giridih and Chatra are municipal towns, while Jhumri Tilaiya has a Notified Area Committee. Ramgarh town has a cantonment while Bermo, Kargali and Bokaro towns have no statutory local bodies. Because of their proximity and interdependence in socioeconomic matters, Kargali, Bokaro, Bermo and Jaridih Bazar towns have been treated as one town group with a combined population of 60,208. The conoept of town group is one of the innovations of the 1961 Census. For a further elucidation of this concept, reference may be made to the ohapter on Urban Populations in the General Report (Part I-A) on the Census of 1961.
7. POPULATION
General
The district of Hazaribagh contained 2,396,411 persons at the sunrise on the 1st March, 19tH. Its population is somewhat lower than the average for a district (2,732,683 persons) in the State. Comprising 5.16 per cent of the State's population, Hazaribagh ranks eleventh among the districts of Bihar in order of population. The districts having smaller populations
than Hazaribagh are Dhanbad, Palamau Bhagalpur, Saharsa, Singhbhup! and Ranchi: In 1951 also, Hazaribagh occupied the same position. Among 328 districts in India, Hazaribagh comes 37th in order of population. Compared to some countries of the world, the district of Hazaribagh has higher popUlation than that of Israel (2.2 millions, 1961), slightly lower than that of New Zealand (2.4 millions, ]961), more than one-third of Ghana (6.7

millions, 1960), and one-fourth of N"epal (9.4 millions, 1961).
Population figures for each anchal and town in Hazaribagh district are given in Table A.I a t page 7 of this book. The diagram below compares the proportions of area and population in different districts in Bihar:
PERCENTAGE OF POPULATION AND AkEA OF DISTRICTS
Distribution of population
Among the three subdivisions of Hazaribagh, Sadar is the most populous. Comprising 50.79 per cent of the district population, it ranks loth among the subdivisions of the State. The oth()r two subdivisions, Giridih and Chatra, contain 35.81 and 13.40 per cent respectively of the district population.
Variations in the distribution of population the anchals are wider still. Giridih which contains Giridih Town, has the population (124.194) and Satgawan
the lowest (25,562) in the Qistrict. is the only anchal in Hazaribagh
with a population of over one lakb.
among anchal, highest anchal Giridih district
The average population of an anchal in the district is 57.057.16 out of 42, or 38 per cen.t of the total, have higher population than the
average indicated above. They contain as much as 51.30 per cent of the district population.
Density of Population
The average density of population in Hazaribagh district is 343 persons per sq. mile which is less than half the State average of 694 persons per sq. mile. Thus Hazaribagh is very sparsely populated particularly on its western side corresponding to the Chatra subdivision (average density 208 persons per sq. mile only). Extensive areas of the district are covered with hills, jungles and infertile gravelly uplands. This district has the largest area (nearly 22 lakh acres) constituting about half of its total land area under forests. Towards the north-east, the density rises to above 400 in several anchals such as Kodarma. Jain agar, Bagodar, Nawadih. Dumri, Dhanwar. Jamua and Giridih. In Giridih anchal itself, the density is 773 mainly due to the coal-fields and mica mines for which the area is well known. The Bermo anchal. which includes the townships of Kargali, Bokaro, Bermo and Jaridih Bazar, has a density of more than 1,200. It may, however, be noted that nearly 70 per cent of the population of Bermo anchal is urban.
Growth of Population
The following table delineats the growth of population in Hazaribagh district since 1872. Percentage variations in the State population have also been indicated alongside for comparison:
Growth of population In Hazarlbagh district and Bihar state, 1872,-1961
Per cent variation r---___ .A-___ --..
Hazaribagh Bihar Year Population Variation district State
1 2 3 4 5
1872 771,875 1881 1,104,742 +332,867 +43.12 +15.56*
1891 1,164,321 +59,579 +5.39 +5.94· 1901 1,177,961 +13,640 +1.17 +0.22*
1911 1,288,609 +110,648 +9.89 +3.67
1921 1,276,946 _ll,663 -0.91 -0.66
1931 1,517,357 +240,411 +18.83 +1l.45
1941 1,751.339 +233,982 +15.42 +12.20
1951 1,937,210 +185,871 +10.61 +10.27
1961 2.396,411 +459,201 +23.70 +19.77
*Una.djusted for changes in territory after 1951.

xi
The dia,gram below depicts the growth of total, rural and urban population of the dietrict since 1901 :
POPULATION. 1901-1961 DISTRICT HAZARIBAGH
24 ----t----1 ---- TOTAL --- RURAL ~UR9AN
J:
• 22
.. .. 2
!
z 18 -
0
..
.. 16
.J
:> .. 0 ..
IO'~ __ ~~ __ _J ____ ~~ __ -L ____ _L __ ~~
1901 1911 1921 1931 1941 1951 1961
In the nine decades since 1872, the population of Hazaribagh has more than trebled. The above statement shows that the hig:hest rate of increase (43.12 per cent) was registered in 1881. Much of this increase was unreal because the enumeration in 1872 was very deficient. The balk of the increase has taken place only after 1921. The following excerpts from the Census Report of 1951 give a succinct account of the trends and factors operating behind the growth of population during the entIre period 1872-1951
"The 1872 census was very deficient in this district. Between 1881-90, the population increased by 5.4 per cent. The increase was mainly in the GiridIh subdivision whIle with the exception of Hunterganj, the population decreased in all thanas in the north-west of the
district. Between 1891 and 1900, the district suffered from failure of crops due to deficient rainfall in 1895, 1896 and 1897; in 1897 there was heavy mortality due to fever, cholera and the indirect effeots of famine. On the whole, public health was good in other years. The 1901 census revealed an increase of l.2 per cent only. It is certain however that if the balance of migration had not boon heavily against the district, the increase would have been much greater than this. The next census (1911) registered an increase of 110,648 or 9.4 per cent and the increase was shared by every thana in the district except Chatra and Simaria which suffered from an acute 'f;'ifdTh):'C;Y ):11 1%'0. 'B-a"llB.:&.gatJTl aTln a part of Hazaribagh thana also suffered from scarcity in 1908. On the whole, however, bothpublic health and economic conditions were satisfaotory in this period. In the next decade (1911-20), there was heavy mortality from cholera and fever in 1911 ; the next five years were generally healthy, but there were cholera epidemios every year from 1916 to 1919, and the influenza epidemic of 1918-19 wrought great havoc, Hazaribagh being one of the districts which suffered most from this epidemic. In 1918, there was acute scarcity in addition to epidemics. There is little cause for surprise therefore that in spite of decrease in the adverse balance of migration, the 1921 census recorded a fall of 0.9 per cent. There was fall in every thana except four: Kodarma, where there was an influx of immigrants due to the development of the Mica industry; Hunterganj which did not suffer from the influenza epidemic to the same extent as other thanas; Dumri and Dhanwar where new coal mines had been recently opened.
ln the following decade (1921-30), the population of· Hazaribagh district increased by no less than 240,411 or 18.8 per cent. Except for epidemics of cholera in 1921 and 1929, and some increase in small-pox duiring 1926 and 1927, public health was satisfactory throughout this period. The mean

H XU
decennial rate of natural increase was 15.2 per cent. The ratio of females to males was lower in 1981 than in 1921 which would seeIn to indicate that there was a falling off in emigration. This conclusion is supported also by other evidence and part of the increase in population during this decade would seem to be due to improvement in the balance of migration.
In the next decade 1981-40, the people of Hazaribagh district enjoyed a remarkable immunity from every kind of epidemic diseases. Cholera appeared in epidemic form in 1935 but did not cause a large number of deaths; plague had disappeared completely; and there was substantial {all in the death rate from fever and small-pox. Except in 1935, when the rice crop suffered due to insufficient rainfall the outturn of crops was satisfactory in all the years of this decade. The population increased by 283,982 or 15.4 per cent. The mean deoonnial growth rate comes to 14.3 per cent but the decennial rate of natural increase based on registered birth and death figures, was 9.5 only. There appears to have been some deterioration in the functioning of the registration system in this district during this period, and the actual rate of natural increase or survival 'must have been much higher than this, but a part of the increase in population should be attributed to improvement in the balance of mIgration and the introduction of an extended period of enumeration based on normal residence in place of the old one-night system of census enumeration.
In the last decade, 1941-50, cholera appeared in epidemic form in 1943, and was present also in other years, but the cholera death rate remained nearly the same as during 1931-40. The death rate from fever and small-pox appears to have declined furthet. The outturn of crops was on the whole satisfactory in most years, but as in many other districts, the winter paddy crops as also Bahi suffered serious damage in 1950-51 particularly in paIts of Chatra subdivision where crops
were deficient also in earlier years. The census of 1951 disclosed an increase of 185,871 or 10.6 per cent over the 1941 census total. The decennial growth rate calculated on the mean population of the decade comes to 10.1 per cent. The registered birth and death figures however yield a survival rate (natural increase rate) of only 6.1 per cent which is certainly an under-estimate. The difference between the growth rate calculated from census figures and natural increase rate based on vital statistics would seem to be due largely to deficiency in registration of births and deaths."
The rate of growth of population in Hazaribagh district in the last decade (1951-61) was higher than in any other decade except 1872-81. The rate of growth at 23.70 per cent in 1951-61 is higher than eVen the State average of 19.77 per cent and in fact, only three districts, viz., Purnea (37.02 per cent), Saharsa (31.75 per cent) and Dhanbad (27.91 per cent) have registered higher rate of increase than the district of Hazaribagh during the last decade.
The main reason behind the big spurt in the rate of growth of population all Over the country during the last decade is believed to be a significant fall in the death rates. Improved public health conditions" better arrangements for medical treatment, and utilisation of m.odern techniques in surgery and wonder drugs have gone a long way toward{3 lOWering of the death rates in general and infant mortality rates in particular. Without any corresponding lowering of birth rates, therefore. a high rate of increase of population is only natural. Unfortunately, because of the well -acknowledged deficiency in the registration of vital statistics of births and deaths, there is not muoh scope for testing the COrrectness of above postulates with reference to the registered figures of births and deaths.
Another factor having an important bearing on growth of population in Hazaribagh district is migration, which is dependent upon general economic conditions prevailing in the district and outside. It is generally found that there is outward movement of population in search of employment from economically backward areas. The trend is reversed when there is affiuenoe at home. UnfoItunately, a complete

xiii
pioture of migration trends at the distriot level is not available, for data relating to interState emigration by the district of origin are not available for any oensus except 1921. However, some indication of the general trend oan be had from the figures relating to interdistrict migration within the State. In 1951, the number of emigrants from Hazaribagh to other districts of the State exceeded the number of immigrants to Hazaribagh from other districts of the State by 4,660. In 1961, however, the number of such immigrants outnumbered the emigrants by 19,001. This may be one of the reasons for relatively higher rate of population growth in Hazaribagh during the last decade.
Areas of comparatively slow rate of growth of population in the last decade oan be easily pinpointed in the table below showing relevant figures for the distriot, subdivisions and anchals:
Per cent variations In the population of subdivisions and anchals of the Hazarlbagh district, 1951-61
Per cent variations In the popuJaClon of subdivisions and aD.cbals 01 the Haliaribf,gb dlstrlet 19&1-61-ooncZd.
DistrictJ Subdivision/
Anchal
1
Kasmar
Jaridih
Kodarma
Markacho
Patratu
Population Percentage decado
Variation variation ---.----. 1951 1961
2
28,478
43,379
68,870
36,139
45,365
345
33,818 +5,340 + 18.75
53,307 +9.928 +22.89
90,814 +21.944 +31.86
41.736 +5.597 + 15.49
59.488 + 14.123 +31.13
Chatra Subdivision 262,5a 821,065 +58,551 +22.80
Chauparan
Itkhori
Hunterganj
Pratap Pur •.
Chatra
Simaria
54,296
48.737
42,672
32,233
~6.339
38,237
64.375 + 10,079 + 18.56
61,423 + 12.686 +26.03
51,520 + 8.848 + 20.73
40.053 +7,820 +24.26
57,001 + 10,662 +23.01
46,693 +8,456 +22.11
Districtl Subdivisionl
Anchal
Population ,..-__ J.. __ -. Pd::Jeage Glrldlh Subdivision 700,202 858,231 +158,037 +22.57
+21.13 191n 1961 Variation variation Gawan 34,388 41,653 +7,265
1
HAZARIBAGH
2 5
1,937,210 2,396,411 +459,201 +23.70
Sadar Subdivision 974,494 1,217,107 +242.613 +24.90
Barhi 40,851 53,078 + 12,227 +29.93
BarkatHa
Bagodar
Bishungarh •.
Haza.riba.gh
Kat kamsandi
Ichak
Barkagaon
Keredari
Tandwa
Mandu
Nagri (Churchu)
Ramgarh
J ainagar
Gola
Gumia
PeteJ;bar
35,880
72,141
44,707
68,873
40,169
38,357
34,285
28,890
26,876
40,823
26,192
66,737
45,276
49.608
54.385
;38,213
46,620 +10.740 +29.93
88.213 + 16,072 +22.28
54,668 +9.961 +22.28
85,621 +16,748 +24.32
51,171 + 11.002 +27.39
47,108 +8,751 +22.81
40,569 + 6,284 + 18.33
34,185 + 5,295 + 18.33
31.802 + 4,926 + 18.33
60,374
38,737
88,180
44,290
+ 19,551
+12,545
+21,443
-986
57,219 +7,611
70.730 + 16,345
45,379 +7,166
+47.89
+47.90
+32.13
-2.18
+15.34
+30.05
+ 18.7t)
Tisri
Satgawan
Jamua
Deori
Dhanwar
Birni
Giridih
Bengabad
Gande
Dumri
Nawadih
Pirtanr
Bermo
29.574
21,408
69,432
48,217
62.522
35,822 +6,248 +21.13
25,562 +4,154 +19.40
82,629 + 13.197 +19.01
56,562 +8.345 +17.31
75,297 +12,775 +20.43
42,595 48,925 +6,330 + 14.86
103,280 124,1~4 +20,914 +20.25
41.231 48,921 +7,690 + 18.65
44,217
55,240
49,233
32,576
66,289
56,684 + 12,467 +28.20
'11.621 + 16.381 +29.65
62,369 + 13,136 +26.68
41,307 +8,731 +26.80
86.693 +20.404 +30.78
1951 populatlOIl8of anchals have been taken from the E.Summary Tables of 1951 Census. Where a police station of 1951 hls been split into two or more &nchals, the 1951 population of the police station has been distributed among the anchals in the same proportion as in 1961.
The map at page XIV shows the percentage variations of popUlation in different anchals of tbe district during 1951-61.

'0 .. e. •
'0
•• •
'0 .. e., •

xv
Among the subdivisions, Hazaribagh Sadar registered the highest rate of growth of 24.90 per cent. Giridih and Chatra (22.57 per cent and 22.30 per oont respectively) had lower growth rate than the district average of 23.70 per cent.
20 and 25 per cent, and 12 others varying between 15 and 20 per cent. Birni (14.86 per cent) is the solitary anchal which has registered growth rate below 15 per cent. Curiously enough, the J ainagar anchal has actually suffered a deoline of 2.18 per cent.
Among the anchals, Nagri (Churchu) has The Rural Population shown the highest increase (47.90 per cent) followed very closely by Mandu (47.89 per cent). 91.60 per cent of the population ofHazariRamgarh (32.13 per cent), Kodarma (31.86 bagh district is ruraL The corresponding per cent), Patratu (31.13 per cent), Bermo proportion for the State is almost the same (30.78 per cent) and Gumia (30.05 per cent), (91.57 per cent). The statement below COID
have also shown more than 30 per cent increase pares the per cent decade variations of rural in population. Of the remaining 35 anchals, . and total populations and proportions of rural 8 anchals have registered growth rates varying population to total populatioll in Hazaribagh between 25 and 30 per cent, 13 varying between district and Bihar State during 1901-61:
Per cent varia.tlons In a.nd proportions of rural population In Ha.zariba.gh district and Bihar State, 1901-61 Hazaribagh district Bihar State
~----------~----------~ ~ Per cent decade variation Per cent of Per cent decade variation Per cent of
Census
1
1901
,-----.... Rural
population
2
1911 +9.59 1921 -1.51 1931 +18.96 1941 +13.75 1951 +8.15 1961 +2l.68
It is significant that the growth of rural population in Hazaribagh district after 1931 has always been tardier than that of total population. It follows, therefore, that the growth of urban population in the district has been faster than its rura] counterpart. It is also noteworthy that the proportion of rural population has been declining at each census since 1931. A comparison with the corresponding proportions for the State will reveal that the extent of urbanisation in the district of Hazaribagh has almost been on par with that of the State as a whole.
3 5
...... rural Total population
population to total
6
+3.67 -0.66 + 11.45 +12.20 + 10.27 + 19.77
population 7
96.01 96.22 95.86 95.46 94.62 93.31 91.57
Hazaribagh has an urban population of 201,184 comprising 8.40 per cent of the district population. The corresponding proportion for the State is almost the same (8.43 per ceht) and for the country more than twice as much (17.97 per cent). The statement below shows the proportions and rates of growth of urban population in Hazaribagh district and Bihar State during the period, 1901-61:
Trend ot urban growth In Hazarlbagh dlstriot and Bihar State, 1901-61 Ha7aribagh district Bihar State
1901 1911 1921 1931 1941 1951 1961
Census
1
~,--------~----------~ ,...,----- -T--.-----.....
Number of towns
2 3 3 3 3 6 8
10
Per cent variation in
urban population
3
+2.98 +19.68 +15.17 +63.08 +60.02 +51.12
Per cent of urban to Number of
total towns population
4 5 3.04 2.86 3.46 3.35 4.75 6.87 8.40
55 57 63 66 82
103 153
Per cent Per cent variation in of urban to
urban total population population
6 7
-1.92 +9.03
+22.00 +32.99 +37.07 +50.94
3.99 3.78 4.14 4.54 5.38 6.69 8.43
'NQ'rJil: Only those towns of pre'VlouB censuses ha.ve been considered which were towns in 1961 also.

xvi
It is evident that the urban population of Hazaribagh district has always been on increase. The rates of growth have, however, been more significant after 1931. It is noteworthy that the rate of urban growth in Hazaribagh has
alwaJ's been higher than that of the State in each decade except 1921-31.
The statement below traces the growth of populati9I}. of individual towns of Hazaribagh district since, 1901 :
Growth of population of Individual towns In Hazarlbagh district, 1901-61
Name of Towns ,... Population ....
1961 1951 1941 1931 1921 1911 1901
1 2 3 4 5 6 7 8
Hazaribagh (M) .• 40.958 33.812 24.918 20,977 17,060 17,009 15,799 (+21.13) ( +35.69) (+18.79) (+22.96) (+0.30) (+7.66)
Giridih (M) 36.881 29,167 25,326 21,122 18,874 10,668 9,433 (+26.45) (+15.17) (+19.90) (+11.91) ( + 76.!l'2) (+13.09)
J aridih Bazar 31,605
Jhumri TilaiYa (N) 21.777 9,090 (+139.57)
Ramgarh (Cantt.) - 20,041 14,775 (+35.64)
Bermo 13,813 8,920 5.674 (+54.85) (+57.21)
Chatra (M) 12,507 9,9Il 9,638 8,758 8,225 9,222 10,599 (+26.19) (+2.83) (+10.05) (+6.48) (-10.81) (-12.99)
Kargali 9,384 17.644 10,127 (-46.81) ( +74.23)
Barki Saraiya Town 8,812
Bokaro 5,406 9,807 7,509 (-44.88) (+30.60)
NOTE : Figures within brackets below the· absolute figures, in dicate per cent increase( +) or decrease (-) during the deCade.
( MI-Municipality (N)-Notified Area ( Oantt.)-Cantonment
The distriot has an urban population of _ 201,184 persons living in 10 towns. Hazaribagh,
Giridih and Chatra are old towns continuing from 1901 or earlier. Three mining towns, viz., Bermo, Kargali and Bokaro, were added in 1941; two more, viz., Jhumri Tilaiya and Ramgarh, in 1951 ; and one more, viz., :Sarki Saraiya in 1961.
Hazaribagh town had 15,799 persons in 1901. The population inoreased only slightly in the next decade and stagnated 'flIhereafter till 1921. There was an increase of 22.9 per cent in 1921-31. This rate was more or less maintained in the following censuses, the only exception being the decade ended in 1951 in which the variation was as muoh as 35.69 per cent. Hazaribagh is nearly 40 miles away from the nearest railway station, and owes its growth
mainly to the pleasant climate and several educational and penal institutions in it. There are residential schools and colleges for boys as well as girls, run chiefly by the missionaries. The Polioe Training College. the Central Jail and the Reformatory are some of its important institutions. The exceptional growth in 1941-51 refleats to some extent the establishment of a number of Government offices and the location of headquarters of the Damodar Valley Corporation. In the last decade the rate of growth has been fair but much behind that of other mining and industrial towns.
Giridih- -had only 9,433 persons in 1901. Unlike Haz&;ribagh, tpe growth of Giridih was very high up to 1921 in whioh year its 1901 population was doubled, and stood higher than that of Hazaribagh. This position continued

xvii
tillI94;I. The growth and prosperity of Giridih were linked with that of the coal and mica. industries. The last decade saw an increase of 26.45 per cent which is only slightly higher than the urban aV'erage of the district.
\
In contrast to Hazaribagh and Giridih, Chatra has hardly grown at all. Its population has risen from 10,599 in 1901 to 12,507 in 1961 or by a mere 18 per cent. The loss of population up to 1921 could not be made up even by 1951, but the last deoade saw an increase of 26.19 per cent. The commercial importance of the town is hardly expected to be regained and it is likely to remain primarily an administrative centre.
The three towns added in 1941 (Bermo, Kargali and Bokaro) constitute one complex, which was joined by Jaridih Bazar in 1961. There has been some confusion regarding the jurisdiction of these towns, and hence the rate of growth may best be considered in terms of the Barmo town group. The population rose from 23,310 in 1941 to 36,371 in 1951 or by 56.03 per cent. The increase of 65.54 per cent in 1951-61 is mainly due to addition of 31,605
persons with the inclusion of Jaridih Bazar. The town group is a very important coal mining centre. It also contains a large Thermal Power Station at Bokaro.
Ramgarh is essentially a cantonment town but because of its situation in the midst of newly started mines and heavy industries, it is fast developing into an important trading and industrial centre. The growth of 35.64 per cent in 1951-61 may well be the forerunner of higher rates in future.
Jhumri Tilaiy.a, has more than doubled its population in the first ten years of its existenoe as a town. It is a very important centre for mica trade and serves the rich mines of Domchanch. It is well connected by road as well as rail. The railway station, which lies in Jhumri Tilaiya, is however known as Kodarma by the name of a place actually 4 miles away.
The only addition to the urban list in 1961 is Barki Saraiya. It is a rail head (Hazaribagh Road Railway Station) and a favourite health resort. It is still a small town with a population of 8,812 only.
8. MIGRATION In Indian census, migration is determined
solely by the Qoncept of place of birth. Thus, a person born at a place other than the village or town of enumeration is treated as an immigrant. Immigrants can be suitably classified according to their place of birth as intra-district immigrants (those born elsewhere in the district of enumeration), inter-district but intra-State immigrants (those born in other districts of the State), inter-State immigrants (those born in States in India beyond the State of enumera-
tion), and international immigrants (those born outside India). Emigrants from the district are those who were born in the district but were enumerated outside it within a district of the State or in another State. . Information is not available for the very few persons borD in the district who may have emigrated outside the country.
The distribution of population en umerated in Hazaribagh district in 1961, by place of birth is given in the fol1owh~g statement
Distribution of population In Ral"rlbagh district by place of birth, 1981
Total Rural Urban Birth place r-- ..... ..... - .... ~
PerSOns Males females PerSOns Males Females PerSOns Males Females -1 2 3 4 5 6 7 8 9 10
'lObi populatioD •• 2,898,401t t,208,&08 t,t92,90I 2,t85,H'I t,09I,878 t,t02.5409 20t.t840 110,825 90.8-159 (tOO.OO) (100.00) (tOO.OO) (100.00) (100.00) (100.00) (100.00) (100.00) (tOO.OO)
Born-At the place of 1,629,380 1,035,023 594,357 1,522,811 974,019 548,792 106,569 61,004 45,565 enumeration. (67.'99) (86.00) (49.83) (69.37) (89.14) (49.7S) (52.9Ii) (55.04) (50.43)
Elsewhere in the district 585,721 82,439 503,282 553,776 68,933 484,843 31,945 13,506 18,439 of enumeration. (24.44) (6.85) (42.19) (25.23) (6.31) (43.97~ (15.88) (12.19) (20.40)
In c»her distriots of Bihar 120,117 51,240 68,877 89,681 33,489 56,192 30,436 17.751 12,685 (5.01) (4.26) (5.77) (4.08) (3.07) (5.10) (15.13) (16.02) (14.04)
In other States of India· 55,006 30.794 24,212 26,~02 14,568 11,934 28,504 16,226 HI,278 (2.30) (2.56) (2.03) (1. 1) (1.33) (1.08) (14.17) (14.64) (13.59)
Outside India 6,187 4,007 2,180 2,457 1,669 788 3,730 2,338 1,39.2 (O.26) (0.S3) (0.18) (0.11) (0.13) (0.07) (1.85) (2.11) (1.54)
• Inoludes birth plaoe ''O'no1assit1a.ble'. NO!rlll: Figures within brackets in4ioate peroentages.

xviii
It is evident that the main bulk (67.99 per cent) of the population in Hazaribagh district was enumerated at the place of birth. The corresponding proportion for the State Was 69.31 per cent. Those born elsewhere in the district of enumeration comprised 24.44 per cent or a little less than one-fourth of the population. Immigrants to Hazaribagh from other districts of Bihar comprised 5.01 per cent of the district population. Those coming from other States of India accounted for 2.30 per cent, while immigrants from outside India comprised 0.26 per cent only of the district population.
The picture of immigration varies rather significantly between the two sexes. The bulk of migration among females is occasioned by the movement consequent upon their getting
married, which is generally contracted outside the place of their birth. Thus, while 86.00 per cent of males in Hazaribagh were enumerated at the ·place of their birth, the corresponding proportion among females was 49.83 per cent and a considerable portion of them no doubt comprised of unmarried girls. Marriage migration among females is, however, largely confined to places within the district. Thus, as against 92.85 per cent males born and enumerated in the district of Hazaribagh, the proportion of females is as high as 92.02 per oent.
It may be of interest to ascertain the extent of immigration to, and emigration from, Hazaribagh in relation to other districts of Bihar. The statement below gives ~he distribution per 1,000 of eaoh separately for males and females;
Distribution of IIligrants to, and from, Hazaribagh in relation to other distrIcts of the state, 11161
Immigrants to..Hazaribagh from- Emigrants from Hazaribagh to-r-~----------'---------..... ,- .....
Totcl
Patna
Gaya
Shahabad
Saran
Districts
Champaran
Muzaffarpur
Darbhanga
Monghyr
Bhagalpur
Saharsa
Purnea
Santal Parganas
Palamau
Ranchi
Dhanbad
Singhbhum
Males
1,000
77
248
82
61
8
26
24
77
19
4
4
42
68
144
82
34
FeI)lales Districts
1,000 Total
37 Patna
215 Gaya
24 Shahabad
17 Saran
;J Champaran
8 Muzaffarpur
6 Darbhanga.
116 Monghyr
10 Bhagalpur
2 Saharaa
3 Purnea
137 Santal Parganas
73 Palamau
120 Ranchi
201 Dhanbad
28 Singhbhum
Males
1,000
15
115
5
1
1
2
3
14
3
1
4
20
41
77
654
44
Females
1,000
23
128
6
2
1
2
2
99
7
1
1
124
73
139
369
23
Hazaribagh has common borders with the districts of Gaya, Monghyr, Santa} Parganas, l?alamau, Ranchi and Dhanbad. Thus, these
districts account for 86.2 per cent of females and 66.1 per' cent of males.among inter-district immigrants to Hazaribagh. No other district

xix
oontributes even 10 per oent of suoh immigrants. So far as emigration from Hazaribagh to other distriots of the State is oonoerned, Dhanbad (65.4 per oent) and Gaya (11.5 per oent), the two adjacent distriots aooount for more than three-fourths of the total among males. Males emigrate generally in searoh of employment. Thus, Dhanbad, whioh provides better avenues of employment, has absorbed nearly two-thirds of the total male emigrants from Hazaribagh to other distriots of Bihar. As stated eaTlier, female emigration is influenoed largely by marriages. It follows that the bulk of it should be confined to adjoining distriots. Thus, the six adjaoent districts of Gaya, Monghyr, Santal Parganas, Palamau, Ranchi and Dhanbad each drawing over 7 per oent of the emigrant females from Hazaribagh to other distriots aooount for 93.2 per cent of them. No other distriot except Patna and Singhbhum (each drawing 2.3 per cent) absorbs even 1 per cent of such emigrant females.
So far as immigrants from other States of India are oonoerned, males (30,794) predominate. Among the States West :Bengal, which is contiguous to Hazaribagh has sent the largest number of immigrants (M-7,312, E-9,277) followed by Madhya Pradesh (M-5,828, F-6,185), Uttar Pradesh (M-7,556, F-2,126), Punjab (M-3,061__, F-I,816), Rajasthan (M-1,429, F-I,178), Orissa (M-973, F-685), Madras (M-995, F-503), Maharashtra (M-746, F-323), Gujarat (M-489, F-358), Kerala (M-570, F-178), Andhra Pradesh (M-331, F-141), Assam (M-152, F-109) and Mysore lM-156, F-93). Figures relating to immigrants from other States are very small. Similar information in respeot of emigrants from Hazaribagh to other States of India are not available for any census after 1921. In that year, as many as 87,806 persons had emigrated from Hazaribagh to other States of India as against 9,958 immigrants from other States to this distriot.
I
9. AGE, SEX AND MARITAL STATUS
Age
Single year age returns have been presented' in Table C-IV of 1961*. This table has not been reproduced in the present volume for want of space. Among the census tables published in this volume, however, is table C-II which classifies the popUlation of either sex in quinquennial age groups and also by marital status. :Broad age groups are also shown in Tables B-! and C-III, inoluded in this volume.
Heapings into quinquen.ial age groups result in better appreoiation of data relating
to age struoture as inconsistenoies apparent in single year age returns are largely eliminated in the heaped age-groups. While the five year' age groups have their own importanoe, particularly in regard to evaluation of seX ratios for the purpose of assessing economic charaoteristics, four broad age groups indioative of children (0-14), young persons (15-34), middle aged peFsons (35-59) and elderly persons (60+) are more revf:>aling.
The following statement shows the distribution of population by sex and four broad age groups in Hazaribagh district and Bihar State :
Distribution of 1,000 persons, males and females in Hazaribagh dlstrietand Bihar state br broad age groups, 1961
Hazaribagh district Bihar State Age-groups ...
""" PerSOnS Males Females Persons Males Females 1 2 3 4 5 6 7
All ages 2,396,411 1,208,503 1,192,908 46,455,610 28,801.449 28,154,181 (1.000) (1,000) (1.000) (1,000) (1.000) (1,000)
0-14 1,042,433 530,615 511,818 19,653,328 10,112,846 9,540,482 (435) (441) (429) (423) (434) (412)
15-34 770,398 379,595 390,803 14.335,615 6,976,349 7,359,266 (322) r(315) (328) (309) "(299) (318)
35-59 481,102 246,367 235,335 9,845,764 5.006,949 4,838,815 (201) (205) (197) (212) (215) (209)
60+ 101,521 46,725 54,796 2,608,218 1.197,596 1,410,622 (42) (39) (46) (56) (52) (61)
Age not sta.ted 357 201 156 12,685 7.709 4,976 (N) (N) (N) (N) (N) (N)
.CenBus of India, 1961, Bihar,·Vol. IV, PartII·C.,Socialand Cultural Tables. (N)-denotes negligible figures,
NOTE: Figures within brackets give the dilltribution per 1,000 persons, males ~nd females,
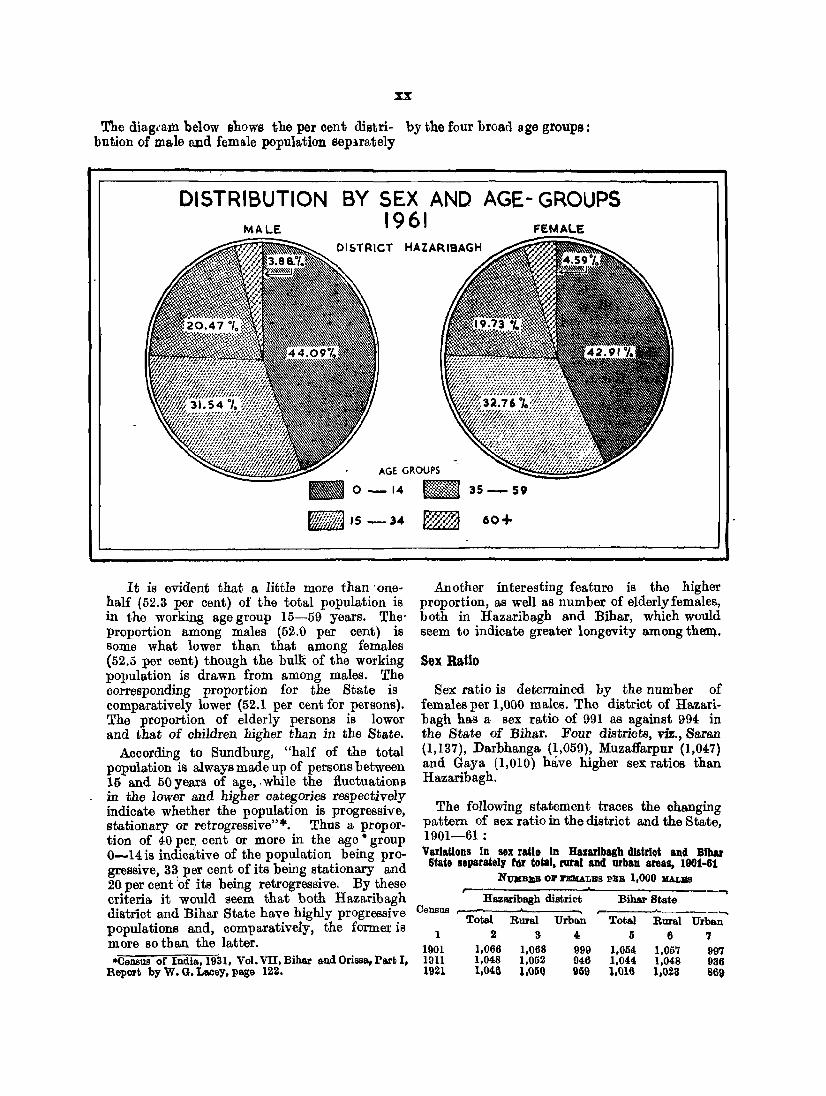
xx
The diagt'aJn below shows the per cent distri- by the four broad age groups: bution of male and female popula.tion sepa.rately
DISTRIBUTION BY SEX AND AGE-GROUPS 1961
-. AGE GROUPS
_ 0-14 _ 35-59
.,5-34 ~ 60+
It is evident that a little more than 'onehalf (52.3 per cent) of the total population is in the working age group 15-59 years. The' proportion among males (52.0 per cent) is some what lower than that among females (52.5 per cent) though the bulK of the working population is drawn from among males. The corresponding proportion for the State is comparatively lower (52.1 per cent for persons). The proportion of elderly persons is lower and that of children higher than in the State.
According to Sundburg, "half of the total popUlation is aJways made up of persons between 15 and 50 years of age" while the fluctuation!> in the lower and higher categories respectively indicate whether the population is progressive, stationary or retrogressive"*. Thus a proportion of 40 per, cent or more in the age· group 0-14 is indicative of the population being progressive, 33 per cent of its being stationary and 20 per cent (of its being retrogressive. By these criteria it would seem that both Hazaribagh district and Bihar State have highly progressive populations and, comparatively, the former is more so than the latter. *Census of India., 1931, Vol. VII, Bihe.r a.nd Orissa., Part I,
Report by W. G. Lacey, page 122.
Another interesting feature is the higher proportion, as well as number of elderly females, both in Hazaribagh and Bihar, which would seem to indicate greater longevity among theJll.
Sex Ratio
Sex ratio is determined by the number of females per 1,000 males. The district of Hazaribagh has a sex ratio of 991 as against 994 in the State of Bihar. Four districts, viz., Saran (1,137), Darbhanga (~,059), Muzaffarpur (1,047) and Gaya (1,010) have higher sex ratios than Hazaribagh.
The following statement traces the changing pattern of sex ratio in the district and the State, 1901-61 : Variations in sex ratio in Hazarlbagh distrlClt and Bihar State separately fOr total. ruraI and urban areas. 1901-81
NV.BlaB OJ!' lI'Ell'ALBS PlI:;& 1,000 JU.LIIS ,... .... Hazaribagh district Biha.r8tate
Census __ - -. ,... ...... Total Rural Urban Total Rural Urban
1 2 3 4: 5 6 '1 1901 1,066 1,068 999 1,054 1,057 997 1911 1,048 1,052 946 1,044 1,048 936 11121 1,046 1,Q5Q 959 1,016 1,023 869

• j
~X:l
Variations tn sex rado In Hazarillagb dlstrlci and Blbar Staia separate I, lor total, rural and urban areas, 1901-S1-eoncld.
NUMBER OF FIIIMALES PER 1,000 lII:ALlllS r----
Hazaribagh district Census r----A..-----.
Bihar State
Total R~ Urban Total Rural Urban
1 2 3 4 5 6 7
1931 1,018 1,021 931 .994 1,003 813
1941 991 999 853 996 1,006 828
1951 974 988 S03 ·1}f)0 1,001 8n
1961 991 1,~09 815 994 1,012 811
The diagram below depicts the a.bove statistics for the district by means of a. graph separately for total, rural and urban populations:
us 0
0
0
.... a: 1&1 Q. 95 ., C&I
~ 90 It..
85
&0
0
0
0
0
' .... 1S
SEX RATIO, 190J-1961
DISTRICT HAZAR1BAGH
TOTAL ----.-- RURAL
~-_ .••... _.--- URBAN
~ . ~ [EOUALITV .~, ' ..
r'-, """i ~ )'./) '. -...
' ... ....... ;Y
..... ~ ) ..
" ....... , ... \ '. ,
\,
\ ......
" "
"
'\ ...... ~ .......
1901 1911 1921 1931 1941 1951 1961
The overall se, ratio remained favourable in Haza,ribagh till 1931; after which it became adverse and has continued so till 1961. During the entire period 1901-51, the trend was towards a falling sex ratio in district as well as the State. 1961 has, however, registered a slight improvement In the position.
It is natural that rural area,s, which send out bulk of'the emigrants, should invariably ha.ve higher sex ratios than urban areas. This is true as muc~ of Hazaribagh as of the State.
The urban sex ratio in the district has always been adverse. The urban areas. in fact suffer from a chronic shortage of females. This is a feature common to most of the towns in northern India. Evidently, the towns serve only a limited purpose, the popUlation being mainly agricultural with its moorings in villages. People take to towns only for purposes such as employment, education, trade, business, profession, etc. Most. of these avocations concern men only who come to, or live in towns as a sort of makeshift arrangement. They continue to keep contact with their Village homes where they leave behind their families and make frequent visits to look after cultivation, observe festivals and for various other' puq>oses. Of course, definite signs of change in this pattern of living are discernible now and more people are making towns their permanent abode. Even so, the old order takes long to change.
Sex ratios by broad age groups give a more illumihating picture of the factors at work. The following statement does so for HazJl.ribagh district and :Bihar State:
Sex ratio lIy broad age groups In Batarlbagh dlstrlct and Bihar State~ 1961
Number of females per 1,000 males
Age group ,...,---------'--___ . __ .....
Razaribagh district Bihar Sta.te
0-14 965 943
15-34 1,030 1,055
35-59 955 966
60+ 1,173 1,178
As in the State so in Haz;aribagh, sex ratio among children (age group 0-14) is adverse. Migration is not likely to have much influence in determining the sex ratio in this age group. It follows, therefore, that deficit of females among children is mainly the outcome ofbiolo~ gical and natural causes. In the age group l5-34 the sex ratio in the district is favourable.

xxii
At least a portion of the high sex ratio among young persons (15-34) is due to educational migration which affects mostly males. The sex ratio in the age group 35-59, however, is adverse. The trend in the age groups 15-34 and 35-59 is similar to that in the State. Higher longevity among females seems to explain the high sex ratio among elderly
persons (60+) both in the district and the State.
Marital status
Table C-II at page 69 furnishes relevant statistics on this topic. The statement below gives the distribution of 1,000 persons, males and fema.le~ by marital status:
Distribution of population In Hazaribagh dlstrielt and Bihar State by marital status, 1961
Hazaribagh district Bihar State Marital status r-- ----.A. c-----.A.
Persons Males Females Persons Males Females
2 3 4 5 6 7
Total 1,000 1,000 1,000 1,~OO 1,000 1,000
Never married .. 445 491 398 447 498 396
Married 480 470 489 476 459 492
Widowod 71 34 109 74 39 109
Divorced or separated 3 4 3 3 3 2
Unspecified status 1 1 1 N 1 1
N-denotes negligible figures. NOTE: All persons in the age group 0-9 have been treated as 'never married' irrespective of actual returns.
The diagram below gives for Hazaribagh the per cent distribution of never married, married and widowed persons separately for males and females. The figures for ,
divorced or separated persons and those of unspecifed status are too small for diagrammatic representation:
DISTRIBUTION
MALE
BY. MARITAL 1961
STATUS
o
39.82 %
DIVORCED OR SEPARATED
NEVER MARRIED

I .. XXlll
Like other districts of Bihar, Hazaribagh has relatively more 'never married' males than females and more married females than males. This is explained by the fact that girls get married at much younger age than boys. As against 49.1 per cent of males in Hazaribagh not married at all, the corresponding proportion among females is 39.8 per cent only. In the State, the proportions are 49.S and 39.6 per cent respjctively for males and females. The proportion of married males in Hazaribagh (47.0 per cent)
is higher than that of the State (45.9 per cent) while the proportion among females in the district (48.9 per cent) is lower than that in the State (49.2 per cent). The percentage of widows in the district (10.9) is the same as in the State.
A hetter appreciation of marital status can be had from an analysis of marital status, by broad age groups as in the following Statement:
Distribution of 1,000 persons of either sex: In broad age groups by marital status, In Hazaribagh, 1961
Males Females
Marital status r-------A------ ---, r---------A-------~ Q-H 15-34 35-59 iii} +.. i}-H 15-34 35-M} 60+
1 2 3 4 5 1) 7 8 9
Total 1,000 1,000 1,000 1,000 1,000 1,000 1,000 1,000
Never married •• 957 209 17 9 894 40 6 6
Married 41 765 894 715 104 915 682 224
Widowed 1 17 85 274 1 39 309 767
Divorced or aeparated 1 8 4 2 1 5 2 2
Unspecified status N 1 N 0 N 1 1 1
N-denotes negligible figures. O-denotes nil.
Notwithstanding the fact that all persons aged 0-9 were treated as 'never married; irrespective of their actual returns in this regard, as much as 4.1 per cent of males and 10.4 per cent of f(fmales in the age group 0-14 have been returned as married. The corresponding proportions for the State are 3.5 and 8.2 per cent respeotively. It follows, therefore, that inoidence of ohild marriages in Hazaribagh distriot is higher than that in the State. ,Compared to other distriots, Gaya (6.1 per cent), Darbhanga (5.9 per cent), Saharsa (5.3 per cent) and Palamau (4.9 per cent) have higher percentages of married males while Monghyr (1l.4 per oent), Saharsa (11.3 per cent), Darbhanga (11.2 per cent), :Bhagalpur (11.0 per cent) and Gaya (10.'1 per oent) have higher peroentages of married females in this age group.
The universality of marriage' particularly among females is established by the faot that only 0.6 per cent of the females in eaoh of the age groups 35-59 and 60+ belong to the category 'never married'. It is also signifioant to note that only 4.0 per cent of females in the age group 15-34 are 'never married'. The corresponding proportions among males are understandably higher, particularly in the age group 15-34.
In regard to widowed persons, it is only natural that with the restrictions prevalent among the Hindus on widow remarriage, the proportion of widows should be apprec1ably higher than that of widowers.
1'0. LITERACY AND EDUCATION
In the district of Hazaribagh, 346,807 persons comprising 14.47 per cent of its total
population are able to read and write or have attained higher educational level. The corres-

xxiv
ponding percentage for BiharStat~ is 18.40. The district has, therefore, lower literacy rate than the State as a whole.
Children up to 4 years of age are, by definition, treated as illiterate. 'rhe effective literacy rate is, therefore, measured by the proportion of literate and ~ducated persons to Parsone! aged [) or more. The following table shows the effective literacy rate per 10,000 of population in Hazaribagh district and Bihar State, separately for persons, males and females, and for total, rural and urban population:
Effective nt.racy rates for Hazaribagh district an' Bihar State, 1981
Number of'literates pet ~,OOO ~
Category oi Persons)Ma1esJ Hazaribagh 'Bihar State population Females district
1 2 3 4
Total P 1,729 2,175 M 2,896 3.519 F 540 817
Rural P 1,460 1,901t M 2,563 3,219 F 339 618
Urban P 4,716 5,021 M 6,075 6,363 F 2,984 3,310
In regard to total population, the effective literacy rate in Ha.zal'ibagh (17.29) is lower
than th~t in the State (21.75 per cent). Among the districts of the . State, it is almost at the bottom. The three diatlicts with lower rates be!ug Saharsa (16.69 per cent), Palamau (16.41 per cent) and Champaran (15.46 per cent). The literacy rate in urban areas of the district is three and a quarter times the rate in rural areas. The difference is particularly marked in case of females. While nearly one out of every three urban females in Hazaribagh is literate, ~he corresponding proportion among rural females is one out of every thirty. It is also noteworthy that almost 61 per cent of males in urba.n. areas are literate, the corresponding percentage in rural areas being a little less than 26 per cent. It is also' noteworthy that the e1iective literacy rates in both the rural and ur bw areas of Haz.aribagh are below the State rates.
A break up of the literate popUlation by, various educational levels shows the backwardness of the district in regard t9 educational progress. Among the literates, as much as 72.3 per cent can merely read and write; 20.6 per cent have crossed the primary or junior basic standard; and only 7.1 percent havepassed the matriculation or higher examination. The classification of literate and educated persons by broad educational levels, separately for total, rural and urban areas is given below:
OlalSlfleat!on ot Hhr,ate and edueatec! person, In Jlazarlbagh district II, broad edueatlonal level., 1981
Number of'literates Proportion per 1,000 of' total Proportion per 1,000 of all Total population literates.
Educatiollal Rural ,- ,- ___." •• lenl Urban
Fers()ns Males Femaleil Persons Males Females Persons Males Females
1 2 3 4. 5 6 7 8 9 10 11
Literate (with. T 250,665 209,198 41,467 125 207 42 723 714 773 out eduoational B 203,462 177,372 26,090 111 194 28 765 755 887 level) ¥ 47,203 31,826 15,377 215 331 204 584 545 684
Primary 011' 1unior T 71,618 61,288 10,330 36 61 10 206 209 192 bs.sic R 49,884 45,362 4,522 27 50 5 188 193 145
U 21,734 15,926 5,808 127 166 77 269 273 258
Matrioulation T 24,524 22,663 ' 1,861 12 22 2 71 77 35 and above R 12,635 12,07.2 563 7 13 1 . " 52 18
U 11,889 10;691 1,298 ~9 110 17 147 182 58
• NOTJII: Total population exoludes population in the age group 0--4.
The contrast between rural and urban a~ong urban females, rural males and rural areas as also between males and females is most females ~re 1.7.1 1.3 and 0.1 respectively. conspicuous in the educational level, mattioUla: ,.' . ' -tion and above. While 11.0 per cent of , The diagr~m at facing page indic~tes the urban males in Hazaribagh district are at least literacy and educational levels for males and matriculate, the corresponding proportions females separately for rural and 'urban areas.

LI~TERACY AND EDUCATIONAL 1961
DISTRICT HAZARIBAGH
LEVELS
MALE RURAL FEMALE
74.37% 96.61 %
MALE FEMALE URIAN
39.25°1.
t. LITE .. ATES WITHOUT tll1l11J EOUCATIONAL LEVELS .----
2. PRIMARY OR JUNIOR 8 AS Ie'
70.16%
S. MAT A leu L A T ION AND ABOVE
4. ILLITERATES

'0
o • •
'. .... •
J: l!> « 7-
U CO < ex: -ex: UJ
I-« :::; N
U. .« 0 :c UJ
'" I- < I-
U z - '" ex: u I- til!
'" (J) Q. -0
xxvi
< on J:
~ 'lol
~ J: 2
.., CI 0-- 0- 0 ~
~ ,...
~ 0 .. J: ~
~ t-J:
\.
.... ' ... 0
.... :3 .... c
~ .. .... a ~
1': -0 <II .., "
..., .. c .... ., -;; ::> c: ()
::> '" " 0
.& .g "" ~ :: ";;i
~ 'ij ..c ... u .. Ci a c .. < VI
ct- IOi '. 0", 0 <:> • ..... 0 0 ...... on ~ N
I
§ f .. c
~I 0 • o
~ ~ I I .. ~ '" ..., 9 ; l xc ~
<

... ~ z ... li1 w ...
The statement below compares the growth of literacy in Hazaribagh district and Bihar State during the period 1901 to 1961 :
Growth 01 literacy in Hazarlbagh ell.trlel and Bihar state. 1901-61
LITJUIAOY BATlD PEa 10.000 Oll' TOTAL POPULATION. IN c----------'----Census Haza.ribagh district Bihar State
c-----'------\
PerBoIlS Meles Femelei! PerBOIlS Meles Fen.ales
1 2 :I 4 5 6 7
1901 305 602 22 3940 777 29
1911 266 504 38 443 854 45
1921 348 665 44 494 926 66
1931 305 567 45 489 893 77
1941 714 1,288 133 1,072 1,873 261
1951 1,225 1,915 399 1,3(5 2,194 474
1961 1,729 2,8116 540 2.175 3.519 817
A graph illustrating the above statistics Hazaribagh district is 80110 given below:
for
LITERACY, 1901-1961 DISTRICT HAZARIBAGH
so
PERSONS MALES -----
40 FEMALES .- .. - .......
30 j ,.
/ , , ,l
20 /
,/
V ,/ ,/
('
" /_
)-~--... ~-....... ~ / >--..... --)..... .
10
- - -- -- - - . > .. . o 1901 1911 1931 1941 1951 1961
·Exoluding persons in the age group 0-4.
Since 1901, the literaoy rate in Haza.ribagh has always lagged behind the State. However, it is noteworthy that the district has taken rapid strides along the path to literaoy during the last six decades. During this period the literaoy rate has gone up nearly six times. Even so the gap between male and female literacy utes is too glaring to escape attention.
The extent of literacy among different categories of workers (vide economic classification given later) also throws interesting light on this subject. ReleV'ant statistics will be found in Tables B--III Part A and B-III Part B printed elsewhere in this book. In Ha.zaribagh, literacy is highest among workers engaged in trade and commeroe (70. 85 per oent) followed by those in transport, storage and communications (55.67 per cent). As is expected, the literaoy is lowest among agricultural labourers (2.:n per cent). Considering all workers together, the bulk of literates among them is made up of cultivators (48.79 per cent) beoause of their large share in the lotal working popUlation.
An idea of the distribution of literacy in different parts of the district oaD be had from the literacy map at page XXVI.
The table below giV'es the rates for each subdivision. anchal and town individually :
Effectiv. nteraey rates In subdivisions, ancha\S and towns of Hazarlbagh district 1961
Subdlvision/Anchall Literacy Subdlvlslon/Anchal Llteracy Town pet Town per
10,000 10,000
1 2 1 2
Sadar Subdivision 1,767 11. Mandu 1.411
1. Barhi 1,374 12. Nagrl(Churchu) 1155
2. Barka.tha 1,211 13. Ramgarh 2,615
3. Bagodar 1.543 Ramgarh Cantt. 5,441
Ba.rki Sa.raiy80 3.623 14. J amagar 1,234 town.
4. Bishungarh 1.095 16. Gola 1,512
5. Hazaribagh 3,841 16. Gumia 1,571
H80ZlIo1'lhagh (M) 6.046 17. Peterbar 1,248
6. Katkamsandi 1,393 18. Kasmar 1.837
7. Ichak 1,446 19. Jaridlh 1,438
8. Barkagaon 1,020 20. Kodlll'llla 2,663
9. Keredari 1,406 Jhumri Tllaiya. (N) 4.163
10. Tandwa 1.016 21. Markacho 1,342

IftecUve 1l1e •• , r.ellD labdlvlso.lll, uchala ,114 to .... ,01 J:laIIrHtagb dfstrle&. 1981-concld.
SubdivisionfAnohalf LiteraCY Subdivisionl bellall Literacy Town per Town pel.'
10.000 lO.O()O
1 2 1 ~
22. Patratu 2,055 34. Dhanwar 1,601
Chatra Subdivision 1.244 35. Birni 1,1117
.23. Chauparan 1,343 36. Giridjh 2,~86
24. Itkbori 1.116 Giridih (J4) &.4.44
25. Hunterganj 1,224 37. Bengabad 1.1.125
.2a. Pratap Pur 983 38. Gande 1.315 -
27. Chatra 1,635 39. Dumri 1.452
Chatra 1M) 3_.92 0 40. Nawadih 1,239
28. Simaria 1.040 41. Pirtal11' 1,195
Glrldlb Subdivision 1.8j8 42. Bermo 3.189
29. Gawan 1,362 Kargali town 3.079
30. Tisri 1,405 :Sokaro town 5,416
31. Satgawan 1,723 Bermo town 2,626
32. Jamua 1,707 Ja.ridih Bazar 3,923
33. Deori 1.42& ~own.
Haza.rib~h anchal (38.41 per cent) ranks first in the istrict in literacy. The large urbrm population of Hazaribagh town with its hi~h literacy rate helps the anchal to gain this
distinction. Bermo (31.89 per cent) cortlee next. There are five other anohals, viz., Giridih (29.86 per cent), Kodarma (26.63 per cent), Ramgarh (26.15 per cent), Patratu (20.55 per cent) and Ka:sm.at (18.37 per cent) which have higher literacy rates than the district (17.29 per cent). The literacy rate is lowest in Flratap Pur anchal (9.83 per cent), while in others the rates vary between (10-17 per cent).
Eilueational1nstltutions and number 01 pupils
There has been appreciable increase in the number of rul types of institutions since 1947. The number of primary schools rose from 709 (661 for boys and 48 for girls) in 1947 to 1,544 (1,404 for boys and 140 for girls) in 1960. The totaJ enrolment in prima.ry 8chools rose from 29,828 (2,127 girls) to 91,483 (7,972 girls) during these years.
Middle school educ~tion has also received great fillip. From 39 (5 for girls) middle schools in 1947 the number rose to 160 (11 for girls) in 1968. The number I()f pupils on the rolls also increased. from 7,560 (.2,600 girls) to 35,3n (2,542 girls).
The number of high schools rose from 14 in 1947 to 35 in 1960. The number of pupils on the roll also increased from 4.713 to 9,894 during these years.
11. LANGUAGE
"Mother-tongue is the language spoken in gives the distribution of major mother-tongues childhood by the person's mother to the pers(:m (having more than 1,000 speakers) in the district or mainly spoken in the household." T~ble separa.tely for total, rural and urban a.reas. C-V at page 74 gives the number of The mother-tongues have been arranged speakers of different languages and dialoota in descending order of their numerical in district and its anchals. The statement bel{)w importance:
Distribution or major motber-Congues In HanrllJagb ilstrlct, 1961
Number of speakers Percentage of speakers of
Mothet'_tongue eaoh language iD
,-.- v4.- ,.. ..... Total Rura.l UrbaD Rural Urban
1 ~ 3 4 5 ~
All laD Pilei - 1,896.4U (100:00)
a,191i.UT (100.00)
101,184 (100.00)
Hindi ... 1, '72()j(J84 1,599,3'73 121,311 92.95 7.05 1?I.80) (72.86) (60.30)
HagahiJMagadhi 267.064 249.315 17.749 93.35 6.65 (l.l.lt-) (1l.36) (8.B2)

xxix
Distribution or major mother-tongues In Basarlllag' dl.triet,1981--oonold.
Number otspeakers per.centage of speakers of each language in
Mo~h.r.tonsue r- '"'" t"'"
Total B1J1'al Urban R1J1'al Urban
1 2 3 4. G 6
Santali 182,600 182.014 586 99.68 0.32 (7.62) (8.29) (0.29)
Urdu 140,864 114.522 26,342 81.30 18.70 (5.88) (5.22) (13.09 )
Bengali 30473 17,882 12,59] 58.68 41.32 (1.27) (0.81) (6.26)
• Kurukh/Oraon 9,660 9,299 361 96.26 3.74
(0.41) (0.42) (0.18)
Mundari 8,541 7,404 1,137 86.69 13.31 (0.36) (0.34) (0.56)
Punjabi 6,269 2,416 3,853 38.54 61.46 (0.26) (0.11) (1'.!t2)
Oriya. 3,237 1,054 2,183 32.56 67.44 (0.13) (0.05) (1.08)
Nepali 3,075 1,717 1,358 55.84 44.16 (0.13) (0.08) (0.67)
Bhojpuri 2,742 1,665 1,077 60.72 39.28 (0.11) (0.07) (0.54)
Marwari ... 2,511 384 2,127 15.29 84.71 (0.10) (0.02) (1.06)
Tamil 1,850 290 1,560 15.68 84.32 (0.08) (0.01) (0.78)
Gujarati 1,846 429 1,417 23.24 76.76 (0.08) (0.02) (0.70)
Rajas~hani 1,810 11 1,799 0.61 99.39 (0.08) (N) (0.89)
Bilaspuri 1,396 897 499 64.26 35.74 (0.06) (0.04) «(};25)
Maithili 1,303 843 460 64.70 35.30 (0.05) (0.(4) (0.23)
KhorthaJKhotta 1,227 1,227 100.00 (0.05) (0.06)
Chattisgarhi 1,217 17 1.200 1.40 98.60 (0.05) (N) (0.60)
Ho 1,205 1,205 100.00 (0.05) (0.05)
Malayalam 1,112 571 541 51.35 48.65 (0.05) (0.03) (0.27)
Others 5,725 2,692 3,033 47.02 52.98 ,(0.24) (0.12) (1~51)
NOTE: Figtue8 within braekets indicate percentages. (N) -denotes negligible tip •.
In Ha.zaribagh, Hindi has been returned a.s popula.tion. MagahiJMa.gadhi ha.s similarly been the mother-tongue of 7r.SO per cent of the retumed in respect of 11.14 per cent a.nd

Xxx
Santali 7.62 per ceut of the population. The three languages taken together account for 90.56 per cent of the district population. Not much should, however, be read into these proportions. To a great extent, they are indicative mainly of individual preferences rather than of any precise linguistic classification.
Among other important languages Urdu was returned by 5.88 per cent and Bengali by 1.27 per cent of thepopula,tion. No other language
has been returned as mother-tongue by even 1 per cent of the district population.
The rural-urban break up indicates that the speakers of the three numerioally important languages mostly reside in villages. It is significant that 99.39 per cent of speakers of Rajasthani, 98.60 per oent of Chattisgarhi, 84.71 per cent of Marwari, 84.32 per cent of Tamil, 76.76 per cent of Gujarati, 67.44 per cent of Oriya and 61.46 per oent of Punjabi were enumerated in urban areaS of the districli.
12. RELIGION
The distribution of popUlation by religion is given up to anchals in Table C-VII at page 86. The following statement shows the number
and per cent distribution of population by religion in total, rural and, urban areas of the district:
Dls'ribution of population by religion in Hazaribagb district, 1961
Number of followers Per oent of eaoh religion in
'Religion r--
Total
1 2
AU reUglons 2,896,411 (100.00)
Hindus .. 2,096,962 (87.50)
Muslims .. 282,915 (U.81)
Christians .\ 7,819 (0.33)
Sikhs 4,054 (0.17)
Jains 2.748 (0.11)
Buddhists 288 (0.01)
Others 1.625 (0.07)
NO'rE; Figures within brackets indicate percentages.
The Hindus comprise 87.50 per cent and the Muslims 11.81 percent of the district popUlation. Other religious groups together constitute a mere 0.69 per cent of the district 1!0pulation.
The rural-urban break up indicates that the two numerically important oommunities in the district-the Hindus and the Muslims-reside mostly in villages. The Buddhists and the J ains flourish mainly in the urban areas.
.A.--~--~ r- .A. ..... Rural Urban Rural Urban
3 4 5 6
2,195.227 201,184 (100.00} (100.00)
1.935,882 161.080 92.32 7.68 (88.19) (80.07)
249,893 33,022 88.33 11.67 (11.38) (16.41)
4,844 2,975 61.95 38.05 (0.22) (1.48)
2,014 2,040 49.68 50.32 (0.09) (1.01)
938 1,810 34.13 65.87 «();"()4) (0.90)
31 257 10.76 89.24 eN} (O.13)
1,625 100.00 (0.08)
(N)-denotes negligible figures.
49.68 per cent of the Sikhs in the district are found in rural &reas. The Sikhs, mostly erstwhile displaced persons, have established themselves in various kinds of trade and business in towns as well as in villages. It is significant to note tha.t 61. 95 per cent of the Christians' live in rural a.reas. The existence of Christian mission~ries in rura.l areas as well as the conversion of a sizeable scheduled tribe popula.tion to Christianity would Beem ~o explain this feature.

xxxi
The table below shows the growth of each religious group in the district during the last sixty years. The figures for Christians, Buddhists,
Sikhs and J ains a.re small and ha.ve been given separately in the foot-note below the table:
Variation In population of each religious group 1901-81
Hindus Muslims
Census r-----A. r-----__,.A,.~--____.
Number Per cent decade Number Per cent deoade va.riatiou variation
1901
1911
1921
1931
1941
1951
1961
1 2
954,129
1,066,084
1,070,756
1,208,099
1,059,615
1,707,558
2,096,962
3
+11.73
+0.44
+12.83
-12.29
+61.15
+22.80
4 {)
119,656
133,328 + 11.43
136,001 +2.00
171,694 +26.24
209,384 +2L95
214,9~1 +2.66
282,915 +31.61
NorE , Absolute figures for Christians, Buddhists, Sikhs and Ja.ins are given below:
Religion 1901 1911 1921 1931 1941 1951 1961
Christia.ns 1,163 1,786 2,123 3,169
221
221
794
4,761
96
913
899
6,928 7,819
Buddhists
Sikhs
15
167
227 288
4,176 4,054
Jains 787
163
542 2,030 1,689 2,748
The Hindus comprised 81.00 per cent and the Muslims 10.16 per cent of the district population in 1901. The corresponding proportions at 1961 Census were 87.50per cent and 11.81 per cent respectively. It is evident, therefore, that both these communities have registered an increase in their proportions in the last six decades. During the last six decades the Hindus have grown by 119.78 per cent as against 103.44 per cent increase in the total popula.tion of the district. Except in 1941 when the Hindu ~pulation reoorded a decline, it has always been on the increase. The Muslim population has increased by 136.44 per cent during the period 1901-61. It is significant that the Muslim popUlation has been on the increase in each census since 1901.
.Among the minor religious groups the Christians have shown high increase in their population. The Sikhs who appeared' for the first
time in 1911 have also shown very high increase during 1941-51. The mass exodus of Sikhs from Pakistan as a result of tense communal situation following the independence in 1947 seems to account for the high increase in the population of Sikhs in 1951. The Buddhists have been returned in the distHct at each census except 1911 and 1921, but their number has always been very small.
The sex ratios for different religious groups in the district are: Hindus-984, Muslims-l,065, Christians---844, Sikhs-490, J ains-827 and Buddhists-3,056. The very low sex ratio among the Sikhs is explained by the fact that they are mostly erstwhile displaced persons and they have taken to various kinds of trade and business leaving behind their families at home. No significant conclusion can be drawn from the very favourabl~ sex ratio among Buddhists, as their population is very small.

xxxii
13. SCHEDULED OASTES AND SCHEDULED TRIBES
The total population of scheduled oastes in Ha.zaribagh district was 296,387 in 1961. The scheduled caste population of the district as given in the census tables in Parts II-C and V-A in Vol. IV, Bihar, 1961 includes 4,260 persons belonging to Bhuiya caste who were wrongly enumerated as soheduled oaste and tabulated under 'unclassified'. Corrected. figures for Tables SCT-I Pa.rt A and its appendix and C-VIII Part A have been given in this volume. However, it has not been possible at this stage to correct the figures in table SC-I or in the Village Statistics.
The scheduled oastes in Hazaribagh comprised 12.37 per cent or a little less than one-eighth of the district population. The corresponding percentagesinprevious oensuses were: 11.14 in 1951, 12.64 in 1941 and 13.17 in 1931. The 19'61 proportion is lower than previous censuses except 1951. In the State as a whole, the soheduled castes comprise 14.00 per cent of the total population. Thus, the district has lower proportion of scheduled oastes in its population than the State.
Hazaribagh ranks eleventh among the districts in the population of soheduled oastes. The six districts having smaller scheduled oaste population are Saharsa (296,130), Santa! Parganas (202,219), Bhagalpur (198,085), Dhanbad (180,455), Ranchi (97,399) and Singhbhum (59,899). The districts of Purnell. (12.24 percent), Bhagalpur (11.58 per oent), Saran (10.33 percent), Santa! Parganas (7.56 per cent), Ranchi (4.55 per cent) and Singhbhum 12.92 per cent) have lower proportions of sch,ed.uled oastes in their population than Hazaribagh.
The greatest concentration of scheduled oastes inr Hazaribagh distriot is in Simaria anchal of Chatra subdivision. where they comprise 25.73 per cent of the total a.nchal popUlation. Satgawan ancha! of Giridih subdivision comes next with, 21.29 per cent. The proportion is lowest in Nagri (Churchu) anclial (6.77 per cent). In 19 anchals, the ~roportions are between 12 and 20 per cent and in other anchals the prop,ortions vary between 7 and 11 per cent of the respective anchal population.
It may now be useful to find out which a.re the more numerous among the scheduled castes
in Hazaribagh district. The statement below lists the scheduled oastes ha.ving more than 1,000 persons in the district:
Population 01 Bcheduled caste. having more than 1,000 persolla In Bazarlbash, 1961
Number per 1,000 of r-------A--~
Name ot soheduled caste_ Popula.tion, Total Total
1
1. Chalnar or Moohi
2. Turi
3. Bhogta
4. Dusa.dh inoluding Dhari or Dharhi.
5. Dhobi
6. Rajwar
7. Musahar
8. Ghasi
9. Pasi
10. Dom or Dhangad
11. Hari. Mehtar or Bhangi
12. Bauri
1961 scheduled population
2
107,115
42,704
37,102
35,672
19,503
11,314
8,342
7,794
7,259
4,238
3,006
1,612
caste ot the population respeotive
in the scheduled distriot castes in
the state
3 4
362 57
144 472
125 423
120 21
66 59
38 73
28 8
26 142
25 28
14 27
10 33
6 21 -----TOTAL 2,85.661 964 48
The above 12 castes comprise 96.4 per cent of the tota.l' population of scheduled castes in the district. Among indi"\7idual castes, the Chamars or Mochis are most numerous and account for 36.2 _per cent of the total schedUled oaste population in the district. Turie co~ next with 14.4 per oent. These two castes taken together aocount for 50.6 per cent of tb~ scheduled oaste popuIa.tion in Hazaribagh. The digt;rict of Hazaribagb contains 5.15 per cent of the total p~pulation of Bihar. It follows that on a pro rata basis, it h88 l;llore than: its fair share of Turis, Bhogtas, Ghasis, ltajwars, Dhobis and Chamars. Other scheduled O1.8tes are under-represented.

xxxiii
Among the remammg scheduled castes (8ee Table SCT-I Pa.rt A at page 96) 10,482 persons have been returned under the category 'unclassified'.' It rela.tes to cases in which vague entries such as Harijau8, Achoot, etc., were made without specifying the exact name of the scheduled oaste to. which the person belonged.
Haza,ribagh lies within the tribal belt and hal:) 270,693 persons belonging to scheduled tribes. They co:nprise 11.30 per cent of the total population of the district. In the State as a whole the scheduled tribes account for 9.05 per cent of the population. Hazaribagh ranks fourth in the State in the population of scheduled tribes.
Pirtanr anchal contains the largest concentration of scheduled tribes who comprise 48.02 per cent of the" anchal population. Jaridih ancha,l with a. proportion of 38.94 per cent follows next. Besides, there are 15 aneha-Is where the proportions vary between 12 and 33 pel' cent. Jainagar is the only anchal in the district which does not oontain a single member of the soheduled tribe.
The statement given alongside lists tlIe scheduled tribes having more than 1,000 persons in the district.
Pop.uJation of SClheduleod tribes having more than 1,000 1I8Tsons In Hazaribagh, 1961
Number per 1,000 of
Name of Scheduled tribe Population, r----J.-_...~-~ 1961
1. Santal 2. :Munds. 3. Badia 4. Karmali " 5.0raon 6. ~[ahli 7. Gond 8. Birhor . . 9. Lohara or Lohra
TOTAL
173,780 27,588 19,867 16,458 15,608
5,184 1,604 1,233 1,028
Total Total ~cheduled population
tribe of the population respective
in the scheduled distriot tribes
in the State
642 lI3 102 ,44 73 520 61 621 58 21 19 76 6 48 4 506 4 11
----262,350 969 83
Among individual tribe", the Santals are the most numerous accounting for 64.2 per cent of the total tribal population of the district. The Mundas follow next with 10.2 per cent. The Bedias, the Karmalis and the Oraons are other numerically important tribes in the district.
4,980 memhers of scheduled trib,es have been shown as 'unclassified'. This category relates to cases in which the name of the tribe was not clearly mentioned.
14. HOUSING
Tables E-t, E-II, E-IV and E-V publislled in Part IV-B of the 1961 Census Publications relating to Bihar contain information on various characteristics of housing in rural and urban areas of the distrio~ and anchals.
Use 01 Houses
The total number of houses in Hazaribagh distriot according to the houselistirJg operation conducted in September-October, 1960 waS 437,878. It ranked twelfth among the dist,ricts of Bihal in number of houses. The five districts with smaller number, of houses' were Singhbhum (43'1,308), Saharsa (334,313), Bhagalpur (289,435),' DhaIlbad (236,984) and 'Falamau (230,994). As against 3.0 per
cent in the State, 5.6 per cent of the houses in Hazaribagh were found vacant at the- time of houselisting, that is, they were not put to any specific use. It follows that 94.4 per cent of the houses in- Hazaribagh were occupied. In comparison to other districts of the State, the proportion of occupied houses in this district is higher than the districts of Ranchi (93.8 per cent) and Saharsa (91.7 peT cent). 84.6 per oent of the houses ~ Hazaribagh district were ustd solely for the purpo£e of dwelling or shop-cum-dwelling or workshop·(lumdwelling. The corresponding prbportion for the State is 79.8 pel' cent.
An idea of the different kinds of uses to which census houses are :put in Ha~aribagll

~xxiv
district can be had from the following tal)le which also gives corresponding proportional figures for Bihar State for comparison
Number and distribution of 1,000 census houses in Haz~ri_ bag.h distrIct by kinds of USieS, 1960
Kind of uses
1
Total Consus Houses
A. VAOANT DURING HOUSE' L[STING.
B. OOOUPIED CENSUS _HOUSES USBD_AB-
(i) Dwellings (inoluding shop~-d wellings or worikshop-cum-dwe]J. ings).
(a) Dwellings
(#.I) Shop-cum-dwellings "
(c) Workshop-cum-dwellings
(ii) Hotels, Sarais, Dharam. shalas, tourist homes and inspection houses.
(iU) Shops excluding eat. ing houses.
(iv) Business houses and offices.
('II) Factories, workshops and worksheds.
(vi) Schools a'hd other educational institu· tions inoluding train. ing classes, coach. ing and shop classes.
<ClU) Restaurants, a,weet. meat shops and eat. ing places.
(viii) Places of entertain· ment and cOlDlDunity gathering (Panohayat Ghar).
(tx) Publio health and medical institutions, hospitals, health cep' tres, d<;>ctors' clinics, dispensaries, etc.
(x) Others
Proportion per 1,()OO oenSUS houses
Number r-------'------~
Hmzaribagb Biha):
2
43'1,87<8
24,729
370,382
354,076
5,046
11,260
479
5,404
2,361
3,540
1,780
175
5,930
486
22,612
district State
3
'1,000
57
846
809
11
26
1
12
5
8
4
N
14
52
4
1,()00
30
798
765
13
20
1
15
4
8
5
1
10
1
N-denotes negligible figures.
The category 'others' is a residuary group incorporating uses which could not be fitted into any of the other prescribed categories and includes entries such as goshaZa" ca,ithka, bhoosaghar, cemetery, lavatory, kitchen, garage, pigeon house, pig house, etc.
DenSity of Houses
There were only 57 houses per sq. mile in rural areas and 596 houses per sq mile in urban areas of the district. In Hazaribagh, as in other districts, the rural density is low because of the large areas covered by agricultural fields, forest, orchard'!, etc., which in rural areas comprise the bulk of the land mass. If the areas of the village settlements only were taken into account, the density of houses in rural areas would De equaily .higb. S'ucb a study is, however, handicapped because relevant figures are not available. However, compared to the State (120 houses per sq. mile in rural areas and 1,016 houses per sq. mile in urban areas), the density of census houses in Hazaribagh is lower. As compared to other districts of Bihar, Hazaribagh occupies fifteenth posi1 ion in order of density of census houses in urban areas. The two districts having lower urban densities are Palamau (530 housf's per sq. mile) and Saharsa (508 houses per sq. mile). COEsidering the rural density of census houses, only one district, namely Palamau has lower density (45 houses per sq. mile) than that of Hazaribagh (57 houses per sq. mile) in this State.
status of Occupancy
94.74 per cent of the households in ruralareas and 47.18 per cent in urban areas of Hazaribagh live in owned houses. It follows that the proportion of households living in rented houses in rural areas is 5.26 per cent only. But in urban areas of the district 52.82 per cent or at least lout of every 2 households lives in rented house. It may be noted that the correspondihg pro pOI tions for the State as a whole (2.5 per ~ent in rural area and 43.5 per cent in urban area) are appreciably lower.
Material of Wall
We may now consider the type of materials that provide the structure of houbes in Hazari-

XXXV
bagh di8trict. The following statement compares the distribution of 1,000 households living in census houses used wholly or partly as dwellings by predominant material of wall, separately for rural and urban areas in Hazarihagh district and Bihar State l
Dlstrlbatlon by 1,000 households living In census hou6es used wholly or partly as dwellings by predominant wall materlalln Hazaribagh dtstrlct and Bihar State. 1960
NUMBER PER 1,000 HOUSEHOLDS
Material of wall Hazaribagh Bihar State district
,....-----"-_---,. ,....------'-----,.
Rural Urban Rural Urban
2 3 4 5
Grass, leaves, reeds or 6 4 225 88 baJUboo
TiJUber 5 62 3 6
Mud 912 279 663 2S9
Unburnt bricks 2 121 7 30
Burnt bricks 71 519 99 579
C.I. sheets or other metal 1 9 1 3 sheets
Stone 3 5 2 3
Cement concrete N N N 1
All other materials N 1 N 1
N-denotes negligible figures.
As in Hazaribagh so in the State, mud is the most comIlloll material of wall in lUral areas, though speaking comparatively, it is more popular in Hazaribagh. At least 9 out of every 10 rural households in Hazaribagh district live in mud walled houses. The use of burnt bricks is confined mainly to urbaIl areas, but it is found in rural areaS also. Unburnt bricks as wall materials are found generally in the urban areas of the district. In comparison to the State as a whole, the use of grass, leav{'s, reeds 01' hamboo as wall materials is insignificant in the district.
Material of Roof
Considering next the material of roof, the table given alongside shows the distribution of 1,000 households living in census houses used whollY'
01' partly as dwellings by predomipant roof material in rural and urban areas of Hazaribagh district as wel1 as Bihar State
Distribution Qf 1,000 househoJd$ living in CIIlllSUS houses used wholly or partly as dwellings by predominent roof materials In Hazarlbagh district and Bihar state, 1960
NUMBER PER 1,000 HOUSEHOL"OS
__. \
Ma.terial of roof Hazaribagh Bihar State district
r----"------,. r--____'____'
1
Grass, leaves, reeds, thatch, wood or bam. boo
Tiles, slate, shingle
Corrugated iron. zino or other metal sheets
Asbestos cement sheets
Brick and lime
Concrete and stone slabs
All other materials
Rural
2
44
918
9
2
26
1
N
Urban
3
10
672
50
8
236
24
0
N-denotes negligible figures.
O-denotes nil.
Rural Urban
4 5
446 125
522 524
8 41
1 21
22 283
1 6
N N
A higher ploportion of households prefer tiled roofs to thatched roofs in rural areas. The Use of brick and lime as roof materials is mostly confined to urban areas of the district and the State. Apart from these. materials, others do not count.
Living Accommodation
For ohvious reasons, the enquiry wnducted by the census at the time of houselisting did not concern itself with the exact area of accommodation available to each household. It Was decided to remain content with information relatil1g to number of r~oms occupied by each household. A 'room' was defined as follows:
"A room should usually havl3 four walls with a doorway with a roof overhead and should be wide and long enough fur a person to sleep in, i. e., it should be at lel'tst 6 f(l~t long. Unenclosed I _

xxxvi
Verandah, kitchen, store, garage, cattleshed and latrine which are not ordinarily used for living and sleeping should not be treated as rooms. Ar. enclosed room, howevel, which is used for living, dining, storing and cookilJg f:!hould be
regarded as a room."
The statement below gives the distribution .of houst'holds by number of rooms occupied separately for total, rural and urban areas in Hazaribagh district and Bihar State :
Distribution of 1,000 cons us housebolds by number of rooms occupied in Hazaribagh district and Bihar state, 1960
Number of rooms
No regular room 1 room 2 rooms 3 rOomS 4 rooms 5 rooms or more
1
It is evident that rural areas of the district are sQmewhat better off than urban areas in the matter of households living in dwellings
NUMBER PER 1,000 r
Hazaribagh district r-----Jo-
Total Rural Urban
2 3 4
1 1 2 366 359 437 310 311 295 157 161 119 84 86 70 82 82 77
with 3 rooms or more. the State also.
HOUSEHOLDS IN
Bihar State r Jo-Total Rural Urban
5 6 7
2 2 4 363 356 441 293 296 264 150 157 127 83 84 73
104 105 91
The same is true of
15. HOUSEHOLDS: SIZE AND COMPOSITION
Size of Households
A household means "the entire group of persons who commonly live together in the same census house and take their meals' from a common meSs unless the 'exigencies of work prevent them from doing so". A cenSU8 h.ou8e is a (Istructure orpart of a structure, a dwelling, a shop, a workshop, factory or place of businesss, or a shop-cum-dwelling giving on the road or a cummon staircase or a common courtyard leading to a main gate or enjoying s separate entrance". It follows that while the concept of census home relates to a physical unit, that of census household extends to a social unit.
In Hazaribagh the average size of a household is 5.33 persons per household. The
corresponding average for the State is 5.49 persons per house-hold. In conformity with the State pattern, the size of a household in rural areas of the district is larger than in urban areas. Comparative figures for the district and the State are noted below:
Total Rural Urban
N u:rnber of person~ per household
,...------.Jo--------,. H!l(l;ari'bagh Bihar district State
5.33 5.35 5.15
5.49 5.51 5.33
Lest the overall average give a misleading notion about the size of households, the following table shows the dist,ribution of 1,000 householdb by different sizes :
Distribution of 1,000 housebolds in Hazaribagh district and Bihar State by their size, 1961
Hazaribagh district Bihar State Size of the household ~------"-\ r-------'---------"
Total Rural Urban Total Rural Urban
1 2 3 4 5 6 7
AU sf,es 1,000 1,000 1,000 1,000 1,000 1,000
Single member 61 57 107 57 53 99 2-3 :m.embers 216 213 254 211 209 !32 4-6 members 445 451 370 436 442 376 7-9 members 197 199 171 202 203 191 10 members and a,bove 81 80 98 9* 1)3 102

Ii XXXVII
While the most common size of households (accounting for 44.5 per cent in Hazar-ibagh) consists of 4-6 members, large households (having 1-9 members) or sml!-ll households (having 2-3 membel's) are by no means very uncommon. In fact they too account for 41.3 per cent or more than two-fifths of the total households. A comparison of the district proportions with those <.f the State would indicatethatlargehouseholds (having 7-9 members) and very large households (having 10 members
Composition of households In
and above) have lower proportions in the district. This would seem to indicate that there is a tendency towards smaller size households in the district.
Oomposition of Households
The statement presented below gives the composition of househGlds by relationship to the head of household :
Hazarlbagh district, 1961
Total Rural Urban
Relationship to head of households r- .4 r--_..A.. .4
1
Total
Heads of households
Spouses of heads of households
Married sons
Other married rela.tions
Never married, widowed relations
and divorced or separated
Unrelated persons
In Hazaribagh 33.4:0 per cent or one out of every three males is head of household as against 4.14 per cent among females. The small proportion of females as heads ofhuuseholds should not cause any surprise, because the patriarchal system of family is almost universal throughout the State. Even the small proportion of female hettds of households presumably relates to elderly widows, mothers of minor sons or such other females. In some cases, continued absence of husbands for long periud on work elsewhere may also have
Males Females Males Females Males Females
2 3 4 o· 6 7
100.00 100.00 100.00 100.00 100.00 100.00
33.40 4.14 33.32 4.30 34.28 2.00
0.08 26.94 0.09 26.67 0.05 30.42
11.80 12.12 8.33
5.34 21.12 5.26 21.41 6.13 17.34
47.56 47.58 47.67 47.44 46.32 49.45
1.82 0.22 1.04 0.18 4.89 0.79
resulted in their wives having been treated as heads of households.
The category (nevt>!' marri~d, widowed .and divorced or separated relations' has the highest proportion among male!; as well as females. The ca.tegory 'other married relations' has higher proportion among females, in rural areas. The proportion of 'unrelated persons' of either sex is higher in urban areas. This is because of the more prevalent practice of ~ngaging domestic helpers, private tutors, professional clerks, etc., in urban areas on salary-cum-food basis.
16. ECONOMIC OHARACTERISTICS
Workers and Non-workers
The economic classification of 1961 Cf'nsus envisages a broad division of the entire population into two categories, viz., workers and nonworkers. A 'worker' is a person who is engaged
_in some kind of economic activity. For example, he may be working as a cultivator, or as an agricultural labourer, or at household industries, or doing any other work of productive and/or gainful nature. Work
includes not only actual work but effective supervISIon or direction of work. Persons engaged in seasonal wot-k like cultivation, livestock, dairying, household industry, etc., were deemed to be wOl'kers if they had regular work for more than an hour every day for the greater part of the last working SeaSon. Per .. sons engaged in trade, profession, business or service were treattd as workers if they were employed during any of the fifteen days preceding the date of enumeration. A person

xxxviii
who is not working is a 'non-worker'. Non~ workers may be full time students or children doing no other work, 40usewives or other persons engaged in household duties only, infants or disabled persons incapable of doing any work, retired persons (not re-employed), rentiers, beggars, vagrants, convict&, in jails, inmates of penal, mental or charitablt, institutions, and unemployed persons. For a fuller understanding of these concepts, reference may be made to the flyleaf to Primary Census Abstract in Part II-A (General Population Tables) or to the Introductory Note in Part II-B(i) (General Economic Tables) of the 1961 Census Publications relating to Bihar.
The Primary Census Abstract gives the distribution of workers by nine categories of economic activity.
Participation Rates The participation rate (also called the labour
participation rate) refers to the number of workers per J ,000 of population.
The following statement gives the participation rates separately for persons, males and females, as well as for total, rural and urban areas in Hazaribagh district and :Bihar State, according to the 1961 Census. Workers have been classifitd by the three broad sectors of economy, viz., primary, secondary and tertiary:
PartieipatIon rate of workers in Hazaribagh distrlet and ;BIhar state by broad seetors of economy. 1961
Workers
District/State
1
Hazaribagh
Bihar
Hazaribagh
Bihar
Hazarihagh
Persons Males
Females
2
P
M
F
P
M
F
P
M
F
P
M
F
P
M
F
p
M
F
Total population
3
TOTAL
1,000
1,000
1,000
1,000
1,000
1,000
RURAL
1,000
1,000
1,000
1,000
1,000
1,000
URBAN
1,000
1,000
1,000
1,000
1,000
1,000
Total
4
484
571
397
414
556
271
496
575
417
422
560
285
359
533
146
332
517
104
Primary Secondary Tertiary sector sector sector
5 6 7
380 67 37
403 106 62
358 28 11
326 41 47
421 57 78
231 24 16
411 58 27
439 92 44
383 25 9
352 34 36
458 45 57
248 23 14
47 166 146
50 244 239
43 70 33
46 114 172
59 180 278
29 32 43
Nonworkers
8
516
429
603
586
444
729
504
425
583
578
440
715
641
467
854
668
483
896

xxxix
In Hazaribagh district, there are 484: workers out of every 1,000 persons, a proportion which is above the State avprage of 4] 4. In the State, only four districts, viz., Ranchi (563), SantaI Parganas (525), Singhbhum (517) and Dhan'bad (488) have higher participation rates than this district. As is expected males have a higher participation rate than females. It is seen that the order of difference between the male and female rates in Hazaribagh is much lower than the State. However, the male rate in Hazaribagh is higher than the State average by 2.7 per cent, while the female rate is higher by as much as 46.5 per cent.
As in the State, the rural areas in the district have higher participation late (496) than the urban areas (359), though the differenCe between the rural and urban rates in Hazaribagh is wider than that in the State. Considering the two Sexes separately also the rural areas have higher participation rate than urban areas. Thus the participation rates for males are 575 and 533 respectively in rural and urban areas while the corresponding rates for females are 417 and 146. A considerable portion of the male population in urban areaS consists of students, job seekers and retired persons who are treated a& non-workers. Among females also, the Scope of work in household industry and agricultural labour (in which they are mostly engaged) is considerably limited in towns. These factors, thetefore, depress the urban participation rates.
The distribution of workers by the three broad sectors of economy, as presented in the foregoing table, giVes a more vivid picture of the factors influencing participation rates. The pnmary 8ector includes workers in cultivation, agricultural labour, livestock, for€stry, fishing,
hunting, plantations, orchards and allied activities. The 8econdarll sector comprises workers engaged in mining and quarrying, househ01d industry, manufacturing, construction and gaEl arid electricity. The tert~ar1l 8ector relates to workers in trade and commerCE, transport, storage and communications and other services.
It is at once evident that as compared to tht. State, Hazaribagh has a higher proportion of' workers in the primary sector. Thus, against 326 persons per 1,000 engag€d in primary sector in Bihar, the proportion is as high as 380 in Hazalibagh. The number per 1,000 engaged in secondary sector in the district is also higher than the StatE', while in the tertiary sector the prop()rtion is lower in the district. This pattern holds good for both rural and urhan areas.
In rural areas d the district and the State, the primary sector claims the largest proportion of workers. Considering urban area& only, 1(he highest proportion of workers in the State belongs to tertiary sector, while in Hazaribagh it is the secondary sector.
Industrial Categories of W'orkers
Workers have been classified into nine industrial categories depending on the sector of economic activity in which they are engaged. In the case of a person doing more than one kind of work, such classification has been done on the basis of principal work determined as the one which consumed the greater part of his working time.
The statement below shows the distribution of 1,000 workers in Hazaribagh district and Bihar State by nine industrial categories, separately for persons, males and females :
Distribution of 1,000 workers in HaZarlbagh district and Bihar State by industrial categories, 1961 PROPORTION FER 1,000 WORXERS
r-Working Hazaribagh district Blhar State
r- r-Persons Males Females Persons Males Females
1 2 3 4 5 6 7 I As Cultivator .. 677 610 774 539 534 547
II As AgrICultural labourer:: 95 76 122 260 199 294 III In Mining, Quarrying, Livestock, Forestry, Fishmg, 78 III 30 34 42 18
Hunting and Plantations, Orchards and Allied activities.
IV At Household Industry .. .. .. 39 41 36 55 46 73 V In Manufacturing other than Household Industry 26 38 9 22 30 6
VI In construction .. 5 8 1 5 8 1 VII In Trade and Commerce .. 16 24 3 27 35 12
VIII In Transport, Storage and Communications 9 14 1 12 17 N IX In Other Services . .' •• 55 78 24 76 89 49
N-denotes negligible figures.

xl
Thus 77.2 per cent of the workers in Hazaribagh district are engaged in cultivation and agricultural labour. The corresponding proportion for the State is 76.9 per cent. The extent of agricultural employment in Hazaribagh is, therefore, of the same order as in the State. It is also noteworthy that although the proportion of cultivators in Hazaribagh (67.7 per cent) is appreciably higher than that of the State (53.9 per cent), the proportion of agricultural labourers (9.5 per cent) is much lower. Agricultural labourers are persons who work in other person's land for wages in cash, kind or share without having any kind of right, title or interest" in such land. These proportions are, therefore~ quite revealing ill regard to the state of agriculture in the district. It is also significant that the proportion of agricultural labourers is relatively h~gh among females.
Hazaribagh has a number of mines and quarries. It is natural, therefore, that employment in category III in this district should be considerably higher than that in the State. The
employment in catgory IV (household industry) in the district is lower for both sexes. The details of household industries will be found later. In manufacturing other than household industry the proportion of workers in Hazaribagh district is comparatively higher than that in the State while in 'construction' figures for both the district and the State are identical. In other categories, viz., trade and commerce, transport, storage and communications, and 'other services' Hazaribagh has lower employment than the State.
Female Participation
An idea of the extent of female participation in economic activities can be had from a consideration of sex Fatio among workers in each industrial category. The followlllg statement gives the relevant figures for Hazaribagh district and Bihar State, separately for total, rural and urban areas as well as for each industrial category, total workers and total population:
NUIlIlber of females per 1,000 males among wQl'kers in different industrIal categories in Hazarlbagh district and lUbar state, :i961
Total population
Tofal workers
I Cutlvators
Ca.tegory of workers
1
II Agrioultural Jabourera
III Workers in MIning, QuarrYIng, etc ...
IV Workers at Household Industry
V workers in Manufaoturing other than Household Industry
VI Workers in C1nstruction ..
VII Workers In Trade and Commerce
• VIII WOl.'kers in Transport, Storage and Communioa-tlOns
IX. Workers in Other Services
In Hazaribagh district, cultivation and agricultural labour provide the greatest scope for female participation in economic activitity. For every l~OOO males working in categories
Hazaribagh district
Total
2
991
688
874
1,105
188
601
155
67
93
38
213
Rural
3
1,009
732
875
1,105
156
637
157
69
123
54
245
Urban
4
815
224
804
950
335
209
151
59
52
15
148
Total
5
994
485
496
716
204
755
105
91
166
12
267
BIhar State
Rural
6
1,012
515
497
717
210
801
162
88
218
11
302
Urban
7
811
163
380
650
169
407
59
95
77
13
181
I and II there are 874 and 1,105 females respectively working in them. The corresponding proportions for the State are 496 and 716 respectively. Household industry comes next

OISft\ICT HAZARISAGt-I
" " R H ,
'''AK''T"''
'''GOOAR
'IIHUNGAIIH
HAZ A AI& A G H
K"'K""'5"NPI
1 C H A IC
'''AIC"GAON
TANPWA
NAGRI (CtiURCHU)
A A'" G " A If
JAINAGAA
G 0 I. A
GUM I A
PETERIIA
IC A SMA II
JAR 1 P 1 14
KODAAIlAA
MARKACHO
PERCENTAGE
xli
ANCHALW\SE C\STR\BUT\ON OF WORKERS '961
DISTRICT HAZARIBAGH
IIEFERENCES __ _
. 1- II III IV v VI VII VIII
A.K.MATHUA
IX

CHAUPARA
I T 1(" OR I
HUNTERGAN
PAATAPPU
CIIATRA
S"toIARIA
G " WAN
T t , R ,
SATGAWAN
JAW U A
o f: 0 R ,
I£"G"I"D
G " N 0 E
DUM R I
HAW A 0 I H
II .. R iii 0
IOERCENTAGE,_ 0
xlii
ANCI;ALWISE DISTRIBUTION OF
1961 DISTRICT HAZARIBAGH
REF E RENCE5:_
II III IV V VI
WORKERS
VI! VIIl I " A
o...:;A:.;..",IC,::;.M:o:~:::..T,,"H.:..:U:;,:R.:.;''-_____________________________________ ~ _____ ~.~ ___ _
---------------------------_._-----_._------

xliii
with 601 females per 1,000 males. Nearly 53 per cent of workers among agricultural 180-b.ourers are females, the corresponding proportIOns for cultivation and household industry being 47 and 38 per cent respectively. It is noteworthy that Hazaribagh has better female participation rates than the State in all the categories except III (mining, quarrying, etc.), VI (construction), VII (trade and commerce) and' IX (other services). Another notable feature is that the participation of females in rural areas is higher than that in urban areas in all the categories except III.
Participation Rates In Anchals
The participation rates at lower levels, e.g., subdivisions and anchals give a. better idea. of the regional differences within the district. The statement below gives the relevant information :
Number of workers per 1.000 males and females in sub· divisions and anollais of Balarlbagh dlstrlot. 19.81
Number of workers per 1,000 population
District/Subdivision/Anohal ....._~
Males Females
1 2 3
BAZARIBAGB 571 &97
Sadar Subdivl&1on &7& 884
Barhi .. 565 445
Barkatha 549 494
Bagodar 531 458
Bishungarh 561 486
Haozaribagh 457 236
Katkamsandi 540 454
Iohak .. 531 272
Barkagaon 570 362
Keredari 625 485
Tandwa .. 584 404
lrlandu •• 621 422
Nagri (Churchu) 618 409
Ramgarh 595 330
Jainagar 571 413
Gola 612 377
Gumia •• 599 381
Namber 01 workers per 1.000 males and female. In .ab-dlviliOns and anebals 01 Basarlbagb dlatrlot. 198t-ooMOld.
Number of workers
Dietriot/subdivi'ionjAnchal per 1,000 population r--~-.
Malee Females
1 2 3
Peterbar 577 341
Kasmar 588 486
Jaridih 589 254
Kodarma 592 302
Markaoho 577 527
Patratu 662 298
Chatra Subdivision &6& 8'9
Chauparan 549 345
Itkhori 547 404
Bunterganj 54li 234
Pratap Pur li80 333
Chatrs •• 541 350
Simaria 580 422
GJrldib Subdivision &71 488
Gawan •• 579 456
Tisri 627 liI4
Satgawan 542 456
Jamua •• 554 514
Deori .. 588 539
Dhanwar lill 370
Birni .. 524 501
Giridih 541 207
Bengabad 591 578
Gande 604 464
Dumri •• 575 513
Nawadih 601 543
Pirtanr .. 592 470
Bermo •. 599 271
So far as male participation is concerned, there is not muoh variation among the subdivisions. The rates vary between 555 in Chatra subdivision and 575 in Sadar subdivision. Among the anchals, the variations are wider. Patratu anchal has the highest participation rate (662) and Hazaribagh anohal the lowest

xliv
(457). Eight anohals ha~e male' participation rates above 600 and the remaining except Hazaribagh have rates varying between 000 and 600.
Among females, the fluctuation is greater still. The rates vary from 207 in Giridih anchal to 578 in Bengabad anchal. Significantly enough, both the anchals are contiguous to each other. Only 8 anchals have female participation rates above 500. As many as 17 out of the remaining 34 anchals have female
participation rates, varying between 400 and 500, and 10 have rates varying between 300 and 400. The remaining 7 anchals have rates below 300.
Workers by Age groups
The following statement shows the percentage of workers in each broad age group in Hazaribagh district and Bihar State, separately for persons, males and females :
Percentage of workers in IIroad age groups In Hazarlbagh district and Bihar state, 1961
PERCENTAGE 01' WORKERS
r-----------------.---A--------------------~ Hazaribagh district Bihar State
Age groups r----. ---"--------'\ r--------'------" Persons Males Females PerSOns Males Females
All ages
0-14 15-34 .. 35-59 .. 60+ .. Age not stated
1
The proportion of child workers (age grcmp 0-14) in Hazaribagh is higher than that in the State both for boys and girlS'. Since the overall participation rate is higher in Hazltribagh, the proportion of workers among ymmg and middle aged persons are also higher. It is, however, seen that as in .. the State, the age
. group 35-59 contains the largest proportion of workers in Hazaribagli J),S well. This is easily explained by the faet that the age group 15-34 includes a considerable proportion of students as well as job seekers who have been treated as non-workers.
It may be noted that except for males in the age group 60 + the proportions of workers in all the age groups and for both sexes are higher in Hazaribagh than in the State. ~he above statement, therefore, simply underlines the higher participation in Hazaribagh district as compared to the Bihar State in the t()tal population as well. as individual age· groups. The differences are particularly striking in the case of females.
Workers' by Literacy and Educatlonal levels
The statistics appearing alongside give an idea. of the distribution of workers by literacy lind
2
48.42
10.49-77.94 82.75 51.00 36.97
3
57.10
11.79 91.43 97.63 79.06 51.24
4
89.65
9.13 64.83 67.17 27.08 18.59
5 6 7
41.40 55.60 27.12
7.84 9.64 5.94 63.90 87.65 41.39 73.29 97.40 48.34 50.26 82.26 23.09 42.84 56.13 22.25
educational levels for Hazaribagh district and Bihar State. Workers 111 lIteraey and educational levels in Halarilla,h
district and Bihar state, 198"1
Percentage of workers in
Educational revel I ----~ Hazaribagh Bihar
district State
1 2 3
Total workers 100.00 100.00
llliterate 84.04 78.45
Literate 15.96 21.55
(i) Literate (without educational 11.31 15.84 lewl)
(ii) Primary or Junior Basic' .. 3.13 3.86
(.i~) Matriculation and above .. 1.52 1.85
It has been observed earlier that the extent of literacy in Hazaribagh district is lower than that in the State. This is true in regard to workets also, as would be evident from the aoove table.
,Status of Employment
Workers in industrial categories III and V to IX have been classified further by four kinds

xlv
of employment status, viz., employer, employee, single worker and family worker. An employer is a person who has to employ other persons in order to perform the work in which he is engaged. An employee is a person who usually works under some other person for salary or wages in cash or kind. A single worker is a person who works by himself, i.e., he is not employed by anyone nor does he employ anyone, not even members of his household except casually. A family worker is a member who works without receiving wages in cash or kind in some industry, business or trade conducted mainly by members of the family and ordinarily does at least one hour of work every day during the working season. For further elucidation of these terms a reference may be made to the flyleaf to Table B-IV Part B •. The statement below shows for 1961 the distribution of 1,000 workers (other than those in agriculture and household industry) in Hazaribagh distriot and Bihar State by eplployment status:
Distrlbuiion of 1,000 workers (other than tb~e In agricul. ture aD(d ooJ1sehold industry) in Hazarlbagh district and Bihar state b, em,l~ment status, 1961
Class of worker
1
Total workers
Employers Employees Single workers Family workers "
NUMBER PER 1,1)00 WORKERS ~ _____ -A-______ ~
Hazaribagh district Bihar State r----->--A.--~ r---"------~ Total Rural Urban Total Rural Urban
2 3 4 5 6 7
1,0001.000 1.000 1.000 1,000 1.000
37 22 75 41 30 67 696 699 689 463 407 590 217 231 180 377 419 280
50 48 56 119 144 63
Employers and employees account for more than 73 per cent of the total workers (other than in agriculture and househ.old industry). This shows the comparative progressiveness' of the district in regard to employment, in large industrial establishments or other business concerns. It is significant to note that employees comprise the main bulk both in rural and urb~ areas of the district.
Households and their Economic Activities
It is well known that the main economic activities of households in Hazaribagh as in the State are cultivation and household industry. The information oollected on the basis of Individual Slips has, therefore, been supplemented in 1961 by further data in Household Schedules ----------.Census of India, 1961, Bihar, Vol. IV, Part II·B(i),
General Economic Tables.
on the aforesaid two economic aotivities of the household as a unit. Tables B-X, B-XI, B-XVII and 0-1 given in this volume are based on 20 per cent sample of Household -Schedules. Other Household Economic Tables have been published in Parts II;l(i) and III(ii) of the 1961 Census Publications relating to Bihar.
The following statement gives th~ distribution of sample households according to their participation in cultivation and household industry:
Distribution 0' hpuseholds in H,azaribagh district and Bihar state b, tllei, eatllDomlc a~tilVitr, 1961
Razaribagh district Bihar State Kind of activi ty r-----_,._---~ r------------"-----~
Total Rural Urban Total Rural Urban
1 2 3 4 5 6 7
All Households .. 100 100 100 100 100 100
Rouseh olds enga!ed-
{i) Neither in cuI· 20 15 78 28 23 81 . tivation norin
household in· dustry.
(ii) In cultivation 71 75 18 64 68 13 only.
(iii) In household 1 1 3 2 2 5 industry only.
(iv) Both in culti· 8 9 1 6 7 1 vation an d
household in· dustry.
Cultivating households with or withbut household industry comprise as much as 79 per cent of the households a proportion which is much above the State average of 70 per oent. It may be noted, however, tha.t these figures do not tltke into aocount households whose members work merely as agricultural labourers. In rural areas the proportion of cultivating households is naturally higher (84 per cent).
-20 per cent of the households in the district
ate engaged neither in cultivation nor :ir). household industry. This proportion is lower than the average for the State (28 per cent). A mere- 1 per oent of the households in the I district is engaged in household· industry only. The corresponding proportion for the State as a whole is 2 per cent. Taking into consideration the households engaged in household industry with or without cultivation, it is observed that the extent of participation is higher in rural areas of the district than in the State.

xlvi
Nature and Size of Land holdings
90 per cent of the cultivating households in Hazaribagh district cultivate lands owned by them. Only 1 per cent of them cultivate unowned lands held from private persons or institutions for payment in money, kind or share. This category evidently includes households of leaseholders and sharecroppers. The remaining 9 per cent have mixed tenancies in the sense that they cultivate lands partly owned by them and partly held from others. The possibility of concealment in furnishing information relating to the extent of sharecropping cannet be ruled out completely. In the State as a whole 68 per cent of the households cultivate owned land while 7 per cent cultivate lands held from private persons.
The following statement shows the distribution of sample cultivating households in rural areas by the size of land cultivated by them:
households in rural' areas of the district have less than one acre of land each and little less than half (49.43 per cent) have less than 2.5 acres each. 7.20 per cent or approximately 1 out of every 14 cultivating households has holding of 10 acres or more. Holdings over 50 acres are owned 'by a minutiae of 9.17 per cent of the households.
Non-workers
Table B-IX at page -46 gives the classification of non-workers by different kinds of activity. It is to be noted that 51.6 per cent of the population in Hazaribagh- district consists of non-workers. This proportion is below the State average of 58.6 per cent. For obvious reasons, the proportion Of non-workers among male (42.9 per cent) is much lower than among females (60.3 per cent). An idea of the different categori~s of non-workers can be had from the following statistics ;
Distrlbuton or cultivating households in rur.. areas of D(~trlbutlon of 1,000 non-90rkel:$ in Hasaribagh district H81Arlbagh dlstriot and Bibar state", size 01 their and Billar state b:v the- kiDij of th.lr alltlvit" 1961 hOldings, 1961
Percentage of cultivating Nmm:mB PBB 1,000 NON-WO:RUBS
,....---"------'""\ households to total culti· Hazaribll€hdistrict Bihar State
vating households Kind of activity r-__'______' in rural areas Per· Males Fe. Per. Males Fe·
Size ofland (in __,,___~ sons males sons males acres) Hazaribagh Bihar
district State 1 2 '3 4 5 6 7
1 2 3 1. Full time students 110 222 30 126 273 36
All sizes 100.00 100.00 2. Household duties 190 1 325 270 3 435
Less than 1 15.04 21.51 3. Dependent~ in· 692 761 642 596 709 526
1.0-2.4 34.39 26.65 fants and disabled
4. Retired, renUer or 2 2 2 2 3 1 2.5-4.9 26.58 23.34 indapendent meanS
5.0-7.4 12.69 12.20 5. Beggars, vagrants. 1 2 1 2 3 2
7.5-9.9 4.02 5.10 etc.
6. Inmates of penal. 1 2 N 1 2 N 10.0-12.4 3.27 3.70 mental and chari·
12.5-14.9 0.97 1.80 table institutions
7. Persons seeking 2 5 N 2 4 N 15.0-29.9 2.44 4.21 employment for
30.0-49.9 0.35 1.01 the first time
8. Persone employed 2 Ii N 1 3 N 50+ 0.17 0.42 before but now
Unspecified 0.08 0.06 out of employ. ment and seek·
76.01 'Per cent of the households in Haza.ri- ing work
bagh have holdings below 5 acres of land. The N-denotes negligible figures.
corresponding proportion for the State is lower Dependents, infants or disabled persons (71.50 per cent). A little more than one-
seventh (15.04 per cent) of the cultivating comprise the largest component of non-workers
xlvii
both in the district (69.2 per cent) and the State (59.6 per cent). The next importa.nt category among males consist of full tihle students who, in Hazaribagh district, aCCOtmt for oV'er one-fifth (22.2 per cent) of the nOnworking population. This proportion is below the State average of 27.3 per cent. Among females, 32.5 per cent of the non-workers in Hazaribagh district are engaged in household duties. This proportion again is lower than the State average of 43.5 per cent. The proportion of inmates of penal, mental and charitable institutions in Hazaribagh is of the same order as in Bihar while that of beggars, vagrants, etc., is lower in the district.
The figures relating to unemployed perSOns give the impression of well-nigh full employ-
ment in the district as well as the State. An explanation for this unusual feature will become obvious if the basis of economic classification at the 1961 Census is taken into account. Much of the unemployment in this country, particularly in rural sector, is in the nature of under employment. A reference to the concepts and definitions discussed earlier would show that most of the under employed persons would have been returned in the census as workers. Even students and other categories ordina.rily listed among non-workers would have figured as workers if engaged in some kind of work or other. N on-workers, by definition, are only those who are not engaged in any kind of economic activity. The number of such persons is naturally very small and limited.
17. VlTAL STATISTICS
System of Registration
Vital Statistics in Hazaribagh, as in other districts of the State, are collected under the Bengal Births and Deaths Registration Act, 1873, which makes the registration of births &,nd deaths compulsory. This Act extends over the whole of Hazaribagh district. In the Pftst, village Ohowkidars were the primary reporttng agency in rural areas. Their reports Were routed to the State level through the officers incharge of police stations and Civil Surgeons. 1:he system worked fairly well in the past hut started deteriorating steadily since 1931. It nearly broke down in several areas in the last decade. The year 1959-60, therefore, saw a far-reaching change in the system as the Gram Panchayats were brought in the picture. ~he Panchayat Sewak is now the primary registering authority, though he still continues to get the return from village Chowkidars. He paElses on the information to the Junior Statisttcal Supervisor at the block level who scrutintses and compiles the data for the block as a whole. At the district level, the District Statistical Officer does the necessary processing. In municipal areas, the municipal body is supposed to maintain the necessary record, and transmit the information to higher authorities. Finally, these data are processed at the State level by the Directorate of Statistics at Patna. Since the beginning of 1965, however, compilation of data at the district level has been given up and the JUIlior
Statistical Supervisors now send reports direct to the State headquarters for further processing.
The Decade, 1951-60
During the decade 1951-60, 149,628 male and 132,945 female births were registered in the Hazaribagh district. During the same period, 87,146 male and 71,887 female deaths were reported. The natural increase in the de facto population of the district thus works out to 123,540 persons (62,482 males and 61,058 females) in the decade, as against the observed increase of 459,201 persons during the decade. It has been noted earlier that the balance of migration in Hazaribagh district in 1961 was favourable. Though information about emigrants from Hazaribagh to other States or outside India is not available, it gained as rmany as 19,001 persons in 1961 as a result of the difference between immigrants from and emigrants to other districts of the State. In 1951, however, the position was otherwise. The district lost 4,660 persons as a result of balance of migration. It is evident, .therefore, that the actual increase in Hazaribagh population in the last decade was 440,200 persons, keep.ing out of consideration immigrants to and emigrants from Hazaribagh in relation to other States of India and countries outside India. A comparison of this with the registered figure of 123,540 would give a measure of the inadequacy of vital registration data.

xlviii
18. NATURAL CALAMITIES The following is a chronological list of severe 1918-19-Scarcity 1946-Flood
1949-Hailstorm
1951-52-Drought 1952-53-Distress
natural calamities in the district: 1934-Earthquaka
1874-Distress 1897-Distress
1908-Famine and scarcity 1913-Flood
1935-38-Distress 1943-Epidemic
19. AGRICULTURE AND IRRIGATION
Table AS-III at page 158 gives the statistics on land utilisation. Out of a total area of 44.71 lakh acres, the cultivated area' (consisting of net area sown and current fallows) is 11.92 lakh acres or about 26.7 per cent of the total area. This represents a decrease of 0.02 lakh acres over the cultivated area (11.94 lakh acres) in 1951, due largely to an increase in the area under 'land put to non-agricultural uses" by about I3,OOO acres:
The per capita availability of land in the district has declined from 2.31 acres in 1951 to 1.87 acres in 1961. However, this is very much higher than the corresponding State averagl3 of 0.92 acre in 1961. A better idea of the pressure of population on land can be had by ~onsidering the proportion of net area sown to the total population. This is termed as agricultlIral holding ~er capita. The agricultural holding per capita in Hazaribagh district is 0.36 a,cre compared to 0.43 acre for the State. It was 0.46 acre in Hazaribagh in 1951. The average size of agricultural h01ding per cultivating household is 4.04 acres in Hazaribagh as against 4.85 acres in, the State. Thus, Hazaribagh is lagging behind in regard to availability of agricultural land. Even in regard to intensity of cropping, the index for Hazaribagh is 124.8 as against 138.3 for the State (assuming net area sown to be 100). Only four districts Monghyr (124.4), Palamau (122.9), Sahf:trsa (117.9) and Ranchi (114.7) havelower inteulSity of cropping than Hazaribagh. For analysie. of intensity of cropping, the figures of gross \Lnd net area sown relating to the year 1960-61 as printed in the Bihar Statistical Handbook, 1960 have been taken into account.
Rice is the main crop of the district. It accounts for 58.4 per cent of the ~ross ltrea sown. Wheat covers only 1 per cent of the gross area sown. Sugarcane is grown in less than 1 per cent of the area. Non-food c:('ops embrace 5.4 per cent of which 5 per cent is covered by oil-seeds. The cropping pattern in detail is L'1dicated in Table AS-III at page 158 and its subsidiary tables at pages 163-167.
The gross area irrigated in the district has increased from 0.59 lakh acres in 1951 to 1.29 lakh acres in 1961, i.e., an increase of over us per. cent. It would appear from Table AS-Vat page 159 that prior to 1961 the area irrigated by Government canals was nil. In 1961 an area of 4.2 thousand acres was irrigated by ,Government canals in the district.
After independence in 1947, considerable attention has been paid to the provision ofirrigation facilities in the district. Several major schemes have been taken up by the Damodar Valley Corporation. Among them mention may be made of Jurga Irrigation Scheme, Chharwa Dam and Gondo Da.m. Besides, irrigation facilities have been extended in the district through 62 medium irrigation schemes, 766 minor irrigation schemes, 3,779 wells, 177 rahat pumps, 130 electric pumps, 60 open boring tube-wells and 50 Bihar hand pump,s.
Notwithstanding the expansion of irrigation facilities and provision of other facilities such as improved seeds, more fertilisers and better agricultural practices, the yield rates of principal crops (Table AS-VI a.t page 160) do not show commensurate increase. Wide variations are noticed from year to year. These may be due to several gaps in the available data and it will be hardly safe to draw any firm conclusion.
Every 100 acres of net area sown in the district provide employment to 92 cultivators and 13 agricultural labourers. The latter consist mainly of field workers whose daily wages during khari/ season appear to have decreased from Rs. 1.37 in 1951 to Rs. 1.12 in 1960 for males and from Rs. 1.06 in 1951 to Re. 0.83 in 1960 for females. 'Children got Re. 0.69 in 1951 and Re. 0.53 in 1960 per day. Table AS-VII' at page 161 gives data relating to, average daily wages. It needs to be stated here that some of the trends revealed by these statistics are prima facie unacceptable. Judging by common experience one is inclined

xlix
to think that the daily wages of labourers, including those in agriculture, have been going
up. But the above figures tell a different story.
20. LIVESTOCK
The term 'livestock' includes cattle (cows, bulls and bullocks), buffaloes, sheep, goats and pigs, while -poultry refers to fowls and ducks. Table LVT-II at page 168 shows the population of these categories with their variations from 1920, as ascertained by quinquennial censuses conducted by the Animal Husbandry Department of the State Government.
The total livestock population of lIazaribagh district in 1961 was 2,085,873. It ranks fifth among the districts of Bihar in livestock population. The four districts having higher livestock population than the district of Hazaribagh are Santal Parganas (2,870,213), Purnea (2,651,806), Ran chi (2,252,570) and . Gaya (2,214,258). It is significant to observe that there was an increase of over 1.5 lakhs in the cattle population of the district in the last quinquennium (1956 -61) which 'Was more than two-fifths of the net accretion during the last 40 years (1920-61). This is obviously an indication of general prosperity among the agricultural classes in the district during the period. The proportion of bulls or bullocks to cows excluding young stock is roughly 7 : 5.
It is interesting tonote that almostfor every 4 heads of cattle in the district there was 1 buffalo.
Commg to poultry, the available data relate to the period 1945 onwards. It is at onoe evident that their population has been steadily increasing. The total poultry population of 756,152, consisting almost entirely of fowls, in 1961 marked an increase of 174,905 or more than 30 per cent during the quinquennium 1956-61.
Table LVT-I at page 167 gives the number of veterinary hospitals, dispensaries and veterinarians in each year of the last decade. The district has 2 hospitals and 43 dispensaries. These are manned by 42 veterinary surgeons. Though the number of veterinary dispensaries has risen from 8 to 43 in the last decade, even the present number seems to be small for the large livestock popUlation of the district. On an average, one veterinary hospital/dispensary is available for almost 1,552 sq. miles'of the district and one veterinary surgeon for every 26,607 heads of cattle.
21. INDUSTRmS
Registered Factories
According to records maintained by the Chief Inspector of Factories, Bihar there were 359 registered factories in Hazaribagh in the year, 1960. They provided employment, on an average to 17,652 workers daily. As many as 227 registered factories were located in towns and the remaining 132 in villages. There were 170 mica factories in the district of which 121 were located in urban areas and 49 in rural areas. Flour mills numbered 62 (35 in rural areas and 27 in urban areas) while there were 29 rice mills (26 in rural areas and 3 in urban areas) in the district. Among the large industrial establishments of the district, mention may be made of the (i) Domchanchi Main Factory of C. M. I. Ltd., P.O. Domchanch, (ii) Tisri Factory of C. M. I. Ltd., P. O. Tisri, (iii) Thermal Power Station, D. V. C., Bokaro, (iv) Indian Explosives Ltd., Kamar Road, Gomia, (v) C. M. Rajgarhia Giridih Factory, No. I, P. O. Giridih,
(vi) C. H. Private Ltd.'s No. III Mica Factory, P. O. Jhumri Telaiya, (vii) The Indian Mica Supply Co., Ltd., Giridih Factory, P. O. Giridih, (viii) Power House, Giridih Collieries, P. O. Baniadih, (ix) Inderchand Rajgarhia & Sons Ltd., Kalimanda Road, P. O. Giridih, (x) C. M. Rajgarhia Giridih Factory, No.3, qiridih, (xi) Bharat Mica Industries Private Ltd., at and P.O. Giridih, (xii) Giridih Factory of C.M.I. Ltd., P. O. Girldih, (xiii) Ghoranjee Factory of C.M.I. Ltd., at and P. O. Ghoranjee and (xiv) Government Reformatory School, whorkshop at and P. O. Hazaribagh.
Houselist figures of IndU'Strial Establishments
During the houselistihg operation preceding the 1961 Census, an attempt was made to aSSess the number and nature of industrial establishments, registered or otherwise, engaged in any kind of «production, processing, repair or servicing or where goods or articles are made and

sold". The enquiry revealed that Hazaribagh had, in all, 14,800 industrial establishmenti3-12,653 in rural areas and 2,147 in towns. The manufaoture of mioa products accounted for the largeSt number (4,803), followed by man.u-
1
facture of earthenware and earthen pottery (2,083), blacksmithy (1,038) and making of textile garments (998). The following statement gives the subdivisionwise break up of five major industries in the district:
Maj or industrial elta bllshments In Hazarlbagh district by subdivisions accordln, to houaellstln: ID 1960
Number of industrial establishments Serial Industrial
no Code no.
1 2
1 348
Particulars of industry
3
Manufacture of mica products
~--- ._ ------~ HlIo2lari· Badar Chatra Giridib bagh 8ubdivi. subdivi· subdivi.
district sion sion sion
4 5 6 7
4,803 514 17 2 350 Manufacture of earthenware and eartli.en pottery ••
~ufactureofsundryhardwares such &.s G.I,.pipe, wire, net, 2,083 818 274
4,272 991
3 369 1,038 474 130 434
60 460 bolt, screw, bucket, outlery.
4 273 Making of textile garments including raincoats and headgear 998 478 Production of other food products such as sweetmeat and 5 209 984 481 76 condiments, muri. murki. chirtJ, kIioi, cocoa, chocolate, toffee,
427
lozenge.
Household In,dustrles_
In view of the importance of household industries to the economy of this country, the number of persons engaged in household- industrieS waS separately recorded and tabulated in the Census of 1961. A household industry Was defined thus:
"An industry oonducted by the head of the household himself and/or mainly by members of the household at home or within the village in rural areas and only at home in urban areas. The industry should not be at the scale of a registered factory. A household industry would relate to production, processing, servicing and repairing and in. cludes making and selling of goods.~'
In the district of Hazaribagh .. 44,938 persons were found engaged in household industries. Their break up industrywise can be found. in Table B·IV Part C •. They comprised 3.87 per cent of the total working popUlation of the district. The number of persons engaged in
the five numerioally important household industries is given below :
Serial Industrial No. of
Particulars of industries persons no. Code no. at work
1 2 3 , 1 040 Production and rearing of live. 8,251
stock (large heads only) main. ly for milk and animal power such as cow, bUPalo, goat.
2 348 Manufacture of mica products 6,501 3 288 Manufacture of materials from 6,003
cork, bamboo, cane, leaves and other allied products.
4 360 Manufacture of earthenware 4,805 and earthen pottery.
5 209 Production of other food pro. 2,210 ducts such as sweetmeat and oondiments, "'1Iri, fIIttrki, cMra, ""oi, ooooa, ohooolate. tofFee, lozenge.
The great importance of livestock raising and of mica splitting from the point of emplcyment in the district is at once evident. Manufacture of materials from cork, bamboo, cane. leaves, etc., making of earthenware and pottery and halfDai/bhansari establishments are also quite significant.
22. TRADE AND COMMEBCE
Trade in Hazaribagh distriot consists mainly of exporting mioa, coal, limestone, lac, timber, katlw, (catechu), biri leaves, glass, cutlery go()ds, potallO, hides, etc., and of importing of sugar,
-Census of India. 1961, Bihar, Vol. IV. Part n·l3(i), Qeueral Eoonomio Tables.
potato, fruits, vegetables, rice, paddy, wheat, pulses, gram, mustard. oil, kerosene oil, etc.
According to the 1961 Census, 18,1'23persons or 1.56 per cent of the total working population of the district were found engagta in trade and commerce.

Ii
Their distribution by sex and class of workers is as follows :
Class of worker Males Females
Total parlons at work In tr~. and 11,683 1,6.1 commerce.
As employer 3,881 102
As employee 2,925 45
As single worker 6,960 999
As family worker 2,816 395
According to the house lists prepared on the eve of the 1961 Census, Hazaribagh had 12,811 shops, business houses, etc., excluding eating houses. Their break up and proportion have earlier been discussed in Section 14 on Housing.
A list of banking offices will be found in Table ADM-X at page 182. It will be seen that besides Hazaribagh han king facilities exist in Giridih, Koderma, Ramgarh and Bokaro with a branch office of the State Bank of India in each.
23. POWER
The district receives most of its power supply from the State Electricity Board, which has its power house located at Chatra.
All the ten towns of Hazaribagh district have electricity now. In rural areas, however, the pace of electrification is comparatively slow. Out of 6,162 inhabited villages in the district, only 130 villages were electrified up to 1960-61. Up to 31st March, 1965, 85 more villages were electrified. The total sale of electric energy by the Bihar State Electricity Board in Hazari-
bagh distlict during 1960-61 was 448.0 lakh KWH. Its break up is given below:
Nature of consumption
1. Domestic or residential 2. COJDDlercial 3. Industrial Power-
(a) Low and medium voltage (b) High voltage ..
4. Public lighting 5. Irrigation.. •. •. 6. Public water works and sewage pumping
S01]BCE : Bihar State Electricity Board.
KWH (in lakhs)
20.0 29.0
95.5 292.5
2.3 1.0 7.7
24. LAND REFORMS AND REVENUE ADMINISTRATION
There were seventy revenue paying estates, one temporarily settled eatate (Karharbari colliery), four GoV'ernment estates and 212 revenue-free estates in the district of Hazaribagh at the time of the last Revisional Settlement (1906-1909). Before the enforcement of the Land Reforms Aot, 1950, the distriot had 84 reV'enue-paying estates, 4 Government estates and 266 revenue-free estates besides one rentfree land borne on the Touzi Roll in 1949-50. The temporarily settl€.d estate of Karharbari colliery has since been removed from the Touzi Roll. The land revenue payable and the demand from the Government estates were Rs. 47,260 and Rs. 51.354 respectively.
With the enactment of the Bihar Land Reforms Act, 1950 and its subsequent amendments, all the estates have veste'd in the State. In the beginning, the estates and tenures of big proprietors having an income of aboV'e Rs.50,OOO each were taken over. Later, in pursuance of Government notification no. 631-LR, dated. the 26th January, 1955, all intermediary interests also vested In the St~te.
With abolition of zamindari in the district a va.st machinery had to be built up for the collection of rent and management"ofland . .It comprises at present of an Additional Collector, 3 Land Reforms Deputy Collectors (one in each subdivision), and 42 Anchal Adhikaris and Circle Inspectors (one for each of the anchals). The Collector and the Subdivisional Qfficer head the revenue administration at the district and subdivisional levels respectively. At the village level, there are Karmacharis for each of the halkas (on an average, 8-12 hal1ca8 constitute an anchal). The Karmachari is required to collect rent from tenants, look after Government properties such as Government hat8, haUff'S, tanks, treeS, etc., make enquiries in mutation and other caseS, report encroachment on Government lands orillegal cutting of trees, etc., and such other duties connected with the land· reVenue administration. His work is supervised by the Circle Inspector, Anchal Adhikari and other superior officers. In suitable caSeS, the work of rent colleotion has been entrusted to Gram ranchayats also,

The following ta.ble shows the revenue demand of the district:
Period
Aller vesting of estates with Income of RI. 60,000 and abov8-
Demand in rupees
1951-52
1952.53
1953.54
1954.55
} .. Not available
1,778,394.00
Iii
Period
Alter totaJ vestJDI-
1955·56 1956·57 1957·58 1958·59 1959·60
Demand in rupeea
2,125,940.00 2,258,812.00 2,614,255.00 3,438,811.00 3,063,634.00
These figures relating to 1954-55 and onward include cess and miscellaneous demands, besides rent.
25. PUBLIC HEALTH AND MEDICAL FACILITIES
.Public Health
The preV'entive and curative branches Were combined in the early fifties to ensure better co-oraination and control. The Civil Surgeon of the distl'ict was, therefore, re-designated as the Senior Medical Executive Officer of Health who is now incharge of the entire medical and public health programme in the district.
He is assisted by a :pi strict Medical Officer of Health and Assistant Health Officers on the preventiV'e side and Deputy Superintendent of Hospitals and Civil Assistant Surgeons attached to GoV'ernment Hospitals on the curative side.
Cholera and smallpox often break out in the district in epidemic form. However, as revealed by Table VS-II at page 152 deaths from cholera during the decade 1951--60 Were 2,387 and from smallpox, 2,663. Plague was almost extinct. Fever accounted for a large number of deaths but much of it was due to a tendency on the part of the reporting agency to put aU deaths which cannot be classified under any other disease, under this head. Thanks to the Anti-Malaria Campaign launched by the Government, the number of deaths from malaria has almost come down to nil.
Medical Facilities
There are eight full-fledged hospitals in the district, including the district and su'bdivisional hospitals. Besides these, there are 42 dispen-saries of which 26 are State managed and 16 belong to Distriot Board. There are also 22 priV'ate hospitals and dispensaries. In addition, there are 26 Primary Health Centres. Only the Hazaribagh Sadar Hospital has a Family Planning Centre. Maternity and Child Welfare
Centres are locatEd at Chatta, Giridih, Hazarihagh and Peterbar. T.B. Centres/Clinics are located one each at Hazalibagh, Koderma and Chatra.
Only 735 beds are provided in the hospitals and dispensaries of the district. This gives a ratio of 1 bed for every 3,260 persons. Similarly, there is on an average only 1 hospital or dispensary to serve an area of about 140 sq. miles. 22 private hospitals and 26 Primary Health Centres have not, however, been taken
. into account for these calculation.
The di&trict has 159 allopaths and 232 homeopaths in rural areaS besides 264 Vaidya8 and 22 Hakim8. Thus, there is one mEdical practitioner for every 3,243 persons in the rural area of the district.
Table PH-I at page 186 gives the details of medical facilities. In Part A of the table is shown the number of degree or diploma holding medica.! practitioners registerEd in the district each year during 1951-60.
The number of persons engagEd in medical and public health work, as returned at the 1961 Census is given below:
Family of Desoriptiona Malt's Fe-National Per·
Classifica. aons males tionof occups.·
tions
1 2 3 4 5
030 PhysiCians and Surgeons, AI· 164 150 14 lopathio.
031 PhysicianS, Ayurvedic 141 102 39
032 Physicians, Homeopathio 119 118 1
033 Physicians, Others 193 188 5

Uii
Family ot Family of National National Ciassifioa. Per· Male. Fe· CJusifioa· Per. Male. Fe-tlon of D&BorJptions BODS males tion of DeaoriptionB BOnl male. ocoupa.
tioDs ocoupa.
tiona 1 2 S 4 5 1 2 S 4 5
034 Physiologists 7 7 045 Physiotherapists, Masseurs and Related Technicians.
2 2
035 Dentists 4 4 046 Sanitation Technicians 213 207 6
039 Physicians, Burgeons and 40 40 Dentists, D. e, c, 047 Opticians 2 2
040 Nurses 195 11 184 049 Medical and Health Teohni· 233 230 3
041 Midwives and Health Visitors 346 5 341 cians, n.e.c. (eXCluding Labo. ratory Assistants).
042 Nursing Attendants and Re. 198 164 34 lated workers. Details of ~heir employment by industrial cate-
043 Pharmacists and Pharmaceu· 244 235 9 gories are given in Table B-VofPartII-B(ii}, 1961 tical Technicians. 044 Vacoinatofs 89 89 of this State.

BRIEF GAZETTEER OF PLACES IN HAZARIBAGH DISTRICT [Compiled trom village notes prepared by enumerators during the 1961 ~us; acouracy of the information has
not been checked in every case.]
Baehra
A large village (population 2,658), situated on the right bank of the Damodar river, about half a mile north-east of Rai railway station. The village has important coal-mines worked by the National Coal Development Corporation, and also some limestone quarries.
Bagodar
A large village (population 3,193), situated on the Grand Trunk Road, about 9 miles west of Hazaribagh Road railway station. It is the headquarters of an anchal, connected by road to Hazaribagh town which is 33 miles away. It has a Basic Training School, a dispensary, a Dak Bungalow and post and telegraph office. A white marble statue of the late Prime Minister Sri Jawaharlal Nehru, has been set up at the junction of the Grand Trunk and Hazaribagh roads.
Bahera
A small village (population 531), situated 4 miles north of Rai railway station. Has a colony of workers of the National Coal DbveLopment Corporation. The Damodar river flows to the south of the village.
Baidadih
A small village (population 241), situated near Maheshmunda railway station on the Madhupur-Giridih section of the Eastern Railway. Noted for its large well, whose water contains important minerals, and is transported to Calcutta and other places for medicinal use. A large annual fair is held in the village on the occasion of La.kshmi Puja.
Bairia
A medium-sirz;ed village (population 1,911), situated 6 miles north-west of Kharagdiha on the Kharagdiha-Tisri road. Noted for its large weekly market.
Baniadih
Situated 10 miles north-west of Dhanbad, it is an important coal-mining (lentre under the National Coal Development Corporation.
Barganda (Barahganda)
A small village (population 290), situated 8 miles north of Dumri, and the temporary headquarters of Dumri apchaI. Investigations have been carried out by the Geological Survey of India for deposits of copper.
Barhi A very large village (population 4,291),
situated 14 miles south of Kodarma railway station on the Grand Trunk Road, at its junction with Patna-Ranchi road. It has a Hydroelectric Power Station of the Damodar Valley Corporation.
Barkagaon A very large village (population 4,044),
situated 16 miles north-west of Hazaribagh town on the road to Tandwa. Headquarters of an anchal, it has a post and telegraph o1lice.
Barkakana A railway junction on the South Eastern
Railway. A central workshop of the National Coal Development Corporation has been established here.
Barkatha (Barah Katha) A large village (J;lopulation 2,256), situated
on the Grand Trunk road, 16 miles south-east of Barhi and 25 miles north-west of Hazaribagh Road railway station. The headquarters of an anchal.
Barughutu A very large village (population 6,746),
situated 19' miles east of Maildu. It has coal washery of the Tata Iron and Steel Company, employing about 4,000 workers.
Baruni Hill Situated 19 miles east of Kodarma, on the
Kodarma-Giridih road. It has a G.T. Survey Station in village Khokhar.
Beko A small village (population 230), situated
13 miles north-west of Birni. It has a hot

Iv
water spring known a.s Suraj KUlld. Its water is efficacious in the treatment of skin diseases.
Belgara
A small village (population 490), situated 3 miles west of SimarIa on the HazaribaghChatra road. Noted for its large cattle fair held annually.
Bendro
A small village (population 317), situated 4 miles south-west of the anchal' headquarters at Gawan. The village is noted for its production of ruby mica-mine renowned all over the world.
Bengabad
" A medium-sized village (population 1,034), situated 6 miles north of Maheshmunda railway station. Headquarters of an anchal, it has a post and telegraph office. It is connected by road to Giridih which is 11 miles away.
Bermo
A small town (population .13,813), the headquarters of an anchal and a rail-head on the Gomoh-Barkaka.na section of Ea.stern Railwa.y. It is an important coal-mining centre.
Bhurkunda
A rail-head on the Barkakana-Dehri-on-Sone sect,ion of the Eastern Railway. The IndoAshahi Glass Factory and several collieries of National Ooal Development Corporation are located here.
BlrDl
A small village (poPJdation 400), situated 19 miles east of Ha$&ribagh Road railway station. The headquarters of an anchal, it has a post and telegraph office.
Bishungarh
A large village (population 2,102), situated 16 miles south-west of Hazaribagh Road railway station. The headqu8.rters of 8.n 8.nchal, it has a post and telegraph office.
Bokaro
A small town (population 5,406), situated on the Bokaro' river near its confluence with the KODar river. Noted for its Thermal Power Station set up by the Damodar Valley Corporation. It has its own water and electricity supply system, a hospital and schools.
Chandaurl
A large village (population .2,.219), situated on the northern bank of rivel" Sakri, about 5 miles north of the anchal headquarters at Tisri. Noted as a centre for the mica splitting industry in which about 600 workers are engaged.
Chauparan
A medium·sized village (population 1,195), situated on the Grand Trunk road 1.2 miles north-west of Barbi. Headquarters of an anchal, it has a post and telegraph office.
Chatra
A medium-sized town with a population of 12,507 persons and the subdivisionalheadquarters, situated 43 miles north-west of Hazaribagh. Noted for its large cattle fair held annually on the occasion of Durga Puja and lasting for 19 days.
Ohatro
A small village (population 87.2), situated near the Deoghar-Giridih road about 12 miles west of Chakai (in Monghyr district), having a large weekly market.
Chlrkl
A small village (population 843), situated on the Giridih-Bagodar road. Theheadquarters of Pirtanr anchal. •
Ohltarpur
A very large village (population 7,13..2), situated 10 miles east of Ramgarh on the rolki to Dhanbad. It has high and senior basic schools. Some collieries are worked near the village.

lvi
Churchu
A very small vi1lage (population 329), situated 12 miles south-east of Hazaribagh, near the headquarters of Nagri (Churchu) anchal. There is a.n old temple in the village arlJund which a large annual fair is held on tho occasion of Ramnavami.
Dalgando
A very small village (population 48), situated 4 miles north-west of the anchal headquarters at Bengabad. A mica belt has been discovered here. The village has a Shiva temple where an annual fair is held on the occasion of Shivaratri.
Debour
The village situated 12 miles from Kodarma on the Patna-Ranchi road, is noted for its large number of mica-mines. It has a Forest, Rest House.
Deohanda
A small village (population 327) in Barhi anchal, situated 2 miles west of the RanchiPatna ·road. Noted for an Experimental Agricultural Farm set up by the Damodar Valley Corporation.
Deopahari
A small village (population 300), situated near the D~oghar-Jamua road. Noted for its temple of Lord Shiva, around which an annual fair is held on the occasion of Shwarat7i,.
Deori
A small village (population 534), situated 38 miles north of GiriJih railway station. The headquarters of an anchal, it has a post and telegraph office.
Dhab A small village (population 941), oaituated
25 miles from Kodarma railway station. Noted for its mica-mines.
Jhanwar
. A large village (population 3,873), situated 19 miles north-east of Hazaribagh Road railway
station. The headquarters of an anchal, it has a post and telegraph office.
Dhora Kola (Ohilangia alia8 Dharhakola)
A small village (population 722), in Kodarma anchal, situated 10 miles north-east of Kodarma on the Kodarma-Giridih road. It is an important mica-mining centre. Some atomic minerals like beryl and lithium have also been found here. The village has a dispensary run by the Mica Mines Labour Welfare Organisation.
Domchanch
A very large village (population 6,761), situated on the Kodarma-Giridih road, 12 milES east of Kodarma. An important centre for mica trade. The Christian Mica and Industries Ltd. have their officfs in the village and employ about 2,500 workers in their factories. There is a higher secondary school in the village.
Dumri
A large village (population 3,250), situated on the Grand Trunk road, 2 miles west of Parasnath ra.ilway station. The headquarters of an anchal, it has a post and telegraph office.
Gande I
A large village (population 1,158), situated 6 miles south of Maheshmunda railway station. The headquarters of an anchal, it has a post and telegraph office.
Gawan
A lar~e village (population 2,303), situated on the bank of the Sakri river, about 55 mil€s north-east oi'"Hazaribagh town. The headquarters of an anchal, it has a post and telegraph office. A large weekly market is held every Wednesday.
Ghorsima
A depopulated village, situated 4 miles west of the anchal headquarters at Satgawan. Noted for its old Shiva temple around ;which an annual fair is held on the occasion of Shiva'I'atri.

Ghase
A small village (popUlation 948), situated in the north-eastern corner of the district. The temporary headquarters of Deori anchal.
Ghutua
A medium-sized village (population 1,185), situated near Barkakana railway station, 5 miles west of Ramgarh town. It has a Central Workshop of the National Ooal Development Corporation.
Gidi
A large village (population 3,605), situated 16 miles wesb of Ramgarh on the river Damodar. Noted for its coal-mine worked by the National Coal Development Corporation.
Giridih
A large town with a population of 36,881 persons. The headquarters of the subdivision. Noted for its trade in mica. It is connected with Madhupur by a branch line running for 24 miles.
Goa Waterfall
Situated 4 miles west of Ghatra, the waterfall near village Jaled is of considerable scenic beauty and draws some visitors.
Gola (Rola alias Gola)
A large village (population 4,~04), situ~ted 12 miles south-east of Ramgarh raIlway statlOn. The headquarters of an anchal, it is connected by road to Ramgarh. town which is 16 miles away.
GUmia
A large village (population 4,037), situated 45 miles Bouth-east of Hazaribagh town near Gumia railway station. The works of Mis. Indian Explosives I:td., the only one of its ~ind in the country, are located here. It IS a modern township marle up mostly of workers in the factory.
Hazaribagh
Headquarters of the district, th~ to.wn has a population of 40,958 persons. It IS sItuated
lvii
80 miles south-east of Gaya and 151 miles from Patna. It has a Reformatory School and a Central Jail. The Police Training School and offices of the Damodar Valley Corporation and other important public offices are loca.ted here, besides the usual administrative offices, and schools and colleges.
Birodlh
A small village lPopulation 935), situated 6 miles south of, Kodarma. It is a rail-head on the Gaya-Gomoh section of the Eastern Railway. A factory of the Gayday Iron and Steel Company is proposed to be located in the village.
Hunterganj Situated 31 miles south of Gaya railway
station, the village is the headquarters of an anchal. It has a post and telegraph office.
Ichak Situated 7 miles north of Hazaribagh town,
the village is the headquarters of an anchal. Formerly it used to be the headquarters of the Ramgarh Raj a.nd still has a palace. The village has Shiva temples and tanks, a high school and a post office. A bi-weekly market is held every Friday &-nd Monday.
Itkhori A medium-sized village (population 1,740),
situated 31 miles north of Hazaribagh near Hazaribagh-Ohatra road. Headquarters of an anchal, it has a post office.
Jainagar A large village (population 2,404), situated
2 miles north of Sarmatand railway station on the Dehri-Barkakana section of the Eastern Railway. The headquarters of an anchaI, it has a post and telegraph office.
Ja,mlUa A small village lPopulation 281), situated
22 miles north of Giridih railway station. The headquarters of an anchaI.
Jarldih A small village (population 867), situated on
the Garga river} 74 miles south-east of Hazaribagh town, the headquarters of an anchal.

lviii
l'hUDlta
.A sma,ll village (population 294:), situ4ted on the Hazaribagh-Bagodal' road, 10 miles ~ast of Hazaribagh. Noted for its weekly mal'ket held every Thursday. Large quantities of vegetables are exported to the industrial al'eas of Jharia, Giridin, Bermo, Gomia and Dhanhad.
,Jhumd Tilaiya
The town, with a population 21,777 persons. is served by the Kodarma railway station on the Gra.nd Chord line, and lies on the PatnaRanchi road. It is one of the largest centres of mica trade in the country. Headquartel'll of an anchal, it contains various other Government offices. It has a degree college, a hi~her secondar'y school .10 and a girls school. .A Notified Area Committee has been constit1lted for the town. The Central Hospital of l\fica Mines Labour Welfar~ Organisation is sitUQted in the neighbouring Karma village.
Kanhatl
A small hill situated 2 miles east of Ha~ribagh town on the Hazaribagh-J agdishpur rl:>OO. A favouJ:ite picnic spot, it has rest h()uBe managed by the Forest Department.
Kantl
A medium-sized village (population 1,520), situated 14 miles south of Kodarma railway station. It is the site for the Tilaiya ])am constructed on the river Barakar.
Karladpur
A small village (population 833), situated o miles east of Ichak, noted for the manufacture of brass metalware. An Industrial Co-operl\tive Society has been constituted with over 32 artisan families as it. members.
Kasmar A medium-sized village (population 1,114),
situated 20 miles east of Gola Roaq. railway station. The headquarters of an anchal, it has a post and' telegraph office.
Katia A medium-sized village (p,opulation 1,012),
situ-ated 3 miles south of Patratu railway station and 13 miles south-west of Ramgarh. A Thermal Power Station is proposed to be set
up here for supply of electricity to the Hea~ Engineering Corporation at H~tia near Ranch) .
Katkamsandf (Katkamsarl)
A medium-sized village (population 1,174), situated 14 miles north-west of Hazaribagh town. Headquarters of an' anchal. It has a dispensary, a veterinary hospital and a middle school. A weekly market is held every Sunday.
Keredari
A medium-sized village {population 1,157). situated 24 miles south-west of Hazaribagh town. The headquarters of an anchal, it has a post and telegraph offioe.
Ked Fall
A waterfall situated near village Sanghri. 3 miles west of Chatra town. A picnic spot.
KhandoU
A small village (population 223), situated on the foot of the hills about 5 miles north of Giridih railway station. The village has a large reservoir which supplies water to Giridih town. A picnic spot.
Kha,a Banaru
The river Lilajan passes through 'a narrow gorge "at this place, near village Babaru, 8 miles south-west oi Chatra town. A place of scenic beauty and tourist interest.
Kodarma
A very large village (population 5,732), situated 6 miles north-east of Kodarma railway station on the Ranchi-Patna road, the headquarters of an anchal. A flourishing centre "for trade in mica. It has a Mining Institute for training of students in mining.
Kolhua BUI
The hill, situated 6 miles south-west of Hunterganj, is noted for the annual fairs held on the occasions of Basant Pa-nehama and Bamnavam'.
Kulu
A large village (population 2,(21), situated 24 miles south-east of Hazaribagh on the

lb.
Hazaribagh-Ranchi road. Noted for its collieriEs.
Kunda Fort Remains of a histOlical fort in village Kunda,
situated 9 miles south of Pratappur. The village used to be the headquarters of Kunda Zamindar family in the Muslim period. There is a Shiva temple near the ruins, around which an annual fair is held on the occasion of Skwaratri. Situated amid fOi'ests the village is noted for its production of oatechu and lac. ,
Lapanga A· medium-sized village (population 1,656),
situated 12 miles south-west of Ramgarh, noted for its large glass factory of Indo-Ashahi Glass Works.
Lawalong' Situated 16 miles west of Simaria on the
Simaria-Barwadih Forest road, the headquarters of a Forest Range Office. A cattle fair is held annually in the month of December. The village has a hostel for Adivasi students and a middle school.
Maharajganj Situated 2 miles south of Chauparan, the
village has a weekly market (held every Thursday) which is one of the largest in the district. The market is leased out by Government for Rs. 10,000 per year.
Mandu A large village (population 3,009), situated
11 miles north-east of Ranchi Road railway station on the Hazaribagh-Ramgarh road. Headquarters of an anchal, it has a post and telegraph office.
Marafari A large village (population 3,154), situated
on the Dhanbad-Ramgarh road and a railhead on the Chandanpuri-Muri line of the South Eastern Railway. It is the proposed site for construction of the Bokaro Steel Plant. It has a weekly market.
Markacho . A very large village (population 4,511),
sItuated on Kodarma-Giridih road 21 miles south-east of Kodarma, the headquartels of an
anchal. Formerly the headquarters of Dharguli Estate, the village has a weekly market.
Nawadih A medium-sized village (population 1,641),
situated 11 miles north of Bermo railway station. ~he headquarters of an anchal, it has a post and telegraph office.
Parasnath The Parasnath hills, highest in the Chotanag
pur Plateau, constitute an important place of pilgrimage for the J ains and large number of pilgrims are drawn every year. It is about 7 miles east of Isri railway station III the Grand Chord of Eastern Railway. The Grand Trunk road passes about 3 miles south of it.
Pratappur (Pratabpur)
A medium-sized village (population 1,264). situated III the north-western corner of the district. It is the headquarters of an anchal, it has a post and telegraph office.
Patratu
A medium-sized village (population 1,052), situated 21 miles west of Ramgarh, the head .. quarters of an anchal. Noted for its Thermal Power Station.
Petarbar
A large village (population 2,263). situated 58 miles north-east of Ranchi and 48 miles west of Dhanbad, the headquarters of an anchal. An important training centre serving adjoining coal-mining areas, particularly Karanpura mines.
Pirtanr
Situated on the south-eastern extremity of the district, 16 miles south-west of Giridih railway station, it is the -headquarters of an anchal.
Rajrappa
A waterfall near the confluence of Damodar and Bhera rivers, situated 24 miles north-east of Ramgarh and 9 miles north-west of Gola Road railway station. There is a Devi temple at the place where a large fair is held on the occasion of Makar8ankranti.

Ramgarh
The town, with a population 20,041 persons, is situated on the south bank of Damodar, 32 miles south of Hazaribagh. It is the headquarters of an anchal. It has a military cantonment and the town is run by a Cantonment Board. It has a post and telegraph office, a telephone exchange and a high school.
satgaon
Situated 20 miles east of N awada ra:ilway station in Gaya district, the headquarters of an anchal. It has a post and telegraph office.
Simaria (Simaria Kalan)
A small village (population 930), situated 30 miles west of Hazaribagh town. The headquarters of an anchal, it has a high school, Basic Teachers' Training School, State DispeRsary, VeterinalY Dispensary and post office.
Sltagarha (Seotagarha)
A small village (population 240), situated 4 mile,S east of Hazaribagh town, noted for its college for training of Jesnit Missionaries.
Surajkund
Hot springs, situated 24 miles south-west of Hazaribagh on the Grand Trunk road. An annual fair is held on the occasion of Makar-8ankranti.
Tandwa
A large village (population 2,320), situated 13 miles south-west of Barkagaon, and 9 miles south-east of Simaria, on the confluence of the Tandwa and Chundu rivers. The headquarters of an anchal, It has a weekly market held every Monday.
Tlsrl --A medium-sized village (population 1,518),
situated on the Giridih-Gawan road, 40 miles north-west of Giridih. The headquarters of an anchal, it is an important centre for mica splitting and processing.
Usrl Fall
A waterfall over river Usri, 8 miles east of Giridih town. A favourite picnic spot.

A GLOSSARY OF THE. BETTER KNOWN ANCIENT MONUMENTS IN THE DISTRICT OF HAZARIBAGH
NOTE
Along with the house listing operation conducted in October, 1960 a. village note was also filled in by the enumelators for each mauza or enumerator's block. The enumerators were required to reoord information on ancient monuments according to the following instructions:
"Part B (3): Anoient Monuments
A monument means 'anything that preserves the memory of a person or an event, a building, pillar, tomb, tablet, statue, mound, etc.'. The idea here is to collect information about monuments which are of some importance and anti~ quity. By antiquity, the idea . is that the period to which the monument
relates should not be less than 150 years old. Religious shrines of some antiquity will be noted under this head as well as item 11 of Part A."
Admittedly, the extent of details collected in this survey is rather meagre and, perhaps, not very authentic. This could not be otherwise, considering the severe limitations and general handicaps of the enumeration agency. Even so, the comprehensive coverage has yielded some significant data which are presented below for further investigation and research by interested persons.
The list is presented in the same order of subdivisions and anchals as in the VillagE:' Directory and Village Statistics. Within an anchal, the villages are arranged in alphabetioal order.
SADAR SUBDIVISION
Anchal-Barkatha
Suruj Kuna {Thana no.llO)-The village contains ruins of a stone and brick structure, said to have been established in ancient times for the propagation of the Buddhist religion.
Anchal-Bagodar
Jarmune (Thana no. 108)-The village contains an old pillar believed to mark the place where the forces of Sher Shah had camped. The pillar is made of bricks and stone.
Anchal-Blshungarh
Jharia (Thana rltO. 116)-The village contains a Shiva temple believed to be over 500 years old. It also has a memorial to a Bati.
Anohal-Ichak
Ohampanagar Nawatlih (Thana no. 3)-The village contains a stone slab containing some indecipherable insoriptions, believed to be over 300 years old.
Jamuari (Thana no. 113}-The village contains a very old Shiva temple.
Anchal-Barkagown
Badam (Thana no. 135)-The village has the ruins of a palace of the Ramgarh Raj which had its headquarters in the village about 300 years ago.
Dari Kalan (Thana no. 51}-The village contains an image of Lord Bhairavanath, believed to be about 2,000 years old. .
Kutul'Ua (Thana no. 111)-The Village has a monastery known as Kutulwa Math, believ€d to have been constructed by King Dalal Singh about 300 years ago.
Sirma, (Thana no: 66)-The village contains the ruins of a palace said to have been built by the Ramgarh Raj. lt also has some caveS.
Anchal-Tandwa
Baham (Thana no. 62)-The village contains a stone piece known as Koharwa, traditionally believed to mark the spot where Lord Ramchandra lived for some time in the course of his exile in the forests.

1 xii
Sidpa (Thana no. 64)-The village contains a. large stone slab with engravings believed to be over 250 years old.
, Anehal-Mandu
Sanri alias Tilaiya (Thana no. 143)-The village ha.s a 250-year olii Shiva temple near a waterfall, from which water falls on the image of Lord Shiva continuously.
Anehal-Nagri (Ohurehu)
Indra lThana no. 61)-The village contains an old monastery.
Anehal-Ramgarh
Sonr (Thana no. 159)-The village contains an ancient temple believed to have been constructed by a Rajput king about 900 years back.
Anebal-Gola
Betul Khurd (Thana no.' 72)-The village contains the ruins of a 300-year old monastery in which Lord Vishnu's image used to be worshipped.
Tonagatu (Thana contains two ancient as Charkapathar and According to folklore, deities who had sought
no. (0)-The village stone pieces known
Dhumdhumiapathar. they symbolise two
among themselves.
J amuna (Thana no. 23)-The viIla~e contains ruins of an ancient monastery known a& Kh'ri Math, established for the propagation of Buddhism. The Raja of Gola was staying here
during the National Movement of 1857 in which the monastery was destroyed.
Anehal-Kas mar
Durgapur (Thana no. 108)-The village contains remains of a tank, well, and a large building said to have been constructed by a local zamindar about 300 years. back. Stone slabs with engravings have also been found.
Manjura (Thana no. 98)-The~e is a hillock known as Ramlakhan Tungri, situated about a mile from the village. The hillock contains remains of an ancient well. It also has marks on stone slabs resembling human and animal footprints. According to tradition, Lord Ramctlandra had come to this hillock while chaSing a deer during his period' of exile.
Ormo lThana no. 117).-The village has an ancient temple in whicli a village deity i& installed.
Anehal-Markaeho
Orkoaa (Thana no. 140)-The village contains a temple known as Suryamal-sthan, which contains some images believed to belong to the Buddhist period and inscriptions in Pali script.
Anchal-Patratu
Ohaingara (Thana no. 57)-The village' contains the ruins of a building ascribed to the Ramgarhia king named as J orakarma. Among the ruins there is a stone slab on which an arrow has been engraved.
OHATRA SUBDIVISION
Anchal-Ohauparan
Bigha (Thana no. 90}-The village has a Bhagwati temple ascribed to the Pala period.
Daihar (Thana no. 95),-The village contains a temple ascribed to the Pala period, slid to have been built in the reign of King Rampal. Tie temple is known as Kamala temple and contains stone images inscribed in Pali script.
Jagodih (Thana no. 231)-The village contains the ruins of a fortress said to be about 11)0 years old.
Mangarh (Thana no. 141X-The village contains a mound said to cover the ruins of a fortress built by Raja Man Singh about 300 years back.
Anohal-Itkhori
BkaduZi (Thana no. 1/263)-The village contains an ancient temple of Tara Devi. The stone image with inscriptions in Pali script is believed to be of the Buddhist period.
Khalari (Thana no. 47j309)-A stone image of Lord Buddha has been found in the village.

biii
The image contains undecipherable inscriptions and is very old.
Lemoia (Thana no. 61/323)-The village contains the ruins of a 500-year old fortress which was destroyed in a battle. The fortress known as 'Lamboiyagarh' is ascribed to the chieftain known as Jitram.
Nawadih Damol (Thana no. 52/314)-The village contains a stone image of Lord Vishnu with indecipherable inscriptions, said to be over 1,000 years old.
Anehal-Pratap ',ur
Humajan (Thana no. 48)-The village contains the grave of a Muslim saint named as
Syed Saheb and is believed to be about 950 years old.
Kunda (Thana no. 145)-The village contains remains of a 300 years old fortress. The gate of the fortress has some stone images among which that of Lord Shankar has been found. It contains inscriptions in Sanskrit and also some other inscriptions which have not been deciphered.
Anehal-Simaria
Serandag (Phana no. 114)- The village contains a mound commemorating site where a lady committed Sati about 200 years back.
Anehal-Gawan
GIRIDIH SUBDIVISION
Anehal-Dhanwar
Sitochak (Thana no. 281)-The village contains an old Shiva temple believed to be about 1,000 years old. It contains several stone images of Lord ShiV'a and Parvati. These bave some inscriptions and engravings on them.
Anehal-Satga wan
Deoghar (Thana no. 22)-The village has a temple of Lord Shiva said to be over 500 years old. It contains several mutilated stone images said to have been destroyed by Emperor Aurangjeb.
Mirganj (Thana no. 3)-A stone slab with engravings of Lord Buddha and inscriptions in Fali script has been found in the village.
Ohatti (Thana no. 124)-The village has a stone temple of Lord Shiva said to be over 350 years old.
Anehal-Pirtanr Madhuban (Thana no. 97)-The village has
famous Jain temples, more tha.n 2,000 years old. Parasnath Hill ({fhana no. 95)-The village
is an important place of pilgrimage for Jains and contains ancient temples and memorials of Jain Tirthankars.
No ancient monuments have been reported from the following anchals :
Barhi, Haza.ribagh, Katkamsandi, Keredari, Jainagar, Gumia, Peterbar, Jaddih, Kodarma, Hunterganj, Chatra, Tisd, Jamua, Deod, Birni, Giridih, Bengabad, Gande, Dumri, Nawadih and BermOj

6(CenI.) 0-1
PART I
CENSUS TABLES AND
OFFICIAL STATISTICS


NOTE
The Census tables have been published in Parts II M V (with their various sub-parts) of the 1961 Census Publications for Bihar. However, many of the important Census tables are a.lso being reproduced in the District Census Handbooks, and some of these give information for units up to the ancha.l.
The Census tables are classified into different series a.ccording to the nature of information presented in them. These are:
A-Series-Genera.l Population Tables; B-Series-Economic Tables, comprising:
(i} Genera.! Economio Tables, and (U) Household Economio Tables;
O-Series-Sooial and CuItura.l Tables;
D-Series-Migration Tables;
E-Series-Housing Tables; and
SCT-Series-Special Tables for Soheduled Castes and Scheduled Tribes.
Seleoted tables from all the above series except D and E are being reproduced in this Handbook. Each series of tables is preceded by a brief explanatory note indioating the oontents of the tables and the concepts used.


EXPLANATORY NOTE
A-Series comprises 4 General Popula.tion Village Tables, viz. :
A-I-Area, houses and population;
A-II-Variation in population during co years;
A-Ill-Villages classified by population; and
A-lV-Towns (and Town-groups) classified by population in 1961, with variation since 1901.
A village means a revenue mauza which is defined as foHows:
"A mauza means a parcel of land which, as a rule, is partly built over but mostly cultivated and waste, with a definite position and area, the boundaries of which were defined either at the time of cadastral surveyor at the time of revenue survey. It may contain no houses at all, or on the other hand, several hamlets each bearing a different name."
Only Tables A-I (together with Appendices and Annexures) and A-IV (with Appendices) are being reproduced in this Handbook, and for the latter, the variation of population has been shown from 1941 instead of from 1901.
The particulars of these tables are given below:
Table A-I-Area, Houses and Population
This table furnishes for each subdivision, anchal, town-group and town, the area (in square miles and square kilometres), density (number of persons per square mile), number of occupied residential houses and population classified by sex. It also gives the number of villages (inhabited or uninhabited) and towns up to anchals. The terms and concepts used in this table are defined below:
Town
A town includes every municipality, notified area, civil lines or cantonment. Certain other selected places were also treated as towns for the 1961 Census provided that they ordinarily fulfilled the following criteria, viz., (i) having a population of not less than 5,000 persons, (ii) density of not less than 1,000 persons per square mile, and (iii) at least 3/4th of the adult male population engaged in non -agricultural activities.
Town-group
If two or more towns are contiguous and so constituted that they form together a compact block, each part having separate civic bodies, the entire area is treated as a town -group. There is, however, one town·group in the district of Hazaribagh.
House
A house is a structure or part of a structure inhabited or vacant, a dewelling, a shop, a workshop, factory or place- of worship or shopcum-dwelling giving on the road or a common staircase or a common courtyard leading to a main gate or enjoying a separate entrance. The term <l'occupied residential houses" refers only to such houses as are used for dwelling purposes or where any other purpose of use is accompanied by the element of dwelling, e. g., shop-cum-dwelling, workshop-cum-dwelling, etc.
Appendix I to Tahle A-I shows the 1951 territorial units constituting the district of Hazaribagh and indicates the changes in their jurisdicti6n after the 1951 Census. For details of villages affected in these changes, a reference may be made to Annexure II to this Appendix.
Annexure I to Appendix I to Table A-I shows the inter-relationship among revenue thanas, police stations and anchaIs.
• Annexure II to Appendix I to Table A-I not published elsewhere gives the list of villages affected in the territorial changes mentioned in Appendix I to Table A-I. The numerical symbols given within brackets in columns 3 and 6 of Appendix I to Table A-I are elaborated in this Annexure. For example 141 villages were transferred from Bagodar P. S. to newly formed Bishungarh P. S. as mentioned in columns 3 and 6 of Appendix I to Table A-I. The numerical symbol (1) is prefixed to this entry and the affected villages are enumerated in Annexure II against the same symbol in column 1 of the Annexure.
Appendix II to Table A-I gives the number of villages with a population of 5,000 and above and of towns with a population under 5,000 up to the level of anchal. It is seen that in Hazaribagh only 9 villages have a popula.tion of more than 5,000 while no town has a population under 5,000.
6
Table A-IV-Towns (and Town~roups) .classified by PopulatIon In 1961 with variations since 1941
This table traces the growth of towns sinoe 1941. The area of eaoh town is given in sq. miles as well as in sq. kms. The towns are divided into 6 classes according to their population sizes as under:
Class I
Class II
Class III
100,000 and above
50,000-99,999
20,000-49,999
Class IV Class V Class VI
10,000-19,999 5,000-9,999 Less than 5,000
The class totals have been worked out by considering the population of towns falling in different olasses on the basis of their actual popula.tion and class in previous censuses.
Two new towns namely, Jaridih Bazar and Barki Saraiya, have been added to the list of towns in 1961, the details of which are given in the Appendix to Table A-IV. No town of 1951 was declassified in 1961.
Explanatory Note A to Appendix to Table A·IV gives the . names and areas of the villages constituting the new towns.
Special Appendix to Table A-IV, prepared in two parts, gives details of the villages oonstituting the towns together with their status and boundaries.

'1
TABLE A-I-AREA, HOUSES AND POPULATION
Popu- Number of District/Subdivision/ Total Area tation villages Number Number of
AnohalJTown Ruralr-·-----'-~ per sq. r------'- ... of ocoupied r-------------..,. Population
Urban Sq. Sq. milet Inhabit. Unin. towns residential Persons Males Femalel!l
1
HAZARIBAGB
Sadar Subdivision
Barhi
Barakatha
Bagodar
Bishungarh
Razaribagh
Hazarlbagh (M)
Katkamsandi
Ichak
Barkagaon
KeredaJi
Tandwa
Mandu
Nagri (Churohu)
Ramgarh
2
T R U
T R U
R
R
T R U
T R U
U
R
R
R
R
R
R
R
T R U
.Bu1garh (Cantt.) U
Jainagar
Gola
Gumia
Peterbar
Jaridih
Kodarma
R
R
R
R
R
R
T R U
miles Km.t ed habited houses
3(G) 3(b)
8,988.0 18,098.7 6,917.9 17,917.4
68.1 176.3
8,882..8 8, '1G9. 7 3,826.0 8,614.4
36.8 95.3
190.0 492.1
166.1 430.2
217.4 210.1
7.3
563.1 544.2
18.9
4
848 317
2,955
8,62 338
2,489
279
281
406 378
1,207
7.30 18.91 1,207
200.6 519.6
120.1 113.0
7.1
311.1 292.7
18.4
273
713 395
5,769
7.10 18.39 5,769
179.0 468.6
149.4 386.9
173.0 448.1
167.7 434.3
145.1 375.8
166.6 431.5
160.9 416.7
119.6 105.7
13.9
309.8 273.8
36.0
286
8U;
235
204
219
362
241
737 645
1,442
13.90 36.00 1,442
89.1 230.8
129.3 334.9
258.9 670.6
117.5 304.3
76.0 196.8
123.7 320.4
167.0 158.5
8.5
432.5 410.5
22.0
497
443
273
386
445
431
544 '36
2,562
5
8,182 6,162
2,195 2,195
129
114
121 121
-117
95 95
117
113
79
79
82
79
87
81 81
138
88
123
64
65
89
142 142
6
887 887
2084 284
38
9
16 16
23
22 22
13
17
5
5
4
6
3
4,
4
32
5
12
1
3
1
40 40
7
10
10
4
4
1
1
1
1
1
1
1
1
1
1
1
8 9 10 11
368,541 330,125 33,416
2,_411 1,203,508 1,192,908 2,195,227 1,092,678 1,102,549
201,184 110,825 90,359
186,808 173,600
13,203
1,217,107 1,125,519
91,588
7,680 53,078
6,318 46,620
11,363 10,002
1,361
1,361
7,965
11,790 6,649 5,141
5,141
88,213 79,401
8,812
8,812
54,668
85,621 44,663 40,958
40,958
617,355 566,296 51,059
26,105
21,575
42,920 38,301 4,619
4,619
26,682
44,781 22,423 22,358
22,358
7,586 51,171 24,887
6,773 47,108 22,623
6,441 40,569 20,193
5,923 34,185 17,326
5,153 31,802 15,718
10,292 60,374 \ 32,498
6,718 38,737 20,338
13,886 10,313
3,573
3,573
88,180 68,139 20,041
20,041
46,858 34,625 12,233
12,233
6,017 44,290 20,818
10,486 67,219 28,717
9,902 70,730 36,416
7,353 45,379 23.164
5,705 33,818 17,{33
7,816 53,307 27,365
13,566 10,438
3,128
90,814 89,037 21,777
48,118 36,269 11,849
599,752 559,223 40,529
26,973
25,045
45,293 41,100
4,193
4,193
27,986
40,840 22,240 18,600
18,600
26,284
24,485
20,376
16,859
16,084
27,876
18,399
41,322 33,514
7,808
7,808
23,472
28,502
34,314
22,215
16,385
25,942
42,696 32,768 9,928

8
TABLE A-I-AREA, HOUSES AND POPULATIOlf-c<mtd.
Popu. Number of District/Subdivision/ Total Area lation villages Number Number of Population
Anchal/ToWl!l Rural r---...... --~ per sq. r---...... ~ of occupied r- _,.A. ____ ..-.,.
Urban Sq. Sq. milet Inhabit- Unin· towns residential Persons Males Females miles Km.t ad habited houses
1 2 3(b) 4 5 6 8 9 10 11
*Jhumri Tilaiya (N) U 8.50 22.02 2,562
7
1 3,128 21,777 11,849 9,928
Markacho
Patratu
Chatra Subdivision
Chauparan
Itkhori
Runterganj
Pl'atap Pur
Chatrs
Chatra(M)
Simaria
Glrldlh Subdivision
Gawan
Tisri
Satgawan
Jamua
Deori
Dhanwar
Birni
Giridih
Giridih(M)
Bengabad
Gande
Dumri
Nawadih
Pirtanr
122.9 318.3
122.9 318.3
T 1,545.2 4,002.1 R 1,541.4 3,992.3 U 3.8 9.8
R
R
R
R
T R U
259.1 671.1
205.2 531.5
198.2 513.3
260.1 673.7
246.3 637.9 242.5 628.1
3.8 9.8
340 135
484 80
208 1,888 200 1,388
3,291
248
299
260
154
231 183
3,291
242
265
224
217
249 249
u 3.80 9.84 3,291 -R
T R U
:a. It
It
R
It
It
no
T no U
U
:a. R
R
R
:a
376.3 974.6 124
1,998.9 5,177.1 1,971.4 5,105.9
27.5 71.2
129.9 336.4
164.2 425.3
117.3 303.8
184.8 478.6
163.2 422.7
134.5 348.4
123.5 . 319.9
160.7 157.6
3.1
416.2 408.2
8.0
429 386
3,533
321
218
218
447
347
560
396
773 564
11,897
3.10 8.03 e11,897
155.7 403.3 314
141.4 366.2 401
164.5 426.0 435
143.5 371.6 435
151.7 392.9 272
191
2579 2,579
129
178
109
300
260
276
168
209 Z09
222
259
177
79
188
22
3
312 312
80
68
46
37
57 57
24
291 291
:n
34
35
15
43
22
13
19 HI
36
15
16
4
9
1
1
1
1
1
5
5
1
1
1
6,132 41,736 19,265
11,938 59,488 33,b55
49,295 47.385 1,910
321,O(l5 308,558 12,507
158,,116 151,728
6,388
8,478 64,375 31,004
8,910 61,423 29,486
8,229 51,520 25,692
7,055 40,053 20,291
8,911 7,001 1,910
1,910
7,712
127,443 109.140
18,303
57,001 44,494 12,507
12,507
46,693
858.~39 761,150
97,089
28,070 21,682 6,388
6,388
23,573
428,032 374,654
53,378
6,295 41,653 20,225
5,711 35,822 17,793
3,475 25,562 12,181
10.380 8'::,1129 38,984
7,537 56,562 27,493
1(),519 75,297 36,167
6,264
20,376 16,326
5,060
tl,060
6,035
8,762
8,851
8,440
6,483
48,925
124,194 87,818 36,881
36,881
48,921
56,684
71,621
62;369
41,307
22,399
63,860 44,268 19,607
19,607
23,964
28,726
36,227
31,360
20,756
22,471
25,933
182,949 156,830
6,119
33,371
31,937
25,828
19,762
28,931 22,812 6,119
6,119
23,120
480,207 386,496 43,711
21,428
18,029
13,381
43,645
29,069
40,140
26,526
60,334 43,080 17,274
17,274
24,967
27,958
36,394
31,009
20,551

TABLE A-I-AREA, HOUSES AND POPULATION-concld.
Popu- Number of Distriot/Subdivision/ Total Area lation villages Number Number of Population
AnohalJTown Rural r---.A.--~ per sq. r-______.A,,--, of occupied r-------.A.---------a Urban
1 2
Bermo T R U
Sq. Sq. milet Inhabit- Unin- towns resideLtial Persons Males Females miles Km.t ed habited houses
3(a} 3(b) 4
64.0 165.8 1,355 39.6 102.6 669 24.4 63.2 2,470
- 5 6
25 25
7
4
4
8
18,315 5,062
13,253
9 10 11 •
86,693 48,907 37,786 26,485 15,136 11,349 60,208 33,771 26,437
Bermo Town-group U 24.38 63.14 2,470 4 13,253 60,208 33,771 26,437
(a) Kargali U 1.12 2.90 8,379 1 2,654 9,38~ 4,965 4,419
(b) Bokaro U 6.73 17.43 803 - 1 1,073 5,~06 3,221 2,185
(0) Bermo U 4.32 11.19 3,197 1 3,309 13,813 7,353 6,460
(d) Jaridih Baza,. U 12.21 :n.62 2,588 1 6,217 31,605 18,232 - 13,373
}iOTIIlS: (1) tThe sq. kms. and density figures of urban areas of Anohal/Subdivision/District are worked out using the area figures corrooted up to 2 places of deoimals obtained by adding the areas of the towns in the respective units and not using the area figures given ill the table. In addition to this the area figures relating to sq. kms. are further adjusted to make the Anchal/Subdivision/District totals tally.
(2) Towns treated as such for the first time in 1951 Census which continue as towns in 1961 Census are shown with asterisk (*) on their left.
(3) Towns treated as suoh for the first time in 1961 are printed in itaU08. (4) The following abbreviations have been used for the status of town, e.g.:
(M)-Munioipality (N)-Notified Area ( Cantt.)-Cantonment
Where no symbol ocours but the place is shown as urban, it means that the place has been treated as town for census purposes.
(5) The rural areas of units smaller than the district do not add up to the total rural area of the district, because the rural areas of units smaller than the district have been oomputed from thana jurisdiotion lists, while the total rural area of the district has been arrived at by subtracting the total urban area of the district as supplied by the Distriot Offioer, from the total area of the district as supplied by the State Survey Office.

Appendix I to Table A-I
~ If Q) ...
10 !a
~ ~ o <V o . 9 ~
:a ... 0
Q)
-5 ... Q)
-5 -5 .~ ~
0 ~ "" g> ~ ~ .~ ..
tS ~
"" tS Q) l:tl §
co 'S ~
<1:: '& ~ Q)
~ I:: ~ ..... ~ ..,
co
""
Q) = ~ ...
~ g-
III
IJl Q) .... ... a 0-tll
f . a EJ:4
~li~
.9
10
<:> ...
0)
co
......
lQ
~
•
1:1 11:1 0
~ ~ -< :a ... e -=
= I'll
i ;I fD
rti ~ '" <II '0 : 1"1
rti p; ... ~ g, <V
1"1
...
...; Q ~
+
rti p; -; § ~

11
Annexure 1 to Appendix 1 to Table A·I ,;,
000 ~C'loo ... (l() ... (l() Cll 10 ~ "'" ..... 0 ... (l() Cll 0 a> ClO ..... ~ 1:1 ..... <>1 ........ eo <>1 10 .... 0 eo 00 .... ~ 00 "'" ClO ... ~ .... .... 0
g.~ ,,., oeo C'looeo eo a> .... .... lQ .... ~ ~ .... .... 0
"'" G'I &:-- 00 ClOOO .... ~-. ~ 0000"; .0 0 ..... .,: 0 ..; ... 0 t:J:)~ 00 0 0> .,!' 0 .0 ¢t)~
~ \1')-<11 00 10 00
"'" 10 "'" "'" "" '" CCI ~ 00 C'I 10 IQ .... "'" Co) 10
~ r . ~ 00'" eo .~ C'I CQ .... lQ 10
"'" co CQ
"'" c-? 10 C'I .... 001'"'1 llJ)! 1:1" c¢ .... '<:"1 O'! .... .... ....
~ ~~ .., .... .... ..c:I o~
""'.-.. .... ..... CQ a> C'I a> .... 00 0 ~ lOa> ~ 1 1l "'-<II ..... O'! a> ..... co "'" IN ..... C'I ... 0 .... .... .... """ .... 00 .... 00 00 ex> OC> G'I co <:0<0 ,D • .., CQ ........ ... .... .... ..... .... .... S 1:1 ....
::s 1-1] .... ..:s z l -l:3 "",,,", ""'OC<l ..... 0 .... C'I ... CQ ClO eo ..... 00 0 "'" G'I .... C'I C'I~ 1 ~ rfl 00 CQ('O<o 0 .... 0 "'" 0 .... 0 10 ClO 10 '" '" e<: a> 10 O~
CI) &G) C<I d ,.;5 ~~g 0 ~ c) c) ~ ~ I1:i cO 0 c) ~ C\i 0) <Xi ~ oD~ .sa.S 1111 ,...., 0><0 C<I ..... "'" ..... <0 '<II co co .... .... C'I C'I 11) .... &:--C'I ~ ......... C'I C<I .... .... .... .... .... ..... .... ..... ... .... .... C"I .... ... "e
~ ..... § ~
0
~ 0- I ~ E-i ;a ..c:I
0 ~ e E-i '<e ~ ..d ~ ~ ;:I ::s .... 7i ..... OJ :w Oil
j ~ ....
~ ~ 1 ,..
~ ..c:I :e~llJ) ..0 ... as = J~ ..d ..... .., ..0
.~ ol
~ ol <> .... ol "O.~ § .~
~ "0 = .;:: llJ) 1; <II ~ l:1.l ~ ~,!d ~~~ ~
CD "0
~ ...
.~ lSI 1; ... ~ ~ 1f ~ <II CD .~
~ <I) ol ~ OJ o:s ... OJ Ii1 ..c:I ~ '0 ~ (,:) p:jp:j IlHCi ;Q I:Q 14 <> !Xl Z ~ ~ ~ C!l Pol ~ .... 1-1 C!l -~ ~ 00 .-.. ® C<I ClO <0 ..... ClO Cll Ji1 ~ 1:1 a> .... <0 ~ 0 II:) .... eo .... 0 J:'. t--
0 eo C'I <0 .... to ..... CCI Co) Cll 0 ~
1 P<o ... 0> 00 ..; cQ .,: cQ 0> .,: C'I &:-- .... ""
~ 0· ... J:'.~ 0 0> ¢t) Pol" a> 00 10 c-?
"'" 0 CI> "'" 10 .... .... ..... J:oo .... 1Q
rfl f CD "0 ..... eo CQ 10 .... "'" ~ • CD '<II .... C<I CQ .... ..... CI> t- 1Q ~ "'" 0 ~ :::l .s~ Ol .... .... 1:1..c
E-t <I) ~~P.2 1004 ~ - t r 1l CQ ."
"'" Co) 0 <0 00 '" Ol a> ~
<I)
"'" C'I -. eN .... '<II CC :;:. ..c .-+> ClO C'I .... , C'I ..... C<I co ~ OC> C"I C<I CO
~ ~ .:1:.8 .... ..... ...
~ z L ~ re «::!> .... .... C<I IN C'I IN
i dl fl .... Co) <0 00
"'" ClO ~ 10 C'I .... "<fI Ol .,.
cO ~ <::5 0
c) .0 c-i CQ 0> 1<:1 co
~ ~ 1:1 tit] 10 .... 0 c)
"'" 00 ".: .... c) <Xi ,~ ~ -< ... 111 CQ IN C<I '" .....
"'" <:-1
IN C'I 1Q C'I C'I ..., .... IN ... ...
0 .~ 1:1 E-4 1 .Sl 1004 ~ ..,
..c:I 1 = l rI.l § CD
"" ~
~ llJ) ..c ol fa ..c:I r;:, <I) .~ ol :w .§ ... '0 ~ "0
~ .~ 1 til) as of ;a ~ , 0
~ l dl .~ ... ~ til) lSI
~ '0 CD ·5
5 <I) ol c:tI ;§ .... ..... ttl p:j iE III ttl 0 CD
~ ~ 0 Pol .e 00 .... 0 CO ... .... 0 ~ <I)
11:1 Cll 00 0 10 .... 00
oS 1<:1 co 00 '" to .... 00 CQ 0> cQ 0> ..; .... 10 o 0 C<I~ .", 0 c.f
i PoI:$ a>
"'" 00 0 Ol 0 t- oo
~ f .... ... ... C<I .... ~ ,"0 .... '" C'I
"'" Ol C<I C<I 10 1:1 CD "'" CQ to .... ... .... ~ ·a:E "'II
CO 'l!f'.!l ... ~ t "0 CQ .... .... 0 CO .... CQ 00
~ ..c • CD "'" .... CQ
"'" CO IQ C<I Cll ~ .:I~ Ct:I C'I "" Co) "" .... C'I ....
~ Z L j .... Ol 0 C'I 00 &!: .... 00 as rfl .... 0'> 10 00 ""! CI> CD • CD C<I oD ~ <Xi .0 ...; <Xi
IN -< 1:1 0':;:: ..... ~ .... co a IQ .... '<II 00 eN .... to .... CQ
"'" "'" "'" 00 CQ eN '" --.§ as .:= S ~ ....... 00 c;i' .~ ~ 0 "'"' e 10 co
tEl I 0 ~ ..... co 0 .... ..c:I C 0' ~ ..c:I ;:I IQ e G' e "OE-i ..... :w .... eI)
,DCD < '" 0 e. 1 :e ,:II "" e "" ..c c:tI
1 ::s ::I =' ,@ ~ .§ ~ ~= .... .~
"'" CD j:II a:J :f 0
~ CD .S ~ < ...
~ lSI ~ ~ N ..,
c:tI c:tI
ii~ "" !Xl !Xl I:Q !Xl )i;I ~ 0 Pol < ce ... = rIl ~

AnDexure I to Appendix I to Taille A·l
IQ ....
-.t< ....
..,
....
......
......
o ......
j o ~
CIO ." ....
0> o oi CIO
IQ o oi lQ IN
IQ o oi lQ IN
CIO -.t< .....
to lQ
lQ ...... u:i o IN
12
0> o o '" IN
.... g ,.: IQ
..... o o t-" lQ
to IQ ci ....
o CIO c.)
.... 0> .....
... 0> ...
..... 0> ....
o o .....
o ." ,..; .... -.t<
IQ ....
o o ."
00 lQ
o '" lQ
CIO <0 ....

13
Annexure I to Appendix I to Table A-I
,,-' .... ..... "" .... 0) r-- M "" co <'l 10 '" '0 ~ 0) co <0'1 00 <0'1 co 0 0) 00 0 .... 0 .S .... co 0) co co. <'l <'l co <'l "" 00 ~ ~ ..; co· 00 co· <N ..... co· ar .0 ..; .. 0 .... ... IN <'l "" lQ r--
.... .: Eo! co "" 00 .... <'l a .... <!) til .... 0
0) 10 lQ <0 "" C> 0 ..::: .. .... .... .... .... <D 0
.g ~ ~ .!l ... ... e § '0
"" 10 <0'1 C> r-- 0) co <'l .... .... .... 10 0 <D .: .... <0'1 lQ r-- r-- 00 <'l C) '0 0
IN <0'1 IN .... .... Oi '" ...
,.:; g =' C) .... 14 Q C) <D CIl .
.... 0 "'" lQ <'l "" r-- 0> Il'I <'l IN .... .: d!
r-- .... r-- ~ lQ 10 ~ 0) ..... r-- <'l IN 0 <D
0 C'l .Q ..... ..,; .,) ..... C'l ..... ,.; ..,; ~ +> <D ;03 co 10 "" co "" 10 co .... !lO ..0
.... ... .... .... .... .... .: <D
~ ;a <D ~ > .. d! '0 0 .d 0 C) ~
~ Eo! C) .,
~ .. III
~ ~ ....
d! .-e 0
g ~ 0 \3 ?' '0 E-l ~ 0
d! .d ~ . S ...
.d :S ..0 ;a .. .... 0 :S
<is
;a '0 ~ <D .... ; ~
Oi ~ 0 ttl .S .
:5 '0 ~ ~ ~ ~ ~ :s <D 'I» .;:: ;! 1: ~
.. !lO
~ tS 0 <D iii III ~ d! d! ~
IX! 0 ~ III ~ = 'i .... > d! -Co
"" .... "" .... 0) r-- Cf) Q.. .... 0) Il'I 00 co 0 0> .... '0
C)
IN co 0 '§ .... 0> co ~ <'l ~ <D
"". co· ~ .... <N .... co· ... '0 <0'1 "'" 10 t- co "" co <D .g ?I .... ~ 0) 10 10 <0 "" 0) =' .S til
.... <'l .... .... .: '" .~ <D <D ~ ~ .!l +> = ~ '"
C> 0) 00 <'l <D 'S! 03
"" Il'I r-- ~ !lO .... Il'I It) t- t- oo <'l .d Il'I .... C) +> .S
Il'I Il'I .... =' ~ ] ~ '0 til ...
0 <D C)
10 <'l "" r-- 0) .... ~ .d ~ .... "'" ..,
r-- r-- ~ lQ It) co 0>
~ 0 .Q ..... ..,; .,) ...; cO .d d ~ <0 10 "" co "" 10 co +> ~ .... ... ..... .... .... .... 0
+> 'j; ... C) a ..s=
.S ';;j ., C)
d! <is bO <D <D
<6 d! :a ... .: ~ ~ '" §
'0 ..d .d 0 .~
d! E-l .;i ..0
..d ..0 <D ;a ~ ~
<D /j ;a gl, 1 .~ ~
=' d ... '0 .;:: ~ 1: .: <D
~ <D <D ~
<D d
a IX! 0 A iii ~ ..0
lil 0 <D .....
0 ~ ~ 0 ~ '" C> .d
.d 0) ~
.d .., a r--
C)
ar ..... III a @ ~ co <D f5 "" IN lit .... =' IN !lO '0 $ d ,g~ .: '" CI'l ·~i
.... <0 IN . S Q.. '" 1 =..,;'1 .d .... Oi
..s i~ .d
'" ~ ~ ~ lQ r--
....... 1>, ... ~
'" r-- 11 :aJ ~ Eo! co "" ..d'" ...
~. lit Q ';;j 0
~';' ~ ...... d~ ~
0 M ..... '0 "a! ~ d •
00 r-- .d d! ,g .!:I 2.i r:.: ..; ';j II) IN ~d i "" II)
.... <D .,E-!
.... "''0 ., ...... III
t~ Gl <D Gl 12'< ...
~§ .~ -d ~j
r.;: .S .... 0 ~ ...
~ G' 1>0 r;r., _ .... 0 :::. e 0;;- ~Iit
co to
t:. '" ...... -
:9 . ~ III
'0 &11
'0; Q foI
0 0 z

14
ANNEXURE II TO APPENDIX I TO TABLE A-I.
Statement showing the name8, thana nu111lJer8 and area of villages affected in territorial (vide Appendix I to Table A-I) during 1951-61
changes
HAZARIBAGH DISTRICT
Symbol Serial Name of the village Revenue Area Symbol Serial Name of the Village Revenue Area no. no. Thana in no. no. Thana in
no. acres no. acres
1 2 3 4 5 1 2 3 4 5
(1) 1 Dongo 129 102.21 (1}-comd. 61 Khapia 181 421.41 2 Gainra 130 1,706.30 52 Murko 182 1,315.80 3 Kirtodih 131 367.71 53 Bisai 183 335.87 4 Chuk Chuko 132 133.22 54, Tati 184 430.19 5 Basaria 133 490.65 55 Bhelwara 185 5,911.65
6 Sauladih 134 425.80 56 Chit Ramu 186 3,488.87 7 Chalkari Kalan 135 557.62 57 Gobindpur Kalan 187 1,090.19 8 Bars. 136 367.81 58 Gohindpur Khurd 188 1,245.20 9 Chalkari Khurd 137 159.66 59 KhamRars. 189 846.82
10 Burha Chanch 138 1,113.38 60 Parsabera 190 443.99
11 Ganrar Bare. 141 1,550.4,8 61 J aria Mahatoia 191 600.23 12 Bha.nreri 142 751.71 132 Tataria 192 395.05 13 Kharna 143 2,469.13 63 Khar Khundu 193 669.90 14 Golgu 144 972.15 64, Alkhari Khurd 194 780.57 15 Kesodih 145 219.91 65 Barha Muria 195 411.75
16 Siju 146 229.98 66 Jamua. 196 700.64 17 Kolhu 147 777.46 67 AlkhariKalan 197 466.20 18 Ramjiti 148 74.85 68 RetWi Murgaon 198 731.61 19 Beram 149 1,170.45 69 Upraili MUrgaon 199 356.95 ~O Barhamoria 150 65.16 70 Bhutahi Murgaon 200 638.46
21 Mayapur 151 1,088.23 71 Nawa.dih 201 495.62 22 Jaruadik 152 776.26 72 Paurejaria 202 152.06 23 Chechaki 153 691.91 73 Chalanga 203 601.24 24 Dharampur 154 1,016.28 74 Urgi 204 1,145.68 25 Pa.nimako 155 1,990.12 75 Ramua 205 602.81
26 Marpa 156 1,003.90 76 Tarabad 206 220.45 27 Chiruwan 157 804.89 77 Badikha.rna 207 421.81 28 Ba.nsi 158 371.89 78 Beraharihara 208 1,935.33 29 Bandi 159 682.39 79 Chalnia 209 524.58 30 Khamwa 160 691.23 80 Katwahi 210 196.85
31 Dudhmania 161 613.72 81 Bukna 211 720.30 32 Dumar 162 541.76 82 Lembua 212 133.20 33 Kharka 163 239.41 83 Chontha 213 365.84 34 Dungo 164 422.75 84 U prail Bodra 214 689.97 35 Churchu 165 630.60 85 Alkopi 215 653.30
36 Banhe 166 390.75 86 N'awadih 216 473.93 37 Ra.rli 167 419.73 87 Bishung~h 217 487.55 83 Berho 168 664.05 88 Cherra 218 519.02 39 Baudha 169 488.95 89 Tands. 219 134,,13 40 Kasra 170 576.77 90 ,D&ndia. 220 332.06
41 Ghughulia 171 533.05 91 Bakaspura 221 952.36 42 Godhea. 172 1,350.59 92 Ledi 222 256.08 43 lIa.twe 173 443.00 Jl3 Simaria. 223 608.06 44 Aintha 174 244.24 ~4 Mayapur 224 322.55 45 Dahar Bhanga. 175 258.44 95 lIethli Bodra 225 795.96
46 Jharis. 176 511.88 96 Gundro 226 942,42 47 Jiolang 177 646.09 97 Alpito 227 493.82 -i8 M\U'IlI.ll&tu 178 457.30 98 Barai 228 2,111.62 49 Sadaro 179 244.33 99 Achaljamu 229 6,309.66 60 Pam·ra 180 404.28 100 Bilandi 230 120.7i

15
ANNEXURE II 'to APPENDIX I TO TABLE A-I-concld.
Statement 8howing the names, thana numbers and area oJ villages affected (vide Appendix I to PalJle A-I) during 1951-61
in territorial change8
Symbol Serial Name of the village Revenue Area Symbol Serial Name of the village Revenue Area no. no. Thana in no. no. Thana in
no. acres no. acres
1 2 3 4 5 1 2 3 4 5
(f)-cDtltd. 101 Bhalua. 231 261.70 (f)-concld. 121 Marmo~ 260 3,598.74
102 Nirghuna 232 273.37 122 Chirudih 261 543.75
103 Charnakhia 233 197.28 123 Chatkari 262 1,038.74
104 Nawada 234 715.53 124 Unohaghana 263 992.73
105 Babudih 235 201.72 125 Chatania 264 518.33
106 Kusumbha 236 1,141.83 126 Salmandra 265 250.10
107 Bhondamurgi 237 195.81 127 Nagi 266 1,692.12
108 Dumardiha 238 601.46 128 Bankharo 267 1,069.76
109 Garmurgi 2'39 500.31 129 Kharkatto 268 882.23
110 Mango Mahuatanr 240 1,264.14: 130 Jobar 269 1,205.40
111 .Tamnijara 241 1,358.85 131 Kharki 270 8,690.72
112 Banaso 242 4,936.03 132 Lahariadih 271 657.89
113 Chano 243 2,653.40 133 Tilaiya. 272 813.72
114 Mangro 244 836.26 134 Arjari 273 1,545.73
115 Pharachanch 245 1,090.75 135 Alkilwa 274 1,044.24
116 Sarukudar 246 1,221.88 136 Gajhandih 275 813.45
117 Balak 247 1,580.89 137 Rangamati 276 1,125.10
118 Udalbera aUaB Thethaiya.. 248 375.76 138 Parasia 277 457.29
Tanr. 139 Baje 278 521.18
119 Chihutia 258 613.26 140 Barki Narki 279 2,493.64
120 Nawadih 259 344.99 141 Narki Khurd 280 1,745.1Q
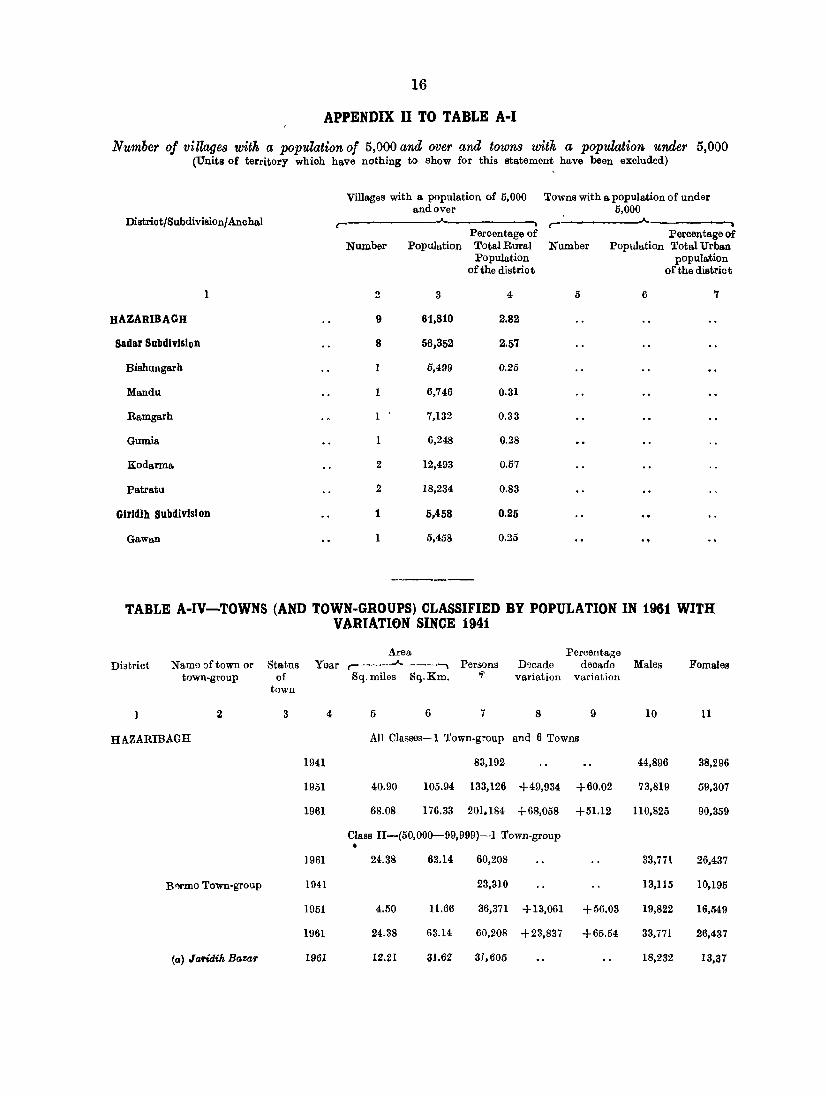
16
APPENDIX II TO TABLE A-I
Number oj village8 with a population of 5,000 and over and towns with a population under 5,000 (Units of territory whioh have nothing to show for this statement have been exoluded)
Distriot/Subdivision/Anohal
1
HAZARIBAGH
Sadar SubdivIsIon
Bishungarh
Mandu
Ramgarh
Gumia
Kodarma
Patratu
Girldih SubdivIsion
Gawan
Villages with a population of 5,000 Towns with a population of under
Number
2
9
8
1
1
1
2
2
1
1
and Over 5,000
r------------------------~ Percentage of Peroentage of
Population Total Rural Number Population Total Urban population
of the distriot Population
of the distriot
3 4 5 6 7
61,810 2.82
56,352 2.57
5,499 0.25
6,746 0.31
7,132 0.33
6,248 0.28
12,493 0.57
18,234 0.83
5,458 0.25
5,458 0.25
------TABLE A-lV-TOWNS (AND TOWN-GROUPS) CLASSIFIED BY POPULATION IN 1961 WITH
VARIATION SINCE 1941
Area Percentage District Name of town or Sta.tus Year r----..A.---, Persons Decade decade Males Females
town.group of Sq. miles Sq.Km. ". variation variation town
1 2 3 4 5 6 7 8 9 10 11
HAZARIBAGH All Classes-l Town-group and 6 Towns
1941 83,192 44,896 38,296
1951 40.90 105.94 133,126 +49,934 +60.02 73,819 59,307
1961 68.08 176.33 201,184 +68,058 +51.12 110,825 90,359
Class II-(50,OOO-99,999)-1 Town-group •
1961 24.38 63.14 60,208 33,771 26,437
B'lrmo Town·group 1941 23,310 13,115 10,195
1951 4.50 11.66 36,371 +13,061 +56.03 19,822 16,549
1961 24.38 63.14 60,208 +23,837 +65.54 33,771 26,437
(a) Jaridih Bazar 1961 12.21 31.62 31,605 18,232 13,31

17
TABLE A-IV-TOWNS (AND TOWN-GROUPS) CLASSIFIED BY POPULATION IN 1961 WITH VARIATION SINCE 1941-contd.
Area Percentage District Name of town or Status Year r--_.A._--""", Persons Decade decade Males Females
town.group of Sq. miles Sq.Km. variation variation town
1 2 3 4 5 6 7 8 9 10 11
(b) Bormo 1941 5,674 3,002 2,672
1951 1.50 3.89 8,920 +3,246 +57.21 4,787 4,133
1961 4.32 11.19 13,813 +4,893 +54.85 7,353 6,460
(c) Kargali 1941 10,127 5,948 4,179
1951 1.50 3.89 17,644 +7,517 +74.23 9,538 8,106
1961 l.l2 2.90 9,384 -8,260 -46.81 4,965 4,419
(d) Bokaro 1941 7,509 4,165 3,344
1951 1.50 3.89 - 9,807 +2,298 +30.60 5,497 4,310
1961 6.73 17.43 5,406 -4,401 -44.88 3,221 2,185
Class III (20,000-49,999)-4 Towns
1941 73,554 39,997 33,557
1951 14.70 38.08 99,350 +25,796 +35.07 54,245 45,105
1961 32.60 84.44 119,657 +20,307 +20.44 66,047 53,610
Hazarihagh M 1941 24,918 13,289 11,629
1951 7.10 18.39 33,812 +8,894 +35.6~ 18,063 15,749
1961 7.10 18.39 40,958 +7,146 +21.13 22,358 18,600
Giridih M 1941 25,326 13,593 11,733
1951 3.10 8.03 29,167 +3,841 +15.17 16,360 12,807
1961 3.10 8.03 36,881 +7,7)4 +26.45 19,607 17,274 ,
*Jhumri Tilaiyll. N 1951 8.50 22.02 9,090 5,097 3,993
1961 8.50 22.02 21,777 +12,687 +139.57 11,849 9,928
*Ramgarh Cantt. 1951 13.90 36.00 14,775 ' 9,449 5,326
1961 13.90 36.00 20,041 +5,266 +35.64 12,233 7,808
Class IV (10,000-19,999)-1 Town
1951 13.90 36.00 14,775 9,449 5,326
1961 3.80 9.84 12,507 -2,268 -·15.35 6,388 6,119
Chatra M 1941 9,638 4,899 4,739
1951 3.80 9.84 9,911 +273 +2.83 5,028 4,883
1961 3.80 9.84 12,507 +2,596 +26.19 6,388 6,119 6(Cen.) 0-2

18
TABLE A-IV-TOWNS (AND TOWN-GROUPS) CLASSIFIED BY POPULATION IN 1961 WITH VARIATION SINCE 1941-concld.
Status Area Percentage District Name of town or of Year
,.-___ .A. __ ...... Persons Decade decade Males Females town-group town Sq_ miles Sq_Km. variation varia.tion
1 2 3 4 5 6 7 8 9 10 11
Class V (5,000-9,999)-1 Town
1941 9,638 4,899 4,739
1951 12_30 :n.86 19,001 +9,363 +97.15 10,125 8,8i6
1961 7.30 18.91 8,812 -10,189 -53.62 4,619 4,193
Barki Saraiya 1961 7.30 18.91 8,812 4,619 4,193
NOTES: (1) TowM treated as such for the first time in 1951 Census which continue as towns in 1961 Census are shown with asterisk (*) on their left.
(2) Towns treated as such for the first time in 1961 are printed in italic8.
(3) The following abbreviations have been used for the status of town :
M-Municipality N-Notified Area Cantt.-Cantonment
Where no symbol occurs but the place is shown as urban, it means that the place has been treated as town for census purposes.
TABLE A-IV-TOWNS (AND TOWN-GROUPS) CLASSIFIED BY POPULATION IN 1961 WITH VARIATION SINCE 1941
. APPENDIX
New towns added in 1961 ana towna in 1951 declassified in 1961
District Name of town
1 2
HAZARIBAGH Barki Saraiya
.Taridrih 13a!ar
NEW TOWNS A.DDED IN 1961 TOWNS IN 1951 BAS BEEN DECLASSIFIED AS RURAL
IN 1961 r----_________.A.-----...... r- ---------~------ -----.
Area Population r_________.A.~ r---.A.---. Name of town
Sq. Sq. 1961 1951 miles Km.
3 4 5 6 7
7.80 18.91 8,81Z N.A.
lZ.21 81.62 81,605 18,155
Area r-.A.----.
Sq. S~_ miles Km.
8 9
Populat.ion r-__.A.,--. 1961 1951
10 11
NOTE: Towns treated as such for the BrEIt time in 1961 are printed in italic8.

19
EXPLANATORY NOTE A TO APPENDIX TO TABLE A-IY
Constituent villages r- _.A. -,.
1951 District Name of new town Name Thana
,-____ .A. -,. no. Area in acres l'opulation
1 2
HAZARIBAGH Barki Saraiya
J aridih Bazar
District/Town Constituent villages
1 2
HAZARIBAGH
3 4 5
Saria Khurd 32 2,183.83
Nawadih 43 874.41
Barki Saria (Part) 44 1,614.07
TOTAL 4,672.31
Jaridih 19 993.22
Baidkaro 20 1,799.51
Phu8ro 67 1,073.82
Dhorhi 68 2,978.34
Jarangdih 116 969.45
TOTAL 7,814.34
SPECIAL APPENDIX TO TABLE A-IV
PART A
Statement showing the constitution of Towns
Thana Area District/Town Constituent villages no. in acreS
3 4 1 2
Hazaribagh(M) Hurhuru (Part) -concld.
Hazaribagh (Mlt HAZARIBAGR REVENUE THANA Chano I (Part)
Chapar
Nura
Okni
Nawada
Municipality
Hazari
135
136
138
139
140
141
104.52 Korra
166.74 Cantonment
193.48 Matwari
128.84 Sarle (Part)
1,869.4,8 Total
198.24
6
1,491
867
N.A.
N.A.
5,324
267
602
4,156
2,806
13,155
Thana Area no. in acres
3 4
147 330.00
148 37.62
156 505.79
157 805.40
158 150.79
159 866.81
6,423.98
'Ramgarh RAMGAlI.lI REVENUE TlIANA Kadmano. 142 168.35 (Cantt.).
Kud (Part) 143 139.17 Chhotki Sihduar (Part) 73 604.44
Sirsi no. 1 (Part) 144 137.42 Pochra 80 1,877.64
Khirgaon 145 514.76 Buzurg·Zamira 81 1,057.05
Sirka 146 106.57 Ramgarh 82 1,970.32

20
SPECIAL APPENDIX TO TABLE A-IV-contd.
PART A-conld.
Stat!3ment showing the constitution of Towns
Distric t/Town Constituent villages Thana Area Distriot/Town Constituent .vilIages Thana Area no. in aores no. inaores
2 3 4 1 2 3 4
Ramgarh Chhotki·Muram 83 132.11 Giridih (M) GIR.IDIH REVENUE THANA (Cantt.)-concld.
Patratu 84 239.77 Makatpur 95 180.74
Hesla !38/173 1,290.17 Mohuliohuan 96 186.98
Marar 144/174 1,415.23 Giridih (Part) 229 151.40
Naisarai 145/175 210.47 Barmasia 230 165.18
Total 8,797.20 Jariagadi (Part) 231 115.46
.Jhumri Tilaiya KODABMA REVENUE THANA Andudih 88 162.70 (N)t
Tundmunda 93 52.00 Tilaia 244 5,258.51
Bhandaridih (piut) 94 224.00 Asna 245 1,013.19
Mohanpur (Part) 92 100.00 BishUnpur 250 366.27
Pasra Bahiar (Part) 97 25.00 Nawada 249 248.66
Chaitadih (Part) 98 28.00 Belatanr 246 176.35
Jarbad (Part) 99 40.00 Bhaddih 247 36.64
47.37 Kamar Sali (Part) 100 50.00
Rajpura 248 Lahkhari (Part) 101 135.00
Barwadih 251 684.47 Dandiadih (Part) 102 50.00
JAINAGAB REVENUE THANA Bishunpur (Part) 103 50.00
Gumo 12 3,261.66 Jaridih Paohamba (Part) 104 150.00
Jadutanr 5 426.53 Salaia (Part) 105 100.00
Moriaon 2 869.48
\ &alyandih (Part) 106 100.00
Jhalpo 1 247.82 Total 2,066.46
Total 12,636.95
Chatra (M) CnTRA REVENUE THANA Kargali DUMBI REVENUE THANA
Chatra 175· 1,042.74 Kargali 66 716.98
Nagwa 182 629.56 Total 716.98
Kisunpur 185 600:1)2
Bind 18S 200.86 Bokaro DUMBI REVENUE THANA
Chaur 190 167.74 Gobindpur 15 4,307.33
Total 2,641.82 Total 4,307.33

21
SPECIAL APPENDIX TO TABLE ,A-IV-contd.
PART A-concZd.
Statement showing the con8titution of Pown8
D13~rictJTown Oon,~ituent villages Thana no.
Area in acres
District/Town C!onstituent villages Thana no.
Area in acres
1 2 3 4 1 2 3 4
Berma DUMRI REVENUE THANA Jaridih Bazar Jarangdih 116 969.45 -coneld.
Bermo 18 2,763.44 Total 7,814.34
Total 2,763.44 Barlci Saraiya BAOODAR REVENUE THANA /
Jaridih Bazar DUMRI REVENUE THANA Saria Khurd 32 2,183.83
Jaridih 19 993.22 Nawadih 43 874.41
Baidkaro 20 1,799.51 Barki Saria (Part) 44 1,614.07
Phusro 67 1,073.82 Total 4,672.31
Dhorhi 118 2,978.34
NOTES :(1) t Area figures as shown in column 4 of the above table differ from the area figures as given in table A-IV. These discrepancies have arisen because the area figures for Table A-IV were obtained initially from local officers, while those for the above tables have been worked out in the Census Office from available records.
(2) Towns treated as such for the first time in 1961 are printed in italic8.
(3) Towns treated as such for the first time in 1951 Census which continue all townS in 1961 Census are shown with asterisk (*) On their left.
District
1
HAZARIBAGH
PART B
Statement showing the boundarie8 of town8, with 8tatu8
Revenue Thana Town with status BoundarieS
2 3 4
Hazaribagh Hazaribagh(M) North-Villages Kolghati (Thana no. 134) and Nawdiha
Kodarma Jhumri Tilaiya (N)
(Thana no_ 162). South-Villages Masipirhi (Thana no. 120), Sirsi no. II
(Thana no. 121) andKud no. II (Thana no. 12'3). East-Villages Jabra (Thana no. 154), Lakhe (Thana no.
155) and Chano II (Thana no. 149). West-Villages Pelawal (Thana no. 130), Kasturi Khap
(Thana no. 129) and Kadma no. II (Thana nO. 128).
North-Village boundary of villages Barhoria, Dhaodhar, Pania, Karmatari and Koderma Reserved Forest. •
South-Village boundary of villages Larabad, Charji Pahari, Chanjguda Khurd, Gara Gargi, Harli, Pipradih, Dibodih and Loohni.
East-Village boundary of villages Raugania tanr, Dokrajpur, Chithi Tanr, Karma, Bhanderwa, Sangram Dih and Pipradih.
West-Thana boundary of thana Chouparan and Village boundary of villages Barwadih, Lalanandi Gihu and Maya.dih.

District
1
22
SPECIAL APPENDIX TO TABLE A-IV-concld.
PART B-concld.
Statement showing the lioundaries of towns with status
Revenue Thana' Town with status Boundaries
2 3 4
Chatra
Giridih
Ramgarh •
Chatra (M) North-Villages Mohana Dih (Thana no. 176). Pakaria (Thana nO. 174) and Bamhne (Thana no. 173).
South-Villages Arudana (Thana. no. 235). Mahapur aliaa Baulia (Thana no. 236). Lipda (Thana no. 184) and Dewaria (Thana nO. 183).
East-Villages Tunrag (Thana no. 178). Tapej (Thana no. 181) and Dewaria (Thana no. 183).
West-Villages Sajna (Thana no. 191). Kathautia.(Thana no. 189). Jaipur (Thana no. 187). Koladih (Thana no. 186) and Paradih (Thana no. 234).
Giridih (M) North-Villages Sihodih (Thana no. 45). Sirsia (than a no. 44) and Pandardih (Thana no. 43).
South-Village Kuldiha (Thana no. 228). East-Villages Garhatana (Thana no. 232) and Mangro-
dih (Thana no. 233). West-Villages Bhandaridih (Thana nO. 94). Pasra Bahiar
(Thana no. 97) and Jogitanr (Thana no. 227).
Ramgarh (Cantt.) North-Damodar River and Villages Samri alia8 Tilaiya (Thana no. 143) and Seota (Thana no. 147) of Ma.ndu Revenue Thana.
South-Villages Muram Kalan (Thana no. 91), Kander (Thana no. 92) and Siur (Thana no. 93).
Ea.st-Village Kaitha. (Thana nO. 85). West-Villages Teliatu (Thana no. 76). Barkaka.na
(Thana no. 77) and Urlung (Thana no. 78).

EXPLANATORY NOTE
I. GENERAL ECONOMIC TABLES
There are 9 Economic Tables (excluding sub-parts) compiled from information collected in the Individual Slips. Termen collectively as the General Economic Tables, these are:
B-I-Workers and non-workers clasE'ified by sex and broad age-groups.
B-II-Workers and non-workers in cities, town-groups and towns arranged territorially classified by sex and broad age-groups.
B-III Part A-Industrial classification of workers and non-workers byeducational levels in urban areas only.
B-III Part B-Industrial classification of workers and non-workers byeducational levels in rural areas only.
B-IV Part A-Industrial classification by sex and class of workers of persons at work at household industry only.
B-IV Part B-Industrial classification by sex and class of workers of persons at work in non-household industry, trade, business, profession or service.
B-IV Part C-Industrial classification by sex and divisions, major groups and minor groups of persons at work other than cultivation.
B-V -Occupational classification by sex of persons at work other than cultivation.
B-VI-Occupational divisions of persons at work other than cultivation classified by sex, broad age-groups and educational levels in urban areas only.
B-VII Part A-Persons working principally (i) as oultivators, (ii) as agrioultural labourers or (iii) at household industry classified by sex and by seoondary work (i) at household industry, (ii) as cultivator or (iii) as agricultural labourer.
B-VII Part B-Industrial classification by sex of persons working in nonhousehold industry, trade, business, profession or service who are also engaged in household industry.
B-VIII Part A-Persons unemployed aged 15 and above by sex, broa4 agegroups and educational levels in urban areas only.
B-VIII Part B-Persons unemployed aged 15 and above by sex and educational levels in rural areas only.
B-IX-Persons not at work classified by sex, broad age-groups and type of activity.
Of these, the following tables have been reproduced in this book :
B-1 B-III Part A B-III Part B B-VIII Part A B-VIII Part B B-IX
Up to district Up to district Up to anchals Up to district Up to anchals Up to anchals
The economic classification adopted in 1961 is based on the division of the entire population in two basic groups, namely, workers and nonworkers. Workers are persons engaged in the production of goods and/or exchangeable services. The Qoncept of work is not tied to the securing of an income, hence even family workers who do not receive any wages in cash or kind (but supplement the family income by engaging in any kind of productive work) have been treated as workers. On the other hand, persons who have earning, but do not work (e. g., beggars, rentiers and pensioners) are classed as non-workers. The workers have been further classified into nine industrial categories according to the sectOl' of economic activity in which they are engaged. This classification, therefore, is entirely industrial and based upon the Indian Standard Industrial Classification Scheme adopted by the Government of India. It may be noted that occupational classi.fioation has also been done, in Tables B-V and B-VI [Printed in Part II-B(ii) of this State] which,

24
however, are not reproduced in this volume. The nine industrial categories are :
I II
III
IV V
VI VII
'; . Working as Cultivat(}r. Working as Agricultural labourer.
Working in Mining, Quarrying, Livestock, Forestry, Fishing, Hunting and Plantations, Orchards and Allied activities.
Working at HouseholdIndustry. Working in Manufacturing other than Household Industry.
Working in Construction. Working in Trade and Com-
merce. V III Working in Transport, Storage
and Communications. IX Working in Other Services.
In pr~vious ~ensuses, the non-working or non -earnIng sectIOn of the population was tagged on to each livelihood class so that the total number of dependants of each livelihood class was easily determinable. In 1961, all nonworkers have been pooled together into one category and it is no longer possible to say what is the extent of dependency among persons, say, engaged in cultivation. However in accordance with the recommendations of th~ United Nations, the non-workers have for the first time in the Indian Census been further classified into the following 8 groups :
1. Full time stUdents,
2. Housewives and persons engaged in unpaid home duties,
3. Infants and other dependants including permanently disabled or old persons,
4. Retired persons, rentiers and others who are in receipt of income without any work,
5. Beggars, vagrants or independant women and others of unspecified source of existence,
6. Convicts in jail, inmates of- a penal, mental or charitable institution ,
7. Persons not employed befote but now seeking employment for the first time, and
8. Persons employed before but now out of employment and seeking work.
The particulars of the tables, reproduced herein are given below :
Table B-I-Workers and Non-workers classified by sex and Broad Age-groups
This table gives for each industrial category of workers and also non-workers the classification by sex and broad age-groups, 0-14, 15-34, 35-59 and 60+, besides the rubric "age not stated."
Oultivation involves production of crops like cereals and vegetables on land owned or held on lease. Thus, tenant cultivators are included, but not. plantation growers.
A n agricultural labourer is a person who works on another person's land for wages in cash, kind or share without having any right on the land. He has also no right to take a decision as to which crop will be sown and when.
Household industry means an industry> not on the scale of a registered factory, a conducted by the head of the household himself and/or members of the household at home or within the village in rural areas and only at home in urban areas.
" Table B-III Part A-Industrial Classification of Workers and Non-workers by Educational Levels in Urban Areas only
Table B-III Part B-Industrial Classification of Workers and Non-workers by Educational Levels in Rural A reas only
These tables give the classification of workers and non-workers by sex, literacy and educational levels separately for urban and rural areas. All persons in the age-group 0-4, are, by definition, illiterate. The classification of persons with some educational standard is common up to the stage of Matriculation or Higher Secondary for both rural and urban areas. However, in urban areas, persons with qualifications above Matriculation or Higher Secondary have been further classified into (i) persons holding technical diploma not equal to degree, (ii) non-technical diploma not equal to degree, (iii) University degree and (iv) technical degree or diploma equal to degree or ~ost-graduate degree in Engineering, Medicine, AgrIculture, Veterinary and Dairying, Technology, Teaching and Others.

25
Illiterate means a person who can neither read nor write or can merely read but not write in any language.
Literate means a person who can both read and write a simple letter.
For a literate person who had also passed a written examination or examinations as proof of the educational standard attained, the highest examination was noted in the Individual Slip. This formed the' basis for grouping under the different educational levels.
Table B-VIII Part A-Persons Unemployed Aged 15 and above by Sex, Broad Agegroups and Educational Levels in Urban Areas only
Table B-VIII Part B-Persons Unemployed Aged 15 and above by -Sex and Education~t Levels in Rural Areas only
These tables give figures of unemployed persons aged 15 and above by sex and the same educational standard as in Table B-IlI. The unemployed persons given in these tables, however, are those (i) seeking employment for the first time, (ii) having been employed before but out of employment and seeking work. Table B-VIlI Part A also show, olassifica'jion by age-groups.
Table B-IX-Persons not at Work Classified by Sex, Broad Age-groups and Type of Activity
This Table gives the figures of the nonworking population classified by sex and broad
age-groups (0-14, 15-34, 35-59 and 60+) into the S different categories of non-workers, ,/)iz.,
1. Full time students or children attending school who do no other work, such as make articles at home for sale, nor even help parttime their own family cultivation, industry, trade, or business.
2. Persons engaged in unpaid home duties (like housewives or other adult females) but doing no other work, such as make articles at home for sale or wages nor helping regularly even part-time in family cultivation, industry, trade, or business.
3. Dependants, including infants or children not attending school, persons permanently disabled from work because of illness or old age.
4. Retired persons not employed again, rentiers, persons living on agricultural or nonagricultural royalty, rent or dividend or other persons of independent means for securing which they do not have to work and who do no other work.
5. Beggars, vagrants or independent women without indication of source of income and others of unspecified source of existence.
6. Convicts in jails (undertrial prisoners were treated as workers if they used to work before being apprehended) or inmates of penal, mental or charitable institutions.
7. Persons who had not been employed before but were seeking employment for the first time during enumeration.
S. Persons employed before but out of employment and seeking work at the time of enumeration.
II. HOUSEHOLD ECONOMIC TABLES
The Household Economic Tables have been prepared from the data collected in the Household Scheq.ule canvassed for each and every household in the State. In preparing the tables, however, a 20 per cent systematic sample was drawn separately for rural and urban areas. Thus, all the tables in this series are based on a 20 per cent sample. The tables are :
B-X-Sample Households (i) engaged neither in cultivation nor in household industry, (ii) engaged either in cultivation or household industry but not in hoth and (iii) engaged
both in cultivation and household industry for all areas.
B-XI-Sample Households engaged in cultivation classified by interest in land and size of land cultivated in rdral and urban areas separately.
B-XIl-Sample Households engaged in cultivation only classified, by size of land cultivated and number of family workers and hired workers in rural and urban areas separately

B-XIII-Sample Households engaged both in cultivation and household industry showing size of land cultivated classified by principal household industry in rural and urban areas separately.
B-XIV-Sample Households engaged only in household industry classified by principal household industry in all areas.
B-XV -Sample Households engaged both in cultivation and household industry classified by size of land in rural and urban areas separately.
B-XVI-Sample Principal Household Industry classified by period of working and total number of workers engaged in household industry in all areas.
B-XVII-Sample Households classified by (i) Number of male and female members by size of households and (ii) Engagement (a) neither in cultivation nor in industry, (b) in household industry only and (c) in cultivation sub-classified by size of land cultivated.
The Household Economic Tables being reproduced in this Handbook are :
Table B-X-Sample Households (i)Engaged neither in Cultivation nor in Household Industry, (U) Engaged either In CultivatIon or Household Industry but not in both and (iii) Engaged both In Cultivation and Household Industry for All areas
This table gives the classification of sample households by the following four types of economic activity :
(i) households engaged neither in cultiva"tion nor in household industry;
(ii) households engaged in cultivation only;
(iii) households engaged in household industry only; and
26
(iv) households engaged both in cultivation and household industry.
Oultivation involves "ploughing, sowing and harvesting and does not include fruit-growing or keeping orchard or groves or working for plantations like, tea, coffee, rubber, cinchona and other medioinal plantations".
Household Industry means "Industry (not on the scale of a registered factory) conduoted by the head of the household himself and/or mainly members of the household at home or within the village in rural areas and only at home in urban areas".
Table B-XI-Sample Households engaged In Cultivation class1fl~ by Interest in Land and Size of Land C,Ultivated in Rural and Urban Areas separatelY
This table gives the classification of sample cultivating households by the following 10 sizeranges of land cultivated in aores :
Less than 1, 1.0 to 2.4; 2.5 to 4.9; 5.0 to 7.4; 7.5 to 9.9; 10.0 to 12.4 S 12.5 to 14.9; 15.0 to 29.9; 30.0 to 49.9 ; 50+ and 'unspecified'.
The information is cross-tabulated with reference to the following 3 kinds of interest in land:
(i) owned or held from Government ~
(ii) held from private persons or institutions for payment in money, kind or share ; and
(iii) partly held from Government and partly from private persons or institutions for payment in money, kind or share.
Table B-XVII-Sample Households classified by (i) NlUDber of male and female members by size of Households and (ii) Eng~gement (a) neither In Vultlvation nor In Industry, (b) In Household Industry only and (c) In

Cultivation sUb-classified by size of land cultivated
'fhis table gives the distribution of sample households by the following size-classes: (i) 1 men ber; (ii) 2-3 members; (iii) 4-6 members, (iv) 7-9 members and (v) 10 members or more. For urban areas the figures are for total sample households. For rural areas, however, the size-class of household is cross-
27 tabulated with reference to the eoonomio activity of the household, viz.,
(a) households engaged neither in cultivation nor in household industry;
(b) households engaged in household industry only; and
(c) households engaged in cultivation only.
These are further categorised into 10 sizeclasses by the extent of holdings.

District
1
HAZARIBAGH
Rural Urban
2
R
Agegroup
3
Total 0-14
15-34 3n-59
60+
28
TABLE B-I-WORKERS AND NON-WORKERS
Total Population
r--- ..A.. _____ -.
Persons Males Females
4 5 6
2,195,227 1,092,678 1,102,549 960,793 488,234 472,559 698,366 338,836 359,530 441,473 222,263 219,210
94,294 43,170 51,124
Total workers r(I-IX)
WORKERS
I As Cultivator
..A.. _____ --.
II As Agricultural
labourer
r--___..A..----. r--___..A.. r-___..A..---. Males Females Males Females Males Females
7 8 9 10 11 12
628,180 459,808 414,613 362,826 52,042 57521 60,912 46,125 36,551 33,771 7,189 6,318
315,031 246,213 196,792 194,404 27,832 31,641 217,578 153,068 152,545 122,907 15,351 18,075
34,570 14,373 28,673 11,726 1,661 1,479 Age not stated 301 175 ]26 89 29 52 18 9 8
U Total 201,184 110,825 90,359 59,045 13,215 4,382 3,521 260 247 0-14 81,640 42,381 39,259 1,674 616 255 257 27 9
15-34 72,032 40,759 31,273 32,036 7,137 1,871 1,901 131 113 35-59 40,229 24,104 16,125 22,950 4,996 1,723 1,224 80 119
60+ 7,227 3,555 3,672 2,371 466 532 139 21 6 Age not stated 56 26 30 14 1 1
TABLE B-III PART A-INDUSTRIAL CLASSIFICATION OF WORKERS AND
EducJ.tional Levels
TOTAL
Illiterate Literate (without educational level) Primary or Junior Basic Matriculation or Higher Secondary Technical diploma not equal to
degree. Non-technical diploma not equal to degree.
University degree or post-graduate degree other than technical degree.
diploma equal Technical degree or to degree or post-graduate degree Engineerillg Medicine Agriculture Veterinary and dctirying Technology Teaching Other~
Total Population of Workers and Non-workers
HAZARIBAGH WORKERS
r-------------__.A. I II III
As Cultivator As Agricultural In Mining, Quarrying, labourer 1"i vestock, Forestry,
Fishing, Hunting and Plantations, Orchards
and Allied activities r------.A.------'-. r----.A.----. r----.A.---. r---__.A.----. Persons Males Females Males Females Males Females Males Females
2 3 4 5 6 7 8 9 10
201,184 110,82.>5 90,359 4,382 3,521 260 247 13,661 4,574
120,358 52,482 67,876 3,053 3,462 208 244 7,791 4,535 47,-203 31,826 15,377 1,005 49 43 3 2,835 30 21,734 15,926 5,808 242 10 8 1,735 6
9,573 8,506 1,067 73 1 1,121 3 111i 103 12 1 11
39 20 19 2 3
1,869 1,704 165 6 138
293 2~ 35 27
103 103 16 82 72 10 3
8 8 2 2 6 6 1
91 66 25 7 1 1

CLASSIFIED BY SEX AND BROAD AGE-GROUPS
r---------III IV
In Mining, Quarry- At ing, Live3took, Household
ForiHtry, Fishing, Industry Hunting and
Plantations, Or-chards and Allied
activiti(1S
V In
Manufaotur. ing other
than Household Indllstry
WORKERS .A. _______________________ --.
VI VII VIn IX In Construction In Trade and In Transport, In Other
Commerce Storage and Services Communioatiops
X Non-workers
,-__ -"-__ --. r---.A._., ,-_.A. __ --. ,-__ .A._---., __ .A._,,-__ .A. __ , ,-__ .A. __ , ,-__ .A. __ ,
Males Femalss Males Females Males Females Males Females Males Females Males Females Males Females Males Females
13 14 15 16 17 18 19 20 21 22 23 24 25 26 27 28
62,796 9,80425,70716,36917,6672,775 4,458 306 9,544 1,177 5,734 311 35,619 8,719 464,498 642,741 7,884 1,714 6,066 3,075 1,024 376 106 37 224 64 55 35 1,813 735 427,322 426,434
3ij,350 5,364 11,113 7,857 11,674 1,601 2,649 187 4,914 436 3,392 206 21,315 4,517 23,805 113,317 18,757 2,599 7,288 4,926 4,674 738 1,577 80 3,824 559 2,207 63 11,355 3,121 4,685 66,142
794 127 1,229 510 294 59 124 2 581 118 80 7 1,134 345 8,600 36,751 11 11 1 1 1 2 1 2 1 86 Q7
13,661 4,5742,867 495 8,4(12 1,274 1,295 11 7,038 364 4,017 60 17,563 2,603 51,780 77,144 156 66 95 34 365 78 21 4 122 15 25 1 608 152 40,707 38,643
6,991 2,630 1,242 223 4,951 684 644 40 3,598 142 2,170 33 10,438 1,371 8,723 24,136 6,219 1,792 880 20!} 2,875 461 570 32 2,894 173 1,730 21 5,979 965 1,154 11,129
295 86 148 29 266 51 59 1 424 34 91 5 535 115 1,184 3,206 2 5 1 1 3 12 30
NON-WORKERS BY EDUCATIONAL LEVELS IN URBAN AREAS ONLY
DISTRICT
r-----IV
At Household Industry
r------"-----, Males Females
11 12
2,367 495
1,126 461 903 31 287 2
45 1
6
V In Manufacturing
other than Household Industry
,----"------. Males Females
13 14
8,462 1,274
3,788 1,241 3,077 20 1,083 12
444 1 4
57
9
6 2
1
WOltjl,ERS ___ .A. ________________________________ ,
VI In
Construction
r----A.----. Males Females
15 16
1,295 77
555 76 430 1 153 122
8
18
9
9
VII VIn IX X In Trade and In Transport,
Commerce Storage and Communications
,-__ .A. __ ., ,-__ .A._--.
Males Females Males Femaleb
17 18 19 20
7,038 364 4,017 60
1,311 ?49 1,478 59 3,032 14 1,258 1 1,751 1 746
809 495 1 1
132 37
2 2
2
1
In Other Services
,-__ .A. ___ ,
Males Females
21 22
17,563 2,603
5,241 2,142 5,666 114 2,537 141 2,906 110
70 7
13 19
947 42
183 28
60 62 7
8 2 3
48 21
Non·workers
,-___ .A. __ --.
Males Females
23 24
51,780 77,144
27,931 55,307 13,577 15,114
7,384 5,636 2,490 952
7 5
2
363 123
26 7
10 4 3
1 10 4
1

30
Table B-III Part B TABLE B-1I1 PART B-INDUSTRIAL CLASSIFICATION OF WORKERS AND
WORKERS
r- ________.A. ..... I II III
Educational Levels Total Population of Workers As Cultivator As Agriculturl11 In Mining, Quarryil]g, and Non-workers labollrer Livestock, Forestry,
Fishing, Hunting and Plantations, Orche-rds and Allied activities
r- """'I r--__.A. r----"-------., r----"----. Persons Males Females Males Females Males Females Males Females
2 3 4, 5 6 7 8 9 10
HAZARIBAGH
TOTAL 8,195,297 1,092,678 1,t02,549 414,613 362,826 52,042 57,52'1 62,796 9,804 Illiterate 1,929,246 857,872 1,071,374 328,709 359,797 49,626 57,444 46,180 9,743 Lit!'rate (without educational level) 203,462 177,372 26,090 71,557 2,690 2,229 73 10,419 43 Primary or Junior Basic 49,884 45,362 4,522 13,309 322 176 4 3,742 11 Matriculation and above 12,63(\ 12,072 563 1,038 17 11 2,455 7
SADAR
TOTAL 1,125,519 566tZ96 559,2.23 214,625 179,151 20,797 25,310 39,104 6,546 Illiterate 986,104 443,561 542,543 173,668 177,65! 19,725 25,273 28,135 6,502 Literate (without educational level) 108,161 94,348 13,813 35,478 1,312 1,007 34 6,618 36 Primary or Junior Basic 23,331 20,872 2,459 4,985 168 63 3 2,542 6 Ma.triculation and above 7,923 7,515 408 494 17 2 1,809 2
Barhi
Total 53,078 26,105 26,973 10,718 10,037 1,251 1,293 536 102 Illiterate 47,005 20,814 26,191 8,836 9,980 1,174 1,293 386 101 Literate (without educational level) ,4,477 3,832 645 1,567 51 68 65 1 Primary or Junior Basic 1,250 1,130 120 285 5 9 44 Matriculation and above 346 329 17 30 1 41
Barkatha
Total 46,620 2lt,575 25,045 9,812 11,145 620 875 255 28 Illitera.te 4f,988 17,276 24,712 7,786 ll,089 583 875 204 28 Literate (without eduoationallevel) 3,901 3,576 325 1,820 52 36 20 Primary or J ,mior Basic 614 606 8 201 4 1 20 Matriculation and above 117 117 5 11
Bagodar
Total 79,401 S8,801 41,100 15,611 17,321 945 1,340 148 109 Illiterate 70,799 30,448 40,351 12,565 17,192 859 1,339 673 109 Literate (without educational level) 7,256 6,561 695 2,752 107 86 1 51 Primary or Junior Basic 994 947 47 278 15 13 Matriculation and above 352 345 7 16 7 11
Bishungarh
Total 54,668 26,182 2"1,986 10,769 11,020 1,921 2,006 359 47 nliterate 49,771 22,361 27,410 8,912 10,990 1,842 2,004 301 ~7
Literate (without educational level) 3,829 3,400 429 1,634 30 76 1 30 Primary or Junior Basic 852 .710 142 206 2 1 17 Matriculation and above 216 211 5 17 1 11
Hazaribagb
Total 44,663 a2,423 22,240 7~123 6,218 1,149 1,685 208 2<3 Illiterate 38,132 16,774 21,358 5,869 6,136 1,072 1,685 158 23
Literate (without educational level) 4,448 3,840 608 1,024; 68 7,1 29 Primary or Junior Basic 1,357 1,149 208 185 12 5 14 Matriculation and above 726 660 66 45 2 1 7

31
NON-WORKERS BY EDUCATIONAL LEVELS IN RURAL 'AREAS ONLY Table B·II1 Palt B
IV A t Household
Industry
V In Manufaaturing
other than Household
I.nduBtl'Y
VI In
Construction
VII VIII In Trade and In Transport,
Commerce Storage and CommunicatIOns
._....., IX
In Other Services
X Non workeL·s
r--____..A.---........ r-___ ..A.. __ --........ r---.A.~ ............. r---..A..-........ r---..A.._-........ ,--_ ...... _-........ ,--_ ...... _--""'1
Males Females Males Females Males FeIXlales Males Females Males Females Males Fomales Males FeJnllles
11
DISTRICT
20,707 2Q.141 4,654
7S0 132
12
16,869 '16 .. 179
138 42 10
SUBDIVISION
14,019 ll,OS7 2,601
281 50
Anehal
462 314 ll2
36
Anebal
426 321
85 20
Anebal
756 562 182 12
Anchal
886 719 156
11
Anehal
187 147 36
4
6,677 6,550
85 36 6
167 165
2
184 184
290 _287
2 1
882 381
1
180 180
13
17,667 .9~$.9.2 5,737 1,267
771
9,460 5,078 3,228
596 558
1OO 61 45 13
1
25 6
12 li 2
58 29 19 4 1
68 31 20 10
2
240 134 32 73
1
14
2,775 2~740
26 6 3
15
4,458 3 ... 055 1,076
216 III
1,841 a 531 1,314 1,775
22 581 3 96 2 79
5 4 1
62 60
2
59 58 1
188 141
39 2 6
55 30 23
2
282 214
56 8 4
54 45
8 1
187 99 26
7 5
16
806 3M
5
282 232
5 5
1 1
26 26
17
9,544 2,47/j 4,992 1,812
265
4,982 1,422 2,610
725 175
284 78
108 45
3
105 17 47 39
2
824 82
207 32
3
201 62
107 30
2
106 50 42
7 7
18
1,177 1,148
26 3
III
5,734 2,642 1,801
850 441
692 3,800 682 1,521
10 1,043
95 95
18 18
28 22
1
17 16 1
88 88
479 :107
81 36 21 16
- 8
49 7
19 17
6
448 273 104 52 19
77 40 13 15
9
105 61 30 11
3
20 21
311 35,619 3D8 19,322
1 7,136 2 4,864
4,297
169 19,604 166 10,376
1 4,414 2 2,365
4 3 I
3 3
2,449
1,153 592 236 160 165
492 188 103 114
87
1,175 671 245 131 128
644 264 133 100 147
1,662 808 354 175 325
22 23 24
8,719 464,498 6421,741 8,2fJ7 :J7,5~8.'JO 61fi,417
137 67,771 22,951 192 18,346 3,940
93 2,551 433
4,595 237,874 334,510 4,315 190,774 319,855
90 36,768 12,223 113 8,740 2,128 77 1,592 304
300 11,362 283 9,196
1 1,571 8 556 8 39
131 131
193 192
1
9,786 8,134 1,411
187 4
17,959 14,520
2,859 417 163
14,965 14,262
588 107
8
12,661 12,384
273 4
21,884 21,210
584 30
58 11,708 14 893 50 10,145 13,861
7 1,223 389 1 318 138
22 5
387 11,506 292 ,8,376
9 2,196 17 668 19 266
13,624 12,870
530 179
45
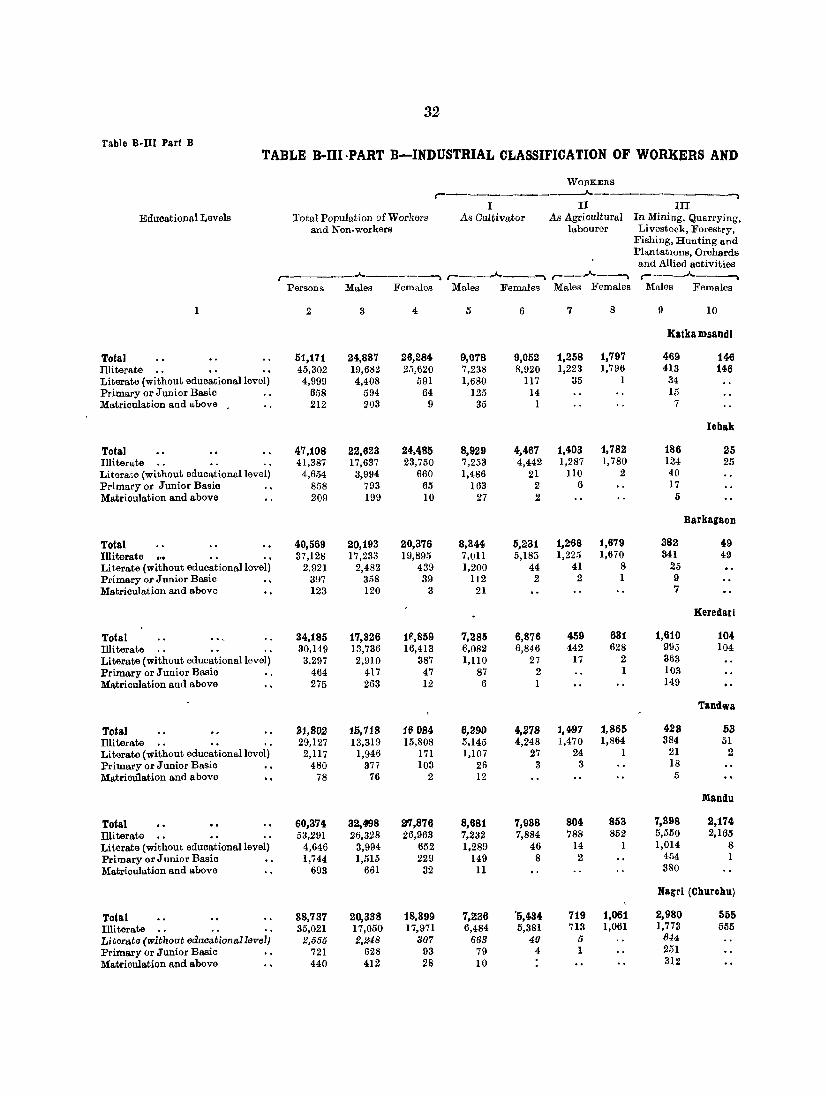

33
Table B·llI Part B NON-WORKERS BY EDUOATIONAL LEVELS IN RURAL AREAS ONLY-contd.
WORXERS
r- .A.
IV V VI VII VIII IX X At Household In Manufacturing In In Trade and In Transport, In Other Non-workers
Industry other than Construction Commerce Storage and Services Household Communications
Indust.ry
r-____.A- r-~ r---.A.----., r---"---. r-----A.--. r-~.A. __ .~ r-----A.~ Males Females Males Females Males Females Males Females Males Females Males Females Males Females
11 12 13 14 15 16 17 18 19 20 21 22 23 24
Anchal
474 455 268 40 131 12 176 82 2,28 1,357 340 11,453 14360 398 450 176. 37 95 12 101 81 187 833 335 9,018 13,843
67 4 78 2 30 64 1 31 278 2 2,111 464 9 1 7 1 4 9 9 154 i 262 47
2 2 2 1 92 2 62 6
Anchal
493 Zi35 108 19 159 37 22 (194 12,2 10610 17817 297 232 49 16 65 37 7 302 107 1l,237 17,127 175 2 56 1 75 8 199 11 1,844 624
21 1 3 1 17 5 93 3 467 fi9 1 2 2 100 1 62 7
Anchal
918 2.57 37 50 20 81 7 11 457 105 8,67'5 12,998 776 245 21 50 10 23 7 3 254 98 7,569 12,591 137 8 14 9 51 6 62 4 937 375
5 3 2 6 1 67 2 154 31 1 1 1 1 74 1 15 1
Anchal
556 283 65 10 65 4 68 10 71 4 644 2,61 6,503 8,676 475 280 23 8 47 4 27 10 19 4 380 250 5,246 8,279
79 3 28 2 12 38 29 133 5 1,101 348 2 7 1 3 14 62 6 138 :18
7 5 9 69 18 11
Anchal
357 186 26 6 21 3 12'5 14 24 5 404 84 6,546 9,590 296 185 18 5 17 3 39 14 10 5 176 84 5,764 9,349 33 3 1 3 53 10 121 571 140 22 1 5 1 27 3 78 194 99 6 6 1 29 17 2
Anehl
919 37'7 480 59 205 37 2'74 18· ~39 14 1,193 291 12,3{)5 16,115 768 369 ~27 59 87 37 78 18 115 14 746 274 10,637 . 15,291 124 4 97 65 107 72 161 8 1,051 585
26 4 38 30 58 30 147 6 581 210 1 18 23 31 22 139 3 36 29
Anehal
626 2.58 89 9 90 7 126 6 87 42 606 158 7,779 10,869 578 256 46 9 52 7 49 (} 67 42 360 149 6,928 10,505
43 2 26 33 40 9 106 2 679 254 5 1:1 1 29 9 80 5 160 84
4, 4, 8 2 00 2 12 26 6 (Cen.) C-3

34
Table B· III Part B TABLE B-III PART B-INDUSTRIAL CLASSIFICATION OF WORKERS AND
WORKERS ,-___________ -----A. _______________ "'""\
I II III Educational Levels Total Population ofWorkors As Cultivator As Agricultural In Mining, Quarrying,
and Non-workers labourer Livestock, Forestry, Fishing, Hunting and PlantatioLs, Orcha,rds, and Allied activities ,-_______ A _____ , ,-___ A __ . __ , ,-__ A __ ---, ,_-----.J--
Parsons Males Females Males Females Males Females Males Females
2 3 4 5 6 7 8 9 10
R¥lgarh
Total 68,13,9 34,625 3>3,514 13,805 9,847 812 896 2,167 624 Illiterate 57,937 26,006 31,931 10,773 9,744 752 892 1,511 616 Literate (without educational lovell 7.674 6,450 1,224 2,480 82 52 4 429 7 Primary or Junior Basic 2,143 1,799 344 513 21 8 154 1 Matriculation and above 385 370 15 39 73
Jalna-gar
Total 44,2'90 20,818 23,472 9,001 8,501 4G6 944 425 16 Illiterate 39,627 16,617 23,010 7,325 8,438 425 942 372 16 Literate (without educational level) 3,945 3,483 462 1,487 63 41 2 38 Primary or Junior Ba~ic 567 567 168 7 Matriculation and above 151 151 21 8
Gola
Total 57,2f9 28,717 28,502 12,834 8,510 948 1,120 992 220 Illiterate 49,998 22,523 27,475 10,269 8,412 905 1,113 915 219 Literate (without educationallevell 5,617 4,770 847 2,029 85 41 7 77 1 P .-imary or Junior Basic 1,474 1,302 172 "105 13 2 M,tl'iculation and "bove 130 122 8 41
Gumia
Tiltal 70,730 36,416 34,314 12,058 9,712 1,469 1,859 3,603 618 Illiterate 61,415 28,190 33,225 9,930 9,642 1,348 1,859 2,549 614 Li terate (without· educational level ) 7,359 6,457 902 1,847 59 117 847 3 Primary or Junior Basic 1,375 1,253 122 266 II 4 132 Matriaulation and above 581 516 65 15 75
Peterbar
Total 45,379 23,164 2.2,215 10,685 6,695 804 599 793 67 Illiterate 40,581 18,790 21,791 8,775 6,638 773 597 648 67 Literate (without educational level) 3,739 3,369 370 1,533 43 30 2 127 Primary or Junior Ba,sic 928 87.', 53 350 14 1 10 Matriculation and above 131 130 1 27 8
Kasmar
'Eotal 33,818 17.,433 16,385 7,883 6,985 977 664 2j26 16 illiterate 28,569 1'2,743 15,826 5,786 6,879 920 663 179 16 Literate (without educational level) 3,584 3,131 453 1,529 85 52 1 24 Primary or Junior Basic 1,452 1,348 104 521 21 .5 14 Matriculatioll and above 213 211 2 47 9
Jarldih
Total 53,307 ~7.365 25,942 12,558 5,12.8 857 540 1,058 114 Illiterate 46,838 21,388 25,450 9,774 5,090 814 539 994 113 Literate (without educational level) 5,136 4,686 450 2,365 30 36 1 49 1 Primary Of Junior Basic 1,151 1,111 4{) 404 8 7 10 Matriculation and above 182 180 2 15 0
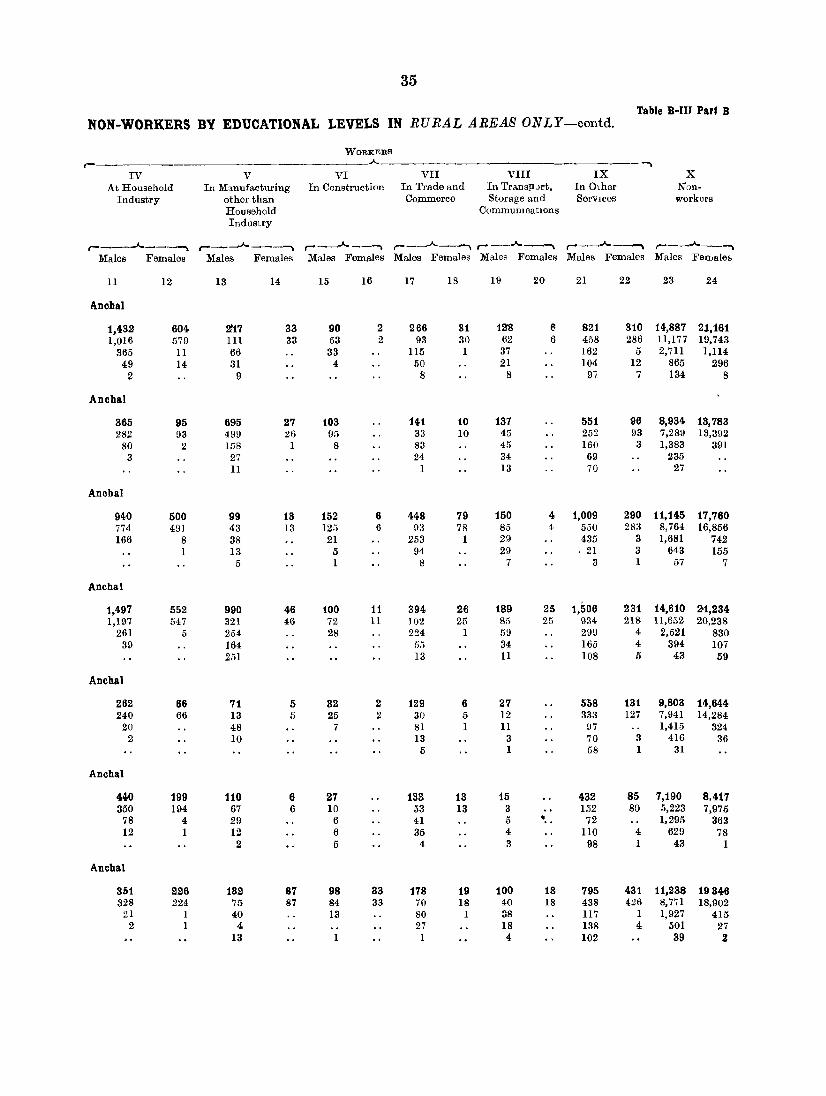
35
Table B-IIJ Par' B NON-WORKERS BY EDUCATIONAL LEVELS IN RURAL AREAS ONLY-contd.
WORKERS
,- - --"-----------------------. IV V VI VII VIII IX X
A t Household In Manufacturing In Construction In Trade and In Transpurt, In Other Non-Industry other than Commerce Storage and ServICes workers
Hou8Elhold CommullleatlOns Industry
,----"----, r----"----, r--..A..---. r---..A..-----, r --.-"----. r---"---' r----"---, Males FElmales Males Females Males Females Males FElmales Males Fomales Males Females Males Female"
11 12 13 14 15 16 17 18 19 20 21 22 23 24
Anllhal
1,432 604 2117 33 90 2 266 81 128 j! 821 310 14,887 2.1,161 1,016 579 III 33 53 2 93 30 62 6 458 286 11,177 19,743
365 11 66 33 115 I 37 162 5 2,711 1,1l4 49 14 31 4 50 21 104 12 865 296
2 9 8 8 97 7 134 8
Anchal
365 95 695 27 103 141 10 137 551 96 8,934 13,783 282 93 499 26 95 33 10 45 252 93 7,289 13,392
80 2 158 1 8 83 45 160 3 1,383 391 3 27 24 34 69 235
11 I 13 70 27
Anchal
940 500 99 13 152 6 448 79 150 4 1,009 290 11,145 17,760 774 491 43 13 125 6 93 78 85 4 550 283 8,764 16,856 166 8 38 21 253 1 29 435 3 1,681 14,2
1 13 5 94 29 . 21 3 643 155 5 1 8 7 3 1 57 7
Anchal
1,497 552 990 46 100 11 394 26 189 25 1,506 231 14,610 2>1,234 1,197 547 321 46 72 11 lO2 25 85 25 934 218 11,652 20,238
261 5 254 28 224 1 59 299 4 2,521 830 39 164 55 34 165 4 394 107
251 13 11 108 5 43 59
Anchal
262 66 71 5 32 2 129 6 2'1 508 131 9,803 14,644 240 66 13 5 25 2 30 5 12 333 127 7,941 14,284
20 48 7 81 1 11 97 1,415 324 2 10 13 3 70 3 416 36
5 1 58 1 31
Anchal
440 199 110 6 27 133 13 15 432 85 7,190 8,417 350 194 67 6 10 53 13 3 152 80 5,223 7,975
78 4 29 6 41 5 • 72 1,295 363 12 1 12 6 35 4 110 4 629 78
2 5 4 3 98 1 43 1
Anchal
351 226 132 87 98 83 178 19 100 18 795 431 11,238 19846 328 224 75 87 84 33 70 18 40 18 438 426 8,771 18,902
21 I 40 13 80 1 38 117 1 1,927 415 2 1 4 27 18 138 4 501 27
13 1 1 4 102 39 2

36
Table B-1lI Part B TABLE B-III PAR'! B-INDUSTRIAL CLASSIFIOATION OF WORKERS AND
WORKERS
r-I II III
Educational Levels Total Population of Workers As Cultivator As Agrioultural In Mining, Quarrying, and Non-workers labourer Livestock, Forestry,
F shing, Hunting and Plantations, Orcllards and Allied activities
r- ""------""""\' r-----'-----"\ r------"--~ r-Persons Males Females Males Females Males Females Males Females
1 2 3 4 5 6 7 8 9 10
Kodarma
Total 69,087 86,269 820,768 8,279 7,967 549 1,046 5,2,69 584 Illiterate 56,107 25,449 30,658 6,277 7,863 530 1,046 4,048 584 Literate (without educational level) 10,634 8,715 1,919 1,836 100 15 736 Primary or Junior Basic 1,328 1,190 138 129 2 4 325 Matriculation and above 968 915 53 37 2 160
Markacho
T,(Ital 41,736 19,265 22,471 8,825 10,904 &71 465 681 10 TIliterate 36,990 14,808 22,182 6,666 10,840 251 465 503 10 Literate (without educational level I 4,325 4,048 277 2,008 60 20 100 Primary or Junior Basic 333 321 12 144 4 20 Matrioulation and above 88 88 7 8
Patratu
Total 59,488 33,555 2'5,933 8,821 5,885 850 810 8,881 862 TIliterate 48,942 24,389 24,553 7,680 5,815 329 310 5,114 844 Literate (without educational level) 7,048 6,048 1,000 1,032 66 20 1,855 13 Primary or Junior Basic 2,191 1,882 309 99 3 1 895 4 Matriculation and above 1,307 1,236 71 10 1 5l7. 1
CHATRA
TOTAL 308,558 151,728 156,880 55,386 84,849 16,642 17,487 2,749 481 Illiterate 279,670 126,409 158,261 44,506 34,039 16,191 17,459 2,333 430 Literate (without educational level) 22,641 19,408 3,233 9,064 295 416 28 223 1 Primary or Junior Basic 5,168 4,851 317 1,615 15 27 135 Matriculation and above 1,079 1,060 1~ 151 8 58
Chauparan
Total 64,376 31,004 83,371 13,065 8,944 1,83,8 2,08,0 449 54 Illiterate 57,175 24,611 32,564 10,337 8,879 1,772 2,030 313 54 Literate (without educational level) 5,8]4 5,068 746 2,356 65 45 74 Primary or Junior Basic 1,104 1,048 56 319 15 38 Matriculation and above 282 277 5 43 6 24
Itkhorl
Total 61,428 29,486 81,937 11,699 9,089 2,662 8,287 400 a1 Illiterate 55,768 ~,347 31,421 9,080 9,021 2,596 3,287 348 21 Literate (without educational level) 3,972 3,538 434 2,056 65 64 29 Primary or Junior Basic 1,509 1,431 78 447 3 2 16 Ma.triculation and above 174 170 4 16 7
Hun'erganj
Total 51,52'0 ~5,692 25,828 '11,408 1,82~ 8,724 8,202 449 88 Illiterate 46,327 21,318 25,009 5,922 1,590 3,592 3,195 395 85 Literate (without educational level) 4,134 3,4.-l2 722 1,165 27 126 7 26 1 Primary or Junior Basio 904 810 94 286 3 6 21 Matriculation and above 155 162 3 30 7

37
NON-W-ORKERS BY EDUCATIONAL LEVELS IN RURAL AREAS ONLY-contd. Table B-lII fiatt B
WORXERIiI r ~
IV V VI VII VIII IX X At Household In Manuf~cturing In Construction In Trade and In Transport, In Other Non-
Industry other than Commerce Storage and Services workers Household Communications Industry
r - ____._ ----. ,--_ ...... --? r- _.A. __ ~ r ~-----, r----'---t r___.J........-.--, r-_.I\o.---"",\ Males Females Males Females Males Females Males Females Males Females Males Females Males Females
11 1,2 13 14 15 16 17 18 19 20 21 22 23 24
Anllhal
815 693 3;912 648 221 19 789 47 485 24 1,505 323 14,445 21,422 583 663 2,208 634 157 19 135 46 171 24 745 271 10,595 19,508 222 23 1,018 9 59 543 I 214 438 15 3,134 1,771
10 4 87 2 62 64 104 18 403 114 3 99 3 49 36 218 19 313 29
ADell,l
474 3Z2 8'12 45 14 104 13 21 1 408 72 8,145 10,639 392 321 196 45 10 23 13 6 1 206 70 6,555 10,417
81 1 170 4 72 15 95 1,483 216 5 6 45 2 101 6
1 1 3 62 6
Anchal
383 16ft 1.293 136 427 64 371 33 656 19 1,538 a46 11,335 18.212 274 158 624 129 291 64 119 32 187 17 734 216 9,037 16,968 78 2 477 5 97 179 1 238 408 10 1,664 903 27 4 63 21 57 90 2 178 13 451 283 4 2 129 2 18 16 141 218 7 183 58
SUBDIVISION
8,269 1,963 435 36 217 9 1,066 219 281 1 4,794 1,874 67,009 :1,00,461 2,816 1,949 256 31 187 9 397 214 128 1 2,984 1,833 56,611 97,296
418 14 134 1 24 526 4 105 667 17 7,831 2,873 32 38 3 4 131 1 43 557 20 2,269 278 3 7 1 2 12 5 516 4 ' 298 14
Abellal
482 2114 75 II 33 218 47 75 83S 20s 13,991 21872 328 213 30 22 61 45 27 423 197 1l,298 21,146 101 1 38 8 135 2 33 150 4 2,128 674
2 5 2 1 19 13 117 7 519 47 1 2 2 3 2 148 46 5
Anehal •
531 199 43 81 185 15 48 635 283 13,352 19,043 450 198 34 28 73 15 22 336 272 11380 18,607
74 1 7 3 87 19 84 2 1,115 366 7 1 21 6 120 6 811 69
1 4 1 95 3 46 1
Anchal
890 572 92 10 39 1 3Q3 9:1. '18 1 1,015 451 11,699 19,794 759 562 56 10 34 1 108 90 36 1 662 445 9,754 19,030 ll9 10 26 3 136 1 28 154 5 1,629 671 11 9 2 56 14 114 291 91 1 1 3 85 1 25 2

as Table s':m Part n
TABLE B-In PART B-INDUSTRIAL CLASSIFICATION OF WORKERS AND
Educational Levels Total Population of Workers and Non-workers
WORXERS r-----_____ __A. _____________ ---.
I II III As Cultivator As Agricultural In Mining, Quarrying,
labourer Livesto'lk, ForeStry, Fishing, Hunting and Plantations, Orchards and Allied activities
r------.A..-___ ..... r----.A..---. r---.A..--. r--_..A._---.
Total Illiterate
1
Literate (without educational level) Primary or Junior Basic Matriculation and above
Total Illiterate Literate (without educational level) Prbnary or Junior Basic Matriculation and above
Total illiterate Literate (without educational level) Primary or Junior Ba-ic Matriculation and above
TOTAL Illiterate Literate (without educational level) Pri;mary or Junior Basic Matriculation and above
Total Illiterate Literate (without educational level) Primary or Junior Basic Matriculation and above
Total Illiterate Literate (without educationallev'el) Primary or Junior Basic Matriculation and above
Total Illiterate Literate (without educational level) Primary or Junior Basic Matriculation and above
Persons Males Females Males Females Males Females Males Females
2
40,053 36,825
2,717 382 129
44,494 40,885
2,927 608
74
46,693 42,690
3,077 661 265
761,150 663,472
72,660 21,385
3,633
41,653 36,935
3,642 960 116
35,822 31,681 3,200
731 210
25,562 21,875
2,656 916 115
3
2Q,291 17,695
2,124 347 125
21,682 18,460 2,561
587 74
23,573 19,978
2,705 628 262
374,654 287,902
63,616 19,639 3,497
20,225 16,058 3,165
892 110
• 17,7<93 14,165 2,806
619 203
121,181 9,064 2,153
851 113
4
19,762 19,130
593 35
4
2,2-,812 22,425
366 21
28,l~0 22,712
372 33
3
386,496-375,570
9,044 1,746
136
21,428 20,877
477 68
6
18,029 17,516
394 112
7
18,381 12,811
503 65
2
5
6,259 5,189
945 108
17
8,241 6,704 1,249
263 25
8,779 1,274 1,293
192 20
144,652 110,535
27,015 6,709
393
6,349 4,938 1,187
220 4
6,610 5,435 1,049
125 I
4,597 3,308
962 306
21
6
2,686 2,581
53 2
6,20[1 6,158
43 5
5,854 5,810
42 2
149,826 148,104
1,083 139
7,811 7,747
60 4
7,051 6,999
52
4,605 4,557
37 11
7
2,726 2,690
35
1
2,388 2,351
36 I
8,804 3,190
110 3
14,603 13,710
806 86
1
8
2,738 2,730
8
2,862 2,862
3,368 3,355
13
14,724 14,712
11 1
7'92 1,094 769 1,093 22 1
1
486 480
6
1,070 1,029
40 I
543 543
1,179 1,175
4
9 10
Partap Pur
785 661
34 30 10
852 296
41 11
4
864 320
19 19
6
20,943 15,712
3,078 1,065
588
2,165 1,721
300 92 52
1,265 920 175
99 71
lQS 65
6 23
9
181 181
Chatra
28 28
SImaria
61 61
GIRIDIH
2,827 2,811
6 5 5
Gawan
90 90
Tisri
53 53
Sat&awan
~9 29

39
NON-WORKERS BY EDUCAT~ONAL LEVE:LS IN RURAL AREAS ONLY -contd. Table a·m lIatt B
WOBKERR r-----~~~--------_ ------.~.A. .,
IV V VI VII VIn IX X At Household In Manufacturing In In Trade and In Transport, In Other :Non-workers
Industry other than Constructi<)n Com.merce Storage and Service8 Household CommunicatlOns Industry
r-------"----, r--___;o.. r--__.J....-....._~ ,-______-A. __.__...., r--___..A..--. ,-__.A----, r---....... _--. Males Females Males Females Males Females Males Females Males Females Males Females Males Females
11 12 13 14 15 16 17 18 19 20 21 22 23 24
Anchal
659 468 98 7 48 219 28 48 987 518 8,52.2 .:13,19:1 591 461 64 6 41 105 27 27 753 516 7,514 12,028 of} 2 28 1 2 96 1 18 105 1 802 527 8 1 16 2 58 1 124 32 1 2 1 71 22 4
Anchal
2)75 181 88 12 2.p 75 25 18 671 a98 9,554 18,205 252 181 53 12 20 24 24 14 519 292 8,227 12,868 20 19 37 1 67 1,091 323 3 15 14 I 3 52 1 225 14 1 33 11
Anchal
482 884 44 5 51 8 66 18 14 578 191 9,891 18,858 436 334 19 3 42 8 26 13 2 291 III 8,378 13,017 45 16 8 35 6 107 5 1,066 312 1 7 1 1 5 5 96 5 299 25 2 1 1 84 148 2
SUBDIVISION
8,419 7,729 7,772 1,398 1710 65 3,546 266 2,108 141 11,291 2~250 159,615 207,770 6,238 7,680 4,508 1,395 1,093 60 656 252 993 141 5.962 2,149 128,445 198,266 1,635 39 2,375 3 471 5 1,856 12 653 2,055 30 23,172 7,855 467 6 633 116 956 2 828 1,942 59 7,337 1,534 79 4 206 30 78 129 J.,332 12 661 ll5
Anchal
838 404 207 83 16 305 17 82 956 264 8,515 11,665 581 398 109 83 10 68 17 32 630 262 7,200 11,187 210 6 87 4 140 39 166 1,OlO 410 47 11 2 97 11 ll9 2 292 62 41 13 6
Anohal
1,4al 1,881 684 149 88 1 155 25 29 470 64 6,640 8,762 972 1,380 489 149 22 27 23 5 219 54 6,596 8,314 275 1 lI6 90 1 15 1{}2 4 888 336 109 58 8 27 1 7 35 4 151 107 65 21 3 11 2 24 2 5 5
Anchal
82-9 156 13 8 149 47 21 815 91 5,581 7,274 235 152 3 I 46 45 6 124 81 4,247 6,772 79 4 7 2 71 2 12 44 1 930 466 14 2 32 3 79 8 391 46 1 1 68 1 13 1

40 'table B·III Paft :a
TABLE B-III PART B-INDUSTRIAL OLASSIFICATION OF WORKERS AND
WORKERS
r- .A. ., I II III
Educational Levels Total PopUlation of Workers As Cultivator As Agricultural In Mining, Quarrying, and Non.workers labourer Livestock, Forestry,
Fishing, Hunting and PIs.ntations, Orohards and Allied activities
r-------"- r-___.A. r-__"""'__' ,J._
Persons Males Females Males Females Males Females Males Females
1 2 3 4 5 6 7 8 9 10
Jamua
Total 82,899 88,98. 408845 17,842 19,878 1,158 1,820 484 55 TIliterate 70,839 28,454 42,385 12,360 19,401 1,062 1,320 372 54 Literate (without educational level) 8,344 7,281 1,063 3,669 245 86 59 1 Primary or Junior Basic 3,102 2,909 193 1,249 30 10 41 Matriculation and above 344 340 4 64 12
Deorl
Total 56,562 27,493 29,069 13,437 12,645 1,452 1,897 111 9 illiterate 49,796 21,374 28,422 10,030 12,529 1,407 1,397 8:). 9 Literate (without eduoationallevel) 4,912 4,378 534 2,594 99 37 12 Primary or Junior Basic 1,689 1,576 113 774 17 8 15 Matriculation and above 165 165 39 3
DhallWar
Total 75,297 85,157 40,140 14,059 12,269 2,084 1,948 204!6 28 Illiterate 65,206 26,042 39,164 10,027 12,198 1,830 1,947 173 28 Literate (without educational level) 7,453 6,612 841 3,145 61 239 1 39 Primary or Junior Basic 2,333 2,198 135 822 10 14 20 Matriculation and above 305 305 65 1 14 ...
BIrDI
Total 48,925 U,S»9 18,526 9,610 12,012 626 1,018 414 58 TIliterate 43,581 17,618 ~5,963 7,390 11,968 579 1,018 366 53 Literate (without educational level) 3,940 3,448 492 1,716 39 45 30 Primary or Junior Basic 1,279 1,209 70 483 5 2 14 Matriculation Bnd above 125 124 1 21 4
GJrfdih
Total 87,818 44,2158 , 48,060 8,792 7,784 1,165 1,0a7 8,008 806 Illiterate 72,885 32,107 40,778 6,545 7,699 1,106 1,027 5,367 792 Literate (without educational level) 11,296 9,285 2,011 1,811 77 53 2,028 4 Primary or Junior Basic 2,458 2,231 227 387 8 6 429 5 Matriculation and above 674 630 44 49 184 5
Beagabacl
Total 48,921 23,944 14,957 10,546 12~47e 574 594 617 72 TIliterate 42,652 18,216 24,436 7,535 12,362 527 691 550 72 Literate (without educational level) 4,849 4,428 421 2,585 103 41 3 87 Primary or Junior Basic 1,256 1,160 96 412 11 6 29 Matriculation and above 164 160 4 14 11
Oanele
Total 56,684 28,126 27,958 12,606 10,521 1,557 1,455 1,416 169 Illiterate 60,410 22,986 27,424 9,785 10,436 1,482 1,464 1,339 169 Literate (without educational level) 5,560 5,073 487 2,610 79 74 66 Primary or Junior Basic 570 528 42 187 .6 1 1 7 Matrieulation and above 144 139 I) 24 4
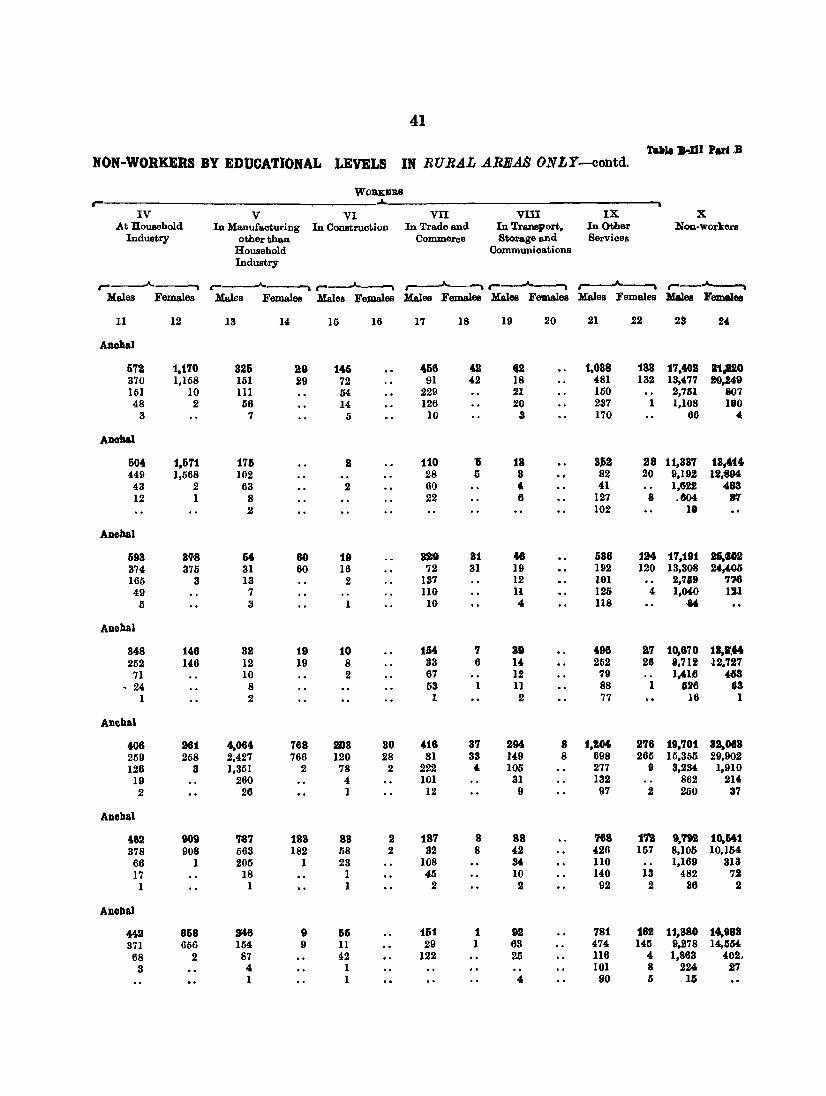
41
Table :B-JlI Par',]I HON-WORKERS BY EDUOATIONAL LEVELS IN RURAL ABBAS ONLY-contd.
WOBltmRfl r- .A.
IV V VI VII VIII IX X At Household In Manufacturing In Construction In Trade and In Transport, In Other NOll-workers
Industry other than Commerce Storage and Services Household Conununications Industry
r---A r--A. r----"------"I ~-~ r----"-~ r---'----"\ r-.A.----. Males Females Males Females Males Fe~es Males Females Males Females Males Females Males Females
11 12 13 14 15 16 17 18 19 20 21 22 23 24
Anual
572 1.170 825 19 1405 456 42 62 1.088 188 17,402 11_a10 370 1,158 151 29 72 91 '2 18 '81 132 13,477 !O,M9 151 10 III 54 229 21 150 2,751 &07 48 2 56 14 126 20 237 1 1,108 110
3 7 5 10 3 170 66 4:
AllOW
504 1,671 176 2 110 15 18 8~2 28 11,887 18-"4 449 1,568 102 28 5 a 82 20 9,19% 12,394 43 2 63 2 60 4: 41 1,622 433 12 1 8 22 6 127 8 .804 fJ!1
2 102 1.
Allobal
698 8~8 54 eo 19 &S9 81 46 686 194 17,191 ,,102 374 375 31 60 16 72 31 19 192 120 13,308 M,405 165 3 13 2 137 12 101 2,7111 776 49 7 no u 125 4 l;~ lSl 5 3 I 10 4: 118 '"
Allohal
848 148 82 19 10 154 '1 a9 496 2.7 10;670 18,1',14 252 146 12 19 8 33 6 14 252 26 8,712 12,727
71 10 2 67 12 79 1,416 433 - 24 8 63 11 88 1 G1I6 83
1 2 1 2 77 16 1
Ancbal
408 H1 4,084 768 208 80 416 87 2M 8 1,aM 2'16 19,701 82.,088 259 258 2.427 766 120 28 81 33 149 8 698 265 15.355 29,902 126 3 1,351 2 78 2 222 4 105 277 9 8,234 1,910 19 260 4 101 31 132 862 214 2 26 1 12 9 97 2 250 37
Allobal
462 909 '187 188 88 2 187 8 88 768 112 9,'192 10.541 378 908 563 182 58 2 32 8 42 426 157 8,105 10,154 66 1 205 1 23 108 34 110 1,169 813 17 18 1 45 10 140 13 482 72
1 1 1 2 2 92 2 36 2
Anobal
442 868 9406 9 55 161 1 92 781 18l! 11,880 14,988 371 656 104 9 11 29 1 63 474 145 9.278 14,5154 68 2 87 42 122 25 116 4 1,863 402, 3 4: 1 101 8 224 27
1 1 4 90 li 15

42
Table B-III Part S TABLE B-III PART B-INDUSTRIAL CLAsSIFICATION OF WORKERS AND
WORKERS ,-_____________ .A.---.:. ___________ .,
I II III Educational Levels Total Population of Workers As Cultivator As Agricultural In Mining, Quarrying,
and Non-workers labourer Livestock, Forestry, Fishing, Hunting and Plantations, Orchards
and Allied activities r-
.A. _____ ., ,-___ .A._~ ,-__ .A. __ --. ,-___ .A.
Persons Males Females Males Females Males Females Males Females
1 2 3 4 5 6 7 8 9 10
Dumrl
Total 71,621 86,227 85,8.94 15,068 15,890 1,780 1,590 527 86 illiterato 63,031 28,532 34,499 11,970 Hi,804 1,(j~4 1,590 444 86 Literate (without educationallevel) 5,883 5,362 521 2,325 70 79 46 Primary or Junior Basic 2,463 2,104 359 724 16 27 27 Matriculation and above 244 229 15 49 10
Nawadih
Total 62,869 81,860 81,009 18,390 15,695 690 605 1,557 109 Illiterate 55,943 25,391 30,552 11,042 15,589 657 604 1,352 109 Literate (without educational level) 4,829 4,415 414 1,796 97 28 1 149 Primary or Junior Basic 1,471 1,428 43 543 9 5 48 Matriculation and above 126 126 9 8
Plrtanr
Total 41,307 20,756 20,551 9,714 8,473 1,074 778 280 ,32 Illiterate 37,186 17,221 19,965 8,141 8,417 1,028 777 234 32 Literate (without educationallevel) 2,965 2,497 468 1,185 49 41 1 27 Primary or Junior Basic 984 870 114 371 7 5 15 Matriculation and above 172 168 4 17 4
Ber,mo'
Total 26,485 15,136 11,849 2,582 2,418 145 176 3,690 1,236 illiterate 21,452 10,674 10,778 2,029 2,398 130 176 2,728 1,235 Literate (without educational level) 3,131 2,713 418 381 15 15 554 1 Primary or Junior Basic 1,173 1,064 109 106 5 206 Matriculation and above 729 685 44 16 202

43
NON-WORKERS BY EDUCATIONAL LEVELS IN RURAL AREAS ONLY-coneld. Table B-III Patt II
WORKERS r -----------..... -~ IV V VI VII VIII I~ X
At Household In Manufaeturing In In Trade and • In Transp()rt, In Other Non-workers Industry other than Cons~ruction Commerce Storage and Services
Household Communications Industry
r-..A..-_","",\ r~-..A..---","",\ r--..A.. __ ","",\ r--..A..~-","",\ .--..A.._","",\ r--..A..--","",\ r--..A..-~ Males Females Males Females Males Females Malas Females Males Females Males FemalO;>8 Males Femalea
11 12 13 14 15 16 17 18 19 20 21 22 23 24
Ane.bal
864 214 121 2 326 11 886 18 398 1,466 859 15,391 17,229 648 212 47 2 285 II 38 13 175 877 351 12,474 16,430 159 2 53 72 145 131) 257 3 2.087 446 57 21 17 151 61 254 5 765 338
2 2 23 78 65 15
Anchal
1,276 326 44 3 204 2 814 14 528 1 840 77 121,52'2 14,177 1,072 319 20 3 144 2 43 12 :lO3 1 507 76 10,251 13,837 151 4 14 44 180 2 125 124 1 1.804 309 53 3 10 15 88 83 139 444 31
1 3 12 70 23
Anchal
259 132 4S 8 17 214 7 27 663 2~5 8,465 10901 197 131 5 3 12 26 5 6 325 218 7.247 10,882 50 1 27 108 2 8 83 3 968 412 12 8 5 69 13 133 4 239 103 3 11 122 11 4
Anchal
105 as 977 90 594 19 270 12 389 132 1,406 248 5,0218 6,995 80 19 445 90 384 16 42 11 158 132 675 242 4,003 6,459 21 231 146 3 177 1 102 315 5 771 393 3 162 49 85 61 233 1 209 103 I 4, 189 15 16 68 183 45 40

4.4
TABLE B-VIII PAllr A-PERSONS UNEMPLOYED AGED 15 AND ABOVE BY SEX, BROAD AGgGROUPS AND -EDUCATIONAL LEVELS IN URBAN AREAS ONLY
Educational Levels Total Unemployed
HAZARIBAGH DISTRICT
SEEKING EMPLOYMENT FOR THE FIRST TIME r-
AGE-GROUI'S
r----------------------~~-------------------------~ Total 15-19 20-24 25-29 30-34 35+ Age not
stated ,_ r --\" 1f"""__.1\.-.." .r-...... --. r-...... --"'\ r__.A.--",\ r ...... .." r ...... .." r ...... .." Persons Males Females M F M F 111 F M F M F M F M F
1 2· 3 4 5 6 7 8 9 10 11 12 13 14 15 16 17 18
TOTAL 2,117 2,056 61 1,115 16 424 5 882 4 186 3 58 3 64 1 1
nliterate 965 912 53 412 12 177 4 99 3 72 1 33 3 31 Literate fwithout educational level) 480 478 2 270 93 94 47 16 20 Pri;mary or Junior Basic 412 411 1 268 1 III 96 44 1 7 10 Ma.triculation or Higher Secondary 228· 224 4 146 2 43 1 79 19 1 2 2 1 Technical diploma not equal to degree.
Non.technical diploma not equal to· degree.
University degree or post·graduate 31 30 1 18 1 13 1 4 1 degree other than technical degree.
Technical degree or diploma equal 1 1 1 1 to degree or post.graduate degree.
1 1 1 Engineering 1 :Medicine Agriculture . Veterinary and dairying ..... Technology Teaching .. .. .. Others
PERSONS EMPLOYED BEFORE BUT NOW OUT OF EMPLOYMENT AND SEEKING WORK r
r EducaMonal Levels Total 15-19 20-24
r__.l\.--" r__.l\.--" r__.A.-.." :M F :M
19 20 21
TOTAL 941 45 187
miterate 500 Literate( without educational level) 208 Primary or Junior Basic 143 Matrioulation or Higher Secondary 78 Technioal diploIDa not equal to degree.
Non.technical diploma not equal to degree.
University degree or post.graduate 12 degree other than technical degree
Technical degree or diploJIla equa1 to .. degree or post-graduate degree.
Engineering Medicine Agriculture Veterinary and dairying Technology Teaching Others
41 109 2 31
32 2 15
F M F
22 23 24
8 166 18
1 63 11 1 37 1
35 1 25 1
6
...... AGE-GROUI'S
A
25-34 35-44 45-59 60+ Age not stated
r-...... ___.... r-...... ___.." r-...... -.." r--...... _-" r ...... ., M F M F M F M F :M F
25 26 29 28 29 30 31 32 33 34
916 7 126 9 128 12 117 1 1
90 7 67 9 70 12 100 1 1 63 34 .. 31 12 48 9 17 2 14 13 9 2
,0
1 3 1 1

45
TABLE B-VIII PART B-PERSONS UNEMPLOYI;D AGED 15 AND A80VE BY SEX, AND EDUCA-TIONAL LEVELS IN RURAL AREAS ONLY
RURAL UNEMPLOYED lIY EDUOA7IONAL LEVELS District/ r-- A
7 Subdivision I Total Unemployed Illiterate Literate (without Primary or Matrioulation Anohal eduoational level) Junior Basio and above
r--____.A.. r---~------' r--____A.-----. r--.A.-----, r-__.A.-~ P M F P 111 F P M F P M F P M F
1 2 3 4 5 6 7 8 9 10 11 12 13 14 15 16
HAZARIBAGH 1,813 1,768 45 80, 761 43 501 500 1 333 332 1 175 175
Sadar Subdlvlsilm 1,022 998 24 441 418 23 298 295 1 179 179 ~06 106
Barhi 74 74 32 32 25 25 12 12 5 5 Barkaths. 16 16 5 5 8 8 2 2 1 1 Bagodar 33 33 3 3 11 11 15 15 4 4 Bishungarh 12 12 4 4 1 1 4 4 3 3 :fIazaribagh 25 25 6 6 3 3 5 5 11 11 Katkamsandi 7 7 5 5 2 2 Ichak 24 24 5 5 9 9 6 6 4 4 Barkagaon 49 49 10 10 24 24 12 12 3 3 Keredari 62 62 32 32 21 21 3 3 6 6 Tandwa Mandu 93 91 2 43 41 2 25 25 21 21 4 4 Nagri (Chul'chu) 12 12 12 12 R~garh 121 118 3 54 52 2 33 32 27 27 7 7 Jainagar 19 19 18 18 1 1 Gola 13 13 1 1 7 7 5 5 Gumia 67 66 1 5 4 1 27 27 19 19 16 16 Peterbar 30 30 9 9 7 7 9 9 5 5 Kasmar 14 14 4 4 1 1 3 3 6 6 .1aridih 8 8 1 1 6 6 1 1 Kodarma 195 189 6 111 105 6 66 66 7 7 11 11 Markacho I 6 6 4 4 1 1 1 1 Pattatu 142 142 84 84 27 . 27 20 20 11 11
Chatra SubdiVision 96 95 1 40 89 1 26 26 21 21 9 9
Chauparan 52 52 28 28 14 14 6 6 4 4 Itkhori Hunterganj 32 32 8 8 11 11 11 11 2 2 Pratap PUI' 5 5 1 1 1 1 3 3 Chatra. 7 6 1 3 2 1 4 4 Simaria.
EUrldlh Subdivision 696 675 20 323 804 19 179 179 1~ 182 1 00" 80
Gawan 36 32 4 -22 18 4 7 7 5 5 2 2 Tisri 3 3 3 3 Satgawan 4 4 I 1 2 2 1 1 Jamua 20 20 5 5 9 9 6 6 Deori 7 6 1 1 1 1 1 3 2 1 2 2 Dhs.nwar 1 Birni 11 11 1 1 1 1 8 8 1 1 Giridih 306 292 14 173 159 14 88 88 27 27 18 18 Bengabad 9 9 a 3 4 4 .. 2 2 Gande 22 22 12 12 7 7 2 2 1 1 Dumri 25 25 3 3 7 7 13 13 2 2 Nawadih 27 27 9 9 8 8 8 8 2 2 Pirtanr 10 10 1 1 3 3 5 5 1 1 Bermo 215 214 1 95 94 1 51 51 47 47 220 22

46
Table B-IX
TABLE B-IX-pERSONS NOT AT WORK CLASSIFIED BY SEX,
Disbriot/Subdivision{Anchal Total Total non-working population Full tim€) students Household duties Rura.l Age-gToups Urban r--_h ..." ,---.A.____..-, ,...___.Jo..
Persons Males Females Males Females Males Females
1 2 3 4, 5 6 7 8 9 10
HAZARIBAGH T TOTAL 1,236,183 516,278 719,885 114,645 21,688 587 388,881 0-14 933,106 468,029 465,077 94,812 20,363 155 33,950
.. 15-34 169,981 32,528 137,453 19,777 1,303 277 127,101 35-59 83,nO 5,839 77,271 48 17 128, 62,518 60+ 49,141 9,784 39,957 29 10,27S Age not stated 225 98 121 10 6 36
R TOTAL 1,107,289 464,498 642,741 94,270 13,026 480 199,957 0-14 853,156 427,322 426,434 79,870 12,564 138 31,645 1~34 137,122 23,805 113,317 14,361 449 187 105,816 35-59 70,827 4,685 66,142 32 11 84 53,132 60+ 45,351 8,600 36,751 21 9,340 Age not sta.ted 183 86 97 7 2 24,
V TOTAL 128,924 61,780 77,144 20,876 8,688 157 88,984, 0-14 79,350 40,707 38,643 14,942 7,799 17 2,305 1~34 32,859 8,723 24,136 5,416 854 90 21,285 35-69 12,283 1,154 11,129 14 6 42 9,384 601+ 4,390 1,184 3,206 8 938 Age not stated 42 12 30 3 3 12
Sadar SubdivisIon R Total 572,384 237,874 384,510 50,948 7,476 38& 108,950 0-14 435,524 216,994 218,530 42,933 7,233 135 17,874
15-34 75,915 13,801 62,114 7,991 232 172 58,195 35-59 37,846 2,666 35,180 17 9 66 28,627 60+ 22,942 4,334 18,608 16 4,730 Age not stated 157 79 78 5 2 24
1. Barhi R Total 26,327 11,362 14,965 2,453 349 3,804 0-14 20,995, 10,529 10,466 2,104 342 682
15-34 2,831 540 2,291 3(9 7 2,159 35--59 1,290 72 1,218 807 60+ 1,211 221 990 156
Age not stated
2. Barkatha R Total 22,397 9,736 12,661 1,961 167 3,047 0-14 18,592 9,294 9,298 1,800 164 681
15-34 ,1,760 224 1,536 161 3 1,465 35-59 973 25 948 708 60+ 1,072 193 879 193 Age not stated
3. Bagociar R Total 39,783 17,959 21,824 3,814 321 6 6,240 0-14 32,953 16,675 16,278 3,174 319 2 1,303
15-34 3,364 785 2,579 631 2 3 2,354 35-59 1,744 108 1,636 9 1 1,290 60+ 1,721 390 1,331 293 Agenotstated 1 1
" Biahllngarh R Tota.l 26,101 11,7OS 14,393 1,994 264 2,870 0-14 22,393 11,218 11,175 1,798 257 581
15-34 1,642 279 1,363 196 7 1,280 35-59 1,062 58 1,004 813 60+ 1,001 152 861 196 Age not stated 1 1

47
Table B-JX
BROAD AGE-GROUPS AND TYPE OF AOTIVITY
Dependants, Retired, rentier Beggars, vagl'ants, Inma.tes of Persons seeking Persons employed infants and or independent etc. penal, mental employment for before but now
disabled means and charitable the first time out of employment institutions and seeking work
r-~""--"'\ ,-~Jo._~ ,----"---'--"""\ ,---A.-----",\ ,-__.A._",,"\ c--.A..-",,"\ District/Sub.
Males Females Males Females Males Females Males Females Males Females Males Females division! Anchal
11 12 13 14 15 16 17 18 19 20 21 22 1
31'13,062 462,384 1,142 1,Ol!! 775 760 1,181 80 2,400 53 2,486 68 HAZARIBAGH 371,861 410,702 1 3 68 40 70 4 246 12 816 3
8,449 8,842 21 21 235 102 649 14: 1,989 37 1,131 33 4,030 13,990 348 416 311 292 418 9 158 4: 407 27 8,636 28,764 772 581 161 326 44 3 11 131 5
86 86 1 1
365,479 428,204 578 799 617 868 1,172 27 1,177 37 77£ 23 347,006 382,168 1 3 54 36 69 3 138 12 46 3
6,901 6,914 18 14 194 79 643 13 939 22 562 10 3,503 12,398 166 322 239 262 416 8 92 3 153 6 7,990 26,653 393 460 130 291 44 3 8 14 4:
79 71
27,583 34,180 564 222 158 92 9 3 1,223 16 1,711 45 24,855 28,534 14 4 1 1 108 770
1,548 1,928 3 7 41 23 6 1 1,050 15 569 23 627 1,592 182 94 72 30 2 1 61 1 254 21 646 2,111 379 121 31 85 8 117 I
7 15 1 1
183,835 217,639 175 125 268 273 1,158 21 722 15 381 11 Sadar SubdivisIon 173,729 193,894 2 23 23 69 2 84 2 21
4,034 3,607 9 12 96 40 637 12 567 10 295 6 1,904 6,392 4S 40 94 100 409 4 65 3 63 5 4,094 13,694 US 71 55 110 43 3 6 2
74 62
8,801 10,786 1 19 22 1 4 64 23 1. ~arhi 8,410 9,442 1 1 12 I
121 120 7 2 3 43 20 60 396 6 14 1 4 2
210 828 1 5 6 5
7,752 9:427 1 6 19 1 14 2 2. Barkatha 7,493 8,450 I 2 1
44 67 4 I 13 2 24 237 3 I
191 .1>73 ~ 1 13
14,053 16,231 19 8 33 23 25 1 I) 3. Bagodar 13,491 14,650 7 (} 1 1
115 218 1 2 7 3 23 I)
75 337 4 1 ]4 8 1 4 371 1,026 H (} 5 7
1
9,688 11,238 3 8 11 13 6 6 4. Bishungarh 9,419 10,337 1
70 75 2 1 5 6 54 187 1 3 3 1
144 639 3 7 I) 9 1

48
Table a-IX
TABLE B-IX-rBRSONS NOT AT WORK CLASSIFIED BY SEX,
Distriot/Subdi visionf,Anobal Total Total non-working population Full time students Household duties Rural ~.groUp8 Urban r- ..... _-""'\ ,--_ _.A..
Persona Hales ' Females l\f.a.les Females Hales FemuJee
1 2 3 4: 5 6 7 8 9 10
5. Hazaribagh B Total 25,130 11,506 13,624 2,489 412 3,929 0-14 17,963 9,15& 8,804 1,861 383 652
15-34: 4,102 1,1I73 2,529 623 29 2,100 35-59 2,026 536 1,490 1,101 60+ 1,015 214 801 176 Age not stated 24 24 I)
6. Ka.tklloll1sa.ndi B Total 25,813 11,453 14,360 2,509 295 4,069 6-14 20,660 10,605 10,055 2,096 282 794
15-34 2,783 671 2,212 411 13 2,056 35-59 1,346 76 1,270 2 1,010 60+ 1,024 201 823 210
Age not stated
7. Iohak B Total 28,427 10,610 17,817 2,610 349 7,673 0-14 19,282 9,550 9,732 2,152 338 787
15-34 5,092 745 4,347 458 II 4,050 35-59 2,892 123 2,769 2,482 60+ 1,161 192 969 864 Age not stated
8. Barkagaon R Total 21,673 8,675 12,998 1,481 176 4,825 0--14 16,036 7,958 8,078 1,292 172 1,002
15-34 2,998 423 2,575 189 4 2,421 35-59 1,668 107 1,561 1,230 60+ 971 187 784 172 Age not sta.ted
9. Keredari B Total 15,179 6,503 8,676 1,356 252 2,177 0--14 12,278 6.091 6,187 1,219 248 439
15-34 1,610 232 1,278 137 4 1,164 35-59 785 56 729 495 60+ 606 124 482 79 Age not stated
10. Tandwa R Total 16,136 6,546 9,590 983 132 2,965 0--14 12,667 6,185 6,482 892 131 625
15-34 1,827 203 1,624 91 1 1,532 36-59 1,073 37 1,036 795 60+ 669 121 448 113 .Age not stated
11. Manda R Total 28,420 12,305 16,115 2,217 404 10 4,489 0-14 23,148 11,413 11,735 1,940 396 2 1,096
15-34 2,960 511 2,449 277 7 6 2,303 35-59 1,310 120 1,190 1 2 892 6'0+ 994 258 736 198 Age not stated 8 3 5
12. Nagri (Churohu) R Total 18,648 7,779 10,869 1,018 176 3,084 0-14 14,816 7,217 7,599 886 172 525
10-34 2,16.9 336 1,833 132 4 1,709 35-59 1,082 107 975 750 60+ 669 107 162 100
Aaenotstated 12 12

49
Table B-IX
BROAD AGE-GROUPS AND TYPE OF ACTIVITY-oonttl.
Dependants, Retired, rentier Begga.rs, vagrants, Inmates of Persons seeking Persons employed infants and or independent etc. penal, mental employment for before but noW
disabled means and oharitable the first time outofemployment institutiona and seeking work
r----'-----"" r----'-----"" r-__..\,----"" ~ r-__..\,---. r-__..\,---. Distriot/Sub. division/Anohal
Males Females Ma1es Females Males Females Males Females Males Females M~es Femalea
11 12 13 14 16 16 17 18 19 20 21 22 1
7,866 9,270 14 4 7 9 1,106 18 .. 8 6. lIazaribagb 7,246 7,869 .. 52 1
307 399 .. 4. 1 616 16 8 133 384 2 1 3 4. 896 2 161 618 l.2 3 4. 41
19
8,913 9,987 9 11 9 4. 7 6. Llikamsandi 8,508 8,979 1
148 144 2 4. 6 67 256 3 4. 6
190 609 6 4: 4. 1
7,973 9,790 3 6 17 7 7.Ichak 7,398 8,607
263 286 17 7 123 283 4. 189 614. 3 1
7,124 7,977 6 3 14 17 32 18 8. Barbgaon 6,664 6,902 1 2 1
193 148 3 2 26 12 90 324 2 7 6 6 6
177 603 6 1 3 8 1
6,083 6,240 1 7 63 10 9. Eeredari 4,871 6,499 1 1
60 110 39 6 .. 39 230 4: 13 4
123 401 1 .2
5,545 6,484. 16 2 9 10. 'l'andwa 5,293 5,826
104 91 8 .. 31 237 6 1 4: "
U7 330 3 1 5
9,949 11,181 11 25 25 14 2 23 68 • 2 11. Mandu 9,468 10,238 2 3 3
138 124 9 11 4 1 23 55 .2 95 288 3 4 6 5 1 13
245 526 8 10 5 2 3 5
6,758 7,590 1 2 7 10 .2 12. Nagri 6,331 6,902 (Churobu)
203 109 1 3 8 106 221 1 2 .2 106 358 1 4
12 .. 6 (Oen.) 0-4

50'
Table B-IX
TABLE B-IX-PERSONS NOT AT WORK CLASSIFIED BY SEX,
Distriat/Subdivision/ Ancbal Total Rural Age-groups
Total non· working population Full time students Household duties
Urban r A r-_.A. r__,.A.
Persons Males Females Males Females Males Females
1 2 II 4 5 6 7 8 9 ll)
13. Ramgarh R Total 36,048 14,887 21,161 3,823 655 38 6,538 0-14 26,338 13,240 13,098 3,126 641 3 498
15-34 5,280 1,120 4,160 694 l() 20 3,755 35-59 2,704 189 2,515 3 3 13 1,960 60+ 1,672 313 1,359 2 319 Age not stated 54 25 29 1 6
14. Jainagar R Total 22,717 8,934 13,783 1,884 258 4,983 0-14 16,819 8,129 8,190 1,621 248 545
15-34 3,117 460 2,657 263 I) 2,504 35-59 2,024 III 1,918 1,668 60+ 1,257 234 1,023 266 Age not stated
15. Gola R Total 28,905 1l,145 17,760 2,855 421 6,953 0-14 21,339 10,230 11,109 2,432 408 1,270
15-34 4,178 623 3,555 422 12 3,449 35-59 2,162 83 2,077 1 1 1,862 60+ 1,226 207 1,019 372
Age not stated
16. Gumia R Total 35,844 14,610 21,234 2,664 510 6,696 0-14 27,339 13,524 13,815 2,266 485 1,125
15-34 4,971 700 4,271 398 23 4,067 35-59 2,277 III 2,166 2 1,410 60+ 1\257 275 982 94 Age not stated
17. Peterbar R Total 24,447 9,803 14,644 2,051 215 22 5,219 0-14 17,986 8,891 9,095 1,728 212 58B
15-34 3,722 090 3,132 323 II 11 2,993 35-59 1,852 130 1,722 11 1,454 60+ 878 183 695 18~ Agenotstated 9 9
18. Kasmar R Total 15,607 7,190 8,417 2,252 311 12 2,095 0-14 12,964 6,563 6,401 1,815 310 4 595 15-34 1,518 508 1,010 !37 1 6 930 35-59 546 35 511 1 423 60+ 566 84 482 i 147 Age not stll-ted 13 13
19. Jatidih R Total 30,584: 1l,238 19,34.6 2,856 291 17 9,207 0-14 20,902 10,206 10,696 2,339 287 3 1,477 15-34" 5,708 730 4,978 517 3 6 4,789 35-59 2,803 132 2,671 6 2,461 60+ 1,146 166 980 2 466 Age not stated 25 4. 21 1 14
20. Kodarma. R Total 35,867 14,445 21,422 3,945 966 144 8,558 0-14 25,128 12,650 12,478 3,123 930 70 1,309 15-34 6,427 1,370 5,057 821 86 61 4,744 35-59 2,878 215 2,663 1 10 2,230 60+ 1,424. 210 1,214 3 271 Age not sta.ted 10 10 4.

51
Table B·IX BROAD AGE-GROUPS AND TYPE OF ACTIVITY-contd.
Dependants, Retired, rentier Beggars, vagrants, Inmates of Persons seeking Persons employed infants and or independent etc. penal, mental employment for before but now
disabled means and charitable the first time out of employment institutions and seeking work
~----"\ r__.\.----"\ r__.\.----"l r__.\.----"\ r-A.----"\ r--.A..--..... District/Sub· division/Anchal
Males Females Males Females Males Females Males Females Males Females Males Females
11 12 13 14 15 16 17 18 19 20 21 22 1
10,857 13,935 19 2 16 28 5 87 2 42 1 13. Ramgarh 10,096 11,952 1 7 3 6 5
288 391 5 3 1 81 1 31 151 540 8 2 7 8 1 1 6 1 297 1,030 11 3 10 25 22
7,015 8,535 4 10 12 14 7 14. Jainagar 6,505 7,397 1 2
180 148 1 12 4 102 240 2 4 5 3 228 750 2 4 7
8,242 10,382 2 31 4 7 8 15. Gola 7,796 9,431 2
176 94 13 5 7 74 214 9 1
196 643 2 9 4
11,854 14,004 4 4 18 18 1 1 48 1 21 16. Gumia 11,255 12,203 2 3
229 173 12 6 1 1 44 1 16 99 742 3 5 9 1 5
271 886 3 1 1 1
7,699 9,210 1 11 19 17. Peterbar 7,163 8,295
226 136 11 19 119 268 182 511 1
9
4,889 6,000 9 3 8 7 5 10 1 5 18. Kasmar 4,740 5,495 2 1 1 1
49 78 2 1 1 8 5 27 88 4 2 1 73 326 ,9 3 6 1
13
8,316 9,782 33 61 7 5 1 7 1 19. Jaridih 7,864 8,932 ..
194 186 5 7 1 113 184 11 24 1 2 1 141 474 22 37 1 3
4 6
10,066 11,847 7 4 32 28 34 13 140 77 6 20. Kodarma. 9,413 10,237 4 1 12 1 14 14
314 251 1 10 13 13 8 105 46 4 141 420 2 1 16 7 8 3 21 16 2 198 933 5 2 2 7 1 1 1
6

52
Table B.IX
TABLE B-IX-PERSONS NOT AT WORK CLASSIFIED BY SEX,
District/Subdivision/ Anchal Total Total non· working population Full time students Household duties Rural Age·groups Urban r------A- """\ r-__..A.--",,"\ r---""-
Persons Males Females Males Females Males Females
1 2 3 4: 5 6 7 8 9 10
21. Markacho R Total 18,784 8,14:5 10,639 1,620 129 2,629 0-14: 15,382 7,673 7,709 1,420 125 500
15-34 1,595 286 1,309 200 4 1,210 35-59 981 89 942 753 60+ 826 14:7 679 166 Age not stated
22 Patratu R Total 29,547 11,335 18,212 2,111 428 140 7,900 0-14 20,044 9,994 10,050 1,849 383 51 500
15-34 6,361 992 5,369 261 43 59 5,162 35-59 2,368 194 2,174 1 2 22 2,033 60+ 774 155 619 8 205 Age not stated
Chatra SubdlvisloD R Total 167,4'10 67,009 100,461 11,815 1,805 87 88,018 0-14 125,621 62,644 62,977 9,617 1,467 2 4,562
15-34 22,294 2,663 19,631 1,696 137 15 17,999 35-59 12,670 578 12,092 1 17 9,347 60+ 6,867 1,122 5,745 3 1,105 Age not stated 18 2 16 2
23. Chauparan R Total 35,863 13,991 21,872 3,025 447 9 7,772 0-14 26,165 12,998 13,167 2,671 327 1,197
15--34 5,249 601 4,648 354 120 5 4,159 35-59 2,872 138 2,734 4: 2,156 60+ 1',577 254 1,323 260 Age not stated
24. Itkhori It Total 32,395 13,352 19,043 2,498 335 5,718 0-14 25,344 12,512 12,832 2,118 332 1,091
15-34 3,752 495 3,257 380 3 3,068 35-59 1,926 91 1,835 1,367 60+ 1,373 254 1,119 192 Age not stated
25. Hunterganj R Total 31,493 11,699 19,794 2,068 373 28 7,946 0-14 21,415 10,738 10,677 1,809 367 2 771
15-34 5,330 543 4,787 259 6 10 4,438 35-59 3,197 150 3,047 13 2,480 60+ 1,551 268 1,'283 3 257 Age not stated
26. Pratap Pur R Total 21,713 8,522 13,191 888 173 4,391 0-14. 16,130 8,059 8,071 759 170 475
15-34 3,085 282 2,803 129 3 2,552 35-59 1,705 61 1,644 1,225 60+ 71)3 120 673 131) Age not stated
27. Chatra R Total 22,759 9,554 13,205 1,242 tal 3,635 0-14 18,110 9,074 9,036 1,036 128 561
15-34 2,437 307 2,130 204 2 1,930 35-59 1,398 58 1,34:0 1 1,020 60+ 810 113 697 124 Age not stated 4: 2 2 2

5a '.'Ie I·IX
BllOAD AGE-GROUPS AND TYPE OF ACTIVITY -contd.
Dependants, Retired, rentier Beggars, vagrants, Inmates of Persons seeking Persons employed infants and or independent eto. penal, mental employment for before but now
disabled means and oharitable the first time out of employment ill.Stitutions and seeking work
r--'-----""'\ r__.A,,----""'\ r~-' r----A_, r----"-_, r------'---"", Distriot/Sub.
Males Females HaIes Females Hales Females M4les division/Anchal
Females Males Females Males Females
11 12 13 14 16 16 17 18 19 20 21 22 1
6,512 7,864 7 15 2 5 1 21. Markaoho 6,263 7,084
78 95 2 5 1 37 180 2 9
144 606 3 6 2
8,881 9,879 13 3 7 2 134 49 22. Patratu 8,063 9,167 40 1
644 164 6 79 44 144 137 7 1 1 1 15 4 140 411 6 2 1 1
55,412 65,605 81 78 f14 183 2 1 54 1 44 Chair. Subdlvlllon 63,013 66.943 1 1 8 3 1 3
846 1,482 1 26 11 1 47 1 33 494 2,660 6 23 47 61 1 3 10
1,060 4.1S04 24 48 33 88 1 1 16
10,874 13,624 8 22 29 1 29 23 23. Chauparan 10,322 ll,643 5
192 368 6 1 25 19 121 666 I) 13 1 3 4, 239 1,048 8 6 16 1
10,809 12,926 23 45 41 24.Itkhori 10,391 11,409 3
104 182 1 11 3 73 435 11 18 22
241 900 11 13 16
9,533 1l,413 10 7 25 64 1 22 13 25. Hunterganj 8,924 9,636 1 2 1 3
243 336 4 7 19 8 ll6 547 3 6 13 14 5 260 995 7 8 31
7,617 8,616 1 10 11 1 3 2 26. fratap Pur 7,300 7,426
146 248 2 1 3 1 .. 66 417 1 4 2
116 626 4 9 1
8,292 9,398 3 30 11 10 1 6 27. Chatra 8,037 8,347 1
96 197 3 1 5 61 317 6 2 1
109 636 2 30 2 8 2 ..

'fable B·IX TABLE B-IX-PERSONS NOT AT WORK CLASSIFmn BY SEX,
District/Subdivision/ Anc hal Total Total non· working population Full time students Household duties Rural Age'groups Urban ,- -"\ r-___.A.. r-_.J..
Persons Males Females Males Females Males Females
1 2 3 4 5 6 7 8 9 10
28. Simaria R Total 23,247 9,891 13,356 1,594 146 3,551 0-14 18,457 9,263 9,194 1,224 143 467
15-34 2,441 435 2,006 370 3 1,852 35-59 1,572 80 1,492 1,099 60+ 763 lI3 650 133 Age not stated 14 14
Glrldlb Subdlvls(on R Total 3,67,885 159,615 207,770 ~.009 8,945 4 57,994 0-14 292,611 147,684 144,927 27,320 3,864 I 9,709
15-34 38,913 7,341 31,572 4,674 80 29,622 35-59 20,311 1,441 18,870 15 1 I 15,158 60+ 15,542 3,144 12,398 2 3,505
Age not stated 8 5 3
29. Gawan R Total 20,180 8,616 11,665 1,449 264 3,111 0-14 16,216 8,094 8,122 '1,313 260 574
15-34 2,104 251 1,853 136 4 1,767 35-59 963 54 909 658 60+ 897 lI6 781 112 Age not stated
30. Tisri R Total 15,402 6,640 8,762 1,195 204 2,466 0-14 13,019 6,387 6,632 1,103 202 842
15-34 1,186 130 1,056 84 2 1,006 35-59 711 54 657 8 504 60+ 486 69 417 114 Age not stated ,
31. Satgawan R Total 12,855 5,581 7,274 1,236 164 2,251 0-14 10,128 5,221 4,907 1,054 164 401
15-34 1,408 251 1,157 182 1,084 35-59 699 34 665 579 60+ 620 75 545 187 Age not stated
32. Jamua R Total 38,622 17,402 21,~20 4,131 339 4,731 0-14 31,577 16,084 15,493 3,423 333 730
15-34 3,383 838 2,545 707 6 2,381 35-59 1,807 86 1,721 1 1,359 60+ 1,855 394 1,461 261 Agenotatated
33. Deori R Total 24,751 1l,337 13,414 2,152 206. 2,934 0-14 20,573 10,638 9,935 1,814 204 548
15-3.4 2,027 407 1,620 338 2 1,412 35-59 1,068 50 1,018 775 60+ 1,083 242 841 199 Agenotstated
34. Dhanwar R Total 42,493 17,191 25,302 3,423 510 10,II 7 0-14 30,942 15,525 15,417 2,809 495 1,393
15-34 6,096 1,058 5,038 614 15 4,810 35-59 3,442 226 3,216 2,817 60+ 2,013 382 1,631 1,097 Age not stated
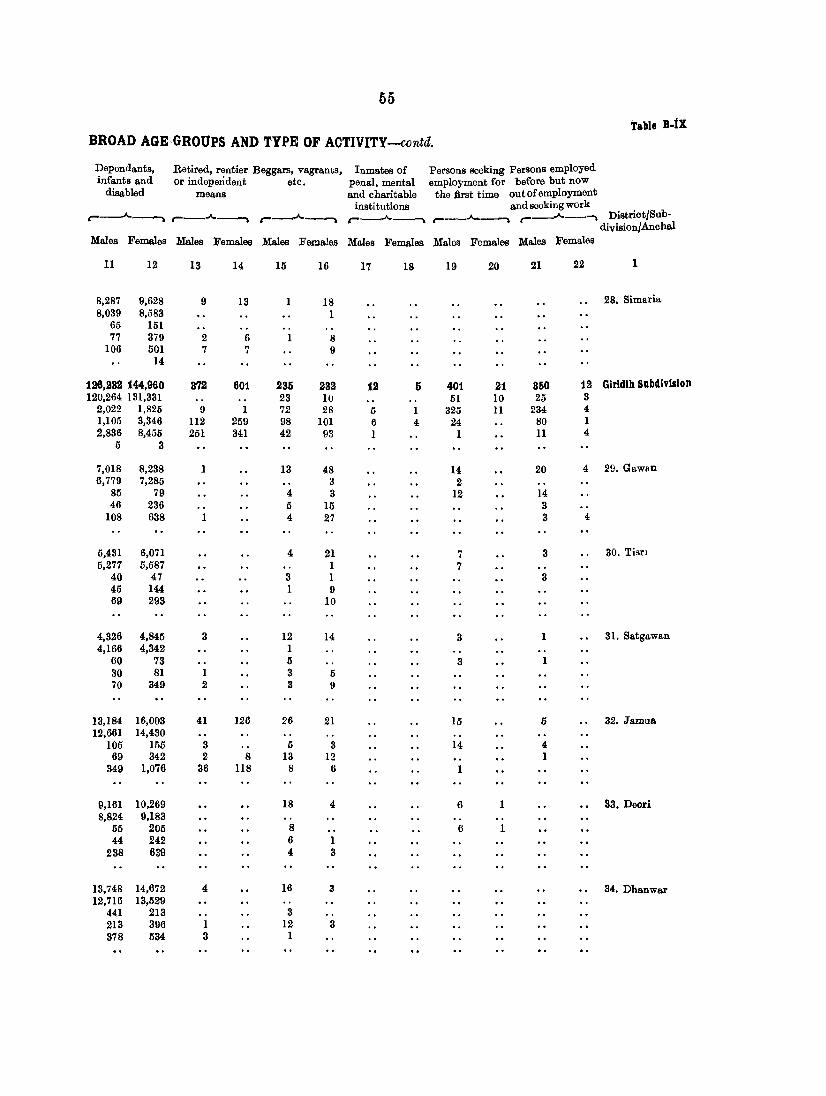
65
Table B-tX
BROAD AGE-GROUPS AND TYPE OF ACTIVITY-contd.
Dependants, Retired, rentier Beggars, vagrants, Inmates of Persons seeking Persons employed infants and or independent etc. penal, mental employment for before but now
disabled means and charitable the :first time outofemployment institutions and seeking work
r-..A.-, r-..A.-, r--A -, r-..A.---""""\ r--.A...-""", c-_...J..--""", District/Sub. division/Anchal
Males Females Ma.l.es Females Males Females Males Females Males Females Males Females
11 12 13 14 15 16 17 18 19 20 21 22 1
8,287 9,628 9 13 1 18 28. Simaria 8,039 8,583 1
65 151 77 379 2 6 1 8
106 501 7 7 9 14
128,S32 144,960 372 801 235 232 12 5 401 21 350 12 Girldlh Subdivision 12U,264 131,331 23 10 51 10 25 3
2,022 1,825 9 1 72 28 5 1 325 11 234 4 1,105 3,346 112 259 98 101 6 4 24 80 1 2,836 8,455 251 341 42 93 1 1 11 4
I) 3
7,018 8,238 1 13 48 14 20 4 29. Gawan 6,779 7,285 3 2
85 79 4 3 12 14 46 236 5 15 3
108 638 1 4 27 3 4
5,431 6,071 4 21 7 3 30. Tisrl 5,277 5,587 1 7
40 47 3 1 3 45 144 1 9 69 293 10
4,326 4,845 3 12 14 3 1 31. Satgawan 4,166 4,342 1
60 73 5 3 1 30 81 1 3 5 70 349 2 3 9
13,184 16,003 41 126 26 21 15 I) 32. Jamua 12,661 14,430
105 155 3 5 3 14 4 69 342 2 8 13 12 1
349 1,076 36 118 8 6 1
9,161 10,269 18 4 6 1 33. Deori 8,824 9,183
55 205 8 6 1 44 242 6 1
238 639 4 3
13,748 14,672 4 16 3 34. Dhanwar 12,716 13,529
441 213 3 213 396 1 12 3 378 534 3 1

M
'table s·li TABLE B-IX-PERSONS NOT.AT WORK OLASSIFIED BY SEk,
Distriot/Subdivision/Anohal Total Total non· working population Full time students Household duties Rural Age-groups Urban r- r----"- -A._"\
Pel'llOM Males Females Males Females Males Females
1 2 3 4 5 6 7 8 9 10
35. Bimi R Total 23,914 10,670 13,244 2,412 187 3,226 0-14 19,646 10,010 9,636 2,112 187 612
Hi--34 1,914 364 1,660 300 1,484 35--69 1,172 60 1,112 896 60+ 1,281 235 1,046 234 Age not stated 1 1
36. Giridih R Total 51,764 19,701 32,063 3,779 738 13,672 0-14 34,608 17,221 17,387 8,068 708 1,200
15--34 10,199 1,648 8,651 707 30 8,049 35--59 6,051 419 4,632 4 3,947 60+ 1,906 613 1,393 476 Age not stated
37. Bengabad R Total 20,333 9,792 10,641 1,871 180 1,618 0-14 17,612 9,183 8,429 1,687 UO 270
16-34 1,218 375 843 284 4: 747 36-59 642 66 676 391 60+ 860 167 693 110 .Age not stated 1 1
38. Gande R Total 26,363 11,380 14,983 2,641 262 4,080 0-14 21,276 10,670 10,606 2,209 261 827
16--34 2,580 426 2,164 330 1 2,046 36--69 1,387 -64 1,323 2 1,041 60+ 1,119 219 900 167 Age not stated 1 1
39. Dumri R Total 32,620 15.391 17,229 3,377 378 3 2,726 0-14. 28,680 14,663 14,117 2,976 371 608
11i-34 1,790 543 1,247 401 7 1,174 35--59 1,020 75 945 1 711
60+ 1,130 210 920 2 .232 Age not stated
'0. Nawadih R Total 26,699 12,622 14,177 2,341 172 1 2,402 0-14 23,334 11,692 11,642 2,037 172 1 897
16-34 1,469 448 l,OIl 304 960 35-59 785 94 691 426 60+ 1,119 286 833 119 Age not stated 2 2
41. Pirtatll' R Total 19,366 8,465 10,901 1,308 224 2,209 0-14 16,326 7,961 8,365 1,118 .218 483
15-34 1,434 282 1,152 190 /; 1,069 35--59 817 63 754 1 547 60+ 786 159 627 110 Age not stated 3 3
42. Bermo It. Total 12,023 s,028 6,995 794 117 2,552 0-14 8,774 4,435 4,339 697 113 324
16-34 2,115 420 1,695 97 4 1,634 36-59 747 98 651 1S07 60+ 387 77 310 87 Age not stated

67
aRoAD Table ii-IX
AGE .. GROUPS .AND TYPE OF ACTIVITY --concld.
Dependants, Retired, rentier Beggars, vagrants, Inmates of Persons seeking Personil etnployed infants and or independent eto, penal, mental employment for before but now
disabled means and oharltable the first time out of employment instltutions and seeking work
-____..)I,.---"'\ ,---A--"""\ ~----. r---A.--..,. r---"--..,. r___'_---"'\ l}ill\;rio\;}'Oub.
[ales Females M:a.les Females :Ma.les Females Males Females division/Anohal
Females Males Fema1es MalcB
11 12 13 I~ 16 16 17 18 19 20 21 22 1
8,238 9,823 7 8 1 12 85, Birni 7,897 8,737 1 " 51 66 2 11 " lI6 213 4, 3 .'
233 807 1 (; 1 " 1 .'
5,271 17,496 237 14 64 55 6 1 158 20 186 7 36. Giridih l4,096 15,463 0 3 38 10 14 3
587 553 I) 1 18 4 2 109 10 120 4 234 637 90 18 27 29 4 1 11 49 354 843 142 55 14 19 3
7,891 8,802 17 34 4 7 4 5 37. Bengabl\d 7,596 7,983 .'
81 92 1 4 5 64 174 9 2 2 .' 149 553 17 25 1 6
1 "
8,795 10,436 2 202 8 3 1 18 15 88. Gande 8,447 9,617 3 1 3 8
75 108 2 1 15 3 54 78 .2 202 3 2 3
218 733 1 1
" 1,933 14,083 17 17 36 26 16 9 39. Dumri 1,078 13,137 9 1
108 54 12 12 16 6 49 222 7 1 15 11 3
198 670 10 16 2
0,117 11,513 20 76 9 11 4 3 22 8 40, Nawadih 9,649 10,572 2 1 3
112 46 5 4 2 1 21 4 91 245 14 4 2 2 1
263 650 20 62 2 2 1 2
7,126 8,433 5 27 16 8 10 41. Pirtanr 6,840 7,664 3
79 78 3 10 57 196 5 6 5
150 492 5 ~~ ~ ~
3
3,993 4,276 25 45 2 3 1 116 98 1 42. Bermo 3,738 3,902
143 56 1 1 1 104 74 53 140 9 .2 1 1 12 21 1 59 178 15 48 2 3
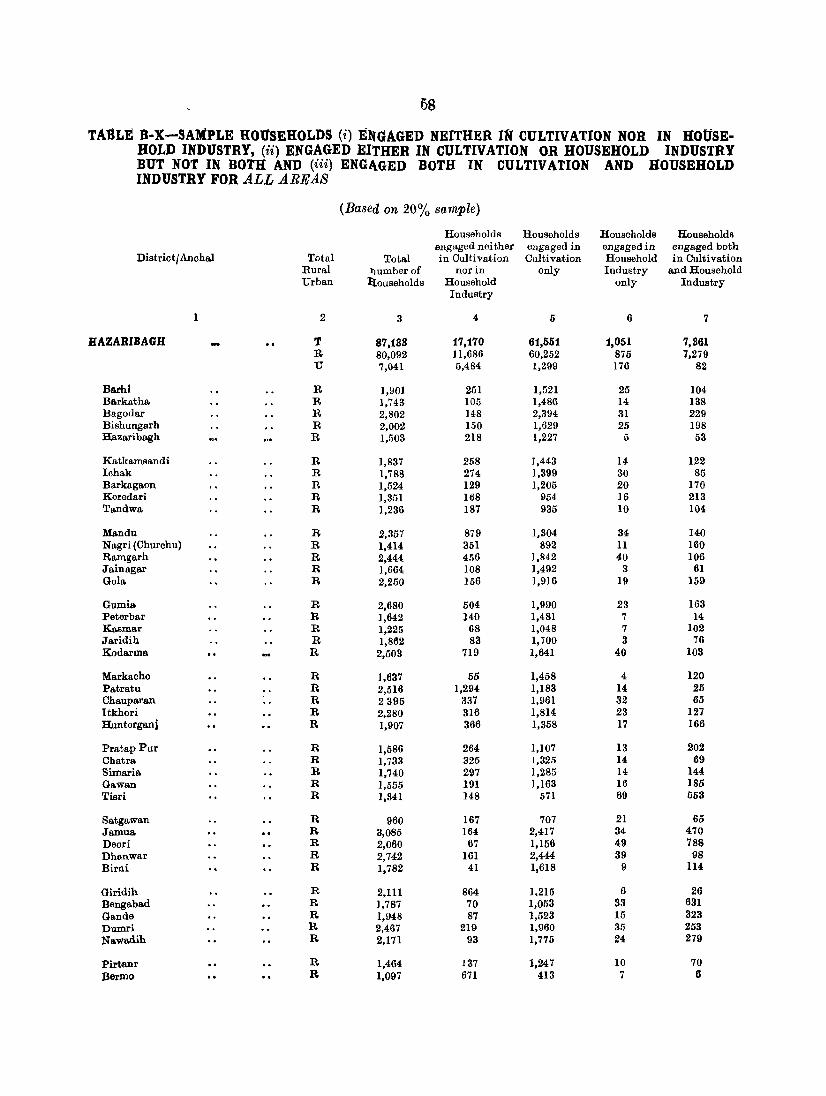
58
TASLE B-X-SAMpLE HOUSEHOLDS (i) ElfClAGED NEITHER 1M CULTIVATION NOR IN HOUSE-HOLD INDUSTRY, (ii) ENGAGED EITHER IN CULTIVATION OR HOUSEHOLD INDUSTRY BUT NOT IN BOTH AND (iii) ENGA.GED BOTH IN CULTIVATION AND HOUSEHOLD INDUSTRY FOR ALL AREAS
(Based on 20% sample)
Households Households Households Households engaged neither engaged in engBgedin engaged both
DistrictfAnchal Total Total in Cultivation Cultivation Household in Cultivation Rural llumberof nor in only Industry and Household Urban ltouseholds Household only Industry
Industry
1 2 3 4 5 6 7
HAZARIBAGH T 87,183 17,170 61,551 1,051 7,861 R 80,092 11,686 60,252 875 7,279 U 7,041 5,484 1,299 176 82
Barhi R 1,901 251 1,521 25 104 Ba.rkatha R 1,743 105 1,486 14 138 Bagodar R 2,802 148 2,394 31 229 Bishungarh R 2,002 150 1,629 25 198 Ha~aribagh R 1,503 218 1,227 5 53
Katkamsandi R 1,837 258 1,443 14 122 Ichak R 1,788 274 1,399 30 85 Barkagaon R 1,524 129 1,205 20 170 Keredari R 1,351 168 954 16 213 Tandwa R 1,236 187 935 10 104
Mandu R 2,357 879 1,304 34 140 Nagri (Churchu) R 1,414 351 892 11 160 Ramgarh R 2,444 456 1,842 40 106 Jain agar R 1,664 108 1,492 3 61 Gola. R 2,250 156 1,916 19 159
Gumia. R 2,680 504 1,990 23 163 Peterbar R 1,642 140 1,481 7 14 Kasmar R 1,225 68 1,048 7 102 Jaridih R 1,862 83 1,700 3 76 Kodarma R 2,503 719 1,641 40 103
Markacho R 1,637 55 1,458 4 120 Patratu R 2,516 1,294 1,183 14 25 Chauparan R 2395 337 1,961 32 65 Itkhori R 2,280 316 1,814 23 127 Hunterganj R 1,907 366 1,358 17 166
Pratap Pur R 1,586 264 1,107 13 202 Chatra R 1,733 325 1,325 14 69 Simaria R 1,740 297 1,285 14 144 Gawan R 1,555 191 1,163 16 185 Tisri R 1,341 148 571 69 553
Satgawan R 960 167 707 21 65 Jamua. R 3,085 164 2,417 34 470 Deori R 2,060 67 1,156 49 788 Dhanwar R 2,742 161 2,444 39 98 Birni R 1,782 41 1,618 9 114
Giridih R 2,111 864 1,215 6 26 Bengabad R 1,787 70 1,053 93 631 Gande R 1,948 87 1,523 15 323 Dumri R 2,467 219 1,960 35 253 Nawadih R 2,171 93 1,775 24 279
Pirtanr R 1,464 137 1,247 10 70 Bermo R 1,097 671 413 7 6

59
TABLE B-XI-SAMPLE HOUSEHOLDS ENGAGED IN ()ULTIVATION CLASSIFIED BY INTEREST IN LAND AND SIZE OF LAND CULTIVATED IN RURAL AND URBAN AREAS SEPARATELY
(Based on 20% sample)
Households engaged in cultivation by size of land in acres No. of r- .A.
Interest in land cultivating oultivated House- Less 1.0- 2.5- 5.0- 7.5- 10.0- 12.5- 15.0- 30.0- 50+ Un-
holds than 1 2.4 4.9 7.4 9.9 12.4 14.9 29.9 49.9 specified
1 2 3 4 5 6 7 8 9 10 11 12 13
HAZARIBAGH DISTRICT-ALL RURAL AREAS
TOTAL 67,531 10,157 2.3,227 17,947 8,571 2,713 2,208 653 1,651 239 112 53 (a) 60,548 9,310 21,305 15,815 7,550 2,321 1,940 529 1,426 210 99 43 (b) 898 433 326 100 24 5 2 4 1 8 (0) 6,085 414 1,596 2,032 997 887 266 124 221 28 13 7
Barhl Anchal-Rural
Total 1,625 180 455 453 261 107 72 28 62 6 8 8 (a) 1,315 165 413 359 195 71 54 12 39 5 2 (b) 13 5 5 2 1 (e) 297 10 37 92 66 36 18 11 23 I 2
Barkatha Anchal-Rural
Total 1,624 269 590 436 211 49 20 13 27 2 3 4 (a) 1,534 262 560 416 191 46 17 12 22 2 3 3 (b) 9 3 5 1 (e) 81 4 25 19 20 3 3 I 5 I
Bagodar Ancbal-Rural
Total 2,623 409 900 748 318 97 74 28 51 4 3 1 (a) 2,527 396 869 718 304 88 72 22 50 4 3 1 (b) 7 6 1 (e) 89 7 30 25 14 9 2 1 1
Bishungarh Anchal-Rural
Total 1,827 802 634 464 230 83 48 a3 36 6 1 (a) 1,661 292 592 413 190 72 43 20 32 6 1 (b) 7 1 4 1 1 (e) 159 9 38 50 39 11 5 3 4
Hazaribagb Anchal-Rural
Total 1,280 805 420 285 150 48 81 9 29 4 8 1 (a) 1,208 302 403 258 140 34 29 8 26 4 3 1 (b) 4 2 1 1 (e) 68 1 16 26 10 9 2 1 3
Katkamsandl Anohal-Rural
Total 1,565 221 476 433 198 88 67 24 • 49 9 (a) 1,411 212 437 384 179 77 59 20 36 7 (b) 22 6 13 2 1 (e) 132 3 26 47 18 11 8 4 13 .2
NOTES : (a) Owned or held from Government.
(b) Held from private persons or institutions for payment in money, kind or share.
(0) Partly held from Government and partly from private persons or institut.ions for payment in money, kind or share.

60
TABLE B-XI--BAMPLE JlOtfSEHOLDS ENGAGED IN CULTIVATION CLASSIFIED Bt INTEREST IN LAND AND SIZE OF LAND OULTIVATED IN RURAL AND URBAN AREAS SEPARATELY -contd.
(Based on 20% 8ample)
Households engaged in cultivation by size of land in acres No. of
Interest in land oultivating r- """\ oultivated Rouse- Less 1.0- 2.5- 5.0- 7.5- 10.0- 12.5- 15.0- 30.0- 50+ Un-
holds than 1 2.4 4.9 7.4 9.9 12.4 14.9 29.9 49.9 speoified
1 2 3 4 5 6 7 8 9 10 11 12 13
lehak Anehal-Rural
Total 1,484 186 612 844 200 86 48 9 89 8 2 (a) 1,339 180 565 293 171 33 44 7 36 8 2 (b) 20 1 11 5 3 (0) 125 5 36 46 26 3 4 2 3
Barkagaon Aoehal-Rural
Total 1,3n 209 547 32.9 158 84 48 9 34 1 1 5 (a) 1,238 192 498 288 141 31 43 8 31 1 1 4 (b) 5 1 1 2 1 (0) 132 16 48 39 16 3 5 1 3 1
Keredarl Anohal-Rural
Total 1,167 112 457 354 137 42 43 8 12 3 1 (a) 1,043 107 412 301 124 38 42 6 11 2 (b) 11 2 6 3 (0) 113 3 39 50 13 4 1 1 1 1
Tandwa Anohal-Rural
Total 1,OS9 118 3S5 2.95 150 89 38 10 40 11 2 1 (a) 927 III 300 264 132 33 33 5 36 10 2 1 (b) 11 2 5 1 2 1 (c) 101 5 30 30 16 6 4 5 4 1
Mandu Anohal-Rural
Total 1.444 280 554 313 144 37 29 11 31 2 1 2 (a) 1,256 247 479 319 119 32 23 8 25 2 2 (b) 20 4 13 2 1 (0) 168 9 62 52 24 5 6 3 6 1
Nagrl (Ohurohu) Anobal-Rural
Total 1.052 122 8z.9 808 159 45 42 16 27 4 5 (a) 961 119 303 275 142 40 38 13 23 4 4 (b) 9 2 IS 1 1 (0) 82 1 21 28 16 5 4 3 3 1
Ra.m,arh Anobal-Rural
Total 1,948 279 853 512 247 87 71 22 54 10 7 8 (a) 1,849 269 629 484 234 82 64 20 46 10 5 6 (b) 6 2 1 2 1
(0) 93 8 23 26 13 5 7 2 7 2
NOOZJll8 I (4) Owned or held from Government.
(b) Held from private persons orillstitutions for payment in money, kind or share.
(c) Pa.rtly held from Government and partly from private persons for institutions for payment in money. kind or share.

61
TABLE B-XI-SAMPLE HOUSEHOLDS ENGAGED IN OULTIVATION OLASSIFIED BY INTEREST IN LAND AND SIZE OF LAND CULTIVATED IN RURAL AND URBAN AREAS SEPARATELY-contd.
(Based on 20% sample)
Households engaged in cultivation by size of land in acres No. of
Interest in land cultivating r-oultivated House- Less 1.0--- 2.5- 5.0- 7.5- 10.0--- 12.5- 15.0- 30.0- 50+ Un-
holds than 1 2.4 •. 9 7.4 9.9 12.4 14.9 29.9 499 specified
1 2 3 4, 5 6 7 8 9 10 11 12 13
.Jalnagar Anohal-Rural
Total 1,653 209 583 409 2il7 68 60 19 45 5 8 (a) 1,451 199 510 373 190 59 54 16 42 5 3 (b) 5 1 3 1 (c) 97 9 20 35 17 4, 6 3 :}
Gola Anohal-Rural
Total 2,075 21)7 611 641 307 laa 69 34 67 11 6 (a) 1,836 193 563 561 264 105 57 26 56 6 5 (b) 9 3 2 2 1 1 (0) 230 11 46 78 42 16 12 8 11 5 1
GUlDla AnchaJ-Rural
Total 2,168 880 878 662 197 58 88 15 26 4 (a) 1,996 358 825 514 179 51 32 11 22 4,
(b) 23 7 11 4 1 (c) 134 15 37 44 18 6 6 4 4.
P&torbar Anoul-Rural
Total 1,495 154 418 448 2.58 87 60 14 57 7 B (a) 1,432 147 403 432 240 82 57 13 51 6 1 (b) 5 2 2 1 (0) 58 5 8 11 18 5 2 1 6 1 1
Kas;n.ar Anchal-Rural
Total 1,150 149 815 864 190 50 87 18 28 2 2 (a) 1,057 145 301 326 175 42 33 11 21 2 1 (6) 5 1 1 2 1 (c) 88 3 13 36 15 8 4 2 7
Jaridlh Anoul-Rural
Total 1,776 198 491 584 278 104 75 28 63 18 4 8 (a) 1,686 186 474 508 259 95 67 20 58 12 4, 3 (b) 7 3 3 1 (c) 83 4 14 25 14 9 8 3 I) 1
Kodarm. Anohal-Rural
Total 1,744 420 684 885 170 51 86 14 24 5 8 2 (a) 1,591 391 590 337 152 46 33 12 21 5 2 2 (b) 20 8 11 1 (c) 133 21 33 47 18 5 3 2 3 1
NOTE. : (a) Owned or held from Government.
(b) Held from private persons or institutions for payment in money, kind or share.
(0) Partly held from Government and partly from private persons or institutions for payment in money, kind Of sbare.

62
TABLE B-XI-SAMPLE HOUSEHOLDS ENGAGED IN CULTIVATION CLASSIFIED BY INTEREST IN LAND AND SIZE OF LAND CULTIVATED IN RURAL AND URBAN AREAS SEPARATELY-contd.
(Based on 20% sample)
Households engaged in oulti vation by size of land in acres No. of
Interest in land cultivating ,- .A.
oultivated House- Less 1.0- 2.5- 5.0- 7.5- 10.0- 12.5- 15.0- 30.0- 50+ Un-holds than 1 2.4 4.9 7.4 9.9 12.4 14.9 29.9 49.9 speoified
1 2 3 4 5 6 7 8 9 10 11 12 13
Markacho Anchal-Rural
Total 1,578 215 580 897 196 64 58 19 84 12 2 1 (a) 1,485 201 555 374 178 62 54 16 30 12 2 1 (b) 8 6 1 1 (c) 85 8 24 22 18 2 4 3 4
Patratu Anehal-Rural
Total 1,208 10a aS7 aS4 2S9 74 46 19 4.8 4 2 2 (a) 1,095 96 304 304 223 63 40 14 44 3 2 2 (b) 12 4 8 (c) 101 3 25 30 16 11 6 is 4 1
Chauparan Anchal-Rural
Total 2,026 232 680 565 310 91 75 20 65 7 1 (a) 1,781 216 595 502 265 69 56 18 54 5 1 (b) 33 7 15 9 2 (c) 212 9 50 54 43 22 19 2 11 2
Itkhorl Anchal-Rural
Total 1,941 262 669 476 275 88 77 26 61 4 1 2 (a) 1,761 254 606 426 236 80 70 24 58 4 1 2 (b) 23 3 11 7 2 (c) 157 I) 52 43 37 8 7 2 3
Hunterganj Anchal-Rural
Total 1,524 418 466 387 123 85 56 14 50 10 14 1 (a) 1,321 345 420 283 108 31 52 10 47 10 14 1 (b) 86 63 18 4 1 (0) 117 10 28 50 15 3 4 4 3
Pratap Pur An,chal-Rural
Total 1,309 453 324 271 104 42 36 13 42 10 14 (a) 1,000 343 255 190 86 32 29 11 33 9 U
{bj 144 98 26 16 2 1 1 (0) 165 12 43 65 16 9 7 2 8 1 2
"hatra Anchal-Rural
Total 1,394 255 538 315 153 46 43 7 82 8 2 (a) 1,271 234 502 278 138 43 38 6 28 2 2 (b) 21 10 6 3 1 1
(0) 102 11 30 34 14 3 5 1 3 1
NOTES: (a) Owned or held from Government.
(0) Held from private persons or institutions for payment in money, kind or share.
(c) Partly held from Government and partly from private persons or institutions for payment in money, kind or share,

63
TABLE B-XI-SAMPLE HOUSEHOLDS ENGAGED IN CULTIVATION CLASSIFIED BY INTEREST IN LAND AND SIZE OF LAND CULTIVATED IN RURAL AND URBAN AREAS SEPARATELY -contd.
(Baaed on 20% aample)
No. of Ko'U'Oenoldl> engaged in tlultivation by 'Oil~ d land in aet'l£
Interest in land cultivaLing r- ---"- --, cultivated llouse- Less 1.0- 2.5- 5.0- 7.5- 10.0- 12.5- 15.0- 30.0- 50+ Un-
holds than 1 2.4 4.9 7.4 9.9 12.4 14.9 29.9 49.9 specified
1 2 3 4 5 6 7 8 9 10 II 12 13
Simaria Anchal-Rural Total 1,429 193 481 351 193 61 72 18 39 14 2 5
(a) 1,297 179 454 307 168 54 69 12 34 13 2 5 (b) 21 10 7 3 1 (e) 111 4 20 41 24 7 3 6 5 1
Gawan Anchal-Rural Total 1,348 402 468 809 98 29 20 9 11 2
(a) l,109 346 391 239 77 22 16 S 9 1 (6) 28 25 I 1 1 (c) 211 31 76 69 20 7 4 1 2 1
Tlsri Anohal-Rural Total t,124 168 395 306 130 58 34 10 18 5 2
(a) 787 128 288 212 87 34 18 4 11 3 2 (6) 53 23 25 4 1 (e) 284 17 82 90 42 22 16 6 7 2
Satgawan Anchal-Rural Total 772 159 289 17'9 72 18 23 4 20 7 1 (a) 596 126 227 129 52 17 19 3 16 7
(b) 13 8 5 (c) 163 25 57 50 20 1 4 1 4 1
Jamua Anchal-Rural Total 2-,887 848 1,006 82<2 390 103 94 26 84 8 5 1 (a) • 2,681 321 950 751 362 94 89 26 76 7 5
(b) 23 14 9 (e) 183 13 47 71 28 9 5 8 1 1
Deorl Anchal-Rural Total 1,944 248 633 47~ 304 102 9(1. 2-6 51 9 2- 1
(al 1,617 197 535 387 260 74 83 23 47 9 2 (1)) 46 31 12 3 (rl 281 20 86 82 44 28 13 3 4 1
Dhanwar Anchal-Rural Total 2,542 471 990 592 2'11 73 77 11 46 (I 5 (a) 2,363 440 929 544 245 68 74 10 42 6 5
(1)) 22 13 7 2 (c) 157 18 54 46 26 5 3 40
Blrnl Anchal-Rural Total 1, 73.2 184 553 506 249 85 67 13 62 6 7 (a) 1,513 163 502 429 223 68 54 10 53 5 6 (b) 9 7 1 1 (e) 210 14 60 76 26 17 13 3 9 1
NOTES: (a) Owned or held from Government. (6) Held from private persons or institutions for payment in money, kind or share. (0) Partly held from Government and partly from private persons Of institutions for payment in money, kind or
share.

64
TABLE B-XI-8AMPLE HOUSEHOLDS ENGAGED IN OULTIVATION OLASSIFIED BY INTEREST IN LAND AND SIZE OF LAND CULTIVATED IN RURAL AND URBAN AREAS SEPARATELY--coneld.
(Based on 20% 8ample)
Households engaged in cultivation by size of land in acres No. of
Interest in land cultivating r- ..A..
cultivated House- Less 1.0- 2.5- 5.0- 7.5- 10.0- 12.5- 15.0- 30.0- 50+ Un-holds than 1 2.4 4.9 7.4 9.9 12.4 14.9 29.9 49.9 specified
1 2 3 4 5 6 7 8 9 10 11 12 13
Glrldlh Anchal-Rural
Total 1,241 203 552 2.54 127 39 33 8 20 4 1 (a) 1,080 184 478 215 114 37 27 6 16 3 (0) 53 14 34 4 1 (0) 108 5 40 35 13 2 6 2 4 1
Bengabad Anohal-Rural
Total 1,684 199 655 444 183 71 70 21 36 4. 1 (a) 1,490 177 599 376 162 61 61 15 35 4 (b) 14 7 6 1 (c) 180 15 50 68 21 10 9 6 1
Gande Anchal-Rliral
Total 1,846 159 639 ,
551 2.87 77 68 20 43 1 1 (a) 1,692 146 604 503 252 69 61 16 40 1 (b) 10 6 2 1 1 (e) 144 7 33 47 34 8 7 4 3 1
Dwnrl Anchal-Rural
Total 2~213 309 809 67~ 247 7~ 53 12 33 3 1 (a) 1,989 293 747 581 212 67 50 8 28 2 1
(b) 18 4 10 3 1 (c) 206 12 52 86 34 9 3 4 5 1
lfawadlh Anchal-Rural
Total 2,054 ~.68 683 651 254 98 46 11 35 5 1 2 (a) 1,754 244 615 543 206 68 40 7 25 3 1 2 (b) 18 9 5 2 1 1 (0) 282 15 63 106 47 29 6 4 10 2
Plrtanl Anchal-Rural
Tofal 1,817 180 528 3B9 146 44 42 13 12 2 1 (a) 1,178 144 493 318 133 34 34 11 9 1 1 (b) 20 7 10 3
(c) 119 9 25 48 13 10 8 2 3 1
Ber~o Anchal'-Ru'ral
Total 419 64 140 114 55 19 16 3 8 (a) 370 60 130 101 42 17 12 1 7 (b) 5 2 3 • (c) 44 2 7 13 13 2 4, 2 1
BAZARIBAGH DISTRICT-ALL URBAN AREAS
TOTAL 1,881 418 473 237 115 3'2 36 22 28 11 9 1 (a) 1,285 407 452 208 95 80 sa 18 26 8 8 1 (b) 11 4 4 8 (c) 85 7 17 26 20 2 8 4 2 8 1
NO'!l!IS : (a) Owned or held from Government. (b) Held from private persons or institutions for payment in money, kind or share. (c) Partly held from Government and partly from private persons or institutions for payment in money, kind or
share.

65
TABLE B-XVU-SAMPLE HOUSEHOLDS OLASSIFIED BY (i) NUMBER OF MALE AND FEMALE MEMBERS BY SIZE OF HOUSEHOLDS AND (ii) ENGAGEMENT (a) NEITHER IN CULTIVATION NOR IN INDUSTRY (b) IN HOUSEHOLD INDUSTRY ONLY AND (c) IN OULTIVATION SUB-OLASSIFIED BY SIZE OF LAND OULTIVATED
Total
(Based on 20% sample) HAZARIBAGH DISTRICT
SIZE 011' SAMl'LE HOUSEHOLDS
~--------------~----~--------~ Single member House·
Total/Rural/Urban nuruberof
sample house· holds
Total Sample Household Population holds 2·3 members
,-, ____ .A. ___ ......... ~, ___ .A. ~ .A. ___ ...
Persons Males Females House· Males Females House· Males Females holds holds
TOTAL All Rural
1
(i) Households engaged neither in Cultivation nor in Household Industry
(ii) Households engaged in Household Industry only.
(iii) Households engaged in Cultivation
Size of holding group-
All Urban
Less than 1 aore 1.0- 2.4 acres 2.5- 4.9 acres 6.0- 7.4 acres 7.5- 9.9 a.cres
10.0-12.4 acres 12.5-14.9 acres 15.0-29.9 acres 30.0-49.9 acres 50+ Unspecified
Total/Rural/lkban
TOTAL All Rural
1
(i) Householdsengagedneither in Oultivation nor in Household Industry.
(ii) Households engaged in HOusehold Industry only
(iii) Households engaged in Oultivation
Size of holding group-
All urban
Less than 1 aore 1.0- 2.4 acres 2.5- 4.9 acrel!l 6.0- 7.4 acres 7.5- 9.9 acres
10.0-12.4 acres 12.6-14.9 acres 16.0-29.9 acrel!l 30.0-49.9 acres 60+ Unspeoified
6 (Ce.n)C-lS
2
87,188 80,092 11,686
875
67,531
10,157 23,227 17,947 8,671 2,718 2,208
653 1,651
239 112
53 7,041
8
464,707 428,474
47,248
4,024
877,202
46,204 114,548 101,549 64,906 19,488 16,986
6,308 14,692
2,262 1,038
271 86,288
4 5
282,027 232,680 212,468 216,011 25,676 21,572
2,037 1,987
184,750 192,452
22,109 55,356 49,967 27,234
9,704 8,496 2,693 7,386 1,144
624 137
19,564
24,095 59,192 61,582 27,672 9,734 8,490 2,615 7,306 1,118
514 134
16,669
6
5,308 4,548 2,008
66
2,474
686 1,044
460 149
42 36 14 30 4 7 2
755
7
8,165 2,518 1,397
35
1,086
236 452 219
83 27 25
7 27
4 6 1
647
SIZE OF SAMPLE HOUSEHOLDS
8 9 10 11
2,188 18,847 24,825 24,259 2,080 17,068 21,676 22,887
611 3,443 4,925 3,712
31 243 308 299
1,888 13,377 16,443 18,376
451 2,815 692 5,629 241 3,199
66 1,149 15 285 11 183
7 49 3 110
38 1 13 1 12
108 '1,784
3,291 6,636 4,088 1,604
371 241
73 166
47 17 20
S,049
3,928 7,661 4,365 1,534
382 233
67 145
42 16 13
1,873
~--------------------------~~-----------------------------~ 4-6 members 7-9 members 10 members and OVer ~ ______ ~ ______ ~ ~ ________ .A., ________ ~ ~ ________ ~ _________ ~
House- Males Females House· Males Females House· holds holds holds
12 13
88,724 94,886 86,119 88,105
4,479 11,332
400 985
31,240 76,788
4,891 11,650 8,574 3,667
999 738 200 418
48 26 29
2,605
11,467 27,765 21,069
9,182 2,575 1,847
527 1,082
129 74 71
8,781
14 15
96,411 90,854 10,359
969
79,026
12,294 29,428 21,699
9,338 2,536 1,904
514 1,073
116 56 68
6,057
17,179 15,974
1,366
138
14,470
1,450 4,022 4,280 2,425
854 669 207 485
64 18
6 1,205
16
85,879 61,048 5,562
536
54,944
6,378 14,982 16,260
9,356 3,320 2,634
829 1,899
205 61 20
4,887
17 18
66,268 61,846
4,863
522
56,461 •
5,602 15,696 16,653
9,480 3,369 2,609
806 1,932
208 78 28
4,417
7,080 6,888
390
28
6,970
315 982
1,434, 1,181
533 582 183 608 100
48 4
892
Males
19
48,773 89,122
2,460
173
36,489
1,738 5,621 8,331 7,109 3,411 3,749 1,257 4,223
759 366
25 4,650
Females
20
48,609 29,894
2,027
166
37,201
1,820 5,815 8,624 7,254 3,432 3,733 1,231 4,153
762 363
24 4,215

EXPLANATORY NOTE
The following tables constitute the C-series :
C-I-Composition of sample households by relationship to head of family classified by size of land cultivated.
CoIl-Age and Marital Status.
C-IlI Part A--Age, Sex and Education in all areas.
C-III Part B-Age, Sex and Education in 'Urban areas only.
C-III Part C-Age, Sex and Education in rural areas only.
C-IV -Single year age returns.
C-V -Mother-tongue.
C-VI-Bilingualism.
C-VII-Rl:'ligion.
C-VIII Part A-Classification by Literacy and Industrial category of Workers and Non-workers among Scheduled Castes.
C-VIII Part B-Classification by Literacy and Industrial category of Workers and Non-workers among Scheduled Tribes.
Table C-I has been prepared from the data collected in the Household Schedule on the basis of 20 per cent sample. The remaining tables of this series have been prepared from information gathered in the individual slips.
The tables reproduced in this Handbook are given below, along with the unit up to which they have been furnished :
Table C-I-For district classified by total, rural and urban.
Table C-II-Up to subdivisions classified by rural and urban.
Table C-III Part B-For dist"rict only.
Table C-III Part C-]'or district only.
Table C-V-Up to anchals for total only.
Table C-VII-Up to anchals.
Table C-VIII Part A-Up to anchals.
Table C-VIII Part B-Up to anchals.
Relevant particulars of the above tables are given below :
Table C-I-Composition of Sample Households by relationship to head of family classified by size of land cultivated
The table gives separately for total,' rural and urban areas the composition of sample households by heads of households, their spouses, relations (separately for married and never married, widowed and divorced or separated), and unrelated persons. The information relating to rural areas is cross-tabulated with reference to households (i) engaged neither in cultivation nor in household industry, (ii) households engaged in households industry only, and (iii) households engaged in cultivation, the last named category being further classified by the size of holding into 10 size classes.
Table C-I1-Age and Marital Status
This table gives, separately for rural and urban population, the marital status of males and females for the entire population and a180 for quinquennial age-groups beginning flOm 10-14 years. All persons up to 9 years of age have been treated as 'Never married'.
, Married' implies a living spouse, whether of the first or a subsequent marriage, and includes any husband-wife relationship customarily recognized by society as well as de facto union.
'Widowed' means married but spouse dead, no remarriage having taken place.
'D1'vorced' means a person divorced in a lawful manner either by a decree of a law court or by a reg:ular social or religious custom, but not remarned and 'Separated' means a person separated from wife or husband and living apart with no apparent intention of living together again.
'Age' means number of completed years On the 1st March, 1961, the reference day for the 1961 Census. Infants below one year have o year as their age.
Table C-III Part B-Age, Sex and Education in Urban Areas only
Table C-III Part C-Age, Sex and Education in Rural Areas only
In both the tables, educational standards of the population (classified by sex) are given

67
for aU ages and quinquennial age-groups commencing from 5-9 years to 30-34 and broader age-groups thereafter. Those within 0-4 years of age were, by definition, treated as illiterate.
Table C-V-Mother-tongue
This table gives the number of speakers of each mother-tongue returned in the Census. The mother-tongues have been given in alphabetioal order and are olassified by the Linguist in the office of the Registrar Genera.l, India, on the basis of Grierson's Linguistio Survey. They have been marked appropriately to indio ate :
(i) mother-tongues of countries outside the Indian sub~oontinent (printed in italics) ;
(ii) mother-tongues unclassified in the Linguistic Survey of India (with asterisk) ;
(iii) mother-tongues though classified in the Linguistic Survey of India, either tentatively reclassified by the Linguist or considered by him to be unclassifiable (with dagger);'
(iv) :qlother-tongues unclassified by the Linguistic Survey of India but tentatively classified by the Linguist (with asterisk and dagger).
In 'Na~puri-Eastern Magahi', the hyphenated words have been inserted by the Linguist to indicate the affiliations, of the mother-tongue 'Nagpuri'.
Mother-tongue is the language 'spoken in childhood by the person's mother to the person or mainly spoken in the household'.
Table C-VII-Religlon
This table gives figures for the following six main religious groups, arranged in a]phabetical order :
(i) Buddhists,
(ii) Christians,
(iii) Hindus,
(iv) Jains,
(v) Muslims, and
(vi) Sikhs.
There is a residuary group of 'other religions and persuasions' as also a group comprising of persons who did not state tlfeir religion.
Table C-VIII-Scheduled castes and Scheduled Tribes, classified by Literacy and Industrial categories of Workers and Non-workers
Part A of the table furnishes data for the combined population of all Scheduled Castes and Part B for the combined population of all Scheduled Tribes.
The population is categorised by sex into (i) illiterate, and (ii) literate and educated, and also by the nine industrial categories of workers and non-workers.
The Scheduled Caste population of' the district as given in Table C-VnI Part A in Part'II·C, Vol. IV, Bihar, 1961 includes 4,260 persons (1,224 in rural and 3,036 in urban areas) belonging to Bhuiya caste wrongly returned as Scheduled Caste while according to the Presidential Order, they are not so. However, corrected figures for Table C·VUI Part A have !Jeen given in this volume.

Table C-I
.... ....
o ....
.... .... 1:-0 o .... ....
o lQ ....
00

69
TABLE (J-IJ-AGE AND MARJ;TAL ~iATu&
MARITAL STATUS
Age-r-
Rura.l Total Population Never Married Married Widowed Divorced or Unspecified group Urban Separated Status
,- - ,---"----"""'\ ,-_ __.A,..---"""'\ ,-__.A..----,. ,-__ -"-_---. ,-~-"""\ Persons Males Females Males Fema.les Males Females Males Females Males Females Males Females
1 2 3 4 5 6 7 8 9 10 11 12 13 14 Hi
HAZARIBAGH DISTRICT
All Ales R 2,195,227 1,092,678 1,102,549 536,612 434,857 512,686 540,1l1J8 88,2160 123,706 4,477 8,170 643 688 U a01,184 110,8a5 90,859 54,883 40,103 53,283 43,265 2,558 6,875 66 70 85 46
0-9 R 718,824 360,237 358,587 360,237 358,587 U 59,763 30,169 29,594 30,169 29,594
10-14 R 241,969 127,997 113,972 105,887 61,970 21,219 50,835 309 538 332 487 250 142 U 21,877 12,212 9,665 11,411 7,532 778 2,118 3 8 20 7
15-19 R 175,342 85,102 90,240 40,490 9,409 43,340 78,974 642 1,010 532 767 98 80 U 16,763 9,561 7,202 7,018 1,819 2,518 5,333 17 44 2 3 6 3
20-24 R 179,453 82,209 97,244 15,222 1,739 64,813 92,658 1,239 2,219 859 542 76 86 U 19,638 10,957 8,681 3,994 598 6,860 7,978 90 91 12 6 1 8
25-29 R 187,444 92,620 94,824 6,553 912 82,941 89,218 2,041 4,167 1,014 442 71 85 U 19,125 10,677 8,448 1,342 353 9,178 7,845 138 232 18 11 1 7
30-34 R 156,127 78,905 77,222 4,134 567 71,732 69,141 2,317 7,124 668 321 54 69 U 16,506 9,564 6,942 461 75 8,925 6,494 165 347 11 23 2 3
35-39 R 127,454 65,069 62,385 1,522 403 60,527 51,915 2,641 9,821 351 181 28 65 U 12,573 7,754 4,819 162 30 7,408 4,364 180 416 3 6 1 3
40-44 R 102,461 50,101 52,360 967 282 45,419 39,179 3,425 12,707 272 143 18 49 U 10,557 6,233 4,324 128 33 5,837 3,537 262 742 6 9 3
45-49 R 89,603 45,635 43,968 528 167 40,578 28,151 4,332 15,552 183 72 14 26 U 7,454 4,498 2,956 64 18 4,127 2,230 301 699 6 2 7
50-54 R 73,227 36,424 36,803 375 295 30,773 18,476 5,158 17,951 104 60 14 21 U 6,395 3,769 2,626 51 14 3,359 1,486 356 1,119 2 6 1 1
55-59 R 48,728 25,034 23,694 250 144 20,561 10,375 4,148 13,126 69 32 6 17 U 3,250 1,850 1,400 25 7 1,604 743 218 646 2 2 1 2
60-64 R 47,424 21,939 25,485 164 208 16,662 6,367 5,065 18,838 43 54 5 18 U 3,654 1,826 1,828 24 5 1,434 667 365 1,153 3 1 2
65-69 R 19,143 8,906 10,237 46 41 6,368 2,288 2,464 7,868 26 32 2 8 U 1,317 655 662 8 3 493 224 153 435 1
70+ R 27,727 12,325 15,402 149 77 7,677 2,49b 4,469 12,775 '24 37 6 18 U 2,256 1,074 1,182 13 6 751 235 310 940 1
Age not R 301 175 126 88 56 76 56 10 10 1 4 stated U 56 26 30 13 16 11 11 3 2
SADAR SUBDIVISION
All Ases R 1,125,519 566,296 559,~8 277,887 2.24,427 267,855 271,190 18,2.2.7 61,284 2,260 1,907 567 415 U 91,~88 51,059 40,5~9 a6,687 18,260 23,296 18,789 1,049 8,442 25 83 2 5
0-9 R 366,164 183,146 183,018 183,146 183,018 U 26,973 13,700 13,273 13,700 J 3,273
10-14 R 124,,741 65,916 58,825 54,988 33,922 10,253 24,240 210 257 236 294 229 112 U 10,638 6,006 4,632 5,741 3,757 263 869 2 5 1
15-19 R 90,.695 . 44,757 45,938 22,417 5,514 21,682 39,453 307 490 261 425 90 li6 U 8,351 5,029 3,322 3,902 888 1,125 2,413 2 20 1
20-24 R 93,158 43,594 49,564 8,884 816 33,675 47,177 562 1,190 404 327 69 54 V 9,282" 5,404 3,878 2,188 180 3,178 3,655 35 42 3 ,1
25-29 l;t 98,812 50,572 48,240 3,976 3.38 44,944 45,496 1,059 2,1l0 533 254 60 42 U 8,273 4,742 3,5'31 6'S3 82 4,0"04 3,348 47 98 8 ,3
30-34 R 80,835 41,8ti7 38,978 1,552 214 38,830 34,899 1,103 3,621 ' 324 211 48 33 U 7,049 4,092 2,957 242 25 3,793 2,759 53 155 3 18 1
35-39 R 66,119 34,-605 31,314 978 171 32,377 25,898 1,267 5,108 161 107 22 30 U 5,387 3,289 2,098 73 13 3,145 1,877 69 208 1 1
40-44 R 51,528 25,704 25,824 639 75 23,256 19,520 1,675 6,1l3 120 92 14 24 U 4,532 2,648 1,884 65 16 2,478 1,529 101 334 4 4 1
45-49 R 45,119 23,156 21,963 269 25 20,750 14,156 2,037 7,722 89 42 11 18 U 3,184 1,902 1,282 28 9 1,764 945 108 326 2 2

70
TABLE (l-R-AGE AND MARITAL STATU8-CO'ntd.
MABlTAL ST~TUS ,-
Age- Rural Total Population Never Married Married Wi'dowed Divorced or Unspeoified group Urban Separated Sta.tus ,- ,---'---. r---A~ r---A~ ,-_..A.,.---"\ ,-___.A. _ _... l'ersons Males Females Males Females Males Females Males Females Males Females Males Fe;males
1 .2 3 4 5 6 7 8 9 10 11 12 13 14 15
SADAR SUBDIVISION-concld.
50-54 R 36,361 18,258 18,103 169 178 15,662 9,204 2,370 8,674 48 37 9 10 U 2,823 1,616 1,207 22 5 1,455 657 137 542 2 3 55-59 R 24,390 12,645 11,745 128 21 10,583 5,363 1,898 6,332 31 20 5 9 U 1,488 844 644 14 4 733 309 96 329 1 2 60-64 R 23,501 10,927 12,574 60 49 8,466 3,144 2,377 9,336 21 36 3 9 U 1,787 877 910 14 2 697 260 165 647 1 1 65-69 R 9,660 4,543 5,117 18 10 3,333 1,161 1,179 3,908 12 32 1 6 U 661 339 322 4 3 254 86 81 233 70+ R 14,202 6,281 7,921 87 39 3,993 1,427 2,175 6,415 20 30 6 10 U 1,149 562 . 687 8 2 401 81 153 503 1 Age not R 234 135 99 76 37 51 52 8 8 2 stated U 11 9 2 3 1 6 1
CHATRA SUBDIVISION
AlI Ages R 808,558 151,728 156,830 77,666 64,871 67,875 78,262 5,742 18,886 425 217 20 94 U 12,507 6,888 6,119 8,344 2,687 2,828 2,752 210 677 .2 a 9
0-9 R 104,828 52,950 51,878 52,950 51,878 U 4,24,2 2,145 2,097 2,145 2,097
10-14 R 33,140 17,522 15,618 14,867 8,718 2,595 6,812 35 48 19 31 6 9 U 1,366 724 642 672 498 47 143 1 6 15-19 R .23,722 11,696 12,026 6,046 1,548 5,617 10,295 83 137 49 36 1 10
U 1,014 533 481 357 70 171 403 2 8 1 2 20-24 R 24,329 10,875 13,454 2,088 557 8,538 12,576 177 291 69 20 3 10
U 976 438 538 90 10 338 521 8 7 1 1 25--29 R 24,615 11,348 13,267 783 405 10,265 12,214 238 602 66 32 1 14
U 1,006 495 511 36 2 449 485 10 24 30-34 R 21,195 10,192 II,003 399 278 9,391 9,714 328 976 72 26 .2 10
U 863 453 410 20 3 421 376 11 31 1 35-39 R 18,106 8,859 9,247 170 211 8,223 7,522 424 1,481 41 20 1 13
U 687 371 316 6 1 350 264 15 49 2 40--44 R 14,921 7,286 7,635 110 193 6,594 5,401 532 2,016 49 18 1 7
U 602 306 296 6 2 284 227 16 67 45--49 R 13,022 6,533 6,489 92 134 5,732 3.763 687 2,584 22 8
U 484 274 210 8 1 236 133 30 75 1 50-54 R 10,129 4,909 5,220 60 106 4,015 2,373 820 2,726 13 9 1 6
U 378 217 161 .2 2 193 79 22 80 55--59 R 7,197 3,555 3,642 39 119 2,833 1.345 666 2,168 16 6 1 4
U .257 128 129 113 64 15 65 60-64 R 6,656 2,980 3,676 35 164 2,250 731 690 2,778 4 11 1 .2 U 311 153 158 1 111 35 41 123 65-69 R 2,798 1,269 1,529 10 31 848 259 406 1,237 4 1 2
U 126 56 70 1 43 15 12 55 70+ R 3,856 1,732 2,124 10 23 1,060 254 661 1,841 1 6
U 194 95 99 67 7 28 92 Age not R 44 22 22 • 7 16 14 3 2 1 1 stated U 1 1 1
GIRIDIH SUBDIVISIO.R
All Ales R 761,160 814,654 886,496 181,559 148,059 176,9116 195,676 140,291 408,586 :1,792 1,046 66 178 U 97,089 68,378 408,711 24,852 19,:156 27,164 21,7S4 1,299 2,756 Be 84 94 41
0-9 R 247,832 124,141 123,691 124,141 123,691 U 28,5118 14,324 14,224 14,324 14,224
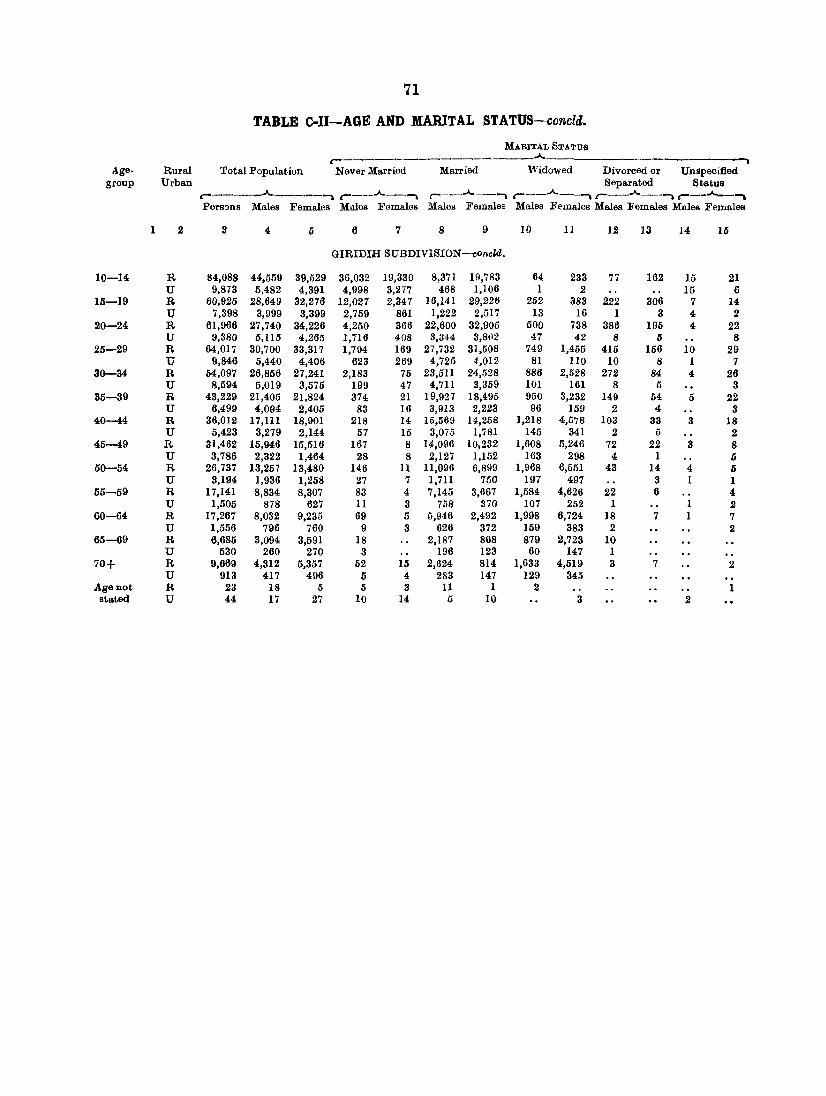
71
TABLE C-II-AGE AND MARITAL STATUS-concld.
MARITAL STATUS r-------------------.A.
Age. Rural Total Population Never Married Married Widowed Divorced or UnSpecified group Urban Separated Status
r---__.A..---, r--_.A._-, r---.A.----, r--_.A._--, r---.A._--, r---""'_-""\ Persons Males Females Males Females Males Females Males Females Males Females Males Females
.2 3 4 5 6 7 8 9 10 11 1.2 13 14 15
QIRIDliH SUBDIVISION--concld.
10-14 R 84,088 44,559 39,5.29 36,032 19,330 8,371 HI,783 64 233 77 162 15 .21 U 9,873 5,482 4,391 4,998 3,277 468 1,106 1 2 15 6
15-19 R 60,925 28,64[1 32,276 12,027 2,347 16,141 2[1,226 252 383 222 306 7 14 U 7,398 3,999 3,399 2,759 861 1,222 2,517 13 16 1 3 4 .2
20-24 R 61,966 27,740 34,226 4,250 366 22,600 32,905 500 738 386 195 4 22 U 9,380 5,115 4,265 1,716 408 3,344 3,802 47 42 8 (j 8
25-29 R 64,017 30,700 33,317 1,794 169 27,732 31,508 749 1,455 415 156 10 29 U 9,846 5,440 4,406 623 269 4,725 4,012 81 110 10 8 1 7
30-34 R 54,097 26,856 27,241 2,183 75 23,511 24,528 886 2,528 272 84 4 .26 U 8,594 5,019 3,575 199 47 4,711 3,359 101 161 8 5 3
35-39 R 43,229 21,405 21,824 374 21 19,927 18,495 950 3,232 149 54 5 22 U 6,499 4,094 2,405 83 16 3,913 2,223 96 159 2 4 3
40-44 R 36,012 17,111 18,901 218 14 15,569 14,258 1,218 4,578 103 33 3 18 U 5,423 3,279 2,144 57 15 3,075 1,781 145 341 2 5 2
45-49 R 31,462 15,946 15,516 167 8 14,096 10;232 1,608 5,246 72 22 3 8 U 3,786 2,322 1,464 28 8 2,127 1,152 163 298 4 1 5
50-54 R 26,737 13,257 13,480 146 11 11,096 6,899 1,968 6,551 43 14 4 5 U 3,194 1,936 1,258 27 7 1,7II 750 197 497 3 1 1
55-59 R 17,141 8,834 8,307 83 4 7,145 3,667 1,584 4,626 22 6 4 U 1,505 878 627 11 3 758 370 107 252 1 1 .2
60-·64 R 17,267 8,032 9,235 69 5 5,946 2,492 1,998 6,724 18 7 1 7 U 1,556 796 760 9 3 626 372 159 383 2 2
65-69 R 6,685 3,094 3,591 18 2,187 868 879 2,723 10 U 530 260 270 3 196 123 60 147 1
70+ R 9,669 4,312 5,357 52 15 2,624 814 1,633 4,519 3 7 2 U 913 417 496 5 4 283 147 129 345
Age not R 23 18 5 5 3 11 1 2 1 stated U 44 17 27 10 14 5 10 3 2

12 Table c-llI Part; B
$ r ~ ~ 'CO~lQCO 'C'I ,I ]~ f 11 .... C'I ~ co ....
~ 1t'tS & § 01 ~ ,.Q j: • oS; 8l ...
~ :~t--~ • ~ C'I 0 .... ....
S .eo i:I '"a 10 .... co
:z;'tSg'L::a .... L~
'<a \ ~ ..... t-I ~ IN..-t ='l ....
fi IQ : ................ .,.M~
N ° CI:I
.eo 50 1 .... co .... til) III 'tSQ)$ .... Q ... 1 <Q 6'v
1 ~ Q) :a I; I'll Q) ... ... ~~ co .c-1 ............... ~Cl) .. .,
fICI • COl'" OOCN~ ~ I:-i ~ 1a S ~
Q .. ~""""I"""t~CN ~ ~ Cl) fICI C'I .... .... 'tS E'1 ~
~ co L~ ~ .... Q)
~ E-IoS L::a 10 I:) l1I
t- 'C'I 10"'''' 00 0 ........ ::I
11 8 t I gJ 'tS
8 ·~P""t(C~~O~
! ~ cr.
C!2 .~ t! ] ~~""" .......... C'I
~ C'I .,.;'
~ .... 0
J;I III '0
I~ ,:I 1;j.rl ~I ~ 8. ~ I'iJ ]·~8 III ! ......... 10 ... 10 C'I C'I eX) C'I fICI ......... .....
"'1:1 ..... Cl) 00 eX) co lOCO 0 .. ~ .; ... .~I:tI1Zl ~ ..... C'lOCQI'""4C'QooC'Q 0 Eo!
cq .... rR ....:'ci..-t .. ,..;-~
i ~ 1;j L::;t .... L::;t
~ ::a
'tS
fl f~ co • .... 00 ... eX) eX) cq C'I 10 c-1 c-1 :- .... ° 10 eX) .... CCl c-1 eX) '" 0 5 ~
.... 9 c:.::t~~r;.~~~~ c-. ~ ° ...
~.~ o ~ ~ .... ........ Oi b ~1l=I :s ::I ,; :a .. i~ ....... cq ........ cq ........... c-1
= 0- j-i C5 . ~.~ I ~ fICI Q) ..... : ....
CN .c:t> lOCO 0""""", cqocc Q)
~ .., 10 CI:I
""00 00000 .... 0 .... C'I Q)Q C'I Cl) ~- c&'cicN ...... ...;'ci ..: S L~ :z; P-I'":I L~ 1C >l 0 l>-E-!
~ ....
~ ~ 0 u .... ~ ::I
fi t- ·0c-1 ... 00 0co"'0 .... 1O 0 'tS
fi 1
~ t- • Cl) c-1 10 <C> '" ......... C'I C'I
~ .. ....
E-! ~]~ co .... OOCOIO ............ OO .... 0 Q) c-1 III eX) llf .. .. ... .. .. .. ... ..
g a .... ;i C'l ...... ...... .-I .-1''''''-' Q) ::s 11= .... ,!!j P ~ ~
I~ = "_'~G)
I~ ~
-=- 'I> C) I>-~ .01O .... "'cq ....... lOcq .... r"I ~
0 co : C<I "" ........ · f;I1 ~ +' = Q) ·OOM<C>c-1 ....... 00C'l .~ .... -: ~iP-t co_ OO ....... CN ... Cl)C'la. .... Oi c-1 ... ~~~~cQci..;ci..; <II
= t:Q ... L~
.... ., l::;t
~ i4 co 'a -:
f1 co co"'COINOOCOcqOOIO~ ~ f 8l
0 . : .... c-1 co C'I .c-1 N t- g~g~~:::~t1~~ C'I .... -: co IN
~ = 00 t:-- ~~..;..;~<tS~"':~(f) Q)
1~ CI f;] CD fICI .... ...
1 C)
t
l~ j CI:I :C<loooo~d!l~ .. ... COCl)"' ........ OO .... OO .... C'lOO
.... too
1 ~ C'I C<I co OOOOCO ........... IO .... Cl) ....... L~ .,p r:-OI00C'lOOt-0>r:-00
lQ 1:11" ~ 00 cO rQ cC cO to aO ..:t" ..; IQ ....
f1 · . 0 · .
)1 til) C<I
~ ~:;l~~«l~~~~~g CI
~ 1C .;:
I~ co 01O"'C<I"' .... o:> ..... a.~ ! ... 0- to ..qi" a; r:: as rrS ~ ~ rtS M ~ ~ • ..... Cl)OO~CCOCO
~ <II ........ '6'0 Cl) . .... c:' .. NC'I .... ....
E.i § ~ L~ ~ j ~ CO"'CN ............. t-t-IOCC
QOOO ..... CCIQ~ccOO,...clQ(N l Q) fill '00 0 co ........ cc '" co co .... CQC'llQ"'~lQO> .... lQ ~ '"'1 CD
10 . '0:> 0 ";..Qc-1~oocn~o~ <XI fICI • ... IQ~COC<l g. .... 1"""1 .......... _. ............... ~i~] 4) ]
.... ....
~ P-I
.... Ol ., ZI!VT -g ... ~~l'~OOlOeOc:l')~~
~1 14] ~ i • .., Of) .... 0.., Cl) 0
CI 00 oo~~~~(NO~o)c.110 .,. .cc~~~c;~~ • 8 ~ C<I ..-:. .... Cl)<Xl ... ~ .... IO .... OCN ... .. ~~"' ..... ·¢,)"~'£c~';r:--" ... 'tI );l ~
L~ <:) CNC"I~""''''''''''''''''C\I'''' L~ ~ ... C'I • · . . .
go "d
~ <D 1 ... 'tS
~ ... ~ .s .... III G
.... a. .... "' .... "''<1' .... '" <Q a, ... ~ .. = .... Cl);:!!~~~c:!: ... ~ .:
CD
J~II!II!lti ~ l~~*~~~l~~; til) eo -: -: ~
........ CNCNCO~ ... CC
~

'3 TABLE C-III PART C-AGE, SEX AND EDUCATION IN RURAL AREAS ONLY
RAZARIBAGR DISTRIOT
Literate (without E;OUCATrONAL LEVll:1II! Total Population Illiterate educational r------,...,A_ ""'\
levels) Primary or Matriculation Junior Basic and above
Age-group ,- Jo.. ____ ~ r----Jo..--~ r--Jo..--~ r-..Io..-~ r--Jo..-....
Persons Males Females Males Femmes Males Females Males Females Males .Females
1 2 3' 4- 5 6 7 8 9 10 11 12
All Ages ~196,227 1,092,6'Z18 1,10~649 867,872 1,O71,8'l4 17t7',872 26,090 46,882 4,622 12,07'2 56B
0--4 360,555 176,431 184,124 176,431 184,124
5-9 358,269 183,806 174,463 154,494 167,074 28,791 6,686 521 203
ID-14 241,969 127,997 113,972 82,151 106,847 35,794 5,876 9,984 1,236 68 13
16-19 175,342 85,102 90,240 56,771 85,978 16,898 3,246 lQ,198 921 1,235 95
20-24 179,453 82,209 97,244 55,069 93,298 16,148 2,969 7,256 804 3.73'6 173
25-29 187,444 92,620 94,824 66,494 91,816 17,838 2,281 5,593' 576 2,695 151
3D-34 156,127 78,905 77,222 58,742 75,231 14,848 1,617 3,709 318 1,606 56
35-44 229,915 115,170 114,745 87,958 112,632 21,224 1,780 4,445 278 1,543 55
45-59 211,558 107,093 104,465 84,600 103,172 18,717 1,135 2,880 140 896 18
60+ 94,294 43,170 51,124 35,017 50,578 7,096 498 769 46 288 2
Age not stated 301 176 126 146 124 18 2 7 6

U Table C-V
rm ..... .",= . ... .a. '" . ... .~
IIH ·ao '0<= ..... 0 .« '" .... .... .... Q>
.... .... ..; ~
.... 10 ... ..... =C"-I '10 . .., • ..... co .......... . ... lOa> .... 'C"-I ·ao 10 • 0 ·0 CO) ..... .... CO) .... 0 ~
~ L~ .... 0 C"-I
1 fj • CO) '10 ;« .... ·10 .... ... 10
'" ....
ci i~r C-l
1~ ! . ~ ·0 .... 'C1 0 .0> ....
C-l p:j ~ CI) ... «
C> ...
0; .... llij ..... ..... ;10 .... 0 .... .... .~ .... ~ ~
0 ...
.0 .... ,0 . ", .... '0> ... . ... '" '10 ..... p:j~ ~ . "" ..... 'C-l ~
... ... ao ... ..; ....
hi] .... • CO) ... ... 0
<= ....
ci C-l Iiiil
~ ~~ ! .CI) '<:1> ~ .... .~
:g~ p:j ~ CI>
~ 0; .... ~ diJ
..... ..... .« co « · .... . "" . .... ... ao 0 ; Of) C-l
~ :e l ! .... '10
'" ..... ·ao • CI) ... , p:j L~ ....
0 ci C1
~ f! :« · ... ..... CO) .... «ao • « .... « ·10 . .., .", "' .... • a. .... "'« • CO) .... ....... lrl 1 .~ <c ... <:> '" • .... ·ao • CIt • ao ~ ....10 ..... • CO) <C
<C 0 1Q<C .... ... "'!« .... ~ = .... "I ~ '" ... E hl' .... 1000 .... ..... =0 "'ooco) ... 'C"-I . .... • .... ..,. ..... C1 • 010 ....... "'a.ao .« 00 '"
.... . ~ 1000 ....... . .... • <C '" • to .... aoo • ... <:I> lDi ~ 10 lOCI) ao CI) ~~ .... = .... CI) ... ...
~~ fi :CI) • 'OIl 10 • <:1> "'CO) ........ lQa>e<I ·10 .... • to .... '" 0010",,'011'" 10'011 .ao .... • '" 10
.0> <C 00> 10 CO) ... .« a. CCC"-l IOCC ..... • 'OIl Q> 'OIl 0 ........ <C C-l .... .... '" C1 ..;
ci ~~ r: .... to cc
~a l~ .., .... lOao ... ... « ... <:I>~ CI)<:I>.., ........ 00000«'" ;e<lg ... ;: 'e<I • « ao ~~ooo>~ 'e<I "" to C"-I "" ... 10"'<:>10 ........ .... ..... • to « • c> 10 '" Oto 10 ... 00 0 1010 ~ .Q ci ... ~ ....
00 · . .. . . - · . . . . . · . 0 .. · . ~ d: IS
! I .. j ~ « p:j
II; 'e-~ :.-~ p:j :a ... :i .0
'~'5 J tS :0 c Ia'! .~ :a ~. '~j ~~lli tC)~ J ":.o:i ~
~UH j c c.~~ i'B,,}
.... ~ .... ~ .... § I 0 ~~"IXI ... .£: .;; .0:." .. .t r ~tl~ ~i!~~ ........ ~.8 .... ,,~.J ~ 't! • a,,q il!:=';~ ].8 .. 1:1 ~ f~l£:e .S 0 l~~ ~<p:j~1XI IXIIXIIXIIXIIXI ~o~AA A~1iiI 0 ~~86r;.'1 III III '-I +- * 18 ... ~Ci)'OII1O <C .... ao"';: "'«CI)'OIIIQ oo .... ooa.o "'e<lCi)'OII1O "' .... 000>0 ... «.., ... ..,
~~~:~ " """' ................ ..... ....c ......... ~ «~e<lC1« C1«CN~Ci) Cl)Ci)CO)CI)Ci)

'1 . .... 0
~~
(Q ....
Q ...
....
'" 00
..... .....
II) .....
. ....
76
.~ .....
.~
.C<I
.<0 ~
.",
.Q
'" .~ .11)
00 ci
.~ ..... C<I cQ
.(Q
.00 0>
.(Q
.00 co:> ...
• t--• (Q
":. ... .(Q .", ..,
....
.(Q ~
Table c .. v .11) .C<I
• 00 .<:C
C<I
.Q
.~ ...
.Q
.~ ...
.00
.~
....
.~
.'" .t--... ... • C<I .(Q ... ...
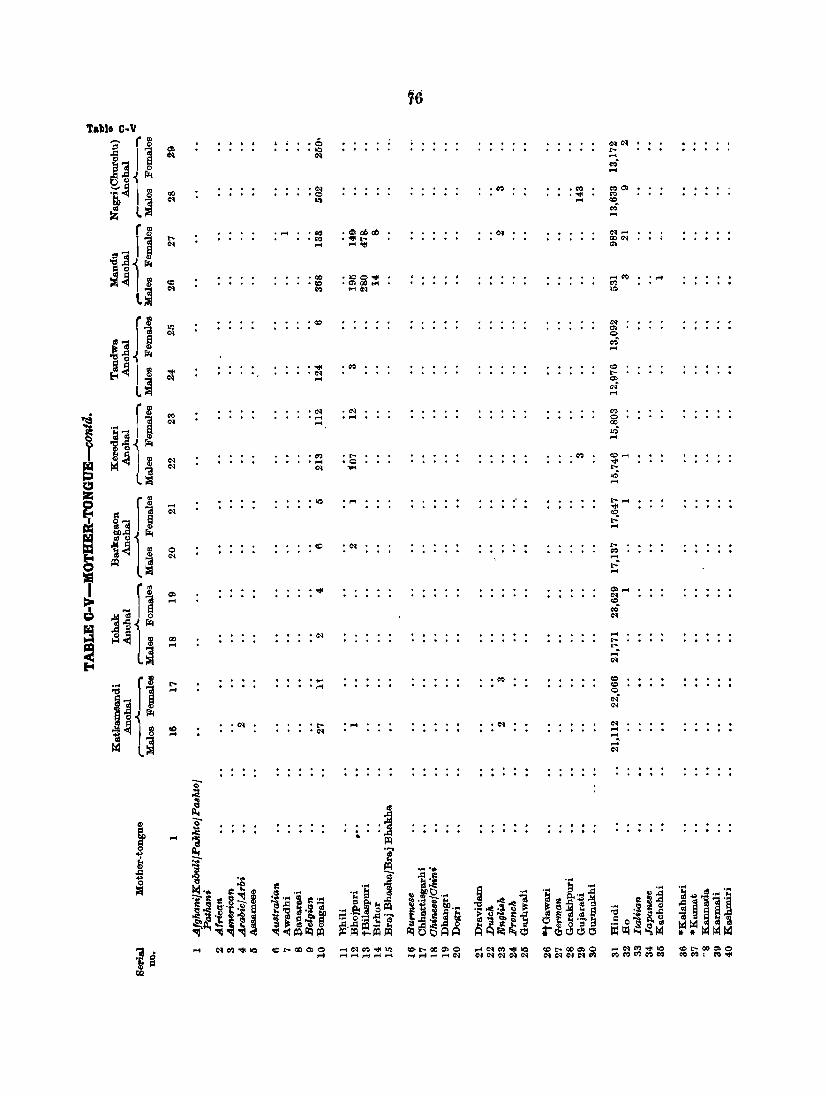
Cl> .....
00 ....
r.....
....
.~
" , . . 6 '10 ~
.~ '0 ..,
..... 'co • CQ ...
'00 ,"" C')
· ""
..... 'C'I ....
'C'I · .... ...
, '" , .... eN
'10
,'"
: ....
· .... .....
.~
'C'I
.",
.C'I , ...
.~
·0 ,...
......
:~
: ....
.",
.~
.",
'C'I
.(0 ..... ...
.",
~
'" .... .,: ....
, .....
, , ..

-~ . • _ 0
~ =
00 ....
• 10 .... · ....
• ..:> .... · ... 10
'00 'C'I ..... .... • <0 ·0
00 ....
· .... • <0 <0
·10 .<0
.;<
· .... ·0 10
• .;< • t-.;<
·0 • IN
.....
:.;<
·10 ·10
C'I
·00 · ..... ..,
·10 .<0 .....
.",
• <0 .....
• .;< .<0
.....
.",
.<0 ....
..... 'C'I
'0 'IN
'<0 • .;<
· ..... • .;<
...... • <0 <0
...... · ..... <0
77
.IN
·00 ...,
• <0 • .;<
'0 • eo .... ..;
.<0
.00 Q>
cQ
• <0 .... .C'I '0 cQ
: .....
'>0 · ....
:..,
.", '';< .... .... '00 'C'I
":. .....
'0 .t-
.;<
· .... 'IN
.t....
.0 .....
......
·co
Table C-V
.<0
.00 o ...
. ...
.C'I <0
." ."", ...
."",
."", .,..
,'0 .00
C'! ... ."'" .:: . ... .0 . ..,
or
• too . ... IN
..." . .... a> <N"
.t-.;;; ci

78 Table C-V
r ~ :~ '<0 :10 :"" ..... • e; ¢ ~ .e;
~] 11 10 · ,... • <0 .... .... "" 00 .... ~ ,.,
cd 0 i r.. ,.,
'g ~ ~ . ", :~ '10 • C!> C<I cc .... .....
"" .~ .... .... ~ L~ ""
'C<I C<I --:. ... ,... . .... .., f~ • 0> :0> .... 'C<I ... ·10 00
:$;& ~ "" ~
"" c-i c-i :S'fiir.. .... ~~ ~ .00 '0 0 .....
.0 · .... 00
~ L~ ~ 00 00
"" ..... ",,' .... r ill .co · .... '<II
~- 11 • 10 c:D .... ... 0
"" .,; s.! ~ ~ .... ",0 r.. ... cd~ I", · .... :C<I ~ 1 ~ 0 · .... '<II
L~ ... 0
"" ..; .... ~ r gJ ."" • 00 c:D
"'- 11 0> · ... 0 ... .... .e.!I~
... ",'
~ 0 1 ~ ....
~ 1) ~ to • 0> · .... ... P-4 ~ 00 .0 r-
L~ ... ... co S If) .... i r~ • C<I .... . .,.. .... c:D .... ,... ·co 'C<I ..... C<I
W ",- S ... "" 00
~ .... .! I ~ ",,'
~ o~ ~ C<I c;:J :z; ~!~ ·00 '00 · .... ......... ,...
'co ·00 .... ..... "" 0 L~ ... 10 ,... E-c 'Ii
C<I
= _ ri · .... 0>0> ."" W 10 .C<I C<lO> • cc ... C<I .... .... = cd '" i ~ ... ...; E-c ~-t1 ~
0 Cl ~. !l . ,... · .... 10'" '0> , ."" coo • 00
l~ "" ... ........ .... ... ...;
fill eN > ~ co 0 · .... ... .... ... ~.... ~ ... C'-J.
f4 ~.! ~ r.. .... ~ ~
I'i 0 I III "' '<G~ ..!l .... .... ... -< • L':) 0>
~ cd C<I 0> E-c l)l ... 00
III
_d' f1 :eN .... ',...0 eN"" ·10 • lOP 'eN .,... 0> .Q> '0 . .... .... · .... '0> '10 .... .... 0> 0>
~] ~ ... ..; bO ~ r.. ... ~~ I ~ . .... · ... • 00 eN ..... .,... . .... ."" lOP .... .0 'eN 0 ..... '10 .... · .... . ... '10 ,... .... ~ l~ ...
~ 00 10 .... r:: ... .
I ~ ~ :f ~
.... 0
i ~ 0 ~ ~ ce .. .... . ... ~
i e ..d ~ ... ....... ~ -g ~ Or ~~ ';:: ~ ..d
t:<.~ =" ~ ~ .... '.:'§ j ., ~g_ .... J ..e..e;; .... Jj .poj
.,~ ]"'~11 ;;;- §t!..q~ ~ .... ~ e· ... ~ a.. .... ~ r"" ~ ;=:e~ =~ '~~J ,,;§ [! .sl ., ~ .. ~ :; i ti> .... '~..e .:; i ~ e ! 0 " ~ cd ~ 1;'~ ., ~ := .e;_ j._ ~... .Q cd ~ cd ~ ~ 't:I .li ..d
l~g~~ :a 0 ...... cd ~~~j ~ e :s~~ ~ Cl ...... ~ .. ~1il ~~j~~ ~~~-i.q ..q<~~~ ..d~ ......
:-~~6C! .... ~.g tS Il:lll:l+-Il:l~ ~o~AA AI:l C! ~ .... ")~
-;. .... ~"'''lQ "'~ooo>o .... CN ... ""l0 <:>,...000>0 ..oCN"'''''lO <:>,...ctl 0> 0 .... C<I ... ""IO co,...ctlo>o • " 0 .... 1""41"""1...-11""'(.-( 1""'(1"""11""'( ..... '" eNC'I~eNC<I ~CNC<lC<I ... ... "1"'''1 ... ... ........... ~ 5:1 rI.l

...
o "'"
'0"'" ....
....
.Q)
..... Q)
.""
·0 '10
."", '10
.....
...... ... "'"
• co
. ....
• co ·cc
.ct) '00
'10
.Q)
."",
'10
."", .... ·00
19
. ....
.....
00 o ...
:IN
·10 ·0 ...
• C'I)
. "",
.... ... ·0 ~
.~ ~ ."" "'"
'cc .... ... It)
.~
'cc 10
'" '10 • co co
'" ."",
• co cc
'" ."" · ... cc ci
·0 .C'I)
cc ci
·10 .IN ... ·10 . ..,.
IN
Table C-V .Q)
:~
....
."'" .... :10
·co . "" ...
• co .~
...: ·co '00
QO
'0 ·co C'I
'00 . ... C'I
'0 .(1)
co
. ...
.(1) co
'0 .", ...
:~ ....
'00 '"", ... ....
..

80
Table o-V
f~ · .... ."" co ... '<0 ..... ~
I! 1 ~ <0 .....
a-: 'lG°11o:! -=~ .. '<0 .<0 co o ~ 0 .~ .C't <0
l~ '" 00
.c ~ r gJ .... .C!) .C't 'C<! "" ~] 11 CO> "" 10 C't s:::.. I ~ a-: ,s"ilo:! .....
~~ 1m · .... .¢") '" 00 "" ~ L~ 10 "" a-: ... . _ r ~ ·0 .¢") '0 00
= a 10 · ... .... CI> ... ~] ~ a-: ~" Io:!
... §~ l ."" .C't '10 "" '" · ... C!)
III l~ 10 10
t-:' ...
. ~] f 1 'C<! .... 00 10 ~ 10 "'" ~.
"1:i ~"llo:! .....
.... 'M .... co ~ ... ~ '" .... ~ '" 1:1 <:>
L~ 10 '" r .0 ...
~ r ·00 00
~ OJ C!) 0 ~_ a 10 ~ 0 ...
lZ4 ~A ~ C!) s:::.. Io:! 0 jll~
·0 10 .... E-I 1:1 'M ...
= 10 IQ
o L~ a> ~
J';Il
a ~ rt '" 1:1:1 ..... .0. .¢") .0> .~ 0 ... '00 .C't · ... · ... 0
fool IQ ... 0 ....
~ '" ~ <!)
... ~ ~ I ~ .C!) .... ."" :~ . ~ '10 C<I .....
'" 0 • 1;-0 ..... · ... · .... 00
> o ~ L~ 10 t-:'
I 0 g ... JiI;1 ~ .... f i · .... co .... 10 . .... :""" .(0 ~oo
0> .~ (o~"" '1:1 g~ ~ "" "" ~
0 ... Ai Q 11:1 I!o Io:!
fool 15 ~ gJ ."" MoO 00 ."" OC!) '0> :~ .... ·10 1Q~C't • C!) ~~
~ L~ 00 0
"" .... ,.; C't
_g] r i .C't .. · .... co 1;-0 • C't 10
"" C<I ... Aol~ C't
~~ Lj .C!) .¢") .<0 · ... (0 ...
<0 · ... · .... <0 .... .... ~ ....
-So 1
:j ~ -t .... ~
l ~
'f o. :;0-~
J ~
.~.~ I fi .0 ...
hbl ~ 1:1 .0 e ~.~ it ~~ gj
~~ a ... ,,~
~]11) ~~l=:a "i!9~'" ~ 1 OJ jif':& a ~l; .. CQ
Illl~ '1> ~. 1ft ;a .~ 1.8 J ~ ili ~.O'! j'i" e ~ ~ -= ~~~ a ~~...,.~ 2! -=. .fj .. ~~Iilj~~ ~ ~~~ "'Ij<ll~~~ ~~~~~ ~ot§~~ :-~&~~ t'*~a + .... .... C'tM .... 1Q <01;-0000.0 .... Cl'1C!)""1Q <ot-oODO>O .... Cl'1CO'Oll1O IiCt-oOOCl>O "'C<lC!)'OII1O (ot-ODCI>O ce • ... ....."""' ............ ........ f'IIt .... ~ C<lC'tCilCilIl'l CilIl'IIl'ICilCO C!)COC!)CO~ ~co~~ .. '1: 0 II) 1:1
C7J

81
Table C-V
e~ r i ...... ~. "" • .., 00 . .... .~ ·10 . .,. .... ·fi "'" . .., .., ..... .~ '10
'" t-- .... t--
l~ir: as ~ . ....
o~ '" • 0) ""' .... . '" '" ..... .", ·10 .", III 0 ."", 00 ..... .., . .., ·00
L~ ..,
"'" "'" as Col' ....
~ r 1 ."", .t-- . .,. 0) .~
111] ~ 10
~"'~r;., ci
1O~11Il Col Col . '" .. III 00 '00
~ L~ 10 ~
ci
'" .... ,.... l CD t-- C<f .<Q lQ "'" '00
~] I] t..:' .... ..... ID '" ~ §.~ Il .... .lQ
<Q 00 .... .lQ 10 ... '" ~ L~ t..:'
r gj ... ·00 ·0 • t--.;::- 11 10 "'" • C't · ... .t--10 t-- t--
~ o ., I ID cQ
f~~ r;., ... .... t--.:: .... ~Igj ."", .", · .... '00
C 'OJ< '" • C<f · ... .... i
10 "" '" L~ cQ ... ~ r~ '10 I:;:)
~]11 ..,
• 10 e 10 10
:z; ..... 0 §' '" ~ r;., ~ .,~ I 81 . "", · .., ... . .., .t--
C<f ."",
d: t'5 L~ 10 'OJ< .... J;I;l 1:1 alp
.... ""'10 • "" 00
..... .", • Col . .... ~ ... • Col 0
• "" 10 .... 'IN ."",
10 ~ "" 00 10 0 ... ci
~ "'" ~ .. ~ · '" t--O ·0 .... • ........ 0) '" .<0 . ..,
o ~ ~ 0 ."", "'Col • IN .., · ..... • 00 :;:., 10 "" "" t-- 10 I l1.I l <:5 ~
Q "'" ~ fl · "'''''' ""..,t-- ... coco · "" .... • IN :~ .", ""If)
'" • 10 11)10 .... INO . ..,0 ·00 .t-- ... '" ='- Ii "" 00 .., ... IN .... co '" = ...
is i.a1r;., ~~ lj
.", .., ~t--oo .... "'t-- ."" "" .00 .t-- .~ ColIN
.t-- ... ",""'" ... ..,.., • ..,0 .t-- .t-- .~ .... ~ 00 IN ~ ...... "" 10
"" .... ....
]-[1 . .., ."" '00 t-- .~ · .., "" 00
Ii ri . .., .... · ... '0 co .t-- .", '011 "" '"
i 8 . . . . . .1:>0 , . .:; g ... s ..
! = :a Gl
~ ... ..= ~ .~ "Cf "" o 0
~ ~ i @_ ~5 .,
'''~j s_ ~ is·f[:a
j IS ..
~ ""' ........... "'" ~ I!!'" oo~~ ... .otl·" ~ J ~ li ~.~ .~~ ",·f! l- S <e :a·':.el~ la IJ~jl ~., ..
a~~~~ IS Il..~ .. § i"OO ~ ~ ~ ::tI~~ ~~o~~ 00 :-00 l1.I ll~~~ ~p
"iii. ~~~~~ ~~~~lii .... <>'1..,""10 "'t--ooo>o ~~;z~~ :g~~~~ "'<>'1 .;:: 0 1OlOlOlOlq 10101010'" t--t-o
II) = l1.I
6 (Cen.):C-6
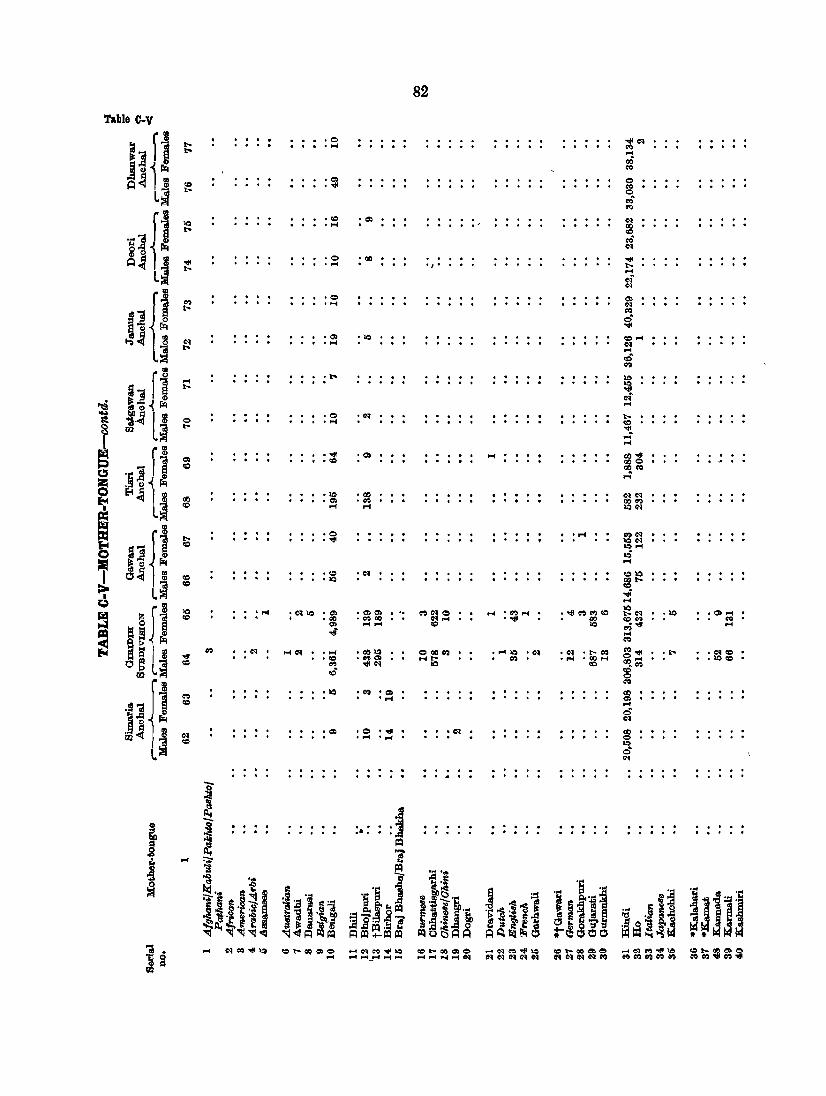
82
Table C-V
j][l I:-. .0
""'~ .r-! 0') I:-. ....
a) cd lZI 0')
A~lgj 00 .~ 0 ..... 0')
l~ ~ 0
c.; 0')
.~] fJ 10 ·00 :~ ~ • r-! .' 00 I:-. '" c.;
~oilZl ~
A~ l~ .... ·0 :00 "'" I:-. · .... ',' I:-. ... c:i ""
Il{l 0') .0 C!)
'r-! "" I:-. c-.I c:S "'"
~~ j ~ .~ '10 "'''"' .r-! ~ ....
'is c-.I
hiJ .... .1:-. 10 10 ~ "'"
~ c:i ...
J~ lj ·0 :~ I:-. t:e 0 • r-! '" , '" "<I!. ... ...
§ riB C!)
."", .~ .... 01)"'"
!]I] .", 000
00 O!lC't,l ... ~ °T ~ j .10 .01) ~~ ~ 00 .0> 'c-.I 000')
d: '" ""' ... 10""
~ {i I:-. ·0 · . .... C't,I"" ."", · . 10"" 00 lOr-!
0 ~~ r: lQ , .... ~~ ill 00
.", ."" "'10 '10 001:-.
~ L~ '" '" -i Q ... ~ ~Ii
10 ."" : ~ '0 .0> .(1)(1) . '. C't,I""O ... • c-.I ""' • "'" 0') 0') 00 I.e"" .10 .(1) ....
'" '00 • C't,I 00 ~ ... ."", ~ "'0') ..,
0> ...... c.;"'" ....
a !III;! <l) -i ... ...... lZI .., as l ill C't,I :"" ""~ ."" • 00 lQ O~C<:I • pof 10 ."" ."" • I:-. C<:I 0')"", .1:-. .c<I'"
"'" .", · ..,.,. c-.I ..... • 00 ... ~~ • 10 '"
~~ ~ '" .... .... "" "'10 '" 'is '" 0
pfi ..,
C<:I '10 'C<:I '(1) 00 · ..... (I)
'" ... 0
~~u "" ~
.(1) ·0 ."'" ."" 01) · ... .... 0 '" 10
0 ~ . . . . . . -0
i :j At -
~ ~ · . .. . 1 ~
0 At 'e .. ~
... =.-'! ~ :a ...
~ '3 ~
··'5 I ... .~ .~ '5 1 ,,~ ·~I = ~~ J ~<l .,~
~JlU :;O-l='~;' ~~'i ~i I ~ £!.~ J~fl~ [~ ... ~ ~J.ll~ l~~l! !~lEt !~Jtl ]2~~'e 'J: 1 1-~.d e ~ f ~
~~~.q ~lHQ~~~ ~ot:5Q~ Ql:I"4-~ :-&&60
10 ... c<I .... ""'1O "''''000>0 ..... ~c,o"'I!f('C ..:>t-OO<:l>O:> ...... ~C'O~\t) ..:>t-OO<:l>O:> """'e.1~"le ~~~~$ ... .... ~_ .... ,....f .... ....... ""pof~ """"""""~ ~~c<I""C't,I C't,IC')C')C')e')
!,IQR
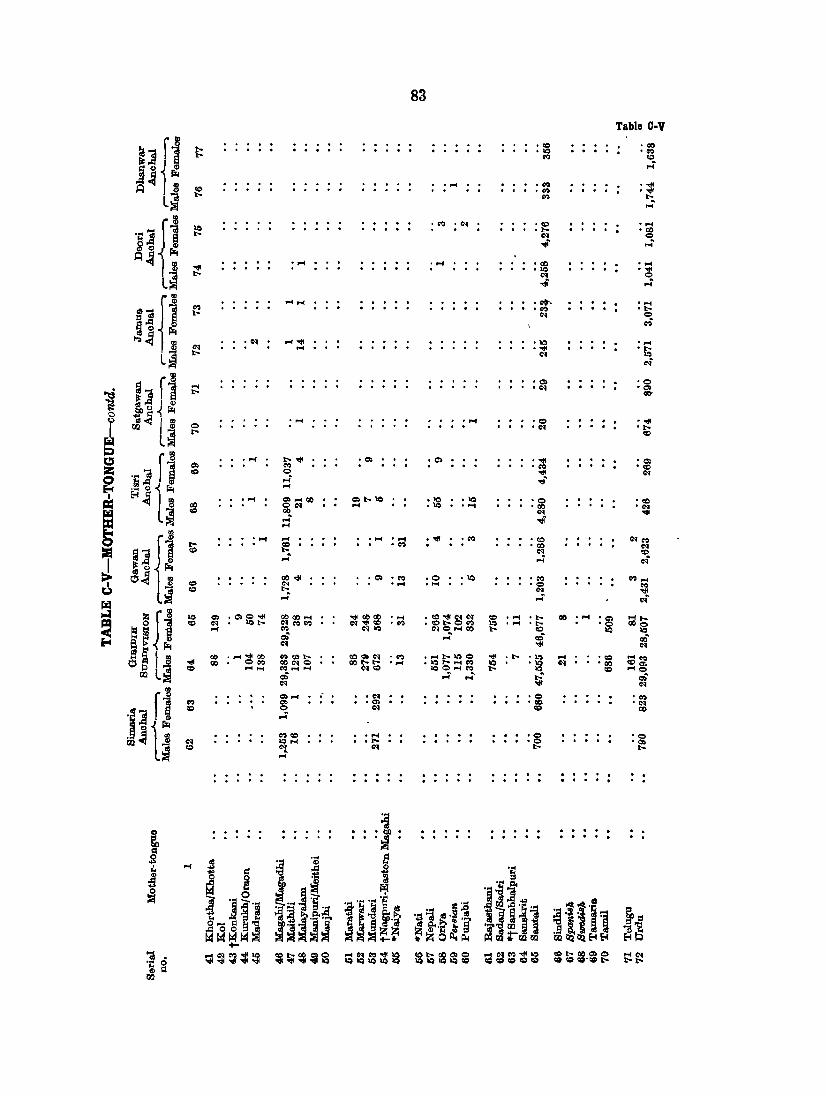
'0'1
....
....
. ...
.....
........
.... -:14 ...
. ...
J:-.-:14 .... o ,...j ..., ="'00 ~O'I ,...j .... .... ~ ...
0000 .... ~ ........ 0; 0'1
.,.t,C)t-. 00C10 ........... 0; c-t
=..., = o ,...j
.=
. ........ .....
'C1 .= c-t
..... • to
c-t
83
.=
. ...,
. -.... . .
.10 .10
.10 .....
.0 oIQ .....
. .. . . ., .
.t,C) ·10 ....
• •• 00 • • • 10
t,C) .... ~ . ...,
c-t .;
'10 ."",
c-t
.= .c-t
'-:14 . .., -:14 .;
'0 '00
c-t -:14'
'co '00
c-t ...
'0 • co <I>
'0 '0 .,_
.. . . 00 • ..., 'CI)
'0 10
.. ..
Table C·V
'-:14 ."", .,_
,...j
. ..., ·co ~ ...
. ..., '-:14 o
,...j
. .... . .,_ o cQ
..... 'J:-.
10 e-i
'0 .= CO'
. ." 'co
c-t
....J:.. GOg ~
S~ ""0
0; c-t . ..,
'C<l co
'0 '0. .,_
.. . .

84
Table C-V
I'" ,'lQ ~ ..... ·00> ¢OINIl> 'IN • "'" "" I:- co co .lQ '0>
~] \ i "" ...... • <C> 00 "" ...... ..., I:-
0> o:g ... <C lQ ."",
eN ..;
IS 0) 1 ~ "" j:Q~ ~ "" .C<! ... :~ • 0> lQ 000C<! ."", ."" ."" • co ¢r,) ... "" .1:- • lQ '
-= • co 0> .... 1:- . "" .... ........ lQ
L~ co ... "" lQ <C 0 ..; ...;
¢r,)
I~ .... .... • lQ · ... · .... ""
• CQ
11 0> • CQ ' .... lQ . ... ... -= ~]~~
~
~ll~ 0 '0> .<c '0> co • I:- co C> · ..... · ..... lQ • "'" co ..... 00
~
rSl C> ...... .....
~111 00 '00 <C
"" 00 ~
;l~~ "" .e I '" 00 · ... ·M ~ 00 ."",
z L~ "" "" ..; "" rl I:- '00 .<c :00 00
._] ~ i 00 '0 "" ..... I:-~
h li "" <C '0 .¢r,) '1:- 0 00 'lQ · ..... . 0>
~ ... lQ
0
S ¢r,)
~~Jj lQ . "", . .., , .... 1:-"'" '0 00 '¢r,) · .... c<I
I CQ
.,:
~ I::I~ ~ .... t!~ I gj "'"
."", .0> ......... cec<l c;, 00 • CQ lQ
:z; L~ lQ .,:
0 .... ~
l]J1 '00 ...... c<I , ¢r,)
e:I:: 00 · ..... · ... I:-
"" ~
..; ~O) I~ ."", .lQ 00"" ~~ '" 0
j:Q l~ &! · "" · "" IN , ... ..;
::> ~ ..... r i ... : .... ..... ."", .0> : .... . ... • I:'- 00 00 '11) ·eN '¢r,) ."" IN ,
"!. 0 u
'l~ ... ..;
~ 't:! 0) "'" @~ ~ "" 'c<I • IN • QI)
.... '0 'lQ It')
0 .lQ • lQ .... ."'" 0> 00 I:'- 0
-< ...j eO E-c "'"
~~ r i .... · ... · .... 0
~ 0> 0> ..;
~~ lj "" :<C co
~ 00 ... ...j
""
i .e
~ ~ J -~ .... ~ .., &:: 'e " Jl ;: ~
-0 ;;s
.~._ J ;a .~ ~ "" 'cO ....
~ 'f ~ 10'" S ._
.~ I i'~ 1 1lO< .... 1"~'''':~ ,,_'! • i:o! j ~~.; ~." to) ~ S2. ..... "':§ ~~ .. ~
~l~l~ ~ ...e. 0;
:a .§ l~ l g .~.£ ~ IO·~ 1 _o..o..o ·s '$.~ tt ~~jlJ ~!~El i~~~~ ~.O' ~.d'0S' ~~l~~ f~&g~ .d :::!.!:l .... ~Olos~ ~ ~"o:l"o:l ~"'l~ ~ j:Q~~~j:Q ~o~A~ ~'""~ ~'-j'ill:l
+-..... . ... ""M""-I$ eo.t-ooo>s .... """''''''lQ eot-oo 0>0 .... """''''''>0 eot-I1:IO> 0 .... """''''''>0 co 1:'-00 0>0 011 • .~ ~
........ .... JIIIif ......... ... "" ....... CN CNCNta"""" ""c<lN""", CQCQ""""CQ ¢r,)""""C':I"'"
11.)

85
Table 0·11 r~ ."'~~ <:C> .... oo CO)CC • 00 .... ·c .... . .... ·00 .... ..... ·00 ~~ 0";)] CO) • 'OIl t;.- t;.- .... ~ C'l1Q~ .... <:C> ·c ~ ..... .1:'- ·c =0 ~ .... c <:C> 0:> 10 ...
~.g ~ ..; ..; ci
trl~f~ '" ........ 00 CO)=O'" "''011 CO) • oo'e-l '10 <'1 .", · .... I:'- .'011 1000 C'l O:>~ CO)C'l 1Q1Q:g .1:'- .... . ~ ~ .<:C> .~ .... = L~ '" .... ... ~q 0 I:'- ... ~ ... ..; .... . ....
ffj 00 • 'OJ< .'011 • If.) .0 .... ... 'C'I · .... · .... .....
'" If.) ... <Q
~ ~ ID CJ) 8 r:..a .= ~ I ~ .... O)t;.- ....C'I · .... ..... .C 0 'OIl .... .... .1:'- .~
L~ = IQ 'OIl CJ)
~1 f i = ..... .00 .1:'-= <'1 .0 .C'l 00 ..... = 00 ..;
It 0 ~ r:..a
Z~ I ~ 00 'OIl • CO) .t;.- .... .t;.-00 00 • t;.- • <:C>
L~ 00 00 00 ..;
'"
'~~JJ ..... • CO) .C'l .00 t;.- · ... .~ 00 .....
~ ..; ..; <;>
5 A~I~ ......... ..... ... ..... C'I ..... • CO) .0 .'011
'" . .... ..... · ... .0 r L~ 00 'OIl 0 ..; ....
~ ~1 rj 'C'I 'OIl .... .'011 · .... . , . .10 10 t;.- · .... .", ~ 00 ~ ... ~
as ci iol~ o~ ~ . t- ... 10 . .... . .... . ..... .1:'- . = Ej4 'OJ< 'C'l '" .1:'- .'011
L~ 00 ~ "'" ~ as <'1.
~ ]1 f1 c .... • 1:'- . .... ..... • CO) . ...
fo4 .... ... ... .'" ''011 00 <0 0 = 0 lIS lIS
~ ~ 0 I r:..a ....
t>~ ~ "'<0 .... ..... "'C'I · ... .... <'1 000-( • <'1 ''0 > trl Lj 00 00 I:'- .... 0
"",. 'OIl. ..; .....
~ ~lJj .... .C'I .... .... "'C'I .... C'l • 'OIl C C 00 lQ • CO) l:-o . .... t;.-C'l 00 ... '" .~ .... CC'l ~ .00 .... 00 .... .... .... C'I <0 • 'OIl
"' ..; CJ)
~ b~ l~ '1:'-= <'11:'- .... '010 .... ·C'lCC'lt;.- ~ .1:'- CO) 'C'I "'=0 0 ........ 00 • 0) t:O ..... 1:0 ... .1:'- .... 'OIIlQ 00 ... ... .... C'I t;.- o .... ..; Q
'gl rl ....
:'011 'C'l · .... '<0 = .10 .t;.-£-0 ... .... .... • 0 ~ Il1
trl~ li :10 .10 .1:'-00 .0) ·0 I:'- C>1 '"
·
! i S :~ .... =a
~ o! :.a 'QI s ~ ~ ~ CIl ....
't:! ... i l:l ~ " ~!
<t! ...
l ~ .... Co
~ .... ~]
l f'~ i~ ~ [:a ......... §
~-t ~;o J o! ~ ~ ..o:.! ;S;;J&>£ ... re.t·;:: ....
&'::1 .... "; o!.! o! ~ >=I ~1 ~.:2~ 11 0_ 0 ~ I~j~j ~j§~~ ~ p;, ._
';;'~ III a a ~~~~~ ~ g..;:: t § ~!~~~ i~ ::.I +-* *:z;o~~ ll:j I'll t'1ll1ll ~p
"; ~~~;~ <Ot;.-oo=oo "'C'I"''OIIIQ <Qt;.-ooo>o ... C'l'" '01110 .0£-000"'0 .... C'I .... 0 'II!.'OII 'OIl '011'0 IQIQIQIQIQ lQlQIQlQ<C> .0 "'(Il>",,,, .0 <Q .0 .0£-0 t;.-£-o a; ~ rI.l

86
Table C-\1I1 TABLE C-VII-
NAMJIIS 0:1' RlDLIGION'S A.B1UN'(tDlD Total
DistriotlSubdivision/Anohal Rural Total r lJ'rban Buddhists Christians Hindus
r .A. r-----'---. r_..A..-, r--.A.
Persons :Males Females Males Females Males Females Males Females
1 2 3 4 I) 6 7 8 9 10 11
HAZARI:BAGH T 2.898,411 1,208,508 1,192,908 '11 21'1 4,241 3,578 1,058,'153 1.040.209 R 2,195,227 1,092,878 1,102,549 29 2 2,499 2,845 966,985 968.897 U 201,184 110,825 90,359 42 215 1,742 1,233 89,768 '11,812
Sadar SubcUvJ8t on T 1,217,107 817,355 599,752 28 177 2,828 2,409 516,885 529,988 R 1,125,519 586,296 559,223 24 1.594 1,608 505,185 498,411 U 91,588 51,059 40,529 2 177 1,032 801 41,'180 81,577
Barhi R 53,078 26,105 26,973 19 4 23,261 23,917
Barka.tha. R 46,620 21,575 25,045 5 4 24 18,540 22,051
Bagodar T 88,213 42,920 45,293 78 7 13 37,512 39,239 R 79,401 38,301 41,100 18 33,196 85,852 lJ' 8,812 4,619 4,193 78 7 4,316 3,887
Bishungarh R 54,668 .26,682 27,986 1 23,520 24,617
Hazaribagh T 85,6.21 44,781 40,840 99 1,037 970 35,797 30,722 R 44,663 22,423 .22,.240 456 390 19,316 18,689 lJ' 40,958 .22,358 18,600 99 581 li80 16,481 12,033
Xatkamsandi R 51,171 24,887 26,.284 187 342 19,829 20,421
" Iohak R 47,108 2.2,623 24,485 1 .21,404 23,532
Bark.a.gaon R 40,569 20,193 20,376 68 1.26 18,037 18,021
Keredari R 34,185 17,326 16,859 191 211 15,525 15,246
Tandwa 'R 31,802 15,718 16,084 11 14,680 15,078
Mandu _R 60,374 32,498 27,876 4 116 25 29,237 25,283
Magri (Churohu) R 38,737 20,338 lS,399 38 115 IS,643 16,965
Ramgarh T 88,1S0 46,858 41,322 .2 468 218 40,378 86,014 B 6S,139 34,625 33,514 55 .23 29,694 28,865 lJ' 20,041 12,233 7,S08 2 413 190 10,684 7,149
Jainagar R 44,290 20,818 23,472 1 17,7S7 19,808
(lola R 57,219 28,717 28,502 13 20 26,546 26,612
Gumia R 70,730 36,416 34,314 5 99 89 32,930 30,826
Peterbar R 45,379 23,164 22,215 6 10 22,097 20,987
• Ka.smar R 33,818 17,433 16,385 .2 5 16,116 15,163
Jaridili R 53,307 27,360 25,942 10 l) 25 • .242 23,893
Kodarma. T 90,814 48,118 42,696 88 82 42,894 37,943 R 69,037 36,269 32,768 57 51 32,645 29,435 tT 21,777 11,849 9,928 31 31 10,249 8,508
Karkaoho R 41,736 19,265 22,471 1 16,682 19,339

81 RELIGION Table O·VII
IN Ar.PHABE:J:IOAL OBjDEB
Other religions and :Religion not Total
Jains Muslims Sikhs persua.sions stated Rura.1 District/Subdi'Vision/Anchal c--.A._-, r---"----. r~ r____..A..----"\ r-.A.____,. Urban
Ma.les Fema.les Ma.Ies Females Males Females Matas Females Males Females
12 13 U 15 16 17 1& 19 2() 21 2 1
1,504 1,944 187,016 145,899 2,720 1,884 1,194 421 4. 6 T HAZARIBAGH 464 484 180,131 129,712 1,332 682 1,194 421 4 6 R
:1,050 760 16,885 :16,187 1,388 ' 652 U
720 547' 64,641 65,669 1,643 819 88a 138 2 5 T Sadar SubdlvlsJon 95 77 57,733 58,458 881 526 832 138 a 5 R
825 470 6,908 7,211 782 293 U
2,818 3,052 5 .2 R Barhi
2,271 2,970 2 7.53 B 'Bar&a'li'aa
52 43 5,274 6,920 72 3 T Bagodar 5,102 5,735 3 R
62 43 172 185 72 U
3,169 3,369 2 R Bishungarh
270 147 7,466 8,902 211 T Hazaribagh 2,624 3,161 27 R
27() 147 4,842 5,741 184 .. U
4,824: 5,424 47 97 R Xatkamsandi
1,219 952 ... R Icha.k
2,088 2,229 R Barkagaon
1,474 1,347 136 55 Eo Xeredari
1,038 995 - - R Tandwa
4 2 3,099 2,531 38 35 Eo Mandu
2 7 1,492 1,222 163 90 - R Na.gri (Ohurohu)
58 31 5,587 4,852 336 171 29 41 - - T Ramgarh '13 5 4,817 4,564 17 16 29 41 R 45 26 770 288 319 155 '0'
3,021 3,654 9 10 B Jainagar
2,158 1.868 2 Eo Gala
29 35 3,260 3,296 93 68 R Gumia
31 21 1,()23 1,183 1 8 - Eo Peterbar
1,315 1,217 - R Iftasmar
2,113 2,044 - - - - - R Jaridih
260 255 4,661 4,241 215 175 T Xodarma .2 1 3,537 3,244 28 37 ... 'R 258 254 1,124 997, 181 138 - U
2,5&2 3,132 - - - - R Markacho

8S
Table C-VII TABLE C-VII-
NAMES Oll' RELIGIONS ARRANGED Total
DistrictjSubdi vision! Anchal Rural Total r- ..A..
Urban Buddhists Christians Hindus r- .A. """\ r---..A.._"""\ r---.A._-"""\ r----..A..-"""\
Persons Males Females Males Females Males Females Males Females
1 2 3 4 6 6 7 8 9 10 11
Patratu R 69,488 33,555 25,933 10 270 143 30,208 24,31i
Chatra Subdivision T 321,065 158,116 162,949 305 153 143,540 146,106 R 308,558 151,728 156,830 2111 148 189,128 142,076 U 12,507 6,888 6,11' 74 5 4,417 4,080
Chauparan R 64:,375 31,004 33,371 3 1 27,740 29,722
Itkhori R 61,423 29,486 31,937 15 28,100 29,432
Hunterganj R 51,520 25,692 25,828 1 23,716 23,598
PratapPur R 40,053 20,291 19,762 17,825 17,187
Chatra T 57,001 28,070 28,931 168 90 24,529 24,854 R 44,494 21,682 22,812 94 85 20,112 20,824 U 12,507 6,388 6,119 74 5 4,417 4,030
Simaria R 46,693 23,573 23,120 133 47 211,630 21,313
Girldih Subdivision T 858,239 428,039 430,207 :45 40 1,310 1,016 366,848 864,115 R '761,150 374,654 886,496 5 2 674 589 322,727 32,810 U 97,089 63,878 43,711 40 ~8 636 427 48,621 85,705
Gawan R 41,653 20,22~ 21,428 13 17,261 18,271
Tisri R 35,822 17,79~ 18,q29 ... 142 88 15,957 16,253
Satgawan R 25,562 12,18! < 13,381 1 2 5 11,120 11,983
Jamua R 82,629 38,984 ,"
43,645 < ~ • 33,154 36,669
Deori R 56,562 27,493 29,069 18 19 25,179 26,750
Dhanwar R 75,297 36,157, 40,1~0 28,720 31,420
Birni R 48,925 22,399 26,526 1 18,718 21,795
Giridih T 124,194 63,860 60,334 8 15 262 232 51,136 47,493 R 87,313 44,253 43,060 2 111 109 36,760 35,183 U 36,881 19,6.7 17,274 8 13 141 123 14,376 ,12,310
Bengabad R 48,921 23,964 24,957 93 128 20,612 21,461
Ganda R 56,684 28,726 27,958 71 57 22,821 22,104
Dumri R 71,621 36,227 35,S\)4 4 31,586 29,403
Nawadih R 62,369 31,360 31,009 27,872 27,454
Pirtanr R 41,307 20,751! 20,5»1 ...... 149 135 19,233 18,921
Bermo T 86,693 48,907 37,'Z:~6 32 25 1569 352 42,979 34,138 R 26,485 15,~3l? ll,=i~ 74 48 13,734 10,743 U '~O,20S 33,771 26,~.7 32 25 495 304 29,245 23,395

89
llELIGION-concld. Table C-Vll
IN ALPHABETIOAL ORDER , Other religiorul .. and Religion not Total
Jains Muslims Sikhs persuasions stated Rural District/Subdivision/Anchal c-___.A.-, r-A-.-.. r--"--.. r-...... ~ .. r-.A..--"""\ Urba.n
;Males Females Males Females ;Males Females Males Females Males Females
12 13 14 15 16 17 18 19 20 21 2 1
14 2,()l.il.i 1,269 3540 205 5 R Patratll
54 59 14,113 16,560 103 70 1 1 T Chatra Subdivision 38 39 12,254 14,511 86 55 1 1 R 21 20 1,869 2,049 17 15 .*. U
29 30 3,222 3,610 10 8 It Cha.upal'Qll
9 1,386 2,481 R Itkhori
1,908 2,183 67 47 R Hunterganj
2,466 2,575 R Pratap Pur
25 20 3,321 3,952 26 15 1 T ChaMa 4 1,462 1,903 9 I R
21 20 1,859 2,049 17 15 U
1,810 1,759 1 R Simaria
730 688 58,262 63,670 974 445 862 283 1 T Glrldih Subdivision 826 368 50,194 56,743 365 101 362 283 1 R 404 270 8,068 6,927 609 344 U
1 2,948 3,157 2 It Gawan
2 1,692 1,688 R Tisri
1,050 1,382 8 11 R Satgawan
5,830 6,976 R Jamua
2,296 2,300 R Deori
6,437 8,720 R Dhanwar
3,680 4,731 R BiJ'ni
198 75 11,718 12,195 248 101 300 223 T Q-iridih 7,068 7,526 14 17 300 223 It
198 75 4,650 4,669 234 84 U
3,227 8,368 32 It Benga.ba.d
5,817 5,7409 17 48 R G~de
67 65 4,568 5,924 2 1 1 R Dumri
3,488 3,555 It Nawa.dih
249 301 1,124 1,194 1 R Firtanr
213 197 4,387 2,731 721 343 5 1 T Bermo 7 2 969 473 346 83 & 1 R
206 195 3,418 2,258 375 260 U

Table C·VIlI Pa.rt A
Districtl Anchal
1
HAZARIBAGH
Barbi Barkatha Bagodar Bishungarh Razaribagh
Katkamsandi Ichak Barkagaon Keredari Tandwa
Mandu
Total Rural Urban
2
T R U
R R R R R
R R R R R
R Nagri (Churchu) R Ramgarh R Jainagar R Gola R
Gumia R Peterbar R Kaamar R Jaridih R Ko4~r;ma R
Markacho R Patratu R Chauparan R Itkhori R Hunterganj R
PratapPur R Chatra R Simaria R Gawan R Tisri R
Satgawan R Jamua R Deori R Dhanwar R Birni R
Giridih R Bengabad R Gande R Dumri R Nawadih R
Pirtanr R Bermo R
90
TABLE O·VIU PART A--cLASSIFICATION BY LITERAOY AND INDUSTRIAL
Total
r--__.A. ...... Persons Males Females
3 4 5
296,887 144,151 152,236 276,358 133,885 142,973 00,029 10,766 9,2.63
5,607 2,735 2,872 5,615 2,371 3,244 8,627 3,883 4,744 5,564 2,743 2,821 2,642 1,266 1,376
5,959 ';851 3,108 5,226 2,427 2,799 4,417 2,129 2,288 5,654 2,956 2,698 5,586 2,708 2,878
5,118 2,730 2,388 2,624 1,349 1,275 4,813 2,271 2,542 5,876 2,602 3,274 4,606 2,526 2,080
7,972 3,949 4,023 4,876 2,592 2,284 3,599 1,830 1,769 5,037 2,552 2,485 9,728 4,941 4,787
5,252 2,312 2,940 5,041 2,564 2,477 7,275 3,521 3,754 4,504 2,162 2,342 7,488 3,705 3,783
8,117 4,118 3,999 7,227 3,479 3,748
12,018 6,000 6,018 6,443 3,130 3,313 5,550 2,725 2,825
5,444 2,662 2,782 13,207 5,859 7,348
8,816 4,013 4,803 11,033 4,969 6,064 .7,329 3,067 4,262
18,751 9,225 9,526 6,972 3,272 3,700 5,315 2,683 2,632 7,627 3,717 3,910 6,667 3,249 3,418
3,446 1,680 1,766 3,690 1,862 1,828
Illiterate
WORKERS
r----------------~----------------~ I
Literate and Total workers As Cultivator educated (I to IX) persons
II As Agricultural
labourer
r--~---"\ r-~---"'" r---A-..... r--..A..---..... r---A-"",\ Males Females Males Females Males Females Males Females Males Females
6 7 8 9 10 11 12 13 14 15-
128,887 151,894 15,764 842 81,845 68,287 87,'1107 89,092 14,000 16,409 119,778 142,361 18,607 612 76,781 66,648 87,881 88,818 18,988 18,869
8,609 9,083 2,167 280 6,114 2,889 826 2'19 67 50
2,378 2,860 357 12 1,546 1,416 822 1,002 262 281 2,030 3,240 341 4 1,153 1,695 724 1,231 204 346 3,499 4,738 384 6 1,938 2,397 1,079 1,572 439 626 2,547 2,817 196 4 1,525 1,546 777 905 412 487 1,037 1,373 229 3 582 605 219 301 193 247
2,538 3,098 313 10 1,487 1,596 873 1,034 189 283 2,179 2,799 248 1,217 1,021 665 405 324 442 1,962 2,279 167 9 1,173 920 667 388 252 392 2,755 2,685 201 13 1,797 1,468 1,210 1,030 188 201 2,538 2,873 170 5 1,683 1,372 1,011 835 380 427
2,498 2,376 232 12 1,631 1,022 536 491 127 117 1,227 1,275 122 773 538 422 320 68 102 1,999 2,312 272 230 1,379 728 527 517 180 133 2,278 3,267 324 7 1,438 1,563 981 1,244 144 289 2,324 2,071 202 9 1,600 620 729 361 141 122
3,533 4,006 416 17 2,262 1,368 733 694 183 324 2,352 2,276 240 8 1,604 I,OO~ 987 750 248 175 1,577 1,759 253 10 1,113 887 675 543 316 213 2,235 2,47,8 317 7 1,308 617 841 381 240 134 4,226 4,752 715 35 2,927 1,863 724 730 247 378
2,050 2,937 262 3 1,275 1,663 719 1,234 105 234 1,508 2,460 1,056 17 1,681 730 585 376 6 51 3,113 3,745 408 9 1,922 1,542 1,324 1,045 296 327 1,985 2,336 177 6 1,153 1,117 761 642 239 388 3,426 3,773 279 10 2,153 1,088 1,282 409 380 460
3,919 3,996 199 3 2,560 1,669 1,498 885 533 547 3,355 3,742 124 6 2,089 1,787 1,269 960 472 676 5,736 6,010 264 8 3,673 2,979 2,380 1,884 864 912 2,969 3,308 161 5 1,808 1,735 501 660 483 672 2,412 2,818 313 7 1,658 1,397 636 730 130 165
2,478 2,780 184 2 1,578 1,684 485 512 865 911 5,202 7,334 657 14 3,074 4,341 1,817 2,775 694 818 3,636 4,797 377 6 2,250 2,966 1,312 1,711 779 794 4,515 6,051 454 13 2,323 2,683 1,346 1,658 741 868 2,67l 4,256 396 6 1,476 2,379 877 1,734 314 , 573
8,016 9,483 1,209 43 5,073 2,431 652 760 488 414 2,935 3,685 337 15 1,913 2,278 1,080 1,589 252 273 2,497 2,625 186 7 1,722 1,382 894 760 456 452 3,402 3,892 315 18 2,118 2,126 1,023 1,221 602 650 3,019 3,416 230 2 1,888 1,873 996 1,494 253 272
1,553 1,755 127 11 983 847 590 623 203 162 1,669 1,828 193 1,225 806 252 417 n 21

91
Table c-VIII Part A CAn:GORY OF WORKERS AND NON .. WORKERS AMONG SOHEDULED CASTES
WORltEllS A ~
III IV V VI VII VIII IX X. In Mining, Quarry. At lIousehold !rn Manufactur. In Construe. In Trade and In Transport, In Other Non.workers
ing, Livestock, Industry ing other than tion Commerce Storage and Services Forestry, FIshing, Household Communications lIunting and Plan· tations, Orchards
Industry
and Allied activities
C---"--""'l c--A-""'l r-A--""'l c--A_" .---A_--" .---A-""'l .--_A-""'l .-_A_""'l
Males Females Males Females Males Females Males Females Males Females Males Females Males Females Males Females
16 17 18 19 20 21 22 23 24 25 26 27 28 29 30 . 31
12,087 a,822 5,314. 4,839 8,888 1,507 874 49 168 126 865 102 6,997 8,841 62,,806 88,949 9,812 1,914 5,094 4,755 2,922 1,107 684 40 118 84 47.9 71 5,808 2,605 57,654 77,826 2,226 908 220 84 961 400 190 9 50 42 886 81 1,689 836 4,652 6,624
53 16 114 31 27 119 5 4 4 145 77 1,189 1,456 25 2 105 69 5 2 1 4 83 47 1,218 1,549 62 12 129 89 10 1 12 206 98 1,945 2,347 34 4 184 120 4 6 8 2 104 24 1,218 1,275 4 1 21 13 13 4 21 1 1 14 96 38 684 771
45 10 139 193 41 12 17 4 2 24 165 62 1,364 1,612 6 132 146 6 4 6 76 28 1,2lO 1,778
37 11 156 86 2 16 12 2 1 45 26 956 1,368 142 83 110 106 11 13 1 8 2 115 95 1,159 1,230 130 15 83 56 4 8 5 6 62 34 1,025 1,506
600 238 164 86 38 6 12 11 5 143 79 1,099 1,366 162 34 69 67 11 1 1 6 4 34 10 576 '137 323 3 147 9 23 19 16 6 6 3 138 57 892 1,814 53 2 29 12 87 3 23 1 8 112 13 1,164 1,711 55 16 401 25 4 2 24 9 66 1 171 93 926 1,460
692 157 305 137 99 10 9 16 226 46 1,687 2,665 157 14 65 22 8 6 2 7 126 40 988 1,281 30 111 80 118 10 1 4 .38 51 717 882 74 7 38 13 21 1 3 1 2 1 6 8 84 71 1,244 1,868
1,097 226 149 230 447 187 69 4 7 3 32 8 165 97 2,014 2,924
107 145 138 65 16 3 3 2 138 39 1,037 1,277 744 150 57 55 66 13 13 5 8 1 43 5 159 74 883 1,747
32 13 157 124 17 16 3 3 4 73 30 1,599 2,212 27 5 70 33 17 7 2 2 30 47 1,009 1,225
109 21 184 124 36 , 5 6 4 4 6 146 65 1,552 2,695
181 38 189 118 26 10 3 7 113 81 1,558 2,330 60 1 104 89 23 9 4 1 1 155 52 1,390 1,961
128 14 206 149 2 7 2 84 20 2,327 3,039 349 40 196 157 29 47 4 6 6 2 ,. 239 154 1,322 1,578 159 4 340 414 292 62 1 1 101 20 1,067 1,428
16 13 135 68 2 11 37 4 60 43 1,084 1,198 146 25 69 632 49 24 .2 4 4 299 67 2,785 3,007
.22 77 452 .21 "
39 9 1,763 1,837 39 1 _ 82 93 7 8 3 2 3 100 55 2,646 3,381 85 6 61 47 1 11 .2 3 133 8 1,591 1,883
.2,411 456 62 36 1,102 596 40 19 6 8 61 6 271 136 4,152 7,095 143 11 58 288 226 65 9 3 12 130 52 1,359 1,4.22 190 10 11 69 19 2 5 5 10 132 89 961 1,250 153 16 23 28 12 45 2 30 230 .209 1,599 1,784 238 19 223 50 6 15 2 37 1 120 35 1,361 1,545
84 2 .6 1 .2 3 5 92 57 697 919 608 268 8 ". 37 112 4 22 .23 141 77 637 1,022

Table c-VIII Part B
Districtl Ancbal
1
HAZARIBAGH
Barbi Barkatha Bagodar Bishungarh Hllzaribagh
Katkamsandi Ichak Barkagaon Keredari Tandwa
Mandu N agri (Churchu 1 Ramgarh Jainagar Gola
Gumia Peterbar Kasmar Jaridih Kodarma
Markacho Patratu Chauparan Itkhori Huntergani
PratapPur Chatra Simaria Gawan Tisri
Satgawan Jamua. Deofl Dhanwar Birni
Giridih Benga.bad Gande Dumri Nawadih
Pirtanr Bermo
Total Rural Urban
2
T R U
R R R R R
R R R R R
R R R R R
R R R R R
R R R R R
R R R R R
R R R R R
R R R R R
R R
92
TABLE c-vm PART B--(}LASSIFIGATION BY LITERACY AND INDUSTRIAL
Total Illiterate
WORKERS
r----------A-----------, I II
Literate and Total workers As Cultivator educated (I to IX) persons
As Agricultural labourer
r----·.A.--.........." r___""-.........." r--_.A._-, r--.A.--, r-__.A-.........." r--.A.--, Females Males Females Persons Males Fomales Males Females Males Females Males Females Males
3 4 5 6 7 8 9 10 11 12 13 14 ' 15
270,693 137,295 133,398 12,7 3~ L
50,046 6,:397 6,264 132~89 9,975 1,109 85,993 64,661 61,266 264,637 134,133 130,504 124,903 1a9,680 9,230 824 84,197 63,539 61,024 49,816 6,289 6,261
6;056 3,162 ~894 2,417 2,609 745 285 1,796 1,122 262 230 8 3
1,135 573 562 545 556 28 6 353 331 306 298 6 5 2,920 1,400 1,520 1,360 1,511 40 9 902 897 754 748 93 127 1,955 981 974 934 972 47 2 612 483 491 411 35 27 5,891 2,923 2,968 2,859 2,965 64 3 1,825 1,691 1,203 1,267 377 334
1,039 631 408 449 325 182 83 267 192 UO 94 22 20
2,536 1,270 1,266 1,083 1,233 187 33 803 738 693 697 24 12 947 {i72 375 {i66 375 6 373 205 342 99 31 106
4,208 2,215 1,993 2,097 1,971 118 22 1,317 777 979 659 45 56
1,789 955 834 895 824 60 10 626 511 492 460 5 11
4,473 2,273 2,200 2,151 2,187 122 13 1,346 9'79 1,140 763 70 151
14,459 7,520 6,939 7,123 6,905 397 34 4,570 3,748 1,872 2,135 179 248 12,609 6,128 6,481 5,781 6,388 347 93 3,886 3,098 2,644 2,168 286 465
10,395 5,119 5,276 4,678 5,188 441 88 2,974 2,140 2,458 1,780 208 216
18,057 9,094 8,963 8,202 8,886 892 77 5,980 3,458 4,468 2,446 471 661
17,166 8,488 8,678 7,900 8,639 588 39 5,717 4,544 3,789 3,138 702 932
14,247 7,860 6,387 7,382 6.366 478 21 4,964 ,'l,003 4,285 2,691 292 243 6,466 3.263 3,203 2,854 3,184, 409 19 '\,995 ~1,841 1,573 1,653 225 14\
20,760 10,588 10,172 9,671 10,151 917 21 6,817 3,095 5,315 2,250 382 297
677 465 212 432 200 33 12 396 130 68 21 14 54
781 398 383 376 383 22 245 213 144 185 6 6
17,163 8,868 8,295 8,326 8,268 542 27 5,537 2,603 3,575 1,989 201 118
2 2 1 1 2 1
87 43 44 40 44 3 18 15 18 14 1
96 44 52 42 52 2 37 15 13 14 13
831 449 382 443 380 6 2 256 169 89 51 73 67
640 281 259 260 258 21 1 174 III 99 77 12 26
3,334 1,708 1,626 1,537 1,601. 171 25 1,066 871 806 681 147 127
2,728 1,314 1,414 1,291 1,411 23 3 852 869 621 769 49 63
9,377 4,577 4,800 4,342 4,779 235 21 3,070 2,937 2,110 2,074 254 229
61 29 32 25 31 4 1 18 19 3 7 2 1
665 342 323 307 322 35 1 227 180 182 171 17 9
8,646 4,209 4,437 3,725 4,412 484 25 2,588 2,780 2,312 2,313 103 112
651 362 289 346 288 16 1 169 41 119 32 26 727 330 397 307 397 23 163 238 147 203 10 35
9,083 4,656 4,427 4,367 4,396 299 32 2,830 1,750 1,592 1,286 273 253
9,929 4,720 5,209 4,239. 5,190 481 19 2,857 3,265 2,434 2,837 92 101
16,780 8,554 8,226 7,918 8,186 636 40 5,372 4,494 3,865 3,545 496 450
8,884 4,549 4,336 4,379 4,324 170 11 2,811 2,384 2,299 2,303 296 8,588 4,249 4,339 4,133 4,338 116 1 2,760 2,567 1,977 2,415 123 103
19,836 lQ,021 9,814 9,536 9~787 485 27 6,133 5,288 5,146 4,669 606 420
4,120 2,112 2,008 2,012 2,007 100 1 1,301 867 492 417 22 21

93
Table C-VIII Part B CATEGORY OF WORKERS AND NON-WORKERS AMONG SOHEDULED TRIBES
WORXERS
r .A. -. III IV V VI VII VIII IX X
In Mining, Quarry- At Household In Manufactur- In Construe- In Trade and In Transport, In Other Non-workers ing, Livestock, Industry ing other than tion Commerce Storage and Services
Forestry, Fishing, Household Communications Hunting and Plan. Industry tat ions, Orchards
and Allied activities
r--.A.---. r--.A.---. r--.A.---. r-...... ----. r-...A.---. r--.A.---. r--.A.---. r---...... --. Males Females Males Females Males Females Males Females Males Females Males Females Males Females Males Females
16 17 18 19 20 21 22 23 24 25 26 27 28 29 30 31
10,323 3,514 3,067 2,607 666 367 480 1~7 32 50 360 121 8,482 1,565 51,302 68,787 9,640 2,990 8,052 2,575 57'0 820 454 127 82 45 288 118 2,848 1,2.87 49,936 66,965
688 524 15 32 96 47 26 5 72 3 634 278 1,366 1,772
14 4 23 22 4 2 220- 231 24 2 15 13 1 14 7 498 623 25 6 31 28 1 29 11 369 491
103 24 102 50 2 7 4 8 26 9 1,098 1,277 21 3 9 56 5 2 4 2 101 10 364 216
56 13 11 8 19 8 467 528 199 170
116 5 84 34 4 17 1 88 6 898 1,21g 78 9 13 7 1 4 2 3 2 31 19 329 323 87 31 21 14 1 7 3 1 19 11 927 1,221
2,036 1,196 217 51 35 22 29 18 35 7 167 71 2,950 3,191 548 304 239 70 15 15 1 9 15 130 75 2,242 3,383
25 120 15 39 11 7 2 11 25 106 91 2,145 3,136
337 '82 306 115 42 7 75 6 3 21 10 1 268 119 3,114 5,505
525 199 375 140 4) f'2 2 4 3 24 21 251 95 2,771 4,134 158 _ 13 110 14 2 13 2 4 102 38 2,896 3,384 38 4 103 -- 38 10 3 43 2 1,268 1,362
653 93 161 143 19 3 45 17 2 9 8 231 284 3,771 7,077 299 3 45 12 10 69 82
40 2 33 20 22 153 170 1,190 323 104 27 155 15 91 44 7 20 69 9 145 58 3,331 5,692
1 25 29
3 1 2 1 5 7 37
37 11 14 13 3 40 37 193 213 5 3 55 8 107 148
68 34 10 18 23 8 13 3 642 755 176 7 3 26 1 1 4 462 545 282 39 277 527 95 49 52 19 1,507 1,863
9 II • 4 11 13 4 8 16 115 143
25 5 106 348 6 1 35 2 1,621 1,657 21 1 1 6 1 1 2 193 248
6 167 159
805 86 49 31 38 42 10 4 1 2 62 46 1,826 2,677 104 31 119 215 7 50 6 7 88 31 1,863 1,944 654 121 107 362 9 2 5 3 9 224 14 3,182 3,732 99 16 52 30 2 1 3 1 61 32 1,738 1,951
366 104 44 6 15 2 37 120 5 1,499 1,772
92 21 121 67 2 1 166 110 3,888 4,526 536 268 2 26 48 91 9 1 32 53 99 51 811 1,141

EXPLANATORY NOTE
Special tables for the Scheduled Castes and Scheduled Tribes, separately for each caste or tribe are an innovation of the 1961 Census. The tables in this series are the following :
seT·I Part A-Industrial classification of persons at work and nonworkers by sex for &hednIed Castes.
sar-! Part B-Industrial classifioation of persons at work and nonworkers by sex for Scheduled Tribes.
SCT·II Part A-Age and marital status for Soheduled Castes.
SOT·II Part B-Age and marital sta.tus for Soheduled Tribes.
SOT-III Part A {i)-Eduoation in urban areas only for Soheduled Castes.
8ar-III Part A(ii)-Education in urban a.reas only for Scheduled Tribes.
SOT-ITr "Part B(i)-Education in only for Casoos.
rural areas Soheduled
SeT-TIl Part B(ii)-Education in rural areas only for Soheduled Tribes.
SCT-IV Part A-Religion for Scheduled Castes.
SOT-IV Pa.rt B-Religion for Soheduled Tribes.
SCT-V Part A-Sample households engaged in cultivation classified by interest in land and size of land oultivated in rural areas only' for members of Scheduled Castes.
SCT-V Part B-Sample households engaged in cultivation classified by interest in land and size of land cultivated in rural areas only for members of Scheduled Tn'bes.
SC-I-Persons not at work classified by sex, type of aotivity and eduoational levels for Scheduled Castes.
ST-I-Mother-tongue and bilingualism for Scheduled Tribes.
STOll-Persons not at work classified by sex and type of activity for Scheduled Tribes.
The tables being reproduoed in this Handbook and the levels up to which they are reproduced, are indioated below :
SCT-I-Industrial classification of persons at work and non-workers by sex for Scheduled Castes (Part A) and Scheduled Tribes (Part B)-For the district as a whole.
BO-I-Persons not at work olassified by sex, type of activity a.nd educational level for Scheduled Castes-For the district as a whole and rural areas of such anchals in whioh the combined Scheduled Caste population is higher than the average Scheduled Caste population per a.nchal in the distriot.
ST-I-Mother.tongue a.nd bilingualism for Scheduled Tribes-For the district and selected anchals in which the combined strength of Scheduled Tribes is higher than the average population of Scheduled Tribes per anchal in the district
SToll-Persons not at work classified by sex and type of activity for Scheduled Tribes-For the distriot and selected anchals in which the Scheduled Tribe population is higher than the average Scheduled Tribe population per Wlcha] in the distric&.
The Scheduled Castes and Scheduled Tribes have been notified as such under Notification no. SRO-2477-A, dated the 29th October, 1956 issued by the Government of India, MinistrY of Hgme Affairs in acoordance with the provisions oontained in Articles 341(1) and 342(1) of the Constitution of India., The list of Soheduled Castes and Scheduled Tribes, thus

notified for the district of Hazaribagh is ~iven below:
A. Scheduled Oastes B. Scheduled Tribe8 1. Bantar 2. Bauri 3. Bhogta. 4. Chamar or M ochl 5. Chaupal 6. Dabgar 7. Dhobi 8. Dom or Dhangad 9. Dusadh including
Dhari or Dharhi 10. Ghasi ll. Halalkhor 12. Hari, Mehtar or B~
13. Kanjar 14. Kurariar 15. Lalbegi 16. Musahar 17. Nat 18. Pan or Sawasi 19. Pasi 20. Rajwar 21. Turi
1. Asur 2. Baiga. 3. Banjara 4. Bathudi 5. Bedia. 6. Bhumij 7. Binjhia 8. Birhor 9. Birjia
10. Chero II. Chik Baraik 12. Gond 13. Gorait U. H(J 15. Karmali 16. Kharia 17. Kharwar 18. Khond 19. Kisan 20. Kora 21. Korwa 22. Lohara or Lohra 23. Mahli 24. Mal Paharia 25. Munds. 26.0raon 27. Parhaiya 28. Santal 29. Sauria Paharia, 30. Savar
95
The Soheduled Caste population of th~ district as given in the Table SOT-! Part A, ~nsus of India, 1961, Vol. IV, Bihar, Ps.rt V-A includes 4,260 Bhuiyas (1,224 in rural areas and 3,()36 in urban areas of the district) wrongly enumerated as Scheduled. Caste and tabulated under cU~clas_ sified' whereas acoording to the Presidl;)ntial Order, they are not so. Correoted figur~s for Table SOl'-I P art A and its Appendix have been given in this volume.
However, it has not been possible at this stage to correot the figures in Table SC-I because the data relating to above table were not tabulated castewise.
Table SOT-I-Industrial classification of P~rsons at work and non-workefS by sex for Scheduled Oastes (PartA) and Scheduled Tribes (Paft B) for the district as a whole
Part A gives the same information fo!:, each of the Scheduled Oastes as given in Table B-1. i. e., industrial classification of wl)rkers
and non-workers. However, the data are not classified by broad age groups. Information is also given of the number of males and females of each caste engaged in the unwholesome occupations of (i) tanning and currying of hides and skins, and (ii) scavenging.
Part B of this table gives the industrial classification by sex of each Scheduled Tribe into nine categories of workers and non-workers.
A.ppendi~ to Table SOT-! shows the total population of Scheduled Castes and Scheduled Tribes in each anchal of Hazaribagh district.
Table SO-I-Persons not at work classified by Sex, Type of Activityand Educational levels for Scheduled Oastes
This table gives for the Soheduled Castes as a whole, the classification of non-workers by sex, type of activity and also educationa.I levels. - Instead of 8 detailed groups of activities relating to non-workers vide Explanatory Note to General Economic Tables, at page 23 the groups are restricted to four, namely, (i) full time students, (ii) persons seeking employment for the first time" (iii) persons employed before, but now out of employment and seeking work, and (iv) others.
'Others' include persons engaged in unpaid home duties (such as housewives), dependants, retired persons, beggars and inmates of penal and mental institutions.
The classification by educational levels is by illiterate, literate without 'educational level, primary or jUnior basic, matriculation or "higher secondary, and above matriculation or higher secondary. Table ST-I-:-Mother-tongne and Bilingualism for
Seheduled Tribes This table gives the extent of prevalence of
tribal languages spoken as mother-tongue by each of the Scheduled Tribes and the number of speakers -of subsidiary language in each tribe. Table ST-I1-Persons not at work classified by
Sex ali,d Type of Activity for Scheduled Tribes
This table gives information similar to that in Table SO-I, in respect of the Scheduled Tribes. However, information about the four types of activities of non-workers, though given separately for each Soheduled Tribe, is not as in the' case of Soheduled Castes, classified by educational levels.

96
Table SOT-I Part A TABLE SOT-I PART A-INDUSTRIAL OLASSIFIOATION OF PERSONS
WORKERS
r .A. ...... I II III
Serial Name of Rurall Total Total workers As Cultivator As Agricultural In Mining, Quarry. no. Scheduled Caste Urban (i-IX) labourer ing, Livestoo k,
Forestry, Fish-ing, Hunting and Plantations, Or. chardsand Allied
, activities r ...... r-.A.-~ r--.A.-...... r-.A.--...... r-.A.-....... ·
P M F M F M F M F M F
1 2 3 4 5 6 7 8 9 10 II 12 13 ]4
HAZARIBAGH
All Scheduled Castes R 276,358 133,385 142,973 75,731 65,648 37,381 38,813 13,933 16,359 9,812 1,914. U 20,029 10,766 9,263 6,114 2,639 326 279 67 50 2,225 908
1 Bantar B 21 14 7 12 3 U
2 Bauri R 1,419 725 694 411 228 153 71 80 36 163 111 U 193 100 93 50 40 44 36
3 Bhogta R 37,102 18,826 18,276 11,989 a,7M 8,270 5,949 2,078 2,260 883 99 U
4 Chamar or Mochi R 99,310 46,745- 52,565 24,812 23,977 10,811 13,861 4,909 6,668 4,142 571 U 7,805 4,210 3,595 2,612 1,118 101 145 29 25 1,338 611
5 Chaupal R U 4 4 4
6 Dabgar R 114 72 42 29 12 U 42 11 31 2 1
7 Dhobi R 18,043 8,946 9,097 4,996 4,099 3,127 3,094 494 513 464 92 U 1,4'60 788 672 467 223 10 9 166 102
8 Dom or Dhangad R 3,370 1,649 1,721 907 769 162 211 151 162 113 41 U 868 495 373 273 117 43 11
9 Dusadh including Dhari R 32,702 15,413 17,289 8,523 7,718 4,933 5,912 1,013 1,292 1,140 106 or Dharhi U 2,970 1,619 1,351 902 248 99 105 20 13 176 27
10 Ghasi R 7,039 3,739 3,300 2,241 1,321 678 597 441 384 241 93 U 755 415 340 232 101 7 6 5 9 31 15
11 Ha.la.lkhor R 3 1 2 1 1 ., U 4 3 1
12 Hari, Mehtar or Bhangi R 1,402 708 694 397 184 124 100 49 21 ' 101 16 U 1,604 781 • 823 327 285 3 13 33
13 Kurariar R 40 22 18 22 11 11 U
14 Musahar B 7,398 3,655 3,743 2,208 1,838 465 424 836 855 641 293 U 944 538 406 330 111 10 6 2 1 168 29
15 Nat R 8 5 3 5 5 U
16 Pan or Sawasi R 8 8 5 1 5 5 1 U

97
Table SeT·I Part A AT WORK AND NON-WORKERS BY SEX FOR SCHEDULED CASTES
WOlUtEB.S ..A. , WOBXEBS
IV V VI VII VIII IX X At nousehold In M:snutae- In Construe- In Trade In Trsnsport, In Other Non-worker8 ' r-----"- Serial
Industry turing other tion and Com- Storage and Services In special oooupations no. than Household merce Communi- r ..A. ,
Industry oations T&nning and Scavenging currying of
hides and skins
r-..A.-· .-_..A._. ,---"---""\ .-_..A._, r-..A.--""\ .--_ ..... _-. r-..A.-. r-..A.-... .-_..A._. M F M F M F M F M F M F M F M F M F
15 16 17 18 19 20 21 22 23 24 25 26 27 28 29 30 31 32 1
DISTRICT
5,094 4,755 2,922 1,107 6S4 40 118 84 479 71 5,30S 2,505 57,654 77,825 60S 57 882 65 2lS0 84 961 400 190 9 50 42 886 31 1,689 886 4,652 6,624 298 880 843
5 1 3 .2 7 1
4: 3 2 .2 7 7 314 466 2 1 1 4 4 60 53
341 319 57 21 31 4 1 12 5 313 142 6,837 9,480 3
1,390 1,397 1,552 617 336 14 20 3 110 20 1,542 826 21,933 28,588 583 57 183 3 4 159 7 568 186 67 10 6 63 1 271 137 1,598 2,477 291 12
& 4
8 4: 5 43 42 10 6 1 9 31
63 79 155 23 36 1 8 2 47 602 295 3,9S0 4,998 6 7 1 20 1 1 5 264 111 321 449 16
259 246 4 12 8 12 11 198 86 742, 952 60 32 8 10 9 3 1 1 1 12 204 95 222 256 5 122 90
60 173 334 62 82 5 18 10 110 1 833 157 6,890 9,571 47 9 8 96 21 89 .2 14 14 125 3 275 63 717 1,103 .2
386 12 70 11 35 16 6 58 7 316 211 1,498 1,979 40 10 10 8 1 9 50 7 122 63 183 239 58
1 1 1 11 3 1
44 8 5 4: I 6 67 85 3ll 610 39 6 1.2 3 5 2 24 284 245 454 538 163 237
2.2 7 13
26 55 59 38 5 5 14 I) 162 163 1,447 1,905 14-13 6 7 S 20 59 17 63 32 208 295
3 15
2 16 17
6 (Cen.) 0-7
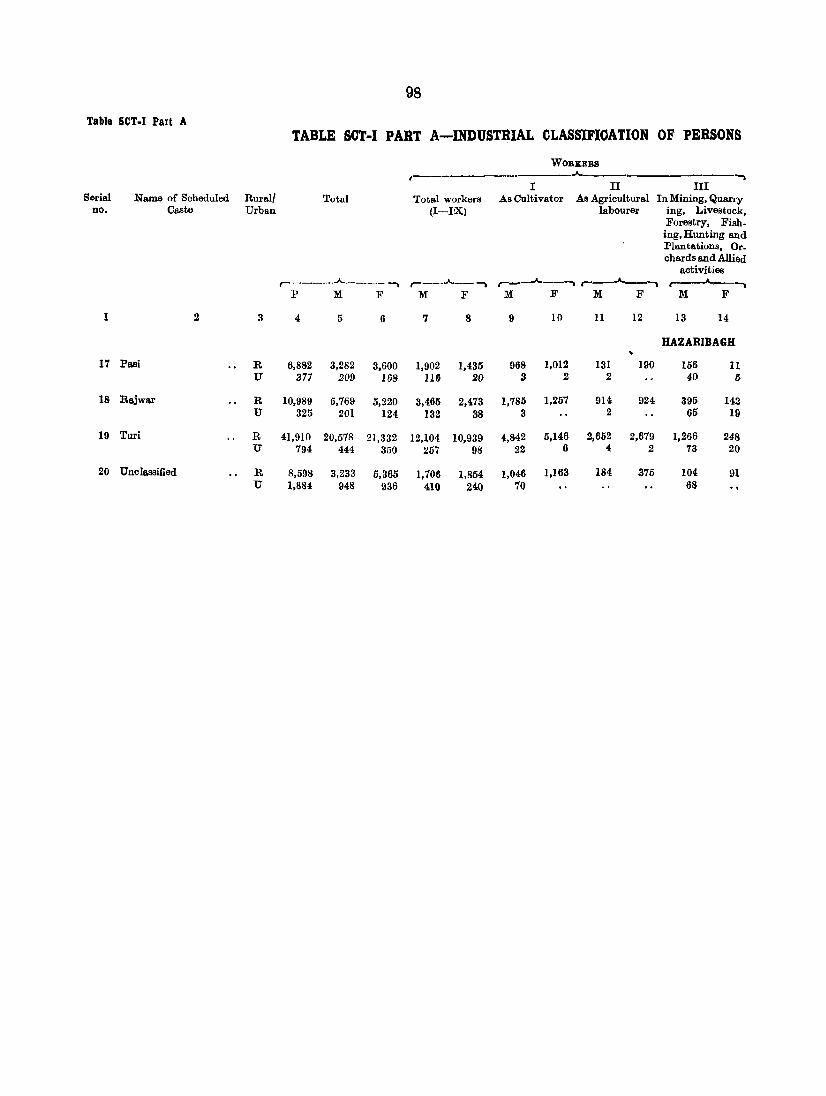
98
Table SCT.I Part A TABLE SOT-I PART A-INDUST~IAL OLASSIFIOATION OF PERSONS
WORKERS
,- A
"'""' I II III Serial Name of Scheduled Ruralf Total Total workers As Cultivator As Agricultural In Mining, Quarry
no. Caste Urban (I-nq labourer ing, Livestock, Forestry, Fish. ing, Hunting and Plantations, Or-chards and Allied
activities r-----. .A.---- .. r---A--. r-_-A--","", r---.A.-. r-A _","",
P M F M F M F M F M F
1 2 3 4 5 6 7 8 9 10 11 12 13 14
HAZARIBAGH .. 17 Pasi R 6,882 3,282 3,600 1,902 1,435 968 1,012 131 190 156 11
U 377 209 168 116 20 3 2 2 40 J}
18 RaJwar R 10,989 5,769 5,220 3,465 2,473 1,785 1,257 914 924 395 142 U 325 201 124 132 38 3 2 65 19
19 Turi R 41,910 20,578 21,332 12,104 10,939 4,842 5,146 2,652 2,679 1,266 248 U 794 444 350 257 98 22 6 4 2 73 20
20 Unclassified R 8,598 3,233 5,365 1,706 1,854 1,046 1,163 184 375 104 91 U 1,884 948 936 410 240 '10 68
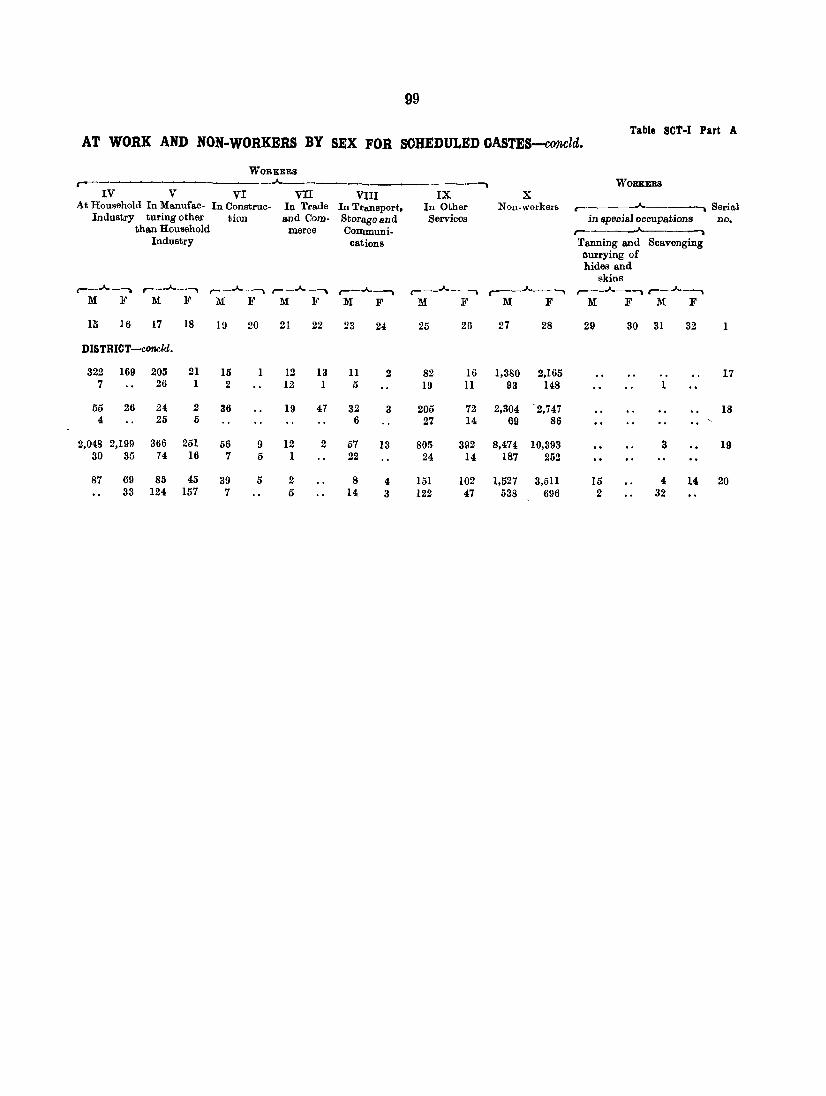
99
Table SOT-I Part A AT WORK AND NON-WORKERS BY SEX FOR SOHEDULED CASTES-concld.
WORKERS
r .-"- ., WORKERS IV V VI vn VIII IX X
At Household In Manufac- In Construe- In Trade In Transport, In Other Non-workers ,_------"------" Serial Industry turing other tion and Com- Storagcand Services in speoial oooupations no.
than Household meree Communi. r---------"-----., Industry cations Tanning and Scavenging
ourrying of hides and
skins r--"--., r----"--, ,---"--, r- --"- --"""\ r--.A.-., r-----"--- ., r---"---, r----"---., r- -"--.,
M F M F M F M F M F M E' M F M F M F
f5 ]6 17 18 19 20 21 22 23 24 25 26 27 28 29 30 31 32 1
DISTRIOT-concld.
322 169 205 21 15 1 12 13 11 2 82 16 1,380 2,165 17 7 26 1 2 12 1 5 19 11 93 148 1
55 26 24 2 36 19 47 32 3 205 72 2,304 "2,747 18 4 25 5 6 27 14 69 86
2,048 2,199 366 251 56 9 12 2 57 13 805 392 8,474 10,393 3 19 30 35 74 16 7 5 1 22 24 14 187 252
87 69 85 45 39 5 2 8 4 151 102 1,527 3,511 15 4 14 20 33 124 157 7 5 14 3 122 47 538 696 2 32

100
Table SCT-l Part B TABLE SCT-I PART B-INDUSTRIAL OLASSIFIOATION, OF PERSONS
WOBE.'ERS
r """"I I II III
Serial Name of Rural! Total Total workers As Cultivator As Agricultural In Mining, no. Scheduled Tribe Urban (I-IX) labourer Quarrying, Live-
stock, Forestry, Fishing, RJmting and Plantations, Orohards and
Allied activities r----.A..----. r--.A..--, r-.A..---. r--.A.. ---. r---"----.
P 111 F 111 F 111 F M F M F
2 3 4 5 6 7 8 9 10 11 12 13 14
HAZARIBAGH
All Sched !tIed Tribes R 2'114,637 134,133 130,504 84,197 63,539 61,024 49,816 6,289 6,2(61 9,640 2,990 U e,056 3,162 2,894 1,796 1,122 262 230 8 3 683 524
Baiga R 77 45 32 23 12 12 2 5 5 4 U .,
2 Banjara R 13 7 6 6 6 U
3 Bedia R 19,818 9,845 9,973 6,266 3,862 5,031 3,326 276 264 649 13!l U 49 29 20 18 9 3
4 Bhumij R 44 43 1 43 1 !l3 U 2 2
5 Birhor R 1,233 648 585 378 273 65 50 33 31 62 22 I U
6 Chero R U 2 2 2
7 Chik Baraik R 21 10 '11 7 5 1 5 U 10 5 5
8 Gond ". R 280 154 126 100 64 1 94 6!l U 1,324 592 732 276 316 2 213 273
9 Gorait R 173 79 94 43 22 16 12 2 1 5 5 I U 9 9 9 6
10 Ro R 37 32 5 10 3 4 3 U 10 4 6 1 1
11 Karmali R 15,855 8,300 7,555 4,947 3,246 2,760 2,164 492 638 713 242 U 603 350 253 180 Il3 22 46 2 20 10
12 Kharia R 117 62 55 30 38 1 1 6 13 U
13 Kharwar R 956 4111 495 357 288 170 177 98 73 29 3 U 1 1 1
14 Khond R 782 349 433 176 165 90 134 40 24 37 U
15 Kisan R 2 2 2 U 1 I'
16 Kora. R U 4 4 4 "

101
AT WORK AND HON-WORKERS BY SEX FOR SCHEDULED TRIBES
r----IV
At Household Industry
V In 'Manufacturing
other than Household Industry
WORKERS __.A.
VI VII In Construe- In Trade and
tion Commerce
VIII In Transport, Storage and
Communicijtions
-~ IX
In Other Services
Table scT-1 Part 8
X Non-workers Serial
no.

102
Table SeT-I Part B
TABLE SCT-I PART B-IBDUSTBIAL CLASSIFICATION OF PERSONS
WORKERS
r I II III
Serial Name of Rural/ Total Total workers As Cultivator As Agricultural In Mining, no. Scheduled Tribe Urban (I-IX) labourer Quarrying, Live-
stock, Forestry, Fishing, Hunting and Plantations,
Orchards and Allied activities
r- ~ r--"-~ r---"---. r-· --"---, r---"-~ P M F M F M F M F M F
1 2 3 4 5 6 7 8 9 10 11 12 13 14
HAZARIBAGH
17 Korwa R 188 109 79 95 79 84 61 28 6 U 7 4 3
18 Lohara or Lohra R 9;2 481 491 305 248 101 124 9 51 108 49 U 56 17 39 16 22 13 21
19 Mahli R 5,099 2,781 2,318 1,832 1,234 843 517 106 83 309 117 U 85 63 22 45 11 1 6
, 20 Munda R 24,761 12,603 12,158 7,845 5,364 5,063 3,728 538 482 1,580 782 U 2,827 1,534 1,293 876 548 197 180 7 I 350 204
21 Oraon R 14,848 7,872 6,976 4,823 3,451 3,112 2,3'35 lU8 259 1,077 615 U 760 390 370 270 69 26 2 20
22 Parhaiya R 889 500 389 293 190 87 53 117 73 45 20 U
23 Santal R 173,583 87,653 85,930 55,281 43,938 42,679 36,505 4,233 3,992 4,848 895 U 197 84 113 51 29 4 28 15
24 Savar R I , 1 U 17 14 3 10 10
25 Unclassified R 4,888 2,139 2,749 1,377 1,008 903 638 126 214 64 20 U 92 59 33 38 4 3 23

103
AT WORK AND NON-WORKERS BY SEX FOB SCHEDULED TBlBE8-concld.
IV At Household
Industry
V VI In Manufacturing In Construe-
other than tion Houaehold Industry
~_-A.~ ~____.,\,----. r---..A.-----a M F M F M F
15 16 17 18 19 20
DISTRICT-concld,
51 24 14 1
459 454 25 9 9 4 3 4 6 1
87 101 62 51 81 16 9 10 34 6 9
65 101 35 IS 61 17 6 16 17 1
10 10 2
1,51\0 1,622 186 193 175 43 1 1 2
102 24 52 16 54 39 1 2 10
VII In Trade and
Commerce
e----"-----a :M F
21 22
1
12
11 4
2
VIII In Transport,
Storage and Communications
~____.,\,-~ M F
23 24
12
2 9 1 1
63 22 29
15 13 18
116 59 4 2
15
IX. In Other Services
e--.A.-~ M F
25 26
5
10 3
78 41 32
370 170 241 147
250 93 182 50
32 34-
1,483 625 12 11
59 57 10 3
Table seT.I Part B
X. Non-workers Serial
no.
e-... _________
:M F
27 28 1
14, 17 4 3
176 243 18 1 17
949 1,084 19 )8 II
4,758 6,794 20 658 745
3,049 3,525 21 120 301
207 199 22
32,372 41,992 23 a3 84
1 24 4- a
762 1,741 25 21 29

104
APPENDIX TO TABLE SOT-I
Statement showing the totaZ population of Scheduled Oaste8 and Scheduled Tribe8 ~n each Anchal of the di8trict of H azaribagh
TOTAL POPULATION
r .A. • Scheduled Castes Soheduled Tribes Serial Name of Anoha.l r- .A. • r- .A. • no.
Persons Males Females Persons Males Females
1 2 3 4 5 6 7 8
1 Barhi 5,607 2,735 2,872 1,135 573 562 2 Barkatha 5,615 2,371 3,244 2,920 1,400 1,620 3 Bagodar 9,679 4,405 5,274 1,955 981 974 4 Bishungarh 5,564 2,743 2,821 5,891 2,923 2,968 5 Hazaribagh " 6,274 3,114 3,160 I,B78 968 905
6 Katkamsandi 5,959 2,851 3,108 2,536 1,270 1,266 7 Ichak 5,226 2,427 2,799 947 672 876 8 Barkagaon 4,417 2,129 2,288 4,208 2,215 1,993 9 Keredari 5,654 2,956 2,698 1,789 955 834
10 Tandwa 6,586 2,708 2,878 4,473 2,273 2,200
11 Mandu 5,118 2,730 2,388 14,459 7,520 6,939 12 Nagri (Ohurahu) 2,624 1,349 1,275 12,609 6,128 6,481 13 Ramgarh 6,150 3,174 2,976 12,073 6,156 5,917 14 Jainagar 5,876 2,602 3,274 15 Gola 4,606 2,526 2,080 18,057 9,094 8,963
16 Gumia 7,972 3,949 4,023 17,166 8,488 8,678 17 Peterbar 4,876 2,592 2,284 14,247 7,860 6,387 18 Kasmar 3,599 1,830 1,769 6,466 3,263 3,203 19 Jaridih 5,037 2,552 2,485 20,760 10,588 10,172 20 Kodarma. 11,350 5,776 5,574 687 475 212
21 Markacho 5,252 2-,312 2,940 781 398 383 22 Patratu 5,041 2,564 2,477 17,163 8,868 8,295 23 Chauparan 7,215 3,521 8,754 2 2 24 Itkhori 4,504 2,162 2,342 87 43 44 25 Hunterganj " 7,488 3,705 3,783 96 44 52
26 Pratap Pur " 8,117 4,118 3,999 831 449 382 27 Chatra 8,205 3,959 4,246 600 329 271 28 Simaria 12,018 6,000 6,018 3,334 1,708 1,626 29 Gawan 6,443 3,130 3,313 2,728 1,314 1,414 30 Tisri 5,550 2,725 2,825 9,377 4,577 4,800
31 Satgawan 5,444 2,662 2,782 61 29 32 32 JaInua 13,207 5,859 7,348 665 342 323 33 Deori 8,816 4,013 4,803 8,646 4,209 4,437 34 Dhanwar 1I,033 4,969 6,064 652 382 289 35 Birni 7,329 3,067 4,262 '127 330 397
36 Giridih 22,720 11,215 11,505 9,155 4,700 4,455 37 Bengabad 6,972 3,272 3,700 9,929 4,720 5,209 38 Gande ' .. 5,315 2,683 2,632 16,780 8,654 8,226 39 Dumri 7,627 3,717 3,910 8,884 4,549 4,336 40 Nawadih 6,667 3,249 3,418 8.588 4,249 4,339
41 Pirtanr 3.446 1,680 1,766 19,835 10,021 9,814 42 Bermo 11,129 6,050 5,079 7,522 3,798 3,724

1()~
TABLE SO-I-PERSONS NOT AT WORK CLASSIFIED BY SEX, TYPE OF ACTIVITY AND ,
EDUCATIONAL LEVELS FOR SCHEDULED CASTES
Persons Persons employed seeking before
Total non-working Full time employment but now Popul~tion students {or the out of
Educational levels first time employment Others and seeking
work r--.A. """I r---.A.--, r-.A.--"\ r-.A.--"\ r--.A.--·-,
P M F M F M F M F M F
1 2 3 , 5 6 7 8 9 10 11 12
HAZARIBAGB DISTRICT-TOTAL , TOTAL 148,718 68,334 85,884 7,074 473 863 9 274 88 55,628 84,864 liliterate 141,456 56,816 84,640 1,784 141 224 9 198 38 54,610 84,452 Literate (without educational level) 6,214 5,534 680 4,415 289 108 61 950 391 Primary or Junior Basic 1,002 938 64 842 43 26 12 58 21 Matriculation or Higher Secondary 43 43 31 5 2 5 Above Matric ulation or Higher Secondary 3 3 2 ]
BAZARIBAGH DISTRICT-RURAL
TOTAL 185j1l48 57,984 77,664 6,489 824 211 7 136 7 51,148 77,826 Illiterate 129,571 62,440 77,131 1,707 126 108 7 100 7 60,626 76,992 Literate (without educational level) 5,223 4,710 513 4,013 183 81 25 591 330 Primal.'Y or Junior Basic 819 799 20 742 16 19 8 30 4 Matriculation or Higher Secondary 34 34 27 3 2 2 Above Matriculation or Higher Secondary 1 1 1
BAZARIBAGB DISTRICT-URBAN
TOTAL 18,070 5,850 7,710 585 149 152 2 188 81 4,475 7,588 Illiterate 11,885 4,376 7,509 77 16 116 2 98 31 4,086 7,460 Literate (without educational level) 991 824 167 402 106 27 36 359 61 Primary or Junior Basic 183 139 44 100 27 7 4 28 17 Matriculation or Higher Secondary 9 9 4 2 .. ' 3 Above Matrioulation or Higher Secondary 2 2 2
Bagodar Anchil-Rural
Total 4,292 1,945 2,847 240 51 2 1,708 2,888 IDiterate 4,081 1,740 2,341 52 4 1,688 2,337 Literate (without educational level) 187 181 6 166 5 15 1 Primary or Junior Basio 23 23 21 2 Matriculation or Higher Secondary 1 1 I Above Matriculation or Higher Secondary
Gumi. Anchal-Rural
Total 4,842 1,887 2,855 245 17 8 4 1,435 2,638 Illiterate 4,081 1,442 2,639 30 6 1 1,411 2,634 Literate (without educational level) 234 219 15 191 11 1 3 24 4 Primary or Junior BaBic 27 26 1 24 1 1 1 Matriculation or Higher Secondary " " Above Matriculation or Higher Secondary ..
Kodarma Anchal- Rural
Total 4,988 2,014 2,924 287 24 II 26 1 1,749 2,899 Illiterate 4,688 1,787 2,901 34 6 2 22 1 1,729 2,894 Literate (without educational level) 236 213 23 189 18 4 20 5 Primary or Junior Basic 9 9 9 Matriculation or Higher Secondary 5 Ii Ii Above Ma.triculation or Higher Secondary


107
TABLE SC-I-PERSONS NOT AT WORK OLASSIFIED BY SEX, TYPE OF ACTIVITY ANn BDUCATIONAL LEVELS FOR SCHEDULED CASTES-concld,
Persons Persons employed seeking before
Total non-working Full time employment but nOW PopulatioJ), students for the - out of
Educational levels first time employment Others and seeking
work r---.A.---~ r--.A.--~ r-.A.--. ...--"----. r--.A.--~
P l\I F l\I F 1\1 F M F M F
1 2 3 4 6 6 7 8 9 10 11 12
Deorl ADohal-Rural
Total 3,600 1,763 1,837 163 1,600 1.837 Illiterate 3,552 1,718 1,834 127 1,591 1,834 Literate (without educational level) 47 44 3 35 9 3 Primary or Junior Basic 1 1 1 Matriculation or Higher Secondary Above Matriculation or Higher Secondary ,-<
Dhanwar ABehal-Rural
Total 6,027 2,646 8,881 111 2 2,535 3,379 Illiterate 5,934 2,553 3,381 III 2 2,442 3,379 Literate (without educational level) 83 83 83 Primary or Junior Basic 10 10 10 Matriculation or Higher Secondary " Above Matriculation or Higher Secondary
Blrnl Anehal-Rural
Total 8,474 1,591 1,888 238 8 5 1,848 1,880 illiterate 3,272 1,392 1,880 65 2 1,335 1.880 Literate (without educational level) 151 148 3 136 3 12 Primary or Junior Basic 50 50 47 3 Matriculation or Higher Secondary 1 1 .-Above Matriculation or Higher Secondary
Glrldlh Al1Chal-Rural
Total 11,247 4,152 7,095 804 28 148 7 69 8 8,681 7,062 Illiterate 10,823 3,776 7,047 42 1 64 7 56 3 3,614 7,036 Literate (without educational level) 366 324 42 221 17 76 12 15 25 Primary or Junior Basic 48 42 6 33 5 7 2 1 Matriculation or Higher Seoondary 10 10 8 1 1 Above Matrioulation or Higher Secondary
DUmri AnehaI-Rurai
Total 8,521 1,677 1,844 208 8 1 2 1,471 1,836 DIiterate 3,339 1,509 1,830 56 1 1,452 1,830 Wterate (without educational leVel) 169 155 14 134 8 2 19 6 Primary or Junior Basic 13 13 13 Matriculation or Higher Seoondary .. -Above Matriculation or Higher Secondary

lOS
TABLE ST-I-MOTJlEll-TONGtJE AND BILINGUALISM FOR SCHEDULED TllIBES
Serial Name of Scheduled Tribes no.
1
1 Chik Baraik
2 Karmali
3 Mahli
4 Munda
5 Oraon
1 Bedia
1 Gond
2 Unclassified
Birhor
1 Baiga
2 B:.njara
3 Bedia,
4 Bhumij
I) Birhor
6 Chero
7 Chik Baraik
8 Gond
9 Gorait
10 Ho
11 Karmali
Mother.tongue and total number of persons returned 88 speaking a language
Total speakers subsidiary to the Subsidiary language mother· tongue
r--_.A.. ~ r--.A.--. Males Females Males Females
2 II 6
HAZARIBAGH DISTRICT-TOTAL
Mother-tongue-i. Bengali
1 1 Hindi (F.Il
5 2
24 3
76 66
Mother-tongue-2.. Bhlll
53 63 43 41 Hindi (M·t3, F.U)
Mother-tongue-B. t BDaspurl
89 48 63 2 English (M-D), Hindi (M·52, F.2), OriYI> (M·2).
33 8 6 5 Hindi (M.6, F·5)
Mother-tongue-4. BlrJior
57 57
lIIDther-tongue-6. HIDdI
45 32
7 6
8,460 8,1115 42 5 Bengali (M·U, F.2), English (M.14), MagBhi/Magadhi (M·9, F.2), Sanskrit (M.I), Santali (M-4), Urdu (F.I).
1 43
225 148 2 English (M-I), Sanskrit (M.l)
2
15 11 3 English (M.l), Oriya (M.2)
630 803 8 Bilaspuri (F.8)
87 94
4 3
6,701 6,001 170 33 Beriya (M.6), English (M.22), Kurukhl Oraon (F·4), MagabifMagadhi (M.19), Sanskrit (M·8), Santali (M·Il5, F.29).

109
TABLE ST-I-MOTHER-TONGUE AND BILINGUALISM FOR SCHEDULED TRIBES-contd.
Mother·tongue and total number of persons returned as speaking a language
Serial Name of Soheduled Tribes Total spebkers au bsidiary to the Subsidiary language DO. mother.tongue
r--.A..--..... r--.A..--..... Males Females Males Females
1 2 3 4 5 6
HAZARIBAGH DISTR~CT-TOTAL-contd.
Mother-tongue-5. Hlndl-concld.
12 Kharia 46 40 English (M·I)
13 Kharwar 129 65 .. English (M·l)
14 Khond 344 433 I English (M.I).
15 Kisan 3
16 Kora 3
17 Korwa 108 78
18 Lohara or Lohra 454 470 2 3 English (M.2), Oriya (F.Il, Santali (F.2).
19 Mahli 2,622 2,162 20 1 Bengali (M.20), Mundari (F.l).
20 Munda 9,219 9,273 30 6 Bengali (M·3, F.2), Oriya (M.2), SaDs, krit (M.8), Santali (M.17, F·4).
21 Oraon 1,479 1,500 126 90 English (M.IS, F.8), Kurukh/Oraon (M.4, F.5), Magahi/Magadhi (F.2), Mundari (M.43, F.40), Oriya. (M.20), Tamil (M.44, F·35).
22 Parhaiya 500 389 4 Kurukh/Oraon (M.4)
23 Santa! 654 892 69 11 English (M·3, F.I), Mundari (F.4), San. tali (M.66, F.6).
24 Savar 14 4
25 U nclasaified 1,651 2,051 19 .. Bengali (M·5), English (M.2), Kurukh/ Oraon (M.l), Magahi/Magadhi (M.2), Muudari (M.4), Tamil (M.5).
Motber-tongue-6. Ho
I Ho 32 5 1 English (M.I)
• 2 Kharwar 332 426 '7 41 Hindi (M.47, F.U)
3 San tal 2
Mother-tongue-7. Karmali
1 Korwa 4
Mother-tongue-S. Kol
1 Karmali 129 134 27 6 Hindi (M.27, F·6)

110
TABLE ST-I-MOTHER-TONGUE AND BILINGUALISM FOR SCHEDULED TRIBES-<:ontd.
Mother·tongue and total number of persons returned as speaking a language
Serial Name of Soheduled Tribes Total speakers subsidiary to the Subsidiary language no. mother·tongue
1
Gorait
2 Kheria
3 Mundo.
4 Oraon
5 Unclusi'ified
1 Bedia
2 Bhumij
3 Gond
4 Ho
5 Karmali
6 Lohara or Lohra
7 Mahli
8 Mundo.
9 Oraon
10 Santal
1 Chik Baraik
2 Gond
3 Ho
" Lohara or Lohra
5 Mundo.
r--.A.--""",\ r--.A.--""",\ M&les Females Males Females
2 3 4 5 6
HAZARIBAGH DISTRICT-TOTAL-contd.
16 15
3
5,280 4,279
3
1,328 1,281
2
1
1
811 825
30 44
66 64
270 280
138 233
296 219
4
6
2
14 16
4,260. 3,668
Mother-tongue-9. Kurukh/Oraon
1,613
3
1,600 English (M.50, F.20), Hindi (M.I,395, F.1,41O), Karmali (M·18), MagahiJ Magadhi (M.10, F·1I3), Mundari (M·24, F.35), Oriya (F·7), Sadan/Sadari (M·SI, F ·35), Santali (M.35).
Hindi (M·3)
Mother-tongue-10. Magahil Magadhl
29
2
41
93
263
11 Hindi (M.29, F·Il)
Santali (M.2)
46 English (M.3, F.15), Hindi (M·3I, F.SO). Mundari (M.7, F.I).
23 English (M·1, F.22), Hindi (M·17, F.Il, Kurukh/Or80n (M.61), Mundari (M·14).
170 English (F.2), Santali (M.263, F·168).
Mother.tonlue-11. Mundari
2 English (F·I), Hindi (F·I).
2 Oriya (F.2)
I Hindi (F.I)
5 Hindi (F.5)
758 566 Bengali (M.S, F·al, English (M·53, F·28), Hindi (M.657, F.478), Magahi/Magadhi (M.27, F·15), Nagpuri·Eastern Magahi (F.7), Oriya (M.ll, F·16), Sadan/Sadari (M.4, F·B), Santali(M.3, F.5l, Urdu (F.6).

III
TABLE ST-I-MOTHER-TONGUE AND BILINGUALISM FOR SCHEDULED TRIBES-contd.
¥other·tongue and tota.! number of persons returned as Speaking a language
Serial Name of Soheduled Tribes Total speakers subsidiary to the Subsidiary language no. mother.tongue
r---"---"'"\ r----"---"'"\ Ma.1es Females Ma.1es Females
1 2 3 4 5 6
HAZARIBAGH DISTRICT-TOTAL-concld
Mother-tongue-ii, Mundari-concZd.
6 Oraon 283 280 37 Hindi (M·37).
7 U nclassifiefl 5 3 4 Hindi (M.4, F.I)
Mother-tongue-12. tHagpurl-Eastern Magahi
Karmali 68 57
2 Mahli 10 26 7 4 Hindi (M·7, F.4) 3 MULld& 29 27 2 Ma.gahiJMagadhi (F .2)
Mother-tongue-13. Orlya
Gond 27 17 Hindi (M.17)
2 Mahli 3
3 Munda 46 22 14 5 Hindi (M.I4, F·5)
Mother-tongue-H. Santall
1 Bedia 33 34
2 Birhor 366 380 SO 65 Hindi (M.SO, F.65)
3 Karmali 936 789 11 6 Karmali (M·ll, F.6)
4 Kharwar 1 4
5 Khond 5
6 Kora 1
7 Korwa l .4
8 Mshli 122 82 2 1 Hindi (M.2, F·I)
9 Munda. '234 115 85 2 English (M.22, F.l), Hindi (M.63, F.I)
10 Oraon 1,082 1,003 98 125 English (M.ll, F.7), Hindi (M.4), Mag&hiJ Magadhi (M·83, F.Il8).
II Bantal 86,785 84,932 27,474 25,582 Bengali (M·7), English (M.20), Hind (M.25,219, F.23,482), Ho (M.ll), Khor. thaJKhotta (M·187), Magahi/Magadhi (M·2,030, F.2,l00).
12 Unol&ssified 506 720 106 Bengali (M·l), Hindi (M·l05).

112
TABLE ST-I-MOTHER-TONGUE AND BILINGUALISM FOR SCHEDULED TRIBES-contd.
Serial Nall1e of Scheduled Tribes no.
1
1 Karmali
2 Mahli
3 Mundo.
1 Gond
2 U nclassifiad
1 Birhor
1 Badia.
2 Chik Baraik
3 Karm.a.li
4 Lohara or Lohra
1 Kharia
2 Oraon
1 Badia
2 Karmali
3 Oraon
4 Santal
1 Munda
1 Karmali
2 Mahli
3 Munda
Total speakers
r--..A..--. Males Females
2 3
Mother-tongue and total number of persons returned as speaking a language Bubsidiary to the
mother-tongue ,..-__ ..A.. __ -.
Males Fem.a.les
4 5
Subsidiary language
6
MANDU ANOHAL-RURAL
Mothe,.,tongut-1. Ben,all
5 2
21 3
60 48
Mother-tongue-2. tBilaspuri
41 48 19 2 Hindi (M-19, F-2).
33 s 6 5 Hindi (M-6, F-5)
Mother-tongue-S. Birhor
14 8
Mother-tQJlgue-4. Hindi
14 .'.
8 5
247 ,195
4:
Mother-tQJlgue-5. Kurukh/oraon
11 5
525 521 52 103 Hindi (M-44, P·I03), Sadan/Sadri (M·S)
Mother-tongue - 6. Magahi/ Magadhl
1,224: 1,197
739 669 29 11 Hindi (M·29, F-ll)
11 7
269 190 262 167 Hindi (M·262, F·167)
Motha~tongue-7. Mundarl
1,432 1,292 76 68 Hindi (M-76, F-66), Magahi/Magadhi (F·2).
Mother-tongue-B. tNagpurl·Eastern Hagahl
68 56
10 26 7 4 Hindi (M·7, F·4)
29 27 2 Maga.bi/Magadhi (F·2)

113
TABLE ST-I-MOTBEB-TONGUE AND BILINGUALISM FOB SOHEDULED TRIBE8-contd.
Mother-tongue and total n1lIllber of persons returned as sp~ a la.nguage
Serial Name of Soheduled Tribes Total speakers subsidiary to the Subsidiary language nO. mother-tongue
1
1 Birhor
2 Xharwar
3 Munda
4: Oraon
5 Santal
1 Bedia.
.2 Bhumij
S Gond
4. Karmali
I) Lohara or Lohra
6 Mabli
'1 Munda
8 Oraon
9 Santa!
1 Ho
1 Oraon
1 Kunda
1 Kunda
.2 Orson
3 Santa! 6 (Cen.}C-S
".---"-_...." ".-__ .A,. I
Males Females Males Females
2
20
1
45
1.21
3 4: 5
MANDU ANCHAL-RT1RAL-concrd.
6
4:
30
113
Mother-tongue-9. SantaU
7 English (M-9, F-7)
6
2,51.2 2,475
9
333 27.2 Ma.gahijMagadhi (M-333, F • .27.2)
NAGRI (CRURCHU) ANCRAL-RURAL
708 689
43
24 .22
667 639
23 31
70 71
182 354:
107
9
268
318
07
3.656
321
40
.2
255
112
~.992
Mother-tongue -1. Hindi
32 . • Santali (M.32)
3 •• English (1'4-3)
Mother-tongue-S. Ho
Mother-tongue -3. Kurukh/Oraon
4: lIindi (M-4)
Mothellotongue-4. Mundarl
91 .. Hindi (M·Dl)
Mother-tongue-5. Santall
81 1 English (M.22, F·Il, Hindi. (M·1I0)
.2,027 2,128 HintU (M.2,027. F·2,128)

114
TABLE ST-I~MOTHER-TONGUIl: AND BILINGUALISM FOR SCHEDULED TBIBES-contd.
Mother-tongue and total number of persons returned as speaking a language
Serial Name of Scheduled Tribes Totll,l speakers subsidiary to the Subsidiary language no. mother-tongue
1
1 Bedia
2 Birhor
3 Karmali
4 Lohara or Lohra
5 Mahii
6 Munda
7 Oraon
8 Santal
9 Unclassified
1 Karmali
1 Bedia
2 Karmali
3 Mahli
4 Mundo.
1 Korwa
1 Oraon
1 Santal "
2 Unclassi1ied
r----..A.--...... r--_..A._--. Males Females Males Females
2 3 4 5
RAMGARH ANOHAL-RURAL
1,2!}9
t2
6~5
5
S4
2,184
1(17
226
358
129
2,766
1,495
162
1,983
4
54
2,<109
21
Mother-tongue-1. Hindi
1,660 10 2 Bengali (M-l), MagahijMagadhi (M-9, F-2).
5 2 English (M-I), Sanskrit (M·I)
494 36 1 English (M-2), Kurukh(Oraon (F·I), MagahijMagadhi (M·3), Sanskrit (M·B), Santali (M·23).
12
82
2,159 14 Santa!i (M.14)
92
222
416 7 Bengali (M-5), MagahijMagadhi (M.2)
Mother-tongue-2. Kol
134 27 6 Hindi (M·27, F·6)
GOLA ANOHAL-RURAL
Mother:'tongue -1. Hindi
2,781
1,349
164
1,947
50
2,366
306
26 2 Bengali (M-13, F-2), English (M·12), Sanskrit (M-l).
13 BeriYa (M-6), English (M·7)
1 Bengali (M·l)
8 Sanskrit (M·8)
Mother..tongue-2. Karmali
Mother.tongue-B. Kurukhjoraon
53 35 English (M-I), Hindi (M·IO), Karmali (M·18), Mundari (M-24, F·35).
Motber-tongue-4. SantaU
306 English (M·I), Hindi (M·294), Ho (1\1.11)

115
TABLE ST-I-MOTHER-TONGUE AND BILINGUALISM FOR SCHEDULED T~BES--conta.
Serial no.
Nama of Soheduled Tribes
1
1 Bedia
2 Karmali
3 Lohara or Lohra
4 Mahli
5 Munda
6 Oraon
1 Mundo.
1 Birhor
2 Mahli
3 Santal
1 Bedia
2 Karmali
3 Mahli
4 Munds.
5 Oraon
6 Santal
7 Unolassified
1 Ora.on
1 Bedia
2 ~ Munds.
Total speakers
r--.A._-...... Males Females
2 3
Mother-tongue and total number of persons returned as speaking a language sllbsldiary to the
mother- tongue r---.A.--~
Males Females
4 5
Subsidiary language
6
GUMIA AMOHAL-RUR.AL
1
806
8
324
389
146
130
60
2
6,622
211
605
28
158
19
27
38
1
104
102
Mother-tongue-i. Hindi
1 Santali (M-l)
847 37 29 SantaH (M-37, F-29)
12()
516 3 4 Santali (M-3, F-4)
1116
Mother-tongue-2. Mundarl
204 36 23 Hindi (M-36, F-23)
Mother-tougue-S. Santali
74 48 40 Hindi (M-48, F-40)
2 Hindi (M·2)
6,76t 1,507 13 English (M·I), Hindi (M-I,5,06, F.13)
PETEltBAR ANOHAL- RURAL
2()8
524
23
163
15
88
08
84
98
Mother-tongue-i. Hindi
4 English (M-I), Santali (M-3)
4 English (M-I), Santali (M·3)
14 Santali.(M-I4)
Moih8I1-tongue-2. KurUkh/Ol'aon
Mothtl'r-tonglle-3. Magahi/Magadhi
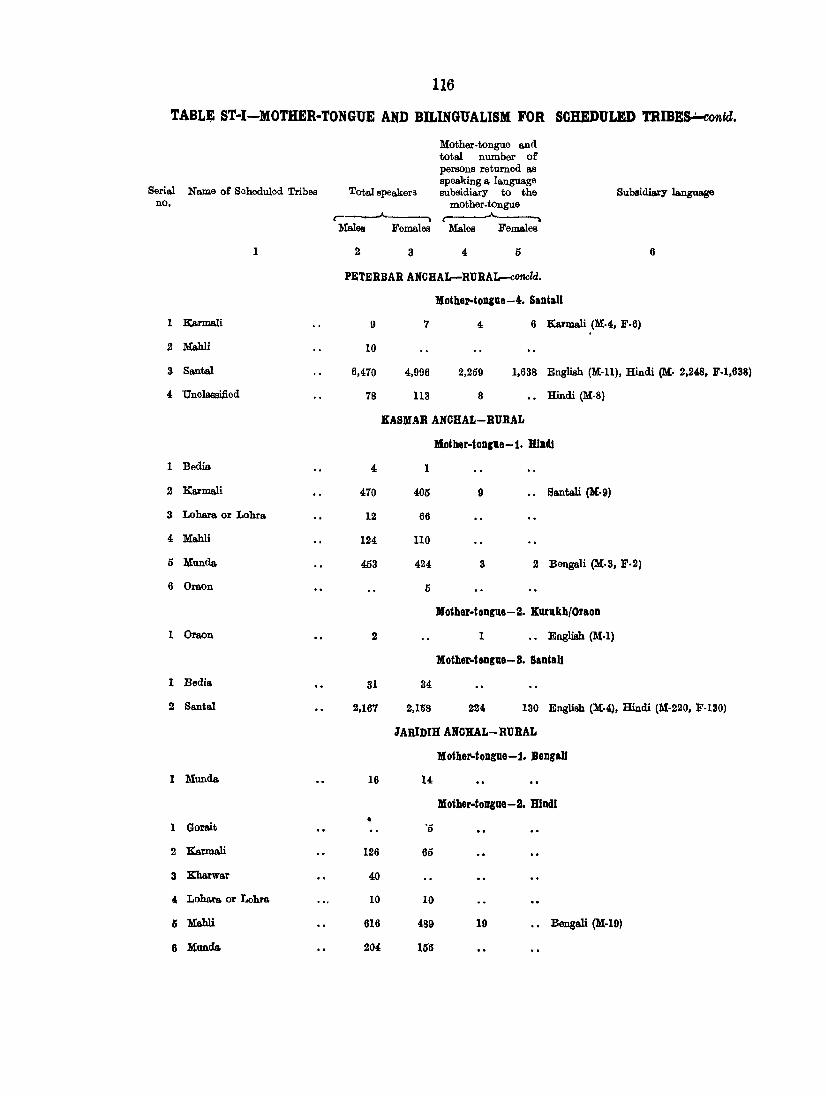
116
TABLJ;!: ST-I-MOTHER-TONGUE AND BILINGUALISM FOR SOHEDULED TBIB~ntd.
Mother·tongue and total number of persons returned as speaking a language
Serial Name or Saheduled Tribes Total spea,kers subsidiary to the SubsidiarY language no. mother.tongue
1
1 Ea.rmwi
2 Mahli
3 Santal
4 Unolasaitied
1 Bedia
2 Karmali
3 Lohara or Lohra
4 Ma.hli
5 Munda
6 Oraon
1 Oraon
1 Bedis
2 Santa.1
1 Munda
1 Gorait
2 Karmali
3 ltharwar
4 Lohars or Lohra
(; Ma.hli
6 It'unda
r-----"---. ..A. __ •
Ma.les Females Males Felnales
2 3 4 5 6
PETERBAR AMCHAL-RORAL-concld.
Mother-tongue-4. Santall
7 4 6 Karmali (M·4, F·6) 9
10
6,470
78
4,996
113
2,259
8
1,638 English (M·ll), Hindi (M. 2,248, F·1,638)
Hindi (M·S)
KASMAR AMOHAL-RURAL
Moth1r·tongue-i. Hindi
4 1
470 405 9 Santali (M·9)
12 66
124 110
453 424 3 2 Bengali (M·3, F·2)
5
Mother·tongue-S. Kurukhforaon
2 1 .. English (M·l)
MothSl>-tongu8-8. Santall
31 34
2,167 2,158 224 130 English (M·4), Hindi (M·220, F·130)
JARIDIH AMCHAL-RURAL
Mother-tongue-i. Bengali
16 14
Mother·tongue-S. Hindi •
'5
126 65
40
10 10
616 489 19 Benga.li (M.19)
204 15'6

117
~ABLE ST-I-MOTHER-TONGUE AND BILINGUALISM FOR SCHEDULED'l'RlBElS-contd.
Serial nO.
7
8
1
2
I
2
Name of Soheduled Tribes
1
Santa!
Unclassified
Munda
Orson
Mahli
Santal
3 UnolassiAed
1 Me.hli
1 Bedia
1 Bedia
.2 Birhor
3 Qond.
4: Gorait
6 LrmaJi
6 Eiean
7 Lobara or Lohra
8 lIahli
9 Munds
10 UncIasaUied
Tota,l speakers
___ .A.._-,
Males Females
2 3
Mother·tongue and total number of p8l'11ons returned as speaking a language subsidiary to the
mother· tongue ---""------'"
Males Females
4 5
Subsidiary language
6
JARIDIH AMO)lAL-RURAL-concld.
6 4: 5 • • Santali (M·5)
197 14"1
JllDthall-tongua -8. M.undarl
3 .Il
6 :l
llothel!-tongne-4. Santall
20 16
8,943 8,963 2.912 1.215 Bengali (M·7). English (M.I). Hindi (M·2,717, F·l,215), Xhortha/Khotta (M.·lS7).
401 298 98 Bengali (M·I), Hindi (M·97)
PATBAT.U AMOHAL-RURAL
MothOJ.l-tongue-1. ~angall
3
53 63
3.069 2.881
4 .. 1
12 13
794 748
2
100 17
70 81
2,224 2,166
888 1.119
Motha»-tongne-S. ~'hiJl
43 41 Hindi (M·43. F·41)
Mother-tongue-S. Hindi
...
22 ..
10
English (M·4). Santali (M.2).
Magahi/Magadhi (M·l6),
Kurukh/Oraon (M.I), Mundari (M.'), Tamil (M·5).

11S
TABLE ST .. !-MOTHER .. TONGUE AND BILINGUALISM FOR SCHEDULED TRIBES-contd.
Mother.tongue and total number of persons returned as speaking a language
Serial Name of Scheduled Tribes Total speakers subsidiary to the Subsidiary language no. mother.tongue
1
1 Kharia
2 Oraon
1 Lohara or Lohra
2 Munda
1 Badia
2 Birhor
3 Santa!
1 Kharwar
2 Loharo. or Lohra
3 Santal
1 Kharwar
1 Oraon
1 Lohafs or Lohro.
2 Santa]
1 Munda
1 Santal
r-.A.--",,"\ r--_.A._-",,"\ Males Females Males Females
2 3 4 5 6
PATRATU ANCHAL-RURAL-conold.
5
1,271
5
232
2
13
120
23
3
2
232
1
16
15
5
4,280
Mother-tongue-4. Kurukh/oraon
8
851 492 346 Hindi (M·492, F·303), Magahi/Magadhi (F·36), Oriya (F·7).
Mother-tongue-5. Mundarl
106 13 5 Hindi (M-4), Santali (M-3, F-5), Urdu (M·6).
Mother-tongue-S. Santall
14
218 18 3 Magahi/Magadhi (M-18, F-3)
TISRI AMCHAL-RURAL
12
1
304
1
26
22
4,434
Mother-tongue-t. Hindi
Mother-tongue-2. Ho
Mother-tongue-S. Kurukh/oraon
1 • • Hindi (M-l).
Mother-tongue-4. Magahi/Magadhl
2 SantaIi (M-2)
lIIothell-tongue - 6. Mundarl
5 .. Hindi (M·5)
Mother-tongue-6. Santali
2,450 1,795 Hindi (M-2,060. F-l,397), Magahi/Magadhi (M-390, F.398).

119
TABLE: ST-i-MOTHER-TONGUE AND BILINGUALISM FOR SOHEDULED TRIBES--contd.
Serial Name ofSoheduled Tribes no,
1
1 Korwa
2 Lohara or Lohra
3 Mahli
4, Santal
1 Korwa
2 Mahli
3 Santal
1 Chik Ba.rait
2 Karmali
3 Xhond
4, Xorwa.
5 Lohara or Lohra
6 Mahli
7 Oraon
8 Santal
I Santa!
I Santal
1 Xharia
2 Mahli
3 Oraon
Mother·tongue and total number of persons returned as speaking a language
Total spJakers subsidiary to the mother· tongue
,-__.A._--. ,-__ .A. __ -.
Subsidiary language
Males Females Males Females
2 4 5 6
DJORIAHCHAL-RURAL
.M;other-iongue -i. Hindi
2
60 57 SantaJi (F·I)
106 101
6 8 2 Santali (F·2)
Mother-tongue-2. Santali _
4
1
4,035 4,266 2,057 1,518 Hindi (M·2,057, F-l,5I8)
GIRIDIH ANOHAL-RURAL
Mother-tongue-i. Hindi
67 67
33 58
25 9
19 3
289 330
2 4,
245 331 48 English (M-I), SantaJi (M.47)
Mother-tongue - 2. Magahi/ ldagadhi
9
Mother-tongue-3. SantaU
3,967 3,622 7lS 598 Hindi (M·7l8, F·598)
BENGABAD ANORAL-RURAL
Mother-tongue-i. Hindi
42 40
)7 14
1

120
TABLE ST-I-MOTHER-TONGUg AND BILINGUALISM FOR SCHEDULED TRIBES-contd.
Serial Name of Sohed.uled Tribes no.
1
1 Lohara or Lohra
2 Mahli
3 Oraon
1 Munda
1 Santa!
1 Bedia
.2 ltharia
3 :Mahli
4 Munda
5 Santa!
1 ltharia
2 Oraon
1 Munda
1 Mahli
2 Santa! . ..
1 Gore.it
.2 Kbond
Mother-tongue and total number of persons returned as
Total speakers speaking a language subsidiary to the Subsidiary ~e
mother-tongue ~ .r----A----~ ltaIes Females Males Females
2 3 4 5
BENGABAD ANCHAL-RURAL-concld.
(16
1
1
18
64
7
Mother-tongue-S. Magahl/Magadhl
Mother-tongue-a. Mundarl
Mother .. tongue-4. Santali
6
4,5~8 5,063 2,2(}2 2,224 Hindi (M-l,080, F-915), Magabi/Magadhi (1\1-1,122, F-l,309).
GANDE ANORAL-RURAL
Mother-tongue-i. Hindi
3
1 1 English (l\[·I)
59 45
5
42
.2
1
46
.2
•
I English (M-l)
Mother-tongue -2. Kurukh/Oraon
.2 • . Hindi (M-.2)
Mother-tongue-S. MlUlclarl
I •. Hindi (M-1)
lIIother-tongue-4. SantaU
69 63
121
8,070 677 1,381 Hindi (M-677, F-l,381)
DUMRIANOHAL-RURAL
Mother-tongue -i. Hindi
16
129

12i
TABLB ST-I-MOTHBR-TONGUB AND BILINGUALISM FOR SCHEDULBD TRIBBS-conttl.
Serial Name of Scheduled Tribes no.
1
3 Lohara or Lohra
4 Mahli
5 Oraon
6 Santal
1 Munds
1 Birhor
2 Santal
1 Birhor
2 Earmali
3 Ehond
4 Lohars or Lohra
5 Mahli
6 Munds
7 Unclassified
1 Orson
1 Santsl
1 Ka.rxnali
2 Ehond
3 Korwa
Mother.tongue and total number of persons returned as
Total spea.kers speaking a. language subSidiary to the
mother.tongue Subsidiary language
,...___.A._~ t A.. __ .....
Males Females Males Females
2 3 Ii 5 6
DUMRI ANCHAL-RURAL-concla.
8
42 49
4 1
28
Mother-tongue-S. Jlundarl
2 • . English (M·2)
Mothar~tongue -3. SantalJ
13 12
4,339 4,120 1,526 2,230 Hindi (M·l,526, F· 2,230)
NAWADIH AMOBAL-RURAL
MotheJ:-tongue-1. Rlndl
4
10 5 o Santali (M·o)
64 71
10 13
243 231
61 62
2 46
3,855
191
34
77
Mothe.r-tongue-.2. Kurukh!oraon
3
MiIIiher-tongue-B. Santall
3,908 747 1,338 Hindi (M·747, ll'.1,338)
PIRTANR ANORAL-RURAL
Mothel'l-tongue-i. Hindi
231 1 • • English (M.I)
44
66 ..

122 TA'BLE ST-I-MOTHER-TONGUE AND BILINGUALISM FOR SCHEDULED TRIBES-concld.
Serial Name of Soheduled Tribes no.
1
4 Lohara. or Lohra
5 Mahli
6 OraOn
1 Karmali
1 Karmali
2 Mailli
3 Santal
Mother-tongue and total number of persons returned as
Total speakers speaking a language subSidiary to the
mother-tongue r-~-.. r-____,A---.
Males Females Males Females
2 3 4 5
PIRTANR ANCHAL-RURAL-concld.
7
207 202
2
Subsidiary language
6
Mother.tongue - 2. Magahl/Magadhl
72 156
Moth8J!-tongue-S. Santali
683 594
21
8,727 8,521 2,147 3,140 Hindi (M-2,147, F-3,140)

123
TABLE ST-II-PERSONS NOT AT WORK CLASSIFIED BY SEX AND TYPE OF AOTIVITY FOR SCHEDULED TRIBES
Persons employed Persons seeking before but now
Total non-working popu- Full time employment for out of employment Others lation students the first timo and seeking work
Name of Scheduled Tribes r--__ A ___ -. r-A-_-. r--A---. r__..A.---. .-__ ........A-__ -.
Persons Males Females Males Females Males Females Males Females Males Females
1 2 3 4 5 6 7 8 9 10 11 12
HAZARIBAGH DISTRICT-TOTAL
ALL SCHEDULED TRIBES 120,039 51,302 68,737 5,032 685 412 13 106 11 45,752 68,028
1 Baiga 42 22 20 22 20 2 Banjara 1 1 1 3 Bedia 9,712 3,590 6,122 381 39 4 1 17 3,188 6,082 4 Bhumij 2 2 1 1 5 Birhor 582 270 312 22 248 312 6 ChikBaraik 19 8 11 3 2 1 4 9 7 Gond 848 370 478 63 3 32 3 5 1 270 471 8 Gorait 108 36 72 3 33 72 9 Ho 33 26 7 1 25 7
10 Karmali 7,972 3,523 4,449 526 35 46 3 19 2,932 4,411 11 Kharia 49 32 17 2 1 1 29 16 12 Kharwar all 104 207 4 15 100 192 13 Khond 441 173 268 18 155 268 14 Kisan 1 I 1 15 Korwa 21 18 3 2 16 3 16 Lohara or Lohra 437 177 260 27 9 1 149 251 17 Mahli 2,062 967 1,095 130 15 (l 3 8 823 1,077 18 Munda 12,955 5,416 7,539 664 172 48 1 30 4,674 7,366 19 Oraon 6,995 3,169 3,826 346 136 13 2 8 1 2,802 3,687 20 Parhaiya '406 207 199 207 199 21 Santal 74,481 32,405 42,076 2,655 246 263 15 9 29,472 41,821 22 Sayar 8 4 4 1 3 4 23 Unclassified 2,553 783 1,770 184 11 598 1;759
HAZARIBAGH DISTRICT-RURAL
ALL SCHEDULED TRIBES 116,901 49,936 66,965 4,832 524 346 10 74 10 44,684 66,421
1 Baiga 42 22 20 22 20 2 Banjara I I 1 3 Bedia 9,690 3,579 6,111 379 39 3 17 3,180 6,071 4 Birhor 582 270 312 22 248 312 5 Chik Baraik' 9 3 6 3 6 6 Gond 116 54 62 5 1 1 48 61 7 Gorait 108 36 72 3 33 72 8 ,Ro 24 22 2 I 21 2 9 Karmali 7,662 3,353 4,309 476 31 41 3 8 2,828 4,275
10 Kharia 49 32 17 2 1 I 29 16 II Kharwar 311 104 207 4 15 100 192 12 Khond 441 173 268 18 155 268 13 Korwa 14 14 14 14 Lohara or Lohra 419 176 243 26 9 I 149 234 15 Mahli 2,033 949 1,084 127 ).5 5 3 8 809 1,066 16 Munda 11,552 4,758 6,794 616 98 35 1 19 4,088 6,695 17 Oraon 6,574 3,049 3,525 326 74 2 2 3 I 2,718 3,448 18 Parhaiya 406 207 199 207 199 19 Santal 74,864 32,372 41,992 2,644 230 260 15 9 29,453 41,753 20 SaYar 1 1 I 21 Unclassified 2,503 762 1,741 183 II 578 1,730

124
TABLE ST-II-PERSONS NOT AT WORK CLASSIFIED BY SEX AND TYPE OF ACTIVITY FOR SCHEDULED TRIBES--contd.
Persons employed Persons seeking before but now
Total non-working popu- Full time employment for out of employment Others lation studE'nts the first time and seeking work
Name of Scheduled Tribes r----.A.----. r------.A.---. r-_.A.---. r-___.A._ -. r-__.A.~ Persons Males Females Males Females Males Females Males Females Males Females
1 2 3 4 5 6 7 8 9 10 11 12
HAZARIBAGH DISTRICT-URBAN
ALL SCHEDULED TRIBES 8,188 1,366 1,7"72 200 161 66 8 32 1 1,068 1,607
1 Bedia 22 11 11 2 1 8 11 2 Bhumij 2 2 1 1 3 Chik Baraik 10 5 5 3 .2 1 1 3 4 Gond 732 316 416 58 2 32 3 4 I 222 410 5 Ho 9 4 5 4 5 6 Karmali 310 170 140 50 4 5 11 104 136 7 Kiss.n 1 1 1 8 Korwa 7 4 3 2 2 3 9 Lohara or Lohra 18 I 17 1 17
10 Mahli 29 18 11 3 1 14 11 11 Munda 1,403 , 658 745 48 74 13 11 586 671 12 Oraon 421 120 301 20 62 11 5 84 239 13 Santal 117 33 84 11 16 3 19 68 14 Sayar 7 4 3 1 3 3 15 Unclassified 50 21 29 1 20 29
Mandu Anchal-Rural
All Soheduled Tribes . , 6,12-2 2,986 8,186 147 12 11 2,778 3,174
1 Birhor 13 13 13 2 Munda 1,283 586 697 40 1 3 543 696 3 Oraon 444 178 266 19 8 1 158 258 4 Santal 2,383 1,261 1,122 1 1,260 1,122 5 Karmali 933 432 501 34 1 4 394 500 6 Bedia 1,016 438 578 52 2 386 576 7 ChikBaraik 3 3 3 8 Gond 33 11 22 1 10 22 9 Kharis. 6 6 2 1 3
10 Unclassified 8 8 8
Nagrl (Churehu) Anehal-Rural
All Scheduled Tribes .• 5,626 2,242 3888 150 80 5 1 2,092 3,'847
1 Munda 597 272 325 35 4 237 321 2 Bo 7 5 2 1 4 2 3 Oraon 342 129 213 27 6 .2 1 102 204 4 Bedia 615 270 345 15 1 255 344 5 Bantal 3.301 1,257 2,044 45 15 1,212 2,029 6 Gond 17 8 9 2 6 9 7 Karmali 649 274 375 24 1 2 250 372 8 Lohara or Lohra 26 26 3 23 9 Mahli 71 27 44 1 1 26 43
Ba,mgarh Anchal-Rural
All Scheduled Tribas .. 5,281 2,145 8,186 824 2a 4. a s 1,814 8,112
1 Birhor 7 7 7 2 Munda 2,127 863 1,264 153 8 1 710 1,255 3 Qraon 175 88 87 12 .2 76 85 4 Santal 143 76 67 20 1 1 55 66 5 Xarmali 767 408 359 104 7 4 1 300 351 6 Badia 1,673 550 1,123 10 3 Z 538 1,120 7 'O'nolassi1led 389 153 236 25 1 128 235

125
TABLE ST-I1-PERSONS NOT AT WORK CLASSIFIED BY SEX AND TYPE OF ACTIVITY FOR SCHEDULED TRIBES-contd.
Persons employed Persons seeking before but now
Total non-working popu- Full time employment for out of employment Others la.tion students the first time and seeking work
Name of Soheduled Tribes r- .A. ~ ,---"--~ ,---"---. r-___""-. ,___....--~ Persons Males Females Males Females Males Females Males Females Males Females
1 2 3 4 5 6 7 8 9 10 11 . 12
Gola Anchal-Bural
All Scheduled Tribes .• 8.619 8,114 5,505 571 68 1 1 2,541 5,437
1 Munda 1,743 620 1,123 91 9 1 528 1,114 2 Oraon 38 23 15 14 9 15 3 Sa.nta.l 2,420 874 1,546 128 27 746 1,519 4 Karma.li 1,427 586 841 117 6 469 835 5 Mahli 161 70 91 20 50 91 6 Bedia 2,560 937 1,623 201 26 1 735 1,597 7 Karwa 4 4 4 8 U nolassitied 266 266 266
Gumla Anehal-Bural
All Seheduled Tribes .. 6,905 2,771 4,134 806 54 2 2,463 4,080
1 Birhor 37 13 24 13 24 2 Munda 616 252 364 21 3 2 229 361 3 oraon 141 60 81 14 6 46 75 4 Bantal 5,227 2,104 3,123 204 35 1,900 3,088 5 Karmali 791 293 498 48 8 245 490 6 Lohara or Lohra 4 4 4 7 Ma.hli 89 45 44 19 2 26 42
Paterbar Anchal-Bural
All Seh8duled Tribes .• 6,280 2,896 3,384 248 29 1 2,647 3,855
1 Munda 234 114 120 18 14 96 106 2 Ora.on 21 12 9 1 11 9 3 Santal 5,056 2,395 2,661 180 12 2,215 2,649 4 Karmali 531 250 281 32 1 1 217 280 5 Mahli 33 12 21 12 21 6 Badia 315 113 202 17 96 202 7 Unolassi1ied 90 90 2 88
~~mar Anehal-Bural
All Scheduled tribes .• 2,680 1,268 1,362 229 80 ,317 722 1,882
1 Munds. 334 172 162 41 3 32 99 159 2 Oraon 5 5 2 3 3 Bantal 1,801 849 952 144 20 251 454 932 4, Karmali 374 191 183 35 2 34 122 181 5 Lohara or Lohra 12 5 7 5 7 6 Mahli 85 44 41 9 3 ... 35 38 7 Bedia' 19 7 12 7 12
J'arilllh Anchal-Bural
All Soheduled Tribes .. 10,848 8,771 7,077 626 18 8,145 7,059
1 Munds 173 60 113 13 1 47 112 2 Oraon 3 3 3 3 Santa! 9,646 3,237 6,409 468 10 2,769 6,399 4 Karmali 74 41 33 10 31 33

126
TABLE ST-I1-PERSONS NOT AT WORK CLASSIFIED BY SEX AND TYPE OF AOTIVITY FOR SCHEDULED TRIBES-contd.
Persons employed Persons seekmg before, but now
Total non-workIng popu- Full tIme employment for out of employment Others lattOn students the first tIme and seeklng work
Name of Scheduled TrIbes r- ....... r---j.._--....... r---j.._~ r--_.A._--. ...--A---. Persons Males Females Males Females Males Females Males Females Males Females
1 2 3 4 5 6 7 8 9 10 11 12
Jarldih Anchal-Rural-concl!l. 5 Lahars. or Lahra. 6 3 3 3 3 6 Mahb 510 234 276 42 5 ',' 192 271 7 Gorrut 5 5 5 8 UnclassIJied 431 196 235 93 2 103 233
Patratu Anchal- Rural All Scheduled Tribes 9,023 3,381 5,692 315 32 8 34 2,979 5,660
1 Btrhor 21 10 11 10 11 2 Munda 2,454 894 1,560 82 5 12 800 1,555 3 OraOn 986 525 461 37 1 1 2 485 460 4 Santal 184 184 184 5 Karmah 844 319 525 45 5 4 270 520 6 Lohara or Lohra. 105 41 64 4 5 37 59 7 Mahh 46 37 9 2 2 35 7 8 Bedia 3,123 1,130 1,993 80 8 2 15 1,033 1,985 9 Khario. 5 5 5
10 Goralt 12 12 12 11 Unclassdied. 1,243 370 873 65 6 1 304 867
Tisri Anchal-Rural Al1 Schedilled Tribes .. 8,370 1,507 1,868 120 15 1,887 1,848
1 Kharwar 175 46 129 15 46 114 2 Santal 3,189 1,461 1,728 120 1,341 1,728 3 Lohara or Lohra 6 6 6
Deori Anchal-Rural All SCheduled Tribes .. 3,278 1,621 1,657 204 14 1,417 1,643
1 Santal 3,173 1,553 1,620 195 14 1,358 1,606 2 Loharo. or Lohra 44 28 16 7 21 16 3 Mahh 59 38 21 2 36 21 4 Korwa 2 2 .2
Giridih Anchal-Rural All Scheduled Tribes .. 4,503 1,826 2,677 112 18 7 3 8 1,699 2,656
1 Santal 3,995 1,655 2,340 105 18 2 1,548 2,322 2 Lohara or Lohra 14 14 3 11 3 Chtk Baralk 3 3 3 4 Khond 74 16 58 16 58 5 Mahh 323 107 216 4 5 3 8 90 .213 6 Oraon 4 4 4 7 Karmah 90 34 56 34 56
Bengabad Anchal-Rural All Scheduled TrIbes 3,807 1,863 1,944 209 8 1,654 1,936
1 Munda 6 1 5 1 1 4 2 Santal 3,687 1,803 1,884 203 7 1,600 1,877 3 Lohara or Lohra 17 8 9 3 5 9 4 Mahh 59 28 31 1 27 31 5 Oraon 2 2 2 6 Kharla 36 21 15 21 15

127
TABLE ST-II-PERSONS NOT AT WORK CLASSIFIED BY SEX AND TYPE OF ACTIVITY FOR SCHEDULED TRIBES-concld.
Persons employed Persons seeking befote but now
Total non-working popu- Full time employed for out of employment Others Name of Scheduled Tribes lation students the first time and seeking work ,-____ .A. ____ ,
r---.A.--, ,--_ ...... --, ,-_ ...... _- ..... r---...... _, Persons Males Females Males Females Males Females Males Females Males Females
1 2 3 4 5 6 7 8 9 10 11 12
Gande Anchal-Rural
All Scheduled Tribes •• 6,914 3,182 3,732 388 46 6 9 2,7.88 3,677
1 Munda 5 5 5 2 Santal 6,837 3,142 3,695 385 45 6 9 2,751 3,641 3 Mahli 70 35 35 3 32 35 4 Kharia 2 2 1 .
Durnrl Anchal-Rural
All Scheduled Tribes _. 3,689 1,738 1,951 118 12 1,620 1,939
1 Santal 3,475 1,646 1,829 106 12 1,540 1,817 2 Lohara or Lohra 8 8 8 3 Birhor 25 13 12 13 12 4 Khond 120 50 70 5 45 70 5 Mahli 52 29 23 7 22 23 6 Gorait 8 8 8 7 Oraon 1 1 1
Nawadlh Anchal-Rural
All Scheduled Tribes •• 3,271 1,499 1,7'72 38 1 1,461 1,771
1 Munda 64 26 38 2 24 38 2 Santal 2,926 1,354 1,572 28 1 1,326 1,571 3 Lolial',L or Lohl'.1 2 2 2 4 Khond 56 24 32 24 32 5 Mahli 184 90 94 8 82 94 6 Karmali 5 3 2 3 2 7 Unclassified 34 34 34
Pirtanr Anchal-Rural
All SchedUled Tribes _ . 8,415 3,889 4,526 223 11 3,666 4,505
1 Santal 7,369 3,388 3,981 187 11 3,201 3,970 2 Khond 73 34 39 10 24 29 3 Mahli 184 99 85 4 95 85 4 Korwa 7 7 7 5 Karmali 7iH 360 421 22 338 421 6 Sayar .~. 1 1 1

EXPLANATORY NOTE
Information relating to the nature and number of houses was collected during the period of houselistingl in September-October, 1960 in the Houselist Form. The data processed from these lists were compiled under the E-Series tables. Although none of the E-Series tables is reproduced in the Handbook, the information collected in the houselists is glven in two tables: {i} classification of rural population by size class of villages determined by the number of houses in them, and (ii) vil1agewise industIi_al data.
Classification of rural population living in vlllages of various sizes The-villages are clasiified into seven categories
by the size class of number of houses contained in each. These are :
(i) 5 and below (U) 6-15
(iii) 16-25 (v) 36-50 (iv) 26-35 (vi) 51-100
(vii) Above 100
Villagewise Industrial data I
This table gives information about the number of industrial establishments in each village. The name of the village is followed by the three-digit code number of the industrial establishment indicating the Division, Major Group and Minor Group of the Indian Standard Industrial Classification. A hst of the Divisions, Major Groups and Minor Groups together with their code numbers occurring in the table is reproduced in the Annexure to this note. Figures within brackets indicate the number of establishments relating to the industry concerned in the village. Data relating to towns have been given separately.

129
ANNEXURE
STANDARD INDUSTRIAL CLASSIFICATION
Major Group (Code)
Desoription Minor Group (Code)
1 2
Ditlirioft 2 II: 3-ManuJaclUring-
20 Food.cv8/J-
3
Produotion of rioe, atta, Flour, eto., by 200 'Milling Dehusking and Processing of orops and foodgrains
Slaughtering, preservation of meat and 204 fish and oanning of flsh
Produotion of bread, bisouits, oake and 205 other bakery products
Produotion of edible fats and oils (other 207 than hydrogenated oil)
Production of other food products such 209 as swe~tmeat and condiment~, muri, chira, khoi, cocoa, chocolate, toffee, lozenge
21 860er0ge8-
Production of distilled spirits, wines, liquor 210 from alcoholio malt, frutis and malts in distillery and brewery
Produotion of country liquor
Production of indegenous liquor suoh as toddy. liquor from mahua. palmjuioe
Produotion of ice
Production of ice·cream
22 a!obacco Produ",-
Manufacture of bidi
23 !I'u:tUe-Oouon-
Cotton, ~ng, oleaning, preasing and baling
Cotton spinning (other than in mill)
Cotton w&a'ring in handloOJDB
211
212
215
216
220
230
231
235
Manufacturing of I:Aadi textile in hand. 236 looms
Printing of ootton teztUs 237
Manufacture of other products like rope, 244 cordage from jute and similar figure such as hemp, Kesta
6 (Can.) C-9
Major Group (Code)
Description Minor Group (Code)
1 2
Dif1ittion 2 d: 3-MamV'aceu,.ing-oontd.
26 T8(J)'ile-Sil1c-
Spinning of silk other than in mills
Manufaoture of silk oordage, rope and twine
27 Tell]tik-MiBcellaneouB-
Manufacture of oarpet and all other simi. lar type of .textile produots
Making of. textile garments inoluding raincoats and headgear
Manufacture of made up textile goods ex· cept wearing apparel suoh as ourtains, pillow cases, bedding materials, mat· tress, textile bags
28 ManUfacture of wood and wooden productlJ-
Sewing and planning of wood
Manufactur of wooden furniture and fix. tures
Manufacture of structural wooden goods (inoluding treated tiJnber) such as beams, posts, doors, windows
Manufaoture of wooden industrial goods other than transport equipment such as bobbin and similar equipment and fixtures
Manufacture of other wooden products suoh as utensils, toys ar~wares
Manufacture of materials from cork, bamboo, oane, leaves and other allied produots
Manufacture of other wood and allied produots not oovered above
Manufacture of produots, suoh as paper, bags, boxes. oards, envelopes and moulded pulp goods from paper board and pulp
3
262
266
270
273
274
.280
281
282
283
!88
289
29.2

130
ANNEXURE--contd.
STANDARD INDUSTRIAL CLASSIFICATION
Major Group (Code)
Desoription
2
Minor Group (Code)
3
Di'IJision 2 cb 3-ManuJacturing-contd.
30 Printing and Publishing-
Printing and publishing of books 301
All other types of printing inoluding 302 lithography, engraving, etching, block making, and other work oonnected with printing industry
All types of binding, stitching, sizing and 303 other allied work connected with binding industry
31 Leather and Leather ProductB-
Currying, tanning and finishing of hides 310 and skins and preparation of finished leather
Manufaot,ure of shoes and other leather 311 footwe&l'
Manufaoture of leather products (except 313 those oovered by oode nos. 311, 312) suoh as leather upholstery, suitoases, pooket books, oigarette and key -cases, purses, saddlery, whip and other arti-oles
Repair of shoes and other leather foot· 314 wear
3'2 Rubber. Petroleum and Ooal Product,-
Manufacture of tyres and tubes 320
33 Ohemicals and Ohemical Produr;ts-
Manufacture of dyes, paints, oolours and 331 varnishes
Manufacture of fertilizers 332
Manufacture of ammunition, explosives /333 and fire works
Manufacture of medioines, pharmaoeutical 335 preparations, perfumes, cusJ)letics and other toilet preparations except soap
Manufacture of soap and other washing 336 and cleaning oompounds
Manufaoture of other chemicals and 339 chemical produots not covered above (inoluding inedible oils and fats)
Major Group (Code)
1
Description
2
Division 2 cb 3-ManuJaclUrlflg-Oontd.
34-35 Non-metallic MineraZ Products other than Petroleum and Ooal-
Manufaoture of struotural olay produots suoh as bricks, tiles
Manufacture oflime
Manufacture of structural stone goodil, stone dressing and stone orushing
Manufaoture of stonewares, other than images
Manufaoture of mioa prod~ots ,
Manufacture of earthenware and earthen pottery
Manufaoture of earthen image, busts and statues
Manufaoture of glass and glass produots exoept optioal and photographio lenses and glass produots oovered above
36 BaBic M eeals and their Products etKIcept Machinery and Transport .ll1,qulpment-
:Manufacture of brass and bell metal products
Manufacture of metal produots (other than of iron brass, bellmetal and aluminium) suoh as tin oan
:Minor Group (Code)
S
340
342
343
344
348
350
366
367
365
367
Enamelling, galvanising, plating (inoluding eleotroplating) polishing and welding of metal p~ducts
368
Manufaoture of sundry hardwares suoh as G. I. pipe, wire net, bolt, screw, buoket outlery (This will also inoluda the manufacture of sundry ferrous engineering produots done by jobbing engineering ooncerns whioh oannot be classified in major groups 36, 37, 38 and 39)
37 Machinery (All kinds other than TranspoJ;t and Electrical equipment)-
Manufaoture of eleotronio equipment suoh as radio, miorophone
lItLmufaoture of eleatrie tna.<lb.inery a.nd apparatus, appliances not speoified above
369
878
379

131
ANNEXURE-concld.
STANDARD INDUSTRIAL CLASSIFICATION
Major Group (Code)
1
Description
2
DWirion 2 c6 3-ManuJacturing-contd.
38 ~ransport Z!l"ipmen~
Manufacture assembly and repairing of locomotives
Manufacture of wagons. coaches, tram. Ways and other rail road equipment other than that covered by code no. 363
Manufacture and assembling of motor vehicles of all types (excepting motor engines)
Repairing and servicing of motor vehicles
Repairing of bicycles and tricycles
Minor Group (Code)
3
380
381
382
384
388
Major Group (Code)
1
Description
2
Divi8ion 2 c6 3-Mantifacturing-conold.
Manufacture of other transport equip. ments not covered a.bove such as ani. mal drawn and hand drawn vehicles
39 Miscellaneous Manufacturing Intluetrie_
Assembling and repairing of watohes and clocks
Manufaoture of jewellerY, silverware and wares using gold and other precious metals
Manufacture and tuning of musioal ins. truments
Manufaoture and repair work of goods not assignable to any other group.
Minor Group (Code)
3
389
392
393
394
399

1~2
CLASSIFICATION OF RURAL PO?ULATION LJ;VING IN VILLAGES OF VARIOUS SIZES
P.opulation living in villages containing houses Total rural
DistrictfAnchal population r- .A.
5 and below 6-15 16-25 26-35 36-50 51-100 Above 100
1 2 3 4 5 6 7 8 9
HAZARtBAAJI •• 2.195.227 10.976 85,629 140,844 164,268 242,227 518,029 1,088,754
1 Barhi 53,078 207 1,163 2,206 4,409 6,801 13,651 24,641 2 Barka~Pa 46,620 227 1,334 1,845 3,225 .6,751 ~,413 24,825 3 Bagodlj,;t' 79,401 114 1,089 3,131 2,860 5,480 15,845 50,882 4 Bishungarh .. 54,668 125 1,413 2,] 72 2,830 4,763 14,554 28,811 5 Hazariba¥h •. 44,663 40 439 1,664 2,487 3,259 11,553 25,221
6 Ka$amsandi 51,171 173 1,234 2,484 2,341 4,052 9,~18 31,269 7 Ichak ., 47,108 297 921 1,263 3,201 5,403 11,093 24,930 8 Barkagaon 40,569 71 602 827 1,344 1,986 10,006 24,743 » Kere4ari 34,185 32 975 1,124 1,236 2,363 7,957 20,498
10 Tandwa 31,802 874 1,084 *.321 02,810 9,102 14,611
11 Mandu 60,374 47 331 1,071 1,249 2,403 8,197 47,076 1.2 Nagri(ChurQbu) 38,737 49 724 1,214 2,154 1,959 10,117 22,520 13 Ramgarh 68,139 70 195 663 554 1,6~8 9,915 55,054 14 Jainagar 44,290 254 2,003 4,148 5,680 8,945 9,113 14,147 15 Gola 57,219 57 322 820 279 2,.697 11,014 42,030
16 Gumia 70,730 164 1,264 1,530 2,089 5,790 16,398 43,495 17 Peterbar 45,379 14 27 783 1,386 2,640 11,162 29,367 18 Kasmar .. 33,818 30 114 461 1,352 2,788 9,148 19,925 19 Jaridih 53,307 275 357 1,152 2,520 7,209 41,794 20 Kodarma 69,037 179 1,587 2,786 2,120 4,353 19,042 38,970
21 Markacho 41,736 242 1,628 4,740 4,820 2,625 10,793 16,888 22 Patratu 59,488 14 107 791 984 2,771 12,376 42,445
• 23 Chauparan 64,375 470 3,359 6,226 8,371 12,695 19,9« 13,310 24 Itkhori 61,423 602 4,704 8,307 8,068 7,264 14,052 18,426 25 Hunterganj •• 51,520 404 3,000 4,222 5,720 8,687 14,158 15,329
26 Pratap Pur ., 40,053 447 3,464 4,923 6,168 6,550 11,430 7,071 27 Chatra 44,494 513 4,651 6,476 6,767 8,271 12,242 5,574 28 Simaria 46,693 414 2,267 3,952 4,058 4,917 19,008 12,077 29 Gawan 41,653 251 2,013 3;127 2,987 3,831 7,021 22,423 30 Tisri 35,822 463 3,344 3,703 4,269 7,028 8,419 8,596
31 Satgawan 25,562 319 1,731 2,481 2,744 4,142 9,200 4,945 32 Jamua 82,629 871 7,420 9,717 10,575 16,624 16,239 21,183 33 Deori 56,562 800 6,251 8,340 5,428 8,063 13,761 13,919 34 Dhanwar 75,297 420 4,359 8,187 10,547 11,337 18,337 22,110 35 Birni 48,925 293 3,474 5,384 5,713 7,085 18,625 8,351
36 Giridih 87,313 407 1,999 3,191 4,697 6,232 18,688 52,099 37 Bengabad 48,921 638 5,378 8,919 5,048 12,747 8,967 7,224 38 Gande 56,684 516 4,162 6,825 9,682 12,879 15,531 7,089 39 Dumri 71,621 302 ~,170 3,799 4,122 7,947 22,354 30,927 40 Nawadih 62,369 70 173 1,300 1,184 2,230 10,549 46,863'
41 Pirtanr 41,307 370 3,016 3,773 6,659 8,087 10,615 8,787 +2 Bermo 26.485 73 328 388 76* l,623 23,309

183
VRLAGEWIsE INDUSTRIAL DATA
HAZARUiAGR DISTRl'OT
TOTAL.. 200(281); 2M(3); 205(29); 207(591) ;209(984); 2H1(1); 211(5) ; 212(10); 215(3); 216(2); 220(123) ; 230(2) ; 231(1) ; 235(658); 236(8) ; 237(51 ; 24-t(1l); 262(3) ; 266(7); 270(4); 273(998) ; 274(3) ; 280(18) ; 281(46) ; 282(66) ; 283(307); 284(14); 288(764); 289(389); 292(7), 301(9); 302(2); 303(1); 310(16); 311(294); 313(7); 314(6) ; 320(1); 331(1);
303(1) I 310(14) ; 311(243}; 3~3(6); 314(4); 33lJl); 332(2); 333(3); 3-36(3); 340(20); 342(6); 343{;l); 344(2) ~ 348(415tlj; 350(2010); 357(2) ; 365(97) ; 368(1) ; 369(947) ; 379(3) ; 380(1) ; 381(2) ; 382(3) ; 384(14) ; 388(57); 389(2); 392(2) ; 393(586); 394(21); 399(18),
33.9(2); 333(4'; 335(3); 336(10) ; 339(2); URBAN •. 340(23) I 342(lO); 343(3) ; 344(2) ; 348(4803);
200(105) ; 204(3) ; 205(22); 207(5) ; 209(380) 212(1); 215(3); 216(2); 220(61); 230(2) 231.(1) 235(3) i: 237{6); 262m; 270(1) 273(204) ; 274(2); 280(7); 281(16); 282(14) 283(1); 284(3); 288(29); 289(41); 292(3) 301(9); 302(1}; 310(2); 311(~ll i 313(1) 314(2); 320(1); 333(1) i 335(11); 336(7) 339(2); 340(3}; 342(4); 348(663); 350(73) 350(1); 357(2); 366(16); 367(3); 368(3) 368(91); 3'78(4); 379(5); 380(2); 384(46) 388(101) ; 389(1); 392(16); 393(113); 394(4). 399(11).
350(OO8S); 855(1) ; 357(4) ; 365(113}; 367(3); 368(4}; 369(103S) ; 378(4); 379(8); 380(3); 3&1{2) ; 382(3); 384(60) ; 388(158); 389(3); 392(18) ; 393(699); 394(25); 399(29) ;
R'C1UL . . 200(176) ; 205(7) ; 207(586) ; 209(6l>4) ; 210(1) ; 211{0} ; 212(9) i 220(62) ; 235(655) ; 236(8)
244(H) ; 262(2) ; 266(7) ; 270(3) ; 273(794) ; 274(1) ; 280(1l); 281(30) ; 282(52) ; 283(306); 284{1l); 2S8(735} ; 289(848) ; 292)(4) ; 302)1);
SADAR SUBDIVISION
Total
Rural
•. 200(128) i 204(3) ; 205(19) ; 207(279) ; 209(481); 210(J); 211(4); 212(2); 216(2); 216(2}; 220(69); 230(2) ; 231(1} ; 235(399); 236(8} ; 237(»}; 244(11); 262(1); 266(6} 270(3}; 273(478); 274(1) ; 280(11) ; 281(34); 282(35; 289(133); 284(6); 288(310) ~ 289(131); 292(1) ; 301(6) ; 302(2} ; 303(1); 310(9); 311(162); 313(6); 314(1); 320(1); 331(1); 332(2); 333(3); 335(3); 336(6); 340(8)'; 342(9); 348(514) ; 350(818) ; 356(1) ; 367(4); 365(84) ; 367(3) ; 368(3); 300(414); 318(3); 379(5); 380(2); 382(3) ; 384(20); 388(98); 389(2); 392(10) ; 393(373); 394(19); 399(21).
200(62); 205(7); 207(277); 209(298); 210(1), 211(4); 212(1) ; 220(43) i 235(396); 236(8); 244(11) i 262(1) ; 266(7) ; 270(3) ; 273(404); 274(1) ; 280(5); 281(23) ; 282(33) ; 283(133) ;
284(4) ; 288(291); 289(120); 302(1) ; 303(1) i 310(9) ; 311(138}; 313(6); 314(1); 331(1) ; 332(2); 333{2);, 336(2); 34.Q(6); 342(6); 348(135) ; 350(801); 357(2) ; 365(81) ; 368(1) ; 369(247) ; 379(3); 382(3); 384(1S) ; 388(34) ; 389(1) ; 392(2); 393(309); 394(16) ; 399(15) :
Urbs.n • • 200(66); 204(3) ; 205(12); 207(2) ; 209(183) i 212(1) i 215(2); 216(2); 220(26); 230(2); 231(1) ; 236(3) ; 231(2); 273(74) ; 280(6); 281(11) i 282(2); 284(2}; 288{l9); 289(11); .292(1); 301(6); 302(1); 311 (24); 320(1) i 333(1); 335(3); 336(4); 340(2); 342(3); 348(379) ; 350(17); 355(1) ; 357(2); 366(3); 367(3); 368(2); 369(47); 378(3); 379(2); 380(2); 384(15); 388(64); 389(1) 392(8); 393(64) ; 394(3) ; 399(6).
Barbl Anebal
Total • • 200(31; 209(5); 220(1).; 273(9); 280(1); 282(ll) J 283(1) ; 333(1); 350(33); 369(3); 388(3) ; 393(1).
LaM ., Barbi 200(2) ; 209(3) ; 220(1) ; 273(1); 280(1); 331(1) i 350(2-6); 388(2); 393(1); Bigaia 369(1); Ohampadih 273(2); Deoohanda
Barkatha Anehal
Total 2()0(2f. 207(26). 209(5) ; 273(19); 283(37); 288(17); 289(6); 310(2); 311(4); 340(4); 348{~); 3W(1l4); 3S5(2); 369(35); 384(1); 388(2) ; 393(13) ; 399(1),
Mauz&8 •• AIagdiha 273(1) ; 348(2) ; 369(4); Barahkatha 209(4); 273(4); 310(2); 311(1); 350(1); 369(4) ; 388(1); 393(7); 399(1); Barkaugaugo 207(4); 273(1) i 283(7); 350(19); Bssaria 311(1); 350(1); Basramo 283(2); Belkapi 288(1) i 289(1} ; 350(2) ; Bero K&lan (lllQ8 Bero 273(2) i 283(4); 350(25); 369(1) i
369(1); Dhaubat 273(1); Gatfria Karma 209(1) ; KolhiiakMan 282(3) ; 300(S) ; Kolhua Khard Aoi8Bjawab 273(1) ; 2"82(1); 283(1); Itonra 200(1) ; MahkoIa 350(4); Mahugara 27S{1); Orpa,l'ta 369(1); Padina 200(2) ; 209(1); RasoiaDhamna273(1); Romi273(1); Saraia 273(1) ; lljaina 388(1),
393(1) ; Birtnakl 288(2); 35'0(11); Buoha Pithauria 369(1); Oha.1kusa 2"89(1); 369(1); 393(1) ; Ch&ube 273(1) ; 369'(1) ; Chhuthari Katia 369(1) ; Ohorbandha 369(1) ; Ohotha 207(2); 369(3); Chuglamo 200(1) ; 207(3); 273(2) ; 369(1); Gaipahari 207(3) ; 350(3) i Gaira 283(10); 311(2); 350(13); 393(1); GangpaC'ho 28S(5) ; 350(6); 369{S) ; Gangtiahi 209(1); 340(1) ; 384(1) ; Gothar288(8) ; 369(1); 393(2); Jhurlhuti 207(4) ; 273(1); 350(3); 369(1); 388(1); Kaplta 207(1); 288(2) j 369(3); Kalighara 273(2); Kendua

184
VILLAGEWISE INDUSTRIAL DATA-conta.
Total
Rural
Urban
Mauzaa
Town
Barkatha Anehal-cOflCld.
CR. Thana no. 66) • 283(4) • 350(14). Kendua (R. Thana. no. 44); 283(1); Khara 207(1). Kha.ri 350(6). Kunhara Kalan 207(2). 273(1). Kunbara Khurd 207(2). 340(3) ; Laganwa 207(2); 369(1). Mango 289(1);
Barodar Anchal
200(16). 207(24) • 209(34); 220(5). 236(8) • 244(11); 270(1): 273(75) • 280(1); 281(16). 282(5); 283(34) ;.284(2). 288(25); 289(90); 310(3) ; 311(10) ; 340(1); 350(91); 365(1) ; 369(63); 388(8) • 389(1). 393(52).
200(8); 207(24); 209(15); 220(5); 236(8) ; 244(11) ; 270(1) J 273(63); 280(1); 281(16); 282(4) • 283(34); 284(2) ; 288(25); 289(90); 3IO(3). 3lI(9); 340(1). 350(83). 365(1) t 369(51) ; 388(3); 393(40).
200(8). 209(19) • 273(12); 282(1); 3U(1); 350(8) ; 369(12); 388(5) • 389(1). 393(12).
Amnari 244(U); 283(16). 311(1) ; 350(5). Anthadih 200(3); 209(2); 220(2); 273(4); 393(2); Aunra 270(1); 369(2); Bagodar 200(2); 209(1); 220(1). 273(2); 281(16). 282(3); 283(15) ; 284(2) ; 289(1); 350(10) ;. 369(8); 393(1); BaJak 207(10). 273(2); 369(2); 393(3); Balhedih 311(2); Band-
Barkisaraiya 200(8); 209(19). 273(12); 282(1); 311(1); 350(8); 369(12). 388(5);
Bls~ungarh Anchal
Total 200(5); 207(38); 209(8); 235(23); 273(32); 282(2) ; 283(2); 288(82); 289(16) • 311(43); 313(6) ; 350(116) ;. 365(34) • 369(52) • 382(1) ; 388(4) ; 393(36); 394(9) ; 399(5).
Mauz_ •• Acha.wamu 207(7) ; 273(8) • 283(2) ; 288(14) ; 289(3); 311(15); 350(32); 365(8); 369(9); 393(6); 394(9); Alpito 350(2); 369(1); Arjari 288(1). Banaso 369{S). Bandi 311(4); Bankharo 369(1); Bara 369(1); Barai 273(1i); Barkinarki 350(2); 369(5); Baudha 369(1). Beraharihara 288(13); 350(20); Bhelwara 369(1) ; Bhutabimurgaon 273(1) ; 288(7) ; Bishnu Garh 200(1); 235(1) ; 273(1); 365(24) • 393(27); 399(5); Chano 207(2); 282(1); 313(5); 369(3). 382(1); Cha.rnakhia 273(1) • Cherra 200(2); 209(3); 273(4) • 388(3); 393(1) • Chulfchuko 3U(1) ; Daharbhanga 288(6). Dharampur 207(1); 311(7); 350(6); 369(1); 393(1); Dango
Hazarlbagh ABabal
Total 200(32) • 205(11); 207(12) ; 209(92); 215(1); 220(12) ; 231(1) ; 235(4) ; 237(2) • 270(2) ; 273(38) ; 27W); 280(2); 281(9) ; 282(1); 283(1); 284(1); 288(1); 289(3); 301(4);
350(4); Maskedih 369(4) ; Heramgarh 369(1) ; Parbata 200(1); Balaia. 350(6); Balaidih 207(2) ; 369(2); Siladih 273(2) ; Tuio 365(2) ; 369(1); Turukbad .273(2); 283(8); 289(3); 350(1) ; 393(1).
kharo 340(1); Bangargi alia, Ala.kdih 200(1); 273(1); 288(1); 369(1); Banpura 369(3); Beko 207(12); 236(8); 273(7); 282(1); 288(6); 289(1); 369(8); Dharguli 273(3); 288(10); 350(9); 393(9). Dhibra 369(2). Dondlo 369(1); Dorio 273(7) J 393(1) ; Dumariatanr 289(6); Hesla 273(4) , Jarmune 200(1) ; 209(10) ; 220(2); 273(4); 280(1) ; 289(47); 369(2); 388(3); 393(19), Kacharpur 369(4) ; 393(1) ; Kailatanr 200(1); Karma 350(12); Keshwari 207(2); 273(4); 289(29); 311(4); 350(19); 369(1); Khamra 311(1); Khaskari 369(6) ; Ehetko 273(1); 369(1); Koiridih 209(2); 369'(2); 393(1); Kadar 273(2); Lukuiya 350(1); MOkamo 273(2); 369(2); Nagarkeshwari 273(1); 289(6); 310(2); 350(3); ParMia 283(3); 310(1); 311(1); Pathal Diha 369(1); 393(3); Pochri 273(1); Pokhari 288(8); 350(18); 865(1); 369(1); Purnidih 273(5); Sonturpi 350(6) ; Tirla 278(11) ; 369(4); Ulibar 273(1) ; Uno 273(1).
389(1) ; 393(12).
350(.2); Dumar 289(3); 350(10); 369(1); Dungo 369(1); Ghughulia 273(1); Godhea 369(1); Golgo 369(1);. Govindpur Xa.Ian 288(13); 311(10); 350(24) ; 169(1) ; Gundro 369(1); Hethlibodra 369(2); Jamni Jara 288(7); Jha.ria 209(3); 273(1); 388(1); 393(1); Xhamua 289(1); Xharki 207(6) J 235(15); 273(3); 369(2); Khama 288(1) J 369(2) ; Kirtodih 273(1) ; 36gel) ; Kolhu 369(2); Mangro 207(2); 273(1); 369(1); Marmo 207(3); 288(3); 311(1); 350(2) ; 369(1) ; Nayapur 288(10) ; Murko 369(1) ; Murumatu 288(6); 369(1) ; Nagi 311(3); 365(1); 369(1); Nawada 200(2); 207(17); 235(6) ; 273(3); 289(9); 369(1) ; Pharaohand 288(1) ; 369(1); Bamua 350(16); 369(1) ; Sarukudar 235(1) ; 273(1) ; 282(1) ; 311(2); 313(1); 365(1); S69(1) J TiIaiya 209(2) I 273(1) ; Unohaghana 369(1) ; Upraili Murgaon 369(1).
302(1); 303(1); SlI(18); 331(1) , 333(1) , 335(2) ; 336(1); 348(1); 350(58); 355(1); 365(3); 367(1); 369(29); 378(2); 384(6), 388(43); 392(5); 393(41) ; 394(2); 399(1).
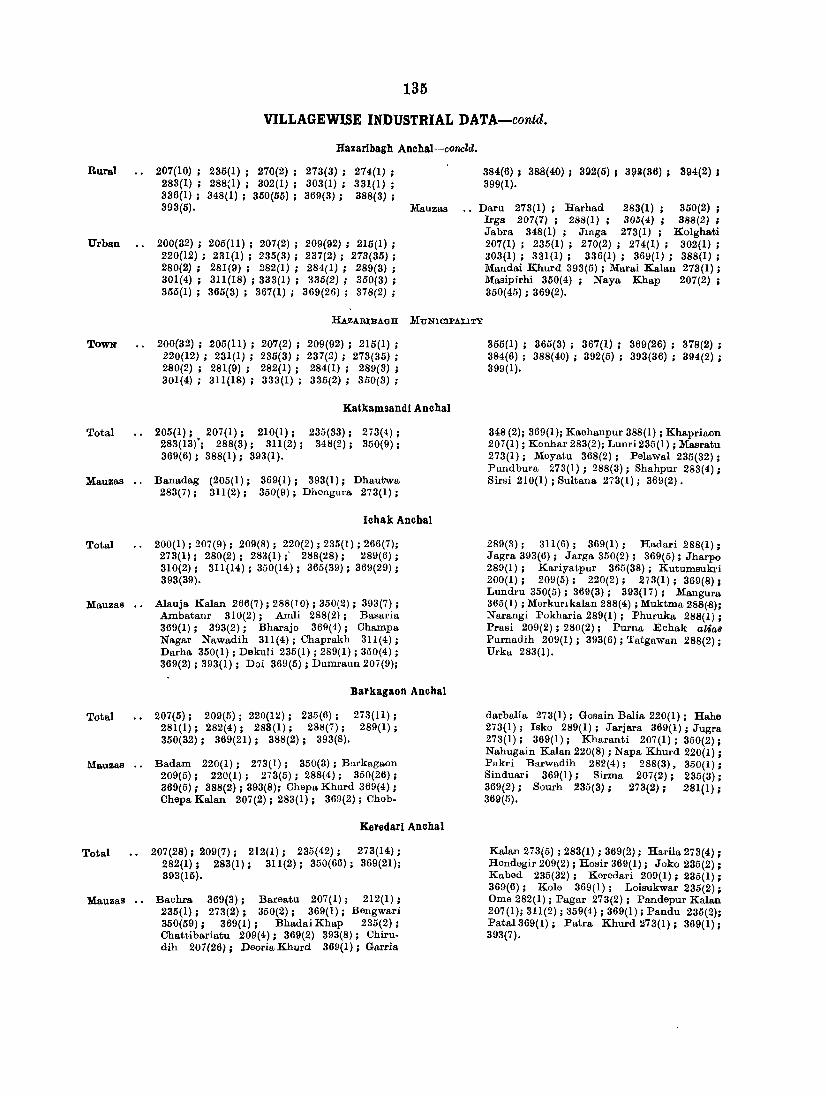
135
VILLAGEWISE INDUSTRIAL DATA-contd.
Rural
Urban
Hazaribagh Anehal-concld.
207(10); 235(1) 283(1) ; 288,1) 336(1); 348(1) 393(5).
270(2); 273(3); 274(1); 302(1); a03(1); 331(1);
350(55); 369(3); 388(3);
200(32); 205(11) ; 207(2) ; 209(92); 215(1) ; 220(12); 231(1) ; 235(3); 237(2); 273(35); 280(2); 281(9); 282(1); 284(1); 289(3); 301(4); 311(18); 333(1); 335(2); 350(3); 355(1); 365(3); 367(1); 369(26); 378(2);
Mauzas
384(6) I 388(40) I 392(5) I 31)3(36); 894(2). 399(1).
Daru 273(1); Harhad 283(1); 350(2); Irga 207(7); 288(1); 305(4); 388(2); Jabra 348(1); Jlnga 273(1); KOlghati 207(1); 235(1); 270(2); 274(1); 302(1); 303(1); 331(1); 336(1); 369(1); 388(1); Mandai Khurd 393(5) ; }Iarai Kalan 273(1); Masipirhi 350(4); Naya Khap 207(2); 350(45) ; 369(2).
lIAzARl;BAGH MUNICIPALITY
TOWN 200(32); .205(11) ; 207(2) ; 209(92); 215(1) ; 220(12) ; 231(1) ; 235(3); 237(2); 273(36); 280(2) ; 281(9); 282(1); 284(1); 289(3); 301(4); 311(18); 333(1); 335(2); 350(3);
Katkamsandl Anehal
Total 205(1); 207(1); 210(1); 235(33); 273(4); 283(13)'; 288(3); 311(2); 348(2); 350(9); 369(6); 388(1); 393(1).
Mauzas .. Banadag (205(1); 369(1); 393(1); Dhautwa 283(7); 311(2); 350(9); Dhongura 273(1);
Ichak Anehal
Total 200(1); 207(9); 209(8); 220(2); 235(1) ; 266(7); 273(1); 280(2); 283(1);' 288(28); 289(6) ; 310(2); 311(14); 350(14); 365(39); 369(29); 393(39).
Mauzas .. Alauja Kalan 266(7); 288(10) ; 350(2); 393(7); AInbatanr 310(2); Arnli 288(2); Basaria 369(1); 393(2); Bharajo 369(4); Champa Nagar Nawadih 311(4); Chaprakh 311(4); Darha 350(1); Dekuli 235(1) ; 289(1) ; 350(4) ; 369(2) ; 393(1); Doi 369(5); Dumraun 207(9);
Barkagaon Anehal
Total 207(5); 209(5); 220(12); 235(6); 273(11) ; 281(1); 282(4); 288(1); 288(7); 289(1) ; 350(32); 369(21); 388(2); 393(8).
Mauzas .. Badam 220(1); 273(1); 350(3); Barkagaon 209(5); 220(1); 273(5); 288(4); 350(26); 369(5); 388(2); 393(8); Chepa Khurd 369(4); Chepa Kalan 207(2); 283(1); 369(2); Chob-
Keredari Anchal
Total 207(28); 209(7); 212(1); 235(42); 273(14); 282(1) ; 283(1) ; 311(2); 350(66); 369(21); 393(15).
MauzaB ., Bachra 369(3) ; Bareatu 207(1); 212(1) ; 235(1); 273(2); 350(2); 369(1); Bengwari 350(59); 369(1); BhadaiKhap 235(2); Chattibariatu 209(4); 369(2) 393(8); Chirudih 207(26); Deoria Khurd 369(1); Garria
355(1) ; 365(3); 367(1); 369(26); 378(2) ; 384(6); 388(40); 392(5) ; 393(36); 394(2); 399(1).
348 (2); 369(1); Kachanpur 388(1) ; Khapriaon 207(1); Konhar 283(2); Lunri235(1); Masratu 273(1); Meyatu 368(2); Pelawal 235(32); Pundbura 273(1); 288(3); Shahpur 283(4); Sirsi 210(1) ; Sultana 273(1); 369(2).
289(3) ; 311(6); 369(1); Hadari 288(1); Jagra 393(6); Jarga 350(2); 369(5); Jharpo 289(1); Kariyatpur 365(38); Kutumsukri 200(1); 209(5); 220(2); 2i3(1); 369(8); Lundru 350(5); 369(3); 393(17); Mangura 365(1) ; Merkunkalan 288(4) ; Muktrna 288(-8); Narangi Pokharia. 289(1); Fhuruka 288(1); Prasi 209(2); 280(2); Purna Echak alias Purnadih 209(1); 393(6); Tatgawan 288(2); Urka 283(1).
darbalia 273(1); Gosain Balia 220(1); Rahe 273(1); Isko 289(1); Jarjara 369(1); Jugra 273(1); 369(1); Kharanti 207(1); 350(2); Nahugain Kalan 220(8) ; Napa Khurd 220(1) ; Pakri Barwadih 282(4) ; 288(3), 350(1); Sinduari 369(1); Sirrna 207(2); 235(3); 369(2); Sourh 235(3); 273(2) ; 281(1) ; 369(5).
Kalan 273(5) ; 283(1) ; 369(2); Harila 273(4); Hendegir 209(2) ; Hosir 369(1); Joko 235(2) ; Kabed 235(32); Keredari 209(1); 235(1); 369(6); Kale 369(1); Loisukwar 235(2); Orne 282(1); Pagar 273(2); Pandepur Kalan 207(1); 311(2); 359(4) ; 369(1); Pandu 235(2); PataI369(1); Patra Khurd 273(1); 369(1); 393(7).

136
VILLAGEWISE INDUSTRIAL DATA-contd.
Tandwa Ancbal
To~a.l 20Q(I), 207(3) J 209(2); 235(16) J 273(15); 281(1); 283(10); 288(12); 289(1); 311(3); 350(31); 369(25); 388(2); 393(4);
:Mauzas •• Bahera 369(2); Bargaon 235(1); 273(3); 350(6); 369(4); Benti 207(1); 350(3); Bukru 273(1}; 369(2); Dahu 283(4); 369(1) ; Dhanara 207(1) J 273(1); Garilaung 350(20); 369(4);
Kamba 235(15); 273(2); 281(1); 311(1) J 369(1); Kharika 283(1); 311(2); 350(1); Lemhea 207(1); 283(5) ; 289(1); 350(1); Misrol 209(1); 273(2); 369(10); Nawadih al-i08 Teliyadih 393(1); Rajdhar 273(1) ; Soparam 369(1); Tandawa 200(1); 209(1) 273(5); 388(2); 393(3); Urda 288(12).
Mandu Anchal
To~al 200(1); 205(1); 207(31); 209(42) I 220(3); 235(25); 273(36) J 281(1); 284(2); 288(24) ; 311(29); 350(73); 368(1); 369(33); 379(1); 382(2) ; 384(3); 388(2); 393(7).
:Mauzas •• Ara 205(1) ; 207(1) ; 209(1) J 281(1); 369(5); Banji 235(1) ; Banwar 235(1); Barka.chumba 209(1) 273(3) 350(18); 393(1); Barughutu 207(1); 209(19) 220(1); 273(17); 311(1); 369(2); 379(1) ; 382(2) ; 384(2); 393(2); Bhadwa 209(2); Bongabar 207(4); 311(9); 350(21); Chainpur 368(1); Chapri 273(1); Datma. 207(3); Digwar 207(1); 235(1) ; 311(4) ; 369(6); Duni 369(1); Edla 369(1); Hathimara 207(1); Karma 207(4); 235(19);
273(4}; 350(6) ; 369(2); 393(1); Kedla 209(2); 288(21); 369(1); Kimo 207(1); Kuju 207(6); 209(6); 273(1); 384(1); 388(2); 393(1); Loiya 273(3); 284(1); 288(3); 311(5); 369(1); 393(1); Majhila Chumba 273(1) ; Mandu 200(1); 207(1); 209(4); 273(2); 369(3); Manuan 207(1); 220(1) J 235(2); 273(2); 350(16) ; 369(1); Murpa 369(2); Phusarai 207(3); 220(1); Pindra 207(1); Pochra 350(2); Eatwe235(1 H 273(1); 350(10); 369(1); Sanri alias Tilaiya 209(3); Sarubera 209(3); 273(1) ; 369(1) ; 369(1); Seota 207(3); 284(1); Sugia 369(3); Taping 369(1); Topa 369(1); Udlu 369(1); 393(1).
Magri (Ohurehu) Anchal
Total •• .209(2) J .273(1); .281(1); 342(2). Mauzas Basaria 342(1); Bundu 342(1); Charihi209(2); 273(1); Gidi 281(1).
Ramgarh Anchal
Total 200(14) J 207(7); 209(51) ; 220(7) J 235(67); 273(26) ; 289(2) J 301(1); 311(3) ; 342(3) ; 350(6), 357(2); 369(13) • 380(2); 384(3); 39'9(2).
211(1) ; 280(2) ; 336(3) ; 365(3) ; 388(8) ;
215(1) ; 288(3); 340(2) ; 367(1);
393(33) ;
Rural 200(6), 207(7), 209(32); 211(1); 220(5); 235(67); 273(16); 288{3); 311(2); 350(6); 365(3); 369(12); 388(1); 393(29); 399'(1).
Urban •• 200(8); 209(19); 215(1); 220(2); 273(10); 280(2); 289(2) ; 301(1); 311(1); 336(3);
Total 200(8) J 209(19); 215(1) r 220(2); 273(10); 280(2) J 289(2) ; 301(1) J 311(1); 336(3) J
340(2) J 342(3) J 357(2) J 367(1) J 369(1); 380(2) ; 384(3); 388(7) J 393(4) J 399(1).
Mauzas •• Arada 209(3) J 273(2) J Barkipona 200(1) J 209(1) J 235(31) J Chhatarmaru 393(3) J Chitarpur 200(3) J 209(14) J 220(5) ~ 273(1) J 311(2); 388(1); Hesta 211(1) J 369(1) J Jamsing 235(1); Kulhi 288(3) J Larikalan 200(1); 207(7); 209(6); 235(6) ; 273(11) J 350(6) ; 365(3) ; 369(3) ; Moe} 235(28) ; Pamcha 235(1); 369(7); Sukmgara Bammi 209(1) ; 273(1) ; 393(26); Shirks 200(1) J 209(7); 273(1); 369(1); 399(1).
340(2) ; 342(3); 357(2) ; 367(1) I 369(1). 380(2); 384(3); 388(7); 393(4); 399(1).
lainagar Anehal
To~al 200(3), 209(18) J 273(9); 348(2); 350(1); 369(9); 388(1) J 393(12); 399(1).
Mauzas •• Barkidhamrai 273(1); Birar 200(1); 209(5); 273(1); 369(4) J 399(1); Bisodih 369(1);
To~al
Gola Anchal
200(3); 207(64); 209(14); 235(1119); 273(15); Mauzas 288(16); 311(5); 350(49); 369(32) 388(2); 393(9).
Jainagar 200(1); 209(5) I 273(2) J 369(1); 388(1) ; 393(3); Kandrapdih 348(2); Katahadih 209(1); Katia 20{)(1); 209(7); 273(5}; 369(1) ; 393(7); Paharidih 393(2); Pipradih 369(1) ; Rembhnadih 369(1); Sonpura 360(1).
Aonradih 207(5) J 273(1) I 288(2) J &50(4) I 369(1); Bariatu 207(4); 235(24); 273(7). 350(3); 369(3); 393(1); Barkikoiya 350(8,:

137·
VILLAGEWISB· DlDVSTRIAL DATA-contd.
Gola Anohal-eoncZd.
369(3); Barlanga 209(4) I 273(2); 350(5); 393(1); Bantara 209(2); Betul Kalan 235(65); 311(1) ; Betul Khurd 235(27) • Biyang 235(2) • Chokad 235(2) ; Banda 273(2) ; Rasaora 288(4);Hethbarga 207(5); 369(2); Hupa 235(7); 369(2); Kamta 207(43); 369(11); Kenke 311(4); Khokha 369(1), KUSUIIldih Kalayanpur 235(2); Lipia 288(10); 350(9) J
GU,mla Anchal
Total 200(5), 205(1); 207(2); 209(16); 220(3); 235(30); 262(1); 273(27); 281(2); 288(27); 311(6); 332(2) ; 333(1) ; 340(1) ; 350(6); 369(34); 388(1); 389(1); 392(1); 393(18); 3\H{I); 399(2).
Mauzas •• Baridari 207(1). 288(14); 389(1) ; Bhitia 235(8); Chorganwa 369(7); 394(7)! ChugIl.u 369(1) ; Chute 200(1) ; Q.angpur 288(5) ; 369(3) , Gumia 200(11); 205(1) ; 209(3) ; 273(5) J 350(6); 369(3); 393(16); Gomikarma· tanr 332(2) ; 340(1) ; Raradgara 235(6) ;
Total
Mauzas
Total
Mauzas
Peter bar Anchal
200(3); 207(2) ; 209(12); 211(2); 273(23) ; 310(2); 350(2); 369(2); 388Cl). 393(6).
Bundu 200(1); 211(1) ; Chalkari 209(1) I 273(1) J Champi 350(2); Chandrapura 209(1);
Kasmar Anchal
200(1) I 207(3); 209(11) I 211(1). 235(2); 273(16) ~ 311(3) J 365(2) J 369(4) J 388(1) I 393(20).
Bagda. 209(4) I 211(1), 365(2); 369(1); Bemrotanr 311(3) J Chandipur 209(1); Garri 209(2) I
Jarldlh Anchal
Total 200(1) I 207(8); 209(8); 220(1); 278(26) I 282(9); 288(23); 331l(1); 350(11); 369(14); 388(1).
Mauzas •• Araju 207(1); 209(2) I Araldih 273(2); Arasaram 282(3): Bahadurpur 209(3). Bandhdih 273(2) J Baradih 273(2) J Baru 273(6) ; Beldih 369(3); Bhulan Khetko 273{1) I Chilgara 207(4); 273(5); 282(5); ~88(5);
Magampur 207(1); 209(1); 235(13) 273(3). Mundudih 369(3); Nawadih (Thana no. 38); 207(2) J Nawadih (Thana no. 81); 207(1); Rola a!ilJ8 Gola 200(3); 209(7); 273(6); 350(2); 388(2) J 393(5); Sagrampur 235(7); 350(11); 393(2); Saragdih 350(3); Serenghatu 350(4); 369(1); SokIa 369(1); Sothai 369(4) J Tonagatu 207(3).
273(1); 369(2); Honhe 369(3); Hosir 200(2) ; 207(1) ; 209(3) ; 220(1); 273(8); 311(1) ; 369(5); 388(1); 392(1); 393(1) ; Hurlang 369(2) ; Jhirki 273(4); Khamhir 311(2); Kumda 235fih 213(3); 311t1h 3u9tl); Lalpania 235(1) ; Lodhi 369(1) ; Naran 288(8) ; 369(3) ; Paliharigurudih 209(5); 273(1) ; 281(1); Saram 200(1) ; 209(5) ; 220(2) ; 262(1) ; 273(4) : 369(2); 393(1); 399(.2); Sashera 281(1); 333(1);' Semarbera 235(8); Tirla 311 (2); 369(1); Tisri 273(1).
Chargi 273(1) J Gagi 209(1); 273(2). 388(1) 393(1); Katarbera 273(1). Khetko 207(2); 209(5); ·273(7). 369(1); Petarbar 211(1) I 273(3); 310(2) • Pichbri 209(3); 273(1), 369(1) J 393(5) I Tenu 200(2). 209(1) J 203(7).
235(1) t 273(4) t 369(2), l{arkata Khurd 369(1): Kasmar 209(1) I :Khaira Chatar 200(1) 209(2). 273(5); Madhukarpur 207(1); 273(3); 393(20); Mayapur 273(1). Surjudih 273(2). Telmunga 207(2) J 209(1); 235(1); 273(1) J 388(1).
350(11); 300(1); Dumro 273(1); Qopalpur 207(2) , 282(1); 288(!}). 369(2); Haridih Hardi 369(5); Kalayanpur 207(1) 336(1); Kanari 273(1); Karharia 273(2); Marapahari 209(2) • 220(1), 273(3)'; 388(1) J Pathria. 209(1) J 273(1); 369(1); Sarabinda 369(1) J Sundro 273(1) ; 288(9) ; Tantri 200(1); Thakurtany 369(1).

1S8
VILLAGEWISE INDUSTRIAL DATA-contd.
Rodarma Anehal
Total 200(29); 204(3); 205(5); 207(3); 209(97); 212(1); 216(2); 220(21); 230(2); 273(44); 280(3); 281(3); 283(4); 284(1); 288(19); 289(6); 292(1), 301(1); 302(1); 311(7); 314(1); 320(1); 335(1); 336(1); 348(487}; 350(9); 367(1); 368(2); 369(25);378(1); 379(2}; 384(7); 388(14); 392(4); 393(31); 394(1); 399(4).
R'llal 200(11); 205(4); 207(3); 209(44); 220(9); 273(27); 280(1); 281(1); 283(4); 311(3); 314(1); 348(108); 350(3); 369(17); 384(1); 388(2); 392(1); 393(19)
Urban . . 200(18); 204(3); 205(1); 209(53); 212(1); 216(2); 220(12); 230(2); 273(17); 280(2); 281(2); 284(1); 288(19); 289(6); 292(1); 301(1); 302(1); 311(4); 320(1); 335(1); 336(1); 348(379); 360(6); 367(1); 368(2); 369(8); 378(1); 379(2); 384(6); 38A(12); 392(3), 393(12), 394(1), 399(4).
'Mauzas •• Bagridih 348(7); Baheradih 348(3); 3113(2); Chilangia alias Dharhakola 209(5); 273(4); 311(1); 369(1); Domchanch / 200(6); 209(16); 220(1); 273(8); 283(4); 311(2); 348(6); 350(2), 369(6); 388(1); 392(1); 393(8); Dumardiha. 348(1); Ekbanwa. 207(1); Jartdih 273(1); 369(2); Jorasemar 348(1); Kamaidih 348(1); Kanungo Bigha 348(1); Koabar 200(1); Kodarma 200(2); 205(4); 209(12); 220(7), 273(3); 314(1); 348(33); 369(2); 384(1); 393(2), Koigarma. 369(2); Lariyadlh 348(2); Lo .. han. pur 281(1); Lobi 348(2); Madhuban 348(2), 369(1); Mathadih 200(1); 207(2); 209(3); 280(1); 348(37); Meghatari 209(5}; 273(4); 348(1); 369(1); Nagarkhara 200(1); 209(1); 220(1); 273(4); 348(3); 350(1); 388(1); 393(3); Nawadih 369(1); Pahro 209(2); 273(3); 348(3); 369(1); 893(1); Pipradih 348(1); Purnanagar 393(3); Puto 348(1); Salaidih 348(1); Sujanpur 348(2).
JJll1HBI TXLAu'A NOTD'IBD ABBA
Town .• 200(18); 204(3); 200(1); 209(5"}; 212(1); 216(2); 220(12); 230(2); 237(1); 273(17); 280(2); 281(2); 284(1); 288(19)! 289(6); 292(1); 301(1); 302(1),
311(4); 320(1); 335(1); 336(1); 348(379); 350(6); 365(1); 367(1); 368(2); 369(8); 378(1); 379(2); 384(6); 388(12); 392(3); 393(12); 394(1); 399(4).
Jtlarkaeho Anchal
Total 200(1); 207(6); 209(4); 273(20); 282(7) 283(28); 288(23); 311(8); 348(20); 350(51); 369(20); 393(22)
Mauzas ., Asnatari 348(1); Babhandih 273(2); Bochhaidih 369(7); Bahadurpur 20'i(1); 283(3); Bakaspura 350(2); Bigha 282(4); 350(3); 369(2); 393(3); Bindomoh 209(1); Dagrnawa 348(1); Debipur 273(2); 350(1); 393(4); Dhargaon 283(6); 288(23); 3ll{I); 350(5); Gagresinga 307(1); 348(2); Jagdishpur 348(1); a50(14);Jamu 209(1); 273(2); 282(1); 348(1); 393(2); Jhalag. diha 350(2); Kadodih 348(1); Ksrikhokho
273(1); Kharkhar 273(1); Kumardib 273(2); KU$umhei 283(1); Labania alias Bela 283(3); 311(1); 350(2); Lohriatanr 283(9); 311 (D); 369(3); Mahugah. 200(1); 273(4); 348(1); Majhiladih 273(1); Markacho 209(2); 282{41}; 348(7); 369(2); 393(10); Masmohana 273(1); 348(1); Murukmani 283(6); 311(1); 348(1); 350(14:); 393(1); Nagrito 273(1); Naitanr 273(1); Naudiha 348(1); Nawada 350(3); Nawadih (Thana no. 117); 207(2); 273(1); 369(1); Nawadih (Thana no. 142); 369(4:)Nawalsah 348(1). Phulwaria 207(1); 348(1); Purnadih 273(1): 350(5), 369(1); Raedih 393(2); Tolkhar 207(1)
Panatll Anellal
Total
MauzaS ••
Total
Rural
200(5); 207(7); 209(40); 220(2); 235(1); 273(17); 282(2); 311(5); 342(4); 350(46); 357(2); 369(4); 379(2); 388(2); 393(5); 399(5).
Barka Kana 200(2); 209(3); 311(1); 388(1); Chaingara 235(1); 273(1); 350(1); Chikor 273(3); 350(2); Deorie. Barganwe. 200(3); 209(21); 220(2); 273(2); 282(1); 311(2); 369(2);
379(2); 393(1); 399(5); Ghutua 209(1); 393(1). Jainagar 273(2); 311(2); 350(41); 393(3): Kirigara 209(1); Lapanga 209(9); 273(2); 357(2); 369{l); Matkuma 342(2); Patratu 342(2); Saukul 273(1); Sale 273(2); 282(1); Saunda 209(4); 273(4); 369(1); 388(1); Terpa 207(7); 209(1); 350(1); Tokieud 351)(1).
OHATRA SUBDIVISION
200(19); 207(99); 209(76); 212(8);, 220(16); 235(111); 273(60); 281(3); 282(8); 283(112); 284(2); 288(149; 289(93); 310(6); 311(80) 314(1); 336(1); 340(1); 342(1); 344(2; 384(17); 350(274); 365(14); 369(130); 388(7); 393(70).
200(12); 207(97); 209(84); 212(8); 220(3); 235(I11h 273(48); 281(3); 282(8); 283(112);
284(2); 288V49); 289(63); 310(5); 311(78); 314(1); 336(1); 344(2); 348(17); 350(261}; 365(3)-369(116); 388(4); 393(56). '
Urban •• 200(7); 207(2); 209{l2); 220(13); 273(12); 289(30). 310(1); 311(2); 340(1); 342(1); 350 (13);365(lI,: 389(14); 388(3); 393(14). '

189
VILLAGEWISE INDUSTRIAL DATA-contd.
Chauparan Anchal
Total •• 200(6); 207(9); 209(21); 212(7); 273(10); 282(3); 283(4); 288(45); 289(13); 310(2)} 311(8); 344(2); 348(17); 350(72); 369(17); 393(8).
Mauzas •• Bangawan 207(2); 283(1); Bara 209(1); Bania Chak 369(1); Basaria 273(1); Bendi 207(1); 273(1); 348(2); .369(1); l3hadel 350(2); Bhaghar 207(1);. 283(1); Bhandar 207(1); 209(1); 350(1); Bhat Bigha 273(1); 369(1); Bhusandih 289(5); Chai Kalan 273(3); 350(11); Chakrasar 212(1); 350(1); Chandwara 273(1); 348(7); Chatan 348(3); Chilo Dih 310(1); Chordaha 311(2); 369(1); Ch~uparan 200(3); 209{1I); 273(3); Dadpur 350(1); Doiya 311(2); Jagdish. pur 288(23); Jawanpur 209(4); 212(2); 344(2);
Ulrhori Anchal
Total 200(2); 207(48); 209(14); 212(1); 235(14); 273(14); 283(94); 288(14); 289(30); 310(3); 311(42); 336(1); 350(105); 369(53); 388(1); 393(36).
Mauzas •• Angara Kalan 207(2); 283(1); Anup Chak 350(1); 369(2); Asarhia 369(2); Baghmundi 207(1); Bain 311(2); Bamandiha 393(1); Banathu 283(3); 350(1); Bara 283(1); Bariatu 283(2); Bari Sakhi 369(2); Barta 289(3); 3U(I), Barw.adih alia8 Nimekhap 207(5); 273(1); 283(5); 350(7); Belhari 311(2); Bel. khori 273(1); 289(3); 310(2); 350(2); Bisna· pur 350(7); Cheri 350(1); 369(1); Chorkari 207(2); 369(3); Dhankheri 207(3); 273(1); 283(1); 289(1); 350(2); Dhewadauri 283(7); 369(1); Dhorhi 369(1); Duari 283(7); 350(13); Dumi 350(5); Ganeshpur 369(2); Gangpur 207(1); 311(1); 350(1); 369(1); Gidhaur 209(1); 273(1); 289(17); 311(5); 369(1); 393(1); Gopi· pur 311(1); Halmata 283(2); Ichak 283(2); pur 311(1); Halmata 283(2); Ichak 283(2); Irki 311(2); Itkhori 209(6); 273(3); 283(4); 236(1); 350(1); 369(1}; 393(9); Itkhori Chatti 350(1); Jagadishpur 369(4); Jhardag 200(1}; 209(1); Kaleanpur 350(2); Kanaudi 283(1); Kanti 283(2); Karni 283(2}; 369(6); 393(1};
HunterganJ Anchal
Total 200(2}; 207(4); 209(13); 220(2); 273(7); 281(2); 282(1}; 283(11); 289(4}; 311(8}; 350(37); 369(10); 388(2); 393(4)
Mauzas •• Aunru 209(1); 311(3); 350(4); Bailgara 283(1); 311(3); Bandu 289(4}; Bhiknahu 350(2); Bhondal 282(1); Bihari 350(9); Daba 350(4); Ghanghri 369(2}; Gokhna 283(1); Gosaindih 207(2); 283(4); 350(1}; Jorikalan 209(1}; Jori
Pratap Pur Ancbal
Total 200(1); 207(21); 209(9}; 220(1); 235(9}; 273(3); 281(1); 282(4); 283(1}; 288(4); 289(12}; 311(2); 350(31); 369(12); 388(1); 393(1).
Mau:r.as •. Babhne 307(3); 393(1); Baghakola 207(1); 369(1); Bandatar 207(2); Bharhi 207(1); Bodhua Bishunpur 235(9}; 282(1); 369(1);
350(35); 369(1); Jhanpa 393(2}; Jongi S50(]); Kalwa Chak 289(2); 369(1); Karma (Thana. no. 75); 393(1); Karma (Thana no. 51); 212(1); 288(22), 311(3); Kathamba 212(1); Kenduahi al;as Danua 369(2); Kubri 2832); 289(1); 310(1); Kumbhiatari 348(2); 369(1); Lohra 348(1); Machla. 311(1); Madangundi 212(1); Madh Gopali 289(1); Mangarh 212(1); Nawadih 369(2); Papro 207(1); 282(3); 350(1); Parsa Tari 207(3); 348(2); 369(2); Pathra 369(1); Petula 350(1); Rampur 350(2}; Rupin 289(4); Singhpur 350(2); Singhrawan 200(2); 209(3); 369(3); Sonpura 350(3); Sugi 393(5); Tajpur 200(1); 209(1); Tetariya 350(2); Thuthi 350(7); Tilaia 350(2).
Kendua 350(3); 369(1); Kirkira 235(4); 273(1); Kurjun 283(2); 310(1); Lita 283(3); Loram 369(3); Madhepur 283(1); Majhgawan 283(4); Majur Hand 209(2); 273(1); 283(2); 350(1); 393(1}; Molakpur.207(2); 283(1); Mauna 207(1); 283(1); Mayapur 207(1); Nawadih 311(3); Nongaon 283(7); 311(3}; 350(4); Pachmo 283(1); Pahara 207(4); 283(2); 311(4); 350(8); Pakaria 311(1); Pakaria Kalan 283(5); 350(8); Patharia 369(3); 393(1); Pathal Gara 207(1); 209(4}; 273(2); 283(6}; 311(1); 350(9}; 369(3); 388(1); 393(2); Pathra 200(1); 350(1); 369(2); 393(3); Parsauni 207(15); 212(1); 235(1); 273(2); 369(7); 393(9); Pitij (Thana no. 9/271); 350(2}; Pitij (Thana no. 8/270), 393(1), Peksa 311(4); 350(2}; 369(2); Pindar Kom 207(1}; 311(2); 350(3); 369(2); Rajbar 350(4); Rajadahar Bhanga 207(3); Romi 350(5); Rupin 3U(2); Salga 350(5); 369(1); Salwe 283(1}; Sonia 283(l); Saharjan 207(2); 311(1); Sinduari Kalan 369(1}; Singhani 207(4); 235(9}; 283(9); 311(3); 350(4); 369(1}; 393(1); Sirmatpur 283(4); 288(14}; Soki 283(1}; 289(6}; 311(l}; 350(2); 393(6); Tetaria 273(1); 283(2); 311(3); Tilaia alif18 TiIetanr 283(1).
Khurd 200(1); Kandabar 207(1); KedliKalan 209(4); 273(3); 283(3); 369(4}; 393(3}; Kedli Khurd 350(3); Khuti Kewal Khurd 200(1); 209(7); 220(1); 273(3); 281(1}; 311(1); 350(8} 369(3); 388(2); 393(1); Khutero. 350(1): Kubo. 369(1); Murar 350(1}; Nawadih 200(1}; 273(1}; 281(1), 3U(I); Pinnri 283(2}; Sahi 207(1); 350(4}.
I Chandri Kalan 311(2); Chapka 350(4); Dumar. war 350(2); Durgahi Bishunpur 350(9}; Egbro. 207(4); Gerua 369(1); Ghorighat. 209(3); 273(3); Gome 283(1); 369(1); Humajan 207(2); Kasmar 209(1); Koura 207(1); Mangra Baijnathpur 350(1); Monya 282(3}: Narainpur 369(1); Pathra 207(2}; 350(1); Pandiadih

140
\7ILLAGEWIS» IMDUSTIUA~ DATA--conta.
Total
Rural
Town
Pratap Pt:r All'Chal-concld.
M9(1); Paratabpur 200(1); 207(4); 209(15); 220(1); 281(1); 288(1); 28WI2); 350(12); 369(4); 38S(1); Rampur 28B(3}; Sami 369(1);
Chatra Anehal
200(7,; 207(2); 209(15); 220(13); 235(1); 273(14); Urban 284(2); 288(35); 289(30); 310(1); 311(4); 314(1); 340(1); 342(1); 350(20}; 365(11); 369(14); 388(3); 393(19)).
209(3); 235(1); 273(2); 284(2); 288(35); 311(2), 314(1); 350(7); 393(5).
Mauzas ••
CHATBA MUNICIPALITY
200(7); 207 2); 209(12); 220(13); 273(12); 289(30); 310(1); 311(2); 340(1); 342(1);
Simaria Anchal
Total 200(1); 207(15); 209(4); 235(87); 273(12); 283(2); 288(51); 289(4); 311 (16); 350(9); 365(3); 369(24); 393(2).
Mauzas .• Araatu 235(1); 273(8); 288(2); 393(2); Bagra 209(1); 273(2); 283(2); Bauasandi 207(1); Bandu 350(1); 369(2); Bahwar 311(1); Belgara 207(2); 311(3)1 365(3); 369(5); Dilho 369(2); Dundua 311(3); 369(2); Rahe 288(1); 369(1); Rerum 288(24); 311(2); 369(2); Jojobari 288(5); Kalyanpur 288(2);
Sangrampur Kalan 350(2); Sibpur 207(1), Tanrwa 369(1).
200(7); 207(2); 209(12); 220(13); 273(12); 289(30); 310(1); 311(2); 340(1); 342(1); 350(13); 365(11); 369(14); 388(3); 393(14).
Baniabandh 288(4); Darha 288(22); Kanhakalan 209(3); 273(2); 314(1); 393(5); Nawad'l. 288(3); Pathel 288(6); Tilala ~35(1); Tulbul 284(2); 311(2); 350P). \
350(13); 365(11); 369(14); 388(3); 393(14).
Kanti alia8 Mandhania. 369(1); Khangara 288(3); Kokolekalan 289(4); Konohi 369(1); Kotari 369(1); Kuti 209(1); Kuti Rangania. 369(1); L!lmta. 311(3); 36il(l); Lowalang 350(7); Madandih 369(1); Meral· 288(10)' Nawadih 3U(3); Rakhed 350(1); Saban~ 207(12), 235(20), Sehada 369(2), Seraudag 200(1); Sildog 288(2); 311(1); Simaria Kalan 209(2); 235(38); 273(2); Simaria Khurd 235(28); Sos 369(1); Tigda 288(2); Tilra 369(1).
GIRIDIH SUBDIVISION
Total
Rural
•. 200(134); 205(10); 207(213); 209(427); 211(1); 215(1); 220(38); 235(148); 237(3); 262(2); 270(1); 273(460); 274(2); 280(7); 281(9); 282(23); 283(62); 284(6); 288(305); 289(165); 292(6); 301(::1); 310(1); 311(52); 313(1); 314(4); 333(1); 336(3); 339(2); 340(14); 343(3); 348(4272); 350(991); 365(15); 368(1); 369(434); 378(1); 379(3); 380(1); 381(2); 384(40); 388(53); 389(1); 392(8); 392(8); 393(256); 394(6); 399(8).
200(102); 207(212); 209(242); 211(1); 220(16); 235(148); 262(1); 273(342); 280(6); 281(4); 282(11); 283(61); 284(5); 288(295); 289(165);
Urban ••
Ga"an Anohal
Total 200(4); 207(93); 209(19); 220(4); 273(22); 282(1); 283(2); 284(5); 311(1); 348(85); 350(42); 369(20); 393(21).
Mauzas •• Badilih 209(2); 273(1); 348(1); 393(2); Baghjant 348(1); Begdedih 348(3); Bendro 348(1); 369(1); Beonk 20Q(2); 209(2); 273(5); 348(19); 393(2); Bhatgarhwa 2S2(1); Birne 348(1); Charki 348(3); Cherwa 369(1); Chihutia 207(1); 273(1); Debar 348(1); Dharbe 348(2); Dumardiha 348(1); Gadar 369(1); Gawan 200(1); 209(7); 273(7); 311(1); 34~(l); 393(1); Rariharpur 348(2); 393(7); Rarla 350(3); Rami 348{1); Hethlikahuai 348(2); Jamdar
292(4); 311(27); 314(2); 333(1); 343(3); 348(3998); 350(948); 369(404); 380(1); 381(2); 384(9); 389(1); 393(221); 394(5); 399(3).
340(14); 365(13); 388(19);
200(32); 205(10); 207(1); 209(185); 215(1); 220(22); 237(3); 262(1); 270(1); 273(118); 274(2); 280(1); 281(5); 282(12); 283(1); 284(1); 288(10); 292(2); 301(3); 310(1); 311(25); 313(1); 314(2); 336(3); 339(2); 348(274); 350(43); 365(2); 368(1); 369(30); 378(1); 379(3); 384(31); 388(34); 392(8); 393(35); 394(1); 399(5).
207(6); 369(1); Jorasemar M9(1); Kaneridbad 273(1); Kharsan 348(1); 369(3); Laohh;mipur 209(1); Lakhikura 348(1); Loharpura 369(2); Maheshpur 369(1); Mahuari 207(2); MaIda 350(24); 393(1); Manjhne 207(1); 209(1); 348(1); 350(1); 393(1); Nagwan 200(1); 209(2);. 220(4); 348(6); 350(12); 369(2); Nawadlh (thana no. 333); 273(1); Nawadih (Thana no. 239); 369(1); Nimadih 207(1). Patna 348(2); 369(2); 393(2); Pihra 207 (6): 209(4); 272(4); 284(4); 348(31); 350(2); 369(3): 393(4); Sankh 207(14); 273(2); 283(2): 284(1); 369(1); 393(1); Sarua 207(2); 348(3): Uprailikahuai 348(1). '

141
VILLAGEWlSB IXDUSTRIAL DATA-coned.
TisrJ Anohal
Totlll
Mauzy •.
200(2); 207(9); 281(1); 288(21); 350(2); 365(5); 393(15); 394(1).
209(10); 262(1); 273(10); 311(1); 314(2); 348(337); 369(16); 384(2); 388(1);
Abrakha 350(1); Arear 348(3); Baherwa Bank 348(1); Balbali 369(1); Barad Dharan 350(1); Barwadih 207(3); 314(1); 369(1), 393(1); Bastikurha 348(4); Belbana 348(2); Bengohuro 348(1); Bhandari 348(4); Bhita. 348(2); Bhurgodih 348(1); Chandauri 209(6); 273(2);
.348(57); 369(2); 388(1); 393(8); Chhotkila Tbhedwi 369(1); Chornitari 348(7); Daldalia 348(1); Diwanjot 348(1); Ghasnitetari 348(21); Gumgi 209(1); 273(2); 348(18); 369(1); 393(1); Rarhara 348(34); Hirakherar 262(1); Jamamo 288(2); Jamuniatanr 273(1); 348(2);
Satgawan A~ohal
Total 200(1); 207(10); 209(16); 283(8); 288(23); 289(8); 350(29); 369(15); 393(j).
220(3); 311(3);
273(7); 348(1);
Mauzas .. Anantpur 348(1); Asnakoni 288(3); Bajania 207(1); Bariardih 200(1); 209(7); 273(3); 369(2); 393(1); Basodih 209(2); 220(1); 369(1); 393(1); Bharampur 283(2); Bishunidih 350(1); Galwati 288(6); Gangdih 288(1); Kanikend ~50(4); Khaira Kalan 207(1); 288(3); Jl[adhapl1l" 207(1); 311(3); 300(7);
Jamua Anollal
Total 200(16); 207(35); 209(31); 220(2); 273(34); 283(14); 288(17); 289(33); 292(4); 311(6); 348(43); 350(172); 369(49); 384(3); 388(5); 393(17); 399(1).
Mauzas •. Alodih 348(1); Andhar Kola 369(1); Aurangaro 311(3); Balaidih 348(2); Balbala 350(20); Balgo 288{l); 311(2); Barkusi 289(2); 369(9); Barotanr (Thana no. 364); 288(3); Barotanr (Thana no. 581); 289(1); 350(1); Bhandaro 369(2); Bhathdih 207(5); 289(11); 350(10); Bhupat Dih 369(2); Chachghara 209(3); 350(3); Charghara 350(1); Charghara Kisgo 360(1); Chunglo 348(2); Danda Tanr 207(12); 289(1); Dangardih 369(2); Dhibi Tanr 207(1); 350(6); Dhuraita 273(-2); Dhurgargi 350(15); Dongodih 369(4); Dumar Diha 350(3); Gandi Khurd 289(2); 393(2); Golaia 369(5); Goro 350(6); Harila 209(3); 273(1); 388(1); Jagar. nath Dih 200(1); 207(1); 209(2); 393(1); Jaruadih 350(5); 369(2); Jiotola 289(2); Jors Sankhs 209(1); Karhadih 273(1); Kari· hari 273(1); 289(6); 348(2); 350(8); 369(1); Katwara 369(6); Kharag Diha 200(5); 299(2);
Deorl Anoha}
Total 200(4); 207(9~); 209(11); 273(17); J82(4); 283(28); 288(77); 289(93); 348(3454); 350(153); 3t}5(2); 369(29); 393(29).
280(4); 311(4); 388(2);
Maullas
365(4); Jogiapahari 207(2); Kakni 209(1); 348(8); 369(1); Katkoho 348(1); Kendus 348(30); KhatpoDk 288(4); 369(1); 393(1); Khijuri 209(1); 369(2); Khirodh 207(1); 348(1); Khoto 348(1); Korchancho 348(14); Lachhmipur 273(1); 348(1); 369(2); 393(4); Lachkan 365(1); Laukai 273(1); Lewabanwaria 288(14); Lohra 288(1); Mansadih 348(49); Narotanr 348(1); Nima 34817); 369(1); Palmarua 207(1); 348(13); Palmo 348(3); Pandna tanr 394(1); Pipra taDr 348(7); Purnadih 273(1); 348(4); Ranadih 207(1); Ratangurra 314(1); 369(1); Sagbari 369(1); Satnal 348(4); Singho 200(1); 207(1); 348(1); Tikulia 348(29); Tlsri 200(1); 209(1); 273(2); 281(1); 311(1); 348(3); 369(1); 384(2); Tisro 348(1).
Marchoi 207(3); 289(2); 350(1); 393(1); Mirganj 289(4); 350(4); 369(2); Nandudih 350(1); Nasirganj 207(1); 288(2); Nawadih 207(1); 283(6); Pachmo 209(1); 369(3); Paharpur 350(1); Rajabar 288(8); Rajowr 350(1) Ramdih SilO(8); Rautdih 207(1); 209(1); 273(1); 393(1); Samaldih 207(1); 209(4); 220(2); 273(3); 289(2); 350(1); 369(1). Sanaidih 369(3); Sheopur 209(1); 369(2); 393(1); Tehro 369(1).
369(1); 393(1); Khariodih Huraita 348(1). Kurho Bindo 350(14); Lataki 220(2); 273(5); Lehra Simar 369(1); Mahes Rai Dih 369(1); Malho 200(1); 348(1); Mt'rho Chaparkho 350(12); Mirza Ganj 200(5); 209(13); 273(17); 348(11); 38~(2); 399(1); Murkhari 207(1); 350(11); N~ltanr (Thana no. 401); 207(1); 369(1); Naltanr (Thana no. 443); 350(14). Naudiha 200(1); 209(2); 273(2); 288(5); 292(4); 388(1); 393(1); Nawadih (Thana no. 409); 288(6); Nawadih (Thana no. 604); 209(2); 348(1); Okharsal 289(3); 311(1). Pandedih 273(2); 350(6); 369(1); 384(3)~ Paranchidih 289(4); Par;manik Dih 350(7). Patardih (Thana no. 266); 348(3); Patar Dih (Thana no. 575); 348(2); Pobi 200(2); 207(6); 209(3); 283(4); 369(1); 893(10); Raddiha 273(2); 348(14); 350(2); 369(2); Raigarh 207(2); 289(1); 369(3); Rama 200(1); 273(1); 350(21); 393(2); Sakhaibad 350(4); 369(1). Salaia 207(8); <Bali 348(1); 369(1); Sandih 207(3); 283(10); 348(1); Shamsingh Nawadih 388(1); Simra Tanr 350(3); Tekodih 288(2). THauna 348(1); 369(1). '
Agui 348(2); A;mjhar 348(8}; Amjo Aragio 348(8); Arwara 288(7); Asro 283(2); 288(8); 348{(6); Baghridih Baheradih 288(3); Bairia 273(2);
348(8); 207(6); 348(3); 288(8};

Total
Mauzas ••
142
VILLAGEWISE INDUSTRIAL DATA-contd.
Deorl AnchaJ-concZd.
348(143); 350(6); 369(1); Bajgunda 273(.1; 348(32); Bahan 348(12); Bandgar 348(15) ; Bangaro 289(4); 348(50); Banrea 348(22); Bansdlh 348(24), Baradlh 288(2); 348(21); Baramasla 348(35); Baramthan 348(4); Barkltanr 348(1); Barkusl 348(21); Barwadlh 200(1); 280(1); 348(11)! Barwabad 273(1); 289(2); 348(122); 350(22); 369(1); Belakola 273(1); 348(7); Belataur 288(2); 348(8); Belwaghatl 207(5); 283(1); 348(16); 369(1), Berodlh 348(2); 350(6); Bhandar 348(1), Bhatuakura 348(12); Bhatudlh 348(11); Bhatu Raldlh 348(10); Budhuadlh 348(11); BIJalsmgh 280(1); 288(1); 289(1); 348(16); BIJhara 348(18), Bishunpur 348(1); Burhla-sare 348(12); Buturwatanr 350(5); Chandadlh 348(18); Chahal 348(5); Chandh 348(39), Charkapathal 348(10); Chatro 200(1); 348(38), 350(4), 369(4); 388(2); Chauk1348(21); Chhewas Emar 348(4); Chlknadlh 289(6); 348(12), 350(17); Chlrodlh 348(4); Chltro Kurha 348(17), 350(2), Chohdlh 348(19) Dadhi Chandh 348(9); Dahuatanr 348(14); Daloradlh 207(7); 348(15); Dalourl 348(1); Danndlh 348(16), 369(1); Daralsaran 348(11); Darldlh 348(6); Deopaharl 273(1); 348(18); Deon 348(18); 350(7); Dhab 348(2); Dhanlramdlh 348( 10), Dham Saran 288(18); 348(5); Chanukdlh 348(11); Dhawatanr 348(13), Dhengadlh 200(1), 348(135), 369(2); Domadlh 350(7); Domblduar 348(26); Dudhkla 348(6); 348(6); Dudhpama 348(4); Dul('bltha 348'20); Dumarbakl 207(1); 348(10); DumarJor 348(1); DUlllEer 348(2); Durlllgana 209(5) ; 273(1); 289(2); 348(28); 369(2); 393(6); Fatehpur 283(3),348(4); GadI348(12), GadldlghI348(4); Galphuha 348(22) ; Gamhardlh 348(9); Garang 348(48); Garanga (Thana 110. 19); 348(4); Gardlh 273(1); 348(39); 393(3); Gana Dighl 348(9); Garhatarr 348(1); Garhl 348(17); Garh (thana 110 24); 348(27); Ghaghra 348(2); Ghaskari Dlh 289(2); 348(16); 350(1); Ghormarwa 348(4); Ghose 348(50) ; Ghutla 348(3); 365(1); Gldhaslmar 348(10);Gldhatanr 369(1); Gldl Kalan 289(1); 348(8); 350(1); 393(8); Gola Ahar 348(6); Gordhowa 348(3) ; Gortoli 283(16); 348(18); Gumathar 348(16) ; Harldlh 288(5) ; 348t30) ; 369(1); Harkund 207(1); 288(2); 348(11); Rarls 273(1) ; 348(130) ; Harmatanrl 348(2); Hathgalh 207(8) ; 348(19) ; 350(4) ; Jaduradlh 348(4) , Jagsemar 348(9); Jalkhanodlh 288(1); 348(5); Jamdlha 209(3); 289(1); 348(31); JamdlhaBagl aZ a8AJmerdih 289(3); 34i(25); Jamkhukhro 283(2); 348(53) ; 350(1) ; 369(7);393(5) ; Jamunia 348(2) ; Jawarl
Dhanwar Anchal
200(14); 207(1); 209(27); 220(1); 235(8); 273(19); 283(1); 311(1); 348(60); 350(15); 365(6); 369(14); 388(4); 393(17); 394(1);
Arkhango 209(1); 348(1); 369(2); Balhara 200(2); Barjo 200(1); BhingodIh 348(7);
348(3); Jirodlh 348(28); Kaknia 348(6); 350(1); Kantl Dighl 289(4); 348(9); Karl 348(9); Karldlh 348(18); KarlJhal 348(17); Karmatanr 348(7); Karmatanr 348(13) ; Karmatanr 348(17); Kasola 348(5); Kendua 348(8) ; KhaJmunda 289(4) ; 348(5) ; 350(5); KharlOdlh 348(24); 369(1); Khataun207(1); 348(1); Kheroun 365(1}; KhISlodlh Chak MaJo 348(48); KhISlodlh KISgO 348(41); KhlSlodlh Latakl 207(3); 348(32); KhoJar Tola 348(28) ; Khoto 348(25) ; Klago 200(1) ; 273(1); 282(4); 283(1); 311(4); 348(23); Ktrko 348(7); Komdlh 348(19); Kolambad 348(5); Koso Gondodlghl 207(1); 288(1); 348(34) ; 350(2) ; Kundllwa 348(4) ; Labanla 288(8); 348(1l); Larlatanr 348(5); Lohlban 348(5); MachhlJ 20-(5); 348(i); Madhopur 348(27); Madnadlh 348(1l) ; Maharadlh273(2) 348(43) ; Maheshadlghl 348(15); Maheshkesor 273(1) ; 348(14); Makdlha 207(12); 348(23); Maktodhara 348(10) ; Maldtha 207(2) ; Manakdtha 289(2); 348(10); Manlkabad 207(9); 273(1); 283(2); 288(4); 289(1); 348(100) ; 350(6) ; 369(1); 393(1); ManJhladth 348(21); ManJhiladlh (Thana no. 534); 348(16) ; Marudth 207(2); 348(54); NaekdIh 207(5); 348(3); Nankar Randlh "348(18); Narampur 348(35); Nawada 207(2); 348(2); Nawabandh 348(13); Nek PUra 289(14); 348(17); 393(4); Nematanr 348(11); Monlatan 348(7); Pachpahan 348(2); Padmatanr 348(3); Paharpur 348(6); Palmarua 348(4) ; Pandedlh 348(7) ; PandedIh (Thana no. 542) ; 350(2) ; Pandedlh (Thana no 1,3); 348(12) ; Pandnadlh 348(10); Parbatraldth 283(1); 248(3); Parbatudlh 207(1); 288(5); 289(5) 348(3) ; 350(3) ; Parsadlh 348(31) ; Parsatanr 273(1); 348(16); PataldIh 207(5); 348(17); 350(21); Pathalghatla 348(6); Pathandth 348(24); 350(11); Phulnadth348(17) ;Phutka aha8 Barmasla 348(12); Plpradlh 348(14); Plpra Tanr 348(10); Purna Bathan 348(7); Ramadlh 348(8); BaronI Tanr 348(14); Barou Saran 348(8); RIJpurl 348(10); Bmldlh 280(2); 348(7); Salaldlh al a8 KhoredIh 289(6); 348(50); Saroua DIh 348(12) ; Sanfatanr 348(6); SIJhua 348(7); SlkrodIh 207(10) ; 209(3); 273(2) ; 348(183); 350(16); 369(6); 393(2); SUDldumar 348(4); Sogra 348(8); Sondlghl 289(35); 348(1); Sonre 348(11); TapsldIh 348(26); TelodIh (Thana no. 42); 348(1); Telodih (Thana no 153) ; 207(7); Tetarta 348(13); TewarldIh (thana no 008); 348(3) ; Tewarldlh 34S(8) ;TuokdIh 288(2); 348(2); Tuoral Tanr 348(7);
Chattl 369(1); ChordIha 348(9); DasrodIh 393(1); Dhakosaran 348(1); Dhanwar200(7); 209(19); 220(1); 273(4); 283/1); 3U(1); 348(7); 350(13); 365(6); 369(4); 388(3); 393(9); 394(1); Dhemlasarkhawatanr 369(3); Doranda 200(2); 209(6); 272(3); 348(5);

143
VlLLAGEWISE INDUSTRIAL DATA--contd.
Dhanwa, Anehal-COflCId.
348(5); 350(2); 369(1); 388(1); 393(7); Oungapur 273(1); Harda+,dih 207(1); Jaruadih 348(3); Kargalikhurd 273(2); 348(4); Kendua 273(1) ; Khorimahua 273(1) Korwsdih 348(1) ; Kubri 200(1) ; 209(1); 273(2);348(3);
Bfrnf ADellaJ
Total 200(9); 207(4); 209(6); 23b(37); 273{S'i); 281 (I) I' 282(1); 283(8); 288(28); 289(18); 340(13); 348(3); 350(61); 369(21); 388(2); 393(7) ; ,
M&u'l.as •. Arwatanr 350(1); Baherwatanr 369(1); Dalia. 273(1); 369(1); Balidih 273(1); Banpura 348(2); Baradih 288(1); 289(4); 340(6); Barwachatar 273(2) ; BaE'gana 200(1) ; Bharkatta 200(2); 209(4); 369(3) t 38S(2); 393(3); Birajpur 283(3); Binli 273(2); Dalang i 273(5); Dhab 369(1); Duarparlhari 369(1); Gadi 200(1); Guritanr 27S(I); Jamdiha. 273(1); Jaridih .200(2); 279(4);
Glrldlh ADohal
Total 200(37); 205(3); 207(1); 209(99}; 211(1}; 215(1); 220(~); 237(3); 262{1); 270(1); 273{/6); 280(1); 281(3); 282(8); 288(14) ; 289(1); 301(2); 311(13); 336(1); 339(2); 340(1); 343(3); 348(285); 350(45); 368(1); 369(,3); 38(1(1); 384(23); 388(20); 392(5); 393(28); 39!)(1);
Rural 200(13); 209(28); 211(1); 220(2) ; 273(26); 288(4); 289(1); 340(1); 843(3); 348(11); 35()(24.-:); 369(54); 380(1); 384(2); 393(8) ; 399(1) ;
Urban 200(24); 205(3); 207(1); 209('il) ; 210(1) ; 220(5); 237(3); 262(1); -2H(I); 273(00) ; 280(1) ; 281(3); 282(8); 288\] (Jl; 301(2); 311(13) ; 336(1); 339(2); 348(274) ; 350(21); 368(1); 369(19); 384(21); 388(26); 39~(5); 393(20),
Mauzas •• Akdonikhurd 209(6); 289(1}; Sol()(I); 843(3); 369(4); 380(1); 384(2); 399(1); Baddiha
Town
Total
MauZIlS
Tohl
GIRID1B MUNICIPALITY
200(24); 205(3); 207(1); 209(71);, 220(5) ; 237(3); 262(1); 270(1) ; 280(1); 281(3); 282(8); 288(10);
215(1) ; 273(50) ; 801(2) ;
Bengabad Anehal
200(4); 209(8); 273(16); 281(1); '88(5) ; 348(4); 350(65); 369(3) ; 388(1); 393(8).
Bengabad 200(2); 209(5); 273(3); 393(1); Chapuadih 273(3) ; Dumarjore 350(2}; l{hutri-bad 393(4); Lalpur 273(1); 348(3); Luppi
Gande Anchal
200(6); 207(1); 209(40); 235(102); 213(19); l'tIauza.s 3ll(I); 350(33); 369(7); 388(1); 393(10);
T.albazar 235(8); 273(4); Madhopur 348(1); Manodih 348(10) ; Nawadih 348(2); Nimadih 348(4); Panehrukhi369(3); Saharpura273(1); Upralidhanwar 200(1); 348(2);
289(1}; 393(1); Jharkhi 283{5}; Kendua 289(2); 350(5); Kenduadih 2730) ; 393(2) ; Keshodih 288(3) ; 350(3) ; 369(4); Kharkhari 200(1); 273(1); 281(1); 282(1); 289(5); 340(7); 350(1); 369(3); Kubri 273(3); 289(5); 350(2); Kusmai 236(37); 273(1); Lakarga.!'ha 273(1); 369(1); Lukuia 369(1); Makhmargo 2~3~5); Manikdiha 209(2); 273(2); 288(15); 800(9); 398(1); Margora 207(4); 273(1\; 289(1 i; 350(40}; Nagri 200(1}; Palaunjia. 200(1) 348(1); Pesham 273(2); 369(3); Pipradih 288(9) ; 369(1) ; Purnanagar 273(1) ; SManda 273(2) ; 369(1) ;
369(1); Badgunda Kalsn 350(5); 369(1); Badgunda Khurd 350(1); Bakshidih 209(1); 273(1); Beltanr 200(1); 209(5); 273(4) ; 369(21); Dhorandi 220(1) ; Chamarkho369(1); Dandidih 200(2); 2(1)(1); 211(1); 220(1) ; 273(2); Dhanaidih 369(5); Gadisirampur 200(1); 209(4); 273(8); 369(1); 393(2) ; Giridih 20(1(1); Bandhadih 369(1); BarSingh Raidih 273(2); Jaridlh Pachamba 350(3) j' Jaspur 288(3); Kalyandih 369(1); Karharbari 2(;(1(2); 348(7 ) ; 393(1); Kodaia 36!l(1); Kurumctiha 3C9(1); Lakhanpur 369(1); Leda 200(2); 209(2); 273(3) ; Lohpiti 369(3); Mahesh Mundi 209(2) ;273(2); 348(2) ; 393(2) ; M~thadih 273(1) ; M811grodih 2CC(4); 209(5); 273(1); 288(1); 348(1); 369(6); 393(3); Mohallpur 369(1); Muturkha 209(1); 350(5); Palmo S50(3); 369(2) ; Pandedih 369(1) ; Paratdih 209(1) ; 273(2); Purnanagar 350(7); Rautgadi369(1); Tikodih 369l1}; Tolhar Kato M8£l).
311(13); 336(1); 339(2); 348(274); 350(21); 368(1); 369(19); 384(21); 388(25); 392(5); 393(20).
273(3,l; Murhari 273(3); Na.w~ih 273(2); Pardlh 273(1); 288(5); 350(50); Raghaidih 200(2); 209(3); Bobrajpur 350(13); 369(2)Tewa.ri Pahari 393(3); Tiklato 369 (I): Tingharwa. 281 (I); 348(1); 388(1). •
•• Ahilapur 209{!); 273(6); 388(1); 393(5); Baghadih 235(20); 273(1); Ba.rkitanr 369(1);

144.
VILLAGEWlSE INDUSTRIAL DATA-contd.
Gande Anehal-concld.
Belatanr 369(1); Bhadwakalan 200(1); Budhu. dih 273(1); Chapra 350(25); Chengarbad 369(3); Daldalla 235(1); IDarwedih 207(1); Gajkunda 235(16);273(1); 350(8); Gande 200(2); 273(2); 393(4); Girnia 200(1); 273(1); J"har. ghatta 369(1); Karmai 235(24); 273(1);
Dumri AnehaJ
Total 200(13); 207(10); 209(30); 273(66); 280(2); 281(1); 282(4); 288(9); 311(3); 350(114); 369(33); 388(3); 393(33).
Mauzas .. Amra 273(3); 369(2); Asurbandh 273(4); 369(2); 393(1); Atki 209(1); 273(2); Balutuda 200(2); 209(3); 273(1); Baramasia 369(2); Barkibergi 273(1); ~erhasuiyadih 273(3); Bharkhar 273(2); 311(1); 369(2); Bhawanand 369(1); Chalimon 369(1); Chegro 207(4); 28"8(8); 350(30); 369(2} ; Chhotkibergi 369(1); Chininkiroiaruadih 369(1); Chino 207(3); 209(1); 273(5); 282(1); 350 (37); 393(3); Domawara 369(1); Dumri 200(2); 209(2); 273(2); 369(2); 393(3); Isri 200(2) ; 209(14); 273(8); 280(2) ; 282(2) ;
Mawadlh Anehal
Total 200(4); 207(6) ; 209(5) ; 220(3); 273(48) ; 282(1); 288(43); 311(6); 350(173); 369(108); 393(33); 394(1); 399(1),
Mauzas •• Ahardih 369 (3); Alargo 373(1); Argame 282(1); 311(2); 36i)(2); Bhalmara 369(1); Bhandra 200(2); 350(2); 369(54) ; 393(1); 399(1); Bhawani 288 (8); Bodro 369(3) ; 393(22); Burgara 369(1); Chapri 209(1); 369(2) ; Chinidih 273(4); 369(2) ; Dahiari 273(1); 369(1); Ghatiari 273(3); 350(22); .Qonnatu 369(6) ; Junodih 350(16); 369(1); 393(4); Kanjkiro 273(1); 350(15) ;
Plrtanr Anehal
Total 200(10); 207(10); 209(23); 220(1); 235(1); 273(16); 288(67); 289(9); 350(65); 369(28); 393.(18); 394(2).
Mauzas •• Asuradih 288(5); Badro 369(1); Baradihkhu 288(2); Bariarpur 369(5); Bikatpur 288(4); Belkatri 288(19); Bholatanr 369(3); Birgaon 288(6); Chethrudih 207(1); Chirki 200(1); 209(2); 369(1), Chirudih273(1); Datelwa235 (1); Dudhania 350(7); Gamhara 369(2); 394(1); Ghorbad 350(8); Hariladih 200(2); 207,(1); 209(1); 273(3); 350(9); Jabardaha 288(2); 369(1);' Jahajpur 288 (4); Jamuatanr
Total
Bermo Anehal
200(10); 205(7.); 209(138); 220(17); 273(73); Rural 274(2); 281(2); 282(4); 283(1}; 284(1); 288(1) ; 289(3) ; 292(2); 301(1) ; 310(1); 311(13); 313(1); 314(2); 333(1); 336(2); 350(22); 365(2); 369(18); 378(1); 379(3); Urban 381(2); 384(12); 388(9); 389(1); 392(8); 393(15); 394(1); 399(5).
Koiridih 235 (2); Koriad 235(17); Mohandih 209(2); Naukisalaia 209(1); Pachrukhi 311(1); Parmadih 273(1); Phulchi 273(3); Phuli· jharia 200(1); 273(1); Phuliharia 235(22) ; 393(1); PiraRingha 273(1); Putaria 369(1); Taratanr 200(1).
311(1); 388(3); 393(20); Jamtara 200(1); 209(4); 273(2); 393(1); Jangidiri 369 (1); Kalhawar 281(1); 369(3); Khairatpura 273(9); 311(1); 350(9); 369(2); Khakhikalan 207(2); 273(1); 369(2); 393(1); Khetko 273(2); Kulgo 207(1); 273(7); 850(12); 869(2); Lohedih 200(1); ::W9(1); Nagri200(2); 209(3); 273(3) ; 369(2) ; 393(4); Nawadih 850(2); Pargotilaia 369(1); Pipradih (Thana no. 142) ; 369(1); Pipradih (Thana no 67); 200(1); 369(1); Pordag 209(1); Rangamati 273(3); Rasuntaura 273(6); 350(1); Bamda 288(1); 350(23); Bankardih 273 (1); Teliatura 273(1); Tengra Kalan 282(1); 369(1); Thakurohak 200(2). -
369(5); Kh-arpito 200(1); 273(1); 288(12); 350(5); 369(1); Kiohho 273(2); Kimbujharia 394(1); Lahia 207(1); 273(4); Lembudih 350(8), 369(3), Narainpur 273(1); Narra 273(1); 350(6); 369(5); Nawadih 207(5); 273(5); 288(2); Sll(2) 369(2); 393(1); Paiamau .273(2); Pipradih 350(3); Potso 850(8); 869(1); Sahria 273(2); 869(2); Surhi 273(6); 288(2); 311(2); 350(25); 369(2); Taranari Madhubasa 200(1); 273(4); 369(7); 393(1); Taratanr 369(1); Telo 209(4); 220(3); 273(10); 288(19); 350(63); 369(3); 393(4),
207(8); Kharpoka 200(1); 273(4); 350(7); Khukhra 273(1); Madhopur 288(1); 350(4), Mahadeodih 393(18); Maiira 288(6); Mandro 273(1); Naukania 288(2); 369(1); Nawadih 369(2); Ojibad 209(4); 273(1), Paharpur 869(1) ; Palganj 200(2); 209(5); 220(1) ; 273(3); 289(9); 350(8); 369(8); Palma 394(1)
'Pipraaih 288(11); 350(2); Rajudih 350(6); Saharpur GobindplJr 350(4); Bemarkorhi 369(2); Sobranpur 209(11); 350(10); - Bohraia 288(1); Sudhabad 288(4); Taratanr 200(3); 273(2); Tuio 200(1) ; 369(1)
200(2); 209(24); 273(5); 288(1) ; 289(3) ; 311(1); 333(1); 369(7); 381(2); 384(2); 389(1).
200(8); 205(7); 209(114); 220(17); 273(68); 27~(2); 281(2); 282(4); 283(1); 284(1); 292(2); 301(1); 310(1); 311(12); 313(1); 314(2);

145
VILLAGE WISE INDUSTRIAL DATA--concld.
BerJlloO Anchal-concZd.
836(2); 850(22); 865(2); 369(11); 378(1); 379(3); 384(10); 388(9); 392(3); 393(15); 394(1); 399(5).
Mauz8.s •• Bandhdih 273(1), 369(1), Bursara 289(2); 369(1); Chandarpura 209(1); Karo 209(3);
BERlIlO TOWN
333(1); Kurumba 369(2); MakoJi 209 (4) ; 273(1); 384(1); Pipradih 200(1); 209(10); 273(3); 289(1); 311(1); 3&9(1); Rangamati 209(3); 288(1); 369(1); 384(1) ; 389(1) ; Sijhua 200(1) ; 209(3); 369(1); 381(2).
Town 209(17); 220(1); 273(7); ~82(1); 311(1); 393(92).
KARGAR TOWN
Town 209(13); 273(6); 393(:l).
BOR'AItO TOWN
Town 200(6); 273(6); 282(1); 311(2); 350(5); 369(1);
Town
379(2); 384(2); 388(2).
JARID'iR BA'ZAR TOWN
200(8); 205(7); 209(78); 220(16); 273(49); 274(2) ; 281(2); 282(2); 283(1); 284(1); 292(2); 301(1); 310(1); 811(9); 313(1);
6,Census)C-IO
314(2); 336(2); 350(17); 365(2); 369(10); 378(1); 379(1); 384(2); 388(7); 392(3). 393(10); 394(1); 399(5). '

EXPLANATORY NOTE
Besides giving the Census tables, the District Census Handbookof 1951 contained information on vital statistics, rainfall, agriculture, livestock, industries and wholesale prices. The present Handbook seeks not only to continue the tradition but also to enlarge its scope by furnishing official statistics on several other topics. The data contained in the following pages are complementary to the Census tables, and attempt to give a complete statistical picture of the district.
The materials in this section have been obtained from various sources indicated in the tables. They can be broadly divided into eight groups, namely, Vital Statistics, Agricultural Statistics, Livestock, Industry, Administration, Education, Public Health and Communications.
The salient features of the tables under each group are briefly summarised below:
VITAL STATISTICS
Table VS-I-Registered Births and Deaths with Mid-year Rates
This table gives for the district as a whole the number of births and deaths registered during the years 1951-60. The birth and death rates have been calculated both on the 1951 Census and the estimated mid-yearpopulation, i. e, the population on the 30th June of each year.
Table VS-II-Deaths and Death Rates due to Selected Causes
This table furnishes the figures of death by selected causes for 1951-60. The death rates have been calculated for 1951 on the figures for the Census of that year, and in other cases on the estimated mid-year population. Data in respect of four causeS of deat:Q. could be had only for the year 1960 and therefore, they have been presented separately .in the supplement to this table.
AGRICULTURAL STATISTICS
Table AS-I-Rainfall
Monthly rainfall data for the years 1951-60 are presented for the five selected rainfall recording stationl3 at Razaribagh "Observatory",
Pachamba (Giridih), Chatra, Ramgarh and Kodarma. The district average has also been given.
Table AS-II-Highest and Lowest Temperatures
This is a table on temperature. The mean maximum, highest, mean minimum and lowest temperatures recorded at Hazaribagh during all the twelve months of the decade 1951-60 have been given.
Table AS-III-Land Utilisation and Area under Different Crops
This table presents land utilisation statistios for the district as a whole. The figures relate to the six census years beginning from 1911. The manner in which the figures have been worked out is indicated in a note appended to the table.
The terms a.nd concepts used in the table are defined below:
Geographical area: It represents the total land area of the district. The 1951 and 1961 area figures tally with the area worked out by the Bihar Survey. In other cases there are slight differences which may be due to computational errors.
Fore8'8 : All actually forested areas on the land classed or administered as forest under any legal enactment dealing with forests, whether State-owned or private.
Barren and uncuZturable land : All Darren and unculturable land like mountains, deserts, etc. Land which cannot be brought under cultivation unless at a high cost is classed 8S uneulturable Whether such land is in isolated blocks, or within cultivated holdings.
Land put to non-agri(iuZ,uraZ use: All lands occupied by buildings, roads and railways or under water, e. g., rivers and canals and other lands put to uses other than agricultural.
Oulturable wa8te: All lands available for cultivation whether not taken up for cultivation or abandoned after five years for one reason or the other. Such lands may be either fallow or covered with shrubs and jungles

147
which are not put to any use. They may: lie in isolated blocks or within cultivated holdmgs.
Permanent pa8ture8 and other grazing land8 : All grazing lands, whether they are permanent pastures and meadows or not. Village common and grazing lands within forested areaS are included under this head.
M i8ceZlaneou8 tree crop8 and grove8: All cultivable lands which are not included under net area sown, but are put to some agricultu_ral use. Lands under casuarina trees, thatchmg grass, bamboo bushes and other groves for fuel, etc., which are not included under 'orchards' are classed under this category.
Other fallow land: All lands which w~re taken up for cultivation but are temporanly out of cultivation for a period of not less than one year and not more than five years.
Ourrent jallow8 : Lands which are left fallow during the current year only.
Net area sown : The net area sown represents the area sown to crops, counting areas sown more than once in the same year only once.
Oultivated area : The sum of net areas sown and area under current fallows gives the cultivated area.
Section B of the table furnishes details of the area covered by different crops. The totalarea sown under all crops is in fact the gross cropped area, which term means "the sum of areas under all crops and represents the sum of net sown area and area sown more than once in the year."
The cropped area is divided into three main groups, viz., under/food crops, non-food crops and miscellaneous crops. The food crops have been further subdivided into basic food crops and other food crops. The former includes rice, wheat, pulses, fruits and vegetables, and the latter, sugarcane, condiments, and others. Non-food crops have also been likewise subdivided into oilseeds, fibres (which term includes cotton, jute and other fibres), and tobacco. Miscellaneous orops cover fodder and other non-food crops.
Table AS-IV-Gross Area Irrigated by Orops
This table gives the gross cropped and irrigated area for the district' as a whole for six census yeari! beginning from 1911. The break-up of the irrigated area by crops (food and nonfood) has also been indicated.
Table AS-V-Gross Area Irrigated by Sources
This table shows the gross area irrigated in the district by different sources for the six census years beginning from 1911.
Table AS-VI-Yield Rates of Principal Crops
This table furnishes the average yield in maunds per acre in respect of the principal crops of the district for the period 1951-52 to 1959-60.
Table AS-VII-statistics of Skllled and Unskilled Agricultural labourers
This table indicates the average daily wages paid to skilled and unskilled agricultural labourers during the rabi and kharij seasons.
Skilled labourers include carpenters, blacksmiths and mocl"i8 (cobblers). Among the unskilled are the field labourers, herdsmen and other agricultural labourers. Separate figures have been given for men, women and children so far as the unskilled labourers are concerned.
Table AS-VIII-Monthly Ruling Wholesale Prices of Staple Foodgrains
The wholesale prices of staple foodgrains, namely, rice (medium), wheat (red), and gram for all the twelve months during the years 1952-60 are presented in this table for the district. Figures for the year 1951 could not be had.
SubsIdiary Tables
Seven subsidiary tables have been prepared. They are all subsidiary to Table AS-III.
Sub8idiary Table A8-III.l.-Land Utili8ation: It gives the break-up of 1,000 acres of the land area in the district by area under forests, etc., and total cultivable area. The net area sown per 1,000 acres of the land area has also been indicated. The distribution of every 1,000 acres of the total cultivable area in the district by the net area sown and area of fallow and other uncultivated land has also been given. The proportion of the cultivable area, net area sown, net area irrigated, etc., in the district to every 1,000 acres in the State has also been worked out to facilitate comparative study.

148
Subsidiary Toole .AS-III.2-Progress of Cultivation during the last three decades: This table traces the progress of c~ltivation since 1931 in terms of area under foodgrains and other orops, net area sown and area sown more than once.
Subsidiary Table .AS-III.3-Componerlts of Land Area, Cultivable and Cult';,vated Area per hundred perEOns during the last three decades: It shows the incidence of land area, area cultivable, net area sown, etc., per 100 persons in the district. The figures relate to the last three decades.
Subsidiary Table.AS-lIl.4~Cropping Pattern: The table indicates the cropping p3Jttern as in 1951 and 1961. The crops have been grouped under two heads, namely food and non-food. The area oovered by different orops per 1,000 acres of the gross area sown in the district as also their proportion to every 1,000 acres in the State as a whole, has been shown.
Subsidiary Table .AS-III.5-Density of Total! Rural Population per 100 acres of area under Foo:igrain8 and net area sown: This table furnishes the density of total and rural population per 100 acres of area under foodgrains, other crops, net area sown and area sown more than once for the last three decades.
Subsidiary Table AS-III.6-Density of Cultivators and AgriculturaZ Labourer8 per 100 acre3 of net area 80wn in 1951 and 1961 : This table gives the density of oultivators and agrioultural labourers per 100 acres of net area sown in 1951 and 1961. Separate figures have been furnished for the total and rural population.
Subsidiary Table AS-Ill.7-Rainfall, Area Sown and Irrigated, Density, etc.: This table furnishes data on rainfall and gross area sown
_ and irrigated (by different crops) together with yield rates. The density per 1,000 acres of the oropped area and the area under foodgrains has also been given.
LIVESTOCK
Table LVT-I-Government Veterinary Facilities
Veterinary facilities existing in the distriot during the years 1951-52 to 1960-61 are indicated in this table. The nuniber of hospitals,
dispensaries and veterinary doctors has been given year by year.
Table LVT-II-Livestock and Poultry
This table presents the population of livestook and poultry for eight livestock censuses beginning from 1920. The variation in the numbers from census to oensus has also been indicated. Figures preceded by a plus (+) sign denote increase and those by minus( -) sign deorease, from previous figures.
Livestock means all domesticated animals of economic importance and includes oattle, buffaloes, sheep, goats and pigs.
Poultry means domestic avian suoh as fowls and duoks.
INDUSTRIES
Table IND-I-Employment in Textile and Nontextile Industries (As on 31st December, 1960)
The number of industrial establishments in the district with daily average employment in each has been furniShed in this table. The industries have been divided into two broad groups-textile and non-textile. While the former category has only two industries namely, the cotton mills and knitting mills, the latter embraces 24 industries detailed in the table. The rural and urban break-up of the industrialestablishment~ has also been given.
Table IND-II-Name of Industry with number of Households and Persons Employed in Rural Areas only (As in September-October, 1960)
This table furnishes anchalwise industrial data for all the rural areas of the district. These have been extracted from the Houselists prepared during September-October, 1960, as a preliminary step to the 1961 Census. Here also the industrial establishments have been grouped into two broad divisions-textile and non-textile. The textile establishments include weaving. Non-textile establishments cover leather works, .blaoksmithy, carpentry, goldsmithy, laundry, tailoring, bamboo products making, bidi making, manufacture of oils, preparation of sweets, etc. The number of villages 'Y'here the particular type of industrial establishment is found along with the number of households and number of persons engaged in it, has been indicated anchalwise.

1M!
The industries whi~h are not wm£!l()n in many of the anohals hayc been shown in the supplement to this table to save space.
ADMINISTARATION
Table ADM~I-Gene1'8.1 Results of Trial of Criminal Cases General results of trial of criminal cases in
the district for the {Jeriod 1951~6(} have been shown in this table. Section A gives the manner of di8pm~al of criminal (lases in terms of persons affected in the lower courts, while Section B deals witn the results of appeals and revisions.
Table ADM-II-Punishments Inflicted in Criminal Oases ThiEl table gives for the distrjct data on
punishml')nts infiict€d in crimina.l C3ses during the period 1951~60.
Table ADM-lll-strength of Pollee
The strength of Police force in t.he district during the years 1951-(iO has been shown in thh; table for every category of policemen.
Table ADM-IV-Places of Confinement and Distribution ot convicts bl' Agegroups and Literacy
This table gives the average daily number of prisonNs in the central jail of Raza,ribagh and other Bub-jails. The nUOlbet: of {lonvicts and their distribution by age groups and literaoy has also been indicated. The figures relate to the years 1951-00.
Table ADM~V-Co-opera.t"e Societies
The data regarding Co-ollerative Societies are presented in this table f(;r the years 1950-51 to HH59-o0. The societies haive been grouped into four broad categories, namely, Primaxy Agrioultural Societjes, Non~a.griCl;tltural Societies, Provincial and Central Oredit Societies and Central Co~operative Banks and Unions. The tirst two have been further subdivided into Non -credit and Credit Societies. For each type of Co-operative Society. information is given i'bout the number of %ocieties, number of members, working capital (in rupees), and profit or lOBS (in rupees). Figures preceded by plus (+) S1gil denote profit, n.nd those by minus (-) sign indicate loss.
F1gures for the Provincial and Central Creuit Societies could not be available.
Table ADM-VI-Receipts of Excise Revenue, Sal~ Tax, Enteltainment-tax, Motol-S'Pl.rit Tax, Stamps. etc.
This table gives for the district details of collections made under various heads such as excise, sales tax, entertainment-tax, motorspirit tax, etc., during the years 1951-52 to 1960-61. ::Figures for registration fee relate to t.he calenda-r years 19S1-60.
Table ADM-VII-Land Revenue/Rent
Figures relating to the deIlland and collection of land revenue/rent for the district, along with the percwtage d collection to the demand, have been given in this tallle. The State Government started taking over the zamindari interests under the Bihar L8.Jld Reforms Act, 1950 in 19M-55. Prior to this, the za,mindars :paid land revenue to Government and the raiyats generally paid rent to the za,mindars. The collection of rent by Government started in 1954Ai5 oonsequent upon the "Vesting of the zamindari interests in the State.
Table ADM-Vlll-Number 01 Registered Documents and value of propeItles nansferred
Registration statistics are, presented in this table for the decade 1951-60. The number of instruments registered and tae value of property transferred are given in this table along with gross receipts and expenditure for the distri(lt as a whole.
Table ADM-IX-8ale and Discharge under Small Savings Scheme
This table furnishes data relating to t·he sale and discharge of certificates under the Sroan Savings Schemes. Figures have been given separately for the Treasury 'Savings Deposit, Post Office Savings Dank, 15~Year Annuity Certificate and Natioaal Plan Savings Certificate for the period 1954~55 to 1960-61.
Table ADM-X-List of Banks
It contains a list of :Banks in the district. Column 1 gives the names of places where banking facilities exist, while column 2 indicates the name!,'; of Bank:>.

150
Table ADM-XI-Progress of Life Insurance
This table traces the progress of Life Insurance in the district from the year 1957 onward.
Table ADM-XII-Number of Motor Vehicles
The number of motor vehicles in the district during the period 1950-51 to 1960-61 is shown in this table. Separate figures have been given for different types of automobiles. State figures have also been given to facilitate comparison.
EDUCATION
Table EDN-I-Educational Institution and Pupils
This table gives the number of various types of educational institutions with pupils therein. Column 10 of the table shows the population in the relevant age group the pupils of which generally receive schooling in the institutions noted against it in column 1. Column 7 furnishes figures of enrolment in 1960-61. The percentage of the pupils enrolled to the total population in the relevant age group has been given in column 13. Since enrolment in schools for professional and special education is open to pupils belonging to a very wide age group, no figures similar to coll!ron 8 onwards have been furnished for such institutions.
Table EDN-II-List of Educational Institutions
This table gives a list of middle and higher educational institui-ions. Column 1 shows the type of institution and column 2 the location in alphabetical order. Where two or more educational institutions exist, the names of such institutions have been indicated within brackets immediately after the name of the locality.
Table EDN-I1I-Press and Journals
This table shows the number of printing presses in the district, and the publications
brought out by them during the period 1951-52 to 1960-61.
Table EDN-IV-List of Cinema Houses
It gives a list of cinema houses in the district.
PUBLIC HEALTH
Table PH-I-Medical Facilities
This is a table on medical facilitiEs. Part A of the table gives the number of degree or diploma holding medical practitioners registered in the district at each year during 1951-60. Part B indicates the number of hospitals and dispensaries. Part 0 is a list of other health institutions, viz., Family Planning Centres, Leprosy Centres, Maternity and Child Welfare Centres and T. B. Centres/Ward.
COMMUNICATIONS
Table CMN-I-Mileage of extra Municipal Roads maintained by Public Authorities
The mileage of various types of roads in the district maintained by the Public Works Department and the Looal BodiES other than municipalities is indicated in this table.
Table CMN-II-List of InspectionjDak Bungalows
This is a list of Inspection jDak :Bungalows with details of amenities existing in each.
Table CMN-III-Polymetric Table of Distances (in miles)
This is a ploymetric table of distances in miles. The district, subdivisional and anchal headquarters, numbering 42, find place in the table. Each place is connEcted with the remaining ones by a vertical line. The road distance between any two places on the table can be read along the vertical line connecting the two places., Rail distances are given within brackets for pJaces connectEd by rail as well.

151
VITAL STATISTICS
TABLE VS-I-REGISTERED BIRTHS AND DEATHS WITH MID-YEAR RATES
Births and deaths 1951-60 1951 1952 1953 1954 1955 1956 1957 1958 1959 1960
2 3 4 5 6 7 8 9 10 11 12
1. Births
Male 149,628 18,081 13,389 16,351 17,820 14,282 15,696 14,261 13,975 12,211 13,562
Female 132,945 10,612 12,270 15,085 16,677 13,112 14,470 13,305 13,158 11,354 12,902
2. Birth rate (a)
Male 7.72 9.33 6.91 8.44 9.20 7.37 8.10 7.36 7.21 6.30 7.00
Female 6.86 5.48 6.33 7.79 8.61 6.77 7.47 6.87 6.79 0.86 6.66
3. Birth rate (b)
Male 6.96 9.27 6.72 8.03 8.57 6.73 7.24 6.44 6.17 5.28 5.74
Female 6.18 5.44 6.l6 7.41 8.02 6.17 6.67 6.00 5.81 4.91 5.4t1
4. Female birth8-reported per 888.50 586.91 916.42 922.57 935.86 918.08 921.89 932.96 941.54 929.82 951.33 1,000 ;male births
5. Death8
Male 87,146 8,257 8,625 9,235 10,218 7,502 10,345 11,089 8,600 6,709 6,566
Female 71,887 6,565 7,002 7,980 8,572 6,259 8,886 9,304 7,024 4,711 5,584
6. Death rate (0)
Mltle 8.88 8.41 8.79 9,4,1 10.41 7.65 10.54 11.30 8.76 6.84 6.69
Female 7.52 6.87 7.32 8.35 8.97 6.55 9.30 9.73 7.35 4.93 5.84
7. Death rate (d)
Male 8.03 8.36 8.56 8.98 9.73 7.00 9.46 9.93 7.55 5.77 5.53
Female 6.74 6.82 7.11 7.93 8.33 5.95 8.26 8.46 6.25 4.10 4.75
8. Female deaths-·reported per 824.90 795.08 811.83 864.10 838.91 834.31 858.97 839.03 8L6.74 702.19 850.44 1,000 male deaths.
NOTES: (a) Number of births per 1,000 of the total population calculated on the population of 1951.
(b) Nu;mber of births per 1,000 of the total population calculated on the estimated population on the 30th June of each year.
(0) Number of deaths per 1,000 population of the same sex calculated on the population of 1951.
(d) Number of deaths per 1,000 population of the same sex oalculated on the estimated population on the 30th June of each year.
SOURCE : Directorate of Statistics, BihlU'.
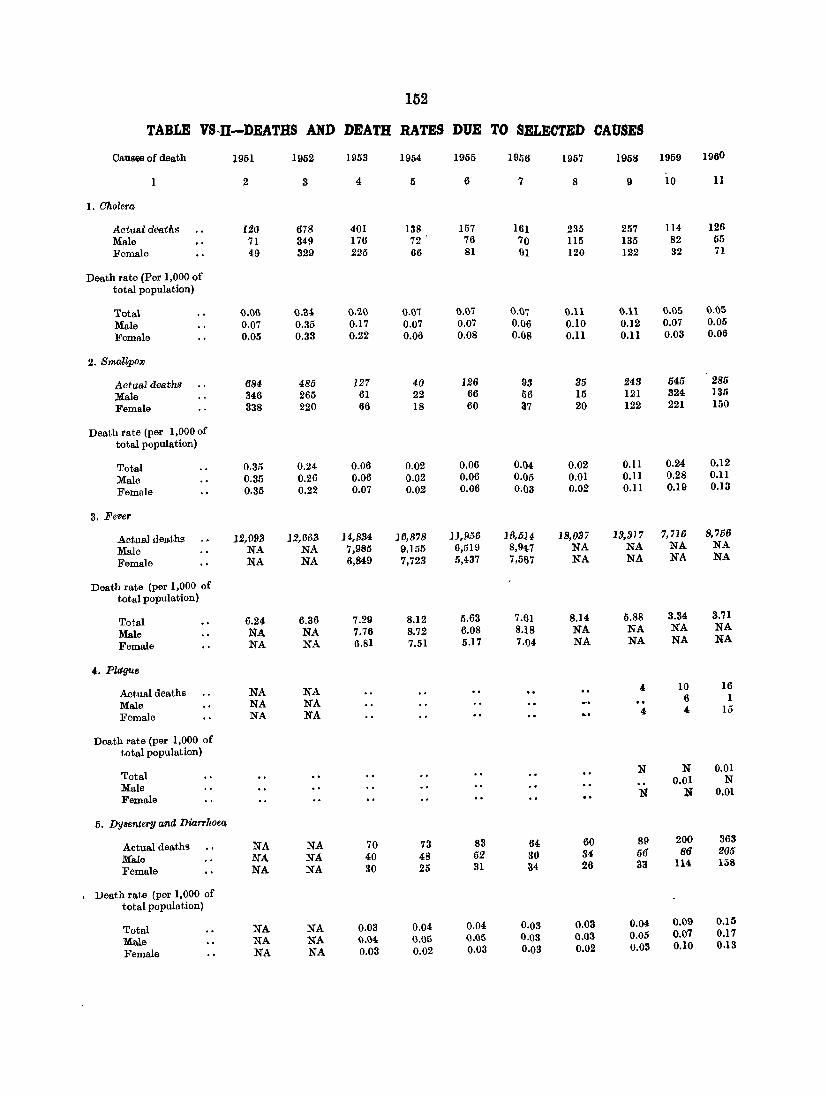
152
TABLE VS-ll-DEATHS AND DEATH RATES DUE TO SELECTED CAUSES
Causes of death 1951 1952 1953 1954 1955 1956 1957 1958 1959 1960
2 3 4 5 6 7 8 9 10 11
1. Oholera
Actual deaths 120 678 401 138 157 161 235 257 114 126 Male 71 349 176 72 76 70 115 135 82 55 Female 49 329 225 66 81 91 120 122 32 71
Death rate (Per 1,000 of total population)
Total Q.OO Q.M Q.20 0.07 0.07 O.\}7 0.11 0.11 O.OS O.OS
Male 0.07 0.35 0.17 0.07 0.07 0.06 0.10 0.12 0.07 0.05
Female 0.05 0.33 0.22 0.06 0.08 0.08 0.11 0.11 0.03 0.06
2. Smallpox
Actual deaths 684 485 127 40 126 93 35 243 545 285
Male 346 265 61 22 66 li6 15 121 324 135
Female 338 220 66 18 60 37 20 122 221 150
Death rate (per 1,000 of total population)
Total 0.35 0.24 0.06 0.02 0.06 0.04 0.02 0.11 0.24 0.12
Male 0.35 0.26 0.06 0.02 0.06 0.05 0.01 0.11 0.28 0.11
Female 0.35 0.22 0.07 0.02 0.06 0.03 0.02 0.11 0.19 0.13
3. Fever
.Actual dMths J2,093 12,663 14,834 16,878 ]],956 16,5U 18,037 13,317 7,716 8,756
Male NA NA 7,985 9,155 6,519 8,9~7 NA NA NA NA
Female NA NA 6,849 7,723 5,437 7,567 NA NA NA NA
Death rate (per 1,000 of total population)
Total 6.24 6.36 7.29 8.12 5.63 7.61 8.14 5.88 3.34 3.71
Male NA NA 7.76 8.72 6.08 8.lS NA NA NA NA
Female NA NA 6.81 7.51 5.17 7.04 NA NA NA NA
4. Plct{J1.te
Actual deaths NA NA 4 10 16
Male NA NA 6 1
Female NA NA 4 4 15
Death rate (per 1,000 of total population)
Total N N 0.01
Male 0.01 N
Felllale N N 0.01
5. DY8enteryana DiarrhoeQ,
Actual deaths NA NA 70 73 83 64 60 89 200 363
Male NA NA 40 48 52 30 34 56 86 205
Fe;male NA NA 30 25 31 34 26 33 114 158
, Death rate (per 1,000 of total population)
Total NA NA 0.03 0.04 0.04 0.03 0.03 0.04 0.09 0.15
Ma.le NA NA 0.04 0.05 IJ.05 0.03 0.03 0.05 0.07 0.17
Female NA NA 0.03 0.02 0.03 0.03 0.02 0.03 0.10 0.13
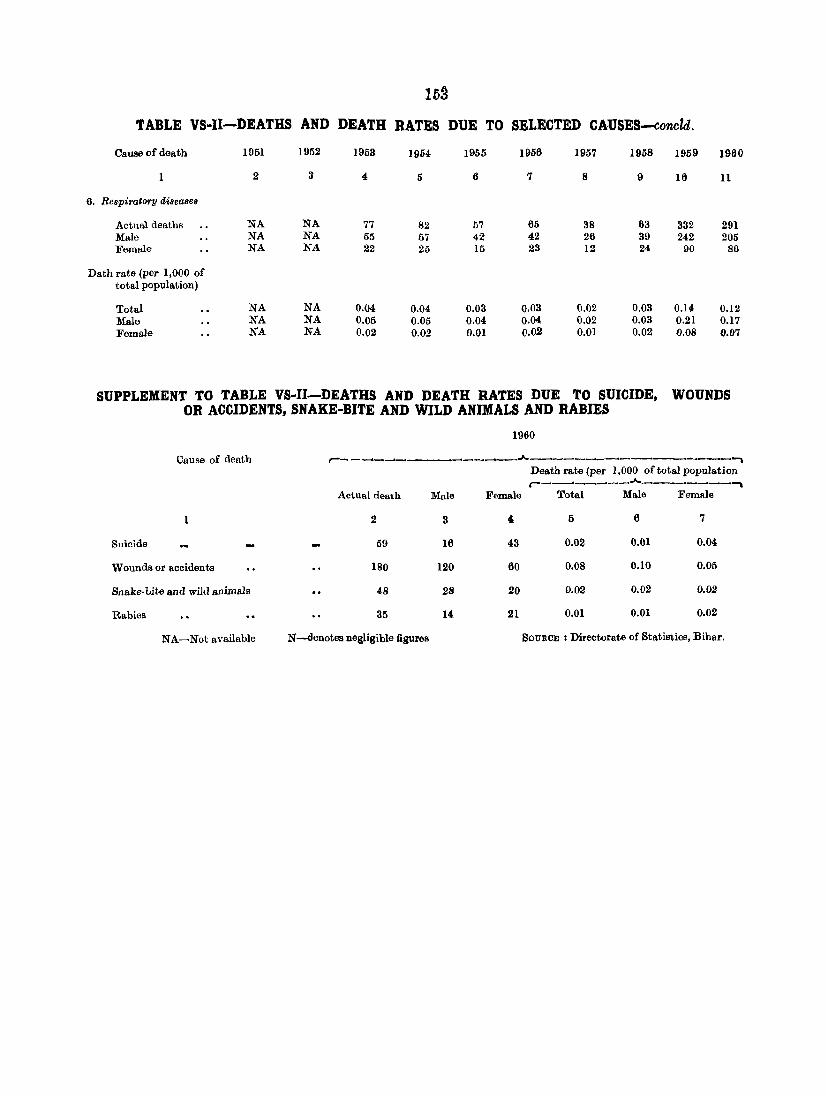
uS TABLE VS-I1-DEATHS AND DEATH RATES DUE TO SELECTED CAUSES-concld.
Cause of death 1951 1952 1953 1954 1955 1956 1957 1958 1959 1960
1 .2 3 4 5 6 7 8 9 It} 11
6. Respiratory di8eaSeB
Actual deaths NA NA 77 82 57 65 38 63 332 291 Male NA NA 55 57 42 42 26 39 242 205 Female NA NA 22 25 15 23 12 24 90 86
Dath rate (per 1,000 of total population)
Total NA NA 0.04 0.04 0.03 0.03 0.02 0.03 0.14 0.12 Male NA NA 0.05 0.05 0.04 0.04 0.02 0.03 0.21 0.17 Female NA NA 0.02 0.02 0.01 0.0.2 0.01 0.02 0.08 0.07
SUPPLEMENT TO TABLE VS-I1-DEATHS AND DEATH RATES DUE TO SUICIDE, WOUNDS OR AOOIDENTS, SNAKE-BITE AND WILD ANIMALS AND RABIES
1960
Cause of death ~ ________________ A _______ ~ __________ ~
Death rate (per 1,000 of total population r--~ _____ A ________ ,
Actual death Male Female Total Male Female
1 2 3 4 5 6 7
Suicide 59 16 43 0.02 0.01 0.04
Wounds or accidents 180 120 60 0.08 0.10 0.05
Snake·bite and wild animals 48 28 20 0.02 0.02 0.02
Rabies 35 14 21 0.01 0.01 0.02
NA-Not available N-denotes negligible figures SOURCE: Directorate of Statistics, Bihar.
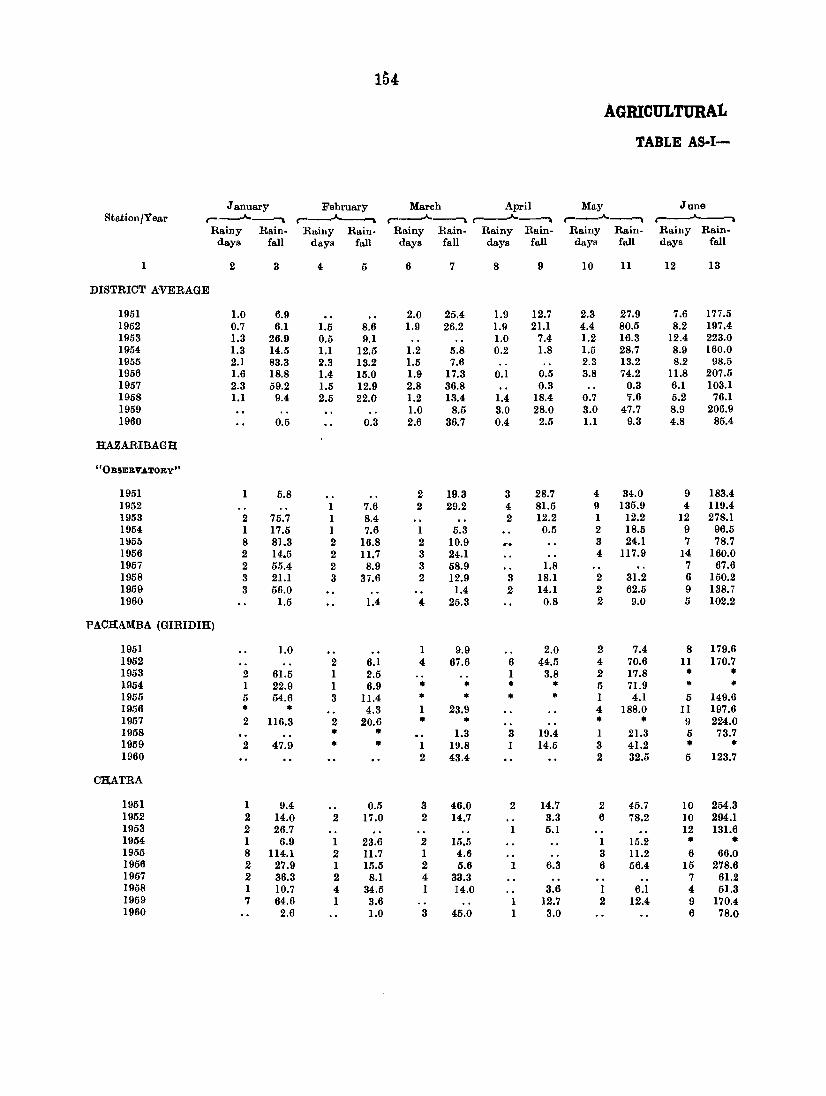
154
AGRICULTURAL
TABLE AS-I-
January February March April May June Station/Year r---"-------'"'"\ r--'-----. r__.A.----. r_..A._, r--.A.~ ~~
Rainy Rain- Rainy Rain- Rainy Rain- Rainy Rain- Rainy Rain- Rainy Rain-days fall days fall days fall days fall days fall days fall
1 2 3 4, 5 6 7 8 9 10 11 12 13
DISTRICT .AVERAGE
1951 1.0 6.9 2.0 25.4 1.9 12.7 2.3 27.9 7.6 177.5 1952 0.7 6.1 1.5 8.6 1.9 26.2 1.9 21.1 4.4 80.5 8.2 197.4 1953 1.3 26.9 0.5 9.1 1.0 7.4 1.2 16.3 12.4 223.0 1954 1.3 14.5 1.1 12.5 1.2 5.8 0.2 1.8 1.5 28.7 8.9 160.0 1955 2.1 83.3 2.3 13.2 1.5 7.6 2.3 13.2 8.2 98.5 1956 1.6 18.8 1.4 15.0 1.9 17.3 0.1 0.5 3.8 74.2 11.8 207.5 1957 2.3 59.2 1.5 12.9 2.8 36.8 0.3 0.3 6.1 103.1 1958 1.1 9.4 2.5 22.0 1.2 13.4 1.4 18.4 0.7 '1.6 5.2 76.1 1959 1.0 8.5 3.0 28.0 3.0 47.7 8.9 206.9 1960 0.5 0.3 2.6 36.7 0.4 2.5 1.1 9.3 4.8 85.4
HAZARIBAGH
"OBSERV.A~ORY"
1951 1 5.8 2 19.3 3 28.7 4 34.0 9 183.4 1952 1 7.6 2 29.2 4 81.5 9 135.9 4 119.4 1953 2 75.7 1 8.4 2 12.2 1 12.2 12 278.1 1954 1 17.5 1 7.6 1 5.3 0.5 2 18.5 9 96.5 1951> 8 81.3 2 16.8 2 10.9 3 24.1 7 78.7 1956 2 14.5 2 11.7 3 24.1 4 117.9 14 160.0 1957 2 55.4 2 8.9 3 58.9 1.8 7 67.6 1958 3 21.1 3 37.6 2 12.9 3 18.1 2 31.2 6 150.2 1959 3 56.0 1.4 2 14.1 2 62.5 9 138.7 1960 1.5 1.4 4 25.3 0.8 2 9.0 5 102.2
PACHAMBA (GIRIDIH)
1951 1.0 1 9.9 2.0 2 7.4 8 179.6 1952 2 6.1 4 67.6 6 44.5 4 70.6 11 170.7 1953 2 61.5 1 2.5 1 3.8 2 17.8 '" '" 1954 1 22.9 1 6.9 '" '" '" '" 5 71.9 '" '" 1955 5 54.6 3 11.4 '" '" '" '" 1 4.1 5 149.6 1956 '" '" 4.3 1 23.9 4 188.0 11 197.6 1957 2 116.3 2 20.6 '" '" '" '" 9 224.0 1958 '" '" 1.3 3 19.4 1 21.3 5 73.7 1959 2 47.9 '" '" 1 19.8 1 14.5 3 41.2 '" '" 1960 2 43.4 2 32.5 5 123.7
CHATRA
1951 1 9.4 0.5 3 46.0 2 14.7 2 45.7 10 254.3 1952 2 14.0 2 17.0 2 14.7 3.3 6 78.2 10 294.1 1953 2 26.7 1 5.1 12 131.6 1954 1 6.9 1 23.6 2 15.5 1 15.2 '" '" 1955 8 114.1 2 11.7 1 4.6 3 11.2 6 66.0 1956 2 27.9 1 15.5 2 5.6 1 6.3 6 56.4 15 278.6 1957 2 36.3 2 8.1 4 33.3 7 61.2 1958 1 10.7 4 34.5 1 14.0 3.6 1 6.1 4 51.3 1959 7 64.6 1 3.6 1 12.7 2 12.4 9 170.4 1960 2.6 1.0 3 45.0 1 3.0 6 78.0

155
STATISTICs , .. ~
RAINFALL
(Rainfall in millimett'es)
July August September October November December r-- - -"-- - -'"""\ r-- - -"-- - --,. r-- - -"-- - -,. r----"-_--,. r---"""'---,. r----"----,. Rainy Rain- Rainy Rain- Rainy Rain- Rainy Rain- Rainy Rain- Rainy Rain- Station/Year
days fall days fall days full days fall days fall days fall
14 15 16 17 18 19 20 21 22 23 24 25 1
DISTRICT AVERAGE
12.3 285.2 11.2 207.8 7.5 196.6 4.0 69.1 0.4 4.1 1951 14.1 250.9 15.9 266.7 10.7 264.9 3.7 56.9 0.1 0.5 1952 17.7 438.9 19.1 446.0 10.2 257.1 0.8 9.9 0.3 13.2 1958 13.5 236.7 12.7 267.2 18.7 237.2 2.5 30.2 0.2 1.3 1954 19.8 352.0 11.2 243.8 8.5 113.8 3.7 24.6 18.5 1955 13.1 222.3 16.3 242.1 14.2 279.9 7.8 143.3 0.7 9.7 1.0 13.5 1956 16.7 381.0 11.0 182.4 7.9 202.2 0.6 8.4 1957 14.9 276.1 15.1 251.8 13.7 316.3 5.3 90.1 1958 14.9 329.3 15.1 279.1 13.4 251.8 8.8 373.1 1959 17.4 263.2 21.4 391.2 10.9 230.8 2.6 59.1 0.1 0.9 1960
llAZARIBAGH
"OBSERVATORY"
12 338.3. 15 222.5 12 320.5 6 106.7 2.0 1951 17 315.7 23 336.8 10 217.2 5 30.7 1 3.3 1952 20 599.4 24 432.8 12 240.0 2 36.6 2 7.9 * * 1953 17 251.5 16 336.3 14 317.7 5 40.9 1 4.1 1954 23 379.5 16 272.0 5 108.7 5 51.1 2.8 1955 14 216.7 21 287.5 ]5 206.5 8 113.3 1 9.1 • • 1956 20 291.6 * * 9 245.1 2.0 191)7 15 242.5 13 320.6 * * NA NA 1958 21 478.4 16 365.7 IS 314.1 8 209.3 1959 19 307.6 20 565.9 12 240.5 5 75.0 1960
PACHAMBA (GIIUDIB)
15 315.2 17 186.9 10 233.7 6 90.7 2.5 1951 15 291.6 16 290.3 11 357.9 3 19.8 1952 17 305.6 18 396.2 9 241.8 2 lli.7 2.3 1953 16 423.9 12 163.1 9 182.6 2 55.1 1.0 1954 13 334.3 Ii 149.6 8 87.1 * • 1.5 1955 10 171.5 10 199.6 14 309.1 9 127.3 1 26.4 * ... 1956 21 418.6 14 210.1 9 80.0 1 4.6 * * 1957 13 275.5 9 208.4 13 366.5 8 180.6 1958 20 319.5 17 266.4 16 246.5 12 565.4 1959 20 174.9 24 477.0 * '" 'II • 1960
CBATRA
13 245.9 19 303.3 7 170.4 3 38.3 1 2.5 1951 14 226.6 20 280.9 13 322.6 5 51.3 1952 16 447.5 16 488.2 10 168.4 1.5 1953 14 239.5 14 240.3 13 215.7 2 9.7 0.5 1954 24 390.4 16 148.8 12 176.3 I 20.8 1.5 1955 16 193.8 20 324.6 14 276.1 7 44.5 3.3 1 20.8 1956 16 357.1 15 217.9 10 253.5 1.3 1957
* '" 16 323.3 19 290.4 5 49.2 1958 16 500.4 16 334.6 14, 197.2 10 226.3 1959 16 284.2 21 445.0 13 329.0 I 8.0 1960

Station/Year
RAMGARH
1951 1952 1953 1954 1955 1956 1957 1958 1959 1960
KODARMA
1951 1952 1953 1954 1955 1956 1957 1958 1959 1960
Station/Year
1
RAMGARH
1951 1952 1953 1954 1955 1956 1957 1958 1959 1960
KODARMA
1951 1952 1953 1954 1955 1956 1957 1958 1959 1960
NA-Not available
15(\
TABLE AS-I-RAINFALL-concZd.
January r-__ .A. __ .,
Rainy Rain-dp.ys fall
2 3
1 9.7 1 17.8 • • • • • • • • • • 1 12.7 1 14.5
Out of order
2 0.5
2 31.2 1 8.6 • • 2 30.5 2 66.8
1.8 6 100.8
July r--_.A.__.,
Rainy Rain-days fall
14 15
15 327.7 '" . '" '" '" . '" . '" '" '" .
18 219.0
'" '" '" . 12 300.5 15 218.9 15 336.5 15 291.1 19 303.5
4 294.6 13 336.5 12 227.1 16 261.5 17 314.7
February r--_.A._-., Rainy Rain-
days fall
4
'" • • '" '" '" '" '"
2
2
'" 1 1 1 2
5
'" '" '" '" '" '" '" '"
20.3
27.2 •
7.9 12.7
9.7 5.0
August r---.A._., Rainy Rain· days fall
16
8
'" '" '" • '"
11 19 •
10
17
20S.8
'" '" '" '" '"
240.3 170.4
'" '"
17 222.8 19 338.3 16 321.1 11 313.7
8 403.6 14 229.6 11 141.7 16 184.3 14 31S.5 19 364.6
March r--_..A._---. Rainy Rain-days fall
6
4 • • '" '" '" • • ..
1 2
1 1 3
1
2
7
41.1
'" • .. '" '" '" '" '"
31.2 26.4
4.1 6.9
20.1
6.9
38.6
September r---.A.__., Rainy Rain-days fall
18
7
'" '" '" '" '" '"
15
'" '"
19
214.1
'" '" '" '" '" '"
596.0
'" '"
9 170.9 12. 239.3 12 264.2 15 137.7 9 S2.5 . '" 8 236.5
12 274.8 9 IS0.4 9 170.6
·Rainfall return not received.
April r--_.A._-., Rainy Raindays fall
S
5 • • • '" '" .. 1 • •
2 1 3 1
1
1
9
48.0
'" .. '" '" '" ..
12.7
'" '"
9.7 10.2 15.5 7.9
2S.7
7.6
October r---.A._-., Rainy Rain-days fall
20 21
3 117.1 '" . '" '" '" '" '" '" '" '" 1 7.6 '" .
Out of order
'" '"
5 63.3 2 24.9
0.5 4 39.4 5 76.5 7 121.2
3.3 4 56.4 9 326.4
2.6
(Rain/all in millimetres)
May r--- .A. __ .,
Rainy Rain-days fall
10
'" '" '" '" '" ... '" 1
'" •
4 4 1 1
2
3 3
II
'" '" '" '" '" '" '"
12.7 • '"
52.S 99.8
5.3 14.5
I.S 39.1
0.5
38.1 23.4
November r---.A._., Rainy Rain. days fall
22
•
'" '" '" '"
'"
1
•
23
'"
'" '" '" '"
...
18.8
...
June r-___.A.--., Rainy Rain-days fall
12 13
5
'" '" '" '" '" '" 7
'" '"
92.5
'" '" '" '" '" ...
65.8
'" '"
'" '" 11 254.0 11 235.2 15 244.9
7 77.2 12 189.0
7 111.0 3 29.4
10 187.2 5 111.4
December r---.A._-., Rainy Rain days fall
24
'" '" '" '" '"
'"
2
25
• '" '" '" '"
'"
19.3
SOURCE : Directorate of Statistics, Bihar

157
TABLE AS-II-HIGHEST AND LOWEST TEMPERATURES
(Figure8 in Fhrenheil)
Year/Temperature Janu· Febru· March April May June July AUgUf,t Septem. Octo· Novem· Decem· ary ary ber ber ber ber
1 2 3 4 5 6 7 8 9 10 11 12 13
HAZARIBAGH
1951 Mean Maximum 71.3 79.6 87.0 94.3 101.5 96.2 85.4 86.5 86.5 86.4 80.1 73.8 HigheRt 79.0 89.0 94.0 104.0 109.0 103.0 93.0 89.0 90.0 91.0 84.0 79.0 Mean Minimum 46.5 54.0 64.2 69.4 75.3 76.2 73.3 74.4 72.1 69.0 56.3 48.6 I,owest 41.0 44.0 54.0 61.0 67.0 72.0 70.0 71.0 68.0 62.0 48.0 43.0
1952 Mean Maximum 76.8 81.8 86.2 95.9 98.8 93.9 85.7 84.1 85.3 84.6 79.2 75.9 Highest 81.0 89.0 97.0 103.0 105.0 104.0 92.0 89.0 88.0 90.0 84.0 72.0 Mean Minimum 50.5 57.2 60.8 70.3 74.5 76.2 74.4 73.7 72.3 66.8 54.6 48.1 Lowest 44.0 50.0 52.0 62.0 67.0 71.0 72.0 71.0 69.0 57.0 45.0 43.0
1953 Mean Maximum 71.9 81.3 94.5 99.0 101.6 94.4 84.9 84.5 85.3 85.1 78.3 76.3 Highest 78.0 89.0 100.0 103.0 109.0 109.0 90.0 89.0 91.0 90.0 82.0 82.0 Mean Minimum 50.0 56.1 66.2 71.8 78.4 76.3 73.9 73.4 72.5 65.2 50.1 51.4 Lowest 42.0 47.0 59.0 62.0 68.0 71.0 70.0 69.0 69.0 58.0 47.0 48.0
19M Mean Maximum 72.5 82.7 88.9 100.6 103.7 92.5 86.9 85.0 84.5 82.3 78.3 74.6 Highest 82.0 90.0 98.0 106.0 108.0 102.0 91.0 89.0 91.0 89.0 81.0 80.0 Mean Minimum 47.4 57.2 62.2 74.8 78.4 75.8 74.3 73.5 72.5 63.5 52.1 49.8 Lowest 39.0 48.0 51.0 64.0 72.0 71.0 71.0 72.0 71.0 53.0 48.0 42.0
1955 Mean Maximum 'i2.1 77.2 91.4 96.7 101.4 96.0 83.8 85.5 85.6 82.8 78.4 73.5 Highe~t 81.0 84.0 100.0 103.0 108.0 109.0 89.0 89.0 90.0 87.0 81.0 78.0 Mean Minimum 50.7 53.9 64.1 69.3 78.0 76.3 73.5 73.2 72.3 67.5 55.4 49.0 Lowest 39.0 47.0 49.0 62.0 66.0 72.0 71.0 69.0 70.0 56.0 50.0 41.0
1956 Mean Maximum 75.0 77.0 89.5 99.8 99.5 86.1 85.1 84.2 84.0 82.2 76.0 75.Q Highest 81.0 89.0 96.0 107.0 110.0 92.0 91.0 88.0 89.0 89.0 80.0 82.0 Mean Minimum 50.8 52.1 63.6 73.0 77.1 73.6 73.2 73.1 71.6 66.6 56.4 51.0 Lowest 43.0 45.0 55.0 63.0 70.0 70.0 71.0 71.0 66.0 60.0 48.0 43.0
1957 Mean Maximum 71.8 75.9 83.8 95.7 103.1 97.5 84.9 86.2 86.2 87.4 82.1 77.2 Highest 78.8 84.0 94.8 104.7 108.3 106.2 91.2 92.7 90.0 91.9 86.0 82.9 Mean Minimum 52.9 51.6 59.9 69.8 78.3 77.2 74.1 74.1 72.0 68.0 55.2 50.9 Lowest 45.1 43.0 47.1 60.1 70.5 71.1 71.8 71.1 67.5 55.6 49.1 41.9
1958 Mean Maximum 78.3 79.3 89.4 100.2 104.2 102.2 87.3 85.8 84.7 84.7 81.7 76.6 Highest 86.5 86.7 98.2 104.2 108.7 110.1 97.3 92.1 91.4 89.2 86.2 79.5 Mean Minimum 51.8 54.7 64.8 78.2 78.4 79.0 74.8 73.8 72.7 68.0 57.6 51.8 Lowest 43.9 42.4 54.7 66.4 78.2 70.3 72.1 70.9 69.6 57.7 49.1 42.6
1959 Mean Maximum 74.8 77.2 90.3 98.2 102.9 93.2 85.3 84.4 NA 83.1 78.3 73.9 Highest 80.1 85.6 99.3 105.6 108.0 lOLl 93.0 88.5 NA 89.8 83.1 78.3 Mean Minimum 51.8 53.1 61.3 71.4 77.7 75.7 73.9 73.6 NA 68.0 54.5 47.7 Lowest 41.4 44.4 52.5 60.1 68.2 70.3 71.2 71.,8 NA 59.7 47.5 41.2
1960 Mean Maximum 72.3 82.6 85.3 98.1 101.5 NA 85.1 85.1 85.8 84.4 79.3 76.S Highest 77.2 90.3 97.7 105.3 108.1 NA 93.9 89.6 91.9 89.1 83.S 82.2 Mean Minimum 47.8 54.0 61.2 72.7 75.9 NA 73.6 74.1 73.0 66.2 53.4 49.8 Lowest 40.1 41.2 53.1 63.0 68.7 NA 70.5 71.6 70.0 58.3 46.0 42.1
l'lA-Not available, SOURCP; : Director, Regional Meteorological Centre, Calcutta.

158
TABLE AS-ID-LAND UTILISATION AND AREA UNDER DIFFERENT CROPS
(.A~ea figure8 in acres)
Classificatio{lof area 1911 1921 1931 1941 1951 1961
1 2 3 4 5 6 7
A. Total geographical areas 4,447,635 4,471,193 4,471,0)?'0 4,471,020 4,476,160 4,47'1,040
Forests 790,997 2,524,591 2,524,5Ql 2,524,591 2,233,179 2,194,825
Area not available for cultivation 979,388 365,299 365,299 365,299 389,851 407,320
Land put to non-agricultural uses
J { 163,506 176,690 979,388 365,299 365,299 365,299
Barren and unculturablo land 226,345 230,630
Arel,l. cultivable 1,089,167 266,263 266,263 266,230 659,339 677,253
Culturable wastes 1 ( 325,861 286,070 Miscellaneous tree crops and groves I N.A_ N.A.
f 1,089,167 266,263 266,263 266,230 -I Pastures and grazing laud I t 120,743 100,791 Other fallows J 212,735 290,392
Area cultivated ,1,588,083 1,315,040 1,314,867 1,314,900 1,193,791 1,191,642
Current fallows 12,183 434,820 375,6n 377,400 295,023 333,819 Net area sown 1,575,900 880,220 939,240 937,500 898,768 867,823
B. Total area sown under all crops 1,727,000 989,459 ,1,065,667 1,057,340 1,116,820 1,133,968
Area under food crops 1,570,550 885,480 938,lS0 940,540 1,037,423 1,072,467
Basic food crops· 1,553,550 868,740 922,920 924,040 1,024,472 1,063,171
Rice 937,750 468,900 486,200 494,440 641,907 662,537 Wheat 12,150 4,740 5,420 6,400 1l,207 12,044 Pulses N.A. N.A. N.A. N.A_ N.A. N.A. Fruits and vegetables 8,000 7,220 7,500 1,000 13,890 24,654
Other food crops 17,000 16,740 15,260 16,500 12,951 9,296
Sugarcane 8,600 9,520 10,000 10,000 8,464 6,715 Condiments 3,400 3,400 3,060 2,500 1,625 821 Others 5,000 3,820 2,200 4,000 2,862 1,760
Area under non-food croJ;ls 115,000 101,160 124,440 116,800 75,858 59,108
Oil seeds 112,250 98,040 122,180 115,300 74,028 57,338 Fibres 2,500 2,840 1,960 1,200 1,388 1,236 Cotton 1,600 1,100 1,000 200 309 7 Jute Others 900 1,740 960 1,000 1,079 1,229
Tobacco 250 280 300 300 442 534
Area under miscellaneous crops 41,650 2,819 3,047 N.A. 3,539 2,393
Fodder N.A. Other non·food crops 41,650 2,819 3,047 N.A. 3,539 2,393
NOTE I 1911 figures represent the average for 1911-12 and 1912·13. Figures for the census years 1921 to 1951 give the average of five crop years with the relevant census year as the mid-yelU" in every case. The 1961 data are the average of the five crop years including and preceding 1960·(11.
NA- Not available. SOURCE: Directorate of Stati::.tics, Bihar. "'Includes figurel of other cereals also.

159
TABLE AS-IVo....GROSS AREA IRRIGATED BY CROPS
(Area in acre8)
Crops irrigated 1911 1921 1931 1941 1951 1961
1 2 3 4 5 6 7
GROSS CROPPED AREA 1,727,200 989,459 1,065,667 1,057,340 1,116,820 1,133,968
Gross Irrigated area 90,010 22,601 15,247 15,247 58,781 128,724
Irrigated area under food cropB 85,994 18,983 14,968 14,968 5'1,8'15 126,151
Rice N.A. 7,239 7,239 7,239 36,034 95,238
Wheat 2,689 911 519 519 2,244 2,233
Other cereals N.A. N.A. N.A. N.A. 12,909 19,646
Pulses N.A. N.A. N.A. N.A. 4,352 3,997
Sugarcane N.A. 6,051 1,327 1,327 2,336 5,037
Irrigated area under nonjood crop8 ',016 3,618 2'19 2'19 906 2,573
Cotton 24 61 61 12
Other non·food crops 4,016 3,594 218 218 894 2,573
NOTE: 1911 figures represent the average for 1911·12 and 1912·13. Figures for the census years 1921 to 1951 give the average of five crop years with the relevant census year as the mid.year in every case. The 1961 data are the average of the five crop years including and preceding 1960·61.
N.A.- Not available. SOURCE: Directorate of Statistics, Bihar.
TABLE AS-V-GROSS AREA IRRIGATED BY SOURCES
(A re!J in acres)
Sources 1911 1921 1931 1941 1951 1961
1 2 3 4 5 i 7
Total Irrigated area by all sources 90,010 22,601 15,247 15,247 58,781 128,724
Government Canals 4,186 Private Canals 65 36 207 9,916 Tanks 25,701 4,334 5,001 5,001 38,499 43,608 Tube·wells Other wells 18,403 15,913 9,514 9,514 13,962 27,541 Other sources such as river, water.fall, etc. 45,841 2,318 732 732 6,113 43,473
NOTE: 1911 figures represent the average for 1911·12 and 1912·13. Figures for the census years 1921 to 1951 give the average of five crop years with the relevant census year as the mid·year in every case. The 1961 data are the average of the five crop years including and preceding 1960·61.
SOURCE: Directorate of Statistics, Bihar.

110
TABLE AS-VI-YIELD RATES OF PRINCIPAL CROPS
(Yield in maund8 per acre)
Prinoipal Crops 1951·52 1952·53 1953·54 1954·55 1955·56 1956·57 1957·58 1958·59 1959·60
1 2 3 4 5 6 7 8 9 10
Rioe 2.98 3.25 4.75 3.84 NA NA NA NA NA
Jowar 4.53 6.68 NA 6.45 5.04 7.97 4.21 4.15 NA
Bajra 3.10 6.09 NA 4.31 3.46 4.71 4.12 4.98 NA
Maize 8.18 8.14 NA NA 4.56 8.38 6.52 4.52 NA
Ragi 6.08 6.68 NA 7.30 5.82 5.59 5.30 6.27 NA
Wheat 4.72 4.36 5.51 2.66 6.28 1.76 5.79 6.18 5.13
Barley 4.09 5.37 3.50 1.82 6.32 4.31 3.50 8.90 3.93
Gram 4.10 3.20 3.49 3.42 2.12 2.19 2.41 4.92 3.50
Tur 4.58 NA NA 5.39 6.66 3.20 6.28 8.48 NA
Potato NA NA NA 19.06 27.53 18.25 15.86 24.95 NA
Sugar oane 166.00 164.00 130.00 192.24 182.80 295.98 377.84 261.61
Chillies (dry) 10.21 8.70 NA 3.03 2.85 3.14 2.90 3.83 NA
Tobacoo NA NA 3.03 4.40 4.81 3.53 4.42 NA
Castor seed 5.43 5.01 NA 1.77 6.48 2.70 5.55 4.89 NA
Sesame NA NA NA 3.46 1.61 2.66 2.85 1.98 NA
Rape and Mustard 3.24 NA NA 2.87 3.44 3.18 2.62 7.98 NA
Linseed 2.32 NA NA 2.80 2.58 2.20 2.18 4.04 NA
Jute NA NA NA NA NA NA NA NA NA
NA- Not available. SOURCES: (i) Estimate of Area and Produotion of Principal Crops in Indla. Vol. II.
(ii) Annual Season Crop Report, Direotorate of Statistics, Bihar.

161
TABL'E AS-VII-STATISTIOS OF SKILL'ED AND UNSKILLED AGRIOULTURAL LABOURERS
Statement Mowing tke afJerag. daily wage8 (in. rupees) paid to the 8ldlleil ancl unskilled agricuUurallabourers durinl Rabi (Jan!('aru-June) and Kharjf (July·-De;ember) seasons, 1951-60.
YeM/Seasons
1
r Rabi 195H
LKhari!
r Rabi 1952~
LKhariJ
r !tabi 1953~
LKho.ri!
r Rabi 1954~
LKhari!
r Rabi 1951i~
LKhariJ
r BaM 1956~
lKhariJ
r Rabi _1957~
LKhariJ
r Babi 1958~
LKhariJ
r Rab' 1959~
LKhariJ
r BOOi 1960~
lKharif
Skilled Labourers r--___ .A. __ _,_~
Car- Black- Mochis penters smiths
2 3 4
Rs. Ra. Ra.
Field Labourers Other AgriculturalLabourera r--__ .. _...A.. ____ -, r------,.,A...--""---l
Men Women Child Men Women Child ren ren
5 6 7 8 9 10
Ra. Ra. Rs. Rs. Rs. Rs.
Herdsmen r-----.A. __ .--_.~
Men Women Child ran
II 12 13
Rs. Rs. Ra.
2.00 2.00 1.50 1.37 1.06 0.69 1.37 1.06 0.69 NA NA 0.50
2.00 2.00 1.50 1.37 1.06 0.69 1.37 1.05 0.85 NA NA 0.50
1.90 1.97 1.70 1.23 1.04 0.69 1.42 1.04 0.69 0.70 0.75 0.56
1.75 1.75 1.50 1.00 1.00 1.00 1.50 1.00 NA 0.75 NA NA
1.50 1.50 1.29 0.86 0.86 0.89 1.50 1.00 NA 0.63 NA NA
1.11 1.11 0.99 0.63 0.63 0.65 1.41 0.96 0.75 0.46 NA NA
0.86 0.86 0.74 0.49 0.49 NA 1.19 0.87 0.70 0.37 NA NA
0.84 0.84 0.72 0.48 0.48 NA 1.04 0.75 0.56 0.36 NA NA
0.81 0.81 0.69 0.47 0.47 1.25 1.29 1.02 0.84 0.33 NA NA
1.09 1.00 0.81 0.65 0.56 0.75 1.25 1.00 0.75 0.40 NA NA
1.06 1.06 1.00 0.94 0.94 0.50 1.25 1.00 0.75 0.31 0.31 0.31
1.30 1.28 0.97 0.91 0.!!9 0.47 1.25 0.98 0.71 0.35 0.35 0.31
2.25 2.07 0.99 0.99 0.99 0.74 1.25 1.00 0.75 0.50 0.50 0.29
2.25 2.00 1.84 1.00 0.68 0.50 1.00 0.62 0.50 0.87 0.50 0.50
1.62 1.62 1.54 1.37 1.32 0.92 1.25 1.13 0.75 0.79 0.79 0.39
1.40 1.40 1.40 0.80 0.80 0.60 1.25 0.75 0.50 0.80 0.70 0.40
1.05 1.06 1.06 0.60 0.60 0.45 1.25 0.75 0.50 0.60 0.53 0.80
1.14 1.18 1.08 0.76 0.76 0.46 1.17 0.92 0.63 0.59 0.54 0.34
1.50 NA NA 0.85 0.74 0.43 1.00 0.88 0.63 1.13 1.00 0.59
2.19 NA NA 1.12 0.83 0.53 1.12 0.83 0.53 1.03 0.75 0.47
N.A.- Not available. SOUROE : Directorate of Statistics, Bihar.
6(O&n.) 0-11

162
TABLE AS-VIII-MONTHLY RULING WHOLESALE PRICES OF STAPLE FOODGRAINS
Year Price per maund during
Foodgrains r------~-----------------. ..A.. ______ ,-_____ ~ _______ - - -""'\
January February March April May June July August Septem· Octo- Novem- Decem-ber ber ber ber
1 2 3 4 5 6 7 8 9 10 11 12 IS 14
Rs. Rs. Rs. Rs Rs. Rs. Rs. Rs. Rs. Rs. Rs. Rs.
1952 Rice 27.00 26.87 25.95 27.75 30.60 31.50 31.00 30.85 32.44 29.62 23.30 20.75
Wheat 20.75 22.33 21.40 21.63 21.90 21.81 21.25 21.10 21.19 21.13 21.00 21.06
Gram 20.75 20.62 17.52 17.62 16.05 17.50 18.88 21.00 20.75 21.50 22.30 20.30
1953 Rice 21.00 20.50 20.75 21.00 22.85 25,25 25.62 27.15 25.87 23.40 16.75 17.25
Wheat 21.00 21.00 22.25 20.00 21.05 20.50 21.00 19.80 19.75 19.00 20.00 19.00
Gram 21.90 23.00 17.50 10.19 17.40 18.50 18.38 18.25 18.75 18.50 16.00 14.62
1954 Rice 17.81 17.25 16.25 10.50 17.00 15.50 15.94 16.25 15.83 16.50 16.00 15.50
Wheat 19.25 17.75 17.25 17.50 17.00 15.00 15.10 15.75 10.33 17.00 16.00 16.00
Gram 16.13 13.08 lS.00 IS.2.2 13.42 11.00 11.70 11.13 11.67 11.63 11.50 9.00
1955 Rice IS.80 15.50 16.00 15.20 15.50 NA· 18.25 17.56 17.30 18.00 17.50 16.57
Wheat 15.30 16.25 NA NA NA NA NA 15.00 15.37 14.75 15.50 NA
Gram 9.05 9.54 9.1S 8.80 8.17 NA 10.12 9.28 10.03 9.81 10.25 10.81
1950 Rice 17.00 17.00 17.80 NA NA 19.00 19.25 20.00 20.00 19.87 19.50 19.00
Wheat NA 16.00 16.81 16.00 NA NA 17.00 16.81 NA
Gram 12.00 12.00 12.81 12.50 13.12 13.45 14.50 14.50 14.69 15.50
1957 Rice 19.00 20.00 20.20 21.00 22.80 23.50 24.00 25.60 20.33 20.00 26.87 25.87
Wheat 10.50 20.00 NA NA NA NA NA 18.00 18.50 18.00 18.75 16.00
Gram 15.12 16.00 16.00 10.00 15.00 15.00 15.00 14:50 16.33 16.00 16.90 14.75
1958 Rice 20.00 24.50 24.3S 20.50 26.80 28.50 28.06 28.00 27.33 25.50 22.63 21.19
Wheat 22.40 21.00 15.00 17.00 18.60 20.75 15.99 J 8.38 18.00 17.17 23.00 NA
- Gram 14.00 13.00 13.00 13.87 13.40 15.37 16.25 17.31 17.83 19.70 20.56 20.25
1959 Rice 19.90 21.00 21.63 22.25 22.70 23.13 23.40 24.00 22.81 22.40 20.63 17.44
Wheat NA NA 17.50 17.25 16.25 NA NA 17.00 16.94 17.00 17.00 10.Q6
Gram 20.85 24.13 21.90 16.63 015.40 15.56 15.35 14.06 13.38 15.15 20.25 20.85
1960 Rice 19.40 22.50 22.50 22.52 23.00 24,,44 24.77 24.09 2S.27 22.50 20.94 20.80
Wheat 15.00 15.50 17.00 15.83 15.56 15.63 15.25 15.17 15.25 NA 20.00 NA
Gram 14.27 15.31 14.75 14.30 14.81 15.50 17.30 16.72 16.80 17.18 18.75 17.60
'NOTl!l: Rice refers to medium rice and wheat tQ red wheat. Figures for 1951 are not available. ,
NA-Not available. SOll"RCE : Directorate of Statistics, Bihar,

163
TABLE AS-III.1-LAND UTILISATION
(Subsidiary Table 1)
(Area in acre8)
Year Serial Classification of land r--------. .A.------,
no. In61 1951
1 2 3 4
1 Total land area according to the Sur· veyor General.
4,490,240 4,490,240
2 Total area for which village papers are available.
4,471,040 4,476,160
3 Per I ,000 acres of the land area in the district-
(i) Unclerforests or othcrwh,e not avail· able for cultivation.
(ii) Total ('ultivable area (iii) Net area sown
4 Per 1,000 acres of total cultivable area in the district-
(i) Net area sown (ii) Area under fallow lands (iii) Area under other uncultivated land
exoluding fallow lano.
5 Proportions per 1,000 acres of the State(i) Total cultivable area ..
(ii) Net area Bown (iii) Net area irrigated (iv) Area sown more than once (v) Area irrigated wore than once
582 586
418 414 192 201
459 485 334 274 207 241
67 59 44 43
N.A. N.A. 4] 39
N.A. N.A.
NOTE: Figures for the census year 1951 give the average of five crop years with the cens].ls year ]951 as the mid·year. The 1961 data are the average of the five crop years including and preceding 1960-61.
N.A.-Not available. SOURCE: Directorate of Statistics, Bihar.
TABLE AS-I1I.2-PROGRESS OF CULTIVATION DURING THE LAST THREE DECADES
(Subsidiary Table II)
(Area in acre8)
Particulars 1961 1951- 1941 1931
1 2 3 4 5
Area under foodgrains 1,038,517 1,010,582 923,040 915,420 Area under crops other than foodgrains 95,451 106,238 1,34,300 150,247 Net area. BOwn 857,823 898,768 937,500 939,240 Area sown more than once 276,145 218,052 119,84(1 126.427
NOTE: Figures for the census years 1931 to 1951 give the average of five crop years with the relevant census year as the mid-year in every case. The 1961 da,ta a,re the average of the five crop years including and preced. ing 1961.
SOURCE: Directorate of Statistics, ~ihar.

164
ABLE AS-III.S--cOMPONENTS OF LAND AREA, CULTIVABLE AND CULTIVATED AREA PER HUNDRED PERSONS DURING THE LAST THREE DECADES
Particulars
1
Land 'area Area cultivable Net area sown Net irrigated area Area sown more than once Area irrigated more than once Area under foodgrains .. Area under crops other than food·
grains.
(Sw8idiary Table Ill)
1961 1951
2 3
187 231 78 96 36 46
N.A. N.A. 12 11
N.A. N.A. 43 52 4 5
(Area in acr(8)
1941 1931
4 5
255 295 90 104 54 62
N.A. N.A. 7 8
N.A. N.A. 53 60 8 10
Land area-Total area according to the village Papers available.
Area cultival>le--Includes (il Net area sown, (ii) Current fallows, (iii) Culturable wastes, (iv) Fallows other than current, (v) Permanent pastures and other grazing land, (vi) Miscellaneous tree crops and groves not included under net area sown.
Net area 8own.-Represents the area SQwn, counting area sown more than once, in the same year, only once.
Net irrigated area-Represents the area irrigated from different sources, counting area irrigated more than once, in the Same year, only once.
Area irrigated more than once-Represents area which receive irrigation more than once in raising the same crop again or other crops in the same year.
NOTE: Figures for the census years 1931 to 1951 give the average of five crop years with the relevant census year as the mid.year in every case. The 1961 data are the average of the five crop years including and preceding 1961.
N. A.-Not available.
SOUROE: Directorate of Statistics, Bihar.
TABLE AS-III.4-0ROPPING PATTERN
Crops
1
All Crops (i) Food crops
Rice Wheat Other foodgrains Sugarcane .. Others
(ii) Non·food crop" Oil seeds Cotton Jute and fibres other than cotton Others
• Figures less than 1,000 &ores N-denotes negligible figures.
(Subsidiary Table IV)
Total area ('000 acres)
r----..-A.------. 1961 1951
2 3
1,184 1,117 1,0'12 1,038
662 642 12 II
364 357 7 8
27 18 62 79 58 74
* * 1 1 3 4
Area per 1,000 acres of gross area sown in
the district "" r---_____.Jo.. -.
1961 1951
4 5
1,000 1,000 !JiG 929 584 575
11 10 321 320
6 8 24 16 64 71 51 66 N N
1 1 2 4,
Area per 1,000 acres in the State
r---.A.-----. 1961 1951
6 7
48 42 14 42 53 50 8 8
39 38 16 23 29 20 42 49 83 73 N 14 2 3
21 23
SOUBOE: Directorate of Statistics, Bihar.
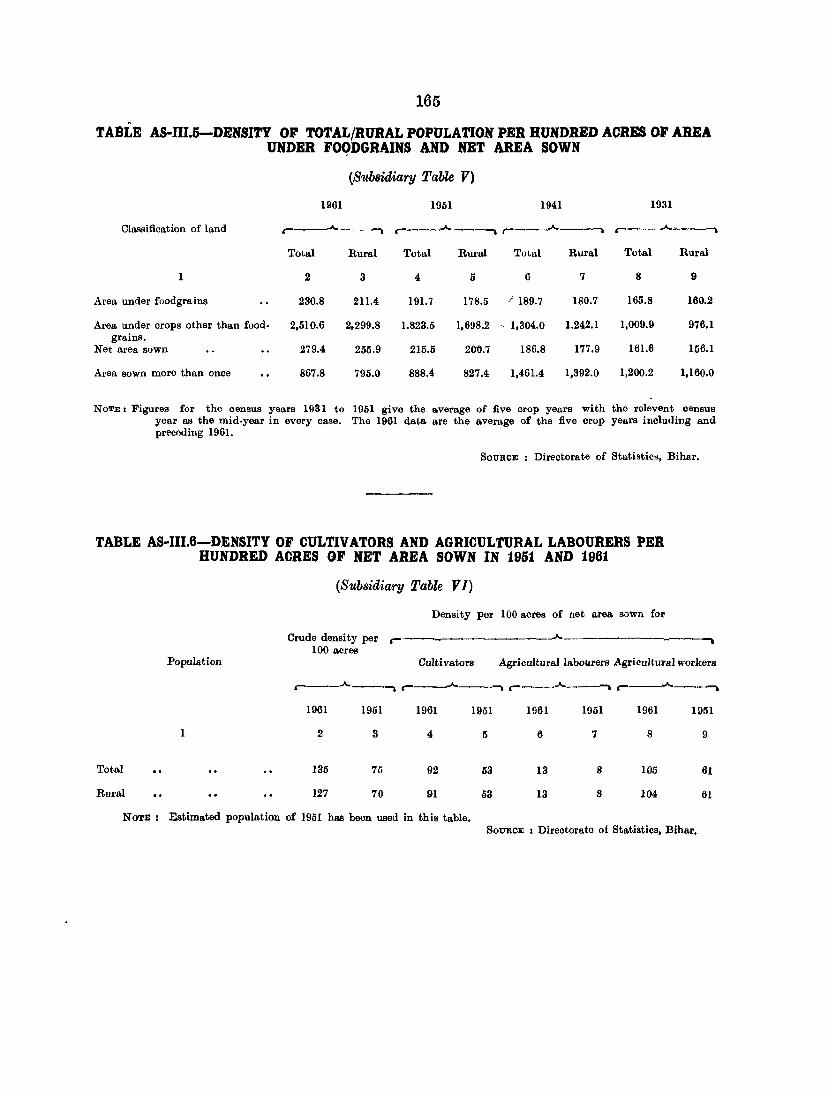
165
TABLE AS-nl.5-DENSITY OF TOTAL/RURAL POPULATION PER HUNDRED ACRES OJ' AREA UNDER FOQDGRAINS AND NET AREA SOWN
(Sub8idiary Table V)
1961 1951 1941 1931
Classification of land r-__,.A. --------,. r---...... ---~ r--_ ...... r----......
Total Rural Total Rural Total Rural Total Rural
1 2 3 4 5 6 7 8 9
Area under foodgrains 230.8 211.4 191.7 178.5 I 189.7 180.7 165.8 160.2
Area under crops other than food- 2,510.6 2,299.8 1.823.5 1,698.2 ~ 1,304.0 1.242.1 1,009.9 976.1 grains.
Net area sown 279.4 255.9 215.5 200.7 186.8 177.9 161.6 156.1
Area sown more than once 867.8 795.0 888.4 827.4 1,461.4 1,392.0 1,200.2 1,160.0
NOTE: Figures for the census years 1931 to 1951 give the average of five crop years with the relevent census year as the mid-year in every case. The 1961 data are the average of the five crop years including and precflding 1961.
SOUROE : Directorate of Statistics, Bihar.
TABLE AS-III.6-DENSITY OF CULTIVATORS AND AGRICULTURAL LABOURERS PER HUNDRED ACRES OF NET AREA SOWN IN 1951 AND 1961
Population
1
Total
Rural
(Subsidiary Table V J)
Density per 100 acres of net area sown for
Crude density per r--------------...... --------__., 100 acres
Cultivators Agricultural labourers Agricultural workers
r----...... -----. ,----...... --""'l r---...... ---~ r--_ ...... _----..
1961 1951 1961 1951 1961 1951 1961 1951
2 3 4 5 6 7 8 9
135 75 92 53 13 8 105 61
127 70 91 63 13 8 104 61
NOTE: Estimated population of 1951 has been used in this table. SOUROE : Directorate of Statistics, Bihar.

166
TABLE AS-III.7-RAINFALL, AREA SOWN AND IRRIGATED, DENSITY, ETC.
(Subsidiary Table VII)
(Area in '000 acres)
Particulars 1951-52 1952-53 1953-54 1954-55 1955-56 1956-57 1957-58 1958-59 1959-60 1960-61
2 3 4 5 6 7 8 9 10 11
Average Annual Rainfall (in inches) 43.37 43.19 06.76 39.24 38.15 48.33 37.33 43.97 55.57 43.90
Annual number of rainy days 54.7 56.7 65.9 64.4 59.9 70.6 49.2 62.4 66.2 63.6
A. Gross area sown under-
(i) Kharif
Main Crop
Rice 671 655 800 571 638 614 661 669 670 698
Secondary crops
Maize 95 99 91 89 93 10 102 103 100 94
Marua 56 57 50 51 56 57 56 63 62 62
Bajra * 1 * * 1 1 _:J 1 1 1
Other cereals 64 79 92 80 88 89 86 84 85 80
Pulses 98 92 104 82 98 84 78 83 82 81
Vegetables 2 1 1 2 2 2 2 4 4 4
Sugarcane 7 7 6 6 5 5 7 7 7 7
Sunhemp 1 1 * * 1 '" '" '" 1 1
Other fibres * 1 * 1 1 1 1 '" 1 1
Other non-food crops 4 2 2 2 2 2 3 3 2 2
Other crops 1 1 1 '" * '" '" '" '" '"
(ii) Ra.bi
Main crop
Gram 11 9 8 9 11 10 6 17 17 12
Secondary cropS
Wheat 11 8 8 9 7 15 7 13 13 12
Barley 7 5 6 6 5 6 3 \} 10 7
Arhar 17 19 14 17 12 11 8 11 - 13 10
Other pulses 6 6 5 4 4 6 2 8 9 8
Sweet Potato 1 1 2 2 1 2 2 3 4 4
Other food crops 2 1 1 1 1 3 1 1 2 4
Chillies 1 1 1 1 1 '" '" 1 1 1
Other spices 1 '" '" 1 '" '" '" '" '" '" Potato 8 6 8 8 10 10 13 17 10 16
Other vegetable 4 2 2 2 2 2 3 4 5 3
Linseed 3 2 1 1 2 3 '" 4 3 3
Castor 1 1 '" 1 '" 2 '" '" 1 1 . Other oilseeds 44 7 58 41 47 49 29 41 42 37
Mango 3 2 2" 1 1 1 1 1 1 '" Tobac('f) '" '" '" '" '" '" '" 1 1
B. Gross area irrigated under
(i) Kharif
Main crop
Rice 97 75 81 87 81 82 123 102 61

167
TABLE AS lII.7-RAINFALL, AREA SOWN AND IRRIGATED, DENSITY, ETC.-concld.
(Sub8idiary Table VII)
Particulars 1951-52 1952-53 1953-54 1954-55 1955-56 1956-57 1957-58 1958-59 1959-60 1960-61
1 2 3 4 5 6 7 8 9 10 11
Secondary crops Mai~e {) .. .. .. .. .. .. .. .. .. Other cereals 17 .. .. 8 1 .. .. .. .. .. Sugarcane 4 7 3 5 4 5 1 7 6 .. Non-food crops 1 2 5 .. .. 1 .. 1 .. ..
(U) Rabi
Main Crops
Gram .. .. .. .. .. 1 1 1 1 .. Secondary crops
Wheat 2 4 2 3 1 4 5 3 4 .. Barley .. 2 • .. .. 1 1 .. 1 • Pulses 2 • .. .. 2 1 7 5 .. .. Other cereals .. • .. 3 .. .. .. .. .. .. Other food crops 13 8 17 6 .. • 1 1 .. .. Fruits .. .. .. .. 8 12 13 15 24 ..
C. Estimated yield of main crops 486 688 941 690 625 905 369 887 907 829 (Lbs. per acres)
D. DensHy-Crude density per 100 acres 43 43 43 43 43 53 63 63 63 63 Density per 100 acres of gross 168 168 160 190 174 219 220 205 205 205
cropped area. Density per 100 acres of area 186 188 165 211 191 235 235 225 225 224
under foodgrains.
·-denotes n3gligible figures. SOURCE: Directorate of Statistics, Bihar.
LIVESTOCK
TABLE LVT-I-GOVERNMENT VETERINARY FACILITIES
Number of Year
,-____ .A. ______
Hospitals Dispensaries Total Doctors
1 2 3 4 {)
1951-52 2 8 10 7 1952·5l 2 8 10 8 1953·54, 2 8 10 JJ 1954,·55 2 10 12 11 1955·56 2 14 16 16 1956·57 2 17 19 17 1957·58 2 22 24 20 1958·59 2 28 30 26 1959-60 2 39 41 37 1960-61 2 43 45 42
SOUROE : Deputy Superintendent, Livestock Census, Bihar.

Category of livestock! poultry
1
Total Livestock
Cattle
Male Female Young stock
Buffaloes
Male Female Young Rtock
Sheep
Goats
Pigs
Poultry
Fowls
Ducks
Category of livestockJ Poultry
Total Livestock
Cattle
Male Female Young stock
Buffaloes
Male Female Young stock
Sheep
Goats
Pigs
Poultry
Fowls
Ducks
1
NA-Not available.
168
TABLE LVT-n-LIVESTOCK AND POULTRY
1920 1925 1930 19(0 1945 r-~--"""-~...... r-~~-"""--''''''' r--_ ...... _ --""-l r--__..A.--"""'l
Population Population Variation PopUlation Variation PopUlation Variation Population Variation
2 3 5 6 7 8 9 10
1,159,252 1,027,822 -181,430 1,185,423 +157,601 1,140,812 -",8U 1,M8,088 -·94,7D8
757,043 694,078 -62,965 729,374 +35,296 708,573 -20,801 640,387 -68,186
266,503 273,308 217,232
276,601 + 10,(J98 253,274 -20,034 164,203 -53,029
289,792 +13,191 253,543 + 269 186,039 +21,836
292,243 +2,451 224,980 -28,663 191,350 +5,311
282,004 -10,239 205,259 -19,721 153,124 -38,226
213,702 170,173 -43,529 179,947 +9,774 152,413 -27,534 161,136 +8,723
107,901 53,846 51,955
37,521
100,777 -7,124 44,470 -9,376 24,926 -27,029
7,805 -29,716
123,085 +22,308 32,165 -12,305 24,697 -229
33,769 +25,964
89,348 -33,737 31,379 -786 31,686 +6,989
27,827 -5,942
97,160 37,352 26,624
26,975
+7,812 +5,973 -5,062
-852
150,986 155,766 +4,780 242,333 +86,567 225,155 -17,178 195,240 -29,915
NA
NA
NA
NA
NA
NA
NA
NA
1951 r-----...... --_..-"""'l
Popula.tion. Variation.
11
~,.s4,168
889,336
366,876 312,543 209,917
193,925
125,005 47,452 21,468
45,230
316,207
39,470
464,782
455,126
9,656
12
+438,082
+2,48,949
+84,872 +107,284 +56,793
+32,789
+27,845 + 10,100 -5,156
+~8,255
+120,967
+17,122
+25,268
+19,097
+6,171
NA
NA
NA
NA
NA
NA
NA
NA
NA
NA
NA
NA
1956 r--_.,____......-~-""-l
Population. Variation.
13
1,758,267
961,334
388,999 314,849 257,486
225,910
137,229 53,621 35,060
55,317
455,169
55,537 •
14
+2~9,099
+71,998
+22,123 +2,306
+47,569
+31,985
+12,224 +6,169
+ 13,592
+10,087
+138,962
+16,067
581,267 + 116,465
573,584 +118,458
7,663 -1,993
26,844
lfA
NA
NA
1961
NA 22,348 -4,496
lfA 489,514 NA
NA 436,029 NA
NA 3,495 NA
r-'-------- ...... ,------ ...... Net
Variation (1920.61). Population.
15
2,086,878
1,117,485
464,330 338,651 314,504
254,475
156,900 55,175 42,400
62,625
589,545
61,743
756,162
750,984
5,168
Variation.
16
+882,606
+156,151
+75,331 +23,802 +57,018
+28,565
+19,671 +1,554 +7,340
+7,308
+134,376
+6,206
+174,906
+177,400
-2,495
17
+926,621
+360,442
+197,827 466,343 +97,272
+40,773
+48,999 +1,329 - 9,505
+25,104
+438,559
+34,899
+8t6,688
+314,955
+1,683
SOURCE: Deputy Superintendent, Livestock Census, Bihar.

169
INDUSTRIES
TABLE INn-I-EMPLOYMENT IN TEXTILE AND NON-TEXTILE INDUSTRIES
(As on 318t December 1960)
Number of Establishment Daily Average Employment Serial Name of Industries
,-______ ..JI,. ___ ___ -.. ,-___ ----A-----__ , no. Total Rural Urban Total Rural Urban
2 3 4 5 6 7 . 8
Total Industries 859 182 227 17·~652 7,222 10,480
A. Pe:etile a a 88'1 88'1
1 Knitting Mills 1 7 7
2 Cotton Mills 2 2 380 380
B. Non·te:rtile 866 182 224 1'1,266 '1,222 10,048
1 General and Jobbing Engineering 17 3 14 676 243 433
2 Printing Press 13 13 57 57
3 Mica factory 170 49 121 12,550 4,459 8,091
4 Manufacturing of Bolts, Nuts etc. 1 1 3 3
5 Welding 2 - 2 6 6
6 Soap factory 1 1 4 4
7 Repairs of motor vehicles 9 9 64 64
8 Repairs of Bicycle 1 3 3
9 Manufacturing of ice 3 3 8 8
10 Electric, Light and Power 17 8 9 1,074 404 670
11 Manufacturing of wooden articles 3 3 50 50
12 Metal containers and steel trunks 1 1 10 10
13 Manufacturing of heavy chemicals 2 2 581 581
14 Coke oven 1 1 183 183
15 Manufacturing of cutlery and locks I 1 53 53
16 Water supply stations 1 24 24
17 Cold Storage 1 1 11 11
18 Bricks and Tiles 1 1 40 40
19 Manufacturing of glass and glass products 2 1 1 1,486 1,263 223
20 Petroleum, pumping and filling stations 1 1 6 6
21 Flour Mills 62 35 27 151 96 55
22 Rice Mills 29 26 3 58 61 7
23 Oil Mills 3 3 8 8
24 Saw Mills 14 7 7 169 86 74
SOURCE: ChiefInspector of Factories, Bihar.

170
TABLE IND-I1-NAME OF INDUSTRY WITH NUMBER OF
(A8 in Sepfember!
TJilXTILE ESTABLISHMENTS NON·TEXTILE • _______ _.A._~ ____ ~ -. ,- ----~-~ ----------- - ------~-----------
Weaving Leather works Blacksmithy
Serial District I Anchal ,-______ A_- ____ -. ,-______ A ____ ---a
,-_~ ____ A ______ • __ --.
no. ---Number Households Persons Number llouseholds Persons Number Households Persons of employed of employed of employed
villages villages villages.
1 2 3 4 5 6 7 8 9 10 11
HAZARIBAGH 66 540 860 119 868 505 291 670 1,182
1 Barhi 2 Barkatha 3 6 15 11 26 41 3 Bagodar 2 11 21 8 20 30 16 41 94 4 Bishungarh 5 21 22 8 47 75 16 39 50 5 Hazaribagh
6 Katkamsandi I 1 1 2 4 4 7 Ichak I 1 1 4 15 15 3 17 18 8 Barkagaon 3 8 12 8 22 28 9 Keredari 7 42 104 2 3 3 9 20 27
10 Talldwa 1 1 2 6 19 19
11 Mandu 5 28 44 4 29 30 10 17 58 12 Nagri (Churchu) 13 Ramgarh 2 7 2 5 g 1 1 1 14 .Tainagar 3 7 102 15 Gala 7 178 262 2 29 67 8 30 48
16 Gumio 9 69 107 5 26 26 12 34 46 17 Peterbar 1 2 3 18 Kasmar 1 1 2 6 30 52 19 Jaridih 2 8 8 20 Kodarma 2 6 8 3 4 11 4 7 12
21 Markacho 5 9 16 4 7 10 22 Patratu 2 3 7 4 9 22 1 1 1 23 Chauparan 1 5 5 6 8 12 9 11 18 24 Itkhori 1 4 4 16 39 42 6 22 29 25 Hunterganj 2 24 24 9 25 29 3 8 10
26 Partap Pur 1 9 26 4 10 13 6 10 15 27 Chatra 2 3 3 28 Simaria 7 16 18 6 11 14 29 Gawan 1 4 27 30 8 10 14 30 Tisri 2 2 2 6 7 7
31 Satgawan 2 5 5 3 8 11 32 Jan'lua 3 6 6 21 49 82 33 Deod 2 2 3 5 13 27 34 Dhanwar 1 7 7 2 4 4 2 5 12 35 Birni 1 3 2 17 26 38
36 Giridih 4 34 62 15 37 73 37 Bengabad 2 2 3 38 Gande 8 84 132 6 9 12 39 Dumri 3 3 3 20 30 38 40 Nawadlh 5 12 13 20 49 72
41 Pirtanr 11 27 31 42 Bermo 2 4 4
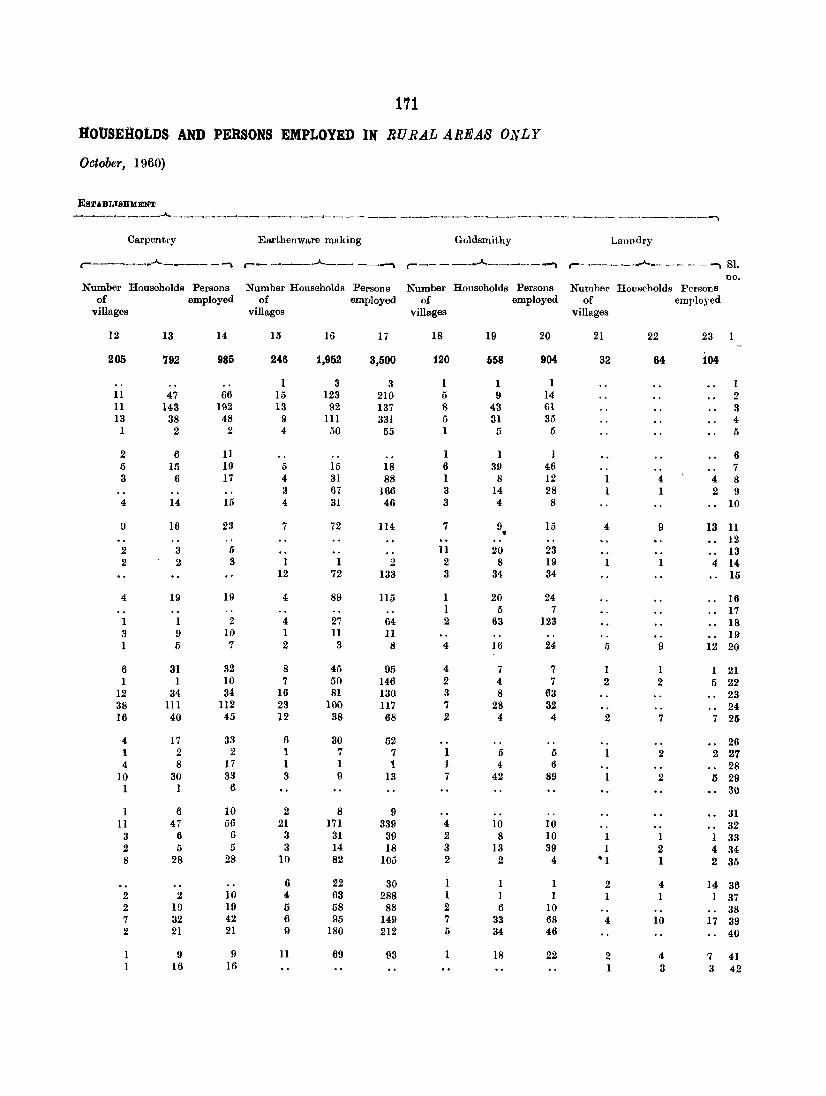
171
HOlJ'SEllotDS AND PERSONS EMPLOYED IN RURAL AREAS ONLY
October, 19(0)
ESTABLISHMENT _____________ ...A._ ... _________________ ~ ___________ __, ___ ... _ ... _ ... ___ • ____ ... _ ... __ ... _____ .. ________ ......
Carpentry Earthenware mRking Goldsmithy Laundry
r-----_.A. _____ -""", r-- ~ ___ .A. ___ - __ """, r-- - ____ .A. ____ - '"""'" r- ________ • .A.._ - - _ -","" 81.
no. Number Households Persons Number Households Persons Number Households Persons Number Households PersonS
of employed of employed of employed of employed villages villages villages villages
12 13 14 15 16 17 18 19 20 21 22 23 1
205 792 985 246 1,952 3,500 120 658 904 32 64 104
1 3 3 1 1 1 11 47 66 15 123 210 5 ~ 14 2 11 143 192 13 92 137 8 43 61 3 13 38 48 9 III 331 5 31 35 4
1 2 2 4 50 55 1 5 5 5
2 6 11 1 1 1 6 5 15 19 5 15 18 6 39 46 7 3 6 17 4 31 88 1 8 12 1 4 4 8
3 67 166 3 14 28 1 1 2 9 4 14 15 4 31 46 3 4 8 10
9 16 23 7 72 114 7 9 15 4 9 13 11 • 12 2 3 5 11 20 23 13 2 2 3 1 1 2 2 8 19 1 4 14
12 72 133 3 34 34 15
4 19 19 4 89 115 1 20 24 16 1 5 7 17
1 1 2 4 27 64 2 63 123 18 3 9 10 1 11 11 19 1 5 7 2 3 8 4 16 24 5 9 12 20
6 31 32 8 45 95 4 7 7 1 1 1 21 1 1 10 7 50 146 2 4 7 2 2 5 22
12 34 34 16 81 130 3 8 63 23 38 III 112 23 100 117 7 28 32 24 16 40 45 12 38 68 2 4 4 2 7 7 25
4 17 33 6 30 52 26 1 2 2 1 7 7 1 5 5 1 2 2 27 4 8 17 I 1 1 I 4 6 28
10 30 33 3 9 13 7 42 89 2 5 29 1 1 6 30
1 6 10 2 8 9 31 11 47 56 21 171 339 4 10 10 32
3 6 6 3 31 39 2 8 10 1 1 1 33 2 5 5 3 14 18 3 13 39 1 2 4, 34 8 28 28 10 82 105 2 2 4 • 1 1 2 35
6 22 30 1 1 1 2 4 14 36 2 2 10 4 63 288 1 1 1 1 1 1 37 2 19 19 5 58 88 2 6 10 38 7 32 42 6 95 149 7 33 68 4 10 17 39 2 21 21 9 180 212 5 34 46 40
9 9 11 69 93 18 22 2 4 7 41 16 16 1 3 3 42

172
TABLE IND-II_NAME OF INDUSTRY WITH NUMBER. OF
(As in September!
NON -TEXTILE
c-----...------_,....-----------------~------..--------
Tailoring Bidi making Bamboo products making
Serial District! Anehal r----.---. A _ -----~ r-____ .A ____ -~ i------.. A-----~ no.
Number Households Persons Number Households Persons Number Households Persons of employed of employed of employed
villages villages villages
1 2 24 25 26 27 28 29 30 31 32
HAZARIBAGH 201 627 889 28 48 160 12'1' 922 1,588
1 Barhi 3 5 7 2 Barkatha 9 18 18 4 17 27 3 Bagodar 16 50 92 2 4 9 7 48 66 4 Bishungarh 10 30 38 13 73 198 5 Hazaribagh 2 2 2 1 3 6
6 Kat'katnsandi 2 2 2 7 Ichak 2 2 3 1 1 1 8 28 62 8 Barkagaon 6 11 33 5 12 75 1 4 10 9 Keredari 5 13 15 1 1 7
10 Tandwa 4 13 16 2 6 6
11 Mandu 11 36 54 4 4 8 1 24 30 12 Nagri (Churchu) 1 1 1 13 Ramgarh 4 13 14 14 Jainagar 2 6 12 15 GoIa 4 20 21 11 121 189
16 Gumia 10 83 119 17 Peterbar 1 1 8 18 Kasmar 4 32 57 19 Jaridih 6 14 14 1 1 6 2 29 30 20 Kodarma 2 13 21 3 .7 15 1 50 50
21 Markacho 6 12 14, 3 48 70 22 Patratu 3 12 26 1 2 4 1 5 10 23 Chauparan 2 2 2 3 41 41 24 Itkhori 5 6 6 1 14 31 25 Runterganj 1 3 5 1 2 2 1 7 7
26 Pratap Pur 1 3 3 3 5 15 27 Chatra 1 1 3 4 31 53 28 Simaria 5 93 174 1 3 5 29 Ga"Wan 6 8 12 30 Tisri 2 20 40
31 Satgawan 5 22 36 32 Jamua 8 15 26 1 2 4 5 17 36 33 Deori 3 40 43 3 11 13 34 Dhanwar 5 11 16 1 1 3 35 Birni 11 20 21 2 28 59
36 Giridih 5 11 13 1 1 1 4 9 23 37 Bengabad 4 10 13 4 16 55 38 Gande 8 39 52 39 Dumri 16 36 40 2 9 9 40 Nawadih 14 40 40 1 8 6 S 56 77
41 Pirtanr 8 16 17 2 2 3 11 63 108 42 Bermo 1 3 3
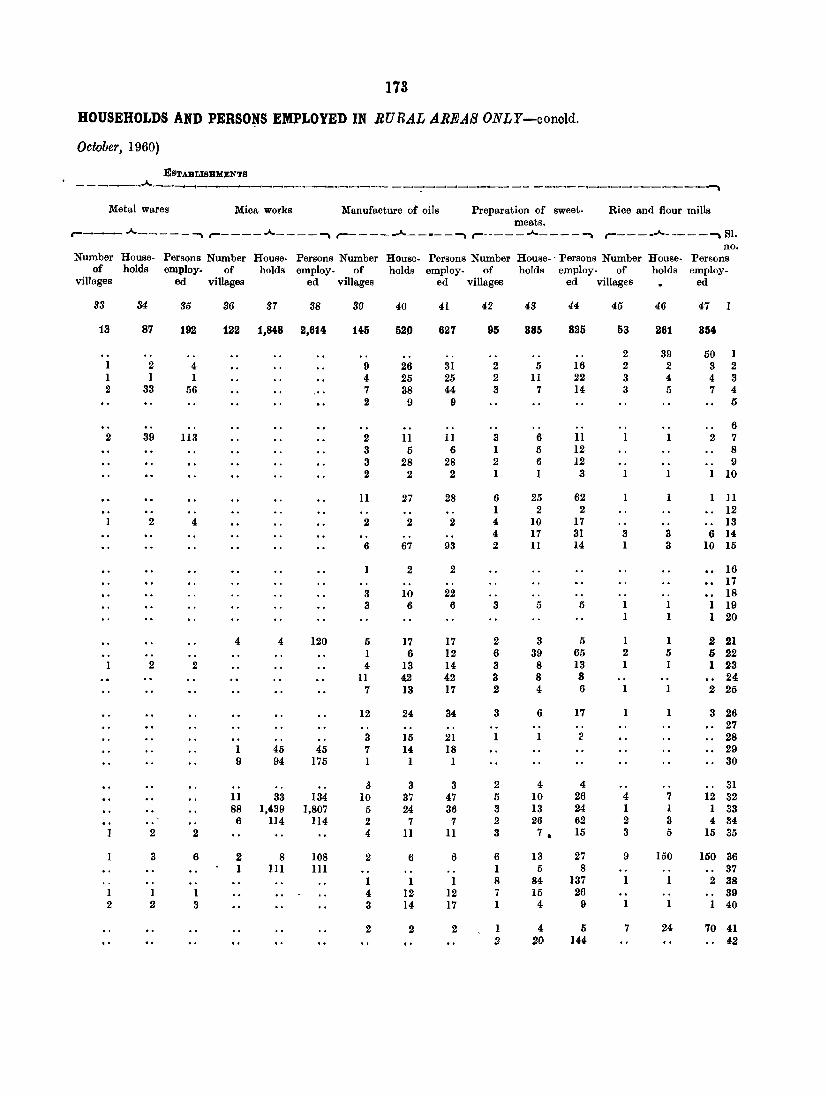
178
HOUSEHOLDS AND PERSONS EMPLOYED IN RURAL AREAS ONLY-conoId.
October, 1960)
ESTABLISHMENTS . - ----_A~--...I--t __________ ... __________ --:-___ --.1 ___ ~ ... _______ "' ______ ~ __ ... __ ~
Metal wares Mica works Manufacture of oils Preparation of sweet· Rice and flour mills meats.
~--- .A. _____ ~ ~----.A.--_-~ r----- • .A.--.--~ r--.---.A.----~ r---- • .A.-----~ Sl. no.
Number House- Persons Number House· Persons Number House. Persons Number House·· Persons Number House- Persons of holds employ. of holds employ. of holds employ. of holds employ. of holds employ.
villages ed villages ed villages ed villages ed villages ed
88 84 85 86 87 88 89 40 41 42 48 44 45 46 47 1
18 87 192 122 1,848 2,614 145 520 627 95 385 825 53 261 354
2 89 50 1 1 2 4 9 26 81 2 5 16 2 2 8 2 1 1 1 4 25 25 2 11 22 8 4 4 3 2 33 56 7 38 44 3 7 14 3 5 7 4
2 9 9 5
6 2 39 113 2 11 11 3 6 11 I 2 7
3 5 6 I 5 12 8 3 28 28 2 6 12 9 2 2 2 I 1 3 I 10
11 27 28 6 25 62 1 I 11 I 2 2 12
2 4 2 2 2 4 10 17 13 4 17 31 3 3 6 14
6 67 93 2 II 14 1 3 10 15
1 2 2 16 17
3 10 22 18 3 6 6 3 5 5 I I 1 19
I 1 1 20
4 4 120 5 17 17 2 3 5 1 1 2 21 1 6 12 6 39 65 2 5 5 22
2 2 4 13 14 3 8 13 I 1 1 23 II 42 42 3 8 8 24
7 13 17 2 4 6 I I 2 25
12 24 34 3 6 17 3 26 27
3 15 21 1 1 :> 28 1 45 45 7 14 18 29 9 94 175 1 1 I 30
g 3 3 2 4 4 81 11 33 184 10 37 47 5 10 26 4 7 12 32 88 1,439 1,807 5 24 86 3 13 24 1 1 1 33
6 114 114 2 7 7 2 26 62 2 8 4 34 1 2 2 4 11 11 3 7 • 15 3 5 15 85
3 6 2 8 108 2 6 6 6 13 27 9 150 150 86 1 III III 1 5 8 37
1 1 1 8 84 137 1 2 88 1 1 I 4 12 12 7 15 26 39 2 2 8 3 14 17 1 4 9 1 40
2 2 2 1 4 5 7 24 70 41 2 20 IH 42

174
SUPPLEMENT TO TABLE IND-I1-NAME OF INDUSTRY WITH NUMBER OF HOUSEHOLDS AND PERSONS EMPLOYED IN RURAL AREAS ONLY
(As in September/October 1960)
NumbeI' H'lUse· Persons Number House· Persons Industry I Anchal of holds employed Industty/Anohal of holds employed
villages villages
2 3 4 1 2 3 4
1. Spinning 7 48 117 7. MedlOine 5 8 10 (1) Gola 3 42 107 (1) H'mterganj 1 2 2 (2) Gumia 1 2 5 (2) Guidlh 2 4 4 (3) Kodarma 1 1 1 (3) Pirtanr 2 2 4 (4) Itkhori I 2 2 8. BrlOk making 1 2 8 (5) Gawan I 1 2 (I) Gumia I 2 8
2. Rope making 9 33 53 9. Lac production 9 21 25 (1) Bagodar I 11 5 (I) Blshungarh 1 5 5 (2) Ichak 1 7 17 (2) Markaoho 3 3 3 (3) Jamua I 4 4 (3) PiJ,tratu 5 13 17 (4) Giridih 5 5 10 10. Wine(Disttllation) 1 I 18 (5) Dumn 1 6 17 (I) Paratap Pur I 1 18
3. Wool and stlkweaving 9 82 124 11. Fishery 2 2 2 Blankets. (1) Tisri 2 2 2 (I) Hazaribagh 2 2 36 12. Tobacco I I 1 (2) Tisri 1 1 2 (1) Birni I 1 1 (3) Blrni I I 1 13. Stone·chips I 2 3 (4) Bengabad 5 78 85 (1) Chauparan I 2 3
4. Hosiery 4 5 9 14. Palm Juice 1 1 I (1) Gande I I 2 (1) Keredari I 1 1 (2) Dumri 3 4 7 15. Indian ExplOSive Ltd. 1 100 625
5. Cycle repairing 5 8 12 (1) Gumla 1 100 625 (I) Kodarma I 2 16. Bhunja maktng 3 44 44 (2) Patratu 2 3 6 (1) HuntergallJ 3 44 44 (3) Deori 1 2 2 17 Gur m'1king I 8 10 (4) Blrlll 1 2 2 (I) GIl"Idlh I 8 10
6. Motor repalrtng I 8 8 18. Meta! (ProductiOn) 1 2 2 (1) Bermo J 8 8 (1) Gmdlh 1 2 2
SOURCE: Superintendent of Census Operations, Bihar. ------
ADMINISTRATION
TABLE ADM-I-GENERAL RESULTS OF TRIAL OF CRIMINAL CASES
Description 1951 1952 1953 1954 1955 1956 1957 1958 1959 1960
1 2 3 4 5 6 7 8 9 10 11
A. Persons brought to trial 5,353 4,999 5,119 4,038 3,543 4,949 5,331 6,598 6,378 6,956 Discharged or aoquitted 1,646 1,655 1,777 1,594 906 1,587 1,177 1,743 2,099 1,741 Convicted 1,128 1,182 972 1,065 811 934 829 1,014 1,105 1,103 Committed or referred to higher 6 13 10 • 11 9 15 12 8 14 11
court. Died, escaped or tranl'feIred 80 8 1 12 41 10 70 32 25
to another State. Under trial 2,493 2,141 2,359 1,356 1,776 2,403 3,243 3,801 3,135 4.100
B. Appellants and Applicants for 98 130 116 122 152 200 155 248 284 192 Revision (Persons)
Rejected 48 50 45 47 . 60 93 59 86 99 51 Sentence or order confirmed 20 20 27 28 32 48 35 44 52 39 Sentence altered 2 4 3 5 7 11 10 13 22 11 Sentence reversed 25 56 41 39 53 48 51 75 61 89 Otherwise disposed of 2 3 2 DIed, escaped or transfetred to 1
another State. Fending trial
SOURCE: Insvector.General of Polke, Bihar.

175
TABLE ADM-II-PUNISHMENTS INFLICTED IN CRIMINAL CASES
Nature-of punishment 1951 1952 1953 1954 1955 1956 1957 1958 1959 1960
2 3 4 5 6 7 8 9 10 11
A. S,entencedto (umber ofpersons)-
1. Death 3 1 6 2 2 6 6 1 2. Transportation or penal ser. 2 8 33 29 12 18 13 17 6 8
vitude. 3. Imprisonment 982 1,031 757 883 709 823 791 898 971 971
(a) Of 15 days or under 28 28 25 20 H) 27 41 21 43 37 (b) Above 15 days to 6 513 575 457 431 386 417 387 428 447 450
months. (e) Above 6 months to 2 394 386 227 374 222 278 284 334 361 374
years. (d) Above 2 years 47 42 48 58 82 101 79 115 120 110
4. Fine or forfeiture 180 176 147 157 110 158 130 149 148 160
(a) Rs. 10 or under 16 17 9 10 16 24 18 13 17 14 (b) Over Rs. lO 164 159 138 147 94 134 112 136 131 146
5. Give Secnrity 1 2
B. Total amount of fine (in Rs.)-
I. Imposed 3,845 3,530 7,631 3,230 3,530 3,378 3,285 3,770 4,174 3,886 2. Realised 3,845 3,530 7,631 3,230 3,530 3,37'1 3,28,") 3,770 4,174 3,886 3. Paid as compeubation
\
SOUl;tCl'J : Inspector·Genel'1l1 of Police, Bihar.
------
TABLE ADM-III-BTRENGTH OF POLICE
Category 1951 1952 1953 1954 1955 1956 1957 1958 1959 1960
2 3 4 5 6 7 8 9 10 11
Total Staff 3,086 3,095 3,091 3,081 .3,231 3,231 3,230 3,369 3,473 . 3,493
Superintendent, Assistant Superin. 4 4 4 4 4 4 4 4 4 4 tendent and Deputy Superin. tendents.
Inspectors, Sub.Inspectors and 78 78 76 78 82 82 82 72 75 80 SergeantR.Major.
Sergeants, Head Constahles, A.S .• Is. 97 99 99 97 119 119 115 122 123 124 and HltvaldRr~.
Foot Constables 848 855 853 843 967 967 970 1,112 1,212 1,226
Chowkidars and Dafadars 2,059 2,059 2,059 2,059 2,059 2,059· 2,059 2,059 2,059 2,059
SOU!(CE : Inspector.General of Police, Bihar.

....
«< zzz
~~~ «z< Zz
«<z Zz
«z< ZZ
«~ zz ....
«z< ZZ
-tI(NOO!) -tI-tIt-~,...;~ OlQlQ .... .... ....
~:g8 oa;.,; t--tllQ ~ .... ....
.....
.... 0) .... ....
0..:>00 (N .... ....
(N(N-tI -tit- .... c:;i"';o ..:> .... 00 ~(N ....
;:'0..:> -0 .... <No>a; (N(Nt~<:<I -
176
00":> lQ ....
, ....
.... '<:<I
00 ....
t- .... O <:<I .... lQ 000~ ~~~ -
! ....
:~
Ot-_. IN t- Z"" lQ ....
, ...
OlQ(N ....
.... 0 .... lQ(NO a;.,;00 0000 .... ~ .... ....
-tI .... O) ":>00":> q:;a;.o t-t- .... ~ .... ....
0>000 -tloo .... cia;.,; <0"'<:<1 ~ .... ....
'<:<I
, ....
t--tl0 lQ",,,, 0.0 ..... t-= .... ~ .... ....
(N .... -tI (N .... O 0000 lQO) .... ~ .... ....
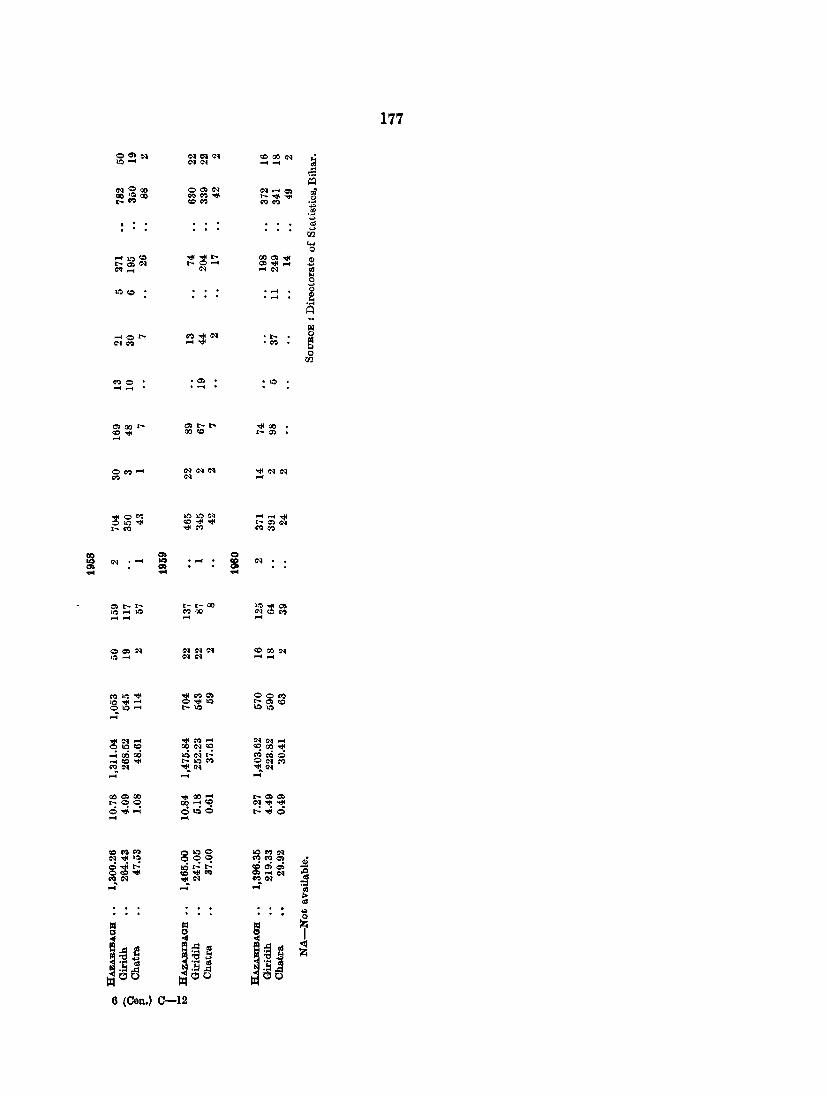
177
O~C'I C'IC'IC'I COCOC'l ..: 10 .... <NC'I .......... os :S I=Q
II'I°CO OO>C'I <N ..... o> ,;; oolQco CQc<)"'" ~""' ..... .~ o;....~ COM c<)M .-; • . "til . ..,
172 ... 0
.... 10-0 ""''''''~ OO~"'" <II t-O>C'I 0;....0 ..... 0>""' ..... "til c. ..... C'I .....<N ... 0 ..,
lOCO · ..... <> · .... <II .!:: A
iii ..... 00;.... M""'C'I • t-
o C'lM .... "'" 'M ~
0 172
~o .0> '10 .... ..... ....
o>oot- O>t-t- ""'00
"'''''' 00 CO 0;.... a> ....
OM ..... <N<N<N ""'C'I<N M <N ....
"",OM >()lQC'I ........ "'" 010"'" CO""'''''' t-a><N ~~ ""'M ~M
r8 ~ 0 C'I ...... IQ . ..... S <N
Cl) ~ ..... ..... .....
O>t-t- t-t-OO 10"",,,, 10 .... 10 C') 00 <NCOM ........ ...... ....
OO>C'I <N<NC'I COOOC'l 10 ...... <N<N ..........
~lQ"'" ~C')O> OO~ 10""' ...... ""'10 t-O>CO 010 .... 0;....10 1010 ....
~<N .... ""'M'" <NC'I ..... lOCO OO<NCO CO 00"'"
~oOOO tcie-l": C'iC'io .... CO"'" .... 10.., OC'lC') MC'I "'!.<N "'!.C'I .... .... .... 000>00 ""'00 ...... ....0>Cl) .... 00 00""" CO <N""'-.!I oooli"; otcio ":""0 ...... ....
CO~.., 0100 1Q~<N C'I-.!I1Q 00 0 MC')c»
~ gooli"': ».Qr--:...: ~.,;.,; <::>"'" 00""'''' .... <:<1 ,.Q
~c:<I ~c:<I ~C'I OS ... :::= ...... ... : OS ...
m III ; ~ ~ ~ I!l;§ e 1Il,.a
l~~ ;:a ~ ~ .... ~ .... OS .... OS
~.!:: t§ .!:: ,.a .!:I,.a ~t!1 ~OO 00
6 (Can.) 0-12

<l-1 '9 .... 10 0> ....
... ...
o ...
00
...
WI ~
i o til
178
...,oo~oo ~OO~C»
0> ......
00 a> 00 !;+
!NO> ... ...
!NO "'1 ...
C'lO "'1 ...
...,0 lQ ...
..... C» 00
00 ..., '"
o ... lQ
00 00 00 0'; r-C'I
c:.+ ...
0>'" or-0 00 ~ ..... " ~+
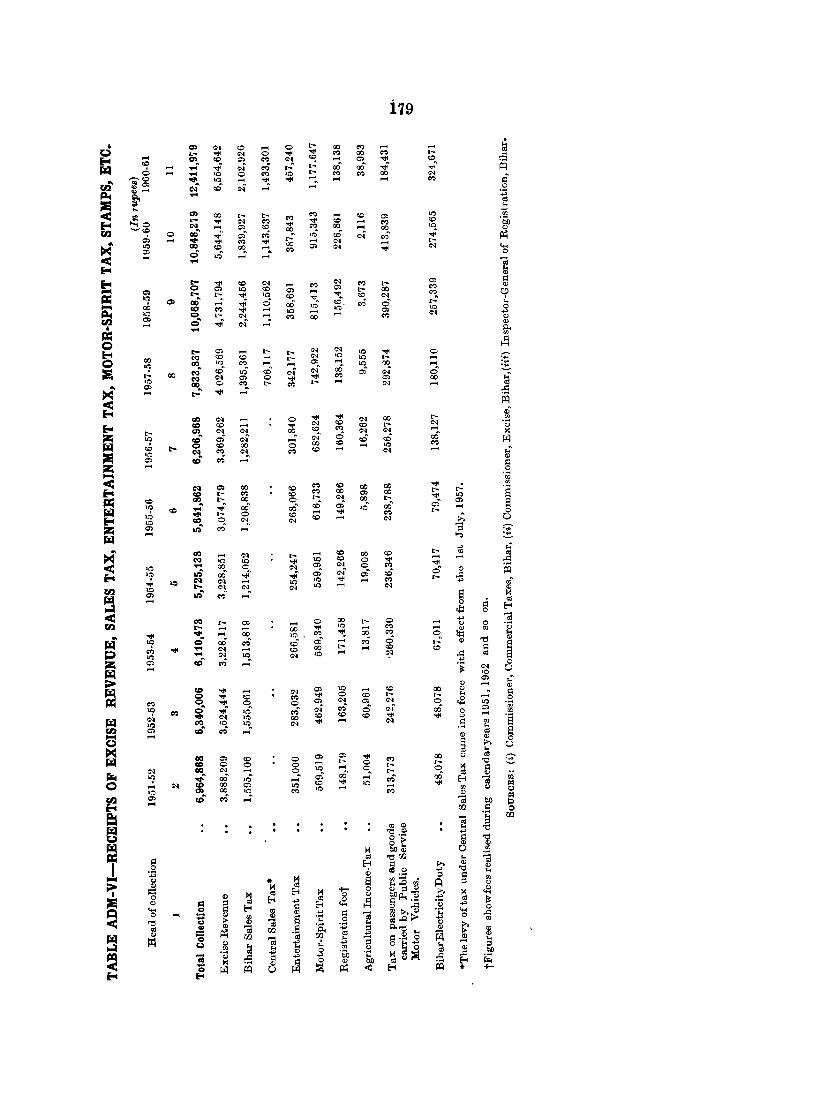
179
• CI) C'1 <C .... 0 .,...
00 ~ ..... ,..., .: to,) .... L- .... .,.. 0 .... .... ~ 00 ~ .,... OJ
i-4 <C CI) '" '" ~ <N '" .... '" "'I' <C ..::::
J";Iil 6 .... .... ~ ..... c-i ...; r: ,-.: 00 00 ...; ",,' ~ ,..., .... 10 0 ~ 10 .,...
~ ~ 00 .,.. ..-. <C
u! 00", • 10 ~ .... ,..., .... ~ ci' ~ .... IN~ <Ii c-i ..... ...; 0
j:I.j ~
.... '';:
~ OJ .. ...
:: ':;0
CI) 00 .,... .,... ~ ,..., '" 10
..... ~ '" '" L- "" .,.. ~ .... .... <C ..... ~ <C '50
~<C ~ ..... '" '" 00 ~ 00 .... 00 10
fIl 0 C1J~ ..... ",' ...; .0 ~ c-i ...; Q)
"" do ..... • .... ~ .... .,.... ..... C'1
...; ,- p:;
II< lO CIJ <C 00 ...... "" '" <N ..... .,.. ....
'" 0 .0 ~ "'I' 0
< ..... ..... ..... .... <; Eo« ~
Eo« .,..
""" <C <N ..... ~
.,.. ~ .,... a> .::
0-1 a> 0 a> 10 '" a> ..... '" .,... 00 ~
Q)
r:; 10 .... '-:. """
lO <C .... """ <C CN ~ '? 0-1 00
CI) tIJ· ..... ...; 0 00 .0 g. ...; 0 r: ... j:I.j CI:I ~ .... .... 10 a> 10 0
10 ~. L- <N ..... ..... ..... CN
.., Ul a> ..... c-i
~ 00 ~ 0
I .... ..... Q)
r:; .... g. 0
.::
'" .,.. CN
t-t
Eo« .,.. ..... .,... .,... lO "'I' 0
0 00 C') '" '" ..... L-.,.. 10 lO .,... ..... .~
"? tIJ ", C') ..... ..... '" ..... lO 00 ..... ... :&1 .,... 00
C')~ ",' .0 ~ c-i .,..' 00 a> c-i 0 ~
10 C') "" a> 0 .... .... ~ a> 00 k
"" a> tIJ <:> «:. .,... ~ L- ..... CN ..... OJ
II< ..... .,... """
..... ..::::
< ~ Eo« tIJ CN """
.... .,... '" ..... 0 CN 00 00
Eo« '" <C ..... .... CN <C <C .,... CN '8 .,... CI) <N CN 00 '" ~ CN CN ..... ;Z; 10 "'~ a> c-i c-i 0 ~ <Ii 00 ~
..... Jl;l J";Iil ~ t- o '" 00 0 00 '" ,..., 10 ~
:&1 10 C<I ~ "'!- ... <C ..... CN .... .... a> ", . ...; Q)
;Z; ..... .:: 0-1
.S '" -< C<I a> 00 '"
... '" 00 00 """ ..: 00
Eo« '" L- ... '" ... 00 '" 00
.,... .~ ~ '" tIJ .,... 00 0
.,... CN 00 .,... "'I' 10
10 .... ~ ...; 00' 00' <Ii a> 10' 00 a> '" r;.:l '" .....
J., • t- o '" .....
""" ... .,... 0
Eo« 10 co 0 "'!- "" '" ..... <N ..6 0
;Z; a> lQ~ ...; ..... :;;-.... ~
r;.:l ~ ~
"" tIJ '" .,... .., k
II< ..... CN .,... ..... 00 '" '" OJ C') 10 10
""" 10 '" 0 .... ..... ..... :9
-< 10 .... 00 0 CN a> CN 0 ~ """ lO .Q 00 ..... ...; a> <N' ",' <Ii 0 Q) ~ Eo« ..,j. C<I CN ..... 10
""" ..... ... .,... ..::::
10 .,.. CN 10 10 ..... .., rn
fIl >0 "'!- <N <N
.Q C'). Q)
r;.:l a> ..... a ~ .... ~ oS
~ 0 E-t
-< ..::: 0
Ul CQ .,... a> ..... 0 00 .,... 0 .... .., 3 .... ..... ..... 00 "'I' 10 ..... ... ..... " 0 0
""" • ..... 00 to ... ~ 00 ~ 0 ~ '" ... ri 10 <:) 00 ...; ",' a> ..... ...; 0 ,-.:' Q) '"0
Q)
P ..; .... .... "" ..... '" 00
.,... ..... <C '" .:: § 10 .... CN 'q, CN 10 ":l ..<:: oS
;z; a> ", . ...; .... .-::: 0
r;.:l ~ CN 0 10
;:> <ll a> k .....
r;.:l '" """ .... CN '" 10 ..... '" 00 0 Q)
r:; 0 .... '" ... "'I' 0 <C .,... ,- ... ...; .: ... 0 "'I' 0 0 a> CN '" CN 0 .8 10 .S 10 C')
o~ .... ' .0 ...; c-i ...; 0 c-i 00 '" 00
e-i • <N 10 00 '" '" <C .... "'I' 0 ..... 00
r;.:l ..,
.~ 10 CQ 10 'q, CN .... ..... "" .S 00
Ul a> <1:> • ...; ... - <ll OJ
to,) § Q) 0 ...
II< ... 0
r;.:l tIJ a> '" 0 a> a> .... ~ 00 <.l <0 S '" 0 0 0 ..... ,- 0 .,... .,... '" .,.. tIJ .,.. ..... ~
10 ..... ~ 0 ~ .: IiIiI "? ~ 00 1~ a> 00 r- oo oS Q)
0 ..... .... ..... ...; E-t ";
., ..... CN co 00 a> 10 '" 10 ..... .... ~
10 CI) 00 'q, ~ 10 ..... 00 0 0
~ a> ", . ...; ~ .!:l .... .... OJ bO ~
~ rn .S 0
-;a ... 00
~ '" Q) .!:l .§ '"00 o'~ .: '"0
r;.:l o t Q) Q)
~ ~ bOO) 0 '"
j:I OJ '"000 ~ i
.~ E-t a to ci> .~ '"0 Q)
:;j .: ... ~ '" * ~ a "' ...... '" :=:- ~ ~ oS ... ..:::: 00 A :;j Q)
~ OJ E-t M +- 0 ~~~ to ~ ~
CD Q) '" ~ '" I'l P E-t .., OJ ~ .:i .:: P-t.~ oS ~ .... .: E-t .: E-t Q) ..:::: '8 .., Q i: '"
0 0 ..... Q)
'" CD Q) .;: .: "; ~$>
.s:: .... ..<::
-< '"0 C> ~ Q) "; s ... .S .., 0
OJ .. Q) 's. ... '" ... oS
== p:; "; 00 .S .., :;j ~'"O Q)
~ '" r;.:l
Q) 00 oS 00 oS .=: 1=t.2a ~ f;a Q)
III 0 ..... ... ~
g Q) OJ .., ... .., :;j o ... .., ... '" :;, ... ...
0 '" 0 ... 0 :;, 1l p
~ '8 .., CD '50 'a ~~::at
b()
;; ..:::: .: .., .., ..<:: ~ - M P:i Q) .: 0 Q) P:i E-t 0 Jl;l 0 Jl;l ~ p:; < E-t * +-
Eo« Eo<

180
TABLE ADM-VII-LAND REVENUE/RENT
Partioulars 1954·55 1955·56
1 2 3
DeJnand 1,778,3,94.00 2,125,940.00
Rent 1,519,630.00 1,835,345.00
Cess 126,i28.00 126,286.00
Miscellaneous 132,636.00 164,309.00
Collection 1,717,913.00 1,908,943.00
Rent 1,478,466.00 1,648,958.00
Cess 110,568.00 109,211.00
Miscellaneous 128,879.00 145,774.00
Percentage· 96.80 89.56
Rent 97.29 89.84
Cess 87.66 86.48
Miscellaneous •• 97.17 88.72
*Give8 the peroentage of total oolleotion to total demand. NOTES: 1. Figures for 1951·52 to 1953·54 are not available.
(In rupees)
1956·57 1957·58 1958·59 1959·60
4 5 6 7
2~258,81B.OO 2,614,255.00 3,438,811.00 3~063,634.00
1,958,881.00 2,255,946.00 3,003,768.00 2,539,905.00
131,405.00 145,638.00 195,349.00 165,103.00
168,526.00 212,671.00 239,694.00 266,050.00
1,666,484.00 1,334,379.00 2,68~796.00 2,363,2185.00
1,439,031.00 1,116,131.00 2,361,300.00 1,998,526.00
93,508.00 70,132.00 150,196.00 127,277.00
133,945.00 148,116.00 171,300.00 202,250.00
73.18 51.04 78.02 77.14
73.46 49.48 78.61 78.69
71.16 48.16 76.89 77.09
79.48 69.65 71.47 76.02
2. Eduoation oeeswas levied for the first time in 1959·60 and a sum of Re. 92,576.00 is inoluded in demand and 110 sum of Rs. 35,232.00 in oolleotion on account of Eduoation Cess.
SOtrROE : Revenue Department, Bihar.
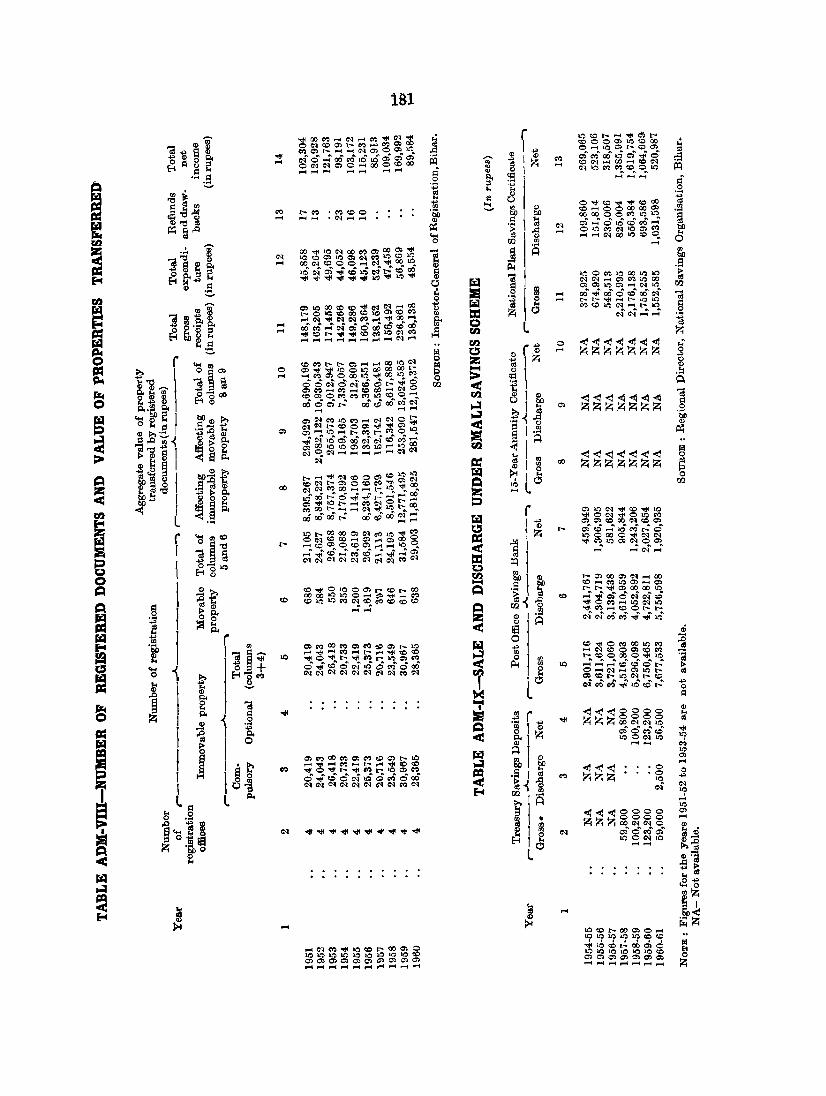
.... ....
o ....
00
....
181
~~g:gg~~~~~ ~1t:>1t:>""~~(')~<o<o ........
..... .....
o .....
00
·0 ·0
It:>
ci
~ "'" 1t:l ..; 1t:l 0> ..... o ...,
IN '? ..... It:> 0> .....
~ al ~:g ~:; -;: ~ .£~ "'Z
~~

1S2
TABLE ADM-X-LIST OF BANKS
Places in the district where banking faciZities exist.
l'>lace Name of Bank Place Name of Bank
2 1 2
BOltARO 1. State Bank of India HAZARIBAGH 1. Hazaribagh Central Co-operative Bank
GIBIDIH
Description
1
No. of policies
1. Giridih Central Co·operative Bank 2. State Bank of India KODARMA 3. United Bank of India 4. United Commercial Bank
2. State Bank of India 3. United Bank of India 1. State Bank of India 2. United Bank of India 1. State Bank ofIndia
SOUROE: The Reserve Bank of India, Bombay.
TABLE ADM-XI-PROGRESS OF LIFE INSURANCE
1957 1958 1959 1960 Staff/Offices 1957 1958 1959 1960
2 3 4 5 1 2 3 4 5
3,446* 2,107 2,361 2,791 Number of-
Sum assured 13,323,912* 7,414,500 8,887,250 11,827,500 Field staff 12 12 11 13 (in Rs.) Agents 570 67G 511 324
Income from pre- N.A. N.A. N.A. 956,000 Sub·offices 2 2 2 mium (in Re.) Branch Offices
Development Centre.
* Separate figures for Hazari bagh and Gaya districts were not available and as such the combined figures have been shown.
N.A.-Not available.
SOUROE : Senior Divisional Manager, Life Insurance Corporation of India, Patna.
TABLE ADM-XII-NUMBER OF MOTOR VEHICLES
Year Motor Trucks Motor Buses Cars and Others Total cycles cabs jeeps
1 2 3 4 5 6 7 8
HAZARIBAGH DISTRIOT
1950·51 160 511 19 104 634 1,428
1951.52 165 562 23 115 684 23 1,572
1952.53 137 406 16 116 713 26 1,414
1953·54 143 411 15 105 581 22 1,277
1954·55 80 325 8 121 708 44 1,286
1955·56 50 310 11 124 561 44 1,100
1958·57 48 323 7 122 544 27 1,071
1957·58 131 407 15 157 705 68 1,483
1958·59 132 449 17 157 696 76 1,527
1959·60 143 433 14 170 757 84 1,601
1960·61 144 439 15 103 790 139 1,630
BIHAR STATE
1950·51 1,450 3,530 197 1,225 6,685 63 13,150
1960·61 3,386 7,766 708 1,881 10,395 984 25,120
SOURCE: State Transport Commissioner, Bihar.
2

i~ ~ is
I 1 '" 1 >. 1.Q L
ria i+" I 0 iE-i
I I 1.$ ~ .::: .() I
1 '" 12 1~ L
....
"" ...
.... ....
.... .... cO
01 110
~.
tC 10
.... to
'" C'1 ....
183
'o:It Q
"" ... ;-00
r--.A.--"-l
o l:I:-~
...
10
"" o

... ~ f~ . § 1 E-i
El • .;;: 1 til
~~~ .... 1 o r ~
..0 1 til a 1 S Z l~
.....
cQ ....
....
·0 .... .....
·0 .... ....
. .....
. .....
. ... . ,_ .....
• 00 .... .co lO
.~ ......
.~ ......
184
...
+ cQ
.....
..... o ... + '0
o ... + .... ....
,_ ,..., o ... + ... .....
00 ..... o ... + ... ,...,
..... 1:<1
o +,
+ co
o ... + ..... 1:<1
.':5

185
TABLE EDN-II-LIST OF EDUCATIONAL INSTITUTIONS
Educational Institution
1
Primary InstitutionsMIDDLE SCHOOLS
Higher InstitutionsHIGH SCHOOL-
(i) For boys
{ii} For girls
HIGDER SECONDARY(i) For boys
(ii) For girls
MULTIPURPOSE HIGDER SECONDARY-(i) For boys (ii) For Girls
COLLEGES-(i) For boys
(ii) For girls
Locations
2
Achaljamu, Akdoni Khurd, Alagdiha. Angwali. Antkadih, Arjadu, Asurbandh, Babudih, Badam, Bagra. BaJIlhanbai, Bansdih, Bara, Baradih. Baramasia, Baramasia, Bargaon, Barhi, Bariatu,Barkagaon, Barkakana, Barkipunu, Barkitanr. Barlanga. Barughutu, Bela, Beonk, Bhaluahi, Bhandra, Bhiknahu, Bhojpur, Bhurkunda, Birne, Budhudih, Chakardaha, Champadih. Chandarpura, Chando. Chandri. Govindpur, Chandwar. Charghara, Chatro, Chatti, Chattibariatu, Chauhe, Cherra, Chhatarmaru, Chirki, Chitardiha, Chitarpur, TIaihar, Dantu, Dari, Dasokhap. Deoria Barg;lUwa. Dhanwar, Dhengadih, Dimra, Domchanch, Doranda. Dugda, Gadisirampur, Garri, Garrikalan. Gawan. Gerua, Ghose, Gidhaur, Gosaindih. Gumia, Hariladih, Hamad, tlosir, Iehak, Isri, Itkhori. Jagarnathdih, Jainagar, Jamuniatanr. Jaridih, Jhargaon, Junori. Kasmar, Karali, Karharia. Kariatpur Chatti, Karma, Katkamsari, Khaira chatar, Kharagdiha, Kheskari, Kiago, Kodarma. Konra. Korambe. Korche, Kosuroha, Kubri, Kuju, Kumarlalo, Kutipisi, Larikalan, Leda, Loagara. Lowalang, Maheshmunda, Mahesra alia8 Mahemr, M ajurhand, Mandaikhurd, Mandhania, Mandu, Marchoi Mathurapur, Meghatari, Meru, Mirganj, Modibigha, Murpa, Nagri, Naudiha. Nawadih. Nawadih, Nawagarh, Oreya, PBchmo, Pagar, Paharidih, Palaunjia, PaJganj, Pandepurkhurd, Parasia, ParBabad. Pasrabahiar. Patardih. Pathalgara, Petarbar. Pibra, Piltaulkalan, Punai. Punidih, Rampur, Rolli. aliaa Gola, Sankh. Saradhu, Saunla. Senadoni, Shahpur, Sheopur, Sila. Singhani. Sobranpur, Sonpur, Tajpur, Tandwa, Tara, Telo, Tiju, Tundag.
Ananda. Bandhdih. Barhi, Barkatha, Basodih, B·engabad. Bhendra, Bhurkunda, Bokaro, Chatra. Chauparan. Chitarpur. Dhanwar. Dhori. Dumri. Gandey. Gawan, Gomia. Buntergunj, Ichak. Ishribazar, Itkhori. Jaridih. Kasmar, Kodenna. Kuhri. Kuroharlala. Makatpur. Mandu Mirzagunj, PachaJllba. Padma. Petarbar, Prtappur, Sankho, Simaria, Suriya.
Chatra. Giridih.
Domchanch. Giridih. Gola, Ilazaribagh (Hindu Ilr. Sec., St. Columbas, B. K. A. V.). Ramgarh.
Hazaribagh.
Bermo, Hazaribagh, Telaiya. Nil.
Giridih, Jhumritilaya, Hazaribagh. Nil.
Prolesslonal InstltutJonsTUOBlDBS TRAINING SCllOOL-
(i) For males Bagoder, Chiterpur, Koderma. Simaria. Sitagarha. (ii) For females Nil.
ENGINEERING SCHOOL(i) For boys
(ii) For girls
Teohnical InstltutioBS(i) Forboys
Baniadih, Kargali, Koderma. Hazaribagh. Nil.
Lokai (Industrial School). Hazaribagh (Agriculture School, Craft and Weaving attached to Reformatory Sohool, Industrial Sohool).
(ii) For girls •• Nil. NOTa. IllitituliiolUl have been named within brackets in all cases where the number is more than one.
G(Cen. )0-13 SOtrROE: Director of :PUblio lnstruction, 13ihar.

186
TABLE EDN-Ill-PRESS AND JOURNALS TABLE EDN-IV-LIST OF CINEMA HOUSES
NUMBER of BOOKS PUBLISHED Year r-----"---_,"'"'"\ r--'- _'-"------'""\
In English In Hindi Presses Newspapers and and Placo Cinema House
at and other other work periodicals Europoan Indian
languages languages
2 3 4 5 1 2
1951·52 13 HAZARIBAGlJ Mohan Talkies House
1952·53 13 1 Anandbhavan
1953·54 13 1 Purnima Talkies
1951·55 13 I RAMGARH Shanti Talkies
1955·56 12 I Giridih Jiwan Talkies
1956-57 12 1 Moti Pioture Palace
1957-58 12 I DUGDA Mahesh Talkies
1958-59 12 I Vindaban Talkills
1959-60 13
1960·61 13 1 SOURCE: Deputy Commissioner (Headquarters).
SOURCE: Political Departlnent, Bihar. Commercial Taxes, Bihar.
PUBLIC HEALTH
TABLE PH-I-MEDICAL FACILITIES
A. MEDICAL PRACTITIONERS
Year
I
1951
1952
1953
]954
1955
1956
1957
1958
1959
Hl60
Degree holders
2
7
4
8
3
4
3
4
2
6
2
Diploma holders
3
2
2
2
7
1
1
B. HOSPITALS AND DISPENSARIES
Name
I
HOSPITALS
District
Subdivisional
Others
DISPENSARIES
State
DiI;trict Board
OTHER HOSPITALS AND DIS
PENSARIES.
PRIMARY HEALTII CENTRES
BEPS
Number
2
8
1
3
4
42
26
16
.22 .
26
735
C. HEALTH INSTITUTIONS
Family Planning Centre-
Sadar Hospital, Hazaribugh
Leprosy Centre-
Peterbar Maternity .nd Child Wellare
Centres-Chatra Giridih Huzaribagh Peterbar
T. B. Ward/Centres-
l:Iazaribagh
Kodarma (IO-l.edded)
Chatra (IO.bedded).
SOVRCE : Director of Health Services, Bihar.

187
COMMUNICATIONS
TABLE OMN-I-MILEAGE OF EXTRA MUNIOIPAL ROADS MAINTAINED BY PUBLIO AUTHORITIES
Maintained by/Nature of Road Mileage
1 2
All Roads . . 1,809.75
P.W.D. &M.E. S. 451.00
Bituminous 368.50
Water bound macadam 7.50
Artificially admixed granular material, etc., on natural 2.25 soil.
Natural Boil motorable in fair weather 35.00
Natural soil unmotorable 37.75
LOOAL BODIES 858.75
Bituminous 664.00
Water bound macadam 182.75
Artificially admixed granular material, etc., on natural 2.00 soil.
Natural Boil motorable in fair weather 6.00
Natural soil unmotorable 4.00
NOTE: Figures under the following head are either nil or not available:
Concrete (P. W. D., M.E.S. and Local Bodies).
P.W.D.- Public Works Department.
~.E.S.- Military Engineering Service.
SOURCE: Chief Engineer, Publio Works Department, Bihar.

00
....
00 <>I
I
~ o ~
188
a e ....
. .... '" ..... . S-_.,
~

t A
,
180
'" .a o e C'I
CI:)
IN
I 'tl d o
!:Ii
a o o ...
C'I

· .... <II = II) !~
i .... o II)
$
Q()
....
.s +>
is o
+> +>
is
190
I
o ~ A

'" a o e ~
o .~ "C
en a o 8 ~
-.~
til
S o o ..
CI
191
en S o 8
CI
til
8 o 8
CI
U1
S o o .. CI
o .... • <;:: ~
a o o .. c,
en <l>
]

192
'" s o 2
0'1
....

c 0 0 ~
:S ~ ~ ~ III ... ... "j ai ai ~ .: ~ ~ ~ .: I oj .. ::i
::i ~ III
III .... as 2- ::i ! ,: t· .., A III III
.~ Q) t A ....
H:i Q) • ..
.S l=l 0 oj
'So § f;I;t 1i ~ 2-
CIl~ .... tll) A = .... ~ 0 0 -E r"'l.~ r"'l .... ~ p;
~ III 1-1 .e: .... 0 .!i: 1i $. t A ..,
A i fI.l .., ~ CD'tS is .~~ .S .S
.~ m ,. tll) t>O ~ g~ .... .0 8
,. ,. g ~ r"'l r"'l oj ..,
CD..c: i~ 'S .... .... CD
~A Q) .!l\ g d d 6 fI.l
III
~ f;il 0
fI.l fI.l III
r4 r4 f;I;i P fI.l 0
fI.l
a a a 0 0 0 g g g ... .... oN
i ~ ~ g. A A A A A
r.? .., .
~ ~ ..,~
~ Ill-; gs g u.i ~ a ~ f;I;t
p.; p.; ~a p.;
co '" <II ~ :::l a a oN It;)
~ .s ~ .J = .... '" <II A ! fJ ~ ..
~ cIS ... g. oj
flt flt A ~
'tS '" Q) ~ ~ .~ ~ !!:! t> ~ . 2 .. .., tll)
.., ~
.., i § ~ 1 .S
i CD !. '" . III ~ ~ ;Q
A~ ~~ CD
~ ~ t3 III III ~ ..:I t § g ~ ~ 0 C)
flt ... I III A .., .... ..,
III !§ ;§ C) .., oil
A ~
.., .Q Q) ~ ~ III ~ iii
CI)
~~ .s~ ~ f4 i ~ ~ A ~ ~ ~ ~ fI.l p.;
~ • , :9 'tS
~ cil
tJ
~ ~ 5 ~ .~ cil
~ ~ ~
~ ~ ~ d! 0 ::i '! :a ....
e1 <
J ....
1 III ~ ~ ..c: .. ..,
~ e 1i ~ PI ~ .S ~ ~ ~ III :. ..c: Z 8 0 ~ ~


195
CMN III
HAZAIlIBAGH I-POLYMETRIC TABLE BARH,4iL
OF BAIIAKATHA J;[j 9
(FIGURES
DISTANCES BAGODAII !. 5 II )3
(IN MILES) BISHUNGARH 10 7 2 23 826
WITHIN BRACKETS INDICATE RAIL DISTANCES) KATKAMSANDI I. 104 7 5 7 14
ICHAK !t 32 43 I 3 21 60'
BA~KAGAON ~ 41 94 I 4 8 5 43 '8 I S
THE DISTANCE BETWEEN ANY TWO PLACES IS KEREOARI 09 3 3 la 0 7 l1 724
INDICATED AT THE INTERSECTION OF THE VERTICAL TANOWA 10 .. I 33 7412 5 .. I 6 15 p
NOTE-
AND HORIZONTAL LINES CONNECTING' THEM MANOU ~ 05 5 .. I 32 2 63 I 4 l 5 64 17
NAGRI ;: 94'0 3 6 72 1263 84 S 5 I ) S I 2
(CHURCHUy'
RAMGARH 4 3 I 459 5164 045 7 4 7 05 4 I I
I"'NAGAR /., I 52 5 768 64 5 4 7 .. 83 31 740
GOLA fa 6 I 5582 974 70 I 556 o 5 5 52 7 i9 4
GUMIA !t (I 5)
6 7 54 I 57 $ 571) 6 960 4 )5 9 I 92 6 4 15745
PETERSAR ~ (4 2) (2 7J
.. I 28 92 77 04 I 87 e 374 5 7 72 I l 4 10 5 57 I 58
KASMAR 10 72 I I 99 163 4774 L8 9 4 9,(!_B I 647 9 4 .. 7 6 27 8 65
JARIOIH 10 6 132 8 2 5 1024 08 ) 5 .. 100 , 68 7 7 085 .. 6 5 3 6 a:; 4 7 ..
KOOARMA ~L 8917 78 70 87 25 3586 96 556 3 45) 5 8 .. , 3 420 .. I
MARKACHO h (8 8)(130) (115)
I 94 B 88 I 8 993 I 384 6 570 B 177 84 667 B 6 I 463 OS)
'!. 8623 69 22 16 43 58 0766 76 1667 8 D 59 I 7 5 52 fATRATU 105936 I 5 54 I. (Ill) !f3X) I) (I 6)
CHAUPARAN 8 I 42269 89 2 a 57 I S 12 96 04 75 26 359< 42 8275 24 ) 2 8 I 2 1 5
ITKHORI ~ 88 350 4101 9 5887 6 7 7 ) 76 24 ) 4 85 I 5 5 4 a 1 6 1195 75 I )62 o I I
HUNTERGANJ /" 2 5 01159 27 6114 128 121 108 109 7 99 4' 5804 9 537 8724 9899 I 786 257
PRATAPPUR 4~ 8 ' 6 I! 18 8 7 2 IL 114 )7 ,L IJ5 7 S 9 07 I 76 5497 4684 5858 9745 8 S ,
CHATRA ;:6202
~
611'''IJBI~IBBe95 2 3 on 7 2 5 97 4 5 560, 9 ) 3 4 1 ~ 2 2 9697 3 584 20
SIMARIA h 4 303" 3 6 " 4 8 I • 2701~948 77 .. 756 9604 146151~1 8384 1 S ~626 as 229
G A WAN ;:'JB ~ 4 110 114 7 26 ~ III 2 8181'~9 17 9105 " I 1129 3 9 a 109 105 9 6749 I 6 OS 3 6 8568 I
TISkl I. 2110 1061121168 " 7 6115 2 n09791 a 47 096 21119 49911'01J69 7759 5 I 44 S 95982
SATGAWAN Iz 6 I 4 112 IJa IJ4 I~a 8 67 8117 .. 2 5 2 I~! 117 110 9 It li9 S S 1~6 '107 112 1~3 III, 110 a 8105 7 4 7 7827 0' 5
JAMUA ~41 8 3 0 I~a 9 6 11'2 II, 7 I I , " I 65 '674 46 6126 2 6" 0 1009 " 87 6 7" 1 9 105 86 96 107 10) 9 4 7 29) 4 84
DEORI/'0)71 ' I , I I
650 II~ 1~4917 7 1~2" 9 1)59 61~6 1117 III IJ4 e 211'4 5 185 6 S 4 I 2 J II. 106 112 126 9 4 7 6 1363 1666
OHANWAR ~ ) I ) 3 9 I 6259 58 5 I~' IJ5 6 3 ~ 5 1:8 I )2 7 8 175665 4 8 02 6 9 77 3789 4 9 08 I 5 9 alo 3 S 28 4 343 6 I
IIIRNI ~ 6 112 116 7
, n87 I J4 2 4 S 027 3 6799 46 0 103 064 5 7" 3 6 9 378 16267 874 5486 4241 7JH 850
GIRIOIH Iz ' I I
7 ) 53 22 26 6406 o 102 121 129 III 9 I 8) II) 4 " 657 87126 5 5 6 ' 7619 28 59 0101 9 7887 I e 7 5 I "OS S717J
eEllMO
'IRTA
IENGABAO I. J I , I I- I iH 125 I ) 82 92 2 I 6593 14 S II) 114 130114 90 82124 52 S 6898 3 6 6 78 8 5 S 1039 101 112 108 99 B 2 9 I 6 67283
GANOE I. 0 I 2 ) ') 3 5 I ITT"' I
5 IL 107 1~2 113 Ici9 100 8 35 78 915 '4 2 2 669 " 5 114 124 140 I ol 100 9 2 125 6 2 6 6 100 8 4 7 7 ~ 8 96 39 9 6 H
DUMRI';:0382 If
I ll~ 5 B 637" 7106 I 4 7J 04 I 6 04 9806 76 6 7 5 8 6 ,02IOfJ~~~ 6 5 " 6 25 I " 5 3 8 9 5 06 .q 02 o I 32 a44'16
ADIH !t I 5 I 49l
II (8-iffI4 7) (4 I)(B 3) to B) 84 I 5 27 I 6 0" 7 8 7 7 8 6 9 7 113 III 7 5 6 8 7 5 6 5 7 3 " 0 3 4 2 7 I • 9 I 25H9638S81725 5 , 9l I 243 955-¥-
NR Iz 4 I 327 25 I 54 ' , 1.2 I Jsla :IS 34 73 7 8 I 5 5 7 8~ ~?_IT-"P~~ 9 6 7 7 5 4 5 8 5 I 4 2 6 J 7 "78707<187037 4 5 77 J J 64
AI. I 0 2 I 6 I 5' 4 85 16 28 17 0101 8 8 8 7 B 2 106 122 126 e 4 716 5 15 B 3 302 4 I 70 B 2 9 8 24411,708 I 7 7 ~ ~ I 7 72 73 4 4,. 5 3
NAW
(ll) (52) (79) (09)(51) (36)
HAZA"18~(iH
B "Rhl
BAGOD""
BISHUNGARH
KATKAMSANDI
I CHAK
BARKAGAON
KEREOARI
TANOWA
MANOU
N",GRI CHURCHU) (
RAMGARH
J AINAGAR
GOlA
GUMIA
fETE RB"R
KA5MAR
J ARIDIH
KODARMA
HARKACHO
PATRATU
I TKHORI
HUNTERGANJ
CHATRA
SIMARIA
GAWAN
TIS R I
SATGA'IIAN
JAMUA
DEORI
DKANWAR
81RNI
GIRIOIH
8ENGA8AD
GANOE
OUMRI
PIRTANR
ae1lMO


Page Description Col. For Read no. no.
1 2 3 4 5
11 Peterbar t203),Police station Jaridih 9 DJegjbJe J
16 Table A.IV,(a)Jaridih Bazar 11 13,37 13,373
45 Giridih Subdivision, Dhanwar 5 1
77 Mother.tongue -U:cdu 27 7,064 1,064
103 25 Unclassified, U 20 10
133 Sadar Subdivision, Total, line 4. 266(6) 266(7)
Ditto Rural, line 9 369(247) 369 (427)
Barhi Anchal, Mauzas, line 2 331(1) 333(1)
135 Keredari Anchal, Mauzas, line 2 350(2) 350(3)
Ditto ditto line II 359 (4) 350(4)
136 Mandu Anchal, Mauzas, lines 22 & 23 Saruhera, 209(3); Sarubera 209( 4); 273(1); 369( 1). 273( 1); 369( 1); 369(1);
Gola Anchal, Mauzas, line 2 273 (7) 273( 1)
137 Peterbar Anchal, Mauzas, last line 203(7) 273 (7)
Jaridih Anchal, Mauzas, line 5 273 (5) 273(4)
138 Markacho Anchal, Mam1:as, line 7 3(}7(1) 207(1) Chatra Subdivision, Total, line 4 384 (17) 348(17)
139 Chauparan Anchal, Mauzas, line 16 Kubri 283 2) Kubri 283 (2) Pratap pur Anchal, M.luzas, line 1 Babhne 307 ( 3) Babhne 207 (3)
140 Chatra Municipality, Town, line 1 2072) 207(2)
Giridih Subdivision, Total, line 9 392(8); 392(8) 392 (8)
141 Jamua Anchal, Mauzas, line 9 360(1) 369( 1)
142 Deori Anohal,Mauzas, lines 22 & 23 Dadhi Chandh Dadhi Chanch 348 (9); 348(9);
Ditto ditto line 29 Chanukdih 348(Il) Dhanukdih 34S( II)
Ditto dit$o line 50 348 (130) 348(103)
Ditto rlitto line !J2 248(3) 348 (33)
142 & Dhanwar Anchal, Mauzlls, lines 8 & 9 272(3); 348 (5); 273(3); 348 (5); 143 348(5);
143 Gande Anchal, Total, line 1 209 (40) 209 (4)