Hawkes LA 2011 Diversity Distrib
17
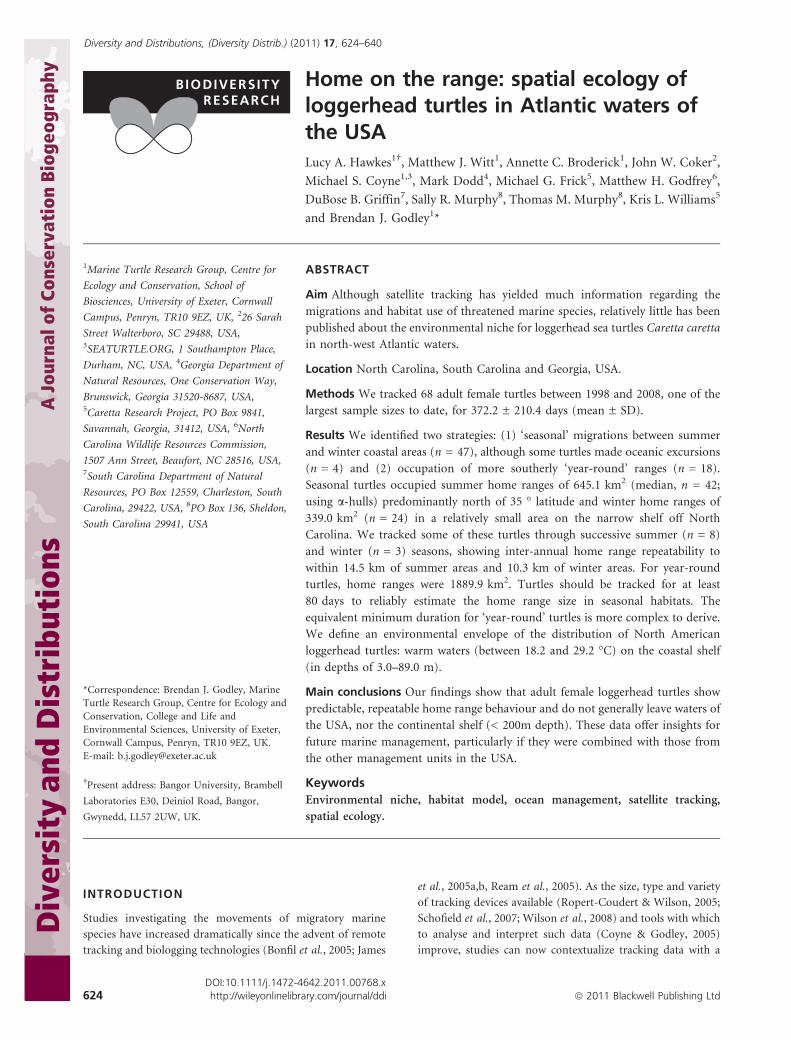
BIODIVERSITY RESEARCH Home on the range: spatial ecology of loggerhead turtles in Atlantic waters of the USA Lucy A. Hawkes 1 , Matthew J. Witt 1 , Annette C. Broderick 1 , John W. Coker 2 , Michael S. Coyne 1,3 , Mark Dodd 4 , Michael G. Frick 5 , Matthew H. Godfrey 6 , DuBose B. Griffin 7 , Sally R. Murphy 8 , Thomas M. Murphy 8 , Kris L. Williams 5 and Brendan J. Godley 1 * INTRODUCTION Studies investigating the movements of migratory marine species have increased dramatically since the advent of remote tracking and biologging technologies (Bonfil et al., 2005; James et al., 2005a,b, Ream et al., 2005). As the size, type and variety of tracking devices available (Ropert-Coudert & Wilson, 2005; Schofield et al., 2007; Wilson et al., 2008) and tools with which to analyse and interpret such data (Coyne & Godley, 2005) improve, studies can now contextualize tracking data with a 1 Marine Turtle Research Group, Centre for Ecology and Conservation, School of Biosciences, University of Exeter, Cornwall Campus, Penryn, TR10 9EZ, UK, 2 26 Sarah Street Walterboro, SC 29488, USA, 3 SEATURTLE.ORG, 1 Southampton Place, Durham, NC, USA, 4 Georgia Department of Natural Resources, One Conservation Way, Brunswick, Georgia 31520-8687, USA, 5 Caretta Research Project, PO Box 9841, Savannah, Georgia, 31412, USA, 6 North Carolina Wildlife Resources Commission, 1507 Ann Street, Beaufort, NC 28516, USA, 7 South Carolina Department of Natural Resources, PO Box 12559, Charleston, South Carolina, 29422, USA, 8 PO Box 136, Sheldon, South Carolina 29941, USA *Correspondence: Brendan J. Godley, Marine Turtle Research Group, Centre for Ecology and Conservation, College and Life and Environmental Sciences, University of Exeter, Cornwall Campus, Penryn, TR10 9EZ, UK. E-mail: [email protected] Present address: Bangor University, Brambell Laboratories E30, Deiniol Road, Bangor, Gwynedd, LL57 2UW, UK. ABSTRACT Aim Although satellite tracking has yielded much information regarding the migrations and habitat use of threatened marine species, relatively little has been published about the environmental niche for loggerhead sea turtles Caretta caretta in north-west Atlantic waters. Location North Carolina, South Carolina and Georgia, USA. Methods We tracked 68 adult female turtles between 1998 and 2008, one of the largest sample sizes to date, for 372.2 ± 210.4 days (mean ± SD). Results We identified two strategies: (1) ‘seasonal’ migrations between summer and winter coastal areas (n = 47), although some turtles made oceanic excursions (n = 4) and (2) occupation of more southerly ‘year-round’ ranges (n = 18). Seasonal turtles occupied summer home ranges of 645.1 km 2 (median, n = 42; using a-hulls) predominantly north of 35 ° latitude and winter home ranges of 339.0 km 2 (n = 24) in a relatively small area on the narrow shelf off North Carolina. We tracked some of these turtles through successive summer (n = 8) and winter (n = 3) seasons, showing inter-annual home range repeatability to within 14.5 km of summer areas and 10.3 km of winter areas. For year-round turtles, home ranges were 1889.9 km 2 . Turtles should be tracked for at least 80 days to reliably estimate the home range size in seasonal habitats. The equivalent minimum duration for ‘year-round’ turtles is more complex to derive. We define an environmental envelope of the distribution of North American loggerhead turtles: warm waters (between 18.2 and 29.2 °C) on the coastal shelf (in depths of 3.0–89.0 m). Main conclusions Our findings show that adult female loggerhead turtles show predictable, repeatable home range behaviour and do not generally leave waters of the USA, nor the continental shelf (< 200m depth). These data offer insights for future marine management, particularly if they were combined with those from the other management units in the USA. Keywords Environmental niche, habitat model, ocean management, satellite tracking, spatial ecology. Diversity and Distributions, (Diversity Distrib.) (2011) 17, 624–640 DOI:10.1111/j.1472-4642.2011.00768.x 624 http://wileyonlinelibrary.com/journal/ddi ª 2011 Blackwell Publishing Ltd A Journal of Conservation Biogeography Diversity and Distributions
Transcript of Hawkes LA 2011 Diversity Distrib
BIODIVERSITYRESEARCH
Home on the range: spatial ecology ofloggerhead turtles in Atlantic waters ofthe USA
Lucy A. Hawkes1�, Matthew J. Witt1, Annette C. Broderick1, John W. Coker2,
Michael S. Coyne1,3, Mark Dodd4, Michael G. Frick5, Matthew H. Godfrey6,
DuBose B. Griffin7, Sally R. Murphy8, Thomas M. Murphy8, Kris L. Williams5
and Brendan J. Godley1*
INTRODUCTION
Studies investigating the movements of migratory marine
species have increased dramatically since the advent of remote
tracking and biologging technologies (Bonfil et al., 2005; James
et al., 2005a,b, Ream et al., 2005). As the size, type and variety
of tracking devices available (Ropert-Coudert & Wilson, 2005;
Schofield et al., 2007; Wilson et al., 2008) and tools with which
to analyse and interpret such data (Coyne & Godley, 2005)
improve, studies can now contextualize tracking data with a
1Marine Turtle Research Group, Centre for
Ecology and Conservation, School of
Biosciences, University of Exeter, Cornwall
Campus, Penryn, TR10 9EZ, UK, 226 Sarah
Street Walterboro, SC 29488, USA,3SEATURTLE.ORG, 1 Southampton Place,
Durham, NC, USA, 4Georgia Department of
Natural Resources, One Conservation Way,
Brunswick, Georgia 31520-8687, USA,5Caretta Research Project, PO Box 9841,
Savannah, Georgia, 31412, USA, 6North
Carolina Wildlife Resources Commission,
1507 Ann Street, Beaufort, NC 28516, USA,7South Carolina Department of Natural
Resources, PO Box 12559, Charleston, South
Carolina, 29422, USA, 8PO Box 136, Sheldon,
South Carolina 29941, USA
*Correspondence: Brendan J. Godley, Marine
Turtle Research Group, Centre for Ecology and
Conservation, College and Life and
Environmental Sciences, University of Exeter,
Cornwall Campus, Penryn, TR10 9EZ, UK.
E-mail: [email protected]
�Present address: Bangor University, Brambell
Laboratories E30, Deiniol Road, Bangor,
Gwynedd, LL57 2UW, UK.
ABSTRACT
Aim Although satellite tracking has yielded much information regarding the
migrations and habitat use of threatened marine species, relatively little has been
published about the environmental niche for loggerhead sea turtles Caretta caretta
in north-west Atlantic waters.
Location North Carolina, South Carolina and Georgia, USA.
Methods We tracked 68 adult female turtles between 1998 and 2008, one of the
largest sample sizes to date, for 372.2 ± 210.4 days (mean ± SD).
Results We identified two strategies: (1) ‘seasonal’ migrations between summer
and winter coastal areas (n = 47), although some turtles made oceanic excursions
(n = 4) and (2) occupation of more southerly ‘year-round’ ranges (n = 18).
Seasonal turtles occupied summer home ranges of 645.1 km2 (median, n = 42;
using a-hulls) predominantly north of 35 � latitude and winter home ranges of
339.0 km2 (n = 24) in a relatively small area on the narrow shelf off North
Carolina. We tracked some of these turtles through successive summer (n = 8)
and winter (n = 3) seasons, showing inter-annual home range repeatability to
within 14.5 km of summer areas and 10.3 km of winter areas. For year-round
turtles, home ranges were 1889.9 km2. Turtles should be tracked for at least
80 days to reliably estimate the home range size in seasonal habitats. The
equivalent minimum duration for ‘year-round’ turtles is more complex to derive.
We define an environmental envelope of the distribution of North American
loggerhead turtles: warm waters (between 18.2 and 29.2 �C) on the coastal shelf
(in depths of 3.0–89.0 m).
Main conclusions Our findings show that adult female loggerhead turtles show
predictable, repeatable home range behaviour and do not generally leave waters of
the USA, nor the continental shelf (< 200m depth). These data offer insights for
future marine management, particularly if they were combined with those from
the other management units in the USA.
Keywords
Environmental niche, habitat model, ocean management, satellite tracking,
spatial ecology.
Diversity and Distributions, (Diversity Distrib.) (2011) 17, 624–640
DOI:10.1111/j.1472-4642.2011.00768.x624 http://wileyonlinelibrary.com/journal/ddi ª 2011 Blackwell Publishing Ltd
A J
ourn
al o
f Co
nser
vati
on B
ioge
ogra
phy
Div
ersi
ty a
nd D
istr
ibut
ions
range of environmental variables to determine their possible
influence on migratory behaviour. Accordingly, we can now
describe habitat use of many species in multiple dimensions –
through time and horizontal and vertical planes (Brischoux
et al., 2007), thermal and dynamic environments (Ream et al.,
2005; Lambardi et al., 2008) and prey fields (Friedlaender
et al., 2006, Witt et al., 2007a).
Understanding the spatio-temporal distribution and abun-
dance of migratory species and their persistent use or re-use of
areas after seasonal migrations (e.g. James et al., 2005a,b;
McMahon & Hays, 2006, Kobayashi et al., 2008; McPherson &
Myers, 2009) is important for the effective management of
large marine vertebrate species of conservation concern.
Effective conservation planning should include spatially and
temporally explicit information about target species and
habitats (Hyrenbach et al., 2000; Parnell et al., 2006), and
projects exist to compile these data (e.g. OBIS-SEAMAP:
Halpin et al., 2009). Further, incorporating animal tracking
data with data describing threats (for example, from fisheries:
Lewison et al., 2004 & Witt et al., 2011; coastal development:
McFadden et al., 2007; pollution: Shahidul Islam & Tanaka,
2004; and climate change (Halpern et al., 2008; Robinson
et al., 2009, Witt et al., 2010a) may yield information that
could significantly aid such management.
With the increase in satellite tracking has come a wealth of
spatio-temporal data for a variety of taxa, with almost every
large marine vertebrate taxon having now been satellite tracked
(e.g. satellite tracking data for 2285 animals across four taxa
hosted online at http://www.wildlifetracking.org; teleost fish
(e.g. Block et al., 2005; Holdsworth et al., 2009; Sims et al.,
2009), cetaceans (e.g. Heide-Jørgensen et al., 2006, Mate et al.,
2007; Andrews et al., 2008), elasmobranchs (e.g. Eckert et al.,
2002; Bonfil et al., 2005) seals & sea lions (e.g. Breed et al., 2009;
Kuhn et al., 2010), seabirds (e.g. Weimerskirch et al., 2000;
Lynnes et al., 2002; Croxall et al., 2005) and marine turtles
(Godley et al., 2008). Much of these data have been published in
location-specific studies but few have been used in meta-data
studies, or to derive population-wide parameters. Marine turtles
are wide-ranging, long-lived, late maturing and are susceptible
to anthropogenic threats such as direct and indirect capture in
fisheries (Zug et al., 1995; Lewison et al., 2004; Epperly et al.,
2007). All species of marine turtles have been satellite tracked in
various ocean basins (reviewed in Godley et al., 2008), and data
now exist to describe spatio-temporal patterns of marine turtle
occurrence in a number of populations.
Adult female marine turtles generally migrate between three
types of home ranges on a seasonal to multi-annual basis: (1)
inter-nesting ranges, occupied by turtles for the duration of the
nesting season (Schofield et al., 2007; Witt et al., 2008) (2)
foraging areas (usually coastal benthic areas for cheloniid
turtles: Plotkin & Spotila, 2002; Dodd & Byles, 2003) and
oceanic areas, previously thought only for leatherback turtles
Dermochelys coriacea (Hatase et al., 2002; Polovina et al., 2004;
James et al., 2005a,b; Hawkes et al., 2006; Houghton et al.,
2006, Hatase et al., 2007; Kobayashi et al., 2008; Seminoff
et al., 2008; Rees et al., 2010) and olive ridley turtles (Lepid-
ochelys olivacea, Polovina et al., 2004; Plotkin, 2010) and in
some temperate areas, (3) wintering areas where some turtles
remain quiescent for extended periods in waters just warm
enough for survival (Broderick et al., 2007; Hawkes et al.,
2007).
The loggerhead sea turtle (Caretta caretta) is found in
temperate and tropical waters of the Atlantic (Ehrhart et al.,
2003), Mediterranean (Margaritoulis et al., 2003), Pacific
(Kamezaki et al., 2003; Limpus & Limpus, 2003) and Indian
(Baldwin et al., 2003) oceans, with the world’s second largest
nesting assemblage utilizing the Atlantic coast of the south-
eastern USA (Ehrhart et al., 2003). Comprising this nesting
assemblage are three genetically distinct subpopulations, now
recognized as three of five Atlantic ‘recovery units’: (Encalada
et al., 1998; National Marine Fisheries Service & Fish and
Wildlife Service, 2008). Despite the nesting population being
well studied, in many respects, there have been comparatively
few data published about specific aspects of their spatial and
temporal distribution and habitat utilization of adults;
information that is important for the designation of appro-
priate protected areas and commercial fisheries impact
mitigation (Palumbi, 2004; Braun-McNeill et al., 2008). In
the context of heterogeneous ocean governance in the USA
(Crowder et al., 2006; McClellan et al., 2011) and given
conservation concern for marine turtles, we quantify home
ranges for adult females from the northern recovery unit
(nesting from Virginia south to the Florida/Georgia state
border) and parameterize a model for their occurrence based
on oceanographic conditions. Including post-pelagic juve-
niles, turtles from this unit number in the thousands, inhabit
commercially fished areas (Lewison et al., 2004; McClellan &
Read, 2007) and occupy waters of one of the most highly
developed countries bordering the Western North Atlantic.
This study brings together one of the largest tracking datasets
for adult female loggerhead sea turtles to date, allowing us to
define the scale, location and drivers of home ranges for
turtles from this subpopulation and also to begin to reveal
the level of fidelity shown to these home ranges.
METHODS
Satellite telemetry
Sixty-eight adult female loggerhead turtles from the northern
recovery unit were instrumented at the nesting site following
clutch deposition in North Carolina (NC, n = 24), South
Carolina (SC, n = 15) and Georgia (GA, n = 29), with
platform transmitter terminals (PTTs) between 1998 and
2008 (supplemental Table S1). Tags were affixed to the second
vertebral scute of the carapace using marine grade epoxy
(PowerFast+, Powers Fasteners, NY, USA) and turtles released
c. 1 h later at the capture site. Tags were programmed to
transmit when at the surface, as indicated by a saltwater switch.
For tag performance metrics, see supplemental Table S1. Data
were downloaded and managed using the Satellite Tracking
and Analysis Tool (STAT; Coyne & Godley, 2005). Argos
Spatial ecology of Atlantic USA loggerhead turtles
Diversity and Distributions, 17, 624–640, ª 2011 Blackwell Publishing Ltd 625
satellite tracking data consist of varying quality of estimates of
location, and a variety of filtering techniques exist with which
to identify the most plausible locations to use in analyses
(Swihart & Slade, 1985; Luschi et al., 1996; Hays et al., 2001;
White & Sjoberg, 2002, Tremblay et al., 2006; Kuhn et al.,
2009; Witt et al., 2010b). To filter the data, we benefited from
the deployment of two GPS ‘Fastloc’ PTT’s (M.S. Coyne
unpublished data ) with which we were able to construct an
optimal filtering schedule for our study. Based on this
schedule, we retained for analysis only location classes 3, 2, 1
and A, and turning angles > 25 � (as acute turning angles are
usually indicative of erroneous, ‘off-track’ locations) and the
best location received on that day (defined as highest quality
location class received that day; where two or more high-
quality locations were received, we only used the first received
that day). We used filtered data to construct home ranges for
each turtle, where applicable. Migration, summer and winter
phases in the data were extracted by plotting displacement
from deployment site (Fig. 1). Migration was considered to
have ceased when displacement began to plateau, likewise
summer and winter phases were considered to have ended
when displacement values started to change again.
Home ranges
In this study, we define a home range as the area that
accommodates all regular activities of an individual and
consider that when animals migrate, they move between
separate seasonal home ranges, which may include breeding,
summer and winter home ranges. Home ranges were
constructed using data-sets describing the area used by each
turtle until subsequent migration. Therefore, in this study, a
home range was considered valid only if the turtle was tracked
until leaving the home range, or if it had occupied the home
range for 6 months or more (57 of 68 turtles, see Supple-
mentary Table S1 for numbers carried forward for analyses).
Where turtles were tracked through multiple years, unless data
from one individual were being compared between seasons,
only the first recorded home ranges were analysed (eight
seasonal turtles completed a second summer foraging season
and three completed a second wintering season, see Fig. S1).
We also considered that summer foraging home ranges
immediately post-nesting would normally be expected to be
shorter than, and therefore potentially smaller than, foraging
ranges in non-breeding years, and we therefore discuss these
separately.
We estimated home ranges using two techniques: the
minimum convex polygon (MCP) and the a-Hull technique.
The MCP estimates home range by drawing the smallest
convex polygon that incorporates all locations. MCPs are
simple to generate and understand, require little computing
power and are therefore widely used. However, MCPs can
include areas of habitat that are likely not visited by tracked
animals (Burgman & Fox, 2003), e.g. concave distributions,
such as in marine applications, terrestrial features (islands or
peninsulas) around which animals may be distributed, but do
not occupy. The MCP technique can be improved upon by
using the a-Hull technique, which estimates species ranges in
a four-step process (see full details in Burgman & Fox, 2003)
and has been used to estimate marine turtle home ranges
previously (Witt et al., 2008). First, all filtered locations are
joined together by non-intersecting lines to form a Delauney
triangulation network. The lengths of all the joining lines are
then measured to obtain the mean line length. All lines
greater than the mean line length multiplied by (a) are
discarded. In building an a-hull complex, adjustments in ‘a’
change the cohesiveness of the overall estimated home range,
moving from a discontinuous, fragmented network to an
MCP. In this study, through iteration, we determined the
optimal (a) to be three standard deviations of the mean
triangle length within each network for each turtle and
applied the same a value to all turtles, such that the home
range was smaller than the MCP. The area encompassed by
the remaining triangles in the network is then summed to
calculate the resultant home range area. The effect of ‘a’ thus
scales proportionately to the spatial architecture of the turtle’s
movements and is dominated by the mean triangle side
length, rather than the multiplier value. In addition, a-hull
estimates do not inflate the estimate of 100% occupation
outside the MCP, as would other techniques such as Kernel
Density Estimates (Laver & Kelly, 2008), yet improve upon
the MCP by cropping out low-use areas objectively. We
generated MCPs using Hawths tools for ArcGIS, and a-Hulls
were processed and mapped using custom script written for
MATLAB (MJW). Data were mapped in ArcGIS 9.3.1 (ESRI,
Redlands, CA, USA). For each home range, we also calculated
the centroid position, defined as the median latitude and
longitude for all filtered location data.
Fidelity
We quantified the extent of site fidelity between consecutive
seasons using the distance between median centroid locations.
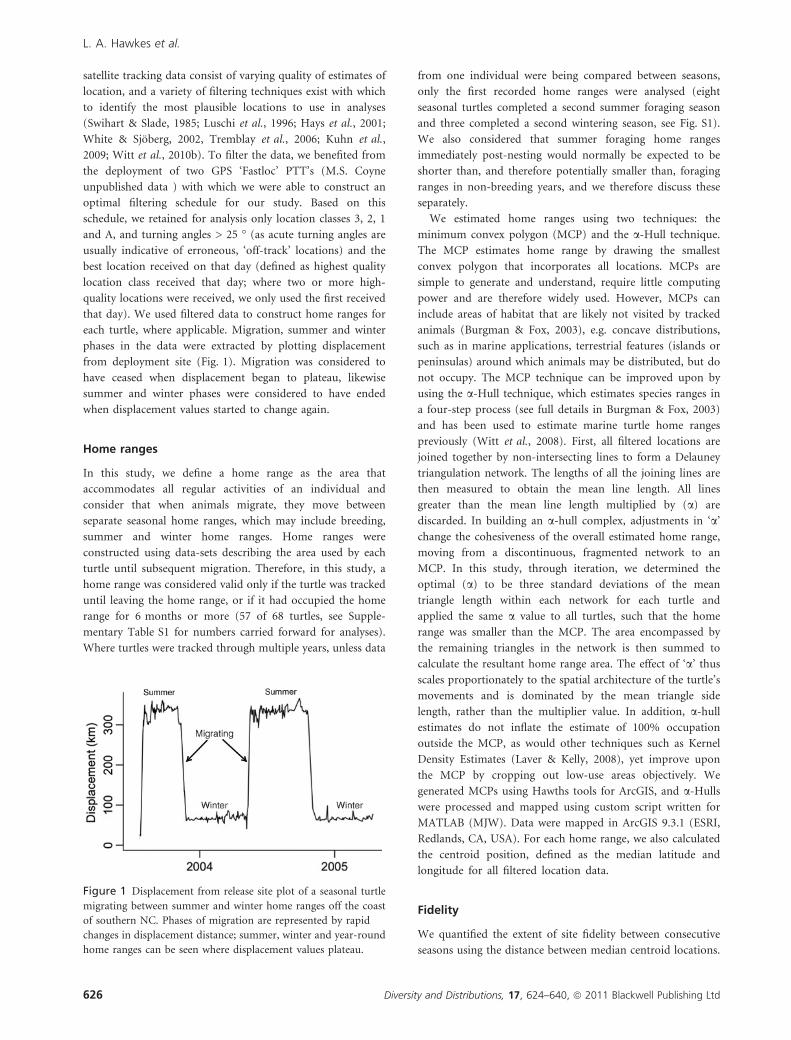
Figure 1 Displacement from release site plot of a seasonal turtle
migrating between summer and winter home ranges off the coast
of southern NC. Phases of migration are represented by rapid
changes in displacement distance; summer, winter and year-round
home ranges can be seen where displacement values plateau.
L. A. Hawkes et al.
626 Diversity and Distributions, 17, 624–640, ª 2011 Blackwell Publishing Ltd
Environmental data
We extracted remotely sensed environmental data (using
custom scripts in MATLAB, MJW) for the best daily ARGOS
locations of the turtles. We used 8-day oceanography products
for sea surface temperatures (SST, from NOAA Geostationary
Operational Environmental Satellite and monthly from the
Advanced Very High Resolution Radiometer). Surface current
geostrophic velocity vector data (AVISO, Ssalto-Duacs
0.3 · 0.3 � gridded absolute dynamic topography, http://
www.aviso.oceanobs.com, all available satellites merged) were
extracted at best temporal resolution, which varied over the
duration of all deployments (weekly, improving to daily).
Bathymetric data used were GEBCO (General Bathymetric Chart
of the Oceans, http://www.bodc.ac.uk/projects/international/
gebco/gebco_digital_atlas).
Habitat suitability model
We quantified the environmental characteristics of habitats
occupied by turtles to develop a method for predicting the
occurrence of loggerhead turtles along the USA coast, a
product of key utility for mitigating threats. First, we used the
habitat suitability model for the eastern United States coast
published in Hawkes et al. (2007), describing suitable habitat
as where SST were warmer than 13.3 �C (Coles & Musick,
2000) and seafloor was shallower than 104 m (using 12 turtles
that are also reported in this study). We tested the performance
of this model by plotting all filtered satellite location data from
53 of the remaining 56 turtles for which there was sufficient
data onto the model surface and enumerated the proportion of
locations that fell in the modelled suitable habitat. Finally, we
constructed a new improved model for summer and winter by
reporting the range of SSTs and bathymetry used by all turtles
with sufficient data.
We analysed data using nonparametric statistics in R 2.10.1,
using Wilcoxon signed-rank test with continuity correction for
matched pairs (function Wilcox.test) and Spearman’s rank
tests.
RESULTS
Turtles were tracked for 372.2 ± 210.4 days (mean ± SD,
range 19–997, n = 68 turtles) and the majority followed one
of two different post-nesting strategies; some turtles (n = 18)
migrated to foraging areas south of 34 �N where they remained
year-round, (Type A1; Godley et al., 2008; Figs 1b, 2a & S1).
All except two of these animals headed south relative to their
nesting beach release sites. The majority of turtles (n = 47)
migrated north to seasonal foraging areas above 35 �N with
subsequent migration south for winter (Type A2; Godley et al.,
2008; Figs 1a & 2a,b). From this point onwards, we refer to
these as ‘year-round’ and ‘seasonal’ turtles, respectively, and we
deal with them separately. Three turtles did not transmit for
sufficiently long enough to be assigned to either strategy and
were omitted from further home range analyses (see Fig. S1).
There was no apparent relationship between post-breeding
strategy and the State in the USA in which the turtle originally
nested (NC: 15 seasonal, three with oceanic excursions, 9 year-
round; SC: 8 seasonal, one with oceanic excursion, 4 year-
round, three could not be assigned to a strategy; and GA 19
seasonal, 5 year-round, five could not be assigned to a
strategy). With the exception of two turtles that foraged in
the Bahamas, and oceanic excursions noted below, which took
place on the high seas, all remaining turtle locations were
received from USA Exclusive Economic Zone waters. We were
able to delineate single home ranges for each turtle’s seasonal
foraging and wintering period, respectively, as well as one
range for year-round turtles, but smaller-scale space use was
not evident from our data (Fig. 1).
Year-round turtles
On average, year-round turtles (n = 13) occupied foraging
areas 482.6 km away from their nesting site (mean value,
± 282.1 SD, range 71.6–956.4) and were recorded in the
waters of South Carolina, Georgia, Florida and the Bahamas
for 353.1 days (± 88.7 days, range 197.8–491.4, n = 13 tur-
tles). Year-round turtles did not make marked migrations to
distinct winter home ranges and remained in the same
general vicinity for the duration of tracking (Fig. 1b).
However, some turtles (n = 8) made short excursions from
their home ranges (moving up to 100 km away from their
home range centroid in varying directions) over several weeks
(median excursion start March to end July). These move-
ments were not sufficiently distinct from overall movements
around the home range to be analysed separately, and the
function of the movements, and whether they were environ-
mentally driven, is not clear. Year-round turtles occupied
home ranges of median 4371.9 km2 (using MCP, 789.3–
6492.7 IQR, n = 13) and 1889.9 km2 (using a-hull, 615.2–
3356.9 IQR, n = 13).
Seasonal turtles
Post-nesting foraging areas for seasonal turtles (n = 42) were
located 683.7 km away from their nesting site (± 265.2 SD,
range 173.5–1165.7) and occupied waters of New Jersey,
Delaware, Maryland, Virginia and North Carolina. Seasonal
turtles remained in their first summer foraging areas for an
average of 71.3 days (mean value, ± 26.6 SD, range 31.4–
124.2) before turning south for winter (median date 13
October, earliest 27 August to latest 23 December). Seasonal
turtles occupied winter areas 293.7 km away from their
original deployment site (mean value, ± 202.8 SD, range
69.7–640.2, n = 24 turtles) for 103.1 days (mean value,
± 35.9 SD, range 22.3–172.9). In the spring (median date 09
March, range 4 February to 14 May), turtles departed again to
the north for summer foraging areas. Four seasonal turtles
(individuals 7, 8, 13 and 16; Table S1) made extended eastward
oceanic excursions from their wintering ranges (22 Nov to 26
Feb; 02 Feb to 20 Aug; 04 Mar to 05 Jun; 05 Apr to 14-Jun,
Spatial ecology of Atlantic USA loggerhead turtles
Diversity and Distributions, 17, 624–640, ª 2011 Blackwell Publishing Ltd 627
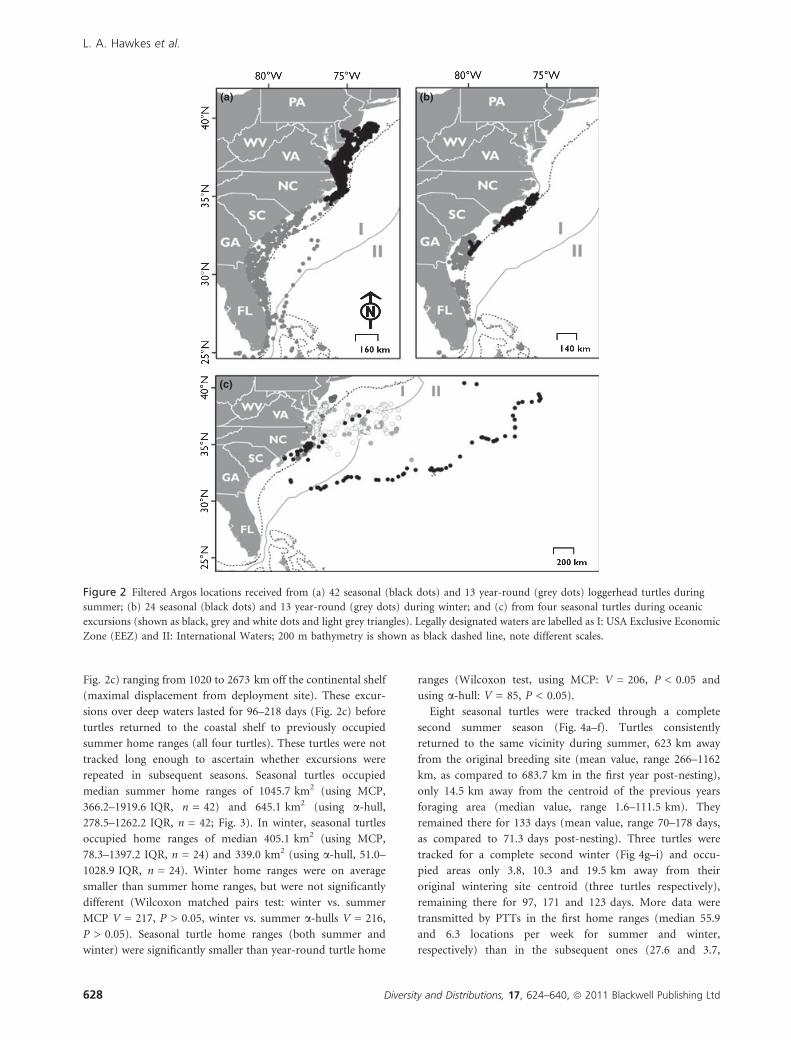
Fig. 2c) ranging from 1020 to 2673 km off the continental shelf
(maximal displacement from deployment site). These excur-
sions over deep waters lasted for 96–218 days (Fig. 2c) before
turtles returned to the coastal shelf to previously occupied
summer home ranges (all four turtles). These turtles were not
tracked long enough to ascertain whether excursions were
repeated in subsequent seasons. Seasonal turtles occupied
median summer home ranges of 1045.7 km2 (using MCP,
366.2–1919.6 IQR, n = 42) and 645.1 km2 (using a-hull,
278.5–1262.2 IQR, n = 42; Fig. 3). In winter, seasonal turtles
occupied home ranges of median 405.1 km2 (using MCP,
78.3–1397.2 IQR, n = 24) and 339.0 km2 (using a-hull, 51.0–
1028.9 IQR, n = 24). Winter home ranges were on average
smaller than summer home ranges, but were not significantly
different (Wilcoxon matched pairs test: winter vs. summer
MCP V = 217, P > 0.05, winter vs. summer a-hulls V = 216,
P > 0.05). Seasonal turtle home ranges (both summer and
winter) were significantly smaller than year-round turtle home
ranges (Wilcoxon test, using MCP: V = 206, P < 0.05 and
using a-hull: V = 85, P < 0.05).
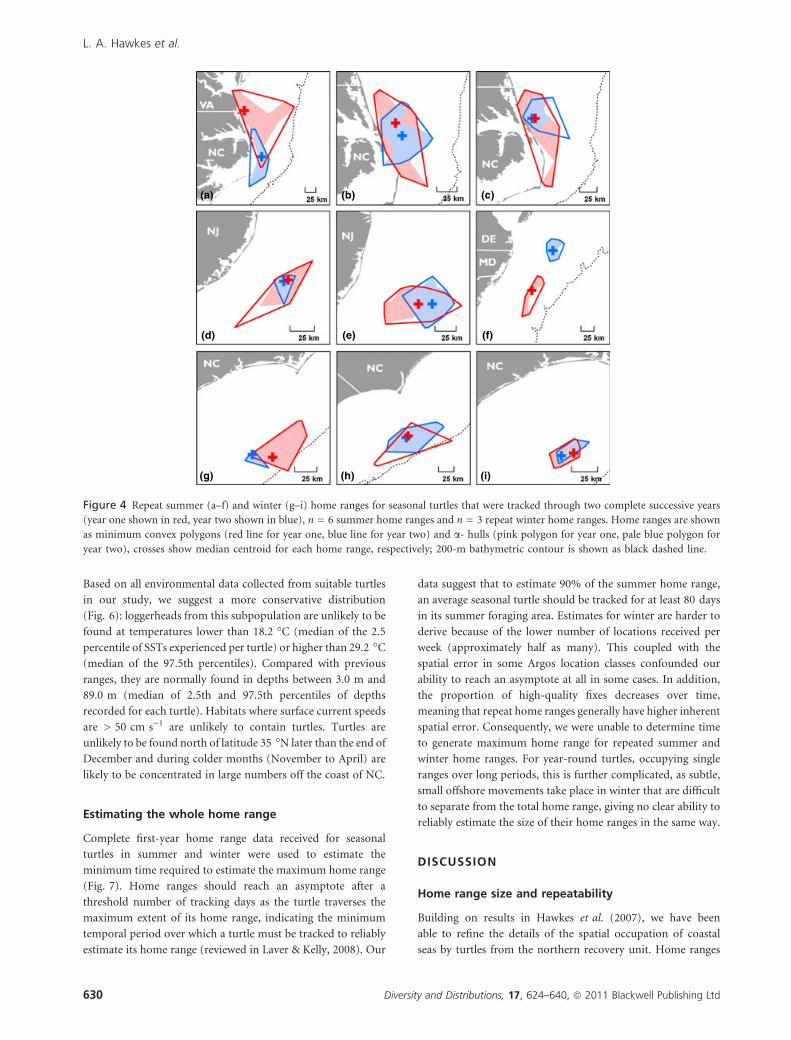
Eight seasonal turtles were tracked through a complete
second summer season (Fig. 4a–f). Turtles consistently
returned to the same vicinity during summer, 623 km away
from the original breeding site (mean value, range 266–1162
km, as compared to 683.7 km in the first year post-nesting),
only 14.5 km away from the centroid of the previous years
foraging area (median value, range 1.6–111.5 km). They
remained there for 133 days (mean value, range 70–178 days,
as compared to 71.3 days post-nesting). Three turtles were
tracked for a complete second winter (Fig 4g–i) and occu-
pied areas only 3.8, 10.3 and 19.5 km away from their
original wintering site centroid (three turtles respectively),
remaining there for 97, 171 and 123 days. More data were
transmitted by PTTs in the first home ranges (median 55.9
and 6.3 locations per week for summer and winter,
respectively) than in the subsequent ones (27.6 and 3.7,
(a)
(c)
(b)
Figure 2 Filtered Argos locations received from (a) 42 seasonal (black dots) and 13 year-round (grey dots) loggerhead turtles during
summer; (b) 24 seasonal (black dots) and 13 year-round (grey dots) during winter; and (c) from four seasonal turtles during oceanic
excursions (shown as black, grey and white dots and light grey triangles). Legally designated waters are labelled as I: USA Exclusive Economic
Zone (EEZ) and II: International Waters; 200 m bathymetry is shown as black dashed line, note different scales.
L. A. Hawkes et al.
628 Diversity and Distributions, 17, 624–640, ª 2011 Blackwell Publishing Ltd
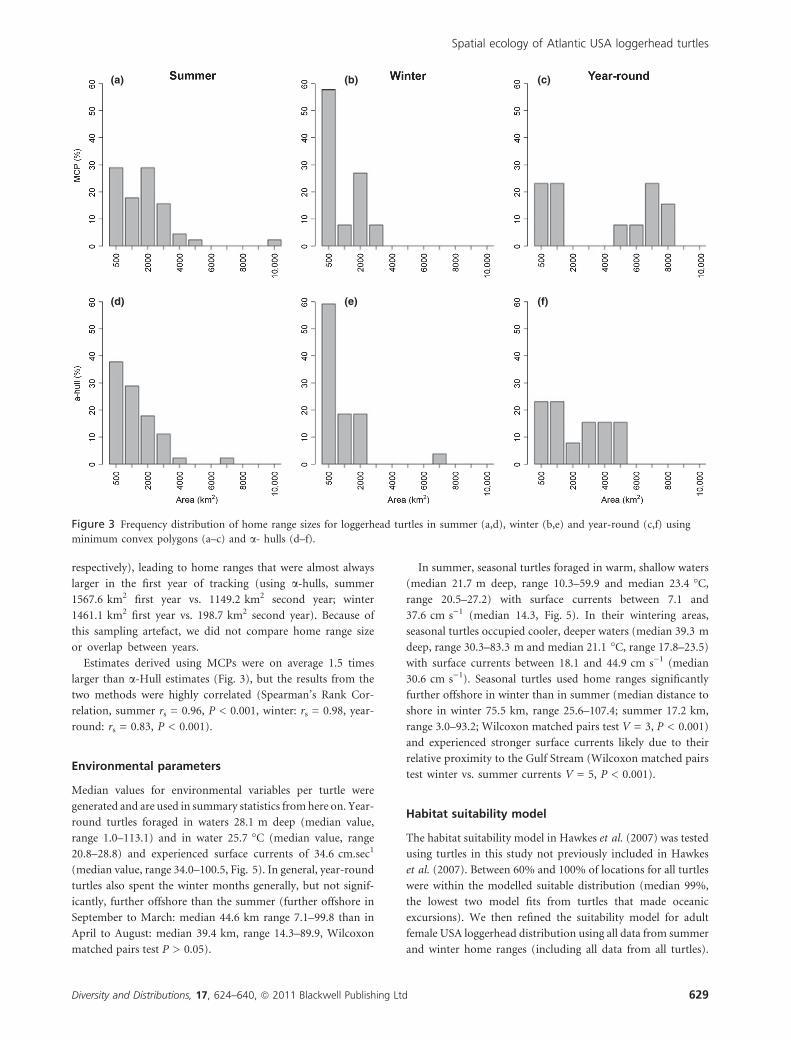
respectively), leading to home ranges that were almost always
larger in the first year of tracking (using a-hulls, summer
1567.6 km2 first year vs. 1149.2 km2 second year; winter
1461.1 km2 first year vs. 198.7 km2 second year). Because of
this sampling artefact, we did not compare home range size
or overlap between years.
Estimates derived using MCPs were on average 1.5 times
larger than a-Hull estimates (Fig. 3), but the results from the
two methods were highly correlated (Spearman’s Rank Cor-
relation, summer rs = 0.96, P < 0.001, winter: rs = 0.98, year-
round: rs = 0.83, P < 0.001).
Environmental parameters
Median values for environmental variables per turtle were
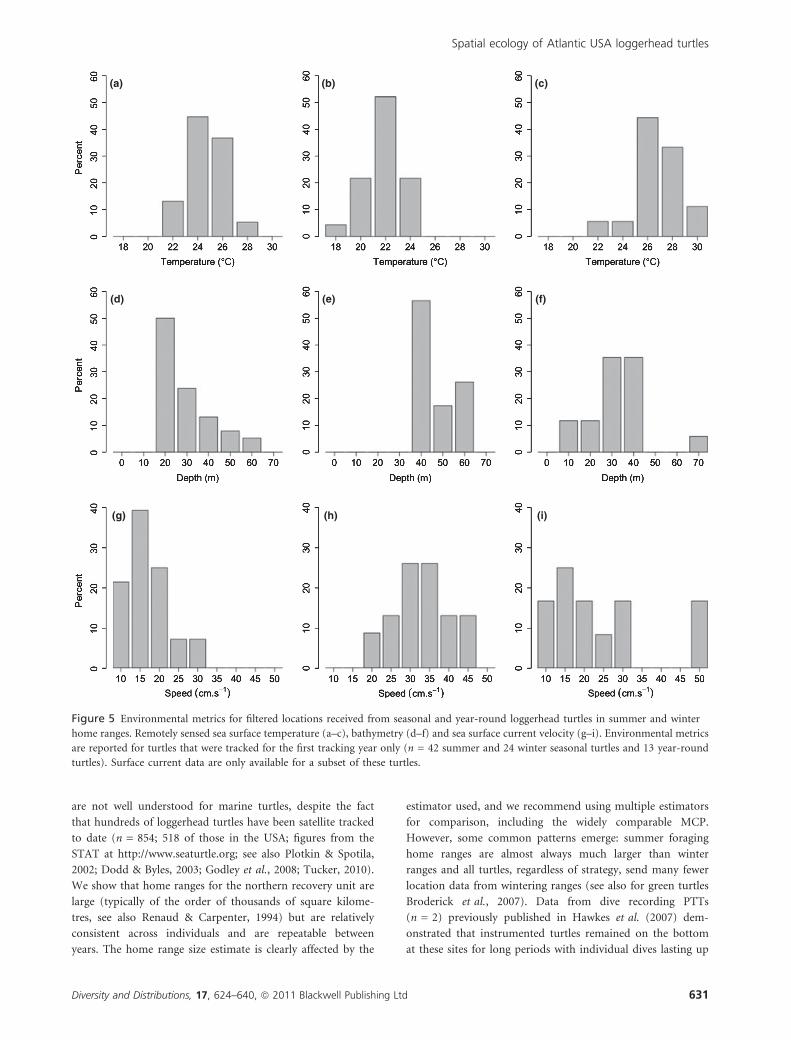
generated and are used in summary statistics from here on. Year-
round turtles foraged in waters 28.1 m deep (median value,
range 1.0–113.1) and in water 25.7 �C (median value, range
20.8–28.8) and experienced surface currents of 34.6 cm.sec1
(median value, range 34.0–100.5, Fig. 5). In general, year-round
turtles also spent the winter months generally, but not signif-
icantly, further offshore than the summer (further offshore in
September to March: median 44.6 km range 7.1–99.8 than in
April to August: median 39.4 km, range 14.3–89.9, Wilcoxon
matched pairs test P > 0.05).
In summer, seasonal turtles foraged in warm, shallow waters
(median 21.7 m deep, range 10.3–59.9 and median 23.4 �C,
range 20.5–27.2) with surface currents between 7.1 and
37.6 cm s)1 (median 14.3, Fig. 5). In their wintering areas,
seasonal turtles occupied cooler, deeper waters (median 39.3 m
deep, range 30.3–83.3 m and median 21.1 �C, range 17.8–23.5)
with surface currents between 18.1 and 44.9 cm s)1 (median
30.6 cm s)1). Seasonal turtles used home ranges significantly
further offshore in winter than in summer (median distance to
shore in winter 75.5 km, range 25.6–107.4; summer 17.2 km,
range 3.0–93.2; Wilcoxon matched pairs test V = 3, P < 0.001)
and experienced stronger surface currents likely due to their
relative proximity to the Gulf Stream (Wilcoxon matched pairs
test winter vs. summer currents V = 5, P < 0.001).
Habitat suitability model
The habitat suitability model in Hawkes et al. (2007) was tested
using turtles in this study not previously included in Hawkes
et al. (2007). Between 60% and 100% of locations for all turtles
were within the modelled suitable distribution (median 99%,
the lowest two model fits from turtles that made oceanic
excursions). We then refined the suitability model for adult
female USA loggerhead distribution using all data from summer
and winter home ranges (including all data from all turtles).
(a) (b) (c)
(d) (e) (f)
Figure 3 Frequency distribution of home range sizes for loggerhead turtles in summer (a,d), winter (b,e) and year-round (c,f) using
minimum convex polygons (a–c) and a- hulls (d–f).
Spatial ecology of Atlantic USA loggerhead turtles
Diversity and Distributions, 17, 624–640, ª 2011 Blackwell Publishing Ltd 629
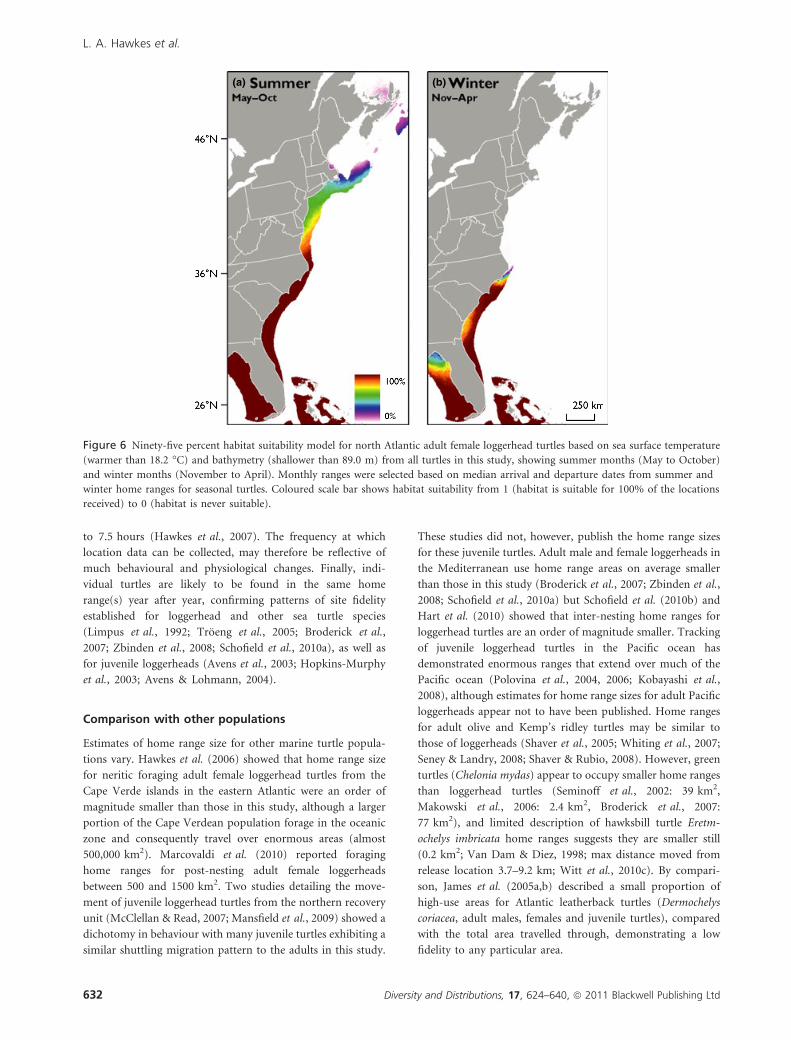
Based on all environmental data collected from suitable turtles
in our study, we suggest a more conservative distribution
(Fig. 6): loggerheads from this subpopulation are unlikely to be
found at temperatures lower than 18.2 �C (median of the 2.5
percentile of SSTs experienced per turtle) or higher than 29.2 �C
(median of the 97.5th percentiles). Compared with previous
ranges, they are normally found in depths between 3.0 m and
89.0 m (median of 2.5th and 97.5th percentiles of depths
recorded for each turtle). Habitats where surface current speeds
are > 50 cm s)1 are unlikely to contain turtles. Turtles are
unlikely to be found north of latitude 35 �N later than the end of
December and during colder months (November to April) are
likely to be concentrated in large numbers off the coast of NC.
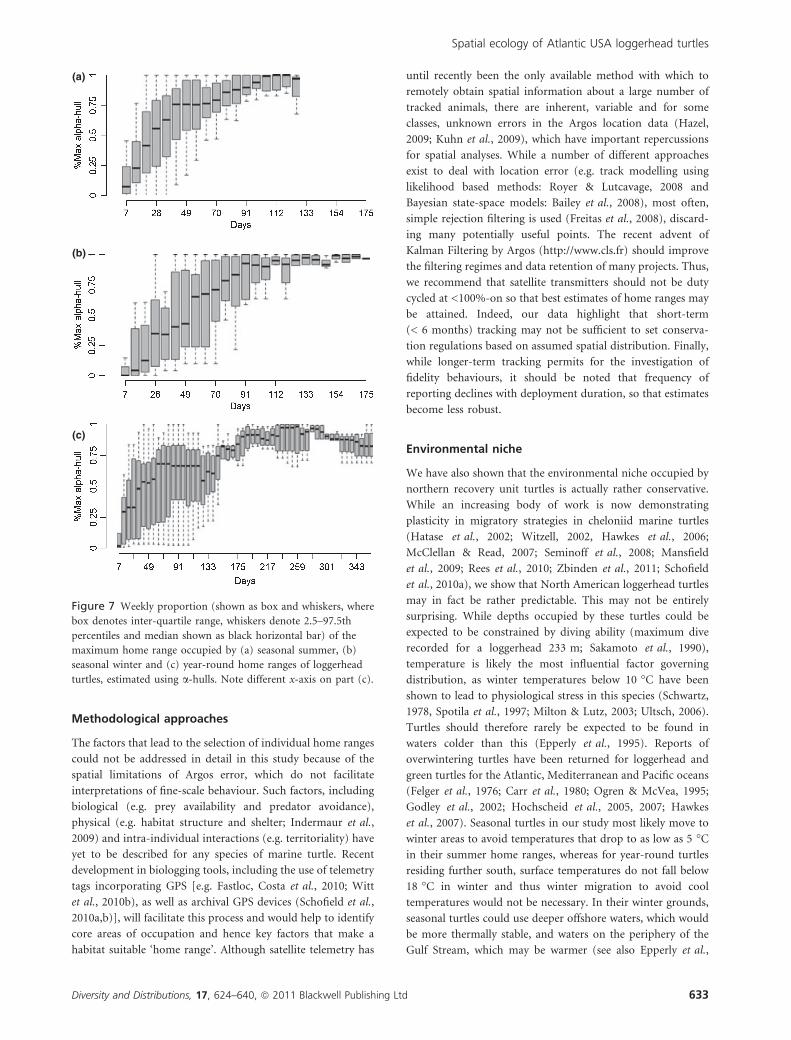
Estimating the whole home range
Complete first-year home range data received for seasonal
turtles in summer and winter were used to estimate the
minimum time required to estimate the maximum home range
(Fig. 7). Home ranges should reach an asymptote after a
threshold number of tracking days as the turtle traverses the
maximum extent of its home range, indicating the minimum
temporal period over which a turtle must be tracked to reliably
estimate its home range (reviewed in Laver & Kelly, 2008). Our
data suggest that to estimate 90% of the summer home range,
an average seasonal turtle should be tracked for at least 80 days
in its summer foraging area. Estimates for winter are harder to
derive because of the lower number of locations received per
week (approximately half as many). This coupled with the
spatial error in some Argos location classes confounded our
ability to reach an asymptote at all in some cases. In addition,
the proportion of high-quality fixes decreases over time,
meaning that repeat home ranges generally have higher inherent
spatial error. Consequently, we were unable to determine time
to generate maximum home range for repeated summer and
winter home ranges. For year-round turtles, occupying single
ranges over long periods, this is further complicated, as subtle,
small offshore movements take place in winter that are difficult
to separate from the total home range, giving no clear ability to
reliably estimate the size of their home ranges in the same way.
DISCUSSION
Home range size and repeatability
Building on results in Hawkes et al. (2007), we have been
able to refine the details of the spatial occupation of coastal
seas by turtles from the northern recovery unit. Home ranges
(a) (b) (c)
(d) (e) (f)
(g) (h) (i)
Figure 4 Repeat summer (a–f) and winter (g–i) home ranges for seasonal turtles that were tracked through two complete successive years
(year one shown in red, year two shown in blue), n = 6 summer home ranges and n = 3 repeat winter home ranges. Home ranges are shown
as minimum convex polygons (red line for year one, blue line for year two) and a- hulls (pink polygon for year one, pale blue polygon for
year two), crosses show median centroid for each home range, respectively; 200-m bathymetric contour is shown as black dashed line.
L. A. Hawkes et al.
630 Diversity and Distributions, 17, 624–640, ª 2011 Blackwell Publishing Ltd
are not well understood for marine turtles, despite the fact
that hundreds of loggerhead turtles have been satellite tracked
to date (n = 854; 518 of those in the USA; figures from the
STAT at http://www.seaturtle.org; see also Plotkin & Spotila,
2002; Dodd & Byles, 2003; Godley et al., 2008; Tucker, 2010).
We show that home ranges for the northern recovery unit are
large (typically of the order of thousands of square kilome-
tres, see also Renaud & Carpenter, 1994) but are relatively
consistent across individuals and are repeatable between
years. The home range size estimate is clearly affected by the
estimator used, and we recommend using multiple estimators
for comparison, including the widely comparable MCP.
However, some common patterns emerge: summer foraging
home ranges are almost always much larger than winter
ranges and all turtles, regardless of strategy, send many fewer
location data from wintering ranges (see also for green turtles
Broderick et al., 2007). Data from dive recording PTTs
(n = 2) previously published in Hawkes et al. (2007) dem-
onstrated that instrumented turtles remained on the bottom
at these sites for long periods with individual dives lasting up
(a) (b) (c)
(d) (e) (f)
(g) (h) (i)
Figure 5 Environmental metrics for filtered locations received from seasonal and year-round loggerhead turtles in summer and winter
home ranges. Remotely sensed sea surface temperature (a–c), bathymetry (d–f) and sea surface current velocity (g–i). Environmental metrics
are reported for turtles that were tracked for the first tracking year only (n = 42 summer and 24 winter seasonal turtles and 13 year-round
turtles). Surface current data are only available for a subset of these turtles.
Spatial ecology of Atlantic USA loggerhead turtles
Diversity and Distributions, 17, 624–640, ª 2011 Blackwell Publishing Ltd 631
to 7.5 hours (Hawkes et al., 2007). The frequency at which
location data can be collected, may therefore be reflective of
much behavioural and physiological changes. Finally, indi-
vidual turtles are likely to be found in the same home
range(s) year after year, confirming patterns of site fidelity
established for loggerhead and other sea turtle species
(Limpus et al., 1992; Troeng et al., 2005; Broderick et al.,
2007; Zbinden et al., 2008; Schofield et al., 2010a), as well as
for juvenile loggerheads (Avens et al., 2003; Hopkins-Murphy
et al., 2003; Avens & Lohmann, 2004).
Comparison with other populations
Estimates of home range size for other marine turtle popula-
tions vary. Hawkes et al. (2006) showed that home range size
for neritic foraging adult female loggerhead turtles from the
Cape Verde islands in the eastern Atlantic were an order of
magnitude smaller than those in this study, although a larger
portion of the Cape Verdean population forage in the oceanic
zone and consequently travel over enormous areas (almost
500,000 km2). Marcovaldi et al. (2010) reported foraging
home ranges for post-nesting adult female loggerheads
between 500 and 1500 km2. Two studies detailing the move-
ment of juvenile loggerhead turtles from the northern recovery
unit (McClellan & Read, 2007; Mansfield et al., 2009) showed a
dichotomy in behaviour with many juvenile turtles exhibiting a
similar shuttling migration pattern to the adults in this study.
These studies did not, however, publish the home range sizes
for these juvenile turtles. Adult male and female loggerheads in
the Mediterranean use home range areas on average smaller
than those in this study (Broderick et al., 2007; Zbinden et al.,
2008; Schofield et al., 2010a) but Schofield et al. (2010b) and
Hart et al. (2010) showed that inter-nesting home ranges for
loggerhead turtles are an order of magnitude smaller. Tracking
of juvenile loggerhead turtles in the Pacific ocean has
demonstrated enormous ranges that extend over much of the
Pacific ocean (Polovina et al., 2004, 2006; Kobayashi et al.,
2008), although estimates for home range sizes for adult Pacific
loggerheads appear not to have been published. Home ranges
for adult olive and Kemp’s ridley turtles may be similar to
those of loggerheads (Shaver et al., 2005; Whiting et al., 2007;
Seney & Landry, 2008; Shaver & Rubio, 2008). However, green
turtles (Chelonia mydas) appear to occupy smaller home ranges
than loggerhead turtles (Seminoff et al., 2002: 39 km2,
Makowski et al., 2006: 2.4 km2, Broderick et al., 2007:
77 km2), and limited description of hawksbill turtle Eretm-
ochelys imbricata home ranges suggests they are smaller still
(0.2 km2; Van Dam & Diez, 1998; max distance moved from
release location 3.7–9.2 km; Witt et al., 2010c). By compari-
son, James et al. (2005a,b) described a small proportion of
high-use areas for Atlantic leatherback turtles (Dermochelys
coriacea, adult males, females and juvenile turtles), compared
with the total area travelled through, demonstrating a low
fidelity to any particular area.
(a) (b)
Figure 6 Ninety-five percent habitat suitability model for north Atlantic adult female loggerhead turtles based on sea surface temperature
(warmer than 18.2 �C) and bathymetry (shallower than 89.0 m) from all turtles in this study, showing summer months (May to October)
and winter months (November to April). Monthly ranges were selected based on median arrival and departure dates from summer and
winter home ranges for seasonal turtles. Coloured scale bar shows habitat suitability from 1 (habitat is suitable for 100% of the locations
received) to 0 (habitat is never suitable).
L. A. Hawkes et al.
632 Diversity and Distributions, 17, 624–640, ª 2011 Blackwell Publishing Ltd
Methodological approaches
The factors that lead to the selection of individual home ranges
could not be addressed in detail in this study because of the
spatial limitations of Argos error, which do not facilitate
interpretations of fine-scale behaviour. Such factors, including
biological (e.g. prey availability and predator avoidance),
physical (e.g. habitat structure and shelter; Indermaur et al.,
2009) and intra-individual interactions (e.g. territoriality) have
yet to be described for any species of marine turtle. Recent
development in biologging tools, including the use of telemetry
tags incorporating GPS [e.g. Fastloc, Costa et al., 2010; Witt
et al., 2010b), as well as archival GPS devices (Schofield et al.,
2010a,b)], will facilitate this process and would help to identify
core areas of occupation and hence key factors that make a
habitat suitable ‘home range’. Although satellite telemetry has
until recently been the only available method with which to
remotely obtain spatial information about a large number of
tracked animals, there are inherent, variable and for some
classes, unknown errors in the Argos location data (Hazel,
2009; Kuhn et al., 2009), which have important repercussions
for spatial analyses. While a number of different approaches
exist to deal with location error (e.g. track modelling using
likelihood based methods: Royer & Lutcavage, 2008 and
Bayesian state-space models: Bailey et al., 2008), most often,
simple rejection filtering is used (Freitas et al., 2008), discard-
ing many potentially useful points. The recent advent of
Kalman Filtering by Argos (http://www.cls.fr) should improve
the filtering regimes and data retention of many projects. Thus,
we recommend that satellite transmitters should not be duty
cycled at <100%-on so that best estimates of home ranges may
be attained. Indeed, our data highlight that short-term
(< 6 months) tracking may not be sufficient to set conserva-
tion regulations based on assumed spatial distribution. Finally,
while longer-term tracking permits for the investigation of
fidelity behaviours, it should be noted that frequency of
reporting declines with deployment duration, so that estimates
become less robust.
Environmental niche
We have also shown that the environmental niche occupied by
northern recovery unit turtles is actually rather conservative.
While an increasing body of work is now demonstrating
plasticity in migratory strategies in cheloniid marine turtles
(Hatase et al., 2002; Witzell, 2002, Hawkes et al., 2006;
McClellan & Read, 2007; Seminoff et al., 2008; Mansfield
et al., 2009; Rees et al., 2010; Zbinden et al., 2011; Schofield
et al., 2010a), we show that North American loggerhead turtles
may in fact be rather predictable. This may not be entirely
surprising. While depths occupied by these turtles could be
expected to be constrained by diving ability (maximum dive
recorded for a loggerhead 233 m; Sakamoto et al., 1990),
temperature is likely the most influential factor governing
distribution, as winter temperatures below 10 �C have been
shown to lead to physiological stress in this species (Schwartz,
1978, Spotila et al., 1997; Milton & Lutz, 2003; Ultsch, 2006).
Turtles should therefore rarely be expected to be found in
waters colder than this (Epperly et al., 1995). Reports of
overwintering turtles have been returned for loggerhead and
green turtles for the Atlantic, Mediterranean and Pacific oceans
(Felger et al., 1976; Carr et al., 1980; Ogren & McVea, 1995;
Godley et al., 2002; Hochscheid et al., 2005, 2007; Hawkes
et al., 2007). Seasonal turtles in our study most likely move to
winter areas to avoid temperatures that drop to as low as 5 �C
in their summer home ranges, whereas for year-round turtles
residing further south, surface temperatures do not fall below
18 �C in winter and thus winter migration to avoid cool
temperatures would not be necessary. In their winter grounds,
seasonal turtles could use deeper offshore waters, which would
be more thermally stable, and waters on the periphery of the
Gulf Stream, which may be warmer (see also Epperly et al.,
(a)
(b)
(c)
Figure 7 Weekly proportion (shown as box and whiskers, where
box denotes inter-quartile range, whiskers denote 2.5–97.5th
percentiles and median shown as black horizontal bar) of the
maximum home range occupied by (a) seasonal summer, (b)
seasonal winter and (c) year-round home ranges of loggerhead
turtles, estimated using a-hulls. Note different x-axis on part (c).
Spatial ecology of Atlantic USA loggerhead turtles
Diversity and Distributions, 17, 624–640, ª 2011 Blackwell Publishing Ltd 633
1995; Hawkes et al., 2007; Mansfield et al., 2009). However,
fast currents in the Gulf Stream (up to 60 cm s)1, Minobe
et al., 2008) could theoretically constrain the distance from
shore for home ranges if extra energetic costs were incurred for
turtles maintaining static home ranges in fast-moving offshore
currents (Hays et al., 2010). Note, however, that upper
temperature limits for turtles in this study may not reflect
preference or tolerance as much as availability, as the waters
occupied by the southern recovery unit are more tropical and
therefore reach warmer maximum temperatures. While the
mechanisms by which the environment may drive distribution
of loggerhead turtles are worthy of future investigation, the fact
that we can confidently predict the environmental niche of
these turtles lends itself well to climate change planning.
Predictive modelling of species range changes in response to
climate change (e.g. Beaugrand et al., 2002; Pearson &
Dawson, 2003; Richardson & Schoeman, 2004; Cotton et al.,
2005; McMahon & Hays, 2006; Chaloupka et al., 2008; Witt
et al., 2010a) depends on such data, preferably incorporating
many individuals and multiple years and should ultimately aid
managers in directing future conservation efforts and funding
appropriately in space and time. However, note that it is not
yet understood how loggerhead turtle dietary breadth and prey
distribution may change with future climate (Hawkes et al.,
2009; Witt et al., 2010a), and efforts should be integrated with
the modelling of prey distribution (McFarlane et al., 2000;
Edwards & Richardson, 2004; Sims et al., 2006; Witt et al.,
2007a).
The oceanic excursions by four turtles observed in our study
may reflect a shift back to the oceanic zone in adult loggerhead
turtles, as has been observed for large juvenile turtles from the
USA population (McClellan & Read, 2007; Mansfield et al.,
2009) from both the northern and southern recovery units
(Rankin-Baransky et al., 2001; Bass et al., 2004; Bowen et al.,
2004) and suggested as one of several explanations for the
gradient noted from stable isotope analysis of nesting turtles
from Florida (Reich et al., 2010). The extent of active choice by
turtles, and role of surface currents, in making these excursions
was not possible to ascertain using data in this study.
Summary statement
Loggerhead turtles, including both sexes and juveniles, likely
number hundreds of thousands in United States eastern
seaboard waters (Shoop & Kenney, 1992; Ehrhart et al., 2003;
Mansfield et al., 2009). In this study, we show that they exhibit
a broad dichotomy in foraging strategies, but broadly conform
to the model behaviour for adult loggerhead turtles (Hopkins-
Murphy et al., 2003). The wide continental shelf off South
Carolina and Georgia is likely occupied by roughly one-third
of the northern recovery unit (c. 1250 adult female turtles,
Ehrhart et al., 2003), and these turtles occupy year-round
home ranges of c. 2000–4000 km2. Conversely, the other two-
thirds of the northern recovery unit (c. 2500 turtles; Ehrhart
et al., 2003) occupy a seasonal range extending northwards as
far as the waters of New Jersey during summer, retracting to a
narrow coastal shelf area (< 30,000 km2) during winter
months (November to April, see also Lutcavage & Musick,
1985; Shoop & Kenney, 1992; Hawkes et al., 2007). Although
some turtles make oceanic excursions into deep water for
several months, these are infrequent when compared with
other populations of loggerheads where oceanic living is
routine for a significant proportion of the population (Hatase
et al., 2002; Hawkes et al., 2006; Rees et al., 2010). These
turtles are unlikely to be found outside the USA EEZ,
potentially simplifying strategies for their conservation relative
to populations of marine turtles that inhabit multiple range
states (Blumenthal et al., 2006; Hawkes et al., 2006; Schofield
et al., 2010a). Work from the considerably more numerous
peninsular Florida recovery unit (Girard et al., 2009) has
revealed that many turtles travel away from the USA as far
south as Mexico and Cuba (11 of 28 turtles), thus introducing
complications for effective conservation strategies for the USA
population as a whole. Given reported declines in nesting
numbers for the peninsular Florida recovery unit (Withering-
ton et al., 2009), this is of increasing importance.
Our collaborative approach, compiling almost all the
satellite tracking datasets that exist for adult female logger-
heads from the northern recovery unit from four different
long-term projects, highlights how such an approach provides
robust data, which can be used to build spatio-temporal
occurrence models and to construct species-specific biocli-
matic envelopes (see also Georges et al., 2007). Such an
approach is in line with the identified ‘global research priorities
for sea turtles’ (Hamann et al., 2010) to elucidate what
parameters influence the biogeography of sea turtles and to
locate their key foraging habitats. Integration of our models
with anthropogenic threat data (e.g. from commercial fisheries;
Lewison et al., 2004; Witt & Godley, 2007, Halpin et al., 2009;
Witt et al., 2011; climate change: Robinson et al., 2009;
Halpern et al., 2008; Hawkes et al., 2009; Witt et al., 2010a)
can then be successfully achieved, identifying key areas of
overlap, which can then be prioritized for conservation
management. A meta-population suitability model for the
entire USA loggerhead population, incorporating available
tracking data from all loggerhead recovery units (Encalada
et al., 1998; National Marine Fisheries Service and US Fish and
Wildlife Service, 2008) should be synthesized as a conservation
priority.
ACKNOWLEDGEMENTS
We thank the staff, volunteers and supporters of the Bald
Head Island Conservancy and the Georgia Department of
Natural Resources. The NC transmitters were funded collab-
oratively by the Bald Head Island Conservancy, the British
Chelonia Group, Juanita Roushdy, Natural Environmental
Research Council, WAVE Foundation/Newport Aquarium
Cincinnati, PADI project AWARE, SEATURTLE.ORG, and
the Whitener Foundation. We thank the USFWS Savannah
Coastal Refuges, G.G. and S.D. at Cape Romain National
Wildlife Refuge, J.F. at Cumberland Island National Seashore
L. A. Hawkes et al.
634 Diversity and Distributions, 17, 624–640, ª 2011 Blackwell Publishing Ltd
and F.H. at Sapelo Island, W.C., C.H., and M.S. for providing
complete project support. Georgia and South Carolina
satellite telemetry research is funded in part by an Endan-
gered Species Act Section 6 Cooperative Agreement with
NOAA Fisheries and the Grays Reef National Marine
Sanctuary. The authors acknowledge using Beyer, H.L.
(2004) Hawth’s analysis tools for ArcGIS. http://www.
spatialecology.com/htools. Sea surface current (geostrophic
velocity vector) altimeter products were produced by Ssalto/
Duacs as part of the Environment and Climate EU Enact
project (EVK2-CT2001-00117) and distributed by Aviso, with
support from CNES. Sea surface temperature data are from
NASA MODIS Aqua/Terra satellites, NOAA GOES satellites,
distributed by National Oceanographic Data Center, and
Advanced Very High Resolution (AVHRR) satellite-based
sensors. L.A.H. is supported by a University of Exeter
Postgraduate Scholarship and the Anning-Morgan Bursary.
M.J.W. is supported by the Peninsula Research Institute for
Marine Renewable Energy (PRIMaRE) through the South
West of England Regional Development Agency. B.J.G. and
A.C.B. acknowledge the additional support of the Darwin
Initiative, European Social Fund and the Natural Environ-
ment Research Council. This work is the result of a major
collaborative effort: B.J.G., D.G., M.C., M.D., M.G.F.,
M.H.G., K.L.W. and S.M. deployed the satellite tags, L.A.H.
and M.J.W. analysed the data, L.A.H. and B.J.G. led the
writing with contribution from all authors.
REFERENCES
Andrews, R.D., Pitman, R.L. & Balance, L.T. (2008) Satellite
tracking reveals distinct movement patterns for Type B and
Type C killer whales in the southern Ross sea Antarctica.
Polar Biology, 31, 1461–1468.
Avens, L.A. & Lohmann, K.J. (2004) Navigation and seasonal
migratory orientation in juvenile sea turtles. Journal of
Experimental Biology, 207, 1771–1778.
Avens, L., Braun, J.B., Epperly, S.P. & Lohmann, K.J. (2003)
Site fidelity and homing behavior in juvenile loggerhead sea
turtles, Caretta caretta. Marine Biology, 143, 211–220.
Bailey, H., Shillinger, G., Palacios, D., Bograd, S., Spotila, J.,
Paladino, F. & Block, B. (2008) Identifying and comparing
phases of movement by leatherback turtles using state space
models. Journal of Experimental Marine Biology and Ecology,
356, 128–135.
Baldwin, R., Hughes, G.R. & Prince, R.I.T. (2003) Loggerhead
turtles in the Indian Ocean. Loggerhead sea turtles (ed. by
A.B. Bolten and B.E. Witherington), pp. 218–232. Smithso-
nian Books, Washington.
Bass, A.L., Epperly, S.P. & Braun-McNeill, J. (2004) Multi-year
analysis of stock composition of a loggerhead turtle (Caretta
caretta) foraging habitat using maximum likelihood and
Bayesian methods. Conservation Genetics, 5, 783–796.
Beaugrand, G., Reid, P.C., Ibanez, F., Lindley, J.A. & Edwards,
M. (2002) Reorganization of North Atlantic marine copepod
biodiversity and climate. Science, 296, 1692–1694.
Block, B.A., Teo, S.L.H., Walli, A., Boustany, A., Stokesbury,
M.J.W., Farwell, C.J., Weng, K.C., Dewar, H. & Williams,
T.D. (2005) Electronic tagging and population structure of
Atlantic bluefin tuna. Nature, 434, 1121–1127.
Blumenthal, J.M., Solomon, J.L., Bell, C.D., Austin, T.J.,
Ebanks-Petrie, G., Coyne, M.S., Broderick, A.C. & Godley,
B.J. (2006) Satellite tracking highlights the need for inter-
national cooperation in marine turtle management. Endan-
gered Species Research, 2, 51–61.
Bonfil, R., Meyer, M., Scholl, M.C., Johnson, R., O’Brien, S.,
Oosthuizen, H., Swanson, S., Kotze, D. & Paterson, M.
(2005) Transoceanic migration, spatial dynamics, and
population linkages of white sharks. Science, 310, 100–
103.
Bowen, B.W., Bass, A.L., Chow, S., Bostrom, M., Bjorndal,
K.A., Bolten, A.B., Okuyama, T., Bolker, B.M., Epperly, S.,
Lacasella, E., Shaver, D., Dodd, M., Hopkins-Murphy, S.R.,
Musick, J.A., Swingle, M., Rankin- Baransky, K., Teas, W.,
Witzell, W.N. & Dutton, P.H. (2004) Natal homing in
juvenile loggerhead turtles (Caretta caretta). Molecular
Ecology, 13, 3797–3808.
Braun-McNeill, J., Sasso, C.R., Epperly, S.P. & Rivero, C.
(2008) Feasibility of using sea surface temperature imagery
to mitigate Cheloniid sea turtle-fishery interactions off the
coast of northeastern USA. Endangered Species Research, 5,
257–266.
Breed, G.A., Jonsen, I.D., Myers, R.A., Bowen, W.D. & Leon-
ard, M.L. (2009) Sex-specific, seasonal foraging tactics of
adult grey seals (Halichoerus grypus) revealed by state–space
analysis. Ecology, 90, 3209–3221.
Brischoux, F., Bonnet, X., Cook, T.R. & Shine, R. (2007)
Allometry of diving capacities: ectothermy v endothermy.
Evolutionary Biology, 21, 324–329.
Broderick, A.C., Coyne, M.S., Fuller, W.J., Glen, F. & Godley,
B.J. (2007) Fidelity and over-wintering of sea turtles. Pro-
ceedings of the Royal Society B: Biological Sciences, 274, 1533–
1538.
Burgman, M.A. & Fox, J.C. (2003) Bias in species range esti-
mates from minimum convex polygons: implications for
conservation and options for improved planning. Animal
Conservation, 6, 19–28.
Carr, A., Ogren, L. & McVea, C. (1980) Apparent hibernation
by the Atlantic loggerhead turtle Caretta caretta off Cape
Canaveral, Florida. Biological Conservation, 19, 7–14.
Chaloupka, M., Kamezaki, N. & Limpus, C. (2008) Is climate
change affecting the population dynamics of the endangered
Pacific loggerhead sea turtle? Journal of Experimental Marine
Biology and Ecology, 356, 136–143.
Coles, W.C. & Musick, J.A. (2000) Satellite sea surface tem-
perature analysis and correlation with sea turtle distribution
off North Carolina. Copeia, 2, 551–554.
Costa, D.P., Robinson, P.W., Arnould, J.P.Y., Harrison, A.L.,
Simmons, S.E., Hassrick, J.L., Hoskins, A.J., Kirkman, S.P.,
Oosthuizen, H., Villegas-Amtmann, S. & Crocker, D.E.
(2010) Accuracy of ARGOS locations of Pinnipeds at-sea
estimated using fastloc GPS. PLoS One, 5, 1–9.
Spatial ecology of Atlantic USA loggerhead turtles
Diversity and Distributions, 17, 624–640, ª 2011 Blackwell Publishing Ltd 635
Cotton, P.A., Sims, D.W., Fanshawe, S. & Chadwick, M. (2005)
The effects of climate variability on zooplankton and basking
shark (Cetorhinus maximus) relative abundance off south-
west Britain. Fisheries Oceanography, 14, 151–155.
Coyne, M.S. & Godley, B.J. (2005) Satellite Tracking and
Analysis Tool (STAT): an integrated system for archiving,
analyzing and mapping animal tracking data. Marine Ecology
Progress Series, 301, 1–7.
Crowder, L.B., Osherenko, G., Young, O.R., Airame, S., Nod-
arse, E.A., Baron, N., Day, J.C., Douvere, F., Ehler, C.N.,
Halpern, B.S., Langdon, S.J., McLeod, K.L., Ogden, J.C.,
Peach, R.E., Rosenburg, A.A. & Wilson, J.A. (2006) Resolv-
ing mismatches in U.S. ocean governance. Science, 313, 617–
618.
Croxall, J.P., Silk, J.R.D., Phillips, R.A., Afanasyev, V. & Briggs,
D.R. (2005) Global circumnavigations: tracking year-round
ranges of nonbreeding albatrosses. Science, 307, 249–250.
Dodd, C.K. & Byles, R. (2003) Post-nesting movements and
behaviour of loggerhead sea turtles (Caretta caretta)
departing from east central Florida nesting beaches. Chelo-
nian Conservation and Biology, 4, 530–536.
Eckert, S.A., Dolar, L.L., Kooyman, G.L., Perrin, W. & Rah-
man, R.A. (2002) Movements of whale sharks (Rhincodon
typus) in south-east Asian waters as determined by satellite
telemetry. Journal of Zoology, 257, 111–115.
Edwards, M. & Richardson, A.J. (2004) Impact of climate
change on marine pelagic phenology and trophic mismatch.
Nature, 430, 881–884.
Ehrhart, L.M., Bagley, D.A. & Redfoot, W.E. (2003) Logger-
head turtles in the Atlantic Ocean: geographic distribution,
abundance and population status. Loggerhead sea turtles (ed.
by A.B. Bolten and B.E. Witherington), pp. 155–174.
Smithsonian Books, Washington.
Encalada, S.E., Bjorndal, K.A., Bolten, A.B., Zurita, J.C., Sch-
roeder, B., Possardt, E., Sears, C.J. & Bowen, B.W. (1998)
Population structure of loggerhead turtle (Caretta caretta)
nesting colonies in the Atlantic and Mediterranean as
inferred from mitochondrial DNA control region sequences.
Marine Biology, 130, 567–575.
Epperly, S.P., Braun, J., Chester, A.J., Cross, F.A., Merriner,
J.V. & Tester, P.A. (1995) Winter distribution of sea turtles
in the vicinity of Cape Hatteras and their interactions with
the summer Flounder Fishery. Bulletin of Marine Science, 56,
547–568.
Epperly, S.P., Braun-McNeill, J. & Richards, P.M. (2007)
Trends in catch rates of sea turtles in North Carolina, USA.
Endangered Species Research, 3, 283–293.
Felger, R.S., Clifton, K. & Regal, P.J. (1976) Winter dormancy
in sea turtles: independent discovery and exploitation in the
Gulf of California by two local cultures. Science, 191, 283–
285.
Freitas, C., Lydersen, C., Fedak, M.A. & Kovacs, K.M. (2008) A
simple new algorithm to filter marine mammal Argos loca-
tions. Marine Mammal Science, 24, 315–325.
Friedlaender, A.S., Halpin, P.N., Qian, S.S., Lawson, G.L.,
Wiebe, P.H., Thiele, D. & Read, A.J. (2006) Whale distri-
bution in relation to prey abundance and oceanographic
processes in shelf waters of the Western Antarctic Peninsula.
Marine Ecology Progress Series, 317, 297–310.
Georges, J.Y., Fossette, S., Billes, A., Ferraroli, S., Fretey, J.,
Gremilet, D., Le Maho, Y., Myers, A.E., Tanaka, H. & Hays,
G.C. (2007) Meta-analysis of movements in Atlantic leath-
erback turtles during the nesting season: conservation
implications. Marine Ecology Progress Series, 338, 225–232.
Girard, C., Tucker, A.D. & Calmettes, B. (2009) Post-nesting
migrations of loggerhead sea turtles in the Gulf of Mexico:
dispersal in highly dynamic conditions. Marine Biology, 156,
1827–1839.
Godley, B.J., Richardson, S., Broderick, A.C., Coyne, M.S.,
Glen, F. & Hays, G.C. (2002) Long-term satellite telemetry of
the movements and habitat utilisation by green turtles in the
Mediterranean. Ecography, 25, 352–362.
Godley, B.J., Blumenthal, J.M., Broderick, A.C., Coyne, M.S.,
Godfrey, M.H., Hawkes, L.A. & Witt, M.J. (2008) Satellite
tracking of sea turtles: where have we been and where do we
go next? Endangered Species Research, 4, 3–22.
Halpern, B.S., Walbridge, S., Selkoe, K.A., Kappel, C.V., Mic-
heli, F., D’Agrosa, C., Bruno, J.F., Casey, K.S., Ebert, C., Fox,
H.E., Fujita, R., Heinemann, D., Lenihan, H.S., Madin,
E.M.P., Perry, M.T., Selig, E.R., Spalding, M., Steneck, R. &
Watson, R. (2008) A global map of human impact on marine
ecosystems. Science, 319, 948–952.
Halpin, P.N., Read, A.J., Fujioka, E., Best, B.D., Donnelly, B.,
Hazen, L.J., Kot, C., Urian, K., LaBrecque, E., Dimatteo, A.,
Cleary, J., Good, C., Crowder, L.B. & Hyrenbach, K.D.
(2009) OBIS-SEAMAP: the world data center for marine
mammal, sea bird and sea turtle distributions. Oceanography,
22, 96–107.
Hamann, M., Godfrey, M.H., Seminoff, J.A. et al. (2010)
Global research priorities for sea turtles: informing man-
agement and conservation in the 21st century. Endangered
Species Research, 11, 245–269.
Hart, K.M., Zawada, D.G., Fujisaki, I. & Lidz, B.H. (2010)
Inter-nesting habitat-use patterns of loggerhead sea turtles:
enhancing satellite tracking with benthic mapping. Aquatic
Biology, 11, 77–90.
Hatase, H., Takai, N., Matsuzawa, Y., Sakamoto, W., Omuta,
K., Goto, K., Arai, N. & Fujiwara, T. (2002) Size related
differences in feeding habitat use of female adult loggerhead
turtles Caretta caretta around Japan determined by stable
isotope analyses and satellite telemetry. Marine Ecology
Progress Series, 233, 273–281.
Hatase, H., Omuta, K. & Tsukamoto, K. (2007) Bottom or
midwater: alternative foraging behaviours in adult female
loggerhead sea turtles. Journal of Zoology, 273, 46–55.
Hawkes, L.A., Broderick, A.C., Coyne, M.S., Godfrey, M.H.,
Lopez-Jurado, L.F., Lopez-Suarez, P., Merino, S.E., Varo-
Cruz, N. & Godley, B.J. (2006) Phenotypically linked
dichotomy in sea turtle foraging requires multiple conser-
vation approaches. Current Biology, 16, 990–995.
Hawkes, L.A., Broderick, A.C., Coyne, M.S., Godfrey, M.H. &
Godley, B.J. (2007) Only some like it hot – quantifying the
L. A. Hawkes et al.
636 Diversity and Distributions, 17, 624–640, ª 2011 Blackwell Publishing Ltd
environmental niche of the loggerhead sea turtle. Diversity
and Distributions, 13, 447–457.
Hawkes, L.A., Broderick, A.C., Godfrey, M.H. & Godley, B.J.
(2009) Climate change and marine turtles. Endangered Spe-
cies Research, 7, 137–154.
Hays, G.C., Akesson, S., Godley, B.J., Luschi, P. & Santidrian,
P. (2001) The implications of location accuracy for the
interpretation of satellite-tracking data. Animal Behaviour,
61, 1035–1040.
Hays, G.C., Fossette, S., Katselidis, K.A., Mariani, P. & Scho-
field, G. (2010) Ontogenetic development of migration:
Lagrangian drift trajectories suggest a new paradigm for sea
turtles. Journal of the Royal Society Interface, 7, 1319–1327.
Hazel, J. (2009) Evaluation of fast-acquisition GPS in sta-
tionary tests and fine-scale tracking of green turtles. Journal
of Experimental Marine Biology and Ecology, 374, 58–68.
Heide-Jørgensen, M.P., Laidre, K.L., Jensen, M.V., Dueck, L. &
Postma, L.D. (2006) Dissolving stock discreteness with
satellite tracking: bowhead whales in Baffin bay. Marine
Mammal Science, 22, 34–45.
Hochscheid, S., Bentivegna, F. & Hays, G.C. (2005) First
records of dive durations for a hibernating sea turtle. Biology
Letters, 1, 82–86.
Hochscheid, S., Bentivegna, F., Bradai, M.N. & Hays, G.C.
(2007) Overwintering behaviour in sea turtles: dormancy is
optional. Marine Ecology Progress Series, 340, 287–298.
Holdsworth, J.C., Sippel, T.J. & Block, B.A. (2009) Near real
time satellite tracking of striped marlin (Kajikia audax)
movements in the Pacific Ocean. Marine Biology, 156, 505–
514.
Hopkins-Murphy, S.R., Owens, D.W. & Murphy, T.M. (2003)
Ecology of immature loggerheads on foraging grounds and
adults in internesting habitat in the eastern United States.
Loggerhead sea turtles (ed. by A. Bolton and B. Withering-
ton), pp. 79–92. Smithsonian Institution Press, Washington,
DC.
Houghton, J.D.R., Doyle, T.K., Wilson, M.W., Davenport, J. &
Hays, G.C. (2006) Jellyfish aggregations and leatherback
turtle foraging patterns in a temperate coastal environment.
Ecology, 87, 1967–1972.
Hyrenbach, D., Forney, K.A. & Dayton, P.K. (2000) Marine
protected areas and ocean basin management. Aquatic
Conservation: Marine and Freshwater Ecosystems, 10, 437–
458.
Indermaur, L., Gehring, M., Wehrle, W., Tockner, K. & Naef-
Daenzer, B. (2009) Behaviour-based scale definitions for
determining individual space use: requirements of two
amphibians. American Naturalist, 173, 60–71.
James, M.C., Myers, R.A. & Ottensmeyer, C.A. (2005a)
Behaviour of leatherback sea turtles, Dermochelys coraicea,
during the migratory cycle. Proceedings of the Royal Society B:
Biological Sciences, 272, 1547–1555.
James, M., Ottensmayer, C.A. & Myers, R.A. (2005b) Identi-
fication of high-use habitat and threats to leatherback sea
turtles in northern waters: new directions for conservation.
Ecology letters, 8, 195–201.
Kamezaki, N., Matsuzawa, K., Abe, O. et al. (2003) Loggerhead
turtles nesting in Japan. Loggerhead sea turtles (ed. by A.B.
Bolten and B.E. Witherington), pp. 210–217. Smithsonian
Institute Press, Washington, D.C.
Kobayashi, D., Polovina, J.J., Parker, D.M., Kamezaki, N.,
Cheng, I.J., Uchida, I., Dutton, P.H. & Balazs, G.H. (2008)
Pelagic habitat characterization of loggerhead sea turtles,
Caretta caretta, in the North Pacific Ocean (1997–2006):
insights from satellite tag tracking and remotely sensed data.
Journal of Experimental Marine Biology and Ecology, 356, 96–
114.
Kuhn, C.E., Johnson, D.S., Ream, R.R. & Gelatt, T.S. (2009)
Advances in the tracking of marine species: using GPS
locations to evaluate satellite track data and a continuous-
time movement model. Marine Ecology Progress Series, 393,
97–109.
Kuhn, C.E., Tremblay, Y., Ream, R.R. & Gelatt, T.S. (2010)
Coupling GPS tracking with dive behaviour to examine the
relationship between foraging strategy and fine-scale move-
ments of northern fur seals. Endangered Species Research, 12,
125–139.
Lambardi, P., Lutjeharms, J.R.E., Menacci, R., Hays, G.C. &
Luschi, P. (2008) Influence of ocean currents on long
distance movements of leatherback sea turtles in the south-
west Indian ocean. Marine Ecology Progress Series, 353, 289–
301.
Laver, P.N. & Kelly, M.J. (2008) A critical review of home
range studies. Journal of Wildlife Management, 72, 290–298.
Lewison, R.L., Freeman, S.A. & Crowder, L.B. (2004) Quan-
tifying the effects of fisheries on threatened species: the
impact of pelagic longlines on loggerhead and leatherback
sea turtles. Ecology Letters, 7, 221–231.
Limpus, C. & Limpus, D.J. (2003) The loggerhead turtle,
Caretta caretta, in the Equatorial and Southern Pacific
Ocean: a species in decline. Loggerhead sea turtles (ed. by A.B.
Bolten and B.E. Witherington), pp. 199–209. Smithsonian
Institution Press, Washington, D.C.
Limpus, C.J., Miller, J.D., Parmenter, C.J., Reimer, D., McLa-
han, N. & Webb, R. (1992) Migration of green (Chelonia
mydas) and loggerhead (Caretta caretta) turtles to and from
eastern Australian rookeries. Wildlife Research, 19, 347–358.
Luschi, P., Papi, F., Liew, H.C., Chan, E.H. & Bonadonna, F.
(1996) Long-distance migration and homing after displace-
ment in the green turtle (Chelonia mydas): a satellite
tracking study. Journal of Comparative Physiology A-Sensory
Neural and Behavioral Physiology, 178, 447–452.
Lutcavage, M. & Musick, J.A. (1985) Aspects of the biology of
sea turtles in Virginia. Copeia, 38, 449–456.
Lynnes, A., Reid, K., Croxall, J. & Trathan, P. (2002) Conflict
or co-existence? Foraging distribution and competition for
prey between Adelie and chinstrap penguins. Marine Biology,
141, 1165–1174.
Makowski, C., Seminoff, J.A. & Salmon, M. (2006) Home
range and habitat use of juvenile Atlantic green turtles
(Chelonia mydas, L.) on shallow reef habitats in Palm beach,
Florida, USA. Marine Biology, 148, 1167–1179.
Spatial ecology of Atlantic USA loggerhead turtles
Diversity and Distributions, 17, 624–640, ª 2011 Blackwell Publishing Ltd 637
Mansfield, K.L., Saba, V.S., Keinath, J.A. & Musick, J.A. (2009)
Satellite tracking reveals a dichotomy in migration strategies
among juvenile loggerhead turtles in the Northwest Atlantic.
Marine Biology, 156, 2555–2570.
Marcovaldi, M.A., Lopez, G.G., Soares, L.S., Lima, E.H.S.M.,
Thome, J.C.A. & Almeida, A.P. (2010) Satellite tracking of
female loggerhead turtles highlights fidelity behaviour in
northeastern Brazil. Endangered Species Research, 12, 263–
272.
Margaritoulis, D., Argano, R., Baran, I., Bentivegna, F., Bradai,
M.N., Caminas, J.A., Casale, P., Metrio, G.D., Demetropo-
ulos, A., Gerosa, G., Godley, B.J., Haddoud, D.A., Houghton,
J., Laurent, L. & Lazar, B. (2003) Loggerhead turtles in the
Mediterranean: present knowledge and conservation per-
spectives. Loggerhead sea turtles (ed. by A.B. Bolton and B.E.
Witherington), pp. 175–198, Smithsonian Institution,
Washington, D.C.
Mate, B., Mesecar, R. & Lagerquist, B. (2007) The evolution of
satellite-monitored radio tags for large whales: one labora-
tory’s experience. Deep Sea Research II, 54, 224–247.
McClellan, C.M. & Read, A.J. (2007) Complexity and variation
in loggerhead sea turtle life history. Biology Letters, 3, 592–
594.
McClellan, C.M., Read, A.J., Cluse, W.M. & Godfrey, M.H.
(2011) Conservation in a complex management environ-
ment: the by-catch of sea turtles in North Carolina’s com-
mercial fisheries. Marine Policy, 35, 241–248.
McFadden, L., Nicholls, R.J., Vafeidis, A. & Tol, R.S.J. (2007) A
methodology for modelling coastal space for global assess-
ment. Journal of Coastal Research, 23, 911–920.
McFarlane, G.A., King, J.R. & Beamish, R.J. (2000) Have there
been recent changes in climate? Ask the fish. Progress in
Oceanography, 47, 147–169.
McMahon, C.R. & Hays, G.C. (2006) Thermal niche, large-
scale movements and implications of climate change for a
critically endangered marine vertebrate. Global Change
Biology, 12, 1330–1338.
McPherson, J.M. & Myers, R.A. (2009) How to infer popula-
tion trends in sparse data: examples with opportunistic
sighting records for great white sharks. Diversity and
Distributions, 15, 880–890.
Milton, S.L. & Lutz, P.L. (2003) Physiological and genetic
responses to environmental stress. The biology of sea turtles
Vol. 2 (ed. by P.L. Lutz, J.A. Musick and J. Wyneken), pp.
163–197. CRC Press, Boca Raton, FL.
Minobe, S., Kuwano-Yoshida, A., Komori, N., Xie, S.P. &
Small, R.J. (2008) Influence of the Gulf Stream on the
troposphere. Nature, 452, 206–210.
National Marine Fisheries Service and US Fish and Wildlife
Service (2008) Recovery plan for the northwest Atlantic pop-
ulation of the loggerhead sea turtle (Caretta caretta). National
Marine Fisheries Service, Silver Spring, MD, USA.
Ogren, L. & McVea, C.J. (1995) Apparent hibernation by sea
turtles in North American waters. Biology and conservation of
sea turtles (ed. by K.A. Bjorndal), pp. 127–132. Smithsonian
Institution Press, Washington.
Palumbi, S.R. (2004) Marine reserves and ocean neighbour-
hoods: the spatial scale of marine populations and their man-
agement. Annual Review of Environmental Resources, 29, 31–68.
Parnell, P.E., Dayton, P.K., Lennert-Cody, C.E., Rasmussen,
L.L. & Leichter, J.J. (2006) Marine reserve design: optimal
size, habitats, species affinities, diversity and ocean micro-
climate. Ecological Applications, 16, 945–962.
Pearson, R.G. & Dawson, T.P. (2003) Predicting the impacts of
climate change on the distribution of species: are bioclimate
envelope models useful? Global Ecology and Biogeography, 12,
361–371.
Plotkin, P.T. (2010) Nomadic behaviour of the highly migratory
olive ridley sea turtle (Lepidochelys olivacea) in the Eastern
Tropical Pacific. Endangered Species Research, 13, 33–40.
Plotkin, P.A. & Spotila, J.R. (2002) Post nesting migrations of
loggerhead turtles Caretta caretta from Georgia, USA: con-
servation implications for a genetically distinct subpopula-
tion. Oryx, 36, 396–399.
Polovina, J.J., Balazs, G.H., Howell, E.A., Parker, D.M., Seki,
M.P. & Dutton, P.H. (2004) Forage and migration habitat of
loggerhead (Caretta caretta) and olive ridley (Lepiochelys
olivacea) sea turtles in the central North Pacific ocean.
Oceanography, 13, 36–51.
Polovina, J.J., Uchida, I., Balazs, G.H., Howell, E.A., Parker,
D.M. & Dutton, P.H. (2006) The Kuroshio extension
bifurcation region: a pelagic hotspot for juvenile loggerhead
sea turtles. Deep Sea Research II, 53, 326–339.
Rankin-Baransky, K.C., Williams, J., Bass, A.L., Bowen, B.W. &
Spotila, J.R. (2001) Origin of loggerhead turtles stranded in
the northeast Atlantic as determined by mtDNA analysis.
Journal of Herpetology, 35, 638–646.
Ream, R.R., Sterling, J.T. & Loughlin, T.R. (2005) Oceano-
graphic features related to northern fur seal migratory
movements. Deep Sea Research II, 52, 823–843.
Rees, A.F., Al Saady, S., Broderick, A.C., Coyne, M.S., Papa-
thanasopoulou, N. & Godley, B.J. (2010) Behavioural poly-
morphism in one of the world’s largest populations of
loggerhead sea turtles, Caretta caretta. Marine Ecology
Progress Series, 418, 201–212.
Reich, K.J., Bjorndal, K.A., Frick, M.G., Witherington, B.E.,
Johnson, C. & Bolten, A.B. (2010) Polymodal foraging in
adult female loggerheads (Caretta Caretta). Marine Biology,
157, 113–121.
Renaud, M.L. & Carpenter, J.A. (1994) Movements and sub-
mergence patterns of loggerhead turtles (Caretta caretta) in
the Gulf of Mexico determined through satellite telemetry.
Bulletin of Marine Science, 55, 1–15.
Richardson, A.J. & Schoeman, D.S. (2004) Climate impact on
plankton ecosystems in the Northeast Atlantic. Science, 305,
1609–1612.
Robinson, R.A., Crick, H.Q.P., Learmonth, J.A. et al. (2009)
Travelling through a warming world: climate change and
migratory species. Endangered Species Research, 7, 87–99.
Ropert-Coudert, Y. & Wilson, R.P. (2005) Trends and per-
spectives in animal attached remote sensing. Frontiers in
Ecology and Environment, 3, 437–444.
L. A. Hawkes et al.
638 Diversity and Distributions, 17, 624–640, ª 2011 Blackwell Publishing Ltd
Royer, F. & Lutcavage, M. (2008) Filtering and interpreting
location errors in satellite telemetry of marine animals.
Journal of Experimental Marine Biology and Ecology, 359,
1–10.
Sakamoto, W., Uchida, I., Naito, Y., Kureha, K., Tujimura, M.
& Sato, K. (1990) Deep diving behaviour of the loggerhead
sea turtle near the frontal zone. Nippon Suisan Gakkashi, 56,
1435–1443.
Schofield, G., Bishop, C.M., Maclean, G., Brown, P., Baker, M.,
Katselidis, K.A., Dimopoulos, P., Pantis, J.D. & Hays, G.C.
(2007) Novel GPS tracking of sea turtles as a tool for con-
servation management. Journal of Experimental Marine
Biology and Ecology, 347, 58–68.
Schofield, G., Hobson, V.J., Fossette, S., Lilley, M.K.S., Kats-
elidis, K.A. & Hays, G.C. (2010a) Fidelity to foraging sites,
consistency of migration routes and habitat modulation of
home range by sea turtles. Diversity and Distributions, 16,
840–853.
Schofield, G., Hobson, V.J., Lilley, M.S., Katselidis, K.A.,
Bishop, C.M., Brown, P. & Hays, G.C. (2010b) Inter-annual
variability in the home range of breeding turtles: implica-
tions for current and future conservation management.
Biological Conservation, 143, 722–730.
Schwartz, F.J. (1978) Behavioural and tolerance responses to
cold water temperatures by three species of sea turtles
(Reptilia, Cheloniidae) in North Carolina. Florida Marine
Research Publication, 33, 16–18.
Seminoff, J.A., Resendiz, A. & Nichols, W.J. (2002) Home
range size of green turtles Chelonia mydas at a coastal for-
aging area in the Gulf of California, Mexico. Marine Ecology
Progress Series, 242, 253–265.
Seminoff, J.A., Zarate, P., Coyne, M., Foley, D.G., Parker, D.,
Lyon, B.N. & Dutton, P.H. (2008) Post-nesting migrations of
Galapagos green turtles Chelonia mydas in relation to
oceanographic conditions: integrating satellite telemetry with
remotely sensed ocean data. Endangered Species Research, 4,
57–72.
Seney, E.E. & Landry, A.M. (2008) Movements of Kemp’s
ridley sea turtles nesting on the upper Texas coast: impli-
cations for management. Endangered Species Research, 4, 73–
84.
Shahidul Islam, M. & Tanaka, M. (2004) Impacts of pollution
on coastal and marine ecosystems including coastal and
marine fisheries and approach for management: a review and
synthesis. Marine Pollution Bulletin, 48, 624–649.
Shaver, D.J. & Rubio, C. (2008) Post-nesting movements of
wild and head-started Kemp’s ridley sea turtles (Lepidochelys
kempii) in the Gulf of Mexico. Endangered Species Research,
4, 43–55.
Shaver, D.J., Schroeder, B.A., Byles, R.A., Burchfield, P.M.,
Pena, J., Marquez, R. & Martinez, H. (2005) Movements and
home ranges of adult male kemp’s ridley sea turtles (Lepid-
ochelys kempii) in the Gulf of Mexico investigated by satellite
telemetry. Chelonian Conservation and Biology, 4, 817–827.
Shoop, C.R. & Kenney, R.D. (1992) Seasonal distribution and
abundances of loggerhead and leatherback sea turtles in
northeastern United States waters. Herpetological Mono-
graphs, 6, 43–67.
Sims, D.W., Witt, M.J., Richardson, A.J., Southall, E.J. &
Metcalfe, J.D. (2006) Encounter success of free-ranging
marine predator movements across a dynamic prey land-
scape. Proceedings of the Royal Society B: Biological Sciences,
273, 1195–1201.
Sims, D.W., Quieroz, N., Doyle, T.K., Houghton, J.D.R. &
Hays, G.C. (2009) Satellite tracking of the World’s largest
bony fish, the ocean sunfish (Mola mola L.) in the North East
Atlantic. Journal of Experimental Marine Biology and Ecology,
370, 127–133.
Spotila, J.R., O’Connor, M.P. & Paladino, F.V. (1997) Thermal
biology. The biology of sea turtles (ed. by P.L. Lutz and J.A.
Musick), pp. 297–314. CRC Press, Boca Raton, Florida.
Swihart, R.K. & Slade, N.A. (1985) Influence of sampling
interval on estimates of home-range size. Journal of Wildlife
Management, 49, 1176–1184.
Tremblay, Y., Shaffer, S.A., Fowler, S.L., Kuhn, P.E., McDon-
ald, B.I., Weise, M.J., Bost, C.A., Weimerskirch, H., Crocker,
D.E., Goebel, M.E. & Costa, D.P. (2006) Interpolation of
animal tracking data in a fluid environment. Journal of
Experimental Biology, 209, 128–140.
Troeng, S., Dutton, P.H. & Evans, D. (2005) Migration of
green turtles Chelonia mydas from Tortuguero Costa Rica.
Marine Biology, 148, 394–402.
Tucker, A.D. (2010) Nest site fidelity and clutch frequency of
loggerhead turtles are better elucidated by satellite telemetry
than by nocturnal tagging effort: implications for stock
management. Journal of Experimental Marine Biology and
Ecology, 383, 48–55.
Ultsch, G.R. (2006) The ecology of overwintering among tur-
tles: where turtles overwinter and its consequences. Biological
Reviews, 81, 339–367.
Van Dam, R.P. & Diez, C.E. (1998) Home range of immature
hawksbill turtles (Eretmochelys imbricata (Linnaeus)) at two
Caribbean islands. Journal of Experimental Marine Biology
and Ecology, 220, 15–24.
Weimerskirch, H., Guionnet, T., Martin, J., Shaffer, S.A. &
Costa, D.P. (2000) Fast and fuel efficient? Optimal use of
wind by flying albatrosses. Procedings of the Royal Society B:
Biological Sciences, 267, 1869–1874.
White, N.A. & Sjoberg, M. (2002) Accuracy of satellite posi-
tions from free-ranging grey seals using ARGOS. Polar
Biology, 25, 629–631.
Whiting, S.D., Long, J.L. & Coyne, M. (2007) Migration routes
and foraging behaviour of olive ridley turtles Lepidochelys
olivacea in northern Australia. Endangered Species Research,
3, 1–9.
Wilson, R.P., Shepard, E.L.C. & Liebsch, N. (2008) Prying into
the intimate details of animal lives: use of a daily diary on
animals. Endangered Species Research, 4, 123–137.
Witherington, B.E., Kubilis, P., Brost, B. & Meylan, A. (2009)
Decreasing annual nest counts in a globally important
loggerhead sea turtle population. Ecological Applications, 19,
30–54.
Spatial ecology of Atlantic USA loggerhead turtles
Diversity and Distributions, 17, 624–640, ª 2011 Blackwell Publishing Ltd 639
Witt, M.J. & Godley, B.J. (2007) A step towards seascape scale
conservation: using VMS to map fishing activity. PLoS One,
2, e1111, 1–59.
Witt, M.J., Broderick, A.C., Johns, D.J., Martin, C.S., Penrose,
R., Hoogmoed, M.S. & Godley, B.J. (2007a) Prey landscapes
help identify potential foraging habitats for leatherback
turtles in the northeast Atlantic. Marine Ecology Progress
Series, 337, 231–244.
Witt, M.J., Broderick, A.C., Coyne, M.S., Formia, A., Ngo-
uessono, S., Parnell, R.J., Sounguet, G.P. & Godley, B.J.
(2008) Satellite tracking highlights difficulties in the design
of effective protected areas for critically endangered leath-
erback turtles Dermochelys coriacea during the inter-nesting
period. Oryx, 42, 296–300.
Witt, M.J., Hawkes, L.A., Godfrey, M.H., Godley, B.J. &
Broderick, A.C. (2010a) Predicting the impacts of climate
change on a globally distributed species: the case of the
loggerhead turtle. Journal of Experimental Biology, 213, 901–
911.
Witt, M.J., Akesson, S., Broderick, A.C., Coyne, M.S., Ellick, J.,
Formia, A., Hays, G.C., Luschi, P., Stroud, S. & Godley, B.J.
(2010b) Assessing accuracy and utility of satellite-tracking
data using Argos-linked Fastloc-GPS. Animal Behaviour, 80,
571–581.
Witt, M.J., McGowan, A., Blumenthal, J.M., Broderick, A.C.,
Gore, S., Wheatley, D., White, J. & Godley, B.J. (2010c)
Inferring vertical and horizontal movements of juvenile
marine turtles from time-depth recorders. Aquatic Biology, 8,
169–177.
Witt, M.J., Bonguno, E.A., Broderick, A.C., Coyne, M.S.,
Formia, A., Gibudi, A., Mounguengui, G.A., Moussounda,
C., Nsafou, M., Nougessono, S., Parnell, R.J., Sounguet, G.P.,
Verhage, S. & Godley, B.J. (2011) Tracking leatherback
turtles from the world’s largest rookery: assessing threats
across the South Atlantic. Proceedings of the Royal Society B:
Biological Sciences, doi: 10.1098/rspb.2010.2467.
Witzell, W.N. (2002) Immature Atlantic loggerhead turtles
(Caretta caretta): suggested changes to the life history model.
Herpetological Review, 33, 266–269.
Zbinden, J.A., Aebischer, A., Margaritoulis, D. & Arlettaz, R.
(2008) Important areas at sea for adult loggerhead sea turtles
in the Mediterranean Sea: satellite tracking corroborates
findings from potentially biased sources. Marine Biology,
153, 899–906.
Zbinden, J.A., Bearhop, S., Bradshaw, P., Gill, B., Margari-
toulis, D., Newton, J. & Godley, B.J. (2011) Migratory
dichotomy and associated phenotypic variation in marine
turtles revealed by satellite tracking and stable isotope
analysis. Marine Ecology Progress Series, 421, 291–302.
Zug, G.R., Balazs, G.H. & Wetherall, J.A. (1995) Growth in
juvenile loggerhead sea turtles (Caretta caretta) in the North
Pacific pelagic habitat. Copeia, 1995, 484–487.
SUPPORTING INFORMATION
Additional Supporting Information may be found in the online
version of this article:
Figure S1 Summary of data used in analyses.
Table S1 Deployment details for the 68 turtles released in this
study (note turtles 1 to 12 were previously published in
Hawkes et al., 2007) from NC (North Carolina), SC (South
Carolina) and GA (Georgia).
As a service to our authors and readers, this journal provides
supporting information supplied by the authors. Such mate-
rials are peer-reviewed and may be re-organized for online
delivery, but are not copy-edited or typeset. Technical support
issues arising from supporting information (other than missing
files) should be addressed to the authors.
BIOSKETCH
Lucy Hawkes is a physiological ecologist, whose work focuses
on the costs and drivers of migration in vertebrates using
techniques such as satellite telemetry, heart rate recording and
metabolic rate measurements. Her work has also investigated
the impact of external forcing factors, such as climate change,
on migration and breeding ecology. This work constituted part
of her doctoral thesis with ACB and BJG at the University of
Exeter, working in the Marine Turtle Research Group along-
side MJW. Further information about LH and publications can
be found at: http://publicationslist.org/l.a.hawkes.
Editor: David Richardson
L. A. Hawkes et al.
640 Diversity and Distributions, 17, 624–640, ª 2011 Blackwell Publishing Ltd