HAVING, GIVING & TAKING - UvA Scripties
25
HAVING, GIVING & TAKING BIG DATA ON THE RELATIONSHIP BETWEEN SOCIAL CLASS AND PROSOCIAL BEHAVIOR In the current research it is examined how social class is related to prosocial behavior. Whereas previous research has found inconsistent results using experimental lab settings and survey approaches, we analysed actual lending and borrowing behavior in a natural setting. Study 1 (N=16.251) found that there is no meaningful relation between social class and lending. Study 2 (N=98), combined behavioral data with survey data and found, contrastingly, that higher social class is associated with more lending. Higher social class was also associated with more borrowing. We conclude that the theoretical field on prosocial behavior highly benefits from a more natural research approach. Statistical challenges regarding analysing big data are discussed. Student name: Mayra Kapteyn Student number: 10002758 Supervisor: Gerben van Kleef Secondary assessor: Eftychia Stamkou Date: January 8th, 2016
-
Upload
khangminh22 -
Category
Documents
-
view
5 -
download
0
Transcript of HAVING, GIVING & TAKING - UvA Scripties

HAVING, G IV ING & TAK ING
BIG DATA ON THE RELATIONSHIP BETWEEN SOCIAL CLASS AND PROSOCIAL BEHAVIOR
In the current research it is examined how social class is related to prosocial behavior.
Whereas previous research has found inconsistent results using experimental lab settings and
survey approaches, we analysed actual lending and borrowing behavior in a natural setting.
Study 1 (N=16.251) found that there is no meaningful relation between social class and
lending. Study 2 (N=98), combined behavioral data with survey data and found,
contrastingly, that higher social class is associated with more lending. Higher social class was
also associated with more borrowing. We conclude that the theoretical field on prosocial
behavior highly benefits from a more natural research approach. Statistical challenges
regarding analysing big data are discussed.
Student name: Mayra Kapteyn
Student number: 10002758
Supervisor: Gerben van Kleef
Secondary assessor: Eftychia Stamkou
Date: January 8th, 2016

2
Participative societies thrive on prosocial behavior. People help each other out by
sharing, volunteering and many other kinds of behavior that are intended to benefit
another. They do this either because it brings them some kind of reward in exchange and/or
because they feel an empathetic and compassionate response to someone else’s need
(Batson & Shaw, 1991). Helping somebody brings prosperity for the other, but how does
one’s own prosperity relate to the willingness to help the other? Do people who have more,
give more, or is it the other way around?
In this research project we assessed how social class is related to prosocial behavior.
Social class can be measured by material resources, such as education (Snibbe & Markus,
2005), income (Kraus & Keltner, 2009) and occupational status (Oakes & Rossi, 2003), as well
as social class rank, which is a subjective perception of rank in comparison to others (Kraus,
Piff & Keltner, 2009). Different social classes experience different levels of opportunity,
which shapes the way they think (Johnson & Kreuger, 2006). We will explain how these
cognitions differ and how that might impact prosocial behavior.
Two viewpoints suggest contrasting hypotheses regarding social class and prosocial
behavior. First, the negative relation hypothesis stems from the social cognitive theory of
class (Kraus, Piff, Mendoza-‐Denton, Rheinschmidt & Keltner, 2012), which suggests that
lower class’ act more prosocial than upper class individuals because they are more attuned
to their environment (Piff, Kraus, Côté, Cheng & Keltner, 2010). Contrastingly, a positive
relation hypothesis stems from the concept of Noblesse Oblige. This viewpoint predicts that
prosocial behavior is higher among upper class individuals because their relative cost of
helping is lower in comparison to lower class individuals (Dovidio, Piliavin, Schroeder &
Penner, 2006; Batson & Shaw, 1991).
Negative relation hypothesis: Social class and Contextualism
Recent research has suggested that there are cognitive differences between lower
and upper class individuals that influence people’s prosocial behavior (Piff et al., 2010).
Lower class individuals are suggested to have a more contextual social cognition, which
means they draw on external forces to explain personal, social and political events (Kraus et
al., 2012). This contextual thinking implies paying a lot of attention to other people’s
thoughts and actions; therefore, Piff et al., (2010) hypothesized that people with contextual

3
social cognition generate behavior that is highly influenced by other people. Upper class
individuals, on the other hand, tend to have what is called a solipsistic relation to the outside
world (Kraus et al., 2012). This refers to an individualistic orientation to the environment,
motivated by internal states, goals and emotions. It implies a higher sense of personal
control over one’s life outcomes.
Indeed, in comparison to their upper class counterparts, lower class individuals are
more dependent on their external world for their personal outcomes (Argygle, 1994), and
experience less control over their lives (Johnson & Krueger, 2006; Lachman & Weaver,
1998). This lack of personal control drives lower class individuals to explain success to
situational factors, while upper class individuals attribute success to internal traits (Kraus et
al., 2009).
This reduced sense of personal control and dependency on other people (Kraus et al.,
2009) may entice lower class people to engage more with one another. In personal
interactions, lower class individuals show a more socially engaged non-‐verbal style than
upper class individuals, who show relatively more impolite behaviors such as self-‐grooming
(Kraus & Keltner, 2009). It is theorised that due to lower class’ reduced sense of personal
control, they think in a contextual way, leading them to be socially engaged.
Consequentially, their contextual cognition may result in them being more helpful towards
other people (Piff et al., 2010; Kraus et al., 2012).
The question remains if lower class’ contextual focus leads them to be more prosocial
than upper class individuals. Research on prosocial behavior has shown that lower class
individuals are better at judging other people’s emotions, signifying more empathic accuracy
(Kraus, Côté & Keltner, 2010). They also report higher levels of compassion in response to
seeing someone else suffering, which is also reflected in their decreased heart rate, a
symptom associated with feeling compassion (Stellar, Manzo, Kraus & Keltner, 2012). This
enhanced empathetic accuracy and feelings of compassion may lead lower class individuals
to act more prosocially than upper class individuals.
To examine this hypothesis, Piff et al. (2010) conducted four studies and found
evidence that social class is negatively related to displays of prosocial behavior. However,
their methodology is flawed in the sense that they don’t measure real-‐world prosocial

4
behavior. The measures of prosocial behavior are either attitude measures (Study 2) or
experimental measures in a lab setting (Study 1, 3 and 4). We will address each study and
explain how these measures lack external validity.
In Study 1, Piff et al. (2010) found that subjective social rank is related to decreased
generosity in the Dictator Game. The Dictator Game is an adequate, highly controllable
measure of prosocial behavior. It is however a very simplified reconstruction of reality,
because the situation depicted the Dictator Game –having to distribute points between
oneself and a stranger-‐ is one that does not (often) present itself often in real life. Therefore,
additional methods using measures closely related to real life is needed.
Second, they found that manipulated social rank and income negatively predict
attitudes on the amount of money people should donate to charity. This attitudinal measure
is flawed because it does not control for social desirability bias (Randall & Fernandes, 1991).
This is a serious problem to validity because different social classes may be more or less
triggered to respond socially desirable. Especially lower class individual’s contextual
cognition (Kraus et al., 2012) may make them more susceptible to social desired responding
because they may be more attuned to leaving a good impression with others. The second
problem with the attitudinal measure is that attitudes generally don’t predict behavior very
well: only when the timing, context, action and target of the attitude measure and the
behavior are similar (Ajzen & Fishbein, 1977). In Study 2, prosocial behavior is measured by
the question “what portion of one’s salary should be allocated to charitable donations”.
Because there are no real costs involved, answering this question in a prosocial manner is
much easier said than done, so the action in the attitude measure does not resemble the
actual action. Therefore, the measured attitudes on donations arguably do not predict class-‐
driven behavior well.
Third, Piff et al. (2010) reported a negative relationship between social class and
prosocial behavior, mediated by egalitarian values. However, they assessed prosocial
behavior using the Trust Game, which is not a valid measure of prosocial behavior. The
participant namely allocates points to another participant, while the other participant has
the chance to return the favour with increased value of the points. This task does not
measure prosocial behavior; rather, it measures whether participants choose a risky,
5
cooperative but potentially rewarding strategy, or a safe individualist strategy, with less
potential rewards. Prosocial behavior is defined as behavior intended to benefit the other
(Brief & Motowidlo, 1986), but in this case, the ultimate intention of the participant may just
be to receive the maximum points for themselves. Upper class’ solipsistic cognitions may
lead them to choose a more individualistic strategy, but that does not mean they’re less
prosocial. Therefore, this is not an accurate measure of prosocial behavior.
Fourth and finally, it was reported that compassion moderates the negative
relationship between social class and helping behavior. This experiment was the only explicit
behavioral measure used in this research. The measure of prosocial behavior was the time
the participant took to help a female confederate who arrived late to do her task. This
measure is biased by social norm rigidity, because the help recipient’s distress (and thus,
need for help) is a direct consequence of her own lack of punctuality. Lack of punctuality is
something people can disapprove strongly of, especially towards women (Kanekar & Vaz,
1993). Bowles and Gelfand (2010) found that when a low-‐status individual (operationalised
as “lacking a high-‐status track record”, as is the case with the confederate) violates a norm,
upper class individuals punish more heavily than lower class individuals. In a subsequent
study, they found that men are more eager to punish female norm violators than male norm
violators. These findings seriously question the conclusion drawn by Piff et al. (2010),
because the supposedly direct effect of social class on prosocial behavior may be
confounded by norm rigidity towards the female, norm-‐violating confederate.
Thus, although Piff et al. (2010) may have a solid theoretical background to
hypothesize that social class inhibits prosocial behavior, their measures of prosocial behavior
lack external validity. The Dictator Game in Study 1 is accurate but simplified, the measure in
Study 2 is merely an attitude measure, study 3 measures strategy instead of helping and the
measure in study 4 is confounded by norm rigidity. These flawed measures of prosocial
behavior imply that these experimental results may not be valid in the real world. Therefore,
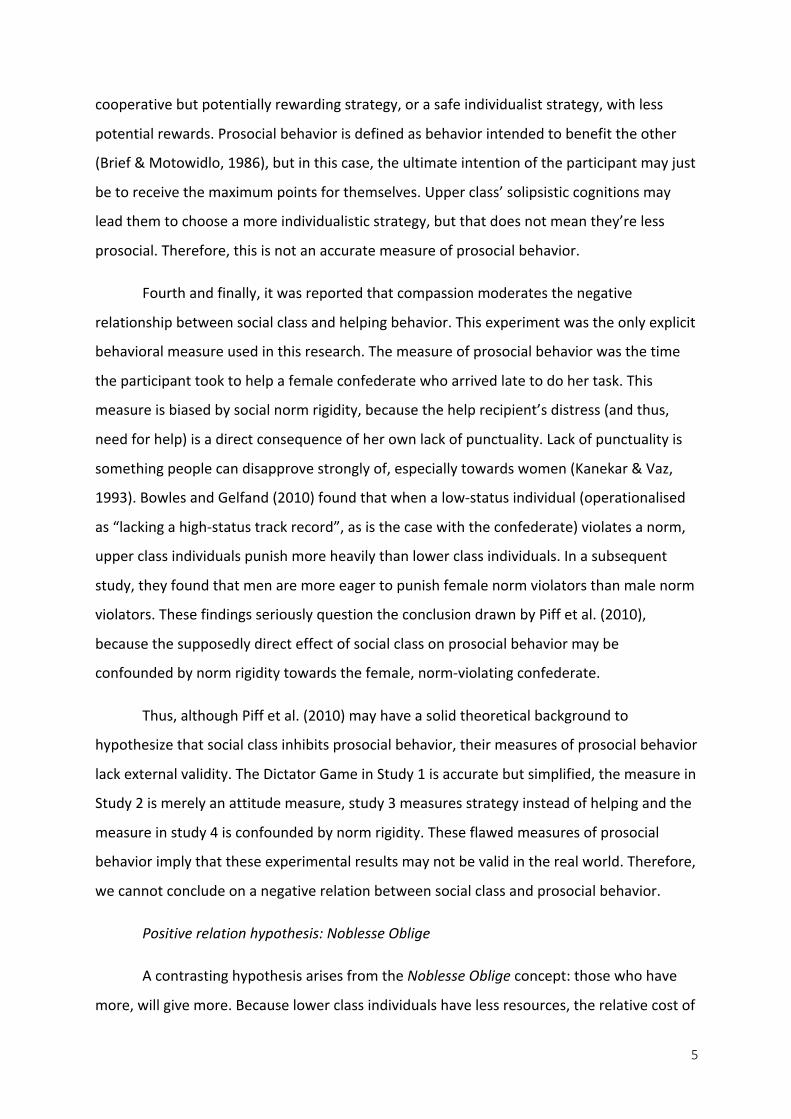
we cannot conclude on a negative relation between social class and prosocial behavior.
Positive relation hypothesis: Noblesse Oblige
A contrasting hypothesis arises from the Noblesse Oblige concept: those who have
more, will give more. Because lower class individuals have less resources, the relative cost of

6
being prosocial is higher. The higher the cost compared to rewards, the lower the probability
that somebody will help (Dovidio et al., 2006; Batson & Shaw, 1991). So simply because
lower class individuals have relatively less to give, they may act less prosocial than upper
class individuals.
Korndörfer, Egloff and Schmukle (2015) tested whether there is a positive or a
negative relation between social class and prosocial behavior. They conducted eight survey
studies and reported mixed results. For example, Study 1, which was conducted in Germany,
reported no significant relationship between social class and relative amount of money
spent on charity among donating households. Contrastingly, Study 2, which was conducted
in the U.S., reported a negative relationship between social class and relative amount of
money spent on charity among donating households. Then Study 3 –also using U.S. data on
donating-‐ reported a positive relationship. Studies 4 (conducted in Germany) and 5
(conducted in the US) also reported positive relationships between social class and reported
volunteering. The results from Study 6 reported a meaningless (b=.06) but significant
positive association between social class and volunteering, among 37.000+ participants
internationally. Study 7 found a significant positive association between objective social class
and everyday helping, but no significant association between subjective social class and
everyday helping. Study 8 found a significant positive relationship between social class and
allocated points in the Trust Game. These results are not consistent, but seem to point in the
direction that there is a positive relationship between social class and prosocial behavior,
contrary to the findings from Piff et al. (2010).
However, the methodology used in this study also lacks external validity. Seven out of
eight studies conducted were survey measures. Survey measures on past behavior (such as
volunteering and donating behavior) are biased by socially desirable responding and recall
bias (Coughlin, 1990; Randal & Fernandes, 1991). Especially prosocial behavior is sensitive to
social desirability bias because prosocial behavior is very socially desired in definition.
Therefore, survey measures are not adequate measures of prosocial behavior.
The only behavioral measure used in this research is the Trust Game in Study 8,
which (as described above) measures behavior intended to benefit the self, not the other. So
in eight studies, none of the measures of prosocial behavior contain actual behavior.

7
Therefore, these results don’t provide sufficient evidence that there is a positive relation
between social class and prosocial behavior, or to state that the negative relation hypothesis
from Piff et al. (2010) is invalidated. There is behavioral research needed in a natural setting
in order to assess a valid relation between social class and prosocial behavior.
Current Research
The current literature on social class and prosocial behavior has used only
experimental or survey data, but no behavioral data in a natural setting, and therefore it
may not be valid in the real world. Therefore, we tested whether social class is positively or
negatively related to prosocial behavior with actual behavioral measures in a natural setting.
We tested if participant’s social class is associated with lending household items through an
online sharing platform called Peerby. Hypothesis 1a is that social class is negatively
associated with lending and hypothesis 1b is that social class is positively associated with
lending.
Balancing Giving and Taking
Aside from the lack of behavioral measures, another missing element in the current
literature regarding social class and prosocial behavior is the balance between giving and
receiving help. Thus far, we have a unilateral understanding of prosocial behavior, because
we only have information on how much people give, and none on how much people take.
The social cognitive theory on social class (Kraus et al., 2012) predicts that upper class
individuals experience more personal control and are therefore less attuned to their
environment. This may have different implications for requesting help. Hypothesis 2a is that
upper class’ elevated sense of personal control (Johnson & Krueger, 2006; Kraus et al., 2009)
reduces their tendency to ask for help because of elevated levels of individualism (see Kraus
et al., 2012). Contrastingly, and alternative explanation is that upper class’ elevated sense of
personal control triggers assertiveness – not being afraid to ask. Following this reasoning,
hypothesis 2b is that higher social class is associated with asking for help more often.
By combining the measures between giving and receiving help, we can get a sense
whether there is truly a relation between social class and prosociality, or that there is only a
relation between social class and activity on Peerby. Namely, if upper or lower social class

8
individuals would both borrow and lend more than the other, it wouldn’t necessarily mean
that they are more prosocial – it could also just mean that they are more participative on
Peerby. Therefore, we tested the relation between social class and a prosociality ratio of
lending minus borrowing. Hypothesis 3a is that the relationship between social class and
prosocial behavior upholds when subtracting borrowing behavior from lending behavior.
This would signal strong differences in prosociality among social classes. Contrastingly,
hypothesis 3b is that there is no relation between social class and prosociality when
subtracting borrowing behavior from lending behavior. This would signal that a difference
between social classes may be due to different levels of activity on the Peerby platform, and
not due to a difference in prosociality.
In the second study, in order to validate that self-‐report measures are indeed
inadequate measures of prosocial behavior, we also assessed how the self-‐report measures
on borrowing and lending relate to the behavioral measures on borrowing and lending.
Therefore, hypothesis 4 is that there is a low correlation between self-‐report lending and
actual lending, and hypothesis 5 is that that there is a low correlation between self-‐report
borrowing and actual borrowing.
Study 1 uses a large dataset (N=16.251) in order to assess robust general findings on
the relations between social class, borrowing, lending and prosociality ratio. We measured
social class by combining average street income and average house value of the participant’s
street. In Study 2, we enriched the street level social class measures and behavioral data
from Peerby with survey data on income, age, gender and self-‐reported borrowing -‐and
lending.
Study 1
In study 1, big data is used to assess if social class is positively or negatively related to
lending (hypothesis 1) and borrowing (hypothesis 2) on the Peerby platform. Third, we
tested if the relation between social class and lending would uphold when subtracting
borrowing from the lending score.
The behavioral data is gathered from Peerby, an online sharing platform where
neighbors lend each other household items for free. Peerby saves button clicks on the

9
website and app onto their database. The measure of lending is somewhat determined by
what objects people have in their homes, so it is important that these are not luxury items
that only upper class individuals possess. The most requested items on Peerby are: (1) drill,
(2) ladder, (3) standing tables, (4) bike, (5) trailer and (6) car. There’s no way of knowing
what items participants exactly have in their home, but the top items clearly aren’t exclusive
to higher social classes. Therefore, it should not confound the measure of prosocial
behavior.
Method
Participants
A dataset containing 92.679 participants was provided by Peerby. 49.182 participants
were excluded because of missing values for all of the social class measures, namely a) they
did not provide their full 6-‐digit zip code area or b) there was no data on income or house
value available for their specific zip code area. To account for the high number of people
who just signed up for Peerby to ‘take a look around’, we selected members who at least
lent out once. After excluding inactive members, 16.167 active members were left in the
dataset. These participants were members for 510.36 days on average (SD = 273.67).
Procedure
FIGURE 1. A PEERBY REQUEST

10
The Peerby platform works demand based: when someone needs something, they
send out a request to their neighbors with a personal message, see Figure 1. The receiver of
the message can then click ‘Help neighbor X’; ‘Not now’ or ‘I don’t have it’. If someone clicks
“Help neighbor X”, the two neighbors enter a chat page where they can make arrangements
to pick up the item. As there are often more than one neighbor offering the item, the
requesting neighbor chooses one of the offering neighbors, then picks the item up at their
home address and returns it after use.
Measures
Lending. Lending was measured by the total number of ‘Help’ clicks per member, see
Figure 1. This is the total number of help clicks on both the app and the web platform (M =
4.20, SD = 7.37). The recipient sees the date, a photograph of the requester, the distance to
the recipient, their name, the item that they need and a personal message they provide.
They can choose to click ‘Help’; ‘Not now’ or ‘I don’t have it’. There is also a flag button, in
case the request is inappropriate or unwanted.
Borrowing. Requested help was measured by the total amount of requests the participant
has placed on the website, see Figure 2. In order to request an item on the Peerby platform,
the participant describes the item that they need and a short story to describe what they
need it for (see Figure 2). Then Peerby sends the request to max. 250 of the participant’s
neighbors. It is communicated that people receive an offer from their neighbors in thirty
minutes on average. The average total number of borrowing is 1.42 times (SD = 2.27).

11
FIGURE 2. A PEERBY REQUEST FORM
Prosociality index. A prosociality index was computed by standardizing borrowing
and lending, and then subtracting borrowing from lending. Thus the higher the score, the
more prosocial the behavior on Peerby.
Social Class. Social class was measured by standardizing the average income and the
average house value in the participant’s street. These two variables are highly correlated,
r(7550)=.68, p<.001, thus predict social class reliably. If one of the two values was missing,
only the other variable was used as proxy for social class. There was more data available on
income (N=16167) than on house value (N=7550).
This data is obtained from the Dutch national databank (CBS, 2012), who published it
as customized data by the request of Sinfore and the Jan van Es Institute. House value is only
published when there are at least 20 venues in the 6-‐digit zip area, rounded off and reported
in units of thousand. The average income is only published when there are at least 10
income receivers in the 6-‐digit zip area and rounded off to values of one hundred. When the

12
average monthly income was below the minimal (€500) or above the maximum (€10.000)
value, the minimal (€500) or maximum (€10.000) value was reported.
Results
The first step was to assess how social class relates to prosocial behavior. Hypothesis
1a was that higher social class is associated with less lending (see Piff et al., 2010), while
hypothesis 1b predicted a positive relation between social class and lending (see Korndörfer
et al., 2015).
Due to the non-‐parametric distribution of the data, we ranked the values and
computed Spearman’s Rho correlation. Table 1 shows that, supporting the positive relation
hypothesis, a very weak but significant positive relationship was found between social class
and prosocial behavior. Hypothesis 2a was that social class would be negatively associated
with social class, while hypothesis 2b predicted a positive association. We found that higher
social class was associated with less borrowing, therefore confirming hypothesis 2a. We thus
confirmed hypothesis 3a, which suggested that the found relationship between social class
and prosocial behavior is indeed caused by higher prosocial behavior among upper class
individuals, and not by increased Peerby activity overall.
Table 1
Spearman’s rho Correlations between measures, (N)
Measure Lending Borrowing Prosociality ratio
Social Class .03* (16251) -‐.04* (16251) .05* (16251)
Note. *p<.001
Although these results suggest significant relations, the coefficients are extremely
weak. The explained variance of social class on lending is only ρ2=.001, and the explained
variance of social class on prosociality is ρ2=.003. Therefore, we cannot conclude there is a
meaningful relationship between social class and prosocial behavior.
Discussion

13
In Study 1, we did not find a meaningful relationship between social class and
prosocial behavior. This indicates that either the assumed relationship between social class
and prosocial behavior is non-‐existent in a natural setting, or that the relationship is more
complex than could be measured in this research design.
In the current study, it was impossible to account for demographic data such as
gender and age. Moreover, we could not assess participant’s social class directly, but used
proxy data from the street the participant lived in. Additional research is needed to verify
the quality of the social class measure and to control for age and gender. That way we can
draw conclusions on the relation between social class and prosocial behavior.
Study 2
Our second study investigated the relationship between social class and borrowing
and lending among a smaller sample of Peerby members, with direct measures of income,
education level, age and gender. However, unfortunately, we weren’t able to control for age
and gender because the data did not meet parametric assumptions.
Taking the results of Study 1 in account, we predicted that, following hypothesis 1b,
higher social class would be associated with more lending and borrowing. The findings in
Study one also set direction for the second hypothesis, namely that higher social class would
be associated with less borrowing. Third, we expected that following hypothesis 3a, the
relation between social class and lending would uphold when accounting for borrowing
behavior. Fourth, we hypothesized that self-‐report measures on lending would weakly
correlate with actual lending. Similar to that account, our fifth hypothesis was that self-‐
report measures on borrowing would be weakly correlated with actual borrowing.
Method
Participants. Participants are members of Peerby who responded to a survey
regarding participation on sharing platforms, conducted by Stipo (N= 180). Stipo is a
consultancy firm that published a report on participative Internet Platforms (Stipo, 2015).
Participants were contacted through e-‐mail and asked to complete a 58 item survey on their
Peerby behavior. A €50 voucher was allotted among the participants. 71 participants were
excluded because of missing data. We also excluded 11 participants because their lending

14
count was above 40, so they were clear outliers who impacted results disproportionately.
Two of these participants were employees of Peerby or Stipo. This left 99 participants in the
final analysis (57 female, 42 male) who were members for 539.85 days on average (SD =
262.62). Participants ranged in age from 25 to 65 years old (M = 44.09, SD = 11.35). 97% of
the respondents reported a Dutch nationality.
Measures
Self-‐report income measure. The self report measure inquired “what is your income
level on a yearly basis” using six categories: (1) <€20.000, (2) €20.000-‐€30.000, (3) €30.000-‐
€50.000, (4) €50.000-‐€70.000, (5) €70.000-‐€100.000, or (6) >€100.000.
This manner of questioning is suboptimal because it remained unclear whether it
referred to personal or household income, and before or after tax deductions. However,
because it is not likely that there is an effect of social class on the way people respond to this
question; we assume that the inaccuracy is distributed equally among social classes. In order
to calculate correlations using income as a scale, participant’s income levels were recoded
into numerical scale variables (1) €18.000*, (2) €25.000, (3) €40.000 (4) €60.000, (5) €85.000,
and (6) €120.000. Participants reported a median income level of €40.000.
Street income. The street income measure was (similar to Study 1) obtained from the
CBS data regarding mean income per month in the participant’s street of residence (CBS,
2012). The mean monthly street income was €2840, with a standard deviation of €989.
In order to assess the validity of the income proxy measure, we calculated Pearson
correlation between the and the self-‐report income measure. The correlation was moderate,
r(74)=.37, p<.01. So even though one measure is direct and the other indirect, they are
moderately associated with each other.
Street house value. The average street house value was obtained from CBS data
regarding average house values per street, following the same procedure to study 1. The
average house value was €212.450 (SD = €87.468).
* €18.000 is chosen because it is the minimum wage for people above 23 years old in The Netherlands

15
Social class. A composite measure of social class was computed by standardizing the
self-‐report income measure, the street income measure and the street house value
measure, then averaging the scores on these three measures. If one of the measures was
missing, the average of the other measures was taken. A Crohnbach’s Alpha (using
standardized values) of α=.73 showed this composite of social class was a reliable predictor.
Education level. Education level was assessed using six categories: (1) lbo (lower craft
education), (2) vmbo (high school), (3) mavo (high school), (4) havo (high school), (5) vwo
(high school), (6) mbo (college), (7) hbo (college), and (8) university. The median education
level was HBO (college).
Interestingly, education level and self-‐reported income were not correlated,
r(96)=.17, p=.10. Therefore, education level was not combined with the other social class
measures to represent social class. This lack of reliability in using education as a measure of
social class may be explained by the egalitarian education model in the Netherlands. Higher
education is government funded with additional funding for lower class individuals. Thus,
even though education has previously been used as a measure of social class (Snibbe &
Markus, 2006), this measure may not be valid in highly egalitarian educational systems.
Lending behavior. Lending behavior was, similar to Study 1, tracked by Peerby. The
measure represents the total number of times the participant has clicked “Help neighbor X”,
in order to lend something to another member of Peerby, see Figure 1. Participants lent 9.37
times on average (SD = 8.5).
Self-‐reported lending. Participants self-‐reported how often they lent things per year
using six categories: (1) once per week, (2) twice or more per week, (3) once a month, (4) a
few times per month, (5) a few times per year, or (6) once a year. In order to calculate
correlations, these scores were recoded into scale values of lending frequency per year: (1)
once per week into 52, (2) twice or more per week into 104, (3) once a month into 12, (4) a
few times per month into 24, (5) a few times per year into 2, and (6) once a year into 1.
Participants reported an average lending of 4.64 times per year (SD = 5.95). The
discrepancy between mean of the self-‐report data and the behavioural measure can be

16
explained by the fact that offering to lend does not always result in actual lending. Often,
help requesters receive multiple lending offers and choose one neighbor to borrow it from.
Borrowing behavior. Borrowing behavior was also tracked by Peerby, just like done
in Study 1 (M = 2.75, SD = 3.39). The count number represents the total number of times the
participant has requested to borrow something from the other members during their
membership.
Self-‐reported borrowing. In the survey, participants were asked how often they
borrowed things per year, using six categories: (1) once per week, (2) twice or more per
week, (3) once a month, (4) a few times per month, (5) a few times per year, or (6) once a
year. This scores were recoded into scale values of lending frequency per year: (1) once per
week into 52, (2) twice or more per week into 104, (3) once a month into 12, (4) a few times
per month into 24, (5) a few times per year into 2, and (6) once a year into 1. The average
frequency was 3.21 times per year (SD = 4.77).
Prosociality ratio. The prosociality ratio was computed by subtracting the
standardized borrowing score from the standardized lending score. This represents the
balance between providing for others and receiving help. The higher the score, the more
lending in comparison to borrowing.
Results
In this study, we assessed if higher social class is related to more prosocial behavior.
We used behavioral data on lending and borrowing to measure prosocial behavior, in
combination with proxy social class measures and survey measures on income, gender, age
and self-‐reported lending and borrowing. Because the behavioral data does not meet
parametric assumptions, we ranked the data and computed Spearman’s rho. Table 2 shows
a summary of the correlations between the social class and prosocial behavior, age and
gender.
Hypothesis 1 was that higher social class is associated with more lending. Indeed,
Spearman’s rho reported that there is a moderate positive association between social class
and lending, r(96)=.23, p<.05. This indicated that higher social class is associated with more
lending, and that the negative relation found by Piff et al. (2010) is falsified.

17
Hypothesis 2 was that higher social class is associated with less borrowing. In contrast
to that prediction, borrowing was marginally significant associated with social class in a
positive direction, r(98)=.16, p=.06. This means that upper class individuals seem to borrow
more than lower class individuals.
So upper class participants both lend and borrow more, relative to lower class
participants. Hypothesis 3 was that the relation between social class and prosociality would
uphold when accounting for both borrowing and lending. Because of the unexpected
positive relation between social class and borrowing, there was no significant relation
between social class and prosociality ratio, r(98)=-‐.03, p=.40. This suggests that the
difference in lending activity found among social classes may be explained by different levels
of participation on Peerby in general, and not by different levels of prosociality. However, in
order to conclude this, we must conduct mediational analysis, which is not possible using
Spearman’s rho.
As for hypothesis 4, we predicted that self-‐reported lending would be weakly
associated with actual lending. We found that indeed, self-‐reported lending was moderately
correlated with actual lending, r(80)=.22, p<.05. This indicates that what participants report
on lending is not accurate in representing actual behavior. Similarly, hypothesis 5 predicted
that self-‐reported borrowing would also be weakly associated with actual borrowing. Our
results showed that this correlation is indeed weak and only borderline significant, r(58)=.22,
p=.051. So in borrowing too, participants’ self reports are not accurate. Due to this
inaccuracy, as can be seen in Table 2, self-‐reported lending is not significantly associated
with social class, while actual lending is significantly higher among upper class participants,
compared to lower class participants. This informs us that self-‐report measures don’t
accurately represent people’s actual behavior.
Finally, we found that age is moderately correlated with lending, self-‐reported
lending and prosociality ratio. This implies that age may be a factor that can explain the
positive relation between social class and lending. But, similar to the other possible
confounds, there is mediational analysis needed before we can conclude that the relation
between social class and prosocial behavior is indeed mediated by participant’s age.
Table 2

18
Correlation Matrix between measures of Prosocial behavior, Social Class and Demographic
Measures (N)
Measure Lending Self-‐reported
Lending
Borrowing Self-‐reported
Borrowing
Prosociality
ratio
Social Class .23 (98)** .06 (79) .16 (98)* -‐.12 (57) -‐.03 (98)
Age .29 (99)*** .19 (80)** -‐.15 (99) -‐.12 (58) .32*** (99)
Gender .11 (99) .10 (80) .02 (99) -‐.05 (58) .08 (99)
Note. *p<.10, **p<.05, ***p<.01
Discussion
The results of Study 2 show that, confirming hypothesis 1b, there is indeed a positive
relation between social class and prosocial behavior. This clearly falsifies the negative
relation hypothesis stipulated by Piff et al. (2010), who suggests that due to lower class’
highly contextual cognition, they are more prosocial than lower class people. In this study,
were able to connect survey data to actual behavioral data gathered in a natural setting. This
gives our findings great external validity, while also ensuring internal validity on our social
class measure, because we were able to measure income directly.
In contrast to the predicted hypothesis 2a, there was also a (borderline significant)
positive relation found between social class and requesting help. So upper class participants
were more likely to both lend and borrow on Peerby. When subtracting borrowing from
lending in one prosociality ratio (hypothesis 3), there was no relationship found between
social class and prosociality ratio.
These results signal the possibility that the relation between social class and prosocial
behavior may not be be caused by upper class’ enhanced prosociality, but on their increased
tendency to participate on Peerby in general. Due to statistical limitations in analysing the
non-‐parametric dataset, we could not conduct mediation or control analyses for this
alternative explanation. Our results do however send a clear signal that prosocial behavior
needs to be put in perspective of help giving as well as giving requesting.

19
Also concerning correct measuring of prosocial behavior, we assessed the validity of
self-‐report data. Confirming hypothesis 4, we found a weak correlation between self-‐
reported lending and actual lending behavior. Similarly, confirming hypothesis 5, we found a
(borderline significant) weak relationship between self-‐reported borrowing and actual
borrowing requests. We do need to be careful interpreting these results. Apart from to the
response errors such as recall bias and socially desired responding (Coughlin, 1990; Randall
& Fernandes, 1991), this low correlation may be caused by the rigid categories participants
had to answer to. For example, 65% of participants reported borrowing “a few times per
year”. This categorical way of asking is necessary because people aren’t able provide an
exact number how often they did something. However, this does lead categorical data to
lose much of the variance that natural data has, especially when events are not frequent and
spread out over a long period of time (Coughlin, 1990). So, our results show that categorical
self-‐report measures specifically don’t predict real-‐world behavior accurately.
Finally, an alternative hypothesis could be that the relation between social class and
lending is confounded by participant’s age. We found a moderate correlation between age
and lending on Peerby. Because the data was not distributed normally, it was impossible to
control for age. The found relationship between social class and lending may be caused by
the fact that older people have more material resources and lend more things. However, the
positive relation between social class and borrowing can not be explained by age, because
older people do not seem to borrow more than younger people. Future research using
parametric datasets (or new statistical methods) are needed to assess if age mediates the
relation between social class and prosocial behavior.
General Discussion
The current research investigated whether having resources is related to giving
resources to somebody else. Our two studies found mixed results. Study 1 found an
extremely weak correlation between social class and prosocial behavior, signalling that there
is no meaningful relation between how much people have and how much they give. Study 2
found a moderate positive relationship between social class and lending. We also found a
marginally significant positive relation between social class and borrowing.

20
The two studies signalled very different strengths regarding how higher social class is
related to more prosocial behavior. This discrepancy might be caused by the large number of
unengaged members of Peerby in Study 1, whereas the sample who responds to a survey
(Study 2) consists of people who are more committed to the platform. The Study 2 sample
indeed had an average lending count of 9.37 times, which is more than double in
comparison to the average of 4.20 times in Study 1. An alternative explanation could be that
the relation between social class and lending only arises among very active members. We
tested this possibility by only selecting very active members (lending > 10) in Study 1. This
did not result in a significant correlation. So the lack of result in Study 1 can’t be explained by
the large group of members who are only sporadically active. Most probably, the data in
Study 1 was simply too complex to be correctly analysed with the current statistical
programs. The dataset of Study 1 contains a lot of participants who are in some way
different than the participants of Study 2, but we don’t know exactly in what way. This is the
challenge that psychological research has facing the opportunities of big data.
The use of big data in the current study does enable this research to be the first on
social class and prosocial behavior to use behavioral data in a natural setting. This has the
advantage that, whereas previous research on social class and prosocial behavior lacked
external validity (Piff et al., 2010; Korndörfer et al., 2015), there is no risk of experiment
constructs, socially desired responding or other responding errors (Randall & Fernandes,
1991; Coughlin, 1990). We found evidence that indeed, what people report on how much
they lend and borrow, does not reflect what how much they actually lend and borrow. So
using natural behavior data, these results robustly contradict the negative relation
hypothesis postulated by Piff et al. (2010).
Balancing Giving and Receiving Help
While upper class people may be more likely to help in comparison to lower class
people, they’re also more likely to request help. This high level of activity among upper class
individuals may be explained by the possibility that due to their elevated personal control
(Johnson & Krueger, 2006; Kraus et al., 2009), upper class individuals adopt innovations
(such as Peerby; see Rogers, 2010) sooner than lower class individuals, and are therefore
more active on Peerby both in borrowing as well as in lending. Additional research must

21
assess whether personal control and innovation adoption mediate the positive relationship
of social class with borrowing and lending.
Another way to experimentally assess how giving and receiving help is related, is to
reverse the Dictator Game. A Reversed Dictator Game could communicate to participants
that an experiment partner has received 10 points and is free to decide how to distribute it.
The participant would get the possibility to ask their experiment partner for a portion of the
points. Requesting help would then be measured with by the amount of points asked by the
participant.
Economic Inequality as Moderator of Upper Class Prosociality
Apart from methodological problems with the evidence provided by Piff et al. (2010),
there is a new theoretical explanation for the contrasting evidence in the literature so far.
The contrasting evidence between the current study and those published by Piff et al. (2010)
may be explained by the amount of economic inequality in the country where the research
took place. While the data analysis of the current research was in progress, Côté et al. (2015)
published findings reporting that economical inequality moderates the effect of income on
generosity in the Dictator Game.
They found that the negative effect of social class on prosocial behavior only emerges
when there is great economic inequality, specifically, when the Gini coefficient (representing
economic inequality) is .485 or higher. Contrastingly, when the Gini coefficient is .454 or
lower, they found that social class is associated with equal or more prosocial behavior. This
pattern also arises when participants are experimentally induced to think there is high vs.
low economic inequality in their home state. This explains why Piff et al. (2010), who
conducted their studies in California (one of the most unequal US states; Wilkinson &
Pickett, 2009), found a negative relationship between social class and prosocial behavior,
while the current research found neutral and positive relationships, conducting research in
the Netherlands. Here, the Gini coefficient is .251, signifying high economic equality.
Therefore, in the current study, the model proposed by Côté et al. (2015) holds up. However,
in order to conclude that the positive relationship between social class and prosocial
behavior was indeed moderated by economic equality, we need to do follow up research on
borrowing and lending under unequal economic circumstances. Peerby has around 500
22
members in the United States, so this data could be analysed in order to conclude if indeed
there is a negative relation between social class and prosocial behavior.
The findings of Côté et al. (2015) combined with those from this research, raise
questions on how different social classes are motivated towards prosocial behaviour. The
reason why the current study found a positive relation between social class and prosocial
behaviour may be because in contexts of economic equality, people are more motivated by
potential rewards for acting prosocial, and less by compassion (Batson & Shaw, 1991).
Compassion is an emotion induced as a reaction to the suffering of others (Goetz, Keltner,
Simon-‐Thomas, 2010). Where there is more economic equality, people might be less
triggered to feel compassion because they’re confronted with less suffering than in
situations with high economic inequality. So acting prosocially may be more driven by
rewards (such as being able to ask for help in return) than by compassion. This drive for
rewards is reflected in our finding that upper class individuals seem to request more help
than lower class individuals. In contrast, in a context with high economic inequality, Piff et al
(2010) found that compassion mediates the relation between social class and prosocial
behavior (Piff et al., 2010). This may explain why unequal economic situations elicit more
prosocial behavior among lower class people and relatively less among upper class people.
Upper class individuals may be more reward focused, while lower class individuals are
motivated to help another by compassion (see van Kleef et al., 2008; Batson & Shaw, 1991;
Clark, Mills & Powel, 1998). Future research should assess how compassion and reward-‐
seeking impact the relation between social class and prosocial behavior in circumstances
with equal –and unequal economic situations.
Challenges in using Big Data in Psychological Research
Concerning big data research, the most critical methodological challenge research is
how to conduct control analysis when data does not meet parametric assumptions. We
could not conduct control analyses for the amount of requests received and age, raising
methodological issues. For example, the amount of requests received may confound the
relation between social class and lending. Members who live in rural areas receive fewer
requests in their neighborhood, and therefore click ‘help’ less often, than members in urban
areas. We cannot exclude the possibility that Peerby members from one social class are

23
more likely to live in a densely populated area than members from another social class, and
this may have repercussions for the validity of the current conclusions. Second, we could not
control for age, even though Study 2 shows that age strongly predicts lending on Peerby. It is
possible that the relation between lending and social class is (partially) mediated by age.
Older people have built up more resources, and may be generally more prosocial than
younger people. Therefore, it is important to assess whether the relation between social
class and prosocial behavior exists when controlling for age and number of received
requests.
The current research explored new possibilities using big data to understand human
interactions. It is clear that statistical programs need to adapt to this new possibility. Still
now, the potential of analysing actual human behaviour instead of lab measures proves
valuable, especially in fields sensitive to socially desired responding like prosocial behavior.
In this article, we provide evidence that social class is not (Study 1) or positively (Study 2)
related to prosocial behavior, contrasting the negative relation hypothesis from the social
cognitive theory on social class (Piff et al., 2010; Kraus et al., 2012). It seems that having
more does lead to giving more, and at the same time, taking more.
Literature
Ajzen, I., & Fishbein, M. (1977). Attitude-‐behavior relations: A theoretical analysis
and review of empirical research. Psychological bulletin, 84(5), 888.
Argyle, M. (1994). The psychology of social class. Psychology Press.
Batson, C. D., & Shaw, L. L. (1991). Evidence for altruism: Toward a pluralism of
prosocial motives. Psychological Inquiry, 2(2), 107-‐122.
Bowles, H. R., & Gelfand, M. (2009). Status and the evaluation of workplace
deviance. Psychological Science.
Brief, A. P., & Motowidlo, S. J. (1986). Prosocial organizational behaviors. Academy of
management Review, 11(4), 710-‐725.
Bowles, H. R., & Gelfand, M. (2009). Status and the evaluation of workplace deviance.
Psychological Science.

24
Coughlin, S. S. (1990). Recall bias in epidemiologic studies. Journal of clinical
epidemiology, 43(1), 87-‐91.
Census (2010). The Asian Population. Gathered from:
http://www.census.gov/prod/cen2010/briefs/c2010br-‐11.pdf.
Census (2010). The African Population. Gathered from:
https://www.census.gov/prod/cen2010/briefs/c2010br-‐06.pdf
Côté, S., House, J., & Willer, R. (2015). High economic inequality leads higher-‐income
individuals to be less generous. Proceedings of the National Academy of Sciences,
201511536.
Clark, M. S., Mills, J., & Powell, M. C. (1986). Keeping track of needs in communal and
exchange relationships. Journal of personality and social psychology, 51(2), 333.
Dovidio, J. F., Piliavin, J. A., Schroeder, D. A., & Penner, L. (2006). The social
psychology of prosocial behavior. Lawrence Erlbaum Associates Publishers.
Goetz, J. L., Keltner, D., & Simon-‐Thomas, E. (2010). Compassion: an evolutionary
analysis and empirical review. Psychological bulletin, 136(3), 351.
Johnson, W., & Krueger, R. F. (2006). How money buys happiness: genetic and
environmental processes linking finances and life satisfaction. Journal of personality and
social psychology, 90(4), 680.
Kanekar, S., & Vaz, L. (1993). Effects of gender and status upon punctuality norms.
The Journal of social psychology, 133(3), 377-‐384.
Korndörfer, M., Egloff, B., & Schmukle, S. C. (2015). A Large Scale Test of the Effect of
Social Class on Prosocial Behavior. PloS one, 10(7), e0133193.
Kraus, M. W., Côté, S., & Keltner, D. (2010). Social class, contextualism, and empathic
accuracy. Psychological Science.
Kraus, M. W., & Keltner, D. (2009). Signs of socioeconomic status a thin-‐slicing
approach. Psychological Science, 20(1), 99-‐106.

25
Kraus, M. W., Piff, P. K., & Keltner, D. (2009). Social class, sense of control, and social
explanation. Journal of personality and social psychology, 97(6), 992.
Kraus, M. W., Piff, P. K., Mendoza-‐Denton, R., Rheinschmidt, M. L., & Keltner, D.
(2012). Social class, solipsism, and contextualism: how the rich are different from the poor.
Psychological review, 119(3), 546.
Lachman, M. E., & Weaver, S. L. (1998). The sense of control as a moderator of social
class differences in health and well-‐being. Journal of personality and social psychology, 74(3),
763.
Oakes, J. M., & Rossi, P. H. (2003). The measurement of SES in health research:
current practice and steps toward a new approach. Social science & medicine, 56(4), 769-‐784.
Piff, P. K., Kraus, M. W., Côté, S., Cheng, B. H., & Keltner, D. (2010). Having less, giving
more: the influence of social class on prosocial behavior. Journal of personality and social
psychology, 99(5), 771.
Randall, D. M., & Fernandes, M. F. (1991). The social desirability response bias in
ethics research. Journal of Business Ethics, 10(11), 805-‐817.
Rogers, E. M. (2010). Diffusion of innovations. Simon and Schuster.
Snibbe, A. C., & Markus, H. R. (2005). You can't always get what you want:
educational attainment, agency, and choice. Journal of personality and social
psychology, 88(4), 703.
Stellar, J. E., Manzo, V. M., Kraus, M. W., & Keltner, D. (2012). Class and compassion:
socioeconomic factors predict responses to suffering. Emotion,12(3), 449.
STIPO, 2015. Nieuwe Rijkdommen. gathered from
http://issuu.com/stipoteam/docs/2015_stipo___nieuwe_rijkdommen_in_d_225d1e3336593
5/1
Trautmann, S. T., van de Kuilen, G., & Zeckhauser, R. J. (2013). Social Class and (Un)
Ethical Behavior A Framework, With Evidence From a Large Population Sample. Perspectives
on Psychological Science, 8(5), 487-‐497.
Wilkinson R, Pickett K (2009) The Spirit Level: Why Greater Equality Makes Societies
Stronger (Bloomsbury Publishing, New York).