Real-time beamforming using high-speed FPGAs at the Allen Telescope Array
Upload
independentCategory
view
0download
0
Ultrasound in Med. & Biol., Vol. -, No. -, pp. 1–11, 2014Copyright � 2014 World Federation for Ultrasound in Medicine & Biology
Printed in the USA. All rights reserved0301-5629/$ - see front matter
/j.ultrasmedbio.2014.03.030
http://dx.doi.org/10.1016d Original Contribution
HARMONIC IMAGING WITH FRESNEL BEAMFORMING IN THE PRESENCEOF PHASE ABERRATION
MAN MINH NGUYEN, JUNSEOB SHIN, and JESSE YEN
Department of Biomedical Engineering, University of Southern California, Los Angeles, California, USA
(Received 1 April 2013; revised 25 January 2014; in final form 31 March 2014)
AWay, DUSA. E
Abstract—Fresnel beamforming is a beamforming method with a delay profile similar in shape to a physicalFresnel lens. The advantage of Fresnel beamforming is the reduced channel count, which consists of four to eighttransmit and two analog-to-digital receive channels. Fresnel beamforming was found to perform comparably toconventional delay-and-sum beamforming. However, the performance of Fresnel beamforming is highly depen-dent on focal errors. These focal errors result in high side-lobe levels and further reduce the performance ofFresnel beamforming in the presence of phase aberration. With the advantages of lower side-lobe levels andsuppression of aberration effects, harmonic imaging offers an effective solution to the limitations of Fresnelbeamforming. We describe the implementation of tissue harmonic imaging and pulse inversion harmonic imagingin Fresnel beamforming, followed by dual apodization with cross-correlation, to improve image quality. Comparedwith conventional delay-and-sum beamforming, experimental results indicated contrast-to-noise ratio improve-ments of 10%, 49%and 264% for Fresnel beamforming using tissue harmonic imaging in the cases of no aberrator,5-mmpork aberrator and 12-mmpork aberrator, respectively. These improvements were 22%, 57% and 352% forFresnel beamforming using pulse inversion harmonic imaging. Moreover, dual apodization with cross-correlationwas found to further improve the contrast-to-noise ratios in all cases. Harmonic imaging was also found to narrowthe lateral beamwidth and shorten the axial pulse length by at least 25% and 21%, respectively, for Fresnel beam-forming at different aberration levels. These results suggest the effectiveness of harmonic imaging in improvingimage quality for Fresnel beamforming, especially in the presence of phase aberration. Even though this combi-nation of Fresnel beamforming and harmonic imaging does not outperform delay-and-sum beamformingcombined with harmonic imaging, it provides the benefits of reduced channel count and potentially reducedcost and size of ultrasound systems. (E-mail: [email protected]) � 2014 World Federation for Ultra-sound in Medicine & Biology.
Key Words: Fresnel, Portable, Dual apodization with cross-correlation, Harmonic, Pulse inversion, Aberration.
INTRODUCTION
In our previous articles, we introduced Fresnel beam-forming as a beamforming method that can reduce thesize and cost of ultrasound systems (Nguyen and Yen2013; Nguyen et al. 2011). Having a delay profilesimilar in shape to a physical Fresnel lens, Fresnelbeamforming has the advantage of reducing the channelcount from 64–128 channels to 4–8 transmit and 2analog-to-digital (A/D) receive channels. The drawbackof Fresnel beamforming is the presence of high side lobesand grating lobes caused by focal errors that result fromphase wraparound and quantization of its delay profile.To suppress high side lobes and grating lobes in Fresnel
ddress correspondence to: Man Minh Nguyen, 1042-Downeyenney Research Center (DRB 391), Los Angeles, CA 90089,-mail: [email protected]
1
beamforming, we previously proposed the integrationinto Fresnel beamforming of a novel clutter suppressionmethod called dual apodization with cross-correlation(DAX) (Nguyen and Yen 2013). DAX is a signal process-ing method that suppresses side lobes and clutter, thusimproving contrast without compromising spatial resolu-tion (Seo and Yen 2008, 2009). While allowing Fresnelbeamforming to be used in cases in which focal errorsare large (up to seven wavelengths), this integration stillrequires improvement for clinical use in overweight andobese patients. In these patients, sound speed aberrationcan induce additional focal errors in Fresnelbeamforming. The improvement described in this articleis achieved by implementing harmonic imaging inFresnel beamforming to suppress side lobes andaberration effects.
Introduced in 1997 by Averkiou et al., harmonic im-aging has become a popular and important diagnostic tool
2 Ultrasound in Medicine and Biology Volume -, Number -, 2014
in many clinical applications (Averkiou et al. 1997;Tranquart et al. 1999). These applications include thedetection of subtle lesions in organs such as the thyroidand breast, delineation of endocardial borders andvisualization of cardiac chambers, as well as abdominalimaging (Kornbluth 1998; Shaprio et al. 1998;Szopinski et al. 2003a, 2003b). Harmonic imagingoffers several benefits over conventional fundamentalimaging. First, ultrasound beamwidth is reduced atharmonic frequencies (Starritt et al. 1986; Ward et al.1997). Second, studies have found that the side lobesgenerated from harmonic frequency signals are muchlower than those generated from fundamental frequencysignals (Christopher 1997, 1998; Rubin et al. 1998).Furthermore, the amplitudes for second harmonicsignals vary in proportion to the square of theamplitudes of fundamental signals. Therefore, smallregional variations in the amplitudes of fundamentalsignals will result in larger variations in harmonicsignals (Desser and Jeffrey 2001). This characteristic,along with lower side-lobe levels, gives harmonic imag-ing the ability to improve image contrast and to detectand characterize lesions. Lastly, compared with funda-mental signals, which travel full round trips, harmonicsignals originate within tissues and, therefore, haveshorter path lengths that are less than a full round trip.This characteristic makes harmonic imaging less vulner-able to distortion in the presence of aberration comparedwith fundamental imaging (Desser and Jeffrey 2001).Because of the characteristics of lower side-lobe levelsand aberration effect suppression, harmonic imaging pro-vides an effective solution to the limitations of Fresnelbeamforming.
Here we describe the implementation of harmonicimaging in Fresnel beamforming. The novelty of this im-plementation is the utilization of both Fresnel beamform-ing and harmonic imaging in providing ultrasoundimaging systems with a reduced channel count and imagequality comparable to that of conventional harmonic im-aging. Because harmonic imaging has become popularand the preferred imaging method over conventionalfundamental imaging for many applications such as liverand cardiac imaging, it is important to evaluate thecompatibility of harmonic imaging with Fresnel beam-forming (Desser and Jeffrey 2001; Shapiro et al. 1998;Tranquart et al. 1999). The expected improvement inFresnel beamforming with harmonic imaging is basedon the fact that the main disadvantage of Fresnelbeamforming, its high side-lobe levels, is counteractedby the advantage of low side-lobe levels offered by har-monic imaging. In this article, the performance of Fresnelbeamforming with harmonic imaging is evaluated andcompared with that of delay-and-sum (DAS) beamform-ing, which is used as the gold standard. The performance
of Fresnel beamforming with different aberrations is alsoinvestigated.
This article is organized as follows. The next sectionprovides background on harmonic imaging techniques,Fresnel beamforming along with its benefits and trade-offs, and the DAX signal processing method. Next,approaches to evaluation of the performance of Fresnelbeamforming with harmonic imaging are presented.The Results and Discussion section and Conclusionssection follows.
BACKGROUND
Harmonic imagingUnlike conventional ultrasound imaging, by which
images are formed from echoes of the transmit frequency(fundamental), harmonic imaging uses echoes at twice thetransmit frequency (second harmonic). These harmonicsignals are generated by the non-linearity of the imagedtarget and the propagation medium (Averkiou et al.1997; Desser and Jeffrey 2001; Tranquart et al. 1999).To explicate, in ultrasound imaging, tissues behave likelinear systems only when the applied acoustic pressureis very small. When higher pressures are applied,compressed tissues are no longer completely elastic andbehave non-linearly, which can be explained by the in-crease in tissue bulk modulus. This means sound travelsfaster through compressed tissues than through relaxedtissues. As a result, ultrasound waveforms are distorted,resulting in the generation of harmonic signals (Beyerand Letcher 1969; Duck 2002; Li and Shen 1999;Cain 1986). These harmonic signals have amplitudeslower than those of fundamental signals. However,because the harmonic signal generation increases withinstantaneous acoustic pressure, dynamic transmitfocusing can be used to increase harmonic signalgeneration as well as to improve the sensitivity andpenetration of harmonic imaging (Li and Shen 1999).
There are two main approaches in harmonic imag-ing; tissue harmonic imaging (THI) and pulse inversionharmonic imaging (PIHI). The former uses bandpass fil-ters to extract harmonic content from the received echoes,while the latter is based on pulse inversion sequencing(Chapman and Lazenby 1997; Ma et al. 2005).Although THI is simple and can be efficientlyimplemented, it is vulnerable to contrast degradationbecause of spectral overlap (Li and Shen 2001). Thisspectral overlap in THI can be reduced with a narrowertransmit bandwidth, at the expense of lengthened axialresolution. On the other hand, PIHI can avoid the poten-tial spectral overlap even when used with a relativelybroad transmit bandwidth. In this method, two transmitpulses, 180
�out of phase relative to each other, are
required for each scan line. The echoes from both

Harmonic imaging with Fresnel beamforming d M. M. NGUYEN et al. 3
transmits are added, resulting in a cancelation of signalsat the fundamental frequency (Chapman and Lazenby1997; Ma et al. 2005). Because PIHI requires twotransmit pulses per scan line, the drawbacks of PIHIinclude frame rate reduction and motion artifacts. In thestudy described here, we implemented and evaluatedboth THI and PIHI approaches in Fresnel beamforming.
Fresnel beamformingIn Fresnel beamforming, the standard geometric
delay, Dt, is replaced by a new delay, DtF, given by
DtF 5DtmodT (1)
where mod indicates the modulo operation, and T is theperiod of ultrasound signals based on the center fre-quency of the signals. DtF is the remainder after integermultiples of the ultrasound period T have been subtractedfrom Dt (Nguyen et al. 2011; Richard et al. 1980). DtF isthen quantized into equally spaced discrete values. Forinstance, for four-phase Fresnel beamforming, DtF takesthe values of 0, 1/4, 2/4 and 3/4 of the period T. To illus-trate, Figure 1 illustrates the delay profiles, Dt, for a 64-element sub-aperture when geometric focusing is used.These delay profiles are calculated from a curvilineararray with a 40-mm radius of curvature and a focus depthof 50 mm. The delay profiles are plotted in terms of signalperiods based on the fundamental frequency (Fig. 1a) andthe second harmonic frequency (Fig. 1b). The new delayprofiles, DtF, for Fresnel beamforming are plotted as boldlines. These delay profiles are similar in shape to a phys-ical Fresnel lens. Each segment corresponds to a period Toffset. Using DtF results in a focal error that is equal to aninteger multiple of T plus the error caused by quantiza-tion. Focusing errors, plotted as dotted lines, indicatethat the number of focal errors, in terms of wavelengths,for Fresnel beamforming doubles as the frequency goesfrom fundamental to second harmonic.
In our design, the discrete time delays of 0, 1/4, 2/4and 3/4 of the period T can be replaced with equivalent
Fig. 1. Delay profiles for Fresnel beamforming and focusing errat (a) the fundamental frequency (1.96 MHz) and (b
phase shifts of 0�, 90
�, 180
�and 270
�, respectively, based
on the relationship in narrowband applications
q52u � Dt (2)
whereu is the angular central frequency of the transducer(Rudnick 1969). As illustrated in Figure 2, four switchesper element are used to apply the phase shifts to thereceived signals. The signals with phase shifts of 0
�, 90
�
180�and 270
�correspond to switches 1, 2, 3 and 4,
respectively. All 0�and 180
�phase-shifted signals are
summed into 1 receive channel (RX1) before being digi-tized by an analog-to-digital (A/D) converter. In the sec-ond receive channel (RX2), all 90
�and 270
�phase-shifted
signals are summed, digitized by the second A/D con-verter and then phase shifted 90
�via a digital Hilbert
transform. The resultant data from these two channelsare then summed digitally to create the beamformedradio-frequency (RF) data, which can be subsequentlyenvelope detected and log compressed to generate adisplay image (Nguyen et al. 2011).
Contrast enhancement with dual apodization withcross-correlation
Dual apodization with cross-correlation (DAX) is asignal processing method that suppresses side lobes andclutter, thus improving contrast without compromisingspatial resolution (Seo and Yen 2008, 2009). Thenovelty of DAX lies in its ability to distinguish clutter-and side lobe-dominated signals and minimize theircontribution to the image. To achieve this, DAX usestwo receive aperture functions that give similar mainlobes and different clutter or side-lobe patterns. Thecross-correlation coefficients will be close to 1 for signalscomposed primarily of main-lobe components and closeto 0 for those composed mainly of clutter. A weightingmatrix based on cross-correlation coefficients is gener-ated as follows. For each pixel, axial segments of thetwo real beamformed RF data sets are cross-correlated.If the coefficient is less than a set threshold value ε .
ors in terms of wavelengths for a 64-element sub-aperture) the second harmonic frequency (3.92 MHz).
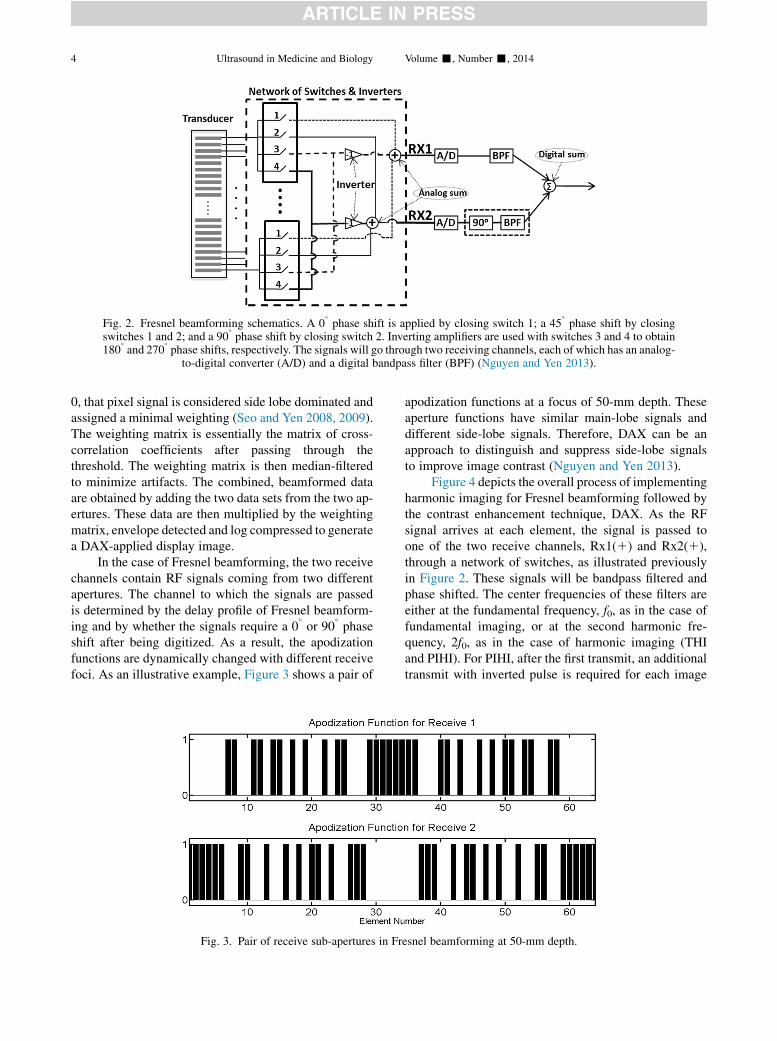
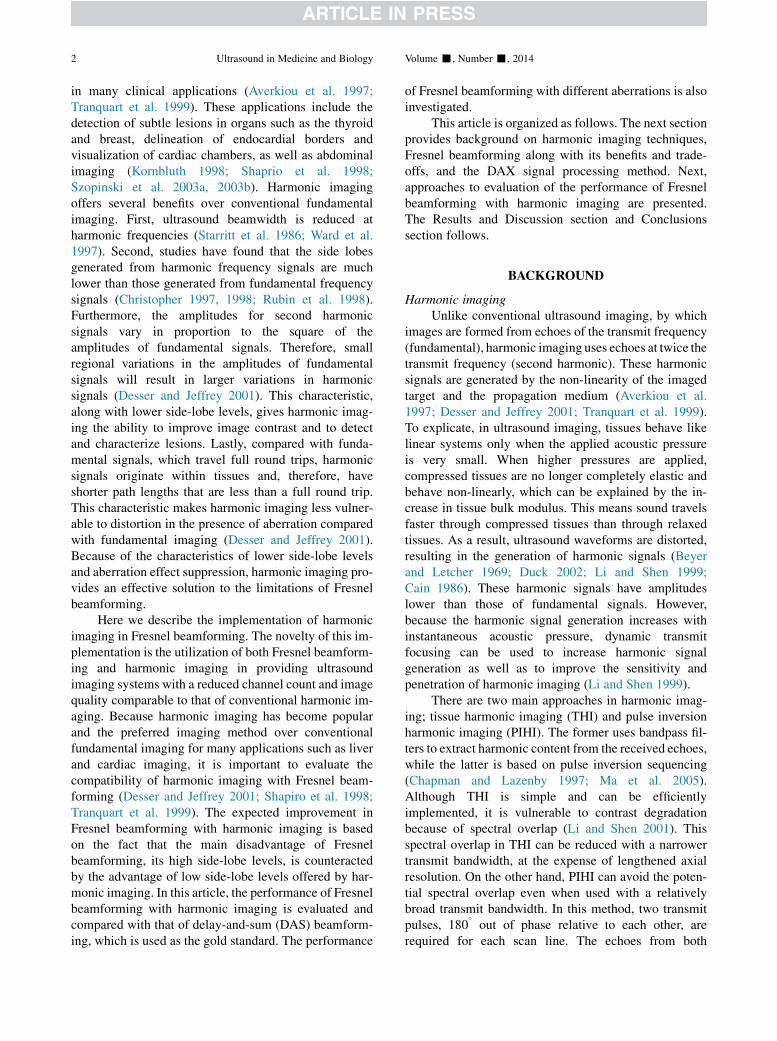
Fig. 2. Fresnel beamforming schematics. A 0�phase shift is applied by closing switch 1; a 45
�phase shift by closing
switches 1 and 2; and a 90�phase shift by closing switch 2. Inverting amplifiers are used with switches 3 and 4 to obtain
180�and 270
�phase shifts, respectively. The signals will go through two receiving channels, each of which has an analog-to-digital converter (A/D) and a digital bandpass filter (BPF) (Nguyen and Yen 2013).
4 Ultrasound in Medicine and Biology Volume -, Number -, 2014
0, that pixel signal is considered side lobe dominated andassigned a minimal weighting (Seo and Yen 2008, 2009).The weighting matrix is essentially the matrix of cross-correlation coefficients after passing through thethreshold. The weighting matrix is then median-filteredto minimize artifacts. The combined, beamformed dataare obtained by adding the two data sets from the two ap-ertures. These data are then multiplied by the weightingmatrix, envelope detected and log compressed to generatea DAX-applied display image.
In the case of Fresnel beamforming, the two receivechannels contain RF signals coming from two differentapertures. The channel to which the signals are passedis determined by the delay profile of Fresnel beamform-ing and by whether the signals require a 0
�or 90
�phase
shift after being digitized. As a result, the apodizationfunctions are dynamically changed with different receivefoci. As an illustrative example, Figure 3 shows a pair of
Fig. 3. Pair of receive sub-apertures in Fr
apodization functions at a focus of 50-mm depth. Theseaperture functions have similar main-lobe signals anddifferent side-lobe signals. Therefore, DAX can be anapproach to distinguish and suppress side-lobe signalsto improve image contrast (Nguyen and Yen 2013).
Figure 4 depicts the overall process of implementingharmonic imaging for Fresnel beamforming followed bythe contrast enhancement technique, DAX. As the RFsignal arrives at each element, the signal is passed toone of the two receive channels, Rx1(1) and Rx2(1),through a network of switches, as illustrated previouslyin Figure 2. These signals will be bandpass filtered andphase shifted. The center frequencies of these filters areeither at the fundamental frequency, f0, as in the case offundamental imaging, or at the second harmonic fre-quency, 2f0, as in the case of harmonic imaging (THIand PIHI). For PIHI, after the first transmit, an additionaltransmit with inverted pulse is required for each image
esnel beamforming at 50-mm depth.
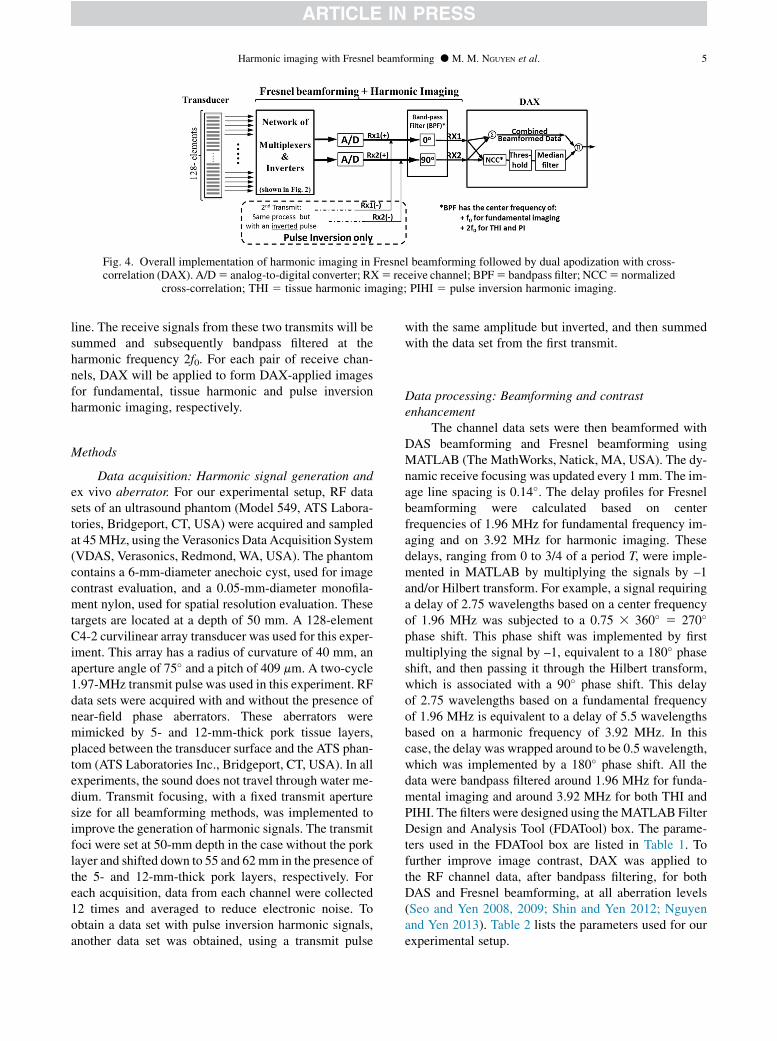
Fig. 4. Overall implementation of harmonic imaging in Fresnel beamforming followed by dual apodization with cross-correlation (DAX). A/D5 analog-to-digital converter; RX5 receive channel; BPF5 bandpass filter; NCC5 normalized
cross-correlation; THI 5 tissue harmonic imaging; PIHI 5 pulse inversion harmonic imaging.
Harmonic imaging with Fresnel beamforming d M. M. NGUYEN et al. 5
line. The receive signals from these two transmits will besummed and subsequently bandpass filtered at theharmonic frequency 2f0. For each pair of receive chan-nels, DAX will be applied to form DAX-applied imagesfor fundamental, tissue harmonic and pulse inversionharmonic imaging, respectively.
Methods
Data acquisition: Harmonic signal generation andex vivo aberrator. For our experimental setup, RF datasets of an ultrasound phantom (Model 549, ATS Labora-tories, Bridgeport, CT, USA) were acquired and sampledat 45MHz, using the Verasonics Data Acquisition System(VDAS, Verasonics, Redmond, WA, USA). The phantomcontains a 6-mm-diameter anechoic cyst, used for imagecontrast evaluation, and a 0.05-mm-diameter monofila-ment nylon, used for spatial resolution evaluation. Thesetargets are located at a depth of 50 mm. A 128-elementC4-2 curvilinear array transducer was used for this exper-iment. This array has a radius of curvature of 40 mm, anaperture angle of 75� and a pitch of 409 mm. A two-cycle1.97-MHz transmit pulse was used in this experiment. RFdata sets were acquired with and without the presence ofnear-field phase aberrators. These aberrators weremimicked by 5- and 12-mm-thick pork tissue layers,placed between the transducer surface and the ATS phan-tom (ATS Laboratories Inc., Bridgeport, CT, USA). In allexperiments, the sound does not travel through water me-dium. Transmit focusing, with a fixed transmit aperturesize for all beamforming methods, was implemented toimprove the generation of harmonic signals. The transmitfoci were set at 50-mm depth in the case without the porklayer and shifted down to 55 and 62mm in the presence ofthe 5- and 12-mm-thick pork layers, respectively. Foreach acquisition, data from each channel were collected12 times and averaged to reduce electronic noise. Toobtain a data set with pulse inversion harmonic signals,another data set was obtained, using a transmit pulse
with the same amplitude but inverted, and then summedwith the data set from the first transmit.
Data processing: Beamforming and contrastenhancement
The channel data sets were then beamformed withDAS beamforming and Fresnel beamforming usingMATLAB (The MathWorks, Natick, MA, USA). The dy-namic receive focusing was updated every 1 mm. The im-age line spacing is 0.14�. The delay profiles for Fresnelbeamforming were calculated based on centerfrequencies of 1.96 MHz for fundamental frequency im-aging and on 3.92 MHz for harmonic imaging. Thesedelays, ranging from 0 to 3/4 of a period T, were imple-mented in MATLAB by multiplying the signals by –1and/or Hilbert transform. For example, a signal requiringa delay of 2.75 wavelengths based on a center frequencyof 1.96 MHz was subjected to a 0.75 3 360� 5 270�
phase shift. This phase shift was implemented by firstmultiplying the signal by –1, equivalent to a 180� phaseshift, and then passing it through the Hilbert transform,which is associated with a 90� phase shift. This delayof 2.75 wavelengths based on a fundamental frequencyof 1.96 MHz is equivalent to a delay of 5.5 wavelengthsbased on a harmonic frequency of 3.92 MHz. In thiscase, the delay was wrapped around to be 0.5 wavelength,which was implemented by a 180� phase shift. All thedata were bandpass filtered around 1.96 MHz for funda-mental imaging and around 3.92 MHz for both THI andPIHI. The filters were designed using theMATLAB FilterDesign and Analysis Tool (FDATool) box. The parame-ters used in the FDATool box are listed in Table 1. Tofurther improve image contrast, DAX was applied tothe RF channel data, after bandpass filtering, for bothDAS and Fresnel beamforming, at all aberration levels(Seo and Yen 2008, 2009; Shin and Yen 2012; Nguyenand Yen 2013). Table 2 lists the parameters used for ourexperimental setup.
Table 1. Parameters for filters designed with theMATLAB FDATool box for harmonic imaging
Parameter Value
Response type BandpassDesign method FIR: least-squaresFilter order 64Fstop1 2.8 MHzFstop2 4.1 MHzSampling frequency 45 MHzWeight value 1 (Wstop1) 1,000,000Weight value 2 (Wstop2) 1
6 Ultrasound in Medicine and Biology Volume -, Number -, 2014
Contrast-to-noise ratio and spatial resolutionThe quality of the cyst images beamformed with
DAS and Fresnel beamforming was quantified in termsof contrast-to-noise ratio (CNR). CNR is defined as thedifference between the mean of the background (areasurrounding the cyst) and the cyst, in decibels, dividedby the standard deviation of the background in decibels(after beamforming and log compression) (Krishnanet al. 1997):
CNR5St2Sbsb
(3)
where St is the arithmetic mean of the signal amplitudefrom the target (in decibels), Sb is the arithmetical meanof the signal amplitude coming from the background (indecibels) and sb is the standard deviation of the signalamplitude from the background (in decibels). The CNRindicates how different signal amplitsudes in the targetand background are with respect to the noise-like charac-teristics in the speckle. Higher CNR values imply betterimage contrast. The regions used for CNR calculation,approximately 2 3 2 and 2.5 3 5 mm for the cyst and
Table 2. Parameters for experimental setup
Parameter Value
Radius of curvature 40 mmNumber of elements 128Aperture angle 75�Elevation element height 13 mmAzimuthal element pitch 0.409 mmTransmit center frequency 1.96 MHzSampling frequency 45 MHzSound speed 1480 m/s (water)
1450 m/s (phantom)Transmit focus 50 mm (no pork)
55 mm (5 mm pork)62 mm (12 mm pork)
Lateral beam spacing 0.14�Receive focal delay step 1 mmThreshold (DAX) 0.001Median filter (DAX) 4l 3 4lAttenuation coefficient (ATS 549) 0.5 dB/cm/MHz 6 5.0%
DAX 5 dual apodization with cross-correlation.
speckle regions, respectively, are marked with boxes inFigures 5–7. On the wire-target images, the –6-dB lateraland axial target sizes were measured to serve as metricsfor spatial resolution.
RESULTS AND DISCUSSION
In Figure 5 are the experimental images of a 6-mm-diameter anechoic cyst from the ATS tissue-mimickingphantom with no aberrator obtained with DAS andFresnel beamforming. Similar sets of images, acquiredwith 5- and 12-mm-thick pork tissue, are provided inFigures 6 and 7, respectively. These images are shownin a 40-dB dynamic range. Table 3 lists the CNR valuesfor these images. For comparison, the regions for CNRcalculation are identical for DAS and Fresnelbeamforming.
Harmonic imaging without DAXHarmonic imaging provided superior image contrast
compared with fundamental imaging at all aberrationlevels for both DAS and Fresnel beamforming. However,as the aberration level increased, image contrast for bothfundamental and harmonic imaging degraded. For DASbeamforming, the CNR values for fundamental imagingdecreased from 6.02 in the case without aberrator to3.65 and 0.93 in the cases of 5- and 12-mm-thick porkaberrators, respectively. Similar degradation was foundwith Fresnel beamforming, where the CNR decreasedfrom 5.83 to 3.17 and 1.38, respectively. Although bothTHI and PIHI improved the image contrast for all aberra-tion levels, the impact of harmonic imaging became morepronounced as the aberration level increased. Forexample, in the case of no aberrator, THI and PIHIimproved CNR by 14% and 21% (from 6.02 to 6.84and 7.28) for DAS beamforming and by 14% and 26%(from 5.83 to 6.65 and 7.35) for Fresnel beamforming,respectively (Fig. 5). In the case of a weak aberrator, thesepercentage improvements were 83% and 84% for DASbeamforming and 72% and 81% for Fresnel beamform-ing, respectively (Fig. 6). The impact of harmonic imag-ing was most obvious in the case of a strong aberrator,where the cysts were not visible with fundamentalimaging for both DAS and Fresnel beamforming. Withharmonic imaging, these cysts became visible, althoughwith some clutter caused by aberration effects (Fig. 7,first column). The improvements in CNR seen withharmonic imaging are the result of the suppression ofaberration effects at the second harmonic.
Harmonic imaging with DAXHarmonic imaging improved the image contrast in
the presence of a weak aberrator, with CNRs comparableto those of un-aberrated cysts using fundamental
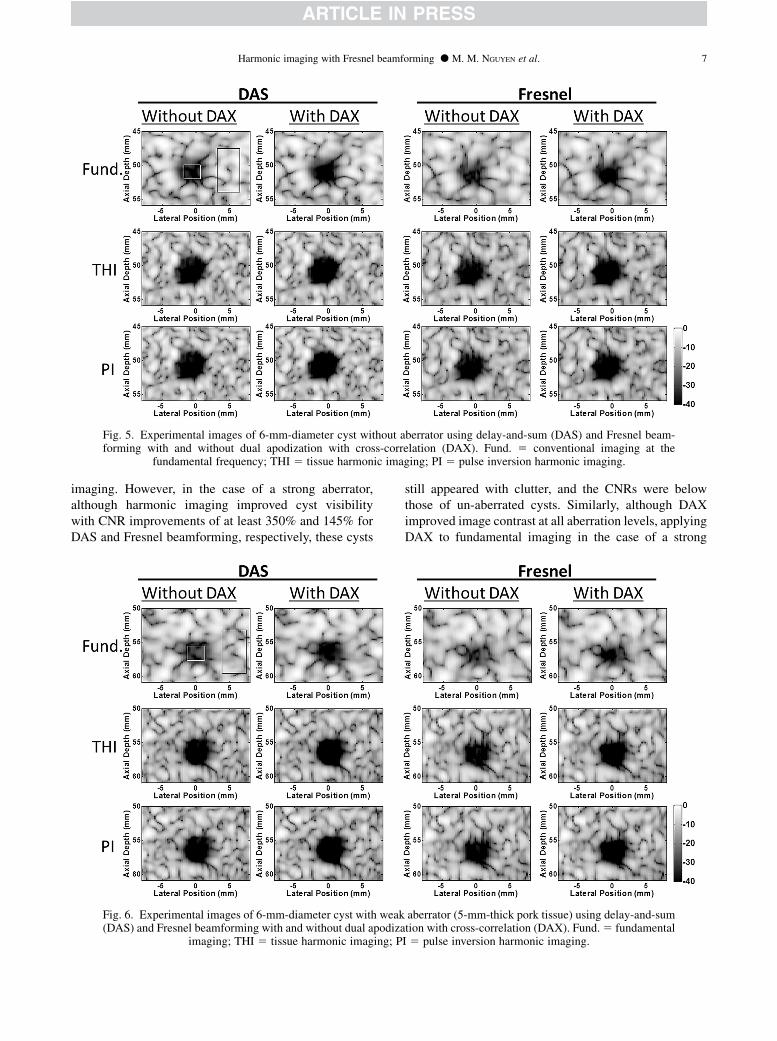
Fig. 5. Experimental images of 6-mm-diameter cyst without aberrator using delay-and-sum (DAS) and Fresnel beam-forming with and without dual apodization with cross-correlation (DAX). Fund. 5 conventional imaging at the
fundamental frequency; THI 5 tissue harmonic imaging; PI 5 pulse inversion harmonic imaging.
Harmonic imaging with Fresnel beamforming d M. M. NGUYEN et al. 7
imaging. However, in the case of a strong aberrator,although harmonic imaging improved cyst visibilitywith CNR improvements of at least 350% and 145% forDAS and Fresnel beamforming, respectively, these cysts
Fig. 6. Experimental images of 6-mm-diameter cyst with weak(DAS) and Fresnel beamforming with and without dual apodiza
imaging; THI 5 tissue harmonic imaging; P
still appeared with clutter, and the CNRs were belowthose of un-aberrated cysts. Similarly, although DAXimproved image contrast at all aberration levels, applyingDAX to fundamental imaging in the case of a strong
aberrator (5-mm-thick pork tissue) using delay-and-sumtion with cross-correlation (DAX). Fund.5 fundamentalI 5 pulse inversion harmonic imaging.
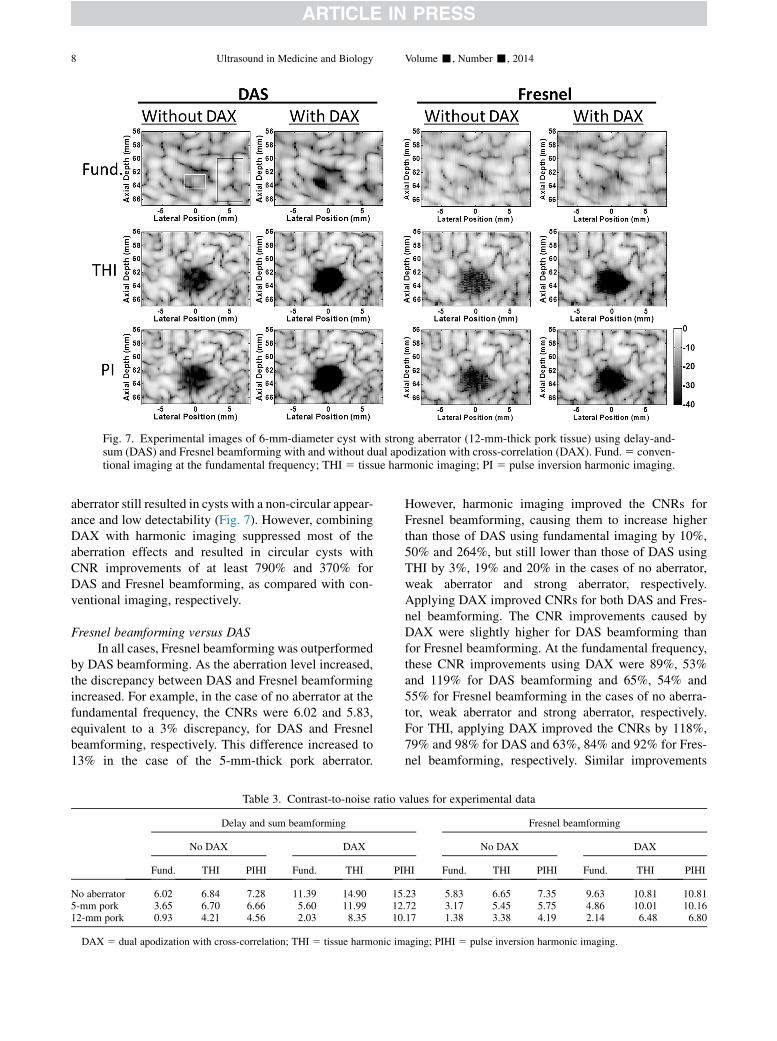
Fig. 7. Experimental images of 6-mm-diameter cyst with strong aberrator (12-mm-thick pork tissue) using delay-and-sum (DAS) and Fresnel beamforming with and without dual apodization with cross-correlation (DAX). Fund.5 conven-tional imaging at the fundamental frequency; THI 5 tissue harmonic imaging; PI 5 pulse inversion harmonic imaging.
8 Ultrasound in Medicine and Biology Volume -, Number -, 2014
aberrator still resulted in cysts with a non-circular appear-ance and low detectability (Fig. 7). However, combiningDAX with harmonic imaging suppressed most of theaberration effects and resulted in circular cysts withCNR improvements of at least 790% and 370% forDAS and Fresnel beamforming, as compared with con-ventional imaging, respectively.
Fresnel beamforming versus DASIn all cases, Fresnel beamforming was outperformed
by DAS beamforming. As the aberration level increased,the discrepancy between DAS and Fresnel beamformingincreased. For example, in the case of no aberrator at thefundamental frequency, the CNRs were 6.02 and 5.83,equivalent to a 3% discrepancy, for DAS and Fresnelbeamforming, respectively. This difference increased to13% in the case of the 5-mm-thick pork aberrator.
Table 3. Contrast-to-noise ratio v
Delay and sum beamforming
No DAX DAX
Fund. THI PIHI Fund. THI PI
No aberrator 6.02 6.84 7.28 11.39 14.90 155-mm pork 3.65 6.70 6.66 5.60 11.99 1212-mm pork 0.93 4.21 4.56 2.03 8.35 10
DAX 5 dual apodization with cross-correlation; THI 5 tissue harmonic im
However, harmonic imaging improved the CNRs forFresnel beamforming, causing them to increase higherthan those of DAS using fundamental imaging by 10%,50% and 264%, but still lower than those of DAS usingTHI by 3%, 19% and 20% in the cases of no aberrator,weak aberrator and strong aberrator, respectively.Applying DAX improved CNRs for both DAS and Fres-nel beamforming. The CNR improvements caused byDAX were slightly higher for DAS beamforming thanfor Fresnel beamforming. At the fundamental frequency,these CNR improvements using DAX were 89%, 53%and 119% for DAS beamforming and 65%, 54% and55% for Fresnel beamforming in the cases of no aberra-tor, weak aberrator and strong aberrator, respectively.For THI, applying DAX improved the CNRs by 118%,79% and 98% for DAS and 63%, 84% and 92% for Fres-nel beamforming, respectively. Similar improvements
alues for experimental data
Fresnel beamforming
No DAX DAX
HI Fund. THI PIHI Fund. THI PIHI
.23 5.83 6.65 7.35 9.63 10.81 10.81
.72 3.17 5.45 5.75 4.86 10.01 10.16
.17 1.38 3.38 4.19 2.14 6.48 6.80
aging; PIHI 5 pulse inversion harmonic imaging.
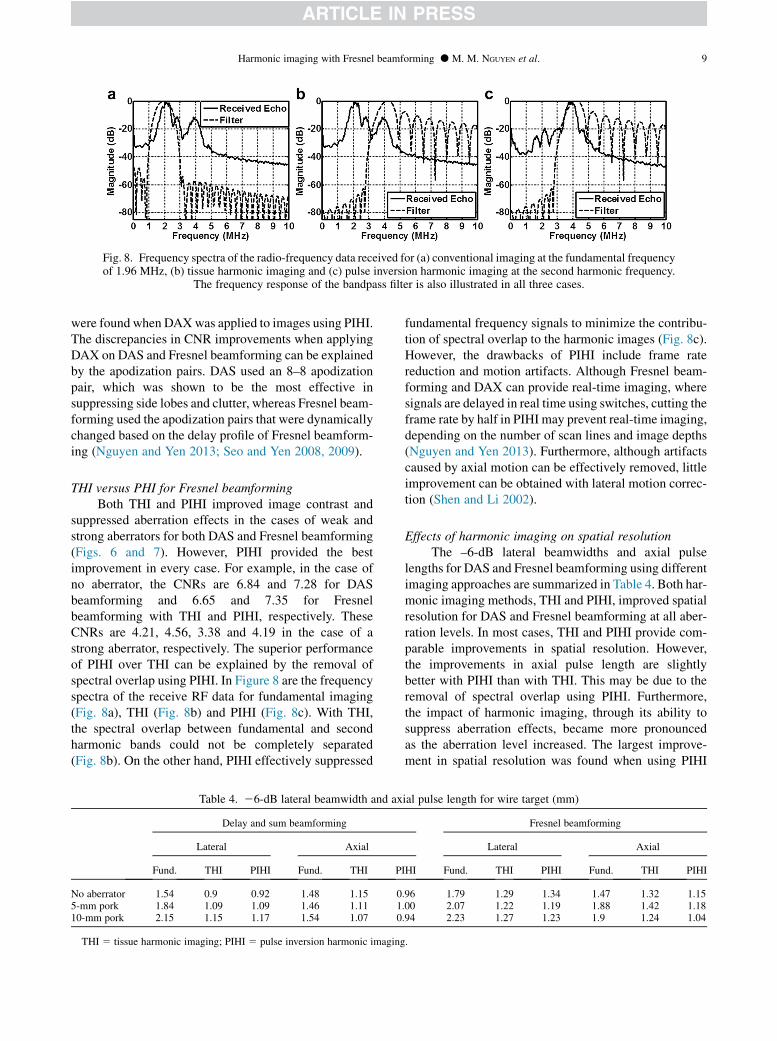
Fig. 8. Frequency spectra of the radio-frequency data received for (a) conventional imaging at the fundamental frequencyof 1.96 MHz, (b) tissue harmonic imaging and (c) pulse inversion harmonic imaging at the second harmonic frequency.
The frequency response of the bandpass filter is also illustrated in all three cases.
Harmonic imaging with Fresnel beamforming d M. M. NGUYEN et al. 9
were found when DAXwas applied to images using PIHI.The discrepancies in CNR improvements when applyingDAX on DAS and Fresnel beamforming can be explainedby the apodization pairs. DAS used an 8–8 apodizationpair, which was shown to be the most effective insuppressing side lobes and clutter, whereas Fresnel beam-forming used the apodization pairs that were dynamicallychanged based on the delay profile of Fresnel beamform-ing (Nguyen and Yen 2013; Seo and Yen 2008, 2009).
THI versus PHI for Fresnel beamformingBoth THI and PIHI improved image contrast and
suppressed aberration effects in the cases of weak andstrong aberrators for both DAS and Fresnel beamforming(Figs. 6 and 7). However, PIHI provided the bestimprovement in every case. For example, in the case ofno aberrator, the CNRs are 6.84 and 7.28 for DASbeamforming and 6.65 and 7.35 for Fresnelbeamforming with THI and PIHI, respectively. TheseCNRs are 4.21, 4.56, 3.38 and 4.19 in the case of astrong aberrator, respectively. The superior performanceof PIHI over THI can be explained by the removal ofspectral overlap using PIHI. In Figure 8 are the frequencyspectra of the receive RF data for fundamental imaging(Fig. 8a), THI (Fig. 8b) and PIHI (Fig. 8c). With THI,the spectral overlap between fundamental and secondharmonic bands could not be completely separated(Fig. 8b). On the other hand, PIHI effectively suppressed
Table 4. 26-dB lateral beamwidth and ax
Delay and sum beamforming
Lateral Axial
Fund. THI PIHI Fund. THI PI
No aberrator 1.54 0.9 0.92 1.48 1.15 05-mm pork 1.84 1.09 1.09 1.46 1.11 110-mm pork 2.15 1.15 1.17 1.54 1.07 0
THI 5 tissue harmonic imaging; PIHI 5 pulse inversion harmonic imaging
fundamental frequency signals to minimize the contribu-tion of spectral overlap to the harmonic images (Fig. 8c).However, the drawbacks of PIHI include frame ratereduction and motion artifacts. Although Fresnel beam-forming and DAX can provide real-time imaging, wheresignals are delayed in real time using switches, cutting theframe rate by half in PIHI may prevent real-time imaging,depending on the number of scan lines and image depths(Nguyen and Yen 2013). Furthermore, although artifactscaused by axial motion can be effectively removed, littleimprovement can be obtained with lateral motion correc-tion (Shen and Li 2002).
Effects of harmonic imaging on spatial resolutionThe –6-dB lateral beamwidths and axial pulse
lengths for DAS and Fresnel beamforming using differentimaging approaches are summarized in Table 4. Both har-monic imaging methods, THI and PIHI, improved spatialresolution for DAS and Fresnel beamforming at all aber-ration levels. In most cases, THI and PIHI provide com-parable improvements in spatial resolution. However,the improvements in axial pulse length are slightlybetter with PIHI than with THI. This may be due to theremoval of spectral overlap using PIHI. Furthermore,the impact of harmonic imaging, through its ability tosuppress aberration effects, became more pronouncedas the aberration level increased. The largest improve-ment in spatial resolution was found when using PIHI
ial pulse length for wire target (mm)
Fresnel beamforming
Lateral Axial
HI Fund. THI PIHI Fund. THI PIHI
.96 1.79 1.29 1.34 1.47 1.32 1.15
.00 2.07 1.22 1.19 1.88 1.42 1.18
.94 2.23 1.27 1.23 1.9 1.24 1.04
.

Table 5. Contrast-to-noise ratios for experimental data with simulated noise*
Delay and sum beamforming Fresnel beamforming
No DAX DAX No DAX DAX
Fund. THI PIHI Fund. THI PIHI Fund. THI PIHI Fund. THI PIHI
No aberrator 5.87 4.12 4.76 10.91 9.91 12.63 5.88 4.18 4.75 9.79 10.80 11.335-mm pork 3.62 4.49 4.72 5.78 9.66 10.14 2.97 3.65 3.77 4.35 7.80 8.3312-mm pork 0.91 2.26 2.83 2.07 6.33 7.49 1.34 2.40 2.81 2.06 4.84 6.47
DAX 5 dual apodization with cross-correlation; THI 5 tissue harmonic imaging; PIHI 5 pulse inversion harmonic imaging.* Noise is normally distributed with zero mean and a standard deviation 0.5 times the root mean square of channel radio-frequency data.
10 Ultrasound in Medicine and Biology Volume -, Number -, 2014
in the case of a strong aberrator, where –6-dB lateralbeamwidths were reduced by 46% and 45% and axialpulse lengths were shortened by 39% and 45% for DASand Fresnel beamforming, respectively. These percentageimprovements were slightly less in cases without an aber-rator and with a weak aberrator. To explicate, in caseswithout an aberrator, using PIHI resulted in reductionsof 40% and 25% in lateral beamwidth (from 1.54 to0.92 mm and from 1.79 to 1.34 mm) and 35% and 22%in axial pulse length (from 1.48 to 0.96 mm and from1.47 to 1.15 mm) for DAS and Fresnel beamforming.Furthermore, we also found that applying DAX did notchange the spatial resolution in all cases, which is consis-tent with the previous studies on DAX (Nguyen and Yen2013; Seo and Yen 2008, 2009).
Effects of noiseBecause harmonic signals are generally lower than
fundamental signals by more than 20 dB, effects of noisewere also investigated in this study by adding simulatednoise to the receive channel data (Christopher 1997; Liand Shen 1999; Shen and Li 2001). The simulated noisehad a normal distribution with zero mean and standarddeviation equal to 0.5 times the root mean square of thechannel data, resulting in a channel signal-to-noise ratioof 6 dB, assuming no noise in the original data. Table 5lists the CNR values for different beamforming methodsat different aberration levels with the simulated noise.CNRs are lower with increasing noise level for all beam-forming cases. In the presence of the simulated noise, theperformance of harmonic imaging is no longer superior tothat of fundamental imaging. To explicate, in caseswithout an aberrator, the CNRs were reduced from 5.87in fundamental imaging to 4.12 in THI and 4.76 inPIHI for DAS beamforming and from 5.88 to 4.18 and4.75 for Fresnel beamforming, respectively. However,in cases with an aberrator, harmonic imaging still outper-formed fundamental imaging. These results can beexplained by the fact that even though harmonic signalsare more vulnerable to noise than fundamental signalsbecause of their smaller amplitudes, they are less vulner-able to the distortion caused by aberration (Christopher
1997; Desser and Jeffrey 2001; Li and Shen 1999). Thesynergetic enhancement obtained by combining DAXand harmonic imaging was also apparent,with CNRimprovements of at least 70% for DAS and 84% forFresnel beamforming. These improvements lead to thehighest CNRs for harmonic imaging combined withDAX for all aberration levels in both DAS and Fresnelbeamforming. Fresnel beamforming also performedcomparably, in terms of CNR, to DAS beamforming inthe presence of noise for all aberration levels. Thesuperior performance of PIHI over THI still holds in allcases.
CONCLUSIONS
We have described the implementation and perfor-mance evaluation of THI and PIHI in Fresnel beamform-ing. The advantages of harmonic imaging include thesuppression of sidelobe levels and aberration effects aswell as shorter wavelengths. Implementing harmonic im-aging in Fresnel beamforming resulted in improvementsin CNR and spatial resolution even though the numberof focal errors in terms of wavelengths for Fresnel beam-forming doubles at the second harmonic frequency. DAXwas found to improve the CNRs of Fresnel beamformingby at least 47%, without compromising spatial resolution,in both fundamental and harmonic imaging at all threedifferent aberration levels. PIHI followed by DAX wasfound to improve image contrast the most. This integra-tion improved the CNRs of Fresnel beamforming by86%, 221% and 394%, compared with those of Fresnelbeamforming using fundamental imaging in the casesof no aberrator, weak aberrator and strong aberrator,respectively. In terms of resolution, these improvementsare 25%, 42% and 44% for lateral beam reduction and22%, 37% and 45% for axial pulse length shortening,respectively.
This article also illustrates the increasing impact ofharmonic imaging, in terms of percentage improvementsin both CNRs and spatial resolution, for both DAS andFresnel beamforming, as aberration strengthens. Howev-er, the choice between THI and PIHI should be madewith

Harmonic imaging with Fresnel beamforming d M. M. NGUYEN et al. 11
care. Although PIHI performs best, it requires two trans-mit pulses per scan line, resulting in frame rate reductionand motion artifacts. On the other hand, THI can be sim-ply implemented with harmonic bandpass filters and canstill provide decent image quality improvements.
The advantage of Fresnel beamforming is thereduced channel count at the cost of high side lobes,which can be counteracted by the advantages of lowerside lobes and suppressed aberration effects offered byharmonic imaging. Even though the combination of Fres-nel beamforming and harmonic imaging does not outper-form harmonic imaging combined with DAS, it providesthe benefits of reduced channel count and potentiallyreduced cost and size of ultrasound systems As harmonicimaging has become widely used in clinics, this study il-lustrates the compatibility of harmonic imaging and Fres-nel beamforming in providing ultrasound imagingsystems, not only with reduced cost and size, but alsowith image quality comparable to that of conventionalharmonic imaging systems. For future experiments, clin-ical data can be used to illustrate feasibility, as well as torefine the proposed method for in vivo imaging.
REFERENCES
Averkiou MA, Roundhill DR, Powers JE. A new imaging techniquebased on the non-linear properties of tissues. Proc IEEE UltrasonSymp 1997;2:1561–1566.
Beyer RT, Letcher SV. Nonlinear acoustics. New York: Academic Press;1969. p. 202–230.
Cain CA. Ultrasonic reflection mode imaging of the non-linear param-eter B/A: A theoretical basis. J Acoust Soc Am 1986;80:28–32.
Chapman CS, Lazenby JC. Ultrasound imaging system employingphase inversion subtraction to enhance the image. US Patent5,632,277, 1997.
Christopher T. Finite amplitude distortion-based inhomogeneous pulseecho ultrasonic imaging. IEEE Trans Ultrason Ferroelectr Freq Con-trol 1997;44:125–139.
Christopher T. Experimental investigation of finite amplitude distortion-based, second harmonic pulse echo ultrasonic imaging. IEEE TransUltrason Ferroelectr Freq Control 1998;45:158–162.
Desser TS, Jeffrey RB. Tissue harmonic imaging techniques: Physicalprinciples and clinical applications. Semin Ultrasound CT MR2001;22:1–10.
Duck FA. Nonlinear acoustics in diagnostic ultrasound. UltrasoundMedBiol 2002;28:1–18.
Kornbluth M. Native tissue harmonic imaging improves endocardiaborder definition and visualization of cardiac structures. J Am SocEchocardiogr 1998;11:693–701.
Krishnan S, Rigby KW, O’Donnell M. Improved estimation of phase ab-erration profile. IEEE Trans Ultrason Ferroelectr Freq Control 1997;44:701–713.
Li PC, Shen CC. Effects of transmit focusing on finite amplitude distor-tion based second harmonic generation. Ultrason Imaging 1999;21:243–258.
Li PC, Shen CC. Harmonic leakage and image quality degradation in tis-sue harmonic imaging. IEEE Trans Ultrason Ferroelectr Freq Con-trol 2001;48:728–736.
Ma Q, Ma Y, Gong X, Zhang D. Improvement of tissue harmonic imag-ing using the pulse-inversion technique. Ultrasound Med Biol 2005;31:889–894.
Nguyen MM, Mung J, Yen JT. Fresnel-based beamforming for low-costportable ultrasound. IEEE Trans Ultrason Ferroelectr Freq Control2011;58:112–121.
Nguyen MM, Yen JT. Performance improvement of Fresnel beamform-ing using dual apodization with cross-correlation. IEEE Trans Ultra-son Ferroelectr Freq Control 2013;60:451–462.
Richard B, Fink M, Alais P. New arrangements for Fresnel focusing. In:Wang K, (ed). Acoustical imaging. New York: Plenum; 1980. p.65–73.
Rubin DN, Yazbek N, Homa D. Why does tissue harmonic imagingimprove image quality: A quantitative examination demonstratingside-lobe suppression [Abstract]. J Am Coll Cardiol 1998;32:127A.
Rudnick P. Digital beamforming in the frequency domain. J Acoust SocAm 1969;46:1089–1090.
Seo C, Yen JT. Sidelobe suppression in ultrasound imaging using dualapodization with cross-correlation. IEEE Trans Ultrason FerroelectrFreq Control 2008;55:2198–2210.
Seo C, Yen JT. Evaluating the robustness of dual apodization with cross-correlation. IEEE Trans Ultrason Ferroelectr Freq Control 2009;56:291–303.
Shapiro RS, Wagreich J, Parsons RB, Stancato-Pasik A, Yeh H, Lao R.Tissue harmonic imaging sonography: Evaluation of image qualitycompared with conventional sonography. Am J Roentgenol 1998;171:1203–1206.
Shen CC, Li PC. Tissue harmonic image analysis based on spatialcovariance. IEEE Trans Ultrason Ferroelectr Freq Control 2001;48:1648–1656.
Shen CC, Li PC. Motion artifacts of pulse inversion based tissue har-monic imaging. IEEE Trans Ultrason Ferroelectr Freq Control2002;49:1203–1211.
Shin J, Yen J. Synergistic enhancements of ultrasound image contrastwith a combination of phase aberration correction and dual apodiza-tion with cross-correlation. IEEE Trans Ultrason Ferroelectr FreqControl 2012;59:2089–2101.
Starritt HC, Duck FA, Hawkins AJ, Humphrey VF. The development ofharmonic distortion in pulsed finite-amplitude ultrasound passingthrough liver. Phys Med Biol 1986;31:1401–1409.
Szopinski KT, Pajk AM, Wysocki M, Amy D, Szopinska M,Jakubowski W. Tissue harmonic imaging: Utility in breast sonogra-phy. Ultrasound Med Biol 2003a;22:479–487.
Szopinski KT, Wysocki M, Pajk AM, Slapa RZ, Jakubowski W,Szopinski M. Tissue harmonic imaging of thyroid nodules: Initialexperience. Ultrasound Med Biol 2003b;22:5–12.
Tranquart F, Grenier N, Eder V, Pourcelot L. Clinical use of ultra-sound tissue harmonic imaging. Ultrasound Med Biol 1999;25:889–894.
Ward B, Baker AC, Humphrey VF. Nonlinear propagation applied to theimprovement of resolution in diagnostic medical ultrasound equip-ment. J Acoust Soc Am 1997;10:143–154.
Copyright © 2022 FDOKUMEN