Happily together forever: temporal variation in spatial patterns and complete lack of territoriality...
10
ORIGINAL ARTICLE Happily together forever: temporal variation in spatial patterns and complete lack of territoriality in a promiscuous rodent Benny Borremans • Nelika K. Hughes • Jonas Reijniers • Vincent Sluydts • Abdul A. S. Katakweba • Loth S. Mulungu • Christopher A. Sabuni • Rhodes H. Makundi • Herwig Leirs Received: 18 February 2013 / Accepted: 20 June 2013 Ó The Society of Population Ecology and Springer Japan 2013 Abstract The availability of resources, their effect on population density and territoriality, and the ways in which these factors are interwoven with mating systems are important determinants of small mammal space use. It is often difficult to study these patterns in an integrated way, however, especially because long-term data are needed but not readily available. In this paper, we investigate effects of population density, season and breeding status on home range patterns of the promiscuous rodent Mastomys natalensis using monthly capture-mark-recapture data collected over 17 years in a 3-ha grid. Home ranges were estimated using minimum convex polygons bounded by trap locations, and home range overlap and visitation rates were calculated as a measure of territoriality. As higher population densities coincide with increased resource availability, we predicted that home range sizes would correlate negatively with density. Furthermore, as M. natalensis is promiscuous and population densities are generally high, we predicted that territoriality would be low, and home range overlap would therefore be high. Contrary to expectations the home ranges of female adults increased with population density, although those of male adults and subadults followed the expected decrease. Home range overlap and visitation rates were generally high, and increased significantly with population density. More importantly, they were never lower than those of simulated datasets consisting of randomly moved home ranges. These results therefore suggest that M. natalensis displays a complete lack of territoriality that is rarely seen in small mammals but still meets predictions based on knowledge of density and mating system. Keywords Absence of territoriality Á Capture- mark-recapture Á Density-dependent Á Home range Á Mastomys natalensis Introduction In small mammal societies, space use of individuals is thought to be a function of resource availability, population density, territoriality and mating system (Wolff 1985; Ostfeld 1990; Waterman 2007; Adler 2011). The avail- ability of resources (food, shelter) in time and space will influence animal numbers, and often also the presence and level of territorial behaviour (Ostfeld 1985). Territoriality will also be determined by population density, as territorial defence of resources and/or mates becomes less economi- cal with higher numbers of competitors (Warner and Hoffman 1980; Wolff 1985). Mating systems are strongly interwoven with density and territoriality, as a decreased Electronic supplementary material The online version of this article (doi:10.1007/s10144-013-0393-2) contains supplementary material, which is available to authorized users. B. Borremans (&) Á N. K. Hughes Á J. Reijniers Á V. Sluydts Á H. Leirs Evolutionary Ecology Group, University of Antwerp, Groenenborgerlaan 171, 2020 Antwerpen, Belgium e-mail: [email protected] V. Sluydts Unit of Medical Entomology, Institute of Tropical Medicine, Nationalestraat 155, 2000 Antwerpen, Belgium A. A. S. Katakweba Á L. S. Mulungu Á C. A. Sabuni Á R. H. Makundi Pest Management Center, Sokoine University of Agriculture, Chuo Kikuu, PO BOX 3110, Morogoro, Tanzania H. Leirs Danish Pest Infestation Laboratory, University of Aarhus, Forsøgsvej 1, 4200 Slagelse, Denmark 123 Popul Ecol DOI 10.1007/s10144-013-0393-2
-
Upload
independent -
Category
Documents
-
view
0 -
download
0
Transcript of Happily together forever: temporal variation in spatial patterns and complete lack of territoriality...
ORIGINAL ARTICLE
Happily together forever: temporal variation in spatial patternsand complete lack of territoriality in a promiscuous rodent
Benny Borremans • Nelika K. Hughes • Jonas Reijniers • Vincent Sluydts •
Abdul A. S. Katakweba • Loth S. Mulungu • Christopher A. Sabuni •
Rhodes H. Makundi • Herwig Leirs
Received: 18 February 2013 / Accepted: 20 June 2013
� The Society of Population Ecology and Springer Japan 2013
Abstract The availability of resources, their effect on
population density and territoriality, and the ways in which
these factors are interwoven with mating systems are
important determinants of small mammal space use. It is
often difficult to study these patterns in an integrated way,
however, especially because long-term data are needed but
not readily available. In this paper, we investigate effects of
population density, season and breeding status on home
range patterns of the promiscuous rodent Mastomys
natalensis using monthly capture-mark-recapture data
collected over 17 years in a 3-ha grid. Home ranges were
estimated using minimum convex polygons bounded by
trap locations, and home range overlap and visitation rates
were calculated as a measure of territoriality. As higher
population densities coincide with increased resource
availability, we predicted that home range sizes would
correlate negatively with density. Furthermore, as
M. natalensis is promiscuous and population densities are
generally high, we predicted that territoriality would be
low, and home range overlap would therefore be high.
Contrary to expectations the home ranges of female adults
increased with population density, although those of male
adults and subadults followed the expected decrease. Home
range overlap and visitation rates were generally high, and
increased significantly with population density. More
importantly, they were never lower than those of simulated
datasets consisting of randomly moved home ranges. These
results therefore suggest that M. natalensis displays a
complete lack of territoriality that is rarely seen in small
mammals but still meets predictions based on knowledge
of density and mating system.
Keywords Absence of territoriality � Capture-
mark-recapture � Density-dependent � Home range �Mastomys natalensis
Introduction
In small mammal societies, space use of individuals is
thought to be a function of resource availability, population
density, territoriality and mating system (Wolff 1985;
Ostfeld 1990; Waterman 2007; Adler 2011). The avail-
ability of resources (food, shelter) in time and space will
influence animal numbers, and often also the presence and
level of territorial behaviour (Ostfeld 1985). Territoriality
will also be determined by population density, as territorial
defence of resources and/or mates becomes less economi-
cal with higher numbers of competitors (Warner and
Hoffman 1980; Wolff 1985). Mating systems are strongly
interwoven with density and territoriality, as a decreased
Electronic supplementary material The online version of thisarticle (doi:10.1007/s10144-013-0393-2) contains supplementarymaterial, which is available to authorized users.
B. Borremans (&) � N. K. Hughes � J. Reijniers � V. Sluydts �H. Leirs
Evolutionary Ecology Group, University of Antwerp,
Groenenborgerlaan 171, 2020 Antwerpen, Belgium
e-mail: [email protected]
V. Sluydts
Unit of Medical Entomology, Institute of Tropical Medicine,
Nationalestraat 155, 2000 Antwerpen, Belgium
A. A. S. Katakweba � L. S. Mulungu � C. A. Sabuni �R. H. Makundi
Pest Management Center, Sokoine University of Agriculture,
Chuo Kikuu, PO BOX 3110, Morogoro, Tanzania
H. Leirs
Danish Pest Infestation Laboratory, University of Aarhus,
Forsøgsvej 1, 4200 Slagelse, Denmark
123
Popul Ecol
DOI 10.1007/s10144-013-0393-2
mate availability at low population densities is likely to
make monogamy and mate guarding more successful
(Kleiman 1977), whereas high abundances may facilitate
polygyny and/or polyandry, which are often assumed to
provide greater fitness benefits than monogamy (Gerlach
et al. 2012).
Examples of the role of resource availability can be
found in several small mammal groups. In Echimyid
rodents, for example, some species experience a patchy
distribution of resources, occur at low population densities,
exhibit territorial spacing and have a monogamous mating
system as predicted (Silva et al. 2008), while others that
occur in resource-rich environments experience higher
population densities, show little territoriality and have a
polygynous mating system (Guichon et al. 2003). Even
within species, changes in resource availability have the
potential to change spacing behaviour and mating system
(Fleming 1971; Lott 1991; Adler et al. 1997; Endries and
Adler 2005). Prairie voles (Microtus ochrogaster), for
instance, are more likely to form monogamous pair bonds
and exhibit low levels of inter-pair territory overlap when
population densities are low, as opposed to when densities
are higher (Getz and Hofmann 1986). The role of food in
shaping territoriality has also been shown experimentally:
territorial behaviour of the California vole (Microtus cali-
fornicus) has been shown to decline with decreased food
availability (Ostfeld 1986; Ims 1987; Ostfeld et al. 1988).
These effects of resource availability are not necessarily
the same for the two sexes however. It is often thought that,
while female distribution is strongly linked to resource
availability, the space use of males is strongly influenced
by that of females (the ‘‘Females in Space’’ hypothesis, see
Ostfeld 1990; Waterman 2007).
Population density is also intricately linked to territori-
ality. Because only a certain number of animal territories fit
into a given area, higher densities may result in larger
home range overlap when territoriality decreases (Warner
and Hoffman 1980; Dobson 1984; Wolff 1985). Alterna-
tively, territorial behaviour may be rigid and limit density
increases beyond certain points through density-dependent
dispersal or breeding suppression (Wolff 1997). When
species maintain strict territoriality, home range overlap
and inter-individual contacts are not expected to increase
with density, limiting possible fluctuations in population
size. In situations where territoriality is absent however,
large density fluctuations may be possible, and home range
overlap and individual contacts will increase with popula-
tion density.
Patterns of home range overlap are therefore useful for
studying territorial behaviour. Yet while there is a rea-
sonably large body of literature on home ranges of terri-
torial monogamous, polygynous and polyandrous species
(Blair 1941; Ostfeld 1986; Gaulin and Fitzgerald 1988;
Ostfeld and Heske 1993; Priotto et al. 2002; Schradin 2004;
Steinmann et al. 2008), there are few datasets long enough
to investigate home range patterns of a species in relation
to, separately, population density and season. In this paper,
we use a long-term capture-mark-recapture (CMR) study to
analyse the spatial patterns in the African multimammate
mouse Mastomys natalensis, a promiscuous murid that
exhibits strong seasonal and interannual fluctuations in
population density. This extensive dataset provides the
statistical power necessary to test specific hypotheses about
the effects of sex, breeding status, season and population
density on home range size and territoriality.
Mastomys natalensis is one of the most widespread
murid rodents in sub-Saharan Africa (Granjon et al. 2011).
Due to its generalist nature (Veenstra 1958; Coetzee 1975;
Leirs 1994) it occurs in a wide variety of habitats, but
thrives in agricultural fields where it can cause consider-
able crop damage (Fiedler 1988; Mwanjabe et al. 2002;
Sluydts et al. 2009; Leirs et al. 2010). Mastomys natalensis
has a promiscuous mating system, where multiple paternity
seems to be common (Veenstra 1958; Coetzee 1975; Isa-
acson 1975; Leirs 1994; Duplantier et al. 1996; Kennis
et al. 2008). A ‘‘scramble competition’’ strategy (where
males roam around to find as many receptive females as
possible) has been suggested for this species, based on the
highly asynchronous post-partum estrus of females during
the breeding season, the positive correlation between male
body weight and mating success, and the lack of evidence
for a harem structure (Leirs 1994; Jackson 1999; Schradin
and Pillay 2004; Kennis et al. 2008). In Tanzania, the
location of our study population, densities of multimam-
mate mice fluctuate strongly over years and seasons,
ranging from less than 30 animals/ha during the breeding
season to more than 300 ha-1 during the non-breeding
season in some years (Sluydts et al. 2007). Food avail-
ability, strongly linked to rainfall, is very predictable
throughout the year (Leirs 1994).
The role of M. natalensis as a significant agricultural
pest and a reservoir host of important zoonotic infections
such as plague and Lassa virus (Frame et al. 1970; Isaacson
1975; Wulff et al. 1977) has stimulated several home range
and movement studies on this species. Radiotelemetry
studies (Leirs et al. 1996; Hoffmann and Klingel 1998)
yielded high resolution data but, as with earlier CMR
studies (Christensen 1996; Leirs et al. 1996; Monadjem and
Perrin 1998), were limited by small sample sizes and
limited time frames, varying from a few weeks for the
telemetry studies to approximately 2 years for the CMR
studies. It has therefore not previously been possible to use
these data to reliably infer home range differences between
demographic categories (adult/subadult, male/female), or
to quantify effects of interannual fluctuations of population
density on spacing behaviour.
Popul Ecol
123
Using M. natalensis as a model species, the present
study tests several hypotheses about small mammal space
use. Because of the positive correlation between population
densities and availability of resources, we expect a nega-
tive correlation between density and home range size for
male and female subadults and female adults. The pre-
dictable and abundant availability of resources, coinciding
with high population densities that would make territory
defence less economical (Wolff 1985), would further result
in a non-clustered and non-territorial distribution of female
adults during the breeding season. A non-clustered distri-
bution of females, combined with the fact that estrus is
asynchronous during the breeding season, would suggest an
absence of territoriality in male animals if their space use is
indeed determined by both resources and female distribu-
tion (Ostfeld 1990; Waterman 2007). Additionally, if males
indeed use a scramble competition strategy (Kennis et al.
2008), they are expected to have larger home ranges than
females during the breeding season. The promiscuous
mating system, which may be a strategy to avoid infanti-
cide by males (Wolff and Macdonald 2004), is likely to
result in an absence of territorial behaviour of females
towards males and vice versa. Because this does not protect
against infanticide by other females, this may, contrary to
the first prediction above, be a reason for females to be
territorial towards each other during the breeding season.
Female breeding territoriality may also arise if females try
to limit access to food resources near their nest.
Materials and methods
Study area and trapping
Trapping was done in a 3-ha rectangular grid of 30 9 10
traps spaced 10 m apart on the campus of the Sokoine
University of Agriculture (Morogoro, Tanzania). The
trapping area is a mosaic environment consisting of patches
of woodland, maize field and fallow land. Between 15 Mar
1994 and 6 Jan 2011, rodents were live-trapped monthly
for three consecutive nights using Sherman LFA live traps
(Sherman Live Trap Co., Tallahassee, FL, USA), baited
with a mix of peanut butter and ground maize. All captured
rodents were weighed, sexed, and individually marked
using toe clipping, as at the time no other method was
available for permanently marking large numbers of indi-
viduals simultaneously. Reproductive status was deter-
mined following a standard protocol (see Leirs 1994 for
details). Mice were considered to be subadult until a sign of
sexual activity could be observed (scrotal testes in males;
perforated vagina, lactating nipples or pregnancy in
females), after which they were considered to be adult.
This trapping effort resulted in 36,425 separate captures of
15,471 unique individuals, captured during 212,700 trap
nights. Mastomys natalensis is an opportunistic omnivore,
and can rapidly adapt to changes in resource availability,
which are positively linked to rainfall (Leirs 1994). The
rainy season is bimodal, starting in October and peaking
around December (vuli-rains) and then again more strongly
around March–April (masika-rains), followed by a dry
season from around June until September–October (Leirs
1994).
Density estimation
The abundance of the rodent population during each
3-night trapping session (during which the population was
assumed to be closed) was estimated using the commonly
used heterogeneity estimator M(h) in the program CAP-
TURE (White et al. 1982). The M(h) estimator allows for
variability in individual capture probabilities and appears
to be quite robust (Parmenter et al. 2003). This estimator
has been widely used to evaluate M. natalensis densities
from field data originating from the same trapping grid
(Leirs et al. 1997; Sluydts et al. 2007, 2009) and thus
permits straightforward comparison with previous studies.
As can be seen in these studies, population densities fluc-
tuate strongly, both seasonally as well as inter-annually,
with estimates ranging from less than 10 ha-1 to more than
300 ha-1, and are strongly correlated with rainfall (Leirs
et al. 1997; Sluydts et al. 2007). During the reproductive
season (April–September), numbers of animals increase
from minimal to high densities due to the recruitment of
juvenile animals (Leirs et al. 1993, 1994). This increase
continues into the first months following the reproductive
season, after which numbers start to decline until they
again reach a minimum in June–July the year after. The sex
ratio is approximately equal outside the breeding season,
but becomes female-biased during the breeding season
(Leirs 1994).
Home range size and overlap
Home range is defined here as the area bounded by the
locations at which an individual was trapped, and is
assumed to be a proxy for the space used by the animal
during its ‘‘normal’’ day-to-day activities like foraging,
mating and litter care (Burt 1943). Because of the limited
number of locations per individual, and for easy compari-
son with other studies, home ranges were estimated using
the minimum convex polygon (MCP) method with an
inclusive boundary strip of 5 m (half the distance between
traps; Stickel 1954). Only animals that were trapped in at
least 2 different months were used for home range esti-
mations, as we assumed these animals to be resident.
Previous studies have shown that applying the MCP
Popul Ecol
123
method to CMR trapping data underestimates M. natalensis
home ranges compared to those based on radio-tracking
data (Leirs et al. 1996), however as we are primarily
interested in relative differences in home range size and
overlap, this is no issue for this study. Because the average
dispersal distance for M. natalensis (300 m) is larger than
the size of the trapping grid, the risk of overestimating
home range sizes due to inclusion of dispersal events is
negligible (Leirs et al. 1996).
We investigated the effects of breeding status (adult vs.
subadult) and season (breeding vs. non-breeding) on home
range size and overlap. Because a sufficient number of
recaptures is needed to allow polygon estimation, the home
ranges need to be estimated over a sufficiently long period
within each category. For this reason, it was not possible to
investigate the effects of breeding status and season in the
same model. Furthermore, as home range estimates were
based on data from multiple months, it was not possible to
use density estimates from a single month as model inputs.
Thus, for each individual in each category, the population
density for the model was calculated as the average density
across all months that an individual remained in a category.
To assess if and how home ranges falling partly outside
the grid affected estimates of home range size and overlap,
we sequentially removed those animals whose polygon
centroid fell within bands of increasing width from the edge
of the trapping grid; the mean home range of each demo-
graphic group was recalculated after each removal. The first
band was 0 m (no removal), and the following distances
were increments of 2 m up to 48 m. For example, a 6 m band
removal meant that all animals whose polygon centroid fell
within 6 m of the edge were removed, and the mean polygon
size of the remaining animals was re-calculated. For each
group, the average polygon sizes were plotted against the
distance from the edge. There was a positive correlation
between band size and polygon size, which started to level
off at 12 m and only slightly increased beyond this distance
due to an increasing proportion of large home ranges [Fig. S1
in Electronic Supplementary Material (ESM)]. Therefore,
only animals whose polygon centroid was located further
than 12 m from the edge were chosen for home range esti-
mation. This distance approximates the radius of an average
home range (about 500 m2; Leirs et al. 1996), and removing
an edge strip equal to the average home range radius is
indeed a frequently used and straightforward approach for
minimizing edge effects (Dice 1938; Stickel 1954).
The percentage of the home range area that overlapped
with other animals was calculated between demographic
groups (female/male, subadult/adult and combinations), for
all animals whose lifetime overlapped. This home range
overlap percentage was calculated for the animals that were
retained after controlling for edge effects, but for all these
animals the overlap with all resident animals was
calculated, including those that had their polygon centroid
within 12 m of the trapping grid edge.
As home ranges are calculated using resident animals
only, the effect of transient animals on home range overlap
could not be assessed. For this reason a daily visitation rate
was calculated by counting the total number of animal
visits to a home range during the residing period (the
period between the first and last capture) of the animal of
interest, divided by the length of the residing period in
days. All animals were used when calculating this visita-
tion rate, thereby including transient animals that were
trapped during only one trapping session.
To test whether the observed overlap patterns were true
biological patterns (i.e., did not arise by chance from the
available combination of home range shapes, numbers and
sizes), a permutation test was used, where 100 new gener-
ated datasets were compared to the original dataset. For each
new dataset, polygons were randomly moved to a different
location in the 3-ha grid, keeping the same orientation and
shape, after which overlaps were again calculated. The
statistical difference in overlap between the original dataset
and a relocated dataset was tested using a one-sided t test,
testing the null hypothesis that the mean overlap percentage
of the original dataset is not smaller than that of the simu-
lated dataset, which would indicate an absence of territori-
ality. A one-sided t test was chosen because while the
randomly relocated home ranges are able to occupy the
entire 3-ha grid, in reality the space that is actually used will
be smaller due to habitat heterogeneity. As a consequence,
the average overlap values of the randomly moved home
ranges are expected to be smaller than those of the real home
ranges. Although using a one-sided t test excludes the pos-
sibility of testing whether the actual home range overlap is
significantly larger than that of randomly relocated home
ranges due to higher levels of social clustering than expec-
ted, it was chosen because we explicitly want to test for the
existence of territorial behaviour, and because it would be
impossible to discern between the effects of social clustering
and habitat heterogeneity. The proportion of non-significant
differences was used as the probability of the null hypothesis
stating that home range overlap in the original dataset is not
significantly smaller than the home range overlap in relo-
cated datasets. A similar method was used to assess the
likelihood of obtaining the visitation rates observed in the
trapping data. This was done by randomly moving each trap
location in the dataset to another place in the grid, and
recalculating the visitation rates. This procedure was also
repeated 100 times.
Home range size and overlap were analysed using
likelihood ratio tests of linear models with breeding status,
sex and density as fixed effects and year and individual as
random effects. There was a positive correlation between
the number of recaptures and the home range size. To
Popul Ecol
123
account for this correlation, the number of recaptures was
included in each model as an independent variable. Home
range visitation rate was analysed using likelihood ratio
tests of generalized linear models with Poisson link func-
tion. Data manipulation, analyses, statistical testing and
plotting was done using ‘‘R 2.14.1’’ (R Development Core
Team 2012) using packages adehabitatHR (Calenge 2006),
gpclib (Peng and Murta 2012), maptools (Lewin-Koh and
Bivand 2012), lme4 (Bates et al. 2012), Matrix (Bates and
Maechler 2012). Error margins of means always denote
standard errors. Statistical significance was assumed for
P values below 0.05.
Results
Home range size: effects of breeding status
Females and males had similar mean home range sizes over
their entire lifetime (645 ± 16 and 652 ± 16 m2, respec-
tively; v2 = 2.41, df = 1, P = 0.121). Mean home range
sizes of adults and subadults differed significantly
(v2 = 12.3, df = 1, P \ 0.001), with sizes of 636 ± 23
and 546 ± 11 m2, respectively. Note here that, due to the
positive correlation between number of recaptures and
home range size, the home range sizes estimated over the
entire lifetime of an individual are on average slightly
larger than those estimated over a period defined by a
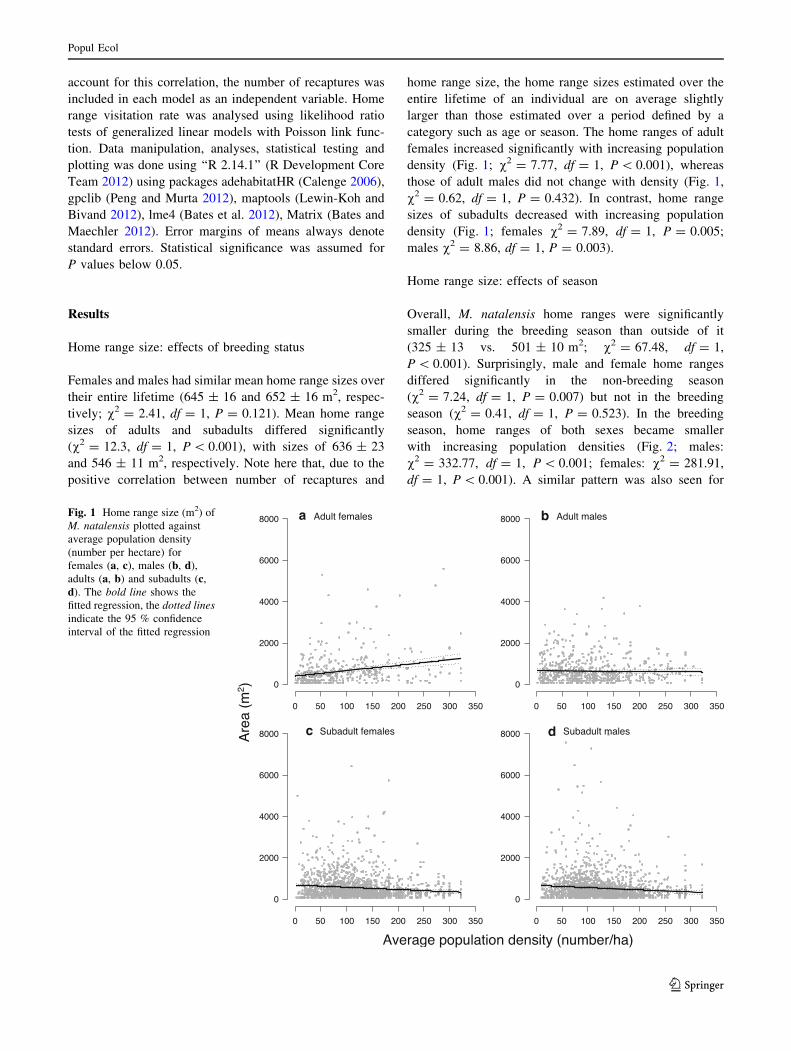
category such as age or season. The home ranges of adult
females increased significantly with increasing population
density (Fig. 1; v2 = 7.77, df = 1, P \ 0.001), whereas
those of adult males did not change with density (Fig. 1,
v2 = 0.62, df = 1, P = 0.432). In contrast, home range
sizes of subadults decreased with increasing population
density (Fig. 1; females v2 = 7.89, df = 1, P = 0.005;
males v2 = 8.86, df = 1, P = 0.003).
Home range size: effects of season
Overall, M. natalensis home ranges were significantly
smaller during the breeding season than outside of it
(325 ± 13 vs. 501 ± 10 m2; v2 = 67.48, df = 1,
P \ 0.001). Surprisingly, male and female home ranges
differed significantly in the non-breeding season
(v2 = 7.24, df = 1, P = 0.007) but not in the breeding
season (v2 = 0.41, df = 1, P = 0.523). In the breeding
season, home ranges of both sexes became smaller
with increasing population densities (Fig. 2; males:
v2 = 332.77, df = 1, P \ 0.001; females: v2 = 281.91,
df = 1, P \ 0.001). A similar pattern was also seen for
a b
c d
Fig. 1 Home range size (m2) of
M. natalensis plotted against
average population density
(number per hectare) for
females (a, c), males (b, d),
adults (a, b) and subadults (c,
d). The bold line shows the
fitted regression, the dotted lines
indicate the 95 % confidence
interval of the fitted regression
Popul Ecol
123
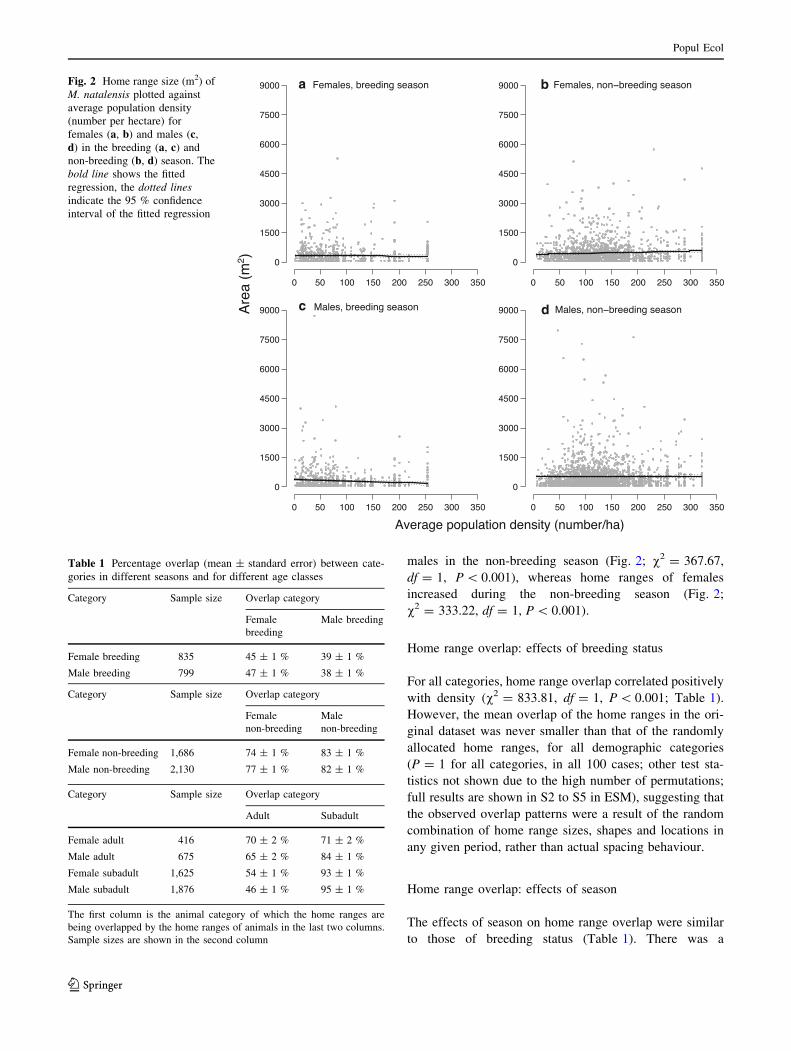
males in the non-breeding season (Fig. 2; v2 = 367.67,
df = 1, P \ 0.001), whereas home ranges of females
increased during the non-breeding season (Fig. 2;
v2 = 333.22, df = 1, P \ 0.001).
Home range overlap: effects of breeding status
For all categories, home range overlap correlated positively
with density (v2 = 833.81, df = 1, P \ 0.001; Table 1).
However, the mean overlap of the home ranges in the ori-
ginal dataset was never smaller than that of the randomly
allocated home ranges, for all demographic categories
(P = 1 for all categories, in all 100 cases; other test sta-
tistics not shown due to the high number of permutations;
full results are shown in S2 to S5 in ESM), suggesting that
the observed overlap patterns were a result of the random
combination of home range sizes, shapes and locations in
any given period, rather than actual spacing behaviour.
Home range overlap: effects of season
The effects of season on home range overlap were similar
to those of breeding status (Table 1). There was a
a b
c d
Fig. 2 Home range size (m2) of
M. natalensis plotted against
average population density
(number per hectare) for
females (a, b) and males (c,
d) in the breeding (a, c) and
non-breeding (b, d) season. The
bold line shows the fitted
regression, the dotted lines
indicate the 95 % confidence
interval of the fitted regression
Table 1 Percentage overlap (mean ± standard error) between cate-
gories in different seasons and for different age classes
Category Sample size Overlap category
Female
breeding
Male breeding
Female breeding 835 45 ± 1 % 39 ± 1 %
Male breeding 799 47 ± 1 % 38 ± 1 %
Category Sample size Overlap category
Female
non-breeding
Male
non-breeding
Female non-breeding 1,686 74 ± 1 % 83 ± 1 %
Male non-breeding 2,130 77 ± 1 % 82 ± 1 %
Category Sample size Overlap category
Adult Subadult
Female adult 416 70 ± 2 % 71 ± 2 %
Male adult 675 65 ± 2 % 84 ± 1 %
Female subadult 1,625 54 ± 1 % 93 ± 1 %
Male subadult 1,876 46 ± 1 % 95 ± 1 %
The first column is the animal category of which the home ranges are
being overlapped by the home ranges of animals in the last two columns.
Sample sizes are shown in the second column
Popul Ecol
123
significant positive correlation between overlap and popu-
lation density (v2 = 84.57, df = 1, P \ 0.001). Again the
overlap means of the original dataset were never smaller
than those of the relocated simulation dataset (P = 1 for all
categories, in all 100 cases; full results are shown in S6 and
S7 in ESM).
Home range visitation rate
Visitation rate patterns did not seem to differ between dif-
ferent demographic categories (visits to home ranges of
adults/subadults/males/females), and therefore seemed to
be completely determined by the relative proportion of
visitor categories (results are shown in S8 to S10 in ESM).
As was the case for home range overlap, there was a sig-
nificant positive correlation between visitation rate and
population density (v2 = 134.51, df = 1, P \ 0.001), and
between visitation rate and home range size (v2 = 106.04,
df = 1, P \ 0.001). Visitation rates derived from the ori-
ginal data never differed significantly from simulated data
(P = 1 for all categories, in all 100 cases), indicating that
patterns of home range visitations were largely determined
by the relative abundance of different population categories.
Discussion
We hypothesized that the high temporal predictability of
abundant resources (Leirs et al. 1989; Leirs 1994), and high
population densities throughout a large part of the year
(Sluydts et al. 2009) would result in low levels of territo-
riality in females, as well as a non-clustered distribution of
their home ranges. This, in combination with the high
levels of promiscuity (Kennis et al. 2008), in turn predicted
a low likelihood of territorial behaviour by males towards
females or other males. Our data not only supported these
predictions, but in fact showed that the overlap and visi-
tation patterns were very similar to those generated by a
simulated random positioning of home ranges, which
suggests a complete lack of territoriality. We further
observed a strong positive correlation between home range
overlap and population density, providing additional sup-
port for a lack of territoriality. Although similar patterns
can be seen in other species (Blair 1941; Fleming 1971;
Dewsbury 2006), such a strong absence of territoriality is
rare, and is perhaps relevant to the fact that this rodent
species is prone to strong population outbreaks that can
cause serious agricultural damage (Leirs et al. 2010).
Based on the suggestion that male multimammate mice
use a ‘scramble competition’ mating strategy (Kennis et al.
2008), we expected to see a larger home range size of males
during the breeding season than during the non-breeding
season. Contrary to expectations however, we observed
equivalent male and female home range sizes during the
breeding season, and no larger male home range size when
compared to those in the non-breeding season. Kennis et al.
(2008) found a positive correlation between body weight
and the number of offspring, as well as a strong heteroge-
neity in reproductive success where a large proportion of
males have low numbers of offspring. The patterns we
observe may therefore indicate that M. natalensis males
stay within their ‘‘normal’’ home range and use a domi-
nance hierarchy rather than a true scramble competition
mating strategy, or a combination of the two. This is not
unlikely, as dominance hierarchies are commonly seen in
high-density populations for several other species (Davis
1958; Wolff 1989), and this is hypothesized to be more
economical when territorial defence becomes too costly
(Waterman 2007).
Home range sizes of subadults decreased slightly with
increasing population density. It is unlikely that this pattern
stems from territorial behaviour, as home range overlap
increased with density. One possible explanation for this
could be that higher population densities are associated
with increased predation pressure, which has been shown
by Mohr et al. (2003) to result in reduced activity of M.
natalensis and therefore smaller home ranges. This expla-
nation is further supported by the observed negative cor-
relation between survival and population density (Leirs
et al. 1997). Another possible explanation involves
resource availability: if a high availability of resources in
the breeding season would result in high population den-
sities, then it is possible that this increased availability
results in smaller home ranges, but only if there is a
positive correlation between resource availability in the
breeding season and the availability later in the year during
the high density period. A food supplementation experi-
ment also suggested an inverse correlation between M.
natalensis home range size and resource availability (Mo-
nadjem and Perrin 1998), while Leirs et al. (1990, 1997)
showed a clear, positive correlation between rainfall and
reproductive rates, presumably through increased resource
availability.
Adult females showed no signs of territorial behaviour
towards males or other females. Thus, while protection
against infanticide may be one of the general drivers of
promiscuity (Wolff and Macdonald 2004), our results
suggest that infanticide in this species is not strong enough
to induce territoriality. Adult females also exhibited a
strong increase in mean home range size with density.
Although the reason for this is unclear, it is possibly related
to the relationship between population density and season.
Densities are lower during the breeding season, and it is
possible that the smaller than average home ranges of adult
females at low densities are related to the need to stay close
to their burrow to feed pups or to protect them against
Popul Ecol
123
infanticide (Ebensperger and Blumstein 2007). The larger
home ranges in higher densities might then be attributed to
a compensation period during which adult females need
more food to compensate for lost reserves during pup
feeding, or perhaps the larger home range estimates are a
by-product of the relocation of the burrow nearer the end of
the breeding season when densities become higher, a
behaviour that has been observed for M. natalensis (B.
Borremans, personal observation in a breeding colony) and
other rodent species in captivity but not yet in field con-
ditions (Brewster and Leon 1980).
Although a large body of support exists for many aspects
of the theoretical interactions between resource availability,
social spacing, population density and mating system, there
are few datasets available through which it is possible to
study the effects of density, season, reproductive status and
sex on home range size and territoriality. By using a long-
term CMR dataset we were able to study these aspects and
provide substantial support for the expected influence of
population density on home range patterns. Because of the
role of M. natalensis as a reservoir host and vector for
several important infections (Lassa virus, Mopeia virus,
Yersinia pestis; Frame et al. 1970; Isaacson 1975; Wulff
et al. 1977), our study also has implications for the study of
the transmission of infections. Both home range overlap and
visitation rates suggest that population-scale contact pat-
terns are random and determined by the relative abundance
of different demographic categories in the population. This
indicates that the ‘‘random mixing’’ assumption that is often
used in theoretical models of disease transmission but rarely
true in wildlife populations may in fact be applicable to
M. natalensis (Anderson and May 1979; McCallum et al.
2001), which makes it uniquely suitable as an epidemio-
logical model system, especially for studying the role of
density in directly transmitted infections (Lloyd-Smith et al.
2005; Borremans et al. 2011; Goyens et al. 2013).
Acknowledgments We are grateful to the Sokoine University of
Agriculture (Morogoro, Tanzania), and in particular the excellent
technical staff at the Pest Management Center. Thanks to two anon-
ymous reviewers whose suggestions improved the manuscript.
Funding was provided over the many years by several projects under
the European Union Framework Programmes, the Flemish University
Development Cooperation (VLIR-UOS), Danish International
Development Agency (DANIDA) and the University of Antwerp.
This work was supported by Deutsche Forschungsgemeinschaft Focus
Program 1596. Borremans B is currently a research fellow of
Research Foundation Flanders (FWO).
References
Adler GH (2011) Spacing patterns and social mating systems of
echimyid rodents. J Mammal 92:31–38
Adler G, Endries M, Piotter S (1997) Spacing patterns within
populations of a tropical forest rodent, Proechimys semispinosus,
on five Panamanian islands. J Zool 241:43–53
Anderson R, May R (1979) Population biology of infectious diseases:
part I. Nature 280:361–367
Bates D, Maechler M (2012) Matrix: sparse and dens matrix classes
and methods. R package version 1.0-9. http://Matrix.R-forge.R-
project.org/
Bates D, Maechler M, Bolker B (2012) lme4: Linear mixed-effects
models using S4 classes. R package version 0.999999-0. http://
CRAN.R-project.org/package=lme4
Blair WF (1941) Some data on the home ranges and general life
history of the short-tailed shrew, red-backed vole, and woodland
jumping mouse in Northern Michigan. Am Midl Nat 25:681–685
Borremans B, Leirs H, Gryseels S, Gunther S, Makundi R, De
Bellocq JG (2011) Presence of Mopeia virus, an African
arenavirus, related to biotope and individual rodent host
characteristics: implications for virus transmission. Vector Borne
Zoonotic Dis 11:1125–1131
Brewster J, Leon M (1980) Relocation of the site of mother–young
contact: maternal transport behavior in Norway rats. J Comp
Physiol Psych 94:69–79
Burt WH (1943) Territoriality and home range concepts as applied to
mammals. J Mammal 24:346–352
Calenge C (2006) The package adehabitat for the R software: a tool
for the analysis of space and habitat use by animals. Ecol Model
197:516–519
Christensen JT (1996) Home range and abundance of Mastomys
natalensis (Smith, 1834) in habitats affected by cultivation. Afr J
Ecol 34:298–311
Coetzee CG (1975) The biology, behaviour, and ecology of Mastomys
natalensis in southern Africa. Bull World Health Organ
52:637–644
Davis D (1958) The role of density in aggressive behaviour of house
mice. Anim Behav 1:207–210
Dewsbury D (2006) A comparative study of rodent social behavior in
a seminatural enclosure. Aggress Behav 9:207–215
Dice LR (1938) Some census methods for mammals. J Wildl Manage
2:119–130
Dobson FS (1984) Environmental influences on sciurid mating
systems. In: Murie JO, Michener GR (eds) The biology of
ground-dwelling squirrels. University of Nebraska Press, Lin-
coln, pp 229–249
Duplantier JMM, Granjon L, Bouganaly H (1996) Reproductive
characteristics of three sympatric species of Mastomys in
Senegal, as observed in the field and in captivity. Mammalia
60:629–638
Ebensperger LA, Blumstein DT (2007) Nonparental infanticide. In:
Wolff JO, Sherman PW (eds) Rodent societies: an ecological &
evolutionary perspective, 1st edn. The University of Chicago
Press, Chicago and London, pp 267–279
Endries MJ, Adler GH (2005) Spacing patterns of a tropical forest
rodent, the spiny rat (Proechimys semispinosus), in Panama.
J Zool 265:147–155
Fiedler L (1988) Rodent problems in Africa. In: Prakash I (ed) Rodent
pest management. CRC Press, Boca Raton, pp 35–65
Fleming TH (1971) Population ecology of three species of Neotrop-
ical rodents. Miscellaneous publications of the Museum of
Zoology, University of Michigan 143:1–77
Frame JD, Baldwin JM, Gocke DJ, Troup JM (1970) Lassa fever, a
new virus disease of man from West Africa. 1. Clinical
description and pathological findings. Am J Trop Med Hyg
19:670–676
Gaulin SJC, Fitzgerald RW (1988) Home-range size as a predictor of
mating systems in Microtus. J Mammal 69:311–319
Popul Ecol
123
Gerlach NM, McGlothlin JW, Parker PG, Ketterson ED (2012)
Promiscuous mating produces offspring with higher lifetime
fitness. Proc R Soc B 279:860–866
Getz LL, Hofmann JE (1986) Social organization in free-living prairie
voles, Microtus ochrogaster. Behav Ecol Sociobiol 18:275–282
Goyens J, Reijniers J, Borremans B, Leirs H (2013) Density
thresholds for Mopeia virus invasion and persistence in its host
Mastomys natalensis. J Theor Biol 317:55–61
Granjon L, Lavrenchenko L, Corti M, Coetzee N, Abdel Rahman E
(2011) Mastomys natalensis. In: IUCN 2011. IUCN Red List of
Threatened Species. Version 2011-1. http://www.iucnredlist.org.
Downloaded on 4 November 2011
Guichon ML, Borgnia M, Righi CF, Cassini GH, Cassini MH (2003)
Social behavior and group formation in the coypu (Mycocastor
coypus) in the Argentinean pampas. J Mammal 84:254–262
Hoffmann A, Klingel H (1998) Spatial and temporal patterns in
Mastomys cf. natalensis (Smith, 1834) as revealed by radio-
tracking. In: Denys C, Granjon L, Poulet A (eds) African small
mammals. IRD Editions, Paris, pp 459–468
Ims RA (1987) Responses in spatial organization and behaviour to
manipulations of the food resource in the vole Clethrionomys
rufocanus. J Anim Ecol 56:585
Isaacson M (1975) The ecology of Praomys (Mastomys) natalensis in
southern Africa. Bull World Health Organ 52:629–636
Jackson T (1999) The social organization and breeding system of
Brants’ whistling rat (Parotomys brantsii). J Zool 247:323–331
Kennis J, Sluydts V, Leirs H, Van Hooft WFP (2008) Polyandry and
polygyny in an African rodent pest species, Mastomys natalen-
sis. Mammalia 72:150–160
Kleiman D (1977) Monogamy in mammals. Q Rev Biol 52:39–69
Leirs H, Verheyen W, Michiels M, Verhagen R, Stuyck J (1989) The
relation between rainfall and the breeding season of Mastomys
natalensis (Smith, 1834) in Morogoro, Tanzania. Ann Soc Roy
Zool Bel 119:59–64
Leirs H, Stuyck J, Verhagen R, Verheyen W (1990) Seasonal
variation in growth of Mastomys natalensis (Rodentia: Muridae)
in Morogoro, Tanzania. Afr J Ecol 28:298–306
Leirs H, Verhagen R, Verheyen W (1993) Productivity of different
generations in a population of Mastomys natalensis rats in
Tanzania. Oikos 68:53–60
Leirs H (1994) Population ecology of Mastomys natalensis (Smith,
1834). Implications for rodent control in Africa. Belgian
Administration for Development Cooperation, Agricultural Ed.
Nr3, Brussels
Leirs H, Verhagen R, Verheyen W (1994) The basis of reproductive
seasonality in Mastomys rats (Rodentia: Muridae) in Tanzania.
J Trop Ecol 10:55–66
Leirs H, Verheyen W, Verhagen R (1996) Spatial patterns in
Mastomys natalensis in Tanzania (Rodentia, Muridae). Mam-
malia 60:545–556
Leirs H, Stenseth NC, Nichols JD, Hines JE, Verhagen R, Verheyen
W (1997) Stochastic seasonality and nonlinear density-depen-
dent factors regulate population size in an African rodent. Nature
389:176–180
Leirs H, Sluydts V, Makundi R (2010) Rodent outbreaks in sub-
Saharan Africa. In: Singleton GR (ed) Rodent outbreaks:
ecology and impacts. International Rice Research Institute, Los
Banos, pp 269–280
Lewin-Koh NJ, Bivand R (2012) Maptools: Tools for reading and
handling spatial objects. R package version 0.8-18. http://CRAN.
R-project.org/package=maptools
Lloyd-Smith JO, Cross PC, Briggs CJ, Daugherty M, Getz WM, Latto
J, Sanchez MS, Smith AB, Swei A (2005) Should we expect
population thresholds for wildlife disease? Trends Ecol Evol
20:511–519
Lott D (1991) Intraspecific variation in the social systems of wild
vertebrates. Cambridge University Press, Cambridge
McCallum H, Barlow N, Hone J (2001) How should pathogen
transmission be modelled? Trends Ecol Evol 16:295–300
Mohr K, Vibe-Petersen S, Lau Jeppesen L, Bildsoe M, Leirs H (2003)
Foraging of multimammate mice, Mastomys natalensis, under
different predation pressure: cover, patch-dependent decisions
and density-dependent GUDs. Oikos 100:459–468
Monadjem A, Perrin M (1998) The effect of supplementary food on
the home range of the multimammate mouse Mastomys natal-
ensis. S Afr J Wildl Res 28:1–3
Mwanjabe PS, Sirima FB, Lusingu J (2002) Crop losses due to
outbreaks of Mastomys natalensis (Smith, 1834) Muridae,
Rodentia, in the Lindi Region of Tanzania. Int Biodeter Biodegr
49:133–137
Ostfeld RS (1985) Limiting resources and territoriality in microtine
rodents. Am Nat 126:1–15
Ostfeld R (1986) Territoriality and mating system of California voles.
J Anim Ecol 55:691–706
Ostfeld RS (1990) The ecology of territoriality in small mammals.
Trends Ecol Evol 5:411–415
Ostfeld RS, Heske EJ (1993) Sexual dimorphism and mating systems
in voles. J Mammal 74:230–233
Ostfeld R, Pugh S, Seamon J (1988) Space use and reproductive
success in a population of meadow voles. J Anim Ecol
57:385–394
Parmenter RR, Yates TL, Anderson DR, Burnham KP, Dunnum JL,
Franklin AB, Friggens MT, Lubow BC, Miller M, Olson GS et al
(2003) Others, Small-mammal density estimation: a field
comparison of grid-based vs. web-based density estimators.
Ecol Monogr 73:1–26
Peng RD, Murta A (2012) gpclib: General polygon clipping library
for R. R package version 1.5-3. http://CRAN.R-project.org/
package=gpclib
Priotto J, Steinmann A, Polop J (2002) Factors affecting home range
size and overlap in Calomys venustus (Muridae: Sigmodontinae)
in Argentine agroecosystems. Mamm Biol 67:97–104
R Development Core Team (2012) R: A language and environment
for statistical computing
Schradin C (2004) Territorial defense in a group-living solitary
forager: who, where, against whom? Behav Ecol Sociobiol
55:439–446
Schradin C, Pillay N (2004) The influence of the father on offspring
development in the striped mouse. Behav Ecol 16:450–455
Silva RB, Vieira EM, Izar P (2008) Social monogamy and biparental
care of the neotropical southern bamboo rat (Kannabateomys
amblyonyx). J Mammal 89:1464–1472
Sluydts V, Crespin L, Davis SA, Lima M, Leirs H (2007) Survival
and maturation rates of the African rodent, Mastomys natalensis:
density-dependence and rainfall. Integr Zool 2:220–232
Sluydts V, Davis S, Mercelis S, Leirs H (2009) Comparison of
multimammate mouse (Mastomys natalensis) demography in
monoculture and mosaic agricultural habitat: Implications for
pest management. Crop Prot 28:647–654
Steinmann AR, Priotto JW, Polop JJ (2008) Territorial behaviour in
corn mice, Calomys musculinus (Muridae: Sigmodontinae), with
regard to mating system. J Ethol 27:51–58
Stickel LF (1954) A comparison of certain methods of measuring
ranges of small mammals. J Mammal 35:1–15
Veenstra AJF (1958) The behaviour of the multimammate mouse,
Rattus (Mastomys) natalensis (A. Smith). Anim Behav
6:195–206
Warner RR, Hoffman SG (1980) Population density and the
economics of territorial defense in a coral reef fish. Ecology
61:772–780
Popul Ecol
123

Waterman J (2007) Male mating strategies in rodents. In: Wolff JO,
Sherman PW (eds) Rodent societies: an ecological & evolution-
ary perspective. The University of Chicago Press, Chicago and
London, pp 27–41
White GC, Anderson DR, Burnham KP, Otis DL (1982) Capture-
recapture and removal methods for sampling closed populations.
Los Alamos National Laboratory, Los Alamos
Wolff JO (1985) The effects of density, food, and interspecific
interference on home range size in Peromyscus leucopus and
Peromyscus maniculatus. Can J Zool 63:2657–2662
Wolff JO (1989) Social behavior. In: Kirkland GL, Layne JN (eds)
Advances in the study of Peromyscus (Rodentia). Texas Tech
University Press, Lubbock, pp 271–291
Wolff J (1997) Population regulation in mammals: an evolutionary
perspective. J Anim Ecol 66:1–13
Wolff JO, Macdonald DW (2004) Promiscuous females protect their
offspring. Trends Ecol Evol 19:127–134
Wulff H, McIntosh BM, Hamner DB, Johnson KM (1977) Isolation of an
arenavirus closely related to Lassa virus from Mastomys natalensis
in south-east Africa. Bull World Health Organ 55:441–444
Popul Ecol
123