Designing of promiscuous inhibitors against pancreatic cancer cell lines
9
Designing of promiscuous inhibitors against pancreatic cancer cell lines Rahul Kumar 1 *, Kumardeep Chaudhary 1 *, Deepak Singla 1,2 {, Ankur Gautam 1 & Gajendra P. S. Raghava 1 1 Bioinformatics Centre, CSIR-Institute of Microbial Technology, Chandigarh-160036, India, 2 Centre for Microbial Biotechnology, Panjab University, Chandigarh-160014. Pancreatic cancer remains the most devastating disease with worst prognosis. There is a pressing need to accelerate the drug discovery process to identify new effective drug candidates against pancreatic cancer. We have developed QSAR models for predicting promiscuous inhibitors using the pharmacological data. Our models achieved maximum Pearson correlation coefficient of 0.86, when evaluated on 10-fold cross-validation. Our models have also successfully validated the drug-to-oncogene relationship and further we used these models to screen FDA approved drugs and tested them in vitro. We have integrated these models in a webserver named as DiPCell, which will be useful for screening and designing novel promiscuous drug molecules. We have also identified the most and least effective drugs for pancreatic cancer cell lines. On the other side, we have identified resistant pancreatic cancer cell lines, which need investigative scanner on them to put light on resistant mechanism in pancreatic cancer. P ancreatic cancer (PCa) remains the fourth leading cause of cancer-related deaths 1 , and it is one of the most lethal malignant tumors. An overall 5-year survival rate of less than 6% and 45,220 new cases were reported in United States alone 1 . The mortality rate of PCa is almost equal to the incidence rate, which demonstrates the aggressiveness and lethal nature of this disease. The contributing factors for this high mortality rate are lack of screening tests for early diagnosis and development of drug resistance in tumor cells 2–5 . Over the years, consid- erable progress has been made in the fight with this disease, and few drugs have been developed to treat this deadly disease. Although gemcitabine is the standard drug of choice 6–10 ; fluorouracil, leucovorin and irinotecan are also used as combination chemotherapy, but existing anti-cancer drugs or therapies are unable to save lives of patients suffering form PCa. One of the major reasons for the inefficiency of existing anti-cancer drugs is acquired drug resistance that is developed due to genetic alterations in various drug targets 11–13 . There is an urgent need to improve pancreatic cancer drug arsenal to combat drug resistance problem and for effective treatment. High- throughput screening of therapeutic molecules from a large pool of chemical compounds is the most suitable way to identify novel anti-cancer molecules. However, it is time and labor consuming effort. In silico methods, which can predict novel inhibitors against pancreatic cancer, will be an attractive alternative approach. Recently, considerable attention has been paid towards pancreatic cancer drug discovery. In this context, Garnett et. al. have screened 132 anti-cancer drugs on 714 cancer cell lines 14 and reported 78070 logIC 50 values for different drug and cell line combinations. In another study, Rechard et. al. have demonstrated that cancer cell lines share the same features (i.e. copy number variation, expression abnormality) as the primary tumors 15 . In 2012, Barretina et. al. clearly demonstrated the correlation between genomic status of primary tumors and cancer cell lines of different lineages 16 . These studies support the extrapolation of cell line studies to primary tumors and further to clinics. Keeping all these facts into consideration, in the present study, we have developed quantitative structure activity relationship (QSAR) models to predict promiscuous inhibitors against 16 pancreatic cancer cell lines. The pharmacological screening data generated in Genomics of Drug Sensitivity in Cancer (one of the projects in COSMIC) was used to develop models 14 . QSAR modeling using high-throughput screening data is a powerful technique, which enables the construction of predictive models. These models can be utilized for the in silico screening of libraries of billions of diverse molecules prior to their experimental validation. Here, we have not considered the biological targets of drugs and just tried to demonstrate the potential of chemical descriptors and QSAR to predict anti-cancer activity of unknown molecules. Our QSAR models will complement the pancreatic cancer research by helping in identification of novel inhibitors against pancreatic cancer cell lines. For the advancement of the scientific community, we have integrated these models on a webserver, DiPCell, which is freely accessible at http://crdd.osdd.net/raghava/dipcell/. OPEN SUBJECT AREAS: DRUG DEVELOPMENT VIRTUAL SCREENING DATA PROCESSING COMPUTATIONAL MODELS Received 22 January 2014 Accepted 17 March 2014 Published 14 April 2014 Correspondence and requests for materials should be addressed to G.P.S.R. (raghava@ imtech.res.in) * These authors contributed equally to this work. { Current Address: National Institute of Pathology, Safdarjang Hospital Complex, New Delhi-110029. SCIENTIFIC REPORTS | 4 : 4668 | DOI: 10.1038/srep04668 1
-
Upload
independent -
Category
Documents
-
view
1 -
download
0
Transcript of Designing of promiscuous inhibitors against pancreatic cancer cell lines
Designing of promiscuous inhibitorsagainst pancreatic cancer cell linesRahul Kumar1*, Kumardeep Chaudhary1*, Deepak Singla1,2{, Ankur Gautam1 & Gajendra P. S. Raghava1
1Bioinformatics Centre, CSIR-Institute of Microbial Technology, Chandigarh-160036, India, 2Centre for Microbial Biotechnology,Panjab University, Chandigarh-160014.
Pancreatic cancer remains the most devastating disease with worst prognosis. There is a pressing need toaccelerate the drug discovery process to identify new effective drug candidates against pancreatic cancer. Wehave developed QSAR models for predicting promiscuous inhibitors using the pharmacological data.Our models achieved maximum Pearson correlation coefficient of 0.86, when evaluated on 10-foldcross-validation. Our models have also successfully validated the drug-to-oncogene relationship and furtherwe used these models to screen FDA approved drugs and tested them in vitro. We have integrated thesemodels in a webserver named as DiPCell, which will be useful for screening and designing novelpromiscuous drug molecules. We have also identified the most and least effective drugs for pancreatic cancercell lines. On the other side, we have identified resistant pancreatic cancer cell lines, which need investigativescanner on them to put light on resistant mechanism in pancreatic cancer.
Pancreatic cancer (PCa) remains the fourth leading cause of cancer-related deaths1, and it is one of the mostlethal malignant tumors. An overall 5-year survival rate of less than 6% and 45,220 new cases were reportedin United States alone1. The mortality rate of PCa is almost equal to the incidence rate, which demonstrates
the aggressiveness and lethal nature of this disease. The contributing factors for this high mortality rate are lack ofscreening tests for early diagnosis and development of drug resistance in tumor cells2–5. Over the years, consid-erable progress has been made in the fight with this disease, and few drugs have been developed to treat this deadlydisease. Although gemcitabine is the standard drug of choice6–10; fluorouracil, leucovorin and irinotecan are alsoused as combination chemotherapy, but existing anti-cancer drugs or therapies are unable to save lives of patientssuffering form PCa. One of the major reasons for the inefficiency of existing anti-cancer drugs is acquired drugresistance that is developed due to genetic alterations in various drug targets11–13. There is an urgent need toimprove pancreatic cancer drug arsenal to combat drug resistance problem and for effective treatment. High-throughput screening of therapeutic molecules from a large pool of chemical compounds is the most suitable wayto identify novel anti-cancer molecules. However, it is time and labor consuming effort. In silico methods, whichcan predict novel inhibitors against pancreatic cancer, will be an attractive alternative approach.
Recently, considerable attention has been paid towards pancreatic cancer drug discovery. In this context,Garnett et. al. have screened 132 anti-cancer drugs on 714 cancer cell lines14 and reported 78070 logIC50 valuesfor different drug and cell line combinations. In another study, Rechard et. al. have demonstrated that cancer celllines share the same features (i.e. copy number variation, expression abnormality) as the primary tumors15. In2012, Barretina et. al. clearly demonstrated the correlation between genomic status of primary tumors and cancercell lines of different lineages16. These studies support the extrapolation of cell line studies to primary tumors andfurther to clinics. Keeping all these facts into consideration, in the present study, we have developed quantitativestructure activity relationship (QSAR) models to predict promiscuous inhibitors against 16 pancreatic cancer celllines. The pharmacological screening data generated in Genomics of Drug Sensitivity in Cancer (one of theprojects in COSMIC) was used to develop models14. QSAR modeling using high-throughput screening data is apowerful technique, which enables the construction of predictive models. These models can be utilized for the insilico screening of libraries of billions of diverse molecules prior to their experimental validation. Here, we havenot considered the biological targets of drugs and just tried to demonstrate the potential of chemical descriptorsand QSAR to predict anti-cancer activity of unknown molecules. Our QSAR models will complement thepancreatic cancer research by helping in identification of novel inhibitors against pancreatic cancer cell lines.For the advancement of the scientific community, we have integrated these models on a webserver, DiPCell,which is freely accessible at http://crdd.osdd.net/raghava/dipcell/.
OPEN
SUBJECT AREAS:DRUG DEVELOPMENT
VIRTUAL SCREENING
DATA PROCESSING
COMPUTATIONAL MODELS
Received22 January 2014
Accepted17 March 2014
Published14 April 2014
Correspondence andrequests for materials
should be addressed toG.P.S.R. (raghava@
imtech.res.in)
* These authorscontributed equally to
this work.
{Current Address:National Institute of
Pathology, SafdarjangHospital Complex,
New Delhi-110029.
SCIENTIFIC REPORTS | 4 : 4668 | DOI: 10.1038/srep04668 1

ResultsAnalysis of pharmacological drug profiling. In order to identify themost effective drugs (i.e., killing most of the pancreatic cancer celllines), we have analyzed the pharmacological profiling of more than80 drugs on 16 pancreatic cancer cell lines. We found that docetaxel,an inhibitor of microtubule assembly was the most effective as it waseffective against 14 out of 16 pancreatic cancer cell lines studied(Figure 1A, Supp. Figure S1A and Supp. Table ST1). Second mosteffective drug was vinblastine, an inhibitor of DNA topoisomerase I,effective against 11 cell lines having logIC50 values in nanomolar
range (Figure 1B, Supp. Figure S1B and Supp. Table ST1). Thisanalysis suggests that these drugs can be used in combination withother drugs against pancreatic cancer. On the other hand, ABT-888(PARP inhibitor) and LFMA-13 (BTK inhibitor) were the leasteffective (Figure 1C & 1D, Supp. Figure S1C & D and Supp. TableST1). Furthermore, clustering of all the anticancer drugs was carriedout, and it was observed that most effective drugs were clusteredtogether (Supp. Figure S2). In addition, we found that Capan-2and YAPC were the most resistant cell lines against most of theanti-cancer drugs (Figure 2A & 2B, Supp. Figure S3A & B and
Figure 1 | Pharmacological profiling of two most effective anticancer drugs (A) docetaxel and (B) vinblastine, and two least effective anticancer dugs(C) ABT888 and (D) LFMA13 on 16 pancreatic cancer cell lines.
Figure 2 | Pharmacological profiling of the most resistant cell lines (A) Capan-2 and (B) YAPC and the most sensitive cell lines (C) KP-4, and (D) MIA-PaCa-2 against 38 anti-cancer drugs.
www.nature.com/scientificreports
SCIENTIFIC REPORTS | 4 : 4668 | DOI: 10.1038/srep04668 2
Supp. Table ST2). Behavior of these two cell lines can be subjected toinvestigate the mechanism of drug resistance in pancreatic cancer.On the other hand, KP-4 and MIA-PaCa-2 were found to be the mostsensitive among all the pancreatic cancer cell lines (Figure 2C & 2D,Supp. Figure S3C & D and Supp. Table ST2).
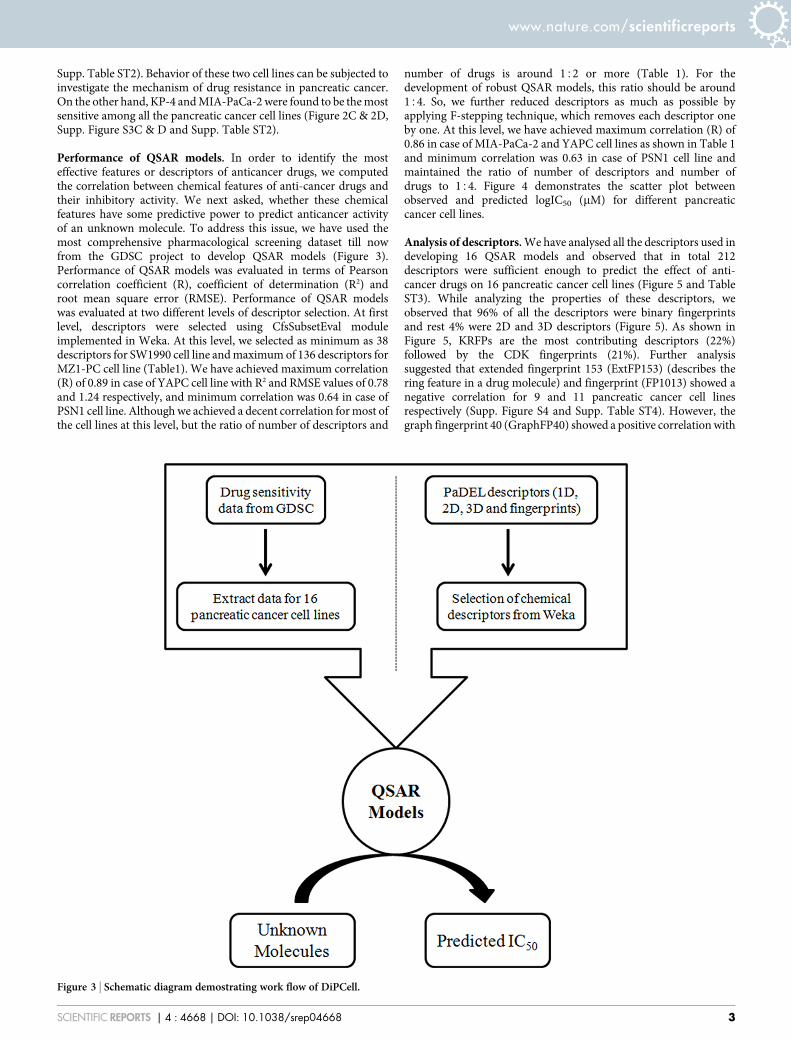
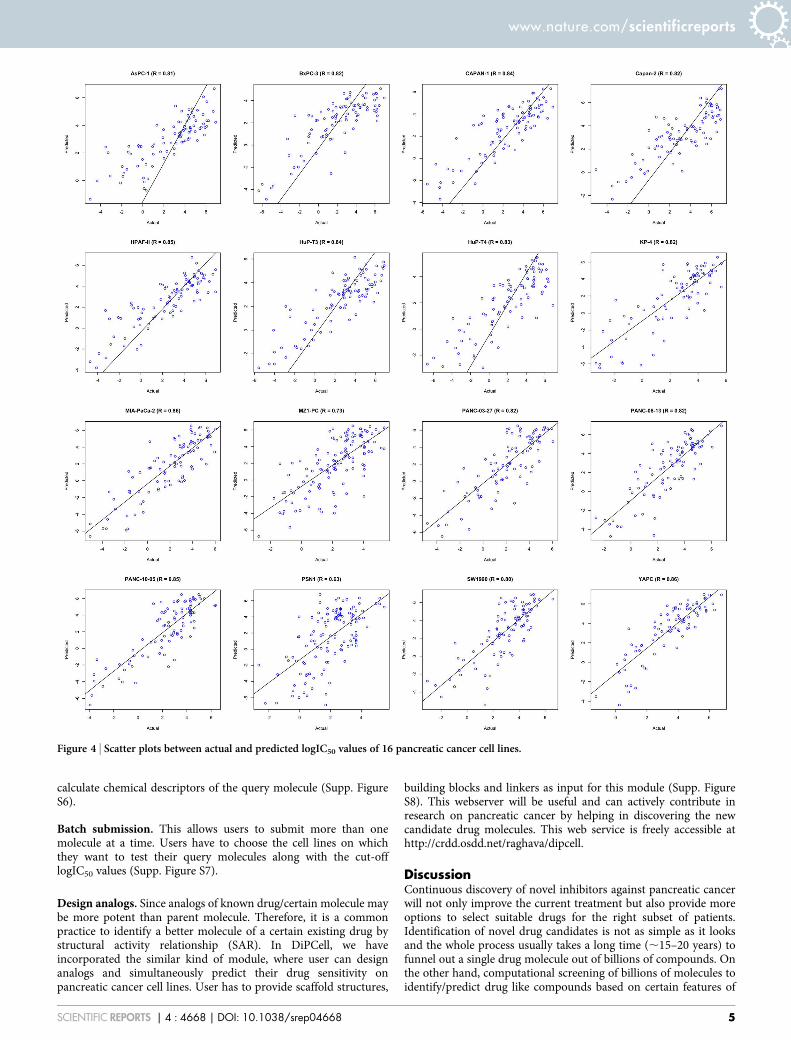
Performance of QSAR models. In order to identify the mosteffective features or descriptors of anticancer drugs, we computedthe correlation between chemical features of anti-cancer drugs andtheir inhibitory activity. We next asked, whether these chemicalfeatures have some predictive power to predict anticancer activityof an unknown molecule. To address this issue, we have used themost comprehensive pharmacological screening dataset till nowfrom the GDSC project to develop QSAR models (Figure 3).Performance of QSAR models was evaluated in terms of Pearsoncorrelation coefficient (R), coefficient of determination (R2) androot mean square error (RMSE). Performance of QSAR modelswas evaluated at two different levels of descriptor selection. At firstlevel, descriptors were selected using CfsSubsetEval moduleimplemented in Weka. At this level, we selected as minimum as 38descriptors for SW1990 cell line and maximum of 136 descriptors forMZ1-PC cell line (Table1). We have achieved maximum correlation(R) of 0.89 in case of YAPC cell line with R2 and RMSE values of 0.78and 1.24 respectively, and minimum correlation was 0.64 in case ofPSN1 cell line. Although we achieved a decent correlation for most ofthe cell lines at this level, but the ratio of number of descriptors and
number of drugs is around 152 or more (Table 1). For thedevelopment of robust QSAR models, this ratio should be around154. So, we further reduced descriptors as much as possible byapplying F-stepping technique, which removes each descriptor oneby one. At this level, we have achieved maximum correlation (R) of0.86 in case of MIA-PaCa-2 and YAPC cell lines as shown in Table 1and minimum correlation was 0.63 in case of PSN1 cell line andmaintained the ratio of number of descriptors and number ofdrugs to 154. Figure 4 demonstrates the scatter plot betweenobserved and predicted logIC50 (mM) for different pancreaticcancer cell lines.
Analysis of descriptors. We have analysed all the descriptors used indeveloping 16 QSAR models and observed that in total 212descriptors were sufficient enough to predict the effect of anti-cancer drugs on 16 pancreatic cancer cell lines (Figure 5 and TableST3). While analyzing the properties of these descriptors, weobserved that 96% of all the descriptors were binary fingerprintsand rest 4% were 2D and 3D descriptors (Figure 5). As shown inFigure 5, KRFPs are the most contributing descriptors (22%)followed by the CDK fingerprints (21%). Further analysissuggested that extended fingerprint 153 (ExtFP153) (describes thering feature in a drug molecule) and fingerprint (FP1013) showed anegative correlation for 9 and 11 pancreatic cancer cell linesrespectively (Supp. Figure S4 and Supp. Table ST4). However, thegraph fingerprint 40 (GraphFP40) showed a positive correlation with
Figure 3 | Schematic diagram demostrating work flow of DiPCell.
www.nature.com/scientificreports
SCIENTIFIC REPORTS | 4 : 4668 | DOI: 10.1038/srep04668 3

drug activity (Supp. Figure S4 and Table ST5). Relative positivecharge descriptor (RPCG) is the only single 3D descriptor whichshowed a high positive correlation with the drug activity in Capan-2 cell line (Figure 6). It suggests that relative positive charge playssome role in anti-cancer activity of drugs, and it would berecommendable to have more relative positive charge for betterantiproliferative activity. On the other hand, PubChem fingerprint,PubchemFP337, which corresponds to substructure C(,C)(,C)(,C)(,O) showed a negative correlation with the drug activity(Supp. Figure S4 and S5) (‘,’ depicts irrespective of bond order).Similarly, activity of anti-cancer drugs for the other cell lines wascorrelated with different types of descriptors, suggesting that thesedescriptors play crucial roles in the functioning of these anti-cancerdrugs (Supp. Figure S4).
Validation of drug-to-oncogene relation. From these QSAR mo-dels, we tried to recapitulate the drug-to-oncogene associations,which were suggested by the experimental data14. For instance, lossof SMAD4 was associated with sensitivity to EGFR-family inhibitorBIBW299214. First, we divided the 16 pancreatic cancer cell lines intotwo classes, first one, which is mutated for SMAD4, and second,which is wild type for SMAD4. We developed different QSARmodels for wild type and mutated cell lines (BIBW2992 was notused in the training of these models to avoid any biases). Then, wepredicted the logIC50 value of BIBW2992 (as an independentmolecule) using our QSAR models for each cell line. We got thesame association from the predicted logIC50 values as earliersuggested by the experimental data (Figure 7).
Screening of FDA approved drugs. Drug repositioning is the wellestablished concept in the field of drug designing and pharmaco-informatics22,23. In 2012, Debnath and coworkers carried out thehigh throughput screening of FDA approved drugs against theintestinal parasite Entamoeba histolytica, which is the causativeagent of human amebiasis24. They found auranofin, which is aprescribed drug in rheumatoid arthritis is ten times more potentthan metronidazole (drug of choice for human amebiasis). Thisfinding and many other earlier such reports advocated thepotential of FDA approved drugs for their unknown therapeuticpotential in other diseases. To capitalize these findings, we havescreened FDA approved drugs by our in silico QSAR models andsorted them according to their predicted IC50 values. We gotinteresting result, out of top 10 FDA approved drugs (Table 2), 7are well known anticancer drugs, which uphold the utility of our
QSAR models for screening anticancer activity. Remaining 3drugs, have yet to be characterized for their anticancer activity.Whole rank wise list of FDA approved drugs is available insupplementary material (Table ST5).
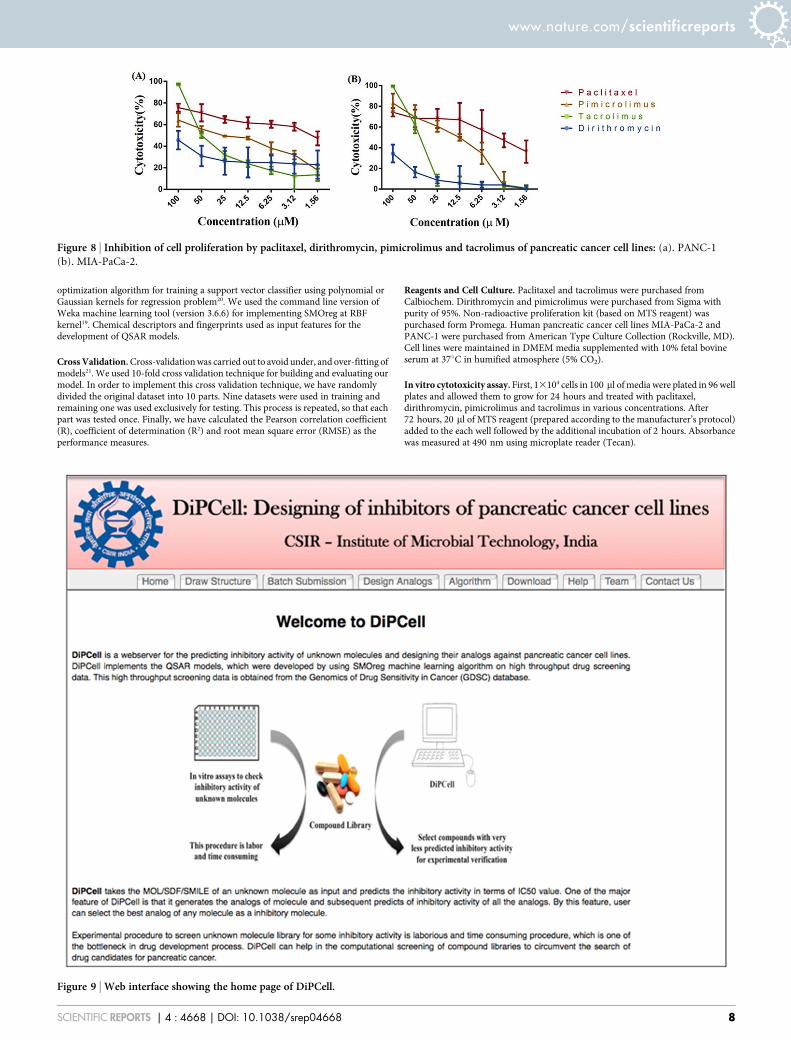
Experimental Validation. In the list of top ten predicted anticancerdrugs, three drugs (pimicrolimus, tacrolimus and dirithromycin)were not known previsouly for their anticancer activity (Table 2).Therefore, we analysed in vitro antiproliferative effect of these threedrugs on two pancreatic cancer cell lines, MIA-PaCa-2 and PANC-1.We have taken paclitaxel as a positive control for the anticanceractivity and the same was also present in our predicted list ofanticancer drugs. As predicted, all three drugs have shown anti-cancer activity on both the cell lines. Tacrolimus was the mosteffective drug at higher concentration (above 50 mM) as it hasshown ,100% cytotoxicity at 100 mM (Figure 8a and 8b) on boththe cell lines. Pimicrolimus has shown more than 60% cytotxicity at100 mM on both the cell lines (Figure 8a and 8b). These results showsthat the tacrolimus have prominent anticancer activity as comparedto the other predicted drugs and paclitaxel (positive control) athigher concentration (100 mM) but found to be less effective atlower concentrations. Pimicrolimus was more effctive thantacrolimus below 50 mM concentration range. On the other hand,dirithromycin was less effective even at higher concentration.
Web ImplementationAs the results demonstrated that developed QSAR models are quiteeffective in predicting the inhibitory activity (logIC50) of unknownmolecules and in reproducing the drug-to-oncogene association,these QSAR models have been implemented to the user friendlywebserver named as DiPCell (Figure 9), where users can predictthe inhibitory activity of unknown molecules (or a whole library ofchemicals) against 16 pancreatic cancer cell lines in terms of logIC50
value. DiPCell includes following tools:
Draw structure. This tool allows users to draw chemical structure oftheir molecule using Marvin editor. At one time, user can predictdrug sensitivity on a maximum of 16 pancreatic cancer cell lines.Since it is very difficult to define the cut-off logIC50 value, whichdiscriminates between sensitive and resistance cancer cell lineshence, an option of logIC50 cut-off value has been provided, whichwill be defined by the user on the basis of their experimental criteria.After submission, DiPCell returns with logIC50 values against pan-creatic cancer cell lines selected by the users along with an option to
Table 1 | Pearson correlation and root mean square error values obtained for each pancreatic cell line by their respective QSAR models
S. No. Cell Line ND* D1 R R2 RMSE D2 R R2 RMSE
1. AsPC-1 92 45 0.84 0.70 1.6 23 0.81 0.66 1.782. BxPC-3 92 47 0.82 0.67 1.82 19 0.82 0.67 1.833. CAPAN-1 96 42 0.83 0.69 1.61 21 0.84 0.71 1.584. Capan-2 90 54 0.86 0.73 1.47 22 0.82 0.67 1.635. HPAF-II 95 42 0.86 0.74 1.45 22 0.85 0.73 1.486. HuP-T3 96 54 0.85 0.73 1.57 22 0.84 0.71 1.637. HuP-T4 92 41 0.79 0.61 2.00 24 0.83 0.69 1.818. KP-4 88 62 0.82 0.68 1.94 22 0.82 0.67 2.049. MIA-PaCa-2 96 45 0.85 0.71 1.81 23 0.86 0.73 1.7610. MZ1-PC 132 136 0.79 0.61 1.94 29 0.73 0.53 2.1611. PANC-03-27 91 44 0.8 0.64 2.00 20 0.82 0.67 1.9112. PANC-08-13 92 50 0.81 0.65 1.75 22 0.82 0.68 1.7413. PANC-10-05 95 41 0.81 0.65 1.92 24 0.85 0.73 1.7114. PSN1 129 116 0.64 0.42 2.68 31 0.63 0.39 2.8115. SW1990 94 38 0.77 0.56 1.89 23 0.80 0.63 1.8316. YAPC 86 65 0.89 0.79 1.24 21 0.86 0.74 1.45
*ND: Number of drugs used to develop QSAR models; D1: Number of descriptors selected from the CfsSubsetEval algorithm; D2: Number of descriptor selected from CfsSubsetEval followed by F-stepping;R: Pearson Correlation; RMSE: Root Mean Square Error.
www.nature.com/scientificreports
SCIENTIFIC REPORTS | 4 : 4668 | DOI: 10.1038/srep04668 4
calculate chemical descriptors of the query molecule (Supp. FigureS6).
Batch submission. This allows users to submit more than onemolecule at a time. Users have to choose the cell lines on whichthey want to test their query molecules along with the cut-offlogIC50 values (Supp. Figure S7).
Design analogs. Since analogs of known drug/certain molecule maybe more potent than parent molecule. Therefore, it is a commonpractice to identify a better molecule of a certain existing drug bystructural activity relationship (SAR). In DiPCell, we haveincorporated the similar kind of module, where user can designanalogs and simultaneously predict their drug sensitivity onpancreatic cancer cell lines. User has to provide scaffold structures,
building blocks and linkers as input for this module (Supp. FigureS8). This webserver will be useful and can actively contribute inresearch on pancreatic cancer by helping in discovering the newcandidate drug molecules. This web service is freely accessible athttp://crdd.osdd.net/raghava/dipcell.
DiscussionContinuous discovery of novel inhibitors against pancreatic cancerwill not only improve the current treatment but also provide moreoptions to select suitable drugs for the right subset of patients.Identification of novel drug candidates is not as simple as it looksand the whole process usually takes a long time (,15–20 years) tofunnel out a single drug molecule out of billions of compounds. Onthe other hand, computational screening of billions of molecules toidentify/predict drug like compounds based on certain features of
Figure 4 | Scatter plots between actual and predicted logIC50 values of 16 pancreatic cancer cell lines.
www.nature.com/scientificreports
SCIENTIFIC REPORTS | 4 : 4668 | DOI: 10.1038/srep04668 5

Figure 5 | Different classes of descriptors associated with inhibitory activity prediction.
Figure 6 | Correration of descriptors (R) with the drug activitiy in Capan-2 cell line.
www.nature.com/scientificreports
SCIENTIFIC REPORTS | 4 : 4668 | DOI: 10.1038/srep04668 6

well known drug molecules seems to be a potential approach. In thepresent study, we have developed QSAR models for prediction ofinhibitors against pancreatic cancer cell lines to enhance andcomplement the drug development process. Our results demon-strated that chemical features of drug molecules can be correlatedto their activity and thus, can be used to predict activity of unknownmolecules. Availability of high throughput drug screening data madeit possible to develop such efficient models, and we anticipate that asmore and more screening data will be available, the predictive powerof these models will increase further. Our models were also able torecapitulate the drug-to-oncogene association, which were revealedby the experimental data. So, it would help to link up the genes asbiomarker of drug sensitivity14,25. As we have shown in our results,Capan-2 and YAPC cell lines were resistant against most of the anti-cancer drugs and earlier studies demonstrated that cancer cell linesare like a mirror image of primary tumors in terms of genomic andtranscriptional abnormalities15,16 and moreover, the high throughputdata as in our case can recapitulate the real conditions up to greatextent and help in systematic identification of new anticancer drugcandidates. Therefore, we can hypothesize that genomic and tran-scriptomic studies of these two cell lines can put some light on thedrug resistance mechanism in pancreatic cancer. As suggested in theliterature, it is not solely the drug, which determined its activity,rather genomics and proteomic signatures of a cell line are alsosubstantial contributors in determining the activity26–29. We are cur-rently investigating these aspects, and in the future we will integratethese signatures with QSAR models to make them more robust andefficient.
LimitationsRecently, Quackenbash and colleague have shown an interestingcomparison between pharmacological data from CCLE and CGP30.They have shown that the pharmacolgical data between these twostudies are miserably correlated (Spearman’s rank correlation of0.28). In the light of this comparative study, one can question about
the validity of our QSAR models, whether they will accurately predictthe anticancer activity or not. We agree with this and certainly itwould limit down the spectrum of these QSAR models. But if wecarefully look, this is not the limitation of QSAR models, this is thelimitation of the pharmacological data available31. This inadequationof the pharmacological data is also reflected in our experimentalvalidation, where we got the anticancer activity in tacrolimus anddirithromycin, but at very high concentration (100 mM). But, we cananticipate as the quality of the data will increase, predictive power ofthese models will increase more and more. This study is solely basedon cell line data, this is also an another constraint, which furthernarrows down the spectrum of these models. But from somewhere atsome point, we have to start and this study is just a beginning of a newarena for drug sensitivity prediction.
MethodsPharmacological data. In this study, we have used a dataset of 132 anti-cancer drugsand their log transformed IC50 values against 714 cancer cell lines and this data wasobtained from the GDSC Website14 (Genomics of Drug Sensitivity, http://www.cancerrxgene.org/translation/Drug, Date of access: 20/11/2012, published in 2012)and CancerDR database17 (CancerDR: Cancer Drug Resistance Database, http://crdd.osdd.net/raghava/cancerdr, Date of access: 07/12/2012, published in 2013). Amongthe 714 cancer cell lines, 16 were pancreatic cancer cell lines. We extracted thepharmacological screening data of these 16 pancreatic cancer cell lines. LogIC50
values of these drugs vary from 211 to 113.6. Higher logIC50 values are just anextrapolation of the drug-response curve, and they do not have any biologicalrelevance. But, if we reduce this scale to a somewhat narrow range, number of drugswill reduced apparently. Accordingly to make a balance between drugs and logIC50
range, we restricted ourself to 27 to 17 scale of logIC50, so that we can get optimumnumber of drugs to develop QSAR models and moreover, to avoid any fallacy inmachine learning.
Structure of Drugs. To obtain the structure of drugs, we have downloaded the SDFfile of molecules available at PubChem and for rest of the drugs, structures weredrawn using PubChem editor. These 2D structures were further converted into 3Dstructures, and their energy was minimized by OpenBabel software18.
Descriptors Calculation. To develop cell line specific QSAR models, we havecomputed 863 chemical descriptors (1D, 2D, and 3D), which include constitutional,topological, geometric, electrostatic, hydrophobic, etc. using PaDEL software [18]. Inaddition, we have calculated 10 different classes of binary fingerprints (FP’s) availablein PaDEL software.
Descriptor Selection. It is a well known fact that all the descriptors are not relevant tothe activity, and it is a fundamental requirement to remove irrelevant descriptors todevelop robust QSAR models, thus we used feature selection techniques in orderto select relevant features/descriptors. We used remove-useless function followed byCfsSubsetEval module with best-fit algorithm implemented in Weka19 for theselection of relevant descriptors. CfsSubsetEval determines the predictive ability ofeach attribute (chemical descriptor) and the redundancy among the descriptors. Italso selects the best set of attributes that are highly correlated with the class forprediction, but at the same time have low inter-correlation. Further, we applied F-stepping, which removes one descriptor at a time to check its correlation with activity.
QSAR Models. We developed individual QSAR models for each of the 16 pancreaticcancer cell lines using SMOreg algorithm in Weka, which uses the sequential minimal
Figure 7 | Scatter plot showing (A) experiemental and (B) predicted (obtained by QSAR models) LogIC50 values for SMAD4 mutated and wild typepancreatic cancer cell lines. Each dot represents the cell line and horizontal line is the geometric mean. In panel (A), 15 cell lines is presented instead of 16
because for one cell line logIC50 is having a negative value.
Table 2 | Rank wise list of predicted anticancer drugs (Top 10)
S. No. Drug Bank ID Name Therapeutic Use
1. DB01248 Docetaxel Anticancer2. DB01229 Paclitaxel Anticancer3. DB00541 Vincristine Anticancer4. DB00570 Vinblastine Anticancer5. DB06772 Cabazitaxel Anticancer6. DB00361 Vinorelbine Anticancer7. DB00954 Dirithromycin Antibiotics8. DB00864 Tacrolimus Immunosuppresent9. DB00337 Pimicrolimus Immunosuppresent10. DB01030 Topotecan Anticancer
www.nature.com/scientificreports
SCIENTIFIC REPORTS | 4 : 4668 | DOI: 10.1038/srep04668 7
optimization algorithm for training a support vector classifier using polynomial orGaussian kernels for regression problem20. We used the command line version ofWeka machine learning tool (version 3.6.6) for implementing SMOreg at RBFkernel19. Chemical descriptors and fingerprints used as input features for thedevelopment of QSAR models.
Cross Validation. Cross-validation was carried out to avoid under, and over-fitting ofmodels21. We used 10-fold cross validation technique for building and evaluating ourmodel. In order to implement this cross validation technique, we have randomlydivided the original dataset into 10 parts. Nine datasets were used in training andremaining one was used exclusively for testing. This process is repeated, so that eachpart was tested once. Finally, we have calculated the Pearson correlation coefficient(R), coefficient of determination (R2) and root mean square error (RMSE) as theperformance measures.
Reagents and Cell Culture. Paclitaxel and tacrolimus were purchased fromCalbiochem. Dirithromycin and pimicrolimus were purchased from Sigma withpurity of 95%. Non-radioactive proliferation kit (based on MTS reagent) waspurchased form Promega. Human pancreatic cancer cell lines MIA-PaCa-2 andPANC-1 were purchased from American Type Culture Collection (Rockville, MD).Cell lines were maintained in DMEM media supplemented with 10% fetal bovineserum at 37uC in humified atmosphere (5% CO2).
In vitro cytotoxicity assay. First, 13104 cells in 100 ml of media were plated in 96 wellplates and allowed them to grow for 24 hours and treated with paclitaxel,dirithromycin, pimicrolimus and tacrolimus in various concentrations. After72 hours, 20 ml of MTS reagent (prepared according to the manufacturer’s protocol)added to the each well followed by the additional incubation of 2 hours. Absorbancewas measured at 490 nm using microplate reader (Tecan).
Figure 8 | Inhibition of cell proliferation by paclitaxel, dirithromycin, pimicrolimus and tacrolimus of pancreatic cancer cell lines: (a). PANC-1
(b). MIA-PaCa-2.
Figure 9 | Web interface showing the home page of DiPCell.
www.nature.com/scientificreports
SCIENTIFIC REPORTS | 4 : 4668 | DOI: 10.1038/srep04668 8

1. Am. Cancer Soc., Cancer Facts & Figures. Atlanta Am. Cancer Soc. 2013 64 (2013).2. Riker, A., Libutti, S. K. & Bartlett, D. L. Advances in the early detection, diagnosis,
and staging of pancreatic cancer. Surg oncol 6, 157–69 (1997).3. Delhaze, M., Jonard, P., Gigot, J. F., Descamps, C. & Dive, C. Chronic pancreatitis
and pancreatic cancer. An often difficult differential diagnosis. ActaGastroenterol. Belg. 52, 458–66.
4. Long, J. et al. Overcoming drug resistance in pancreatic cancer. Expert Opin. Ther.Targets 15, 817–28 (2011).
5. Sheikh, R., Walsh, N., Clynes, M., O’Connor, R. & McDermott, R. Challenges ofdrug resistance in the management of pancreatic cancer. Expert Rev. AnticancerTher. 10, 1647–61 (2010).
6. Pliarchopoulou, K. & Pectasides, D. Pancreatic cancer: current and futuretreatment strategies. Cancer Treat. Rev. 35, 431–6 (2009).
7. Di Marco, M. et al. Metastatic pancreatic cancer: is gemcitabine still the beststandard treatment? (Review) Oncol. Rep. 23, 1183–92 (2010).
8. Patra, C. R. et al. Targeted delivery of gemcitabine to pancreatic adenocarcinomausing cetuximab as a targeting agent. Cancer Res. 68, 1970–8 (2008).
9. Hidalgo, M. Pancreatic cancer. N. Engl. J. Med. 362, 1605–17 (2010).10. Shore, S., Raraty, M. G. T., Ghaneh, P. & Neoptolemos, J. P. Review article:
chemotherapy for pancreatic cancer. Aliment. Pharmacol. Ther. 18, 1049–69(2003).
11. Grønbaek, K., Hother, C. & Jones, P. A. Epigenetic changes in cancer. APMIS 115,1039–59 (2007).
12. Sadikovic, B., Al-Romaih, K., Squire, J. A. & Zielenska, M. Cause andconsequences of genetic and epigenetic alterations in human cancer. Curr.Genomics 9, 394–408 (2008).
13. Wang, H. et al. Identification of the MEK1(F129L) activating mutation as apotential mechanism of acquired resistance to MEK inhibition in human cancerscarrying the B-RafV600E mutation. Cancer Res. 71, 5535–45 (2011).
14. Garnett, M. J. et al. Systematic identification of genomic markers of drugsensitivity in cancer cells. Nature 483, 570–5 (2012).
15. Neve, R. M. et al. A collection of breast cancer cell lines for the study offunctionally distinct cancer subtypes. Cancer Cell 10, 515–27 (2006).
16. Barretina, J. et al. The Cancer Cell Line Encyclopedia enables predictive modellingof anticancer drug sensitivity. Nature 483, 603–7 (2012).
17. Kumar, R. et al. CancerDR: cancer drug resistance database. Sci. Rep. 3, 1445(2013).
18. O’Boyle, N. M. et al. Open Babel: An open chemical toolbox. J. Cheminform. 3, 33(2011).
19. Frank, E., Hall, M., Trigg, L., Holmes, G. & Witten, I. H. Data mining inbioinformatics using Weka. Bioinformatics 20, 2479–81 (2004).
20. Cao, L. J. et al. Parallel sequential minimal optimization for the training of supportvector machines. IEEE Trans. Neural Netw. 17, 1039–49 (2006).
21. Kooperberg, C. et al. Logic regression for analysis of the association betweengenetic variation in the renin-angiotensin system and myocardial infarction orstroke. Am. J. Epidemiol. 165, 334–43 (2007).
22. Ashburn, T. T. & Thor, K. B. Drug repositioning: identifying and developing newuses for existing drugs. Nat. Rev. Drug Discov. 3, 673–83 (2004).
23. Chong, C. R. & Sullivan, D. J. New uses for old drugs. Nature 448, 645–6 (2007).24. Debnath, A. et al. A high-throughput drug screen for Entamoeba histolytica
identifies a new lead and target. Nat. Med. 18, 956–60 (2012).
25. Rodrı́guez-Paredes, M. & Esteller, M. Cancer epigenetics reaches mainstreamoncology. Nat. Med. 17, 330–9 (2011).
26. Chen, B.-J. et al. Harnessing gene expression to identify the genetic basis of drugresistance. Mol. Syst. Biol. 5, 310 (2009).
27. Park, E. S. et al. Integrative analysis of proteomic signatures, mutations, and drugresponsiveness in the NCI 60 cancer cell line set. Mol. Cancer Ther. 9, 257–67(2010).
28. Reinhold, W. C. et al. CellMiner: a web-based suite of genomic and pharmacologictools to explore transcript and drug patterns in the NCI-60 cell line set. Cancer Res.72, 3499–511 (2012).
29. Nagpal, G. et al. PCMdb: Pancreatic Cancer Methylation Database. Sci. Rep. 4,4197 (2014).
30. Haibe-Kains, B. et al. Inconsistency in large pharmacogenomic studies. Nature504, 389–393 (2013).
31. Cumming, J. G., Davis, A. M., Muresan, S., Haeberlein, M. & Chen, H. Chemicalpredictive modelling to improve compound quality. Nat. Rev. Drug Discov. 12,948–62 (2013).
AcknowledgmentsAuthors are thankful to funding agencies Council of Scientific and Industrial Research(project Open Source Drug Discovery and GENESIS BSC0121) and Department ofBiotechnology (project BTISNET), Govt. of India for financial support.
Author contributionsR.K. collected the data and created the datasets. R.K., K.C. and D.S. developed QSARmodels. R.K. and K.C. created the back end server. R.K., K.C., A.G., and D.S. developed thefront end user interface. R.K., A.G. and G.P.S.R. analysed the results and wrote themanuscript. R.K. carried out the experimental validations. R.K. and A.G. prepared figure 1,2, 3, 5, 7, 8 and 9. D.S. prepared figure 4 and 6. G.P.S.R. conceived and coordinated theproject, helped in the interpretation of data, refined the drafted manuscript and gave overallsupervision to the project. All of the authors read and approved the final manuscript.
Additional informationSupplementary information accompanies this paper at http://www.nature.com/scientificreports
Competing financial interests: The authors declare no competing financial interests.
How to cite this article: Kumar, R., Chaudhary, K., Singla, D., Gautam, A. & Raghava, G.P.S.Designing of promiscuous inhibitors against pancreatic cancer cell lines. Sci. Rep. 4, 4668;DOI:10.1038/srep04668 (2014).
This work is licensed under a Creative Commons Attribution-NonCommercial-ShareAlike 3.0 Unported License. The images in this article are included in thearticle’s Creative Commons license, unless indicated otherwise in the image credit;if the image is not included under the Creative Commons license, users will need toobtain permission from the license holder in order to reproduce the image. To view acopy of this license, visit http://creativecommons.org/licenses/by-nc-sa/3.0/
www.nature.com/scientificreports
SCIENTIFIC REPORTS | 4 : 4668 | DOI: 10.1038/srep04668 9