
H3C S5120-EI Switch Series
208
H3C S5120-EI Switch Series Network Management and Monitoring Configuration Guide Hangzhou H3C Technologies Co., Ltd. http://www.h3c.com Software version: Release 2210 Document version: 6W100-20110915
-
Upload
khangminh22 -
Category
Documents
-
view
0 -
download
0
Transcript of H3C S5120-EI Switch Series

H3C S5120-EI Switch Series Network Management and Monitoring
Configuration Guide
Hangzhou H3C Technologies Co., Ltd. http://www.h3c.com Software version: Release 2210 Document version: 6W100-20110915

Copyright © 2011, Hangzhou H3C Technologies Co., Ltd. and its licensors
All rights reserved
No part of this manual may be reproduced or transmitted in any form or by any means without prior written consent of Hangzhou H3C Technologies Co., Ltd.
Trademarks
H3C, , Aolynk, , H3Care,
, TOP G, , IRF, NetPilot, Neocean, NeoVTL, SecPro, SecPoint, SecEngine, SecPath, Comware, Secware, Storware, NQA, VVG, V2G, VnG, PSPT, XGbus, N-Bus, TiGem, InnoVision and HUASAN are trademarks of Hangzhou H3C Technologies Co., Ltd.
All other trademarks that may be mentioned in this manual are the property of their respective owners
Notice
The information in this document is subject to change without notice. Every effort has been made in the preparation of this document to ensure accuracy of the contents, but all statements, information, and recommendations in this document do not constitute the warranty of any kind, express or implied.

Preface
The H3C S5120-EI documentation set includes 10 configuration guides, which describe the software features for the H3C S5120-EI Switch Series Release 2210, and guide you through the software configuration procedures. These configuration guides also provide configuration examples to help you apply software features to different network scenarios.
The Network Management and Monitoring Configuration Guide describes network management and monitoring fundamentals and configuration. It describes how to view the system information, collect traffic statistics, assess the network performance, synchronize time for all devices with clocks in your network, and use the ping, tracert, and debug commands to check and debug the current network connectivity.
This preface includes:
• Audience
• New and changed features
• Conventions
• About the S5120-EI documentation set
• Obtaining documentation
• Technical support
• Documentation feedback
Audience This documentation is intended for:
• Network planners
• Field technical support and servicing engineers
• Network administrators working with the S5120-EI Switch Series
New and changed features None
Conventions This section describes the conventions used in this documentation set.
Command conventions
Convention Description
Boldface Bold text represents commands and keywords that you enter literally as shown.
Italic Italic text represents arguments that you replace with actual values.
[ ] Square brackets enclose syntax choices (keywords or arguments) that are optional.

Convention Description
{ x | y | ... } Braces enclose a set of required syntax choices separated by vertical bars, from which you select one.
[ x | y | ... ] Square brackets enclose a set of optional syntax choices separated by vertical bars, from which you select one or none.
{ x | y | ... } * Asterisk marked braces enclose a set of required syntax choices separated by vertical bars, from which you select at least one.
[ x | y | ... ] * Asterisk marked square brackets enclose optional syntax choices separated by vertical bars, from which you select one choice, multiple choices, or none.
&<1-n> The argument or keyword and argument combination before the ampersand (&) sign can be entered 1 to n times.
# A line that starts with a pound (#) sign is comments.
GUI conventions
Convention Description
Boldface Window names, button names, field names, and menu items are in Boldface. For example, the New User window appears; click OK.
> Multi-level menus are separated by angle brackets. For example, File > Create > Folder.
Symbols
Convention Description
WARNING An alert that calls attention to important information that if not understood or followed can result in personal injury.
CAUTION An alert that calls attention to important information that if not understood or followed can result in data loss, data corruption, or damage to hardware or software.
IMPORTANT An alert that calls attention to essential information.
NOTE An alert that contains additional or supplementary information.
TIP An alert that provides helpful information.
Network topology icons
Represents a generic network device, such as a router, switch, or firewall.
Represents a routing-capable device, such as a router or Layer 3 switch.
Represents a generic switch, such as a Layer 2 or Layer 3 switch, or a router that supports Layer 2 forwarding and other Layer 2 features.
Port numbering in examples
The port numbers in this document are for illustration only and might be unavailable on your device.

About the S5120-EI documentation set The H3C S5120-EI documentation set includes:
Documents Purposes
Product description and specifications Marketing brochure Describe product specifications and benefits.
Technology white papers Provide an in-depth description of software features and technologies.
Hardware specifications and installation Compliance and safety manual
CE DOCs Provide regulatory information and the safety instructions that must be followed during installation.
Installation quick start Guides you through initial installation and setup procedures to help you quickly set up your device.
Installation manual Provides a complete guide to switch installation and specifications.
RPS Ordering Information for H3C Low-End Ethernet Switches Helps you order RPSs for switches that can work with an RPS.
User manuals for RPSs Describe the specifications, installation, and replacement of RPSs.
User manuals for interface cards Describe the specifications, installation, and replacement of expansion interface cards.
H3C Low End Series Ethernet Switches Pluggable Modules Manual Describes the specifications of pluggable transceiver modules.
Pluggable SFP[SFP+][XFP] Transceiver Modules Installation Guide
Describe the installation, and replacement of SFP/SFP+/XFP transceiver modules.
Software configuration Configuration guides Describe software features and configuration procedures.
Command references Provide a quick reference to all available commands.
Operations and maintenance H3C Series Ethernet Switches Login Password Recovery Manual Helps you deal with switch login password loss.
Release notes
Provide information about the product release, including the version history, hardware and software compatibility matrix, version upgrade information, technical support information, and software upgrading.
Obtaining documentation You can access the most up-to-date H3C product documentation on the World Wide Web at http://www.h3c.com.
Click the links on the top navigation bar to obtain different categories of product documentation:
[Technical Support & Documents > Technical Documents] – Provides hardware installation, software upgrading, and software feature configuration and maintenance documentation.
[Products & Solutions] – Provides information about products and technologies, as well as solutions.

[Technical Support & Documents > Software Download] – Provides the documentation released with the software version.
Technical support [email protected]
http://www.h3c.com
Documentation feedback You can e-mail your comments about product documentation to [email protected].
We appreciate your comments.

i
Contents
System maintenance and debugging ························································································································· 1 Ping·····················································································································································································1
Introduction ·······························································································································································1 Configuring ping ······················································································································································1 Ping configuration example ····································································································································1
Tracert ················································································································································································3 Introduction ·······························································································································································3 Configuring tracert ···················································································································································4
System debugging ····························································································································································5 Introduction to system debugging···························································································································5 Displaying debugging information·························································································································5 Configuring system debugging·······························································································································6
Ping and tracert configuration example ·························································································································7
NTP configuration ························································································································································ 9 NTP overview ····································································································································································9
Applications of NTP ·················································································································································9 Advantages of NTP ··················································································································································9 How NTP works····················································································································································· 10 NTP message format ············································································································································· 11 Operation modes of NTP ····································································································································· 12
NTP configuration task list············································································································································· 14 Configuring the operation modes of NTP ··················································································································· 15
Operation modes and static and dynamic associations ··················································································· 15 Configuring NTP client/server mode ·················································································································· 15 Configuring the NTP symmetric peers mode ······································································································ 16 Configuring NTP broadcast mode······················································································································· 16 Configuring NTP multicast mode ························································································································· 17
Configuring optional parameters of NTP ···················································································································· 18 Specifying the source interface for NTP messages ···························································································· 18 Disabling an interface from receiving NTP messages······················································································· 18 Configuring the maximum number of dynamic sessions allowed···································································· 19
Configuring access-control rights ································································································································· 19 Configuration prerequisites ·································································································································· 19 Configuration procedure ······································································································································ 19
Configuring NTP authentication ··································································································································· 20 Configuration prerequisites ·································································································································· 20 Configuration procedure ······································································································································ 20
Displaying and maintaining NTP ································································································································· 22 NTP configuration examples········································································································································· 22
Configuring NTP client/server mode ·················································································································· 22 Configuring the NTP symmetric mode ················································································································ 23 Configuring NTP broadcast mode······················································································································· 25 Configuring NTP multicast mode ························································································································· 27 Configuring NTP client/server mode with authentication················································································· 29 Configuring NTP broadcast mode with authentication ····················································································· 30
Information center configuration ·······························································································································34 Information center overview·········································································································································· 34
Introduction to information center························································································································ 34

ii
Classification of system information ···················································································································· 35 System information levels ····································································································································· 35 System information channels and output destinations······················································································· 35 Outputting system information by source module······························································································ 36 Default output rules of system information ·········································································································· 36 System information format···································································································································· 37
Configuring information center····································································································································· 40 Information center configuration task list ············································································································ 40 Outputting system information to the console····································································································· 40 Outputting system information to a monitor terminal ························································································ 41 Outputting system information to a log host······································································································· 42 Outputting system information to the trap buffer································································································ 43 Outputting system information to the log buffer ································································································· 44 Outputting system information to the SNMP module························································································· 45 Outputting system information to the web interface ·························································································· 45 Saving security logs into the security log file······································································································ 46 Configuring synchronous information output ····································································································· 49 Disabling a port from generating link up/down logging information····························································· 50
Displaying and maintaining information center ········································································································· 51 Information center configuration examples ················································································································· 51
Outputting log information to a UNIX log host ·································································································· 51 Outputting log information to a Linux log host··································································································· 53 Outputting log information to the console ·········································································································· 54 Saving security logs into the security log file······································································································ 55
SNMP configuration ··················································································································································58 SNMP overview······························································································································································ 58
SNMP mechanism ················································································································································· 58 SNMP protocol versions ······································································································································· 59
SNMP configuration task list········································································································································· 59 Configuring basic SNMP settings ································································································································ 59
Configuring basic SNMPv3 settings ··················································································································· 59 Configuring basic SNMPv1 or SNMPv2c settings ···························································································· 61
Configuring network management-specific interface index ······················································································ 62 About the network management-specific interface index ················································································· 62 Switching the format of an NM-specific ifindex································································································· 62
Configuring SNMP logging ·········································································································································· 63 Introduction to SNMP logging ····························································································································· 63 Enabling SNMP logging······································································································································· 63
Configuring SNMP traps··············································································································································· 64 Introduction to SNMP traps ·································································································································· 64 Enabling SNMP traps ··········································································································································· 64 Configuring trap sending parameters ················································································································· 65
Displaying and maintaining SNMP ····························································································································· 66 SNMP configuration examples ····································································································································· 66
SNMPv1/SNMPv2c configuration example ······································································································ 66 SNMPv3 configuration example·························································································································· 68 SNMP logging configuration example ··············································································································· 70
MIB style configuration ··············································································································································72 Overview········································································································································································· 72 Setting the MIB style······················································································································································· 72 Displaying and maintaining MIB style ························································································································· 72
RMON configuration ·················································································································································73 RMON overview ···························································································································································· 73

iii
Introduction ···························································································································································· 73 Working mechanism············································································································································· 73 RMON groups ······················································································································································· 73
Configuring the RMON statistics function ··················································································································· 75 Configuring the RMON Ethernet statistics function···························································································· 76 Configuring the RMON history statistics function ······························································································ 76
Configuring the RMON alarm function ······················································································································· 76 Configuration prerequisites ·································································································································· 76 Configuration procedure ······································································································································ 77
Displaying and maintaining RMON···························································································································· 77 Ethernet statistics group configuration example·········································································································· 78 History group configuration example ·························································································································· 79 Alarm group configuration example···························································································································· 81
Port mirroring configuration ······································································································································83 Introduction to port mirroring········································································································································ 83
Terminologies of port mirroring ··························································································································· 83 Port mirroring classification and implementation······························································································· 84
Configuring local port mirroring ·································································································································· 86 Local port mirroring configuration task list ········································································································· 86 Creating a local mirroring group ························································································································ 86 Configuring source ports for the local mirroring group ···················································································· 86 Configuring the monitor port for the local mirroring group·············································································· 87 Using the remote probe VLAN to enable local mirroring to support multiple monitor ports ························· 88
Configuring Layer 2 remote port mirroring ················································································································· 90 Layer 2 remote port mirroring configuration task list ························································································ 90 Configuring a remote source group (on the source device) ············································································· 90 Configuring a remote destination group (on the destination device) ······························································ 92
Displaying and maintaining port mirroring················································································································· 94 Port mirroring configuration examples························································································································· 95
Local port mirroring configuration example ······································································································· 95 Local port mirroring with multiple monitor ports configuration example························································· 96 Layer 2 remote port mirroring configuration example ······················································································ 97
Traffic mirroring configuration ······························································································································· 100 Introduction to traffic mirroring···································································································································100 Traffic mirroring configuration task list ······················································································································100 Configuring traffic mirroring ·······································································································································100
Configuring match criteria ·································································································································100 Configuring traffic mirroring of different types ································································································101 Configuring a QoS policy ··································································································································102 Applying a QoS policy·······································································································································102
Displaying and maintaining traffic mirroring············································································································104 Traffic mirroring configuration example ····················································································································104
Traffic mirroring configuration example ···········································································································104
NQA configuration ················································································································································· 107 NQA overview ·····························································································································································107
NQA features ······················································································································································107 NQA concepts·····················································································································································109 NQA probe operation procedure ·····················································································································110
NQA configuration task list ········································································································································110 Configuring the NQA server ······································································································································111 Enabling the NQA client ·············································································································································111 Creating an NQA test group······································································································································112 Configuring an NQA test group ································································································································112

iv
Configuring ICMP echo tests······························································································································112 Configuring DHCP tests ······································································································································113 Configuring DNS tests ········································································································································114 Configuring FTP tests···········································································································································115 Configuring HTTP tests ········································································································································116 Configuring UDP jitter tests·································································································································117 Configuring SNMP tests ·····································································································································119 Configuring TCP tests··········································································································································119 Configuring UDP echo tests································································································································120 Configuring voice tests ·······································································································································121 Configuring DLSw tests ·······································································································································123
Configuring the collaboration function ······················································································································124 Configuring threshold monitoring·······························································································································124 Configuring the NQA statistics collection function···································································································126 Configuring the history records saving function ·······································································································126 Configuring optional parameters for an NQA test group·······················································································127 Configuring a schedule for an NQA test group·······································································································128 Displaying and maintaining NQA·····························································································································129 NQA configuration examples ····································································································································129
ICMP echo test configuration example ·············································································································129 DHCP Test configuration example·····················································································································131 DNS test configuration example························································································································132 FTP test configuration example ··························································································································134 HTTP test configuration example························································································································135 UDP jitter test configuration example ················································································································136 SNMP test configuration example ·····················································································································139 TCP test configuration example ·························································································································140 UDP echo test configuration example ···············································································································142 Voice test configuration example ······················································································································143 DLSw test configuration example·······················································································································146 NQA collaboration configuration example······································································································147
sFlow configuration················································································································································· 150 sFlow overview·····························································································································································150
Introduction to sFlow ···········································································································································150 sFlow operation ···················································································································································150
Configuring sFlow························································································································································151 Configuring the sFlow agent and sFlow collector····························································································151 Configuring flow sampling·································································································································151 Configuring counter sampling····························································································································152
Displaying and maintaining sFlow·····························································································································152 sFlow configuration example ······································································································································152 Troubleshooting sFlow configuration ·························································································································154
IPC configuration····················································································································································· 155 IPC overview·································································································································································155
Node·····································································································································································155 Link ········································································································································································155 Channel ································································································································································155 Packet sending modes ········································································································································156
Enabling IPC performance statistics ···························································································································156 Displaying and maintaining IPC·································································································································157
PoE configuration ···················································································································································· 158 PoE overview ································································································································································158
Advantages ··························································································································································158

v
PoE concepts ························································································································································158 Protocol specification ··········································································································································159
PoE configuration task list ···········································································································································159 Enabling PoE for a PoE interface································································································································160 Detecting PDs································································································································································161
Enabling the PSE to detect nonstandard PDs ···································································································161 Configuring a PD disconnection detection mode ····························································································161
Configuring the maximum PoE interface power ·······································································································161 Configuring PoE interface power management········································································································162 Configuring the PoE monitoring function···················································································································163
Configuring PSE power monitoring···················································································································163 Monitoring PD······················································································································································163
Configuring PoE interface through PoE profile ·········································································································163 Configuring PoE profile ······································································································································164 Applying PoE profile ···········································································································································164
Upgrading PSE processing software in service ········································································································165 Displaying and maintaining PoE ································································································································165 PoE configuration example ·········································································································································166 Troubleshooting PoE ····················································································································································167
Cluster management configuration························································································································ 169 Cluster management overview ···································································································································169
Why cluster management···································································································································169 Roles in a cluster··················································································································································169 How a cluster works············································································································································170
Cluster management configuration task list···············································································································173 Configuring the management switch ·························································································································175
Enabling NDP globally and for specific ports··································································································175 Configuring NDP parameters ····························································································································175 Enabling NTDP globally and for specific ports ································································································175 Configuring NTDP parameters···························································································································176 Manually collecting topology information ········································································································177 Enabling the cluster function ······························································································································177 Establishing a cluster···········································································································································177 Enabling management VLAN auto-negotiation ································································································178 Configuring communication between the management switch and the member switches within a cluster··············································································································································································179 Configuring cluster management protocol packets ·························································································179 Cluster member management ····························································································································180
Configuring the member switches ······························································································································181 Enabling NDP ······················································································································································181 Enabling NTDP ····················································································································································181 Manually collecting topology information ········································································································181 Enabling the cluster function ······························································································································181 Deleting a member switch from a cluster··········································································································181
Configuring access between the management switch and its member switches ··················································181 Adding a candidate switch to a cluster ·····················································································································182 Configuring advanced cluster management functions ·····························································································182
Configuring topology management ··················································································································182 Configuring interaction for a cluster··················································································································183 SNMP configuration synchronization function·································································································184 Configuring web user accounts in batches ······································································································185
Displaying and maintaining cluster management ····································································································186 Cluster management configuration example ············································································································186

vi
Stack configuration ················································································································································· 190 Stack configuration overview······································································································································190
Introduction to stack ············································································································································190 Establishing a stack·············································································································································190
Stack configuration task list·········································································································································191 Configuring the master device of a stack··················································································································191
Configuring a private IP address pool for a stack···························································································191 Configuring stack ports·······································································································································191 Creating a stack ··················································································································································192
Configuring stack ports of a slave device ·················································································································192 Logging in to the CLI of a slave from the master ······································································································192 Displaying and maintaining stack configuration ······································································································193 Stack configuration example ······································································································································193
Index ········································································································································································ 195
1
System maintenance and debugging
You can use the ping command and the tracert command to verify network connectivity, and use the debug command to enable debugging and thus to diagnose system faults based on the debugging information.
Ping
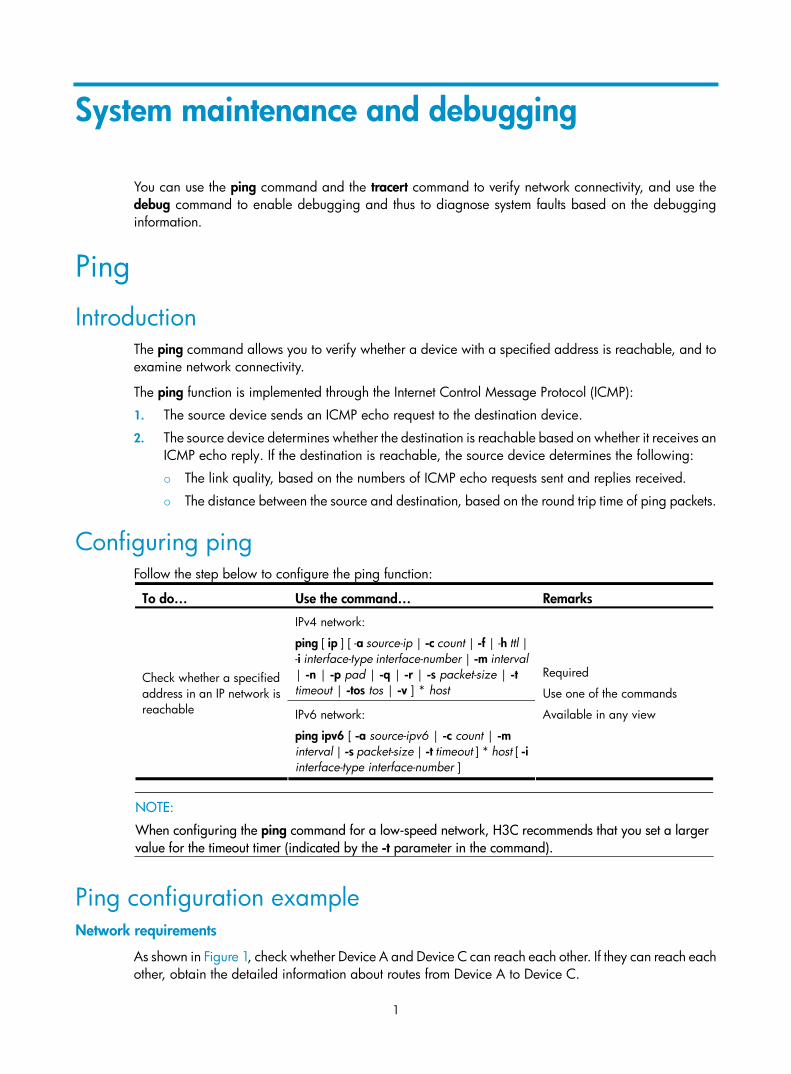
Introduction The ping command allows you to verify whether a device with a specified address is reachable, and to examine network connectivity.
The ping function is implemented through the Internet Control Message Protocol (ICMP):
1. The source device sends an ICMP echo request to the destination device.
2. The source device determines whether the destination is reachable based on whether it receives an ICMP echo reply. If the destination is reachable, the source device determines the following:
The link quality, based on the numbers of ICMP echo requests sent and replies received.
The distance between the source and destination, based on the round trip time of ping packets.
Configuring ping Follow the step below to configure the ping function:
To do… Use the command… Remarks
IPv4 network:
ping [ ip ] [ -a source-ip | -c count | -f | -h ttl | -i interface-type interface-number | -m interval | -n | -p pad | -q | -r | -s packet-size | -t timeout | -tos tos | -v ] * host
Check whether a specified address in an IP network is reachable IPv6 network:
ping ipv6 [ -a source-ipv6 | -c count | -m interval | -s packet-size | -t timeout ] * host [ -i interface-type interface-number ]
Required
Use one of the commands
Available in any view
NOTE:
When configuring the ping command for a low-speed network, H3C recommends that you set a larger value for the timeout timer (indicated by the -t parameter in the command).
Ping configuration example Network requirements
As shown in Figure 1, check whether Device A and Device C can reach each other. If they can reach each other, obtain the detailed information about routes from Device A to Device C.

2
Figure 1 Network diagram
Configuration procedure
# Use the ping command to display whether Device A and Device C can reach each other. <DeviceA> ping 1.1.2.2
PING 1.1.2.2: 56 data bytes, press CTRL_C to break
Reply from 1.1.2.2: bytes=56 Sequence=1 ttl=254 time=205 ms
Reply from 1.1.2.2: bytes=56 Sequence=2 ttl=254 time=1 ms
Reply from 1.1.2.2: bytes=56 Sequence=3 ttl=254 time=1 ms
Reply from 1.1.2.2: bytes=56 Sequence=4 ttl=254 time=1 ms
Reply from 1.1.2.2: bytes=56 Sequence=5 ttl=254 time=1 ms
--- 1.1.2.2 ping statistics ---
5 packet(s) transmitted
5 packet(s) received
0.00% packet loss
round-trip min/avg/max = 1/41/205 ms
# Get the detailed information about routes from Device A to Device C. <DeviceA> ping -r 1.1.2.2
PING 1.1.2.2: 56 data bytes, press CTRL_C to break
Reply from 1.1.2.2: bytes=56 Sequence=1 ttl=254 time=53 ms
Record Route:
1.1.2.1
1.1.2.2
1.1.1.2
1.1.1.1
Reply from 1.1.2.2: bytes=56 Sequence=2 ttl=254 time=1 ms
Record Route:
1.1.2.1
1.1.2.2
1.1.1.2
1.1.1.1
Reply from 1.1.2.2: bytes=56 Sequence=3 ttl=254 time=1 ms
Record Route:
1.1.2.1
1.1.2.2
1.1.1.2

3
1.1.1.1
Reply from 1.1.2.2: bytes=56 Sequence=4 ttl=254 time=1 ms
Record Route:
1.1.2.1
1.1.2.2
1.1.1.2
1.1.1.1
Reply from 1.1.2.2: bytes=56 Sequence=5 ttl=254 time=1 ms
Record Route:
1.1.2.1
1.1.2.2
1.1.1.2
1.1.1.1
--- 1.1.2.2 ping statistics ---
5 packet(s) transmitted
5 packet(s) received
0.00% packet loss
round-trip min/avg/max = 1/11/53 ms
The principle of ping –r is as shown in Figure 1.
1. The source (Device A) sends an ICMP echo request with the RR option being empty to the destination (Device C).
2. The intermediate device (Device B) adds the IP address (1.1.2.1) of its outbound interface to the RR option of the ICMP echo request, and forwards the packet.
3. Upon receiving the request, the destination device copies the RR option in the request and adds the IP address (1.1.2.2) of its outbound interface to the RR option. Then the destination device sends an ICMP echo reply.
4. The intermediate device adds the IP address (1.1.1.2) of its outbound interface to the RR option in the ICMP echo reply, and then forwards the reply.
5. Upon receiving the reply, the source device adds the IP address (1.1.1.1) of its inbound interface to the RR option. Finally, you can get the detailed information of routes from Device A to Device C: 1.1.1.1 <-> {1.1.1.2; 1.1.2.1} <-> 1.1.2.2.
Tracert
Introduction To check whether a network is available, you can use the tracert command to trace the Layer 3 device involved in delivering an IP packet from source to destination. This is useful for identification of failed nodes in the event of network failure.

4
Figure 2 Network diagram
The tracert function is implemented through ICMP, as shown in Figure 2:
1. The source (Device A) sends a packet with a TTL value of 1 to the destination (Device D). The UDP port of the packet is a port number that will not be used by any application of the destination.
2. The first hop (Device B) (the Layer 3 device that first receives the packet) responds by sending a TTL-expired ICMP error message to the source, with its IP address 1.1.1.2 encapsulated. In this way, the source device receives the address (1.1.1.2) of the first Layer 3 device.
3. The source device sends a packet with a TTL value of 2 to the destination device.
4. The second hop (Device C) responds with a TTL-expired ICMP error message, which gives the source device the address (1.1.2.2) of the second Layer 3 device.
5. The above process continues until the ultimate destination device is reached. No application of the destination uses this UDP port. Therefore, the destination replies a port unreachable ICMP error message with the destination IP address 1.1.3.2.
6. When the source device receives the port unreachable ICMP error message, it knows that the packet has reached the destination, and that it has received the addresses of all the Layer 3 devices involved in delivering the packet to the destination device (1.1.1.2, 1.1.2.2, 1.1.3.2).
Configuring tracert Configuration prerequisites
For an IPv4 network:
• Enable sending of ICMP timeout packets on the intermediate device (the device between the source and destination devices). If the intermediate device is an H3C device, execute the ip ttl-expires enable command on the device. For more information about this command, see Layer 3—IP Services Command Reference.
• Enable sending of ICMP destination unreachable packets on the destination device. If the destination device is an H3C device, execute the ip unreachables enable command. For more information about this command, see Layer 3—IP Services Command Reference.
For an IPv6 network:
• Enable sending of ICMPv6 timeout packets on the intermediate device (the device between the source and destination devices). If the intermediate device is an H3C device, execute the ipv6 hoplimit-expires enable command on the device. For more information about this command, see Layer 3—IP Services Command Reference.

5
• Enable sending of ICMPv6 destination unreachable packets on the destination device. If the destination device is an H3C device, execute the ipv6 unreachables enable command. For more information about this command, see Layer 3—IP Services Command Reference.
Tracert configuration
Follow the step below to configure tracert:
To do… Use the command… Remarks
IPv4 network:
tracert [ -a source-ip | -f first-ttl | -m max-ttl | -p port | -q packet-number | -w timeout ] * host Display the routes from source to
destination IPv6 network:
tracert ipv6 [ -f first-ttl | -m max-ttl | -p port | -q packet-number | -w timeout ] * host
Required
Use one of the commands
Available in any view
System debugging
Introduction to system debugging The device provides various debugging functions. For the majority of protocols and features supported, the system provides debugging information to help users diagnose errors.
The following two switches control the display of debugging information:
• Protocol debugging switch: Controls protocol-specific debugging information.
• Screen output switch: Controls whether to display the debugging information on a certain screen.
Displaying debugging information As shown in Figure 3, assume that the device can provide debugging for the three modules 1, 2, and 3. The debugging information can be output on a terminal only when both the protocol debugging switch and the screen output switch are turned on.

6
Figure 3 The relationship between the protocol and screen output switch
Configuring system debugging Administrators usually use the debugging commands to diagnose network failure. However, output of the debugging information may reduce system efficiency. Therefore, when debugging is completed, disable the debugging function that was used, or use the undo debugging all command to disable all the debugging functions.
Output of debugging information depends on the configurations of the information center and the debugging commands of each protocol and functional module. Debugging information is commonly output to a terminal (including console or VTY) for display. You can also output debugging information to other destinations. For more information, see Network Management and Monitoring Command Reference. By default, you can output debugging information to a terminal by following these steps:
To do… Use the command… Remarks
Enable the terminal monitoring of system information
terminal monitor
Optional
The terminal monitoring on the console is enabled by default and the terminal monitoring on the monitoring terminal is disabled by default.
Available in user view
Enable the terminal display of debugging information terminal debugging
Required
Disabled by default
Available in user view
Enable debugging for a specified module
debugging module-name [ option ]
Required
Disabled by default
Available in user view

7
To do… Use the command… Remarks
Display the enabled debugging functions
display debugging [ interface interface-type interface-number ] [ module-name ] [ | { begin | exclude | include } regular-expression ]
Optional
Available in any view
NOTE:
You must configure the debugging, terminal debugging and terminal monitor commands before you candisplay the detailed debugging information on the terminal. For more information about the terminal debugging and terminal monitor commands, see Network Management and Monitoring Command Reference.
Ping and tracert configuration example Network requirements
As shown in Figure 4, Device A failed to telnet Device C. Determine whether Device A and Device C can reach each other. If they cannot reach each other, locate the failed nodes in the network.
Figure 4 Network diagram
Configuration procedure
# Use the ping command to display whether Device A and Device C can reach each other. <DeviceA> ping 1.1.2.2
PING 1.1.2.2: 56 data bytes, press CTRL_C to break
Request time out
Request time out
Request time out
Request time out
Request time out
--- 1.1.2.2 ping statistics ---
5 packet(s) transmitted
0 packet(s) received
100.00% packet loss
# Device A and Device C cannot reach each other. Use the tracert command to determine failed nodes. <DeviceA> system-view
[DeviceA] ip ttl-expires enable
[DeviceA] ip unreachables enable
[DeviceA] tracert 1.1.2.2
traceroute to 1.1.2.2(1.1.2.2) 30 hops max,40 bytes packet, press CTRL_C to bre
ak
1 1.1.1.2 14 ms 10 ms 20 ms

8
2 * * *
3 * * *
4 * * *
5
<DeviceA>
The output shows that Device A and Device C cannot reach other, Device A and Device B can reach each other, and an error has occurred on the connection between Device B and Device C. In this case, use the debugging ip icmp command to enable ICMP debugging on Device A and Device C to check whether the devices send or receive the specified ICMP packets, or use the display ip routing-table command to display whether Device A and Device C can reach each other.

9
NTP configuration
NTP overview Defined in RFC 1305, the Network Time Protocol (NTP) synchronizes timekeeping among distributed time servers and clients. NTP runs over the User Datagram Protocol (UDP), using UDP port 123.
The purpose of using NTP is to keep consistent timekeeping among all clock-dependent devices within a network so that the devices can provide diverse applications based on the consistent time.
The time of a local system that runs NTP can be synchronized to other reference sources and used as a reference source to synchronize other clocks..
Applications of NTP An administrator is unable to keep time synchronized among all the devices within a network by changing the system clock on each station, because this would be a huge workload and would not guarantee clock precision. NTP, however, allows quick clock synchronization within the entire network and ensures a high degree of clock precision.
NTP is used when all devices within the network must be consistent in timekeeping. For example:
• In analysis of the log information and debugging information collected from different devices in network management, time must be used as reference basis.
• All devices must use the same reference clock in a charging system.
• To implement certain functions, such as scheduled restart of all devices within the network, all devices must be consistent in timekeeping.
• To ensure the correct execution sequence, when multiple systems process a complex event in cooperation, the systems must all use the same reference clock.
• For incremental backup between a backup server and clients, timekeeping must be synchronized between the backup server and all the clients.
Advantages of NTP • NTP uses a stratum to describe clock precision, and is able to synchronize time among all devices
within the network.
• NTP supports access control and MD5 authentication.
• NTP can unicast, multicast or broadcast protocol messages.
NOTE:
• Clock stratum determines the accuracy of a server, which ranges from 1 to 16. Clock accuracy decreasesas the stratum number increases. The stratum of a reference clock ranges from 1 to 15. A stratum 16 clock is in unsynchronized state.
• The local clock of a switch cannot operate as a reference clock. It can serve as an NTP server only afterit is synchronized.

10
How NTP works Figure 5 shows the basic workflow of NTP. Device A and Device B are connected over a network. They have their own independent system clocks, which need to be automatically synchronized through NTP. Assume that:
• Prior to system clock synchronization between Device A and Device B, the clock of Device A is set to 10:00:00 am while that of Device B is set to 11:00:00 am.
• Device B is used as the NTP time server (Device A synchronizes its clock to that of Device B).
• It takes 1 second for an NTP message to travel from one device to the other.
Figure 5 Basic work flow of NTP
IP network
IP network
IP network
IP network
Device BDevice A
Device BDevice A
Device BDevice A
Device BDevice A
10:00:00 am 11:00:01 am
10:00:00 am
NTP message 10:00:00 am 11:00:01 am 11:00:02 am
NTP message
NTP message
NTP message received at 10:00:03 am
1.
3.
2.
4.
The process of system clock synchronization is as follows:
• Device A sends Device B an NTP message, which is timestamped when it leaves Device A. The time stamp is 10:00:00 am (T1).
• When this NTP message arrives at Device B, it is timestamped by Device B. The timestamp is 11:00:01 am (T2).
• When the NTP message leaves Device B, Device B timestamps it. The timestamp is 11:00:02 am (T3).
• When Device A receives the NTP message, the local time of Device A is 10:00:03 am (T4).
Up to now, Device A has sufficient information to calculate the following two important parameters:
• The roundtrip delay of NTP message: Delay = (T4–T1) – (T3-T2) = 2 seconds.
• Time difference between Device A and Device B: Offset = ((T2-T1) + (T3-T4))/2 = 1 hour.
Based on these parameters, Device A can synchronize its own clock to the clock of Device B.
This is only a rough description of the work mechanism of NTP. For more information, see RFC 1305.

11
NTP message format NTP uses two types of messages: clock synchronization messages and NTP control messages. An NTP control message is used in environments where network management is needed. Because it is not essential for clock synchronization, it is not described in this document.
NOTE:
All NTP messages mentioned in this document refer to NTP clock synchronization messages.
A clock synchronization message is encapsulated in a UDP message, in the format shown in Figure 6.
Figure 6 Clock synchronization message format
LI VN Mode Stratum Poll Precision
0 7 15 23 31
Root delay (32 bits)
Root dispersion (32 bits)
Reference identifier (32 bits)
Receive timestamp (64 bits)
Transmit timestamp (64 bits)
Authenticator (optional 96 bits)
Reference timestamp (64 bits)
Originate timestamp (64 bits)
1 4
The clock synchronization message format includes the following fields:
• LI (Leap Indicator): A 2-bit leap indicator. When set to 11, it warns of an alarm condition (clock unsynchronized). When set to any other value, it is not to be processed by NTP.
• VN (Version Number): A 3-bit version number that indicates the version of NTP. The latest version is version 3.
• Mode: A 3-bit code that indicates the work mode of NTP. This field can be set to these values:
0—reserved
1—symmetric active
2—symmetric passive
3—client
4—server
5—broadcast or multicast
6—NTP control message
7—reserved for private use.

12
• Stratum: An 8-bit integer that indicates the stratum level of the local clock, with the value ranging from 1 to 16. Clock precision decreases from stratum 1 through stratum 16. A stratum 1 clock has the highest precision. A stratum 16 clock is not synchronized.
• Poll: An 8-bit signed integer that indicates the maximum interval between successive messages, which is called the poll interval.
• Precision: An 8-bit signed integer that indicates the precision of the local clock.
• Root Delay: Roundtrip delay to the primary reference source.
• Root Dispersion: The maximum error of the local clock relative to the primary reference source.
• Reference Identifier: Identifier of the particular reference source.
• Reference Timestamp: The local time at which the local clock was last set or corrected.
• Originate Timestamp: The local time at which the request departed from the client for the service host.
• Receive Timestamp: The local time at which the request arrived at the service host.
• Transmit Timestamp: The local time at which the reply departed from the service host for the client.
• Authenticator: authentication information.
Operation modes of NTP Devices that run NTP can implement clock synchronization in one of the following modes:
• Client/server mode
• Symmetric peers mode
• Broadcast mode
• Multicast mode
You can select operation modes of NTP as needed. If the IP address of the NTP server or peer is unknown and many devices in the network need to be synchronized, you can adopt the broadcast or multicast mode. In the client/server and symmetric peers modes, a device is synchronized from the specified server or peer, so clock reliability is enhanced.
Client/server mode
Figure 7 Client/server mode
When working in client/server mode, a client sends a clock synchronization message to servers, with the Mode field in the message set to 3 (client mode). Upon receiving the message, the servers automatically work in server mode and send a reply, with the Mode field in the messages set to 4 (server mode). Upon receiving the replies from the servers, the client performs clock filtering and selection, and synchronizes its local clock to that of the optimal reference source.

13
In client/server mode, a client can be synchronized to a server, but a server cannot be synchronized to a client.
Symmetric peers mode
Figure 8 Symmetric peers mode
In symmetric peers mode:
1. Devices that work in symmetric active mode and symmetric passive mode exchange NTP messages with the Mode field 3 (client mode) and 4 (server mode).
2. Then the device that works in symmetric active mode periodically sends clock synchronization messages, with the Mode field in the messages set to 1 (symmetric active).
3. The device that receives the messages automatically enters symmetric passive mode and sends a reply, with the Mode field in the message set to 2 (symmetric passive).
This exchange of messages establishes symmetric peers mode between the two devices, so the two devices can synchronize, or be synchronized by, each other. If the clocks of both devices have been synchronized, the device whose local clock has a lower stratum level synchronizes the clock of the other device.
Broadcast mode
Figure 9 Broadcast mode
In broadcast mode:
1. A server periodically sends clock synchronization messages to broadcast address 255.255.255.255, with the Mode field in the messages set to 5 (broadcast mode).

14
2. Clients listen to the broadcast messages from servers. When a client receives the first broadcast message, the client and the server start to exchange messages with the Mode field set to 3 (client mode) and 4 (server mode), to calculate the network delay between client and the server.
3. Then the client enters broadcast client mode. The client continues listening to broadcast messages, and synchronizes its local clock based on the received broadcast messages.
Multicast mode
Figure 10 Multicast mode
In multicast mode:
1. A server periodically sends clock synchronization messages to the user-configured multicast address, or, if no multicast address is configured, to the default NTP multicast address 224.0.1.1, with the Mode field in the messages set to 5 (multicast mode).
2. Clients listen to the multicast messages from servers. When a client receives the first multicast message, the client and the server start to exchange messages with the Mode field set to 3 (client mode) and 4 (server mode), to calculate the network delay between client and server.
3. Then, the client enters multicast client mode. It continues listening to multicast messages, and synchronizes its local clock based on the received multicast messages.
NOTE:
In symmetric peers mode, broadcast mode and multicast mode, the client (or the symmetric active peer) and the server (the symmetric passive peer) can work in the specified NTP working mode only after theyexchange NTP messages with the Mode field being 3 (client mode) and the Mode field being 4 (server mode). During this message exchange process, NTP clock synchronization can be implemented.
NTP configuration task list Complete the following tasks to configure NTP:
Task Remarks
Configuring the operation modes of NTP Required
Configuring optional parameters of NTP Optional
Configuring access-control rights Optional
Configuring NTP authentication Optional

15
Configuring the operation modes of NTP Devices can implement clock synchronization in one of the following modes:
• Client/server mode
• Symmetric mode
• Broadcast mode
• Multicast mode
For client/server mode or symmetric mode, you need to configure only clients or symmetric-active peers. For broadcast or multicast mode, you need to configure both servers and clients.
Operation modes and static and dynamic associations A single device can have a maximum of 128 associations at the same time, including static associations and dynamic associations.
• A static association refers to an association that a user has manually created by using an NTP command.
• A dynamic association is a temporary association created by the system during operation. A dynamic association is removed if the system fails to receive messages from it over a specific long time.
Operation modes affect the creation of associations in the following ways:
• In client/server mode, when you execute a command to synchronize the time to a server, the system creates a static association. The server will not create an association (static or dynamic), but will simply respond passively upon the receipt of a message.
• In symmetric mode, static associations are created at the symmetric-active peer side, and dynamic associations are created at the symmetric-passive peer side.
• In broadcast or multicast mode, static associations are created at the server side, and dynamic associations are created at the client side.
Configuring NTP client/server mode For devices working in client/server mode, perform configurations on the clients.
Follow these steps to specify an NTP server on the client:
To do… Use the command… Remarks
Enter system view system-view —
Specify an NTP server for the device
ntp-service unicast-server { ip-address | server-name } [ authentication-keyid keyid | priority | source-interface interface-type interface-number | version number ] *
Required
No NTP server is specified by default.

16
NOTE:
• In the ntp-service unicast-server command, ip-address must be a unicast address. It cannot be a broadcast address, a multicast address or the IP address of the local clock.
• When the source interface for NTP messages is specified by the source-interface keyword, the source IPaddress of the NTP messages is configured as the primary IP address of the specified interface.
• A device can act as a server to synchronize the clock of other devices only after its clock has been synchronized. If the clock of a server has a stratum level higher than or equal to that of a client’s clock,the client will not synchronize its clock to that server’s clock.
• You can configure multiple servers by repeating the ntp-service unicast-server command. The clients will select the optimal reference source.
Configuring the NTP symmetric peers mode For devices working in symmetric mode, specify a symmetric-passive peer for a symmetric-active peer.
Following these steps to specify a symmetric-passive peer on the active peer:
To do… Use the command… Remarks
Enter system view system-view —
Specify a symmetric-passive peer for the device
ntp-service unicast-peer { ip-address | peer-name } [ authentication-keyid keyid | priority | source-interface interface-type interface-number | version number ] *
Required
No symmetric-passive peer is specified by default.
NOTE:
• In symmetric mode, use the any NTP configuration command in Configuring the operation modes of NTP to enable NTP. Otherwise, a symmetric-passive peer will not process NTP messages from a symmetric-active peer.
• In the ntp-service unicast-peer command, ip-address must be a unicast address, rather than a broadcast address, a multicast address or the IP address of the local clock.
• When the source interface for NTP messages is specified by the source-interface keyword, the source IPaddress of the NTP messages is configured as the primary IP address of the specified interface.
• Typically, at least one of the symmetric-active and symmetric-passive peers has been synchronized. Otherwise the clock synchronization will not proceed.
• You can configure multiple symmetric-passive peers by repeating the ntp-service unicast-peer command.
Configuring NTP broadcast mode The broadcast server periodically sends NTP broadcast messages to the broadcast address 255.255.255.255. After receiving the messages, the device working in NTP broadcast client mode sends a reply and synchronizes its local clock.
For devices working in broadcast mode, configure both the server and the clients. NTP broadcast mode can be configured only in the specific interface view, because an interface needs to be specified on the broadcast server for sending NTP broadcast messages and an interface also needs to be specified on each broadcast client for receiving broadcast messages.

17
Configuring a broadcast client
To do… Use the command… Remarks
Enter system view system-view —
Enter VLAN interface view interface interface-type interface-number
Required
Enter the VLAN interface used to receive NTP broadcast messages.
Configure the device to work in NTP broadcast client mode ntp-service broadcast-client Required
Configuring the broadcast server
To do… Use the command… Remarks
Enter system view system-view —
Enter VLAN interface view interface interface-type interface-number
Enter the VLAN interface used to send NTP broadcast messages.
Configure the device to work in NTP broadcast server mode
ntp-service broadcast-server [ authentication-keyid keyid | version number ] *
Required
NOTE:
A broadcast server can synchronize broadcast clients only when its clock has been synchronized.
Configuring NTP multicast mode The multicast server periodically sends NTP multicast messages to multicast clients, which send replies after they receive the messages and synchronize their local clocks.
For devices working in multicast mode, configure both the server and clients. The NTP multicast mode must be configured in the specific interface view.
Configuring a multicast client
To do… Use the command… Remarks
Enter system view system-view —
Enter VLAN interface view interface interface-type interface-number
Enter the VLAN interface used to receive NTP multicast messages.
Configure the device to work in NTP multicast client mode
ntp-service multicast-client [ ip-address ] Required
Configuring the multicast server
To do… Use the command… Remarks
Enter system view system-view —
Enter VLAN interface view interface interface-type interface-number
Enter the VLAN interface used to send NTP multicast message.

18
To do… Use the command… Remarks
Configure the device to work in NTP multicast server mode
ntp-service multicast-server [ ip-address ] [ authentication-keyid keyid | ttl ttl-number | version number ] *
Required
NOTE:
• A multicast server can synchronize broadcast clients only when its clock has been synchronized.
• You can configure up to 1024 multicast clients, among which 128 can take effect at the same time.
Configuring optional parameters of NTP
Specifying the source interface for NTP messages If you specify the source interface for NTP messages, the device sets the source IP address of the NTP messages as the primary IP address of the specified interface when sending the NTP messages.
When the device responds to an NTP request received, the source IP address of the NTP response is always the IP address of the interface that received the NTP request.
Following these steps to specify the source interface for NTP messages:
To do… Use the command… Remarks
Enter system view system-view —
Specify the source interface for NTP messages
ntp-service source-interface interface-type interface-number
Required
By default, no source interface is specified for NTP messages, and the system uses the IP address of the interface determined by the matching route as the source IP address of NTP messages.
CAUTION:
• If you have specified the source interface for NTP messages in the ntp-service unicast-server or ntp-service unicast-peer command, the interface specified in the ntp-service unicast-server or ntp-service unicast-peer command serves as the source interface of NTP messages.
• If you have configured the ntp-service broadcast-server or ntp-service multicast-server command, thesource interface of the broadcast or multicast NTP messages is the interface configured with the respective command.
• If the specified source interface for NTP messages is down, the source IP address for an NTP message that is sent out is the primary IP address of the outgoing interface of the NTP message.
Disabling an interface from receiving NTP messages When NTP is enabled, NTP messages can be received from all the interfaces by default.
Follow these steps to disable an interface from receiving NTP messages:
To do… Use the command… Remarks
Enter system view system-view —

19
To do… Use the command… Remarks
Enter VLAN interface view interface interface-type interface-number —
Disable the interface from receiving NTP messages ntp-service in-interface disable
Required
An interface is enabled to receive NTP messages by default.
Configuring the maximum number of dynamic sessions allowed
To do… Use the command… Remarks
Enter system view system-view —
Configure the maximum number of dynamic sessions allowed to be established locally
ntp-service max-dynamic-sessions number
Required
100 by default.
Configuring access-control rights With the following command, you can configure the NTP service access-control right to the local device. There are four access-control rights, as follows:
• query: Control query permitted. This level of right permits the peer devices to perform control query to the NTP service on the local device but does not permit a peer device to synchronize its clock to that of the local device. The so-called “control query” refers to query of some states of the NTP service, including alarm information, authentication status, clock source information, and so on.
• synchronization: Server access only. This level of right permits a peer device to synchronize its clock to that of the local device but does not permit the peer devices to perform control query.
• server: Server access and query permitted. This level of right permits the peer devices to perform synchronization and control query to the local device but does not permit the local device to synchronize its clock to that of a peer device.
• peer: Full access. This level of right permits the peer devices to perform synchronization and control query to the local device and also permits the local device to synchronize its clock to that of a peer device.
From the highest NTP service access-control right to the lowest one are peer, server, synchronization, and query. When a device receives an NTP request, it performs an access-control right match and uses the first matched right.
Configuration prerequisites Prior to configuring the NTP service access-control right to the local device, create and configure an ACL associated with the access-control right. For more information about ACLs, see ACL and QoS Configuration Guide.
Configuration procedure Follow these steps to configure the NTP service access-control right to the local device:

20
To do… Use the command… Remarks
Enter system view system-view —
Configure the NTP service access-control right for a peer device to access the local device
ntp-service access { peer | query | server | synchronization } acl-number
Required
peer by default
NOTE:
The access-control right mechanism provides only a minimum level of security protection for a system running NTP. A more secure method is identity authentication.
Configuring NTP authentication NTP authentication should be enabled for a system running NTP in a network with a high security demand. It enhances the network security by means of client-server key authentication, which prohibits a client from synchronizing with a device that has failed authentication.
Configuration prerequisites NTP authentication requires configuration on the client and on the server.
The following principles apply:
• For all synchronization modes, when you enable the NTP authentication feature, configure an authentication key and specify it as a trusted key. In other words, the ntp-service authentication enable command must work together with the ntp-service authentication-keyid command and the ntp-service reliable authentication-keyid command. Otherwise, the NTP authentication function cannot be normally enabled.
• For client/server mode or symmetric mode, associate the specified authentication key on the client (symmetric-active peer if in the symmetric peer mode) with the corresponding NTP server (symmetric-passive peer if in the symmetric peer mode). Otherwise, the NTP authentication feature cannot be normally enabled.
• For broadcast server mode or multicast server mode, associate the specified authentication key on the broadcast server or multicast server with the corresponding NTP server. Otherwise, the NTP authentication feature cannot be normally enabled.
• For client/server mode, if the NTP authentication feature has not been enabled for the client, the client can synchronize with the server regardless of whether the NTP authentication feature has been enabled for the server. If the NTP authentication is enabled on a client, the client can be synchronized only to a server that can provide a trusted authentication key.
• For all synchronization modes, the server side configuration and the client side configuration must be consistently.
Configuration procedure Configuring NTP authentication for a client
Follow these steps to configure NTP authentication for a client:
To do… Use the command… Remarks
Enter system view system-view —

21
To do… Use the command… Remarks
Enable NTP authentication ntp-service authentication enable
Required
Disabled by default
Configure an NTP authentication key
ntp-service authentication-keyid keyid authentication-mode md5 value
Required
No NTP authentication key by default
Configure the key as a trusted key
ntp-service reliable authentication-keyid keyid
Required
By default, no authentication key is configured to be trusted.
Client/server mode:
ntp-service unicast-server { ip-address | server-name } authentication-keyid keyid Associate the
specified key with an NTP server Symmetric peers mode:
ntp-service unicast-peer { ip-address | peer-name } authentication-keyid keyid
Required
You can associate a non-existing key with an NTP server. To enable NTP authentication, you must configure the key and specify it as a trusted key after associating the key with the NTP server.
NOTE:
After you enable the NTP authentication feature for the client, make sure that the authentication key you configure for the client is the same as on the server, and specify that the authentication key is trusted. Otherwise, the client cannot be synchronized to the server.
Configuring NTP authentication for a server
Follow these steps to configure NTP authentication for a server:
To do… Use the command… Remarks
Enter system view system-view —
Enable NTP authentication ntp-service authentication enable
Required
Disabled by default
Configure an NTP authentication key
ntp-service authentication-keyid keyid authentication-mode md5 value
Required
No NTP authentication key by default
Configure the key as a trusted key
ntp-service reliable authentication-keyid keyid
Required
By default, no authentication key is configured to be trusted.
Enter VLAN interface view interface interface-type interface-number —
Broadcast server mode:
ntp-service broadcast-server authentication-keyid keyid Associate the
specified key with an NTP server Multicast server mode:
ntp-service multicast-server authentication-keyid keyid
Required
You can associate a non-existing key with an NTP server. To enable NTP authentication, you must configure the key and specify it as a trusted key after associating the key with the NTP server.
NOTE:
The procedure for configuring NTP authentication on a server is the same as on a client. Aslo, the same authentication key must be configured on both the server and client.

22
Displaying and maintaining NTP To do… Use the command… Remarks
Display information about NTP service status
display ntp-service status [ | { begin | exclude | include } regular-expression ]
Available in any view
Display information about NTP sessions
display ntp-service sessions [ verbose ] [ | { begin | exclude | include } regular-expression ]
Available in any view
Display the brief information about the NTP servers from the local device back to the primary reference source
display ntp-service trace [ | { begin | exclude | include } regular-expression ]
Available in any view
NTP configuration examples
Configuring NTP client/server mode Network requirements
Perform the following configurations to synchronize the time between Device B and Device A:
• As shown in Figure 11, the local clock of Device A is to be used as a reference source, with the stratum level of 2.
• Device B works in client/server mode and Device A is to be used as the NTP server of Device B.
Figure 11 Network diagram
Configuration procedure
1. Set the IP address for each interface as shown in Figure 11. (Details not shown)
2. Configure Device B:
# View the NTP status of Device B before clock synchronization. <DeviceB> display ntp-service status
Clock status: unsynchronized
Clock stratum: 16
Reference clock ID: none
Nominal frequency: 64.0000 Hz
Actual frequency: 64.0000 Hz
Clock precision: 2^7
Clock offset: 0.0000 ms
Root delay: 0.00 ms
Root dispersion: 0.00 ms
Peer dispersion: 0.00 ms
Reference time: 00:00:00.000 UTC Jan 1 1900 (00000000.00000000)
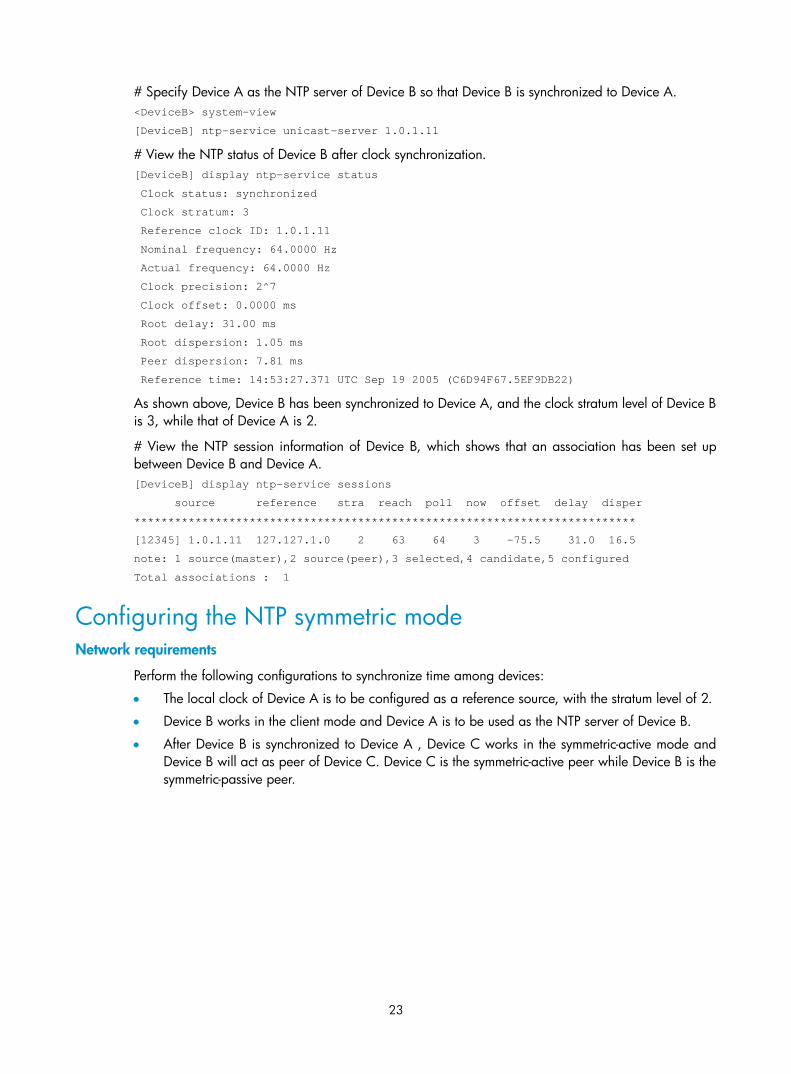
23
# Specify Device A as the NTP server of Device B so that Device B is synchronized to Device A. <DeviceB> system-view
[DeviceB] ntp-service unicast-server 1.0.1.11
# View the NTP status of Device B after clock synchronization. [DeviceB] display ntp-service status
Clock status: synchronized
Clock stratum: 3
Reference clock ID: 1.0.1.11
Nominal frequency: 64.0000 Hz
Actual frequency: 64.0000 Hz
Clock precision: 2^7
Clock offset: 0.0000 ms
Root delay: 31.00 ms
Root dispersion: 1.05 ms
Peer dispersion: 7.81 ms
Reference time: 14:53:27.371 UTC Sep 19 2005 (C6D94F67.5EF9DB22)
As shown above, Device B has been synchronized to Device A, and the clock stratum level of Device B is 3, while that of Device A is 2.
# View the NTP session information of Device B, which shows that an association has been set up between Device B and Device A. [DeviceB] display ntp-service sessions
source reference stra reach poll now offset delay disper
**************************************************************************
[12345] 1.0.1.11 127.127.1.0 2 63 64 3 -75.5 31.0 16.5
note: 1 source(master),2 source(peer),3 selected,4 candidate,5 configured
Total associations : 1
Configuring the NTP symmetric mode Network requirements
Perform the following configurations to synchronize time among devices:
• The local clock of Device A is to be configured as a reference source, with the stratum level of 2.
• Device B works in the client mode and Device A is to be used as the NTP server of Device B.
• After Device B is synchronized to Device A , Device C works in the symmetric-active mode and Device B will act as peer of Device C. Device C is the symmetric-active peer while Device B is the symmetric-passive peer.

24
Figure 12 Network diagram
Device A
Device B Device C
3.0.1.31/24
3.0.1.32/24 3.0.1.33/24
Configuration procedure
1. Configure IP addresses for interfaces. (Details not shown)
2. Configure Device B:
# Specify Device A as the NTP server of Device B. <DeviceB> system-view
[DeviceB] ntp-service unicast-server 3.0.1.31
3. View the NTP status of Device B after clock synchronization. [DeviceB] display ntp-service status
Clock status: synchronized
Clock stratum: 3
Reference clock ID: 3.0.1.31
Nominal frequency: 100.0000 Hz
Actual frequency: 100.0000 Hz
Clock precision: 2^18
Clock offset: -21.1982 ms
Root delay: 15.00 ms
Root dispersion: 775.15 ms
Peer dispersion: 34.29 ms
Reference time: 15:22:47.083 UTC Sep 19 2005 (C6D95647.153F7CED)
The output shows that Device B has been synchronized to Device A, and the clock stratum level of Device B is 3.
4. Configure Device C (after Device B is synchronized to Device A):
# Configure Device C as a symmetric peer after local synchronization. [DeviceC] ntp-service unicast-peer 3.0.1.32
The output shows that Device B and Device C are configured as symmetric peers, with Device C in the symmetric-active mode and Device B in the symmetric-passive mode. Because the stratus level of Device C is 16 while that of Device B is 3, Device B is synchronized to Device C.
# View the NTP status of Device C after clock synchronization. [DeviceC] display ntp-service status
Clock status: synchronized
Clock stratum: 4
Reference clock ID: 3.0.1.32

25
Nominal frequency: 100.0000 Hz
Actual frequency: 100.0000 Hz
Clock precision: 2^18
Clock offset: -21.1982 ms
Root delay: 15.00 ms
Root dispersion: 775.15 ms
Peer dispersion: 34.29 ms
Reference time: 15:22:47.083 UTC Sep 19 2005 (C6D95647.153F7CED)
The output shows that Device C has been synchronized to Device B and the clock stratum level of Device C is 4.
# View the NTP session information of Device C, which shows that an association has been set up between Device B and Device C. [DeviceC] display ntp-service sessions
source reference stra reach poll now offset delay disper
********************************************************************************
[12345] 3.0.1.32 3.0.1.31 3 3 64 16 -6.4 4.8 1.0
note: 1 source(master),2 source(peer),3 selected,4 candidate,5 configured
Total associations : 1
Configuring NTP broadcast mode Network requirements
As shown in Figure 13, Device C functions as the NTP server for multiple devices on a network segment and synchronizes the time among multiple devices as follows:
• Device C’s local clock is to be used as a reference source, with the stratum level of 2.
• Device C works in broadcast server mode and sends out broadcast messages from VLAN-interface 2.
• Device A and Device B work in broadcast client mode, and each listen to broadcast messages through their VLAN-interface 2.
Figure 13 Network diagram
Vlan-int23.0.1.31/24
Vlan-int23.0.1.32/24
Vlan-int23.0.1.30/24
Device A
Device C
Device B
Configuration procedure
1. Set the IP address for each interface as shown in Figure 13. (Details not shown)

26
2. Configure Device C:
# Configure Device C to work in broadcast server mode and send broadcast messages through VLAN-interface 2. [DeviceC] interface vlan-interface 2
[DeviceC-Vlan-interface2] ntp-service broadcast-server
3. Configure Device A:
# Configure Device A to work in broadcast client mode and receive broadcast messages on VLAN-interface 2. <DeviceA> system-view
[DeviceA] interface vlan-interface 2
[DeviceA-Vlan-interface2] ntp-service broadcast-client
4. Configure Device B:
# Configure Device B to work in broadcast client mode and receive broadcast messages on VLAN-interface 2. <DeviceB> system-view
[DeviceB] interface vlan-interface 2
[DeviceB-Vlan-interface2] ntp-service broadcast-client
Device A and Device B get synchronized upon receiving a broadcast message from Device C.
# Take Device A as an example. View the NTP status of Device A after clock synchronization. [DeviceA-Vlan-interface2] display ntp-service status
Clock status: synchronized
Clock stratum: 3
Reference clock ID: 3.0.1.31
Nominal frequency: 64.0000 Hz
Actual frequency: 64.0000 Hz
Clock precision: 2^7
Clock offset: 0.0000 ms
Root delay: 31.00 ms
Root dispersion: 8.31 ms
Peer dispersion: 34.30 ms
Reference time: 16:01:51.713 UTC Sep 19 2005 (C6D95F6F.B6872B02)
As shown above, Device A has been synchronized to Device C, and the clock stratum level of Device A is 3, while that of Device C is 2.
# View the NTP session information of Device A, which shows that an association has been set up between Device A and Device C. [DeviceA-Vlan-interface2] display ntp-service sessions
source reference stra reach poll now offset delay disper
**************************************************************************
[1234] 3.0.1.31 127.127.1.0 2 254 64 62 -16.0 32.0 16.6
note: 1 source(master),2 source(peer),3 selected,4 candidate,5 configured
Total associations : 1

27
Configuring NTP multicast mode Network requirements
As shown in Figure 14, Device C functions as the NTP server for multiple devices on different network segments and synchronizes the time among multiple devices as follows:
• Device C’s local clock is to be used as a reference source, with the stratum level of 2.
• Device C works in multicast server mode and sends out multicast messages from VLAN-interface 2.
• Device A and Device D work in multicast client mode and receive multicast messages through VLAN-interface 3 and VLAN-interface 2 respectively.
NOTE:
In this example, Switch B must be a Layer 3 switch supporting multicast routing.
Figure 14 Network diagram
Vlan-int31.0.1.11/24
Vlan-int31.0.1.10/24
Vlan-int23.0.1.31/24
Vlan-int23.0.1.32/24
Vlan-int23.0.1.30/24
Device A Device B
Device C
Device D
Configuration procedure
1. Set the IP address for each interface as shown in Figure 14. (Details not shown)
2. Configure Device C:
# Configure Device C to work in multicast server mode and send multicast messages through VLAN-interface 2. [DeviceC] interface vlan-interface 2
[DeviceC-Vlan-interface2] ntp-service multicast-server
3. Configure Device D:
# Configure Device D to work in multicast client mode and receive multicast messages on VLAN-interface 2. <DeviceD> system-view
[DeviceD] interface vlan-interface 2
[DeviceD-Vlan-interface2] ntp-service multicast-client
Because Device D and Device C are on the same subnet, Device D can receive the multicast messages from Device C without being enabled with the multicast functions and can be synchronized to Device C.
# View the NTP status of Device D after clock synchronization. [DeviceD-Vlan-interface2] display ntp-service status

28
Clock status: synchronized
Clock stratum: 3
Reference clock ID: 3.0.1.31
Nominal frequency: 64.0000 Hz
Actual frequency: 64.0000 Hz
Clock precision: 2^7
Clock offset: 0.0000 ms
Root delay: 31.00 ms
Root dispersion: 8.31 ms
Peer dispersion: 34.30 ms
Reference time: 16:01:51.713 UTC Sep 19 2005 (C6D95F6F.B6872B02)
As shown above, Device D has been synchronized to Device C, and the clock stratum level of Device D is 3, while that of Device C is 2.
# View the NTP session information of Device D, which shows that an association has been set up between Device D and Device C. [DeviceD-Vlan-interface2] display ntp-service sessions
source reference stra reach poll now offset delay disper
**************************************************************************
[1234] 3.0.1.31 127.127.1.0 2 254 64 62 -16.0 31.0 16.6
note: 1 source(master),2 source(peer),3 selected,4 candidate,5 configured
Total associations : 1
4. Configure Device B:
Because Device A and Device C are on different subnets, you must enable the multicast functions on Device B before Device A can receive multicast messages from Device C.
# Enable IP multicast routing and IGMP. <DeviceB> system-view
[DeviceB] multicast routing-enable
[DeviceB] interface vlan-interface 2
[DeviceB-Vlan-interface2] pim dm
[DeviceB-Vlan-interface2] quit
[DeviceB] vlan 3
[DeviceB-vlan3] port gigabitethernet 1/0/1
[DeviceB-vlan3] quit
[DeviceB] interface vlan-interface 3
[DeviceB-Vlan-interface3] igmp enable
[DeviceB-Vlan-interface3] igmp static-group 224.0.1.1
[DeviceB-Vlan-interface3] quit
[DeviceB] interface gigabitethernet 1/0/1
[DeviceB-GigabitEthernet1/0/1] igmp-snooping static-group 224.0.1.1 vlan 3
5. Configure Device A: <DeviceA> system-view
[DeviceA] interface vlan-interface 3
# Configure Device A to work in multicast client mode and receive multicast messages on VLAN-interface 3. [DeviceA-Vlan-interface3] ntp-service multicast-client
# View the NTP status of Device A after clock synchronization.

29
[DeviceA-Vlan-interface3] display ntp-service status
Clock status: synchronized
Clock stratum: 3
Reference clock ID: 3.0.1.31
Nominal frequency: 64.0000 Hz
Actual frequency: 64.0000 Hz
Clock precision: 2^7
Clock offset: 0.0000 ms
Root delay: 40.00 ms
Root dispersion: 10.83 ms
Peer dispersion: 34.30 ms
Reference time: 16:02:49.713 UTC Sep 19 2005 (C6D95F6F.B6872B02)
As shown above, Device A has been synchronized to Device C, and the clock stratum level of Device A is 3, while that of Device C is 2.
# View the NTP session information of Device A, which shows that an association has been set up between Device A and Device C. [DeviceA-Vlan-interface3] display ntp-service sessions
source reference stra reach poll now offset delay disper
**************************************************************************
[1234] 3.0.1.31 127.127.1.0 2 255 64 26 -16.0 40.0 16.6
note: 1 source(master),2 source(peer),3 selected,4 candidate,5 configured
Total associations : 1
Configuring NTP client/server mode with authentication Network requirements
As shown in Figure 15, perform the following configurations to synchronize the time between Device B and Device A and ensure network security as follows:
• The local clock of Device A is to be configured as a reference source, with the stratum level of 2.
• Device B works in client mode and Device A is to be used as the NTP server of Device B, with Device B as the client.
• NTP authentication is to be enabled on both Device A and Device B.
Figure 15 Network diagram
1.0.1.11/24 1.0.1.12/24
Device A Device B
Configuration procedure
1. Set the IP address for each interface as shown in Figure 15. (Details not shown)
2. Configure Device B: <DeviceB> system-view
# Enable NTP authentication on Device B. [DeviceB] ntp-service authentication enable
# Set an authentication key.

30
[DeviceB] ntp-service authentication-keyid 42 authentication-mode md5 aNiceKey
# Specify the key as a trusted key. [DeviceB] ntp-service reliable authentication-keyid 42
# Specify Device A as the NTP server of Device B. [DeviceB] ntp-service unicast-server 1.0.1.11 authentication-keyid 42
Before Device B can synchronize its clock to that of Device A, enable NTP authentication for Device A.
Perform the following configuration on Device A:
# Enable NTP authentication. [DeviceA] ntp-service authentication enable
# Set an authentication key. [DeviceA] ntp-service authentication-keyid 42 authentication-mode md5 aNiceKey
# Specify the key as a trusted key. [DeviceA] ntp-service reliable authentication-keyid 42
# View the NTP status of Device B after clock synchronization. [DeviceB] display ntp-service status
Clock status: synchronized
Clock stratum: 3
Reference clock ID: 1.0.1.11
Nominal frequency: 64.0000 Hz
Actual frequency: 64.0000 Hz
Clock precision: 2^7
Clock offset: 0.0000 ms
Root delay: 31.00 ms
Root dispersion: 1.05 ms
Peer dispersion: 7.81 ms
Reference time: 14:53:27.371 UTC Sep 19 2005 (C6D94F67.5EF9DB22)
As shown above, Device B has been synchronized to Device A, and the clock stratum level of Device B is 3, while that of Device A is 2.
# View the NTP session information of Device B, which shows that an association has been set up Device B and Device A. [DeviceB] display ntp-service sessions
source reference stra reach poll now offset delay disper
**************************************************************************
[12345] 1.0.1.11 127.127.1.0 2 63 64 3 -75.5 31.0 16.5
note: 1 source(master),2 source(peer),3 selected,4 candidate,5 configured
Total associations : 1
Configuring NTP broadcast mode with authentication Network requirements
As shown in Figure 16, Device C functions as the NTP server for multiple devices on different network segments and synchronizes the time among multiple devices. Device B authentications the reference source.
• Device C’s local clock is to be used as a reference source, with the stratum level of 3.

31
• Device C works in broadcast server mode and sends out broadcast messages from VLAN-interface 2.
• Device A and Device B work in broadcast client mode and receives broadcast messages through VLAN-interface 2.
• NTP authentication is enabled on both Device B and Device C.
Figure 16 Network diagram
Vlan-int23.0.1.31/24
Vlan-int23.0.1.32/24
Vlan-int23.0.1.30/24
Device A
Device C
Device B
Configuration procedure
1. Set the IP address for each interface as shown in Figure 16. (Details not shown)
2. Configure Device A:
# # Configure the Device A to work in the NTP broadcast client mode and receive NTP broadcast messages on VLAN-interface 2. <DeviceA> system-view
[DeviceA] interface vlan-interface 2
[DeviceA-Vlan-interface2] ntp-service broadcast-client
3. Configure Device B:
# Enable NTP authentication on Device B. Configure an NTP authentication key, with the key ID of 88 and key value of 123456. Specify the key as a trusted key. <DeviceB> system-view
[DeviceB] ntp-service authentication enable
[DeviceB] ntp-service authentication-keyid 88 authentication-mode md5 123456
[DeviceB] ntp-service reliable authentication-keyid 88
# Configure Device B to work in broadcast client mode and receive NTP broadcast messages on VLAN-interface 2. [DeviceB] interface vlan-interface 2
[DeviceB-Vlan-interface2] ntp-service broadcast-client
4. Configure Device C:
# Configure Device C to work in the NTP broadcast server mode and use VLAN-interface 2 to send NTP broadcast packets. [DeviceC] interface vlan-interface 2
[DeviceC-Vlan-interface2] ntp-service broadcast-server
[DeviceC-Vlan-interface2] quit

32
# Device A synchronizes its local clock based on the received broadcast messages sent from Device C. View NTP service status information on Device A, you can see that Device A has been synchronized to Device C, and the clock stratum level of Device A is 4, while that of Device C is 3. [DeviceA-Vlan-interface2] display ntp-service status
Clock status: synchronized
Clock stratum: 4
Reference clock ID: 3.0.1.31
Nominal frequency: 64.0000 Hz
Actual frequency: 64.0000 Hz
Clock precision: 2^7
Clock offset: 0.0000 ms
Root delay: 31.00 ms
Root dispersion: 8.31 ms
Peer dispersion: 34.30 ms
Reference time: 16:01:51.713 UTC Sep 19 2005 (C6D95F6F.B6872B02)
# View the NTP session information of Device A, which shows that an association has been set up Device A and Device C. [DeviceA-Vlan-interface2] display ntp-service sessions
source reference stra reach poll now offset delay disper
**************************************************************************
[1234] 3.0.1.31 127.127.1.0 3 254 64 62 -16.0 32.0 16.6
note: 1 source(master),2 source(peer),3 selected,4 candidate,5 configured
Total associations : 1
# NTP authentication is enabled on Device B, but not enabled on Device C. Therefore, Device B cannot synchronize its local clock to that of Device C. [DeviceB-Vlan-interface2] display ntp-service status
Clock status: unsynchronized
Clock stratum: 16
Reference clock ID: none
Nominal frequency: 100.0000 Hz
Actual frequency: 100.0000 Hz
Clock precision: 2^18
Clock offset: 0.0000 ms
Root delay: 0.00 ms
Root dispersion: 0.00 ms
Peer dispersion: 0.00 ms
Reference time: 00:00:00.000 UTC Jan 1 1900(00000000.00000000)
# Enable NTP authentication Device C. Configure an NTP authentication key, with the key ID of 88 and key value of 123456. Specify the key as a trusted key. [DeviceC] ntp-service authentication enable
[DeviceC] ntp-service authentication-keyid 88 authentication-mode md5 123456
[DeviceC] ntp-service reliable authentication-keyid 88
# Specify Device C as an NTP broadcast server, and associate the key 88 with Device C. [DeviceC] interface vlan-interface 2
[DeviceC-Vlan-interface2] ntp-service broadcast-server authentication-keyid 88

33
# After NTP authentication is enabled on Device C, Device B can synchronizes its local clock to that of Device C. View NTP service status information on Device B, you can see that Device B has been synchronized to Device C, and the clock stratum level of Device B is 4, while that of Device C is 3. [DeviceB-Vlan-interface2] display ntp-service status
Clock status: synchronized
Clock stratum: 4
Reference clock ID: 3.0.1.31
Nominal frequency: 64.0000 Hz
Actual frequency: 64.0000 Hz
Clock precision: 2^7
Clock offset: 0.0000 ms
Root delay: 31.00 ms
Root dispersion: 8.31 ms
Peer dispersion: 34.30 ms
Reference time: 16:01:51.713 UTC Sep 19 2005 (C6D95F6F.B6872B02)
# View the NTP session information of Device B, which shows that an association has been set up between Device B and Device C. [DeviceB-Vlan-interface2] display ntp-service sessions
source reference stra reach poll now offset delay disper
**************************************************************************
[1234] 3.0.1.31 127.127.1.0 3 254 64 62 -16.0 32.0 16.6
note: 1 source(master),2 source(peer),3 selected,4 candidate,5 configured
Total associations : 1
# After you configure NTP authentication on Device C, there is no influence to Device A. Device A still synchronizes its local clock to that of Device C. [DeviceA-Vlan-interface2] display ntp-service status
Clock status: synchronized
Clock stratum: 4
Reference clock ID: 3.0.1.31
Nominal frequency: 64.0000 Hz
Actual frequency: 64.0000 Hz
Clock precision: 2^7
Clock offset: 0.0000 ms
Root delay: 31.00 ms
Root dispersion: 8.31 ms
Peer dispersion: 34.30 ms
Reference time: 16:01:51.713 UTC Sep 19 2005 (C6D95F6F.B6872B02)

34
Information center configuration
Information center overview
Introduction to information center The information center classifies and manages system information, offering powerful support for network administrators and developers to monitor network performance and troubleshoot network problems.
The following describes the working process of information center:
• Receives the log, trap, and debugging information generated by each module.
• Outputs the above information to different information channels according to user-defined output rules.
• Outputs information to different destinations based on the information channel-to-destination associations.
Information center assigns log, trap, and debugging information to 10 information channels according to eight severity levels and then outputs the information to different destinations. The following describes the working process in detail.
Figure 17 Information center diagram (default)
1
2
3
4
5
6
7
8
9
console0
channel6
monitor
loghost
trapbuffer
logbuffer
snmpagent
channel7
channel8
channel9
Log information
Trap information
Debugging information
Console
Monitor
Log host
Trap buffer
Log buffer
SNMP module
System information
Information channel
Output destination
Web interface
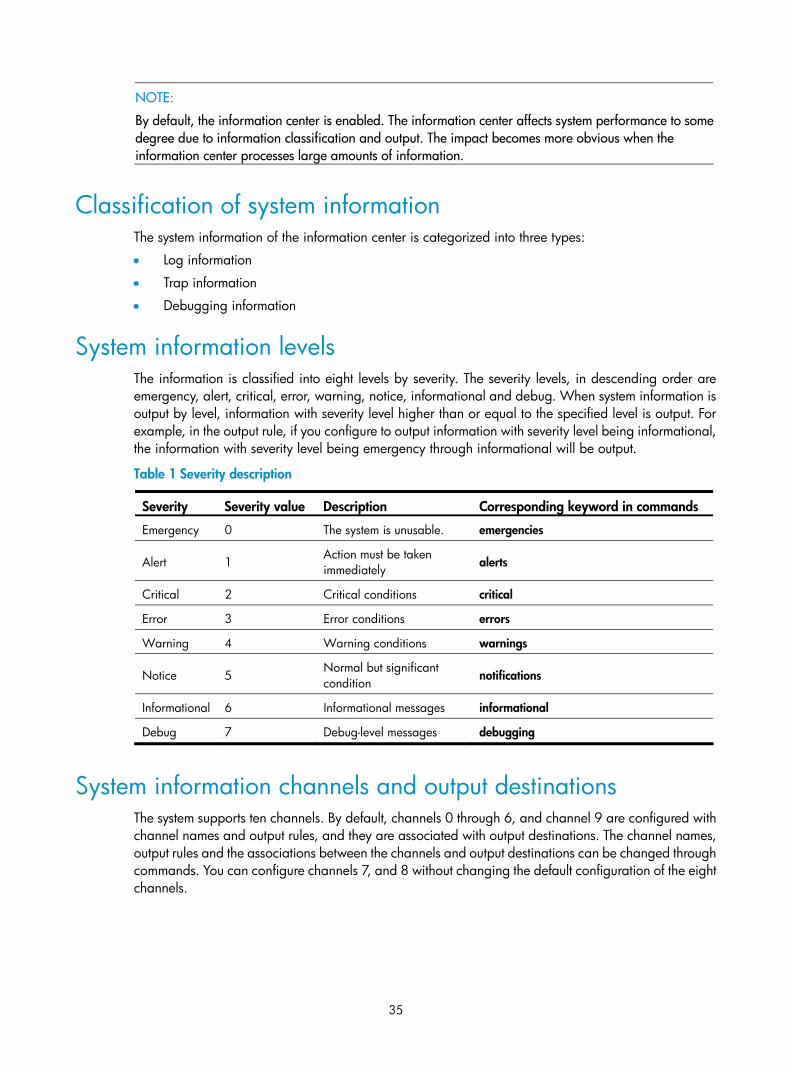
35
NOTE:
By default, the information center is enabled. The information center affects system performance to somedegree due to information classification and output. The impact becomes more obvious when the information center processes large amounts of information.
Classification of system information The system information of the information center is categorized into three types:
• Log information
• Trap information
• Debugging information
System information levels The information is classified into eight levels by severity. The severity levels, in descending order are emergency, alert, critical, error, warning, notice, informational and debug. When system information is output by level, information with severity level higher than or equal to the specified level is output. For example, in the output rule, if you configure to output information with severity level being informational, the information with severity level being emergency through informational will be output.
Table 1 Severity description
Severity Severity value Description Corresponding keyword in commands
Emergency 0 The system is unusable. emergencies
Alert 1 Action must be taken immediately alerts
Critical 2 Critical conditions critical
Error 3 Error conditions errors
Warning 4 Warning conditions warnings
Notice 5 Normal but significant condition notifications
Informational 6 Informational messages informational
Debug 7 Debug-level messages debugging
System information channels and output destinations The system supports ten channels. By default, channels 0 through 6, and channel 9 are configured with channel names and output rules, and they are associated with output destinations. The channel names, output rules and the associations between the channels and output destinations can be changed through commands. You can configure channels 7, and 8 without changing the default configuration of the eight channels.

36
Table 2 Information channels and output destinations
Information channel number
Default channel name
Default output destination Description
0 console Console Receives log, trap and debugging information.
1 monitor Monitor terminal Receives log, trap and debugging information, facilitating remote maintenance.
2 loghost Log host Receives log, trap and debugging information and information will be stored in files for future retrieval.
3 trapbuffer Trap buffer Receives trap information, a buffer inside the device for recording information.
4 logbuffer Log buffer Receives log and debugging information, a buffer inside the device for recording information.
5 snmpagent SNMP module Receives trap information.
6 channel6 Web interface Receives log information.
7 channel7 Not specified Receives log, trap, and debugging information.
8 channel8 Not specified Receives log, trap, and debugging information.
9 channel9 Not specified Receives log, trap, and debugging information.
Outputting system information by source module The system is composed of a variety of protocol modules, board drivers, and configuration modules. The system information is classified, filtered, and output according to source modules. You can use the info-center source ? command to view the supported information source modules.
Default output rules of system information The default output rules define the source modules allowed to output information on each output destination, the output information type, and the output information level as shown in Table 3. The following applies to all modules by default:
• All log information is allowed to be output to the web interface. Log information with severity level equal to or higher than informational is allowed to be output to the log host. Log information with severity level equal to or higher than informational is allowed to be output to the console, monitor terminal, and log buffer. Log information is not allowed to be output to the trap buffer or the SNMP module.
• All trap information is allowed to be output to the console, monitor terminal, log host, web interface. Trap information with severity level equal to or higher than informational is allowed to be output to the trap buffer and SNMP module. Trap information is not allowed to be output to the log buffer.
• All debugging information is allowed to be output to the console and monitor terminal. Debugging information is not allowed to be output to the log host, trap buffer, log buffer, the SNMP module, web interface.

37
Table 3 Default output rules for different output destinations
LOG TRAP DEBUG Output destination
Modules allowed Enabled/
disabled Severity Enabled/disabled Severity Enabled/
disabled Severity
Console default (all modules) Enabled
Informational Enabled Debug Enabled Debug
Monitor terminal
default (all modules) Enabled
Informational Enabled Debug Enabled Debug
Log host default (all modules) Enabled
Informational Enabled Debug Disabled Debug
Trap buffer default (all modules) Disabled
Informational Enabled
Informational Disabled Debug
Log buffer default (all modules) Enabled
Informational Disabled Debug Disabled Debug
SNMP module
default (all modules) Disabled Debug Enabled
Informational Disabled Debug
Web interface
default (all modules) Enabled Debug Enabled Debug Disabled Debug
System information format The format of system information varies with the output destinations.
1. If the output destination is not the log host (such as console, monitor terminal, logbuffer, trapbuffer, SNMP), the system information is in the following format:
timestamp sysname module/level/digest:content
For example, a monitor terminal connects to the device. When a terminal logs in to the device, the log information in the following format is displayed on the monitor terminal: %Jun 26 17:08:35:809 2011 Sysname SHELL/4/LOGIN: VTY login from 1.1.1.1
2. If the output destination is the log host, the system information is in one of the following formats:
• H3C format <PRI>timestamp sysname %%vvmodule/level/digest: source content
For example, if a log host is connected to the device, when a terminal logs in to the device, the following log information is displayed on the log host: <189>Oct 9 14:59:04 201 MyDevice %%10SHELL/5/SHELL_LOGIN(l):VTY logged in from 192.168.1.21.
• UNICOM format <PRI>timestamp sysname vvmodule/level/serial_number: content
For example, if a log host is connected to the device, when a port of the device goes down, the following log information is displayed on the log host: <186>Oct 13 16:48:08 2011 H3C 10IFNET/2/210231a64jx073000020: log_type=port;content=Vlan-interface1 link status is DOWN.
<186>Oct 13 16:48:08 2011 H3C 10IFNET/2/210231a64jx073000020: log_type=port;content=Line protocol on the interface Vlan-interface1 is DOWN.

38
NOTE:
• The closing set of angel brackets (< >), the space, the forward slash (/), and the colon are all requiredin the above format.
• The format in the previous section is the original format of system information, so you may see the information in a different format. The displayed format depends on the log resolution tools you use.
Following is a detailed explanation of the fields involved in system information:
PRI (priority)
Priority is calculated using the following formula: facility*8+severity. In the formula, facility represents the logging facility name, which can be configured when you set the log host parameters. Facility ranges from local0 to local7 (16 to 23 in decimal integers) and defaults to local7. Facility marks different log sources on the log host, and to query and filter the logs of the corresponding log source. Severity ranges from 0 to 7. Table 1 details the value and meaning associated with each severity.
Note that the priority field takes effect only when the information has been sent to the log host.
timestamp
Times tamp records the time when the system information was generated. The time stamp of the system information sent to the log host has a precision of seconds, and that to all the other destinations has a precision of milliseconds. The time stamp format of the system information sent to the log host is configured with the info-center timestamp loghost command, and that of the system information sent to the other destinations is configured with the info-center timestamp command.
Table 4 Description on the time stamp parameters
Time stamp parameter Description Example
boot
System up time (that is, the duration for this operation of the device), in the format of xxxxxx.yyyyyy, where xxxxxx represents the higher 32 bits, and yyyyyy represents the lower 32 bits.
System information sent to all destinations except log host supports this parameter.
%0.109391473 Sysname FTPD/5/FTPD_LOGIN: User ftp (192.168.1.23) has logged in successfully.
0.109391473 is a time stamp in the boot format.
date
Current date and time of the system, in the format of Mmm dd hh:mm:ss:sss yyyy.
System information sent to all destinations supports this parameter.
%May 30 05:36:29:579 2011 Sysname FTPD/5/FTPD_LOGIN: User ftp (192.168.1.23) has logged in successfully.
May 30 05:36:29:579 2011 is a time stamp in the date format.
iso Time stamp format stipulated in ISO 8601
Only the system information sent to a log host supports this parameter.
<189>2011-05-30T06:42:44 Sysname %%10FTPD/5/FTPD_LOGIN(l): User ftp (192.168.1.23) has logged in successfully.
2011-05-30T06:42:44 is a time stamp in the iso format.
none No time stamp is included.
System information sent to all destinations supports this parameter.
% Sysname FTPD/5/FTPD_LOGIN: User ftp (192.168.1.23) has logged in successfully.
No time stamp is included.

39
Time stamp parameter Description Example
no-year-date
Current date and time of the system, with year information excluded.
Only the system information sent to a log host supports this parameter.
<189>May 30 06:44:22 Sysname %%10FTPD/5/FTPD_LOGIN(l): User ftp (192.168.1.23) has logged in successfully.
May 30 06:44:22 is a time stamp in the no-year-date format.
Sysname (host name or host IP address)
• If the system information is sent to a log host in the format of UNICOM, and the info-center loghost source command is configured, the field is displayed as the IP address of the device that generates the system information.
• In other cases (when the system information is sent to a log host in the format of H3C, or sent to other destinations), the field is displayed as the name of the device that generates the system information, namely, the system name of the device. You can use the sysname command to modify the system name. For more information, see Fundamentals Command Reference.
%% (vendor ID)
This field indicates that the information is generated by an H3C device. It is displayed only when the system information is sent to a log host in the format of H3C.
vv
This field is a version identifier of syslog, with a value of 10. It is displayed only when the output destination is log host.
module
The module field represents the name of the module that generates system information. You can enter the info-center source ? command in system view to view the module list.
level (severity)
System information is divided into eight levels based on its severity, from 0 to 7. See Table 1 for definitions and descriptions of these severity levels. The levels of system information generated by modules are predefined by developers, and you cannot change the system information levels. However, with the info-center source command, you can configure to output information of the specified level and not to output information lower than the specified level.
digest
The digest field is a string of up to 32 characters, outlining the system information.
For system information destined to the log host:
• If the character string ends with (l), the information is log information
• If the character string ends with (t), the information is trap information
• If the character string ends with (d), the information is debugging information
For system information destined to other destinations:
• If the time stamp starts with a %, the information is log information
• If the time stamp starts with a #, the information is trap information
• If the time stamp starts with a *, the information is debugging information

40
serial number
This field indicates the serial number of the device that generates the system information. It is displayed only when the system information is sent to a log host in the format of UNICOM.
source
This field indicates the source of the information. It is optional and is displayed only when the system information is sent to a log host in the format of H3C. This field takes one of the following values:
• IRF member ID
• Source IP address of the log sender
content
This field provides the content of the system information.
Configuring information center
Information center configuration task list Complete the following tasks to configure information center:
Task Remarks
Outputting system information to the console Optional
Outputting system information to a monitor terminal Optional
Outputting system information to a log host Optional
Outputting system information to the trap buffer Optional
Outputting system information to the log buffer Optional
Outputting system information to the SNMP module Optional
Outputting system information to the web interface Optional
Saving security logs into the security log file Optional
Configuring synchronous information output Optional
Disabling a port from generating link up/down logging information Optional
Outputting system information to the console Outputting system information to the console
To do… Use the command… Remarks
Enter system view system-view —
Enable information center info-center enable Optional
Enabled by default
Name the channel with a specified channel number
info-center channel channel-number name channel-name
Optional
See Table 2 for default channel names.

41
To do… Use the command… Remarks
Configure the channel through which system information can be output to the console
info-center console channel { channel-number | channel-name }
Optional
By default, system information is output to the console through channel 0 (known as console).
Configure the output rules of system information
info-center source { module-name | default } channel { channel-number | channel-name } [ debug { level severity | state state } * | log { level severity | state state } * | trap { level severity | state state } * ] *
Optional
See “Default output rules of system information.”
Configure the format of the time stamp
info-center timestamp { debugging | log | trap } { boot | date | none }
Optional
The time stamp format for log, trap and debugging information is date by default.
Enabling the display of system information on the console
After setting to output system information to the console, you need to enable the associated display function to display the output information on the console.
Follow these steps to enable the display of system information on the console (in user view):
To do… Use the command… Remarks
Enable the monitoring of system information on the console terminal monitor
Optional
Enabled on the console and disabled on the monitor terminal by default.
Enable the display of debugging information on the console terminal debugging
Required
Disabled by default
Enable the display of log information on the console terminal logging
Optional
Enabled by default
Enable the display of trap information on the console terminal trapping
Optional
Enabled by default
Outputting system information to a monitor terminal System information can also be output to a monitor terminal, which is a user terminal that has login connections through the VTY user interface.
Outputting system information to a monitor terminal
To do… Use the command… Remarks
Enter system view system-view —
Enable information center info-center enable Optional
Enabled by default
Name the channel with a specified channel number
info-center channel channel-number name channel-name
Optional
See Table 2 for default channel names.

42
To do… Use the command… Remarks
Configure the channel through which system information can be output to a monitor terminal
info-center monitor channel { channel-number | channel-name }
Optional
By default, system information is output to the monitor terminal through channel 1 (known as monitor).
Configure the output rules of the system information
info-center source { module-name | default } channel { channel-number | channel-name } [ debug { level severity | state state } * | log { level severity | state state } * | trap { level severity | state state } * ] *
Optional
See “Default output rules of system information.”
Configure the format of the time stamp
info-center timestamp { debugging | log | trap } { boot | date | none }
Optional
By default, the time stamp format for log, trap and debugging information is date.
Enabling the display of system information on a monitor terminal
After setting to output system information to a monitor terminal, you need to enable the associated display function in order to display the output information on the monitor terminal.
Follow these steps to enable the display of system information on a monitor terminal:
To do… Use the command… Remarks
Enable the monitoring of system information on a monitor terminal terminal monitor
Required
Enabled on the console and disabled on the monitor terminal by default.
Enable the display of debugging information on a monitor terminal terminal debugging
Required
Disabled by default
Enable the display of log information on a monitor terminal terminal logging
Optional
Enabled by default
Enable the display of trap information on a monitor terminal terminal trapping
Optional
Enabled by default
Outputting system information to a log host To do… Use the command… Remarks
Enter system view system-view —
Enable information center info-center enable Optional
Enabled by default
Name the channel with a specified channel number
info-center channel channel-number name channel-name
Optional
See Table 2 for default channel names.

43
To do… Use the command… Remarks
Configure the output rules of the system information
info-center source { module-name | default } channel { channel-number | channel-name } [ debug { level severity | state state } * | log { level severity | state state } * | trap { level severity | state state } * ] *
Optional
See “Default output rules of system information.”
Specify the source IP address for the log information
info-center loghost source interface-type interface-number
Optional
By default, the source interface is determined by the matched route, and the primary IP address of this interface is the source IP address of the log information.
Configure the format of the time stamp for system information output to the log host
info-center timestamp loghost { date | iso | no-year-date | none }
Optional
date by default.
Set the format of the system information sent to a log host to UNICOM
info-center format unicom Optional
H3C by default.
Specify a log host and configure the related output parameters
info-center loghost { host-ipv4-address | ipv6 host-ipv6-address } [ port port-number ] [ channel { channel-number | channel-name } | facility local-number ] *
Required
By default, the system does not output information to a log host. If you specify to output system information to a log host, the system uses channel 2 (loghost) by default.
The value of the port-number argument should be the same as the value configured on the log host, otherwise, the log host cannot receive system information.
Outputting system information to the trap buffer
NOTE:
The trap buffer receives the trap information only, and it discards the log and debugging information evenif you have configured to output them to the trap buffer.
To do… Use the command… Remarks
Enter system view system-view —
Enable information center info-center enable Optional
Enabled by default
Name the channel with a specified channel number
info-center channel channel-number name channel-name
Optional
See Table 2 for default channel names.

44
To do… Use the command… Remarks
Configure the channel through which system information can be output to the trap buffer and specify the buffer size
info-center trapbuffer [ channel { channel-number | channel-name } | size buffersize ] *
Optional
By default, system information is output to the trap buffer through channel 3 (known as trapbuffer) and the default buffer size is 256.
Configure the output rules of the system information
info-center source { module-name | default } channel { channel-number | channel-name } [ debug { level severity | state state } * | log { level severity | state state } * | trap { level severity | state state } * ] *
Optional
See “Default output rules of system information.”
Configure the format of the time stamp
info-center timestamp { debugging | log | trap } { boot | date | none }
Optional
The time stamp format for log, trap and debugging information is date by default.
Outputting system information to the log buffer
NOTE:
The log buffer accepts only log and debugging information; it discards trap information even if you haveconfigured to output it to the log buffer.
To do… Use the command… Remarks
Enter system view system-view —
Enable information center info-center enable Optional
Enabled by default.
Name the channel with a specified channel number
info-center channel channel-number name channel-name
Optional
See Table 2 for default channel names.
Configure the channel through which system information can be output to the log buffer and specify the buffer size
info-center logbuffer [ channel { channel-number | channel-name } | size buffersize ] *
Optional
By default, system information is output to the log buffer through channel 4 (known as logbuffer) and the default buffer size is 512.
Configure the output rules of the system information
info-center source { module-name | default } channel { channel-number | channel-name } [ debug { level severity | state state } * | log { level severity | state state } * | trap { level severity | state state } * ] *
Optional
See “Default output rules of system information.”
Configure the format of the time stamp
info-center timestamp { debugging | log | trap } { boot | date | none }
Optional
The time stamp format for log, trap and debugging information is date by default.

45
Outputting system information to the SNMP module
NOTE:
The SNMP module accepts only the trap information; it discards log and debugging information even if you have configured to output them to the SNMP module.
To monitor the device running status of the device, trap information is usually sent to the SNMP network management station system (NMS). You To do so, you need to configure to send traps to the SNMP module, and then set the trap sending parameters for the SNMP module to further process traps. For more information, see the chapter “SNMP configuration.”
Follow these steps to configure to output system information to the SNMP module:
To do… Use the command… Remarks
Enter system view system-view —
Enable information center info-center enable Optional
Enabled by default
Name the channel with a specified channel number
info-center channel channel-number name channel-name
Optional
See Table 2 for default channel names.
Configure the channel through which system information can be output to the SNMP module
info-center snmp channel { channel-number | channel-name }
Optional
By default, system information is output to the SNMP module through channel 5 (known as snmpagent).
Configure the output rules of the system information
info-center source { module-name | default } channel { channel-number | channel-name } [ debug { level severity | state state } * | log { level severity | state state } * | trap { level severity | state state } * ] *
Optional
See “Default output rules of system information.”
Configure the format of the time stamp
info-center timestamp { debugging | log | trap } { boot | date | none }
Optional
The time stamp format for log, trap and debugging information is date by default.
Outputting system information to the web interface
This feature allows you to control whether to output system information to the web interface and which system information can be output to the web interface. The web interface provides abundant search and sorting functions; therefore, if you configure to output the system information to the web interface, you can view system information by clicking corresponding tabs after logging in to the device through the web interface.
Follow these steps to set to output system information to the web interface:
To do… Use the command… Remarks
Enter system view system-view —
Enable information center info-center enable
Optional
Enabled by default.
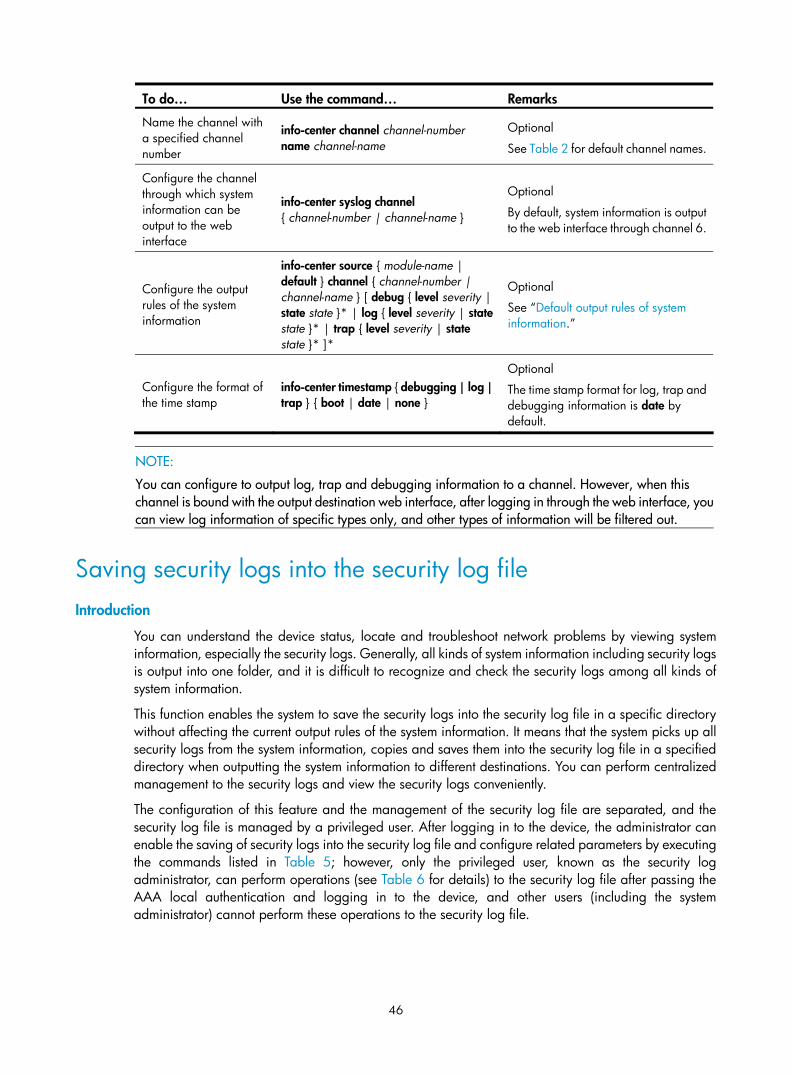
46
To do… Use the command… Remarks
Name the channel with a specified channel number
info-center channel channel-number name channel-name
Optional
See Table 2 for default channel names.
Configure the channel through which system information can be output to the web interface
info-center syslog channel { channel-number | channel-name }
Optional
By default, system information is output to the web interface through channel 6.
Configure the output rules of the system information
info-center source { module-name | default } channel { channel-number | channel-name } [ debug { level severity | state state }* | log { level severity | state state }* | trap { level severity | state state }* ]*
Optional
See “Default output rules of system information.”
Configure the format of the time stamp
info-center timestamp { debugging | log | trap } { boot | date | none }
Optional
The time stamp format for log, trap and debugging information is date by default.
NOTE:
You can configure to output log, trap and debugging information to a channel. However, when this channel is bound with the output destination web interface, after logging in through the web interface, youcan view log information of specific types only, and other types of information will be filtered out.
Saving security logs into the security log file
Introduction
You can understand the device status, locate and troubleshoot network problems by viewing system information, especially the security logs. Generally, all kinds of system information including security logs is output into one folder, and it is difficult to recognize and check the security logs among all kinds of system information.
This function enables the system to save the security logs into the security log file in a specific directory without affecting the current output rules of the system information. It means that the system picks up all security logs from the system information, copies and saves them into the security log file in a specified directory when outputting the system information to different destinations. You can perform centralized management to the security logs and view the security logs conveniently.
The configuration of this feature and the management of the security log file are separated, and the security log file is managed by a privileged user. After logging in to the device, the administrator can enable the saving of security logs into the security log file and configure related parameters by executing the commands listed in Table 5; however, only the privileged user, known as the security log administrator, can perform operations (see Table 6 for details) to the security log file after passing the AAA local authentication and logging in to the device, and other users (including the system administrator) cannot perform these operations to the security log file.

47
NOTE:
• You can authorize a security log administrator by executing the authorization-attribute user-role security-audit command in local user view.
• The system administrator cannot view, copy, and rename the security log file; otherwise, the system prompts “% Execution error”. The system administrator can view, copy and rename other types of files.
• For more information about local user and AAA local authentication, see Security Configuration Guide.
Saving security logs into the security log file
With this feature enabled, when the system outputs the system information to a specified destination, it copies the security logs at the same time and saves them into the security log file buffer. Then, the system writes the contents of the security log file buffer into the security log file at a specified frequency (the security log administrator can trigger the saving of security logs into the log file manually). After the contents of the buffer are saved into the security log file successfully, the security log file buffer is cleared immediately.
The size of the security log file is limited. When the size of the security log file reaches the predefined maximum value, the system deletes the oldest information and then writes the new information into the security log file. To avoid security log file loss, you can set the alarm threshold of the security log file usage. When the alarm threshold is reached, the system outputs the log information to inform the administrator. In this case, the administrator can log in to the device as the security log administrator, and then back up the security log file, preventing the loss of important historical data.
By default, the saving of security logs into the security log file is disabled. The parameters, such as the saving frequency, the maximum size and the alarm threshold of the security log file usage, have their default settings. To modify these parameters, you need to log in to the device as the system administrator, and then follow the steps in the following table to configure the related parameters:
Table 5 Save security logs into the security log file
To do… Use the command… Remarks
Enter system view system-view —
Enable the information center info-center enable Optional
Enabled by default.
Enable the saving of the security logs into the security log file
info-center security-logfile enable
Required
Disabled by default.
Set the frequency with which the system saves the security log file
info-center security-logfile frequency freq-sec
Optional
The default value is 600 seconds.
Set the maximum storage space reserved for the security log file
info-center security-logfile size-quota size
Optional
The default value is 1 MB.
Set the alarm threshold of the security log file usage
info-center security-logfile alarm-threshold usage
Optional
80 by default. (That is, when the usage of the security log file reaches 80%, the system will inform the user.)

48
Managing the security log file
After passing the AAA local authentication, the security log administrator can perform the following operations:
Table 6 Manage the security log file
To do… Use the command… Remarks
Display the summary of the security log file
display security-logfile summary [ | { begin | exclude | include } regular-expression ]
Optional
Change the directory where the security log file is saved
info-center security-logfile switch-directory dir-name
Optional
By default, the directory to save the security log file is the seclog directory under the root directory of the storage medium.
Available in user view
Display contents of the security log file buffer
display security-logfile buffer [ | { begin | exclude | include } regular-expression ]
Optional
Save all the contents in the security log file buffer into the security log file security-logfile save
Optional
By default, the system automatically saves the security log file at a frequency configured by the info-center security-logfile frequency command into a directory configured by the info-center security-logfile switch-directory command.
Available in user view
Display the contents of the specified file more file-url
Display information about all files and folders
dir [ /all ] [ file-url ]
Create a folder under a specified directory on the storage medium
mkdir directory
Change the current working directory cd { directory | .. | / }
Display the current path pwd
Perform these operations to the security log file
Move a specified file from a storage medium to the recycle bin
delete [ /unreserved ] file-url
Optional
Available in user view
For more information about these commands, see Fundamentals Command Reference.
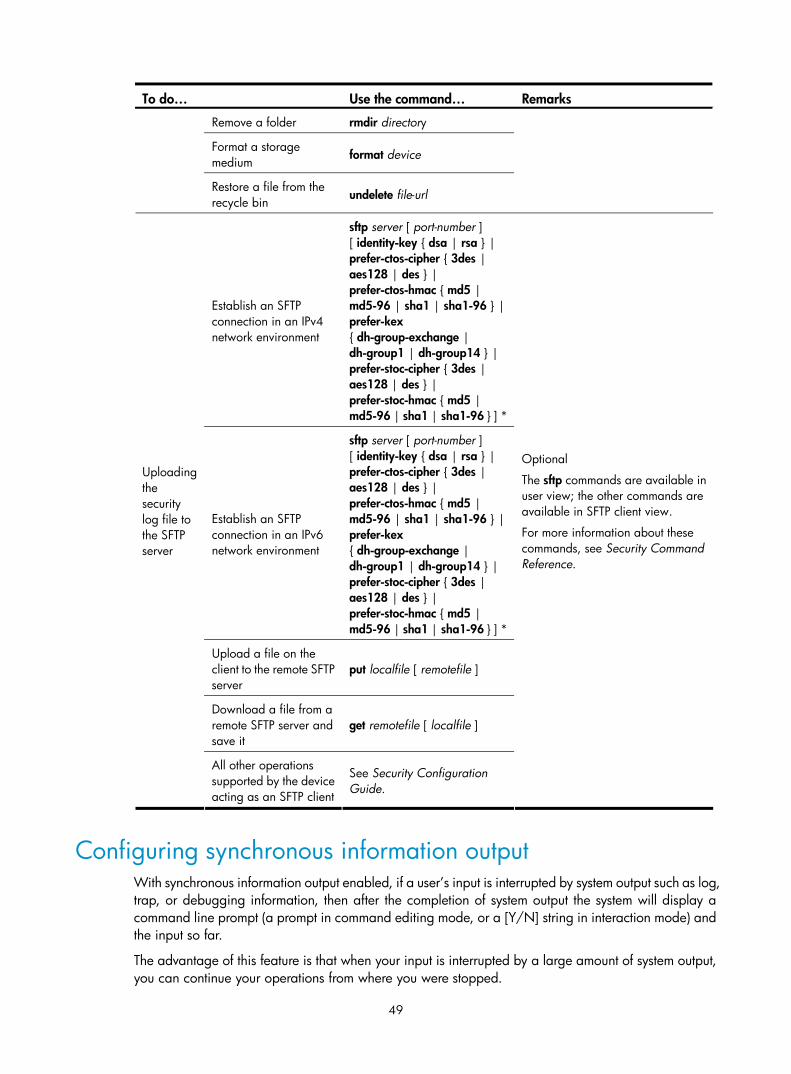
49
To do… Use the command… Remarks
Remove a folder rmdir directory
Format a storage medium format device
Restore a file from the recycle bin undelete file-url
Establish an SFTP connection in an IPv4 network environment
sftp server [ port-number ] [ identity-key { dsa | rsa } | prefer-ctos-cipher { 3des | aes128 | des } | prefer-ctos-hmac { md5 | md5-96 | sha1 | sha1-96 } | prefer-kex { dh-group-exchange | dh-group1 | dh-group14 } | prefer-stoc-cipher { 3des | aes128 | des } | prefer-stoc-hmac { md5 | md5-96 | sha1 | sha1-96 } ] *
Establish an SFTP connection in an IPv6 network environment
sftp server [ port-number ] [ identity-key { dsa | rsa } | prefer-ctos-cipher { 3des | aes128 | des } | prefer-ctos-hmac { md5 | md5-96 | sha1 | sha1-96 } | prefer-kex { dh-group-exchange | dh-group1 | dh-group14 } | prefer-stoc-cipher { 3des | aes128 | des } | prefer-stoc-hmac { md5 | md5-96 | sha1 | sha1-96 } ] *
Upload a file on the client to the remote SFTP server
put localfile [ remotefile ]
Download a file from a remote SFTP server and save it
get remotefile [ localfile ]
Uploading the security log file to the SFTP server
All other operations supported by the device acting as an SFTP client
See Security Configuration Guide.
Optional
The sftp commands are available in user view; the other commands are available in SFTP client view.
For more information about these commands, see Security Command Reference.
Configuring synchronous information output With synchronous information output enabled, if a user’s input is interrupted by system output such as log, trap, or debugging information, then after the completion of system output the system will display a command line prompt (a prompt in command editing mode, or a [Y/N] string in interaction mode) and the input so far.
The advantage of this feature is that when your input is interrupted by a large amount of system output, you can continue your operations from where you were stopped.

50
Follow these steps to enable synchronous information output:
To do… Use the command… Remarks
Enter system view system-view —
Enable synchronous information output info-center synchronous
Required
Disabled by default
NOTE:
• If system information, such as log information, is output before you input any information under the current command line prompt, the system will not display the command line prompt after the system information output.
• If system information is output when you are inputting some interactive information (non Y/N confirmation information), after the system information output, the system will not display the commandline prompt but your previous input in a new line.
Disabling a port from generating link up/down logging information
By default, all the ports of the device generate link up/down logging information when the port state changes. You may want to disable specific ports from generating such information in some cases. For example:
• You are only concerned with the states of some ports. In this case, you can use this function to disable other ports from generating link up/down logging information.
• A port is unstable, and continuously outputs logging information. In this case, you can disable the port from generating link up/down logging information.
Follow these steps to disable a port from generating link up/down logging information:
To do… Use the command… Remarks
Enter system view system-view —
Enter Layer 2 Ethernet port view, or VLAN interface view.
interface interface-type interface-number —
Disable the port from generating link up/down logging information undo enable log updown
Required
By default, all ports are allowed to generate link up/down logging information when the port state changes.
NOTE:
A port enabled with this feature does not output link up/down log information, and cannot be monitoredconveniently. Therefore, H3C recommends that you use the default configuration in normal cases.

51
Displaying and maintaining information center To do… Use the command… Remarks
Display the information about information channels
display channel [ channel-number | channel-name ] [ | { begin | exclude | include } regular-expression ]
Available in any view
Display the information about each output destination
display info-center [ | { begin | exclude | include } regular-expression ] Available in any view
Display the state of the log buffer and the log information recorded
display logbuffer [ reverse ] [ level severity | size buffersize | slot slot-number ] * [ | { begin | exclude | include } regular-expression ]
Available in any view
Display a summary of the log buffer
display logbuffer summary [ level severity | slot slot-number ] * [ | { begin | exclude | include } regular-expression ]
Available in any view
Display the state of the trap buffer and the trap information recorded
display trapbuffer [ reverse ] [ size buffersize ] [ | { begin | exclude | include } regular-expression ]
Available in any view
Reset the log buffer reset logbuffer Available in user view
Reset the trap buffer reset trapbuffer Available in user view
Information center configuration examples
Outputting log information to a UNIX log host Network requirements
• Send log information to a UNIX log host with an IP address of 1.2.0.1/16;
• Log information with severity higher than or equal to informational will be output to the log host;
• The source modules are ARP and IP.
Figure 18 Network diagram
Configuration procedure
Before the configuration, make sure that there is a route between Device and PC.
1. Configure the device
# Enable information center. <Sysname> system-view
[Sysname] info-center enable
# Specify the host with IP address 1.2.0.1/16 as the log host. Use channel loghost to output log information (optional, loghost by default), and use local4 as the logging facility. [Sysname] info-center loghost 1.2.0.1 channel loghost facility local4

52
# Disable the output of log, trap, and debugging information of all modules on channel loghost. [Sysname] info-center source default channel loghost debug state off log state off trap state off
CAUTION:
Because the default system configurations for different channels are different, you need to first disable theoutput of log, trap, and debugging information of all modules on the specified channel (loghost in this example) first. Then configure the output rule as needed so that unnecessary information will not be output.
# Configure the information output rule. Allow log information of ARP and IP modules with severity equal to or more severe than informational to be output to the log host. (The source modules that are allowed to output information depend on the switch model.) [Sysname] info-center source arp channel loghost log level informational state on
[Sysname] info-center source ip channel loghost log level informational state on
2. Configure the log host
The following configurations were performed on SunOS 4.0 which has similar configurations to the UNIX operating systems implemented by other vendors.
Step 1: Log in to the log host as a root user.
Step 2: Create a subdirectory named Device under directory /var/log/, and create file info.log under the Device directory to save logs of Device. # mkdir /var/log/Device
# touch /var/log/Device/info.log
Step 3: Edit file /etc/syslog.conf and add the following contents. # Device configuration messages
local4.info /var/log/Device/info.log
In the above configuration, local4 is the name of the logging facility used by the log host to receive logs. info is the information level. The UNIX system will record the log information with severity level equal to or more severe than informational to file /var/log/Device/info.log.
NOTE:
Be aware of the following issues while editing file /etc/syslog.conf:
• Comments must be on a separate line and begin with the pound sign (#).
• No redundant spaces are allowed after the file name.
• The logging facility name and the information level specified in the /etc/syslog.conf file must be identical to those configured on the device using the info-center loghost and info-center source commands. Otherwise the log information may not be output properly to the log host.
Step 4: After log file info.log is created and file /etc/syslog.conf is modified, you need to issue the following commands to display the process ID of syslogd, kill the syslogd process and then restart syslogd using the –r option to make the modified configuration take effect. # ps -ae | grep syslogd
147
# kill -HUP 147
# syslogd -r &
After the above configurations, the system will be able to record log information into the log file.

53
Outputting log information to a Linux log host Network requirements
• Send log information to a Linux log host with an IP address of 1.2.0.1/16;
• Log information with severity equal to or higher than informational will be output to the log host;
• All modules can output log information.
Figure 19 Network diagram
Configuration procedure
Before the configuration, make sure that there is a route between Device and PC.
1. Configure the device
# Enable information center. <Sysname> system-view
[Sysname] info-center enable
# Specify the host with IP address 1.2.0.1/16 as the log host. Use channel loghost to output log information (optional, loghost by default), and use local5 as the logging facility. [Sysname] info-center loghost 1.2.0.1 channel loghost facility local5
# Disable the output of log, trap, and debugging information of all modules on channel loghost. [Sysname] info-center source default channel loghost debug state off log state off trap state off
CAUTION:
Because the default system configurations for different channels are different, you need to first disable theoutput of log, trap, and debugging information of all modules on the specified channel (loghost in this example). Then configure the output rule as needed so that unnecessary information will not be output.
# Configure the information output rule. Allow log information of all modules with severity equal to or more severe than informational to be output to the log host. [Sysname] info-center source default channel loghost log level informational state on
2. Configure the log host
Step 1: Log in to the log host as a root user.
Step 2: Create a subdirectory named Device under directory /var/log/, and create file info.log under the Device directory to save logs of Device. # mkdir /var/log/Device
# touch /var/log/Device/info.log
Step 3: Edit file /etc/syslog.conf and add the following contents. # Device configuration messages
local5.info /var/log/Device/info.log

54
In the above configuration, local5 is the name of the logging facility used by the log host to receive logs. info is the information level. The Linux system will record the log information with severity level equal to or more severe than informational to file /var/log/Device/info.log.
NOTE:
Be aware of the following issues while editing file /etc/syslog.conf:
• Comments must be on a separate line and begin with the pound sign (#).
• No redundant spaces are allowed after the file name.
• The logging facility name and the information level specified in the /etc/syslog.conf file must be identical to those configured on the device using the info-center loghost and info-center source commands. Otherwise the log information may not be output properly to the log host.
Step 4: After log file info.log is created and file /etc/syslog.conf is modified, you need to issue the following commands to display the process ID of syslogd, kill the syslogd process, and restart syslogd using the -r option to make the modified configuration take effect. # ps -ae | grep syslogd
147
# kill -9 147
# syslogd -r &
NOTE:
Make sure that the syslogd process is started with the -r option on a Linux log host.
After the above configurations, the system will be able to record log information into the log file.
Outputting log information to the console Network requirements
• Log information with a severity equal to or higher than informational will be output to the console;
• The source modules are ARP and IP.
Figure 20 Network diagram
Configuration procedure
# Enable information center. <Sysname> system-view
[Sysname] info-center enable
# Use channel console to output log information to the console (optional, console by default). [Sysname] info-center console channel console
# Disable the output of log, trap, and debugging information of all modules on channel console. [Sysname] info-center source default channel console debug state off log state off trap state off

55
CAUTION:
Because the default system configurations for different channels are different, you need to first disable theoutput of log, trap, and debugging information of all modules on the specified channel (console in this example). Then configure the output rule as needed so that unnecessary information will not be output.
# Configure the information output rule. Allow log information of ARP and IP modules with severity equal to or more severe than informational to be output to the console. (The source modules that are allowed to output information depend on the switch model.) [Sysname] info-center source arp channel console log level informational state on
[Sysname] info-center source ip channel console log level informational state on
[Sysname] quit
# Enable the display of log information on a terminal. (optional, this function is enabled by default.) <Sysname> terminal monitor
Info: Current terminal monitor is on.
<Sysname> terminal logging
Info: Current terminal logging is on.
After the above configuration takes effect, if the specified module generates log information, the information center automatically sends the log information to the console, which displays the information.
Saving security logs into the security log file Network requirements
As shown in Figure 21, to efficiently and conveniently view the security events and understand the security status of the device, you need to make sure of the following:
• Save security logs into the security log file Flash:/securitylog/seclog.log at a frequency of one hour.
• Only the security log administrator can view the contents of the security log file. All other logged-in users cannot view, copy and rename the security log file.
Figure 21 Network diagram
Configuration considerations
The configuration in this example includes two parts:

56
1. Logging in to the device as the system administrator
• Enable the saving of the security logs into the security log file and set the frequency with which the system saves the security log file to one hour.
• Create a local user seclog with the password 123123123123, and authorize this user as the security log administrator. That is, you need to use the authorization-attribute command to set the user privilege level to 3 and specify the user role as security audit. In addition, specify the service types that the user can use by using the service-type command.
• Set the authentication mode to scheme for the user logging in to the device, and make sure that only the local user that has passed the AAA local authentication can view and perform operations on the security log file.
2. Logging in to the device as the security log administrator
• Set the directory for saving the security log file to Flash:/securitylog/seclog.log.
• View the contents of the security log file to get the security status of the device.
Configuration procedure
1. Configuration performed by the system administrator
# Enable the saving of the security logs into the security log file and set the frequency with which the system automatically saves the security log file to one hour. <Sysname> system-view
[Sysname] info-center security-logfile enable
[Sysname] info-center security-logfile frequency 3600
# Create a local user seclog, and configure the password for the user as 123123123123. [Sysname] local-user seclog
New local user added.
[Sysname-luser-seclog] password simple 123123123123
# Authorize the user to manage the security log file. [Sysname-luser-seclog] authorization-attribute level 3 user-role security-audit
# Authorize the user to use SSH, Telnet, and terminal services. [Sysname-luser-seclog] service-type ssh telnet terminal
[Sysname-luser-seclog] quit
# According to the network plan, the user will log in to the device through SSH or telnetting, so you need to configure the authentication mode of the VTY user interface as scheme. [Sysname] display user-interface vty ?
INTEGER<0-15> Specify one user terminal interface
The above information indicates that the device supports sixteen VTY user interfaces, which are numbered 0 through 15. [Sysname] user-interface vty 0 15
[Sysname-ui-vty0-15] authentication-mode scheme
[Sysname-ui-vty0-15] quit
2. Configuration performed by the security log administrator
# Re-log in to the device as user seclog. C:/> telnet 1.1.1.1
******************************************************************************
* Copyright (c) 2004-2011 Hangzhou H3C Tech. Co., Ltd. All rights reserved. *
* Without the owner's prior written consent, *

57
* no decompiling or reverse-engineering shall be allowed. *
******************************************************************************
Login authentication
Username:seclog
Password:
<Sysname>
# Display the summary of the security log file. <Sysname> display security-logfile summary
Security-log is enabled.
Security-log file size quota: 1MB
Security-log file directory: flash:/seclog
Alarm-threshold: 80%
Current usage: 0%
Writing frequency: 1 hour 0 min 0 sec
The above information indicates that the directory for saving the security log file is flash:/seclog.
# Change the directory where the security log file is saved to Flash:/securitylog. <Sysname> mkdir securitylog
.
%Created dir flash:/securitylog.
<Sysname> info-center security-logfile switch-directory flash:/securitylog/
# Display contents of the security log file buffer. <Sysname> display security-logfile buffer
%@175 Nov 2 17:02:53:766 2011 Sysname SHELL/4/LOGOUT:
Trap 1.3.6.1.4.1.25506.2.2.1.1.3.0.2<hh3cLogOut>: logout from Console
%@176 Nov 2 17:02:53:766 2011 Sysname SHELL/5/SHELL_LOGOUT:Console logged out from aux0.
Contents of other logs are not shown.
The above information indicates that there is still new content in the buffer that has not been saved into the security log file yet.
# Save the contents of the security log file buffer into the security log file manually. <Sysname> security-logfile save
Info: Save all the contents in the security log buffer into file flash:/securitylog/seclog.log successfully.
# Display the contents of the security log file. <Sysname> more securitylog/seclog.log
%@157 Nov 2 16:12:01:750 2011 Sysname SHELL/4/LOGIN:
Trap 1.3.6.1.4.1.25506.2.2.1.1.3.0.1<hh3cLogIn>: login from Console
%@158 Nov 2 16:12:01:750 2011 Sysname SHELL/5/SHELL_LOGIN:Console logged in from aux0.
Contents of other logs are not shown.

58
SNMP configuration
SNMP overview The Simple Network Management Protocol (SNMP) is an Internet standard protocol widely used for a management station to access and operate the devices on a network, regardless of their vendors, physical characteristics and interconnect technologies.
SNMP enables network administrators to read and set the variables on managed devices for state monitoring, troubleshooting, statistics collection, and other management purposes.
SNMP mechanism The SNMP framework comprises the following elements:
• SNMP manager—Works on a network management system (NMS) to monitor and manage the SNMP-capable devices in the network.
• SNMP agent—Works on a managed device to receive and handle requests from the NMS, and send traps to the NMS when some events, such as interface state change, occur.
• Management Information Base (MIB)—Specifies the variables (for example, interface status and CPU usage) maintained by the SNMP agent for the SNMP manager to read and set.
Figure 22 Relationship between an NMS, agent and MIB
A MIB stores variables called “nodes” or “objects” in a tree hierarchy and identifies each node with a unique OID. An OID is a string of numbers that describes the path from the root node to a leaf node. For example, the object B in Figure 23 is uniquely identified by the OID {1.2.1.1}.
Figure 23 MIB tree
A
2
6
1
5
21
1
2
1
B
SNMP provides the following basic operations:
• Get—The NMS retrieves SNMP object nodes in an agent MIB.
• Set—The NMS modifies the value of an object node in the agent MIB.

59
• Trap—The SNMP agent sends traps to report events to the NMS.
• Inform—The NMS sends alarms to other NMSs.
SNMP protocol versions H3C supports SNMPv1, SNMPv2c, and SNMPv3.
• SNMPv1 uses community names for authentication. To access an SNMP agent, an NMS must use the same community name as set on the SNMP agent. If the community name used by the NMS is different from the community name set on the agent, the NMS cannot establish an SNMP session to access the agent or receive traps and notifications from the agent.
• SNMPv2c also uses community names for authentication. SNMPv2c is compatible with SNMPv1, but supports more operation modes, data types, and error codes.
• SNMPv3 uses a user-based security model (USM) to secure SNMP communication. You can configure authentication and privacy mechanisms to authenticate and encrypt SNMP packets for integrity, authenticity, and confidentiality.
IMPORTANT:
An NMS and an SNMP agent must use the same SNMP version to communicate with each other.
SNMP configuration task list Complete the following tasks to configure SNMP:
Task Remarks
Configuring basic SNMP settings Required
Configuring network management-specific interface index Optional
Configuring SNMP logging Optional
Configuring SNMP traps Optional
Configuring basic SNMP settings SNMPv3 differs from SNMPv1 and SNMPv2c in many aspects. Their configuration procedures are described in separate sections.
Configuring basic SNMPv3 settings Follow these steps to configure basic SNMPv3 settings:
To do… Use the command… Remarks
Enter system view system-view —

60
To do… Use the command… Remarks
Enable the SNMP agent snmp-agent
Optional
Disabled by default.
You can also enable the SNMP agent by using any command that begins with snmp-agent except the snmp-agent calculate-password and snmp-agent ifmib long-ifindex enable commands.
Configure system information for the SNMP agent
snmp-agent sys-info { contact sys-contact | location sys-location | version { all | { v1 | v2c | v3 }* } }
Optional
By default, the contact is Hangzhou H3C Tech. Co.,Ltd., the physical location is Hangzhou, China, and the protocol version is SNMPv3.
Configure the local engine ID snmp-agent local-engineid engineid
Optional
The default local engine ID is the company ID plus the device ID.
Create or update a MIB view snmp-agent mib-view { excluded | included } view-name oid-tree [ mask mask-value ]
Optional
By default, the MIB view ViewDefault is predefined and its OID is 1.
Configure an SNMPv3 group
snmp-agent group v3 group-name [ authentication | privacy ] [ read-view read-view ] [ write-view write-view ] [ notify-view notify-view ] [ acl acl-number ]
Required
Convert a plain text key to an encrypted key
snmp-agent calculate-password plain-password mode { 3desmd5 | 3dessha | md5 | sha } { local-engineid | specified-engineid engineid }
Optional
Add a user to the SNMPv3 group
snmp-agent usm-user v3 user-name group-name [ [ cipher ] authentication-mode { md5 | sha } auth-password [ privacy-mode { 3des | aes128 | des56 } priv-password ] ] [ acl acl-number ]
Required
If the cipher keyword is specified, the arguments auth-password and priv-password are considered as encrypted keys.
Configure the maximum size (in bytes) of SNMP packets for the SNMP agent
snmp-agent packet max-size byte-count
Optional
By default, the SNMP agent can receive and send the SNMP packets up to 1,500 bytes.
CAUTION:
After you change the local engine ID, the existing SNMPv3 users become invalid, and you must re-createthe SNMPv3 users.

61
NOTE:
Each view-name oid-tree pair represents a view record. If you specify the same record with different MIBsubtree masks multiple times, the last configuration takes effect. Except the four subtrees in the default MIBview, you can create up to 16 unique MIB view records.
Configuring basic SNMPv1 or SNMPv2c settings Follow these steps to configure basic SNMPv1 or SNMPv2c settings:
To do… Use the command… Remarks
Enter system view system-view —
Enable the SNMP agent snmp-agent
Optional
Disabled by default.
You can also enable the SNMP agent service by using any command that begins with snmp-agent except the snmp-agent calculate-password and snmp-agent ifmib long-ifindex enable commands.
Configure system information for the SNMP agent
snmp-agent sys-info { contact sys-contact | location sys-location | version { all |{ v1 | v2c | v3 }* } }
Required
By default, the location information is Hangzhou, China, version is SNMPv3, and the contact is Hangzhou H3C Tech. Co., Ltd..
Configure the local engine ID snmp-agent local-engineid engineid Optional
The default local engine ID is the company ID plus the device ID.
Create or update a MIB view snmp-agent mib-view { excluded | included } view-name oid-tree [ mask mask-value ]
Optional
By default, the MIB view ViewDefault is predefined and its OID is 1.
Configure SNMP access right
Approach 1: Create an SNMP community
snmp-agent community { read | write } community-name [ acl acl-number | mib-view view-name ]*
Approach 2: Create an SNMP group, and add a user to the SNMP group 1. snmp-agent group { v1 | v2c }
group-name [ read-view read-view ] [ write-view write-view ] [ notify-view notify-view ] [ acl acl-number ]
2. snmp-agent usm-user { v1 | v2c } user-name group-name [ acl acl-number ]
Required
Use either approach.
By default, no SNMP group exists.
In approach 2, the username is equivalent to the community name in approach 1, and must be the same as the community name configured on the NMS.

62
To do… Use the command… Remarks
Configure the maximum size (in bytes) of SNMP packets for the SNMP agent
snmp-agent packet max-size byte-count
Optional
By default, the SNMP agent can receive and send the SNMP packets up to 1,500 bytes.
NOTE:
Each view-name oid-tree pair represents a view record. If you specify the same record with different MIBsubtree masks multiple times, the last configuration takes effect. Except the four subtrees in the default MIBview, you can create up to 16 unique MIB view records.
Configuring network management-specific interface index
About the network management-specific interface index A network management (NM)-specific ifindex identifies an interface and is provided by the SNMP managed device to the NMS. A network management-specific ifindex takes one of the following two formats:
1. 16-bit NM-specific ifindex
The system dynamically assigns 16-bit NM-specific ifindex values to uniquely identify its interfaces. The 16-bit NM-specific ifindex value starts from 1 and increments by 1.
2. 32-bit NM-specific ifindex
A 32-bit NM-specific ifindex value comprises an Offset, Interface Type, Slot ID, and Chassis ID, as shown in Figure 24.
Figure 24 32-bit NM-specific ifindex
• Offset: This field is 16 bits in length and is used to distinguish different interfaces of the same type on the same interface board.
• Interface type: This field is 7 bits in length and is the enumerated value corresponding to the interface type. It supports up to 128 different interface types and supports more than 80 interface types at present.
• Slot ID: Number of the physical slot in which the interface resides, with the length of 5 bits.
• Chassis ID: This field is 4 bits in length. For a distributed IRF fabric, this field indicates the member ID of the device to which the interface belongs. For other types of device, this field has no meanings and the value is 0.
Switching the format of an NM-specific ifindex You use the 32-bit NM-specific ifindex format when the NMS requires the 32-bit NM-specific ifindex format to get information such as the slot that contains the interface. If the network protocol operating on

63
the NMS does not support 32-bit NM-specific ifindex values, make sure that NM-specific ifindex values on the device are 16-bit. By default, the device adopts the 16-bit NM-specific ifindex format.
For example, you must use the 16-bit format when the device runs the version 5 or version 8 of NetStream, because the two NetStream versions reserve only 16 bits for the ifindex. NetStream version 9 reserves 32 bits for the ifindex, so you can use either 16-bit or 32-bit NM-specific ifindex format.
Follow these steps to switch the format of an NM-specific ifindex:
To do… Use the command… Remarks
Enter system view system-view —
Switch the format of an NM-specific ifindex from 16-bit to 32-bit
snmp-agent ifmib long-ifindex enable
Optional
By default, an NM-specific ifindex is in 16-bit format.
Switch the format of an NM-specific ifindex from 32-bit to 16-bit
undo snmp-agent ifmib long-ifindex enable
Optional
By default, an NM-specific ifindex is in 16-bit format.
CAUTION:
An NM-specific ifindex format change invalidates the NM-specific ifindex dependent settings, and thesesettings cannot become valid until you switch the format back. To use these settings in the new format, youmust re-configure them. For example, if a RMON alarm group or private alarm group has alarm variablesin the format of OID/variable-name.NM-specific-ifindex, you must reconfigure these variables after an NM-specific ifindex format change.
Configuring SNMP logging
Introduction to SNMP logging The SNMP agent logs Get requests, Set requests and Set responses, but does not log Get responses.
• For a Get operation, the agent logs the IP address of the NMS, name of the accessed node, and node OID.
• For a Set operation, the agent logs the IP address of the NMS, name of the accessed node, node OID, the assigned value and the error code and error index of the Set response.
The SNMP module sends these logs to the information center as informational messages. You can output these messages to certain destinations, for example, the console and the log buffer by configuring the information center to output informational messages to these destinations. For more information about the information center, see the chapter “Information center configuration.”
Enabling SNMP logging Follow these steps to configure SNMP logging:
To do… Use the command… Remarks
Enter system view system-view —
Enable SNMP logging snmp-agent log { all | get-operation | set-operation }
Required
Disabled by default.
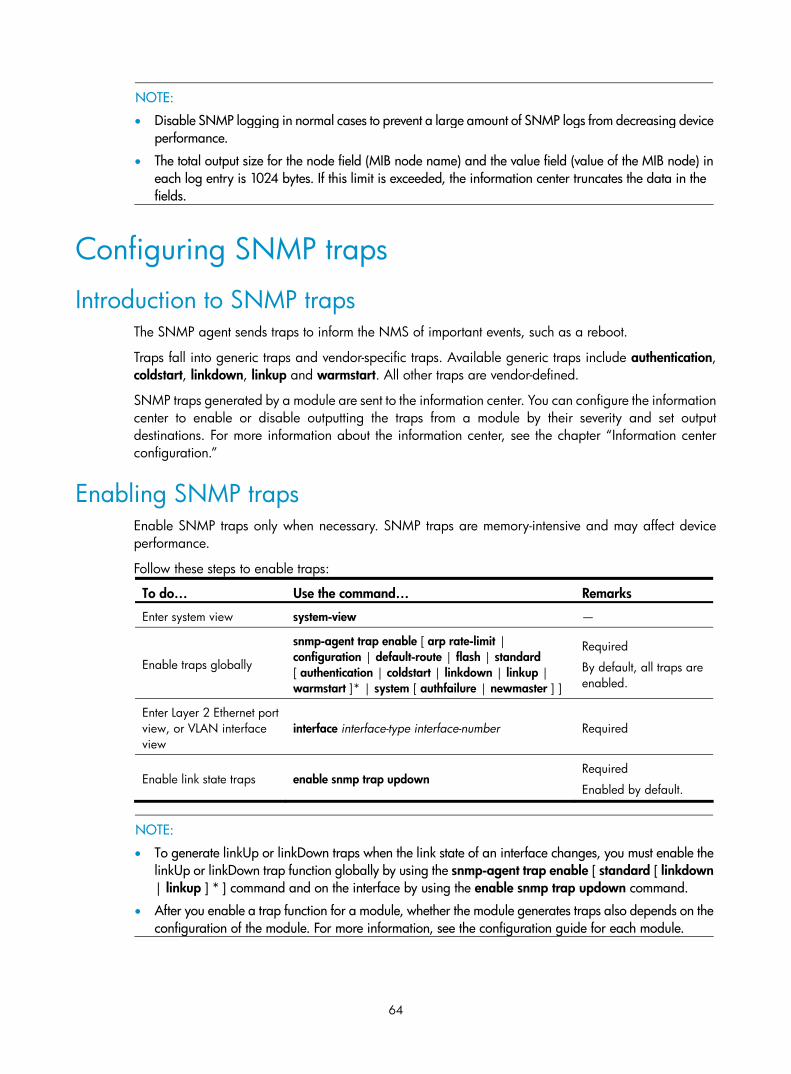
64
NOTE:
• Disable SNMP logging in normal cases to prevent a large amount of SNMP logs from decreasing deviceperformance.
• The total output size for the node field (MIB node name) and the value field (value of the MIB node) in each log entry is 1024 bytes. If this limit is exceeded, the information center truncates the data in the fields.
Configuring SNMP traps
Introduction to SNMP traps The SNMP agent sends traps to inform the NMS of important events, such as a reboot.
Traps fall into generic traps and vendor-specific traps. Available generic traps include authentication, coldstart, linkdown, linkup and warmstart. All other traps are vendor-defined.
SNMP traps generated by a module are sent to the information center. You can configure the information center to enable or disable outputting the traps from a module by their severity and set output destinations. For more information about the information center, see the chapter “Information center configuration.”
Enabling SNMP traps Enable SNMP traps only when necessary. SNMP traps are memory-intensive and may affect device performance.
Follow these steps to enable traps:
To do… Use the command… Remarks
Enter system view system-view —
Enable traps globally
snmp-agent trap enable [ arp rate-limit | configuration | default-route | flash | standard [ authentication | coldstart | linkdown | linkup | warmstart ]* | system [ authfailure | newmaster ] ]
Required
By default, all traps are enabled.
Enter Layer 2 Ethernet port view, or VLAN interface view
interface interface-type interface-number Required
Enable link state traps enable snmp trap updown Required
Enabled by default.
NOTE:
• To generate linkUp or linkDown traps when the link state of an interface changes, you must enable thelinkUp or linkDown trap function globally by using the snmp-agent trap enable [ standard [ linkdown| linkup ] * ] command and on the interface by using the enable snmp trap updown command.
• After you enable a trap function for a module, whether the module generates traps also depends on theconfiguration of the module. For more information, see the configuration guide for each module.

65
Configuring trap sending parameters Configuration prerequisites
• Complete the basic SNMP settings and check that they are the same as on the NMS. If SNMPv1 or SNMPv2 is used, you must configure a community name. If SNMPv3 is used, you must configure an SNMPv3 user and MIB view.
• The device and the NMS can reach other.
Configuration procedure
The SNMP module buffers the traps received from a module in a trap queue. You can set the size of the queue, the duration that the queue holds a trap, and trap target (destination) hosts, typically the NMS.
Follow these steps to configure trap sending parameters:
To do… Use the command… Remarks
Enter system view system-view —
Configure a target host
snmp-agent target-host trap address udp-domain { ip-address | ipv6 ipv6-address } [ udp-port port-number ] params securityname security-string [ v1 | v2c | v3 [ authentication | privacy ] ]
Required
If the trap destination is a host, the ip-address argument must be the IP address of the host.
Configure the source address for traps
snmp-agent trap source interface-type interface-number
Optional
By default, SNMP chooses the IP address of an interface to be the source IP address of traps.
Extend the standard linkUp/linkDown traps
snmp-agent trap if-mib link extended
Optional
Standard linkUp/linkDown traps are used by default.
Configure the trap queue size snmp-agent trap queue-size size Optional
The default trap queue size is 100.
Configure the trap holding time snmp-agent trap life seconds Optional
120 seconds by default.
NOTE:
• Extended linkUp/linkDown traps add interface description and interface type to standard linkUp/linkDown traps. If the NMS does not support extended SNMP messages, use standard linkUp/linkDown traps.
• When the trap queue is full, the oldest traps are automatically deleted for new traps.
• A trap is deleted when its holding time expires.
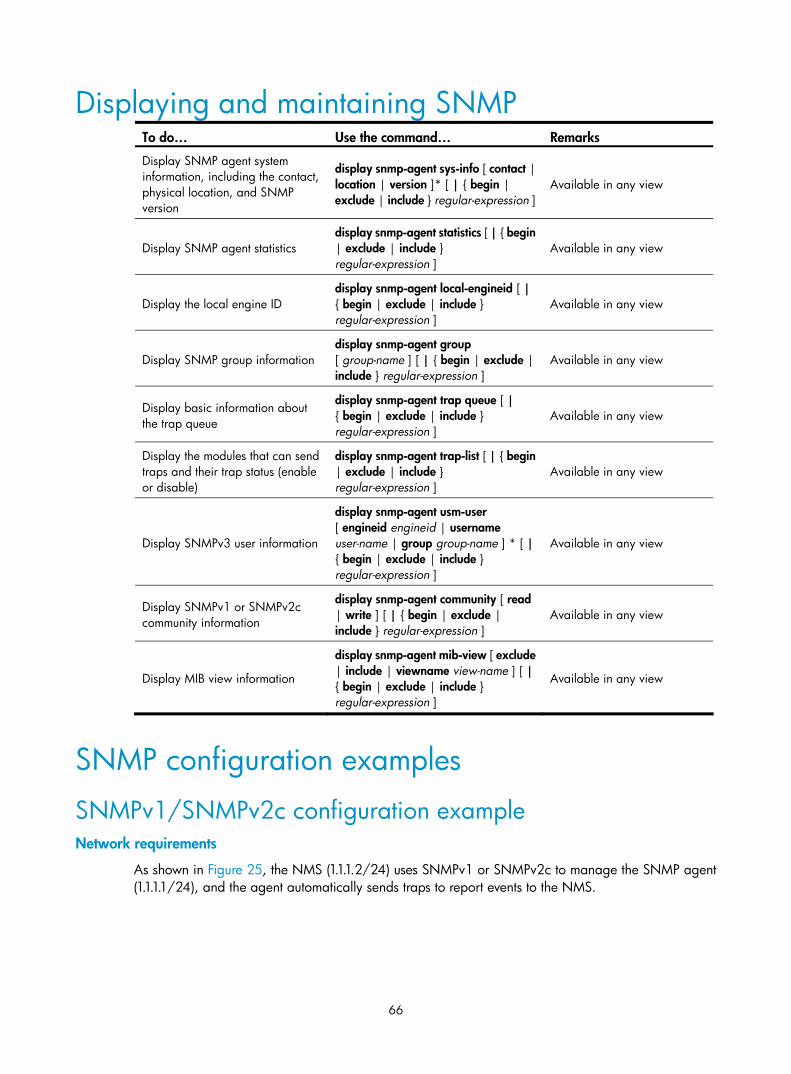
66
Displaying and maintaining SNMP To do… Use the command… Remarks
Display SNMP agent system information, including the contact, physical location, and SNMP version
display snmp-agent sys-info [ contact | location | version ]* [ | { begin | exclude | include } regular-expression ]
Available in any view
Display SNMP agent statistics display snmp-agent statistics [ | { begin | exclude | include } regular-expression ]
Available in any view
Display the local engine ID display snmp-agent local-engineid [ | { begin | exclude | include } regular-expression ]
Available in any view
Display SNMP group information display snmp-agent group [ group-name ] [ | { begin | exclude | include } regular-expression ]
Available in any view
Display basic information about the trap queue
display snmp-agent trap queue [ | { begin | exclude | include } regular-expression ]
Available in any view
Display the modules that can send traps and their trap status (enable or disable)
display snmp-agent trap-list [ | { begin | exclude | include } regular-expression ]
Available in any view
Display SNMPv3 user information
display snmp-agent usm-user [ engineid engineid | username user-name | group group-name ] * [ | { begin | exclude | include } regular-expression ]
Available in any view
Display SNMPv1 or SNMPv2c community information
display snmp-agent community [ read | write ] [ | { begin | exclude | include } regular-expression ]
Available in any view
Display MIB view information
display snmp-agent mib-view [ exclude | include | viewname view-name ] [ | { begin | exclude | include } regular-expression ]
Available in any view
SNMP configuration examples
SNMPv1/SNMPv2c configuration example Network requirements
As shown in Figure 25, the NMS (1.1.1.2/24) uses SNMPv1 or SNMPv2c to manage the SNMP agent (1.1.1.1/24), and the agent automatically sends traps to report events to the NMS.

67
Figure 25 Network diagram
Configuration procedure
1. Configure the SNMP agent
# Configure the IP address of the agent and make sure that the agent and the NMS can reach each other. (Details not shown)
# Specify SNMPv1 and SNMPv2c, create a read-only community public, and a read and write community private. <Agent> system-view
[Agent] snmp-agent sys-info version v1 v2c
[Agent] snmp-agent community read public
[Agent] snmp-agent community write private
# Configure contact and physical location information for the agent. [Agent] snmp-agent sys-info contact Mr.Wang-Tel:3306
[Agent] snmp-agent sys-info location telephone-closet,3rd-floor
# Enable SNMP traps, set the NMS at 1.1.1.2/24 as an SNMP trap destination, and use public as the community name. (To make sure that the NMS can receive traps, specify the same SNMP version in the snmp-agent target-host command as on the NMS.) [Agent] snmp-agent trap enable
[Agent] snmp-agent target-host trap address udp-domain 1.1.1.2 params securityname public v1
[Agent] quit
2. Configure the SNMP NMS
Specify the read only community, the read and write community, the timeout time, and the number of retries.
NOTE:
The SNMP settings on the agent and the NMS must match.
3. Verify the configuration
# Try to get the count of sent traps from the agent, and the attempt succeeds. Send request to 1.1.1.1/161 ...
Protocol version: SNMPv1
Operation: Get
Request binding:
1: 1.3.6.1.2.1.11.29.0
Response binding:
1: Oid=snmpOutTraps.0 Syntax=CNTR32 Value=18
Get finished
# Use a wrong community name to get the value of a MIB node from the agent, and you can see an authentication failure trap on the NMS.

68
1.1.1.1/2934 V1 Trap = authenticationFailure
SNMP Version = V1
Community = public
Command = Trap
Enterprise = 1.3.6.1.4.1.43.1.16.4.3.50
GenericID = 4
SpecificID = 0
Time Stamp = 8:35:25.68
SNMPv3 configuration example Network requirements
As shown in Figure 26, the NMS (1.1.1.2/24) uses SNMPv3 to monitor and manage the interface status of the agent (1.1.1.1/24). The agent automatically sends traps to report events to the NMS.
The NMS and the agent perform authentication when they set up an SNMP session. The authentication algorithm is MD5 and the authentication key is authkey. The NMS and the agent also encrypt the SNMP packets between them by using the DES algorithm and the privacy key prikey.
Figure 26 Network diagram
Configuration procedure
1. Configure the agent
# Configure the IP address of the agent and make sure that the agent and the NMS can reach each other. (Details not shown)
# Assign the NMS (SNMPv3 group managev3group) read and write access to the objects under the snmp node (OID 1.3.6.1.2.1.11), and deny its access to any other MIB object. <Agent> system-view
[Agent] undo snmp-agent mib-view ViewDefault
[Agent] snmp-agent mib-view included test snmp
[Agent] snmp-agent group v3 managev3group read-view test write-view test
# Add the user managev3user to the SNMPv3 group managev3group), set the authentication algorithm to MD5, authentication key to authkey, the encryption algorithm to DES56, and the privacy key to prikey. [Agent] snmp-agent usm-user v3 managev3user managev3group authentication-mode md5 authkey privacy-mode des56 prikey
# Configure contact and physical location information for the agent. [Agent] snmp-agent sys-info contact Mr.Wang-Tel:3306
[Agent] snmp-agent sys-info location telephone-closet,3rd-floor
# Enable traps, specify the NMS at 1.1.1.2 as a trap destination, and set the username to managev3user for the traps. [Agent] snmp-agent trap enable
[Agent] snmp-agent target-host trap address udp-domain 1.1.1.2 params securityname managev3user v3 privacy

69
2. Configure the SNMP NMS
• Specify SNMPv3.
• Create the SNMPv3 user managev3user.
• Enable both authentication and privacy functions.
• Use MD5 for authentication and DES for encryption.
• Set the authentication key to authenkey and the privacy key to prikey.
• Set the timeout time and maximum number of retries.
For information about configuring the NMS, see the manual for the NMS.
NOTE:
The SNMP settings on the agent and the NMS must match.
3. Verify the configuration
# Try to get the count of sent traps from the agent, and the get attempt succeeds. Send request to 1.1.1.1/161 ...
Protocol version: SNMPv3
Operation: Get
Request binding:
1: 1.3.6.1.2.1.11.29.0
Response binding:
1: Oid=snmpOutTraps.0 Syntax=CNTR32 Value=18
Get finished
# Try to get the device name from the agent, but the get attempt fails because the NMS has no access right to the node. Send request to 1.1.1.1/161 ...
Protocol version: SNMPv3
Operation: Get
Request binding:
1: 1.3.6.1.2.1.1.5.0
Response binding:
1: Oid=sysName.0 Syntax=noSuchObject Value=NULL
Get finished
# Execute the shutdown or undo shutdown command on an idle interface on the agent, and you can see the interface state change traps on the NMS: 1.1.1.1/3374 V3 Trap = linkdown
SNMP Version = V3
Community = managev3user
Command = Trap
1.1.1.1/3374 V3 Trap = linkup
SNMP Version = V3
Community = managev3user
Command = Trap

70
SNMP logging configuration example Network requirements
An SNMP agent (1.1.1.1/24) connects to an NMS (1.1.1.2/24) over Ethernet, as shown in Figure 27.
Configure the agent to log the SNMP operations performed by the NMS.
Figure 27 Network diagram
Configuration procedure
NOTE:
This configuration example assumes that you have configured all required SNMP settings for the NMS and the agent (see “SNMPv1/SNMPv2c configuration example” and “SNMPv3 configuration example.”).
# Enable displaying log messages on the configuration terminal. (This function is enabled by default. Skip this step if you are using the default.) <Agent> terminal monitor
<Agent> terminal logging
# Enable the information center to output the system events of the informational or higher severity to the console port. <Agent> system-view
[Agent] info-center source snmp channel console log level informational
# Enable logging Get and Set operations. [Agent] snmp-agent log all
# Verify the configuration.
• Use the NMS to get a MIB variable from the agent. The following is a sample log message displayed on the configuration terminal:
%Jan 1 02:49:40:566 2011 Sysname SNMP/6/GET:
seqNO = <10> srcIP = <1.1.1.2> op = <get> node = <sysName(1.3.6.1.2.1.1.5.0)> value=<>
• Use the NMS to set a MIB variable on the agent. The following is a sample log message displayed on the configuration terminal:
%Jan 1 02:59:42:576 2011 Sysname SNMP/6/SET:
seqNO = <11> srcIP = <1.1.1.2> op = <set> errorIndex = <0> errorStatus =<noError> node = <sysName(1.3.6.1.2.1.1.5.0)> value = <Agent>
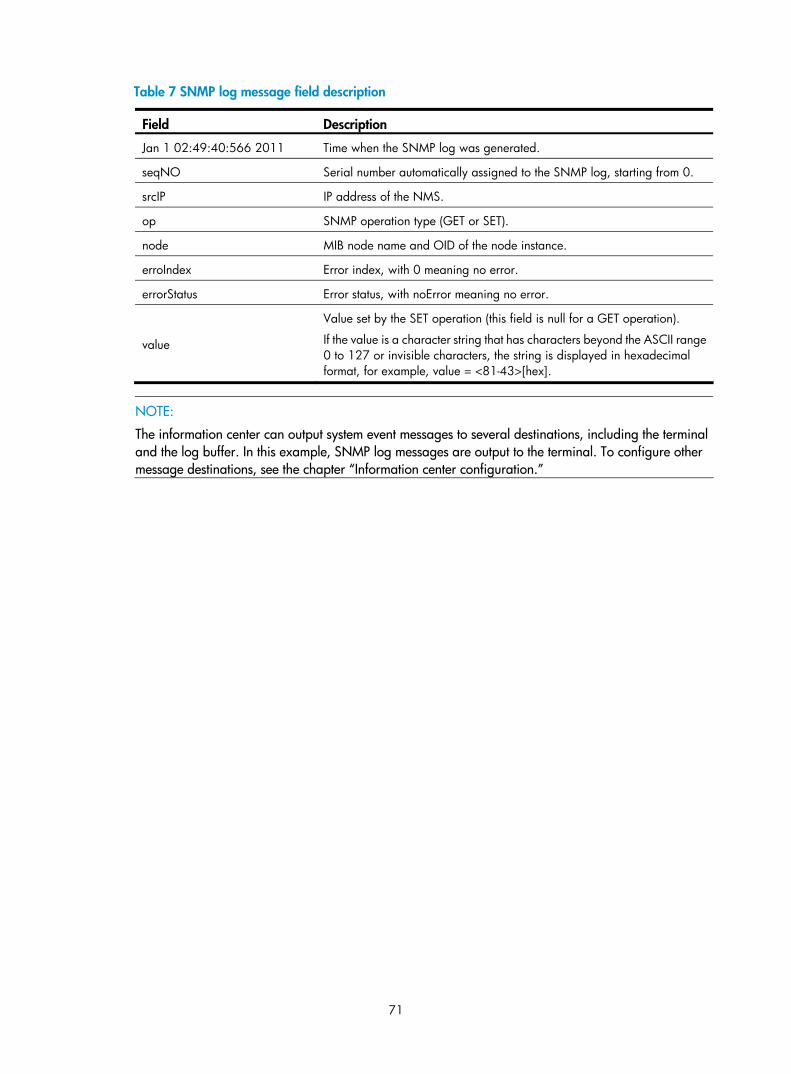
71
Table 7 SNMP log message field description
Field Description
Jan 1 02:49:40:566 2011 Time when the SNMP log was generated.
seqNO Serial number automatically assigned to the SNMP log, starting from 0.
srcIP IP address of the NMS.
op SNMP operation type (GET or SET).
node MIB node name and OID of the node instance.
erroIndex Error index, with 0 meaning no error.
errorStatus Error status, with noError meaning no error.
value
Value set by the SET operation (this field is null for a GET operation).
If the value is a character string that has characters beyond the ASCII range 0 to 127 or invisible characters, the string is displayed in hexadecimal format, for example, value = <81-43>[hex].
NOTE:
The information center can output system event messages to several destinations, including the terminal and the log buffer. In this example, SNMP log messages are output to the terminal. To configure other message destinations, see the chapter “Information center configuration.”

72
MIB style configuration
Overview MIBs fall into public MIBs and private MIBs. A private MIB is attached to a sub-node under the enterprises MIB node (1.3.6.1.4.1). The H3C private MIB has two styles: the H3C compatible MIB style and the H3C new MIB style:
• In the H3C compatible MIB style, the device public MIB is under the H3C’s enterprise ID 25506, and the private MIB is under the enterprise ID 2011.
• In the H3C new MIB style, both the device public MIB and the private MIB are under the H3C’s enterprise ID 25506.
These two styles of MIBs implement the same management function. Your device comes with a MIB loaded but the MIB style depends on the switch model. You can change the MIB style as needed, but must make sure that the device is using the same MIB style as the NMS.
Setting the MIB style Follow these steps to set the MIB style:
To do… Use the command… Remarks
Enter system view system-view —
Set the MIB style mib-style [ compatible | new ] Optional
new by default.
NOTE:
After changing the MIB style, reboot the device to validate the change.
Displaying and maintaining MIB style To do… Use the command… Remarks
Display the MIB style display mib-style [ | { begin | exclude | include } regular-expression ] Available in any view

73
RMON configuration
RMON overview
Introduction Remote Monitoring (RMON) is an enhancement to SNMP for remote device management and traffic monitoring. An RMON monitor, typically the RMON agent embedded in a network device, periodically or continuously collects traffic statistics for the network attached to a port, and when a statistic crosses a threshold, log the crossing event and send a trap to the management station.
RMON uses SNMP traps to notify NMSs of exceptional conditions. RMON SNMP traps report various events, including traffic events such as broadcast traffic threshold exceeded. In contrast, SNMP standard traps report device operating status changes such as link up, link down, and module failure.
RMON enables proactive monitoring and management of remote network devices and subnets. The managed device can automatically send a trap when a statistic crosses an alarm threshold, and the NMS does not need to constantly poll MIB variables and compare the results. As a result, network traffic is reduced.
Working mechanism RMON monitors typically take one of the following forms:
• Dedicated RMON probes. NMSs can obtain management information from RMON probes directly and control network resources. In this approach, NMSs can obtain all RMON MIB information.
• RMON agents embedded in network devices. NMSs exchange data with RMON agents by using basic SNMP operations to gather network management information. This approach consumes the resources of managed network devices, and most RMON agent implementations only provide four groups of MIB information, alarm, event, history, and statistics.
H3C devices provide the embedded RMON agent function. You can configure your device to collect and report traffic statistics, error statistics, and performance statistics.
RMON groups Among the RMON groups defined by RMON specifications (RFC 2819), the device uses the statistics group, history group, event group, and alarm group supported by the public MIB. HP also defines and implements the private alarm group, which enhances the functions of the alarm group.
Ethernet statistics group
The statistics group defines that the system collects statistics of traffic information on an interface (at present, only Ethernet interfaces are supported) and saves the statistics in the Ethernet statistics table (ethernetStatsTable) for query convenience of the management device. It provides statistics about network collisions, CRC alignment errors, undersize/oversize packets, broadcasts, multicasts, bytes received, packets received, and so on.

74
After the creation of a statistics entry on an interface, the statistics group starts to collect traffic statistics on the interface. The result of the statistics is a cumulative sum.
History group
The history group defines that the system periodically collects statistics of traffic information on an interface and saves the statistics in the history record table (ethernetHistoryTable) for query convenience of the management device. The statistics include bandwidth utilization, number of error packets, and total number of packets.
A history group collects statistics on packets received on the interface during each period, which can be configured at the command line interface (CLI).
Event group
The event group defines event indexes. It controls the generation and notifications of the events triggered by the alarms defined in the alarm group and the private alarm group. The events can be handled in one of the following ways:
• Log: Logging event related information (the events that occurred, contents of the event, and so on) in the event log table of the RMON MIB of the device. The management device can check the logs through the SNMP Get operation.
• Trap: Sending a trap to notify the occurrence of this event to the network management system (NMS).
• Log-Trap: Logging event information in the event log table and sending a trap to the NMS.
• None: No action.
Alarm group
The RMON alarm group monitors alarm variables, such as the count of incoming packets (etherStatsPkts) on an interface. After you define an alarm entry, the system gets the value of the monitored alarm variable at the specified interval. When the value of the monitored variable is greater than or equal to the rising threshold, a rising event is triggered. When the value of the monitored variable is smaller than or equal to the falling threshold, a falling event is triggered. The event is then handled as defined in the event group.
If an alarm entry crosses a threshold multiple times in succession, the RMON agent generates an alarm event only for the first crossing. For example, if the value of a sampled alarm variable crosses the rising threshold multiple times before it crosses the falling threshold, only the first crossing triggers a rising alarm event, as shown in Figure 28.

75
Figure 28 Rising and falling alarm events
Private alarm group
The private alarm group calculates the values of alarm variables and compares the result with the defined threshold, thereby realizing a more comprehensive alarm function.
The system handles the prialarm alarm table entry (as defined by the user) in the following ways:
• Periodically samples the prialarm alarm variables defined in the prialarm formula.
• Calculates the sampled values based on the prialarm formula.
• Compares the result with the defined threshold.
• Generates an appropriate event if the threshold value is reached.
NOTE:
If an alarm entry crosses a threshold multiple times in succession, the RMON agent generates an alarm event only for the first crossing. For example, if the value of a sampled alarm variable crosses the rising threshold multiple times before it crosses the falling threshold, only the first crossing triggers a rising alarmevent. If the count result of the private alarm group overpasses the same threshold multiple times, only thefirst one can cause an alarm event. In other words, the rising alarm and falling alarm are alternate.
Configuring the RMON statistics function The RMON statistics function can be implemented by either the Ethernet statistics group or the history group, but the objects of the statistics are different. You can configure a statistics group or a history group accordingly.
• A statistics object of the Ethernet statistics group is a variable defined in the Ethernet statistics table, and the recorded content is a cumulative sum of the variable from the time the statistics entry is created to the current time. For more information, see “Configuring the RMON Ethernet statistics function.”
• A statistics object of the history group is the variable defined in the history record table, and the recorded content is a cumulative sum of the variable in each period. For more information, see “Configuring the RMON history statistics function.”

76
Configuring the RMON Ethernet statistics function Follow these steps to configure the RMON Ethernet statistics function:
To do… Use the command… Remarks
Enter system view system-view —
Enter Layer 2 Ethernet port view interface interface-type interface-number —
Create an entry in the RMON statistics table rmon statistics entry-number [ owner text ] Required
NOTE:
You can create one statistics entry per interface and up to 100 statistics entries on the device. When the number of statistics entries exceeds 100, you cannot add new entries.
Configuring the RMON history statistics function Follow these steps to configure the RMON history statistics function:
To do… Use the command… Remarks
Enter system view system-view —
Enter Layer 2 Ethernet port view interface interface-type interface-number —
Create an entry in the RMON history control table
rmon history entry-number buckets number interval sampling-interval [ owner text ] Required
NOTE:
• The entry-number must be globally unique and cannot be used on another interface. Otherwise, the operation fails.
• You can configure multiple history entries on one interface, but the values of the entry-number arguments must be different, and the values of the sampling-interval arguments must be different too. Otherwise, the operation fails.
• Up to 100 history entries can be created for the switch.
• When you create an entry in the history table, if the specified buckets number argument exceeds the history table size supported by the device, the entry is created. However, the validated value of the buckets number argument that corresponds to the entry is the history table size supported by the device.
Configuring the RMON alarm function
Configuration prerequisites • To enable the managed devices to send traps to the NMS when the NMS triggers an alarm event,
configure the SNMP agent as described in the chapter “SNMP configuration” before configuring the RMON alarm function.
• If the alarm variable is the MIB variable defined in the history group or the Ethernet statistics group, make sure that the RMON Ethernet statistics function or the RMON history statistics function is configured on the monitored Ethernet port. Otherwise, the creation of the alarm entry fails, and no alarm event is triggered.

77
Configuration procedure Follow these steps to configure the RMON alarm function:
To do… Use the command… Remarks
Enter system view system-view —
Create an event entry in the event table
rmon event entry-number [ description string ] { log | log-trap log-trapcommunity | none | trap trap-community } [ owner text ]
Required
Create an entry in the alarm table
rmon alarm entry-number alarm-variable sampling-interval { absolute | delta } rising-threshold threshold-value1 event-entry1 falling-threshold threshold-value2 event-entry2 [ owner text ]
Create an entry in the private alarm table
rmon prialarm entry-number prialarm-formula prialarm-des sampling-interval { absolute | changeratio | delta } rising-threshold threshold-value1 event-entry1 falling-threshold threshold-value2 event-entry2 entrytype { forever | cycle cycle-period } [ owner text ]
Required
Use at least one command.
NOTE:
• A new entry cannot be created if its parameters are identical with the corresponding parameters of anexisting entry. If the created entry is a history entry, it will be compared with the existing history entriesonly on the same interface. See Table 8 for the parameters to be compared for different entries.
• The system limits the total number of each type of entries (see Table 8 for the detailed numbers). Whenthe total number of an entry reaches the maximum number of entries that can be created, the creationfails.
Table 8 Restrictions on the configuration of RMON
Entry Parameters to be compared Maximum number of entries that can be created
Event Event description (description string), event type (log, trap, logtrap or none) and community name (trap-community or log-trapcommunity) 60
Alarm Alarm variable (alarm-variable), sampling interval (sampling-interval), sampling type (absolute or delta), rising threshold (threshold-value1) and falling threshold (threshold-value2)
60
Prialarm
Alarm variable formula (alarm-variable), sampling interval (sampling-interval), sampling type (absolute, changeratio or delta), rising threshold (threshold-value1) and falling threshold (threshold-value2)
50
Displaying and maintaining RMON To do… Use the command… Remarks
Display RMON statistics display rmon statistics [ interface-type interface-number ] [ | { begin | exclude | include } regular-expression ]
Available in any view

78
To do… Use the command… Remarks
Display the RMON history control entry and history sampling information
display rmon history [ interface-type interface-number ] [ | { begin | exclude | include } regular-expression ]
Available in any view
Display RMON alarm configuration information
display rmon alarm [ entry-number ] [ | { begin | exclude | include } regular-expression ] Available in any view
Display RMON prialarm configuration information
display rmon prialarm [ entry-number ] [ | { begin | exclude | include } regular-expression ] Available in any view
Display RMON events configuration information
display rmon event [ entry-number ] [ | { begin | exclude | include } regular-expression ] Available in any view
Display log information for the specified or all event entries
display rmon eventlog [ entry-number ] [ | { begin | exclude | include } regular-expression ] Available in any view
Ethernet statistics group configuration example Network requirements
As shown in Figure 29, Agent is connected to a configuration terminal through its console port and to Server through Ethernet cables.
Configure the RMON Ethernet statistics table to gather incoming packet statistics for GigabitEthernet 1/0/1, so the administrator can view the incoming traffic status of the interface at any time.
Figure 29 Network diagram
Configuration procedure
# Configure RMON to gather statistics for interface GigabitEthernet 1/0/1. <Sysname> system-view
[Sysname] interface gigabitethernet 1/0/1
[Sysname-GigabitEthernet1/0/1] rmon statistics 1 owner user1
The system gathers incoming packet statistics for GigabitEthernet 1/0/1. To view the statistics:
• Execute the display command. <Sysname> display rmon statistics gigabitethernet 1/0/1
EtherStatsEntry 1 owned by user1-rmon is VALID.
Interface : GigabitEthernet1/0/1<ifIndex.3>
etherStatsOctets : 21657 , etherStatsPkts : 307
etherStatsBroadcastPkts : 56 , etherStatsMulticastPkts : 34
etherStatsUndersizePkts : 0 , etherStatsOversizePkts : 0

79
etherStatsFragments : 0 , etherStatsJabbers : 0
etherStatsCRCAlignErrors : 0 , etherStatsCollisions : 0
etherStatsDropEvents (insufficient resources): 0
Packets received according to length:
64 : 235 , 65-127 : 67 , 128-255 : 4
256-511: 1 , 512-1023: 0 , 1024-1518: 0
• Perform SNMP Get operation on the NMS to obtain the value of the MIB node.
History group configuration example Network requirements
As shown in Figure 30, Agent is connected to a configuration terminal through its console port and to Server through Ethernet cables.
Configure the RMON history statistics table to gather incoming packet statistics for GigabitEthernet 1/0/1 every one minute, so the administrator can view whether traffic bursts have happened on the interface in a short time.
Figure 30 Network diagram
Configuration procedure
# Configure RMON to periodically gather statistics for interface GigabitEthernet 1/0/1. <Sysname> system-view
[Sysname] interface gigabitethernet 1/0/1
[Sysname-GigabitEthernet1/0/1] rmon history 1 buckets 8 interval 60 owner user1
The system gathers incoming packet statistics for GigabitEthernet 1/0/1. To view the statistics:
• Execute the display command. [Sysname-GigabitEthernet1/0/1] display rmon history
HistoryControlEntry 2 owned by null is VALID
Samples interface : GigabitEthernet1/0/1<ifIndex.3>
Sampled values of record 1 :
dropevents : 0 , octets : 834
packets : 8 , broadcast packets : 1
multicast packets : 6 , CRC alignment errors : 0
undersize packets : 0 , oversize packets : 0
fragments : 0 , jabbers : 0
collisions : 0 , utilization : 0
Sampled values of record 2 :
dropevents : 0 , octets : 962

80
packets : 10 , broadcast packets : 3
multicast packets : 6 , CRC alignment errors : 0
undersize packets : 0 , oversize packets : 0
fragments : 0 , jabbers : 0
collisions : 0 , utilization : 0
Sampled values of record 3 :
dropevents : 0 , octets : 830
packets : 8 , broadcast packets : 0
multicast packets : 6 , CRC alignment errors : 0
undersize packets : 0 , oversize packets : 0
fragments : 0 , jabbers : 0
collisions : 0 , utilization : 0
Sampled values of record 4 :
dropevents : 0 , octets : 933
packets : 8 , broadcast packets : 0
multicast packets : 7 , CRC alignment errors : 0
undersize packets : 0 , oversize packets : 0
fragments : 0 , jabbers : 0
collisions : 0 , utilization : 0
Sampled values of record 5 :
dropevents : 0 , octets : 898
packets : 9 , broadcast packets : 2
multicast packets : 6 , CRC alignment errors : 0
undersize packets : 0 , oversize packets : 0
fragments : 0 , jabbers : 0
collisions : 0 , utilization : 0
Sampled values of record 6 :
dropevents : 0 , octets : 898
packets : 9 , broadcast packets : 2
multicast packets : 6 , CRC alignment errors : 0
undersize packets : 0 , oversize packets : 0
fragments : 0 , jabbers : 0
collisions : 0 , utilization : 0
Sampled values of record 7 :
dropevents : 0 , octets : 766
packets : 7 , broadcast packets : 0
multicast packets : 6 , CRC alignment errors : 0
undersize packets : 0 , oversize packets : 0
fragments : 0 , jabbers : 0
collisions : 0 , utilization : 0
Sampled values of record 8 :
dropevents : 0 , octets : 1154
packets : 13 , broadcast packets : 1
multicast packets : 6 , CRC alignment errors : 0
undersize packets : 0 , oversize packets : 0
fragments : 0 , jabbers : 0
collisions
: 0 , utilization : 0

81
• Perform SNMP Get operation on the NMS to obtain the value of the MIB node.
Alarm group configuration example Network requirements
As shown in Figure 31, Agent is connected to a console terminal through its console port and to an NMS across Ethernet.
Do the following:
• Connect GigabitEthernet 1/0/1 to the FTP server. Gather statistics on traffic of the server on GigabitEthernet 1/0/1 with the sampling interval being five seconds. When traffic is above or below the thresholds, Agent sends the corresponding traps to the NMS.
• Execute the display rmon statistics command on Agent to display the statistics, and query the statistics on the NMS.
Figure 31 Network diagram
Configuration procedure
# Configure the SNMP agent, and make sure that the SNMP settings are the same as on the NMS. This example sets the SNMP version to SNMPv1, read community to public, write community to private, and the trap destination to 1.1.1.2, the IP address of the NMS. <Sysname> system-view
[Sysname] snmp-agent
[Sysname] snmp-agent community read public
[Sysname] snmp-agent community write private
[Sysname] snmp-agent sys-info version v1
[Sysname] snmp-agent trap enable
[Sysname] snmp-agent target-host trap address udp-domain 1.1.1.2 params securityname public
# Configure RMON to gather statistics for interface GigabitEthernet 1/0/1. [Sysname] interface gigabitethernet 1/0/1
[Sysname-GigabitEthernet1/0/1] rmon statistics 1 owner user1
[Sysname-GigabitEthernet1/0/1] quit
# Create an RMON alarm entry so when the delta sampling value of node 1.3.6.1.2.1.16.1.1.1.4.1 exceeds 100 or is lower than 50, event 1 is triggered to send traps. [Sysname] rmon event 1 trap public owner user1
[Sysname] rmon alarm 1 1.3.6.1.2.1.16.1.1.1.4.1 5 delta rising-threshold 100 1 falling-threshold 50 1
# Display the RMON alarm entry configuration.

82
<Sysname> display rmon alarm 1
AlarmEntry 1 owned by null is Valid.
Samples type : delta
Variable formula : 1.3.6.1.2.1.16.1.1.1.4.1<etherStatsOctets.1>
Sampling interval : 5(sec)
Rising threshold : 100(linked with event 1)
Falling threshold : 50(linked with event 2)
When startup enables : risingOrFallingAlarm
Latest value : 0
# Display statistics for interface GigabitEthernet 1/0/1. <Sysname> display rmon statistics gigabitethernet 1/0/1
EtherStatsEntry 1 owned by user1-rmon is VALID.
Interface : GigabitEthernet1/0/1<ifIndex.3>
etherStatsOctets : 57329 , etherStatsPkts : 455
etherStatsBroadcastPkts : 53 , etherStatsMulticastPkts : 353
etherStatsUndersizePkts : 0 , etherStatsOversizePkts : 0
etherStatsFragments : 0 , etherStatsJabbers : 0
etherStatsCRCAlignErrors : 0 , etherStatsCollisions : 0
etherStatsDropEvents (insufficient resources): 0
Packets received according to length:
64 : 7 , 65-127 : 413 , 128-255 : 35
256-511: 0 , 512-1023: 0 , 1024-1518: 0
You can now query alarm events on the NMS. On the monitored device, alarm event messages are displayed when events occur. The following is a sample output: [Sysname]
#Aug 27 16:31:34:12 2011 Sysname RMON/2/ALARMFALL:Trap 1.3.6.1.2.1.16.0.2 Alarm table 1 monitors 1.3.6.1.2.1.16.1.1.1.4.1 with sample type 2,has sampled alarm value 0 less than(or =) 50.

83
Port mirroring configuration
Introduction to port mirroring Port mirroring is the process of copying the packets passing through a port to the monitor port connecting to a monitoring device for packet analysis.
Terminologies of port mirroring Mirroring source
The mirroring source can be one or more monitored ports. Packets (called “mirrored packets”) passing through them are copied to a port connecting to a monitoring device for packet analysis. Such a port is called a “source port” and the device where the port resides is called a “source device”.
Mirroring destination
The mirroring destination is the destination port (also known as the monitor port) of mirrored packets and connects to the data monitoring device. The device where the monitor port resides is called the “destination device”. The monitor port forwards mirrored packets to its connecting monitoring device.
NOTE:
A monitor port may receive multiple duplicates of a packet in some cases because it can monitor multiplemirroring sources. For example, assume that Port 1 is monitoring bidirectional traffic on Port 2 and Port 3on the same device. If a packet travels from Port 2 to Port 3, two duplicates of the packet will be receivedon Port 1.
Mirroring direction
The mirroring direction indicates that the inbound, outbound, or bidirectional traffic can be copied on a mirroring source.
• Inbound: Copies packets received on a mirroring source.
• Outbound: Copies packets sent out a mirroring source.
• Bidirectional: Copies packets both received and sent on a mirroring source.
Mirroring group
Port mirroring is implemented through mirroring groups, which fall into local, remote source, and remote destination mirroring groups. For more information about the mirroring groups, see “Port mirroring classification and implementation.”
Reflector port, egress port, and remote probe VLAN
A reflector port, remote probe VLAN, and an egress port are used for Layer 2 remote port mirroring. The remote probe VLAN specially transmits mirrored packets to the destination device. Both the reflector port and egress port reside on a source device and send mirrored packets to the remote probe VLAN. The egress port must belong to the remote probe VLAN while the reflector port may not. For more information about the source device, destination device, reflector port, egress port, and remote probe VLAN, see “Port mirroring classification and implementation.”

84
NOTE:
The reflector port is used to enable local mirroring to support multiple monitor ports.
Port mirroring classification and implementation According to the locations of the mirroring source and the mirroring destination, port mirroring falls into local port mirroring and remote port mirroring.
Local port mirroring
In local port mirroring, the mirroring source and the mirroring destination are on the same device. A mirroring group that contains the mirroring source and the mirroring destination on the device is called a “local mirroring group”.
Figure 32 Local port mirroring implementation
As shown in Figure 32, the source port GigabitEthernet 1/0/1 and monitor port GigabitEthernet 1/0/2 reside on the same device. Packets of GigabitEthernet 1/0/1 are copied to GigabitEthernet 1/0/2, which then forwards the packets to the data monitoring device for analysis.
Remote port mirroring
In remote port mirroring, the mirroring source and the mirroring destination reside on different devices and in different mirroring groups. The mirroring group that contains the mirroring source or the mirroring destination is called a “remote source/destination group”. The devices between the source devices and destination device are intermediate devices.
Because the source and destination devices are on the same Layer 2 network, remote port mirroring is also referred to Layer 2 remote port mirroring.

85
Figure 33 Layer 2 remote port mirroring implementation
On the network shown in Figure 33,
The source device does the following:
1. Copies the packets received on the source port GigabitEthernet 1/0/1 to the egress port GigabitEthernet 1/0/2.
2. Forwards the packets to the intermediate device, which then broadcasts the packets in the remote probe VLAN.
3. Transmits the packets to the destination device via the intermediate device.
Then, the destination device does the following:
4. Receives the mirrored packets.
5. Compares their VLAN IDs to the ID of the remote probe VLAN configured in the remote destination group.
6. If the VLAN IDs of these mirrored packets match the remote probe VLAN ID, the device forwards them to the data monitoring device through the monitor port GigabitEthernet 1/0/2.
NOTE:
• Allow remote probe VLAN to pass through the intermediate devices to make sure the source device andthe destination device can communicate at Layer 2 in the remote probe VLAN.
• For a mirrored packet to successfully arrive at the remote destination device, make sure the VLAN ID ofthe mirrored packet is not removed or changed. Otherwise, the Layer 2 remote port mirroring configuration will fail.
• To monitor both the received and sent packets of a port in a mirroring group, you must use the mac-address mac-learning disable command on the source, intermediate, and destination devices todisable MAC address learning of the remote probe VLAN. For more information about the mac-address mac-learning disable command, see Layer 2—LAN Switch Command Reference.

86
Configuring local port mirroring
Local port mirroring configuration task list Configure a local mirroring group and then configure one or more source ports and a monitor port for the local mirroring group.
Complete these tasks to configure local port mirroring:
Task Remarks
Creating a local mirroring group Required
Configuring source ports for the local mirroring group Required
Configuring the monitor port for the local mirroring group Required
Using the remote probe VLAN to enable local mirroring to support multiple monitor ports Optional
Creating a local mirroring group Follow these steps to create a local mirroring group:
To do… Use the command… Remarks
Enter system view system-view —
Create a local mirroring group mirroring-group group-id local Required
No local mirroring group exists by default.
NOTE:
A local mirroring group takes effect only after you configure a monitor port and source ports for it.
Configuring source ports for the local mirroring group If you use system view, you can use a list to configure multiple source ports for a mirroring group at one time. If you use interface view, you can assign only the current port to the group as a source port, so you must repeat the step for each additional port.
Configuring source ports in system view
Follow these steps to configure source ports for a local mirroring group in system view:
To do… Use the command… Remarks
Enter system view system-view —
Configure source ports mirroring-group group-id mirroring-port mirroring-port-list { both | inbound | outbound }
Required
By default, no source port is configured for a local mirroring group.
Configuring a source port in interface view
Follow these steps to configure a source port for a local mirroring group in interface view:

87
To do… Use the command… Remarks
Enter system view system-view —
Enter interface view interface interface-type interface-number —
Configure the current port as a source port
[ mirroring-group group-id ] mirroring-port { both | inbound | outbound }
Required
By default, a port does not serve as a source port for any local mirroring group.
NOTE:
• A mirroring group can contain multiple source ports.
• A port can belong to only one mirroring group.
Configuring the monitor port for the local mirroring group You can configure the monitor port for a mirroring group in system view, or assign the current port to a mirroring group as the monitor port in interface view. The two methods lead to the same result.
Configuring the monitor port in system view
Follow these steps to configure the monitor port of a local mirroring group in system view:
To do… Use the command… Remarks
Enter system view system-view —
Configure the monitor port mirroring-group group-id monitor-port monitor-port-id
Required
By default, no monitor port is configured for a local mirroring group.
Configuring the monitor port in interface view
Follow these steps to configure the monitor port of a local mirroring group in interface view:
To do… Use the command… Remarks
Enter system view system-view —
Enter interface view interface interface-type interface-number —
Configure the current port as the monitor port
[ mirroring-group group-id ] monitor-port
Required
By default, a port does not serve as the monitor port for any local mirroring group.

88
NOTE:
• A mirroring group contains only one monitor port.
• To make sure that the mirroring function works properly, do not assign the monitor port to a source VLAN, or enable the spanning tree feature on the monitor port.
• H3C recommends you use a monitor port for port mirroring only. This is to make sure that the data monitoring device receives and analyzes only the mirrored traffic rather than a mix of mirrored traffic and normally forwarded traffic.
• You cannot configure the monitor port in a mirroring group as a port in a RRPP ring.
Using the remote probe VLAN to enable local mirroring to support multiple monitor ports
In typical local port mirroring configuration, you can configure only one monitor port in a local mirroring group. As a result, you cannot monitor traffic of a local device on multiple data monitoring devices. To do that, you can take advantage of the remote probe VLAN used in Layer 2 remote mirroring.
In Layer 2 remote port mirroring, a remote probe VLAN is configured, and the mirrored packets are broadcast within the remote probe VLAN. By connecting multiple data monitoring devices to the member ports of the remote probe VLAN, you can monitor the traffic of the local device on multiple data monitoring devices.
Configure this feature in the following steps:
1. Configure a remote source mirroring group on the local device
2. Configure the monitored ports on the device as source ports of this mirroring group
3. Configure a remote probe VLAN for this mirroring group
4. Assign the ports connecting the data monitoring devices to the remote probe VLAN
In this way, when packets mirrored on the monitored ports are broadcast in the remote probe VLAN, they will be sent out the ports connecting the data monitoring devices, and all the data monitoring devices can thus receive these mirrored packets.
Configuration procedure
Follow these steps to configure local port mirroring with multiple monitor ports:
To do… Use the command Remarks
Enter system view system-view —
Create a remote source mirroring group
mirroring-group group-id remote-source
Required
By default, no mirroring group exists on a device.

89
To do… Use the command Remarks
In system view mirroring-group group-id mirroring-port mirroring-port-list { both | inbound | outbound }
interface interface-type interface-number
[ mirroring-group group-id ] mirroring-port { both | inbound | outbound }
Configure source ports for the remote source mirroring group
In interface view
quit
Use either command
By default, no source port is configured for a mirroring group.
Configure the reflector port for the remote source mirroring group
mirroring-group group-id reflector-port reflector-port
Required
By default, no reflector port is configured for a mirroring group.
Create the remote probe VLAN and enter VLAN view vlan vlan-id
Required
By default, no remote probe VLAN is configured for a mirroring group.
Assign monitor ports to the remote probe VLAN port interface-list
Required
By default, a newly-created VLAN does not have any member port.
Return to system view quit —
Configure the remote probe VLAN for the remote source mirroring group
mirroring-group group-id remote-probe vlan rprobe-vlan-id
Required
By default, no remote probe VLAN is configured for a mirroring group.
NOTE:
• The reflector port of a remote source mirroring group must be an access port and belong to the defaultVLAN, VLAN 1.
• H3C recommends that you configure an unused port as the reflector port of a remote source mirroringgroup and disable STP on it.
• A mirroring group can contain multiple source ports.
• To make sure that the port mirroring function works properly, do not assign a source port to the remoteprobe VLAN.
• If you have already configured a reflector port for a remote source mirroring group, you can no longerconfigure an egress port for it.
• A VLAN can serve as the remote probe VLAN for only one remote source mirroring group. H3C recommends you use the remote probe VLAN for port mirroring exclusively. Do not create a VLAN interface for the VLAN or configure any other features for the VLAN.
• A remote probe VLAN must be a static VLAN. To remove the VLAN configured as a remote probe VLAN, you must first remove the remote probe VLAN with the undo mirroring-group remote-probe vlan command.
• If the remote probe VLAN of a remote mirroring group is removed, the remote mirroring group will become invalid.
• The link type of monitor ports configured for port mirroring must be access.

90
Configuring Layer 2 remote port mirroring
Layer 2 remote port mirroring configuration task list Configuring Layer 2 remote port mirroring is to configure remote mirroring groups. To do that, configure the remote source group on the source device and configure the cooperating remote destination group on the destination device. If an intermediate device exists, allow the remote probe VLAN to pass through the intermediate device.
NOTE:
H3C recommends you not enable GARP VLAN Registration Protocol (GVRP). If GVRP is enabled, GVRP may register the remote probe VLAN to unexpected ports, resulting in undesired duplicates. For more information about GVRP, see Layer 2—LAN Switching Configuration Guide.
Configure the following on the source device:
• Source ports
• Remote probe VLAN
• The egress port
Then, configure the following on the destination device:
• Remote probe VLAN
• Monitor port
Complete these tasks to configure Layer 2 remote port mirroring:
Task Remarks
Creating a remote source group Required
Configuring source ports for the remote source group Required
Configuring the egress port for the remote source group Required
Configuring a remote source group
Configuring the remote probe VLAN for the remote source group Required
Creating a remote destination group Required
Configuring the monitor port for the remote destination group Required
Configuring the remote probe VLAN for the remote destination group Required
Configuring a remote destination group
Assigning the monitor port to the remote probe VLAN Required
Configuring a remote source group (on the source device) Creating a remote source group
Follow these steps to create a remote source group:
To do… Use the command… Remarks
Enter system view system-view —

91
To do… Use the command… Remarks
Create a remote source group mirroring-group group-id remote-source Required
By default, no remote source group exists on a device.
Configuring source ports for the remote source group
If you use system view, you can use a list to configure multiple source ports for a mirroring group at one time. If you use interface view, you can assign only the current port to the group as a source port, so you must repeat the step for each additional port.
• Configuring source ports in system view
Follow these steps to configure source ports for the remote source group in system view:
To do… Use the command… Remarks
Enter system view system-view —
Configure source ports for the remote source group
mirroring-group group-id mirroring-port mirroring-port-list { both | inbound | outbound }
Required
By default, no source port is configured for a remote source group.
• Configuring a source port in interface view
Follow these steps to configure a source port for the remote source group in interface view:
To do… Use the command… Remarks
Enter system view system-view —
Enter interface view interface interface-type interface-number —
Configure the current port as a source port
[ mirroring-group group-id ] mirroring-port { both | inbound | outbound }
Required
By default, a port does not serve as a source port for any remote source group.
NOTE:
• A mirroring group can contain multiple source ports.
• A port can belong to only one mirroring group.
Configuring the egress port for the remote source group
You can configure the egress port for a mirroring group in system view, or assign the current port to it as the egress port in interface view. The two configuration modes lead to the same result.
• Configuring the egress port in system view
Follow these steps to configure the egress port for the remote source group in system view:
To do… Use the command… Remarks
Enter system view system-view —
Configure the egress port for the remote source group
mirroring-group group-id monitor-egress monitor-egress-port
Required
By default, no egress port is configured for a remote source group.

92
• Configuring the egress port in interface view
Follow these steps to configure the egress port for the remote source group in interface view:
To do… Use the command… Remarks
Enter system view system-view —
Enter interface view interface interface-type interface-number —
Configure the current port as the egress port
mirroring-group group-id monitor-egress
Required
By default, a port does not serve as the egress port for any remote source group.
NOTE:
• A mirroring group contains only one egress port.
• A source port of an existing mirroring group cannot be configured as an egress port.
• To make sure that the mirroring function works properly, disable these functions on the egress port: thespanning tree feature, 802.1X, IGMP snooping, static ARP, and MAC address learning.
Configuring the remote probe VLAN for the remote source group
Before configuring a remote probe VLAN, create a static VLAN that will serve as the remote probe VLAN for the remote source group.
Follow these steps to configure the remote probe VLAN for the remote source group:
To do… Use the command… Remarks
Enter system view system-view —
Configure the remote probe VLAN
mirroring-group group-id remote-probe vlan rprobe-vlan-id
Required
By default, no remote probe VLAN is configured for a remote source group.
NOTE:
• A VLAN can serve for only one mirroring group.
• When a VLAN is configured as a remote probe VLAN, you must remove the remote probe VLAN configuration before deleting the VLAN.
• When you remove the configuration of a remote probe VLAN, an active mirroring group becomes inactive.
• When a VLAN is configured as a remote probe VLAN, use the remote probe VLAN for port mirroringexclusively. Do not create a VLAN interface for the VLAN or configure any other features for the VLAN.
• The remote mirroring groups on the source device and destination device must use the same remote probe VLAN.
Configuring a remote destination group (on the destination device)
To configure a remote destination group, make the following configurations on the destination device:

93
Creating a remote destination group
Follow these steps to create a remote destination group:
To do… Use the command… Remarks
Enter system view system-view —
Create a remote destination group mirroring-group group-id remote-destination
Required
By default, no remote destination group exists on a device.
Configuring the monitor port for the remote destination group
You can configure the monitor port for a mirroring group in system view, or assign the current port to a mirroring group as the monitor port in interface view. The two methods lead to the same result.
• Configuring the monitor port in system view
Follow these steps to configure the monitor port for the remote destination group in system view:
To do… Use the command… Remarks
Enter system view system-view —
Configure the monitor port mirroring-group group-id monitor-port monitor-port-id
Required
By default, no monitor port is configured for a remote destination group.
• Configuring the monitor port in interface view
Follow these steps to configure the monitor port for the remote destination group in interface view:
To do… Use the command… Remarks
Enter system view system-view —
Enter interface view interface interface-type interface-number —
Configure the current port as the monitor port
[ mirroring-group group-id ] monitor-port
Required
By default, a port does not serve as the monitor port for any remote destination group.
NOTE:
• A mirroring group contains only one monitor port.
• To make sure that the mirroring function works properly, do not enable the spanning tree feature on themonitor port.
• H3C recommends you use a monitor port only for port mirroring. This is to make sure that the data monitoring device receives and analyzes only the mirrored traffic rather than a mix of mirrored traffic and normally forwarded traffic.
• You cannot configure the monitor port in a mirroring group as a port in a RRPP ring.
Configuring the remote probe VLAN for the remote destination group
Follow these steps to configure the remote probe VLAN for the remote destination group:
To do… Use the command… Remarks
Enter system view system-view —

94
To do… Use the command… Remarks
Configure the remote probe VLAN
mirroring-group group-id remote-probe vlan rprobe-vlan-id
Required
By default, no remote probe VLAN is configured for a remote destination group.
NOTE:
• A VLAN can serve for only one mirroring group.
• When a VLAN is configured as a remote probe VLAN, use the remote probe VLAN for port mirroringexclusively. Do not configure a VLAN interface for the VLAN or configure any other features for the VLAN.
• When a VLAN is configured as a remote probe VLAN, you must remove the remote probe VLAN configuration before deleting the VLAN.
• When you remove the configuration of a remote probe VLAN, an active mirroring group becomes inactive.
Assigning the monitor port to the remote probe VLAN
Follow these steps to assign the monitor port to the remote probe VLAN:
To do… Use the command… Remarks
Enter system view system-view —
Enter the interface view of the monitor port interface interface-type interface-number —
For an access port port access vlan vlan-id
For a trunk port port trunk permit vlan vlan-id Assign the port to the probe VLAN
For a hybrid port port hybrid vlan vlan-id { tagged | untagged }
Required
Use one of the commands
NOTE:
For more information about the port access vlan, port trunk permit vlan, and port hybrid vlan commands, see Layer 2—LAN Switching Command Reference.
Displaying and maintaining port mirroring To do… Use the command… Remarks
Display the configuration of mirroring groups
display mirroring-group { group-id | all | local | remote-destination | remote-source } [ | { begin | exclude | include } regular-expression ]
Available in any view

95
Port mirroring configuration examples
Local port mirroring configuration example Network requirements
On the network shown in Figure 34:
• Device A connects to the marketing department through GigabitEthernet 1/0/1 and to the technical department through GigabitEthernet 1/0/2. It connects to the server through GigabitEthernet 1/0/3.
• Configure local port mirroring in source port mode to enable the server to monitor the bidirectional traffic of the marketing department and the technical department.
Figure 34 Network diagram
Configuration procedure
1. Create a local mirroring group.
# Create local mirroring group 1. <DeviceA> system-view
[DeviceA] mirroring-group 1 local
# Configure GigabitEthernet 1/0/1 and GigabitEthernet 1/0/2 as source ports and port GigabitEthernet 1/0/3 as the monitor port. [DeviceA] mirroring-group 1 mirroring-port GigabitEthernet 1/0/1 GigabitEthernet 1/0/2 both
[DeviceA] mirroring-group 1 monitor-port GigabitEthernet 1/0/3
# Disable the spanning tree feature on the monitor port GigabitEthernet 1/0/3. [DeviceA] interface GigabitEthernet 1/0/3
[DeviceA-GigabitEthernet1/0/3] undo stp enable
[DeviceA-GigabitEthernet1/0/3] quit
2. Verify the configurations.
# Display the configuration of all mirroring groups. [DeviceA] display mirroring-group all

96
mirroring-group 1:
type: local
status: active
mirroring port:
GigabitEthernet1/0/1 both
GigabitEthernet1/0/2 both
monitor port: GigabitEthernet1/0/3
After the configurations are completed, you can monitor all the packets received and sent by the marketing department and the technical department on the server.
Local port mirroring with multiple monitor ports configuration example Network requirements
As shown in Figure 35, Dept. A, Dept. B, and Dept. C are connected to Switch A through ports GigabitEthernet 1/0/1, GigabitEthernet 1/0/2, and GigabitEthernet 1/0/3, respectively. Configure port mirroring to enable all three data monitoring devices, Server A, Server B, and Server C, to monitor both the incoming and outgoing traffic of the three departments.
Figure 35 Network diagram
Dept. A
Dept. B
Dept. C
SwitchAGE1/0/1
GE1/0/2
GE1/0/3
GE1/0/11
GE1/0/12
GE1/0/13
ServerA
ServerB
ServerC
Configuration procedure
# Create remote source mirroring group 1. <SwitchA> system-view
[SwitchA] mirroring-group 1 remote-source
# Configure GigabitEthernet 1/0/1 through GigabitEthernet 1/0/3 as source ports of remote source mirroring group 1. [SwitchA] mirroring-group 1 mirroring-port gigabitethernet 1/0/1 to gigabitethernet 1/0/3 both
# Configure an unused port (GigabitEthernet 1/0/5 for example) of Switch A as the reflector port of remote source mirroring group 1. [SwitchA] mirroring-group 1 reflector-port GigabitEthernet 1/0/5

97
# Create VLAN 10 and assign the three ports (GigabitEthernet 3/0/1 through GigabitEthernet 3/0/3) connecting the three data monitoring devices to VLAN 10. [SwitchA] vlan 10
[SwitchA-vlan10] port gigabitethernet 3/0/1 to gigabitethernet 3/0/3
[SwitchA-vlan10] quit
# Configure VLAN 10 as the remote probe VLAN of remote source mirroring group 1. [SwitchA] mirroring-group 1 remote-probe vlan 10
Layer 2 remote port mirroring configuration example Network requirements
On the Layer 2 network shown in Figure 36,
• Device A connects to the marketing department through GigabitEthernet 1/0/1 and connects to the trunk port GigabitEthernet 1/0/1 of Device B through the trunk port GigabitEthernet 1/0/2; Device C connects to the server through GigabitEthernet 1/0/2 and connects to the trunk port GigabitEthernet 1/0/2 of Device B through the trunk port GigabitEthernet 1/0/1. Device A supports egress port configuration.
• Configure Layer 2 remote port mirroring to enable the server to monitor the bidirectional traffic of the marketing department.
Figure 36 Network diagram
Configuration procedure
1. Configure Device A (the source device)
# Create a remote source group. <DeviceA> system-view
[DeviceA] mirroring-group 1 remote-source
# Create VLAN 2 as the remote probe VLAN. [DeviceA] vlan 2
# Disable MAC address learning for the remote probe VLAN. [DeviceA-vlan2] mac-address mac-learning disable
[DeviceA-vlan2] quit
# Configure VLAN 2 as the remote probe VLAN of the mirroring group; configure GigabitEthernet 1/0/1 as a source port and GigabitEthernet 1/0/2 as the egress port in the mirroring group.

98
[DeviceA] mirroring-group 1 remote-probe vlan 2
[DeviceA] mirroring-group 1 mirroring-port GigabitEthernet 1/0/1 both
[DeviceA] mirroring-group 1 monitor-egress GigabitEthernet 1/0/2
# Configure output port GigabitEthernet 1/0/2 as a trunk port to permit the packets of VLAN 2 to pass through, and disable the spanning tree feature on the port. [DeviceA] interface GigabitEthernet 1/0/2
[DeviceA-GigabitEthernet1/0/2] port link-type trunk
[DeviceA-GigabitEthernet1/0/2] port trunk permit vlan 2
[DeviceA-GigabitEthernet1/0/2] undo stp enable
[DeviceA-GigabitEthernet1/0/2] quit
2. Configure Device B (the intermediate device)
# Create VLAN 2 as the remote probe VLAN. <DeviceB> system-view
[DeviceB] vlan 2
# Disable MAC address learning for the remote probe VLAN. [DeviceB-vlan2] mac-address mac-learning disable
[DeviceB-vlan2] quit
# Configure GigabitEthernet 1/0/1 as a trunk port that permits the packets of VLAN 2 to pass through. [DeviceB] interface GigabitEthernet 1/0/1
[DeviceB-GigabitEthernet1/0/1] port link-type trunk
[DeviceB-GigabitEthernet1/0/1] port trunk permit vlan 2
[DeviceB-GigabitEthernet1/0/1] quit
# Configure GigabitEthernet 1/0/2 as a trunk port that permits the packets of VLAN 2 to pass through. [DeviceB-GigabitEthernet1/0/1] quit
[DeviceB] interface GigabitEthernet 1/0/2
[DeviceB-GigabitEthernet1/0/2] port link-type trunk
[DeviceB-GigabitEthernet1/0/2] port trunk permit vlan 2
[DeviceB-GigabitEthernet1/0/2] quit
3. Configure Device C (the destination device)
# Configure GigabitEthernet 1/0/1 as a trunk port that permits the packets of VLAN 2 to pass through. <DeviceC> system-view
[DeviceC] interface GigabitEthernet 1/0/1
[DeviceC-GigabitEthernet1/0/1] port link-type trunk
[DeviceC-GigabitEthernet1/0/1] port trunk permit vlan 2
[DeviceC-GigabitEthernet1/0/1] quit
# Create a remote destination group. [DeviceC] mirroring-group 1 remote-destination
# Create VLAN 2 as the remote probe VLAN. [DeviceC] vlan 2
# Disable MAC address learning for the remote probe VLAN. [DeviceA-vlan2] mac-address mac-learning disable
[DeviceA-vlan2] quit

99
# Configure VLAN 2 as the remote probe VLAN of the mirroring group and GigabitEthernet 1/0/2 as the monitor port of the mirroring group, disable the spanning tree feature on GigabitEthernet 1/0/2, and assign the port to VLAN 2. [DeviceC] mirroring-group 1 remote-probe vlan 2
[DeviceC] interface GigabitEthernet 1/0/2
[DeviceC-GigabitEthernet1/0/2] mirroring-group 1 monitor-port
[DeviceC-GigabitEthernet1/0/2] undo stp enable
[DeviceC-GigabitEthernet1/0/2] port access vlan 2
[DeviceC-GigabitEthernet1/0/2] quit
4. Verify the configurations
After the configurations are completed, you can monitor all the packets received and sent by the marketing department on the server.

100
Traffic mirroring configuration
Introduction to traffic mirroring Traffic mirroring copies the specified packets to the specified destination for packet analyzing and monitoring. It is implemented through QoS policies. In other words, you define traffic classes and configure match criteria to classify packets to be mirrored and then configure traffic behaviors to mirror packets that fit the match criteria to the specified destination. Traffic mirroring allows you to flexibly classify packets by defining match criteria and obtain accurate statistics.
You can configure the traffic to be mirrored to an interface, or to a CPU.
• Mirroring traffic to an interface copies the matching packets to a destination interface.
• Mirroring traffic to a CPU copies the matching packets to a CPU.
NOTE:
For more information about QoS policies, traffic classes, and traffic behaviors, see ACL and QoS Configuration Guide.
Traffic mirroring configuration task list Complete these tasks to configure traffic mirroring:
Task Remarks
Configuring match criteria Required
Mirroring traffic to a port Configuring traffic mirroring of different types Mirroring traffic to the CPU
Required
Perform at least one configuration.
Configuring a QoS policy Required
Apply a QoS policy to a port
Apply a QoS policy to a VLAN
Apply a QoS policy globally Applying a QoS policy
Apply a QoS policy to the control plane
Required
Perform one of these configurations
Configuring traffic mirroring
Configuring match criteria Follow these steps to configure match criteria:
To do… Use the command… Remarks
Enter system view system-view —

101
To do… Use the command… Remarks
Create a class and enter class view traffic classifier tcl-name [ operator { and | or } ]
Required
By default, no traffic class exists.
Configure match criteria if-match match-criteria Required
By default, no match criterion is configured in a traffic class.
NOTE:
For more information about the traffic classifier and if-match commands, see ACL and QoS Command Reference.
Configuring traffic mirroring of different types
NOTE:
In a traffic behavior, you can configure only one type of traffic mirroring.
Mirroring traffic to a port
Follow these steps to mirror traffic to an interface:
To do… Use the command… Remarks
Enter system view system-view —
Create a behavior and enter behavior view
traffic behavior behavior-name
Required
By default, no traffic behavior exists.
Specify the destination interface for traffic mirroring
mirror-to interface interface-type interface-number
Required
By default, traffic mirroring is not configured in a traffic behavior.
NOTE:
• For more information about the traffic behavior command, see ACL and QoS Command Reference.
• You can specify up to four destination interfaces by performing the mirror-to interface command repeatedly.
Mirroring traffic to the CPU
Follow these steps to mirror traffic to the CPU:
To do… Use the command… Remarks
Enter system view system-view —
Create a behavior and enter behavior view
traffic behavior behavior-name
Required
By default, no traffic behavior exists.
Mirror traffic to the CPU mirror-to cpu Required
By default, no traffic mirroring is configured in a traffic behavior.
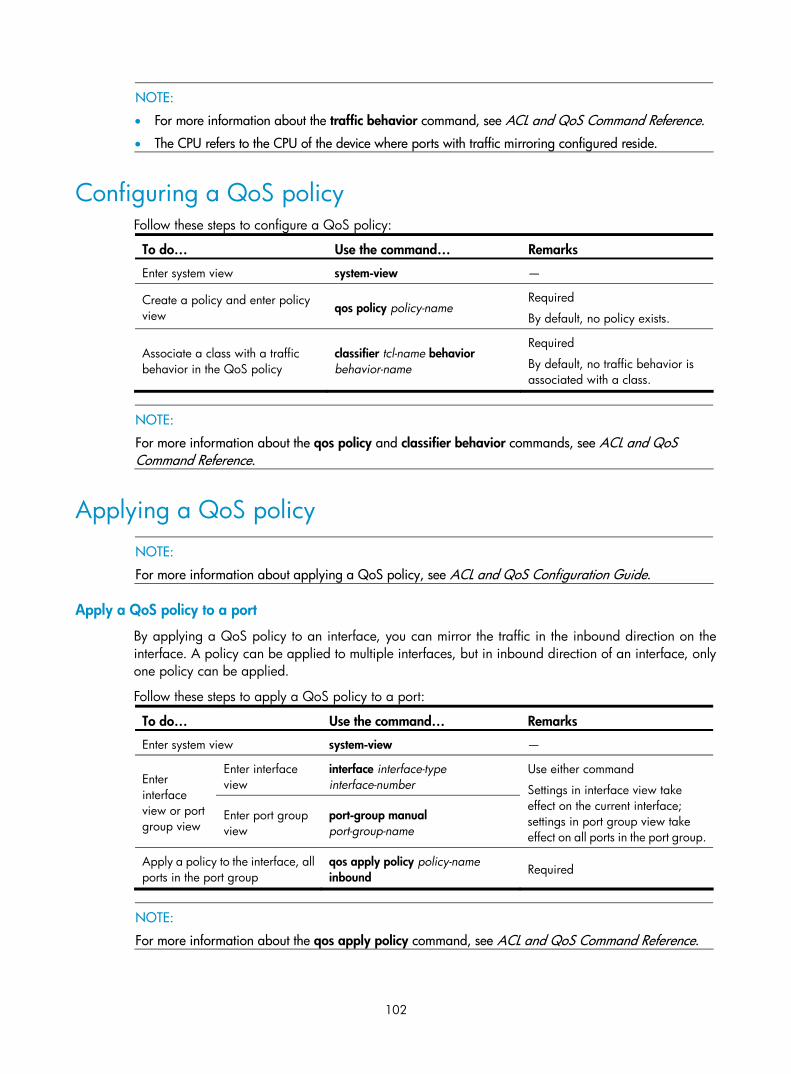
102
NOTE:
• For more information about the traffic behavior command, see ACL and QoS Command Reference.
• The CPU refers to the CPU of the device where ports with traffic mirroring configured reside.
Configuring a QoS policy Follow these steps to configure a QoS policy:
To do… Use the command… Remarks
Enter system view system-view —
Create a policy and enter policy view qos policy policy-name
Required
By default, no policy exists.
Associate a class with a traffic behavior in the QoS policy
classifier tcl-name behavior behavior-name
Required
By default, no traffic behavior is associated with a class.
NOTE:
For more information about the qos policy and classifier behavior commands, see ACL and QoS Command Reference.
Applying a QoS policy
NOTE:
For more information about applying a QoS policy, see ACL and QoS Configuration Guide.
Apply a QoS policy to a port
By applying a QoS policy to an interface, you can mirror the traffic in the inbound direction on the interface. A policy can be applied to multiple interfaces, but in inbound direction of an interface, only one policy can be applied.
Follow these steps to apply a QoS policy to a port:
To do… Use the command… Remarks
Enter system view system-view —
Enter interface view
interface interface-type interface-number Enter
interface view or port group view
Enter port group view
port-group manual port-group-name
Use either command
Settings in interface view take effect on the current interface; settings in port group view take effect on all ports in the port group.
Apply a policy to the interface, all ports in the port group
qos apply policy policy-name inbound Required
NOTE:
For more information about the qos apply policy command, see ACL and QoS Command Reference.

103
Apply a QoS policy to a VLAN
You can apply a QoS policy to a VLAN to mirror the traffic in the inbound direction on all ports in the VLAN.
Follow these steps to apply the QoS policy to a VLAN:
To do… Use the command… Remarks
Enter system view system-view —
Apply a QoS policy to a VLAN qos vlan-policy policy-name vlan vlan-id-list inbound Required
NOTE:
For more information about the qos vlan-policy command, see ACL and QoS Command Reference.
Apply a QoS policy globally
You can apply a QoS policy globally to mirror the traffic in the inbound direction on all ports.
Follow these steps to apply a QoS policy globally:
To do… Use the command… Remarks
Enter system view system-view —
Apply a QoS policy globally qos apply policy policy-name global inbound Required
NOTE:
For more information about the qos apply policy command, see ACL and QoS Command Reference.
Apply a QoS policy to the control plane
You can apply a QoS policy to the control plane to mirror the traffic in the inbound direction of the control plane.
Follow these steps to apply a QoS policy to the control plane:
To do… Use the command… Remarks
Enter system view system-view —
Enter control plane view control-plane slot slot-number —
Apply a QoS policy to the control plane qos apply policy policy-name inbound Required
NOTE:
For more information about the control-plane and qos apply policy commands, see ACL and QoS Command Reference.

104
Displaying and maintaining traffic mirroring To do… Use the command… Remarks
Display user-defined traffic behavior configuration information
display traffic behavior user-defined [ behavior-name ] [ | { begin | exclude | include } regular-expression ]
Available in any view
Display user-defined QoS policy configuration information
display qos policy user-defined [ policy-name [ classifier tcl-name ] ] [ | { begin | exclude | include } regular-expression ]
Available in any view
NOTE:
For more information about the display traffic behavior and display qos policy commands, see ACL andQoS Command Reference.
Traffic mirroring configuration example
Traffic mirroring configuration example Network requirements
As shown in Figure 37:
• Different departments of a company use IP addresses on different subnets. The marketing and technology departments use the IP addresses on subnets 192.168.1.0/24 and 192.168.2.0/24 respectively. The working hour of the company is from 8:00 to 18:00 on weekdays.
• Configure traffic mirroring so that the server can monitor the traffic that the technology department sends to access the Internet, and IP traffic that the technology department sends to the marketing department.
Figure 37 Network diagram

105
Configuration procedure
# Create ACL 3000 to allow packets from the technology department (on subnet 192.168.2.0/24) to access the Internet. <DeviceA> system-view
[DeviceA] acl number 3000
[DeviceA-acl-adv-3000] rule permit tcp source 192.168.2.0 0.0.0.255 destination-port eq www
[DeviceA-acl-adv-3000] quit
# Create traffic class tech_c, and configure the match criterion as ACL 3000. [DeviceA] traffic classifier tech_c
[DeviceA-classifier-tech_c] if-match acl 3000
[DeviceA-classifier-tech_c] quit
# Create traffic behavior tech_b, and configure the action of mirroring traffic to port GigabitEthernet 1/0/3. [DeviceA] traffic behavior tech_b
[DeviceA-behavior-tech_b] mirror-to interface GigabitEthernet 1/0/3
[DeviceA-behavior-tech_b] quit
# Configure a time range named work to cover the time from 8: 00 to 18: 00 in working days. [DeviceA] time-range work 8:0 to 18:0 working-day
# Create ACL 3001 to allow packets sent from the technology department (on subnet 192.168.2.0/24) to the marketing department (on subnet 192.168.1.0/24). [DeviceA] acl number 3001
[DeviceA-acl-adv-3001] rule permit ip source 192.168.2.0 0.0.0.255 destination 192.168.1.0 0.0.0.255 time-range work
[DeviceA-acl-adv-3001] quit
# Create traffic class mkt_c, and configure the match criterion as ACL 3001. [DeviceA] traffic classifier mkt_c
[DeviceA-classifier-mkt_c] if-match acl 3001
[DeviceA-classifier-mkt_c] quit
# Create traffic behavior mkt_b, and configure the action of mirroring traffic to port GigabitEthernet 1/0/3. [DeviceA] traffic behavior mkt_b
[DeviceA-behavior-mkt_b] mirror-to interface GigabitEthernet 1/0/3
[DeviceA-behavior-mkt_b] quit
# Create QoS policy tech_p, and associate traffic class tech_c with traffic behavior tech_b in the QoS policy. [DeviceA] qos policy tech_p
[DeviceA-qospolicy-tech_p] classifier tech_c behavior tech_b
# Associate traffic class mkt_c with traffic behavior mkt_b in the QoS policy. [DeviceA-qospolicy-tech_p] classifier mkt_c behavior mkt_b
[DeviceA-qospolicy-tech_p] quit
# Apply QoS policy tech_p to the incoming packets of GigabitEthernet 1/0/4. [DeviceA] interface GigabitEthernet 1/0/4
[DeviceA-GigabitEthernet1/0/4] qos apply policy tech_p inbound
[DeviceA-GigabitEthernet1/0/4] quit

106
After completing the configurations, through the server, you can monitor all traffic sent by the technology department to access the Internet and the IP traffic that the technology department sends to the marketing department during working hours.

107
NQA configuration
NQA overview Network Quality Analyzer (NQA) can perform various types of tests and collect network performance and service quality parameters such as delay jitter, time for establishing a TCP connection, time for establishing an FTP connection, and file transfer rate.
With the NQA test results, you can diagnose and locate network faults, be aware of network performance in time and take proper actions to correct any problems.
NQA features Supporting multiple test types
Ping uses only the Internet Control Message Protocol (ICMP) to test the reachability of the destination host and the round-trip time. As an enhancement to ping, NQA supports more test types and functions.
NQA supports 11 test types: ICMP echo, DHCP, DNS, FTP, HTTP, UDP jitter, SNMP, TCP, UDP echo, voice, and DLSw.
NQA enables the client to send probe packets of different test types to detect the protocol availability and response time of the peer. Test results help you understand network performance.
Supporting the collaboration function
Collaboration is implemented by establishing reaction entries to monitor the detection results of NQA probes. If the number of consecutive probe failures reaches a limit, NQA informs the track module of the detection result, and the track module triggers other application modules to take predefined.
Figure 38 Implement collaboration
The collaboration comprises the following parts: the application modules, the track module, and the detection modules.
• A detection module monitors objects, such as the link status, and network performance, and informs the track module of detection results.
• Upon the detection results, the track module changes the status of the track entry and informs the associated application module. The track module works between the application modules and the detection modules. It hides the differences among detection modules from application modules.

108
• The application module takes actions when the tracked object changes its state.
The following describes how a static route is monitored through collaboration.
1. NQA monitors the reachability to 192.168.0.88.
2. When 192.168.0.88 becomes unreachable, NQA notifies the track module of the change.
3. The track module notifies the state change to the static routing module
4. The static routing module sets the static route as invalid.
NOTE:
For more information about collaboration and the track module, see High Availability Configuration Guide.
Supporting threshold monitoring
NQA supports threshold monitoring for performance parameters such as average delay jitter and packet round-trip time. The performance parameters to be monitored are monitored elements. NQA monitors threshold violations for a monitored element, and reacts to certain measurement conditions (for example, sending trap messages to the network management server). This helps network administrators understand the network service quality and network performance.
1. Monitored elements
Table 9 describes the monitored elements and the NQA test types in which the elements can be monitored.
Table 9 Monitored elements and NQA test types
Monitored elements Test type supported
Probe duration Tests excluding UDP jitter test and voice test
Count of probe failures Tests excluding UDP jitter test and voice test
Packet round-trip time UDP jitter test and voice test
Count of discarded packets UDP jitter test and voice test
One-way delay jitter (source-to-destination and destination-to-source) UDP jitter test and voice test
One-way delay (source-to-destination and destination-to-source) UDP jitter test and voice test
Calculated Planning Impairment Factor (ICPIF) (see “Configuring voice tests”) Voice test
Mean Opinion Scores (MOS) (see “Configuring voice tests”) Voice test
2. Threshold types
The following threshold types are supported:
• average—Monitors the average value of monitored data in a test. If the average value in a test exceeds the upper threshold or goes below the lower threshold, a threshold violation occurs. For example, you can monitor the average probe duration in a test.
• accumulate—Monitors total number of times the monitored data violates the threshold in a test. If the total number of times reaches or exceeds a specific value, a threshold violation occurs.
• consecutive—Monitors the number of consecutive times the monitored data violates the threshold since the test group starts. If the monitored data violates the threshold consecutively for a specific number of times, a threshold violation occurs.

109
NOTE:
The counting for the average or accumulate threshold type is performed per test, but the counting for theconsecutive type is performed since the test group is started.
3. Triggered actions
The following actions may be triggered:
• none—NQA only records events for terminal display; it does not send trap information to the network management server.
• trap-only—NQA records events and sends trap messages to the network management server.
NOTE:
NQA DNS tests do not support the action of sending trap messages. The action to be triggered in DNS tests can only be the default one, none.
4. Reaction entry
In a reaction entry, a monitored element, a threshold type, and the action to be triggered are configured to implement threshold monitoring.
The state of a reaction entry can be invalid, over-threshold, or below-threshold, using the following workflow:
• Before an NQA test group starts, the reaction entry is in the state of invalid.
• After each test or probe, threshold violations are counted according to the threshold type and range configured in the entry. If the threshold is violated consecutively or accumulatively for a specific number of times, the state of the entry is set to over-threshold; otherwise, the state of the entry is set to below-threshold.
If the action to be triggered is configured as trap-only for a reaction entry, when the state of the entry changes, a trap message is generated and sent to the network management server.
NQA concepts Test group
An NQA test group specifies test parameters including the test type, destination address, and destination port. Each test group is uniquely identified by an administrator name and operation tag. You can configure and schedule multiple NQA test groups to test different objects.
Test and probe
After the NQA test group starts, tests are performed at a specific interval. During each test, a specific number of probe operations are performed. Both the test interval and the number of probe operations per test are configurable. But only one probe operation is performed during one voice test.
In different test types, probe operation has the following different meanings:
• During a TCP or DLSw test, one probe operation means setting up one connection.
• During a UDP jitter or a voice test, one probe operation means continuously sending a specific number of probe packets. The number of probe packets is configurable.
• During an FTP, HTTP, DHCP, or DNS test, one probe operation means uploading or downloading a file, obtaining a web page, obtaining an IP address through DHCP, or translating a domain name to an IP address.

110
• During an ICMP echo or UDP echo test, one probe operation means sending an ICMP echo request or a UDP packet.
• During an SNMP test, one probe operation means sending one SNMPv1 packet, one SNMPv2C packet, and one SNMPv3 packet.
NQA client and server
A device with NQA test groups configured is an NQA client, and the NQA client initiates NQA tests. An NQA server makes responses to probe packets destined to the specified destination address and port number.
Figure 39 Relationship between the NQA client and NQA server
Not all test types require the NQA server. Only the TCP, UDP echo, UDP jitter, or voice test requires both the NQA client and server, as shown in Figure 39.
You can create multiple TCP or UDP listening services on the NQA server. Each listens to a specific destination address and port number. Make sure the destination IP address and port number for a listening service on the server are the same as those configured for the test group on the NQA client. Each listening service must be unique on the NQA server.
NQA probe operation procedure An NQA probe operation involves the following steps:
1. The NQA client constructs probe packets for the specified type of NQA test, and sends them to the peer device.
2. Upon receiving the probe packets, the peer sends back responses with timestamps.
3. The NQA client computes the network performance and service quality parameters, such as the packet loss rate and round-trip time based on the received responses.
NQA configuration task list Complete the following task to enable the NQA server:
Task Remarks
Configuring the NQA server Required for TCP, UDP echo, UDP jitter, and voice tests
To perform NQA tests successfully, perform the following configurations on the NQA client:
1. Enable the NQA client.
2. Create a test group and configure test parameters. The test parameters may vary with test types.
3. Configure a schedule for the NQA test group.
Complete these tasks to configure NQA client:
Task Remarks
Enabling the NQA client Required
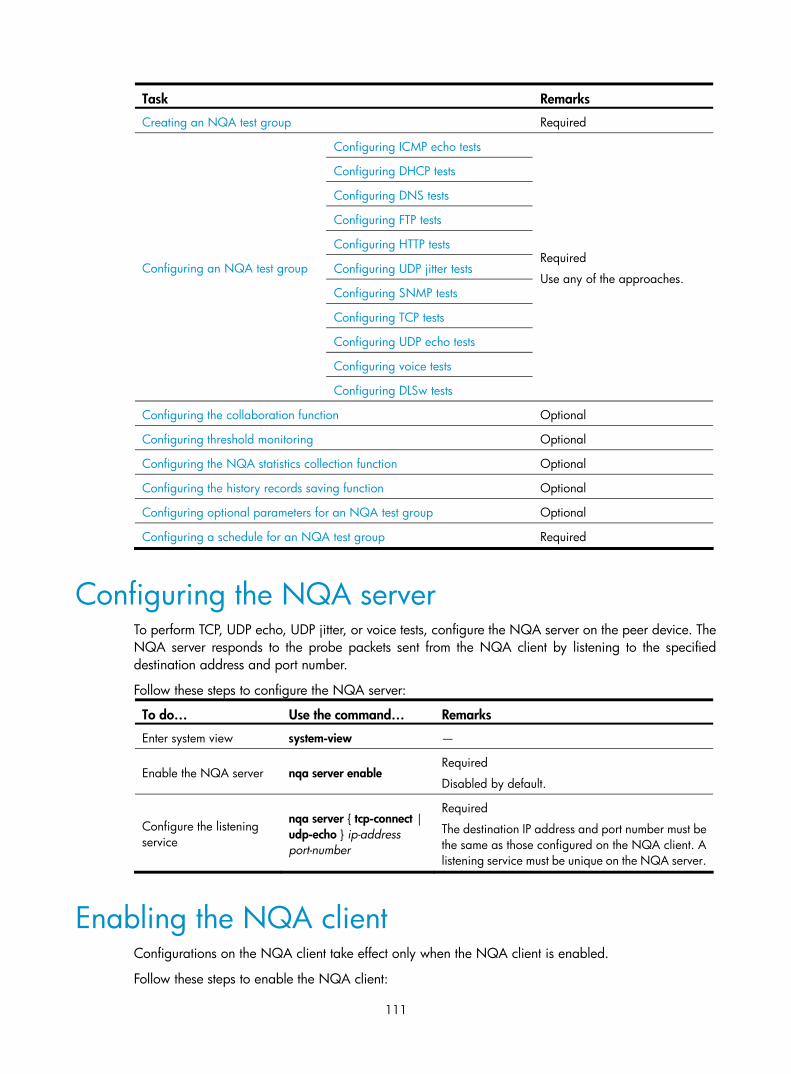
111
Task Remarks
Creating an NQA test group Required
Configuring ICMP echo tests
Configuring DHCP tests
Configuring DNS tests
Configuring FTP tests
Configuring HTTP tests
Configuring UDP jitter tests
Configuring SNMP tests
Configuring TCP tests
Configuring UDP echo tests
Configuring voice tests
Configuring an NQA test group
Configuring DLSw tests
Required
Use any of the approaches.
Configuring the collaboration function Optional
Configuring threshold monitoring Optional
Configuring the NQA statistics collection function Optional
Configuring the history records saving function Optional
Configuring optional parameters for an NQA test group Optional
Configuring a schedule for an NQA test group Required
Configuring the NQA server To perform TCP, UDP echo, UDP jitter, or voice tests, configure the NQA server on the peer device. The NQA server responds to the probe packets sent from the NQA client by listening to the specified destination address and port number.
Follow these steps to configure the NQA server:
To do… Use the command… Remarks
Enter system view system-view —
Enable the NQA server nqa server enable Required
Disabled by default.
Configure the listening service
nqa server { tcp-connect | udp-echo } ip-address port-number
Required
The destination IP address and port number must be the same as those configured on the NQA client. A listening service must be unique on the NQA server.
Enabling the NQA client Configurations on the NQA client take effect only when the NQA client is enabled.
Follow these steps to enable the NQA client:

112
To do… Use the command… Remarks
Enter system view system-view —
Enable the NQA client nqa agent enable Optional
Enabled by default.
Creating an NQA test group Create an NQA test group before you configure NQA tests.
Follow theses steps to create an NQA test group:
To do… Use the command… Remarks
Enter system view system-view —
Create an NQA test group, and enter the NQA test group view
nqa entry admin-name operation-tag
Required
In the NQA test group view, you can specify the test type
You can use the nqa entry command to enter the test type view of an NQA test group with test type configured.
Configuring an NQA test group
Configuring ICMP echo tests ICMP echo tests of an NQA test group uses ICMP echo response information to test reachability of a destination host. An ICMP echo test has the same function as the ping command but provides more output information. In addition, you can specify the next hop for ICMP echo tests. ICMP echo tests are used to locate connectivity problems in a network.
Follow these steps to configure ICMP echo tests:
To do… Use the command… Remarks
Enter system view system-view —
Enter NQA test group view nqa entry admin-name operation-tag —
Configure the test type as ICMP echo, and enter test type view type icmp-echo Required
Configure the destination address of ICMP echo requests destination ip ip-address
Required
By default, no destination IP address is configured.
Configure the size of the data field in each ICMP echo request data-size size
Optional
100 bytes by default.
Configure the string to be filled in the data field of each ICMP echo request
data-fill string Optional
By default, the string is the hexadecimal number 00010203040506070809.

113
To do… Use the command… Remarks
Configure the source interface for ICMP echo requests
source interface interface-type interface-number
Optional
By default, no source interface is configured for probe packets.
The requests take the IP address of the source interface as their source IP address when no source IP address is specified.
The specified source interface must be up; otherwise, no ICMP echo requests can be sent out.
Configure the source IP address of ICMP echo requests source ip ip-address
Optional
By default, no source IP address is configured.
If you configure both the source ip command and the source interface command, the source ip command takes effect.
The source IP address must be the IP address of a local interface. The local interface must be up; otherwise, no ICMP echo requests can be sent out.
Configure the next hop IP address of ICMP echo requests next-hop ip-address
Optional
By default, no next hop IP address is configured.
Configure optional parameters See “Configuring optional parameters for an NQA test group”
Optional
NOTE:
NQA ICMP echo tests are not supported in IPv6 networks. To test the reachability of an IPv6 address, usethe ping ipv6 command. For more information about the command, see Network Management and Monitoring Command Reference.
Configuring DHCP tests DHCP tests of an NQA test group are used to test if a DHCP server is on the network, and the time for the DHCP server to respond to a client request and assign an IP address to the client.
Configuration prerequisites
Before you start DHCP tests, configure the DHCP server. If the NQA (DHCP client) and the DHCP server are not in the same network segment, configure a DHCP relay. For the configuration of DHCP server and DHCP relay, see Layer 3—IP Services Configuration Guide.
Configuring DHCP tests
Follow these steps to configure DHCP tests:
To do… Use the command… Remarks
Enter system view system-view —

114
To do… Use the command… Remarks
Enter NQA test group view nqa entry admin-name operation-tag —
Configure the test type as DHCP, and enter test type view type dhcp Required
Specify an interface to perform DHCP tests
operation interface interface-type interface-number
Required
By default, no interface is configured to perform DHCP tests.
The specified interface must be up; otherwise, no probe packets can be sent out.
Configure optional parameters See “Configuring optional parameters for an NQA test group”
Optional
NOTE:
• The interface that performs DHCP tests does not change its IP address. A DHCP test only simulates address allocation in DHCP.
• When a DHCP test completes, the NQA client sends a DHCP-RELEASE packet to release the obtained IPaddress.
Configuring DNS tests DNS tests of an NQA test group are used to test whether the NQA client can translate a domain name into an IP address through a DNS server and test the time required for resolution.
Configuration prerequisites
Before you start DNS tests, configure the mapping between a domain name and an IP address on a DNS server.
Configuring DNS tests
Follow these steps to configure DNS tests:
To do… Use the command… Remarks
Enter system view system-view —
Enter NQA test group view nqa entry admin-name operation-tag —
Configure the test type as DNS, and enter test type view type dns Required
Specify the IP address of the DNS server as the destination address of DNS packets
destination ip ip-address Required
By default, no destination IP address is configured.
Configure the domain name that needs to be translated resolve-target domain-name
Required
By default, no domain name is configured.
Configure optional parameters See “Configuring optional parameters for an NQA test group” Optional

115
NOTE:
A DNS test simulates the domain name resolution. It does not save the mapping between the domain nameand the IP address.
Configuring FTP tests FTP tests of an NQA test group are used to test the connection between the NQA client and an FTP server and the time required for the FTP client to transfer a file to or download a file from the FTP server.
Configuration prerequisites
Before you start FTP tests, configure the FTP server. For example, configure a username and password that are used to log in to the FTP server. For more information about FTP server configuration, see Fundamentals Configuration Guide.
Configuring FTP tests
Follow these steps to configure FTP tests:
To do… Use the command… Remarks
Enter system view system-view —
Enter NQA test group view nqa entry admin-name operation-tag —
Configure the test type as FTP, and enter test type view type ftp Required
Specify the IP address of the FTP server as the destination address of FTP request packets
destination ip ip-address Required
By default, no destination IP address is configured.
Configure the source IP address of FTP request packets source ip ip-address
Required
By default, no source IP address is specified.
The source IP address must be the IP address of a local interface. The local interface must be up; otherwise, no FTP requests can be sent out.
Configure the operation type operation { get | put }
Optional
By default, the operation type for the FTP is get, which means obtaining files from the FTP server.
Configure a login username username name Required
By default, no login username is configured.
Configure a login password password password Required
By default, no login password is configured.
Specify a file to be transferred between the FTP server and the FTP client
filename file-name Required
By default, no file is specified.
Set the data transmission mode for FTP tests mode { active | passive }
Optional
active by default.

116
To do… Use the command… Remarks
Configure optional parameters See “Configuring optional parameters for an NQA test group”
Optional
NOTE:
• When you execute the put command, the NQA client creates a file named file-name of fixed size on theFTP server. The file-name argument does not represent any file on the NQA client. When you execute theget command, the client does not save the files obtained from the FTP server.
• When you get a file that does not exist on the FTP server, FTP tests fail.
• When you perform an FTP test, use a small file and set a long NQA probe timeout time. A big file or short probe timeout time may result in probe timeout.
Configuring HTTP tests HTTP tests of an NQA test group are used to test the connection between the NQA client and an HTTP server, and the time required to obtain data from the HTTP server. HTTP tests enable you to detect the connectivity and performance of the HTTP server.
Configuration prerequisites
Before you start HTTP tests, configure the HTTP server.
Configuring HTTP tests
Follow these steps to configure HTTP tests:
To do… Use the command… Remarks
Enter system view system-view —
Enter NQA test group view nqa entry admin-name operation-tag —
Configure the test type as HTTP, and enter test type view type http Required
Configure the IP address of the HTTP server as the destination address of HTTP request packets
destination ip ip-address Required
By default, no destination IP address is configured.
Configure the source IP address of request packets source ip ip-address
Optional
By default, no source IP address is specified.
The source IP address must be the IP address of a local interface. The local interface must be up; otherwise, no probe packets can be sent out.
Configure the operation type operation { get | post }
Optional
By default, the operation type for the HTTP is get, which means obtaining data from the HTTP server.
Configure the website that an HTTP test visits url url Required

117
To do… Use the command… Remarks
Configure the HTTP version used in HTTP tests http-version v1.0
Optional
By default, HTTP 1.0 is used.
Configure optional parameters See “Configuring optional parameters for an NQA test group”
Optional
NOTE:
The TCP port must be port 80 on the HTTP server for NQA HTTP tests.
Configuring UDP jitter tests
NOTE:
Do not perform NQA UDP jitter tests on known ports, ports from 1 to 1023. Otherwise, UDP jitter tests might fail or the corresponding services of this port might be unavailable.
Real-time services such as voice and video have high requirements on delay jitters. UDP jitter tests of an NQA test group obtain uni/bi-directional delay jitters. The test results help you verify whether a network can carry real-time services.
A UDP jitter test performs the following procedure:
1. The source sends packets to the destination port at regular intervals.
2. The destination affixes a time stamp to each packet that it receives, and then sends the packet back to the source.
3. Upon receiving the response, the source calculates the delay jitter, which reflects network performance. Delay refers to the amount of time it takes a packet to be transmitted from source to destination or from destination to source. Delay jitter is the delay variation over time.
Configuration prerequisites
UDP jitter tests require cooperation between the NQA server and the NQA client. Before you start UDP jitter tests, configure UDP listening services on the NQA server. For more information about UDP listening service configuration, see “Configuring the NQA server.”
Configuring UDP jitter tests
Follow these steps to configure UDP jitter tests:
To do… Use the command… Remarks
Enter system view system-view —
Enter NQA test group view nqa entry admin-name operation-tag —
Configure the test type as UDP jitter, and enter test type view type udp-jitter Required

118
To do… Use the command… Remarks
Configure the destination address of UDP packets destination ip ip-address
Required
By default, no destination IP address is configured.
The destination IP address must be the same as that of the listening service on the NQA server.
Configure the destination port of UDP packets
destination port port-number
Required
By default, no destination port number is configured.
The destination port must be the same as that of the listening service on the NQA server.
Specify the source port number of UDP packets source port port-number
Optional
By default, no source port number is specified.
Configure the size of the data field in each UDP packet data-size size
Optional
100 bytes by default.
Configure the string to be filled in the data field of each probe packet data-fill string
Optional
By default, the string is the hexadecimal number 00010203040506070809.
Configure the number of probe packets to be sent during each UDP jitter probe operation
probe packet-number
packet-number
Optional
10 by default.
Configure the interval for sending probe packets during each UDP jitter probe operation
probe packet-interval packet-interval
Optional
20 milliseconds by default.
Configure the interval the NQA client must wait for a response from the server before it regards the response is timed out
probe packet-timeout packet-timeout
Optional
3000 milliseconds by default.
Configure the source IP address for UDP jitter packets source ip ip-address
Optional
By default, no source IP address is specified.
The source IP address must be the IP address of a local interface. The local interface must be up; otherwise, no probe packets can be sent out.
Configure optional parameters See “Configuring optional parameters for an NQA test group”
Optional
NOTE:
The probe count command specifies the number of probe operations during one UDP jitter test. The probepacket-number command specifies the number of probe packets sent in each UDP jitter probe operation.

119
Configuring SNMP tests SNMP tests of an NQA test group are used to test the time the NQA client takes to send an SNMP packet to the SNMP agent and receive a response.
Configuration prerequisites
Before you start SNMP tests, enable the SNMP agent function on the device that serves as an SNMP agent. For more information abut SNMP agent configuration, see the chapter “SNMP configuration.”
Configuring SNMP tests
Follow these steps to configure SNMP tests:
To do… Use the command… Remarks
Enter system view system-view —
Enter NQA test group view nqa entry admin-name operation-tag —
Configure the test type as SNMP, and enter test type view
type snmp Required
Configure the destination address of SNMP packets destination ip ip-address
Required
By default, no destination IP address is configured.
Specify the source port of SNMP packets source port port-number
Optional
By default, no source port number is specified.
Configure the source IP address of SNMP packets source ip ip-address
Optional
By default, no source IP address is specified.
The source IP address must be the IP address of a local interface. The local interface must be up; otherwise, no probe packets can be sent out.
Configure optional parameters
See “Configuring optional parameters for an NQA test group”
Optional
Configuring TCP tests TCP tests of an NQA test group are used to test the TCP connection between the NQA client and a port on the NQA server and the time for setting up a connection. The test result helps you evaluate the availability and performance of the services provided by the port on the server.
Configuration prerequisites
TCP tests require cooperation between the NQA server and the NQA client. Before you start TCP tests, configure a TCP listening service on the NQA server. For more information about the TCP listening service configuration, see “Configuring the NQA server.”
Configuring TCP tests
Follow these steps to configure TCP tests:

120
To do… Use the command… Remarks
Enter system view system-view —
Enter NQA test group view
nqa entry admin-name operation-tag —
Configure the test type as TCP, and enter test type view
type tcp Required
Configure the destination address of TCP probe packets
destination ip ip-address
Required
By default, no destination IP address is configured.
The destination address must be the same as the IP address of the listening service configured on the NQA server.
Configure the destination port of TCP probe packets
destination port port-number
Required
By default, no destination port number is configured.
The destination port number must be the same as that of the listening service on the NQA server.
Configure the source IP address of TCP probe packets
source ip ip-address
Optional
By default, no source IP address is specified.
The source IP address must be the IP address of a local interface. The local interface must be up; otherwise, no probe packets can be sent out.
Configure optional parameters
See “Configuring optional parameters for an NQA test group”
Optional
Configuring UDP echo tests UDP echo tests of an NQA test group are used to test the connectivity and round-trip time of a UDP packet from the client to the specified UDP port on the NQA server.
Configuration prerequisites
UDP echo tests require cooperation between the NQA server and the NQA client. Before you start UDP echo tests, configure a UDP listening service on the NQA server. For more information about the UDP listening service configuration, see “Configuring the NQA server.”
Configuring UDP echo tests
Follow these steps to configure UDP echo tests:
To do… Use the command… Remarks
Enter system view system-view —
Enter NQA test group view nqa entry admin-name operation-tag —
Configure the test type as UDP echo, and enter test type view type udp-echo Required

121
To do… Use the command… Remarks
Configure the destination address of UDP packets destination ip ip-address
Required
By default, no destination IP address is configured.
The destination address must be the same as the IP address of the listening service configured on the NQA server.
Configure the destination port of UDP packets
destination port port-number
Required
By default, no destination port number is configured.
The destination port number must be the same as that of the listening service on the NQA server.
Configure the size of the data field in each UDP packet data-size size
Optional
100 bytes by default.
Configure the string to be filled in the data field of each UDP packet
data-fill string Optional
By default, the string is the hexadecimal number 00010203040506070809.
Specify the source port of UDP packets source port port-number
Optional
By default, no source port number is specified.
Configure the source IP address of UDP packets source ip ip-address
Optional
By default, no source IP address is specified.
The source IP address must be that of an interface on the device and the interface must be up; otherwise, no probe packets can be sent out.
Configure optional parameters See “Configuring optional parameters for an NQA test group”
Optional
Configuring voice tests
NOTE:
Do not perform voice tests on known ports, ports from 1 to 1023. Otherwise, the NQA test might fail or thecorresponding services of these ports might be unavailable.
Voice tests of an NQA test group are used to test voice over IP (VoIP) network status, and collect VoIP network parameters so that users can adjust the network.
A voice test performs the following procedure:
1. The source (NQA client) sends voice packets of G.711 A-law, G.711 μ-law or G.729 A-law codec type at regular intervals to the destination (NQA server).
2. The destination affixes a time stamp to each voice packet that it receives and then sends it back to the source.
3. Upon receiving the packet, the source calculates results, such as the delay jitter and one-way delay based on the packet time stamps. The statistics reflect network performance.
Voice test result also includes the following parameters that reflect VoIP network performance:

122
• Calculated Planning Impairment Factor (ICPIF)—Measures impairment to voice quality in a VoIP network. It is decided by packet loss and delay. A higher value represents a lower service quality.
• Mean Opinion Scores (MOS)—A MOS value can be evaluated by using the ICPIF value, in the range of 1 to 5. A higher value represents a higher quality of a VoIP network.
The evaluation of voice quality depends on users’ tolerance for voice quality, which should be taken into consideration. For users with higher tolerance for voice quality, use the advantage-factor command to configure the advantage factor. When the system calculates the ICPIF value, this advantage factor is subtracted to modify ICPIF and MOS values, so objective and subjective factors are both considered when you evaluate voice quality.
Configuration prerequisites
Voice tests require cooperation between the NQA server and the NQA client. Before you start voice tests, configure a UDP listening service on the NQA server. For more information about UDP listening service configuration, see “Configuring the NQA server.”
Configuring voice tests
Follow these steps to configure voice tests:
To do… Use the command… Remarks
Enter system view system-view —
Enter NQA test group view
nqa entry admin-name operation-tag —
Configure the test type as voice, and enter test type view
type voice Required
Configure the destination address of voice probe packets
destination ip ip-address
Required
By default, no destination IP address is configured for a test operation.
The destination IP address must be the same as that of the listening service on the NQA server.
Configure the destination port of voice probe packets
destination port port-number
Required
By default, no destination port number is configured.
The destination port must be the same as that of the listening service on the NQA server.
Configure the codec type codec-type { g711a | g711u | g729a }
Optional
By default, the codec type is G.711 A-law.
Configure the advantage factor for calculating MOS and ICPIF values
advantage-factor factor Optional
By default, the advantage factor is 0.
Specify the source IP address of probe packets source ip ip-address
Optional
By default, no source IP address is specified.
The source IP address must be the IP address of a local interface. The local interface must be up; otherwise, no probe packets can be sent out.
Specify the source port number of probe packets source port port-number
Optional
By default, no source port number is specified.

123
To do… Use the command… Remarks
Configure the size of the data field in each probe packet
data-size size
Optional
By default, the probe packet size depends on the codec type. The default packet size is 172 bytes for G.711A-law and G.711 μ-law codec type, and 32 bytes for G.729 A-law codec type.
Configure the string to be filled in the data field of each probe packet
data-fill string Optional
By default, the string is the hexadecimal number 00010203040506070809.
Configure the number of probe packets to be sent during each voice probe operation
probe packet-number packet-number
Optional
1000 by default.
Configure the interval for sending probe packets during each voice probe operation
probe packet-interval packet-interval
Optional
20 milliseconds by default.
Configure the interval the NQA client must wait for a response from the server before it regards the response times out
probe packet-timeout packet-timeout
Optional
5000 milliseconds by default.
Configure optional parameters
See “Configuring optional parameters for an NQA test group”
Optional
NOTE:
Only one probe operation is performed in one voice test.
Configuring DLSw tests DLSw tests of an NQA test group are used to test the response time of a DLSw device.
Configuration prerequisites
Before you start DLSw tests, enable the DLSw function on the peer device.
Configuring a DLSw test
Follow these steps to configure DLSw tests:
To do… Use the command… Remarks
Enter system view system-view —
Enter NQA test group view nqa entry admin-name operation-tag —
Configure the test type as DLSw, and enter test type view
type dlsw Required

124
To do… Use the command… Remarks
Configure the destination address of probe packets destination ip ip-address
Required
By default, no destination IP address is configured.
Configure the source IP address of probe packets source ip ip-address
Optional
By default, no source IP address is specified.
The source IP address must be the IP address of a local interface. The local interface must be up; otherwise, no probe packets can be sent out.
Configure optional parameters
See “Configuring optional parameters for an NQA test group”
Optional
Configuring the collaboration function Collaboration is implemented by establishing reaction entries to monitor the detection results of a test group. If the number of consecutive probe failures reaches the threshold, the configured action is triggered.
Follow these steps to configure the collaboration function:
To do… Use the command… Remarks
Enter system view system-view —
Enter NQA test group view nqa entry admin-name operation-tag —
Enter test type view of the test group
type { dhcp | dlsw | dns | ftp | http | icmp-echo | snmp | tcp | udp-echo }
The collaboration function is not supported in UDP jitter and voice tests.
Configure a reaction entry
reaction item-number checked-element probe-fail threshold-type consecutive consecutive-occurrences action-type trigger-only
Required
Not created by default.
You cannot modify the content of an existing reaction entry.
Exit to system view quit —
Configure a track entry and associate it with the reaction entry of the NQA test group
track entry-number nqa entry admin-name operation-tag reaction item-number
Required
Not created by default.
Configuring threshold monitoring Configuration prerequisites
Before you configure threshold monitoring, complete the following tasks:
• Configure the destination address of the trap message by using the snmp-agent target-host command. For more information about the snmp-agent target-host command, see Network Management and Monitoring Command Reference.
• Create an NQA test group and configure the related parameters.

125
Configuring threshold monitoring
Follow these steps to configure threshold monitoring:
To do… Use the command… Remarks
Enter system view system-view —
Enter NQA test group view nqa entry admin-name operation-tag —
Enter test type view of the test group
type { dhcp | dlsw | dns | ftp | http | icmp-echo | snmp | tcp | udp-echo | udp-jitter | voice } —
Configure to send traps to the network management server under specified conditions
reaction trap { probe-failure consecutive-probe-failures | test-complete | test-failure cumulate-probe-failures }
Configure a reaction entry for monitoring the probe duration of a test (not supported in UDP jitter and voice tests)
reaction item-number checked-element probe-duration threshold-type { accumulate accumulate-occurrences | average | consecutive consecutive-occurrences } threshold-value upper-threshold lower-threshold [ action-type { none | trap-only } ]
Configure a reaction entry for monitoring the probe failure times (not supported in UDP jitter and voice tests)
reaction item-number checked-element probe-fail threshold-type { accumulate accumulate-occurrences | consecutive consecutive-occurrences } [ action-type { none | trap-only } ]
Configure a reaction entry for monitoring packet round-trip time (only supported in UDP jitter and voice tests)
reaction item-number checked-element rtt threshold-type { accumulate accumulate-occurrences | average } threshold-value upper-threshold lower-threshold [ action-type { none | trap-only } ]
Configure a reaction entry for monitoring the packet loss in each test (only supported in UDP jitter and voice tests)
reaction item-number checked-element packet-loss threshold-type accumulate accumulate-occurrences [ action-type { none | trap-only } ]
Configure a reaction entry for monitoring one-way delay jitter (only supported in UDP jitter and voice tests)
reaction item-number checked-element { jitter-ds | jitter-sd } threshold-type { accumulate accumulate-occurrences | average } threshold-value upper-threshold lower-threshold [ action-type { none | trap-only } ]
Configure a reaction entry for monitoring the one-way delay (only supported in UDP jitter and voice tests)
reaction item-number checked-element { owd-ds | owd-sd } threshold-value upper-threshold lower-threshold
Configure a reaction entry for monitoring the ICPIF value (only supported in voice tests)
reaction item-number checked-element icpif threshold-value upper-threshold lower-threshold [ action-type { none | trap-only } ]
Configure a reaction entry for monitoring the MOS value (only supported in voice tests)
reaction item-number checked-element mos threshold-value upper-threshold lower-threshold [ action-type { none | trap-only } ]
Required
Configure to send traps.
No traps are sent to the network management server by default.

126
NOTE:
• NQA DNS tests do not support the action of sending trap messages. The action to be triggered in DNStests can only be the default one, none.
• Only the test-complete keyword is supported for the reaction trap command in a voice test.
Configuring the NQA statistics collection function NQA groups tests completed in a time period for a test group, and calculates the test result statistics. The statistics form a statistics group. To view information about the statistics groups, use the display nqa statistics command. To set the interval for collecting statistics, use the statistics interval command.
When the number of statistics groups kept reaches the upper limit and a new statistics group is to be saved, the oldest statistics group is deleted. To set the maximum number of statistics groups that can be kept, use the statistics max-group command.
A statistics group is formed after the last test is completed within the specified interval. Statistics groups have an aging mechanism. A statistics group is deleted when its hold time expires. To set the hold time of statistics groups for a test group, use the statistics hold-time command.
Follow these steps to configure the NQA statistics collection function:
To do… Use the command… Remarks
Enter system view system-view —
Enter NQA test group view nqa entry admin-name operation-tag —
Enter test type view of the test group
type { dlsw | dns | ftp | http | icmp-echo | snmp | tcp | udp-echo | udp-jitter | voice }
—
Configure the interval for collecting the statistics of test results statistics interval interval
Optional
60 minutes by default.
Configure the maximum number of statistics groups that can be kept statistics max-group number
Optional
2 by default.
To disable collecting NQA statistics, set the maximum number to 0.
Configure the hold time of statistics groups statistics hold-time hold-time
Optional
120 minutes by default.
NOTE:
• The NQA statistics collection function is not supported in DHCP tests.
• If you use the frequency command to set the frequency between two consecutive tests to 0, only one testis performed, and no statistics group information is collected.
Configuring the history records saving function The history records saving function enables the system to save the history records of NQA tests. To view the history records of a test group, use the display nqa history command.

127
The configuration task also allows you to configure the following elements:
• Lifetime of the history records—The records are removed when the lifetime is reached.
• The maximum number of history records that can be saved in a test group—If the number of history records in a test group exceeds the maximum number, the earliest history records are removed.
Follow these steps to configure the history records saving function of an NQA test group:
To do… Use the command… Remarks
Enter system view system-view —
Enter NQA test group view nqa entry admin-name operation-tag —
Enter NQA test type view type { dhcp | dlsw | dns | ftp | http | icmp-echo | snmp | tcp | udp-echo | udp-jitter | voice }
—
Enable the saving of the history records of the NQA test group
history-record enable Required
By default, history records of the NQA test group are not saved.
Set the lifetime of the history records in an NQA test group
history-record keep-time keep-time
Optional
By default, the history records in the NQA test group are kept for 120 minutes.
Configure the maximum number of history records that can be saved for a test group
history-record number number Optional
By default, the maximum number of records that can be saved for a test group is 50.
Configuring optional parameters for an NQA test group
Optional parameters for an NQA test group are valid only for tests in this test group.
Unless otherwise specified, the following optional parameters are applicable to all test types.
Follow these steps to configure optional parameters for an NQA test group:
To do… Use the command… Remarks
Enter system view system-view —
Enter NQA test group view nqa entry admin-name operation-tag —
Enter test type view of a test group
type { dhcp | dlsw | dns | ftp | http | icmp-echo | snmp | tcp | udp-echo | udp-jitter | voice }
—
Configure the description for a test group description text
Optional
By default, no description is available for a test group.

128
To do… Use the command… Remarks
Configure the interval between two consecutive tests for a test group
frequency interval
Optional
By default, the interval between two consecutive tests for a test group is 0 milliseconds. Only one test is performed.
If the last test is not completed when the interval specified by the frequency command is reached, a new test does not start.
Configure the number of probe operations to be performed in one test
probe count times
Optional
By default, one probe operation is performed in one test.
Not available for voice tests, Only one probe operation can be performed in one voice test.
Configure the NQA probe timeout time probe timeout timeout
Optional
By default, the timeout time is 3000 milliseconds.
Not available for UDP jitter tests.
Configure the maximum number of hops a probe packet traverses in the network
ttl value
Optional
20 by default.
Not available for DHCP tests.
Configure the ToS field in an IP packet header in an NQA probe packet
tos value
Optional
0 by default.
Not available for DHCP tests.
Enable the routing table bypass function route-option bypass-route
Optional
Disabled by default.
Not available for DHCP tests.
Configuring a schedule for an NQA test group You can configure a schedule for an NQA test group by setting the start time and test duration for a test group.
A test group performs tests between the scheduled start time and the end time (the start time plus test duration). If the scheduled start time is ahead of the system time, the test group starts testing immediately. If both the scheduled start and end time are behind the system time, no test will start. To view the current system time, use the display clock command.
Configuration prerequisites
Before you configure a schedule for an NQA test group, complete the following tasks:
• Configure test parameters required for the test type.
• Configure the NQA server for tests that require cooperation with the NQA server.
Scheduling an NQA test group
Follow these steps to configure a schedule for an NQA test group:

129
To do… Use the command… Remarks
Enter system view system-view —
Configure a schedule for an NQA test group
nqa schedule admin-name operation-tag start-time { hh:mm:ss [ yyyy/mm/dd ] | now } lifetime { lifetime | forever }
Required
now specifies the test group starts testing immediately.
forever specifies that the tests do not stop unless you use the undo nqa schedule command.
Configure the maximum number of tests that the NQA client can simultaneously perform
nqa agent max-concurrent number
Optional
By default, the maximum number of tests that the NQA client can simultaneously perform is 2.
NOTE:
• After an NQA test group is scheduled, you cannot enter the test group view or test type view.
• System adjustment does not affect started or completed test groups. It only affects test groups that havenot started.
Displaying and maintaining NQA To do… Use the command… Remarks
Display history records of NQA test groups
display nqa history [ admin-name operation-tag ] [ | { begin | exclude | include } regular-expression ]
Display the current monitoring results of reaction entries
display nqa reaction counters [ admin-name operation-tag [ item-number ] ] [ | { begin | exclude | include } regular-expression ]
Display the results of the last NQA test
display nqa result [ admin-name operation-tag ] [ | { begin | exclude | include } regular-expression ]
Display statistics of test results for the specified or all test groups
display nqa statistics [ admin-name operation-tag ] [ | { begin | exclude | include } regular-expression ]
Display NQA server status display nqa server status [ | { begin | exclude | include } regular-expression ]
Available in any view
NQA configuration examples
ICMP echo test configuration example Network requirements
As shown in Figure 40, configure NQA ICMP echo tests to test whether the NQA client (Device A) can send packets through a specific next hop to the specified destination (Device B) and test the round-trip time of the packets.

130
Figure 40 Network diagram
NQA client
Device BDevice A
10.1.1.1/24 10.2.2.2/24
Device C
10.1.1.2/24
10.3.1.2/24
Device D
10.2.2.1/24
10.4.1.1/24
10.3.1.1/24 10.4.1.2/24
Configuration procedure
NOTE:
Before you make the configuration, make sure the devices can reach each other.
# Create an ICMP echo test group, and specify 10.2.2.2 as the destination IP address for ICMP echo requests to be sent. <DeviceA> system-view
[DeviceA] nqa entry admin test
[DeviceA-nqa-admin-test] type icmp-echo
[DeviceA-nqa-admin-test-icmp-echo] destination ip 10.2.2.2
# Configure 10.1.1.2 as the next hop IP address for ICMP echo requests. The ICMP echo requests are sent to Device C to Device B (the destination). [DeviceA-nqa-admin-test-icmp-echo] next-hop 10.1.1.2
# Configure the device to perform 10 probe operations per test, perform tests at an interval of 5000 milliseconds. Set the NQA probe timeout time as 500 milliseconds. [DeviceA-nqa-admin-test-icmp-echo] probe count 10
[DeviceA-nqa-admin-test-icmp-echo] probe timeout 500
[DeviceA-nqa-admin-test-icmp-echo] frequency 5000
# Enable the saving of history records and configure the maximum number of history records that can be saved for a test group. [DeviceA-nqa-admin-test-icmp-echo] history-record enable
[DeviceA-nqa-admin-test-icmp-echo] history-record number 10
[DeviceA-nqa-admin-test-icmp-echo] quit
# Start ICMP echo tests. [DeviceA] nqa schedule admin test start-time now lifetime forever

131
# Stop the ICMP echo tests after a period of time. [DeviceA] undo nqa schedule admin test
# Display the results of the last ICMP echo test. [DeviceA] display nqa result admin test
NQA entry (admin admin, tag test) test results:
Destination IP address: 10.2.2.2
Send operation times: 10 Receive response times: 10
Min/Max/Average round trip time: 2/5/3
Square-Sum of round trip time: 96
Last succeeded probe time: 2011-01-23 15:00:01.2
Extended results:
Packet loss in test: 0%
Failures due to timeout: 0
Failures due to disconnect: 0
Failures due to no connection: 0
Failures due to sequence error: 0
Failures due to internal error: 0
Failures due to other errors: 0
Packet(s) arrived late: 0
# Display the history of ICMP echo tests. [DeviceA] display nqa history admin test
NQA entry (admin admin, tag test) history record(s):
Index Response Status Time
370 3 Succeeded 2011-01-23 15:00:01.2
369 3 Succeeded 2011-01-23 15:00:01.2
368 3 Succeeded 2011-01-23 15:00:01.2
367 5 Succeeded 2011-01-23 15:00:01.2
366 3 Succeeded 2011-01-23 15:00:01.2
365 3 Succeeded 2011-01-23 15:00:01.2
364 3 Succeeded 2011-01-23 15:00:01.1
363 2 Succeeded 2011-01-23 15:00:01.1
362 3 Succeeded 2011-01-23 15:00:01.1
361 2 Succeeded 2011-01-23 15:00:01.1
DHCP Test configuration example Network requirements
As shown in Figure 41, configure NQA DHCP tests to test the time required for Device A to obtain an IP address from the DHCP server (Device B).
Figure 41 Network diagram

132
Configuration procedure
# Create a DHCP test group, and specify interface VLAN-interface 2 to perform NQA DHCP tests. <DeviceA> system-view
[DeviceA] nqa entry admin test
[DeviceA-nqa-admin-test] type dhcp
[DeviceA-nqa-admin-test-dhcp] operation interface vlan-interface 2
# Enable the saving of history records. [DeviceA-nqa-admin-test-dhcp] history-record enable
[DeviceA-nqa-admin-test-dhcp] quit
# Start DHCP tests. [DeviceA] nqa schedule admin test start-time now lifetime forever
# Stop DHCP tests after a period of time. [DeviceA] undo nqa schedule admin test
# Display the result of the last DHCP test. [DeviceA] display nqa result admin test
NQA entry (admin admin, tag test) test results:
Send operation times: 1 Receive response times: 1
Min/Max/Average round trip time: 624/624/624
Square-Sum of round trip time: 389376
Last succeeded probe time: 2011-01-22 09:56:03.2
Extended results:
Packet loss in test: 0%
Failures due to timeout: 0
Failures due to disconnect: 0
Failures due to no connection: 0
Failures due to sequence error: 0
Failures due to internal error: 0
Failures due to other errors: 0
Packet(s) arrived late: 0
# Display the history of DHCP tests. [DeviceA] display nqa history admin test
NQA entry (admin admin, tag test) history record(s):
Index Response Status Time
1 624 Succeeded 2011-01-22 09:56:03.2
DNS test configuration example Network requirements
As shown in Figure 42, configure NQA DNS tests to test whether Device A can translate the domain name host.com into an IP address through the DNS server and test the time required for resolution.

133
Figure 42 Network diagram
IP network
NQA client
Device A
10.1.1.1/16 10.2.2.2/16
DNS server
Configuration procedure
NOTE:
Before you make the configuration, make sure the devices can reach each other.
# Create a DNS test group. <DeviceA> system-view
[DeviceA] nqa entry admin test
[DeviceA-nqa-admin-test] type dns
# Specify the IP address of the DNS server 10.2.2.2 as the destination address for DNS tests, and specify the domain name that needs to be translated as host.com. [DeviceA-nqa-admin-test-dns] destination ip 10.2.2.2
[DeviceA-nqa-admin-test-dns] resolve-target host.com
# Enable the saving of history records. [DeviceA-nqa-admin-test-dns] history-record enable
[DeviceA-nqa-admin-test-dns] quit
# Start DNS tests. [DeviceA] nqa schedule admin test start-time now lifetime forever
# Stop the DNS tests after a period of time. [DeviceA] undo nqa schedule admin test
# Display the results of the last DNS test. [DeviceA] display nqa result admin test
NQA entry (admin admin, tag test) test results:
Destination IP address: 10.2.2.2
Send operation times: 1 Receive response times: 1
Min/Max/Average round trip time: 62/62/62
Square-Sum of round trip time: 3844
Last succeeded probe time: 2011-01-10 10:49:37.3
Extended results:
Packet loss in test: 0%
Failures due to timeout: 0
Failures due to disconnect: 0
Failures due to no connection: 0
Failures due to sequence error: 0
Failures due to internal error: 0
Failures due to other errors: 0
Packet(s) arrived late: 0
# Display the history of DNS tests. [DeviceA] display nqa history admin test

134
NQA entry (admin admin, tag test) history record(s):
Index Response Status Time
1 62 Succeeded 2011-01-10 10:49:37.3
FTP test configuration example Network requirements
As shown in Figure 43, configure NQA FTP tests to test the connection with a specific FTP server and the time required for Device A to upload a file to the FTP server. The login username is admin, the login password is systemtest, and the file to be transferred to the FTP server is config.txt.
Figure 43 Network diagram
Configuration procedure
NOTE:
Before you make the configuration, make sure the devices can reach each other.
# Create an FTP test group. <DeviceA> system-view
[DeviceA] nqa entry admin test
[DeviceA-nqa-admin-test] type ftp
# Specify the IP address of the FTP server 10.2.2.2 as the destination IP address for FTP tests. [DeviceA-nqa-admin-test-ftp] destination ip 10.2.2.2
# Specify 10.1.1.1 as the source IP address for probe packets. [DeviceA-nqa-admin-test-ftp] source ip 10.1.1.1
# Set the FTP username to admin, and password to systemtest. [DeviceA-nqa-admin-test-ftp] username admin
[DeviceA-nqa-admin-test-ftp] password systemtest
# Configure the device to upload file config.txt to the FTP server for each probe operation. [DeviceA-nqa-admin-test-ftp] operation put
[DeviceA-nqa-admin-test-ftp] filename config.txt
# Enable the saving of history records. [DeviceA-nqa-admin-test-ftp] history-record enable
[DeviceA-nqa-admin-test-ftp] quit
# Start FTP tests. [DeviceA] nqa schedule admin test start-time now lifetime forever
# Stop the FTP tests after a period of time. [DeviceA] undo nqa schedule admin test
# Display the results of the last FTP test. [DeviceA] display nqa result admin test

135
NQA entry (admin admin, tag test) test results:
Destination IP address: 10.2.2.2
Send operation times: 1 Receive response times: 1
Min/Max/Average round trip time: 173/173/173
Square-Sum of round trip time: 29929
Last succeeded probe time: 2011-01-22 10:07:28.6
Extended results:
Packet loss in test: 0%
Failures due to timeout: 0
Failures due to disconnect: 0
Failures due to no connection: 0
Failures due to sequence error: 0
Failures due to internal error: 0
Failures due to other errors: 0
Packet(s) arrived late: 0
# Display the history of FTP tests. [DeviceA] display nqa history admin test
NQA entry (admin admin, tag test) history record(s):
Index Response Status Time
1 173 Succeeded 2011-01-22 10:07:28.6
HTTP test configuration example Network requirements
As shown in Figure 44, configure NQA HTTP tests to test the connection with a specific HTTP server and the time required to obtain data from the HTTP server.
Figure 44 Network diagram
Configuration procedure
NOTE:
Before you make the configuration, make sure the devices can reach each other.
# Create an HTTP test group. <DeviceA> system-view
[DeviceA] nqa entry admin test
[DeviceA-nqa-admin-test] type http
# Specify the IP address of the HTTP server 10.2.2.2 as the destination IP address for HTTP tests. [DeviceA-nqa-admin-test-http] destination ip 10.2.2.2
# Configure the device to get data from the HTTP server for each HTTP probe operation. (get is the default HTTP operation type, and this step is optional.) [DeviceA-nqa-admin-test-http] operation get

136
# Configure HTTP tests to visit website /index.htm. [DeviceA-nqa-admin-test-http] url /index.htm
# Configure the HTTP version 1.0 to be used in HTTP tests. (Version 1.0 is the default version, and this step is optional.) [DeviceA-nqa-admin-test-http] http-version v1.0
# Enable the saving of history records. [DeviceA-nqa-admin-test-http] history-record enable
[DeviceA-nqa-admin-test-http] quit
# Start HTTP tests. [DeviceA] nqa schedule admin test start-time now lifetime forever
# Stop HTTP tests after a period of time. [DeviceA] undo nqa schedule admin test
# Display results of the last HTTP test. [DeviceA] display nqa result admin test
NQA entry (admin admin, tag test) test results:
Destination IP address: 10.2.2.2
Send operation times: 1 Receive response times: 1
Min/Max/Average round trip time: 64/64/64
Square-Sum of round trip time: 4096
Last succeeded probe time: 2011-01-22 10:12:47.9
Extended results:
Packet loss in test: 0%
Failures due to timeout: 0
Failures due to disconnect: 0
Failures due to no connection: 0
Failures due to sequence error: 0
Failures due to internal error: 0
Failures due to other errors:
Packet(s) arrived late: 0
# Display the history of HTTP tests. [DeviceA] display nqa history admin test
NQA entry (admin admin, tag test) history record(s):
Index Response Status Time
1 64 Succeeded 2011-01-22 10:12:47.9
UDP jitter test configuration example Network requirements
As shown in Figure 45, configure NQA UDP jitter tests to test the delay jitter of packet transmission between Device A and Device B.

137
Figure 45 Network diagram
Configuration procedure
NOTE:
Before you make the configuration, make sure the devices can reach each other.
1. Configure Device B.
# Enable the NQA server, and configure a listening service to listen to IP address 10.2.2.2 and UDP port 9000. <DeviceB> system-view
[DeviceB] nqa server enable
[DeviceB] nqa server udp-echo 10.2.2.2 9000
2. Configure Device A.
# Create a UDP jitter test group. <DeviceA> system-view
[DeviceA] nqa entry admin test
[DeviceA-nqa-admin-test] type udp-jitter
# Configure UDP jitter packets to use 10.2.2.2 as the destination IP address and port 9000 as the destination port. [DeviceA-nqa-admin-test-udp-jitter] destination ip 10.2.2.2
[DeviceA-nqa-admin-test-udp-jitter] destination port 9000
# Configure the device to perform UDP jitter tests at an interval of 1000 milliseconds. [DeviceA-nqa-admin-test-udp-jitter] frequency 1000
[DeviceA-nqa-admin-test-udp-jitter] quit
# Start UDP jitter tests. [DeviceA] nqa schedule admin test start-time now lifetime forever
# Stop UDP jitter tests after a period of time. [DeviceA] undo nqa schedule admin test
# Display the result of the last UDP jitter test. [DeviceA] display nqa result admin test
NQA entry (admin admin, tag test) test results:
Destination IP address: 10.2.2.2
Send operation times: 10 Receive response times: 10
Min/Max/Average round trip time: 15/32/17
Square-Sum of round trip time: 3235
Last succeeded probe time: 2011-01-29 13:56:17.6
Extended results:
Packet loss in test: 0%
Failures due to timeout: 0
Failures due to disconnect: 0

138
Failures due to no connection: 0
Failures due to sequence error: 0
Failures due to internal error: 0
Failures due to other errors: 0
Packet(s) arrived late: 0
UDP-jitter results:
RTT number: 10
Min positive SD: 4 Min positive DS: 1
Max positive SD: 21 Max positive DS: 28
Positive SD number: 5 Positive DS number: 4
Positive SD sum: 52 Positive DS sum: 38
Positive SD average: 10 Positive DS average: 10
Positive SD square sum: 754 Positive DS square sum: 460
Min negative SD: 1 Min negative DS: 6
Max negative SD: 13 Max negative DS: 22
Negative SD number: 4 Negative DS number: 5
Negative SD sum: 38 Negative DS sum: 52
Negative SD average: 10 Negative DS average: 10
Negative SD square sum: 460 Negative DS square sum: 754
One way results:
Max SD delay: 15 Max DS delay: 16
Min SD delay: 7 Min DS delay: 7
Number of SD delay: 10 Number of DS delay: 10
Sum of SD delay: 78 Sum of DS delay: 85
Square sum of SD delay: 666 Square sum of DS delay: 787
SD lost packet(s): 0 DS lost packet(s): 0
Lost packet(s) for unknown reason: 0
# Display the statistics of UDP jitter tests. [DeviceA] display nqa statistics admin test
NQA entry (admin admin, tag test) test statistics:
NO. : 1
Destination IP address: 10.2.2.2
Start time: 2011-01-29 13:56:14.0
Life time: 47 seconds
Send operation times: 410 Receive response times: 410
Min/Max/Average round trip time: 1/93/19
Square-Sum of round trip time: 206176
Extended results:
Packet loss in test: 0%
Failures due to timeout: 0
Failures due to disconnect: 0
Failures due to no connection: 0
Failures due to sequence error: 0
Failures due to internal error: 0
Failures due to other errors: 0
Packet(s) arrived late: 0
UDP-jitter results:
RTT number: 410

139
Min positive SD: 3 Min positive DS: 1
Max positive SD: 30 Max positive DS: 79
Positive SD number: 186 Positive DS number: 158
Positive SD sum: 2602 Positive DS sum: 1928
Positive SD average: 13 Positive DS average: 12
Positive SD square sum: 45304 Positive DS square sum: 31682
Min negative SD: 1 Min negative DS: 1
Max negative SD: 30 Max negative DS: 78
Negative SD number: 181 Negative DS number: 209
Negative SD sum: 181 Negative DS sum: 209
Negative SD average: 13 Negative DS average: 14
Negative SD square sum: 46994 Negative DS square sum: 3030
One way results:
Max SD delay: 46 Max DS delay: 46
Min SD delay: 7 Min DS delay: 7
Number of SD delay: 410 Number of DS delay: 410
Sum of SD delay: 3705 Sum of DS delay: 3891
Square sum of SD delay: 45987 Square sum of DS delay: 49393
SD lost packet(s): 0 DS lost packet(s): 0
Lost packet(s) for unknown reason: 0
NOTE:
The display nqa history command does not show the results of UDP jitter tests. To know the result of a UDPjitter test, use the display nqa result command to view the probe results of the latest NQA test, or use thedisplay nqa statistics command to view the statistics of NQA tests.
SNMP test configuration example Network requirements
As shown in Figure 46, configure NQA SNMP tests to test the time it takes for Device A to send an SNMP query packet to the SNMP agent and receive a response packet.
Figure 46 Network diagram
Configuration procedure
NOTE:
Before you make the configuration, make sure the devices can reach each other.
1. Configure the SNMP agent (Device B).
# Enable the SNMP agent service and set the SNMP version to all, the read community to public, and the write community to private. <DeviceB> system-view

140
[DeviceB] snmp-agent sys-info version all
[DeviceB] snmp-agent community read public
[DeviceB] snmp-agent community write private
2. Configure Device A.
# Create an SNMP test group, and configure SNMP packets to use 10.2.2.2 as their destination IP address. <DeviceA> system-view
[DeviceA] nqa entry admin test
[DeviceA-nqa-admin-test] type snmp
[DeviceA-nqa-admin-test-snmp] destination ip 10.2.2.2
# Enable the saving of history records. [DeviceA-nqa-admin-test-snmp] history-record enable
[DeviceA-nqa-admin-test-snmp] quit
# Start SNMP tests. [DeviceA] nqa schedule admin test start-time now lifetime forever
# Stop the SNMP tests after a period of time. [DeviceA] undo nqa schedule admin test
# Display the results of the last SNMP test. [DeviceA] display nqa result admin test
NQA entry (admin admin, tag test) test results:
Destination IP address: 10.2.2.2
Send operation times: 1 Receive response times: 1
Min/Max/Average round trip time: 50/50/50
Square-Sum of round trip time: 2500
Last succeeded probe time: 2011-01-22 10:24:41.1
Extended results:
Packet loss in test: 0%
Failures due to timeout: 0
Failures due to disconnect: 0
Failures due to no connection: 0
Failures due to sequence error: 0
Failures due to internal error: 0
Failures due to other errors: 0
Packet(s) arrived late: 0
# Display the history of SNMP tests. [DeviceA] display nqa history admin test
NQA entry (admin admin, tag test) history record(s):
Index Response Status Time
1 50 Timeout 2011-01-22 10:24:41.1
TCP test configuration example Network requirements
As shown in Figure 47, configure NQA TCP tests to test the time for establishing a TCP connection between Device A and Device B.

141
Figure 47 Network diagram
Configuration procedure
NOTE:
Before you make the configuration, make sure the devices can reach each other.
1. Configure Device B.
# Enable the NQA server, and configure a listening service to listen to IP address 10.2.2.2 and TCP port 9000. <DeviceB> system-view
[DeviceB] nqa server enable
[DeviceB] nqa server tcp-connect 10.2.2.2 9000
2. Configure Device A.
# Create a TCP test group. <DeviceA> system-view
[DeviceA] nqa entry admin test
[DeviceA-nqa-admin-test] type tcp
# Configure TCP probe packets to use 10.2.2.2 as the destination IP address and port 9000 as the destination port. [DeviceA-nqa-admin-test-tcp] destination ip 10.2.2.2
[DeviceA-nqa-admin-test-tcp] destination port 9000
# Enable the saving of history records. [DeviceA-nqa-admin-test-tcp] history-record enable
[DeviceA-nqa-admin-test-tcp] quit
# Start TCP tests. [DeviceA] nqa schedule admin test start-time now lifetime forever
# Stop the TCP tests after a period of time. [DeviceA] undo nqa schedule admin test
# Display the results of the last TCP test. [DeviceA] display nqa result admin test
NQA entry (admin admin, tag test) test results:
Destination IP address: 10.2.2.2
Send operation times: 1 Receive response times: 1
Min/Max/Average round trip time: 13/13/13
Square-Sum of round trip time: 169
Last succeeded probe time: 2011-01-22 10:27:25.1
Extended results:
Packet loss in test: 0%
Failures due to timeout: 0
Failures due to disconnect: 0
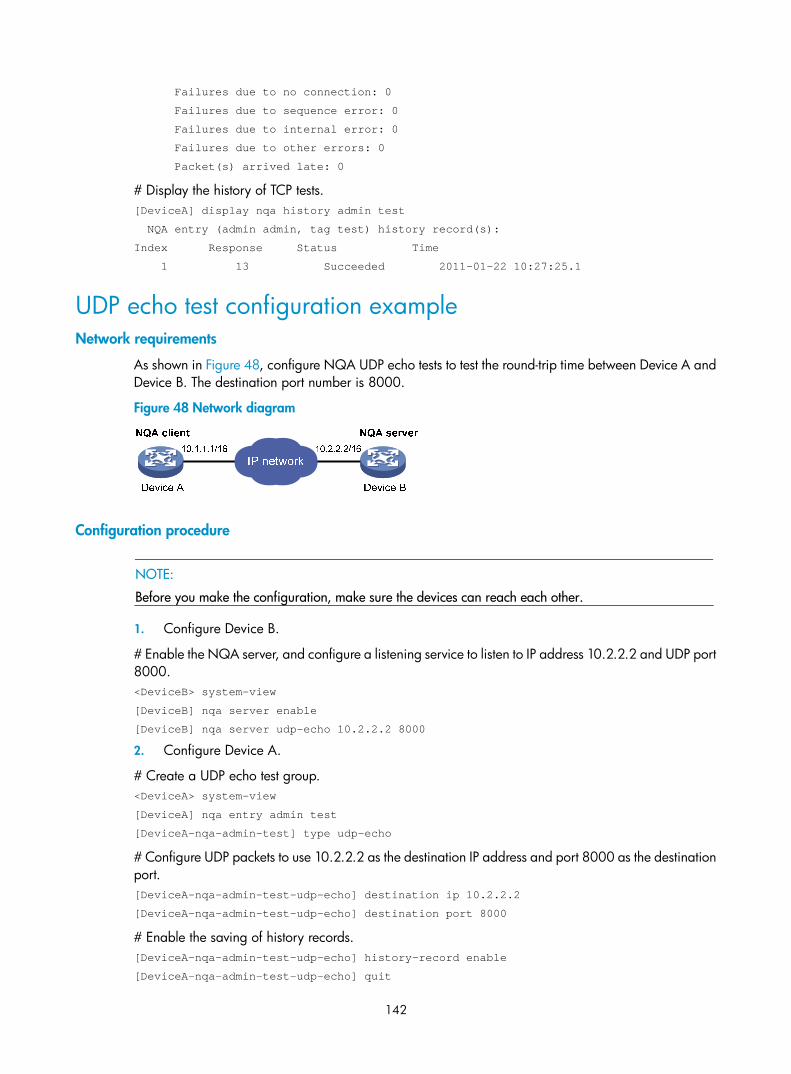
142
Failures due to no connection: 0
Failures due to sequence error: 0
Failures due to internal error: 0
Failures due to other errors: 0
Packet(s) arrived late: 0
# Display the history of TCP tests. [DeviceA] display nqa history admin test
NQA entry (admin admin, tag test) history record(s):
Index Response Status Time
1 13 Succeeded 2011-01-22 10:27:25.1
UDP echo test configuration example Network requirements
As shown in Figure 48, configure NQA UDP echo tests to test the round-trip time between Device A and Device B. The destination port number is 8000.
Figure 48 Network diagram
Configuration procedure
NOTE:
Before you make the configuration, make sure the devices can reach each other.
1. Configure Device B.
# Enable the NQA server, and configure a listening service to listen to IP address 10.2.2.2 and UDP port 8000. <DeviceB> system-view
[DeviceB] nqa server enable
[DeviceB] nqa server udp-echo 10.2.2.2 8000
2. Configure Device A.
# Create a UDP echo test group. <DeviceA> system-view
[DeviceA] nqa entry admin test
[DeviceA-nqa-admin-test] type udp-echo
# Configure UDP packets to use 10.2.2.2 as the destination IP address and port 8000 as the destination port. [DeviceA-nqa-admin-test-udp-echo] destination ip 10.2.2.2
[DeviceA-nqa-admin-test-udp-echo] destination port 8000
# Enable the saving of history records. [DeviceA-nqa-admin-test-udp-echo] history-record enable
[DeviceA-nqa-admin-test-udp-echo] quit
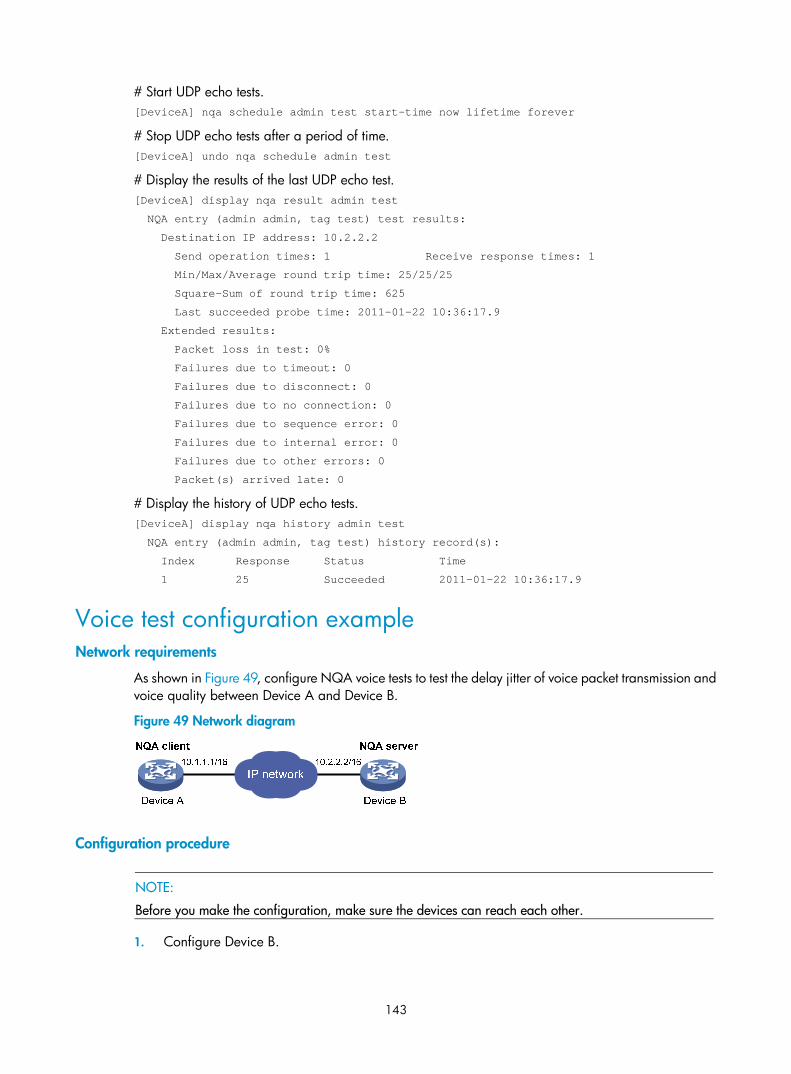
143
# Start UDP echo tests. [DeviceA] nqa schedule admin test start-time now lifetime forever
# Stop UDP echo tests after a period of time. [DeviceA] undo nqa schedule admin test
# Display the results of the last UDP echo test. [DeviceA] display nqa result admin test
NQA entry (admin admin, tag test) test results:
Destination IP address: 10.2.2.2
Send operation times: 1 Receive response times: 1
Min/Max/Average round trip time: 25/25/25
Square-Sum of round trip time: 625
Last succeeded probe time: 2011-01-22 10:36:17.9
Extended results:
Packet loss in test: 0%
Failures due to timeout: 0
Failures due to disconnect: 0
Failures due to no connection: 0
Failures due to sequence error: 0
Failures due to internal error: 0
Failures due to other errors: 0
Packet(s) arrived late: 0
# Display the history of UDP echo tests. [DeviceA] display nqa history admin test
NQA entry (admin admin, tag test) history record(s):
Index Response Status Time
1 25 Succeeded 2011-01-22 10:36:17.9
Voice test configuration example Network requirements
As shown in Figure 49, configure NQA voice tests to test the delay jitter of voice packet transmission and voice quality between Device A and Device B.
Figure 49 Network diagram
Configuration procedure
NOTE:
Before you make the configuration, make sure the devices can reach each other.
1. Configure Device B.

144
# Enable the NQA server, and configure a listening service to listen to IP address 10.2.2.2 and UDP port 9000. <DeviceB> system-view
[DeviceB] nqa server enable
[DeviceB] nqa server udp-echo 10.2.2.2 9000
2. Configure Device A.
# Create a voice test group. <DeviceA> system-view
[DeviceA] nqa entry admin test
[DeviceA-nqa-admin-test] type voice
# Configure voice probe packets to use 10.2.2.2 as the destination IP address and port 9000 as the destination port. [DeviceA-nqa-admin-test-voice] destination ip 10.2.2.2
[DeviceA-nqa-admin-test-voice] destination port 9000
[DeviceA-nqa-admin-test-voice] quit
# Start voice tests. [DeviceA] nqa schedule admin test start-time now lifetime forever
# Stop the voice tests after a period of time. [DeviceA] undo nqa schedule admin test
# Display the result of the last voice test. [DeviceA] display nqa result admin test
NQA entry (admin admin, tag test) test results:
Destination IP address: 10.2.2.2
Send operation times: 1000 Receive response times: 1000
Min/Max/Average round trip time: 31/1328/33
Square-Sum of round trip time: 2844813
Last succeeded probe time: 2011-01-13 09:49:31.1
Extended results:
Packet loss in test: 0%
Failures due to timeout: 0
Failures due to disconnect: 0
Failures due to no connection: 0
Failures due to sequence error: 0
Failures due to internal error: 0
Failures due to other errors: 0
Packet(s) arrived late: 0
Voice results:
RTT number: 1000
Min positive SD: 1 Min positive DS: 1
Max positive SD: 204 Max positive DS: 1297
Positive SD number: 257 Positive DS number: 259
Positive SD sum: 759 Positive DS sum: 1797
Positive SD average: 2 Positive DS average: 6
Positive SD square sum: 54127 Positive DS square sum: 1691967
Min negative SD: 1 Min negative DS: 1
Max negative SD: 203 Max negative DS: 1297

145
Negative SD number: 255 Negative DS number: 259
Negative SD sum: 759 Negative DS sum: 1796
Negative SD average: 2 Negative DS average: 6
Negative SD square sum: 53655 Negative DS square sum: 1691776
One way results:
Max SD delay: 343 Max DS delay: 985
Min SD delay: 343 Min DS delay: 985
Number of SD delay: 1 Number of DS delay: 1
Sum of SD delay: 343 Sum of DS delay: 985
Square sum of SD delay: 117649 Square sum of DS delay: 970225
SD lost packet(s): 0 DS lost packet(s): 0
Lost packet(s) for unknown reason: 0
Voice scores:
MOS value: 4.38 ICPIF value: 0
# Display the statistics of voice tests. [DeviceA] display nqa statistics admin test
NQA entry (admin admin, tag test) test statistics:
NO. : 1
Destination IP address: 10.2.2.2
Start time: 2011-01-13 09:45:37.8
Life time: 331 seconds
Send operation times: 4000 Receive response times: 4000
Min/Max/Average round trip time: 15/1328/32
Square-Sum of round trip time: 7160528
Extended results:
Packet loss in test: 0%
Failures due to timeout: 0
Failures due to disconnect: 0
Failures due to no connection: 0
Failures due to sequence error: 0
Failures due to internal error: 0
Failures due to other errors: 0
Packet(s) arrived late: 0
Voice results:
RTT number: 4000
Min positive SD: 1 Min positive DS: 1
Max positive SD: 360 Max positive DS: 1297
Positive SD number: 1030 Positive DS number: 1024
Positive SD sum: 4363 Positive DS sum: 5423
Positive SD average: 4 Positive DS average: 5
Positive SD square sum: 497725 Positive DS square sum: 2254957
Min negative SD: 1 Min negative DS: 1
Max negative SD: 360 Max negative DS: 1297
Negative SD number: 1028 Negative DS number: 1022
Negative SD sum: 1028 Negative DS sum: 1022
Negative SD average: 4 Negative DS average: 5
Negative SD square sum: 495901 Negative DS square sum: 5419
One way results:

146
Max SD delay: 359 Max DS delay: 985
Min SD delay: 0 Min DS delay: 0
Number of SD delay: 4 Number of DS delay: 4
Sum of SD delay: 1390 Sum of DS delay: 1079
Square sum of SD delay: 483202 Square sum of DS delay: 973651
SD lost packet(s): 0 DS lost packet(s): 0
Lost packet(s) for unknown reason: 0
Voice scores:
Max MOS value: 4.38 Min MOS value: 4.38
Max ICPIF value: 0 Min ICPIF value: 0
NOTE:
The display nqa history command cannot show you the results of voice tests. To know the result of a voicetest, use the display nqa result command to view the probe results of the latest NQA test, or use the display nqa statistics command to view the statistics of NQA tests.
DLSw test configuration example Network requirements
As shown in Figure 50, configure NQA DLSw tests to test the response time of the DLSw device.
Figure 50 Network diagram
Configuration procedure
NOTE:
Before you make the configuration, make sure the devices can reach each other.
# Create a DLSw test group, and configure DLSw probe packets to use 10.2.2.2 as the destination IP address. <DeviceA> system-view
[DeviceA] nqa entry admin test
[DeviceA-nqa-admin-test] type dlsw
[DeviceA-nqa-admin-test-dlsw] destination ip 10.2.2.2
# Enable the saving of history records. [DeviceA-nqa-admin-test-dlsw] history-record enable
[DeviceA-nqa-admin-test-dlsw] quit
# Start DLSw tests. [DeviceA] nqa schedule admin test start-time now lifetime forever
# Stop the DLSw tests after a period of time. [DeviceA] undo nqa schedule admin test
# Display the result of the last DLSw test.
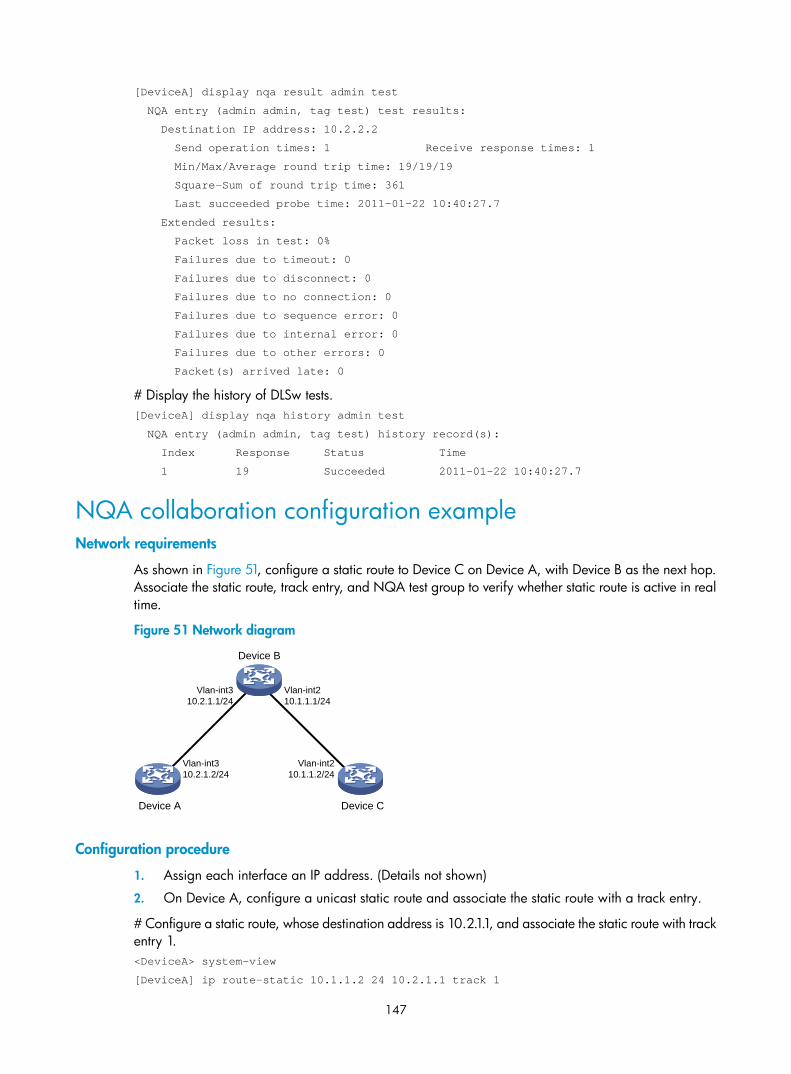
147
[DeviceA] display nqa result admin test
NQA entry (admin admin, tag test) test results:
Destination IP address: 10.2.2.2
Send operation times: 1 Receive response times: 1
Min/Max/Average round trip time: 19/19/19
Square-Sum of round trip time: 361
Last succeeded probe time: 2011-01-22 10:40:27.7
Extended results:
Packet loss in test: 0%
Failures due to timeout: 0
Failures due to disconnect: 0
Failures due to no connection: 0
Failures due to sequence error: 0
Failures due to internal error: 0
Failures due to other errors: 0
Packet(s) arrived late: 0
# Display the history of DLSw tests. [DeviceA] display nqa history admin test
NQA entry (admin admin, tag test) history record(s):
Index Response Status Time
1 19 Succeeded 2011-01-22 10:40:27.7
NQA collaboration configuration example Network requirements
As shown in Figure 51, configure a static route to Device C on Device A, with Device B as the next hop. Associate the static route, track entry, and NQA test group to verify whether static route is active in real time.
Figure 51 Network diagram
Vlan-int210.1.1.1/24
Vlan-int210.1.1.2/24
Vlan-int310.2.1.1/24
Device C
Vlan-int310.2.1.2/24
Device B
Device A
Configuration procedure
1. Assign each interface an IP address. (Details not shown)
2. On Device A, configure a unicast static route and associate the static route with a track entry.
# Configure a static route, whose destination address is 10.2.1.1, and associate the static route with track entry 1. <DeviceA> system-view
[DeviceA] ip route-static 10.1.1.2 24 10.2.1.1 track 1

148
3. On Device A, create an NQA test group.
# Create an NQA test group with the administrator name being admin and operation tag being test. [DeviceA] nqa entry admin test
# Configure the test type of the NQA test group as ICMP echo. [DeviceA-nqa-admin-test] type icmp-echo
# Configure ICMP echo requests to use 10.2.1.1 as their destination IP address. [DeviceA-nqa-admin-test-icmp-echo] destination ip 10.2.1.1
# Configure the device to perform tests at an interval of 100 milliseconds. [DeviceA-nqa-admin-test-icmp-echo] frequency 100
# Create reaction entry 1. If the number of consecutive probe failures reaches 5, collaboration with other modules is triggered. [DeviceA-nqa-admin-test-icmp-echo] reaction 1 checked-element probe-fail threshold-type consecutive 5 action-type trigger-only
[DeviceA-nqa-admin-test-icmp-echo] quit
# Configure the test start time and test duration for the test group. [DeviceA] nqa schedule admin test start-time now lifetime forever
4. On Device A, create the track entry.
# Create track entry 1, and associate it with reaction entry 1 of the NQA test group (admin-test). [DeviceA] track 1 nqa entry admin test reaction 1
5. Verify the configuration.
# On Device A, display information about all the track entries. [DeviceA] display track all
Track ID: 1
Status: Positive
Notification delay: Positive 0, Negative 0 (in seconds)
Reference object:
NQA entry: admin test
Reaction: 1
# Display brief information about active routes in the routing table on Device A. [DeviceA] display ip routing-table
Routing Tables: Public
Destinations : 5 Routes : 5
Destination/Mask Proto Pre Cost NextHop Interface
10.1.1.0/24 Static 60 0 10.2.1.1 Vlan3
10.2.1.0/24 Direct 0 0 10.2.1.2 Vlan3
10.2.1.2/32 Direct 0 0 127.0.0.1 InLoop0
127.0.0.0/8 Direct 0 0 127.0.0.1 InLoop0
127.0.0.1/32 Direct 0 0 127.0.0.1 InLoop0
The output shows that the static route with the next hop 10.2.1.1 is active, and the status of the track entry is positive. The static route configuration works.
# Remove the IP address of VLAN-interface 3 on Device B. <DeviceB> system-view

149
[DeviceB] interface vlan-interface 3
[DeviceB-Vlan-interface3] undo ip address
# On Device A, display information about all the track entries. [DeviceA] display track all
Track ID: 1
Status: Negative
Notification delay: Positive 0, Negative 0 (in seconds)
Reference object:
NQA entry: admin test
Reaction: 1
# Display brief information about active routes in the routing table on Device A. [DeviceA] display ip routing-table
Routing Tables: Public
Destinations : 4 Routes : 4
Destination/Mask Proto Pre Cost NextHop Interface
10.2.1.0/24 Direct 0 0 10.2.1.2 Vlan3
10.2.1.2/32 Direct 0 0 127.0.0.1 InLoop0
127.0.0.0/8 Direct 0 0 127.0.0.1 InLoop0
127.0.0.1/32 Direct 0 0 127.0.0.1 InLoop0
The output shows that the next hop 10.2.1.1 of the static route is not reachable, and the status of the track entry is negative. The static route does not work.

150
sFlow configuration
sFlow overview
Introduction to sFlow Sampled Flow (sFlow) is a traffic monitoring technology mainly used to collect and analyze traffic statistics.
As shown in Figure 52, the sFlow system involves an sFlow agent embedded in a device and a remote sFlow collector. The sFlow agent collects traffic statistics and packet information from the sFlow-enabled interfaces and encapsulates them into sFlow packets. When the sFlow packet buffer is full, or the age time of sFlow packets is reached, (the age time is one second), the sFlow agent sends the packets to a specified sFlow collector. The sFlow collector analyzes the sFlow packets and displays the results.
sFlow has the following two sampling mechanisms:
• Flow sampling: Packet-based sampling, used to obtain packet content information.
• Counter sampling: Time-based sampling, used to obtain port traffic statistics.
Figure 52 sFlow system
As a traffic monitoring technology, sFlow has the following advantages:
• Supporting traffic monitoring on Gigabit and higher-speed networks.
• Providing good scalability to allow one sFlow collector to monitor multiple sFlow agents.
• Saving cost by embedding the sFlow agent in a device, instead of using a dedicated sFlow agent device.
NOTE:
Only the sFlow agent function is supported on the switch.
sFlow operation sFlow operates in the following ways:
1. Before enabling the sFlow function, configure the sFlow agent and sFlow collector on the device.

151
2. With flow sampling enabled on an Ethernet interface, the sFlow agent samples packets and encapsulates them into sFlow packets. For the configuration, see “Configuring flow sampling.”
3. With counter sampling enabled on an Ethernet interface, the sFlow agent periodically collects the statistics of the interface and encapsulates the statistics into sFlow packets. For the configuration, see “Configuring flow sampling.”
Configuring sFlow Before configuring sFlow, complete the following tasks:
• Configure the IP address, flow sampling, and counter sampling of the sFlow collector on the device.
• Configure the sFlow collector.
Configuring the sFlow agent and sFlow collector The sFlow feature enables the remote sFlow collector to monitor the network and analyze sFlow packet statistics.
Follow these steps to configure the sFlow agent and sFlow collector:
To do… Use the command… Remarks
Enter system view system-view —
Specify the IP address for the sFlow agent
sflow agent { ip ip-address | ipv6 ipv6-address }
Optional
Not specified by default. The device periodically checks the existence of the sFlow agent address. If the sFlow agent has no IP address configured, the device automatically selects an interface IP address for the sFlow agent but does not save the selected IP address.
NOTE: • H3C recommends configuring an IP address
manually for the sFlow agent. • Only one IP address can be specified for the
sFlow agent on the device.
Configure the sFlow collector
sflow collector collector-id { { ip ip-address | ipv6 ipv6-address } | datagram-size size | description text | port port-number | time-out seconds } *
Required
By default, the device presets a number of sFlow collectors.
Use the display sflow command to display the parameters of the preset sFlow collectors.
Specify the source IP address of sent sFlow packets
sflow source { ip ip-address | ipv6 ipv6-address } *
Optional
Not specified by default.
Configuring flow sampling Follow these steps to configure flow sampling:
To do… Use the command… Remarks
Enter system view system-view —

152
To do… Use the command… Remarks
Enter Layer 2 Ethernet interface view
interface interface-type interface-number —
Set the Flow sampling mode sflow sampling-mode { determine | random }
Optional
random by default.
Set the interval for flow sampling sflow sampling-rate interval Required
Not set by default.
Set the maximum copied length of a sampled packet sflow flow max-header length
Optional
By default, up to 128 bytes of a sampled packet can be copied. You are recommended to use the default value.
Specify the sFlow collector for flow sampling
sflow flow collector collector-id
Required
No collector is specified for flow sampling by default.
NOTE:
The switch does not support the flow sampling mode determine.
Configuring counter sampling Follow these steps to configure counter sampling:
To do… Use the command… Remarks
Enter system view system-view —
Enter Layer 2 interface view interface interface-type interface-number —
Set the interval for counter sampling sflow counter interval seconds
Required
Counter sampling is disabled by default.
Specify the sFlow collector for counter sampling
sflow counter collector collector-id
Required
No collector is specified for counter sampling by default.
Displaying and maintaining sFlow To do… Use the command… Remarks
Display sFlow configuration information display sflow [ slot slot-number ] [ | { begin | exclude | include } regular-expression ]
Available in any view
sFlow configuration example Network requirements
As shown in Figure 53, Host A is connected with Server through Device (sFlow agent).

153
Enable sFlow (including flow sampling and counter sampling) on GigabitEthernet 1/0/1 to monitor traffic on the port. The device sends sFlow packets through GigabitEthernet 1/0/3 to the sFlow collector, which analyzes the sFlow packets and displays results.
Figure 53 Network diagram
Configuration procedure
1. Configure the sFlow agent and sFlow collector
# Configure the IP address of vlan-interface 1 on Device as 3.3.3.1/16. <Device> system-view
[Device] interface vlan-interface 1
[Device-Vlan-interface1] ip address 3.3.3.1 16
[Device-Vlan-interface1] quit
# Specify the IP address for the sFlow agent. [Device] sflow agent ip 3.3.3.1
Source Address:
# Specify sFlow collector ID 2, IP address 3.3.3.2, the default port number, and description of netserver for the sFlow collector. [Device] sflow collector 2 ip 3.3.3.2 description netserver
2. Configure counter sampling
# Set the counter sampling interval to 120 seconds. [Device] interface gigabitethernet 1/0/1
[Device-GigabitEthernet1/0/1] sflow counter interval 120
# Specify sFlow collector 2 for counter sampling. [Device-GigabitEthernet1/0/1] sflow counter collector 2
3. Configure flow sampling
# Set the Flow sampling mode and sampling interval. [Device-GigabitEthernet1/0/1] sflow sampling-mode random
[Device-GigabitEthernet1/0/1] sflow sampling-rate 4000
# Specify sFlow collector 2 for flow sampling. [Device-GigabitEthernet1/0/1] sflow flow collector 2
# Display the sFlow configuration and operation information. [Device-GigabitEthernet1/0/1] display sflow
sFlow Version: 5
sFlow Global Information:

154
Agent IP:3.3.3.1
Collector Information:
ID IP Port Aging Size Description
1 6343 0 1400
2 3.3.3.2 6543 N/A 1400 netserver
3 6343 0 1400
4 6343 0 1400
5 6343 0 1400
6 6343 0 1400
7 6343 0 1400
8 6343 0 1400
9 6343 0 1400
10 6343 0 1400
sFlow Port Information:
Interface CID Interval(s) FID MaxHLen Rate Mode Status
GE1/0/1 2 120 2 128 4000 Random Active
The output shows that GigabitEthernet 1/0/1 enabled with sFlow is active, the counter sampling interval is 120 seconds, the Flow sampling interval is 4000, all of which indicate sFlow operates normally.
Troubleshooting sFlow configuration Symptom
The remote sFlow collector cannot receive sFlow packets.
Analysis
• The sFlow collector has no IP address specified.
• No interface is enabled with sFlow to sample data.
• The IP address of the sFlow collector specified on the sFlow agent is different from that of the remote sFlow collector.
• No IP address is configured for the Layer 3 interface on the device, or the IP address is configured, but the UDP packets with the IP address being the source cannot reach the sFlow collector.
• The physical link between the device and the sFlow collector fails.
Solution
1. Check whether sFlow is correctly configured by displaying sFlow configuration with the display sflow command.
2. Check whether the correct IP address is configured for the device to communicate with the sFlow collector.
3. Check whether the physical link between the device and the sFlow collector is normal.

155
IPC configuration
IPC overview Inter-Process Communication (IPC) is a reliable communication mechanism among processing units, typically CPUs. It is typically used on a distributed device or in an IRF fabric to provide reliable inter-card or inter-device transmission. The following are the basic IPC concepts.
Node An IPC node is an independent IPC-capable processing unit, typically, a CPU. Typically, distributed devices and IRF fabrics have multiple IPC nodes, because each card or device in them has at least one CPU.
Link An IPC link is a connection between any two IPC nodes. There is one and only one link for packet sending and receiving between any two nodes. All IPC nodes are fully connected.
IPC links are created when the system is initialized: When a node starts up, it sends handshake packets to other nodes. It the handshake succeeds, a connection is established.
The system uses link status to identify the link connectivity between two nodes. An IPC node can have multiple links, each having its own status.
Channel A channel is a communication interface used by an upper layer application module of a node to communicate with an application module of a peer node. Each node assigns a locally unique channel number to each upper layer application module to identify this module.
Data of an upper layer application module is sent to the IPC module through a channel, and the IPC module sends the data to a peer node through the link. The relationship between a node, link and channel is as shown in Figure 54.

156
Figure 54 Relationship between a node, link and channel
Link
Channel 1Cha
nnel
2
Packet sending modes IPC supports three packet sending modes: unicast, multicast (broadcast is considered as a special multicast), and mixcast, each having a queue. The upper layer application modules can select a packet sending mode as needed.
• Unicast: packet sending between two single nodes.
• Multicast: packet sending between a single node and multiple nodes. To use multicast mode, a multicast group needs to be created first. Multicasts will be sent to all the nodes in the multicast group. An application can create multiple multicast groups. The creation and deletion of a multicast group and multicast group members depend on the application module.
• Mixcast, namely, both unicast and multicast are supported.
Enabling IPC performance statistics When IPC performance statistics is enabled, the system collects statistics for packet sending and receiving of a node in a specified time range (for example, in the past 10 seconds, or in the past 1 minute). When IPC performance statistics is disabled, statistics collection is stopped. At this time, if you execute the display command, the system displays the statistics information at the time that IPC performance statistics was disabled.
Follow these steps to enable IPC performance statistics:
To do… Use the command… Remarks
Enable IPC performance statistics
ipc performance enable { node node-id | self-node } [ channel channel-id ]
Required
Disabled by default
Available in user view

157
Displaying and maintaining IPCTo do… Use the command… Remarks
Display IPC node information display ipc node [ | { begin | exclude | include } regular-expression ]
Display channel information of a node
display ipc channel { node node-id | self-node } [ | { begin | exclude | include } regular-expression ]
Display queue information of a node
display ipc queue { node node-id | self-node } [ | { begin | exclude | include } regular-expression ]
Display multicast group information of a node
display ipc multicast-group { node node-id | self-node } [ | { begin | exclude | include } regular-expression ]
Display packet information of a node
display ipc packet { node node-id | self-node } [ | { begin | exclude | include } regular-expression ]
Display link status information of a node
display ipc link { node node-id | self-node } [ | { begin | exclude | include } regular-expression ]
Display IPC performance statistics information of a node
display ipc performance { node node-id | self-node } [ channel channel-id ] [ | { begin | exclude | include } regular-expression ]
Available in any view
Clear IPC performance statistics information of a node
reset ipc performance [ node node-id | self-node ] [ channel channel-id ]
Available in user view

158
PoE configuration
PoE overview Power over Ethernet (PoE) enables a power sourcing equipment (PSE) to supply power to powered devices (PDs) from Ethernet interfaces through straight-through twisted pair cables.
Advantages • Reliable—Power is supplied in a centralized way so that it is very convenient to provide a backup
power supply.
• Easy to connect—A network terminal requires no external power supply but only an Ethernet cable.
• Standard—In compliance with IEEE 802.3af, and a globally uniform power interface is adopted.
• Promising—It can be applied to IP telephones, wireless LAN access points (APs), portable chargers, card readers, web cameras, and data collectors.
PoE concepts As shown in Figure 55, a PoE system comprises PoE power, PSE, power interface (PI), and PD.
1. PoE power—The whole PoE system is powered by the PoE power.
2. PSE—A PSE supplies power for PDs. A PSE can examine the Ethernet cables connected to PoE interfaces, search for PDs, classify them, and supply power to them. When detecting that a PD is unplugged, the PSE stops supplying power to the PD. A PSE can be built-in (Endpoint) or external (Midspan). A built-in PSE is integrated in the switch, and an external PSE is independent from the switch. The PSEs of the switch are built in.
NOTE:
The PSE ID is the switch member ID multiplies 3 and then plus 1. For example, if the member ID of the device is 3, the PSE ID of the device is 3 × 3 + 1 = 10.
3. PI—An Ethernet interface with the PoE capability is called PoE interface. Currently, a PoE interface can be an FE or GE interface.
4. PD—A PD accepts power from the PSE, including IP phones, wireless APs, chargers of portable devices, POS, and web cameras. The PD that is being powered by the PSE can be connected to another power supply unit for redundancy power backup.

159
Figure 55 PoE system diagram
Protocol specification The protocol specification related to PoE is IEEE 802.3af.
PoE configuration task list You can configure a PoE interface by using either of the following methods:
• At the command line interface (CLI).
• Through configuring the PoE profile and applying the PoE profile to the PoE interface.
To configure a single PoE interface, configure it at the CLI. To configure PoE interfaces in batches, use the PoE profile. For a PoE configuration parameter of a PoE interface, you can only select one mode (including modification and removal of a PoE interface).
Complete these tasks to configure PoE:
Task Remarks
Enabling PoE for a PoE interface Required
Enabling the PSE to detect nonstandard PDs Optional Detecting PDs
Configuring a PD disconnection detection mode Optional
Configuring the maximum PoE interface power Optional
Configuring PoE interface power management Optional
Configuring PSE power monitoring Optional
Optional Configuring the PoE monitoring function Monitoring PD
Optional
The device automatically monitors PDs when supplying power to them, so no configuration is required.
Configuring PoE profile Optional Configuring PoE interface through PoE profile Applying PoE profile Optional
Upgrading PSE processing software in service Optional

160
CAUTION:
• Before configuring PoE, make sure that the PoE power supply and PSE are operating properly. Otherwise, you cannot configure PoE or the configured PoE function does not take effect.
• Turning off the PoE power supply during the startup of the device might cause the PoE configuration inthe PoE profile to be invalid.
Enabling PoE for a PoE interface The system does not supply power to or reserve power for the PDs connected to a PoE interface if the PoE interface is not enabled with the PoE function.
You are allowed to enable PoE for a PoE interface if the PoE interface will not result in PoE power overload. Otherwise, whether you can enable PoE for the PoE interface depends on whether the PoE interface is enabled with the PoE power management function (for the detailed description of the PoE interface power management function, see “Configuring PoE interface power management.”)
• If the PoE interface is not enabled with the PoE power management function, you are not allowed to enable PoE for the PoE interface.
• If the PoE interface is enabled with the PoE power management function, you are allowed to enable PoE for the PoE interface (Whether the PDs can be powered depends on other factors, for example, the power supply priority of the PoE interface.)
The PSE supplies power for a PoE interface in the following modes:
• Over signal wires—the PSE uses the pairs (1, 2, 3, 6) for transmitting data in category 3/5 twisted pair cables to supply DC power while transmitting data to PDs.
• Over spare wires—the PSE uses the pairs (4, 5, 7, 8) not transmitting data in category 3/5 twisted pair cables to supply DC power to PDs.
NOTE:
• When the sum of the power consumption of all powered PoE interfaces on a PSE exceeds the maximumpower of the PSE, the system considers the PSE to be overloaded. The maximum PSE power is decidedby the user configuration.
• A PSE can supply power to a PD only when the selected power supply mode is supported by both the PSE and PD. If the PSE and PD support different power supply modes (for example, the PSE does not support power over spare wires, while the PD supports power over spare wires), you have to change theorder of the lines in the twisted pair cable to supply power to the PD.
• The PoE interface of the switch supports only power supply over signal wires to PDs.
Follow these steps to enable PoE for a PoE interface:
To do… Use the command… Remarks
Enter system view system-view —
Enter PoE interface view interface interface-type interface-number —
Enable PoE for the PoE interface poe enable Required
Disabled by default.

161
To do… Use the command… Remarks
Configure a description for the PD connected to the PoE interface poe pd-description text
Optional
By default, no description for the PD connected to the PoE interface is available.
Detecting PDs
Enabling the PSE to detect nonstandard PDs There are standard PDs and nonstandard PDs. Usually, the PSE can detect only standard PDs and supply power to them. The PSE can detect nonstandard PDs and supply power to them only after the PSE is enabled to detect nonstandard PDs.
Follow these steps to enable the PSE to detect nonstandard PDs:
To do… Use the command… Remarks
Enter system view system-view —
Enable the PSE to detect nonstandard PDs poe legacy enable pse pse-id
Required
By default, the PSE can detect standard PDs rather than non standard PDs.
Configuring a PD disconnection detection mode To detect the PD connection with PSE, PoE provides two detection modes: AC detection and DC detection. The AC detection mode is energy saving relative to the DC detection mode.
Follow these steps to configure a PD disconnection detection mode:
To do… Use the command… Remarks
Enter system view system-view —
Configure a PD disconnection detection mode poe disconnect { ac | dc }
Optional
The default PD disconnection detection mode varies with devices.
CAUTION:
If you change the PD disconnection detection mode when the device is running, the connected PDs will bepowered off. Therefore, be cautious to do so
Configuring the maximum PoE interface power The maximum PoE interface power is the maximum power that the PoE interface can provide to the connected PD. If the power required by the PD is larger than the maximum PoE interface power, the PoE interface will not supply power to the PD.

162
NOTE:
For the S5120-52C-PWR-EI switches, the total PoE power supplied by Ethernet ports numbered 25 through 48 is 370 W, and that supplied by Ethernet ports number 25 through 48 is 370 W.
Follow these steps to configure the maximum PSE power:
To do… Use the command… Remarks
Enter system view system-view —
Enter PoE interface view interface interface-type interface-number —
Configure the maximum power for the PoE interface poe max-power max-power
Optional • 15400 milliwatts for PoE
switches by default. • 30000 milliwatts for PoE+
switches by default.
Configuring PoE interface power management The power supply priority of a PD depends on the priority of the PoE interface. The priority levels of PoE interfaces are critical, high and low in descending order. Power supply to a PD is subject to PoE interface power management policies.
All PSEs implement the same PoE interface power management policies. When a PSE supplies power to a PD, the following actions occur:
• If the PoE interface power management is not enabled, no power will be supplied to a new PD when the PSE power is overloaded.
• If the PoE interface power management priority policy is enabled, the PD with a lower priority is first powered off to guarantee the power supply to the PD with a higher priority when the PSE power is overloaded.
NOTE:
• 19 watts guard band is reserved for each PoE interface on the device to prevent a PD from being powered off because of a sudden increase of the PD power. When the remaining power of the PSE where the PoE interface resides is lower than 19 watts and no priority is configured for the PoE interface,the PSE does not supply power to the new PD; when the remaining power of the PSE where the PoE interface resides is lower than 19 watts, but priority is configured for the PoE interface, the interface witha higher priority can preempt the power of the interface with a lower priority to ensure the normal working of the higher priority interface.
• If the sudden increase of the PD power results in PSE power overload, power supply to the PD on the PoEinterface with a lower priority will be stopped to ensure the power supply to the PD with a higher priority.
If the guaranteed remaining PSE power (the maximum PSE power minus the power allocated to the critical PoE interface, regardless of whether PoE is enabled for the PoE interface) is lower than the maximum power of the PoE interface, you will fail to set the priority of the PoE interface to critical. Otherwise, you can succeed in setting the priority to critical, and this PoE interface will preempt the power of other PoE interfaces with a lower priority level. In the latter case, the PoE interfaces whose power is preempted will be powered off, but their configurations will remain unchanged. When you

163
change the priority of a PoE interface from critical to a lower level, the PDs connecting to other PoE interfaces will have an opportunity to be powered.
Configuration prerequisites
Enable PoE for PoE interfaces.
Configuration procedure
Follow these steps to configure PoE interface power management:
To do… Use the command… Remarks
Enter system view system-view —
Configure PoE interface power management priority policy poe pd-policy priority
Required
Not configured by default.
Enter PoE interface view interface interface-type interface-number —
Configure the power supply priority for a PoE interface poe priority { critical | high | low }
Optional
low by default.
Configuring the PoE monitoring function With the PoE monitoring function enabled, the system monitors the parameter values related to PoE power supply, PSE, PD, and device temperature in real time. When a specific value exceeds the limited range, the system automatically takes some measures to protect itself.
Configuring PSE power monitoring When the PSE power exceeds or drops below the specified threshold, the system sends trap messages.
Follow these steps to configure a power alarm threshold for the PSE:
To do… Use the command… Remarks
Enter system view system-view —
Configure a power alarm threshold for the PSE
poe utilization-threshold utilization-threshold-value pse pse-id
Optional
80% by default.
Monitoring PD When a PSE starts or ends power supply to a PD, the system sends a trap message.
Configuring PoE interface through PoE profile You can configure a PoE interface either at the CLI or by using a PoE profile and applying the PoE profile to the specified PoE interfaces.
To configure a single PoE interface, configure it at the CLI. To configure PoE interfaces in batches, use a PoE profile.
A PoE profile is a collection of configurations that contain multiple PoE features. On large-scale networks, you can apply a PoE profile to multiple PoE interfaces so that these interfaces have the same PoE features.

164
If the PoE interface connecting to a PD changes to another one, apply the PoE profile applied on the originally connected interface to the currently connected interface instead of reconfiguring the features defined in the PoE profile one by one. This simplifies the PoE configurations.
The device supports multiple PoE profiles and the maximum number of profiles that can be created depends on the switch model. You can define PoE configurations based on each PD, save the configurations for different PDs into different PoE profiles, and apply the PoE profiles to the access interfaces of PDs accordingly.
Configuring PoE profile Follow these steps to configure a PoE profile:
To do… Use the command… Remarks
Enter system view system-view —
Create a PoE profile, and enter PoE profile view poe-profile profile-name [ index ] Required
Enable PoE for the PoE interface poe enable Required
Disabled by default.
Configure the maximum power for the PoE interface poe max-power max-power
Optional • 15400 milliwatts for PoE
switches by default. • 30000 milliwatts for PoE+
switches by default.
Configure power supply priority for the PoE interface poe priority { critical | high | low }
Optional
low by default.
CAUTION:
• If a PoE profile is applied, it cannot be deleted or modified before you cancel its application.
• The poe max-power max-power and poe priority { critical | high | low } commands must be configured in only one way, that is, either at the CLI or by configuring PoE profile.
• A PoE parameter on a PoE interface must be configured, modified, and deleted in only one way. If a parameter configured in one way (for example, at the CLI) is then configured in the other way (for example, through PoE profile), the latter configuration fails, and the original one is still effective. To makethe latter configuration effective, you must cancel the original one first.
Applying PoE profile You can apply a PoE profile in either system view or interface view. If you perform application to a PoE interface in both views, the latter application takes effect. To apply a PoE profile to multiple PoE interfaces, the system view is more efficient.
Follow these steps to apply the PoE profile in system view:
To do… Use the command… Remarks
Enter system view system-view —
Apply the PoE profile to one or multiple PoE interfaces
apply poe-profile { index index | name profile-name } interface interface-range
Required

165
Follow these steps to apply the PoE profile in interface view:
To do… Use the command… Remarks
Enter system view system-view —
Enter PoE interface view interface interface-type interface-number —
Apply the PoE profile to the current PoE interface
apply poe-profile { index index | name profile-name } Required
CAUTION:
A PoE profile can be applied to multiple PoE interfaces, while a PoE interface can be applied with only onePoE profile.
Upgrading PSE processing software in service You can upgrade the PSE processing software in service in either of the following modes:
• Refresh mode—Enables you to update the PSE processing software without deleting it. You can upgrade the PSE processing software in the refresh mode through the command line.
• Full mode—Deletes the PSE processing software and reloads it. If the PSE processing software is damaged (you cannot execute any of the PoE commands successfully), you can upgrade the PSE processing software in full mode to restore the PSE function.
An in-service PSE processing software upgrade may be unexpectedly interrupted (for example, an error results in device reboot). If you fail to upgrade the PSE processing software in full mode after reboot, you can power off the device and restart it before upgrading it in full mode again. After upgrade, restart the device manually to make the new PSE processing software take effect.
CAUTION:
Do not use the PSE processing software for a PoE switch on a PoE+ switch, and vice versa. Otherwise, thePoE function may not operate properly after the PSE processing software is upgraded.
Follow these steps to upgrade the PSE processing software in service:
To do… Use the command… Remarks
Enter system view system-view —
Upgrade the PSE processing software in service
poe update { full | refresh } filename pse pse-id Required
Displaying and maintaining PoE To do… Use the command… Remarks
Display PSE information display poe device [ | { begin | exclude | include } regular-expression ]
Available in any view

166
To do… Use the command… Remarks
Display the power supplying state of the specified PoE interface
display poe interface [ interface-type interface-number ] [ | { begin | exclude | include } regular-expression ]
Available in any view
Display power information for PoE interfaces
display poe interface power [ interface-type interface-number ] [ | { begin | exclude | include } regular-expression ]
Available in any view
Display information about PSE display poe pse [ pse-id ] [ | { begin | exclude | include } regular-expression ]
Available in any view
Display the power supply states of all PoE interfaces connected to the PSE
display poe pse pse-id interface [ | { begin | exclude | include } regular-expression ]
Available in any view
Display power information for all PoE interfaces connected to the PSE
display poe pse pse-id interface power [ | { begin | exclude | include } regular-expression ]
Available in any view
Display the configurations and applications of the PoE profile
display poe-profile [ index index | name profile-name ] [ | { begin | exclude | include } regular-expression ]
Available in any view
Display the configurations and applications of the PoE profile applied to the specified PoE interface
display poe-profile interface interface-type interface-number [ | { begin | exclude | include } regular-expression ]
Available in any view
PoE configuration example Network requirements
As shown in Figure 56, the device supplies power to PDs through its PoE interfaces.
• GigabitEthernet 1/0/1, GigabitEthernet 1/0/2, and GigabitEthernet 1/0/3 are connected to IP telephones.
• GigabitEthernet 1/0/11 and GigabitEthernet 1/0/12 are connected to APs.
• The power supply priority of IP telephones is higher than that of the APs, for which the PSE supplies power to IP telephones first when the PSE power is overloaded.
• The maximum power of AP 2 connected to GigabitEthernet 1/0/12 does not exceed 9000 milliwatts.

167
Figure 56 Network diagram
GE1/0/12
GE1
/0/3
Configuration procedure
# Enable PoE on GigabitEthernet 1/0/1, GigabitEthernet 1/0/2, and GigabitEthernet 1/0/3, and configure their power supply priority as critical. <Sysname> system-view
[Sysname] interface GigabitEthernet 1/0/1
[Sysname-GigabitEthernet1/0/1] poe enable
[Sysname-GigabitEthernet1/0/1] poe priority critical
[Sysname-GigabitEthernet1/0/1] quit
[Sysname] interface GigabitEthernet 1/0/2
[Sysname-GigabitEthernet1/0/2] poe enable
[Sysname-GigabitEthernet1/0/2] poe priority critical
[Sysname-GigabitEthernet1/0/2] quit
[Sysname] interface GigabitEthernet 1/0/3
[Sysname-GigabitEthernet1/0/3] poe enable
[Sysname-GigabitEthernet1/0/3] poe priority critical
[Sysname-GigabitEthernet1/0/3] quit
# Enable PoE on GigabitEthernet 1/0/11 and GigabitEthernet 1/0/12, and configure the maximum power of GigabitEthernet 1/0/12 as 9000 milliwatts. [Sysname] interface GigabitEthernet 1/0/11
[Sysname-GigabitEthernet1/0/11] poe enable
[Sysname-GigabitEthernet1/0/11] quit
[Sysname] interface GigabitEthernet 1/0/12
[Sysname-GigabitEthernet1/0/12] poe enable
[Sysname-GigabitEthernet1/0/12] poe max-power 9000
Configuration verification
After the configuration takes effect, the IP telephones and AP devices are powered and can work normally.
Troubleshooting PoE Symptom 1: Setting the priority of a PoE interface to critical fails.
Analysis:
• The guaranteed remaining power of the PSE is lower than the maximum power of the PoE interface.
• The priority of the PoE interface is already set.

168
Solution:
• In the first case, you can solve the problem by increasing the maximum PSE power, or by reducing the maximum power of the PoE interface when the guaranteed remaining power of the PSE cannot be modified.
• In the second case, you should first remove the priority already configured.
Symptom 2: Applying a PoE profile to a PoE interface fails.
Analysis:
• Some configurations in the PoE profile are already configured.
• Some configurations in the PoE profile do not meet the configuration requirements of the PoE interface.
• Another PoE profile is already applied to the PoE interface.
Solution:
• In the first case, you can solve the problem by removing the original configurations of those configurations.
• In the second case, you need to modify some configurations in the PoE profile.
• In the third case, you need to remove the application of the undesired PoE profile to the PoE interface.
Symptom 3: Provided that parameters are valid, configuring an AC input under-voltage threshold fails.
Analysis:
The AC input under-voltage threshold is greater than or equal to the AC input over-voltage threshold.
Solution:
You can drop the AC input under-voltage threshold below the AC input over-voltage threshold.

169
Cluster management configuration
Cluster management overview
Why cluster management Cluster management is an effective way to manage large numbers of dispersed network switches in groups. Cluster management offers the following advantages:
• Saves public IP address resources. You do not have to assign one public IP address for every cluster member switch.
• Simplifies configuration and management tasks. By configuring a public IP address on one switch, you can configure and manage a group of switches without the trouble of logging in to each switch separately.
• Provides a useful topology discovery and display function for network monitoring and debugging.
• Allows simultaneous software upgrading and parameter configuration on multiple switches, free from topology and distance limitations.
Roles in a cluster The switches in a cluster play different roles according to their different functions and status. You can specify the following three roles for the switches:
• Management switch (Administrator)—Providing management interfaces for all switches in a cluster and the only switch configured with a public IP address. You can specify one and only one management switch for a cluster. Any configuration, management, and monitoring of the other switches in a cluster can only be implemented through the management switch. When a switch is specified as the management switch, it collects related information to discover and define candidate switches.
• Member switch (Member)—A switch managed by the management switch in a cluster.
• Candidate switch (Candidate)—A switch that does not yet belong to any cluster but can be added to a cluster. Different from a member switch, its topology information has been collected by the management switch but it has not been added to the cluster.

170
Figure 57 Network diagram
As shown in Figure 57, the switch configured with a public IP address and performing the management function is the management switch, the other managed switches are member switches, and the switch that does not belong to any cluster but can be added to a cluster is a candidate switch. The management switch and the member switches form the cluster.
Figure 58 Role change in a cluster
As shown in Figure 58, a switch in a cluster changes its role according to the following rules:
• A candidate switch becomes a management switch when you create a cluster on it. A management switch becomes a candidate switch only after the cluster is removed.
• A candidate switch becomes a member switch after being added to a cluster. A member switch becomes a candidate switch after it is removed from the cluster.
How a cluster works Cluster management is implemented through HW Group Management Protocol version 2 (HGMPv2), which consists of the following three protocols:
• Neighbor Discovery Protocol (NDP)
• Neighbor Topology Discovery Protocol (NTDP)
• Cluster
A cluster configures and manages the switches in it through the above three protocols. Cluster management involves topology information collection and the establishment and maintenance of a cluster. Topology information collection and cluster maintenance are independent from each other; in fact, topology information collection starts before the cluster is created. The following workflow applies:
• All switches use NDP to collect the information of directly connected neighbors, including their software version, host name, MAC address and port number.
• The management switch uses NTDP to do the following:
Collect the information of the switches within user-specified hops.
Collect the topology information of all switches.

171
Specifies the candidate switches of the cluster based on the collected information.
• The management switch adds or deletes a member switch and modifies cluster management configuration according to the candidate switch information collected through NTDP.
Introduction to NDP
NDP is used to discover the information about directly connected neighbors, including the switch name, software version, and connecting port of the adjacent switches. NDP works in the following ways:
• A switch running NDP periodically sends NDP packets to its neighbors. An NDP packet carries NDP information (including the switch name, software version, and connecting port, etc.) and the holdtime, which is how long the receiving switches will keep the NDP information. At the same time, the switch also receives (but does not forward) NDP packets from its neighbors.
• A switch running NDP stores and maintains an NDP table. The switch creates an entry in the NDP table for each neighbor. If a new neighbor is found, meaning the switch receives an NDP packet sent by the neighbor for the first time, the switch adds an entry in the NDP table. If the NDP information carried in the NDP packet is different from the stored information, the corresponding entry and holdtime in the NDP table are updated; otherwise, only the holdtime of the entry is updated. If an entry’s holdtime expires (in other words, no NDP information from the neighbor is received to restart the hold time before it ages out), the entry is removed from the NDP table.
NDP runs on the data link layer, and therefore supports different network layer protocols.
Introduction to NTDP
NTDP provides information required for cluster management; it collects topology information about the switches within the specified hop count. Based on the neighbor information stored in the neighbor table maintained by NDP, NTDP on the management switch advertises NTDP topology-collection requests to collect the NDP information of all the switches in a specific network range as well as the connection information of all its neighbors. The information collected will be used by the management switch or the network management software to implement required functions.
When a member switch detects a change on its neighbors through its NDP table, it informs the management switch through handshake packets. Then the management switch triggers its NTDP to collect specific topology information, so that its NTDP can discover topology changes promptly.
The management switch collects topology information periodically. You can also administratively launch a topology information collection. The process of topology information collection is as follows:
• The management switch periodically sends NTDP topology-collection request from the NTDP-enabled ports.
• Upon receiving the request, the switch sends NTDP topology-collection response to the management switch, copies this response packet on the NTDP-enabled port and sends it to the adjacent switch. Topology-collection response includes the basic information of the NDP-enabled switch and NDP information of all adjacent switches.
• The adjacent switch performs the same operation until the NTDP topology-collection request is sent to all the switches within specified hops.
When the NTDP topology-collection request is advertised in the network, large numbers of network switches receive the NTDP topology-collection request and send NTDP topology-collection response at the same time. This can cause congestion and may be a problem to the management switch. You can configure the following delays to control the speed of the NTDP topology collection request advertisement:
• Instead of immediately forwarding an NTDP topology collection request when it is received, each switch waits for a period of time. At the end of the specified delay, it forwards the NTDP topology

172
collection request on the first NTDP-enabled port.
• Except for its first port, each of a switch’s NTDP-enabled ports wait for a period of time, and then forward the NTDP topology collection request after the previous port forwards it.
Cluster management maintenance
1. Adding a candidate switch to a cluster
You should specify the management switch before creating a cluster. The management switch discovers and defines a candidate switch through NDP and NTDP protocols. The candidate switch can be automatically or manually added to the cluster.
After the candidate switch is added to the cluster, it can obtain the member number assigned by the management switch and the private IP address used for cluster management.
2. Communication within a cluster
In a cluster the management switch communicates with its member switches by sending handshake packets to maintain connection between them. The management/member switch state change is shown in Figure 59.
Figure 59 Management/member switch state change
Rece
ives
the
hand
shak
e
or m
anag
emen
t pac
kets
Fails
to re
ceive
han
dsha
ke p
acke
ts
in th
ree
cons
ecut
ive in
terv
als
State holdtime exceedsthe specified value
Disconnect state is recovered
Active
DisconnectConnect
• After a cluster is created and a candidate switch is added to the cluster and becomes a member switch, the management switch saves the state information of the member switch and identifies it as Active. And the member switch also saves its state information and identifies itself as Active.
• After a cluster is created, its management switch and member switches begin to send handshake packets. Upon receiving the handshake packets from the other, the management switch or a member switch simply remains its state as Active, without sending a response.
• If the management switch does not receive the handshake packets from a member switch in an interval three times of the interval to send handshake packets, it changes the status of the member switch from Active to Connect. Likewise, if a member switch fails to receive the handshake packets from the management switch in an interval three times of the interval to send handshake packets, the status of itself will also be changed from Active to Connect.
• During information holdtime, if the management switch receives handshake or management packets from a member switch that is in Connect state, it changes the state of the member switch to Active. Otherwise, it considers the member switch to be disconnected, and changes the state of the member switch to Disconnect.
• During information holdtime, if a member switch in Connect state changes its state to Active if it

173
receives handshake or management packets from the management switch; otherwise, it changes its state to Disconnect.
• If communication between the management switch and a member switch is recovered, the member switch which is in Disconnect state will be added to the cluster, and the state of the member switch locally and on the management switch will be changed to Active.
• Also, a member switch sends handshake packets to inform the management switch when there is a neighbor topology change.
Management VLAN
The management VLAN is a VLAN used for communication in a cluster; it limits the cluster management range. Through configuration of the management VLAN, the following functions can be implemented:
• Management packets (including NDP, NTDP and handshake packets) are restricted within the management VLAN. This isolates them from other packets, which enhances security.
• The management switch and the member switches communicate with each other through the management VLAN.
For a cluster to work normally, you must set the packets from the management VLAN to pass the ports connecting the management switch and the member/candidate switches (including the cascade ports). Therefore:
• If the packets from the management VLAN cannot pass a port, the switch connected with the port cannot be added to the cluster. Therefore, if the ports (including the cascade ports) connecting the management switch and the member/candidate switches prohibit the packets from the management VLAN, you can set the packets from the management VLAN to pass the ports on candidate switches with the management VLAN auto-negotiation function.
• Normally, only the packets with tags from the management VLAN can pass the ports. However, you can set packets without tags from the management VLAN to pass the ports if the default VLAN ID of the cascade ports and of the ports connecting the management switch and the member/candidate switches is the same as that of the management VLAN.
NOTE:
• If a candidate switch is connected to a management switch through another candidate switch, the portsbetween the two candidate switches are cascade ports.
• For more information about VLAN, see Layer 2—LAN Switching Configuration Guide.
Cluster management configuration task list Before configuring a cluster, you need to determine the roles and functions the switches play. You also need to configure the related functions, preparing for the communication between switches within the cluster.

174
Complete these tasks to configure cluster management functions:
Task Remarks
Enabling NDP globally and for specific ports Optional
Configuring NDP parameters Optional
Enabling NTDP globally and for specific ports Optional
Configuring NTDP parameters Optional
Manually collecting topology information Optional
Enabling the cluster function Optional
Establishing a cluster Required
Enabling management VLAN auto-negotiation Required
Configuring communication between the management switch and the member switches within a cluster Optional
Configuring cluster management protocol packets Optional
Configuring the management switch
Cluster member management Optional
Enabling NDP Optional
Enabling NTDP Optional
Manually collecting topology information Optional
Enabling the cluster function Optional
Configuring the member switches
Deleting a member switch from a cluster Optional
Configuring access between the management switch and its member switches Optional
Adding a candidate switch to a cluster Optional
Configuring topology management Optional
Configuring interaction for a cluster Optional
SNMP configuration synchronization function Optional
Configuring advanced cluster management functions
Configuring web user accounts in batches Optional
CAUTION:
• Disabling the NDP and NTDP functions on the management switch and member switches after a clusteris created will not cause the cluster to be dismissed, but will influence the normal operation of the cluster.
• In a cluster, if a member switch enabled with the 802.1X or MAC address authentication function has other member switches connected to it, you must enable HW Authentication Bypass Protocol (HABP) server on the switch. Otherwise, the management switch of the cluster cannot manage the switches connected with it. For more information about the HABP, see Security Configuration Guide.
• If the routing table of the management switch is full when a cluster is established, that is, entries with thedestination address as a candidate switch cannot be added to the routing table, all candidate switcheswill be added to and removed from the cluster repeatedly.
• If the routing table of a candidate switch is full when the candidate switch is added to a cluster, that is,the entry with the destination address as the management switch cannot be added to the routing table,the candidate switch will be added to and removed from the cluster repeatedly.

175
Configuring the management switch
Enabling NDP globally and for specific ports For NDP to work normally, you must enable NTDP both globally and on specific ports.
Follow these steps to enable NDP globally and for specific ports:
To do… Use the command… Remarks
Enter system view system-view —
Enable NDP globally ndp enable Optional
Enabled by default.
In system view ndp enable interfaceinterface-list
interface interface-type interface-number
Enable the NDP feature for the port(s)
In Ethernet interface view or Layer 2 aggregate interface view ndp enable
Use either command
By default, NDP is enabled globally and also on all ports.
NOTE:
H3C recommends that you disable NDP on a port which connects with the switches that do not need to jointhe cluster. This prevents the management switch from adding and collecting topology information from switches which do not need to joint the cluster.
Configuring NDP parameters A port enabled with NDP periodically sends NDP packets to its neighbors. If no NDP information from the neighbor is received to reset the holdtime, the holdtime times out and the switch removes the corresponding entry from the NDP table.
Follow these steps to configure NDP parameters:
To do… Use the command… Remarks
Enter system view system-view —
Configure the interval for sending NDP packets ndp timer hello hello-time
Optional
60 seconds by default.
Configure the period for the receiving switch to keep the NDP packets ndp timer aging aging-time
Optional
180 seconds by default.
CAUTION:
The time for the receiving switch to hold NDP packets cannot be shorter than the interval for sending NDPpackets; otherwise, the NDP table may become instable.
Enabling NTDP globally and for specific ports For NTDP to work normally, you must enable NTDP both globally and on specific ports.
Follow these steps to enable NTDP globally and for specific ports:

176
To do… Use the command… Remarks
Enter system view system-view —
Enable NTDP globally ntdp enable Optional
Enabled by default
Enter Ethernet interface view or Layer 2 aggregate interface view
interface interface-type interface-number —
Enable NTDP for the port ntdp enable Optional
NTDP is enabled on all ports by default.
NOTE:
HP recommends that you disable NTDP on a port which connects with the switches that do not need to jointhe cluster. This prevents the management switch from adding and collecting topology information from switches which do not need to join the cluster.
Configuring NTDP parameters By configuring the maximum hops for collecting topology information, you can get topology information of the switches in a specified range, thus avoiding unlimited topology collection.
After the interval for collecting topology information is configured, the switch collects the topology information at this interval.
To avoid network congestion caused by large amounts of topology responses received in short periods:
• Upon receiving an NTDP topology-collection request, a switch does not forward it immediately. Instead, it waits for a period of time and then forwards the NTDP topology-collection request on its first NTDP-enabled port.
• Except for its first port, each switch’s NTDP-enabled ports wait for a period of time, and then forward the NTDP topology collection request after the previous port forwards it.
Follow these steps to configure NTDP parameters:
To do… Use the command… Remarks
Enter system view system-view —
Configure the maximum hops for topology collection ntdp hop hop-value
Optional
3 by default.
Configure the interval to collect topology information ntdp timer interval
Optional
1 minute by default.
Configure the delay to forward topology-collection request packets on the first port
ntdp timer hop-delay delay-time Optional
200 ms by default.
Configure the port delay to forward topology-collection request on other ports ntdp timer port-delay delay-time
Optional
20 ms by default.
NOTE:
The two delay values should be configured on the topology collecting switch. A topology-collection request sent by the topology collecting switch carries the two delay values, and a switch that receives therequest forwards the request according to the delays.
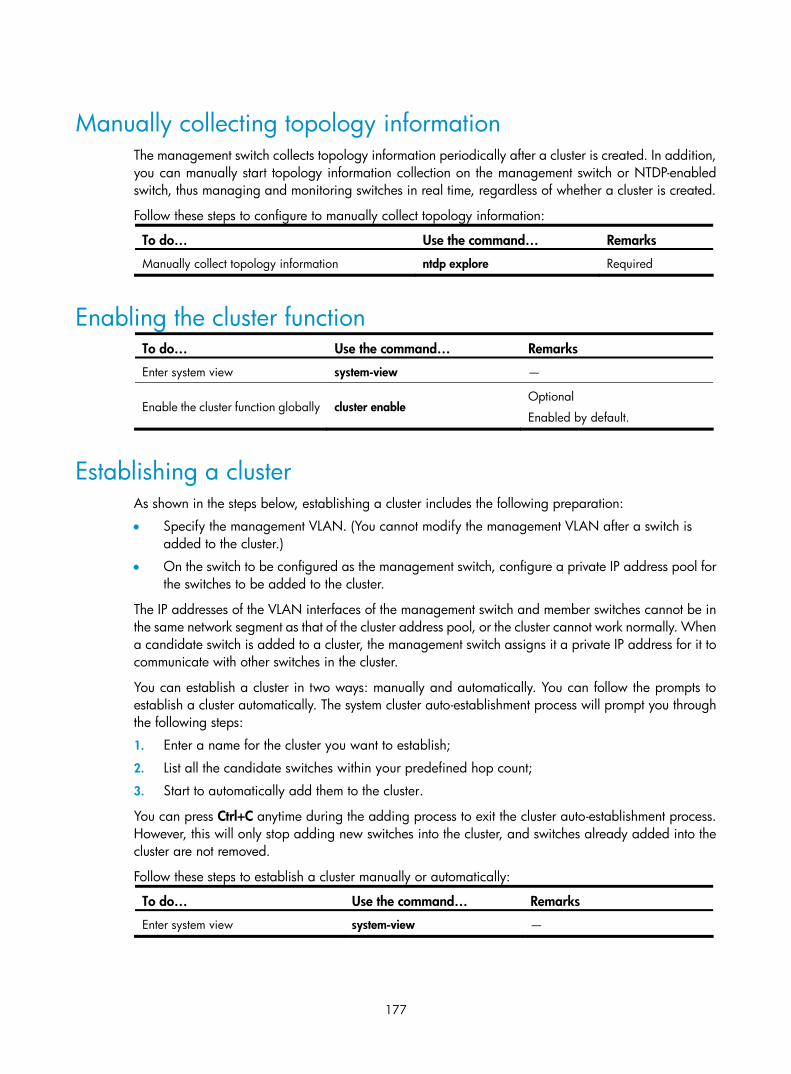
177
Manually collecting topology information The management switch collects topology information periodically after a cluster is created. In addition, you can manually start topology information collection on the management switch or NTDP-enabled switch, thus managing and monitoring switches in real time, regardless of whether a cluster is created.
Follow these steps to configure to manually collect topology information:
To do… Use the command… Remarks
Manually collect topology information ntdp explore Required
Enabling the cluster function To do… Use the command… Remarks
Enter system view system-view —
Enable the cluster function globally cluster enable Optional
Enabled by default.
Establishing a cluster As shown in the steps below, establishing a cluster includes the following preparation:
• Specify the management VLAN. (You cannot modify the management VLAN after a switch is added to the cluster.)
• On the switch to be configured as the management switch, configure a private IP address pool for the switches to be added to the cluster.
The IP addresses of the VLAN interfaces of the management switch and member switches cannot be in the same network segment as that of the cluster address pool, or the cluster cannot work normally. When a candidate switch is added to a cluster, the management switch assigns it a private IP address for it to communicate with other switches in the cluster.
You can establish a cluster in two ways: manually and automatically. You can follow the prompts to establish a cluster automatically. The system cluster auto-establishment process will prompt you through the following steps:
1. Enter a name for the cluster you want to establish;
2. List all the candidate switches within your predefined hop count;
3. Start to automatically add them to the cluster.
You can press Ctrl+C anytime during the adding process to exit the cluster auto-establishment process. However, this will only stop adding new switches into the cluster, and switches already added into the cluster are not removed.
Follow these steps to establish a cluster manually or automatically:
To do… Use the command… Remarks
Enter system view system-view —

178
To do… Use the command… Remarks
Specify the management VLAN management-vlan vlan-id Optional
By default, VLAN 1 is the management VLAN.
Enter cluster view cluster —
Configure the private IP address range for member switches
ip-pool ip-address { mask | mask-length }
Required
Not configured by default.
Manually establish a cluster build cluster-name
Establish a cluster Automatically
establish a cluster auto-build [ recover ]
Required
Use either approach
By default, the switch is not the management switch.
CAUTION:
Handshake packets use UDP port 40000. For a cluster to be established successfully, make sure that the port is not in use before establishing it.
Enabling management VLAN auto-negotiation The management VLAN limits the cluster management range. If the switch discovered by the management switch does not belong to the management VLAN, meaning the cascade ports and the ports connecting with the management switch do not allow the packets from the management VLAN to pass, and the new switch cannot be added to the cluster. Through the configuration of the management VLAN auto-negotiation function, the cascade ports and the ports directly connected to the management switch can be automatically added to the management VLAN.
NOTE:
When the management VLAN auto-negotiation is enabled, the ports connecting member switches automatically change to hybrid ports, and permit the packets of the management VLAN to pass throughtagged.
• If a port was an access or a trunk port, after changed to a hybrid port, the port does not permit the packets of any other VLAN except the management VLAN to pass through.
• If a port was a hybrid port, the link type change process does not affect the permitted VLANs. The onlychange is that the packets of the management VLAN are permitted to pass through tagged.
Before enabling this function, check the link types of ports connecting member switches and the VLANs whose packets are permitted to pass through to avoid influence to your network due to link type change ofports.
Follow these steps to configure management VLAN auto-negotiation:
To do… Use the command… Remarks
Enter system view system-view —
Enter cluster view cluster —
Enable management VLAN auto-negotiation
management-vlan synchronization enable
Required
Disabled by default.

179
Configuring communication between the management switch and the member switches within a cluster
In a cluster, the management switch and member switches communicate by sending handshake packets to maintain connection between them. You can configure interval of sending handshake packets and the holdtime of a switch on the management switch. This configuration applies to all member switches within the cluster. For a member switch in Connect state:
• If the management switch does not receive handshake packets from a member switch within the holdtime, it changes the state of the member switch to Disconnect. When the communication is recovered, the member switch needs to be re-added to the cluster (this process is automatically performed).
• If the management switch receives handshake packets from the member switch within the holdtime, the state of the member switch remains Active and the holdtime is restarted.
Follow these steps to configure communication between the management switch and the member switches within a cluster:
To do… Use the command… Remarks
Enter system view system-view —
Enter cluster view cluster —
Configure the interval to send handshake packets timer interval
Optional
10 seconds by default
Configure the holdtime of a switch holdtime hold-time Optional
60 seconds by default
Configuring cluster management protocol packets By default, the destination MAC address of cluster management protocol packets (including NDP, NTDP and HABP packets) is a multicast MAC address 0180-C200-000A, which IEEE reserved for later use. Since some switches cannot forward the multicast packets with the destination MAC address of 0180-C200-000A, so cluster management packets cannot traverse these switches. For a cluster to work normally in this case, you can modify the destination MAC address of a cluster management protocol packet without changing the current networking.
The management switch periodically sends MAC address negotiation broadcast packets to advertise the destination MAC address of the cluster management protocol packets.
Follow these steps to configure the destination MAC address of the cluster management protocol packets:
To do… Use the command… Remarks
Enter system view system-view —
Enter cluster view cluster —

180
To do… Use the command… Remarks
Configure the destination MAC address for cluster management protocol packets
cluster-mac mac-address
Required
The destination MAC address is 0180-C200-000A by default.
The following are the configurable MAC addresses: • 0180-C200-0000 • 0180-C200-000A • 0180-C200-0020 through
0180-C200-002F • 010F-E200-0002
Configure the interval to send MAC address negotiation broadcast packets
cluster-mac syn-interval interval
Optional
One minute by default.
CAUTION:
When you configure the destination MAC address for cluster management protocol packets:
• If the interval for sending MAC address negotiation broadcast packets is 0, the system automatically setsit to 1 minute.
• If the interval for sending MAC address negotiation broadcast packets is not 0, the interval remains unchanged.
Cluster member management You can manually add a candidate switch to a cluster, or remove a member switch from a cluster.
If a member switch needs to be rebooted for software upgrade or configuration update, you can remotely reboot it through the management switch.
Adding a member switch
To do… Use the command… Remarks
Enter system view system-view —
Enter cluster view cluster —
Add a candidate switch to the cluster
add-member [ member-number ] mac-address mac-address [ password password ] Required
Removing a member switch
To do… Use the command… Remarks
Enter system view system-view —
Enter cluster view cluster —
Remove a member switch from the cluster
delete-member member-number [ to-black-list ] Required
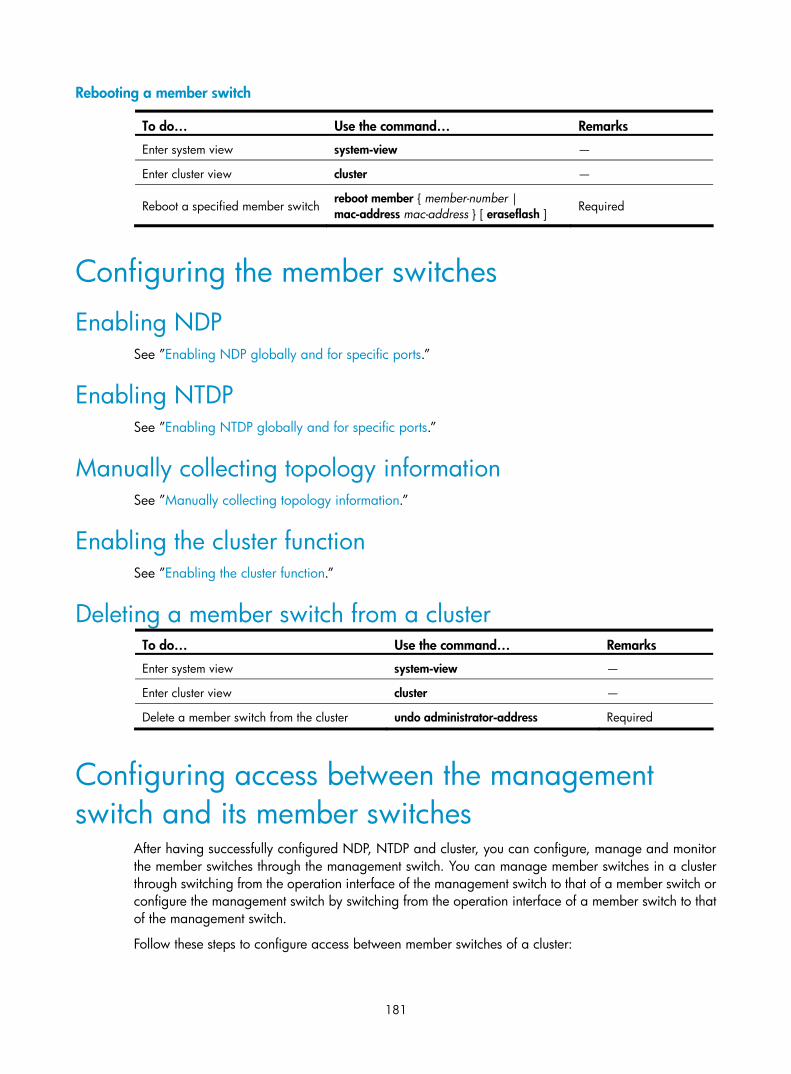
181
Rebooting a member switch
To do… Use the command… Remarks
Enter system view system-view —
Enter cluster view cluster —
Reboot a specified member switch reboot member { member-number | mac-address mac-address } [ eraseflash ] Required
Configuring the member switches
Enabling NDP See ”Enabling NDP globally and for specific ports.”
Enabling NTDP See ”Enabling NTDP globally and for specific ports.”
Manually collecting topology information See ”Manually collecting topology information.”
Enabling the cluster function See ”Enabling the cluster function.”
Deleting a member switch from a cluster To do… Use the command… Remarks
Enter system view system-view —
Enter cluster view cluster —
Delete a member switch from the cluster undo administrator-address Required
Configuring access between the management switch and its member switches
After having successfully configured NDP, NTDP and cluster, you can configure, manage and monitor the member switches through the management switch. You can manage member switches in a cluster through switching from the operation interface of the management switch to that of a member switch or configure the management switch by switching from the operation interface of a member switch to that of the management switch.
Follow these steps to configure access between member switches of a cluster:

182
To do… Use the command… Remarks
Switch from the operation interface of the management switch to that of a member switch
cluster switch-to { member-number | mac-address mac-address | sysname member-sysname }
Required
Switch from the operation interface of a member switch to that of the management switch cluster switch-to administrator Required
CAUTION:
Telnet connection is used in the switching between the management switch and a member switch. Note thefollowing when switching between them:
• Authentication is required when you switch from a member switch to the management switch. The switching fails if authentication is not passed. If authentication is passed, your user level is allocated bythe management switch according to the predefined level.
• When a candidate switch is added to a cluster and becomes a member switch, its super password withthe level of 3 will be automatically synchronized to the management switch. Therefore, after a cluster isestablished, it is not recommended to modify the super password of any member (including the management switch and member switches) of the cluster; otherwise, the switching may fail because of an authentication failure.
• If the member specified in this command does not exist, the system prompts error when you execute thecommand; if the switching succeeds, your user level on the management switch is retained.
• If the Telnet users on the switch to be logged in reach the maximum number, the switching fails.
• To prevent resource waste, avoid ring switching when configuring access between cluster members. Forexample, if you switch from the operation interface of the management switch to that of a member switchand then need to switch back to that of the management switch, use the quit command to end the switching, but not the cluster switch-to administrator command to switch to the operation interface of the management switch.
Adding a candidate switch to a cluster Follow these steps to add a candidate switch to a cluster:
To do… Use the command… Remarks
Enter system view system-view —
Enter cluster view cluster —
Add a candidate switch to the cluster administrator-address mac-address name name Required
Configuring advanced cluster management functions
Configuring topology management The concepts of blacklist and whitelist are used for topology management. An administrator can diagnose the network by comparing the current topology (namely, the information of a node and its neighbors in the cluster) and the standard topology.

183
• Topology management whitelist (standard topology): A whitelist is a list of topology information that has been confirmed by the administrator as correct. You can get the information of a node and its neighbors from the current topology. Based on the information, you can manage and maintain the whitelist by adding, deleting or modifying a node.
• Topology management blacklist: Switches in a blacklist are not allowed to join a cluster. A blacklist contains the MAC addresses of switches. If a blacklisted switch is connected to a network through another switch not included in the blacklist, the MAC address and access port of the latter are also included in the blacklist. The candidate switches in a blacklist can be added to a cluster only if the administrator manually removes them from the list.
The whitelist and blacklist are mutually exclusive. A whitelist member cannot be a blacklist member, and the blacklist member cannot be a whitelist member. However, a topology node can belong to neither the whitelist nor the blacklist. Nodes of this type are usually newly added nodes, whose identities are to be confirmed by the administrator.
You can back up and restore the whitelist and blacklist in the following two ways:
• Backing them up on the FTP server shared by the cluster. You can manually restore the whitelist and blacklist from the FTP server.
• Backing them up in the Flash of the management switch. When the management switch restarts, the whitelist and blacklist will be automatically restored from the Flash. When a cluster is re-established, you can choose whether to restore the whitelist and blacklist from the Flash automatically, or you can manually restore them from the Flash of the management switch.
Follow these steps to configure cluster topology management:
To do… Use the command… Remarks
Enter system view system-view —
Enter cluster view cluster —
Add a switch to the blacklist black-list add-mac mac-address Optional
Remove a switch from the blacklist black-list delete-mac { all | mac-address } Optional
Confirm the current topology and save it as the standard topology
topology accept { all [ save-to { ftp-server | local-flash } ] | mac-address mac-address | member-id member-number }
Optional
Save the standard topology to the FTP server or the local Flash topology save-to { ftp-server | local-flash } Optional
Restore the standard topology information topology restore-from { ftp-server | local-flash } Optional
Configuring interaction for a cluster After establishing a cluster, you can configure FTP/TFTP server, NM host and log host for the cluster on the management switch.
• After you configure an FTP/TFTP server for a cluster, the members in the cluster access the FTP/TFTP server configured through the management switch. Execute the ftp server-address or tftp server-address command and specifying the private IP address of the management switch as the server-address. For more information about the ftp and tftp commands, see Fundamentals Command Reference.
• After you configure a log host for a cluster, all the log information of the members in the cluster will be output to the configured log host in the following way:

184
Member switches send their log information to the management switch
The management switch converts the addresses of log information and sends them to the log host.
• After you configure an NM host for a cluster, the member switches in the cluster send their Trap messages to the shared SNMP NM host through the management switch.
If the port of an access NM switch (including FTP/TFTP server, NM host and log host) does not allow the packets from the management VLAN to pass, the NM switch cannot manage the switches in a cluster through the management switch. In this case, on the management switch, you need to configure the VLAN interface of the access NM switch (including FTP/TFTP server, NM host and log host) as the NM interface.
Follow these steps to configure the interaction for a cluster:
To do… Use the command… Remarks
Enter system view system-view —
Enter cluster view cluster —
Configure the FTP server shared by the cluster
ftp-server ip-address [ user-name username password { simple | cipher } password ]
Required
By default, no FTP server is configured for a cluster.
Configure the TFTP server shared by the cluster tftp-server ip-address
Required
By default, no TFTP server is configured for a cluster.
Configure the log host shared by the member switches in the cluster logging-host ip-address
Required
By default, no log host is configured for a cluster.
Configure the SNMP NM host shared by the cluster
snmp-host ip-address [ community-string read string1 write string2 ]
Required
By default, no SNMP host is configured.
Configure the NM interface of the management switch
nm-interface vlan-interface interface-name Optional
CAUTION:
To isolate management protocol packets of a cluster from packets outside the cluster, you are recommended to configure to prohibit packets from the management VLAN from passing the ports that connect the management switch with the switches outside the cluster and configure the NM interface for the management switch.
SNMP configuration synchronization function Using the SNMP configuration synchronization function facilitates management of a cluster, with which you can perform SNMP-related configurations on the management switch and synchronize them to the member switches on the whitelist. This operation is equal to configuring multiple member switches at one time. It simplifies the configuration process.
Follow these steps to configure the SNMP configuration synchronization function:
To do… Use the command… Remarks
Enter system view system-view —

185
To do… Use the command… Remarks
Enter cluster view cluster —
Configure the SNMP community name shared by a cluster
cluster-snmp-agent community { read | write } community-name [ mib-view view-name ]
Required
Configure the SNMPv3 group shared by a cluster
cluster-snmp-agent group v3 group-name [ authentication | privacy ] [ read-view read-view ] [ write-view write-view ] [ notify-view notify-view ]
Required
Create or update information of the MIB view shared by a cluster
cluster-snmp-agent mib-view included view-name oid-tree
Required
By default, the name of the MIB view shared by a cluster is ViewDefault and a cluster can access the ISO subtree.
Add a user for the SNMPv3 group shared by a cluster
cluster-snmp-agent usm-user v3 user-name group-name [ authentication-mode { md5 | sha } auth-password ] [ privacy-mode des56 priv-password ]
Required
NOTE:
• The SNMP-related configurations are retained when a cluster is dismissed or the member switches areremoved from the whitelist.
• For more information about SNMP, see the chapter “SNMP configuration.”
Configuring web user accounts in batches Configuring web user accounts in batches enables you to do the following:
• Through the web interface, configure, on the management switch, the username and password used to log in to the cluster switches (including the management switch and member switches) .
• Synchronize the configurations to the member switches in the whitelist.
This operation is equal to performing the configurations on the member switches. You need to enter your username and password when you log in to the cluster switches (including the management switch and member switches) through the web interface.
Follow these steps to configure web user accounts in batches:
To do… Use the command… Remarks
Enter system view system-view —
Enter cluster view cluster —
Configure web user accounts in batches
cluster-local-user user-name password { cipher | simple } password Required

186
NOTE:
If a cluster is dismissed or the member switches are removed from the whitelist, the configurations of webuser accounts are still retained.
Displaying and maintaining cluster management To do… Use the command… Remarks
Display NDP configuration information
display ndp [ interface interface-list ] [ | { begin | exclude | include } regular-expression ]
Display NTDP configuration information
display ntdp [ | { begin | exclude | include } regular-expression ]
Display the switch information collected through NTDP
display ntdp device-list [ verbose ] [ | { begin | exclude | include } regular-expression ]
Display the detailed NTDP information of a specified switch
display ntdp single-device mac-address mac-address [ | { begin | exclude | include } regular-expression ]
Display information of the cluster to which the current switch belongs
display cluster [ | { begin | exclude | include } regular-expression ]
Display the standard topology information
display cluster base-topology [ mac-address mac-address | member-id member-number ] [ | { begin | exclude | include } regular-expression ]
Display the current blacklist of the cluster
display cluster black-list [ | { begin | exclude | include } regular-expression ]
Display the information of candidate switches
display cluster candidates [ mac-address mac-address | verbose ] [ | { begin | exclude | include } regular-expression ]
Display the current topology information
display cluster current-topology [ mac-address mac-address [ to-mac-address mac-address ] | member-id member-number [ to-member-id member-number ] ] [ | { begin | exclude | include } regular-expression ]
Display the information about cluster members
display cluster members [ member-number | verbose ] [ | { begin | exclude | include } regular-expression ]
Available in any view
Clear NDP statistics reset ndp statistics [ interface interface-list ] Available in user view
Cluster management configuration example Network requirements
• Three switches form cluster abc, whose management VLAN is VLAN 10. In the cluster, Switch B serves as the management switch (Administrator), whose network management interface is VLAN-interface 2; Switch A and Switch C are the member switches (Member).
• All the switches in the cluster use the same FTP server and TFTP server on host 63.172.55.1/24, and use the same SNMP NMS and log services on host IP address: 69.172.55.4/24.

187
• Add the switch whose MAC address is 000f-e201-0013 to the blacklist.
Figure 60 Network diagram
Configuration procedure
1. Configure the member switch Switch A
# Enable NDP globally and for port GigabitEthernet 1/0/1. <SwitchA> system-view
[SwitchA] ndp enable
[SwitchA] interface gigabitethernet 1/0/1
[SwitchA-GigabitEthernet1/0/1] ndp enable
[SwitchA-GigabitEthernet1/0/1] quit
# Enable NTDP globally and for port GigabitEthernet 1/0/1. [SwitchA] ntdp enable
[SwitchA] interface gigabitethernet 1/0/1
[SwitchA-GigabitEthernet1/0/1] ntdp enable
[SwitchA-GigabitEthernet1/0/1] quit
# Enable the cluster function. [SwitchA] cluster enable
2. Configure the member switch Switch C
As the configurations for the member switches are the same, the configuration procedure for Switch C is not shown here.
3. Configure the management switch Switch B
# Enable NDP globally and for ports GigabitEthernet 1/0/2 and GigabitEthernet 1/0/3. <SwitchB> system-view
[SwitchB] ndp enable
[SwitchB] interface gigabitethernet 1/0/2
[SwitchB-GigabitEthernet1/0/2] ndp enable
[SwitchB-GigabitEthernet1/0/2] quit
[SwitchB] interface gigabitethernet 1/0/3

188
[SwitchB-GigabitEthernet1/0/3] ndp enable
[SwitchB-GigabitEthernet1/0/3] quit
# Configure the period for the receiving switch to keep NDP packets as 200 seconds. [SwitchB] ndp timer aging 200
# Configure the interval to send NDP packets as 70 seconds. [SwitchB] ndp timer hello 70
# Enable NTDP globally and for ports GigabitEthernet 1/0/2 and GigabitEthernet 1/0/3. [SwitchB] ntdp enable
[SwitchB] interface gigabitethernet 1/0/2
[SwitchB-GigabitEthernet1/0/2] ntdp enable
[SwitchB-GigabitEthernet1/0/2] quit
[SwitchB] interface gigabitethernet 1/0/3
[SwitchB-GigabitEthernet1/0/3] ntdp enable
[SwitchB-GigabitEthernet1/0/3] quit
# Configure the hop count to collect topology as 2. [SwitchB] ntdp hop 2
# Configure the delay to forward topology-collection request packets on the first port as 150 ms. [SwitchB] ntdp timer hop-delay 150
# Configure the delay to forward topology-collection request packets on the first port as 15 ms. [SwitchB] ntdp timer port-delay 15
# Configure the interval to collect topology information as 3 minutes. [SwitchB] ntdp timer 3
# Configure the management VLAN of the cluster as VLAN 10. [SwitchB] vlan 10
[SwitchB-vlan10] quit
[SwitchB] management-vlan 10
# Configure ports GigabitEthernet 1/0/2 and GigabitEthernet 1/0/3 as Trunk ports and allow packets from the management VLAN to pass. [SwitchB] interface gigabitethernet 1/0/2
[SwitchB-GigabitEthernet1/0/2] port link-type trunk
[SwitchB-GigabitEthernet1/0/2] port trunk permit vlan 10
[SwitchB-GigabitEthernet1/0/2] quit
[SwitchB] interface gigabitethernet 1/0/3
[SwitchB-GigabitEthernet1/0/3] port link-type trunk
[SwitchB-GigabitEthernet1/0/3] port trunk permit vlan 10
[SwitchB-GigabitEthernet1/0/3] quit
# Enable the cluster function. [SwitchB] cluster enable
# Configure a private IP address range for the member switches, which is from 172.16.0.1 to 172.16.0.7. [SwitchB] cluster
[SwitchB-cluster] ip-pool 172.16.0.1 255.255.255.248
# Configure the current switch as the management switch, and establish a cluster named abc. [SwitchB-cluster] build abc
Restore topology from local flash file,for there is no base topology.

189
(Please confirm in 30 seconds, default No). (Y/N)
N
# Enable management VLAN auto-negotiation. [abc_0.SwitchB-cluster] management-vlan synchronization enable
# Configure the holdtime of the member switch information as 100 seconds. [abc_0.SwitchB-cluster] holdtime 100
# Configure the interval to send handshake packets as 10 seconds. [abc_0.SwitchB-cluster] timer 10
# Configure the FTP Server, TFTP Server, Log host and SNMP host for the cluster. [abc_0.SwitchB-cluster] ftp-server 63.172.55.1
[abc_0.SwitchB-cluster] tftp-server 63.172.55.1
[abc_0.SwitchB-cluster] logging-host 69.172.55.4
[abc_0.SwitchB-cluster] snmp-host 69.172.55.4
# Add the switch whose MAC address is 000f-e201-0013 to the blacklist. [abc_0.SwitchB-cluster] black-list add-mac 000f-e201-0013
[abc_0.SwitchB-cluster] quit
# Add port GigabitEthernet 1/0/1 to VLAN 2, and configure the IP address of VLAN-interface 2. [abc_0.SwitchB] vlan 2
[abc_0.SwitchB-vlan2] port gigabitethernet 1/0/1
[abc_0.SwitchB] quit
[abc_0.SwitchB] interface vlan-interface 2
[abc_0.SwitchB-Vlan-interface2] ip address 163.172.55.1 24
[abc_0.SwitchB-Vlan-interface2] quit
# Configure VLAN-interface 2 as the network management interface. [abc_0.SwitchB] cluster
[abc_0.SwitchB-cluster] nm-interface vlan-interface 2

190
Stack configuration
Stack configuration overview To manage network devices situated at distant sites as a whole, you can connect the network devices and perform necessary configurations to establish a stack, helping reduce customer investments and simplify network management.
Introduction to stack A stack is a management domain that comprises several network devices connected to one another through stack ports. In a stack, there is a master device and several slave devices.
An administrator can manage all the devices in a stack through the master device. Figure 61 shows a network diagram for stack management.
Figure 61 Network diagram for stack management
• Master device: In a stack, the master device acts as the configuration interface in stack management. Management and monitoring of all the devices in the stack are performed through the master device.
• Slave devices: Managed devices in a stack.
• Stack port: Ports between stack devices.
Establishing a stack An administrator can establish a stack as follows:
• Configure a private IP address pool for a stack and create the stack on the network device which is desired to be the master device.
• Configure ports between the stack devices as stack ports.
• The master device automatically adds the slave devices into the stack, and assigns a number for each stack member.

191
• The administrator can log in to any slave device from the master device of the stack, and perform configurations for the slave device.
Stack configuration task list Complete the following tasks to configure stack:
Task Remarks
Configuring a private IP address pool for a stack Required
Configuring stack ports Required Configuring the master device of a stack
Creating a stack Required
Configuring stack ports of a slave device Required
Logging in to the CLI of a slave from the master Optional
Configuring the master device of a stack
Configuring a private IP address pool for a stack To do… Use the command… Remarks
Enter system view system-view —
Configure a private IP address pool for the stack
stack ip-pool ip-address { mask | mask-length }
Required
By default, no IP address pool is configured for a stack.
NOTE:
• If a device is already configured as the master device of a stack or is already a slave device of a stack,you cannot configure a private IP address pool on the device.
• When you configure a private IP address pool for a stack, the number of IP addresses in the address pool needs to be equal to or greater than the number of devices to be added to the stack. Otherwise, some devices may not be able to join the stack automatically for lack of private IP addresses.
Configuring stack ports On the master device, configure ports that connect to slave devices as stack ports.
Follow the steps below to configure stack ports:
To do… Use the command… Remarks
Enter system view system-view —
Configure the specified ports as stack ports
stack stack-port stack-port-num port interface-list
Required
By default, a port is not a stack port.

192
Creating a stack After you execute the stack role master command on a stack-capable device, the device becomes the master device of a stack and automatically adds the devices connected with its stack ports to the stack.
Follow the steps below to create a stack:
To do… Use the command… Remarks
Enter system view system-view —
Create a stack stack role master Required
NOTE:
After you configure a device as the master device of a stack, the prompt changes to <stack_0.Sysname>,where Sysname is the system name of the device.
Configuring stack ports of a slave device You need to configure stack ports to add a slave device to the stack.
The ports of a slave device that connect to other stack devices need to be configured as stack ports.
Follow the steps below to configure stack ports:
To do… Use the command… Remarks
Enter system view system-view —
Configure the specified ports as stack ports
stack stack-port stack-port-num port interface-list
Required
By default, a port is not a stack port.
NOTE:
After a device joins a stack and becomes a slave device of the stack, the prompt changes to <stack_n.Sysname>, where n is the stack number assigned by the master device, and Sysname is the system name of the device.
Logging in to the CLI of a slave from the master In a stack, you can log in to the CLI of a slave device from the master device and perform configurations for the slave device.
Follow the step below to log in to the CLI of a slave device from the master device:
To do… Use the command… Remarks
Log in to the CLI of the specified slave device from the master device
stack switch-to member-id Required
Available in user view
NOTE:
The stack switch-to command is used to log in to the CLI of a slave device from the master with the user level being unchanged. To return to the master device, use the quit command.

193
Displaying and maintaining stack configuration To do… Use the command… Remarks
Display the stack information of stack members
display stack [ members ] [ | { begin | exclude | include } regular-expression ]
Available in any view
Stack configuration example Network requirements
• Switch A, Switch B, Switch C, and Switch D are connected with one another.
• Create a stack, where Switch A is the master device, Switch B, Switch C, and Switch D are slave devices. An administrator can log in to Switch B, Switch C and Switch D through Switch A to perform remote configurations.
Figure 62 Network diagram for stack management
GE1/0/1 GE1/0/3
Switch B: Member switch GE1/0/1GE1/0/1
Switch C: Member switch Switch D: Member switch
Stack
GE1/0/1GE1/0/2
Switch A: Master switch
Configuration procedure
1. Configure the master device
# Configure a private IP address pool for the stack on Switch A. <SwitchA> system-view
[SwitchA] stack ip-pool 192.168.1.1 24
# Configure port GigabitEthernet 1/0/1 as a stack port on Switch A. [SwitchA] stack stack-port 1 port gigabitethernet 1/0/1
# Configure switch A as the master device. [SwitchA] stack role master
2. Configure the slave devices
# On Switch B, configure local ports GigabitEthernet 1/0/2, GigabitEthernet 1/0/1, and GigabitEthernet 1/0/3 as stack ports. <SwitchB> system-view
[SwitchB] stack stack-port 3 port GigabitEthernet 1/0/1 GigabitEthernet 1/0/2 GigabitEthernet 1/0/3

194
# On Switch C, configure local port GigabitEthernet 1/0/1 as a stack port. <SwitchC> system-view
[SwitchC] stack stack-port 1 port GigabitEthernet 1/0/1
# On Switch D, configure local port GigabitEthernet 1/0/1 as a stack port. <SwitchD> system-view
[SwitchD] stack stack-port 1 port GigabitEthernet 1/0/1
3. Verify the configuration
# Display stack information of the stack members on Switch A. <stack_0.SwitchA> display stack members
Number : 0
Role : Master
Sysname : stack_0. SwitchA
Device type: H3C S5120-52C-PWR-EI
MAC address: 000f-e200-1000
Number : 1
Role : Slave
Sysname : stack_1. SwitchB
Device type: H3C S5120-52C-PWR-EI
MAC address: 000f-e200-1001
Number : 2
Role : Slave
Sysname : stack_2. DeviceC
Device type: H3C S5120-52C-PWR-EI
MAC address: 000f-e200-1002
Number : 3
Role : Slave
Sysname : stack_3. DeviceD
Device type: H3C S5120-52C-PWR-EI
MAC address: 000f-e200-1003

195
Index
A C D E H I L N O P R S T U A
Adding a candidate switch to a cluster,182 Alarm group configuration example,81
C
Cluster management configuration example,186 Cluster management configuration task list,173 Cluster management overview,169 Configuring a schedule for an NQA test group,128 Configuring access between the management switch and its member switches,181 Configuring access-control rights,19 Configuring advanced cluster management functions,182 Configuring an NQA test group,112 Configuring basic SNMP settings,59 Configuring information center,40 Configuring Layer 2 remote port mirroring,90 Configuring local port mirroring,86 Configuring network management-specific interface index,62 Configuring NTP authentication,20 Configuring optional parameters for an NQA test group,127 Configuring optional parameters of NTP,18 Configuring PoE interface power management,162 Configuring PoE interface through PoE profile,163 Configuring sFlow,151 Configuring SNMP logging,63 Configuring SNMP traps,64 Configuring stack ports of a slave device,192 Configuring the collaboration function,124 Configuring the history records saving function,126 Configuring the management switch,175 Configuring the master device of a stack,191 Configuring the maximum PoE interface power,161 Configuring the member switches,181 Configuring the NQA server,111 Configuring the NQA statistics collection function,126
Configuring the operation modes of NTP,15 Configuring the PoE monitoring function,163 Configuring the RMON alarm function,76 Configuring the RMON statistics function,75 Configuring threshold monitoring,124 Configuring traffic mirroring,100 Creating an NQA test group,112
D
Detecting PDs,161 Displaying and maintaining cluster management,186 Displaying and maintaining information center,51 Displaying and maintaining IPC,157 Displaying and maintaining MIB style,72 Displaying and maintaining NQA,129 Displaying and maintaining NTP,22 Displaying and maintaining PoE,165 Displaying and maintaining port mirroring,94 Displaying and maintaining RMON,77 Displaying and maintaining sFlow,152 Displaying and maintaining SNMP,66 Displaying and maintaining stack configuration,193 Displaying and maintaining traffic mirroring,104
E
Enabling IPC performance statistics,156 Enabling PoE for a PoE interface,160 Enabling the NQA client,111 Ethernet statistics group configuration example,78
H
History group configuration example,79
I
Information center configuration examples,51 Information center overview,34 Introduction to port mirroring,83 Introduction to traffic mirroring,100 IPC overview,155
L

196
Logging in to the CLI of a slave from the master,192
N
NQA configuration examples,129 NQA configuration task list,110 NQA overview,107 NTP configuration examples,22 NTP configuration task list,14 NTP overview,9
O
Overview,72
P
Ping,1 Ping and tracert configuration example,7 PoE configuration example,166 PoE configuration task list,159 PoE overview,158 Port mirroring configuration examples,95
R
RMON overview,73
S
Setting the MIB style,72 sFlow configuration example,152 sFlow overview,150 SNMP configuration examples,66 SNMP configuration task list,59 SNMP overview,58 Stack configuration example,193 Stack configuration overview,190 Stack configuration task list,191 System debugging,5
T
Tracert,3 Traffic mirroring configuration example,104 Traffic mirroring configuration task list,100 Troubleshooting PoE,167 Troubleshooting sFlow configuration,154
U
Upgrading PSE processing software in service,165