EI-1998 Mar..pdf - Philippine Statistics Authority
43
"'~.-. 'If,TlONAL STATISTICAL COORDINATION BOA ARCHIVES ECONOMIC MAR - - 1998 I Republika ng Pilipinas PAMBANSANG LUPON SA UGNAYANG PANG-ESTADISTIKA NATIONALSTATISTICALCOORDINATION BOARD - -
-
Upload
khangminh22 -
Category
Documents
-
view
0 -
download
0
Transcript of EI-1998 Mar..pdf - Philippine Statistics Authority

"'~.-.
'If,TlONAL STATISTICAL COORDINATION BOAARCHIVES
ECONOMICMAR - - 1998 I
Republika ng PilipinasPAMBANSANG LUPON SA UGNAYANG PANG-ESTADISTIKANATIONAL STATISTICALCOORDINATION BOARD
-
-
--
--
ECONOMIC INDICATORS
•Pambansang Lupon sa Ugnayang Pang-Estadistika(NATIONAL STATISTICAL COORD INA TION BOARD)

. . ;
The statistical tables in this publication are also available in diskette.
For more information, please direct inquiries to the:
Statistical Information Management ServiceNational Statistical Coordination BoardGround Floor, Midland Buendia Building403 Sen Gil J. Puyat Avenue1200 Makati, Metro Manila, Philippines
Telephone Nos. (632) 8909405; (632) 8952767Fax No. (632) 8909408Internet E-Mail addresses:[email protected]
[email protected] Webpage address: http://users.info.com.phrnscbrscs
--
--

FOREWORD
The monthly Economic Indicators is a regular publication of the National Statistical Coordination Board (NSCB). It presents the latestavailable monthly statistical indicators of the levels and trends of the country's economic activities and performance. These indicators have
------ been carefully identified.to meet.the.varying needsof.policy-makers, decision-makers and other-researchers for_more.relevant.data. _
-- To guide data users towards a more meaningful analysis of economic behavior and events, the indicators are presented in a movingthirteen-month time series. In addition, quarterly data on the gross national product, gross domestic product, wage rates, quarterly indices,and employment are presented as they become available.
We gratefully acknowledge the sustained support and contribution of the various source agencies for providing the NSCB with thenecessary data inputs. The regular and timely release of this publication depends greatly on the goodwill of the following cooperatingagencies/ organizations:
--
I. Air Transportation Office2. Bangko Sentral ng Pilipinas3. Bureau of Agricultural Statistics4. Bureau of Customs5. Bureau of Labor and Employment Statistics6. Bureau of Treasury7. Department of Energy8. Department of Tourism9. Forest Management Bureau10. Land Transportation Office11. Light Rail Transit Authority
12. Manila International Airport Authority13. Mines and Geo-Sciences Bureau14. National Conciliation and Mediation Board15. National Statistics Office16. Philippine Electrical Electronics and Allied Industries
Federation17. Philippine Cement Manufacturers Corporation18. Philippine National Railways19. Philippine Overseas Employment Administration20. Philippine Stock Exchange Incorporated21. Securities and Exchange Commission
,
f---' A ----ROMULO A. VIROLA
Secretary General
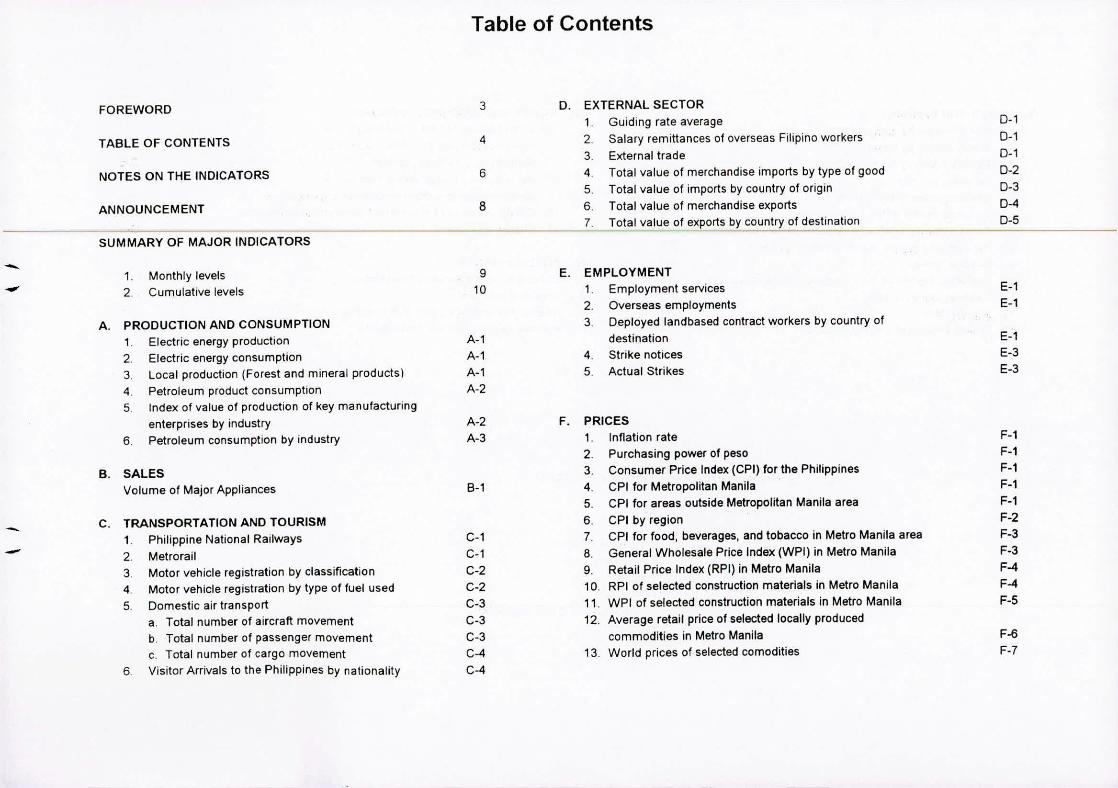
Table of Contents
FOREWORD 3 D. EXTERNAL SECTOR1. Guiding rate average 0-1
TABLE OF CONTENTS 4 2. Salary remittances of overseas Filipino workers 0-1
3. External trade 0-1
NOTES ON THE INDICATORS 6 4. Total value of merchandise imports by type of good 0-2
5. Total value of imports by country of origin 0-3
ANNOUNCEMENT 8 6. Total value of merchandise exports 0-4
7. Total value of exports by country of destination 0-5
SUMMARY OF MAJOR INDICATORS
- 1. Monthly levels 9 E. EMPLOYMENT- 2 Cumulative levels 10 1. Employment services E-1
2. Overseas employments E-1
A. PRODUCTION AND CONSUMPTION 3. Deployed landbased contract workers by country of
1. Electric energy production A-1 destination E-1
2. Electric energy consumption A-1 4. Strike notices E-3
3. Local production (Forest and m,neral products) A-1 5. Actual Strikes E-3
4. Petroleum product consumption A-2
5 Index of value of production of key manufacturing
enterprises by industry A-2 F. PRICES
6. Petroleum consumption by industry A-3 1. Inflation rate F-1
2. Purchasing power of peso F-l
B. SALES 3. Consumer Price Index (CPI) for the Philippines F-l
Volume of Major Appliances B-1 4. CPI for Metropolitan Manila F-l
5. CPI for areas outside Metropolitan Manila area F-l
- C. TRANSPORTATION AND TOURISM 6. CPI by region F-2
1. Philippine National Railways C-1 7. CPI for food, beverages, and tobacco in Metro Manila area F-3- 2 Metrorail C-l 6. General Wholesale Price Index (WPI) in Metro Manila F-3
3. Motor vehicle registration by classification C.2 9. Retail Price Index (RPI) in Metro Manila F-4
4. Motor vehicle registration by type of fuel used C-2 10 RPI of selected construction materials in Metro Manila F-4
5 Domestic air transport C-3 11. WPI of selected construction materials in Metro Manila F-5
a. Total number of aircraft movement C-3 12. Average retail price of selected locally produced
b. Total number of passenger movement C-3 commodities in Metro Manila F-6
c. Total number of cargo movement C-4 13. World prices of selected comodities F-7
6 Visitor Arrivals to the Philippines by nationality C-4
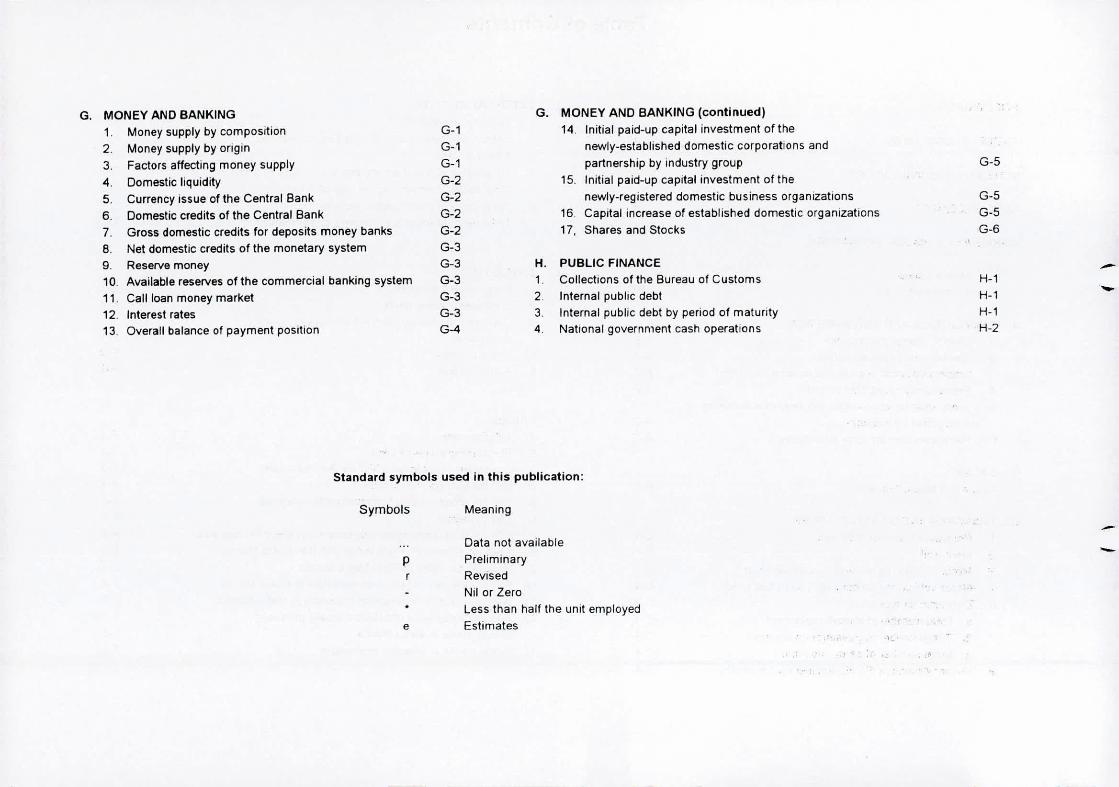
G. MONEY AND BANKING G. MONEY AND BANKING (continued)
1. Money supply by composition G-1 14. Initial paid.up capital investment of the
2. Money supply by ongin G-1 newly.established domestic corporations and
3. Factors affecting money supply G-1 partnership by industry group G-5
4. Domestic liquidity G-2 15. Initial paid-up capital investment of the
5. Currency issue of the Central Bank G-2 newly-registered domestic business organizations G-5
6. Domestic credits of the Central Bank G-2 16 Capital increase of established domestic organizatIOns G-5
7. Gross domestic credits for deposits money banks G-2 17, Shares and Stocks G-6
8. Net domestic credits of the monetary system G-3..
9. Reserve money G-3 H. PUBLIC FINANCE -10. Available reserves of the commercial banking system G-3 1. Collections of the Bureau of Customs H-1
11. Call loan money market G-3 2. Internal public debt H-1 -12. Interest rates G-3 3. Internal public debt by period of matunty H-1
13. Overall balance of payment position G-4 4. National government cash operations H-2
Standard symbols used in this publication:
Symbols
p
e
Meaning
Data not availablePreliminaryRevised
Nil or ZeroLess than half the unit employedEstimates
., ,~ .~
--

NOTES ON THE MONTHLY INDICATORS
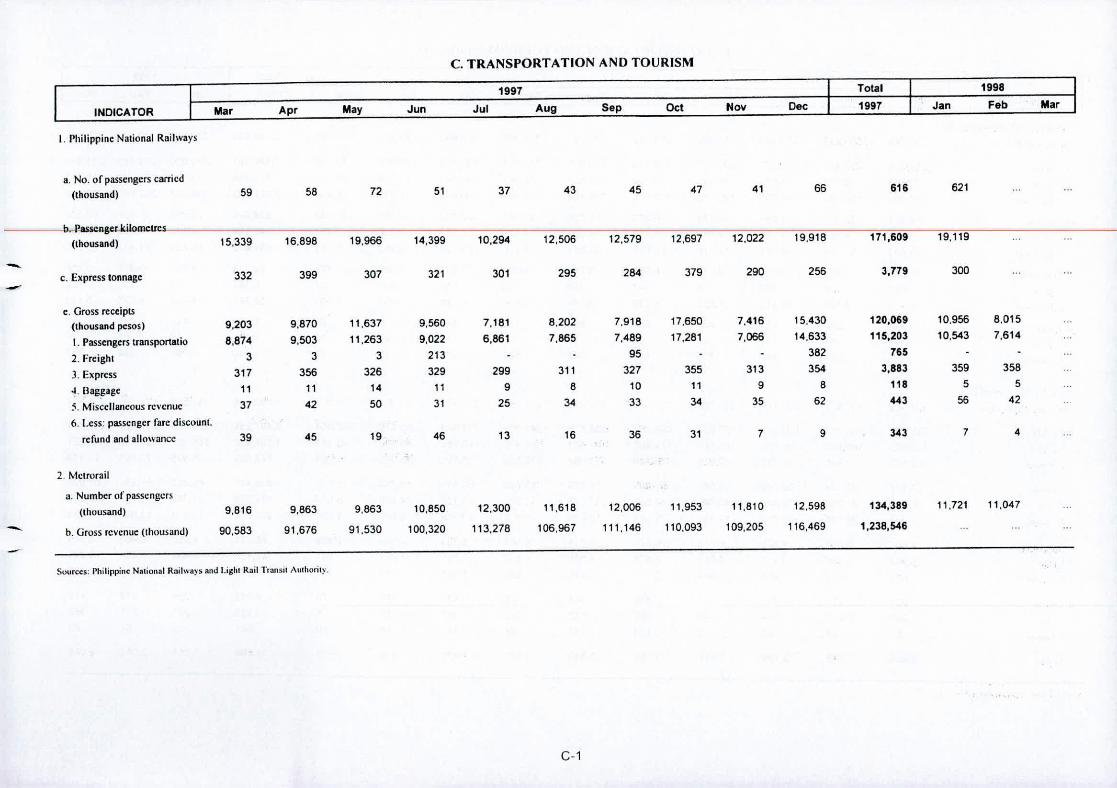
PART C. TRANSPORTATION AND TOURISMMonthly data on railroad transportation are reported by the Philippine
National Railways. Data on motor vehicle transportation by classification andby type of fuel used are provided by the Land Transportation Office whiledata on air transportation are derived from the Manila International AirportAuthority. On the other hand, data on passengers and gross revenue on thelight rail transit are provided by the Light Rail Transit Authority.
PART D. EXTERNAL SECTORThe value and quantity data appearing in this section represent
transactions during the specified month. Cumulative levels can be derived byadding successive monthly figures in the series. Some of the data are obtainedfrom the Bangko Sentral ng Pilipinas (BSP), and therefore the definition ofitems, limitations, and coverage of data are as stated in the BSP StatisticalBulletin. Data on the value of merchandise imports and exports and theindices of external trade, are as reported by the NSO.
Also included in this section is a summary of monthly visitor arrivals bycountry of residence, which is derived from the Arrival/Departure cards ofthe Department of Tourism.
PART B. SALESUnder Section A (Monthly levels), oppeors 0 list of principol economic Soles of mojor home opplionces ore compiled by the Philippine Elcctricol
indicators selected from the different sections of this publicotion. For eoch of Electronics ond Allied Industries Federation. These dota reflect the volume ofthese indicotors, the latest figure reported is compared with the preceding various home appliances sold on 0 monthly basis as provided by members ofrna nth's repo rt-and -also-with the co rrespo ndi ng report- for the-same- month-o f---the-f'edcrat ion-n arne1y: -Association - of - Home_Appliance_Manufacturers, ---the preceding calendar year. The changes are expressed in percent. Consumer Electronic Products Manufacturers Association; Cooking and
Heating Appliance Manufacturer of the Philippines; and Philippine ElectricFan Manufacturers' Association.
SUMMARY OF MAJOR INDICATORS
Under Section B (Cumulative levels), the data presented are the sums ofsuccessive monthly increments from January' to the latest recorded month ofthe current calendar year. These are compared with corresponding sums ofmonthly increments for the same period in the preceding calendar year. Thecomparisons are expressed as percentage increases (or decreases) over the latterfigures.
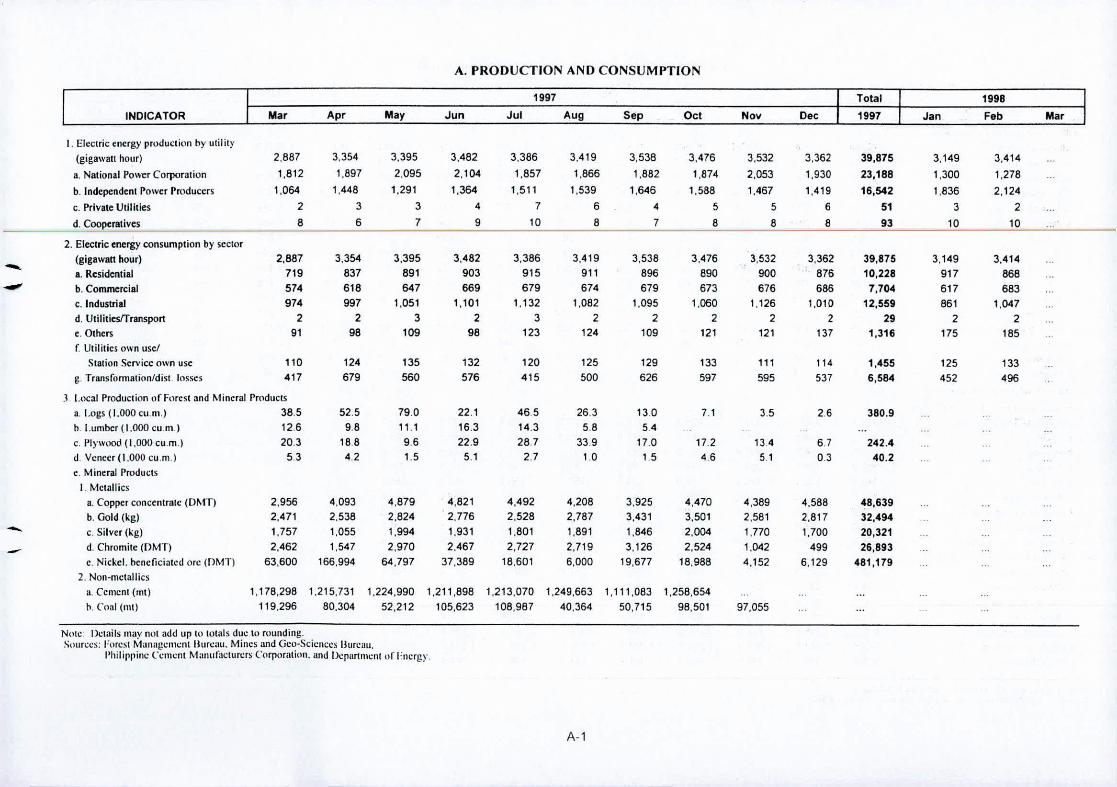
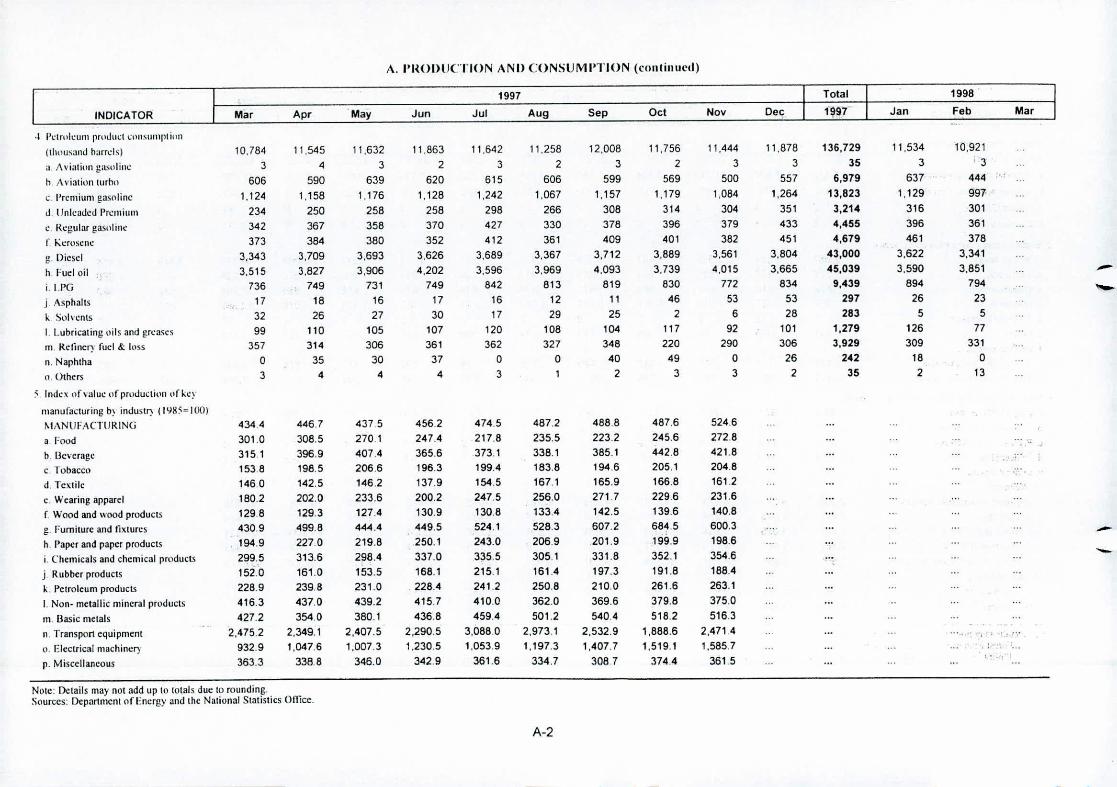
PART A. PRODUCTION AND CONSUMPTION"The monthly data on electric energy production and consumption, by
sectors and basic data on petroleum consumption by type and by industryare supplied by the Department of Energy. Data on local production of forestproduc~s are generated by the Forest Management Bureau. Data on mineralproducts, on the: 'other hand, are generated by the Mines and Geo.SciencesBureau and Philippine Cement Manufacturers Corporation.
The index of value of production of key manufacturing enterprises isderived from the Monthly Survey of Key Manufacturing Enterprises (SKEM),which is being undertaken by the National Statistics Office (NSO). Data onwater production and consumption, on the other hand, are provided by theMetropolitan Waterworks and Sewerage System.
--
---
6
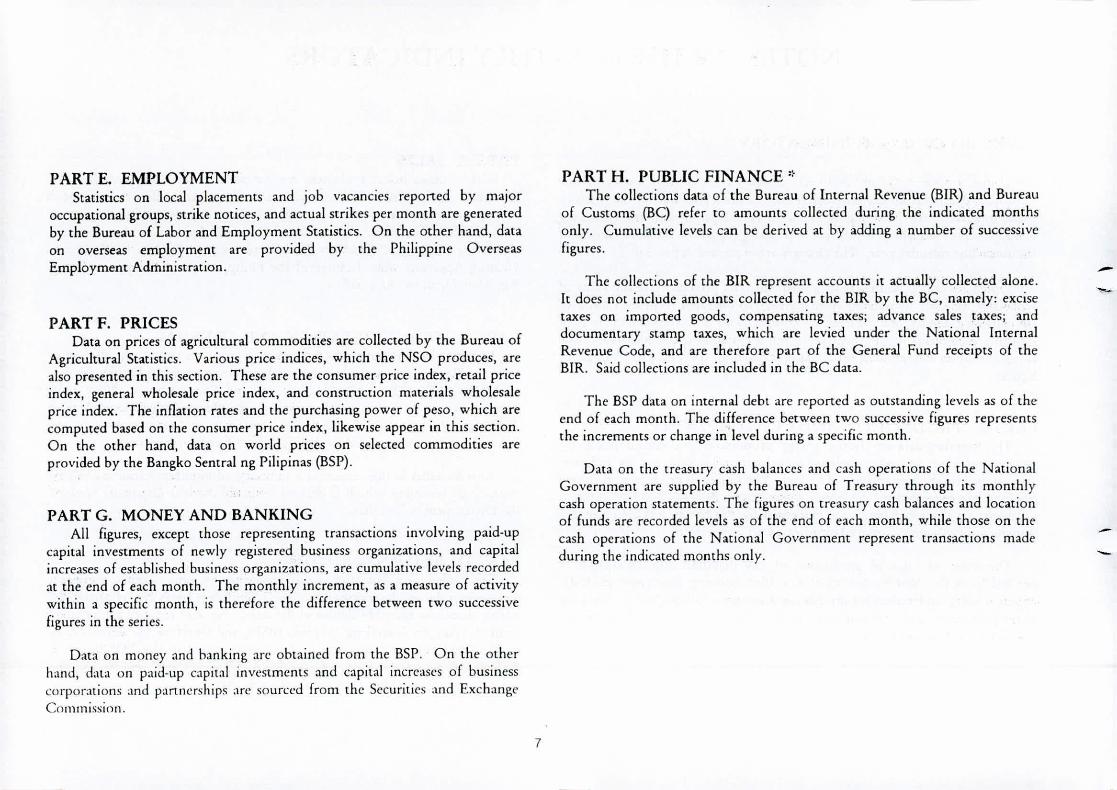
PART E. EMPLOYMENTStatistics on local placements and job vacancies reported by major
occupational groups, strike notices, and actual strikes per month are generatedby the Bureau of Labor and Employment Statistics. On the other hand, dataon overseas employment are provided by the Philippine OverseasEmployment Administration.
PART F. PRICESData on prices of agricultural commodities are collected by the Bureau of
Agricultural Statistics. Various price indices, which the NSO produces, arealso presented in this section. These are the consumer price index, retail priceindex, general wholesale price index, and construction materials wholesaleprice index. The inflation rates and the purchasing power of peso, which arecomputed based on the consumer price index, likewise appear in this section.On the other hand, data on world prices on selected commodities areprovided by the Bangko Sentral ng Pilipinas (BSP).
PART G. MONEY AND BANKINGAll figures, except those representing transactions involving paid-up
capital investments of newly registered business organizations, and capitalincreases of established business organizations, are cumulative levels recordedat the end of each month. The monthly increment, as a measure of activitywithin a specific month, is therefore the difference between two successivefigures in the series.
D,lta on money and hanking arc ohtained from the BSP. On the otherhand, &na on paid-up Cilpit<tlinvestments and capital increases of businesscorporations ~lOdpJ.nncrships are sourced from the Securities and Exch;]n~('
Cc)mmissioll.
7
PART H. PUBLIC FINANCE"The collections data of the Bureau of Internal Revenue (BIR) and Bureau
of Customs (BC) refer to amounts collected during the indicated monthsonly. Cumulative levels can be derived at by adding a number of successivefigures.
The collections of the BIR represent accounts it actually collected alone.It does not include amounts collected for the BIR by the BC, namely: excisetaxes on imported goods, compensating taxes; advance sales taxes; anddocumentary stamp taxes, which are levied under the National InternalRevenue Code, and are therefore part of the General Fund receipts of theBIR. Said collections are included in the BC data.
The BSP data on internal debt are reported as outstanding levels as of theend of each month. The difference between two successive figures representsthe increments or change i~'level during a specific month.
Data on the treasury cash balances and cash operations of the NationalGovernment are supplied by the Bureau of Treasury through its monthlycash operation statements. The figures on treasury cash balances and locationof funds are recorded levels as of the end of each month, while those on thecash operations of the National Government represent transactions madeduring the indicated months only.
---
--

SUMMARY OF MAJOR INDICATORS
Preceding Percent Same Month Percent
INDICATOR Latest Month Month Change A Vear A90 Change
A. MONTHLY LEVELS
I. Electric energy production (million kwh) Feb 1998 3,414 3,149 8.42 Feb 1998 3,175 7.53
1. Petro/em product consumption (thousand barrels) Feb 1998 10,921 11.534 (5.31 ) Feb 1998 10,207 7.00
J. Rail tronsportotiOl1a. Passenger Ict/OIMtres (thousand) Jan 1998 19,119 19,918 (4.01) Jan 1997 14,855 28.70- b. G,.cus nee/pI (thousand puos) Feb 1998 10,926 8,015 36.32 Feb 1998 6,941 57.41- 4. Visitor arrlwJLJ /0 the Phllfppirres Feb 1998 173,998 186,332 (6.62) Feb 1998 173,907 0.05
5. Salary n",/tIQn~1 of owrsttu Filipino worurs(milion USS) Dec 1997 590.0 506.5 16.49 Dec 1996 295.2 99.86
6. Total imporU (F.OB. million USS) Feb 1998 2,585.2 2,837.9 (8.90) Feb 1998 2,626.5 (1.57)
7. Total aport! (F.o.B. million US!) Feb 1998 2,227.2 2,115.2 5.30 Feb 1998 1,812.4 22.89
8, COfUumer price index (/988-100) ALLrrCMS
a. Philippines Mar 1998 253.0 251.4 0.64 Mar 1997 235.8 7.29
b. Metropolitan Manila Area (NCR) Mar 1998 277.4 276.4 0.36 Mar 1997 257.7 7.64
c. For arras outside Metropolitan
Manila Area (NCR) Mar 1998 245,1 243.3 0.74 Mar 1997 228.7 7.17
-. 9. Wholesale price index in Metropolitan Manila Area (NCR)
ALLrrCMS Dec 1997 894.2 883.2 1.25 Dec 1996 883.8 1.18
lO. Money Supply (million P) Jan 1998 246,082 258,318 (4.74) Jan 1997 209,968 17.20
J J. Net domestic credit (million P) Dec 1997 1,932,053 1,825,945 5.81 Dec 1996 1,507,732 28.14
/2. In;,ial paid-up copital investment of newly registered
business organi:afions (lhouUlnd P) Dec 1997 5,170,238 2,247,641 130.03 Dec 1996 2,392,825 116.07
IJ. Cllsloms coJlecl;ons (million P) Dec 1997 13,311 7,567 75.91 Dec 1996 8,568 55.39

, , SUMMARY OF MA.IOR INIlICATORS
Latest Year Year Ago Percent Previous Year Ratio
INDICATOR Period Total Period Total Change Jan-Dec (1) I (4)
(1) (2) (3) (4) (5)
11.ClIMl'L\TI\"J: I.EVEI.S
I. Eft:<,,,',ic ('tll'rX" P,.o'/I1("(;on (millioll J,;\I-Jo Jan. Feb 1996 6.563 Jan. Feb 1997 6,044 6.59 36,665 0.16
1. pt',rolcr/m prodllct ("ml!lump/ion (lhoIl5,,,,J har'l!'f,fJ Jan. Feb 1998 22,455 Jan. Feb 1997 20,919 7.34 131.600 0.17 -J Rail (rampOrlafwlI -
a Passe1lj(l!r Jillw1/('ters (lhOlUtmdl Jan 1998 19.119 Jan 1997 14,655 28.70 68,515 0.28
h. GrOSJ rt'celp' (llulll.taml pesus) Jan. Feb 1998 18.971 Jan. Feb 1997 16,002 1855 42,921 0.44
4 ";$;[0' arnmb If) tilt' Phil'l'pint'S Jan. Feb 1996 360.330 Jan. Feb 1997 351,569 2.49 2.049,367 0.18
5. Safary remlttanct's of O\'t"f.R'(H "-illp",o llorkers
(mil/lOrr {'.'lSI Jan. Dec 1997 5.7418 Jan - Dec 1996 4.243.5 35.31 4.243.5 1.35
6 row! ,mports (F(), H m;1/;01l { '.\"5) Jan. Feb 1997 5,423.1 Jan - Feb 1997 5,464.4 (0.76) 32,426.9 0.17
To/af t!.tporl$ a,-pR, million C'sSJ Jan. Feb 1997 4.342.4 Jan - Feb 1997 3.504.7 2390 25,227.8 0.17
~, Change In mone)' supply (million Pl Jan 1998 (12.236) Jan. Dec 1997 36,361 (133.65) 37,026 (033)
9, Initial paid-lip capilal mWSlmenl of n~,,-/)' regislered
busine,u orgom=UllolIs (thollsand 1') Jan. Dec 1997 51,465,623 Jan - Dec 1996 41,525.575 23.94 41.525,575 1.24 -IO.Custums co/leClwns (III/liiull P) Jan. Nov 1997 64,196 Jan. Nov 1996 95.620 (11.95) 82.102 1.03 -II. l'l/ational government ca5Jr operations (million P)
a. Rewnlles Jan. Mar 1998 103.038 Jan - Mar 1997 96,600 6.66 471,843 0.22
b. Expenditures Jan - Mar 1998 115.427 Jan - Mar 1997 96,946 19.06 467,319 0.25
A. PRODUCTION AND CONSUMPTION
1997 1998INDICATOR Mar Apr May Jun Jul AU9 Sep Oct Nov Dec Jan Feb Mar
I. Electric cncrgy production by utility
(gigawatt ho~r) 2,887 3,354 3,395 3,482 3,386 3,419 3,538 3,476 3,532 3,362 39,875 3,149 3,4148. National Power Corporation 1,812 1,897 2,095 2,104 1,857 1,866 1,882 1,874 2,053 1,930 23,188 1,300 1,278b. Independent Power Producers 1,064 1,448 1,291 1,364 1,511 1,539 1,646 1,588 1,467 1,419 16,542 1,836 2,124c. Private Utilities 2 3 3 4 7 6 4 5 5 6 51 3 2d. Cooperatives 8 6 7 9 10 8 7 8 8 8 93 10 10
2. Electric energy consumption by sector(gigawan hour) 2,887 3,364 3,395 3,482 3,386 3,419 3,538 3,476 3,532 3,362 39,875 3,149 3.414- a. Residential 719 837 891 903 915 911 896 890 900
,876 10,228 917 868- b. Commercial 574 618 647 669 679 674 679 673 676 686 7,704 617 683
c. Industrial 974 997 1,051 1,101 1,132 1,082 1,095 1,060 1,126 1,010 12,559 861 1,047d. Utilitiesrrranspor1 2 2 3 2 3 2 2 2 2 2 29 2 2c. Others 91 98 109 98 123 124 109 121 121 137 1,316 175 185f. Utilities own uscl
Station Service own use 110 124 135 132 120 125 129 133 111 114 1,455 125 133g. Transfonnalion/dist, Insses 417 679 560 576 415 500 626 597 595 537 6,584 452 496
) I.ocal Production ofFllrcsl and Mineral Pmduc1s<I, Logs (1.000 cu,m.) 385 52.5 79.0 22,1 465 26.3 130 7.1 3.5 26 380.9b. Lumber (1.000 cu,m.) 12.6 98 11.1 16.3 14.3 5.8 54c. 1J1l'""md (1.000 cU.m.) 203 188 9.6 22.9 28.7 339 17.0 17.2 134 67 242.4tJ Veneer (1.000 cU.m.) 53 4.2 1.5 5.1 2.7 10 1.5 46 5.1 03 40.2c. Mineral Products
I. Mclallicsa. Copper concentrate (UMT) 2,956 4,093 4,879 4,821 4,492 4,208 3,925 4,470 4,389 4,588 48,639b. Gold (kg) 2,471 2,538 2,824 2,776 2,528 2,787 3,431 3,501 2,581 2,817 32,494- c. Silver (kg) 1,757 1,055 1,994 1,931 1,801 1,891 1,846 2,004 1,710 1,700 20,321- d. Chromile (DMT) 2,462 1,547 2,970 2,467 2,727 2,719 3,126 2,524 1,042 499 26,893e. Nickel. beneficiated orc (DMT) 63,600 166,994 64,797 37,389 18,601 6,000 19,671 18,988 4,152 6,129 481,179
2. NOl1-mctallicsa. CcOlcn! (011) 1,178,298 1.215,731 1,224,990 1,211,898 1,213,070 1,249,663 1,111,083 1,258,654b, ('(Jill (lilt) 119,296 80,304 52,212 105,623 108,987 40,364 50,715 98,501 97,055
N(lte: Dctails may nul add up lU totals due to rounding.Sources: FlUesl ManilJ;crnent Burcau. Mincs and (jcll-Sciences Bureau.
I)hilippinc Cement Mallufaclurers Cnrpnrtltiun. ilnd Dcpurtllleni tlf I-:tu:rgy.
A-1
A. l'IH>lllICTION ANIl CONSUMPTION (cunlinn",I)
1997 1998 .
INDICATOR Mar Apr May Jun Jul AU9 Sep Oct Nov Dec Jan Feb Mar
.1 Pclnllctll1l prl1dul.:ll:llIlSIl111plitlll
(lhl1usand harrels) 10.784 11,545 11.632 11,863 11.642 11,258 12.008 11.756 11,444 11,878 136,729 11,534 10,921
a Ihiatiml gilSI11illC 3 4 3 2 3 2 3 2 3 3 35 3 " :3h ..hiati,lll lurl;lo 606 590 639 620 615 606 599 569 500 557 6,979 637 444 ;'.;
c. Premium g.a.•oJinc 1.124 1,158 1,176 1.128 1,242 1,067 1.157 1,179 1,084 1,264 13,823 1,129 997
d. t Inlcildcd Premiulll 234 250 258 258 298 266 308 314 304 351 3,214 316 301
c. Regular gasoline 342 367 358 370 427 330 378 396 379 433 4,455 396 361
r. Kerosene 373 384 380 352 412 361 409 401 382 451 4,679 461 378
g, Diesel 3,343 ,3,709 3.693 3,626 3.689 3,367 3,712 3.889 3.561 3,804 43,000 3.622 3.341
h, Fuel oil :; 3,515 3.827 3,906 4,202 3,596 3,969 4.093 3,739 4.015 3,665 45,039 3,590 3.851 -i.I.PG 736 749 731 749 842 813 819 830 772 834 9,439 894 794 -j As()halts 17 18 16 17 16 12 11 46 53 53 297 26 23
l Sllh ellIS 32 26 27 30 17 29 25 2 6 28 283 5 5
I. Lubricaling oils and l!n:a'il."s 99 110 105 107 120 108 104 117 92 101 1,279 126 77
m Rdinc:ry' fuel & loss 357 314 306 361 362 327 348 220 290 306 3,929 309 331
n. Naphtha 0 35 30 37 0 0 40 49 0 26 242 18 0
o. Others 3 4 4 4 3 1 2 3 3 2 35 2 13
:'. Index oh-aluc nfprududilll111fkcy
manulacturing. b) induslr) (IYK:,= 100l
~I,\NlJF ..\CTlJR1N<i 4344 446.7 437.5 4562 4745 487.2 488.8 487.6 524.6
a Food 3010 308,5 270.1 247.4 217,8 235.5 223.2 245.6 2728
b. Llc\"Clagc 3151 396,9 407.4 365.6 373,1 338.1 385,1 442.8 421,8 ,
c, Tobacco 1538 198.5 2066 196.3 199.4 183.8 194.6 205,1 204.8
d. Textile 1460 142.5 146.2 137,9 154.5 167.1 165.9 166.8 161.2
c. Vicaring apparel 180.2 202.0 233,6 200.2 247.5 256,0 271.7 229.6 231,6
r. Wood and wood products 1298 129.3 127.4 1309 130.8 133.4 142.5 139.6 140.8
g. Fumiture and fi.'(tun:s 4309 4998 444.4 449.5 524,1 528.3 607.2 68~5 600,3 -h. J)apcr and paper products 194,9 227.0 219.8 250.1 243.0 2069 201.9 199,9 198.6
L Chemicals and chemical products 299,5 313,6 298.4 337,0 335.5 305.1 3318 352,1 354.6 -j. Rubber products 1520 161.0 153,5 168,1 215.1 161.4 197.3 191.8 188.4
L "etrolcum products 228.9 239.8 231.0 . 228.4 241.2 2508 2100 261.6 263,1
I. Non- metallic mineral products 416.3 437.0 439.2 415,7 4100 362,0 369.6 379,8 375,0
m. Dasic melals 427.2 3540 380,1 436.8 459.4 501.2 540.4 5182 5163
n. Transpon equipment 2,475.2 2,349.1 2,407.5 2,290.5 3,088.0 2.973,1 2,532,9 1,888.6 2,4714 .•. 1.••••
o. Electrical machineI') 932,9 1,0476 1.007,3 1,230.5 1.0539 1,197,3 1,407.7 1.519.1 1.585,7 " "
fl. Miscellaneous 363.3 3388 346,0 342.9 361.6 334,7 3087 374.4 361.5 \.' .'1 !
Note; Delails may not add up 10 lotals due to rounding.Sourccs: Dcpm1ment or Energy and the National Statistics Office.
A-2

A. PRODUCTION ANI) CONSUMI'TION (continued)
1997 1998INDICATOR. Mar Apr May Jun Jul Aug Sep Ocl Nov Dec Jan Feb Mar
6, Petroleum consumption hy industry(thousand barrels) 5,641 6,319 6,580 6,587 5,905 5,867 6,589 6,053 6,233 6,080 72.644 5,474 5,514
ManufaclUring 1,031 988 1,036 1,140 1,243 1,150 1,217 1,075 569 834 12.126 1,122 945Beverages 73 82 86 86 83 79 91 87 70 62 953 84 73Tobacco 9 10 10 12 13 11 6 9 6 5 102 8 7CocoNegclable oil 51 49 63 43 71 42 83 49 64 69 724 63 45Sugar 62 49 42 63 67 49 49 84 67 68 695 60 68Other food processing 128 140---162---147 68 146 206---161 143---143--1;838 144 118"Textile/Apparel 105 108 110 109 126 49 99 97 91 72 1,165 77 83- Wood Prod!FumilUrc 8 11 9 11 10 10 10 9 6 11 110 10 8Paper ProdlPrinting 60 61 68 55 68 64 71 71 68 61 748 58 58- Chemical except fertilizer 74 74 74 71 79 80 104 76 63 101 943 74 86Fertilizer 15 8 18 25 17 10 29 13 16 10 189 12 10RubcrfRubbcr products 17 16 19 19 19 19 24 22 17 10 217 16 19Glass/Glass products 52 63 45 53 52 59 63 54 62 65 688 61 41Cement 129 96 100 178 180 173 177 171 169 200 1,864 234 137I.ube refining 61 49 59 82 85 178 12 (6) (472) (181) (289) 48 42Other mln-mclallic minerals 21 23 21 19 18 13 19 17 11 13 210 14 13Basic metals 159 140 142 154 170 154 156 161 167 107 1,802 140 120r..1ach inc')'/1 :qui flmen! 9 9 10 11 17 14 18 20 21 18 164 19 17
Mining. 70 76 81 65 46 46 67 56 99 50 762 81 63('onslructilln 108 132 116 111 115 108 110 112 119 110 1.331 113 102Transport 715 716 736 711 704 745 696 721 689 727 8.509 684 557Railwar 1 1 1 1 1 1 1 1 1 1 12 1 1Ruad Iranspon 202 208 211 201 208 180 204 212 197 222 2,427 211 181Walertranspon 384 414 424 408 395 477 400 423 401 411 4,874 395 340Air transport 128 92 100 101 100 87 91 85 90 93 1,193 77 35
Commercial 105 117 108 69 71 75 79 203 216 249 1,538 219 174Wholesale trade 90 100 99 62 63 66 72 196 209 241 1,396 211 166- Financing and housing 1 1 1 1 1 1 1 1 1 1 12 1 1Private services 14 16 8 6 7 8 6 6 6 7 130 7 7
Agriculture 253 266 245 234 273 210 265 266 239 358 3,097 257 203Fishery 173 197 182 179 208 158 202 183 168 150 2,136 186 178Agri crops pwtlucts 59 50 43 38 51 33 47 66 54 45 600 58 14[.ivcshlCkJlJuullry 3 4 4 3 5 4 5 8 3 1 49 4 4Agri services 3 4 3 3 3 3 3 3 3 1 35 4 3l:orcSII)' 16 12 12 11 6 12 8 6 11 161 280 5 4
Power gelleralilill 2,421 3,007 3,298 3,298 2,381 2,659 3,165 2,880 3,639 2,796 34,118 2,274 2,623Others. N.El' 581 660 603 602 710 547 644 520 463 648 7,235 415 516Heliner)' fuel and 1,ISs,,:s 357 357 357 357 362 327 346 220 200 308 3,929 309 331
Noh:: Details llIay Iwi ;Idd lip hI hllals due hi ruunding..Startill~ J;llluary 1997.1;.hular limnal IlrpelrukllHl prmlutl consumption h" imiuslry was rc\'isnl
Slllln.:I.': lh.:p;uII1lClll IIITlll.'ft!.y. . .
A-3

II. SALES
1997 Tolal 1998
Itrlll Mar A r Ma Jun Jul Aug Se Oel Nov Dec 1997 Jan Feb Mar
\'olulIIl: ilr
I\liljnr Appli;\n~l,.'S 444,306 510,477 535,513 529,383 503,653 436,151 556,042 407,112 454,498 501,079 5,717,212 322,773 336,473
Rdrig.:rator 46,473 46,147 49,609 53,266 61,578 42,321 39,594 56,284 43,947 46,544 574,149 29,927 30,695 .
I.duor 39,528 38,803 38,697 43,390 50,758 36,591 34,324 46,011 37,560 41,837 484,583 25,619 26,569
2-dllm 6,895 7,312 10,878 9,849 10,774 5,727 5,265 8,267 6,367 6,689 89,202 4,277 2,340
()ther" 50 32 34 27 46 3 5 6 0 18 364 31 1,766
Fr.:.:l..:r (llprighl) 2,295 4,051 3,890 2,875 1,638 2,869 977 2,303 1,741 3,077 29,483 1,007 2,324
\\'a.~hingMa~'hin.: 47,372 56,368 53,496 71,218 65,184 53,655 63,124 41,471 56,049 64,264 676,554 19,534 45,061
\'a~"Uum Cleaner 2,473 402 816 394 208 734 286 533 326 303 7,371 212 355 -Air,"on 20,500 19,439 28,_ 26,505 16,521 11,994 22,680 14,717 15,008 18,129 225,362 10,200 14,018 -
Room 18,078 16,897 25,680 23,988 13,397 9,546 19,363 11,559 12,088 14,704 191,637 7,882 11,991Split Type 1,216 1,399 1,285 1,163 1,685 1,118 1,865 1,443 1,519 2,412 17,579 1,303 1,077P.u.:kagcd 1,206 1,143 1,439 1,354 1,439 1,330 1,462 1,715 1,401 1,013 16,146 1,015 950
Rice COOK•.••. 11,255 12,928 14,257 13,195 14,807 19,209 21,400 17,498 19,129 18,838 184,581 10,517 12,779
Flat Iron 22,360 22,843 21,518 29,635 25,639 25,870 22,868 24,032 21,769 24,376 289,215 14,290 20,806
T03.."tcr 6,786 7,006 6,572 7,242 6,568 6,370 6,732 5,420 8,756 10,985 87,844 3,_ 5,730
Sto\'e- 32,966 37,236 37,589 39,331 34,163 36,326 47,033 38,077 44,749 35,892 452,331 43,707 39,162
Range 4,561 5,456 4,924 5,429 5,547 5,106 5,070 8,220 6,817 8,578 72,329 8,056 5,411
Elcl,:1ril: Fan 74,125 131,887 127,937 120,898 112,030 105,634 114,900 107,110 97,656 98,057 1,244,595 71,847 66,417
Video 86,835 81,150 91,602 80,210 80,908 66,282 102,615 37,628 59,067 79,565 911,339 57,328 44,886
81ill:kI\\'hile T\' 4,679 2,619 1,039 2,047 1,396 1,329 1,184 3,181 861 581 25,236 479 351 -Colored TV 82,156 78,531 90,563 78,163 79,512 64,953 101,431 34,447 56,206 78,984 886,103 56,849 44,535
Audio 53,377 50,006 60,825 54,511 46,674 40,980 58,846 39,686 53,436 59,271 617,170 35,941 27,885
Music Component 15,552 ' 9,808 14,350 14,343 12,096 10,860 17,992 14,133 17,783 19,911 171,783 15,876 7,129
Radio Ca.\.'icttc: 14,219 11,993 12,910 11,497 16,113 8,990 18,547 9,518 11,655 15,357 155,300 12,303 5,816
Kardoke 23,606 28,205 33,565 28,671 18,465 21,130 22,307 16,035 23,998 24,003 290,087 7,762 14,940
Video Player/Recorder 32,928 35,558 34,074 24,674 32,188 18,801 49,917 14,133 24,046 31,200 344,883 16,523 21,144
Sourc~: Philippine Ele.•1rieal Eler.:tronics and Allied Industric!> Federation.
8-1
C. TRANSPORTATION AND TOURISM
1997 Total 1998
INDICATOR Mar Apr May Jun Jul Aug Sep Ocl Nov Dec 1997 Jan Feb Mar
I. Philippine National Railways
a. No. of passengers carried(thousand) 59 58 72 51 37 43 45 47 41 66 616 621
be Passenger kilometres(loousand) 15,339 16,898 19,966 14,399 10,294 12,506 12,579 12,697 12,022 19,918 171,609 19,119
- c. Express tonnage 332 399 307 321 301 295 264 379 290 256 3,779 300-e. Gross receipts(thousand pesos) 9,203 9,870 11,637 9,560 7,181 8,202 7,918 17,650 7,416 15,430 120,069 10,956 8,015
1. Passengers lransportatio 8,874 9,503 11,263 9,022 6,861 7,865 7,489 17,281 7,066 14,633 115,203 10,543 7,614
2. Frcigllt 3 3 3 213 95 382 765
3. Express 317 356 326 329 299 311 327 355 313 354 3,883 359 358
~. Bagg.age 11 11 1. 11 9 8 10 11 9 8 118 5 5
5. Miscellaneous rc\'COUC 37 42 50 31 25 34 33 34 35 62 443 56 42
6. Less: passenger fare discount
refund Bnd allowance 39 45 19 46 13 16 36 31 7 9 343 7 4
,2. MClrllrail
a. Number of passengers
(thousand) 9,816 9,863 9,863 10,850 12,300 11,618 12,006 11,953 11,810 12,598 134,389 11,721 11,047
b. Gross revenue (lhousamJ) 90,583 91,676 91,530 100,320 113,278 106,967 111,146 110,093 109,205 116,469 1,238,546
Sources: rhilippinc National RaiII"Q)"s and tighl Rail TranSIt ""lhoril~'.
C.1
C. TI{ANSI'ORTATION ANIJ TOURISM (colltinuell)
1997 Total 1998€'
. ;. INDlCI).TOR Mar Apr May Jun Jul Aug Sep Oct Nov Dec 1997 Jan Feb Mar
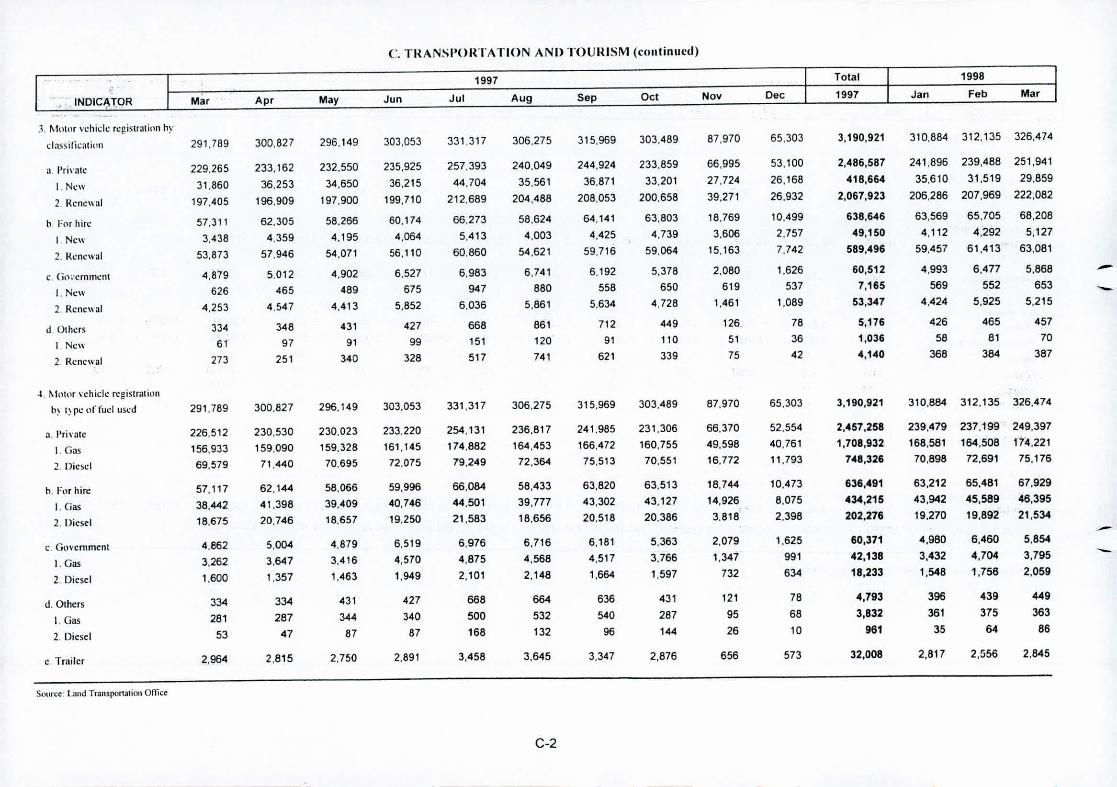
.1. Molllr ,'chide rcgiSlralion hy
tlassilicali,lIl 291,789 300,827 296,149 303,053 331,317 306,275 315,969 303,489 87,970 65,303 3,190,921 310,884 312,135 326,474
a Prh'alc 229,265 233,162 232.550 235,925 257,393 240.049 244,924 233,859 66,995 53,100 2,486,587 241.896 239,488 251,941
I.New 31.860 36,253 34.650 36,215 44.704 35.561 36.871 33.201 27,724 26,168 418,664 35.610 31,519 29.859
2. Hcncwal 197,405 196,909 197,900 199,710 212.689 204.488 208.053 200.658 39,271 26.932 2,067,923 206.286 207,969 222,082
h, For hire 57.311 62,305 58.266 60.174 66,273 58.624 64,141 63.803 18.769 10,499 638,646 63,569 65,705 68,208
I. New 3.438 4,359 4,195 4.064 5,413 4.003 4.425 4.739 3.606 2.757 49,150 4,112 4,292 5,127
2. Hem:wal 53,873 57,946 54,071 56,110 60,860 54.621 59.716 59,064 15,163 7.742 589,496 59,457 61,413 63.081
c. Cill;"Crnl1lcnl 4.879 5.012 4.902 6.527 6.983 6,741 6,192 5,378 2.080 1.626 60,512 4,993 6,477 5,868 -J. New 626 465 489 675 947 880 558 650 619 537 7,165 569 552 653 -2. Rcnc\\itl 4,253 4,547 4.413 5,852 6.036 5.861 5.634 4,728 1,461 1,089 53,347 4,424 5.925 5.215
d Others 334 348 431 427 668 861 712 449 126 78 5,176 426 465 457
I. Nc\\ 61 97 91 99 151 120 91 110 51 36 1,036 58 81 70
2. Renewal 273 251 340 328 517 741 621 339 75 42 4,140 368 384 387
~ Mnl(lf \'chicle rcgislr.lIitln
hy l~pc nffucl used 291,789 300.827 296.149 303,053 331,317 306.275 315,969 303.489 87.970 65.303 3,190,921 310,884 312,135 326.474
a. )'ri"Ollc 226.512 230,530 230,023 233,220 254,131 236.817 241.985 231,306 66.370 52.554 2,457,258 239,479 237,199 249,397
I. Gas 156,933 159,090 159.328 161,145 174,882 164.453 166,472 160,755 49,598 40,761 1,708,932 168,581 164,508 174.221
2. Diesel 69,579 71,440 70.695 72.075 79,249 72,364 75,513 70,551 16,772 11.793 748,326 70,898 72,691 75.176
h. Fur hire 57,117 62.144 58,066 59,996 66,084 58,433 63,820 63.513 18,744 10.473 636,491 63,212 65.481 67.929
I. Gas 38,442 41,398 39,409 40,746 44,501 39,777 43,302 43,127 14,926 8,075 434,215 43,942 45,589 46,395
2. Diesel 18.675 20.746 18,657 19.250 21,583 18.656 20.518 20.386 3.818 2.398 202,276 19,270 19,892 21,534 -c. (ion-:mment 4.862 5.004 4,879 6.519 6.976 6,716 6,181 5.363 2,079 1.625 60,371 4,980 6.460 5,854
I. Gas 3.262 3.647 3,416 4,570 4,875 4.568 4,517 3.766 1,347 991 42,138 3,432 4,704 3.795 -2. Diesel 1,600 1.357 1.463 1,949 2,101 2,148 1,664 1.597 732 634 18,233 1,548 1,756 2,059
d.Olhers 334 334 431 427 668 664 636 431 121 78 4,793 396 439 449
I. Gas 281 287 344 340 500 532 540 287 95 68 3,832 361 375 363
2. Diesel 53 47 87 87 168 132 96 144 26 10 961 35 64 86
c Trailer 2,964 2,815 2,750 2,891 3,458 3,645 3,347 2,876 656 573 32,008 2,817 2,556 2.845
Source: l.anJ Tr.lI1sport.1lioll om,e
C-2

C. TRANSPORTATION AND TOURISM (conlinued)
1997 Total 1998
INDICATOR Mar Apr May Jun Jul Aug Sep Ocl Nov Dec 1997 Jan Feb Mar
5. Domcslic air uansport
a. Total no. of a;rcratl
movement 28,346 28,613 30,252 30,503 22,538 27,559 30,666 31,375 30,746 37,479 356,004 33,026
NCR 11,503 9,537 11,142 10,599 10,712 10,747 11,898 12,425 12,712 16,377 141,371 12,816
CAR 362 180 350 198 186 26 58 168 216 2,402 232
R~giQ!1I 668 448 436 600 590 474 830 592 672 428 6,978 712
Region 2 590 1,396 848 980 728 708 682 598 616 778 9,084 706
Region) 618 596 424 554, 500 230 616 648 624 508 6,676 412-- Region 4 988 780 1,278 1,044 908 732 1,086 1,174 1,158 1,322 12,876 1,066- Region S 592 898 668 568 844 808 838 808 692 410 8,458 824
Region 6 4,852 4,774 3,978 4,194 2,864 3,688 3,890 4,196 4,454 5,192 50,924 5,050
Region 7 3,869 4,458 4,846 3,254 402 3,894 4,642 4,866 4,376 4,212 46,511 4,186
Region 8 728 970 1,030 1,042 976 928 946 586 502 1,126 9,820 926
Regiun 9 2,468 2,140 1,824 3,290 2,164 2,012 1,802 1.748 1.638 2.820 25,598 2.370
Region 10 64 864 1,052 1.132 852 980 1.128 1.174 1.050 1.126 11,006 936
Region II 392 1.572 1.744 2.640 414 1,902 1,982 1.796 1,544 2,328 18.382 2.172
RegillR 12 652 632 408 398 430 268 596 708 636 5,918 618
b. TOlal no. of passengermll\'CnlCnt 950,300 1,341,667 1.394,205 1,157,825 824.716 1.108.618 1.110,363 1,233.351 1,823,470 1.975.045 14,897,042 2.007.111
NCR 447.549 547,046 594,499 487,323 473.583 448.639 457,734 508.151 523,912 554.281 5,877,592 525.529
CAR 5.178 2,704 7,685 1,472 3.163 662 1,455 3,474 9.144 44,449 6.386
Region I 5.496 1,022 990 5.970 6.070 8.118 6,389 5.820 11,406 11.748 74,047 10.128- Region 2 6.920 11.997 8.285 8.768 4.123 6,484 6.597 6,409 11,698 15.648 98,369 23.788- Region 3 1.346 1.226 929 1.180 1.064 487 508 1,580 2,806 2.570 16,435 2,326
Region 4 10.336 29.768 39.037 31.655 25,296 35,431 27.908 31.545 59,546 59.542 407,232 51.182
Region 5 23.323 39.037 35.639 27,298 33,485 33.531 34.211 33.342 58,960 42,754 407,409 62,498
Rqdull () 141.815 164.861 158.874 140,662 118,714 127,417 . 121,501 143.236 261.160 243.068 1,876,916 324.620
Region 7 208,395 261.688 272,604 202.338 10.532 201.932 216,334 249,229 444.310 481.902 2,978,894 511,074
Reginn K 23,624 35.361 43.919 38,130 32.625 35.932 31,965 22.313 38,654 80,848 429,339 69.508
Rcgil1n I} 46.962 51,246 36.099 50,660 47.789 48.565 41,714 48,939 93.928 96,468 640,452 81.270
Regiull 10 2,079 48.643 55,434 50.287 43.237 48,078 52.963 57,880 116,596 127,548 669,179 99.624
Rcg.ioll II 11.138 114.879 121,976 100,679 1'.340 98,280 96.972 104,229 168.130 218,188 1,150,529 208.736
Rcgitlll 1.2 16.139 32.189 18,235 11,403 13,695 15.062 14,112 17,204 32.364 31,336 226,200 30,442
••.' 1I",llll:I:lIIIIIII;I.lll1'lI
N"k 1>.11" 1111 ;111 1':\\S<-'I1~l:1llh'\l'lIll'UI mdmlc "'1;11 p.l\\\:IW.:r ,1111\aI, lIalls;l :11,,1dCI',1r1ufl" C-3S'"11(l:' f\1;uula lull'lllall,'''''! l\u[1I1I1.•\"tlUIi ,l~ . ,\Ir II ,m'I",,',III<UI Il!lin'

C. TRANSl'OllTATlON ANI> TOURISM (CllllliIlIlOd)
1997 Total 1998
INDICATOR Mar Apr May Jun Jul Aug Sep Oct Nov Dec 1997 Jan Feb Mar
c. Tnlal nu til' cargu 111mcllIcnl
(~iltlgrallls) 15,571,532 17,353,053 17,522,186 22,274,347 12,247,414 18.195,849 21,598,457 19,916,064 19,854,983 64,114,090 257,846,105 15,770,021
NCR 8,229,100 7,143,430 6,340,600 8,953,890 8,403,737 6,967,300 8,378,510 8.090,466 8,378,770 8,154,440 93,055,225 6,137,428
CAl{ 13,002 6,193 17,508 4,242 10,226 3,008 4,083 7,898 11,034 101,329 8,225
Region I 374 25 483 199,191 39,784 87,356 80,000 54,992 19,200 15 665,710
Rcg.i(m 2 36,433 105,799 70,068 90,751 39,848 74,609 89,644 74,753 78.976 64,062 774,426 68,710
Region J 1,060 18,500 7,500 22,180 54,275 22,865
Region 4 51,406 431,710 483,410 414,365 409,998 571,650 387,705 383,353 204,972 306,999 4,243,315 229,487
Region 5 223,552 186,773 222.710 174,935 352,374 254,731 370,328 315,960 244,614 277,634 3,023,479 266,200 -Rcgi(ln 6 1,315,544 1,319,450 1,318,930 1,388,471 1,594,148 1,244,161 1,811,676 1,602,361 1,749,144 8,263,041 23,513,011 1,344,496
3,959,504 4,117,632 4,726,088 159,057 3,077,471 4,743,129 3,983,650 4,040,149 4,089,388 44,604,978 3,502,993 -Region 7 4,430,310
Rcgi{ln 8 293,966 279,540 302,999 327,591 24,028 192,392 297,694 171,869 192,323 285,306 2,819,709 230,735
Region q 586,575 458.563 395.425 846,041 377,361 644,872 546,111 533.879 586,412 5,450,510 11,307,145 496,078
Region 10 19,487 579,377 788.413 1,048,135 375,968 821,907 988,096 1.285,146 1,192,051 1,029,949 9,575,786 534,800
Region II 274,180 2.669,554 3.314.305 3.917,643 284,666 4,101,962 3,783,634 3.272,943 3.085,346 36,072,012 62,501,158 2,846,745
Region 11 96.443 213,135 149,703 183,004 176,219 154,430 117,847 120,294 75,526 87,520 1,606,559 81,259
6. Visitor i1rrirals b~' c(1unll') ~If
residence 181,713 172,568 161,302 171,204 187,192 184,274 172,209 188,208 218,590 233,694 2,222,523 186,332 173,998
it, Ascan 11,599 14,176 12,317 12,741 13,241 12,136 13,396 13,630 16,622 12,391 155,226 11,897 11,516
b, Easl Asia 74,650 70.636 68,282 74,337 88,104 101,216 79,546 79,569 87,103 84,010 971,870 79,831 69,726
c. South Asia 1,937 2,239 2,720 2,450 2,088 1,933 2,282 2,208 2,905 1,678 26,189 2,092 2,603
d. Middle East 1,381 1.526 1,460 1,428 2,088 1,845 1,456 1,683 1,725 1,376 18,334 1,115 1,531
c. North A~rica 43.011 37,378 41.957 43,604 38,868 31,473 34,448 42,661 46,307 58,911 491,523 43,210 39,545
r. Cenlfal America 97 92 79 110 80 86 117 118 158 135 1,238 151 120 -g. South America 233 271 241 247 231 245 284 275 301 599 3,452 327 300 -h. Western Europe 13,635 10,488 7,988 8,362 11,107 8,061 8,382 11,197 14,382 15,364 133,198 13,351 12,812
i. Northern Europe 12,245 10,707 7,931 9,867 10,518 7,957 9,584 11,219 12,049 13,337 126,094 12,330 15,074
j. Southern Europe 2,251 2,360 1,798 1,830 2,389 2,205 1,933 2,519 3,230 3,017 27,959 2,435 2,192
k. Eastern Europe 355 360 386 296 324 204 347 314 540 381 4,368 444 728
I. Oceania 9,237 8,203 7,743 7,829 8,301 7,418 '0,161 8,218 9,734 13,957 105,391 8,037 8,186
nl. Africa 303 284 277 217 210 170 319 222 284 217 2,913 226 313
n. Others & not specifiedresidences 1,405 1,692 1,653. 1,578 1,560 1,918 1,595 1,981 2,261 1,658 20,227 1,520 1,346
o. Overseas Filipinus 9,374 12,156 6,470 6,308 -' 8,083 7,407 8,359 12,394 20,989 26,663 134,541 9,366 8,006
Nole: Sum or volul1Ie of car~o IOilded and unloadcd.Sources: Manila International Airpol1 AuthorilY, Ai •. Trausp0l1a!ion ORicc. J}cP;UlIl1t111 ofTourisln.
C-4

D. EXTERNAL SECTOR1997 1998
INDICATOR Mar Apr May Jun Jul Aug Sep Ocl Nov Dec Jan Feb Mar
1. Guiding rale: average (I) per lJSS)a. liuying rate 26.226 26.248 26.248 26.257 26639 29034 32.110 34.163 34218 36.855 29.205 42.331 39.955 38.659
b. Selling rate 26.438 26.482 26.488 26.498 27.797 29.579 32.660 34.724 34.778 37.474 29.647 43.002 40.760 39.309
c. Inter-banI.: guiding rate average 26.332 26364 26.372 26.377 27.265 29331 32.395 34.464 34.518 37.171 29.437 42.661 40.414 39.004
2. Salary remittance of OWfScas
Filipino workers (million U.s.S) • 383.8 398.2 382.6 358.4 469.9 534.1 492.3 5286 506.5 5900 5,741.8-. 8. Land.b85C'd 353.9 373.7 362.1 336.9 4458 511.6 474.9 511.1 490.8 5722 5,484.2- b. Sea-based 29.9 24.5 20.5 21.5 24.1 22.5 17.4 17.5 15.7 17.8 257.7
3. Extcmallrade (F.O.R. in million lJSS)
a EXflons 2,001.0 2,082.4 1,982.9 2,1291 2,067.1 2,258.0 2,337.5 2,326.1 2,308.4 2.2306 25,227.8 2,1152 2,2272
h. Imports 2,935.2 2,942.1 2,954.4 3,032.3 3,1692 3,327.9 2,956.5 3,413.8 2,9453 2,792.7 35,933,8 2.837.9 2.585.2
c. Balanccortrade (934.2) (8597) (971.5) (903.2) (1,102.1) (1.069.9) (6190) (1,087.7) (636 9) (562.1) (10,706.0) (7227) (3580)
•. Including residenl aliens.
Sources Dill1~ko Senltill n[[ PihpinOlS. and lhe N:llional Sldlinics Office
-.
. 0-1

Il. F:XTF:RNAL SECTOI{ (cunlinucd)
1997 1996. INDICATOR "Mar Apr May 'Jun Jul Aug Sep Oct Nov Dec Jan Feb Mar
~. I lltal value of mcrch:.lluJisc: imptlrl\ hy
I~penfgoou IF.o B in llliJli~11l list) 2.9352 2.942.1 2.9544 3.032.3 3.1692 3,327.9 2.9565 3,4138 2,945.3 2.792 ..7 35,933.8 2.837.9 2,5852
;1 f\lachincf} tlliler Ih~1I1ckl:lrk 355.3 4430 411.3 3829 492.1 4214 427.1 "4792 4260 4530 5,135.4 463.4 343611.Mineral fuels. lubricants
alld related nlalcriah 303.5 187.5 156.0 330.7 276.6 272.4 182.9 3299 241.5 2356 3,074.2 207.9 180.1c Base metals 153.5 153.4 168.8 1372 132.9 201. I 142.1 1368 87.2 92.1 1,656.8 93,8 76.8d Cereals and ccreal prcparatiuns 914 94.7 100.5 859 79.2 47.5 46.5 680 322 662 770.9 704 702c. Iranspt1r1 equipment 140.7 211 2 2406 194.1 155.3 349.1 1451 148.3 1928 148.2 2,262.1 1861 127.6 -f Organic and il1l1rganic chl'micat .• 766 577 604 514 656 535 71.5 528 46.5 48,1 687.1 54.3 413g, Chemical materia'" and PWdUClS 27.7 256 273 293 32.0 280 27.6 329 24.1 205 321.3 229 253 -Ii H:ctric machinery. apparatus
and aprl ianccs 327.4 4735 5242 5159 6568 5503 5745 6949 6629 604 I 6,465.9 650.6 5720i. TC\lilcs lil:k:rs (nol manufaClur.cd into
~am.lhn:adtlffabricsl and \\aSlc sill.. 220 265 24.6 22.8 19.5 16.I 167 14.4 96 11.6 221.9 142 10.2j. Dairy PfIldtKIS. and hiI'd..•' egg. 37.3 38.1 26.9 37.6 309 34.7 37.4 29.4 353 26 I 405.4 205 266k. Mal1ufilctlJrCS of metals 374 439 37.7 652 339 40.5 529 365 37.4 433 510.8 435 334I TC.\lilc yam. filhrks. make.up
articles and related products 121 4 1200 122.0 1130 1046 1062 1104 1102 686 635 1,275.6 937 73.9111 !'apcr. papcrbtlUrd and manuracillre~
thereof 93.9 86.0 69.1 830 31.1 26.2 32.4 29.8 27.0 17.7 567.6 27.6 19.9n Professional. scicntilic and cuntrolling
instruments; photog.raphic and opticalgoods. walchcs &. ClllCI..S 40.5 39.6 346 380 436 36.9 344 40.4 489 36.3 465.3 37.1 39.0
ll. Medicinal and pharmaceutical produCIS 300 28.3 293 204 37.9 290 246 34.0 26.6 21.0 331.2 31.8 73.5p. Fish and fish prcparalion 6.4 4.7 3.5 64 3.6 6.4 54 7. I 3.9 7.I 71.2 4.4 2.5 -q Miscellaneous manufactured articles 42.7 38.2 449 41.9 52.4 47.8 464 54.3 420 36.7 516.5 392 25.3 -r. Non.metallic manufactuTCs.n.c.s 288 26.1 254 24.7 23.4 24.0 22.2 16.2 17.3 222 263.6 16.9 10.5s. Dyeing. tanning and coloring malcrials 16.1 15.7 14.2 13.2 14.6 140 14.8 17.7 11.5 11.6 174.6 13.3 11.11. Fcrtil izcrs. manufactured 150 17.9 13.5 26.5 24.5 32.9 16.5 25.1 10.9 9.0 213.6 12.7 12.6u. Others 9656 808.3 7992 810.0 6563 987.9 922.9 1.051.9 870.7 796.6 10,522.2 733.6 807.6
Source: Nation~1 Slahslics om,,:
0-2
--
--
D. EXTERNAL SECTOI~(continued)
1997 1998
INDICATOR Mar Apr May Jun Jul Aug Sep Oct Nov Dec Jan Feb Mar
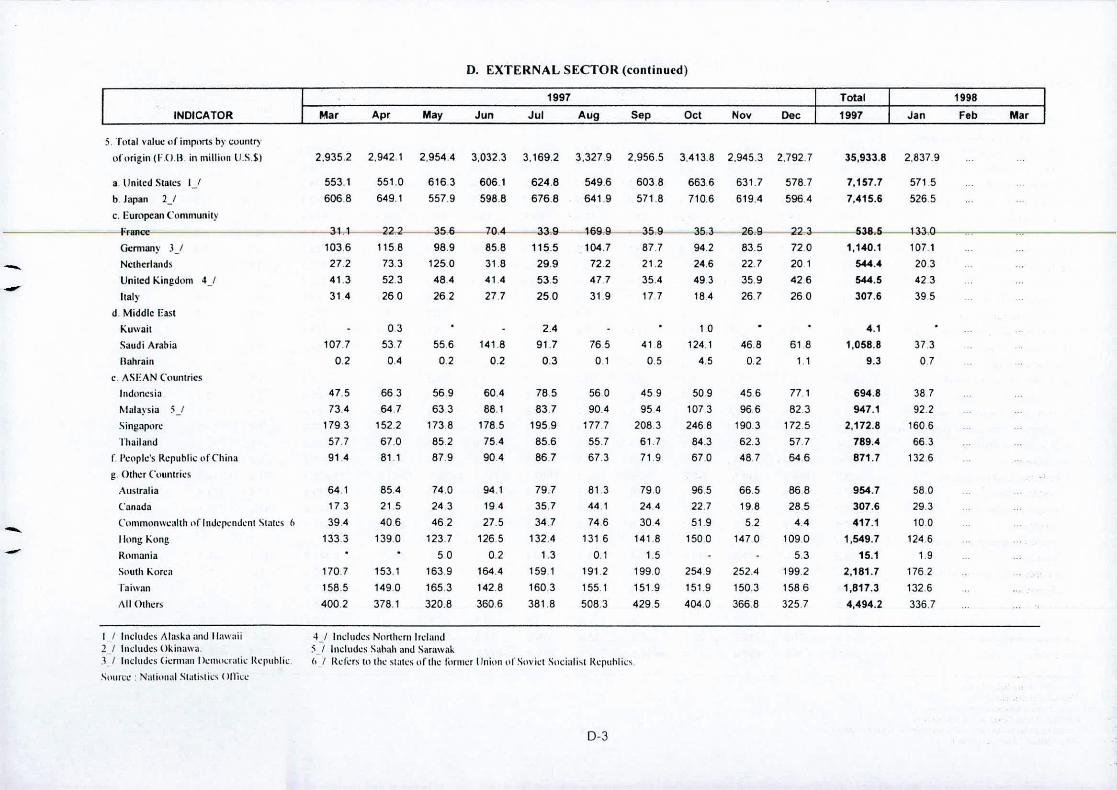
5. Total ••.."Iue (If imports by count!')
ofurig.in (Hl.B in milliun U,S,SoI 2.935.2 2.942.1 2.9544 3.032.3 3.169.2 3.3279 2.956.5 3.4138 2.945.3 2.792.7 35.933.8 2.837.9
a, United Stales l-l 553.1 551.0 6163 606.1 6248 5496 603.8 6636 631.7 578.7 7.157.7 5715b. Japan l-l 6068 649.1 557.9 598.8 6768 641.9 5718 710.6 619.4 596.4 7.415.6 5265c. European Cummunity
France 31.1--22.2--356--70.4--33.9 --169.9--359--35.3 -- 26.9-- 22.3---538.5--1330Germany lJ 1036 115.8 989 858 115.5 104.7 87.7 94.2 83.5 720 1.140.1 107.1Netherlands 272 73.3 1250 318 29.9 72.2 21.2 24.6 22.7 201 5«.4 203United King.dom 'J 41.3 52.3 484 41,4 53.5 47.7 35.4 493 35.9 42.6 5«.5 42.3Italy 31.4 260 262 27.7 250 31.9 177 184 26.7 26.0 307.6 395
d, Middle EastKuwail 0.3 24 10 4.1Saudi Arabia 107.7 53.7 556 141.8 91.7 765 418 124 I 468 618 1.058.8 373Bahrain 0.2 0.4 0.2 0.2 0.3 01 0.5 4.5 0.2 1.1 9.3 0.7
c. ASEAN (\lunlricsIndonesia 47.5 663 569 60.4 78.5 560 459 509 456 77.1 694.8 387f\lalapia 5-' 73.4 64.7 633 88.1 83.7 90.4 95.4 1073 966 62.3 947.1 92.2SingilJ1l.m: 1793 152.2 1738 178.5 1959 177.7 208.3 2468 190.3 172.5 2.172.8 1606I'hailalll.l 57.7 67.0 852 754 65.6 55.7 61.7 643 62.3 57.7 789.4 663
f. Pcople's Republic (If China 91.4 61.1 87.9 90.4 66.7 67.3 71.9 670 467 646 871.7 1326~. Other C(luntrics
,\ustralia 64.1 854 74.0 94.1 79.7 81.3 79.0 965 665 666 954.7 580Canada 173 21 5 243 194 35.7 44.1 244 227 198 265 307.6 29.3Conllnlln\n:a1th nflndcpcndcnt Slates 6 394 406 462 27.5 34.7 746 304 51.9 5.2 44 417.1 100((nog Kong 1333 1390 123.7 1265 132.4 1316 141.8 1500 147.0 1090 1.549.7 124.6Rtllllania 50 0.2 1.3 0.1 1.5 53 15.1 1.9Suulh KOfe.l 170.7 153.1 1639 1644 159.1 191.2 1990 2549 2524 1992 2.161.7 1762raiwnn 156.5 1490 165.3 142.6 160.3 1551 151.9 151.9 150.3 1586 1.617.3 1326All Others 400.2 376.1 3206 3606 361.6 506.3 4295 404.0 3666 325.7 4.494.2 336.7
I J Indudes AlaSKa and Hawaii2-' lududcs Okin;lwa.J.' Includes (icnnilll J kllltluali~ Repuhlie.
~tlmee : Nalillilal Sl.lti .•lil; .. ()Ilil.:C
-t_1 Indulles Northern Ireland5_1 Inchll.lcs S,lhah and Sarawilk(I I Rt.:li:rs In (he st,lle!' oflhe li.trlllcr (lniul1 tlfStivicl Sociali .•l Rcpuhlit.:s
D-3

II. EXTERNAL SECTOf{ (continncd)
1997 Total 1998
.... INDICATOR Mar Apr May Jun Jul Aug Sep Oct Nov Dec 1997 Jan Feb Mar
h rilial valu..: tlf mcrdlillldisc c\pI1rb
(F nit in lIlillinn U.S,S) 2,0010 2,0824 1,9829 2,1291 2.067.1 2,258 a 2.337.5 2.326.1 2.3084 2.2306 25.227.8 2.1152 2.227.2
;1 I,t1gs mllilurllhcr 08 0.0 04 03 1.0 0.6 0.5 4.0
h ("lprer c.:llrl\:cnlralc\ 38 46 39 3.0 5.8 4,7 2.8 34 28 08 44.2 4 1 20
c, Sugar II 5 1 15,1 88 134 17.7 5.9 68 82.7 12.4 8.8
d. ('tlC\lIlUlllil ~I 34,1 45.9 185 829 53.3 72,3 498 584 64.9 88.2 674,2 854 656
c.I'I)\\Ilt1d )1 07 07 06 04 0.6 09 01 04 5,6 0.3 02
r Dcssicalcd ({lCI\llUI 65 56 6.5 78 81 6.6 8.0 7,6 7,7 9.2 88,3 45 7.0
g. Bananas (fn:sh) 189 17,2 19.6 15.5 15,7 20.0 16.7 21.0 197 185 217.1 156 17,1 -h (il,ld <I 19 1 36.6 255 29.1 288 249 206 28.3 21.2 13.7 288.4 264 19.4 -i Cilpra"\lill:ah \11 Illcal 42 33 26 37 3.7 48 4.5 39 58 5.1 52.6 5.1 2,9
j Ahaca Ul1manUfaclurcJ 2.0 33 24 24 1.2 1.7 1.6 16 1.7 3.3 25.5 2.6 1.7
l. Pincappk ;mt.l pineapple Tlrl1duI.:b 126 12,3 107 146 11.4 16.8 11.6 130 10.4 164 149.7 116 10,2
J. ~hllasscs inedihle 23 1.6 18 09 09 1.3 12 24 14,9 0.9 2.5
Ill. I'mllantl cement
n Veneer sheels &:. (tlrcsllJd 0.3 2.3 04 as 03 0.2 39 33 11.2 21 02
o. Unmanufactured rUbaeCll 34 1.2 34 57 2.6 1.6 19 23 1.3 3.3 29.8 26 08
p. Imn ore aggI11llH:r:lIcs (sinlers) 66 7.0 49 85 7.5 '82 36 94 10.0 6.9 88.8 63 6.8
~ Shrimps & pra\\l1s.fn:sh.t.:hillcdlfnucll 11.6 7.8 84 94 61 10 4 132 16.2 15.9 12.0 126.9 7,1 11.7
f. \\\)(ldcran and furniture 421 37,7 34.8 418 39.9 39.7 34.7 339 42.2 34.1 453.5 31 6 361
s. Chrtlmium lire 02 2.4 as 10 0.9 03 08 0.4 0.8 0.4 7.7 0.2 0.2
t Electmnics and Clllllpuncnls' 8651 9199 8946 8426 792.0 9893 1,087.1 1.0851 1,058.5 1.049.8 11.077.2 1,0718 1.114.5
(a) Micro~circui(s 167,9 1740 185.7 162.1 155.6 1563 1620 209.0 199.3 205.1 2.070.6 189.4 171.4
(b) Semi -conductor 512.2 525.8 492.9 497.2 481.7 5998 676.4 648.4 635.9 593.0 6.486.5 697.3 756.1
(c) O(hcrs 185 a 220 2 2161 183.3 204.8 233.2 2487 227.6 2233 251.7 2.570.3 1901 1870 -u. Articles or apparel and c1uthingaccessories 1932 161.0 1899 2162 227.4 241.1 2194 167.4 1940 211.7 2,348.4 146.9 186.6 -
'Y. Cordage. cable. mpe & twille 1.3 1.1 12 1.6 1.6 1.2 14 1.2 1.4 1.5 15.2 1.0 1.2
w. Foutwear 138 17.3 15.8 18.1 16.9 18.3 157 139 19.6 15.0 193.7 124 13.0
:'1:. Tuna 51 140 11.7 118 10,1 163 140 13,3 16.2 12.7 17.7 163.6 153 12.6
)'. Com~e nol roao;tcd. raw or green 0.1 0.2 1.0 3.0 0.1 6.3 10.7 02
z, Petroleum products 16.1 31.9 182 22.5 253 13.9 16.0 17.5 27.4 4.3 241.9 12.6 7.4
aa. Othcrs 723.1 7348 6980 777.4 7336 7595 810 0 812.8 7790 715.9 '8,761.8 631,4 698.5
I/lnclut.!es eenlnfugal ant.! fclilll:!!,2/lucludes cnuJc lllld refined)1 First class. ordinary "lid olhe, plp"ood ..(1 E\l",~lC,j hom copper orcs & COIICClllraics5/ Includes fresh. (rOZCll. prell.lred or prcserved in airtighl conlainef 0-4Source: Nalional Slalislics Office
D. EXTERNAL SECTOR «olliinned)
INDICATOR Mar Apr May Jun1997
Jul Aug Sep Oct Nov Dec
Total
1997 Jan
1998
Feb Mar
201 15170-8--934
139.7 143.3690 65659 56
20.0 21.6909--963
121.6 129.774.9 101581 7.0
--
--
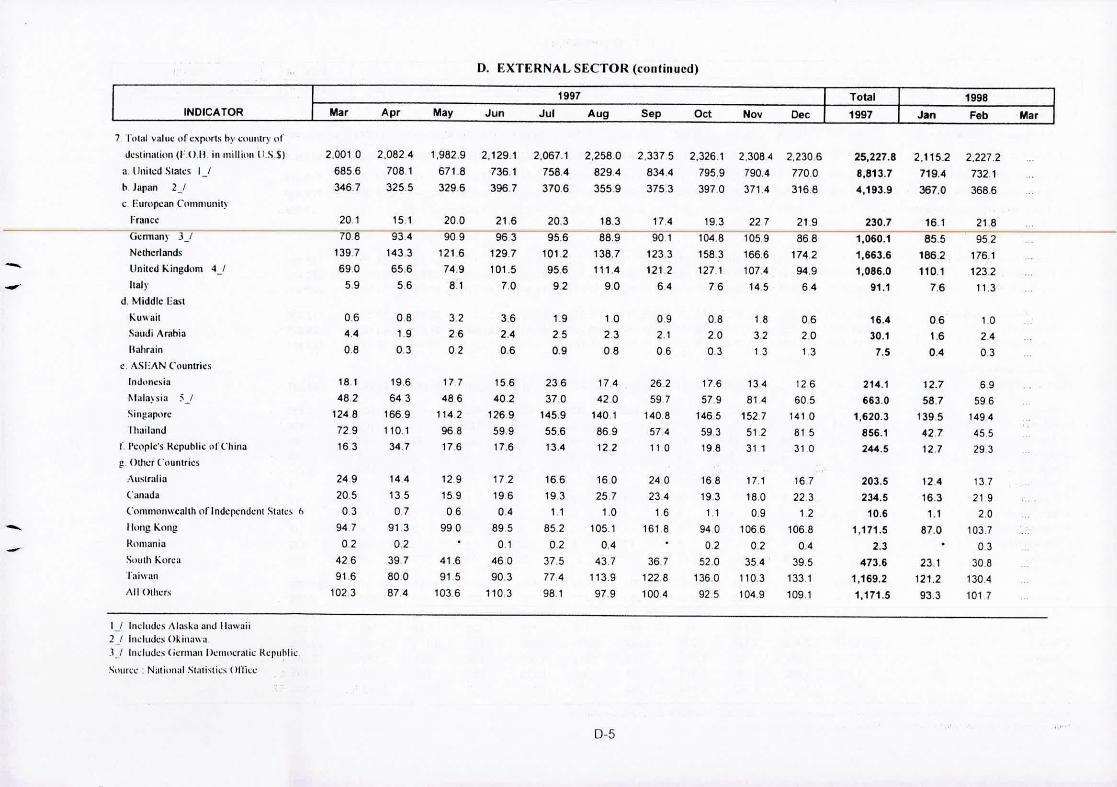
7. rotal value of c.'(rx'r1S hy ctltJlltry (11'
destination(FOB in millioll USS)
a. lJnilcd Slnlcs 1_'
h. Jaran 2)c. EUTllpcan Cn1ll111Ullil~
I=rancc
Gennan) 3_'
Netherlands
United l\ingdllm ~ I
Italyd, Middle cast
J\u ••••.ail
Saudi ArahiaBahrain
c. ASEAN ('(lunITies
Incl(IJlcsia
to.l.lla)sia 5_'
Sin~ilrtlfC
Ih"i1and
r. I'cIlplc's Republic l,rChinag. Other ('oUlllries
:\uslrali ••
('anada
('()mmonwcalth 11flndcJlC'ndcnt !'ital!;!, fl
Iiong Knng
KomaniaSouth Kureal":IiwOIn
All Others
_, Indlllies Alaska ant.! ",Iwaii2) Includes Okinawa.1) Includes (icrm,lIllh.'llltlcrali, I{'pulllk.
SOLIn.:, : Naliunal Slali~tk ••Ollkc
2,001 068563467
064.4
08
18.1
482124872.9163
249205039470242.69161023
2,0824708.13255
0819
0.3
1966431669110.134.7
1441350791.30239780.0874
1,982.9671.83296
32
2.6
02
1774861142968176
12915906990
41.69151036
2,129.1736.1396.7
362.40.6
156402126959.9176
1721960.4
89501
4609031103
2,067.1758.43706
20395.6101295692
192509
23637.0145955613.4
1661931.1
8520237.577.498.1
2,258.0829.43559
18.38891387111.4
90
10
2.3
08
17.4
420140.1869122
16025710
105.10.4
437113.997.9
D-5
2,3375834.43753
174901123.3121 264
092.1
0.6
262597140.8574110
24023.416
1618
36.712281004
2,3261795.9397.0
19.31048158.3127.176
082.00.3
17.657.9146559.3198
1681931.1
9400.2
52.0136.092.5
2,308479043714
2271059166.6107.414.5
1 83213
134814152.751 231.1
17.1
18.00.9
10660235411031049
2,230677003168
219868174294.964
06201 3
126
6051410
815310
16722312
10680.4
39.5133.1109.1
25,227,88,813.74,193.9
230,71,060.11,663,61,086.0
91.1
16.430.17.5
214,1663.0
1,620.3856,1244.5
203.5234.510.6
1,171,52,3
473.61,169.21,171.5
2,115.2719.4367.0
16.185.51862110.17.6
06160.4
12.758.7139542.7
12.7
12416.31.1
87.0
23.1121.293.3
2,227.273213686
218952176.11232113
1.0
2403
695961494
455293
13721920
103.70330.8130.4101 7
" ....

E. EMI'['OYMENT
1997 1998INDICATOR Mar Apr May Jun Jul Aug Sep Ocl Nov Dec Jan Feb Mar
I. Emplnymcnl services
I I Jon \';tcancics slllicitcd/rt:pnrlcd 48,122 58,704 35,506 78,962 30,350 24,257 38,583 37,912 67,113 31,754 510,881
12, Applicants placed 49,142 54,817 38,467 65,275 21,688 22,632 30,130 30,681 75,533 27,902 478,920
a Rcginnal cmp!n)'IllCllI cenh:f\ 11,076 10,733 '7,290 7,706 13,144 14,718 15,320 17,913 30,416 21,158 170,1701:1.<.'llnununily Cmpl{l)'mcnl centers 37,046 41,051 28,797 54,662 5,970 4,354 10,621 8,760 42,972 6,254 279,409c. I.neal/private recruitment ag.encies 1,020 2,993 2,380 2,907 2,574 3,560 4,189 4,008 2,145 490 29,301
.1. lh-crscas cmph)ymcnl
;] Pwccsscd contract \nlrkcr~ 67,194 75,643 63,862 64,581 68,218 57,330 55,251 57,179 50,692 54,750 755,350 -I. Land-based 50,461 56,842 47,657 48,483 51,261 44,526 40,302 36,661 33,350 41,427 552,4402 Sc,J-ba!icd 16,733 18,801 16,205 16,098 16,957 12,804 14,949 20,518 17,342 13,323 202,910 -
h. Ikpluycd C\lnlracl uorl.:crs 68,101 72,230 65,350 64,292 66,813 59,515 55,879 53,649 52,609 57,334 747,696I. I.and.based 51,742 55,325 49,286 49,159 51,663 44,252 40,331 36,897 34,663 43,482 559,2272 Sca-h3-~cd 16,359 16,905 16,064 15,133 15,150 15,263 15,548 16,752 17,946 13,852 188,469
,Deployed landba\cd Cllnlrm;l \wrkcrs
hy Ct1Unlry of dcslinalit1n 3_1 51,742 55,325 49,286 49,159 51,663 44,252 40,331 36,897 34,663 43,482 559,227
I Africa 151 172 202 157 188 260 437 406 414 606 3,517a AIg.eria 35 17 35 17 4 16 146 135 10 108 576b :\n!!ola 25 36 38 43 44 45 55 53 63 35 531 ' ..C. MowcclJ 1 2 4 2 1 0 1 0 1 5 21d. Nig.eria 46 50 55 31 40 117 144 136 238 238 1,264c. Somalia 0r. Sud:m 2 6 1 6 31 12 4 0 I 1 72g. West Africa 8 7 4 4 1 4 5 25 7 113 187h Zambia 1 3 0 3 1 1 0 0 3 4 17 -i Africa (ump.) 1 1 7 4 17 8 32 8 13 34 138 -j. Others 32 50 58 47 49 57 50 49 78 68 711
2. Asia 24,560 21,637 20,404 20,745 24,701 19,079 16,665 15,827 14,497 18,197 235,126iI. Brunei 674 847 952 820 651 " 777 793 782 760
..902 9,594
b. lIongkong 13,274 8,593 7,287 6,232 10,350 6,340 3,140 3,107 3,152 3,049 78,513c. Indonesia 111 143 '47 141 180 146 128 123 117 288 2,031d. Japan 1.840 2,492 2,450 3,030 3,532 2,944 2,895 3,712 3,170 3,764 33,200e. Malaysia 1,125 1,252 1,164 1,286 1,236 1,318 1,061 939 704 686 13,581r Singapore , ,215 1,283 1,381 1,674 1,229 1,103 1,216 991 737 1,915 16,055g, Others 6,321 7,027 7,023 7,562 7,523 6,451 7,432 6,173 5,857 7,593 82,152
a J Includes depJo~'ed landt'lased contracl workers by courllry of dt.'S!lIt•.,linn. LAC NAJA c,.bin crews. ilnd f>OEA Regio.lal ElI:lcnsioll Units.SIHIICCS: Dcpar1ment ofl.abof and Employmellt. and Philippine Overseas Emplu)'lllt.'l11 Adminislf;lIiun
E-1

E. EMPLOYMENT (continued)
1997 1998INDICATOR Mar Apr May Jun Jul Aug Sep Oct Noy Oec Jan Feb Mar
J.Occllnia 152 193 185 134 155 175 157 118 117 168 1,9708. Nauru 1 4 6 4 5 3 3 3 2 5 47b. PNG 145 165 154 108 139 125 143 96 105 152 1,726c. Others 6 24 25 22 11 47 11 19 10 11 197
4. Europe 943 1,525 1.193 1.011 1.077 1.531 764 533 546 771 12,626a. Austria 36 45 45 26 34 24 18 10 11 24 379b. Greece 42--66--48--40---32--40---16---21---34--'28 460c.llaly 657 1.118 896 751 701 1,221 581 340 298 408 8,915- d. Spain 46 53 60 54 71 54 28 46 92 71 669e. Switzerland 21 26 21 9 26 10 8 18 11 32 262.- 217 131 182f. Others 141 123 213 113 98 100 208 1,941
:5.Middle Easl 19.234 23.267 20.043 19.864 18,360 16.531 16.076 14.073 13.294 15.776 221,047a. Bahrain 174 297 325 275 266 291 338 216 203 203 3,341b. Iraq 0 0 0 a 0 0 0 a 0 2 2c. Kuwait 688 899 860 843 881 963 890 710 844 867 10,205d, Libya 447 690 801 465 458 436 561 0143 352 491 6,270e. Oman 310 399 343 360 348 339 332 299 208 318 3,970f. Qatar 830 803 671 605 690 784 739 539 500 476 8,294g. Saudi Arabia 13.753 17.910 14,901 15.204 12.937 11.247 10.813 9.833 9.363 11.529 160,302h. UAE 2.760 1.940 1,893 1,875 2,547 2,263 2.210 1.818 1,651 1.591 25,579i. Others 272 329 249 237 233 208 193 215 173 299 3,084
6. Americas 434 676 569 606 568 554 492 582 618 630 7,058a. Canada 121 144 135 153 144 161 130 138 147 170 1,714b. Guam 75 89 76 96 32 43 102 75 51 48 844- c. U.S.A. 164 212 222 190 188 173 184 173 172 201 2,397.- d. Others 74 231 136 167 204 177 76 196 248 211 2,103
7. Trusl Terrilories 472 511 443 457 373 421 506 424 381 335 5,280a. Palau 78 92 93 76 54 55 77 67 78 75 901b. Saipan 3,244 329 278 307 268 291 326 291 260 206 6,452c.Olhcrs -2,650 90 72 74 51 75 103 66 43 54 -2,073
SllUrcc; Philippine: ()vcrscas 1:lllplllYIl1CIlt Adminislraliun
E-2

..,E. EMI'LOYMENT (ClIlllill.llcd)
1997 1998INDICATOR Mar .. Apr May Jun Jul Aug Sep Oct Nov Dec Jan Feb Mar
j Stril.c llnlil;cs
a I'ending. I1q:illlling. 126 103 124 .92 89 90 113 98 120 126 1,245
b Ne\\ cases filed 55 96 56 74 79 83 .88 84 73 37 892
c. T{ll;11 handled 181 199 180 166 168 173 201 182 193 163 2,137
d Tnlal disposed 22 75 88 68 78 60 93 62 67 18 742I. SClllcd/dccidcd/\\ ilhdra\\n '4 65 70 54 61 47 76 52 53 17 5952. ..\ssulIlcd jurisdictitll1 by the labor
Sccn:lary 0 0 2 2 2 1 0 . 0 2 0 103. <. 'crtilicd fur compulsory arhilralion 1 0 0 0 3 1 0 0 0 0 8 -4. Materialized inhl actual strikcslluckuuls 5 5 12 7 10 7 9 4 5 , 81;. Others 1 0 1 0 0 3 3 5 0 14 -
" Actual slriles
:1. Pending. hcginning 10 9 3 10 6 13 '4 8 8 3 100
h Nel\ cases declared 4 5 12 8 15 10 9 4 5 2 93
10: Ttlla! handled 14 14 15 18 21 23 23 12 13 5 193
d T,ll;:J1 disposed 6 11 5 13 8 9 14 4 10 4 100I. Selt lcd/d~'cidcd!\\ ilhdra\\ n 2 9 5 9 2 7 11 4 5 3 692 Assurncdjurisdkti'ln b~ Ihe 130M
sccrctar) 0 0 0 2 3 1 2 0 1 0 113. Certified flIT c{lmpulsur~.. arhilralinn 4 2 0 0 2 1 1 0 3 0 154. Others 0 0 0 2 1 0 0 0 1 1 5
c. Workers involved ('000) 3 2 4 10 3 14 2 52
f. Mandays lost fr(lm lln.going strikes ('000) 46 43 30 70 83 81 100 58 33 15 717 -Nl)lc; Includes actual !>lrikcs/locL;uuts \\'ithuut nOlil.:cs -Source: National Conciliation and Mediation Bnard
E-3

F. PRICES
1997 1998
INDICATOR Mar Apr May Jun Jul Aug Sep Oct Nov Dec Jan Feb Mar
I. Inll<lIiuTl Rmc
;t, I'hilippines 4.8 46 42 48 48 45 5.3 57 6.5 6.1 5.1 6.4 7.4 7.3
h Mclw Manila 7.0 60 59 6.9 6.9 5.8 6.8 70 7.0 6.9 6.6 7.8 84 7.6
c. An.:a ••oU!sidc ~lclrl\ Manila 40 40 3.6 4.1 4.0 40 47 52 6.3 58 4.5 6.0 7.1 72
2. Purchasing p{I\\Cr of peso
a Philippines 0.42 0.42 0.42 042 0.42 0.41 0.41 0.41 0.41 0.41 0.42 0.40 0.40 0.40tJ, MClro Manila 0.39 0.39 039 0.38 0.38 0.38 038 0.37 0.37 0.37 0.38 037 0.36 0.36
c. Areas outside Mctrn Manila 044 0.44 044 0.43 0.43 043 043 0.42 0.42 0.42 0.43 0.42 0.41 041- 3. Consumer price index fi.lr the Philippines (1988= 100)- ALL ITEMS 2358 236.1 2360 239.0 239.3 241.1 242.5 2432 244.7 2456 239.2 2480 251.4 253.0a Food. hc\'cragcs and whaCCt") 220.4 220.5 220.1 221.4 220.9 222.6 223.8 223.7 224.3 224.7 221.6 2264 2292 2303b, Clothing 1930 193.1 193.3 194.1 194.5 195.1 195.9 197.3 197.8 198.6 194.7 199.8 202.3 2033c. Illlusing and repairs 311.9 312.6 3132 315.7 318.4 320.1 3234 325.7 328.3 3298 317.6 334.5 3404 3440d Fuel. light and waler 2482 2502 2486 2496 248.9 255.0 254.5 256.5 259.9 261.4 252.0 2640 269.4 3690C, SCr\' ices 2700 270.6 2718 288.4 290.6 291.8 2937 295.9 300.5 303.6 284.5 307.6 3109 313.1(, ~fisc~lIancous 187.2 1872 187.4 187.8 188.2 188.5 1888 189.8 1907 191.6 188.4 193.1 196.5 198.7
4. C\\nSUOlCr prkc indc'i Itll Mclm Manila (1988= 100)
,'\lL ITEMS 257.7 257.5 2583 263.3 263.2 264.4 265.7 267.3 267.9 270.1 261.9 272.4 276.4 277.4a Fooo. bncragcs and h\haccn 212.4 211.0 2130 2141 212.2 211.5 2130 213.8 212.5 214.8 212.3 214.1 216.1 217.3b. ChHhing 183.4 183.7 1838 183.9 183.6 1835 1833 183.2 183.9 184.6 183.3 187.9 190.9 191.1c. Iiousing and repairs 3869 387.8 387.8 388.3 391.8 394.2 397.7 400.3 402.0 403.2 391.0 408.9 417.5 418.2d. Fucl. light and \\aler 2455 2498 244.9 2438 242.5 259.0 253.3 258.5 263.3 266.4 251.9 268.9 278.3 273.8e. Services 266.9 267.3 2680 300.8 301.5 302.0 303.3 305.4 308.9 312.9 289.2 320.2 322.2 324.6f Miscellaneous 185.0 184.9 184.5 184.8 184.5 184.3 1842 185.0 185.8 187.0 184.9 189.3 192.3 194.4-- ). Consumer price ind(x for areas outside Metro Manila (IQS8= I00)
ALL ITEMS 228.7 229.2 2288 2312 231.6 233.5 234.9 235.4 237.1 237.7 231.8 240.1 243.3 245.1a, Food beverages and tobacco 222.4 222.9 221.9 223.2 223.1 225.4 226.5 226.2 227.3 227.2 224.0 229.5 232.5 233.6b. Clothing 1954 195.4 195.7 1966 197.2 198.0 1990 200.8 201.3 202.1 197.6 202.8 205.1 206.3c. Housing and repairs 2606 261.2 262.1 266.1 268.1 269.4 272.5 274.6 277.9 279.5 267.4 283.6 287.7 293.3d. Fuel. light and water 249.2 2504 250.0 251.7 251.3 2535 254.9 255.8 258.6 259.5 252.0 262.2 266.1 267.2e. Services 271.4 272.0 273.' 283.0 285.9 287A 289.5 291.8 2968 299.6 282.5 302.1 305.9 308.1f. fl.1isccllaneous 187.7 187.8 188.1 188.6 189.1 189.5 190.0 191.0 191.9 1927 189.2 194.0 197.5 199.8
Source: National Statistics omcc
F-1
F. I'IUCES (4.'onlinucd)
1997 1998INDICATOR Mar Apr May Jun Jul Aug Sep Oct Nov Dec Jan Feb Mar
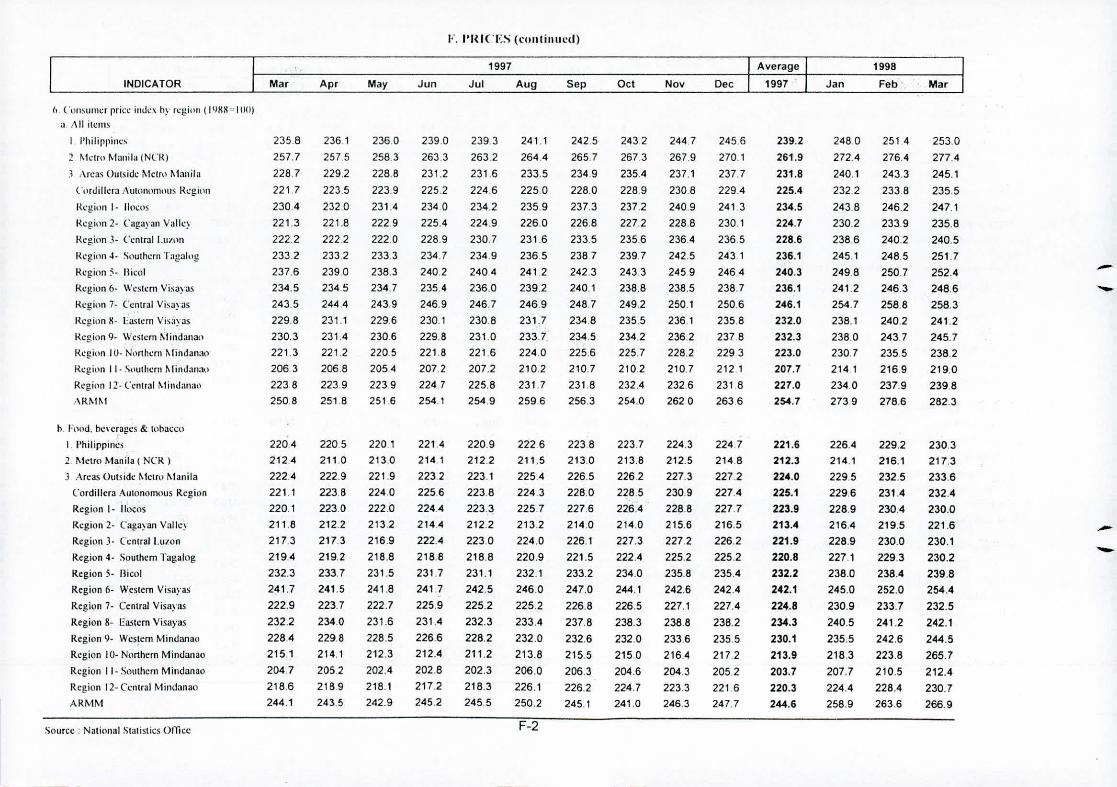
6. {'omul1Il:r pril:l: illl1l:\ hy rqdoll (ItJXX'" lOll)•• 1\ II ill:lllS
I I'hilippilll:.' 235.8 236.1 2360 239.0 239.3 241.1 242.5 2432 2447 2456 239.2 248.0 251.4 2530~ i\klw i\lllniia (Nl'I{) 257.7 257.5 258.3 263.3 2632 2644 265.7 2673 267.9 270.1 261.9 2724 2764 277.4.l Areas Oulsidl: Mctw r-.fanila 228.7 2292 2288 231.2 231.6 233.5 2349 2354 237.1 237.7 231.8 240.1 243.3 245.1{'mdilkm.<\tlltlnnnlllllS I{l.:gillll 221.7 223.5 223.9 225.2 224.6 2250 228.0 2289 230.8 2294 225.4 2322 2338 235.5!{l:gion 1- IIllcos 2304 232.0 2314 2340 234.2 235.9 237.3 237.2 240.9 2413 234.5 2438 246.2 247.1HegillO 2. Cagayan Villle~ 221.3 221.8 2229 225.4 2249 2260 2268 227.2 228.8 230.1 224.7 2302 233.9 235.8Hegi(lO J. ('enlral I.U/I)fl 2222 2222 222.0 2289 230.7 231.6 233.5 235.6 2364 2365 228.6 2386 240.2 240.5Hegilm~. Sl1ulhern TagnhlJ; 2332 2332 2333 234.7 234.9 236.5 2387 239.7 242.5 2431 236.1 2451 248.5 251.7Region 5. lliCllI 237.6 2390 238.3 240.2 2404 241.2 2423 243.3 2459 2464 240.3 2498 250.7 252.4 -Hegilln 6- Western Visaya~ 234.5 234.5 234.7 235.4 236.0 239.2 240.1 238.8 238.5 2387 236.1 241.2 2463 248.6 -Region 7. Central Visilyao; 243.5 244.4 2439 246.9 246.7 2469 2487 2492 2501 250.6 246.1 254.7 2588 258.3...Hcgion 8- Ea<>ternVis.lyas 229.8 231.1 2296 230.1 2308 231.7 2348 235.5 2361 2358 232.0 238.1 2402 241.2Hcgion Q. Weo;lcm Mindanao 230.3 2314 2306 229.8 231.0 233.7. 234.5 2342 2362 2378 232.3 238.0 243.7 245.7Ht,'g.ivn IU. Ntlr1hem Mindanatl 221.3 221.2 2205 221.8 221.6 224.0 2256 2257 2282 2293 223.0 230.7 2355 238.2Hegilln 11- Slluthem MindalKhl 206.3 2068 2054 207.2 207.2 2102 210.7 2102 210.7 212.1 207.7 214,1 2169 219.0Reg.itm I:!. {'cntral i\liIHJanal\ 2238 2239 2239 2247 225.8 231.7 231.8 232.4 232.6 231.8 227.0 2340 237.9 2398..\RMM 2508 251.8 251.6 254.1 254.9 2596 256.3 254.0 2620 2636 254.7 2739 2786 282.3
h. Fond. hC\c~ages &: Illl:JaCCll
I. Philippines 2204 2205 2201 2214 220.9 2226 2238 223.7 2243 2247 221.6 2264 2292 23032. Ml:tr{l Manila ( NCR) 2124 2110 2130 214.1 212.2 211.5 213.0 213.8 212.5 2148 212.3 214.1 216.1 217.3J Areas Outside Melto Manila 2224 222.9 221.9 2232 223.1 2254 226.5 226.2 227.3 227.2 224.0 229.5 232.5 233.6Cordillera Autonomous Rcgilln 221.1 2238 2240 2256 2238 224.3 2280 228.5 230.9 2274 225.1 2296 231.4 232.4Regilm I. Ilocos 2201 2230 2220 2244 223.3 225.7 2276 2264 2288 227.7 223.9 228.9 230.4 230.0Region 2- Caga)an Vallc~ 211.8 212.2 2132 2144 2122 2132 214.0 214.0 215.6 216.5 213.4 2164 219.5 221.6 -Region J. Ccnlrall.ullln 217.3 217.3 216.9 2224 2230 224.0 226.1 227.3 2272 2262 221.9 228.9 230.0 230.1 -Region 4- Southern Tagalog 2194 219.2 218.8 2188 218.8 220.9 221.5 222.4 225.2 225.2 220.8 227.1 2293 230.2Region 5- Hieol 232.3 233.7 231.5 231.7 231.1 232.1 233.2 234.0 235.8 235.4 232.2 238.0 238.4 239.8Region 6. Western Visayas 241.7 241.5 241.8 241.7 242.5 246.0 247.0 244.1 242.6 242.4 242.1 245.0 252.0 254.4Region 7- Central Visayas 222.9 223.7 222.7 225.9 225.2 225.2 226.8 226.5 227.1 227.4 224.8 230.9 233.7 232.5Region 8. Easlem Visayas 232.2 2340 231.6 2314 232.3 233.4 237.8 238.3 238.8 238.2 234.3 240.5 241.2 242.1Regilln 9- Wcs!cm Mindanall 2284 2298 228.5 2266 228.2 232.0 232.6 232.0 2336 2355 230.1 235.5 242.6 244.5Region IO~Nmthem Mindanao 215.1 214.1 212.3 2124 211.2 213.8 215.5 215.0 216.4 2172 213.9 218.3 223.8 265.7Region 11- Suuthcm Mindanao 204.7 205.2 202.4 202.8 202.3 206.0 2063 2046 2043 205.2 203.7 207.7 210.5 212.4Region 12- O:ntral Mindal1all 2186 2189 218.1 217.2 218.3 226.1 2262 2247 2233 221.6 220.3 2244 228.4 230.7ARMM 244.1 243.5 242.9 2452 245.5 250.2 245.1 241.0 246.3 247.7 244.6 258.9 263.6 266.9
Source: Nalional Statistics Office F-2

F. PRICES (l'IlIItillllt.'d)
714.6 679.1 684.4 6940 672.5 7339 795.1 8768 846.5 900.5
1,17191,084.11,11321,10371,098.01,10391,1340 1,114.6 1,'22.5 1,136.3
787.7 784.5 784.4 778.7 778.0 7793 7750 771.5 771.4 773.2
7574 743.0 719.1 724.3 726.4 711.1 7213 745.8 735.9 736.6
--
--
INDICATOR
7. l'llll!'>tlIllCr pril;c index tlf Jilll!.!. hc\Cr,,~c'andl\lh"':Cll in Melro Manila (]9RR-= 1001
a <:crcal~and c.:rcal prcparatit11l
(I) Cereals
i. Rke
ii ("tIm
(2) Cl"rcal prcparatilln
h, Dairy prtlduCh
c. Egg.s
d, Fish
c Fruits and \Cl,!ctabks
r. Meat
h lkn:ragcs
R General \\h{)lcsalc price indc' in
flolcuuManila (IQ78=IOO)
ALL ITLMS
b Beverages and lobac(O
c. Crude male rials. inedible. except fuels
d. Mineral fuels. lubricants and relatedmaterials
c. Chemicals including animal and
n:gcluhlc oils and fOIlS
[ Manufactured goods classifiedchieny by materials
g. Machinery and transport equipment
h Miscellaneous manufaClUred articles
Source: National Statistics Office
Mar
212.4
2293
256.3
2565
237.5
1731
187.6
181.4
2356
2162
'92.1
2152
2146
181 4
8729
6160
708.0
5578
876.5
Apr
211.0
2298
257.1
2572
2400
1731
'882
'855
2326
201.0
1928
217.0
210.7
1827
8540
610.7
709.6
5578
880.5
May
2130
227.8
2538
2539
244.9
1738
1883
1862
2324
207.6
1993
2188
2109
183 ,
8614
598.6
703.5
557.8
882.6
Jun
214.1
228.9
255.0
255.'
239.6
174.6
186.9
'862
236.0
2144
198.2
2190
210 7
'83.1
8588
5982
704.0
558.8
882.0
1997
Jut
212.2
231.2
258.3
258.4
241.7
174.7
'85.9
'86.5
2335
200.1
1963
2190
208.3
'831
854.5
601.0
698.2
558.8
882.7
AU9
211 5
232.3
2597
2599
241.5
1754
1840
1869
2304
200.8
1939
2192
2058
1837
8593
592.2
699.9
559.9
883.6
F-3
Sep
2130
2334
261 1
2613
243 ,
1758
184 1
1881
23'.7
2104
1938
220.0
2045
181.5
8792
5990
7005
570.7
887.1
Oct
2138
2348
262.9
2631
243.1
, 76.4
1872
'87.7
2436
2063
1932
2186
205.6
180.8
883.3
627.4
701.9
5736
887.2
Nov
2'25
235.8
2639
264.1
244.1
1772
'883
'885
237.1
1950
1950
218.4
2047
'81.3
8832
6203
706.6
573.6
890.4
Dec
214.8
2331
2594
2595
2480
178A
189'
188.1
2594
194.3
1967
218.7
2076
183.7
894.2
631.6
705.6
573.6
893.5
212.3
231.0
258.3
258.4
241.7
174.3
186.2
185.2
235.5
205.0
194.3
217.7
210.9
181,9
872.1
1,119.2
781,1
738.4
763.1
612.3
703,5
563,1
883,1
Jan
214 ,
231.0
2556
2556
2504
179.9
195.7
1890
252.7
190.4
1958
219.7
2098
191.8
1998
Feb
2'6.1
232'
256.6
2566
254.6
181.2
208.4
1902
258.2
186.2
197.2
2208
211.7
200.9
Mar
2173
2329
2570
2570
257.5
182.9
2098
'910
2498
198.6
199.2
221.1
2125
201.1
F. PI{ICES (•...unlillu •...tI)
1997 1998
INDICATOR Mar Apr May Jun Jul Aug Sep Ocl Nov Dec Jan Feb Mar
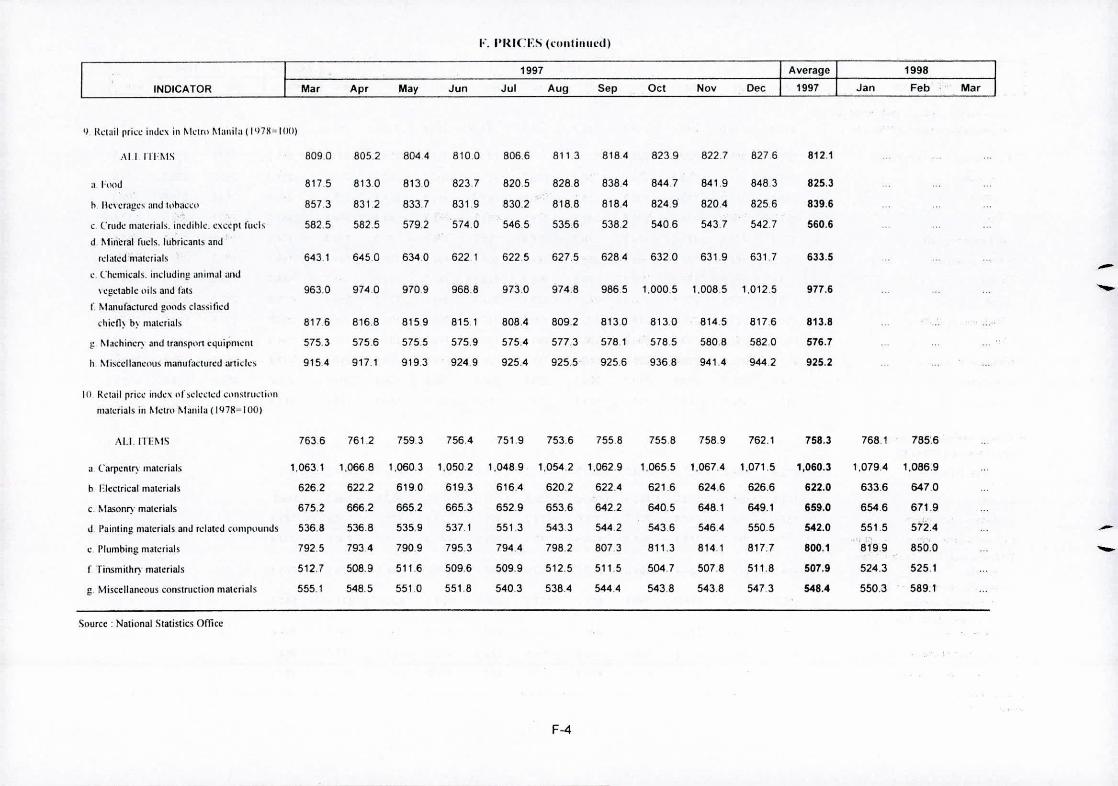
" Ih:lail prh:L'illdL'\ in f\klm f\lanila (11J7X=IOll)
,\1 I IInlS 8090 8052 8044 810.0 8066 811 3 8184 8239 822.7 8276 812.1
01 hlod 817.5 8130 8130 823.7 820.5 828.8 8384 8447 841.9 8483 825.3,. .'
1\ Ikn.:rag.cs and hll\acw 857.3 8312 8337 831.9 8302 818.8 8184 824.9 8204 8256 839.6-0
e. Crude matL'rials. incdihk. c.,,:cpllill.'h 582.5 582.5 5792 574.0 5465 5356 5382 5406 543.7 5427 560.6d Mineral fuds. lubricants and
rdatcd inalcrials 643.1 6450 6340 622.1 6225 627.5 6284 6320 631.9 631.7 633.5c. Chcmkals. including il1limal.lIld -
\cgL'tabtc nils and fau 963.0 9740 970.9 9688 9730 974.8 9865 1.0005 1.0085 1.012.5 977.6 -r. Manufal:tured gU\lds classified
ctJicO) h) materials 817.6 8168 8159 815 1 8084 8092 8130 8130 8145 8176 813.8
g Machincl') and transpl1rl equipmcnt 575.3 5756 5755 575.9 575.4 577.3 5781 5785 580.8 582.0 576.7
h ,'Iiscdl::ml.'uus manufactured articles 9154 917.1 9193 924.9 9254 9255 9256 9368 941.4 9442 925.2
10 Rctail pricc inJc\ llf ~ck'h ..d CIJn~tru,lillll
materials in f\ktm Manila (IQ7R=IOO)
AU. II"~IS 7636 7612 7593 7564 751.9 7536 7558 7558 7589 762.1 758.3 7681 7856
a Carpenll') materials 1.0631 1.0668 1.060.3 1.050.2 1.048.9 1.054.2 1.0629 1.0655 1.067.4 1.071.5 1,060.3 1.0794 1.086.9
b I-:tc:clrkal materials 6262 622.2 6190 619.3 616.4 620.2 6224 621.6 624.6 626.6 622.0 6336 647.0
c. Masonry materials 6752 666.2 665.2 665.3 652.9 653.6 642.2 640.5 648.1 649.1 659.0 654 6 671.9
d. I)ainting materials and rdated Cllmrhlunds 536.8 536.8 535.9 537.1 5513 543.3 5442 543.6 546.4 550.5 542.0 551.5 572.4 -.• ', L',
c I)lwnbing male-rials 792.5 7934 7909 7953 7944 7982 8073 811.3 814.1 817.7 800.1 819.9 850.0 -f Tinsmithr)' malerials 512.7 508.9 511.6 5096 5099 512.5 511.5 504.7 5078 511.8 507.9 524.3 5251
g, Miscellaneous construction materials 555.1 548.5 551.0 5518 540.3 5384 544.4 543.8 543.8 547.3 548.4 550.3 589.1
Source: National Statistics Office
F-4

F. PRICES (colliinued)
INDICATOR Mar Apr May Jun1997
Jul Aug Sep Ocl Nov Dec JanII. Whnlcsak pricl,.' cllllSlrUl:liull materials
intlc.\ ill Mclrn fl.1anila ( 191<5 ~ I (JO)
AI.1 III'MS 2199 2195 219.3 219.1 2186 2188 2188 218.8 220.7 2208 219.5 223.4 227.4
3582
1823
2238
2600
151.1
1630
1587
1907
2276
2456
2480
181.3
1384
2282
1883
1708
1686
2555
1738
1794
1292
2548
'775
2309
1891
227.6
2346
247.5
1806
1368
2132
1828
1694
1686
2555
1724
1785
1292
2548
176.1
2257
343.3 3554
198.1 19'.2
2ZL.Z-2B_2_2_~2.84 __6 _
216.9 223.8
254.2 260.0
140.8 1476
163.0 163.0
154.7 1587
183.7
215.3
224.1
247.1
180.2
133.3
208.6
176.9
169.6
168.6
236.3
168.9
179.1
129.2
254.8
170.4
219.1
344.9
1896
2768
2188
2568
1439
1630
156.9
1872
223.4
2340
2476
1804
1354
2144
1806
169.8
1686
2410
171 9
1790
1292
2548
1758
2247
2144
1872
2234
2340
2476
1804
1335
1806
1698
1686
2404
1719
1790
1292
254.8
1758
2247
1854
2234
2262
247.6
1801
133.3
2074
1751
1698
1686
2400
1697
1790
1292
254.8
'736
224.7
344.9 3449
1884 '891
1.Ll-216.8
217.5 2189
2558 2568
143.9 1439
'6301630
1542 1569
184.1
2162
2262
247.6
1802
132.9
2074
1751
1698
1686
2400
.1702
1790
1292
2548
1736
2247
3457 3457
1933 1875
2 2182166 217.8
2558 255.8
1403 141.1
1630 163.0
1542 154.2
2074
1751
169.5
1686
2400
1700
1790
,1292
2548
1708
2163
343.5
193.9
277 4
2162
254 5
137.5
1630
154 2
181.9 1829
211.5. ,2115
221 1 '221.1
247.6 2476
1802 1802
1328 1329
207.4
1751
169.5
1686
2400
1700
1790
1292
2548
1708
2163
343.5
200.1
277 4
216.2
2545
137.4
163.0
1542
1826
211 5
221.1
247.1
1802
1328
207.4
1769
1695
1686
2322
168.9
1790
129.2
2548
1694
2163
3423
201.2
278.1
2162
2545
1378
1630
1542
1826
2125
221. 1
2472
1802
133.1
2074
1769
1695
1686
2323
1662
178.9
1292
2548
1663
2163
341.5
2045
2781
2162
251.9
1386
1630
1542
'826
2125
221.1
2472
1802
1332
2074
1769
1695
1686
2323
1662
1793
1292
2548
1663
2163(11'\'(' \\:111'1 pipl.:'"
1::\ll:riI11 ck'l;lri~al cquipmclltlsupplics
a Sand. slolle and g.ravel
h Cement
f Fuels and luhricants
c. \\'('\(ld pruducl:o.
g. Asphalt
h {iIOlSS anll gl:1.\' pwduCb
i,lIartl\\arc
j. Metal J1i[ll:s
l.., 1'\'<: rires
r Slrudural sled
III I'lull1hin~ Ihlun'"
q (il sheels
\\', t\lachim'r~ and \,.'llllip"II.:nlll'lllal
I, inh:rillr I,:lcclril.:alli\lun;s ;md lk\"il"cS
r :\lulllinul1Il<:. olher lllt'I;ll pmJIh.::h
-
-
341.5
2100
_________ uum,l::!c_r 2781
d PI)wUlld 216 2
251.9
1395
1630
1542
1826
212.5
221 1
2472
180.2
1332
2074
1769
1695
1686
2323
1662
1793
1292
2548
166.3
2163
-
-
F.5

F. I'I{lCES (c""linnl"')
1997 1998INDICATOR Mar Apr May Jun Jul Aug Sep Oct Nov Dec Jan Feb Mar
I ~ l'wJm:crs' price index 1i.'T
Illanu!;lclurillg. hy illJlIslr~ 117.88 117.55 117.37 11684 115.43 117.22 11868 119.96 119.63;, '",kId m<lllu(ilf.:luring. 128.55 128.48 128.26 12832 127.97 129.13 13036 131.37 131.99
b ()Iher l(llld manufacturing. 120.05 11962 119.85 121.17 121.41 121.25 122.33 123.92 124.19
l' Bncragc 11380 113.80 11380 113.80 113.80 113.80 113.80 113.80 113.80
d h,bacl.:u 159.23 15923 15917 15924 159.24 159.24 15924 159.24 159.24l' Ic\lilc: 89.81 88.55 8827 8822 88.77 8940 8881 8966 8966
Wearing "ppard 171.90 17968 168.02 17352 18683 18250 187.11 200.84 20538g. I cal her &. le.uIH:r rwJucl!<o 156.55 156.55 15655 15655 156.55 156.55 156.55 15655 15655 -h hlllr\\Car 174.83 174.83 17483 17483 24673 24673 24673 246.73 246.73i. \\"t'l\ld and \\\llld prt1thll:IS 155.89 153.81 157.25 15381 15831 172.07 173.99 179.30 179.30 -j Furnilure am! lixturcs 109.16 109.16 109.16 109.16 10916 10916 109.16 110 11 109.20~.Pulp. parer and papacrhnarJ 143.32 14563 14632 143.07 145.04 147.63 147.55 151.00 151.15I Printing and rublishing 13363 13363 13369 133.67 13364 13385 141.01 141.11 141.11
on Indu .•trial ehemkals 11930 117.67 112.79 11601 11931 120.15 11659 12056 12176n (lIhcr chcrnil:"J pr\IJUI.:ls 12341 12602 12412 12409 124.01 124.79 12457 12528 12596
" l'clwlcul1I n;tilll:rics 112.71 11139 10980 10496 93.16 10267 10510 10635 106.35
P .\(isccllanCtlliS pctrllll'ulTl 10708 10708 10708 107.08 107.08 107.08 10922 109.22 109.22q Kuhber prllJucls 101 35 101.35 101 35 101.35 10135 101.35 101.35 101.35 101.35, Plastic rrtldllCI~ 10934 10996 11005 111 07 111.96 11196 113.40 11340 116 71s Other nlln.nn:lililic 10346 10346 103.69 10369 10372 9897 99.71 99.61 9961I (jlass and glass pWdUCI .•.. 97.70 9896 98.96 9525 9437 9501 9539 95.39 9474II Cl:l1lcnl 125.08 121.02 119.82 11901 11901 117.77 117.77 116.29 11629\'. Inm and sled 102.64 9968 107.16 10631 10705 10831 11542 121.37 122.16\\. Non-ferruus me'lal 118.77 115 23 116.56 117.80 11135 112.69 114.97 114.97 11497 -.\. Fabric<llcd metal prtHJUCI!> 106.30 10618 10637 10695 106.41 109.42 120.18 120.24 12022 -)'. Machincf) 103.75 103.75 103.75 103.75 103.79 103.75 103.79 106.21 107.35z. l:leclricalmilchincl') 11740 117.43 117.63 11685 118.26 117.23 117.26 117.62 111.92aa. rranspon equipment 100.58 100.51 100.47 100.18 100.59 100.33 100.08 100.26 100.26ab_ Other manufacluring indu .•tries 106.65 10679 106.64 110.76 10855 104.58 118.92 113.74 11368
Source: Nalional Slalislits Oflicc
F-6

F. PRICES (continued)
'997 '998INDICATOR Mar Apr May Jun Jul Aug Sep Ocl Nov Cec Jan Feb Mar
13. Average retail price or selected locall)'
produced commodities in Metro Manila
(NCR)
• Food
I. Rice. commercial. C -4 (kg) 17.24 1742 17.35 17.42 1759 17.77 17.58 17.66 1765 17.47 17.38 17.54 17.562. Com, whole train. )"cllow (kg) 14.50 14.83 15.13 '4.63 1500 14.83 15.00 1500 15.00 15.30 14.85 1550 1608._Chicken. dressed. broiler (kg) 72.89-12.00 .82 3.58 Q 69.59-20.08_6U6 58-23.50 '1.69-Z2~2-I3.L0
4. Beef. tenderloin (kg) 132.29 13264 133.44 '32.71 '33.30 13347 134.'0 134.34 134.07 '34.14 '33.35 134.36 134.76- S. Pork. pigue or perna (kg) 98.83 99.82 10336 105.49 106 '0 10518 10427 10306 103.29 '03.40 102.6' 10321 103396. Fresh fish. Bangus. medium (kg.) 90.92 90.03 79.94 75.41 72.41 66.96 68.77 7002 6980 70.51 77.47 6975 6913- 7. Tomatoes, medium (kg.) 18.81 '3.62 16.87 27.83 31.74 21.87 20.02 2973 33.84 26.94 22.71 17.08 14.138. Sweet potatoes (kg.) 11.11 10.47 9.31 9.60 9.74 12.03 14.40 13.97 14.26 17.25 12.05 15.85 11.699. Onion, Bermuda. n:d. medium (kg.) 27.59 23.52 22.11 23.61 26.87 27.11 27.30 26.08 2811 3665 31.47 3372 297810. Mongo. green (kg.) 34.13 35.1' 35.42 35.25 35.50 34.96 34.79 35.57 35.33 3522 34.9' 3589 37.25II. Eggs. White Leghorn (pc,) 2.42 2.48 2.49 2.49 2.49 2.47 2.48 2.47 2.48 2.47 2.46 248 248
b. C('Instruclion Materials
I. Ruugh lumber. Tanguilc. (bd ft) 2338 23'6 23.06 22.59 22.64 22.72 2338 2354 2348 23.70 23.22 2349 23642. G,I. pipe. local 1/2" ,20" dia 181.91 181.91 18191 180.88 179.98 164.11 18907 190.25 191.97 19440 185.03 19673 20362J. 0.1. sheet gauge 26. corrugated.
(linear feet) 22.77 22.24 22.70 22.43 22.42 22.59 22.36 22.61 2296 2330 22.64 2409 24.184. Plywood. class C. If4"x4"x8' (shU 292.07 29341 293.04 29054 287.66 28395 273.88 270.34 27057 26983 284.11 27665 276.76;. Portland Cement. Republic 40 kg. 14397 13831 13751 137.57 131.13 130.50 124.49 12554 12624 12563 '34.07 12733 '2847
e. Textile- I. Denims. m4long. ordinary. 4S~ (m.l 115.97 11597 115.96 11620 11623 116.19 116.08 115.97 115.97 11625 116.05 115.95 114.312. Cotlon. printed. 36" wide (m.l 4303 43.04 43.05 4327 41.64 4001 39.99 4004 40.10 40.19 4'.67 40.28 41.28-
d. Fuel
I Gasoline. premium. (liter) 11.28 1154 11.49 11.40 11.40 1189 11.92 12.11 12.11 12.11 '1.61 12.75 13302. Gasoline. regular. (liter) 10.18 10.32 10.22 1004 10.04 1004 10.04 1004 10.04 10.04 '0.11 10.04 10.043. Diesel (Iiler) 7.79 7.67 7.70 7.68 7.65 7.75 7.76 7.83 7.83 7.83 7.84 8.10 8.334. LPG. Shellane. 13.5 (kg.) 181.82 180.36 17648 170.88 171.07 17202 17359 177.95 177.47 177.52 175.74 178.01 178.70
Snuu;cs : BurCillIlI( A~ri,u1tur~1 Slalislics. anJ National SI<llisllcs (}ni,c
F-7

F..PIHCES (l'unlilllll'd)
1997" 1998
INDICATOR Mar Apr May Jun Jul Aug Sep Oct Nov Dec Jan ,Feb Mar
I' Wlll1d l'ril.:l.:~orSde(led Cll111llllldilil-"
(inll_S. (em ••per pound Illlk~s ll\her\\i~e
~lalcd)
a Copra n q. n.Q. n.q nq n.q n.q nq nq nq nq n.Q. nq nq n.q
h CII({lllUInil 3410 3266 3073 2896 27.18 2610 2683 2628 2836 2747 29.7 25.66 2575 26.79
c. Sn)hcan lIil 2348 2351 24.02 23.36 2202 2204 23.10 24.62 2601 2534 23,6 25,19 2672 27,33
d Palm Iljl 27,14 28.17 2890 27.35 26.22 2555 2661 2733 27.29 27.58 27.4 29.30 31.13 3187
c. (iuld (U.S S per IH\~ \IUIl\::C) 35203 344.53 34352 341.22 324.46 32309 322.55 32566 30683 28893 331.2 28840 29757 29596
r ('llppcr calhlllk 12023 115.35 12056 123.29 115.14 107,59 95.39 9334 86.94 7988 107.4 76.30 7557 7921
g. Sugar 12,18 11.49 1154 1209 12,15 1254 12.70 12.86 1318 1290 12.2 11.72 11 06 10.68
h, ("{lOCC 164 234 286 252 210 213 212 167 159 177 194 176 185 162 -i Wheal 847 7,92 7.62 691 589 6.42 636 6.37 632 6 15 7.0 593 595 5,85 -Cllrn 4.68 5.12 4.94 465 4.40 4.66 466 4,76 482 467 4.8 463 4.61 461
~, (\llhll\ 71.56 68.84 6980 72.05 72.91 72.18 71.37 69,15 6830 6437 70.2 62.80 6433 6847
1 Ruhher 6525 6008 57.70 57.47 5202 5245 51.88 51.36 4799 4069 55.6 4005 4396 4170
111I.umller (U.S.S per '0(1) hrJ It I n q. n q. nq nq. nq. nq n,Q, nq, nq n,Q. n.q. nq n.q. n.q.
(",'p,a I m(an of l>1I~('I-••••-[]n.nF [mull!:" IIC;lI('~1f,''''Jrd shipmenl Stlun.:e \ JllIlcJ l"ll<;tlnut Assl-...:ialion of Ihc PhlhpIll1lCS IUrA!'1 W.:.:ll~ Bullelln
Cu.;nllul "tI Imc;lll ul hU~(,I-~dl(r ,('11' U ~ A E;lll ('l.~:\l Uull••'l1careSI f,\I"\';1I\J sh'plllcn'S: Source UCAPS Wcell~ Ihlllclln
Sll~lIean 011- cash Mealor. II SA: Snurcc: n1t~Asian Wall ScrcCl JournalPalm ()lllfefirlcd.l;\kaeheJ, JCo,j,lll/eJ)Cllh, <:n-- Nc\' Orleans. U.S A; Suulee nle A"ian Wall Sired Joumal
(jolJ _ bol~'lllg, c1nSllllo!.1.1"ld,'n llold pri~c, Sllmce' Reulels flililoce and IIlI!i"nCopper Calhot.le _ n":01Ilof tlld.a~lcd. c;Hh I"nc; S"urct:'s: Metals \I,,'l:'cl and Reulers (feller;,1 Report
SU~,1f_ 11llemalional SUll.l1 Alllecll1enlllSA) I)ail~ pricc spot. Sourccs' Reulef1 Su~ar Report; Repubhc !-'lanlCts lbnl do1il~marlel report aliI!
Inlcmallonal su~ar or~aUl1.alilll1 nl{)l1thr~SlallSlic,,1 RullClm
ColTce(U"llllian~a5h.'lt\lll1ino1l Nc\\ Y"rl,US,A; Source; Thc Asian Wall Slrct'l Journal
Whcal 1-'(No.2.harJ) ~a~h rail bIds l\anS.::JSCil~' U S.A,; Sourec; 111eASlau Wall Slrccl ]ullmalCom l!No2,~'ello\\I. ca.~h;elc\ ah>r bllb II) producers IIhn(lis. USA: Source: The ,\sian Wall Strccl JounJal
COllon (1-1(\6 inch slnel tW'lniddlin~)- eash Memphis. U.S.A.; Source: The Asian Wall Streel Joumal
Rubbel (smoked sheets) - cas.h Nt'\\ Yorl. USA; Source The Alian Wall Strcel JournalLUlllbcr. nearesl for" ard sl1itllflentlSClllclncnt Chica~o Men;antile F.~change US A.: Source 1'hc Asian Wall Slreel Joumal
N.Q. - No quolahOn
Nole In U.s ccnlS per pound unles.s lllhcl",isc staled
Source: CompilatIOn of the Ball~kl) Sentr.tl nl:!Pilipinas from \'aricus SOllfCC::S
F-8
--

G. MONEY, BANKING AND INVESTMENTS
1997 Total 1998
INDICATOR Mar Apr May Jun Jul Aug Sep Oct Nov Dec 1997 Jan Feb .Mar
I.Money supply by composition
(million P) 216,256 223,200 226,632 224,333 226,661 219,707 222,692 228.156 236,436 256,316 258,318 246,082
a. Currency in circulation 106,779 111,343 115,019 107,217 105,148 107,974 110,252 115,024 120,092 143,643 143,643 126,834
b. Peso deposits subject to check 109,477 111,857 111,613 117,116 121,513 111,733 112,440 113,134 116,344 114,675 114,675 117,246
2 ,--Money _suppl )'_b)....Q£igi~mi IIion-¥} 218,256 223,200 226,632 224,333 225,859 219,707 222,692 228,158 236,436 256,318 258,318 246,082
3. Net foreign asselS (260,984) (303,768) (332,959) (359,479) (376,395) (406,253) (419,105) (435,231) (416,952) (482;479) (482,479)- I. Monetary authorities 249,816 244,322 234,573 217,574 176,953 202,666 246,796 226,496 219,316 211,907 211,907
- 2. Deposit money banks (510,800) (546,090) (567,532) (577,053) (553,346) (610,939) (665,901) (661,727) (636,266) (694,386) (694,3861
b. Net domestic credil5 1,499,720 1,537,775 1,578,947 1,618,056 1,700,832 1,712,351 1,777,440 1,815,201 1,825,945 1,932,053 1,932,053
I. Monetary authorities 69,109 78,116 109,842 112,673 154,457 106,094 90,815 112,423 136,506 166,429 168,429
2. Deposit mone)' banks 1,430,611 1,459,659 1,469,105 1,505,383 1,546,375 1,606,257 1,686,625 1,702,776 1,689,439 1,763,624 1,763,624
c. Non-money suppl)' deposits 688,148 681,708 688,650 701,655 742,955 742,746 767,611 773,623 789,579 610,975 810,975
I. Quasi-money deposits 678,329 672,264 679,355 692,317 733,867 733,109 755,641 760,602 775,707 795,631 795,631
D. Son'iogs deposits 632,670 626,738 636,012 649,623 692,765 691,316 713,383 717,094 732,234 751,270 751,270
b. Time dcp~.)silS 45,659 43,526 43,343 42,694 41,122 41,793 42,256 43,508 43,473 44,361 44,361
2. [k~lsits substitutes 7,205 7,067 6,690 6,794 6,601 7,067 9,351 10,057 10,741 12,066 12,068
3. Marginal deposits 2,614 2,377 2,405 2,544 2,467 2,570 2,819 2,964 3,131 3,276 3,276
d, Net other accounts 334,332 329,099 330,706 332,569 355,623 341,645 367,832 376,189 382,978 360,281 380,281
I. Other assets 206,519 195,776 200,513 205,167 210,746 199,657 206,783 220,243 223,229 260,238 260,238
2. Other liabilities 246,743 221,256 226,991 221,551 246,268 218,740 244,091 260,930 259,604 277,401 277,401
3. Capital accounts 296,108 303,617 304,228 316,225 316,101 322,762 332,524 337,502 346,603 363,116 363,118-- 3, Factors affecting moncy supply
(million P) 216,256 223,200 226,632 224,333 226,661 219,707 222,692 228,158 236,436 256,318 258,318
a, Internal sector 477,240 526,966 559,591 563,612 602,254 627,960 641,797 663,389 653,366 740,797 740,797
I, IJuhlic scclor 197,522 191,609 207,798 214,456 245,920 266,505 241,926 262,508 294,933 326,650 326,650
a. National governlllent 267,168 263,696 263,789 293,629 331,755 330,811 322,713 342,449 373,071 388,801 366,801
h. Local g,ovcmmcl1t and
semH~tlvt:rnmelll enlitil"s (69,646) (72,087) (75,991) (79,173) (85,835) (64,306) (60,767) (79,941) (76,138) (62,151) (62,151)
2, Private se(lm 279,716 335,359 351,793 369,356 356,334 361,455 399,671 400,661 356,455 414,147 414,147 , .',:
h. I:xlcmal scClm (260,964) (303,768) (332,959) (359,479) . (375,593) (408,253i (419,105) (435,231) (416,952) (462,479) (482,479)",' , ., '
N"l.:' Ilcl;uls ilia) 11"1,,,111tip I" 1.~;,llltlC I" I"III1\1i1l1:
SI'lun:: 1\;1lIl!"''' Sl'ullal "I! 1',hl'lII:I' G-1
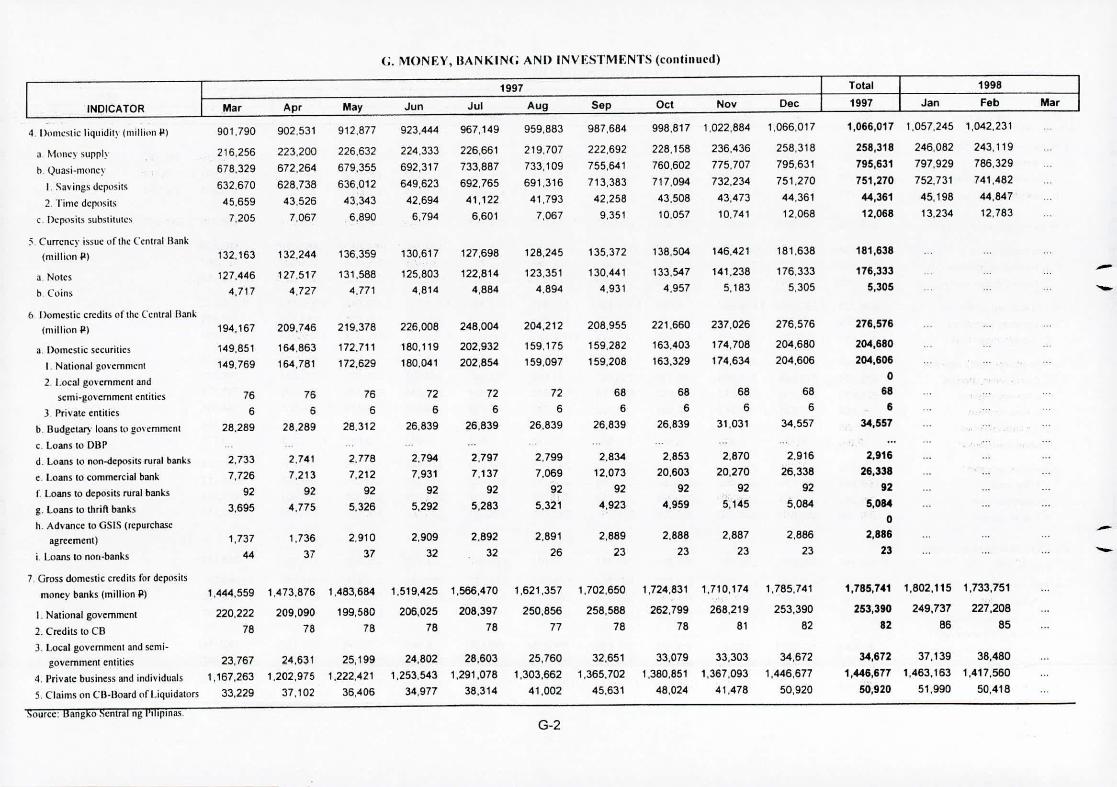
(;. MONEY, HANKIN(; ANIlINVF.STMENTS (conlinucd)
1997 Total 1998
INDICATOR Mar Apr May Jun Jul Aug Sep Oct Nov Dec 1997 Jan Feb Mar
4, OOllleslic liqlliJil~'(l11illilll\ iJ.) 901.790 902.531 912.877 923.444 967.149 959.883 987.684 998,817 1,022,884 1,066.017 1.066.017 1.057.245 1,042.231
a Money suppl~ 216,256 223.200 226.632 224,333 226,661 219,707 222.692 228,158 236.436 258.318 258,318 246,082 243.119
n. Quasi.m(lnc~ 678,329 672.264 679.355 692.317 733,887 733,109 755.641 760,602 775,707 795,631 795,631 797.929 786.329
I. Savings dCflosils 632,670 628.738 636.012 649.623 692.765 691.316 713.383 717.094 732.234 751.270 751,270 752.731 741,482
2. Time deposits 45.659 43.526 43,343 42.694 41.122 41,793 42.258 43.508 43.473 44.361 44,361 45.198 44.847
c. Ikpnsits suhstitutes 7,205 7,067 .6,890 6.794 6.601 7.067 9.351 10.057 10.741 12.068 12,068 13,234 12,783
5. Currency issue of the ("cnlral BanI.;(millilmP) 132,163 132,244 136.359 130.617 127.698 128.245 135.372 138.504 146.421 181,638 181,638
a Notes 127.446 127,517 131.588 125.803 122.814 123.351 130.441 133.547 141.238 176.333 176,333 -h Coins 4,717 4,727 4.771 4.814 4.884 4.894 4.931 4.957 5.183 5.305 5,305 -
b Domestic credits of the Central Ban"
(milliclO P) 194.167 209.746 219.378 226.008 248.004 204,212 208.955 221.660 237,026 276.576 276,576
a. Domestic securities 149.851 164.863 172.711 180.119 202.932 159.175 159,282 163,403 174,708 204.680 204,680
I. National ~o\"Cmnll:n( 149.769 164,781 172.629 180.041 202.854 159,097 159,208 163.329 174.634 204.606 204,606
2. I.oeal gon:mmcnl and 0
sc:mi-lW\'CmmCIlI entities 76 76 76 72 72 72 68 68 68 68 68
3. Pri\';)tc entities 6 6 6 6 6 6 6 6 6 6 6
b. BudgclaJ') loans tn glwcmmcnl 28.289 28.289 28.312 26.839 26.839 26.839 26.839 26,839 31.031 34,557 34,557 ...c. loans 10 DB?
...d. l.oans 10 non-dcposits rural banks 2.733 2.741 2.778 2,794 2.797 2.799 2,834 2.853 2.870 2.916 2,916
(.I.oans 10 commercial bank 7.726 7,213 7.212 7.931 7.137 7.069 12,073 20,603 20.270 26,338 26,338
f. loans 10 deposits rural banks 92 92 92 92 92 92 92 92 92 92 92
g. loans to thrift banks 3.695 4.775 5.326 5.292 5,283 5,321 4,923 4.959 5.145 5.084 5,084
h. Advance to GSIS (repurchase 0
agreement) 1.737 1.736 2.910 2.909 2,892 2,891 2.889 2.888 2,887 2.886 2,886 -i Loans to nOfl-banks 44 37 37 32 32 26 23 23 23 23 23 -
7. Gross domestic credits (or deposits
money banks (million P) 1,444,559 1.473.876 1,483,684 1,519,425 1.566,470 1,621,357 1,702,650 1,724.831 1.710.174 1.785.741 1,785,741 1,802,115 1,733,751
I. National government 220,222 209,090 199,580 206,025 208.397 250.856 258.588 262,799 268,219 253,390 253,390 249,737 227.208
2. Credits 10 cn 78 78 78 78 78 77 78 78 81 82 82 86 85
3. Local government and semi.
govcmmenl enlilies 23,767 24.631 25,199 24.802 28,603 25.760 32.651 33,079 33,303 34.672 34.672 37.139 38,480
4. ('rivalc business and individuals 1,167,263 1,202,975 1.222,421 1,253,543 1.291,078 1.303.662 1.365,702 1,380,851 1.367.093 1,446.677 1,446,677 1.463,163 1,417,560
5. Claims on ell-Board of Liquidators 33.229 37.102 36,406 34.977 38.314 41.002 45.631 48,024 41,478 50.920 50,920 51,990 50,418
Source: Bangko Sentral ng I',hpmas.G-2

G. MONEY, BANKING AND INVESTMENTS (conlinued)
1997 Tolal 1998
INDICATOR Mar Apr May Jun Jul Aug Sep Ocl Nov' Dec 1997 Jan Feb Mar
N. Net dOlllestic "edits ()f (he 11I1l11ctal)
system (millillO pcs()s) 1,499,720 1.537.775 1.578.947 1.618.056 1.700.832 1.712.351 1.777,440 1.815.201 1.825.945 1.932.053 1,932,053
a PUhlic 292,749 290,140 311.974 321,412 363,322 359,534 358,321 378,484 409.329 426,426 426,426
I. Claims 011nalhmal g()Vernmcnl 267,168 263,696 283.789 293.629 331,755 330,812 322,713 342,449 373,071 368,801 388.801
2. Claims on local go\'cmmcnt 7,213 7.077 7,178 7,494 8,228 8,070 8,271 8.255 8.434 9,072 9,072
_CJaims on scmi-go\lcmmcnt
entities 18,368 19.367 21,007 20,289 23,339 20.652 27.337 27,780 27,824 28.553 28,553
-- b, Private 1.206.971 1.247,635 1,266,973 1,296.644 1.337.510 1,352.817 1.419.119 1.436,717 1.416.616 1,505.627 1,505,627
I. Claims on thrift banks 3.696 4.774 5.326 5.292 5,283 5,321 4.923 4,959 5,145 5.084 5,084- 2. Claims un specialized
go\'cmmcnt banks). Claims on non-deposits of rural
banks 2.733 2,741 2,778 2,794 2,797 2,799 2,834 2.853 2,870 2.916 2,916
.$, Claims on non-hanks 44 37 36 32 32 27 23 24 24 24 24
5. Claims {lApri\'alC husiness
and individuals 1.167,239 1,202,981 1.222,427 1.253.549 1.291,084 1.303.668 1,365.708 1,380,857 1.367,099 1,446,683 1,446,683
fl. Claims un CB.B\lard nf l.iquhbh1 33.229 37.105 36.406 34,977 38.314 41,002 45.631 48,024 41,478 50.920 50,920
o. Res('''.-(' muncy (million peS():;) 223,868 217.937 225.300 211.853 196.785 220,517 218,416 229,634 241.222 266.489 266.489 247.967
10. r\\-ailahlc reserves (If the cummercial
llanking. system (milliun P) 137.138 127,305 131.017 125.741 114,069 181.344 163,284 161.284 161.194
a. Required reserves 110,714 110,224 111.211 113,615 111.500 109,357 113.118 126.165 116,662
b. Excess rcsen'cs 26,424 17.081 19.806 12,126 2.568 71.987 50.166 35.119 44,533-- I I. Calt Inan money markel
.1. Numher 4,784 5.863 5.027 5.562 5.092 4.300 6,873 8.492 6,151 5.740 5,740 5.776 4.726 5.940
h. Amoullt (millillll..J1) 576.884 696,692 572,684 697,638 608,567 504.056 837.567 976.697 664,379 618,407 618,407 632.296 616.799 713.681
12. Interesl rates (weighted avcragc 'Yo[l.a I
;\. r>.t:llIil"n.,'fcrcnce rOll\,.'60 10.6 9.6 99 103 11.4 14.5 151 16.4 17.3 . 18.1 13.4 198 186 175
h. Mllnil" rcli:rcl\I,:c r<llCCHI 94 92 93 99 10.6 116 124 12.7 148 148 11.1 14.1 161 15.3,. Manila rcli:rclI" rale 1HO 84 78 88 8.7 9.1 109 11.6 12.0 133 13.4 9.8 148 150 136J Savings Ilcllosil:-. 6.0 70 7.0 7.0 9.0 10.0 11.0 12.0 12.0 120 9.0c. Timc tkpllsilS 90 80 90 80 120 120 130 14.0 140 160 11.2I: Illlcrh;lI11-(1I1l'll 100 102 130 130 250 18.0 160 340 170 140 16.0 129 13.5 132
SIfill l.:\"'. Iialll-'-(u SI,.'IIH"lng P,hpllla" G-3

(;. MONEY. IIANKING ANI) INVESTMENTS (runlinncd)
1997 Total 1998
INDICATOR Mar Apr May Jun Jul Aug Sep Ocl Nov Dec 1997 Jan Feb Mar
1.1 (hera!l hal;lIl~c Ilf p"YllIcnl (1\1 Il')
pllsitillllimillillll (IS dtlllars) .200 (252) (337) (191) (2.136) 57(1 5(.1 (KK~) (1"1) (I ,ilK 1) (3,363)
" C:urn:nt 3n:uunl
!"rade. net (155) (777) (607) (518) (963) (492) (295) (538) (457) 25 (5,383)
(i\I\UJs. net (934) (815) (982) (967) (1.203) (1,030) (848) (1.130) (967) (562) (11,127)
b;jltms 2.001 2,082 1,983 2.129 2.067 2,258 2.338 2.326 2.308 2.231 25,228
Imll"r1S 2.935 2,897 2.965 3.096 3.270 3,288 3.186 3.456 3.005 2,793 36,355
Scrrkcs. net 779 38 375 449 240 538 553 592 240 587 5,744 -Receipts 2,049 1.485 1.518 2,199 2.085 1.878 1,950 2.111 1,574 2.139 22,835
1,143 1.340 1.394 --l'aymcllIs 1.270 1.447 1,750 1.845 1,519 1,334 1,552 17,091
Transfers. nct 99 54 121 70 82 103 116 85 100 101 1,080
InflO\\ 122 118 165 119 128 144 140 152 170 133 1,670
oulll0\\ 23 64 44 49 46 41 24 67 70 32 590
Currenl accounl. nel (56) (723) (486) (448) (881) (389) (179) (453) (357) 126 (4,303)
h C"pilal and financial aC(\lunl
tookdiunl C1nd long-term I\lans. net 1.056 74 220 727 559 302 813 94 323 196 4,688
A\'ailments 1.384 317 425 1,040 745 489 940 351 553 563 7,427
Repayments 328 243 205 313 186 187 127 257 230 367 2,739
Imcstmcnts. net 232 147 (200) (178) (15) 232 (233) (81) 4 90 (676)
Non-resident in\"cstrncllts(I'hils.) 272 144 (192) (166) (35) 291 (215) (34) 10 100 847
Resident im'estmcnlS abroad 40 (3) 8 12 (20) 59 18 47 6 10 81
Shor1.leml capital. net 34 113 (liD) (27) 157 159 (186) 51 120 (47) 495
Change in c(lmmcrcial banks' NFA (72) 598 815 1,029 (1.505) 916 804 (585) (361) (873) 1,191 .-Ca[lilal and financial aCC(lunl.ncl 1.193 793 587 1,661 (834) 1.463 1.235 (595) 72 (739) 6,464
Others -c
Monetization of gold 0 1 22 9 16 17 0 19 0 25 105
Revaluation adjustments (77) (60) 109 (22) (72) (3) (14) (74) (125) (27) (465)
d Net unclassified items (860) (263) (569) (1,391) (365) (512) (481) 219 219 (466) (5,164)
Noles: 1997 data are preliminary
Source: Bangko Scntral ng l)ilipina~.
G-4

G. MONEY, BANKING AND INVESTMENTS (continued)
1997 Total 1998
INDICATOR Mar Apr May Jun Jul Aug Sep Oct Nov Dec 1997 Jan Feb Mar
14, (nilial paid-up capiliil investment l\fnewly estahlisheddumestic c(lrpmalillns and rmrtncrships by industl)' gwup(thousand Il)
All INIlUSTRJ[~, 2.823.372 6.292.222 2.654.001 5.876.128 6.605.823 4.921,483 4.930.780 5.064,741 2.247.641 5.170.238 51.465,823
a. Agriculture. fishery and fnrcsln 6.904 4.741 50,447 15,445 26,416 23.991 23,186 31,040 1.250 9,504 222,888b. Mining <lAdqUarT}ing 63.158 67.218 14.456 31.608 10,997 14,352 96.517 3.255 9.908 3.538 344,631c. Manufacturing. 774.435 261,618 318.355 450.022 558.559 564,400 1.714.284 313.096 403.957 321.443 7,437,634- d. Electricity. gas and" ater 40 0 7.200 2.668 75.764 6.346 148.744 3.349 328 7.950 324,417- c. Construction 58.240 194.971 87.809 155.026 106.676 102.204 251.917 111.019 576.376 38.934 3,529,503f. Wholesale and relail 518.924 681.417 509.792 3.651.867 746.196 1.731.444 687.109 697.086 697.450 657.546 11,105,402g. TranSJ'f,'nali(lll. storage andcommunication 61,236 39,888 34.923 50.923 75,050 121.397 123,421 64.922 24,520 102.451 1,062,598
h. Financing. insurance. real estale
and business sen"j,.:s 1.273.965 4.963.965 1.547.584 1.295.799 4.920.615 2.224.136 1.742.139 3.584.840 438.413 3.934.300 26,115,956i. Community. sudat umJ pcrsunal
sen'ices 66.470 78,404 83,435 222.770 85.550 133.212 143.463 256.135 95.439 94.572 1,322,793
15. Initial paid.up capilal inHslmcnl (If
m:\\ ly.rc~i!ih:rctJ dl\RlCstic businc,:ss
tlrganilatillOS (Iht1usand P) 2.823.372 6.292.222 2.654.001 5.876.128 6.605.823 4.921.483 4.930.780 5.064.741 2.247.641 5.170.238 51,465,823
a Cmptlrati\lnS 2.511.267 5.861.555 2.306.584 2.447,440 5.936.918 4.268.431 4.310.504 4.461.973 1.762.632 4.635.766 43,244.832b_I'artncrsh illS 312.105 430.667 347.416 3.428.688 668.905 653.052 620.276 602.769 485.009 534.472 8,220,992- Ill. Capital inl;tcasc (If cstnoli ••hcd- dOOlCSlicnrgani;r.alit)fls (Ih.lu~ilnd P) 3.968.633 7.595.935 4.337.049 12.252.958 7.183.039 14.096.884 15.038,713 16.310.538 7.733.841 14,742.900 103,652,827
II <'\lrpmatit1ll'i 3.968.633 7.595.935 4.337.049 12.252.958 7.183.039 14.096.884 15.038.713 16.310.538 7,733.841 14,742,900 103,652,827b. Pnrtncrships ...
Null:: Iklilils m.IY nul add up due \ll ruunding.S\lUrces: Ilang"o Senlraillg. I'ilipillils .lIld the Securities and h:changc {"\ll1ul1l\sillll
G.5
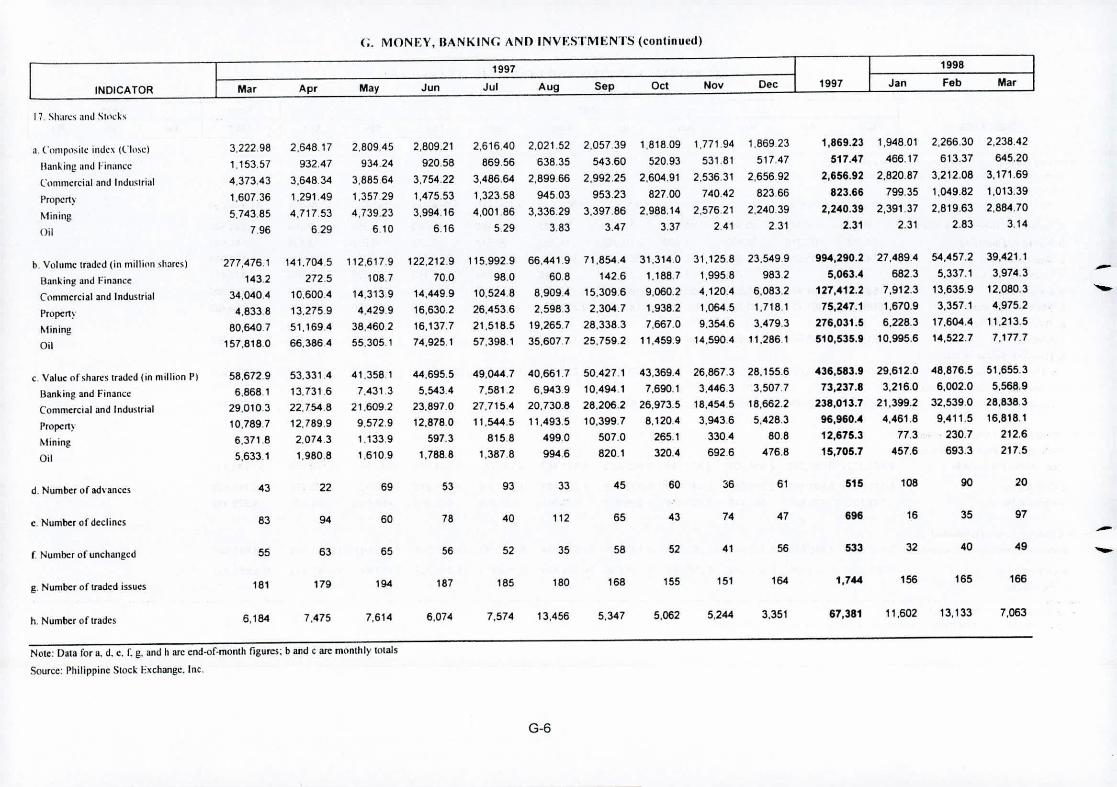
(;. MONEY, IlANKING ANIl INVESTMENTS (conlinucd)
1997 1998
INDICATOR Mar Apr May Jun Jul Aug Sep Oct Nov Dec 1997 Jan Feb Mar
17. Sh,lrcs and Shl('h
a. Composite indc\ (Ch1se) 3.222.98 2.64817 2.809.45 2.809.21 2.61640 2.021.52 2.057.39 1.818.09 1.771.94 1.869.23 1,869.23 1.948.01 2.266.30 2.238.42
Banking ,lOJ Finance 1.153.57 932.47 934.24 920.58 869.56 638.35 543.60 520.93 531.81 517.47 517.47 466.17 613.37 645.20
Cummercial anJ Indumial 4.373.43 3.648.34 3.88564 3.754.22 3.486.64 2.89966 2.992.25 2.604.91 2.536.31 2.656.92 2,656.92 2.820.87 3.212.08 3.171.69
Property 1.607.36 1.291.49 1.35729 1,475.53 1.32358 945.03 953.23 827.00 740.42 82366 823.66 799.35 1.049.82 1.013.39
Mining 5,743.85 4,71753 4.739.23 3.994.16 4.00186 3.336.29 3.397.86 2.988.14 2.576.21 2.24039 2,240.39 2.391.37 2.819.63 2.884.70
Oil 7.96 629 610 6.16 529 3.83 3.47 3.37 2.41 2.31 2.31 2.31 2.83 3.14
b. Vtllume IraJcd (in millilln shares) 277.476.1 141.704 5 112.617.9 122.212.9 115.9929 66.441.9 71.854.4 31.3140 31.1258 23.549.9 994,290.2 27.489.4 54.457.2 39.421.1
Banl;ing and Finance 1432 272.5 108.7 70.0 98.0 608 142.6 1.1887 1.9958 9832 5,083.4 682.3 5.337.1 3.974.3 -Cummercial and Industrial 34.0404 10.6004 14.3139 14.449.9 10.5248 8.909.4 15.3096 9.060.2 4.120.4 6.083.2 127,412.2 7.912.3 13.635.9 12.080.3 -Propert} 4.8338 13.2759 4,429.9 16.6302 26.4536 2.5983 2.304.7 1.938.2 1.064.5 1.718.1 75,247.1 1.670.9 3.357.1 4.975.2
Mining 80.6407 51.1694 38.4602 16.137.7 21.518.5 19.265,7 28.338.3 7.667.0 9.3546 3.479.3 276,031.5 6.228.3 17.604.4 11.213.5
Oil 157.818.0 66.3864 55.305.1 74.925.1 57.398.1 35.607.7 25,759.2 11.459.9 14.590,4 11.2861 510,535.9 10.995.6 14.522.7 7.177.7
c. Value of shares traded (in million III 58.6729 53.3314 41.3581 44.695.5 49.044.7 40.661.7 50,427.1 43.369.4 26.667.3 28.1558 436,583.9 29.612.0 48.876.5 51.655.3
Banking and Finance 6.868.1 13.7316 7.431.3 5.543.4 7.581.2 6.9439 10.494.1 7.690.1 3,446.3 3.507.7 73,237.8 3.2160 6.002.0 5.568.9
Commercial and Industrial 29.010.3 22,754.8 21.609.2 23.897.0 27.715.4 20.7308 28.206.2 26.973.5 18.4545 18.662.2 238,013.7 21.399.2 32.539.0 28.8383
Property 10.789.7 12.789.9 9.572.9 12.878.0 11.544.5 11.493.5 10.399.7 8.120.4 3.943.6 5.428.3 96,960.4 4.461.8 9.411.5 16.818.1
Mining 6.3718 2.0743 1.1339 597.3 8158 499.0 507.0 265.1 330.4 808 12,675.3 77.3 .230.7 212.6
Oil 5.633.1 1.980.8 1.6109 1.788.8 1.387.8 9946 8201 320.4 692.6 476.8 15.705.7 457.6 693.3 217.5
d. Number of ad\"3:nccs 43 22 69 53 93 33 45 60 :>6 61 515 108 90 20
c. Number o( declines 83 94 60 78 40 112 65 43 74 47 696 16 35 97 -f Number of unchanged 55 63 65 56 52 35 58 52 41 56 533 32 40 49 -g. Number o( traded issues 181 179 194 187 185 180 168 155 151 164 1,744 156 165 166
h. Number o(trades 6.164 7.475 7.614 6.074 7.574 13.456 5.347 5.062 5.244 3.351 67,381 11.602 13.133 7.063
N(lle: Data for a. d. c. f. g. and h arc end-of.month figures; b and c are monthly lotals
Source: Philippine Siock Exchange. Inc.
G-6

H. PUBLIC FINANCE
1997 1998
INDICATOR Mar Apr May Jun Jul Aug Sop Oct Nov Dec Jan Fob Mar
I. a. Collections of the Bureau of
Cusloms 7,745 6,796 6,669 7,387 7,436 7,646 9,695 8,952 7,567 13,311 97.506
I. Duties and taxes on impurts
and exports 7,653 6,727 8,573 7,334 7.347 7,566 9,604 8,889 7,500 13.101 96.433
2. Others 92 69 96 53 89 82 91 63 66 210 1.073
h. Allotment to local ~uvcmmenl 5,772 5,920 5,920 6,179 5,920 6,747 5,273 8,095
- 2, Internal public debt (million pesos) 719,542 712,032 712,515 714,118 705,421 704,269 710,951 720,032 718,958 722.073 722.073-- a. Status and levels of government dc:ht 719,298 711,912 712,395 714,047 705,350 704,199 710,922 720,003 718,930 722,045 722.045
1. National government 711.983 704,642 704,000 705,659 696,962 695,814 702,552 711.648 710,580 713,689 713.689
2. Government corporation 7.315 7,271 8,395 8,388 8,388 8,385 8,370 8,356 8,350 8,356 8.356
b. Monetary institution 244 120 120 71 71 70 29 29 29 28 28
3. Internal public debt by period (lr
malUril)' (million pesos) 719,542 711,032 712,515 714,118 705.421 704,269 710,951 720,032 718,958 722,073 722,073
3. Lung.lcnn 146,945 149,249 155,092 150,908 151,008 151,008 151,008 155,809 159,731 163,004 163,004
b. Medium term 155,753 157,020 160,179 165,734 162,784 162,802 160,592 161,334 160,067 158,365 158.365
c. Sh(lrt leml 416,844 404,763 397,244 397,476 391,629 390,460 399,352 402.890 399,161 400,705 400.705
Sources: Hureau of Customs, and Bangl.;v Scntr:lI ng 1)i1ipinas
---
H-'
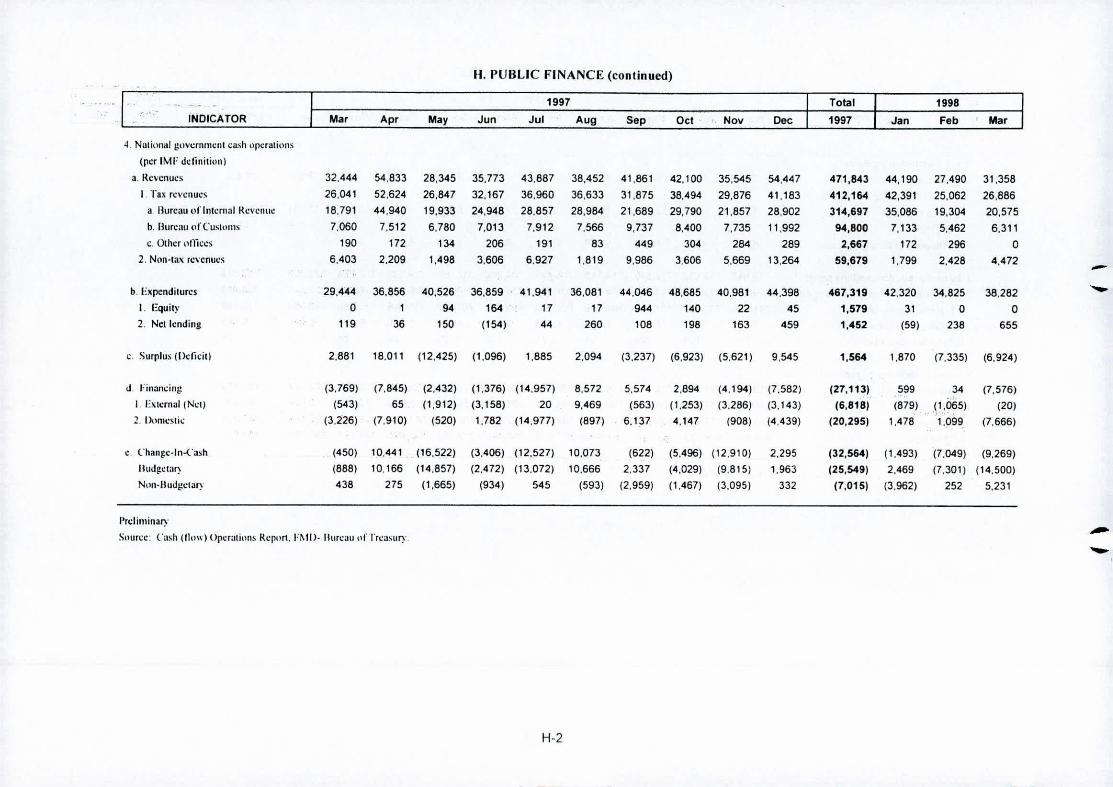
H. PUBLIC FINANCE (continued)
-. -.. . 1997 1998~..~.INDICATOR Mar Apr May Jun Jul Aug Sop Oct t. Nov Dec Jan Feb , Mar
4. Nali{lIlal gll\'crnmCIII ca~h Ilpcraliuns
(per IMF ddinitiun)
a Kc\-'cnucs 32,444 54,833 28,345 35,773 43,887 38,452 41,861 42,100 35,545 54,447 471,843 44,190 27,490 31,358I. TBll revenues 26,041 52,624 26,847 32,167 36,960 36,633 31,875 36,494 29,676 41,183 412,164 42,391 25,062 26,866
3. Bureau uflnh:mal KC\'CllUC 18,791 44,940 19,933 24,948 28,657 28,964 21,689 29,790 21,857 26,902 314,697 35,066 19,304 20,575b. Burcall OrCUSIUllh 7,060 7,512 6,780 7,013 7,912 7,566 9,737 6,400 7,735 11,992 94,800 7,133 5,462 6,3111;. Other 1\lTIccs 190 172 134 206 191 83 449 304 284 269 2,667 172 296 0
2. Non-lax rc\"cnucs 6,403 2,209 1,496 3,606 6,927 1,819 9,966 3,606 5,669 13.264 59,679 1,799 2,428 4,472 -b. Expenditures 29,444 36,856 40,526 36,859 41,941 36,081 44,046 46,685 40,981 44,398 467,319 42,320 34,825 38.282 --
I. EquilY 0 1 94 164 17 17 944 140 22 45 1,579 31 0 02. Nctlcnding 119 36 150 (154) 44 260 108 198 163 459 1,452 (59) 238 655
c. Surplus (I)diciO 2,861 18,011 (12,425) (1,096) 1,885 2,094 (3,237) (6,923) (5,6211 9,545 1,564 1,870 (7,335) (6.924)
d Fin:mcing (3,769) (7,845) (2,432) (1,376) (14.957) 8,572 5,574 2,894 (4,1941 (7.582) (27,113) 599 34 (7,576)I. b:lcmal (Nl.'l) (543) 65 (1,912) (3,158) 20 9,469 (563) (1.253) (3,286) (3,143) (6,818) (679) .. \'.:065) (20)2. I)\lnlcslic (3,226) (7,910) (520) 1,782 (14,9771 (897) 6,137 4,147 (9061 (4,439) (20,295) 1,478 1,099. (7,666)
, Changc-In-('ash (450) 10.441 (16,522) (3,406) (12,527) 10,073 (622) (5,496) (12,910) 2,295 (32,5&41 (1,493) (7,049) (9,269)Iludgclat) (868) 10.166 (14,857) (2,4721 (13,072) 10,666 2,337 (4,029) (9,8151 1,963 (25,549) 2,469 (7,3011 (14,500)NI1n.Uudgc-IJl) 438 275 (1,665) (934) 545 (593) (2,959) (1,4671 (3,0951 332 (7,0151 (3,962) 252 5,231
Preliminary -Snurcc: Cash (lhl\\) Orcr:llitlllS Rerun. Ft\ll>. nurc3uIlf rrcasury. -I
H.2

Ih:puhlika 11~I'ilipillil'
+P:lmhans:tII}! l.'lIwn S:I lJ~na)"llll~ P:'lIg.I.:sl:Hli~tik:1(Naliullal Sl;lli~tjl:al('{lorliinaliull "(lard)(jrd., 211d, 8:.sth Floors I\.lidlillld Bucndia Buildin);-103 Sell. (iii J. Puyal AVCIlIlC, r\'lakati Cil~
Sl'ctnr/Su hjecl IlHlicaturs hcing munitored/used Other indicators proposed for inclusiun Rcmarks( I ) (2) (3)
Dear Daw User.
W C' consider it our duty1\. Production
to do our best andin mcctio? your statislical data needs and Consumptionexpectations. BUI we need your help. Youcan do your share by providing us with your IITransportation- comments and suggestions to further and Tourism- improve the publication. the EconomicIndicators.
Please list in column 1 the indicators thai C. EXlernalyou use/monitor. For other indicators that Sec loryou want to be included. please list themunder column 2. Write your othercomments/remarks under column 3. D. Employmenl
Thank you for your help_ ,f--- .A .......--
E. PricesROMULO A. VIROLA
Secretary General
F. Money and- BankingSE~DER- Name: G. PublicDesignation: Finance
Office:
Address: H. Olhers-specify
Tel. No. Fax. No.
E-Mail Address:
:K Plcase cullhis page and send il lhru fax: 890-94-08, 890-31-35; mail il 10 the above address; or <-mail to [email protected], [email protected].