
GUIDELINES ON THE ECONOMIC VALUATION OF THE ENVIRONMENTAL IMPACTS FOR EIA PROJECTS DEPARTMENT OF...
142
GUIDELINES ON THE ECONOMIC VALUATION OF THE ENVIRONMENTAL IMPACTS FOR EIA PROJECTS DEPARTMENT OF ENVIRONMENT MINISTRY OF NATURAL RESOURCES AND ENVIRONMENT PUTRAJAYA JUNE 2008
-
Upload
independent -
Category
Documents
-
view
0 -
download
0
Transcript of GUIDELINES ON THE ECONOMIC VALUATION OF THE ENVIRONMENTAL IMPACTS FOR EIA PROJECTS DEPARTMENT OF...

GUIDELINES ON THE ECONOMIC VALUATION OF THE ENVIRONMENTAL IMPACTS
FOR EIA PROJECTS
DEPARTMENT OF ENVIRONMENT MINISTRY OF NATURAL RESOURCES AND ENVIRONMENT
PUTRAJAYA
JUNE 2008

PREFACE The Guidelines on the Economic Valuation of the Environmental Impacts for EIA Projects Prescribed Activities contain advice and instructions to assist project initiators in the identification, quantification, and where possible the monetization of the environmental impacts of the project. Project initiators should appoint registered consultants with the required expertise to implement these Guidelines as such economic valuation of the environmental impacts of the project constitutes a component of EIA reports per requirements of the Handbook of Environmental Impact Assessment Guidelines These Guidelines consist of eight chapters as follows: Chapter 1 This chapter provides the rationale and objective, and describes the
content of these Guidelines; Chapter 2 This chapter describes the concept of total economic value as this
concept provides the overarching framework guiding the economic valuation of environmental projects;
Chapter 3 This chapter discusses issues which need to be addressed at the
outset of the economic valuation process and are common to all economic valuation methodologies;
Chapter 4 This chapter presents an overview of the methodologies available
to undertake the economic valuation of environmental impacts Chapter 5 This chapter discusses the principles and applications of the
change in productivity methodology; Chapter 6 This chapter discusses the principles and applications of revealed
preferences methodologies which include the replacement cost methodology, the defensive expenditure methodology, the cost of illness methodology, the travel cost methodology, and the hedonic pricing methodology;
Chapter 7 This chapter discusses the principles and applications of stated
preferences methodologies focusing on the contingent valuation methodology;
Chapter 8 This chapter discusses the benefit-transfer methodology; Chapter 9 This chapter provides a summary of the key recommendations
presented in these Guidelines.
ii
This is the first edition of the Guidelines on the Economic Valuation of the Environmental Impacts for EIA Projects in Malaysia. As experience develops with their implementation, this edition will be updated as and when deemed necessary by the Director General of Environmental Quality. Director General of the Department of Environment Malaysia
iii
TABLE OF CONTENTS Preface ii Table of contents iv List of Tables viii List of Figures ix List of Boxes x List of Acronyms xi Chapter 1 Introduction 1 1.1 Background 1 1.2 Applicability of the Guidelines 2 1.3 Objective of the Guidelines 2 1.4 Content of the Guidelines 2 PART A INTRODUCTION TO THE ECONOMIC VALUATION OF
ENVIRONMENTAL IMPACTS 4
Chapter 2 The concept of total economic value 5 2.1 Ecosystems and economic values 5 2.2 Total economic value and its components 7 2.3 Measuring changes in economic values 12 2.4 Identification, quantification, and economic valuation 15 Chapter 3 Approaching the economic valuation of environmental
impacts: Issues of common interest 16
3.1 Scope of analysis 16 3.1.1 Geographical scoping 16 3.1.2 Stakeholders scoping 18 3.2 Choice of scenario: With project versus without project 18 3.3 Dealing with price changes: Nominal versus real 21 3.4 Accounting for time: Discounting 22 3.4.1 Discounting and present value 22 3.4.2 The mechanics of discounting 22 3.4.3 Selecting a discount rate 25 3.5 Selecting a time horizon 26 3.6 Conducting sensitivity analysis 27 3.7 Summary of recommendations to project initiators 28 3.7.1 With respect to the scope of analysis 28 3.7.2 With respect to the scenario of reference 29 3.7.3 With respect to inflation 29 3.7.4 With respect to the discount rate 29 3.7.5 With respect to selecting the time horizon 30 3.7.6 With respect to the conduct of sensitivity analysis 30
iv
PART B METHODOLOGIES FOR THE ECONOMIC VALUATION OF
ENVIRONMENTAL IMPACTS 31
Chapter 4 Introduction to the methodologies for economic valuation 32 4.1 From environmental impacts to methodologies 32 4.2 Recommendations to project initiators 35 Chapter 5 Change of productivity methodology 36 5.1 When to use this methodology 36 5.2 How to use this methodology 37 5.2.1 Step 1: Quantify the impact on productivity 37 5.2.2 Step 2: Monetize the impact 38 5.3 Strengths and limitations of the methodology 39 5.3.1 Strengths 39 5.3.2 Limitations 39 5.4 Recommendations to project initiators 39 5.4.1 Quantify the impact on productivity 39 5.4.2 Monetize the impact 40 Chapter 6 Revealed preferences methodologies 42 6.1 Introduction to revealed preferences methodologies 42 6.2 The replacement cost methodology 44 6.2.1 When to use this methodology 44 6.2.2 How to use this methodology 47 6.2.3 Strengths and limitations of the methodology 47 (i) Strengths 47 (ii) Limitations 48 6.2.4 Recommendations to project initiators 48 6.3 Defensive expenditure methodology 49 6.3.1 When to use this methodology 49 6.3.2 How to use this methodology 50 6.3.3 Strengths and limitations of the methodology 50 (i) Strengths 50 (ii) Limitations 51 6.3.4 Recommendations to project initiators 51 6.4 Cost of illness methodology 52 6.4.1 When to use this methodology 52 6.4.2 How to use this methodology 52 6.4.3 Strengths and limitations of the methodology 55 (i) Strengths 55 (ii) Limitations 55 6.4.4 Recommendations to project initiators 56 6.5 Hedonic pricing methodology 57 6.5.1 When to use this methodology 57 6.5.2 How to use this methodology 58
v
6.5.3 Strengths and limitations of the methodology 60 (i) Strengths 60 (ii) Limitations 61 6.5.4 Recommendations to project initiators 61 6.6 Travel cost methodology 61 6.6.1 When to use this methodology 61 6.6.2 How to use this methodology 62 (i) The zonal travel cost approach 64 (ii) The individual travel cost approach 66 (iii) The random utility approach 66 6.6.3 Strengths and limitations of the methodology 67 (i) Strengths 67 (ii) Limitations 67 6.6.4 Recommendations to project initiators 68 Chapter 7 Stated preferences methodologies 69 7.1 Introduction to stated preferences methodologies 69 7.2 Contingent valuation methodology 69 7.2.1 When to use this methodology 69 7.2.2 How to use this methodology 70 (i) Steps in the application of the methodology 70 (ii) Characteristics of a good application of the CVM 71 7.2.3 Strengths and limitations of the methodology 73 (i) Strengths 73 (ii) Limitations 73 7.2.4 Recommendations to project initiators 73 Chapter 8 Benefits transfer methodology 75 8.1 When to use this methodology 75 8.2 How to use this methodology 75 8.2.1 Transfer without adjustment 76 8.2.2 Transfer with adjustment 77 8.2.3 Benefit function transfer 77 8.3 Strengths and limitations of this methodology 78 8.3.1 Strengths 78 8.3.2 Limitations 78 8.4 Recommendations to project initiators 78 PART C SUMMARY OF RECOMMENDATIONS 79 Chapter 9 Summary of recommendations 80 References 89 Additional references 90 Websites of interest 91 Glossary 92
vi

Annex 1 Penang National Park travel cost survey 95 Annex 2 Lake Sevan contingent valuation survey 107
vii
LIST OF TABLES
Table 3.1 Undiscounted stream of environmental costs and benefits 29 Table 3.2 Present value of environmental costs and benefits
calculated for different discount rates 30
Table 4.1 Environmental impacts and methodologies 34 Table 6.1 Application of revealed preferences methodologies 43 Table 9.1 Technical and economic expertise required 81 Table 9.2 Summary of recommendations 82
viii

LIST OF FIGURES
Figure 2.1 From ecosystems to economic values 5 Figure 2.2 Total economic value and its components 8 Figure 2.3 Direct use value 9 Figure 2.4 Use value 10 Figure 2.5 Non-use value 10 Figure 2.6 Total economic value 10 Figure 2.7 Measuring changes in economic values 13 Figure 2.8 Environmental effect, impact, and human well-being 14 Figure 2.9 Identification, quantification, economic valuation I 15 Figure 3.1 Geographical scoping of environmental impacts 17 Figure 3.2 With versus without project 20 Figure 3.3 The mechanics of compounding 23 Figure 3.4 The mechanics of discounting 23 Figure 3.5 Presentation of environmental costs and benefits 24 Figure 4.1 Economic values and methodologies 33 Figure 4.2 Identification, quantification and economic valuation II 35 Figure 6.1 Defensive expenditure and cost of illness methodologies 52 Figure 6.2 Components of the cost of illness 54 Figure 6.3 Defining zones 65
ix
LIST OF BOXES
Box 2.1 Example of the total economic value framework applied to wetlands
11
Box 3.1 Example of with versus without project 21 Box 3.2 Discounting and inflation 26 Box 3.3 Discount rate and the indefinite future 27 Box 6.1 Sedimentation traps in Malaysia 42 Box 6.2 The costs of river sedimentation: The case of Beaufort
(Sabah) 45
Box 6.3 The Tenom Pangi hydropower plant in the Padas River catchment (Sabah)
46
Box 6.4 Regression analysis with the hedonic pricing methodology 60
x

LIST OF ACRONYMS
CVM Contingent valuation methodology DOE Department of Environment (Malaysia) EIA Environmental impact assessment NOAA National Oceanic and Atmospheric Administration NTFPs Non-timber forest products TCM Travel cost methodology VSL Value of a statistical life
xi

Chapter 1
Introduction 1.1 Background In July 1987, Malaysia’s Department of Environment (DOE) published the first edition of the Handbook of Environmental Impact Assessment Guidelines (hereafter EIA Guidelines). The EIA Guidelines state that:
The aim of environmental impact assessment in Malaysia is to assess the overall impact on the environment of development projects proposed by the public and private sectors (Section 1.3.2)
To achieve this overall aim, the EIA Guidelines list the following five objectives of environmental impact assessment:
• To examine and select the best from the project options available;
• To identify and incorporate into the project plan appropriate
abatement and mitigating measures; • To predict residual environmental impacts; • To determine the significance of the residual environmental
impacts predicted; and
• To identify the environmental costs and benefits of the project to the community.
The last of the above five objectives clearly requires not only the identification of the (physical) environmental impacts of the project, but further requires that these impacts be monetized and transformed into environmental costs (negative environmental impacts) and environmental benefits (positive environmental impacts). It is of importance to note that the above five objectives do not call for the undertaking of a cost-benefit analysis of the project. While not denying the importance of cost-benefit analysis in guiding the allocation of scarce private and public sector resources, the focus of EIA lies in the identification, quantification, and monetization (economic valuation) of the environmental impacts of the project. Undoubtedly, such economic valuation would in most circumstances be a component of a broader and more comprehensive cost-benefit analysis. But this economic valuation in and by itself does not constitute a cost-benefit analysis.
1
1.2 Applicability of the Guidelines The need for economic valuation must be determined during the scoping exercise. The need shall be based on the project’s expected impacts e.g on the productivity of land (such as agricultural productivity) and water (such as fisheries productivity). health and others. These impacts have to be clearly identified, quantified, and transformed into environmental costs or benefits following the procedures described in these Guidelines. 1.3 Objective of the Guidelines The overall objective of these Guidelines on the Economic Valuation of the Environmental Impacts of Prescribed Activities (henceforth Guidelines) is to provide clear guidance as to the framework and methodologies allowing the monetization of the environmental impacts of the project into environmental costs and benefits. The Guidelines aim to provide practical advice to project initiators and project assessors undertaking the economic valuation of environmental impacts of projects. These Guidelines aim to provide practical advice to project initiators on the topic of economic valuation of a project’s environmental impacts, with the understanding that the expertise to undertake and review such economic valuation is currently limited. It is foreseen that such capacity will increase with experience, and that these Guidelines will be reviewed accordingly. 1.4 Content of the Guidelines Part A first presents the general framework guiding the economic valuation of environmental impacts (Chapter 2). Part A also discusses issues common to all methodologies. In particular, it discusses issues pertaining to choice of scope of analysis, both geographical and stakeholders. It also discusses the appropriate scenario setting for the identification and quantification of the environmental impacts of the project (with project versus without project). It describes the techniques of discounting and shows how to consider changes in prices over time. Finally, Part A discusses the necessity to undertake sensitivity analysis (Chapter 3). Part B presents the various methodologies available to undertake the economic valuation of the environmental impacts of the project. An introduction to the methodologies is presented in Chapter 4. Four types of methodologies are described: the change of productivity methodology (Chapter 5), revealed preferences methodologies (Chapter 6), stated preferences methodologies (Chapter 7), and the benefit-transfer methodology (Chapter 8). In each chapter of Part B, the methodologies are first described in details. Second, specific recommendations are made to project initiators regarding the
2

presentation and discussion of the results of their economic valuation in their EIA reports. Concluding remarks and recommendations are presented in Chapter 9.
3

PART A
INTRODUCTION TO THE ECONOMIC VALUATION OF ENVIRONMENTAL IMPACTS
4
Chapter 2
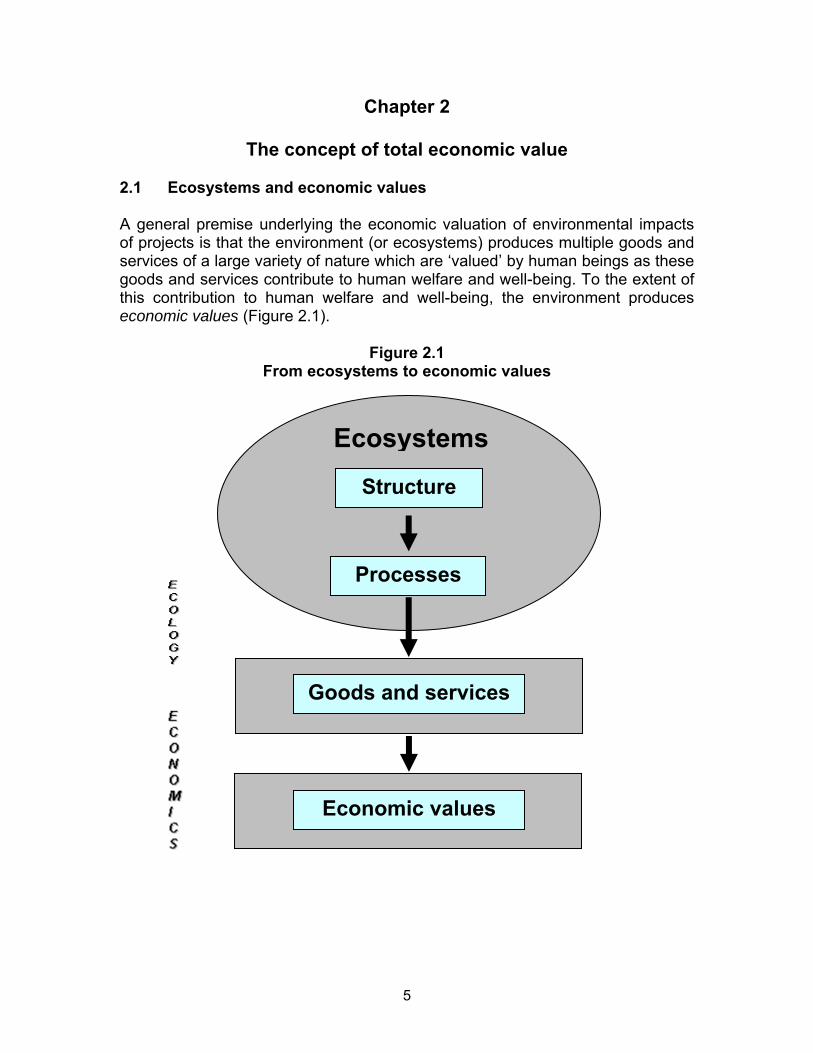
The concept of total economic value 2.1 Ecosystems and economic values A general premise underlying the economic valuation of environmental impacts of projects is that the environment (or ecosystems) produces multiple goods and services of a large variety of nature which are ‘valued’ by human beings as these goods and services contribute to human welfare and well-being. To the extent of this contribution to human welfare and well-being, the environment produces economic values (Figure 2.1).
Figure 2.1 From ecosystems to economic values
G
E
Ecosystems
Processes
Structure
oods and services
conomic values
5
Examples of services produced by ecosystems include:1
• Purification of air and water; • Mitigation of floods and droughts; • Generation and renewal of soil and soil fertility; • Pollination of crops and natural vegetation; • Control of agricultural pests; • Protection against the sun’s ultra-violet rays; • Stabilization of climate.
Similarly, surface waters provide a large number of goods and services, including:2
• Drinking, cooking, washing, and other household uses; • Manufacturing and other industrial uses; • Power generation; • Irrigation of crops, parks, golf courses; • Aquaculture; • Transportation; • Recreational swimming and boating.
To the extent that the above goods and services contribute to human welfare and well-being, they are said to be source of economic values. A further premise is that changes in the flow of goods and services provided by the environment impact the nature and extent of the economic values associated with these goods and services. More specifically, adverse changes in this flow of goods and services are associated with a reduction in economic values (and therefore a reduction in human welfare), while positive changes in this flow are associated with an increase in economic values (and therefore an increase in human welfare). In other words, adverse changes are considered as costs (or environmental costs), while positive changes are considered as benefits (or environmental benefits). Such changes in the flow of goods and services provided by the environment are occasionally triggered by natural events. For example, tropical storms may adversely impact the flow of agricultural outputs. Such changes may also be triggered by human actions. Such is the case with development projects which may positively or negatively impact the flow of goods and services produced by the environment.3 For example, a development project
1 Daily, G.C. (1997). 2 Postel, S.L, and S. Carpenter (1997). 3 Human action is not solely restricted to development projects (generally associated with infrastructure projects). Human action also includes policies. However, given that these
6
may impair the ambient quality of surfaced waters which may then reduce the possibility of using the water for crop irrigation. In such circumstances, a key issue is to identify and quantify the changes in the flow of goods and services produced by the environment which are impacted by a development project, and then to monetize these changes into costs or benefits. If the environment produces a large number of goods and services which are used in a multiplicity of different ways, then different types of economic values will be associated with these good and services. As illustrated above, a body of surfaced water may be used in many different ways and produce many different types of goods and services each with its own economic value. The total economic value of the environment is made of the aggregation of all these different economic values. 2.2 Total economic value and its components The concept of total economic value is now generally recognized as being the most suitable framework guiding the economic valuation of environmental impacts. As illustrated in Figure 2.2, the total economic value of the environment is made of different types of economic values, each corresponding to the different use that is made of the environment. We provide below a brief description of each of these economic values
Guidelines are presented in the context of the EIA process in Malaysia, human action is here understood to be development projects (or prescribed activities as defined by the Environmental Quality Act).
7
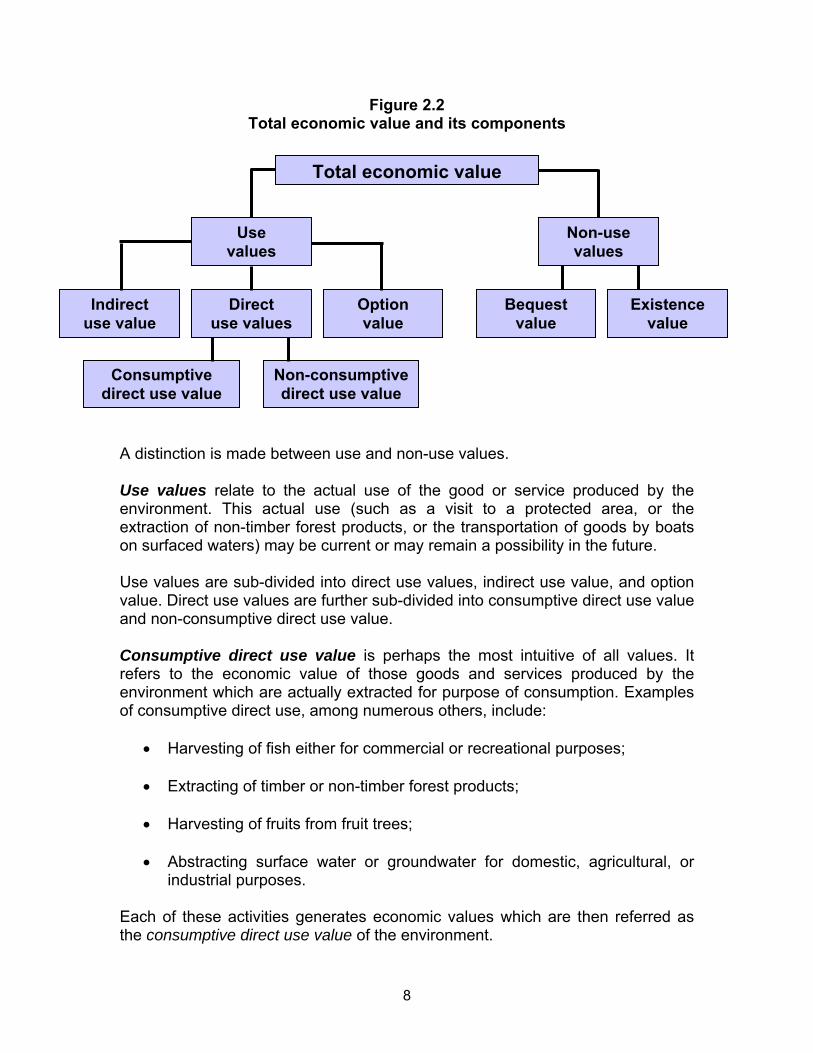
Figure 2.2 Total economic value and its components
Total economic value
Non-consumptive direct use value
Consumptive direct use value
Direct use values
Indirect use value
Use values
Non-use values
Bequest value
Existence value
Option value
A distinction is made between use and non-use values. Use values relate to the actual use of the good or service produced by the environment. This actual use (such as a visit to a protected area, or the extraction of non-timber forest products, or the transportation of goods by boats on surfaced waters) may be current or may remain a possibility in the future. Use values are sub-divided into direct use values, indirect use value, and option value. Direct use values are further sub-divided into consumptive direct use value and non-consumptive direct use value. Consumptive direct use value is perhaps the most intuitive of all values. It refers to the economic value of those goods and services produced by the environment which are actually extracted for purpose of consumption. Examples of consumptive direct use, among numerous others, include:
• Harvesting of fish either for commercial or recreational purposes; • Extracting of timber or non-timber forest products;
• Harvesting of fruits from fruit trees;
• Abstracting surface water or groundwater for domestic, agricultural, or
industrial purposes. Each of these activities generates economic values which are then referred as the consumptive direct use value of the environment.
8
Non-consumptive direct use value refers to the economic value of those goods and services produced by the environment without actual extraction or abstraction taking place. Examples of non-consumptive direct use, among numerous others, include:
• Using surface waters for purpose of transportation; • Recreational swimming;
• Bird watching in a protected area;
• Hydro-power production (in cases where the water is not diverted).
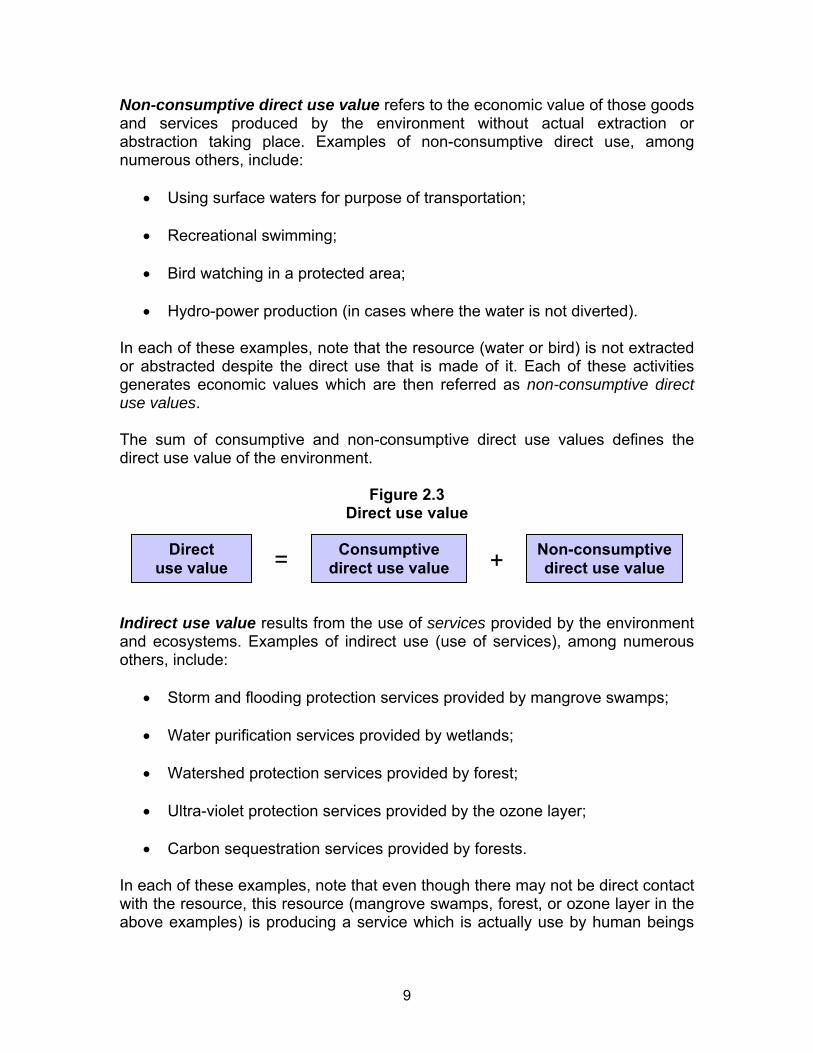
In each of these examples, note that the resource (water or bird) is not extracted or abstracted despite the direct use that is made of it. Each of these activities generates economic values which are then referred as non-consumptive direct use values. The sum of consumptive and non-consumptive direct use values defines the direct use value of the environment.
Figure 2.3 Direct use value
Direct
use value Non-consumptive direct use value
Consumptive direct use value +=
Indirect use value results from the use of services provided by the environment and ecosystems. Examples of indirect use (use of services), among numerous others, include:
• Storm and flooding protection services provided by mangrove swamps; • Water purification services provided by wetlands;
• Watershed protection services provided by forest;
• Ultra-violet protection services provided by the ozone layer;
• Carbon sequestration services provided by forests.
In each of these examples, note that even though there may not be direct contact with the resource, this resource (mangrove swamps, forest, or ozone layer in the above examples) is producing a service which is actually use by human beings
9

and is therefore source of economic values which are then referred as indirect use values. Option value refers to the benefit of potentially using a resource at a later point in the future. For example, protected areas may be set aside for conservation purposes not only for the direct and indirect values they may currently generate, but also for keeping the option possible (in the future) to conduct these or other activities. The sum of direct, indirect, and option values defines the use value of the environment.
Figure 2.4 Use value
Direct use value
Indirect use value
Option value
Use value = + +
Non-use values refer to the fact that some individuals in our societies obtain satisfaction (welfare) simply from knowing that the existing flow of goods and services produced by the environment is maintained as it currently is even if there is no current or potential use of these goods and services by themselves (existence value), or is maintained to keep the option opened for use by future generations (bequest value).
Figure 2.5 Non-use value
Bequest
value Existence
value Non-use
value = + The sum of use and non-use values defines the total economic value of the good and services produced (delivered) by the environment.
Figure 2.6 Total economic value
Total economic
value = Use value
Non-use value +
10
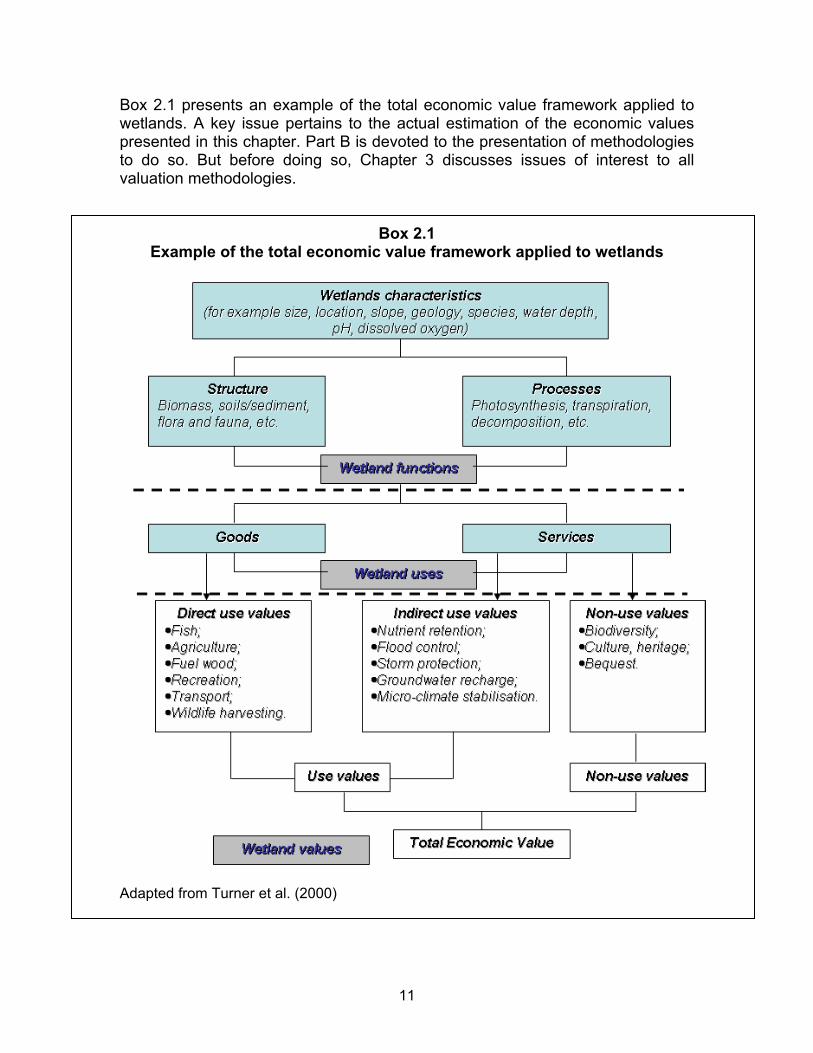
Box 2.1 presents an example of the total economic value framework applied to wetlands. A key issue pertains to the actual estimation of the economic values presented in this chapter. Part B is devoted to the presentation of methodologies to do so. But before doing so, Chapter 3 discusses issues of interest to all valuation methodologies.
Box 2.1 Example of the total economic value framework applied to wetlands
Adapted from Turner et al. (2000)
11
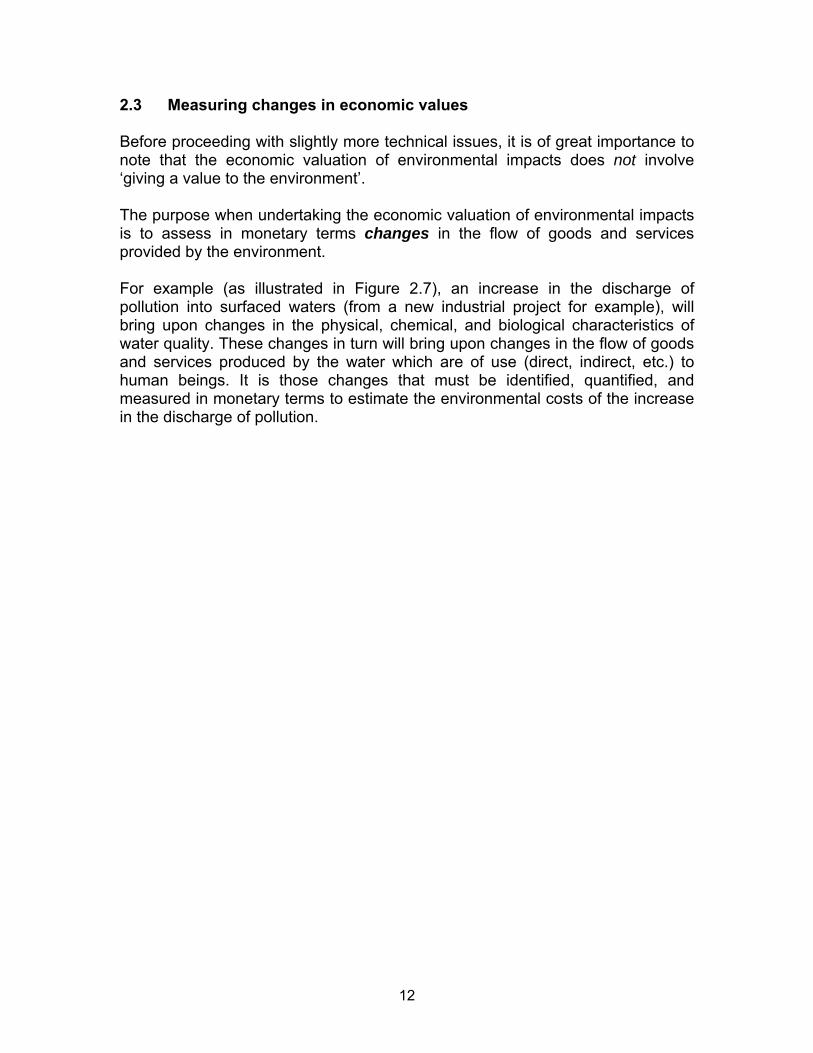
2.3 Measuring changes in economic values
Before proceeding with slightly more technical issues, it is of great importance to note that the economic valuation of environmental impacts does not involve ‘giving a value to the environment’. The purpose when undertaking the economic valuation of environmental impacts is to assess in monetary terms changes in the flow of goods and services provided by the environment. For example (as illustrated in Figure 2.7), an increase in the discharge of pollution into surfaced waters (from a new industrial project for example), will bring upon changes in the physical, chemical, and biological characteristics of water quality. These changes in turn will bring upon changes in the flow of goods and services produced by the water which are of use (direct, indirect, etc.) to human beings. It is those changes that must be identified, quantified, and measured in monetary terms to estimate the environmental costs of the increase in the discharge of pollution.
12
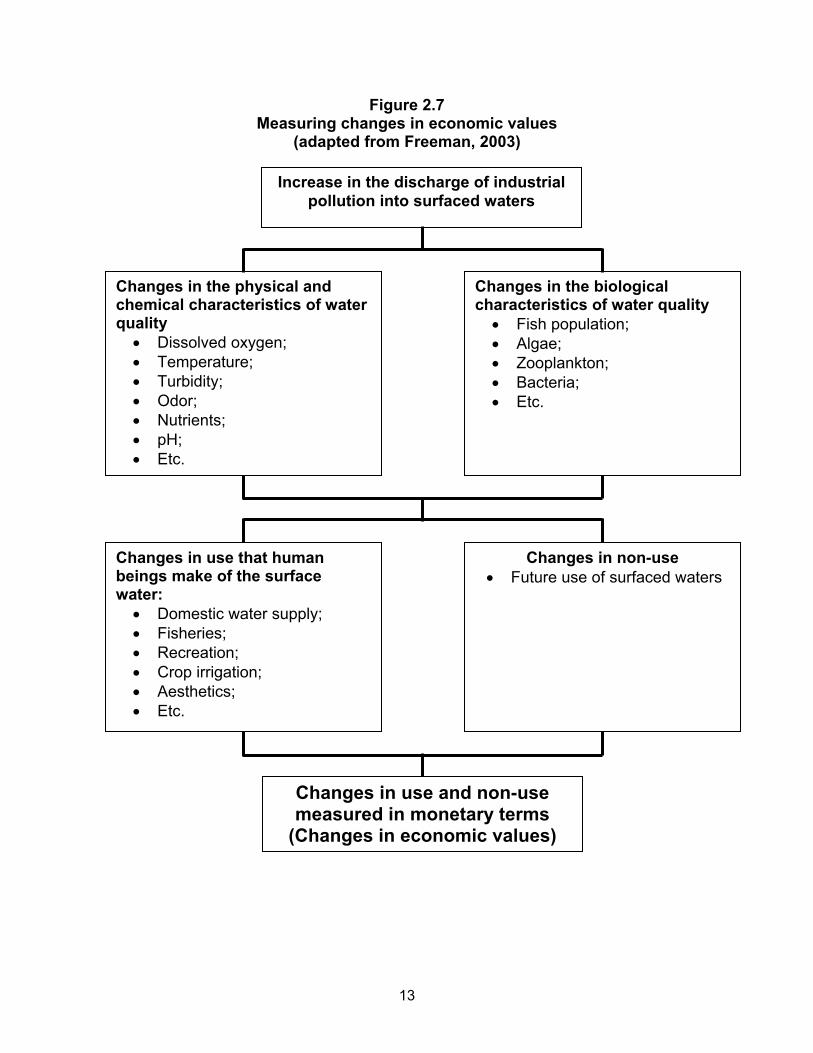
Figure 2.7 Measuring changes in economic values
(adapted from Freeman, 2003)
Increase in the discharge of industrial pollution into surfaced waters
Changes in the physical and chemical characteristics of water quality
• Dissolved oxygen; • Temperature; • Turbidity; • Odor; • Nutrients; • pH; • Etc.
Changes in the biological characteristics of water quality
• Fish population; • Algae; • Zooplankton; • Bacteria; • Etc.
Changes in use that human beings make of the surface water:
• Domestic water supply; • Fisheries; • Recreation; • Crop irrigation; • Aesthetics; • Etc.
Changes in non-use • Future use of surfaced waters
Changes in use and non-use measured in monetary terms
(Changes in economic values)
13

Note that it is not ‘changes in the environment’ that is of interest, but instead ‘changes in the use that human beings makes of the goods and services produced by the environment’. This last point is clear when noting the definition of ‘environmental effect’ and ‘environmental impact’ presented in the existing EIA Guidelines (Glossary of Terms)
ENVIRONMENTAL EFFECT A process such as soil erosion, accumulation of pollutants, or relocation of people that is modified by man’s actions. ENVIRONMENTAL IMPACT The net change (good or bad) in man’s health or well-being, including the ecosystems on which man’s well-being depends, that results from an ENVIRONMENTAL EFFECT. Environmental impact should take into account the change in environmental quality that would have occurred naturally, without man’s action.
Figure 2.8
Environmental effect, impact, and human well-being
ENVIRONMENTAL EFFECT: • Soil erosion; • Land conversion; • Reduction of air quality; • Reduction of water quality; • Pollution of groundwater; • Increase in noise level; • Etc.
ENVIRONMENTAL IMPACT: • Reduction in agricultural yield; • Reduction in fisheries yield; • Increase in the number of asthma
attacks; • Increase in the number of gastro-
intestinal diseases; • Etc.
CHANGE IN HUMAN WELL-BEING
14

2.4 Identification, quantification, and economic valuation It is appropriate in the context of the above discussion to conclude this chapter with the following important warning. The examples presented in Figure 2.7 and Figure 2.8 make very clear that before proceeding with the monetization of the environmental impacts of the project (economic valuation), these impacts must first be identified (e.g. adverse impact in water quality will lead to a reduction in nearby fisheries), and then quantified (e.g. quantity of fisheries yield lost). Environmental impacts which have not been identified cannot be, by definition, monetized. Similarly, any errors in the quantification of the impacts will necessarily lead to errors in the economic valuation of these impacts. The key point is that the economic valuation of the project’s environmental impacts can only be so good as the identification and quantification of these impacts. Hence, the request to proceed with the economic valuation of the project’s environmental impacts (as specified in the EIA Guidelines) does not relieve project initiators from the needs of identifying and quantifying these impacts (as is currently the case in the EIA process), but in fact makes these needs even more important and should induce project initiators to pay even more attention to this identification and quantification process.
Figure 2.9 Identification, quantification, economic valuation I
STEP 1
IDENTIFICATION OF ENVIRONMENTAL IMPACTS
STEP 2 QUANTIFICATION OF
ENVIRONMENTAL IMPACTS
STEP 3 ECONOMIC VALUATION OF ENVIRONMENTAL IMPACTS
15

Chapter 3
Approaching the economic valuation of environmental impacts: Issues of common interest
This chapter discusses issues which must be addressed at the outset of the economic valuation process and are common to all economic valuation methodologies. 3.1 Scope of analysis As indicated in Chapter 1, the EIA Guidelines specifies that one of the objectives of environmental impact analysis in Malaysia is:
To identify the environmental costs and benefits of the project to the community.
A key issue pertains to the identification of the ‘community’, or in other words of who to include (whose impacts to include; whose environmental costs and environmental benefits to include) in the analysis. As indicated in the ‘Glossary of Terms’ of the EIA Guidelines, the word ‘community’ is understood to stand (most often) as an abbreviation of ‘Human Community’, where ‘Human Community’ is defined as:
Any diverse group of people sharing the environment. The community may be local as in village or international as for example the Straits of Malacca. The community may be homogeneous (same race, same religion, same socio-economic position) or heterogeneous.
When considering the appropriate scope of analysis (who to include), both geographical scoping, and stakeholder scoping must be made very clear. 3.1.1 Geographical scoping While environmental impacts may occasionally be limited to a narrow geographical area in the vicinity of the project, in other circumstances these impacts may extend well beyond a narrowly defined area to cover an entire watershed, airshed, state, country, or even be global. Misspecifying the geographical scope of the EIA (most often by limiting unduly the geographical area of interest) can lead to significant under-estimates of the environmental costs and environmental benefits of the project. Unfortunately, there is no easy rule to guide the selection of the appropriate geographical scope of the EIA. While local governments may wish to limit the
16
assessment of the environmental impacts solely to their local constituencies, the federal government should typically want to address all environmental impacts of the project at least nationwide, irrespective of local jurisdictions or state boundaries. Of utmost importance is that the choice of geographical scope not be guided by strategic considerations leading to under-estimating the nature and extent of the possible adverse environmental impacts of the project, or over-estimating the nature and extent of the possible favorable environmental impacts of the project. To better inform the discussion pertaining to the identification, quantification, and economic valuation of environmental impacts:
• Group the environmental impacts (both positive and negative) into those occurring: (1) Within the local community where the project is located; (2) On other local communities within the state where the project is located; and (3) On other states of Malaysia (Figure 3.1);
• Select the same geographical scoping for the identification of both the
positive and negative environmental impacts.
Figure 3.1 Geographical scoping of environmental impacts
17
3.1.2 Stakeholder scoping An equally sensitive issue pertains to selecting whose costs and benefits to account for in the economic valuation. While the issue of stakeholder scoping may occasionally coincide with the issue pertaining to geographical scoping, it is different in that the environmental impacts of a project may impact different groups of people or households within a given geographical area. This is of particular relevance when the environmental impacts of projects (such as for example road improvement projects, bridge projects, coastal land reclamation projects among others) may have adverse or positive effects on the well-being of non-nationals who may only temporarily reside within the geographical area of interest (such as temporary workers or visitors). As for the selection of the appropriate geographical scope, there is no easy rule guiding the selection of the appropriate stakeholder scoping. Project initiators should however clearly identify the groups of individuals or households who are included into the process of identifying, quantifying, and monetizing the environmental impacts of the project, and those who are excluded. 3.2 Choice of scenario: With project versus without project Recall the definition of ‘Environmental impact’ presented in the EIA Guidelines:
ENVIRONMENTAL IMPACT The net change (good or bad) in man’s health or well-being, including the ecosystems on which man’s well-being depends, that results from an ENVIRONMENTAL EFFECT. Environmental impact should take into account the change in environmental quality that would have occurred naturally, without man’s action.
The last sentence of the above definition is of great importance. It points out that in order to identify the environmental impacts of the project, one must compare what is likely to happen to the environment (and the resulting impacts on human well-being) with the project relative to what is likely to happen if there were to be no project. In order words, one must look into the future and ask (for the selected group of stakeholders within the selected geographical scope): what is the future going to look like without the project versus with the project.
18
Note that in most circumstances, this is unlikely to be before and after the project. The before and after comparison:
• ignores or fails to account for future changes in environmental quality which may happen even in the absence of the project; and
• implicitly assumes that the environment in the future is going to remain the
same as it is today. Suppose a road or bridge project aims to reduce traffic congestion between two cities of Peninsular Malaysia. Suppose further that this reduction in traffic congestion is expected to have a positive impact on ambient air quality by reducing vehicular emissions of pollution. A key issue pertains to quantifying this improvement in ambient air quality. For this purpose, a reference scenario must be established. As illustrated in Figure 3.2, without the project it may be unlikely that air pollution concentration would remain at existing levels. In fact, one may reasonably expect that without the project, traffic congestion would get worse, and that air pollution concentration would concurrently get worse as well. In such situations, the scenario of reference is not the existing levels of pollution, but is instead the expected level of pollution if there were to be no project. Note in Figure 3.2 that even if pollution concentration were to be higher with the project, one would not conclude that the project resulted in an increase of pollution concentration. In the example presented in Figure 3.2, the project would still reduce pollution concentration when compared to a scenario where there were to be no project.
19

Figure 3.2 With project versus without project
Expected pollution concentration with project
Expected pollution concentration without project
Existing pollution concentration
Today
Impact of the project
In order to identify and quantify the environmental impacts of projects, project initiators should clearly specify the:
• Expected changes in environmental quality and the associated environmental impacts if there were to be no project (without project scenario);
And then compare the above scenario with the:
• Expected changes in environmental quality and the associated environmental impacts if there were to be a project (with project scenario).
20

Box 3.1 Example of with versus without project
In a detailed EIA report submitted to DOE, one read the following:
The project site is mainly under agriculture and secondary forest. At lowers slopes, durian trees were planted (some still in production) and at a later stage other fruit trees as well as other agricultural cash crops were added. There is expected to be a loss in terms of agricultural productivity as a result of development in the area. Durian and other fruit crops will be removed in the process of development but it is expected that this loss is insignificant as the area has not been maintained and the crops that are present are old and near the end of their peak productivity.
While one may argue or disagree with the conclusion that “this loss is insignificant”, the approach used to identify the potential loss of agricultural productivity is correct. Assuming indeed that the best use of this land is its existing land use, then the study aimed to identify what is likely to happen to agricultural productivity in the future without the project (“the crops are old and near the end of their peak productivity”) versus with the project. 3.3 Dealing with price changes: Nominal versus real The market price of a specific commodity may vary for two different reasons. First, it may vary simply because of changes in the general price level and in more or less the same proportion as these changes in the general price level (when this change in the general price level is upward, it is referred as inflation). Such changes are referred as changes in nominal prices. Second, it may vary because of changes in the supply and/or demand for the commodity. Such changes are referred as changes in real prices.4 Since inflation impacts all prices in more or less the same manner, there is no need to incorporate inflation in the process of undertaking the economic valuation of the environmental impacts of the project. As such, there is no need to attempt
4 For example, the significant increase in the price of oil observed over the period 2006-2008 does not result from inflationary pressure but mostly from an increase in the demand for oil. This change in the price of oil is not a change in nominal price but is a change in real price. Note that the expressions ‘real price’ and ‘constant price’ are often used interchangeably. They should not be. As the case of the price of oil shows clearly, there is no reason to expect that ‘real prices’ are constant.
21

forecasting future inflation rates or future changes in prices, except for those changes in real prices. Specific recommendations are:
• Conduct the economic valuation of the project’s environmental impacts in terms of real prices;
• Do not incorporate in the economic valuation of the project’s
environmental impacts changes in prices solely caused by inflation; • As a level of reference, use the level of prices as observed at the time of
preparing the EIA report. 3.4 Accounting for time: Discounting In this section we address issues which arise from the fact that environmental costs and environmental benefits may arise at different points in time, some in the near future, and others in a more distant future. These issues arise from observing that RM 1 million of environmental costs or benefits today is not the same as RM 1 million of environmental costs or benefits in 1 or 2 or 10 years from now.
3.4.1 Discounting and present value Discounting is simply a technique which allows to measure in a common unit of measurement (today’s dollars) costs or benefits which are taking place at different points in time. The value today of future environmental costs and benefits is known at the present value of these environmental costs and benefits. 3.4.2 The mechanics of discounting Discounting is simply compound interest in reverse. The mechanics of compounding is presented in Figure 3.3. RM 100 earning 10% per year will be worth RM 110 in one year from now, 121 in two years from now, and more generally will be worth RM 100(1.1)t in t years from now. With compounding, one estimates the future value of RM 100 received today.
22
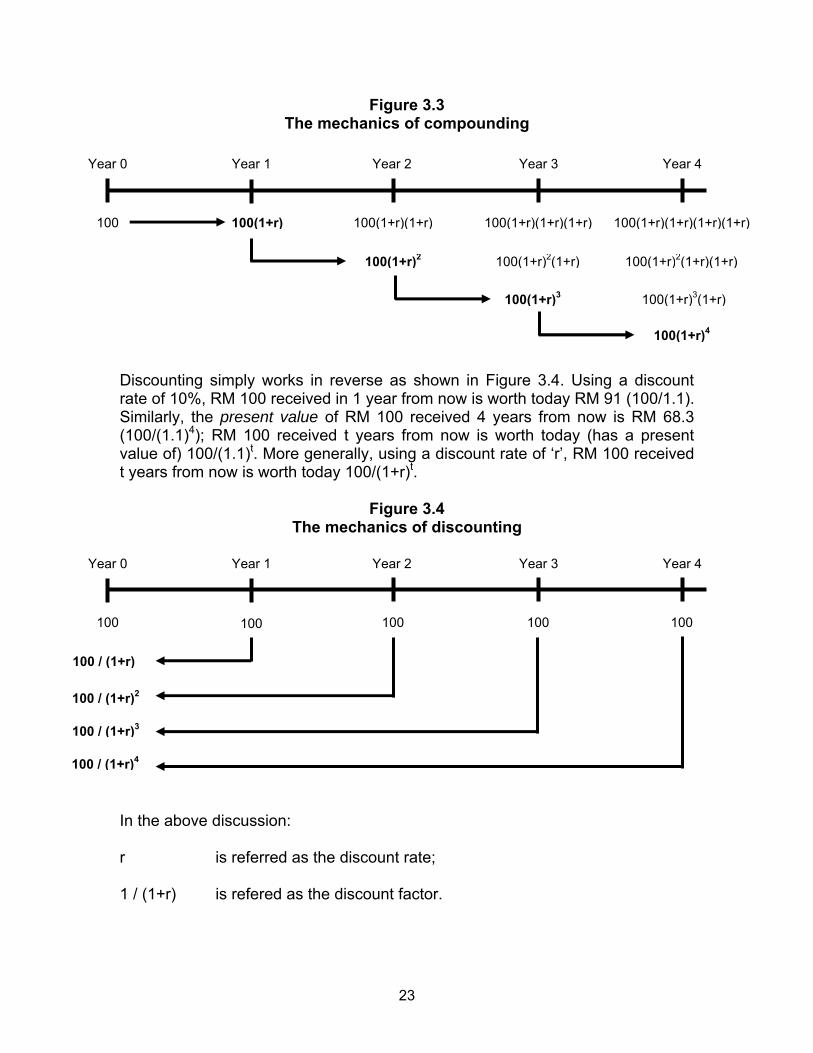
Figure 3.3 The mechanics of compounding
Year 0 Year 1 Year 2 Year 3 Year 4
100 100(1+r) 100(1+r)(1+r)
100(1+r)2 100(1+r)2(1+r)
100(1+r)3
100(1+r)(1+r)(1+r)
100(1+r)2(1+r)(1+r)
100(1+r)3(1+r)
100(1+r)(1+r)(1+r)(1+r)
100(1+r)4
Discounting simply works in reverse as shown in Figure 3.4. Using a discount rate of 10%, RM 100 received in 1 year from now is worth today RM 91 (100/1.1). Similarly, the present value of RM 100 received 4 years from now is RM 68.3 (100/(1.1)4); RM 100 received t years from now is worth today (has a present value of) 100/(1.1)t. More generally, using a discount rate of ‘r’, RM 100 received t years from now is worth today 100/(1+r)t.
Figure 3.4 The mechanics of discounting
Year 0 Year 1 Year 2 Year 3 Year 4
100
100 / (1+r)
100
100 / (1+r)2
100 / (1+r)3
100 100
100 / (1+r)4
100
In the above discussion: r is referred as the discount rate; 1 / (1+r) is refered as the discount factor.
23

Denote by Ct the economic value of the potential adverse environmental impacts of the project in period t (environmental costs). Denote by Bt the economic value of the potential positive environmental impacts of the project in period t (environmental benefits). Where appropriate, these environmental costs and benefits must be presented clearly in a manner similar to Figure 3.5 (the selection of ‘T’ is discussed in section 3.5 below).
Figure 3.5 Presentation of environmental costs and benefits
Year 0 Year 1 Year 2 Year 3 Year T
C0 C2 C3 CTC1
● ● ●
● ● ●
B0 B2 B3 BTB1 ● ● ●
Once environmental costs and environmental benefits are presented in a manner similar to Figure 3.5, then the present value of these environmental costs and benefits can be calculated as:5 Present value of
environmental costs TT
rC
rC
rC
rCC
)1()1()1()1( 33
221
0 ++•••+
++
++
++=
∑= +
=T
ttr
C0
0
)1(
Present value of
environmental benefits TT
rB
rB
rB
rBB
)1()1()1()1( 33
221
0 ++•••+
++
++
++=
∑= +
=T
ttr
B0
0
)1(
5 The function ‘NPV’ in Excel Spreadsheet performs this calculation.
24
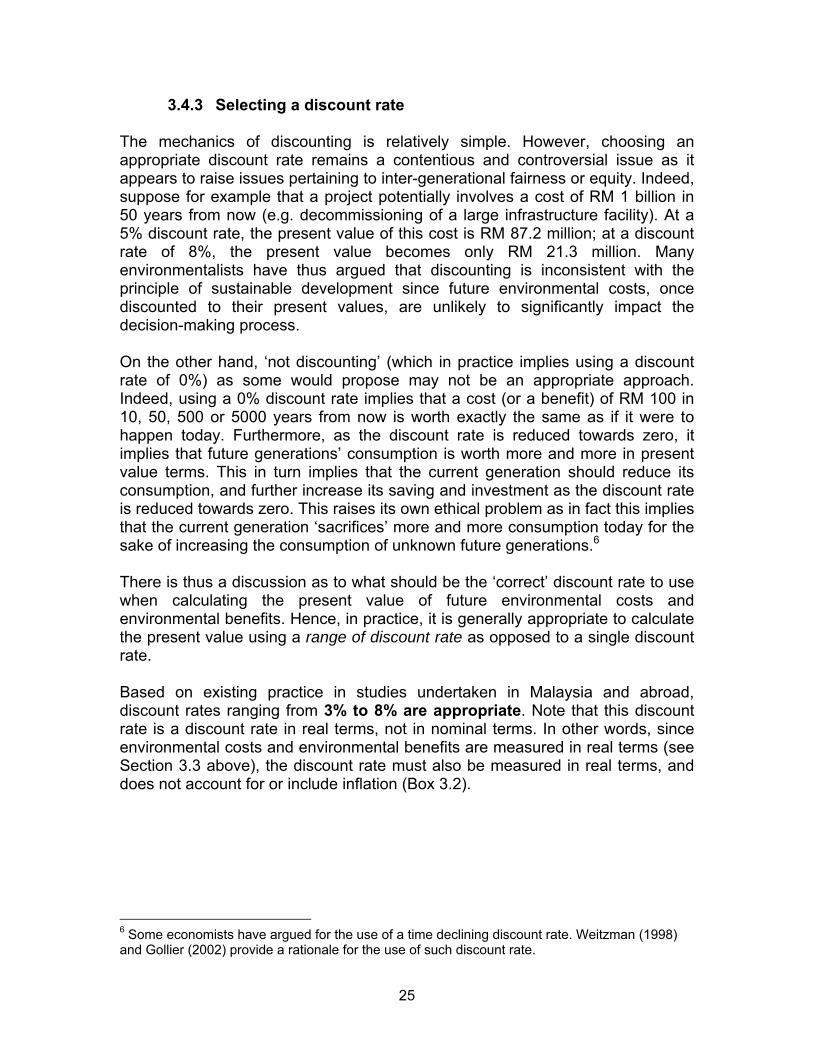
3.4.3 Selecting a discount rate The mechanics of discounting is relatively simple. However, choosing an appropriate discount rate remains a contentious and controversial issue as it appears to raise issues pertaining to inter-generational fairness or equity. Indeed, suppose for example that a project potentially involves a cost of RM 1 billion in 50 years from now (e.g. decommissioning of a large infrastructure facility). At a 5% discount rate, the present value of this cost is RM 87.2 million; at a discount rate of 8%, the present value becomes only RM 21.3 million. Many environmentalists have thus argued that discounting is inconsistent with the principle of sustainable development since future environmental costs, once discounted to their present values, are unlikely to significantly impact the decision-making process. On the other hand, ‘not discounting’ (which in practice implies using a discount rate of 0%) as some would propose may not be an appropriate approach. Indeed, using a 0% discount rate implies that a cost (or a benefit) of RM 100 in 10, 50, 500 or 5000 years from now is worth exactly the same as if it were to happen today. Furthermore, as the discount rate is reduced towards zero, it implies that future generations’ consumption is worth more and more in present value terms. This in turn implies that the current generation should reduce its consumption, and further increase its saving and investment as the discount rate is reduced towards zero. This raises its own ethical problem as in fact this implies that the current generation ‘sacrifices’ more and more consumption today for the sake of increasing the consumption of unknown future generations.6 There is thus a discussion as to what should be the ‘correct’ discount rate to use when calculating the present value of future environmental costs and environmental benefits. Hence, in practice, it is generally appropriate to calculate the present value using a range of discount rate as opposed to a single discount rate. Based on existing practice in studies undertaken in Malaysia and abroad, discount rates ranging from 3% to 8% are appropriate. Note that this discount rate is a discount rate in real terms, not in nominal terms. In other words, since environmental costs and environmental benefits are measured in real terms (see Section 3.3 above), the discount rate must also be measured in real terms, and does not account for or include inflation (Box 3.2).
6 Some economists have argued for the use of a time declining discount rate. Weitzman (1998) and Gollier (2002) provide a rationale for the use of such discount rate.
25
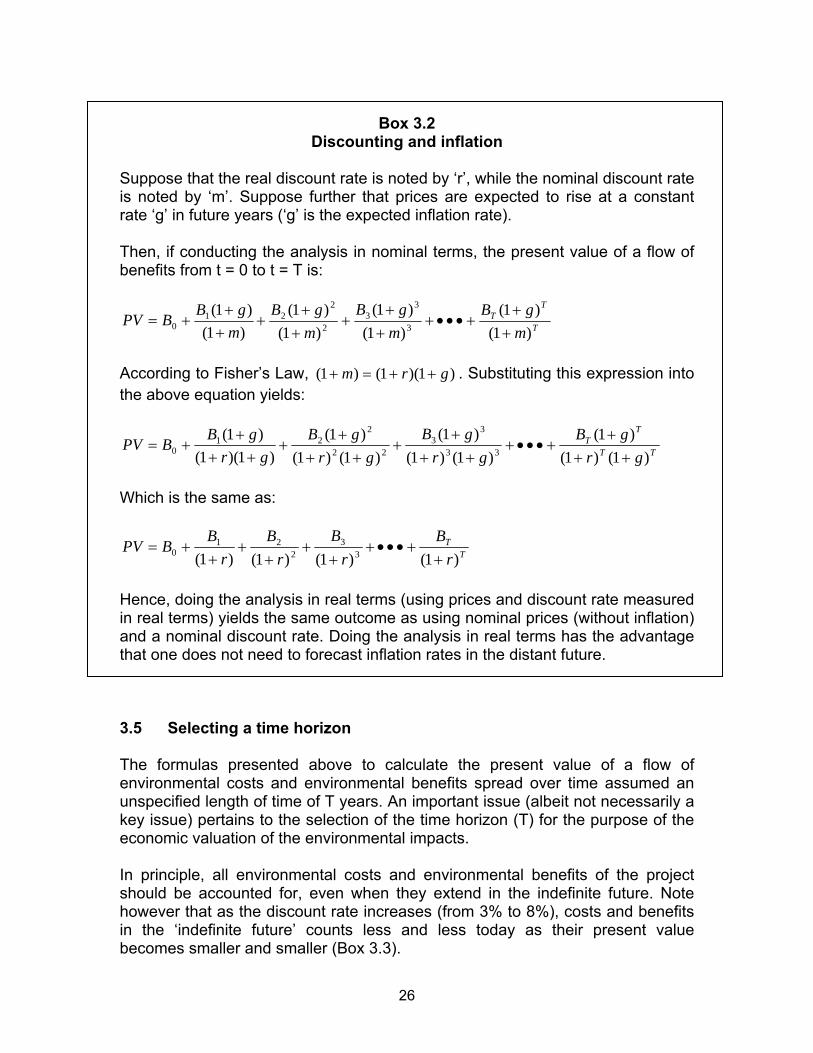
Box 3.2
Discounting and inflation Suppose that the real discount rate is noted by ‘r’, while the nominal discount rate is noted by ‘m’. Suppose further that prices are expected to rise at a constant rate ‘g’ in future years (‘g’ is the expected inflation rate). Then, if conducting the analysis in nominal terms, the present value of a flow of benefits from t = 0 to t = T is:
T
TT
mgB
mgB
mgB
mgBBPV
)1()1(
)1()1(
)1()1(
)1()1(
3
33
2
221
0 ++
+•••++
++
++
++
++=
According to Fisher’s Law, )1)(1()1( grm ++=+ . Substituting this expression into the above equation yields:
TT
TT
grgB
grgB
grgB
grgBBPV
)1()1()1(
)1()1()1(
)1()1()1(
)1)(1()1(
33
33
22
221
0 +++
+•••+++
++
+++
+++
++=
Which is the same as:
TT
rB
rB
rB
rBBPV
)1()1()1()1( 33
221
0 ++•••+
++
++
++=
Hence, doing the analysis in real terms (using prices and discount rate measured in real terms) yields the same outcome as using nominal prices (without inflation) and a nominal discount rate. Doing the analysis in real terms has the advantage that one does not need to forecast inflation rates in the distant future. 3.5 Selecting a time horizon The formulas presented above to calculate the present value of a flow of environmental costs and environmental benefits spread over time assumed an unspecified length of time of T years. An important issue (albeit not necessarily a key issue) pertains to the selection of the time horizon (T) for the purpose of the economic valuation of the environmental impacts. In principle, all environmental costs and environmental benefits of the project should be accounted for, even when they extend in the indefinite future. Note however that as the discount rate increases (from 3% to 8%), costs and benefits in the ‘indefinite future’ counts less and less today as their present value becomes smaller and smaller (Box 3.3).
26

Box 3.3
Discount rate and the indefinite future Suppose that a project involves an environmental cost or benefit of RM 100 millions in 100 years from now. The present value of this cost or benefit will not be very large for any discount rate between 3% and 8%, and would be decreasing significantly as the discount rate increases from 3% to 8% as shown below.
Present value of RM 100 millions received in 100 years from now
Discount rate Present value (RM)
3% 5,203,283 4% 1,980,004 5% 760,004 6% 294,722 7% 115,245 8% 45,459
A key issue is to recognize that though a project may be completed from an engineering point of view (for example, the construction of the road or bridge is completed), environmental costs and benefits may continue to arise for many more years beyond the ‘construction phase’. To this extent, the appropriate time horizon to select should coincide with the expected duration (in time) of the environmental impacts of the project. If some environmental impacts are expected to be of a temporary nature (for example, during the construction phase of the project), then for these impacts the appropriate time horizon to select is the number of years these impacts are expected to last. If some environmental impacts are expected to be permanent, then using a time horizon of between 30 to 50 years is generally sufficient to provide an adequate estimate of the present value of these impacts. 3.6 Conducting sensitivity analysis Each of the steps leading to the estimation of the environmental costs and benefits of the project (identification, quantification, and monetization) is undertaken in a context of uncertainty as well as with incomplete and sometimes unreliable information. For this reason, it is always prudent to estimate costs and benefits under a series of different assumptions as to what may be the environmental impacts of the project.
27

The purpose of conducting a sensitivity analysis is to identify the variables which influence most the present value of environmental costs and environmental benefits, and to quantify the impact of changes in these variables on the present value of these costs and benefits. There are two relatively straightforward ways of conducting sensitivity analysis. One way, most often conducted in such analysis, is to assume that the impacts of the project (or the most important impacts of the project) are slightly higher or lower than those expected, and for each new assumption or scenario to recompute the present value of environmental costs and benefits. An alternative way is to assume a worst case or a best case scenario. Establishing a worst case scenario is especially useful when the project has adverse environmental impacts on the environment. For example, if a project were to have adverse impact on nearby fisheries or agricultural activities, a worse case scenario would estimate the environmental costs assuming that all fisheries or all agricultural activities were to disappear forever. After conducting the sensitivity analysis, the estimated present value of environmental costs or environmental benefits will not be a point estimate (for example, RM 100 million), but will be a range of values (for example, between RM 75 and RM 130 million). Such range will provide more useful information pertaining to the ‘likely’ impacts of the project on the environment. 3.7 Summary of recommendations to project initiators Project initiators are not formally required to follow any specific format or instructions when undertaking and presenting the economic valuation of the project’s environmental impacts in their EIA reports. However, in order to facilitate the understanding of this economic valuation and discussions with DOE, the following recommendations are presented. 3.7.1 With respect to the scope of analysis
• Aim first to identify the environmental impacts of the project, not to select the geographical scoping of the project;
• Group the environmental impacts (both positive and negative) into those
occurring: (1) Within the local community where the project is located; (2) On other local communities within the state where the project is located; and (3) On other states of Malaysia. On the basis of this information, define the appropriate geographical scoping of the project for purpose of the EIA process;
28

• Identify clearly the groups of individuals or households who are included and those who may be excluded from the process of identifying, quantifying, and monetizing the environmental impacts of the project. 3.7.2 With respect to the scenario of reference
• In order to identify and quantify the extent of the project’s environmental
impacts, project initiators should clearly specify and compare the following two scenarios:
Scenario 1: Expected changes in environmental quality and the associated environmental impacts if there were to be no project (without project scenario) Scenario 2: Expected changes in environmental quality and the associated environmental impacts if there were to be a project (with project scenario)
• Present the undiscounted stream of environmental costs and
environmental benefits of the project, in each of the period in these the costs and benefits are taking place (as in Table 3.1 below);
Table 3.1
Undiscounted stream of environmental costs and benefits Year 0 Year 1 Year 2 Year 3 Year 4 ● ● ● Year T Environmental Costs
C0 C1 C2 C3 C4 ● ● ● CT
Environmental Benefits
B0 B1 B2 B3 B4 ● ● ● BT
3.7.3 With respect to inflation
• Conduct the economic evaluation of the project’s environmental impacts in terms of real prices;
• Do not incorporate in the economic valuation of the project’s
environmental impacts changes in prices solely caused by inflation; • As a level of reference, use the level of prices as observed at the time of
preparing the EIA report.
29
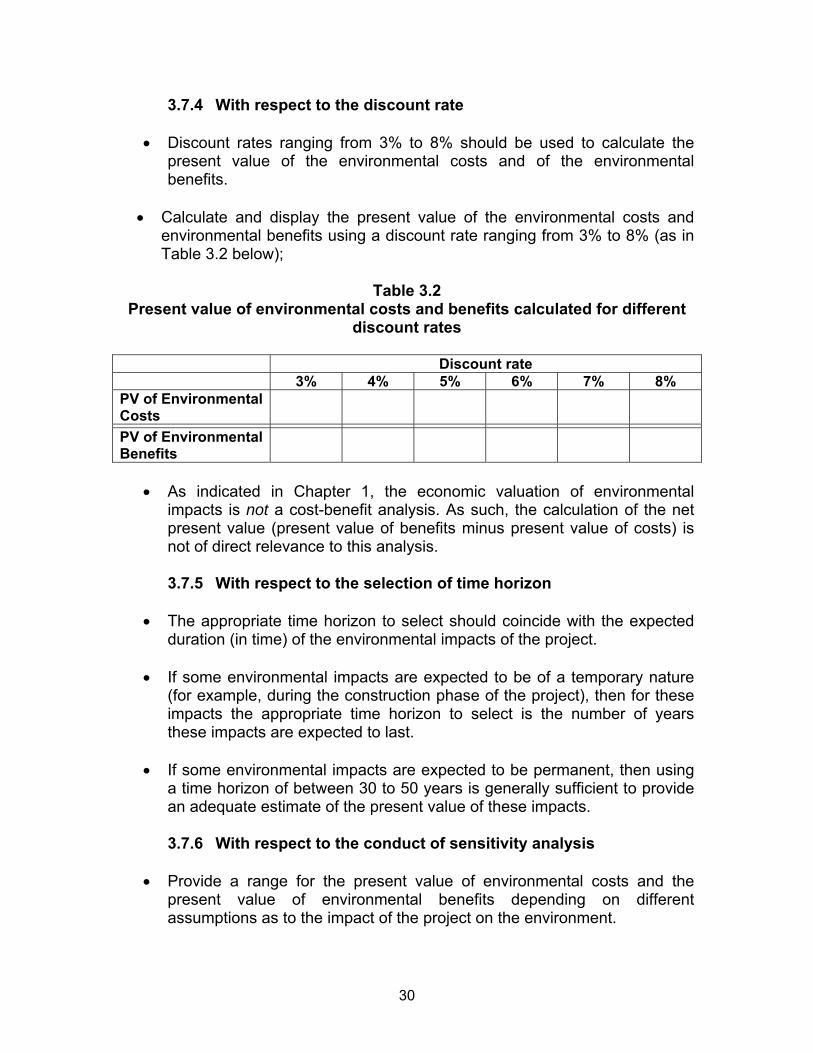
3.7.4 With respect to the discount rate
• Discount rates ranging from 3% to 8% should be used to calculate the present value of the environmental costs and of the environmental benefits.
• Calculate and display the present value of the environmental costs and
environmental benefits using a discount rate ranging from 3% to 8% (as in Table 3.2 below);
Table 3.2
Present value of environmental costs and benefits calculated for different discount rates
Discount rate 3% 4% 5% 6% 7% 8% PV of Environmental Costs
PV of Environmental Benefits
• As indicated in Chapter 1, the economic valuation of environmental
impacts is not a cost-benefit analysis. As such, the calculation of the net present value (present value of benefits minus present value of costs) is not of direct relevance to this analysis.
3.7.5 With respect to the selection of time horizon
• The appropriate time horizon to select should coincide with the expected duration (in time) of the environmental impacts of the project.
• If some environmental impacts are expected to be of a temporary nature
(for example, during the construction phase of the project), then for these impacts the appropriate time horizon to select is the number of years these impacts are expected to last.
• If some environmental impacts are expected to be permanent, then using a time horizon of between 30 to 50 years is generally sufficient to provide an adequate estimate of the present value of these impacts.
3.7.6 With respect to the conduct of sensitivity analysis
• Provide a range for the present value of environmental costs and the
present value of environmental benefits depending on different assumptions as to the impact of the project on the environment.
30

PART B
METHODOLOGIES FOR THE ECONOMIC VALUATION OF ENVIRONMENTAL IMPACTS
31

Chapter 4
Introduction to the methodologies for economic valuation 4.1 From environmental impacts to methodologies In this second part of these Guidelines, the purpose is to describe methodologies typically used to undertake the economic valuation of environmental impacts. The following methodologies are presented and discussed:
• Change of productivity methodology (Chapter 5);
• Revealed preferences methodologies (Chapter 6);
• Stated preferences methodologies (Chapter 7); and
• Benefit-transfer methodology (Chapter 8). Before discussing the details of these approaches, it is of importance to note that the choice of an economic valuation methodology depends on the nature of the environmental impacts one seeks to monetize. Recall that Figure 2.2 presented the concept of total economic value and of its components (use and non-use values, direct use, indirect use, etc.). Different economic valuation methodologies are thus used to estimate different economic values as shown in Figure 4.1:
• Changes in consumptive direct use values are typically estimated using the change in productivity methodology;
• Changes in non-consumptive direct use as well as indirect use values are
typically estimated using revealed preferences methodologies. However, the change of productivity and stated preferences methodologies may occasionally be used for this purpose as well depending on the nature of the environmental impacts;
• Changes in non-use values can only be estimated using stated
preferences methodologies.
32

Figure 4.1 Economic values and methodologies
Use value
Direct use value
Indirect use value
Non-use value
Bequest value
Existence value
Consumptive direct use value
Non-consumptive direct use value
Hence, the choice of an economic valuation methodology dof the environmental impacts one seeks to monetize (Tableof the environmental impacts which determines which methomay occasionally be more than one methodology possibeconomic valuation of a particular impact (Table 4.1). Inavailability (or lack) of data is more likely to determmethodology can be implemented.
33
Change of productivity
Change of productivity Revealed preferences and stated preferencesmethodologies
Stated preferences methodologies
epends on the nature 4.1). It is the nature dology to use. There le to undertake the
such situations, the ine which specific
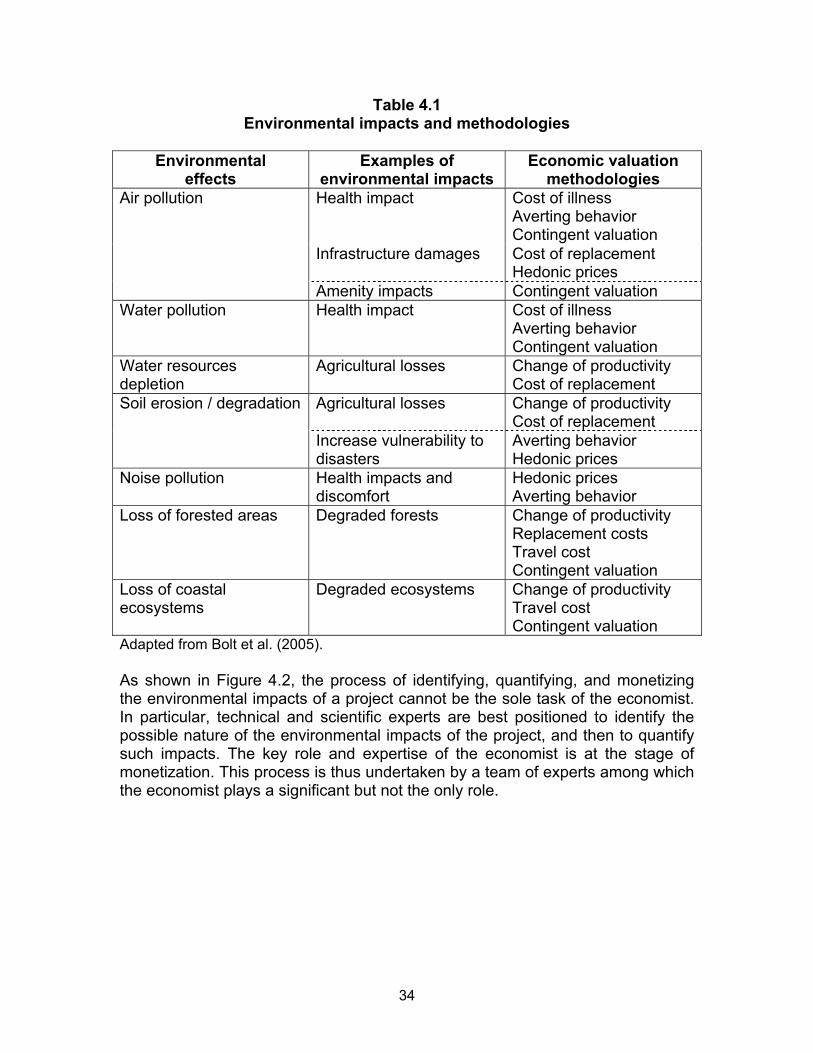
Table 4.1 Environmental impacts and methodologies
Environmental
effects Examples of
environmental impacts Economic valuation
methodologies Air pollution Health impact Cost of illness
Averting behavior Contingent valuation
Infrastructure damages
Cost of replacement Hedonic prices
Amenity impacts Contingent valuation Water pollution Health impact Cost of illness
Averting behavior Contingent valuation
Water resources depletion
Agricultural losses Change of productivity Cost of replacement
Soil erosion / degradation Agricultural losses Change of productivity Cost of replacement
Increase vulnerability to disasters
Averting behavior Hedonic prices
Noise pollution Health impacts and discomfort
Hedonic prices Averting behavior
Loss of forested areas Degraded forests Change of productivity Replacement costs Travel cost Contingent valuation
Loss of coastal ecosystems
Degraded ecosystems Change of productivity Travel cost Contingent valuation
Adapted from Bolt et al. (2005). As shown in Figure 4.2, the process of identifying, quantifying, and monetizing the environmental impacts of a project cannot be the sole task of the economist. In particular, technical and scientific experts are best positioned to identify the possible nature of the environmental impacts of the project, and then to quantify such impacts. The key role and expertise of the economist is at the stage of monetization. This process is thus undertaken by a team of experts among which the economist plays a significant but not the only role.
34

Figure 4.2 Identification, quantification and economic valuation II
Identification of the
environmental impacts
Quantification of the environmental impacts
Monetization of the environmental impacts
Task of technical / scientific experts and economist
Task of economist
Task of technical / scientific experts
4.2 Recommendations to project initiators
• Identify all environmental impacts of the project and assess which data is currently available in order to quantify the environmental impacts (changes in physical terms);
• Given the nature of the available data, determine which methodology is
best to use to undertake the economic valuation of the environmental impacts, and depending on the selected methodology, proceed with (additional) data collection if necessary;
• Ensure that the team of experts is appropriate to the task at hand and that
the economist is a member of the team from the very outset of the EIA process to ensure that the data necessary for purpose of economic valuation is indeed collected.
35

Chapter 5
Change of productivity methodology 5.1 When to use this methodology In a number of instances, changes in environmental quality lead to changes in the quantity (or quality) of goods or services produced by the environment. In other instances, one may think of environmental quality as an input (along with other inputs such as capital and labor) into the production of goods and services, such as in agriculture for example. In such instances, changes in environmental quality may impact the flow (quantity or quality) of the goods and services produced by the environment or may impact the productivity (yield) of the goods produced with the support of the environmental input. In such instances, the change of productivity methodology may be used to transform the adverse changes in environmental quality into environmental costs, and the positive changes in environmental quality into environmental benefits.7 Examples when the application of the change of productivity methodology is appropriate include:
• Water pollution and water resources depletion. The quantity and quality of water diverted for irrigation purposes affects the agricultural productivity (yield) of irrigated land. Hence, changes in water quality or quantity is likely to have an impact on agricultural productivity or on the cost of conducting agricultural production;
• Water pollution. The quality of water impacts fisheries productivity (yield).
Hence, changes in water quality is likely to have an impact on fisheries productivity or on the cost of conducting fisheries activities;
• Water resources depletion. In a number of instances, the depletion (or
pollution) of the water resources impacts the productivity (quantity of energy produced) of hydro-power dams. Such use of the water resources is generally referred as an indirect use of the resource and produces indirect use value. The economic value of the lost energy production is a cost to society;
• Soil erosion (on-site impact). The quantity and quality of soil affects
agricultural productivity. Hence, the loss of soil (erosion) is likely to have an impact on agricultural productivity or on the cost of conducting agricultural production;
7 In order to avoid unduly burdening the text with both adverse and positive environmental impacts, most of the text will directly address adverse environmental impacts as these may be more appropriate given the context in which these Guidelines are going to be used.
36
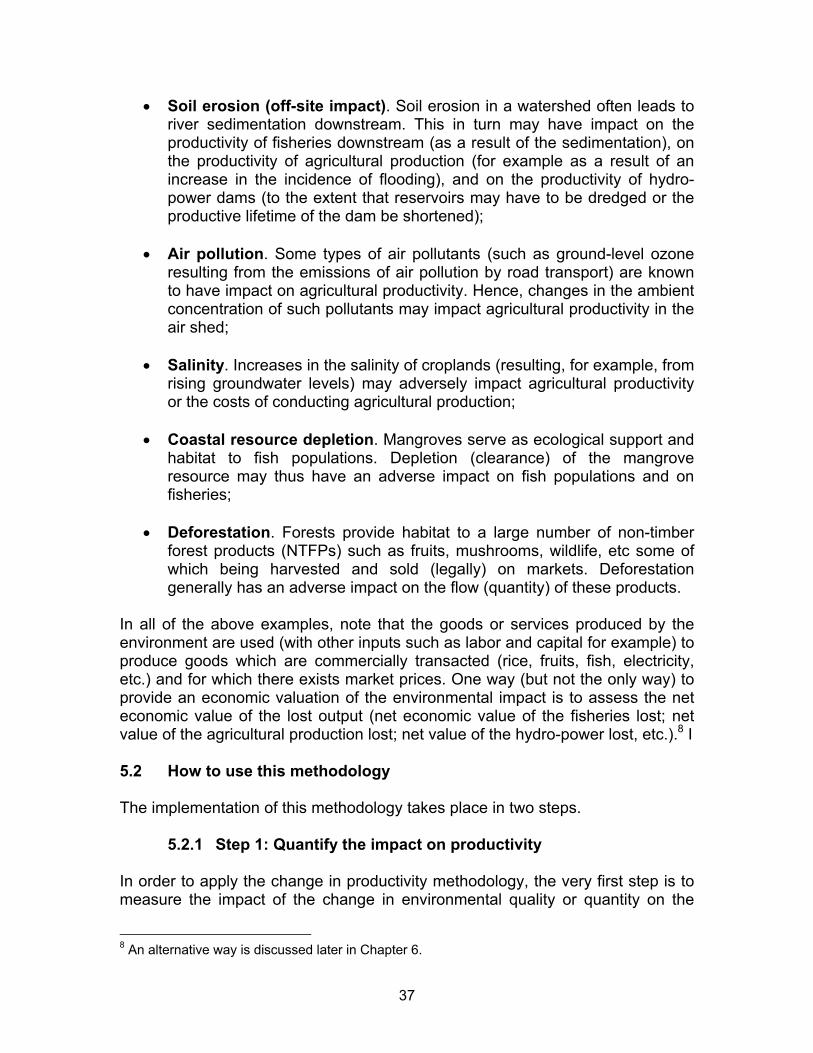
• Soil erosion (off-site impact). Soil erosion in a watershed often leads to river sedimentation downstream. This in turn may have impact on the productivity of fisheries downstream (as a result of the sedimentation), on the productivity of agricultural production (for example as a result of an increase in the incidence of flooding), and on the productivity of hydro-power dams (to the extent that reservoirs may have to be dredged or the productive lifetime of the dam be shortened);
• Air pollution. Some types of air pollutants (such as ground-level ozone
resulting from the emissions of air pollution by road transport) are known to have impact on agricultural productivity. Hence, changes in the ambient concentration of such pollutants may impact agricultural productivity in the air shed;
• Salinity. Increases in the salinity of croplands (resulting, for example, from
rising groundwater levels) may adversely impact agricultural productivity or the costs of conducting agricultural production;
• Coastal resource depletion. Mangroves serve as ecological support and
habitat to fish populations. Depletion (clearance) of the mangrove resource may thus have an adverse impact on fish populations and on fisheries;
• Deforestation. Forests provide habitat to a large number of non-timber
forest products (NTFPs) such as fruits, mushrooms, wildlife, etc some of which being harvested and sold (legally) on markets. Deforestation generally has an adverse impact on the flow (quantity) of these products.
In all of the above examples, note that the goods or services produced by the environment are used (with other inputs such as labor and capital for example) to produce goods which are commercially transacted (rice, fruits, fish, electricity, etc.) and for which there exists market prices. One way (but not the only way) to provide an economic valuation of the environmental impact is to assess the net economic value of the lost output (net economic value of the fisheries lost; net value of the agricultural production lost; net value of the hydro-power lost, etc.).8 I 5.2 How to use this methodology The implementation of this methodology takes place in two steps.
5.2.1 Step 1: Quantify the impact on productivity In order to apply the change in productivity methodology, the very first step is to measure the impact of the change in environmental quality or quantity on the
8 An alternative way is discussed later in Chapter 6.
37

productivity of the resource. This may be the most difficult step when implementing this methodology. It consists in asking and attempting to answer questions such as (for example):
• How much agricultural yield would be lost (in quantity terms) if ambient water quality were to degrade as a result of wastewater discharges from the proposed project?
• How much fisheries would be lost (in quantity terms) if ambient water
quality were to degrade as a result of wastewater discharges from the proposed project?
• How much agricultural yield would be lost (in quantity terms) if the project
were to increase soil erosion?
• How much energy from the downstream hydro power dam would be lost if the project were to increase soil erosion upstream?
In technical terms, this amounts to establishing a dose-response function (sometimes also called a ‘exposure-response’ function) between the change in environmental quality (dose) and the resulting impact on productivity (response). In some instances, estimating the lost productivity may be relatively simple (for example, if a project were to convert existing agricultural land, then the lost of productivity could be simply estimated as the difference between the existing productivity and zero – a complete loss).9 In other instances, this may be relatively difficult (for example, if a project has an adverse but temporary impact on water quality, assessing the impact on fisheries productivity may be relatively difficult). This explains the need to conduct comprehensive sensitivity analysis.
5.2.2 Step 2: Monetize the impact Once the environmental impacts have been quantified in physical terms, these impacts then need to be monetized. In a number of cases, market prices (as they are simply observed on the markets) are used to estimate the net economic value (revenues minus production costs) of the change in productivity. However, in a number of instances, market prices may be somewhat misleading market prices may also reflect the presence of taxes, subsidies, import restrictions, etc. Hence, before using market prices, it is important to adjust these 9 Under the assumption that future land productivity were to be equal to the existing level of productivity.
38
prices to remove the impacts of such policies. In circumstances where the commodity is transacted internationally, world prices may serve as a good estimate of the economic value of the commodity. 5.3 Strengths and limitations of the methodology 5.3.1 Strengths Of all the economic valuation methodologies available, the change of productivity methodology is perhaps the least demanding in terms of data analysis and the required economic expertise. The results from applying the change of productivity methodology are also of immediate use in the context of the EIA process as the estimated change in economic value often translates in lost or increased income to those exploiting the resources (fishermen, farmers, etc.). To this extent, the assessment of environmental costs which results from applying the change of productivity methodology is often better explained and better understood by stakeholders and decision-makers. 5.3.2 Limitations The key difficulty when applying the change of productivity methodology is to assess the impact of the change in environmental quality or quantity on the quantity (or quality) of the goods produced with the help of the environment. In a number of instances, the dose-response functions are not well-known or will provide a wide range of possible productivity impacts resulting from the change in environmental quality or quantity. The technical (or scientific) expertise required may be relatively significant. It is also important to note that the change in productivity methodology provides the economic value of the goods and services produced by the environment only as these goods and services are used to produce marketed products. To the extent that the goods and services produced by the environment are also used in many other ways, the economic value estimated from applying the change in productivity methodology will under-estimate the total economic value of these goods and services. 5.4 Recommendations to project initiators 5.4.1 Quantify the impact on productivity In almost all cases, estimating the effect of the environmental impacts on productivity will involve the following:
39

• Estimate the existing annual level (on average) of productivity (by means of time series data over the last 5 years approximately);
• Establish what may be expected to happen to the future level of
productivity if there were to be no project (one possible scenario (hypothesis) is that the future level of productivity would be equal on average to the recently observed level of productivity). This is the without project scenario;
• Establish what may be expected to happen to the future level of
productivity if there were to be a project. This is the with project scenario;
• Indicate clearly if the impacts are expected to be temporary (for example occurring only during the construction phase of the project) or permanent. If temporary, indicate clearly for how many years the impacts are expected to occur, and how productivity (in quantitative terms) is expected to recover over time to the level that is expected to exist without project;
• Estimate the impact on productivity by calculating the difference between
the without project and with project scenarios;
• Construct alternative scenarios including a worst case scenario (where appropriate) to give a possible range of the impact of the project on productivity (sensitivity analysis).
5.4.2 Step 2: Monetize the impact
In almost all cases, monetizing the estimated change in productivity will involve the following:
• Collect information about recent and existing market prices for the commodity whose productivity is impacted, as well as for the inputs necessary to the production of this commodity (e.g. labor, machinery, etc.);
• Before using market prices, adjust these prices at least for the presence of
taxes, and if possible of subsidies and any other policies which may impact market prices;
• Calculate the net economic value of the change (decrease or increase) in
productivity per unit of output (for example, per kilogram or ton of product; or per hectares of lost agricultural land);
• Multiply the net economic value per unit of output by the total estimated
quantity of lost (or gained) output in any given year;
40
• Calculate the present value of the change in productivity using a discount rate ranging between 3% and 8%;
• Given the outcome of the sensitivity analysis, give a possible range for the
estimated economic value of the change in productivity. The examples presented in Appendix 1 and 2 are illustrative of the application of the change of productivity methodology.
41

Chapter 6
Revealed preferences methodologies 6.1 Introduction to revealed preferences methodologies In a number of circumstances, instead of letting the change in environmental quality or quantity impact the productivity of their resource, individuals (such as farmers for example) may seek to undertake activities (such as, for example, using additional quantities of fertilizers, or working longer hours) to offset (partially or totally) this potential impact (Box 6.1)
Box 6.1 Sedimentation ponds in Malaysia
In a large number of instances in Peninsular and Eastern Malaysia, farmers must remove large quantities of sediments from surface waters before using the water to irrigate their field. For this purpose, farmers generally use sedimentation ponds in which water lies still for a period of time sufficiently long to let the sediments fall at the bottom of the pond (which is most often simply a large hole dug in the ground). This represents one type of activity undertaken by farmers to offset the presence of large quantities of sediments in surface waters. Moreover, unlike the types of situations covered in Chapter 5, in a number of circumstances the change in environmental quality may not have a direct impact on the productivity of a resource such as land (e.g. agricultural yield) or water (e.g. fisheries). For example:
• Individuals may seek to offset adverse changes in water quality by treating the water (e.g. boiling) before its consumption;
• Increases in air or noise pollution may adversely impact the market value
of surrounding properties;
• An increase in water pollution or deforestation may adversely impact recreational opportunities on a beach or forest.
In each of the above examples, one observes individuals changing their behavior as a result of the change in environmental quality. The economic costs associated with this change in behavior may reveal the extent to which individuals wish to avoid the negative change in environmental quality.
42
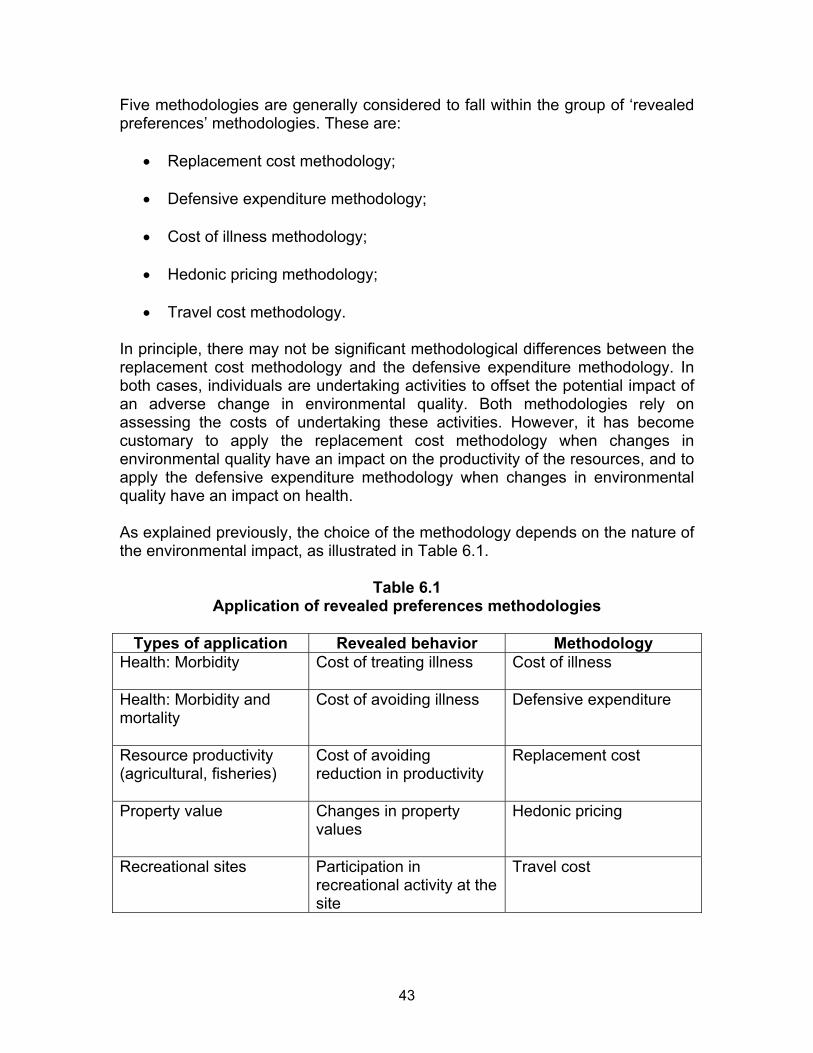
Five methodologies are generally considered to fall within the group of ‘revealed preferences’ methodologies. These are:
• Replacement cost methodology; • Defensive expenditure methodology;
• Cost of illness methodology;
• Hedonic pricing methodology;
• Travel cost methodology.
In principle, there may not be significant methodological differences between the replacement cost methodology and the defensive expenditure methodology. In both cases, individuals are undertaking activities to offset the potential impact of an adverse change in environmental quality. Both methodologies rely on assessing the costs of undertaking these activities. However, it has become customary to apply the replacement cost methodology when changes in environmental quality have an impact on the productivity of the resources, and to apply the defensive expenditure methodology when changes in environmental quality have an impact on health. As explained previously, the choice of the methodology depends on the nature of the environmental impact, as illustrated in Table 6.1.
Table 6.1 Application of revealed preferences methodologies
Types of application Revealed behavior Methodology
Health: Morbidity
Cost of treating illness Cost of illness
Health: Morbidity and mortality
Cost of avoiding illness Defensive expenditure
Resource productivity (agricultural, fisheries)
Cost of avoiding reduction in productivity
Replacement cost
Property value Changes in property values
Hedonic pricing
Recreational sites Participation in recreational activity at the site
Travel cost
43

We discuss in some details each of these methodologies below. 6.2 Replacement cost methodology 6.2.1 When to use this methodology In a number of instances, producers (such as farmers, fishermen, hydropower operators, water supply providers, etc), may seek to offset (compensate) for the loss of environmental quality or quantity by undertaking activities which aim to keep production (or production costs) more or less constant, despite the adverse change in environmental quality. In such instances, it may be possible and of interest to attempt estimating: (1) the costs (for the farmers, fishermen, hydropower operators, or water
supply providers) of undertaking these activities which they would not need to undertake if environmental quality were not to deteriorate; or
(2) the benefits (for the farmers, fishermen, hydropower operators, or water
supply providers) of not undertaking these activities anymore if environmental quality were to improve.
Examples when the application of the change of productivity methodology is appropriate include:
• Wetlands degradation. It is well known that wetlands provide a large number of ecological services including water purification services (see Box 2.1 in Chapter 2). It may be possible to estimate the economic value of this particular service provided by wetlands by estimating the cost of providing clean water with alternative purifying methods such as filtering and chemical treatment. If the wetlands were to be degraded or to disappear (as a result of urban expansion for example), and if the same level of water quality were to be desired, then society would have to invest this additional cost to obtain purified water from alternative means instead of being ‘freely’ provided by wetlands;
• Deforestation - Sedimentation. Poorly managed logging practices often
leads to river sedimentation of river catchments. As a result, water supply providers in the effected catchments may have to incur additional operational costs directly associated with the presence of sediments in the source of water supply. Alternatively, the costs of undertaking these additional activities may be a measure of the benefits of implementing logging practices which would prevent such sedimentation (Box 6.2);
44

Box 6.2 The costs of river sedimentation:
The case of Beaufort (Sabah)
Beaufort is located downstream the Padas River catchment in Sabah. As a result of numerous activities including logging upstream the catchment, the Padas River experiences high levels of sedimentation. In order to remove the sediments from the water before it be provided to its customer, the Beaufort Water Supply Company must use large quantities of alum and lime. Over the period 2001-2005 the following expenditures have been incurred:
Alum and lime expenditures in Beaufort Alum Lime Quantity
(kg) Expenditures
(RM) Quantity
(kg) Expenditures
(RM) 2001 549,000 424,267 177,025 84,2642002 593,950 459,004 189,750 90,3212003 782,100 600,736 250,475 119,2262004 782,100 604,406 307,675 146,4532005 786,400 607,729 389,675 185,485Total quantity 3,493,550 1,314,600 Average annual expenditures
539,228 125,150
In addition to the above costs, the water intake must be cleaned as sludge accumulates and reduces the water flow. Over the period 2001 – 2005, desludging took place 8 times for an annual average cost of approximately RM8,800. Finally, during periods of shutdowns (for desludging purposes), the company is under the obligation of providing water to its domestic customers. It does so by trucking water to households. Over the period 2001 – 2005, the annual average cost of this activity reached RM375,040. On the basis of the above estimates, the presence of high concentration of sediments in the Padas River costs the Beaufort Water Supply Company approximately RM1.05 million per year. This economic cost is a part (and in all likelihood not the only component) of the total cost of river sedimentation in the Padas Catchment. It may also be interpreted as the potential benefit of a project (or policy) which would aim to reduce river sedimentation in the Padas River.
• Water pollution. As a result of the significant presence of debris in surfaced waters, hydropower dams may have to shut down on a regular basis to allow for the removal of the debris. In addition to the direct costs of debris removal activities, energy production may either be lost (change in productivity) or may have to be produced by alternative means of production. The costs of replacing hydropower with power produced from
45
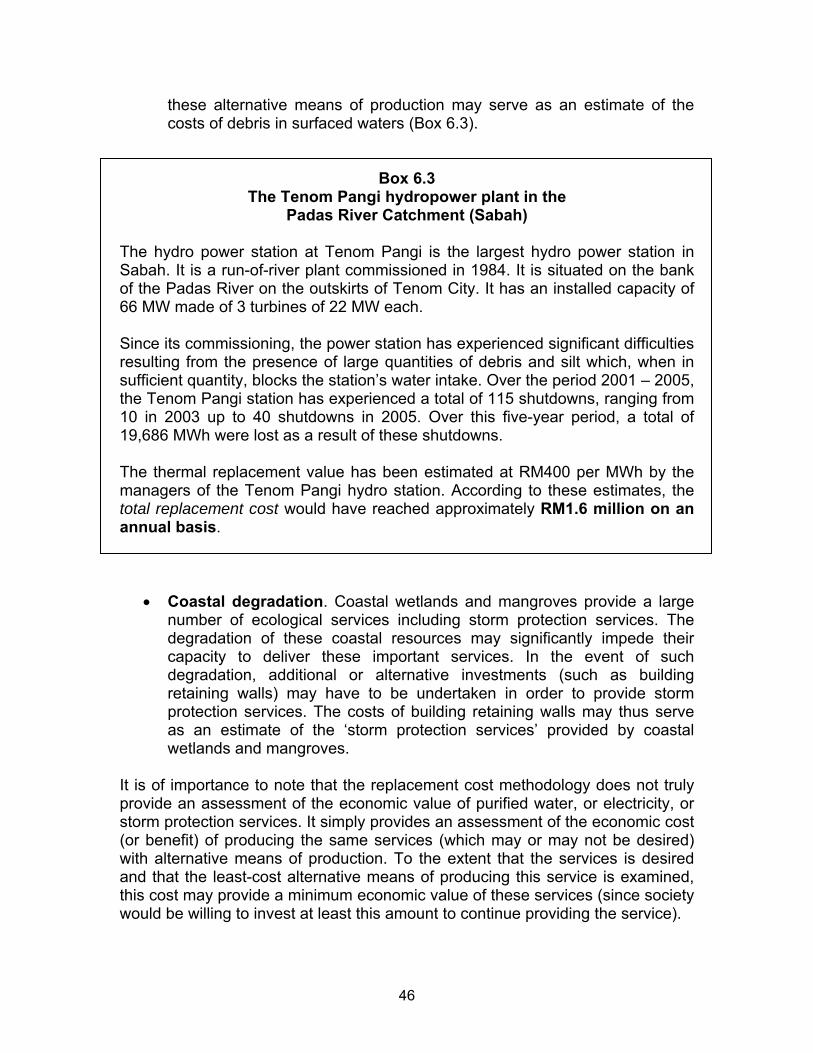
these alternative means of production may serve as an estimate of the costs of debris in surfaced waters (Box 6.3).
Box 6.3 The Tenom Pangi hydropower plant in the
Padas River Catchment (Sabah) The hydro power station at Tenom Pangi is the largest hydro power station in Sabah. It is a run-of-river plant commissioned in 1984. It is situated on the bank of the Padas River on the outskirts of Tenom City. It has an installed capacity of 66 MW made of 3 turbines of 22 MW each. Since its commissioning, the power station has experienced significant difficulties resulting from the presence of large quantities of debris and silt which, when in sufficient quantity, blocks the station’s water intake. Over the period 2001 – 2005, the Tenom Pangi station has experienced a total of 115 shutdowns, ranging from 10 in 2003 up to 40 shutdowns in 2005. Over this five-year period, a total of 19,686 MWh were lost as a result of these shutdowns. The thermal replacement value has been estimated at RM400 per MWh by the managers of the Tenom Pangi hydro station. According to these estimates, the total replacement cost would have reached approximately RM1.6 million on an annual basis.
• Coastal degradation. Coastal wetlands and mangroves provide a large number of ecological services including storm protection services. The degradation of these coastal resources may significantly impede their capacity to deliver these important services. In the event of such degradation, additional or alternative investments (such as building retaining walls) may have to be undertaken in order to provide storm protection services. The costs of building retaining walls may thus serve as an estimate of the ‘storm protection services’ provided by coastal wetlands and mangroves.
It is of importance to note that the replacement cost methodology does not truly provide an assessment of the economic value of purified water, or electricity, or storm protection services. It simply provides an assessment of the economic cost (or benefit) of producing the same services (which may or may not be desired) with alternative means of production. To the extent that the services is desired and that the least-cost alternative means of producing this service is examined, this cost may provide a minimum economic value of these services (since society would be willing to invest at least this amount to continue providing the service).
46
6.2.2 How to use this methodology The replacement cost methodology is relatively simple to implement from both a technical point of view, and economic point of view. There are essentially three steps involved. Step 1: The fist step is of a technical or scientific nature and consists in undertaking an ecological assessment of the nature and extent of the services provided by the impacted resource. For example:
• How much storm protection services is actually provided by the coastal resources; or
• What is the physical impact of river sedimentation on the activities of
downstream water supply utilities? Once these services or impacts are clearly understood, then one may proceed to the second step. Step 2: Identify the alternative means by which the same services as those produced by the environment (in terms of both quantity and quality) could be provided. Step 3: Estimate the costs of these alternative means by which the services could be produced. The least costly alternative means to produce the same service (and assuming that the service is indeed desired by society) provide an estimate of the economic value of the ecological services.
6.2.3 Strengths and limitations of the methodology
(i) Strengths The strengths of the replacement cost methodology are:
• In a number of instances, it may be easier to estimate the least cost alternative means of producing the ecological services instead of attempting to measure the economic benefits of the services. To the extent that society does indeed value the ecological service, this assessment will provide a lower bound value to the ecological services since society would be willing to invest at least this amount in order to continue ‘consuming’ this service;
47
• The methodology is relatively simple to implement and does not require high degree of technical or economic expertise.
(ii) Limitations
However, this methodology (as well as the defensive expenditure methodology and the cost of illness methodology described below) suffers from a number of limitations, including:
• The methodology is a valid approach to the economic valuation of the goods or services produced by the environment only to the extent that society does value and indeed is willing-to-pay the cost for the continued provision of these same goods or services by alternative means of production if the environment were to cease (because of it being degraded by the project for example) the production of these goods or services. If society is not willing to pay this cost, then one could not say that this cost provides an assessment of the economic value of the goods or services produced by the environment;
• Even if society were willing to pay for providing the goods or services by
alternative means of production, one could not say that this estimated cost provides a measure of the economic value of the goods or services. In other words, costs are normally not a measure of the benefits (e.g. the cost of consuming meat generally does not provide a measure of the benefits of consuming meat). However, in appropriate circumstances, it may be said that the estimated cost provides a lower bound estimate of the economic value of the goods or services produced by the environment; 10
• In some situations, it may be difficult or impossible to find alternative means which would produce the goods or services in exactly the same quantity and quality as produced by the environment. In such circumstances, it may not be possible to say that the estimated cost of producing this alternative service represents a lower bound value of the goods or services produced by the environment since in fact these goods or services are not exactly the same.
6.2.4 Recommendations to project initiators
• Implement the replacement cost methodology to assess the economic
value of the goods and services produced by the environment only when there is sufficient evidence that society does value and would be willing-to-
10 For example, many would argue that the consumption of fish raised in hatcheries is not the same as the consumption of wild fish – whose production could be adversely impacted by fisheries. If this were to be the case, then the cost of producing fish in hatcheries would not be an appropriate estimate of the economic value of wild fish.
48
pay for the continued provision of these goods and services by alternative means of production;
• When identifying alternative means of production, ensure that exactly the
same good or service is going to be produced by this alternative means of production as is currently produced by the environment;
• Assess the least cost of providing the same goods or services as currently
produced by the environment. 6.3 Defensive expenditure methodology
6.3.1 When to use this methodology As indicated earlier, there are not significant methodological differences between the replacement cost methodology and the defensive expenditure methodology. In both cases, the methodologies rely on assessing the costs of undertaking activities aimed at offsetting changes in environmental quality. However, while the replacement cost methodology is applied in situation when changes in environmental quality have an impact on productivity, the defensive expenditure methodology is applied when these changes in environmental quality have an impact on health. Examples when the application of the defensive expenditure methodology is appropriate include:
• Air pollution. As a result of an increase in air pollution, individuals may undertake activities to avoid exposure to the degraded ambient air quality. For example, individuals may buy face masks of various nature to filter the air or buy air purifying units or simply spend more time indoors to avoid exposure to the pollution;
• Noise pollution or smell. Individuals may avoid opening their windows to
avoid exposure to smell or install double-glazed windows to avoid exposure to noise from industrial facilities, road traffic or airports for example;
• Water pollution. In order to avoid risk of sickness from exposure to
polluted water, it is often observed that individuals buy bottled water and/or boil water or in some other ways treat the water before its consumption.
In the above examples, it is observed that individuals are undertaking costly activities to avoid exposure to the degraded environment in order to reduce (partly or totally) the risk of falling ill.
49
The defensive expenditure methodology consists in attempting to measure the costs of undertaking these activities. 6.3.2 How to use this methodology The defensive expenditure methodology does not require a high degree of technical or economic expertise. There are essentially four steps involved. Step 1: The fist step is of a technical or scientific nature and consists in identifying the nature of the environmental impact, or in other words the expected change in environmental quality which may result from the project. For example:
• What is the expected change in noise level which may happen as a result of the project? or
• What is the expected change in air quality or water quality which may
happen as a result of the project? Once these changes are clearly identified, then one may proceed to the second step. Step 2: Since the expected change in environmental quality is assumed to impact people’s behavior, an important and key step is to identify the population which may be exposed to the expected change in environmental quality. This relates to the issue of geographical and stakeholder scoping. In the case of air pollution, the exposed population may be considerably removed from the project site itself. Step 3: Observe (essentially by means of surveys) the actions and activities that individuals are doing in order to avoid exposure to the degraded environmental quality. Step 4: Measure the costs for the individuals of undertaking these actions of activities. 6.3.3 Strengths and limitations of the methodology Given the methodological similarities of this methodology with the replacement cost methodology, it shares a similar set of strengths and weaknesses.
(i) Strengths
50

The strengths of the defensive expenditure methodology are:
• The methodology is relatively simple to implement and does not require high degree of technical or economic expertise;
• Since it is based on actual behavior undertaken by individuals, it may have
more credibility at times of discussion between stakeholders.
(ii) Limitations A key limitation of this methodology (as for the replacement cost methodology) is the following:
• Even if individuals are willing to pay to protect (or defend) themselves against exposure to degraded environmental quality, one cannot say that this estimated expenditure provides a true measure of the benefits of the protection undertaken or of the true cost of the degraded environmental quality. In other words, once again, costs are normally not a measure of the benefits. However, in appropriate circumstances, it may be said that the estimated expenditure provides a lower bound estimate of the true economic cost of the degraded environmental quality (and therefore of the benefit of the defensive activities).
6.3.4 Recommendations to project initiators
• Implement the defensive expenditure methodology in cases where there is
evidence that individuals may undertake defensive activities to protect themselves against the adverse health impacts of changes in environmental quality;
• Identify as precisely as possible the change in environmental quality which
may result from the project during both its construction phase and operation phase;
• Identify in terms of both area and numbers, the population which may
experience the change in environmental quality;
• Identify the nature of the activities which may be undertaken by individuals to avoid exposure to the degraded environmental quality, and the costs of undertaking these measures. Such assessment may be undertaken for the entire population being exposed, or it may be assessed on the basis of a representative sample, and then extrapolated to the entire exposed population.
51
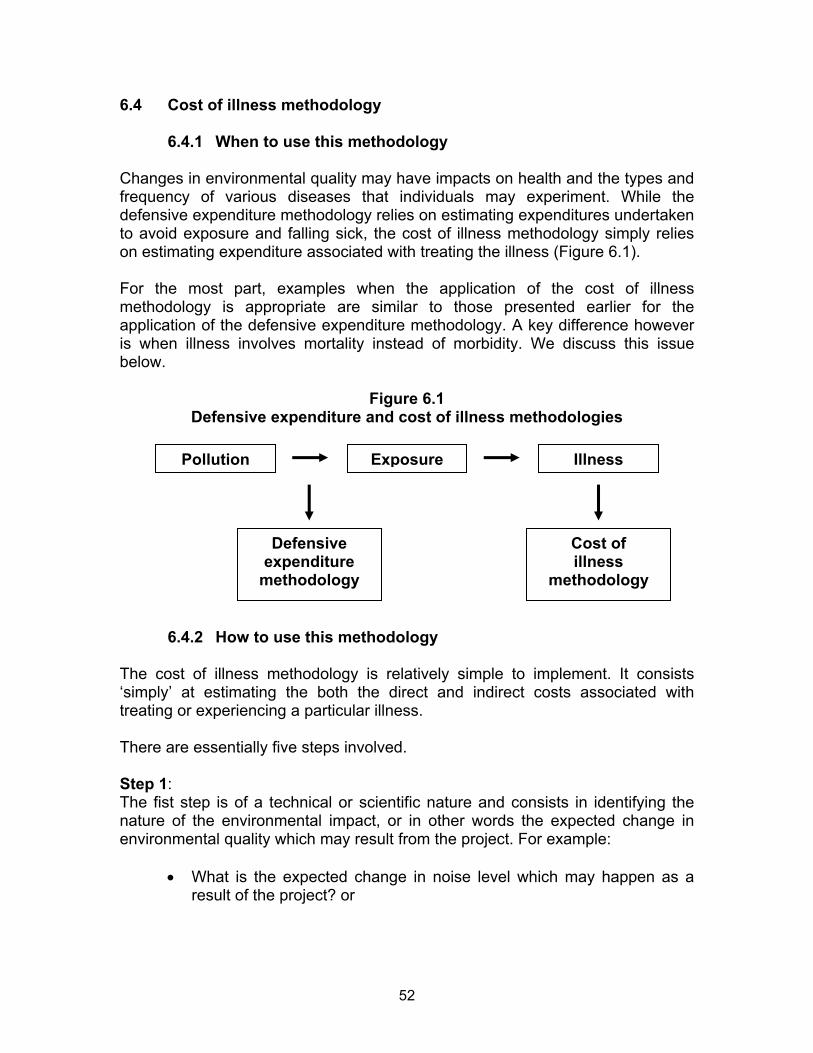
6.4 Cost of illness methodology
6.4.1 When to use this methodology Changes in environmental quality may have impacts on health and the types and frequency of various diseases that individuals may experiment. While the defensive expenditure methodology relies on estimating expenditures undertaken to avoid exposure and falling sick, the cost of illness methodology simply relies on estimating expenditure associated with treating the illness (Figure 6.1). For the most part, examples when the application of the cost of illness methodology is appropriate are similar to those presented earlier for the application of the defensive expenditure methodology. A key difference however is when illness involves mortality instead of morbidity. We discuss this issue below.
Figure 6.1 Defensive expenditure and cost of illness methodologies
Pollution ExposureExposure Illness
Defensive expenditure
methodology
Cost of illness
methodology
6.4.2 How to use this methodology The cost of illness methodology is relatively simple to implement. It consists ‘simply’ at estimating the both the direct and indirect costs associated with treating or experiencing a particular illness. There are essentially five steps involved. Step 1: The fist step is of a technical or scientific nature and consists in identifying the nature of the environmental impact, or in other words the expected change in environmental quality which may result from the project. For example:
• What is the expected change in noise level which may happen as a result of the project? or
52

• What is the expected change in air quality or water quality which may happen as a result of the project?
Once these changes are clearly identified, then one may proceed to the second step. Step 2: The second step is to identify the impacts that these changes in environmental quality may have on health or the types of illnesses which may be experienced. For example, a change in air pollution such as ground-level ozone which may result from a road project may have an impact on the incidence of asthma while a change in water pollution may have an impact on various types of gastro-intestinal diseases. Step 3: As for the defensive expenditure methodology, since the expected change in environmental quality is assumed to impact people’s behavior (that is, treating illness), an important and key step is to identify the population which may be exposed to the expected change in environmental quality. This relates to the issue of geographical and stakeholder scoping. Step 4: Observe (essentially by means of surveys) the actions and activities that individuals are doing in order to treat illnesses. Step 5: Measure the costs for the individuals of undertaking these actions of activities. As indicated in Figure 6.2, it is important to recognize that the cost of illness is made of different components. First, individuals must incur a direct cost to seek treatment for the illness. This is made of both medical and non-medical cost. Second, there may be an indirect cost associated with the illness in that individuals may be losing valuable productive time while treating the illness. This cost must also be included in the cost of illness. A further important issue must be considered. The Government of Malaysia provides extensive subsidies to the health sector. For example, government clinic consultation fees were maintained at RM1 in 2007. While the direct cost paid by patients visiting these clinics is thus capped at RM1, the actual cost (for society) of providing such services is higher than RM1.11 The cost of illness measured under the cost of illness methodology must capture both the cost (direct and
11 It was recently asserted that the cost of each medical consultation in government hospitals cost between RM20 and RM30 (Sunday Star, February 17, 2008, quoting the Women, Family and Community Development Minister).
53

indirect) incurred by those experiencing the illness and the extent of the subsidy provide by the state to treat such illnesses.
Figure 6.2 Components of the cost of illness
Cost of illness
Direct medical costs
Direct non medical costs
Cost of seeking treatment, diagnosis
of illness, and treating illness
Cost of resource lost because of illness
Direct cost Indirect cost
Time lost while treating illness
Transportation to seek medical
services
Hospital inpatient Physician inpatient
Physician outpatient Emergency outpatient
Medical supplies Diagnostic tests
Drugs and medicines
In some circumstances, changes in environmental quality have impacts not on the probability of illness, but on the probability of death. When this occurs, a key issue pertains to providing an economic valuation of such impact. For this purpose, the concept of “Value of a statistical life” (VSL) has been developed to assess the economic value of changes in such probability. It is important to note that this is not the value of life, nor the value of the life of a specific individual (that is the value of changing the risk of mortality from one to zero for a specific individual). The VSL represents what a society would be willing to pay to reduce the probability of dying which would result in saving one life.
54
Numerous studies in developed countries and a smaller number in developing countries have been conducted to measure VSL. In the United States, these measures range between USD 3 and 7 millions (mostly depending on the type of methodology used to undertake such assessment and the risk context – for example occupational risk versus road traffic risks). In Canada and the United Kingdom, studies reveal a VSL ranging from USD 1 to 4 millions. Studies conducted in India, Hong Kong, Taiwan and South Korea reveals a VSL ranging between USD 0.2 and 3 millions. Of course, since the VSL is a measure of a society’s willingness-to-pay to reduce the probability of dying in its population, this willingness-to-pay will partly depend on the level of income of the population. We are currently not aware of specific studies attempting to measure VSL in Malaysia. However, based on existing studies in both developed and developing countries, one could estimate a VSL in Malaysia ranging between USD 0.5 and 1.5 millions once differences in per capita income are considered. Such procedure (using VSL calculated in other countries to estimate VSL in Malaysia while controlling solely for differences in per capita income) is a crude application of the benefit-transfer methodology which will be discussed in Chapter 8 below. It has two important drawbacks. First, it implicitly assumes that preferences for health in Malaysia are similar to preferences for health where VSL studies have been conducted. There is no reason to believe that this is necessarily so. Second, it implicitly assumes that the income elasticity for improved health is equal to 1.0. In the absence of original studies in Malaysia, we recommend that a value ranging between USD 0.5 and 1.5 millions be used to assess VSL in Malaysia and to apply these values where and when appropriate. 6.4.3 Strengths and limitations of the methodology Given the methodological similarities of this methodology with the defensive expenditure methodology, it shares a similar set of strengths and weaknesses.
(i) Strengths The strengths of the cost of illness methodology are:
• The methodology is relatively simple to implement and does not require high degree of technical or economic expertise;
• Since it is based on actual behavior undertaken by individuals (seeking
treatment), it may have more credibility at times of discussion between stakeholders. (ii) Limitations
55

A key limitation of this methodology (as for the replacement cost methodology and the defensive expenditure methodology) is the following:
• Even if individuals are willing to pay to treat an illness following exposure to degraded environmental quality, one cannot say that this estimated expenditure provides a true measure of the benefits of treating the illness or the true cost of the degraded environmental quality. In other words, once again, costs are normally not a measure of the benefits. However, in appropriate circumstances, it may be said that the estimated expenditure provides a lower bound estimate of the true economic cost of the degraded environmental quality (and therefore of the benefit of the defensive activities). 6.4.4 Recommendations to project initiators
• Implement the cost of illness methodology in cases where there is
evidence that individuals seek treatment for illnesses directly associated with changes in environmental quality such as air pollution, water pollution, exposure to toxic compounds, etc.;
• Identify as precisely as possible the change in environmental quality which
may result from the project during both its construction phase and operation phase;
• Identify in terms of both area and numbers, the population which may
experience the change in environmental quality;
• Identify the nature of the activities which may be undertaken by individuals to treat illnesses if they were exposed to the degraded environmental quality, and the costs of undertaking these measures. Such assessment may be undertaken for the entire population being exposed, or it may be assessed on the basis of a representative sample, and then extrapolated to the entire exposed population;
• Remember that the cost of illness methodology requires that subsidies
paid by the government for the treatment of illnesses also be included in the calculation of the cost of illness
56
6.5 Hedonic pricing methodology
6.5.1 When to use this methodology Goods or services bought by consumers are made of a number of characteristics. For example, when buying a watch, consumers may not be interested in the watch per se but in its features such as material, shape, color, easiness to read, etc. Similarly, when buying a car, consumers may not be interested in the car per se but in its characteristics such as size, comfort, color, maximum speed, fuel consumption, etc. The hedonic pricing methodology is based on the assumption that when individuals buy a good or a service, the price they are willing to pay for this good or service is based on a package of characteristics contained in the good or service. The methodology seeks to isolate the contribution of each of these individual characteristics to the market price of the good or service. In a number of situations, environmental quality may be one of these characteristics which impact the market price of the transacted commodity. For example, when renting a night at the hotel, consumers may not be interested only in the size, color, comfort and other physical characteristics of the room itself but may also be interested in whether the room has a nice view or not (such as ocean view for example). Similarly, the market price of a real estate property (apartment or house) will in all likelihood depend on a number of characteristics such as: size, number of rooms, construction material, age, proximity to school or working place, etc. It may also depend on the level of noise or smell (from a nearby landfill for example) or air pollution in the area. It may also depend on the proximity of recreational areas. More generally, the market price of such real estate property may also depend on the level of environmental quality.
The hedonic pricing methodology is then used to isolate the value of environmental quality as it contributes to explain the market price of properties. Having isolated such value, it is then possible to estimate the impact of changes in environmental quality (increased or decreased environmental quality) on market prices.
Most (albeit not all) applications of the hedonic pricing methodology use residential housing prices to estimate the value of environmental amenities. Examples when the application of the hedonic pricing methodology is appropriate include:
57
• Air pollution (including noise or smell). Individuals may be willing to pay less for residential properties impacted by an adverse change in air pollution. Typical examples would include: proximity to a landfill, industrial facility, road traffic, and airport;
• Water pollution. The market value of residential properties may be
impacted adversely by adverse changes in the water quality of a nearby beach;
• Green areas. The market value of residential properties may be impacted
by the presence of green areas (such as public parks) in the neighborhood or vicinity. Changes in the extent or quality of these green areas may thus impact the market price of residential properties.
• Open views. The market value of residential properties may be impacted
by the quality of the open views it may offer. Changes in the quality of the views may thus impact market prices of such properties.
Note that the interest here is not in market prices per se, but in the fact that such changes in prices resulting from changes in environmental quality indicate reveal individual preferences for environmental quality. This is why this methodology falls under the category of revealed preferences methodology. 6.5.2 How to use this methodology While the hedonic pricing methodology is intuitively easy to understand, its application requires considerable statistical expertise. It is not the intent of these Guidelines to provide technical details pertaining to the implementation of the methodology. Project assessors requested to implement this methodology (where appropriate) will in most likelihood be able to access such expertise. The key steps involved in using this methodology are discussed below in non-technical terms. Step 1: The first step to undertake when implementing the hedonic pricing methodology is to specify the possible relationship between the market prices of properties and the characteristics which may impact those prices. This is known as a hedonic price function. For example, if the project were to be a landfill, it may be thought that the market value of properties may be impacted depending on their location (distance) relative to the landfill. In such circumstances, the hedonic price function may be as: House price depends on (is a function of; is determined by):
58

• Size of the house; • Number of rooms; • Construction material; • Other physical house characteristics; • Neighborhood characteristics such as quality of schools in the area, crime
rate, etc; and • Distance (km) from the landfill.
Step 2: The second step has to with data collection. The nature of the hedonic price function determines which data should be collected. For each observation (or market transaction), one would collect the price of the house as well as information about each characteristic specified in the hedonic price function. In order to be reliable, the dataset must contain a few hundreds of such observations collected by means of surveys. Step 3: Once the data has been collected, the third step consists in analyzing the data. Statistical (econometric) expertise is required to undertake this particular step. This is normally done by using regression analysis. Regression analysis measures the portion of the property price which is attributable to each characteristic impacting house values. From this regression analysis, the analyst will calculate the value (or hedonic price) of the distance from landfill. Step 4: Finally, using the estimated hedonic price, the analyst needs to measure the demand curve for environmental quality in which the hedonic price depends on household income, other household characteristics, and of course in the context of the above example, distance from the landfill.
59

Box 6.4 Regression analysis with the hedonic pricing methodology
Suppose that the hedonic price function is simply stated as: P = f(Size, Rooms, Mat, DKM) where ‘P’ is the price of the house; ‘Size’ is the square footage of the house; ‘Rooms’ is the number of bathrooms; ‘Mat’ is the nature of the construction material; and ‘DKM’ is the distance from a landfill. The analyst may then specify the following hedonic price model:
εβββββ eDKMMatRoomsSizeP 43210=
In order to estimate the above equation, it is usually appropriate to take the natural logarithms on both sides to obtain:
εβββββ +++++= DKMMatRoomsSizeP lnlnlnlnlnln 43210 The purpose of the regression analysis is to estimate the value of the iβ . In the above equation, 3β is the variable of interest. In the context of the above equation, the hedonic price will be measured as:
DKMP
3β
6.5.3 Strengths and limitations of the methodology
(i) Strengths
• The main strength of this methodology is that it is based on actual
decisions and choices made by individuals, and as these choices are reflected in actual market prices of a transacted commodity. It thus benefits from a high level of credibility;
• The methodology can be readily be implemented when data on property
sales and characteristics are available.
60

(ii) Limitations
• The method is relatively complex to implement and interpret, and requires a high degree of statistical expertise;
• If the data is not readily available, data collection may be a time
consuming and resource intensive activity;
6.5.4 Recommendations to project initiators
• Identify as precisely as possible the change in environmental quality which may result from the project during both its construction phase and operation phase;
• Identify in terms of both area and numbers, the population which may
experience the change in environmental quality and the types of properties where this population in which this population is currently living;
• Assess the potential changes in market values which on average each of
these properties could experience as a result of the change in environmental quality, and on this basis assess the potential aggregate change in market value on impacted property;
• Conduct sensitivity analysis.
6.6 Travel cost methodology
6.6.1 When to use this methodology The travel cost methodology (TCM) attempts to estimate the economic value of sites which are essentially used for recreation purposes (such as beaches, coral reefs, or protected areas). It does so by assuming that the economic value (willingness to pay) to visit a recreational site must be at least as much as the cost incurred by individuals to visit the site. This methodology should therefore be used only when a change in environmental quality (negative or positive) brought upon by a project has the potential to impact the quantity of trips to a recreational site, or the enjoyment experienced at a recreational site. The travel cost method can be used to estimate the economic benefits or costs resulting from:
• elimination of an existing recreational site; • addition of a new recreational site;
61
• changes in environmental quality at a recreational site.
6.6.2 How to use this methodology
As for the hedonic pricing methodology, the TCM is intuitively easy to understand. However, its application also requires considerable statistical expertise. In addition, it proceeds by means of surveying potential or actual visitors to the recreational site of interest. The surveying process involves the preparation of a survey template, the training of a surveyor team, the data collection itself with potential or actual visitors, and then the data processing. The methodology recognizes that the frequency at which individuals visit a recreation site (such as a national park for example) depends on a number of household characteristics (such as income, number of children, etc), as well as the costs incurred to visit to the site: all other things being equal, the higher the cost, the smaller the visitation rate. A key insight of the methodology is that it recognizes that this cost is not only made of the entrance fee (if any), but also includes the monetary costs of traveling to the site (bus/train/air fares; petrol expenses; vehicle wear and tear), and of the value of the time spent traveling to the site. By means of statistical analysis, it is this relationship between the frequency of visit (visitation rate) and the travel costs that one seeks to estimate, resulting in a demand function for visitation at the site. There are several ways to approach the problem. These include:
• A zonal travel cost approach which uses mostly data collected from actual visitors at the site itself;
• An individual travel cost approach which can use data collected from
visitors at the site itself, or can use data from using a more detailed survey of potential visitors in a given population;
• A random utility approach using surveys as well as other existing data.
Regardless of the approach selected (one of the 3 approaches referred to above), the TCM generally requires that the following information be collected:
• number of visits from each origin zone or from a given population;
• demographic information about people from each zone or from a given population;
• travel costs from each zone;
• the value of time spent traveling.
62

Better applications of the TCM may also collect information about:
• exact distance that each individual traveled to the site; • exact travel expenses;
• the length of the trip;
• the amount of time spent at the site;
• other locations visited during the same trip, and amount of time spent at
each;
• substitute sites that the person might visit instead of this site, and the travel distance to each;
• other reasons for the trip (is the trip only to visit the site, or for several
purposes);
• quality of the recreational experience at the site, and at other similar sites (e.g., fishing success);
• perceptions of environmental quality at the site;
• characteristics of the site and other, substitute, sites.
This data can be collected either on-site or through general population surveys. Each survey type has its own advantages and disadvantages. For example, while general population surveys (individual travel cost approach) have the potential to be more broadly representative of a population, they may suffer from biases such as respondent recall bias if the site in question is infrequently visited or disproportionately zero visits if a large proportion of the survey sample is not visiting the site at all. Furthermore, general population surveys are typically more demanding in terms of data collection. On the other hand, on-site surveys (zonal travel cost approach) have the advantage of precision regarding the time, date and certainty of visit. Moreover, they are based on the response of actual visitors to the site. However, they run the risk of over-sampling only those in the population who are avid users of the site while not sampling other visitors of the site who happen not to visit the site at the time of the survey, or other potential visitors should constraints to the participation decision be relaxed. It is not the intent of these Guidelines to provide technical details pertaining to the implementation of the methodology. Project assessors requested to implement
63
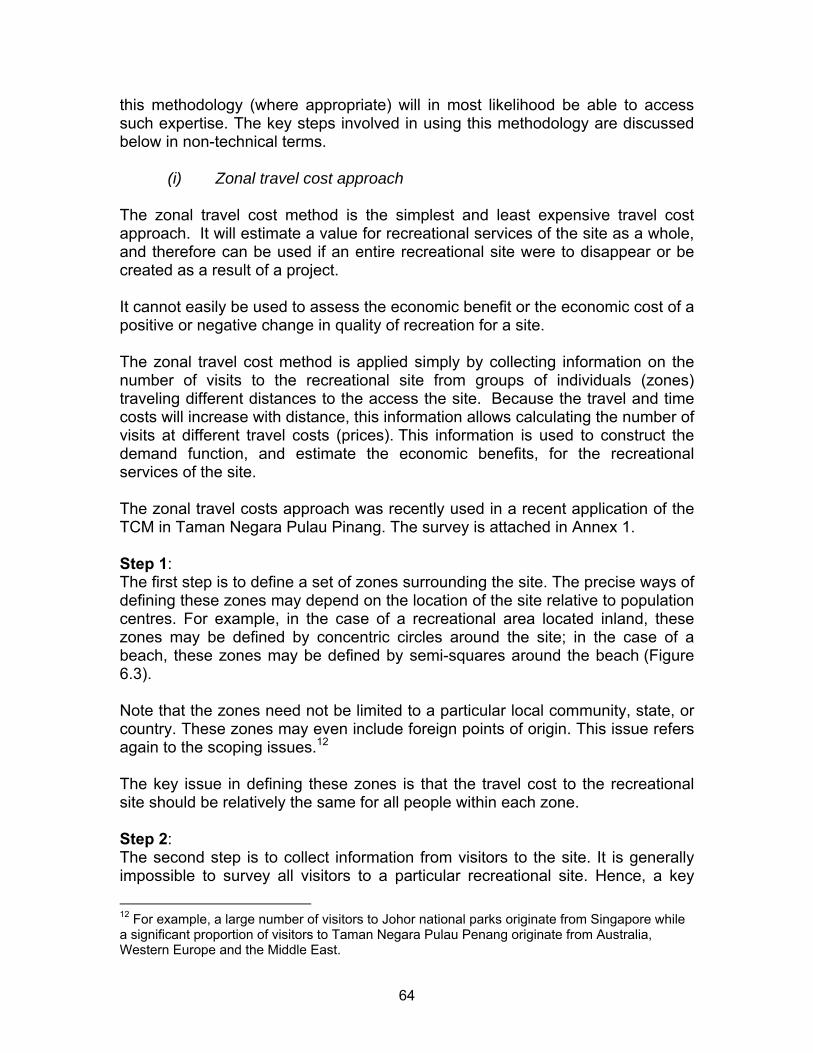
this methodology (where appropriate) will in most likelihood be able to access such expertise. The key steps involved in using this methodology are discussed below in non-technical terms. (i) Zonal travel cost approach The zonal travel cost method is the simplest and least expensive travel cost approach. It will estimate a value for recreational services of the site as a whole, and therefore can be used if an entire recreational site were to disappear or be created as a result of a project. It cannot easily be used to assess the economic benefit or the economic cost of a positive or negative change in quality of recreation for a site. The zonal travel cost method is applied simply by collecting information on the number of visits to the recreational site from groups of individuals (zones) traveling different distances to the access the site. Because the travel and time costs will increase with distance, this information allows calculating the number of visits at different travel costs (prices). This information is used to construct the demand function, and estimate the economic benefits, for the recreational services of the site. The zonal travel costs approach was recently used in a recent application of the TCM in Taman Negara Pulau Pinang. The survey is attached in Annex 1. Step 1: The first step is to define a set of zones surrounding the site. The precise ways of defining these zones may depend on the location of the site relative to population centres. For example, in the case of a recreational area located inland, these zones may be defined by concentric circles around the site; in the case of a beach, these zones may be defined by semi-squares around the beach (Figure 6.3). Note that the zones need not be limited to a particular local community, state, or country. These zones may even include foreign points of origin. This issue refers again to the scoping issues.12
The key issue in defining these zones is that the travel cost to the recreational site should be relatively the same for all people within each zone. Step 2: The second step is to collect information from visitors to the site. It is generally impossible to survey all visitors to a particular recreational site. Hence, a key
12 For example, a large number of visitors to Johor national parks originate from Singapore while a significant proportion of visitors to Taman Negara Pulau Penang originate from Australia, Western Europe and the Middle East.
64

issue in this data collection process is to ensure that the sample of visitors who are surveyed is representative of the entire population of visitors. The number of visitors interviewed thus needs to capture the characteristics of the population of visitors, and need to be sufficiently large to produce results which are statistically significant (in general, this would imply surveying at least 400 visitors). Step 3: Once the data has been collected, then the data needs to be analyzed in order to assess the nature of the relationship between the travel cost and the visitation rate, while all other possible variables which may impact visitation rates (such as income, age, education level, etc.) are accounted for. This step will yield a trip generating function. This step is done by regression analysis.
Figure 6.3
Defining zones
Site
Zone 1
Zone 2
Zone 3
Zone 1
Beach
Zone 2
Zone 3
65
Step 4: Using the results of the regression analysis, the fourth step is to construct the demand function for visits to the site. This demand function establishes the relationship between the visitation rate and the travel costs. The slope of this demand function will indicate by how much the visitation rate would fall if travel cost were to increase by RM1; or by how much the visitation rate would increase if travel cost were to fall by RM1. Step 5: Finally, the last step is to calculate the total economic benefit of the site to visitors by calculating the consumer surplus, or the area under the demand curve. (ii) Individual travel cost approach The individual travel cost approach is similar to the zonal approach, but uses survey data from individual visitors in the statistical analysis, rather than data from each zone. This method thus requires more data collection and slightly more complicated analysis, but will give more precise results. The steps are similar to Step 2 to 5 presented in the zonal travel cost approach. The difference is that one does not define a zone but base the analysis on individual rather than zonal data. (iii) Random utility approach The random utility approach models the choice of a recreation site from among a set of alternative sites as a utility-maximizing decision. In other words, it assumes that individuals have the choice between different sites and make trade-offs between site quality and the cost of travel to the site. A key difference between this approach and the previous two approaches is that the random utility approach requires information not only on the site which may be impacted by a project, but on all possible sites that a visitor may have selected. As such, the random utility approach is the most complicated approach to estimate the economic value of a recreational site. But it is also the best approach unless it is assumed that no other sites could be substitutes to the site of interest. The random utility approach is the best approach to estimate the impact of change in site quality on recreation demand. The outcome is a set of probabilities of the likelihood of visiting a particular site and changes in these probabilities as site quality changes.
66
6.6.3 Strengths and limitations of the methodology
(i) Strengths
• The TCM is based on actual (as opposed to hypothetical) behavior. For this reason, it gains some sense of credibility. Because it is based on actually behavior, the results are relatively easy to explain and understand.
(ii) Limitations
• In many instances, a visit to a specific recreational area may be one of
many other purposes of a trip (this for example would typically be the case for international tourists). It is then necessary to apportion the travel costs (such as the international airfare for example) among the various purposes;
• The methodology implicitly assumes that the time spent traveling is a cost.
However, for some individuals, the journey itself may have value, and not be cost. In such cases, the trip should be considered as multi-purpose;
• Defining and measuring the value of time spent traveling is typically
difficult; . • In order to estimate the demand function, there needs to be sufficient
variations in travel costs incurred by visitors (for example, if all visitors to a site face the same travel cost, then it will not be possible to estimate how changes in travel cost impact the visitation rate). This implies that the methodology is generally not very well suited for a site near a major population center since it may then be expected that most visitors to the site will originate from this population center and will incur more or less the same travel cost;
• When individuals have choice between different recreational sites, the
zonal and individual travel cost approaches will not provide a correct measure of the economic value of the recreational site. In such situations, the random utility approach needs to be implemented;
• The zonal and individual travel cost approaches (though easier to use
than the random utility approaches) are not well suited to measure the impact of changes in environmental quality. In such circumstances, the random utility approach (or the contingent valuation approach described in the next chapter) is better suited;
67

6.6.4 Recommendations to project initiators
• Identify as precisely as possible the change in environmental quality which may result from the project during both its construction phase and operation phase;
• Identify whether or not a recreational site may be impacted as a result of
the project;
• If use of the site may be severely impaired by the project, use the zonal or individual travel cost approach; if changes in environmental quality will impact enjoyment of the site, use the random utility approach;
• Document in a careful manner the existing use of the recreational site, and
the characteristics of the existing population of visitors;
• In all cases, ensure that the sample of actual or potential visitors to the site is truly representative of the population of visitors;
• Survey formats should be developed and pre-tested before full
implementation;
• A team of surveyors should be put in place with appropriate training in the survey conduct;
• Present the results of the analysis in a detailed and clear manner.
68

Chapter 7
Stated preferences methodologies 7.1 Introduction to stated preferences methodologies Stated preferences methodologies elicit people’s willingness-to-pay for changes in the quantity or quality of the goods and services provided by the environment. It seeks to estimate economic values by directly asking individuals to state such willingness-to-pay. This explains that these methodologies are often referred as ‘willingness-to-pay’ study. States preferences methodologies can be applied to estimate any components of the total economic value of the goods and services produced by the environment (direct, indirect, use, and non-use). However, only stated preferences methodologies can be sued to assess non-use economic values (the change of productivity methodology and revealed preferences methodologies cannot be used to assess non-use values). There are two types of stated preferences methodologies: the contingent valuation methodology and the choice modeling methodology. However, the choice modeling methodology has thus far received only limited applications in the field of the environment.13 The contingent valuation methodology has by far received the most attention. For this reason, in this chapter we focus on the contingent valuation methodology (CVM).14
7.2 The contingent valuation methodology
7.2.1 When to use this methodology As indicated above, CVM can be used to estimate both use and non-use values. It is also occasionally combined with revealed preferences methodologies (such as the travel cost methodology) in the context of a single data collection effort. CVM has been used in a very large number of different applications including issues pertaining to water quality, air quality, outdoor recreation, biodiversity, health impacts, natural resources damages, sanitation improvements, etc.15
13 It is however considerably used by marketing consultancies when developing new products or the advertising of new products. 14 Readers interested in the application of the choice modeling methodology may refer to the list of references. 15 The website http://envirovaluation.org/ records hundreds and hundreds of empirical studies using CVM.
69
7.2.2 How to use this methodology Applying CVM involves directly asking people, in a survey, how much they would be willing to pay for specific environmental goods or services in a specific, but hypothetical situation where changes would occur to these goods or services. The word ‘contingent’ is used because of the hypothetical nature of the scenarios presented to the respondents. This hypothetical nature of the scenarios is in fact perhaps the most significant critique made of CVM. CVM is often equated to ‘willingness-to-pay’ studies. As such it wrongly conveys the impression that using CVM consists simply in asking a few people 4 or 5 questions including how much they would be willing to pay for this or that. In fact, a serious and credible application of CVM is extremely demanding, and must follow some specific steps and protocols for it to produce any credible results. We review these below.
(i) Steps in the application of the methodology Step 1: The first step is to define and set-up the hypothetical situation to which the respondent will be asked to consider. This hypothetical situation has to be defined very clearly and very precisely. Furthermore, the respondent to the survey must clearly understand the nature of the change in environmental quality that will be suggested. Step 2: The second step, as for all survey exercises (such as the travel cost methodology and to a certain extent the hedonic pricing methodology presented earlier), consists in the nature and size of the sample. Key is that the sample be representative of the entire population of interest, and that it be of sufficient to yield results which are statistically significant. Step 3: The third step is to determine the method by which the survey is going to be conducted. Options include: by mail, phone or in person interviews. The choice among these options may depend on the budget available to conduct the survey and also on whether or not support material or visual aid (such as photographs for example) will be used to in the course of the survey. Mail surveys are generally the least expensive, and can be sent to thousands of potential respondents. However, they typically suffer from low response rates. Telephone surveys may be less expensive, but do not allow using of visual aid. In-person interviews are generally the most effective for complex questions, because it is often easier to explain the required background information to
70

respondents in person, and people are more likely to complete a long survey. On the other hand, in-person interviews are more expensive to conduct. Step 4: The fourth step is the actual survey design. This is the most important and difficult part of the process, and itself is made is several steps. It will generally start with focus group discussions in order to ensure whether potential respondents will fully understand the issues presented to them, and to test the wording of the various questions to eliminate possibilities that the questions be misunderstood. These discussions will lead to the development of a first complete draft of the survey which will be pre-tested and then finalized. A key issue in the context of the survey design pertains to what is referred as the elicitation method, or how precisely will the willingness-to-pay question be presented to the respondent. There are essentially 3 ways of presenting this question to the respondent (there may be some variations around these 3 methods):
• Open-ended. The respondent is asked to ‘state’ his/her highest willingness-to-pay. No numbers are presented or suggested to the respondent;
• Close-ended. The respondent is presented with a specific number (RM)
and is asked whether or not (Yes or No) he/she would be willing to pay this amount (this method is occasionally referred as dichotomous choice);
• Payment card. The respondent is presented with a sequence of potential
payments (RM) and is asked to circle the highest number he/she would be willing to pay on the card.
An example of survey design recently used in Armenia is presented in Annex 2. Step 5: The final step is to compile, analyze and report the results. The data must be entered and analyzed using statistical techniques appropriate for the type of question. (ii) Characteristics of a good application of the CVM As indicated earlier, CVM (or willingness-to-pay study) is not simply about asking a few hundred individuals how much they would be willing-to-pay to have access to a cleaner beach, or less polluted air. It is generally a complicated, lengthy, and expensive process. In order to collect useful data and provide results which are reliable and can effectively be used in the policy arena, the sample of respondents must be properly selected, and the survey must be properly
71
designed, pre-tested, and implemented. The survey questions must focus on changes in specific environmental goods or services, and these changes (against a ‘no-change scenario’ have to be clearly defined and understood by survey respondents. If respondents do not clearly understand what is it that they are asked – hypothetically – to pay for, then the stated willingness-to-pay will not be a reliable measure of the environmental costs and benefits. A panel of economic experts provided the U.S. National Oceanic and Atmospheric Administration (NOAA) a series of guidelines (or recommendations) concerning the proper execution of the contingent valuation survey. The six most important guidelines are summarized below:
1. CVM should rely on in-person interviews rather than telephone interviews, or mail surveys. If (mainly because of the high costs of conducting in-person interviews) it is not possible to conduct in-person interviews, then telephone interviews are generally preferable to mail surveys;
2. CVM should elicit the respondent’s willingness-to-pay to prevent a future
degradation of environmental quality;
3. CVM should use a close-ended (dichotomous choice) elicitation format, in which the responded is asked to say Yes or No to a particular suggested payment. The close-ended elicitation format is less vulnerable to strategic behavior by the respondent;
4. CVM should contain an accurate and understandable description of the
project under consideration and the associated changes in environmental quality in each of the two scenarios, i.e., with and without the project. This generally requires Interdisciplinary work with other experts in the field of environment;
5. CVM should include reminders of the substitutes for the commodity in
question as well as its budget. The respondent should be reminded that his/her (hypothetical) contribution would reduce the amount of money that he/she has available to spend on other things. It is crucial that the valuation exercise be as close as possible to a real market transaction;
6. CVM experiments should include a follow-up section at the end of the
questionnaire to be sure if the respondents understood (or not) the choice that they were asked to make.
72

7.2.3 Strengths and limitations of the CVM (i) Strengths
• As indicated earlier, CVM is a very flexible methodology and has been
used in a very large number of applications throughout the world; • In order to estimate non-use value (bequest value and existence value),
CVM is the only methodology which can be used;
• Unlike the concept of consumer surplus, results obtained from CVM are relatively easy to understand since they can be presented as average willingness-to-pay per person or per household, and then aggregated over a population.
(ii) Limitations
• When conducted properly, a CVM study can be very expensive and time-
consuming, because of the extensive pre-testing and survey work. A proper CVM must be conducted by individuals who are experts in the conduct of such surveys;
• A key perceived limitation of CVM is the hypothetical nature of the
scenarios presented to the respondent. Respondents may fail to take questions seriously because they will not actually be required to pay the stated amount. Responses may also provide unrealistically high willingness-to-pay if they believe their answer may in fact be used in decisions to undertake the project while they don’t yet have to pay for it. The hypothetical nature of the scenarios is often used in policy scenario to discredit the results obtained from a CVM study;
. 7.2.4 Recommendations to project initiators
• Identify as precisely as possible the change in environmental quality which
may result from the project during both its construction phase and operation phase;
• Conduct focus group discussions with appropriate stakeholders to
understand in greater details how people understand the nature of the goods or services which may be impacted by a change in environmental quality;
• Determine both the appropriate nature of the sample, as well as the
sample size large enough to yield credible and significant results. Simultaneously, determine whether to conduct in-person interviews, telephone surveys, or mail surveys. If resources allow, in-person
73
interviews are preferable to telephone or mail surveys. If resources do not allow, then telephone surveys are generally preferred (if there is no need for visual aid while conducting the survey);
• Prepare a draft of the survey and conduct comprehensive pre-testing of
the survey to ensure that respondents understand all questions. The survey must be clear, and the respondents must fully understand the nature of the problem they are asked to consider. When appropriate, this may be done using photographs, videos, or other multi-media techniques, as well as written and verbal descriptions;
• In general, when actually eliciting the willingness-to-pay, it is preferable to
use the close-ended approach in which respondents are asked whether or not (Yes or No) they would be willing a specified amount for the environmental change;
• The CVM survey must clearly specify by which mechanism this payment
will be made (for example, it could be a one-time donation to a fund; or it could be a surcharge in monthly utility bills);
• The survey must create confidence that the stated payment will in fact be
used for the purpose described in the survey. If respondents do not believe their contribution will be used for the stated purpose, they may under-state their true willingness-to-pay;
• The survey should include validation questions to verify comprehension
and acceptance of the scenario, and to elicit socioeconomic and attitudinal characteristics of respondents, in order to better interpret variation in responses across respondents;
• Survey design, survey implementation, and the analysis of survey results
must be conducted by individuals with expertise in conducting CVM study.
74
Chapter 8
Benefits transfer methodology 8.1 When to use this methodology In a large number of circumstances, it is argued that there is not enough time or resources to proceed with a full-scale study to measure the economic value of the environmental impacts of the project. A key question is then asked: Would it not be possible to use estimated economic values from some other existing studies and apply these estimated values to our case? The benefit transfer methodology is used to estimate economic values of environmental goods or services by transferring available information from studies already completed in other sites and using these values to the problem under examination. The benefits transfer methodology is often used when it is too expensive or there is too little time available to conduct an original valuation study, yet some measure of benefits is needed. 8.2 How to use this methodology The benefits transfer methodology will never yield better estimates than original (primary) studies. However, it may quickly provide some estimates which may be sufficient to make some decisions. A key objective should therefore be to increase the reliability of the estimated environmental costs and benefits based on numbers from studies done elsewhere, and at a previous time. Step 1: Identify as precisely as possible the change in environmental quality which may result from the project during both its construction phase and operation phase. The nature of this expected change in environmental quality and its potential impact on the delivery of environmental goods and services which will guide the research of similar studies which may already have been done elsewhere. Step 2: Once the changes in environmental quality have been clearly identified, the second step is to identify existing studies or values which have already been conducted on similar types of changes in environmental quality, or to measure similar economic values. For this purpose, existing database of economic valuation studies may be of great use. Two such extensive electronic databases can currently be used:
75
http://www.evri.ca The Environmental Valuation Reference Inventory (EVRI) is a searchable database of empirical studies on the economic value of environmental benefits and human health effects.16 It has been developed specifically for the purpose of using the benefits transfer methodology. It contains in excess of 1,500 studies. Each study is summarized by topic, by area, by method, and by results. It is however accessible only to subscribers. http://envirovaluation.org/ This website, entitled “Environmental valuation and cost-benefit news”, is perhaps the most extensive source of information on the web on empirical economic valuation studies and cost-benefit analysis. It covers thousands of economic valuation and cost-benefit studies throughout the world. It does not however attempt to summarize and compile these studies specifically for the purpose of conducting benefits transfer as does the EVRI database. Step 3: Once relevant studies have been identified, the third step is to decide whether or not the economic values found in those studies can reliably be used and transferred to the site of interest. A key issue is whether or not the impacted site by the project shares a sufficient number of characteristics with the sites found in existing studies. Step 4: The final step is to proceed with the transfer of values. Three approaches may be used to do so. 8.2.1 Transfer without adjustment The easiest and quickest way to proceed is to take the estimated economic values in other studies and to apply them without any forms of adjustment to the site under study. Needless to say, such benefits transfer may yield substantial errors since one may expect economic values to be different as a result of at least different impacted population (different level of income, different level of education, age, etc.), ad well as different site characteristics.
16 EVRI is the outcome of a collaboration between Environment Canada, the United States Environmental Protection Agency, the United Kingdom Department of Environment, Food, and Rural Affairs, the New South Wales Department of Environment & Climate Change, and the France Ministere de l’Ecologie, du Developpement et de l’Amenagement Durables.
76

8.2.2 Transfer with income adjustment Since estimates of economic values are known to depend on level of income, then it is occasionally possible to proceed with transfer while adjusting for possible differences in the levels of income. The proper way to perform this adjustment is: BP = BE (YP / YE)e
where BP stands for the estimated benefit for the site impacted by the project; BE is the estimated benefits in existing studies; YP and YE are income per capita for the population impacted by the project and the population in existing studies respectively, and e is the income elasticity of the benefits. If it is assumed that income elasticity is equal to 1, then the adjustment in the economic values is simply in proportion of the differences in per capita income. 8.2.3 Benefit function transfer In a number of circumstances, it may be possible to adjust the economic values not only for differences in income, but also for differences in other variables such as the different levels of education between the populations, and the different levels of age (for example). Since more variables are taken into consideration, the benefit function transfer approach is likely to yield better results in terms of estimating economic values for the site of interest based on other studies. In order to do so, the proper approach is to estimate the determinants of the environmental costs or benefits in existing studies. Such analysis should normally be provided in these existing studies. Suppose for example that in existing studies it is found that: BE = ß0 + ß1INCOMEE + ß2AGEE + ß3EDUCATIONE In this equation, the value of the coefficients ß indicate by how much BE changes when INCOME or AGE or EDUCATION changes by 1 unit. Then upon knowing the level of income, age, and education of the population impacted by the project, one can estimate BP using the coefficients ß estimated from the existing studies.
77
8.3 Strengths and limitations 8.3.1 Strengths
• Benefit transfer is generally less costly and less time-consuming than other economic valuation methodologies;
• The method can be used to obtain gross approximations of what could be
the possible extent of the environmental costs or benefits and may be used to indicate whether or not it could be worthy to proceed with an original study; 8.3.2 Limitations
• The benefit transfer methodology may not yield accurate benefits of the environmental costs and environmental benefits since the site under study will never be exactly the same as the sites from which benefit or cost numbers are being transferred from;
• If the original studies from which benefit or cost numbers are being
transferred from are not good or reliable, then the methodology will not yield reliable estimates of the environmental costs and benefits for the site under study;
8.4 Recommendations to project initiators
• Identify as precisely as possible the change in environmental quality which may result from the project during both its construction phase and operation phase;
• Identify existing studies which have already been conducted on similar
types of changes in environmental quality, or to measure similar economic values;
• Discuss clearly the similarities and differences between the sites found in
existing studies and the site impacted by the project;
• Proceed with benefits transfer and discuss clearly whether the actual economic values may be higher or lower than the values thus estimated.
78

PART C
SUMMARY OF RECOMMENDATIONS
79

Chapter 9
Summary of recommendations In these Guidelines on the Economic Valuation of the Environmental Impacts of Prescribed Activities, the conceptual framework as well as specific methodologies were presented to undertake the economic valuation of the environmental impacts of projects, or in other words to estimate the environmental costs and environmental benefits of the project. As indicated in the Handbook of Environmental Impact Assessment Guidelines, such economic valuation remains a key objective of the EIA process in Malaysia. As pointed out, the choice of which methodology to use when undertaking the economic valuation of environmental impacts is dictated by the nature of the expected impacts and its resulting effect on the ways by which human beings ‘use’ the goods and services produced by the environment. As indicated at the outset, these Guidelines aim to provide practical advice to project initiators on the topic of economic valuation of a project’s environmental impacts. In doing so, it is understood that the expertise to undertake and review such economic valuation is currently limited but is expected to increase with experience. It is also understood that in some circumstances, the lack of time or resources may impede the undertaking of the economic valuation of environmental impacts. Finally, it is also understood that the economic valuation methodologies presented in these Guidelines vary considerably in terms of the required technical and economic expertise for their proper implementation. As indicated in Table 9.1, while some economic valuation methodologies may be relatively easy to implement, others require a significant degree of expertise.
80
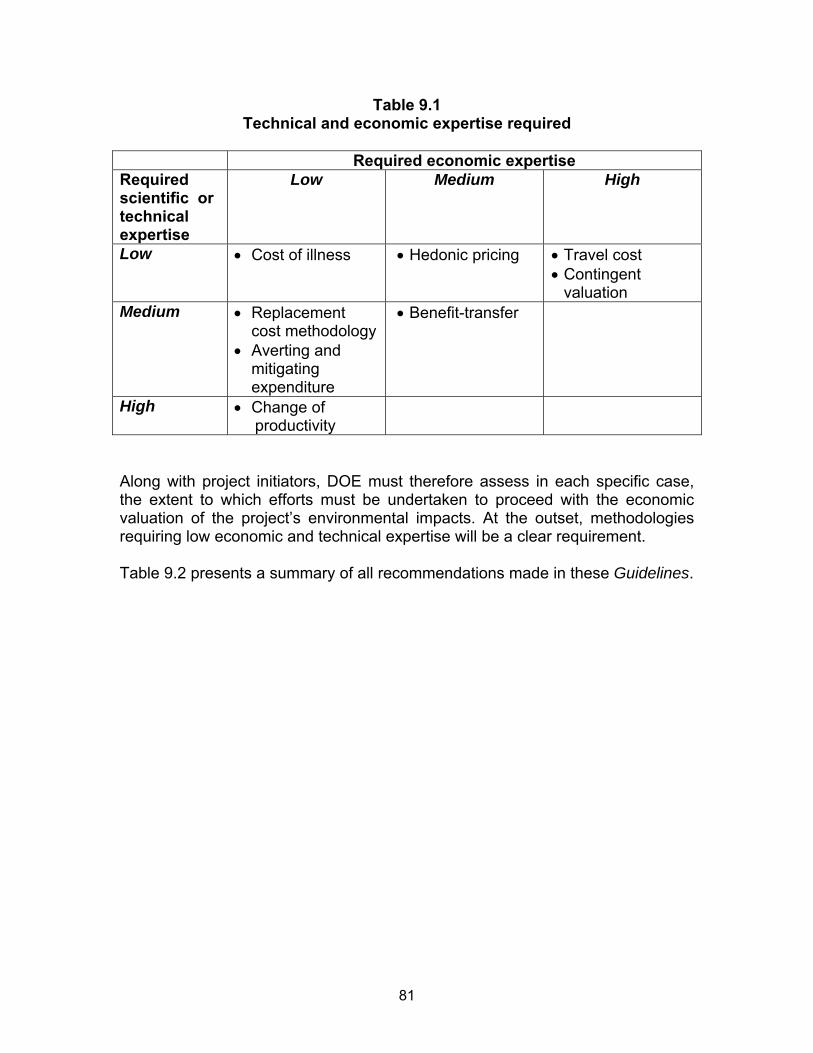
81
Table 9.1 Technical and economic expertise required
Required economic expertise Required scientific or technical expertise
Low Medium High
Low
• Cost of illness
• Hedonic pricing • Travel cost • Contingent
valuation Medium • Replacement
cost methodology • Averting and
mitigating expenditure
• Benefit-transfer
High
• Change of productivity
Along with project initiators, DOE must therefore assess in each specific case, the extent to which efforts must be undertaken to proceed with the economic valuation of the project’s environmental impacts. At the outset, methodologies requiring low economic and technical expertise will be a clear requirement. Table 9.2 presents a summary of all recommendations made in these Guidelines.

Table 9.2 Summary of recommendations
Recommendations to Project Initiators
Chapter 3: Approaching the economic valuation of environmental impacts: Issues of common interest The scope of analysis • Aim first to identify the environmental impacts of the project, not to select the geographical
scoping of the project; • Group the environmental impacts (both positive and negative) into those occurring: (1) Within the
local community where the project is located; (2) On other local communities within the state where the project is located; and (3) On other states of Malaysia;
• Identify clearly the groups of individuals who may be excluded from the process of identifying,
quantifying, and monetizing the environmental impacts of the project. The scenario of reference
• In order to identify and quantify the extent of the project’s environmental impacts, project initiators should clearly specify and compare the following two scenarios:
Scenario 1: Expected changes in environmental quality and the associated environmental impacts if there were to be no project (without project scenario) Scenario 2: Expected changes in environmental quality and the associated environmental impacts if there were to be a project (with project scenario)
Inflation • Conduct the economic evaluation of the project’s environmental impacts in terms of real prices; • Do not incorporate in the economic valuation of the project’s environmental impacts changes in
prices solely caused by inflation; • As a level of reference, use the level of prices as observed at the time of preparing the EIA
report. The discount rate • Present the undiscounted stream of environmental costs and environmental benefits of the
project, in each of the period in these the costs and benefits are taking place (Table 3.1);
82

• Discount rates ranging from 3% to 8% should be used to calculate the present value of the environmental costs and of the environmental benefits.
• Calculate and display the present value of the environmental costs and environmental benefits
using a discount rate ranging from 3% to 8% (Table 3.2); • The economic valuation of environmental impacts does not a cost-benefit analysis. As such, the
calculation of the net present value (present value of benefits minus present value of costs) is not of direct relevance to this analysis.
The selection of the time horizon
• The appropriate time horizon to select should coincide with the expected duration (in time) of the environmental impacts of the project;
• If some environmental impacts are expected to be of a temporary nature (for example, during the
construction phase of the project), then for these impacts the appropriate time horizon to select is the number of years these impacts are expected to last;
• If some environmental impacts are expected to be permanent, then using a time horizon of
between 30 to 50 years is generally sufficient to provide an adequate estimate of the present value of these impacts.
Sensitivity analysis • Provide a range for the present value of environmental costs and the present value of environmental benefits depending on different assumptions as to the impact of the project on the environment.
Chapter 4: Introduction to the methodologies for economic valuation • Identify all environmental impacts of the project; • Assess which data is currently available in order to quantify the environmental impacts (changes in physical terms); • Given the nature of the available data, determine which methodology is best to use to undertake the economic valuation of the
environmental impacts; • Depending on the selected methodology, proceed with (additional) data collection if necessary. • Ensure that the team of experts is appropriate to the task at hand and that the economist is a member of the team from the very
83

outset of the EIA process to ensure that the data necessary for purpose of economic valuation is indeed collected. Chapter 5: Change of productivity methodology
• Estimate the existing annual level (on average) of productivity (by means of time series data over the last 5 years approximately);
• Establish what may be expected to happen to the future level of productivity if there were to be no project (one possible scenario
(hypothesis) is that the future level of productivity would be equal on average to the recently observed level of productivity). This is the without project scenario;
• Establish what may be expected to happen to the future level of productivity if there were to be a project. This is the with project
scenario; • Indicate clearly if the impacts are expected to be temporary (for example occurring only during the construction phase of the
project) or permanent. If temporary, indicate clearly for how many years the impacts are expected to occur, and how productivity (in quantitative terms) is expected to recover over time to the level that is expected to exist without project;
• Estimate the impact on productivity by calculating the difference between the without project and with project scenarios; • Construct alternative scenarios including a worst case scenario (where appropriate) to give a possible range of the impact of the
project on productivity (sensitivity analysis). • Collect information about recent and existing market prices for the commodity whose productivity is impacted, as well as for the
inputs necessary to the production of this commodity (e.g. labor, machinery, etc.); • Before using market prices, adjust these prices at least for the presence of taxes, and if possible of subsidies and any other
policies which may impact market prices; • Calculate the net economic value of the change (decrease or increase) in productivity per unit of output (for example, per
kilogram or ton of product; or per hectares of lost agricultural land); • Multiply the net economic value per unit of output by the total estimated quantity of lost (or gained) output in any given year; • Calculate the present value of the change in productivity using a discount rate ranging between 3% and 8%;
84
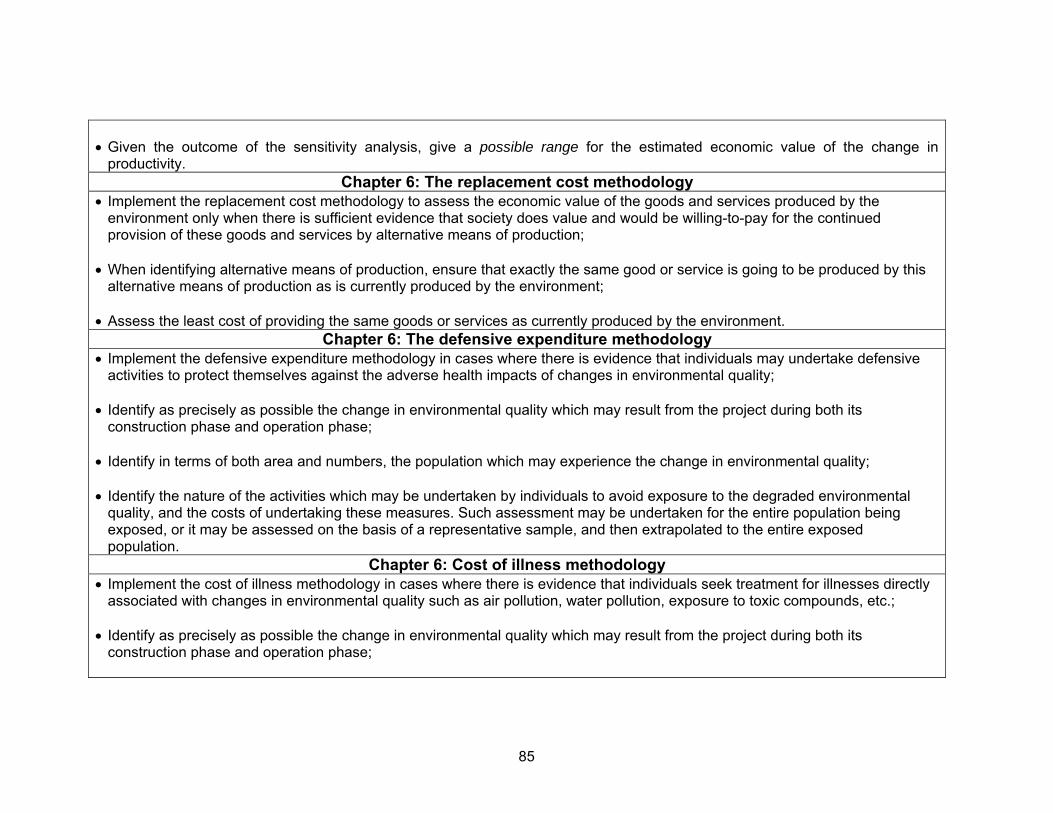
• Given the outcome of the sensitivity analysis, give a possible range for the estimated economic value of the change in
productivity. Chapter 6: The replacement cost methodology
• Implement the replacement cost methodology to assess the economic value of the goods and services produced by the environment only when there is sufficient evidence that society does value and would be willing-to-pay for the continued provision of these goods and services by alternative means of production;
• When identifying alternative means of production, ensure that exactly the same good or service is going to be produced by this
alternative means of production as is currently produced by the environment; • Assess the least cost of providing the same goods or services as currently produced by the environment.
Chapter 6: The defensive expenditure methodology • Implement the defensive expenditure methodology in cases where there is evidence that individuals may undertake defensive
activities to protect themselves against the adverse health impacts of changes in environmental quality; • Identify as precisely as possible the change in environmental quality which may result from the project during both its
construction phase and operation phase; • Identify in terms of both area and numbers, the population which may experience the change in environmental quality; • Identify the nature of the activities which may be undertaken by individuals to avoid exposure to the degraded environmental
quality, and the costs of undertaking these measures. Such assessment may be undertaken for the entire population being exposed, or it may be assessed on the basis of a representative sample, and then extrapolated to the entire exposed population.
Chapter 6: Cost of illness methodology • Implement the cost of illness methodology in cases where there is evidence that individuals seek treatment for illnesses directly
associated with changes in environmental quality such as air pollution, water pollution, exposure to toxic compounds, etc.; • Identify as precisely as possible the change in environmental quality which may result from the project during both its
construction phase and operation phase;
85

• Identify in terms of both area and numbers, the population which may experience the change in environmental quality; • Identify the nature of the activities which may be undertaken by individuals to treat illnesses if they were exposed to the
degraded environmental quality, and the costs of undertaking these measures. Such assessment may be undertaken for the entire population being exposed, or it may be assessed on the basis of a representative sample, and then extrapolated to the entire exposed population;
• Remember that the cost of illness methodology requires that subsidies paid by the government for the treatment of illnesses
also be included in the calculation of the cost of illness Chapter 6: Hedonic pricing methodology
• Identify as precisely as possible the change in environmental quality which may result from the project during both its construction phase and operation phase;
• Identify in terms of both area and numbers, the population which may experience the change in environmental quality and the
types of properties where this population in which this population is currently living; • Assess the potential changes in market values which on average each of these properties could experience as a result of the
change in environmental quality, and on this basis assess the potential aggregate change in market value on impacted property; • Conduct sensitivity analysis.
Chapter 6: Travel cost methodology • Identify as precisely as possible the change in environmental quality which may result from the project during both its
construction phase and operation phase; • Identify whether or not a recreational site may be impacted as a result of the project; • If use of the site may be severely impaired by the project, use the zonal or individual travel cost approach; if changes in
environmental quality will impact enjoyment of the site, use the random utility approach; • Document in a careful manner the existing use of the recreational site, and the characteristics of the existing population of
visitors; • In all cases, ensure that the sample of actual or potential visitors to the site is truly representative of the population of visitors;
86
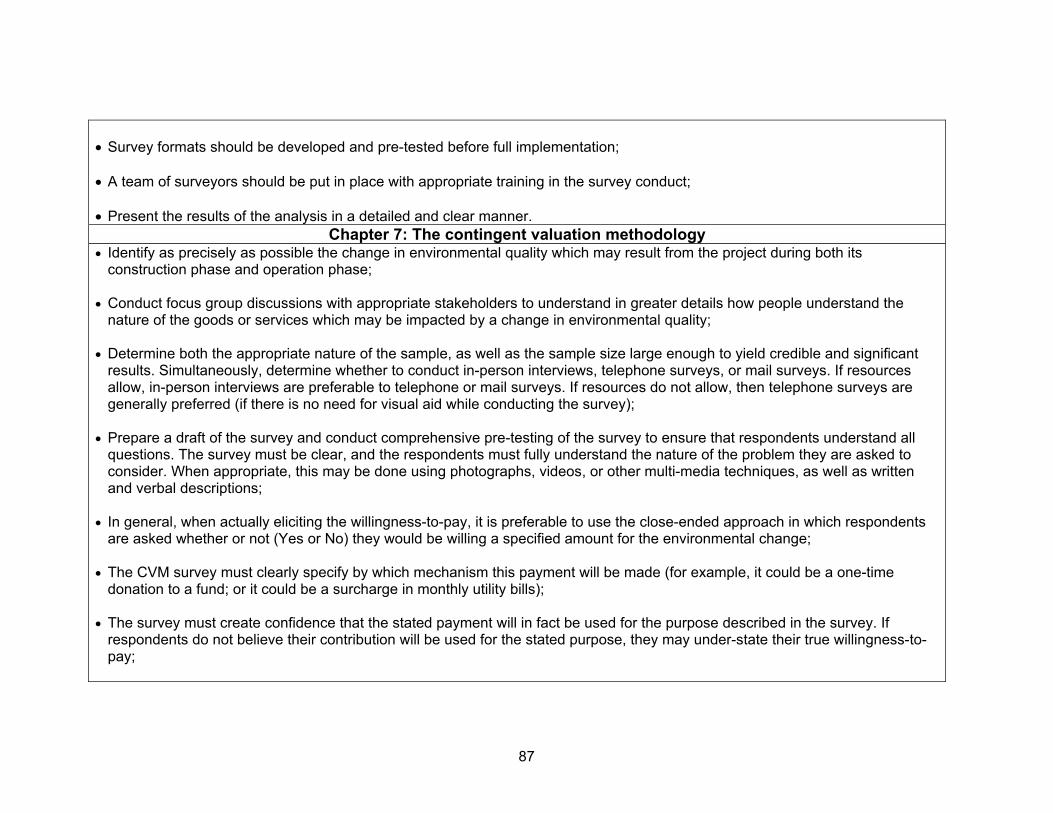
• Survey formats should be developed and pre-tested before full implementation; • A team of surveyors should be put in place with appropriate training in the survey conduct; • Present the results of the analysis in a detailed and clear manner.
Chapter 7: The contingent valuation methodology • Identify as precisely as possible the change in environmental quality which may result from the project during both its
construction phase and operation phase; • Conduct focus group discussions with appropriate stakeholders to understand in greater details how people understand the
nature of the goods or services which may be impacted by a change in environmental quality; • Determine both the appropriate nature of the sample, as well as the sample size large enough to yield credible and significant
results. Simultaneously, determine whether to conduct in-person interviews, telephone surveys, or mail surveys. If resources allow, in-person interviews are preferable to telephone or mail surveys. If resources do not allow, then telephone surveys are generally preferred (if there is no need for visual aid while conducting the survey);
• Prepare a draft of the survey and conduct comprehensive pre-testing of the survey to ensure that respondents understand all
questions. The survey must be clear, and the respondents must fully understand the nature of the problem they are asked to consider. When appropriate, this may be done using photographs, videos, or other multi-media techniques, as well as written and verbal descriptions;
• In general, when actually eliciting the willingness-to-pay, it is preferable to use the close-ended approach in which respondents
are asked whether or not (Yes or No) they would be willing a specified amount for the environmental change; • The CVM survey must clearly specify by which mechanism this payment will be made (for example, it could be a one-time
donation to a fund; or it could be a surcharge in monthly utility bills); • The survey must create confidence that the stated payment will in fact be used for the purpose described in the survey. If
respondents do not believe their contribution will be used for the stated purpose, they may under-state their true willingness-to-pay;
87
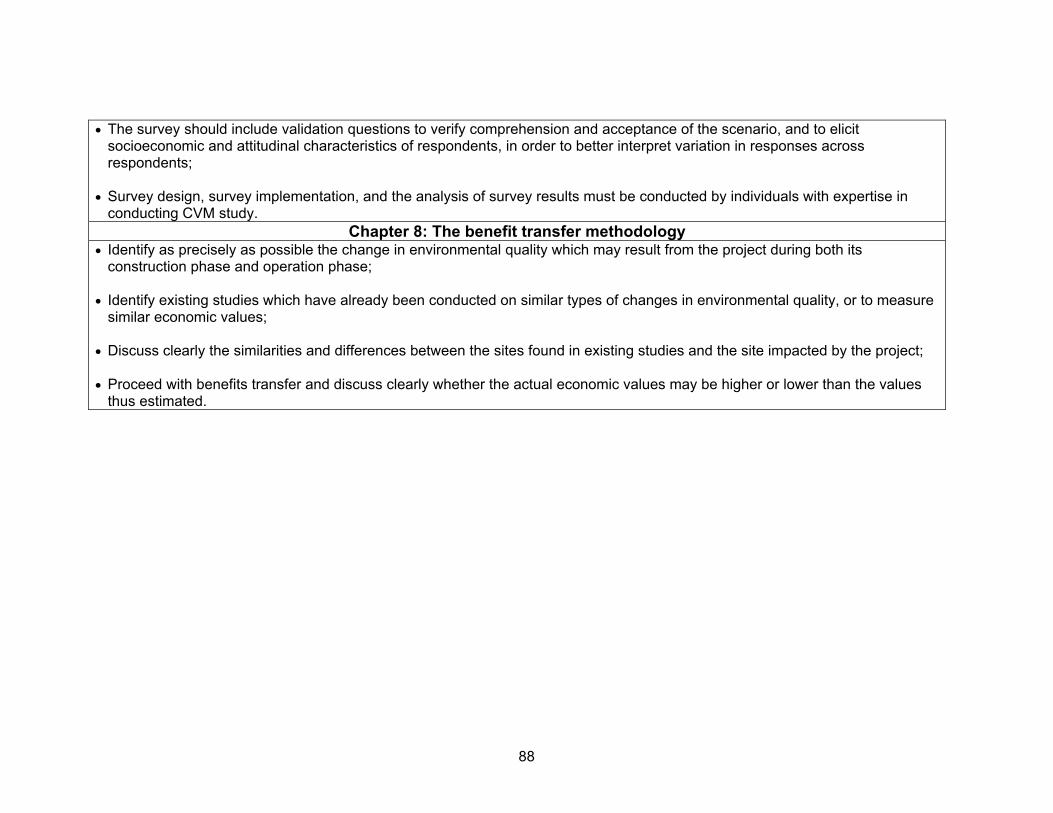
• The survey should include validation questions to verify comprehension and acceptance of the scenario, and to elicit socioeconomic and attitudinal characteristics of respondents, in order to better interpret variation in responses across respondents;
• Survey design, survey implementation, and the analysis of survey results must be conducted by individuals with expertise in
conducting CVM study. Chapter 8: The benefit transfer methodology
• Identify as precisely as possible the change in environmental quality which may result from the project during both its construction phase and operation phase;
• Identify existing studies which have already been conducted on similar types of changes in environmental quality, or to measure
similar economic values; • Discuss clearly the similarities and differences between the sites found in existing studies and the site impacted by the project; • Proceed with benefits transfer and discuss clearly whether the actual economic values may be higher or lower than the values
thus estimated.
88

References cited in these Guidelines Bolt, K., Ruta, G., and M. Sarraf (2005), Estimating the Cost of Environmental
Degradation, Environment Department Papers, The World Bank, Washington, D.C.
Daily, G.C. (1997), “Introduction: What are ecosystem services?” In G.C. Daily
(eds) Nature’s Services: Societal Dependence on Natural Ecosystems, Island Press, Washington, D.C.
Freeman, M. A. III (2003), The Measurements of Environmental and Resource
Values: Theory and Methods, Resources for the Future, Washington, D.C. Gollier, C. (2002), “Discounting an uncertain future”, Journal of Public
Economics, 85, 149-166. Postel, S.L, and S. Carpenter (1997), “Freshwater ecosystem services”. In G.C.
Daily (eds) Nature’s Services: Societal Dependence on Natural Ecosystems, Island Press, Washington, D.C.
Turner, R.K. van den Bergh, J.C.M., Sodenqvist, T. Barendregt, A., van der
Straaten, J., Maltby, E., and E.C. van Ierland (2000), “Ecological-economic analysis of wetlands: Scientific integration for management and policy”, Ecological Economics, 35, 7-23.
Weitzman, M. L. (1998), “Why the far distant future should be discounted at its
lowest possible rate”, Journal of Environmental Economics and Management, 36, 201-208.
89
Additional References There exist a very large number of documents on the economic valuation of environmental impacts. We provide below a short list of references which the interested reader may wish to consult for further and more detailed information. Dixon, J.A., Scura, L.F., Carpenter, R.A., and P.B. Sherman (1995), Economic
Analysis of Environmental Impacts, Earthscan Publications Ltd, London. Hutton, G, and L. Haller (2004), Evaluation of the Costs and Benefits of Water
and Sanitation Improvements at the Global Level, World Health Organization, Geneva.
McNally, R., and M.S. Othman (2002), Environmental Economics: A Practical
Guide, WWF, United Kingdom. National Research Council (2005), Valuing Ecosystem Services: Toward Better
Environmental Decision-Making, National Academy of Sciences, National Academies Press, Washington, D.C.
Pearce, D., Atkinson, G., and S. Mourato (2006), Cost-Benefit Analysis and the
Environment: Recent Developments, Organisation for Economic Co-Operation and Development, Paris.
United Nations Environment Program (2000), Environmental Valuation: A
Worldwide Compendium of Case Studies, J. Rietbergen-McCracken and H. Abaze (eds), Earthscan Publications Ltd, London.
90

Websites of interest http://envirovaluation.org/ This website, entitled “Environmental valuation and cost-benefit news”, is perhaps the most extensive source of information on the web on empirical economic valuation studies and cost-benefit analysis. It covers thousands of economic valuation and cost-benefit studies throughout the world. http://www.evri.ca The Environmental Valuation Reference Inventory (EVRI) is a searchable database of empirical studies on the economic value of environmental benefits and human health effects. It has been developed specifically for the purpose of using the benefits transfer methodology. It contains in excess of 1,500 studies. Each study is summarized by topic, by area, by method, and by results. It is however accessible only to subscribers. http://yosemite.epa.gov/ee/epa/eed.nsf/webpages/homepage This is the website of the National Center for Environmental Economics of the U.S. Environmental Protection Agency. http://noep.mbari.org/nonmarket/ This is the website of the U.S. National Ocean Economics Program. It reviews applications of economic valuation methodologies to ocean activities, in particular recreational activities. http://www.csc.noaa.gov/coastal/economics/envvaluation.htm This is the website of the Coastal Services Centre of the National Oceanic and Atmospheric Administration. It provides good general readings on environmental valuation.
91
Glossary Benefits transfer methodology
The benefits transfer methodology estimates economic values by transferring existing benefit estimates from studies already completed for another location or issue.
Bequest value The value that people place on knowing that future generations will have the option to enjoy something.
Consumer surplus The difference between the price actually paid for a good, and the maximum amount that an individual is willing to pay for it.
Contingent valuation methodology (CVM) A method, usually in the form of a survey questionnaire, of eliciting values for environmental goods and services based upon hypothetical situations. CVM may be the only means of estimating the passive or non-use values for environmental goods/services.
Defensive expenditures methodology The defensive expenditures methodology uses the calculation of defensive expenditures to prevent the degradation of an environmental good/service or the quality of that good/service in order to determine the value of a particular environmental good or service such as air or water quality.
Demand curve The graphical representation of the demand function.
Demand function The mathematical function that relates price and quantity demanded for goods or services. It tells how many units of a good will be purchased at different prices. The market demand function is calculated by adding together all of the individual consumers’ demand functions.
Discount rate The rate used to reduce future benefits and costs to their present time equivalent.
Existence value The value that people place on simply knowing that something exists, even if they will never see it or use it.
92
Hedonic pricing methodology The hedonic pricing methodology assesses the value of an environmental feature (clean air, clean water, serenity, view) by examining actual markets where the feature contributes to the price of a marketed good. For example, using the hedonic pricing method one could determine the contribution of an ocean view, by looking at the contribution of ocean views to property values. The contribution of the environmental good is usually determined by a regression of the price of the marketed good on attributes of the good, including the environmental attribute in question.
Non-use values Values that are not associated with actual use, or even the option to use a good or service.
Opportunity cost The value of the best alternative to a given choice, or the value of resources in their next best use. In regard to time, the opportunity cost of time spent on one activity is the value of the best alternative activity that the person might engage in at that time.
Option value The value that people place on having the option to enjoy something in the future, although they may not currently use it.
Producer surplus The difference between the total amount earned from a good (price times quantity sold) and the production costs.
Random utility model (RUM) RUM is a model of consumer choice in which the consumer is assumed to have perfect discrimination capability between goods or activities in order to maximize their 'utility'. It is generally used in the context of the travel cost methodology.
Revealed preferences Revealed preferences is an approach that is used to identify the underlying preferences, and thus demands of individuals, based upon the choices each reveals in their consumption.
Regression analysis A statistical process for fitting a line through a set of data points. It gives the intercept and slope(s) of the “best fitting” line. Thus it tells how much one variable (the dependent variable) will change when other variables (the independent, or explanatory, variables) change.
93
Stated preferences Stated preferences methodologies use discrete choice methods to model stated preferences for alternative goods or environmental scenarios. Stated and revealed preference methods may be combined.
Supply curve The graphical representation of the supply function.
Supply function
The mathematical function that relates price and quantity supplied for goods or services. The supply function tells how many units of a good that producers are willing to produce and sell at a given price.
Total economic value – the sum of all types of use and non-use values for a good or service.
Travel cost methodology
The travel cost methodology estimates economic values associated with ecosystems or sites that are used for recreation. It assumes that the value of a site can be deduced from how much people are willing to pay to travel to visit the site.
Use value Value derived from actual use of a good or service. Uses may include indirect uses. For example, enjoying a television show about whales provides an indirect use value for the whales.
Willingness to pay The amount—measured in goods, services, or dollars—that a person is willing to give up to get a particular good or service.
94

Annex 1 Penang National Park travel cost survey Survey ID Number: ____________________
Name of the Enumerator: ____________________ Date: Day:_______; Month: _______ Start Time: ___:___
Verbal Agreement Tourist Survey for Penang National Park
Good morning [afternoon]. My name is [_____]. As you may know, Penang National Park was created in 2003, and it is the most recent national park created in Malaysia. The Park authorities are currently in the process of finalizing the Park’s development plan, and it is in this context that we would welcome your comments and suggestions. I am working with a team of researchers and our purpose is to get a better understanding of the profile of the visitors coming to Penang National Park. We are interviewing both national and international visitors to the Penang National Park, and you have been selected just by chance. If you wish to stop the interview or do not wish to answer a specific question, this is entirely up to you. All the information you provide will be strictly confidential. Your name or address will never be requested in the course of this survey. The interview will take about 20 minutes. Would you be willing to be interviewed? (If no, sorry. stop the interview)
95
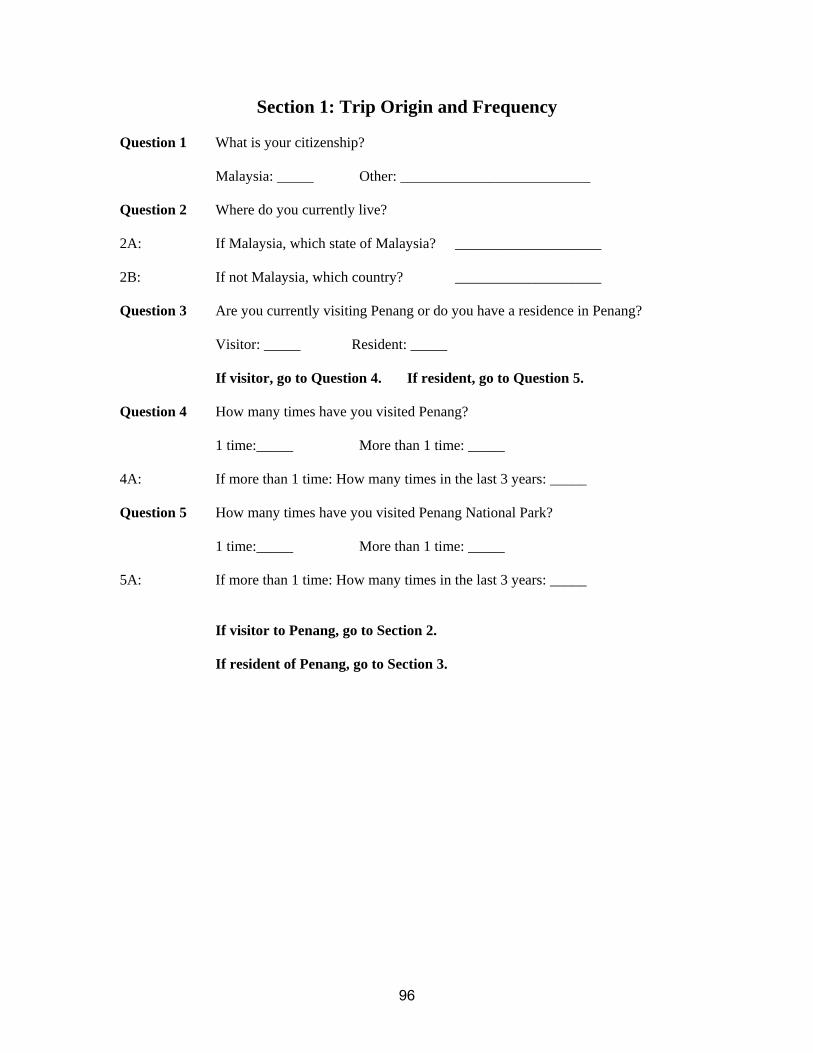
Section 1: Trip Origin and Frequency Question 1 What is your citizenship?
Malaysia: _____ Other: __________________________ Question 2 Where do you currently live? 2A: If Malaysia, which state of Malaysia? ____________________
2B: If not Malaysia, which country? ____________________ Question 3 Are you currently visiting Penang or do you have a residence in Penang?
Visitor: _____ Resident: _____ If visitor, go to Question 4. If resident, go to Question 5. Question 4 How many times have you visited Penang? 1 time:_____ More than 1 time: _____ 4A: If more than 1 time: How many times in the last 3 years: _____ Question 5 How many times have you visited Penang National Park? 1 time:_____ More than 1 time: _____ 5A: If more than 1 time: How many times in the last 3 years: _____ If visitor to Penang, go to Section 2.
If resident of Penang, go to Section 3.
96

Section 2: Trip duration and Travel costs
This section shall be completed only for visitors to Penang Question 6 In the course of this trip, are you visiting Penang only or are you also visiting
other parts of Malaysia or are you also visiting other countries of South East Asia?
Penang only: _____
Malaysia only: _____ Also other parts of South East Asia: _____ If also visiting other parts of South East Asia, go to Section 2A.
If visiting Malaysia only, go to Section 2B. If visiting Penang only, go to Section 2C.
Section 2A: Also visit other parts of South East Asia Question 7 7A What is the point of origin of your current trip to South East Asia? ________________ 7B Which other parts of SE Asia are you visiting? ______________________________ 7C What is the duration of your entire trip to SE Asia (number of days)? ______________ 7D In Malaysia, in addition to Penang, are your visiting other parts of Malaysia? ______ If yes, go to Question 8. If no, go to Question 9. Question 8 8A Which other parts of Malaysia are you visiting? _________________________ 8B How many days are you spending in total in Malaysia, including Penang? _________ Question 9 How many days are you spending in Penang? __________ Question 10 For this trip to South East Asia, did you buy a package tour including airfare and
accommodations, or did you buy airfare separately from accommodations?
97

____________________ If airfare separate from accomodations, go to Question 11.
If package tour, go to Question 14. Question 11 11A What is the total airfare for this trip to South East Asia (note currency)? __________ 11B From which city did you travel to Penang? _____________________ 11C How did you come from [ city mentioned above ] to Penang? _____________________ If by plane go to Question 12. If other means of transport go to Question 13. Question 12 12A Was the airfare from [city mentioned above] to Penang included in the overall
airfare of your trip to South East Asia? _____
If included, do you know by how much your airfare increased because of your trip to Penang?
Don’t know: _____; If know, write down the amount: ________
If not included, what was the airfare from [city mentioned above] to Penang? __________
Question 13 13A What was the total cost of transport from [city mentioned above] to Penang? __________ 13B How much time did it take to perform this trip? ___________ Question 14 14A What does the package tour include? Airfare: _____; Accommodation: ____; Food: _____; Other (list): __________________ 14B What is the total cost of the package tour (note currency)? ______________ 14C Do you know by how much the cost of your package tour increased because of
your trip to Penang? Don’t know: _____; If know, write down the amount: ________
98
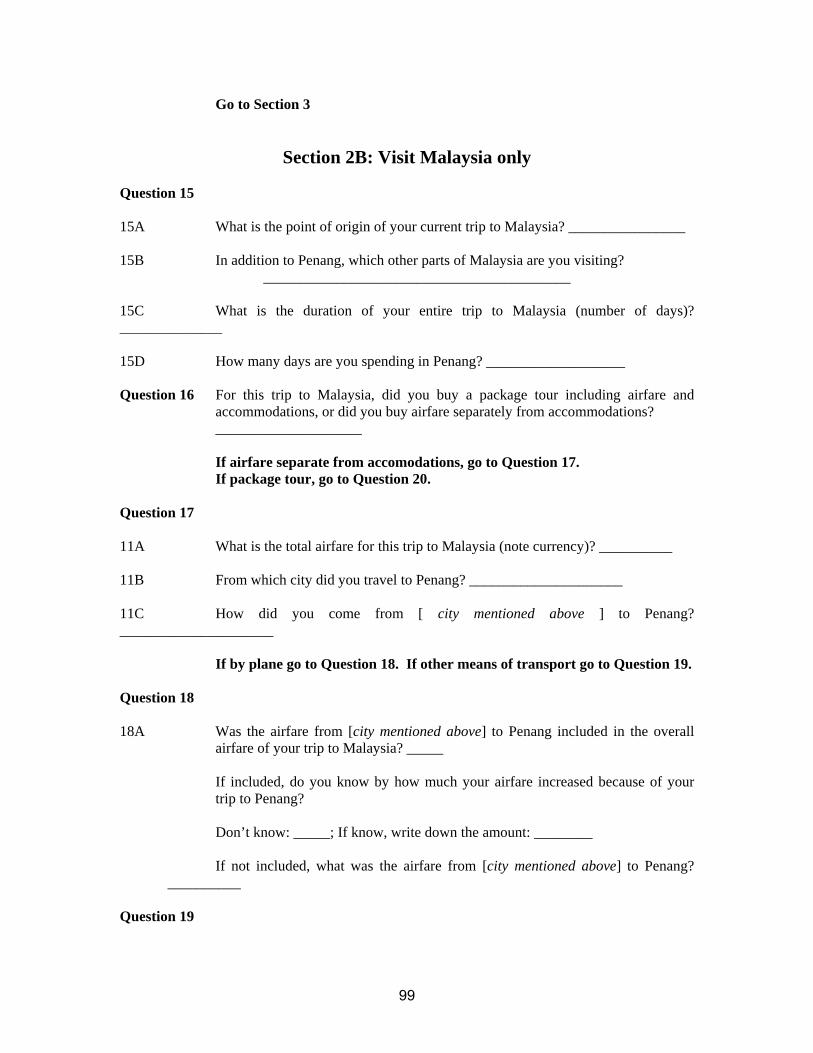
Go to Section 3
Section 2B: Visit Malaysia only Question 15 15A What is the point of origin of your current trip to Malaysia? ________________ 15B In addition to Penang, which other parts of Malaysia are you visiting? __________________________________________ 15C What is the duration of your entire trip to Malaysia (number of days)? ______________ 15D How many days are you spending in Penang? ___________________ Question 16 For this trip to Malaysia, did you buy a package tour including airfare and
accommodations, or did you buy airfare separately from accommodations? ____________________ If airfare separate from accomodations, go to Question 17.
If package tour, go to Question 20. Question 17 11A What is the total airfare for this trip to Malaysia (note currency)? __________ 11B From which city did you travel to Penang? _____________________ 11C How did you come from [ city mentioned above ] to Penang? _____________________ If by plane go to Question 18. If other means of transport go to Question 19. Question 18 18A Was the airfare from [city mentioned above] to Penang included in the overall
airfare of your trip to Malaysia? _____
If included, do you know by how much your airfare increased because of your trip to Penang?
Don’t know: _____; If know, write down the amount: ________
If not included, what was the airfare from [city mentioned above] to Penang? __________
Question 19
99

19A What was the total cost of transport from [city mentioned above] to Penang? __________ 19B How much time did it take to perform this trip? ___________ Question 20 20A What does the package tour include? Airfare: _____; Accommodation: ____; Food: _____; Other (list): __________________ 20B What is the total cost of the package tour (note currency)? ______________ 20C Do you know by how much the cost of your package tour increased because of
your trip to Penang? Don’t know: _____; If know, write down the amount: ________
Go to Section 3
Section 2C: Visit Penang only Question 21 How many days are you spending in Penang? _________________ Question 22 22A From which city did you travel to Penang? ______________________ 22B How did you travel to Penang? ________________________________ 22C How many hours did it take to travel to Penang? __________________ Question 23 For this trip to Penang, did you buy a package tour including transport and
accommodations, or did you buy transport separately from accommodations? ____________________ If transport separate from accomodations, go to Question 24.
If package tour, go to Question 25. Question 24 24A What is the total transport cost for this trip to Penang (note currency)? __________ 24B What is the total cost of accomodations for this trip to Penang (note currency)? ________
100

24C Does the total cost of accomodations include meals? ________ 24D If no, what would be your best estimates of the total cost of meals while in
Penang? ______________ Question 25 25A What does the package tour include? Airfare: _____; Accommodation: ____; Food: _____; Other (list): __________________ 25B What is the total cost of the package tour (note currency)? ______________ 25C If the package tour does not include meals, what would be your best estimates of
the total cost of meals while in Penang? ___________________
Section 3: Current trip to the Penang National Park
Question 26 Where are you currently staying in Penang? _____________________________ Name of accomodations: ____________________________________________ Question 27 27A Are you coming alone today to visit Penang NP? ____________ 27B If no, how many people in your group, including yourself? ___________ Question 28 How long do you intend to spend at the National Park?
One day: _____; Half day: _____; More than one day: _____
If more than one day, how many days: _____ Question 29 What activities do you want to undertake in Penang NP?
Enjoying natural beauty and climate: _____; Swimming / Beaching: _____; Boating / Paddle boating: _____; Picnicking / BBQ: _____; Fishing: _____ Other (specify) ____________________________________________
Question 30 Is this trip to Penang NP organized by you or is it a part of a travel package
organized by a travel company or by your hotel? ________________________ If organized by travel company or hotel, go to Question 31.
101
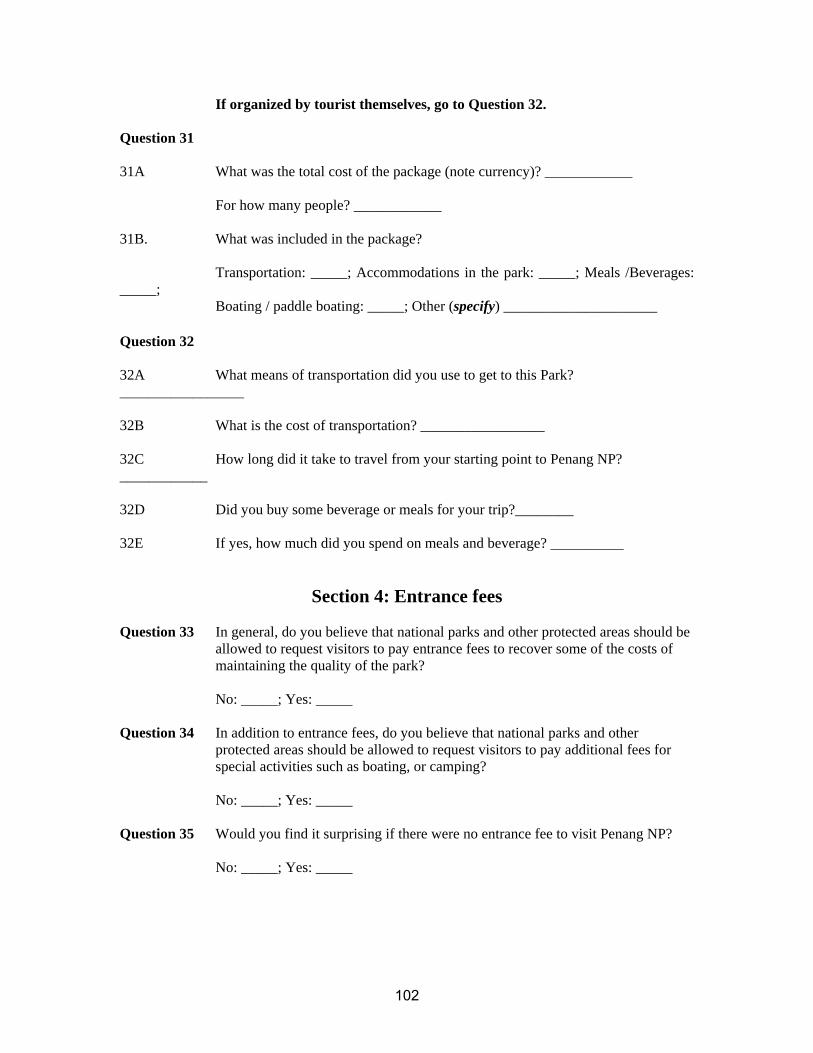
If organized by tourist themselves, go to Question 32. Question 31 31A What was the total cost of the package (note currency)? ____________ For how many people? ____________ 31B. What was included in the package? Transportation: _____; Accommodations in the park: _____; Meals /Beverages: _____; Boating / paddle boating: _____; Other (specify) _____________________ Question 32 32A What means of transportation did you use to get to this Park? _________________ 32B What is the cost of transportation? _________________ 32C How long did it take to travel from your starting point to Penang NP? ____________ 32D Did you buy some beverage or meals for your trip?________ 32E If yes, how much did you spend on meals and beverage? __________
Section 4: Entrance fees Question 33 In general, do you believe that national parks and other protected areas should be
allowed to request visitors to pay entrance fees to recover some of the costs of maintaining the quality of the park?
No: _____; Yes: _____ Question 34 In addition to entrance fees, do you believe that national parks and other
protected areas should be allowed to request visitors to pay additional fees for special activities such as boating, or camping?
No: _____; Yes: _____
Question 35 Would you find it surprising if there were no entrance fee to visit Penang NP?
No: _____; Yes: _____
102

Question 36 Assume that there was an entrance fee to use the Penang NP. This fee would not include fees for boating or camping. It would simply give you the right to walk, picnic, take pictures, and generally enjoy the natural beauty of the park. The entrance fee would be per person, valid for one day.
I am going to list to you entrance fees. Please tell me if: (1) you would enter the
Park for sure; (2) you would probably enter the park; (3) you would probably not enter the park; or (4) you would surely not enter the park.
Entrance fee
Per person (RM) Will enter for sure
Will probably
enter
Will probably not
enter
Will not enter for
sure 0 1 2 3 4 5 6 7 8 9
10 11 12 13 14 15 16 17 18 19 20 25 30 40 50 75
100 150 200 400 600 800
1000
103

Section 5: Socio-economic Characteristics Question 37 37A Gender of respondent: Male: _____ Female: _____ 37B What is your age? Under 20: _____; 20 – 30: _____; 30 – 40: _____; 40 – 50: _____; Above 50 – 60: _____; Above 60: _____ 37C Are you married? _____ 37D How many people comprise your current household (including yourself)? ______ 37E What is the highest level of education that you have completed? (Please
check one) 1. None: _____ 2. Incomplete secondary school: _____ 3. Completed secondary school: _____ 4. Professional technical education: _____ 5. Institute / University: _____ 6. Postgraduate: _____
37F What kind of job(s) do you have? (List & check all that apply)
1. Management: _____ 2. Large business owner: _____ 3. Small business owner/ Retail sales: _____ 4. Specialist /Professional: _____ 5. Clerical: _____ 6. Factory worker: _____ 7. Farmer/Agricultural worker: _____ 8. Unemployed: _____ 9. Don’t work (pensioner, student, housewife etc.): _____ 10. Other (specify) ______________
Question 38 38A What would be the level of your household income?
RM per month (if Malaysian)
USD (per _______)
0 – 1000 0 – 1000 1000 – 2000 1000 – 2000 2000 – 3000 2000 – 3000 4000 – 5000 4000 – 5000 5000 – 7500 5000 – 7500 7500 – 10000 7500 – 10000 10000 – 15000 10000 – 15000 15000 – 20000 15000 – 20000 20000 – 30000 20000 – 30000
104
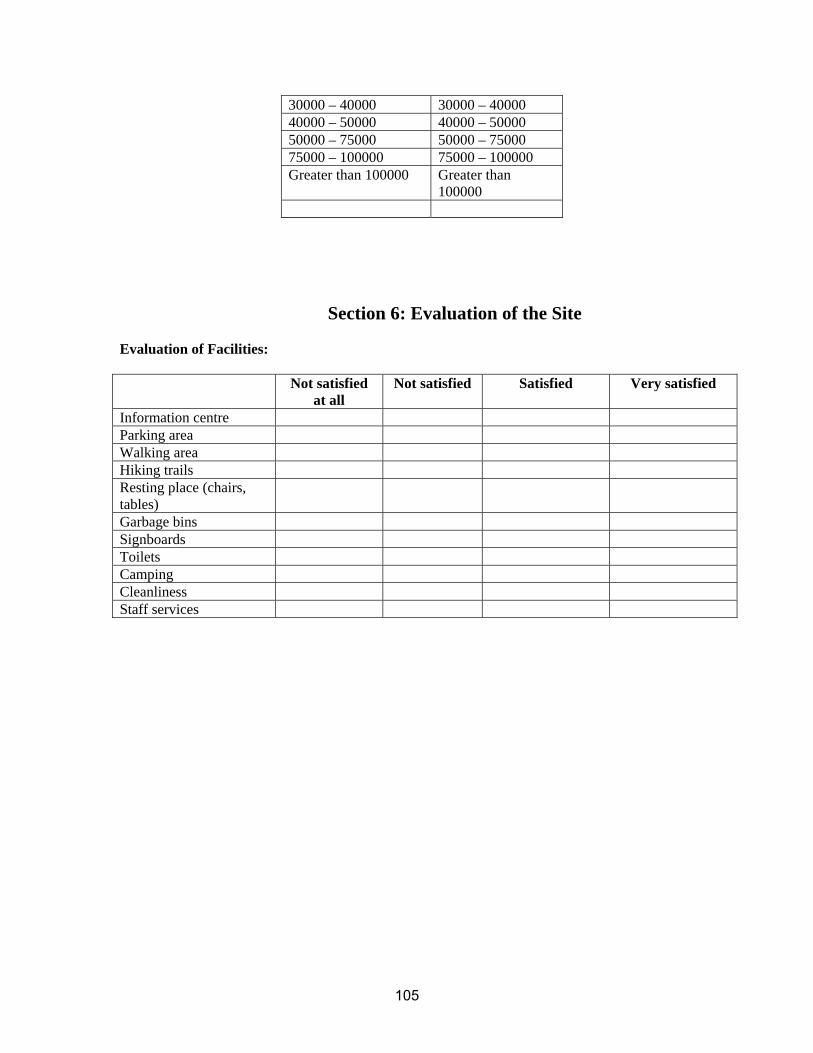
30000 – 40000 30000 – 40000 40000 – 50000 40000 – 50000 50000 – 75000 50000 – 75000 75000 – 100000 75000 – 100000 Greater than 100000 Greater than
100000
Section 6: Evaluation of the Site
Evaluation of Facilities: Not satisfied
at all Not satisfied Satisfied Very satisfied
Information centre Parking area Walking area Hiking trails Resting place (chairs, tables)
Garbage bins Signboards Toilets Camping Cleanliness Staff services
105

Section 7. Interviewer Debriefing Questions 1. Was the person who answered the questions irritated or nervous during the interview?
Yes No 2. Do you think that it was easy for the respondent to answer the questions concerning
number of visits regarding entrance fees and National Park level changes? Yes No NA/Missing 3. Was the person who answered the questions looking bored or tired during the interview? Yes No 4. Are you certain that the interviewee was answering to the questions honestly and truly?
1 2 3 4 5 Very Moderately Neutral Moderately Very
Uncertain Uncertain Certain Certain 5. Who else was listening while you conducted this interview with the respondent? (Check
all that apply) No one Spouse Other adult family members Other adults Children Other (specify) ________________________
Time finished: ____ : ____ Data entry operator ______________
106
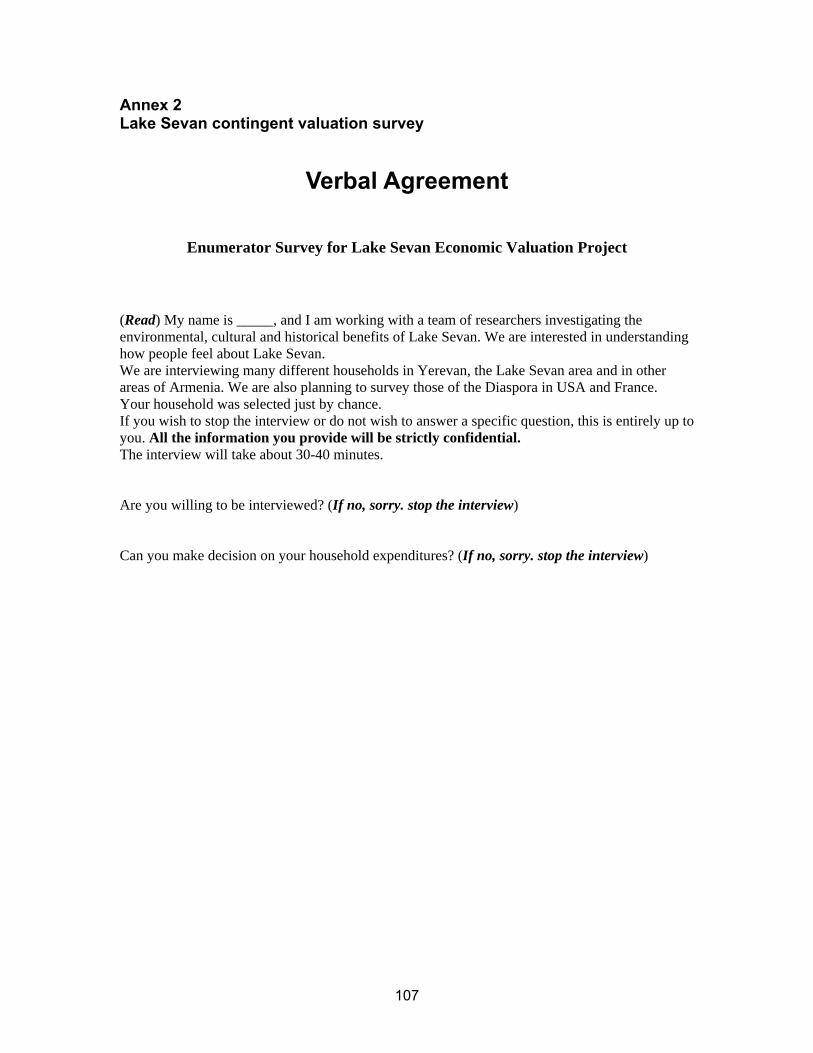
Annex 2 Lake Sevan contingent valuation survey
Verbal Agreement
Enumerator Survey for Lake Sevan Economic Valuation Project (Read) My name is _____, and I am working with a team of researchers investigating the environmental, cultural and historical benefits of Lake Sevan. We are interested in understanding how people feel about Lake Sevan. We are interviewing many different households in Yerevan, the Lake Sevan area and in other areas of Armenia. We are also planning to survey those of the Diaspora in USA and France. Your household was selected just by chance. If you wish to stop the interview or do not wish to answer a specific question, this is entirely up to you. All the information you provide will be strictly confidential. The interview will take about 30-40 minutes. Are you willing to be interviewed? (If no, sorry. stop the interview) Can you make decision on your household expenditures? (If no, sorry. stop the interview)
107
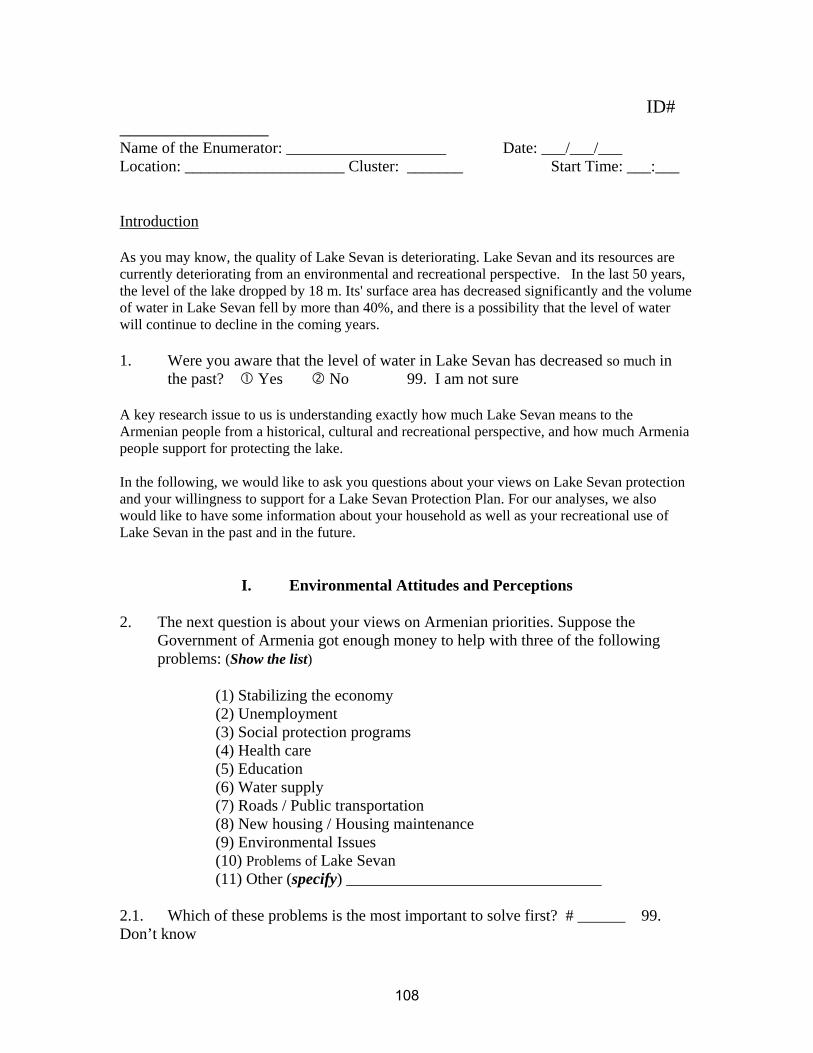
ID# ________________ Name of the Enumerator: ____________________ Date: ___/___/___ Location: ____________________ Cluster: _______ Start Time: ___:___ Introduction As you may know, the quality of Lake Sevan is deteriorating. Lake Sevan and its resources are currently deteriorating from an environmental and recreational perspective. In the last 50 years, the level of the lake dropped by 18 m. Its' surface area has decreased significantly and the volume of water in Lake Sevan fell by more than 40%, and there is a possibility that the level of water will continue to decline in the coming years. 1. Were you aware that the level of water in Lake Sevan has decreased so much in
the past? Yes No 99. I am not sure A key research issue to us is understanding exactly how much Lake Sevan means to the Armenian people from a historical, cultural and recreational perspective, and how much Armenia people support for protecting the lake. In the following, we would like to ask you questions about your views on Lake Sevan protection and your willingness to support for a Lake Sevan Protection Plan. For our analyses, we also would like to have some information about your household as well as your recreational use of Lake Sevan in the past and in the future.
I. Environmental Attitudes and Perceptions 2. The next question is about your views on Armenian priorities. Suppose the
Government of Armenia got enough money to help with three of the following problems: (Show the list)
(1) Stabilizing the economy (2) Unemployment (3) Social protection programs (4) Health care (5) Education (6) Water supply (7) Roads / Public transportation (8) New housing / Housing maintenance (9) Environmental Issues (10) Problems of Lake Sevan (11) Other (specify) ________________________________ 2.1. Which of these problems is the most important to solve first? # ______ 99. Don’t know
108
2.2. Which of these problems is the most important to solve second? # ______99. Don’t know 2.3. Which of these problems is the most important to solve third? # ______ 99. Don’t know 3. Have you ever heard about any environmental issues in Armenia on TV, the
radio, newspapers, magazines, or by community groups in the past 12 months? Yes No (Skip to question 6)
99. I am not sure (Skip to question 6) 4. If YES, how often (Please list & check one):
__ A few times (1-5) __ More than 20 times
__ Several times (6-10) 99. __ I don’t know __ Many times (11-20) 5. If YES, what were the issues you recall being most often discussed?
________________________________________________________________________________________________________________________________________________
6. Which three of the environmental issues listed below do you consider to be the
most significant in your area? __ Water pollution and lack of treatment of wastewater __ Loss of forests and wildlife __ Solid waste disposal and poor garbage collection __ Air pollution caused by cars __ Air pollution caused by factories __ Nuclear radiation __ Soil contamination
__ Toxic waste __ Other (specify) ____________________________ 6.1. First? # ______ 99. Don’t know 6.2. Second? # ______99. Don’t know 6.3. Third? # ______ 99. Don’t know (Read) For each of the following statements, please indicate your opinion on a scale of 'strongly agree' to 'strongly disagree'. (Please circle one)
109

7. If harming the environment, any Armenian economic or social development programs should be pursued only if the program has a detailed mitigation plan for environmental impacts.
1 2 3 4 5 99
Strongly disagree
Disagree Neutral Agree Strongly agree
Don’t Know
8. No matter what the environmental damages may be, Armenia needs to exploit its
natural resource base such as forests, water and land to increase jobs and incomes.
1 2 3 4 5 99 Strongly disagree
Disagree Neutral Agree Strongly agree
Don’t Know
9. We, as Armenians, should sacrifice some of our income and standard of living so
that the next generation may benefit from a better environment.
1 2 3 4 5 99 Strongly disagree
Disagree Neutral Agree Strongly agree
Don’t Know
10. If I were asked to contribute money or time to environmental protection programs
in Armenia, I would.
1 2 3 4 5 99 Strongly disagree
Disagree Neutral Agree Strongly agree
Don’t Know
11. I believe it is up to the Government of Armenia to solve environmental problems
in Armenia.
1 2 3 4 5 99 Strongly disagree
Disagree Neutral Agree Strongly agree
Don’t Know
12. Endangered or threatened species have a right to exist even though they may be of
no use to mankind.
1 2 3 4 5 99 Strongly disagree
Disagree Neutral Agree Strongly agree
Don’t Know
110
II. Lake Sevan Action Plan While dealing with its severe economic situation, the government of the Republic of Armenia recently expressed the interest to adopt a restoration plan using a number of actions to protect Lake Sevan from further, and perhaps irreversible, degradation and to make an attempt at improving the quality. The plan’s actions currently under discussion include: a. Limiting annual water releases to stabilize the level of the lake; b. construction of the Vorotan Tunnel; c. completion of the Yeghvard reservoir; d. combinations of the above. With different combinations of these actions, two targets which may be achieved are: 1) stabilizing the level of the lake and preventing any further lowering of the water level; and 2) raising the level of the lake by 3 meters in the next 15 years. Without any action, the water level of the lake is predicted to drop by 2 meters more in the next 10 years. 13. Are you aware of this Plan? 1. Yes, I know a lot about the plan 2. I have heard about some issues, but don’t know the details of the proposal 3. No, I am not aware of this proposal 14. Do you think that, without any action, the value of Lake Sevan as an important
cultural heritage site for the people of Armenia would be significantly damaged? 1. Yes, very significantly 2. Yes, slightly 3. No, the value would not be damaged even with further water level
decrease 99. I am not sure 15. In your opinion, has the environmental condition of Lake Sevan been getting
better, getting worse, or staying the same, over the past five years? 1. Getting worse 2. Staying the same 3. Getting better 99. I don’t know 16. Do you think that, if the water level of Lake Sevan is to be protected, there will be
less water for irrigation purposes today, but may be more water in the future? Yes No 99. I am not sure
17. Do you think that, if the water level of Lake Sevan is to be protected, there will be
less water to produce energy along the Hrazdan river today, but may be more water in the future?
111

Yes No 99. I am not sure
18. How often have you heard about environmental problems with Lake Sevan on TV, the radio, newspapers, magazines, or by community groups in the last 12 months?
__ Never __ A few times (1-5)
__ Several times (6-10) __ Many times (11-20) __ More than 20 times 99. __ I don’t know 19. Do you generate any income from the lake such as fishing or providing services to
tourists, etc.? Yes No 99. I don’t know 20. Do you feel that protecting Lake Sevan is very important to you? Yes, very important
Yes, important No, not very important (Skip to question 22) No, not important at all (Skip to question 22)
21. If YES, please tell me why. Please choose three answers from the following list.
To use Lake Sevan for recreational purposes for my family Others to be able to use the lake for recreation To preserve the historical and cultural value of Lake Sevan To protect fish and animal habitats that rely on the lake’s health To protect human health by the improvement of water quality To stabilize water quantity for farm irrigation and hydroelectric use To protect Lake Sevan for future generations Other reasons (specify): _______________________________
99. I don’t know 21.1. First? # ______ 99. Don’t know 21.2. Second? # ______99. Don’t know 21.3. Third? # ______ 99. Don’t know 22. If NO, please indicate below the statement that most closely reflects your thinking. __ I do not think that the water quantity and quality issues are important
__ I think that there are other more important problems that should be addressed first (specify):_________________________________________________
__ Other reasons for saying no (specify): ______________________________
112
____________________________________________________________ 99. __ I don’t know 23. As for deciding on which action plan should be adopted, do you think it’s a good
idea to use a public referendum in Armenia? Yes No 99. I am not sure
III. Contingent Valuation Questions: Willingness to Pay for Environmental Improvements to Lake Sevan
Consequences of the Lake Sevan Protection Action Plan We would like to know how strongly you may support a Lake Sevan Action Plan which may introduce some cost to your household. Let’s focus on the possible plan that targets raising the water level of the lake by 3 meters in 15 years. To meet the target, actions may include: 1. Limiting annual water releases in such a way so as to prevent a further lowering of the lake, and 2. Constructing the Vorotan Tunnel. I think you would like to know what are the consequences of a water level increase by 3 meters before you make decision on whether to support such an action plan. The economy and the ecosystem of the lake are too complex, however, to predict precisely the effects such a plan would have. (Show graph and picture) Presented here is a general description of the possible consequences. A summary of the impacts include: A. There would be no further water level decrease B. Water quality in the lake would be improved, benefiting fish and bird populations C. The ecosystem of the lake would be improved and thus it would be better for recreational and
tourist activities D. The commercial fishery could also be increased E. More water is available after the increase of the lake level for agricultural irrigation and in
times of drought, and therefore agricultural output could be better protected F. In the future, when necessary, the stock of water could be used for more energy generation Costs of the Action Plan Of course there would be a cost to Armenians in implementing this Lake Sevan Restoration Action Plan. Some Armenians may be negatively affected by the two action options - limiting water releases from Lake Sevan and constructing the Vorotan Tunnel. Financial support from different groups of Armenians, such as households like yours, would be necessary. The Armenian Diaspora outside Armenia would also be asked for financing this plan by making donations.
113
Plan Implementation: To implement such a plan, a Lake Sevan Trust Fund would be established. Citizens in Armenia would be asked to pay a separate monthly bill (like telephone bill) for 3 years that would go into the Trust Fund. The Fund's sole purpose would be to finance the efforts of the action plan and would contribute all of the proceeds to the plan. The Fund would be managed and administered by a Board of Governors comprising various interest groups so as to minimize any possible bias and to create an atmosphere of trust. Although this list is not exhaustive, the Board would at the very least consist of people form the Ministry of Nature Protection, environmental and community groups from the USA, France and Armenia as well as local residents of the Sevan basin area. Each member of the Board would have an equal vote and there would not be any overriding veto power by any one individual in the Board, thus there would be no overruling Chairman present in the Board. The activities of the Board would be completely transparent and all the activities supported by the Fund would have to be approved by a unanimous decision of the Board. You could thus have complete trust in the allocation of the money toward protecting and restoring Lake Sevan. [Do you have any questions? About any of the impacts, the costs, the Board of Governors etc.?]
114

Current situation Action Plan: No Action: & No Change 3 meters Increase in 15 years 2 meters Decrease in 10 year
+ 1
0
- 1
Current status
- 1
Change (m) Change (m)
0 0
+ 1 + 1
- 1
+ 3
+ 2
- 2
- 3
+ 2
+ 3
- 2
- 3
+ 2
+ 3
- 2
- 3
Expected impacts Fish: Slight increase in general catch, but endemic trout still endangered Birds: No further loss of bird species Plants: Increased number and variety of aquatic plants Water quality: a little bit better Power generation: small decrease today, some increase in the future Agriculture irrigation: less water use today, but greater availability in the
Expected impacts Fish: Decrease in general catch, and endemic trout become extinct Birds: Continued decrease in bird species due to wetlands habitat destruction Plants: Decreased numband variety of aquatic plants Water quality: a lot worse Power generation: small decrease
er
today, larger decrease in the future Agriculture irrigation: less water use today and even less availability in the
+ 4
+ 5
+ 6
+ 4
+ 5
+ 6
+ 4
+ 5
+ 6
115
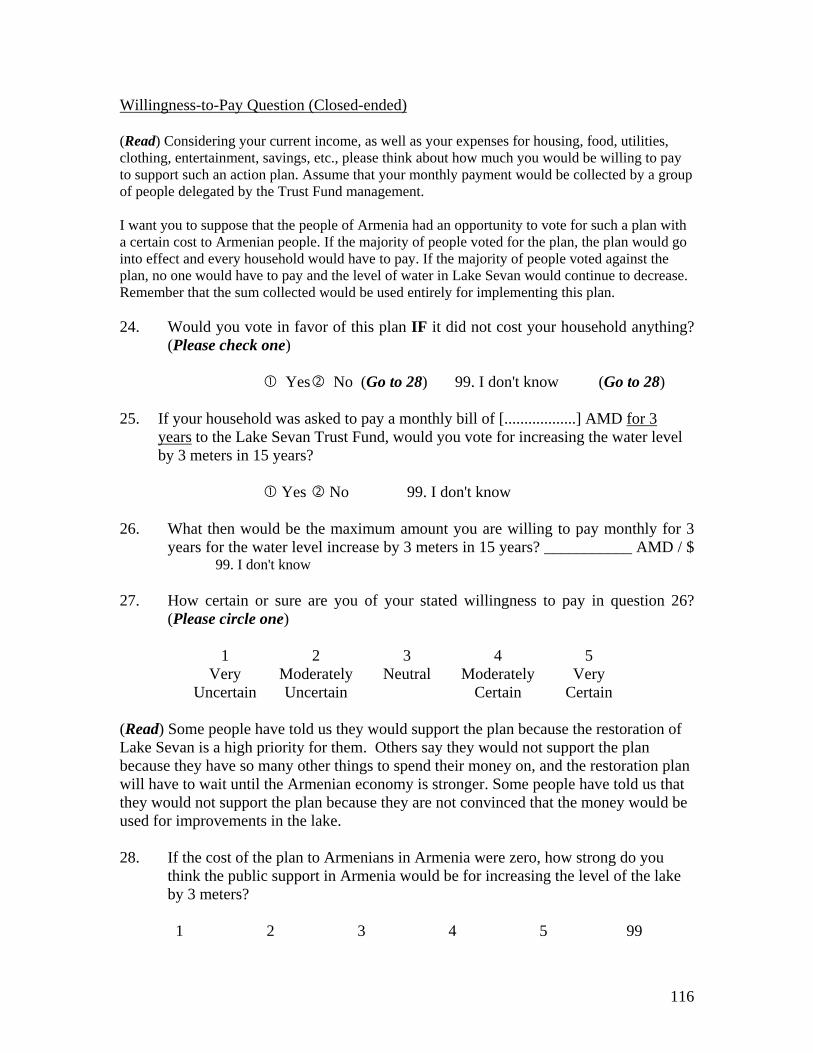
Willingness-to-Pay Question (Closed-ended) (Read) Considering your current income, as well as your expenses for housing, food, utilities, clothing, entertainment, savings, etc., please think about how much you would be willing to pay to support such an action plan. Assume that your monthly payment would be collected by a group of people delegated by the Trust Fund management. I want you to suppose that the people of Armenia had an opportunity to vote for such a plan with a certain cost to Armenian people. If the majority of people voted for the plan, the plan would go into effect and every household would have to pay. If the majority of people voted against the plan, no one would have to pay and the level of water in Lake Sevan would continue to decrease. Remember that the sum collected would be used entirely for implementing this plan. 24. Would you vote in favor of this plan IF it did not cost your household anything?
(Please check one) Yes No (Go to 28) 99. I don't know (Go to 28) 25. If your household was asked to pay a monthly bill of [..................] AMD for 3
years to the Lake Sevan Trust Fund, would you vote for increasing the water level by 3 meters in 15 years?
Yes No 99. I don't know 26. What then would be the maximum amount you are willing to pay monthly for 3
years for the water level increase by 3 meters in 15 years? ___________ AMD / $ 99. I don't know
27. How certain or sure are you of your stated willingness to pay in question 26?
(Please circle one)
1 2 3 4 5 Very Moderately Neutral Moderately Very
Uncertain Uncertain Certain Certain (Read) Some people have told us they would support the plan because the restoration of Lake Sevan is a high priority for them. Others say they would not support the plan because they have so many other things to spend their money on, and the restoration plan will have to wait until the Armenian economy is stronger. Some people have told us that they would not support the plan because they are not convinced that the money would be used for improvements in the lake. 28. If the cost of the plan to Armenians in Armenia were zero, how strong do you
think the public support in Armenia would be for increasing the level of the lake by 3 meters?
1 2 3 4 5 99
116
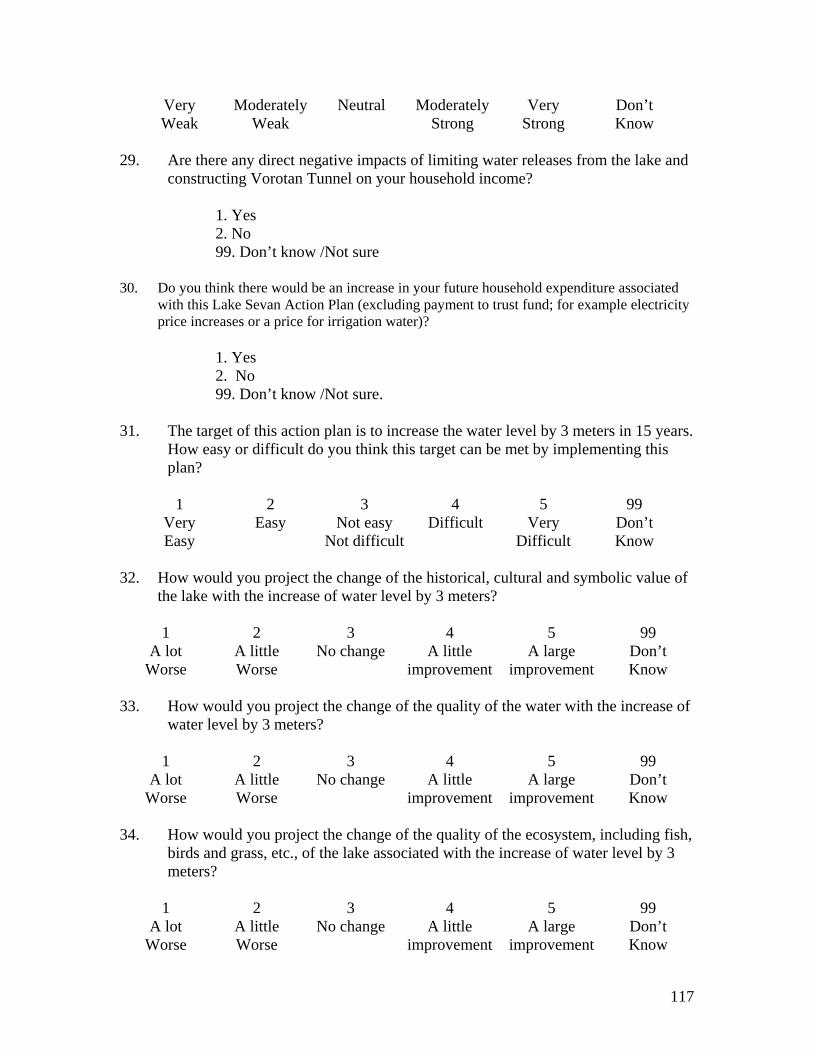
Very Moderately Neutral Moderately Very Don’t Weak Weak Strong Strong Know
29. Are there any direct negative impacts of limiting water releases from the lake and
constructing Vorotan Tunnel on your household income? 1. Yes 2. No 99. Don’t know /Not sure 30. Do you think there would be an increase in your future household expenditure associated
with this Lake Sevan Action Plan (excluding payment to trust fund; for example electricity price increases or a price for irrigation water)?
1. Yes 2. No 99. Don’t know /Not sure. 31. The target of this action plan is to increase the water level by 3 meters in 15 years.
How easy or difficult do you think this target can be met by implementing this plan?
1 2 3 4 5 99
Very Easy Not easy Difficult Very Don’t Easy Not difficult Difficult Know
32. How would you project the change of the historical, cultural and symbolic value of
the lake with the increase of water level by 3 meters?
1 2 3 4 5 99 A lot
Worse A little Worse
No change A little improvement
A large improvement
Don’t Know
33. How would you project the change of the quality of the water with the increase of
water level by 3 meters?
1 2 3 4 5 99 A lot
Worse A little Worse
No change A little improvement
A large improvement
Don’t Know
34. How would you project the change of the quality of the ecosystem, including fish,
birds and grass, etc., of the lake associated with the increase of water level by 3 meters?
1 2 3 4 5 99
A lot Worse
A little Worse
No change A little improvement
A large improvement
Don’t Know
117

35. How would you project the change of the quality of the lake for recreational use
that may be associated with the increase of water level by 3 meters?
1 2 3 4 5 99 A lot
Worse A little Worse
No change A little improvement
A large improvement
Don’t Know
36. Are there any possible direct damages to your household, economically, with the
increase of water level by 3 meters (for example some properties may be damaged by the increase)?
1. Yes, a lot 2. Yes, a little
3. No 99. Don’t know
37. Do you think that the governing board of the Trust Fund as we described before
can do a good job in managing the implementation of the action plan?
1 2 3 4 5 99 No
Surely No
To some extent
Neutral Yes To some
extent
Yes Surely
Don’t Know
38. How realistic do you think it is for the trust fund management to collect monthly
payments as you may have agreed? 1. No problem, it can be collected 2. There will be some problems, but still possible 3. There will be a lot of problems and it is not realistic 99. Don’t know 39. Do you think that if the action plan were to be implemented only by the Armenian
government, it can be appropriately implemented?
1 2 3 4 5 99 No
Surely No
To some extent
Neutral Yes To some
extent
Yes Surely
Don’t Know
40. With your understanding of the current situation in Armenia, do you think that the
action plan as we described before can be finally implemented?
1 2 3 4 5 99 No
Surely No
To some Neutral Yes
To some Yes
Surely Don’t Know
118
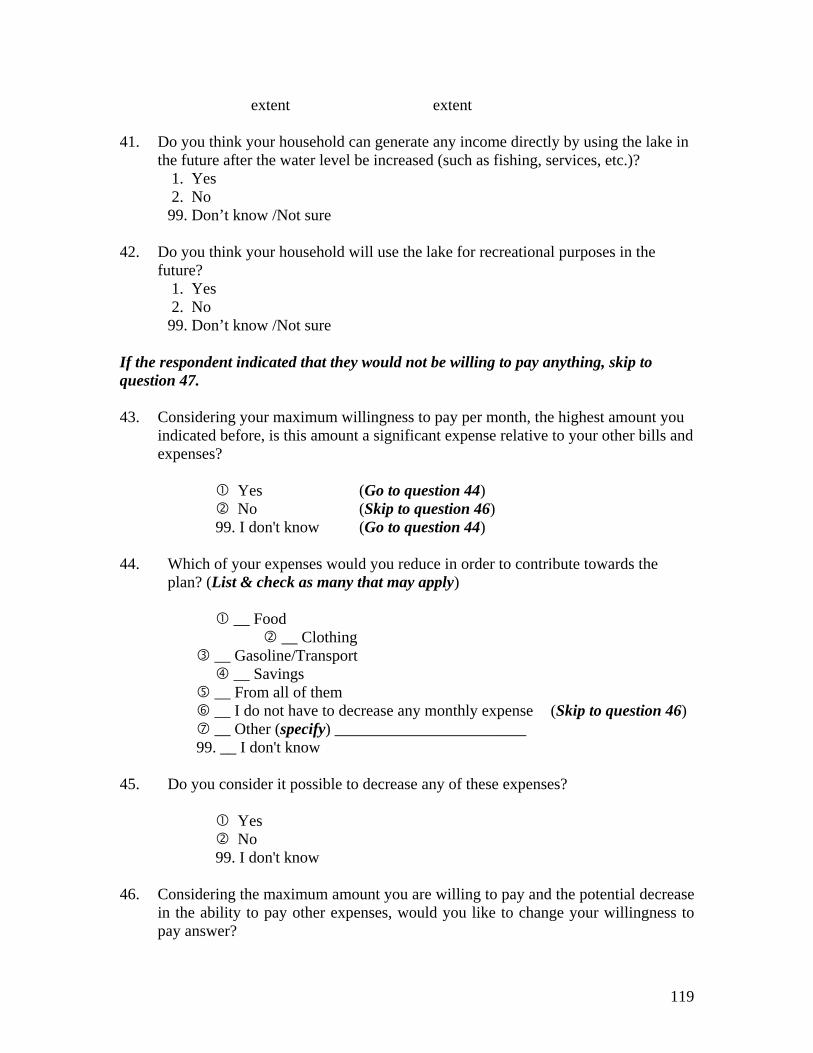
extent extent 41. Do you think your household can generate any income directly by using the lake in
the future after the water level be increased (such as fishing, services, etc.)? 1. Yes 2. No 99. Don’t know /Not sure 42. Do you think your household will use the lake for recreational purposes in the
future? 1. Yes 2. No 99. Don’t know /Not sure If the respondent indicated that they would not be willing to pay anything, skip to question 47. 43. Considering your maximum willingness to pay per month, the highest amount you
indicated before, is this amount a significant expense relative to your other bills and expenses?
Yes (Go to question 44) No (Skip to question 46)
99. I don't know (Go to question 44) 44. Which of your expenses would you reduce in order to contribute towards the
plan? (List & check as many that may apply) __ Food
__ Clothing __ Gasoline/Transport
__ Savings __ From all of them __ I do not have to decrease any monthly expense (Skip to question 46) __ Other (specify) ________________________
99. __ I don't know 45. Do you consider it possible to decrease any of these expenses?
Yes No
99. I don't know 46. Considering the maximum amount you are willing to pay and the potential decrease
in the ability to pay other expenses, would you like to change your willingness to pay answer?
119

Yes (Go back to question 26 and repeat the question) No (Go to question 47)
99. I don't know (Go to question 47) 47. What are those major factors determining the maximum amount you are willing to
pay for the Lake Sevan action plan? (even if your willingness to pay is zero) __________________________________________________________________ __________________________________________________________________ 48. Please make a list of additional information that you would require before making
your choice on how to vote (For example, if you have any uncertainty about the plan, any environmental impacts, the trust fund, etc). _________________________________________________________________________________________________________________________________________________________________________________________________
0. I don’t need (Go to question 50) 99. I don't know (Go to question 50) 49. If we were able to provide more information on the items you listed above, would
you be more certain about your willingness to pay or make your decision any easier?
Yes No 99. I don't know
IV. Socio-economic Characteristics 50. Gender of respondent: Male Female 51. What is your age?______ years 52. How many people stay and reside in your household in total (including yourself)? _____ 53. How many adults stay and reside in your household (18+ years)? _______ 54. How many people in this household have paid jobs? _____ 55. What is the highest level of education that you have completed? (Please check
one) __ None __ Incomplete secondary school __ Completed secondary school __ Professional technical education __ Institute / University __ Postgraduate
120
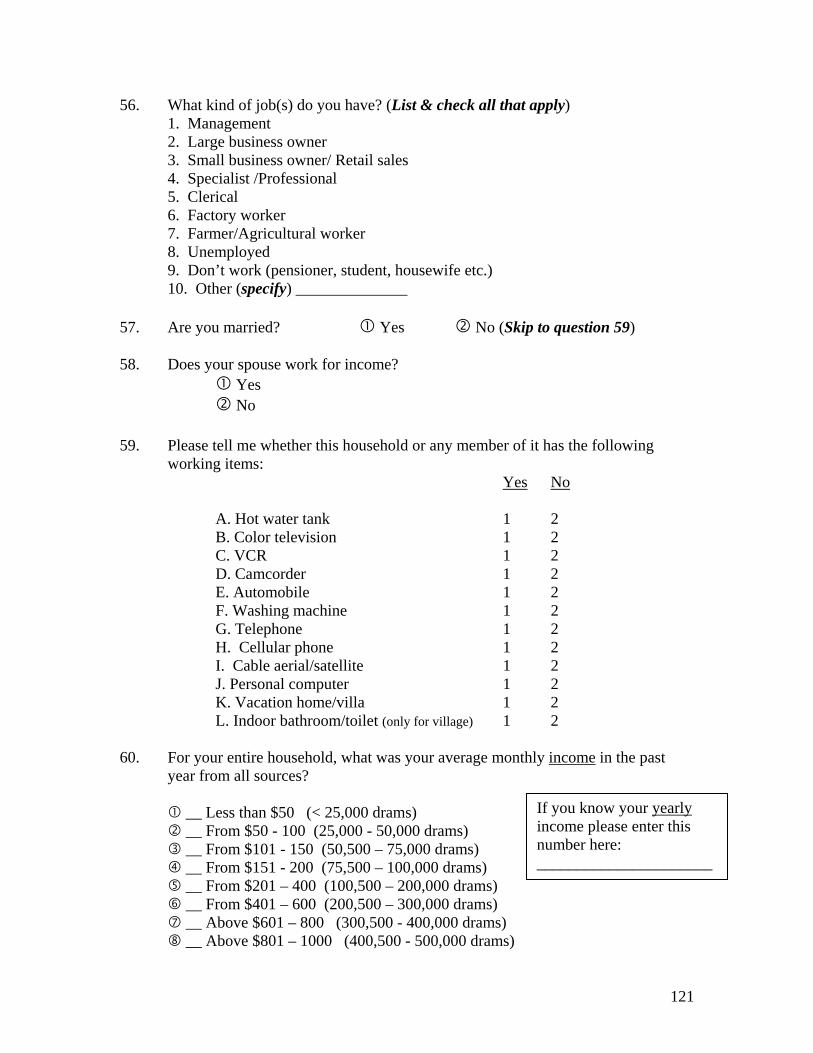
56. What kind of job(s) do you have? (List & check all that apply) 1. Management 2. Large business owner 3. Small business owner/ Retail sales 4. Specialist /Professional 5. Clerical 6. Factory worker 7. Farmer/Agricultural worker 8. Unemployed 9. Don’t work (pensioner, student, housewife etc.) 10. Other (specify) ______________
57. Are you married? Yes No (Skip to question 59) 58. Does your spouse work for income? Yes No 59. Please tell me whether this household or any member of it has the following
working items: Yes No A. Hot water tank 1 2 B. Color television 1 2 C. VCR 1 2 D. Camcorder 1 2 E. Automobile 1 2 F. Washing machine 1 2 G. Telephone 1 2 H. Cellular phone 1 2 I. Cable aerial/satellite 1 2 J. Personal computer 1 2 K. Vacation home/villa 1 2 L. Indoor bathroom/toilet (only for village) 1 2
60. For your entire household, what was your average monthly income in the past
year from all sources?
If you know your yearly income please enter this number here: ______________________
__ Less than $50 (< 25,000 drams) __ From $50 - 100 (25,000 - 50,000 drams) __ From $101 - 150 (50,500 – 75,000 drams) __ From $151 - 200 (75,500 – 100,000 drams) __ From $201 – 400 (100,500 – 200,000 drams) __ From $401 – 600 (200,500 – 300,000 drams) __ Above $601 – 800 (300,500 - 400,000 drams) __ Above $801 – 1000 (400,500 - 500,000 drams)
121
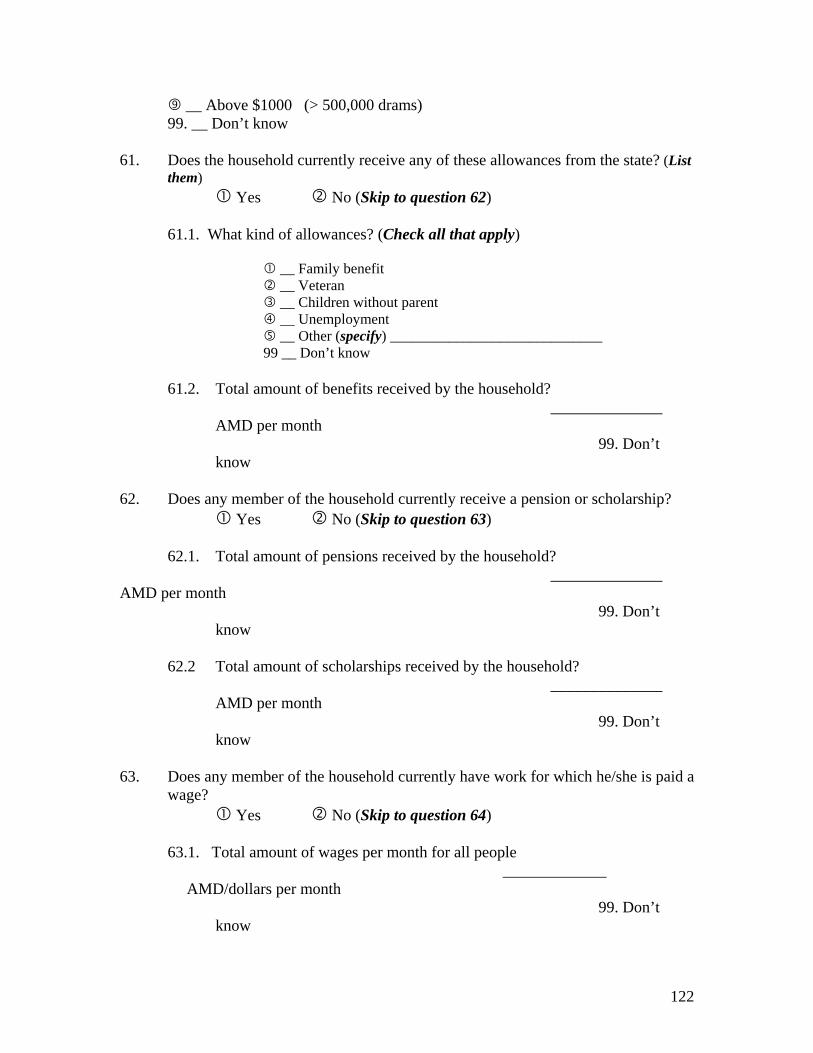
__ Above $1000 (> 500,000 drams) 99. __ Don’t know
61. Does the household currently receive any of these allowances from the state? (List
them) Yes No (Skip to question 62) 61.1. What kind of allowances? (Check all that apply) __ Family benefit __ Veteran __ Children without parent __ Unemployment __ Other (specify) _____________________________ 99 __ Don’t know 61.2. Total amount of benefits received by the household?
______________ AMD per month 99. Don’t know
62. Does any member of the household currently receive a pension or scholarship? Yes No (Skip to question 63) 62.1. Total amount of pensions received by the household? ______________ AMD per month
99. Don’t know
62.2 Total amount of scholarships received by the household?
______________ AMD per month 99. Don’t know
63. Does any member of the household currently have work for which he/she is paid a
wage? Yes No (Skip to question 64) 63.1. Total amount of wages per month for all people
_____________ AMD/dollars per month
99. Don’t know
122

64. Did your household receive money or other assistance from a spouse living abroad, relatives or friends (including those living overseas)?
Yes No (Skip to question 65) 64.1.What is the value of this assistance (including cash, gifts, or other assistance)
______________ AMD/dollars in last year 99. Don’t know
65. Does your household have any other income (temporary work, agricultural sales, own business, rent out, seasonal income, sales of property, etc.)?
Yes No (Skip to question 66)
65.1. Amount last year ________________AMD/dollars 99. Don’t know
66. For your entire household, what were your total expenditures in the past month?
1. Less than $10 (< 5,000 drams) 2. $10 - 50 (5,000 - 25,000 drams) 3. $51 - 75 (25,500 - 37,500 drams) 4. $76 - 100 (38,000 - 50,000 drams) 5. $101 - 200 (50,500 - 100,000 drams) 6. $201 - 300 (100,500 - 150,000 drams) 7. $301 - 500 (150,500 - 250,000 drams) 8. Above $500 (> 250,000 drams) 99. Don’t know
67. Is your household income enough for your family needs? No, far from enough for basic needs; Just enough for food; Enough for food and clothing Enough for a good quality of life With the income, we can have some savings 99. Don’t know 68. How did your total household income change from the year before?
1 2 3 4 5 99 Significantly
worsened Worsened No change Improved Significantly
Improved Don’t Know
69. How would you describe the quality of your living condition relative to others in your
city/village?
1 2 3 4 5 99
123
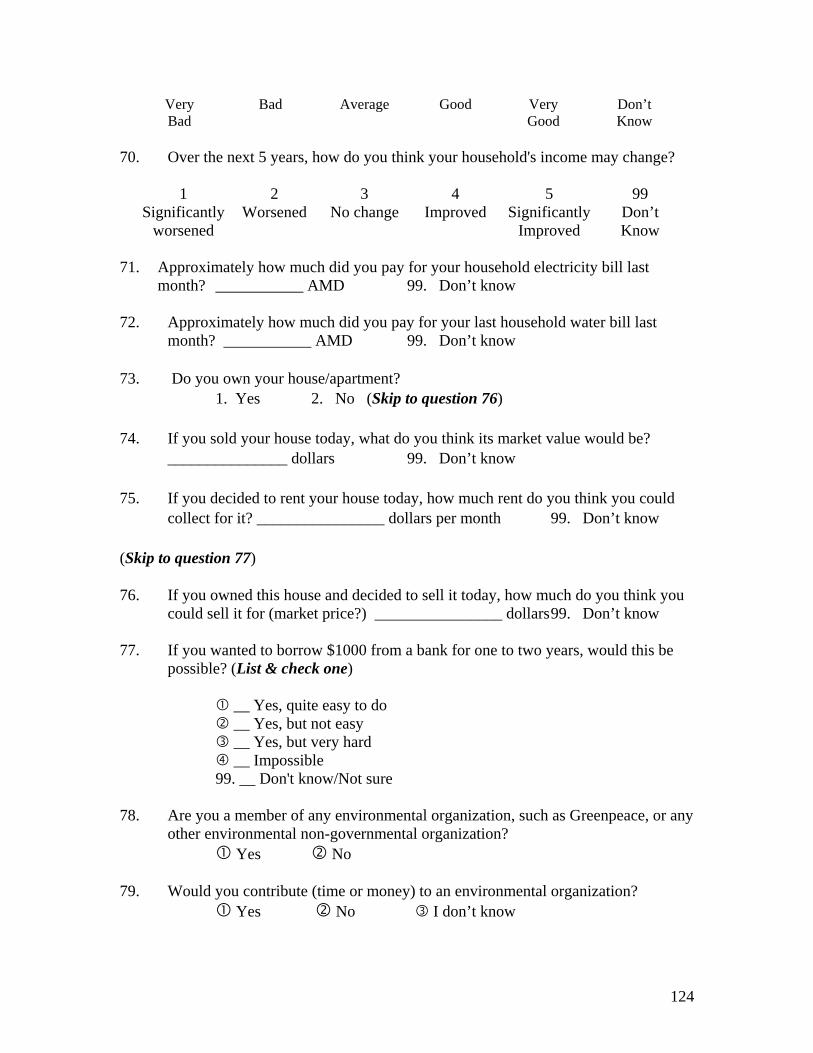
Very Bad Average Good Very Don’t Bad Good Know
70. Over the next 5 years, how do you think your household's income may change?
1 2 3 4 5 99 Significantly
worsened Worsened No change Improved Significantly
Improved Don’t Know
71. Approximately how much did you pay for your household electricity bill last
month? ___________ AMD 99. Don’t know 72. Approximately how much did you pay for your last household water bill last
month? ___________ AMD 99. Don’t know 73. Do you own your house/apartment? 1. Yes 2. No (Skip to question 76) 74. If you sold your house today, what do you think its market value would be? _______________ dollars 99. Don’t know 75. If you decided to rent your house today, how much rent do you think you could
collect for it? ________________ dollars per month 99. Don’t know (Skip to question 77) 76. If you owned this house and decided to sell it today, how much do you think you
could sell it for (market price?) ________________ dollars 99. Don’t know 77. If you wanted to borrow $1000 from a bank for one to two years, would this be
possible? (List & check one)
__ Yes, quite easy to do __ Yes, but not easy __ Yes, but very hard __ Impossible
99. __ Don't know/Not sure 78. Are you a member of any environmental organization, such as Greenpeace, or any
other environmental non-governmental organization? Yes No
79. Would you contribute (time or money) to an environmental organization? Yes No I don’t know
124
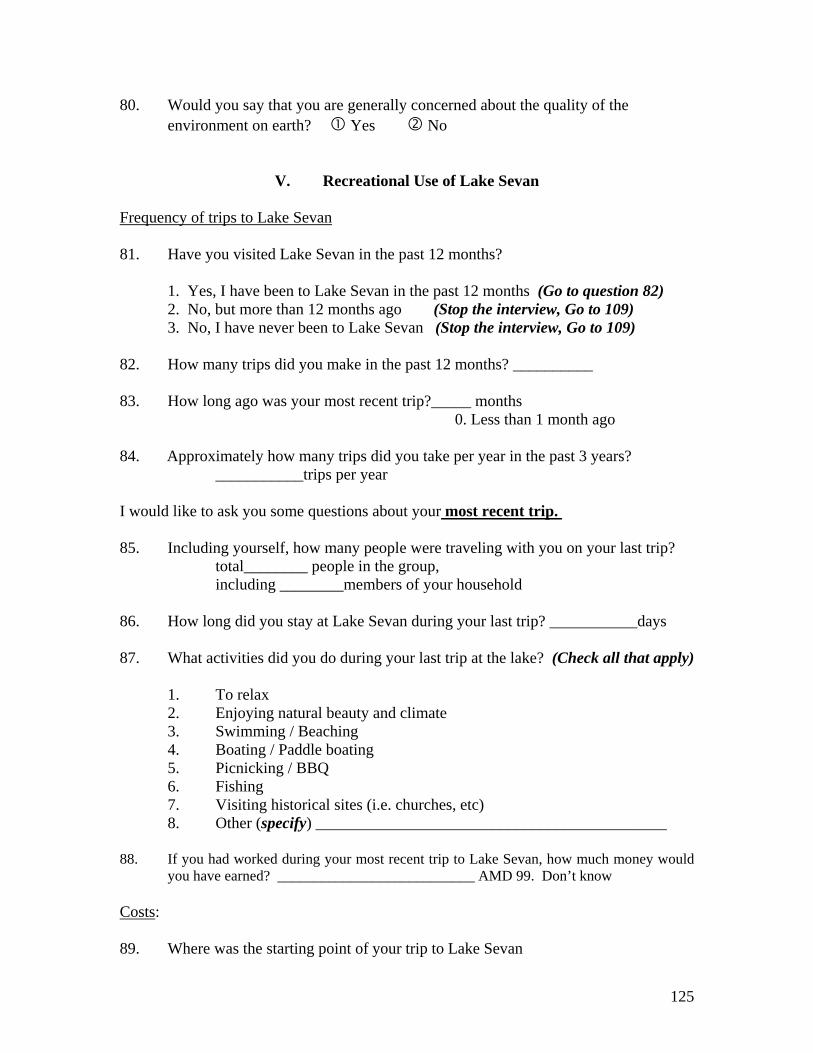
80. Would you say that you are generally concerned about the quality of the environment on earth? Yes No
V. Recreational Use of Lake Sevan Frequency of trips to Lake Sevan 81. Have you visited Lake Sevan in the past 12 months? 1. Yes, I have been to Lake Sevan in the past 12 months (Go to question 82)
2. No, but more than 12 months ago (Stop the interview, Go to 109) 3. No, I have never been to Lake Sevan (Stop the interview, Go to 109)
82. How many trips did you make in the past 12 months? __________ 83. How long ago was your most recent trip?_____ months 0. Less than 1 month ago
84. Approximately how many trips did you take per year in the past 3 years? ___________trips per year I would like to ask you some questions about your most recent trip. 85. Including yourself, how many people were traveling with you on your last trip? total________ people in the group, including ________members of your household 86. How long did you stay at Lake Sevan during your last trip? ___________days 87. What activities did you do during your last trip at the lake? (Check all that apply)
1. To relax 2. Enjoying natural beauty and climate 3. Swimming / Beaching 4. Boating / Paddle boating 5. Picnicking / BBQ 6. Fishing 7. Visiting historical sites (i.e. churches, etc) 8. Other (specify) ____________________________________________
88. If you had worked during your most recent trip to Lake Sevan, how much money would
you have earned? ___________________________ AMD 99. Don’t know Costs: 89. Where was the starting point of your trip to Lake Sevan
125
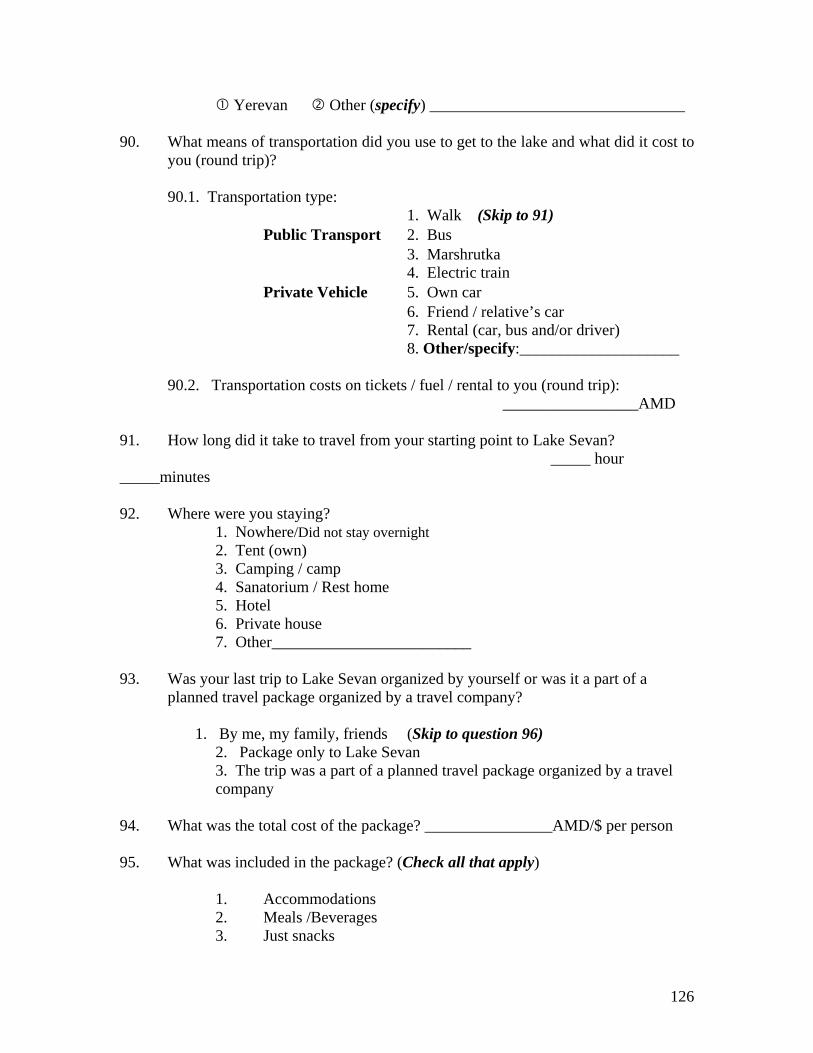
Yerevan Other (specify) ________________________________ 90. What means of transportation did you use to get to the lake and what did it cost to
you (round trip)? 90.1. Transportation type:
1. Walk (Skip to 91) Public Transport 2. Bus
3. Marshrutka 4. Electric train Private Vehicle 5. Own car 6. Friend / relative’s car 7. Rental (car, bus and/or driver) 8. Other/specify:____________________
90.2. Transportation costs on tickets / fuel / rental to you (round trip): _________________AMD 91. How long did it take to travel from your starting point to Lake Sevan? _____ hour _____minutes 92. Where were you staying? 1. Nowhere/Did not stay overnight 2. Tent (own) 3. Camping / camp 4. Sanatorium / Rest home 5. Hotel 6. Private house 7. Other_________________________ 93. Was your last trip to Lake Sevan organized by yourself or was it a part of a
planned travel package organized by a travel company? 1. By me, my family, friends (Skip to question 96) 2. Package only to Lake Sevan 3. The trip was a part of a planned travel package organized by a travel company 94. What was the total cost of the package? ________________AMD/$ per person
95. What was included in the package? (Check all that apply) 1. Accommodations 2. Meals /Beverages 3. Just snacks
126
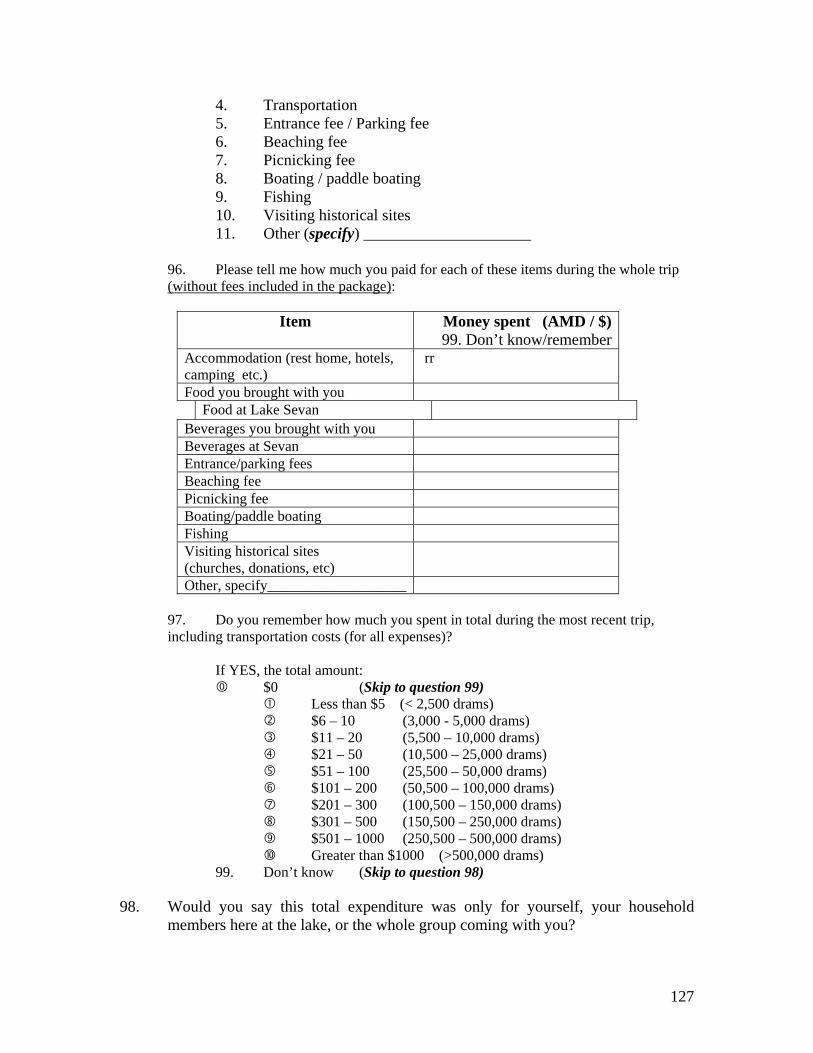
4. Transportation 5. Entrance fee / Parking fee 6. Beaching fee 7. Picnicking fee 8. Boating / paddle boating 9. Fishing 10. Visiting historical sites 11. Other (specify) _____________________
96. Please tell me how much you paid for each of these items during the whole trip (without fees included in the package):
Item Money spent (AMD / $) 99. Don’t know/remember
Accommodation (rest home, hotels, camping etc.)
rr
Food you brought with you Food at Lake Sevan
Beverages you brought with you Beverages at Sevan Entrance/parking fees Beaching fee Picnicking fee Boating/paddle boating Fishing Visiting historical sites (churches, donations, etc)
Other, specify___________________
97. Do you remember how much you spent in total during the most recent trip, including transportation costs (for all expenses)?
If YES, the total amount:
$0 (Skip to question 99) Less than $5 (< 2,500 drams) $6 – 10 (3,000 - 5,000 drams) $11 – 20 (5,500 – 10,000 drams) $21 – 50 (10,500 – 25,000 drams) $51 – 100 (25,500 – 50,000 drams) $101 – 200 (50,500 – 100,000 drams) $201 – 300 (100,500 – 150,000 drams) $301 – 500 (150,500 – 250,000 drams) $501 – 1000 (250,500 – 500,000 drams) Greater than $1000 (>500,000 drams) 99. Don’t know (Skip to question 98) 98. Would you say this total expenditure was only for yourself, your household
members here at the lake, or the whole group coming with you?
127
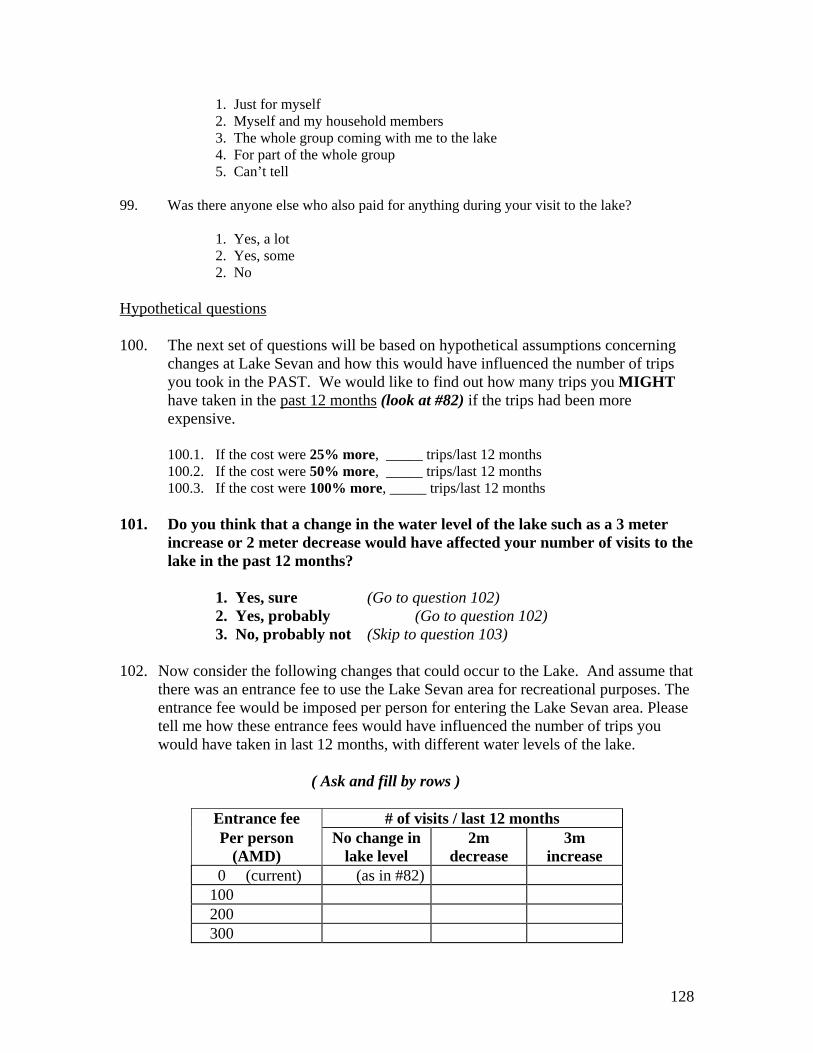
1. Just for myself 2. Myself and my household members 3. The whole group coming with me to the lake 4. For part of the whole group 5. Can’t tell 99. Was there anyone else who also paid for anything during your visit to the lake? 1. Yes, a lot 2. Yes, some 2. No Hypothetical questions 100. The next set of questions will be based on hypothetical assumptions concerning
changes at Lake Sevan and how this would have influenced the number of trips you took in the PAST. We would like to find out how many trips you MIGHT have taken in the past 12 months (look at #82) if the trips had been more expensive.
100.1. If the cost were 25% more, _____ trips/last 12 months 100.2. If the cost were 50% more, _____ trips/last 12 months 100.3. If the cost were 100% more, _____ trips/last 12 months 101. Do you think that a change in the water level of the lake such as a 3 meter
increase or 2 meter decrease would have affected your number of visits to the lake in the past 12 months?
1. Yes, sure (Go to question 102) 2. Yes, probably (Go to question 102) 3. No, probably not (Skip to question 103) 102. Now consider the following changes that could occur to the Lake. And assume that
there was an entrance fee to use the Lake Sevan area for recreational purposes. The entrance fee would be imposed per person for entering the Lake Sevan area. Please tell me how these entrance fees would have influenced the number of trips you would have taken in last 12 months, with different water levels of the lake.
( Ask and fill by rows )
Entrance fee # of visits / last 12 months Per person
(AMD) No change in
lake level 2m
decrease 3m
increase 0 (current) (as in #82) 100 200 300
128
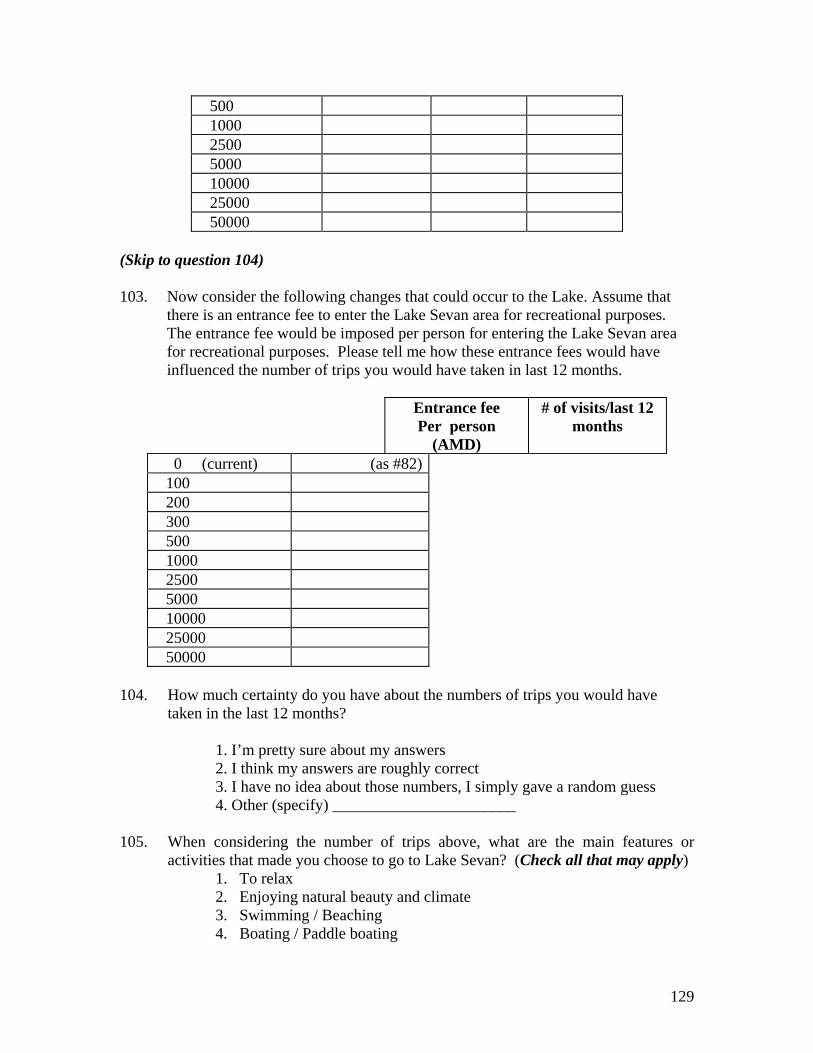
500 1000 2500 5000 10000 25000 50000
(Skip to question 104) 103. Now consider the following changes that could occur to the Lake. Assume that
there is an entrance fee to enter the Lake Sevan area for recreational purposes. The entrance fee would be imposed per person for entering the Lake Sevan area for recreational purposes. Please tell me how these entrance fees would have influenced the number of trips you would have taken in last 12 months.
Entrance fee Per person
(AMD)
# of visits/last 12 months
0 (current) (as #82) 100 200 300 500 1000 2500 5000 10000 25000 50000
104. How much certainty do you have about the numbers of trips you would have
taken in the last 12 months? 1. I’m pretty sure about my answers 2. I think my answers are roughly correct 3. I have no idea about those numbers, I simply gave a random guess 4. Other (specify) _______________________ 105. When considering the number of trips above, what are the main features or
activities that made you choose to go to Lake Sevan? (Check all that may apply) 1. To relax 2. Enjoying natural beauty and climate 3. Swimming / Beaching 4. Boating / Paddle boating
129

5. Picnicking / BBQ 6. Fishing 7. Visiting historical sites (i.e. churches, etc) 8. Other (specify) ____________________________
Future visits: 106. If the level of the lake were to rise by 3 meters, do you think this would affect your
decision to visit Lake Sevan in the future? 1. Yes 2. No (Go to question 108) 99. Don’t know (Go to question 108)
107. How many trips would you plan on taking in the next 12 months assuming the
imagined changes in Lake conditions occur very quickly after the water's rise? _______ trips in the next 12 months 99. Don’t know 108. Which future activities do you think the increase will affect the most and what way?
Affect of the quality of each item Activities Worse Same Better N/A
Dknow Relax 1 2 3 99 Enjoying natural beauty and climate 1 2 3 99 Swimming/beaching 1 2 3 99 Boating 1 2 3 99 Picnicking 1 2 3 99 Fishing 1 2 3 99 Visiting historical sites 1 2 3 99 Other/specify:_________________ 1 2 3 99 Thank the respondent for his/her participation and provide the incentive.
VI. Interviewer Debriefing Questions 109. Was the person who answered the questions irritated or nervous during the
interview? Yes No
110. Do you think that it was easy for the respondent to answer the questions
concerning number of visits regarding entrance fees and lake level changes? Yes No NA/Missing
130

111. Was the person who answered the questions looking bored or tired during the interview?
Yes No 112. Are you certain that the interviewee was answering to the questions honestly and
truly? 1 2 3 4 5
Very Moderately Neutral Moderately Very Uncertain Uncertain Certain Certain
113. Who else was listening while you conducted this interview with the respondent?
(Check all that apply) No one Spouse Other adult family members Other adults Children Other (specify) ________________________
Time finished: _____ : _____ Data entry operator ____________
131