Convenience and Safety of Walking Experience in Putrajaya Neighbourhood Area
10
Procedia - Social and Behavioral Sciences 101 (2013) 318 – 327 1877-0428 © 2013 The Authors. Published by Elsevier Ltd. Selection and/or peer-review under responsibility of the Association of Malaysian Environment-Behavior Researchers, AMER (ABRA malaysia). doi:10.1016/j.sbspro.2013.07.206 ScienceDirect AicQoL 2013 Langkawi AMER International Conference on Quality of Life Holiday Villa Beach Resort & Spa, Langkawi, Malaysia, 6-8 April 2013 "Quality of Life in the Built and Natural Environment" Convenience and Safety of Walking Experience in Putrajaya Neighbourhood Area Hafazah Abdul Karim a , Diyanah Inani Azmi b* a Centre for Town and Regional Planning Studies a,b Centre for Environment-Behaviour Studies Universiti Teknologi MARA, Shah Alam 40450, Malaysia Abstract Walking experience is one of the important components in measuring the walkability of neighbourhood area. There are two main components in measuring walking experience which are (1) safety and security; (2) convenience and attractiveness. The objective of this paper is to identify the reliability of walking experience variable in relation to walkability in two different urban neighbourhoods in Putrajaya. The data was gathered by using the questionnaire survey and analysed by the internal consistency and correlation analysis. The findings of this study will show the final items used for walking experience in determining the walkability level of a neighbourhood area. Keywords: Walking experiences; Putrajaya; C 1. Introduction Walking experience can be attained through walking activities. Walking activities can be considered as one category of physical activities. provided by skeletal muscles that result (Brouchard and Shepard 1994). Physical activity can occur in various forms and contexts (Malina and Bielicki 1996). different category of physical activities. Activities that taking place in the public environment are shaped by * Corresponding author. Tel.:+6012-6670274; fax: 03 55444353. E-mail address: [email protected]. Available online at www.sciencedirect.com © 2013 The Authors. Published by Elsevier Ltd. Selection and/or peer-review under responsibility of the Association of Malaysian Environment-Behavior Researchers, AMER (ABRA malaysia).
Transcript of Convenience and Safety of Walking Experience in Putrajaya Neighbourhood Area
Procedia - Social and Behavioral Sciences 101 ( 2013 ) 318 – 327
1877-0428 © 2013 The Authors. Published by Elsevier Ltd.Selection and/or peer-review under responsibility of the Association of Malaysian Environment-Behavior Researchers, AMER (ABRA malaysia).doi: 10.1016/j.sbspro.2013.07.206
ScienceDirect
AicQoL 2013 Langkawi AMER International Conference on Quality of Life
Holiday Villa Beach Resort & Spa, Langkawi, Malaysia, 6-8 April 2013 "Quality of Life in the Built and Natural Environment"
Convenience and Safety of Walking Experience in Putrajaya Neighbourhood Area
Hafazah Abdul Karima, Diyanah Inani Azmib* aCentre for Town and Regional Planning Studies
a,b Centre for Environment-Behaviour Studies Universiti Teknologi MARA, Shah Alam 40450, Malaysia
Abstract
Walking experience is one of the important components in measuring the walkability of neighbourhood area. There are two main components in measuring walking experience which are (1) safety and security; (2) convenience and attractiveness. The objective of this paper is to identify the reliability of walking experience variable in relation to walkability in two different urban neighbourhoods in Putrajaya. The data was gathered by using the questionnaire survey and analysed by the internal consistency and correlation analysis. The findings of this study will show the final items used for walking experience in determining the walkability level of a neighbourhood area. © 2013 The Authors. Published by Elsevier Ltd. Selection and peer-review under responsibility of the Association of Malaysian Environment-Behaviour Researchers, AMER (ABRA Malaysia).
Keywords: Walking experiences; Putrajaya; C
1. Introduction
Walking experience can be attained through walking activities. Walking activities can be considered as one category of physical activities. provided by skeletal muscles that result (Brouchard and Shepard 1994). Physical activity can occur in various forms and contexts (Malina and Bielicki 1996). different category of physical activities. Activities that taking place in the public environment are shaped by
* Corresponding author. Tel.:+6012-6670274; fax: 03 55444353. E-mail address: [email protected].
Available online at www.sciencedirect.com
© 2013 The Authors. Published by Elsevier Ltd.Selection and/or peer-review under responsibility of the Association of Malaysian Environment-Behavior Researchers, AMER (ABRA malaysia).
319 Hafazah Abdul Karim and Diyanah Inani Azmi / Procedia - Social and Behavioral Sciences 101 ( 2013 ) 318 – 327
different factors than activities occurring within private territories. For example in public environment, the presence or absence of sidewalks can determine the individual decision to walk in the neighbourhood. Moreover, physical activities in public environments also tend to be affected by the urban morphology of the site, the neighbourhood, and the metropolitan area (Handy et al. 2002). Neighbourhood setting has the potential to host a multitude of physical activities. In United States, studies done by Brownson et.al (2001) showed that the majority of respondent identified neighbourhood streets as the setting where they engage in physical activity. This indicated that neighbourhood can present environment constraints and opportunities to encourage people engaged with physical activity especially walking. Unfortunately, this also depends on the neighbourhood characteristic. Neighbourhood with high physical and social disorder can generates stress and fear as it can affect behaviour because people who are fearful of street crime are likely to constrain their outdoor activities (Ross 1993; Ross and Mirowski 2001; Klinenberg 2002). Conversely, quiet, safe and clean neighbourhood can invite outdoor activity. Significantly, walking activities take place in the local environment of neighbourhood streets; the activities are greatly influenced by the neighbourhood context. Studies done by (Hovell et al. 1989; Brownson et al. 2001; Craig et al. 2002), point out that there is a positive association between the neighbourhood environment and physical activity. A number of recent empirical studies have tried to establish which variables are more significant determinants of physical activity under specific sociodemographic and physical conditions. The associations documented between physical activity and environmental variables have been stronger with objective environmental variables than with self-reported and perceived environmental variables (Ball et al. 2001).
2. Walking experience
Experience is the apprehension of an object, thought, or emotion through the senses or mind. Based on Untermann (1985), good walking experience can be achieved by improving safety, convenience and pleasure. Studies by Saelens, B.E et. al (2002), developed Neighbourhood Environmental Walkability Scale(NEWS) assesses residents' perception of neighbourhood design features related to physical activity, including 1) residential density, 2) land use mix - including both indices of proximity and accessibility, 4) street connectivity, 5) infrastructure for walking/cycling, 6) neighbourhood aesthetics, 7) traffic and crime safety, and 8) Neighbourhood satisfaction. Studies by Khisty (1994) found seven factors for increasing the walking activities at pedestrian facilities such as attractiveness, comfort and convenience, population density, mixed land use, safety, system coherence (directness) and continuity. Studies by Handy et. al (2002), underlying six dimensions of the built environment that can affect the choice of walking such as 1) density and intensity, 2) land use mix, 3) street connectivity- directness and availability of alternative routes, 4) street scale, 5) aesthetic qualities and 6) regional structure (distribution of activities and transportation throughout the region). Ball et.al (2001), suggested environment variable to be correlates with walking activities includes features of the local neighbourhood such as convenient facilities, presence of the shop and parks, more aesthetically favourable and safe environment. On the other hand, Giles-Corti and Donovan (2002), suggested that recreational physical activity seems to be influence by spatial access, convenience and neighbourhood safety. Therefore, it seems that from a study of the literature suggested environmental variables can influence an Environmental variables that emerge as predominantly important are 1) safety and security and 2) convenience and attractiveness.

320 Hafazah Abdul Karim and Diyanah Inani Azmi / Procedia - Social and Behavioral Sciences 101 ( 2013 ) 318 – 327
2.1. Safety and security
The element that need to be consider in improving the safe walk is the road design, traffic intensity and speed, the continually changing pedestrian environment, the physical and mental state of both pedestrian and drivers, weather condition and time of day. free from fear, care, danger, etc.; safety or a sense of safety; freedom from doubt or uncertainty; and
Logically, most would agree that if an environment is perceived as unsafe most of people would not want to walk. Studies by Baunman et al. (1996), found that perceived safety was one of the most important environmental qualities for walking. While, Hawthrone (1989) stated that safety from crime was one of the most appealing features for walking while dangerous street crossings were perceived as an unappealing factor. Studies by Weinstein et al. (1999) observed a higher prevalence of inactivity among those who perceived their neighbourhood as unsafe.
Other than that, elderly and handicapped people also have difficulties in crossing streets as signals often allow insufficient time for slow walker to cross the street which causes elderly to run the remaining distance. Fear of muggers and other street criminals is a concern to many potential walkers such as elderly, women and children which make them less walk and shift to automobile used. As a conclusion, there are various studies that explain the relationship between safety and walking. Based on Loukaiyou-Sideris (2001) point out that, some studies use neighbourhood safety as an independent or dependent variable. Others use a composition of outcome, measure which combines safety attributes with other physical and aesthetic characteristic of the neighbourhood. This study shall use the approached of combining the safety attributes with other physical and aesthetic characteristic which is convenience and attractiveness.
2.2. Convenience and attractiveness
Convenience can make people willing to walk which depends on directness, continuity and availability. Removing obstacles such as barriers and installing sidewalk none exist is the first step. Shortcuts routes are the best aids which will make people walk as it reduce walking distance, focusing on desirable location such as school, shopping, play and work. Other than that time to ½ second per foot of roadway width assures adequate time and freer movement. Walker can change direction and go around obstacles but not without a sense of disruption as walk with few barriers contributes to psychological well-being and walking pleasure, but barrier elimination also can speeds up traffic flow and increase the walking capacity. Auto travel has reduced the quality of many pedestrian areas and lengthened the walking distance necessary to accomplish daily activities. The shift also has reduced bus transportation making it difficult to live without a car. Shoppers who carry packages or tending children are not willing to walk more than 1,000 feet. Older people tired easily and not be able to walk a long distance. Other than that, construct an outstanding road network has been a factor in lowering the quality of the pedestrian system. When driver do not need to walk long distance, the need to developed good walkways disappears. In this paper, the aesthetic characteristic from Neighbourhood Environmental Walkability Scale (NEWS) by Saelens, B.E et. al (2002) is use to serve as the framework in developing the convenience and attractiveness attributes in this study.
3. Methodology
This paper aims to identify the reliability of walking experience variable in relation to walkability in two different urban neighbourhoods in Putrajaya. This paper is a pilot study of an on-going master
321 Hafazah Abdul Karim and Diyanah Inani Azmi / Procedia - Social and Behavioral Sciences 101 ( 2013 ) 318 – 327
research to identify a suitable variable that can be used in the study. This study is not limited to neighbourhood with different type of weather condition. The study is conducted in an urban neighbourhood area at Precinct 9 and Precinct 14 in Putrajaya. Putrajaya is a planned city, located 25km south of Kuala Lumpur, which serves as the federal administrative centre of Malaysia. A total of 30 respondents who live in Precinct 9 and Precinct 14 were randomly selected to answer the questionnaire survey. Respondents were 17 women and 13 men aged between 17-60 years. The sample size is considered as ample and adequate for this study. According Thomas (2004), suggested that the sample size for pilot survey within10 to 30 respondents depending on the complexity of the survey.
3.1. Research instrument
The survey conducted using a questionnaire about perceptions on the safety and security and convenience and attractiveness attributes which can influence them to walk from their home to community facilities or services provided within the walkable catchment identified. There are 13 questions for safety and security attributes and only 6 questions for convenience and attractiveness attributes. agreement on prescribed tasks. The respondents are required to state their agreement and disagreement on the listed attributes then rank each of them according to their preference on the rating scale 1 to 7, where 1 represent as strongly disagree, 2 as disagree, 3 as slightly disagree, 4 as moderate, 5 as slightly agree, 6 as agree and 7 represent as strongly disagree. The respondents required to rank their agreement and disagreement according to their preference of priority. Then the responses will be tabulated and analyzed using reliability test with the aid of Statistical Package for the Social Sciences (SPSS) software.
3.2. Data analysis
This master research consists of four main domains which are 1) Social Demographic Characteristic, 2) Neighbourhood Characteristic, 3) Walkability Characteristic and 4) Community Facilities Planning. This paper focuses only on walkability characteristic domains. There are two main variables in walkability characteristic domains which are 1) walking behaviour and 2) walking experience. This paper only covers one variable which is walking experience variable that consist of two main attributes such as 1) safety and security 2) convenience and attractiveness. A set of items were tabulated and clustered together for each of the prescribed main attributes (refer Table 1). Under safety and security attributes there are two sub-attributes which are personal safety and traffic safety while under convenience and attractiveness there is one sub-attributes which is neighbourhood surrounding. The items then were analysed using indicators of the reliability scales known as internal consistency. According to Pallant (2007), internal consistency is the degree to which the items that make up the scale are all measuring the same underlying attribute. The most pha, which will be used in this study. This statistic provides an indication of the average correlation among all of the items that make up rating scales. Values range from 0 to 1, with higher values indicating greater reliability.
322 Hafazah Abdul Karim and Diyanah Inani Azmi / Procedia - Social and Behavioral Sciences 101 ( 2013 ) 318 – 327
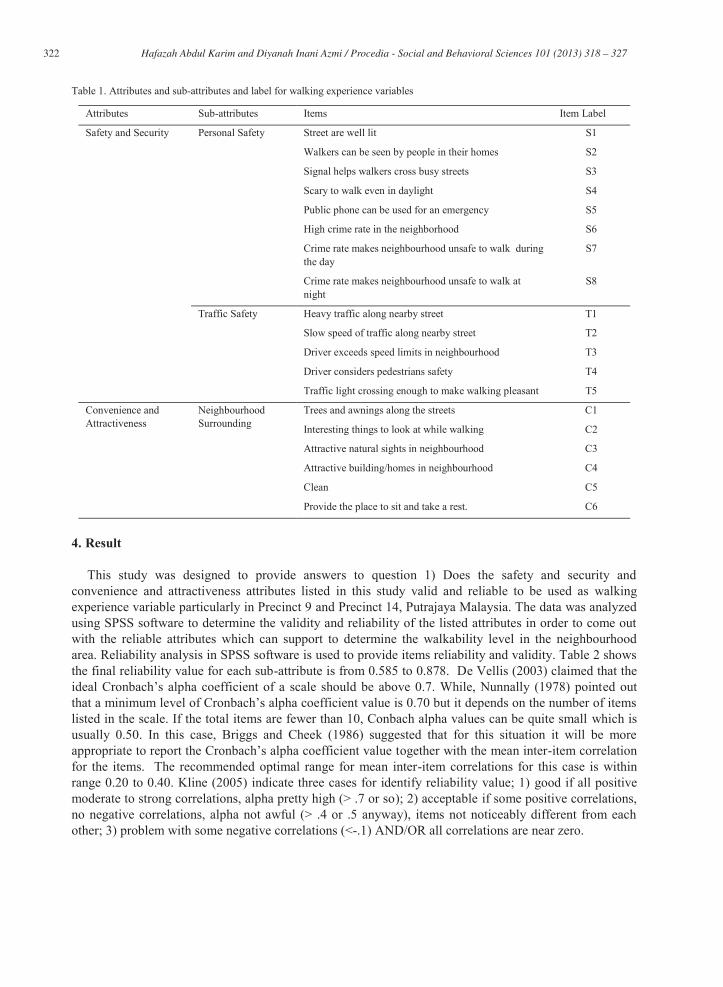
Table 1. Attributes and sub-attributes and label for walking experience variables
Attributes Sub-attributes Items Item Label
Safety and Security Personal Safety Street are well lit S1
Walkers can be seen by people in their homes S2
Signal helps walkers cross busy streets S3
Scary to walk even in daylight S4
Public phone can be used for an emergency S5
High crime rate in the neighborhood S6
Crime rate makes neighbourhood unsafe to walk during the day
S7
Crime rate makes neighbourhood unsafe to walk at night
S8
Traffic Safety Heavy traffic along nearby street T1
Slow speed of traffic along nearby street T2
Driver exceeds speed limits in neighbourhood T3
Driver considers pedestrians safety T4
Traffic light crossing enough to make walking pleasant T5
Convenience and Attractiveness
Neighbourhood Surrounding
Trees and awnings along the streets C1
Interesting things to look at while walking C2
Attractive natural sights in neighbourhood C3
Attractive building/homes in neighbourhood C4
Clean C5
Provide the place to sit and take a rest. C6
4. Result
This study was designed to provide answers to question 1) Does the safety and security and convenience and attractiveness attributes listed in this study valid and reliable to be used as walking experience variable particularly in Precinct 9 and Precinct 14, Putrajaya Malaysia. The data was analyzed using SPSS software to determine the validity and reliability of the listed attributes in order to come out with the reliable attributes which can support to determine the walkability level in the neighbourhood area. Reliability analysis in SPSS software is used to provide items reliability and validity. Table 2 shows the final reliability value for each sub-attribute is from 0.585 to 0.878. De Vellis (2003) claimed that the ideal ed out
listed in the scale. If the total items are fewer than 10, Conbach alpha values can be quite small which is usually 0.50. In this case, Briggs and Cheek (1986) suggested that for this situation it will be more
ogether with the mean inter-item correlation for the items. The recommended optimal range for mean inter-item correlations for this case is within range 0.20 to 0.40. Kline (2005) indicate three cases for identify reliability value; 1) good if all positive moderate to strong correlations, alpha pretty high (> .7 or so); 2) acceptable if some positive correlations, no negative correlations, alpha not awful (> .4 or .5 anyway), items not noticeably different from each other; 3) problem with some negative correlations (<-.1) AND/OR all correlations are near zero.
323 Hafazah Abdul Karim and Diyanah Inani Azmi / Procedia - Social and Behavioral Sciences 101 ( 2013 ) 318 – 327
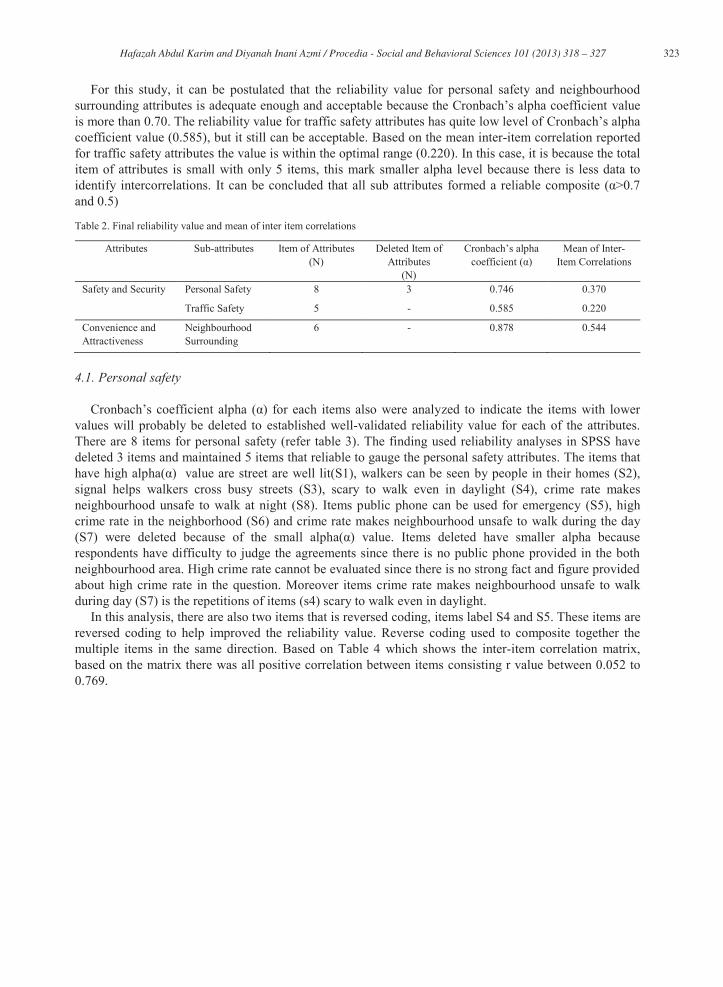
For this study, it can be postulated that the reliability value for personal safety and neighbourhood value
is more than 0.70. The reliability value for traffic safety attributes has quite low level of coefficient value (0.585), but it still can be acceptable. Based on the mean inter-item correlation reported for traffic safety attributes the value is within the optimal range (0.220). In this case, it is because the total item of attributes is small with only 5 items, this mark smaller alpha level because there is less data to identify intercorrelations. It can be concluded that all sub attributes and 0.5)
Table 2. Final reliability value and mean of inter item correlations
Attributes Sub-attributes Item of Attributes (N)
Deleted Item of Attributes
(N)
coefficient
Mean of Inter- Item Correlations
Safety and Security Personal Safety 8 3 0.746 0.370
Traffic Safety 5 - 0.585 0.220
Convenience and Attractiveness
Neighbourhood Surrounding
6 - 0.878 0.544
4.1. Personal safety
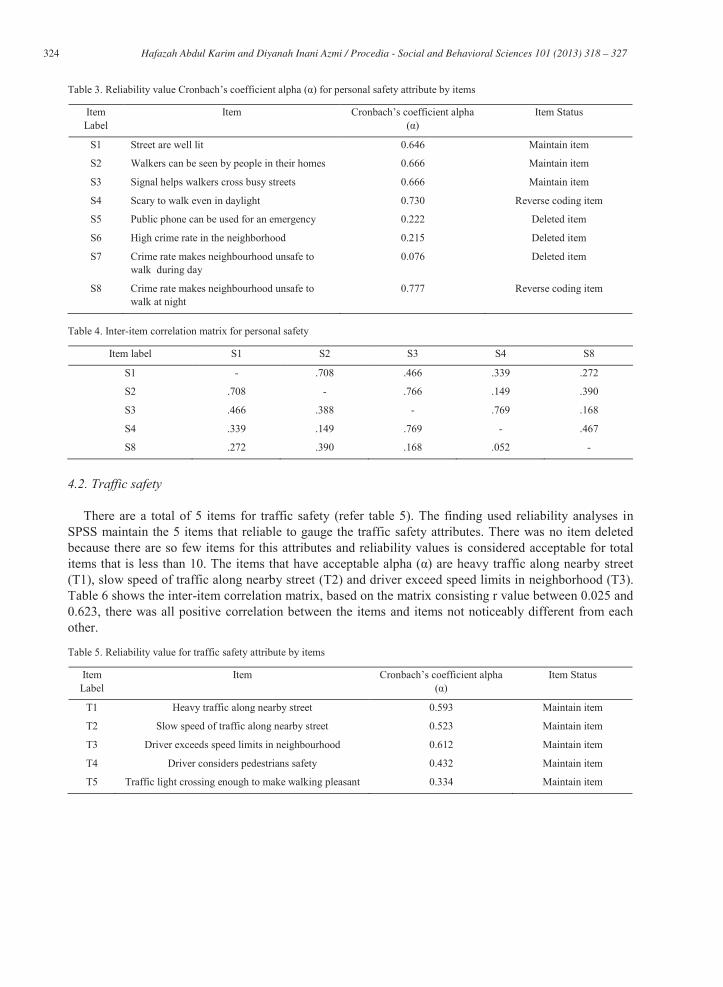
zed to indicate the items with lower values will probably be deleted to established well-validated reliability value for each of the attributes. There are 8 items for personal safety (refer table 3). The finding used reliability analyses in SPSS have deleted 3 items and maintained 5 items that reliable to gauge the personal safety attributes. The items that have high alpha value are street are well lit(S1), walkers can be seen by people in their homes (S2), signal helps walkers cross busy streets (S3), scary to walk even in daylight (S4), crime rate makes neighbourhood unsafe to walk at night (S8). Items public phone can be used for emergency (S5), high crime rate in the neighborhood (S6) and crime rate makes neighbourhood unsafe to walk during the day (S7) were deleted because of the small alpha( ) value. Items deleted have smaller alpha because respondents have difficulty to judge the agreements since there is no public phone provided in the both neighbourhood area. High crime rate cannot be evaluated since there is no strong fact and figure provided about high crime rate in the question. Moreover items crime rate makes neighbourhood unsafe to walk during day (S7) is the repetitions of items (s4) scary to walk even in daylight.
In this analysis, there are also two items that is reversed coding, items label S4 and S5. These items are reversed coding to help improved the reliability value. Reverse coding used to composite together the multiple items in the same direction. Based on Table 4 which shows the inter-item correlation matrix, based on the matrix there was all positive correlation between items consisting r value between 0.052 to 0.769.
324 Hafazah Abdul Karim and Diyanah Inani Azmi / Procedia - Social and Behavioral Sciences 101 ( 2013 ) 318 – 327
Item Label
Item
Item Status
S1 Street are well lit 0.646 Maintain item
S2 Walkers can be seen by people in their homes 0.666 Maintain item
S3 Signal helps walkers cross busy streets 0.666 Maintain item
S4 Scary to walk even in daylight 0.730 Reverse coding item
S5 Public phone can be used for an emergency 0.222 Deleted item
S6 High crime rate in the neighborhood 0.215 Deleted item
S7 Crime rate makes neighbourhood unsafe to walk during day
0.076 Deleted item
S8 Crime rate makes neighbourhood unsafe to walk at night
0.777 Reverse coding item
Table 4. Inter-item correlation matrix for personal safety
Item label S1 S2 S3 S4 S8
S1 - .708 .466 .339 .272
S2 .708 - .766 .149 .390
S3 .466 .388 - .769 .168
S4 .339 .149 .769 - .467
S8 .272 .390 .168 .052 -
4.2. Traffic safety
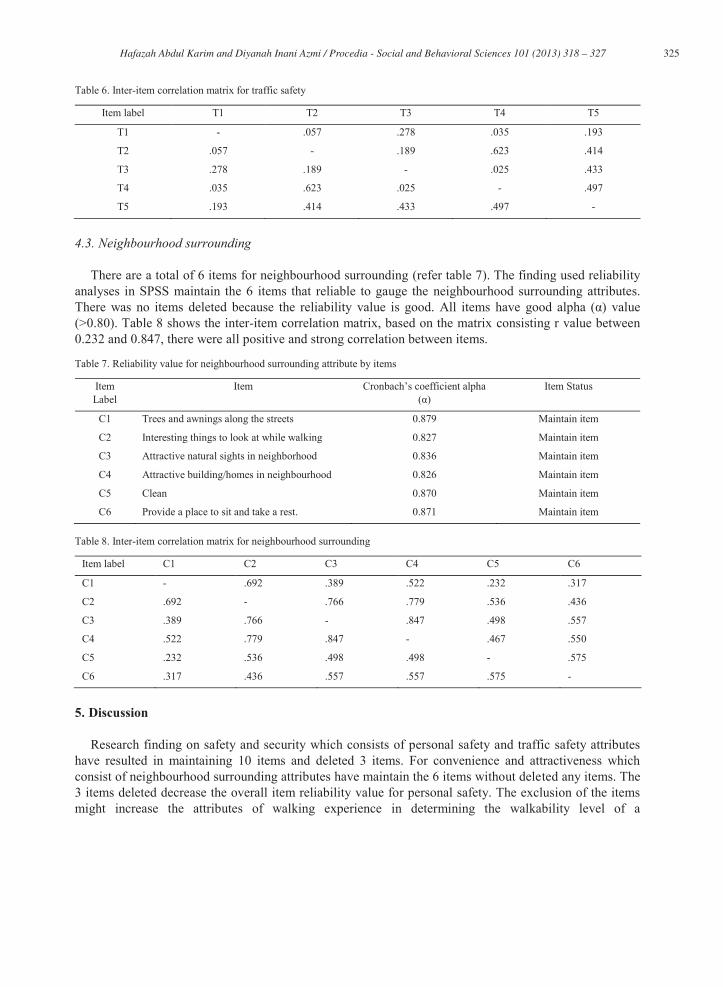
There are a total of 5 items for traffic safety (refer table 5). The finding used reliability analyses in SPSS maintain the 5 items that reliable to gauge the traffic safety attributes. There was no item deleted because there are so few items for this attributes and reliability values is considered acceptable for total items that is less than 10. The items that have acceptable alpha ( are heavy traffic along nearby street (T1), slow speed of traffic along nearby street (T2) and driver exceed speed limits in neighborhood (T3). Table 6 shows the inter-item correlation matrix, based on the matrix consisting r value between 0.025 and 0.623, there was all positive correlation between the items and items not noticeably different from each other.
Table 5. Reliability value for traffic safety attribute by items
Item Label
Item
Item Status
T1 Heavy traffic along nearby street 0.593 Maintain item
T2 Slow speed of traffic along nearby street 0.523 Maintain item
T3 Driver exceeds speed limits in neighbourhood 0.612 Maintain item
T4 Driver considers pedestrians safety 0.432 Maintain item
T5 Traffic light crossing enough to make walking pleasant 0.334 Maintain item
325 Hafazah Abdul Karim and Diyanah Inani Azmi / Procedia - Social and Behavioral Sciences 101 ( 2013 ) 318 – 327
Table 6. Inter-item correlation matrix for traffic safety
Item label T1 T2 T3 T4 T5
T1 - .057 .278 .035 .193
T2 .057 - .189 .623 .414
T3 .278 .189 - .025 .433
T4 .035 .623 .025 - .497
T5 .193 .414 .433 .497 -
4.3. Neighbourhood surrounding
There are a total of 6 items for neighbourhood surrounding (refer table 7). The finding used reliability analyses in SPSS maintain the 6 items that reliable to gauge the neighbourhood surrounding attributes. There was no items deleted because the reliability value is good. All items have good value (>0.80). Table 8 shows the inter-item correlation matrix, based on the matrix consisting r value between 0.232 and 0.847, there were all positive and strong correlation between items.
Table 7. Reliability value for neighbourhood surrounding attribute by items
Item Label
Item
Item Status
C1 Trees and awnings along the streets 0.879 Maintain item
C2 Interesting things to look at while walking 0.827 Maintain item
C3 Attractive natural sights in neighborhood 0.836 Maintain item
C4 Attractive building/homes in neighbourhood 0.826 Maintain item
C5 Clean 0.870 Maintain item
C6 Provide a place to sit and take a rest. 0.871 Maintain item
Table 8. Inter-item correlation matrix for neighbourhood surrounding
Item label C1 C2 C3 C4 C5 C6
C1 - .692 .389 .522 .232 .317
C2 .692 - .766 .779 .536 .436
C3 .389 .766 - .847 .498 .557
C4 .522 .779 .847 - .467 .550
C5 .232 .536 .498 .498 - .575
C6 .317 .436 .557 .557 .575 -
5. Discussion
Research finding on safety and security which consists of personal safety and traffic safety attributes have resulted in maintaining 10 items and deleted 3 items. For convenience and attractiveness which consist of neighbourhood surrounding attributes have maintain the 6 items without deleted any items. The 3 items deleted decrease the overall item reliability value for personal safety. The exclusion of the items might increase the attributes of walking experience in determining the walkability level of a
326 Hafazah Abdul Karim and Diyanah Inani Azmi / Procedia - Social and Behavioral Sciences 101 ( 2013 ) 318 – 327
neighbourhood area. Further verification and refinement of the items are still necessary or deleted as if it is irrelevant in measuring walkability.
value for items has showed item S5 (Public phone can be used for an emergency) is the hardest to be assessedneighbourhood environment. It is found that there is no public phone provided along the walkways or sidewalks for both of the neighbourhood. Thus, it might be hard for the respondent to agree on the use of public phone to call for help in case of emergency while the performed their walking activities.
Moreover, item S6 (high crime rate in the neighbourhood) also have similar cases with items S5. It is hard for the respondent to agree on high crime rate in their neighbourhood as they are not sure or aware of the current crime rate at their neighbourhood. While item S7 (Crime rate makes neighbourhood unsafe to walk during the day) is the repetition with item S4 (Scary to walk even in daylight). To summarize, there are a total of 16 items used for walking experience in determining the walkability level of a neighbourhood area.
6. Conclusion
Identification on reliability of safety and security; convenience and attractiveness attributes for walking experience in neighbourhood area are crucial in order to develop walkable environment. This research is only a pilot study with the minimum number of respondents where purposely to understand the interrelation between residents and their perceived on walking experience within Malaysia context particularly in Putrajaya. Thus, larger scales of respondents with wider sample on different type of neighbourhood are advisable as to get better precise result.
Acknowledgements
The writers would like to acknowledge the support given by Universiti Teknologi MARA during the carrying out of this research. This study was funded by Research Intensive Faculty (600-RMI/DANA/5/3/RIF 62/2012), provided by Research Management Institute, Universiti Teknologi MARA Shah Alam, Malaysia.
References
Ball, K., A. Bauman, E. Leslie, and N. Owen (2001). Perceived environmental aesthetics and convenience and company are associated with walking for exercise among Australian adults. Preventive Medicine, 33, 434 440.
Bauman, A., F. Wallner, A. Miners, and V. Westley-Wise (1996). No ifs no buts Illawarra physical activity project: Baseline research report. Commonwealth Department of Health and Family Services, Warrong, New South Wales.
Briggs, S. R. & Cheek, J. M. (1986). The role of factor analysis in the development and evaluation of personality scales. Journal of Personality, 54, 106-48.
Brouchard, C., and R. J. Shepard (1994). Physical activity, fitness, and health: The model and key concepts. In Physical Activity, Fitness, and Health: International Proceedings and Consensus Statement, (C. Brouchard and R. J. Shepard, and T. Stephens, eds.). Human Kinetics, Champaign, Ill.77 88.
Brownson, R. C., R. A. Houseman, D. R. Brown, J. Jackson-Thompson, A. C. King, B. R. Malone, and J. F. Sallis (2000). Promoting physical activity in rural communities. American Journal of Preventive Medicine, 18(3), 235 241.
Brownson, R. C., E. A. Baker, R. A. Houseman, L. K. Brennan, and S. J. Bacak (2001). Environmental and policy determinants of physical activity in the United States. American Journal of Public Health, 91(12), 1995 2003.
Craig, C. L., R. C. Brownson, S. E. Cragg, and A. L. Dunn (2002). Exploring the effect of the environment on physical activity: A study examining walking to work. American Journal of Preventive Medicine, 23(2) (supplement), 36 43.
DeVellis, R. F. 2003. Scale development:Theory and applications (2nd ed.). Thousand Oaks, California:Sage.
327 Hafazah Abdul Karim and Diyanah Inani Azmi / Procedia - Social and Behavioral Sciences 101 ( 2013 ) 318 – 327
Giles-Corti, B., and R. J. Donovan (2002). The relative influence of individual, social and physical environmental determinants of physical activity. Social Science and Medicine, 54, 1793 1812.
Handy, S. (1996). Urban Form and Pedestrian Choices: Study of Austin Neighborhoods.Transportation Research Record 1522, TRB, National Research Council, 135 144.
Handy, S. L., M. Boarnet, R. Ewing, and R. E. Killingsworth (2002). How the built environment affects physical activity: views from urban planning. American Journal of Preventive Medicine, 23(2) (supplement), 64 73.
Hawthorne, W. (1989)Probe Research Foundation, Ontario.
Hovell, M. F., J. F. Sallis, C. R. Hofstetter, V. M. Spy, P. Faucher, and C. J. Caspersen (1989). Identifying correlates of walking for exercise: an epidemiologic prerequisite for physical activity promotion. Preventive Medicine, 18, 856 866.
Klinenberg, E. (2002). Heat wave: A Social autopsy of disaster in Chicago. The University of Chicago Press. Kline, P. (1986). A handbook of test construction. New York: Methuen. Khisty, C. J. (1994). Evaluation of Pedestrian Facilities: Beyond the Level-of-Service Concept. In Transportation Research Record
1438, TRB, National Research Council, 45 50. Loukaitou-Sideris, A. (1999). Hot spots of bus stop crime: The importance of environmental attributes. Journal of the American
Planning Association, 65(4), 395 411. Malina, R. M., and T. Bielicki (1996). Retrospective longitudinal growth study of boys and girls active in sport. Acta Paediatrica,
85, 570 575. Nunnally, J. O. (1978). Psychometric theory. New York:McGraw-Hill. Pallant (2007). SPSS Survival Manual. Retrieved from http://www.scribd.com/doc/28054205/21517870-eBook-SPSS-Survival-
Manual. Ross, C. E., and J. Mirowsky (2001). Neighborhood disadvantage, disorder, and health. Journal of Health and Social Behavior,
42(3), 258 276. Saelens, B.E et al. (2002). Neighborhood Environment Walkability Survey (NEWS ... (n.d.). Retrieved from
http://www.activelivingresearch.org/node/10649 Thomas, S. J. (2004). Using Web and Paper Questionnaires for Data- Based Decision Making Pilot Testing the Questionnaire.
Retrived 01 January 2013 from Online ISBN: 9781412986496. Untermann, R (1984). Accomodating the Pedestrian : Adapting Towns and Neighbourhood for Walking and Bicycling. New York,
England, Australia, Canada: Van Nostrand Reinhold Company Limited. ican Language: College edition (1966). The World Publishing Company, Cleveland
and New York. Weinstein, A., P. Felgley, P. Pullen, L. Mann, and L. Redman (1999). Neighborhood safety and the prevalence of physical
inactivity selected states. Journal of the American Medical Association, 281, 1373.