
WIL EIA App 10 - Environmental Protection Department
456
CONTENTS 1 INTRODUCTON 1 1.1 BACKGROUND 1 1.2 SCOPE OF HAZARD TO LIFE ASSESSMENT 2 1.3 HAZARD TO LIFE ASSESSMENT OBJECTIVES AND RISK CRITERIA 3 1.4 STRUCTURE OF THE APPENDIX 10 5 2 PROJECT DESCRIPTION AND BASIS FOR THE ASSESSMENT 7 2.1 PROJECT OVERVIEW 7 2.2 EXPLOSIVE TYPES FOR WIL 7 2.3 OVERVIEW OF BLASTING 12 2.4 DESIGN OF THE EXPLOSIVE MAGAZINE 16 2.5 CONSTRUCTION OF THE PROJECT MAGAZINE 17 2.6 CONSTRUCTION OF THE WIL TUNNELS AND ADITS 18 2.7 TRANSPORT OF EXPLOSIVES AND INITIATION SYSTEMS 19 3 HAZARD TO LIFE ASSESSMENT METHODOLOGY 24 3.1 GENERAL ASSUMPTIONS OF THE STUDY 27 4 POPULATION ESTIMATES 28 4.1 POPULATION ESTIMATE NEAR THE EXPLOSIVE MAGAZINE 28 4.2 POPULATION ALONG EXPLOSIVES DELIVERY ROUTES 30 4.3 POPULATION CONSIDERED FOR THE USE OF EXPLOSIVES 33 5 HAZARD IDENTIFICATION 38 5.1 OVERVIEW 38 5.2 ACCIDENTAL INITIATION DUE TO HAZARD PROPERTIES OF EXPLOSIVE 38 5.3 ACCIDENTAL INITIATION ASSOCIATED WITH STORAGE AT MAGAZINE 40 5.4 GROUND VIBRATION ASSOCIATED WITH USE OF EXPLOSIVES 41 5.5 REVIEW OF INCIDENTS 43 5.6 SCENARIOS FOR HAZARD ASSESSMENT 46 6 FREQUENCY ASSESSMENT 48 6.1 STORAGE OF EXPLOSIVES 48 6.2 TRANSPORT OF EXPLOSIVES 51 6.3 TRANSPORTATION WITHIN THE ACCESS TUNNEL OF THE MAGAZINE 67 6.4 USE OF EXPLOSIVES 68 7 CONSEQUENCE ASSESSMENT 70 7.1 GENERAL 70 7.2 PHYSICAL EFFECT MODELLING 71 7.3 RESULTS OF CONSEQUENCE ASSESSMENT 90 8 RISK SUMMATION 111
-
Upload
khangminh22 -
Category
Documents
-
view
0 -
download
0
Transcript of WIL EIA App 10 - Environmental Protection Department
CONTENTS
1 INTRODUCTON 1
1.1 BACKGROUND 1
1.2 SCOPE OF HAZARD TO LIFE ASSESSMENT 2
1.3 HAZARD TO LIFE ASSESSMENT OBJECTIVES AND RISK CRITERIA 3
1.4 STRUCTURE OF THE APPENDIX 10 5
2 PROJECT DESCRIPTION AND BASIS FOR THE ASSESSMENT 7
2.1 PROJECT OVERVIEW 7
2.2 EXPLOSIVE TYPES FOR WIL 7
2.3 OVERVIEW OF BLASTING 12
2.4 DESIGN OF THE EXPLOSIVE MAGAZINE 16
2.5 CONSTRUCTION OF THE PROJECT MAGAZINE 17
2.6 CONSTRUCTION OF THE WIL TUNNELS AND ADITS 18
2.7 TRANSPORT OF EXPLOSIVES AND INITIATION SYSTEMS 19
3 HAZARD TO LIFE ASSESSMENT METHODOLOGY 24
3.1 GENERAL ASSUMPTIONS OF THE STUDY 27
4 POPULATION ESTIMATES 28
4.1 POPULATION ESTIMATE NEAR THE EXPLOSIVE MAGAZINE 28
4.2 POPULATION ALONG EXPLOSIVES DELIVERY ROUTES 30
4.3 POPULATION CONSIDERED FOR THE USE OF EXPLOSIVES 33
5 HAZARD IDENTIFICATION 38
5.1 OVERVIEW 38
5.2 ACCIDENTAL INITIATION DUE TO HAZARD PROPERTIES OF EXPLOSIVE 38
5.3 ACCIDENTAL INITIATION ASSOCIATED WITH STORAGE AT MAGAZINE 40
5.4 GROUND VIBRATION ASSOCIATED WITH USE OF EXPLOSIVES 41
5.5 REVIEW OF INCIDENTS 43
5.6 SCENARIOS FOR HAZARD ASSESSMENT 46
6 FREQUENCY ASSESSMENT 48
6.1 STORAGE OF EXPLOSIVES 48
6.2 TRANSPORT OF EXPLOSIVES 51
6.3 TRANSPORTATION WITHIN THE ACCESS TUNNEL OF THE MAGAZINE 67
6.4 USE OF EXPLOSIVES 68
7 CONSEQUENCE ASSESSMENT 70
7.1 GENERAL 70
7.2 PHYSICAL EFFECT MODELLING 71
7.3 RESULTS OF CONSEQUENCE ASSESSMENT 90
8 RISK SUMMATION 111
8.1 OVERVIEW 111
8.2 RISK MEASURES 111
8.3 SOCIETAL RISK 112
8.4 INDIVIDUAL RISK 117
8.5 OPTION ANALYSIS 123
8.6 UNCERTAINTY ANALYSIS AND SENSITIVITY TESTS 124
9 CONCLUSION & RECOMMENDATIONS 128
9.1 CONCLUSIONS 128
9.2 RECOMMENDATIONS 128
10 REFERENCES 132
ANNEX A BLASTING PROCESS
ANNEX B ACCIDENT REVIEW
ANNEX C POPULATION DATA
ANNEX D TRAFFIC SURVEY REPORT
ANNEX E USE OF EXPLOSIVES – FREQUENCY ASSESSMENT DETAILS
ANNEX F USE OF EXPLOSIVES – HUMAN FACTOR ASSESSMENT & REDUCTION
TECHNIQUE
ANNEX G USE OF EXPLOSIVES – BLASTING ROUTE AND SLOPES DETAILS

A10-1
1 INTRODUCTON
1.1 BACKGROUND
MTR Corporation Limited (MTRC) is planning to construct the
West Island Line (WIL), which consists approximately of a 3.3 km alignment
to extend the Island Line (ISL) from the existing Sheung Wan Station (SHW) to
the new Kennedy Town Station (KET), via two new intermediate stations, Sai
Yin Pun (SYP) and University (UNV).
A significant length of the WIL tunnels, adits and station boxes will be
excavated in rock. The amount of rock to be extracted will be approximately
480,000 m3. A significant amount of explosives will be required for the
construction of rock caverns, tunnels and adits for the WIL.
To enable a timely delivery of explosives to site and in order to meet the
proposed construction work programme, an Explosive Storage Magazine
(Magazine) is required. The purpose of the Magazine is to maintain
construction activities in case of delivery interruptions by Mines Division
(Mines) from the Geotechnical Engineering Office (GEO), Civil Engineering
and Development Department (CEDD). Mines will deliver explosives and
initiation devices (detonators) to the Magazine on a daily basis. The
transportation of explosives by Mines is under Mines responsibility and falls
outside the scope of this EIA.
The appointed contractors of MTRC will transport explosives in maximum
200 kg lots in licensed trucks, from the Magazine to a particular construction
site for the daily or twice-daily blasts depending on requirements for
construction.
The proposed Magazine is planned as an underground cavern to be built
beneath Mount Davis and located near a disused Government Facility Site
with an entrance adjacent to Victoria Road. It is proposed to use an existing
flat platform of land to access the underground magazine.
Under Section 5(7) of the Environmental Impact Assessment (EIA) Ordinance
(Cap. 499) (EIAO), the Director of Environmental Protection (Director) from
the Environmental Protection Department (EPD) has issued a Study Brief No.
ESB-130/2005 for this project (EIA Study Brief). Section 3.4.6 of the EIA Study
Brief requires a Hazard to Life assessment to be conducted for the overnight
storage of explosives on the construction site and credible and applicable
hazardous scenarios within the boundaries of the construction site during
transport, storage and use of explosives for blasting operations.
ERM-Hong Kong, Limited (ERM) was commissioned by MTRC to undertake
the Hazard to Life Assessment for the storage, transport and use of explosives
during the WIL Construction Stages and propose risk mitigation measures if
necessary. The criteria and guidelines for assessing Hazard to Life are stated
in Annexes 4 and 22 of the Technical Memorandum (EIAO-TM Criteria).

A10-2
The Hazard to Life assessment requirements of the EIA Study Brief are shown
below.
Figure 1.1 EIA Brief – Hazard to Life Requirement
3.4.6 Hazard to Life
If there is overnight storage of explosives on construction site and the storage location is in
close proximity to populated areas and/or Potentially Hazardous Installation site(s), the
Applicant shall follow the criteria and guidelines for evaluating hazard to life as stated in
Annexes 4 and 22 of the TM in conducting hazard assessment for construction stage and
include the following in the assessment:
(i) Identification of all credible and applicable hazardous scenarios within the boundaries of the
construction site during transport, storage and use of explosives for blasting operations;
(ii) Execution of a Quantitative Risk Assessment to determine risks to the surrounding
population in both individual and societal terms;
(iii) Comparison of individual and societal risks with the Criteria for Evaluating Hazard to Life
stipulated in Annex 4 of the TM, to determine the acceptability of the assessed risk;
(iv) Identification and assessment of practicable and cost effective risk mitigation measures to
demonstrate the compliance with the Risk Guidelines; and
(v) The methodology of hazard assessment shall be agreed with the Director taking into
account relevant previous studies.
This section of the EIA presents:
• The basis for the assessment;
• Description of the detailed methodology;
• The results for each QRA step; and
• The assessment of the risk against the EIAO-TM Risk Criteria.
In accordance with the study brief, a methodology statement was submitted to
EPD for agreement. The details of the methodology are elaborated further in
various sections of this report.
1.2 SCOPE OF HAZARD TO LIFE ASSESSMENT
The hazard to life assessment addresses, in particular, the following:
• Use of Explosives during the Construction of the WIL, including:
• Use of Cartridged Emulsion Explosives;
• Use of Bulk Emulsion Explosives;
• Use of blasting accessories including detonators and boosters;
• Use of Explosives during the Construction of the Magazine, including:
• Use of Cartridged Emulsion Explosives;
• Use of Bulk Emulsion Explosives;

A10-3
• Use of blasting accessories including detonators and boosters;
• Storage of Explosives at the Magazine (blasting explosives, boosters
and detonators);
• Transport of Explosives, including:
• Handling of Explosives at the Magazine;
• Transport of Explosives from the Magazine to the construction site;
and
• Handling of Explosives at the delivery points.
1.3 HAZARD TO LIFE ASSESSMENT OBJECTIVES AND RISK CRITERIA
The main objective of this Hazard to Life Assessment is to demonstrate that
the Risk Criteria set in Annex 4 of the EIAO-TM will be met during the
construction phase of the West Island Line and to identify, where applicable,
practical mitigation measures to ensure the EIAO-TM criteria are met.
The study will particularly focus on the following:
• Identification of hazardous scenarios within the boundaries of the
construction site during transport, storage and use of explosives for
blasting operations;
• Preparation of a Quantitative Risk Assessment (QRA) to estimate risks
to the surrounding population in both individual and societal terms;
• Comparison of individual and societal risks with the Criteria for
Evaluating Hazard to Life stipulated in Annex 4 of the EIAO TM to
determine the acceptability of the assessed risk (i.e. the Hong Kong
Risk Guideline (HKRG));
• Identification and assessment of practicable and cost effective risk
mitigation measures to demonstrate the compliance with the Risk
Guidelines.
1.3.1 Risk Criteria
The risk guidelines and societal risk guidelines specified in Annex 4 of the
EIAO-TM are shown below.
Individual Risk (IR)
Individual risk is defined as the frequency of fatality per year to a specific
individual due to the realisation of specified hazards, with account taken of
temporal factors.
The maximum level of off site individual risk should not exceed 1 in 100,000
per year, ie 1x10⁻⁵ per year.
A10-4
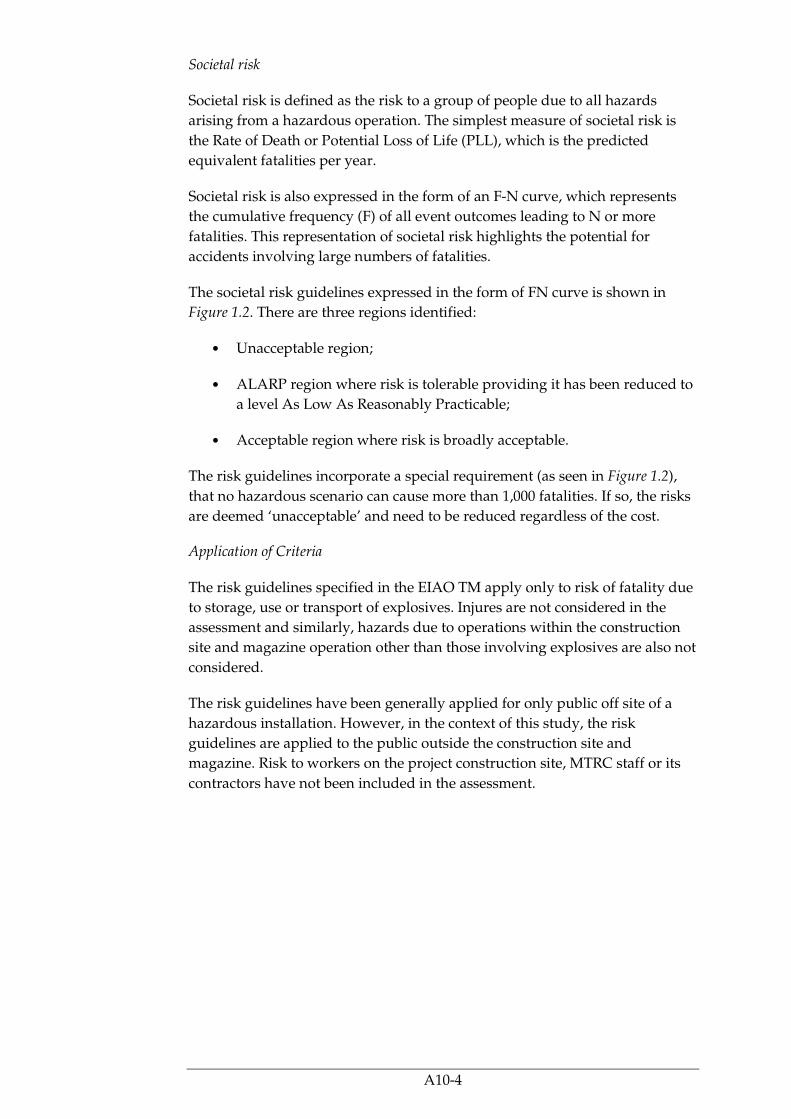
Societal risk
Societal risk is defined as the risk to a group of people due to all hazards
arising from a hazardous operation. The simplest measure of societal risk is
the Rate of Death or Potential Loss of Life (PLL), which is the predicted
equivalent fatalities per year.
Societal risk is also expressed in the form of an F-N curve, which represents
the cumulative frequency (F) of all event outcomes leading to N or more
fatalities. This representation of societal risk highlights the potential for
accidents involving large numbers of fatalities.
The societal risk guidelines expressed in the form of FN curve is shown in
Figure 1.2. There are three regions identified:
• Unacceptable region;
• ALARP region where risk is tolerable providing it has been reduced to
a level As Low As Reasonably Practicable;
• Acceptable region where risk is broadly acceptable.
The risk guidelines incorporate a special requirement (as seen in Figure 1.2),
that no hazardous scenario can cause more than 1,000 fatalities. If so, the risks
are deemed ‘unacceptable’ and need to be reduced regardless of the cost.
Application of Criteria
The risk guidelines specified in the EIAO TM apply only to risk of fatality due
to storage, use or transport of explosives. Injures are not considered in the
assessment and similarly, hazards due to operations within the construction
site and magazine operation other than those involving explosives are also not
considered.
The risk guidelines have been generally applied for only public off site of a
hazardous installation. However, in the context of this study, the risk
guidelines are applied to the public outside the construction site and
magazine. Risk to workers on the project construction site, MTRC staff or its
contractors have not been included in the assessment.

A10-5
Figure 1.2 Societal Risk Criteria in Hong Kong
1.4 STRUCTURE OF THE APPENDIX 10
The Appendix 10 “ Risk Assessment for Transport, Storage and Use of
Explosives” is structured as follows:
Section 1: Introduction including scope, objectives and risk criteria
Section 2: Project Description and Basis for the Assessment
Section 3: Hazard to Life Assessment Methodology
Section 4: Population Estimates
Section 5: Hazard Identification
Section 6: Frequency Assessment
Section 7: Consequence Assessment
Section 8: Risk Summation
Section 9: Conclusion & Recommendations
Section 10: References

A10-6
Annexes
Annex A: Blasting Process
Annex B: Accident Review
Annex C: Population Data
Annex D: Traffic Survey Report
Annex E: Use of Explosives - Frequency Assessment Details
Annex F: Use of Explosives – Human Factor Assessment & Reduction
Technique
Annex G: Use of Explosives – Blasting Route and Slopes Details
A10-7
2 PROJECT DESCRIPTION AND BASIS FOR THE ASSESSMENT
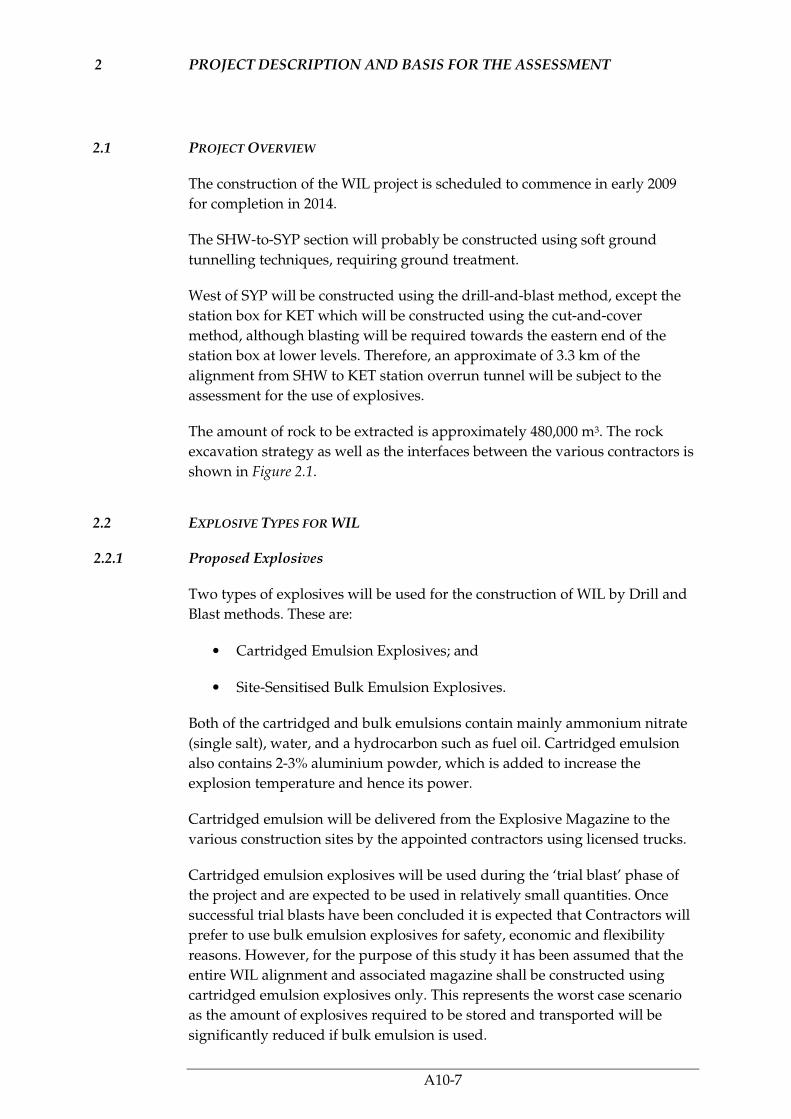
2.1 PROJECT OVERVIEW
The construction of the WIL project is scheduled to commence in early 2009
for completion in 2014.
The SHW-to-SYP section will probably be constructed using soft ground
tunnelling techniques, requiring ground treatment.
West of SYP will be constructed using the drill-and-blast method, except the
station box for KET which will be constructed using the cut-and-cover
method, although blasting will be required towards the eastern end of the
station box at lower levels. Therefore, an approximate of 3.3 km of the
alignment from SHW to KET station overrun tunnel will be subject to the
assessment for the use of explosives.
The amount of rock to be extracted is approximately 480,000 m3. The rock
excavation strategy as well as the interfaces between the various contractors is
shown in Figure 2.1.
2.2 EXPLOSIVE TYPES FOR WIL
2.2.1 Proposed Explosives
Two types of explosives will be used for the construction of WIL by Drill and
Blast methods. These are:
• Cartridged Emulsion Explosives; and
• Site-Sensitised Bulk Emulsion Explosives.
Both of the cartridged and bulk emulsions contain mainly ammonium nitrate
(single salt), water, and a hydrocarbon such as fuel oil. Cartridged emulsion
also contains 2-3% aluminium powder, which is added to increase the
explosion temperature and hence its power.
Cartridged emulsion will be delivered from the Explosive Magazine to the
various construction sites by the appointed contractors using licensed trucks.
Cartridged emulsion explosives will be used during the ‘trial blast’ phase of
the project and are expected to be used in relatively small quantities. Once
successful trial blasts have been concluded it is expected that Contractors will
prefer to use bulk emulsion explosives for safety, economic and flexibility
reasons. However, for the purpose of this study it has been assumed that the
entire WIL alignment and associated magazine shall be constructed using
cartridged emulsion explosives only. This represents the worst case scenario
as the amount of explosives required to be stored and transported will be
significantly reduced if bulk emulsion is used.

A10-8
Bulk emulsion precursor will be transported to the blast sites within the
Adits/Tunnels by the appointed third party supplier. It only becomes
classified as an explosive after being sensitized at the blast location or working
face, by the addition of a gassing agent as it is pumped into the blastholes.
Bulk emulsion pumping equipment in Hong Kong has an accuracy of ± 100
grams. Mines have previously approved its use down to a charge weight
(MIC) of 100 grams at the Ocean Park Funicular Tunnel and the Drainage
Services Department (DSD) Hong Kong West Drainage project.
In much lesser explosive quantities, detonators, boosters and detonating cords
will be used to initiate the blast at the working face, depending on the blast
requirement. Detonators approved for use in Hong Kong are of the Non-
Electric Type, ie. initiated by shock tube.
2.2.2 Explosives Properties
Explosives that are relevant to the WIL project can be classified into two (2)
types:
• blasting explosives; and
• initiating explosives.
Their properties are shown in Table 2.1.
Table 2.1 Explosive Types
Type Explosion Type Use Example
High explosives Detonation General blasting,
Shattering
rock/structures
Emulsion explosives,
Primers/Boosters,
Detonating cord
Initiating explosives Detonation Initiation of secondary
explosive
Detonators
Explosives Classification
The hazards implicit in the storage, transportation and use of explosives are
described by their dangerous goods classification.
For the purpose of this study, explosives will be classified in accordance with
the United Nations Dangerous Goods classification system because all the
references world-wide use that system and all the base analytical data is based
on that system. In the United Nations system, explosives are Class 1
Dangerous Goods, and the Hong Kong equivalent is Category 1 dangerous
goods under the Control of Dangerous Goods Ordinance, Cap. 295.
Dangerous Goods of UN Class 1 (Explosives) are assigned to one of six
divisions, depending on the type of hazard they present (see Table 2.2 below)
and to one of thirteen compatibility groups, which identifies the kinds of
explosive substances and articles (see Table 2.3, only details for those
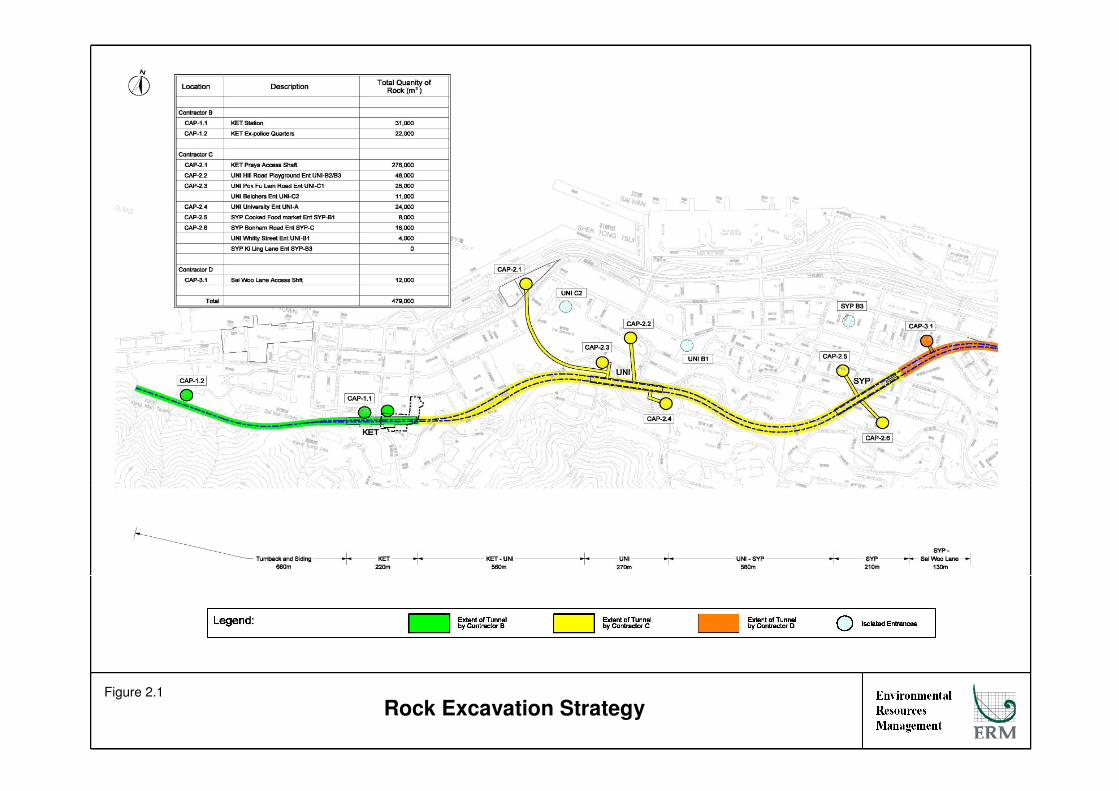
Rock Excavation StrategyFigure 2.1

A10-9
compatibility letters that are relevant to the WIL project are shown) that are
deemed to be compatible.
Table 2.2 UN Class 1 Explosive Hazard Divisions
Hazard
Division
Definition Example
1.1 Substances and articles which have a mass explosion
hazard
Lead Azide,
boosters/primers,
detonators /
blasting caps
1.2 Articles which have a projection hazard but not a mass
explosion hazard
Military mortar
shells
1.3 Substances or articles which primarily have a fire
hazard and either a minor blast hazard or minor
projection hazard or both.
Propellant
powder
1.4 Articles which present no significant hazard outside
their packaging
Packaged sporting
ammunition,
some detonators
in appropriate
packaging
1.5 Very insensitive substances which have a mass
explosion hazard
Sensitised bulk
emulsion
1.6 Extremely insensitive articles which do not have mass
explosion hazard
Military
explosives
Table 2.3 UN Class 1 Explosive Compatibility Letters
Compatibility
letter
Definition Example
B An article containing a primary explosive
substance and not containing two or more
protective features
Detonators
D Secondary detonating explosive substance
without means of initiation and without
propelling charge
Primers/Boosters,
Cartridged
emulsion,
Detonating cord,
Sensitised bulk
emulsion
S Substance or article so packed or designed that
any hazardous effects arising from accidental
functioning are limited to the extent that they do
not significantly hinder or prohibit fire fighting or
other emergency response efforts in the
immediate vicinity of the package
Detonators
2.2.3 Cartridged Emulsion
The cartridged explosive is designed as small diameter packaged emulsion,
which can be used for both priming and full column applications, particularly
in underground mining. It is used for mining, quarrying and general blasting
work.

A10-10
It is packaged in a range of plastic films with the tips clipped at each end to
form a cylindrical sausage, or wrapped in waxed paper. It is classified as a UN
Class 1.1D explosive and Dangerous Goods (DG) Category 1 explosive under
the Hong Kong classification system. It has a TNT equivalence of 0.96 kg of
TNT per kg of emulsion.
Like all explosives, cartridged emulsion consists of a mixture of oxidisers and
fuel. What makes emulsion unique is the high quantity of water it contains –
typically around 10-14%. The oxidisers are typically ammonium nitrate,
calcium nitrate or sodium nitrate. The fuels are waxes or oils like diesel fuel.
The mixture is complete with small amounts of emulsifiers (less than 1%),
which keep the water and oil mixture homogeneous.
Cartridged emulsion is detonator sensitive, and hence it does not require the
use of a booster to cause it to detonate.
When cartridged emulsion explosives are used, the required number of sticks
equivalent to the MIC will be loaded into each blasthole.
2.2.4 Bulk Emulsion Precursor
Bulk Emulsion has a similar composition to Cartridged Emulsion, except that
it does not contain aluminium. The bulk emulsion precursor has a density of
1.38-1.40 gms/cc. It is not considered an explosive and is classified as UN 5.1
oxidising agent and Dangerous Goods Ordinance (Cap. 295) Category 7
Strong Supporters of Combustion. This material is stored in a Category 7
store, which falls under the jurisdiction of the Fire Services Department (FSD),
and not Mines Division.
Bulk emulsion precursor is stable under normal conditions and there is no
major fire hazard before sensitization. Hazard associated with bulk emulsion
precursor is mainly due to its oxidizing properties causing irritation to eyes
and skin. Explosion is considered possible only under prolonged fire,
supersonic shock or high energy projectile impact.
Storage and transport of bulk emulsion precursor is not included within the
scope of this study.
2.2.5 Bulk Emulsion
Bulk emulsion may be used instead of cartridged emulsion to excavate rock by
tunnel blasting. Bulk emulsion precursor is sensitised at the blast site by the
addition of a gassing solution (usually Acetic/Citric acid). This is added to the
charging hose downstream from delivery pump.
A delivery pump is used for the loading of the bulk emulsion into the
blastholes. There are two different types of pump driving mechanisms, which
are:-
• Pneumatic; and
• Hydraulic.

A10-11
A hydraulic driven pump has an delivery accuracy of ± 100 g, compared to a
pneumatic driven pump with an accuracy of ≥ 200 g. Gassing solution is
injected into the precursor to reduce the density to 0.8 to 1.1g/cc at the
discharge end of the loading hose. This sensitises the emulsion by producing
nitrogen gas bubbles that aid the propagation of the detonation wave. Hence,
the bulk emulsion does not become an explosive until it is pumped into the
blastholes at the working blast face. The sensitised emulsion can then be
detonated with the assistance of a small booster and a detonator. The bulk
emulsion, once it is gassed is classified as UN 1.5D explosive or a Dangerous
Goods (DG) Category 1 explosive under the Hong Kong classification system.
Bulk Emulsion explosives which are pumped into blastholes completely fill
the blasthole and thus are ‘fully coupled’ to the rock. This results in improved
explosive performance and enables Bulk Emulsion explosives of lower power
( cf. Cartridged Emulsions ) to be utilized.
2.2.6 Detonating devices (detonators, detonating cord, primers)
Detonators
Detonators are small devices that are used to safely initiate blasting explosives
in a controlled manner. There have been many types of detonators in the past
(safety fuse, electrical, and others) however, this study is limited to Non-
electric, or Shock Tube detonators, because these are the only type that will be
used. Detonators are classified as either UN 1.1B, 1.4B, or 1.4S, or DG
Category 1 explosive under the Hong Kong classification system.
Although detonators contain the most sensitive types of explosives in
common use, they are constructed in a manner such that they may be handled
and used with minimal risk. They are packaged in a manner that, if
accidentally initiated, they should have no serious effects outside the package.
Detonators are manufactured with in-built delays that are of various duration.
This is to facilitate effective blasting to allow shots to be initiated at one time
but to fire sequentially, thereby enhancing the practical effects of the blast. The
detonators to be used in this project will be either millisecond delay period
detonators (MS Series) or half second delay detonators (Long Period or LPD).
The delay time of a detonator is controlled by the burning time of a
pyrotechnic ignition mixture pressed into a 6.5mm diameter steel tube, which
is the delay element. This element causes the primary explosion, which is
typically a small amount of lead azide, to detonate. This in turn, causes the
secondary, or output, explosive to detonate, which is usually PETN
(Pentaerythrite tetranitrate). The quantity of PETN within each detonator is
approximately 0.9g. Each detonator has a delay time that is based upon the
length of steel tube and the compaction of the pyrotechnic mixture within it.
In designing the blasting of a tunnel face, the general principle is to select the
required detonators to ensure that no two blastholes will detonate less than 8
ms apart.

A10-12
The ignition of the pyrotechnic mixture is achieved by the use of shock tubes.
This is a small diameter plastic tube that has a light dusting of explosive
powder to the inside surface along its length. When ignited by a hot, high
pressure impulse the explosive powder combusts at a rate of over 2000 m/s,
and causes ignition of the detonator pyrotechnic mixture.
Detonating Cord
Detonating cord is a thin, flexible tube with an explosive core. It has the effect
of a detonator along its entire length and is suitable for initiating other
explosives that are detonator sensitive, such as boosters. It can be used for
synchronising multiple charges to detonate different charges almost
simultaneously. It is used to chain together multiple explosive charges.
Typical uses include mining, drilling, and demolitions. The core of the cord is
a compressed powdered explosive, usually PETN, and it is initiated by the use
of a blasting cap. Detonating cord will initiate most commercial high
explosives (e.g. dynamite) but will not reliably initiate less sensitive blasting
agents like bulk emulsion or ANFO on its own. A small charge (or booster),
usually of PETN or TNT, is required to bridge between the cord and a charge
of insensitive blasting agent like bulk emulsion or ANFO.
Explosive Primer or Booster
The small quantity of explosive in a detonator is usually inadequate to reliably
initiate many bulk explosives so they are used in conjunction with larger, less
sensitive explosives to boost the explosion. When a booster is “primed” with a
detonator it is called a primer. These explosives are used as part of the
initiating system to initiate the main blasting explosives. The booster typically
contains PETN or Pentolite, a mixture of TNT and PETN, and is detonator
sensitive. It is classified as UN 1.1D.
2.3 OVERVIEW OF BLASTING
2.3.1 The Blasting Process
Supply of Detonators and Cartridged Emulsion Explosives
Detonators are imported into Hong Kong. Destructive product sample tests
are conducted by the manufacturer before each order leaves the factory. These
tests record the actual delay firing time of each sample detonator and must fall
within the manufacturers upper and lower tolerances as dictated by their
quality control and quality assurance (QC /QA) system. In the event that the
tested sample falls outside of the delay time control, or tolerance limits the
batch will be destroyed. The delay time, detonator shock tube length, batch
number and date of manufacture are printed on each vacuum bag (inner
packaging) and the delay time is printed on the aluminium shell and the coil
tag of each detonator, where the detonator shock tube length is also shown.
The detonator order will be imported into Hong Kong and stored at the Mines
Division Kao Shat Wan (KSW) explosives magazine. Users will then order
from Mines for delivery to their on-site explosives magazine or to their
blasting site.

A10-13
Cartridged emulsion explosives are imported into Hong Kong and stored at
the KSW magazine and delivered to end users by Mines Division on a daily
basis.
Blast Design
The design of the blast will consider the quantity and type of explosives
needed including MIC (maximum instant charge), number of detonators
required, as well as the sensitive receivers at the blasting location. The blast
design will be produced by the blasting engineer using computer aided tools,
checked and approved by the project Registered Engineer (RE), and then
endorsed by Mines Division prior to implementation. The blast plan will
contain information covering the dimensions of the face to be blasted, MIC,
location (chainage) size of blastholes, type and number of delay detonators
required, powder factor (kg / m3), which is defined as the ratio of mass of
explosives used to the volume of rock removed by the blast,. The blast design
will ensure that each detonator will initiate at a different time delay to allow
sequential breaking of the rock.
Blast Loading and Execution
Immediately prior to loading, the required and approved amount of
explosives, cast boosters, detonating cord and detonators for the blast will be
collected by the Registered Shotfirer and delivered to the blasting site by
licensed contractors’ vehicle. The collection of the correct quantity of
explosives, cast boosters, detonating cord and detonators from magazine will
be checked by the Registered Shotfirer, a representative from the supervising
consultant (ie. Resident Site Engineer, (RSS)), a representative from the
Contractor, and sometimes a representative from Mines Department.
To ensure that blasting of different sectors of the blast face occurs in the
correct sequence and not simultaneously, the shock tubes from the detonators
associated with a particular sector may be ‘bunched’ together and wrapped, or
‘looped’, with detonating cord. A bunch block is then attached to the
detonating cord. A bunch block contains approximately 0.3 g of explosive, is
sufficient to initiate the detonating cord, which in turn ignites the shock tubes
around which the cord is wrapped. The shock tube tail of the bunch block is
itself be ignited by a surface connector.
A surface connector has a smaller mass of explosive (0.11 g) than a bunch
block, which whilst it is insufficient to initiate the detonating cord, it is
sufficient to ignite shock tubes. A bunch block and detonator cord
combination is used to ignite a bundle of shock tubes because a surface
connector can only hold up to a maximum of 8 shock tubes. Two surface
connectors may be linked in series, with their connected bunch blocks in
parallel, to ensure the staggering of the individual detonations across the
entire blast face. The bunch block typically has no delay time, as the delay is
provided by the surface connector to which its initiating shock tube is
connected.

A10-14
For each blast, generally, 3-5 surface connectors will be used, (each having a
delay time of 9 and 17 ms), and 4-6 bunch blocks (0 ms) per blast. A typical
blast round usually takes 4 to 5 seconds for completion.
A detailed step-by-step method of blasting loading and execution is given in
Annex A.
2.3.2 Safe Operating Practices
Vibration Monitoring
It is a requirement to monitor every blast in Hong Kong to record blast
induced ground vibrations. Each blast is influenced by a controlling sensitive
receiver which may be a building, slope or utilities. The controlling sensitive
receiver, and its allowable peak particle velocity (PPV) will dictate the MIC
that can be used for any blast.
When each and every blast is designed, the first parameter to be established is
the controlling sensitive receiver, its allowable PPV, its radial distance from
the blast and the allowable MIC calculated.
As the excavation advances on a blast-by-blast basis the controlling sensitive
receiver may change or remain constant. However, the allowable MIC may
decrease or increase depending on the radial distance between the blast and
the controlling sensitive receiver.
A dedicated Geotechnical Engineer is responsible for ensuring that the
controlling and other nominated sensitive receivers for each blast are
monitored to record the PPV in mm/sec. In addition, there may be instances
where it is necessary to record air overpressure generated by blasting
activities.
Trial Blasts
Trial blasts will be carried out for the first series of blasts for the tunnels and
adits and different areas or sectors of the project if required. The trial blasts
will be used to determine rock characteristics and to collect data to enable site
specific constants to be calculated for future vibration (in terms of Peak
Particle Velocity, PPV) prediction, and to ensure the blasting monitoring and
control procedures are effective.
Trial blasts are conducted with cartridged emulsion explosives.
Advance Notice of Blasts
As part of the process of issuing a License to Possess and a Permit to Use
dangerous goods, Mines Division will require that highly visible warning
notices/signs be posted at several locations to warn the public that blasting
will take place. These warning signs will be posted near the intended blasting
location, even though all blasts will be conducted underground. The
Contractor is required to write the blasting date and time on the notice.
A10-15
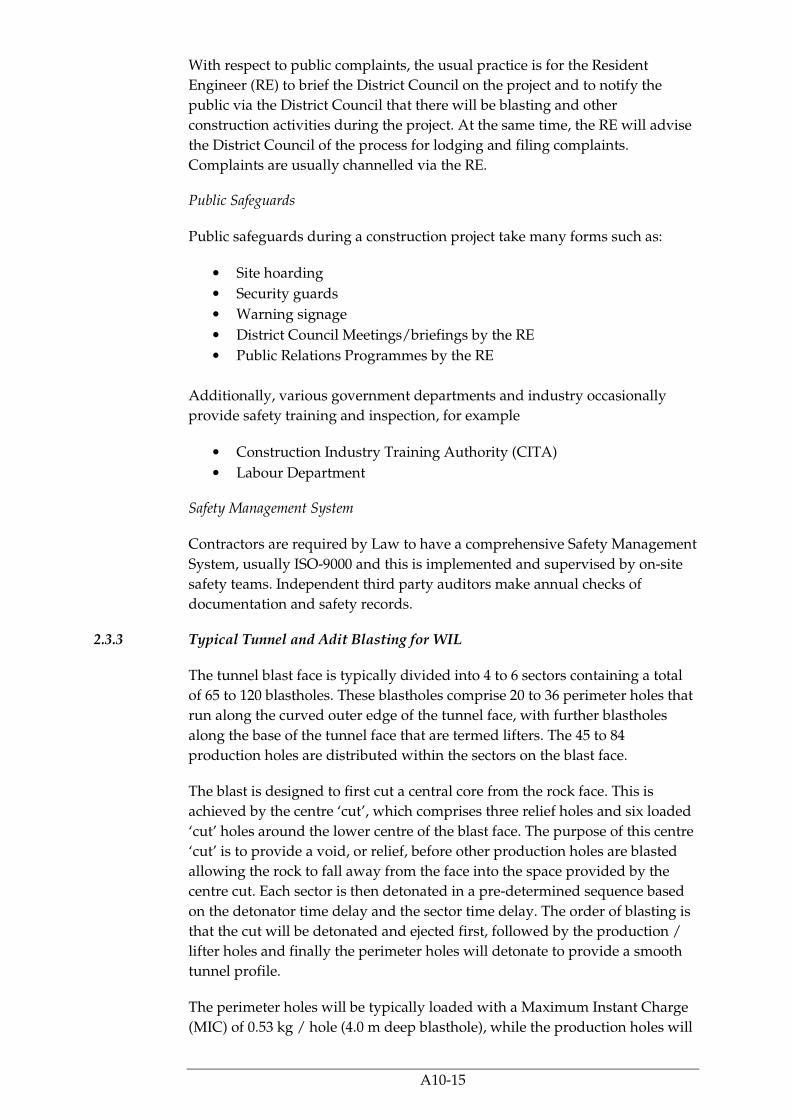
With respect to public complaints, the usual practice is for the Resident
Engineer (RE) to brief the District Council on the project and to notify the
public via the District Council that there will be blasting and other
construction activities during the project. At the same time, the RE will advise
the District Council of the process for lodging and filing complaints.
Complaints are usually channelled via the RE.
Public Safeguards
Public safeguards during a construction project take many forms such as:
• Site hoarding
• Security guards
• Warning signage
• District Council Meetings/briefings by the RE
• Public Relations Programmes by the RE
Additionally, various government departments and industry occasionally
provide safety training and inspection, for example
• Construction Industry Training Authority (CITA)
• Labour Department
Safety Management System
Contractors are required by Law to have a comprehensive Safety Management
System, usually ISO-9000 and this is implemented and supervised by on-site
safety teams. Independent third party auditors make annual checks of
documentation and safety records.
2.3.3 Typical Tunnel and Adit Blasting for WIL
The tunnel blast face is typically divided into 4 to 6 sectors containing a total
of 65 to 120 blastholes. These blastholes comprise 20 to 36 perimeter holes that
run along the curved outer edge of the tunnel face, with further blastholes
along the base of the tunnel face that are termed lifters. The 45 to 84
production holes are distributed within the sectors on the blast face.
The blast is designed to first cut a central core from the rock face. This is
achieved by the centre ‘cut’, which comprises three relief holes and six loaded
‘cut’ holes around the lower centre of the blast face. The purpose of this centre
‘cut’ is to provide a void, or relief, before other production holes are blasted
allowing the rock to fall away from the face into the space provided by the
centre cut. Each sector is then detonated in a pre-determined sequence based
on the detonator time delay and the sector time delay. The order of blasting is
that the cut will be detonated and ejected first, followed by the production /
lifter holes and finally the perimeter holes will detonate to provide a smooth
tunnel profile.
The perimeter holes will be typically loaded with a Maximum Instant Charge
(MIC) of 0.53 kg / hole (4.0 m deep blasthole), while the production holes will

A10-16
be loaded with an MIC of 0.5-5.0kg / hole depending on the allowable MIC
and the blasthole depth.
The distribution of design MIC for the WIL alignment is shown in Figure 2.2. It
can be seen that more than 70% of the design MIC is less than 2 kg.
Figure 2.2 Distribution of Design MIC for the WIL Alignment
0 - 0.5kg
31%
0.5-1kg
17%
3-4kg
6%
1-2kg
26%
2-3kg
16%
4-5kg
4%
A review of the allowable MIC’s over the length of the entire WIL project
(tunnels, adits and station boxes), indicates that the WIL project will require
approximately 5,660 individual blast rounds for completion.
Depending on the radial distance to the controlling sensitive receiver(s) and
the resultant MIC, the maximum blast length would be 3 to 4 m, while the
minimum would be about 0.5 m, for each blast round.
2.3.4 Typical Station Block Blasting for WIL
The station excavation will involve the blast face consisting of up to 6 sectors.
The initial blast will provide the centre ‘cut’ to allow the collapse of the rock
from the surrounding sectors of the blast face. An upper central ‘pilot’ section
is subsequently blasted from the station face, followed by upper outer strips
either side of the central pilot section. Finally, the base section of the working
face is extracted by one or more bench blasts.
2.4 DESIGN OF THE EXPLOSIVE MAGAZINE
The proposed magazine is sized for a maximum storage equivalent of about
two days of forecast daily explosive consumption at peak output. It consists of
9 niches, 8 of which are designed to store up to 300 kg of Category 1 explosive
each. A separate niche will be used to store detonators. The amount of
detonators to be stored will be about 7-9kg net explosives quantity (NEQ).
The following design codes were used as a reference in the design of the
magazine:
• US Department of Labor, Mine Safety and Health Administration, Title
30 Code of Federal Regulations, Parts 1 through 199, July 2003
(CFR30);

A10-17
• AS2187.1 – 1998 Explosives – Storage, transport and use Part 1 Storage;
and
• US Department of Defense, DoD 6055.9-STD, DoD Ammunition and
Explosives Safety Standards, Oct 2004.
The proposed Magazine is planned as an underground cavern to be built
beneath Mount Davis and located near a disused Government Facility Site
with an entrance adjacent to Victoria Road (see Figure 2.3). It is proposed to
use an existing flat platform of land to access the underground magazine.
The advantages of the proposed location are:
• the site is as far as practicable from any densely populated areas;
• good rock cover;
• good accessibility from Victoria Road to all areas of the site;
• minimal public road usage to the principal construction access shafts;
• public areas (mainly Victoria Road) and the Works will be shielded
from direct blast effects by the orientation of the portals, in the unlikely
event that a magazine explosion should occur;
• multiple magazines (for all contractors) can all be located together to
facilitate security.
The magazine is sized to contain a buffer stock to offset a possible interruption
in Mines deliveries due to weather, sea conditions or other unforeseen
circumstances.
The two entrances of the magazine complex will be protected by reinforced
concrete barrier walls and covered with absorbent material designed to catch
any explosion debris and to reduce the effects of air overpressure in the
unlikely event of an accidental explosion within the magazine.
Security of the explosives kept on site is an acknowledged priority. As this is a
public report, details of security arrangements are provided separately. Other
safety precautions of the magazine are described in [31].
2.5 CONSTRUCTION OF THE PROJECT MAGAZINE
The construction of the tunnels and storage niches of the underground
magazine will largely use site sensitized bulk emulsion explosives. Cartridged
emulsion will be also required during the trial blasting phase. All explosives
materials will be delivered to the site on a daily basis by Mines to enable a
mid-afternoon blasting time. There will be no storage of explosive on-site.
Bulk emulsion precursor will be delivered on-site by the appointed third party
supplier.
A10-18
The construction of the magazine adit / tunnel will adopt the following
general procedure:
1. Construct access to portal area;
2. Construct the portal site formation;
3. Form the tunnel portal and excavate beneath Victoria Road by non-
blasting methods;
4. Install permanent support structures as required;
5. Install temporary protective blast doors at the tunnel portals;
6. Excavate the next 10 m of tunnel using the heading and bench or pilot
and strip drill and blast methods;
7. Excavate the remaining adit / tunnel using full face drill and blast; and
8. Complete the fitting out of the magazine tunnels and portal facilities.
The initial excavation of the magazine access tunnel will be by mechanical
methods. This will extend for 40 m until the tunnel has passed beneath
Victoria Road. This is to minimise the possible risks to Victoria Road and its
adjacent slopes due to ground shock during the construction of the magazine.
After this, the construction of the magazine will primarily use site-sensitized
bulk emulsion and cartridged emulsion explosives. Cartridged emulsion
explosives and initiation systems will be delivered to the construction site on a
daily basis by Mines.
2.6 CONSTRUCTION OF THE WIL TUNNELS AND ADITS
The construction of the WIL tunnels will be similar to the construction of the
underground Magazine. After commissioning of the underground magazine
the proposed delivery-storage-blasting cycle will consist of the following
elements:
1. Weekday morning deliveries of explosives and initiating systems to
the underground magazine by Mines as needed.
2. Storage in the underground magazine niches. Each contractor will
have one or more dedicated explosive stores
3. Transfer from the explosives niche(s) to the main construction access
shafts of the excavation utilizing public roads via routes as indicated in
Figure 2.5.
4. Transfer from the access shafts to the working face(s) of the excavation
via underground adits.
5. Load and fire the face(s) to be blasted. Regular times of initiation to be
kept to wherever possible (say 7am, 12:30pm, 7pm). It has been

Magazine Location and LayoutFigure 2.3

Proposed Explosive Delivery Routes from Underground MagazineFigure 2.5

A10-19
estimated that at peak rates, one or two blasts will be carried out each
day at selected locations. Blasts in a particular area will be initiated
from a common firing point once all personnel are clear and entry
routes to each blast site are secured. All blasts are to be carried out
underground.
2.7 TRANSPORT OF EXPLOSIVES AND INITIATION SYSTEMS
2.7.1 Overview
Generally the explosives and initiating system requirements for a particular
drill and blast project are delivered on a daily basis by Mines Division,
arriving at the designated site at around 12 noon – 1:00 pm. This means that
blasts can only be fired mid-late afternoon, and limits the project to one blast
face / day.
When approved by Mines Division, a dedicated on-site explosives magazine
can be constructed to service the particular needs of a project. This enables
more than one blast face / day assuming the drill and blast cycle can be
completed each 12 hours.
Mines Division limit the amount of explosives that a Contractor can transport
from the magazine to the blast site to 200 kg. However, the amount of
explosives that will be transported during the project construction phase is a
maximum of 125 kg of cartridged emulsion, which is equivalent to 120 kg of
TNT, based on estimated peak explosive usage. In some circumstances this
limit necessitates more than 1 trip to deliver the required volume of explosives
for a blast.
Detonators shall be transported in a separate licensed vehicle and are never to
be carried with explosives.
The project magazine allows any unused explosives or detonators from a blast
to be returned to their magazine niches. If the magazine is unavailable, then
any unused cartridged emulsion explosives must be destroyed by burning,
and excess initiating systems (detonators) shall be destroyed by linking them
into the subject blast.
2.7.2 Transport Strategy
Bulk emulsion precursor will be delivered directly to site by the appointed
third party supplier. It should be noted that bulk emulsion precursor is not an
explosive. It will not become an explosive until after being sensitized at the
blast face while being pumped into blastholes.
The overall intent is that Mines Division will deliver explosives daily to a
maximum of one construction site and the project magazine, from where
explosives will be transferred to the point of use by the contractors.

A10-20
• Two deliveries will be made each day to most of the delivery points. The
first delivery each day will be made in the early morning when roads will
be relatively quieter.
• Loads will be limited to a maximum of 125kg per truck, which is the
maximum load expected for the project.
Each contractor will have at least two licensed explosive trucks to facilitate
delivery to their designated storage niche(s).
Explosives will then be transferred to the relevant niche by the relevant
contractor using their licensed truck. No more than one truck will be allowed
within the magazine complex at any one time.
The transport strategy for the explosives is shown in Figure 2.4.
Figure 2.4 Transport Strategy for the Explosives
Explosives and detonators will be transported separately from the
underground magazine to the designated access shafts / blasting sites by the
contractors’ licensed delivery vehicles under the escort of armed security
guards. Deliveries of explosives will take place during non-peak traffic hours
where possible.
Only access points 1 to 4 and 7 will be used for explosive deliveries (see Figure
2.5).
To minimise the transport risk, the following principles have been observed in
planning delivery routes between the magazine and the various sites:
• Routes have been planned to avoid areas of high population density
and Potentially Hazardous Installations (PHIs) wherever possible.
• Two deliveries will be made each day to most of the delivery points /
access shafts (see Figure 2.5). The first delivery each day will be made
in the early morning when roads will be relatively quieter.

A10-21
• Loads will be limited to a maximum of 200 kg per truck in accordance
with the permit issued by Mines Division. However, the maximum
explosive load is 125 kg based on peak explosive use during the
construction phase.
• The quantity of Category 1 cartridged emulsion explosives on the
roads has been minimised by using bulk emulsion precursor, which
will be sensitised at the blast face
• Bulk emulsion precursor will be delivered directly to site by the
appointed third party supplier. It should be noted that bulk emulsion
precursor is not an explosive. It will not become an explosive until
after being sensitised at the blast face while being pumped into
blastholes
2.7.3 Safety Features of Transport Vehicles
The transport truck for explosives will be licensed by Mines Division and will
meet all regulatory requirements for that transport.
The licensed explosives delivery vehicles will have the following safety
features:
• Diesel powered;
• Battery and fuel isolation switches;
• Forward mounted exhaust with spark arrestor;
• Two fire extinguishers;
• Lockable wood lined steelor aluminium receptacles mounted on the
vehicle tray; and
• Fold down / up explosives warning signs and rotating flashing light.
2.7.4 Details of Cartridged Emulsion Deliveries
The Cartridged Emulsion Explosives will be delivered to the various
construction sites using the public roads as shown in Figure 2.5. The proposed
site delivery points are the access shafts at:
1. Ex-police quarters, Kennedy Town;
2. Kennedy Town Swimming Pool (Smithfield Road);
3. Site at Kennedy Town Praya;
4. Site at end of South Lane; and
7. Site at Sai Woo Lane.
Other access points will not be used for delivery of explosives from the
magazine.
According to the current programme of work, delivery of cartridged emulsion
explosives to points 1, 2, 3, 4 and 7 will be required from 2009 to 2011.
Construction Phase I will require delivery of cartridged emulsion to Points 1
to 4 and 7 while Construction Phase II will only require delivery of cartridged
emulsion to Points 3 and 4. There will be no overlap between the two phases.

A10-22
The maximum amount of anticipated daily deliveries of cartridged emulsion
by the contractors to points 1, 2, 3, 4 and 7 for Construction Phase I is
summarised in Table 2.4 below, while the maximum anticipated daily delivery
to points 3, 4 for Construction Phase II is summarised in Table 2.5. The
deliveries to point 7 will either be carried out in the morning or in the
afternoon. In addition to the cartridged emulsion, detonating cords and cast
boosters, will be stored and transported. These have been included in the
weight figures in Table 2.4 and Table 2.5. The proposed delivery routes to the
delivery points are shown in Figure 2.5.
The explosives delivery quantities are summarised in Table 2.4 and Table 2.5
for Construction Phase I and Phase II respectively. Construction Phase I has
the highest transport frequency per year and hence been selected as the basis
of the QRA.
Table 2.4 Explosives Delivery Quantities – WIL Construction Phase I
Contractor Delivery Point Daily
AM
Delivery
(kg/day)
No of
Trips
AM
Daily
PM
Delivery
(kg/day)
No of
Trips PM
Consumption
(kg/day)
Contractor
B
1 – Ex-police-quarters,
Kennedy Town
80 1 0 0 80
2 – Kennedy Town
Swimming Pool
80 1 0 0 80
Contractor
C
3 – Site at the Kennedy
Town Praya
125 2 125 2 500
4 – Site at the end of
South Lane
80 1 80 1 160
Contractor
D
7 – Site at the Sai Woo
Lane
80* 1* 0* 0* 80
* Delivery may be carried during PM instead of AM
Table 2.5 Explosives Delivery Quantities – WIL Construction Phase II
Contractor Delivery Point Daily
AM
Delivery
(kg/day)
No of
Trips
AM
Daily
PM
Delivery
(kg/day)
No of
Trips PM
Consumption
(kg/day)
Contractor
C
3 – Site at the Kennedy
Town Praya
80 1 80 1 160
4 – Site at the end of
South Lane
80 1 80 1 160
2.7.5 Transport Route
Explosives are transported from the magazine to the access shafts / blasting
sites using the routes as shown in Table 2.6 below.

A10-23
Table 2.6 Delivery Routes for Explosives to the Blasting Site
Delivery Point - Destination Route
1 – Ex-police-quarters,
Kennedy Town
Victoria Road – Ka Wai Man Road
2 – Kennedy Town
Swimming Pool
Victoria Road – Cadogan Street – Catchick Street – Smithflied
Road
3 – Site at the Kennedy Town
Praya
Victoria Road – Cadogan Street – New Praya, Kennedy Town –
Shing Sai Road – Sai Cheung Street – Kennedy Town Praya
4 – Site at the end of South
Lane
Victoria Road – Cadogan Street – New Praya, Kennedy Town –
Shing Sai Road – Connaught Road West – Ka On Street – Des
Voeux Road West – Whitty Street – Queens Road West – Woo
Hop Street – South Lane
7 – Site at the Sai Woo Lane Victoria Road – Cadogan Street – New Praya, Kennedy Town –
Shing Sai Road – Connaught Road West / Central – Rumsy
Street – Wing Lok Street – Morrision Street – Connaught Road
West – Queens Street – Queen Street West
It is recognised that the above routes involve transport through densely
populated high rise residential areas. This is taken into account in the risk
assessment.
A10-24
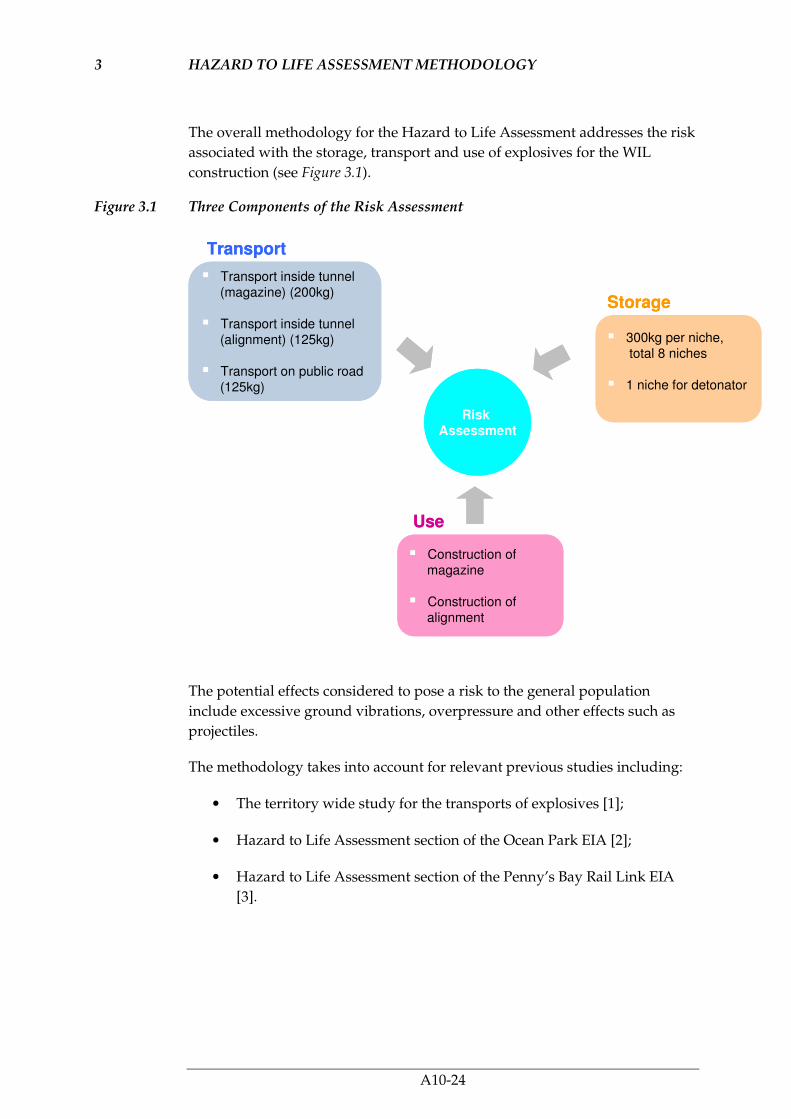
3 HAZARD TO LIFE ASSESSMENT METHODOLOGY
The overall methodology for the Hazard to Life Assessment addresses the risk
associated with the storage, transport and use of explosives for the WIL
construction (see Figure 3.1).
Figure 3.1 Three Components of the Risk Assessment
The potential effects considered to pose a risk to the general population
include excessive ground vibrations, overpressure and other effects such as
projectiles.
The methodology takes into account for relevant previous studies including:
• The territory wide study for the transports of explosives [1];
• Hazard to Life Assessment section of the Ocean Park EIA [2];
• Hazard to Life Assessment section of the Penny’s Bay Rail Link EIA
[3].
� Transport inside tunnel (magazine) (200kg)
� Transport inside tunnel (alignment) (125kg)
� Transport on public road (125kg)
� 300kg per niche,total 8 niches
� 1 niche for detonator
� Construction of magazine
� Construction of alignment
Risk Assessment
Transport
Use
Storage
� Transport inside tunnel (magazine) (200kg)
� Transport inside tunnel (alignment) (125kg)
� Transport on public road (125kg)
� 300kg per niche,total 8 niches
� 1 niche for detonator
� Construction of magazine
� Construction of alignment
Risk Assessment
Transport
Use
Storage

A10-25
The elements of the QRA are shown schematically in Figure 3.2. It includes the
following steps.
• Relevant data on the proposed storage magazine, the transport from
the magazine and the use of explosives at the blast face, as well as
population and vulnerable receptors, such as slopes, retaining walls
etc., in the vicinity of the tunnel construction and proposed transport
routes were collected and reviewed.
• A structured study, involving a “what-if” analysis, was conducted to
identify all the hazards associated with the storage, transport and use
of the proposed blasting explosives. A review of literature and accident
databases was also undertaken. These formed the basis for identifying
all the hazardous scenarios for the QRA study.
• The frequencies, or the likelihood, of the various outcomes that result
from the hazards associated with the storage and transport of blasting
explosives were taken from published references; such as the UK HSE,
TNO, or from previous EIA QRAs that have been accepted by the
relevant authority. Where necessary, these frequencies are modified to
take account of local factors.
• The frequencies of scenarios associated with the use of explosives at
the blast face were established using fault tree analysis, in conjunction
with a human factor assessment to evaluate human error probabilities.
• For all identified hazards the frequency assessment has been
documented and the consequences of the event were modelled.
• The consequence model employed by the QRA varied depending on
the location of any explosion, i.e. above or below ground, and upon the
receiver, i.e. slope, building or person.
• The consequence and frequency data were subsequently combined
using ERM’s proprietary software Riskplot TM to produce the required
risk estimates.
• Finally, the results from the risk assessment were compared to the
HKRG. Recommendations have been made where required to ensure
compliance with relevant best practice, and to reduce the hazard by
strengthening various vulnerable receptors.

A10-26
Figure 3.2 Schematic Diagram of QRA Process
Published / Historical Data
Storage Transport Use
Hazard Identification
Initiating Event
Frequency
Event Tree Frequency
Outcome Frequency
Risk Summation
Risk Profile
Risk Assessment
Risk Criteria
Population
Consequence
Modelling
Physical Effects Modelling
Hazard Zone of Consequence
Hazard Identification
What-If Study
Failure Mode
Analysis
Initiating Event Frequency
Human Factors Assessment
Fault Tree Analysis
Outcome Frequency
Vulnerable Receptors
Published /
Historical Data

A10-27
3.1 GENERAL ASSUMPTIONS OF THE STUDY
The study has assumed that cartridged emulsion is being used throughout the
WIL project (see Figure 3.3). This represents the a worst case scenario, as the
use of bulk emulsion, which is more likely to be used, will significantly reduce
the amount of explosive material that is required to be stored and transported.
It is estimated that in reality, no more than 20% of the blasts will use
cartridged emulsion. However, all trial blasts will use cartridged emulsion.
When bulk emulsion explosives are used on a daily basis by Contractors, the
volume of cartridged emulsion explosives being transported along public
roads will reduce dramatically to between 15 – 30 kg per trip. This amount of
cartridged emulsion is based on their use as a primer or booster for the bulk
emulsion. However, it should be noted that the number of detonators required
will not change with the use of bulk emulsion.
Hence, the risk estimated by this study can be considered as upper bound and
the actual risks will be lower.
Figure 3.3 Consumption of Explosives for the WIL
Notes: The quantities assumed for use, transport, storage for the QRA are higher than the
predicted actual consumptions, to account for the peak consumption in a year for conservative
purpose
� No of delivery per year: 365 times for point 1, 2 & 7,
1460 times for point 3 and 730 times for point 4
� Quantity of explosives delivered per day: 900kg/ day
� Maximum Load per vehicle: 125 kg
� Assumed explosives delivery (from magazine): 330ton/year
or 990 ton/project
� No of delivery by contractor per year: 365 x 6 times
� Quantity of explosive delivered by contractor per trip: 200kg
� Assumed explosives Delivery (to magazine): 438 ton/year
or 1,314 ton/project
� No of Blast round per year: 5660
� No of blasthole per round: 65 – 120
� Quantity of explosive per blasthole: 0.5 – 5kg
� Assumed explosives consumption: 300 ton/year or 900 ton/project
Predicted Actual Consumption: 600 ton/project
Use
Storage

A10-28
4 POPULATION ESTIMATES
4.1 POPULATION ESTIMATE NEAR THE EXPLOSIVE MAGAZINE
The nearest public inhabited building, 410 Victoria Road, is 64m to the north
east at its closest point to the magazine tunnel. This building is approximately
110m to the north of the nearest explosives storage chamber.
In addition Victoria Road is 67m to the west of the nearest explosive storage
chamber at its closest point.
4.1.1 Nearby Populations
The possible persons at risk to an incident within the explosives magazine are
located in:
• Nearby occupied buildings;
• Road vehicles and pedestrians on Victoria Road; and
• Boats operating in the West Lamma Channel and Sulphur Channel.
Occupied Buildings
The area surrounding the proposed magazine site is sparsely populated.
However, there are some inhabited buildings situated to the North just off
Victoria Road. These are presented in Table 4.1.
Table 4.1 Population for Occupied Buildings for Consequence Assessment for Storage of
Explosives
Number Building name Street Name Population
Day Night
1 Abandoned building 410 Victoria Road 0 0
2 Caritas Jockey Club Hostel
Mount Davis
405 Mount Davis
Cottage Area
200 200
3 Chee Sing Kok Social
Centre of the Humanity
Life
404 Mount Davis
Cottage Area
200 200
Road Users
The road population density has been obtained from the 2000 – Based District
Traffic Model (BDTM). A growth factor of 1% per year to the construction year
is included.
The road population density was calculated using the formula:-
Population Density = P N / (1000 W V)

A10-29
where P is the average number of persons per vehicle, assumed to be
equal to 3
W is the road width, m
V is the vehicle speed, km/hr
N is the number of vehicles counted
The following table lists the road population density used in the study:
Table 4.2 Road Population Density for Consequence Assessment for Storage of
Explosives
Road Name Road Population Density (persons/m2)
AM PM
Victoria Road – North of Magazine 0.0071 0.019
Victoria Road – South of Magazine 0.0051 0.014
The pedestrian population density on the footpaths is assumed to be 0.15
persons/m² during the morning non peak hours and 0.25 person/m² during
peak hours. It is assumed that there are no pedestrians between 10pm and 6
am.
A high density value of 0.5 persons/m² is equivalent to a footpath level of
service D, as defined by the Highway Capacity Manual. This level of service
provides for a reasonable smooth flow of pedestrians, but friction and
interaction between the pedestrians is likely. This is considered to be very
conservative for the footpaths alongside Victoria Road at the location of the
magazine. Therefore, a value of 50% of this level is assumed for peak hours
only and 33% for other times.
However, for the assessment of fatalities caused by slope failure the Transport
Department Annual Traffic Census 2007 was used for the station 2206 located
on Victoria Road between Smithfield Road and Mount Davies Road. The
average daily traffic values have been inflated by 1% per year to represent the
likely traffic during the construction and operation of the magazine in 2009.
Table 4.3 Annual Average Daily Traffic for Victoria Road between Smithfield Road and
Mount Davies Road
Number Road name Annual Average
Daily Traffic
From To West East
2206 Belchers Street and
Victoria Road
Smithfield
Road
Mount Davies
Road
4,020 3,450
Waterways
The exit portals of the magazine are facing North West looking over the West
Lamma Channel, near the entrance to the Sulphur Channel that separates
Green Island and Hong Kong Island. The distance of the magazine entrance
and exit portals to the coastline is 70m, with the shipping navigation channel a
further 150m from the shoreline.

A10-30
4.2 POPULATION ALONG EXPLOSIVES DELIVERY ROUTES
The proposed route for the transport of explosives would involve the
explosives truck passing through densely populated high rise commercial
areas, in particular Des Voeux Road, Wing Lok Street and Connaught Road.
Also situated along the route are a number of residential buildings, schools,
outdoor recreation areas and educational institute (Kennedy Town Centre).
The risk assessment focuses on the high rise blocks, representing the largest
concentration of people indoors (people indoors are relatively more
vulnerable to the effects of an accidental explosion than those outdoors). All of
the buildings along the delivery route (see Annex C) have been entered
individually into the risk ‘model’, so as to accurately represent the population.
A population density approach has been adopted for modelling the presence
of pedestrians and road users.
Population data have been collected by a combination of survey, the Code of
Practice for Fire Safety, Planning Department Zoning Plans and the census.
Three types of population have been considered:
• Pedestrian population on footpaths and pavements next to delivery
routes;
• Road population; and
• Building population.
Assumptions used in estimating population are listed in Table 4.4.
Table 4.4 Population Assumptions
Type of Population Assumption Remarks
Residential Building 3 persons / flat Governments Territorial Population and
Employment Data Matrices (TPEDM) indicates
current Persons Per Unit (PPU) in Kennedy Town,
University and Sai Ying Pun are 2.61, 2.995 and
2.46 respectively. A value of 3 has been adopted as
a conservative assumption.
Commercial Building 9 m2/person Code of Practice for the Provision of Means of
Escape in Case of Fire indicates 9m2/person as a
minimum requirement.
Footpath 0.5 persons /m2 Density figure of 0.5 persons/m2 is defined as
footpath Level Of Service (LOS) in the Highway
Capacity Manual. this is considered as a
reasonable conservative density for the footpaths
in the study area and is supported by surveys
carried out during the preliminary design stage
which indicated lower values..
Education Institute 500 persons / hall

A10-31
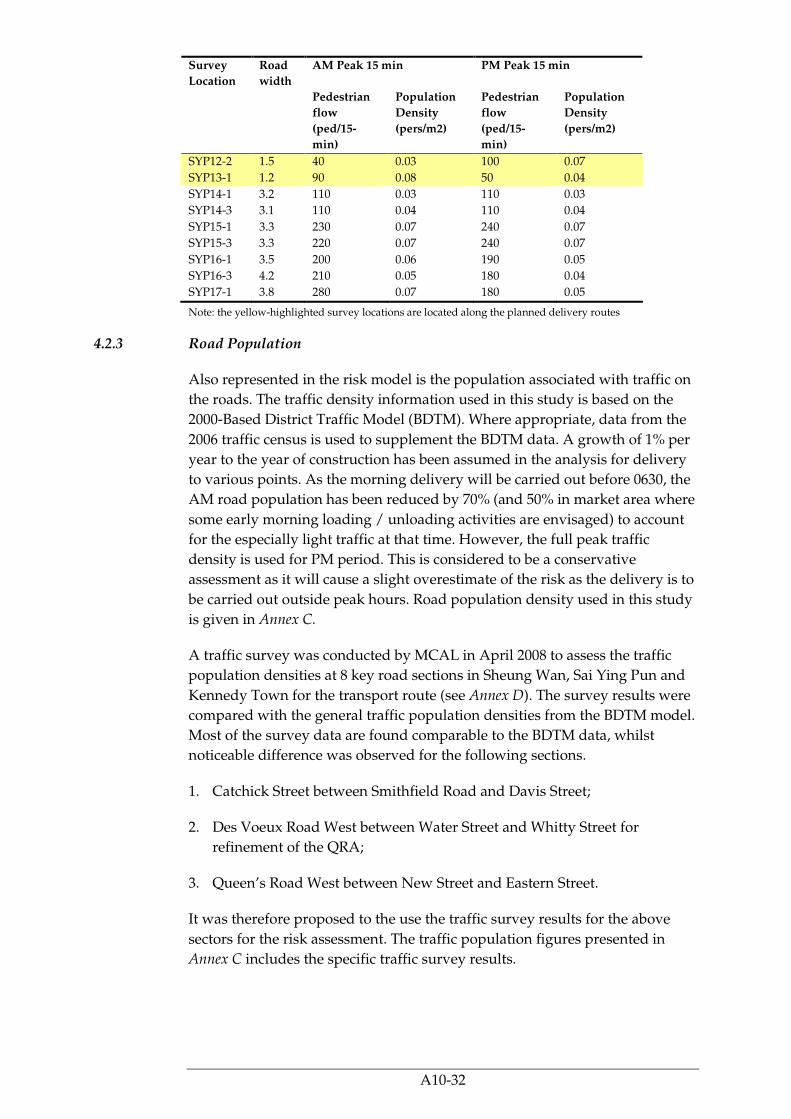
4.2.2 Pedestrian Population
The 0.5 persons/ m2 is the assumed pedestrian population density as per Table
4.4 . For morning delivery, a density figure of 0.25 persons/m2 is adopted for
the footpaths from Ka On Street to South Lane (to delivery point 4) and the
footpaths along Queens Road West, Second Street and Bonham Road (near
delivery point 7) to account for the reduced footpath population density as
morning delivery will be made in very early hours, ie. before 0630. A density
figure of 0.15 persons/m2 is used for all other footpaths. This value is
considered conservative when compared with the Traffic Impact Assessment
(Working Paper WP TT07) [14].
In the Traffic Impact Assessment, pedestrian flow had been assessed at
locations near the planned station entrances. Results are extracted in Table 4.5
below. For those survey locations along the delivery routes (highlighted
yellow in Table 4.5), the survey results indicated that the a.m. and p.m. peak
pedestrian densities are lower than those adopted in this study. The higher
density figures, as specified in Table 4.5, are nevertheless adopted to maintain
a reasonably conservative estimate, and cater for fluctuation of population
density along the routes (e.g. at bus stops).
Table 4.5 Pedestrian Density Extracted from WP TT07
Survey
Location
Road
width
AM Peak 15 min PM Peak 15 min
Pedestrian
flow
(ped/15-
min)
Population
Density
(pers/m2)
Pedestrian
flow
(ped/15-
min)
Population
Density
(pers/m2)
KET1-1 2.5 70 0.03 40 0.02
KET5-1 2.6 290 0.11 330 0.13
KET6-1 3.1 260 0.08 270 0.09
KET7-1 2.3 80 0.03 40 0.02
KET8-1 2.7 50 0.02 30 0.01
KET9-1 2.9 100 0.03 10 0.00
KET10-1 2.7 310 0.11 130 0.05
KET15-1 2.7 340 0.13 320 0.12
KET16-1 3 330 0.11 390 0.13
KET17-1 3 350 0.12 470 0.16
KET18-1 3 180 0.06 190 0.06
UNI1-1 2.6 140 0.05 140 0.05
UNI4-1 2.6 30 0.01 60 0.02
UNI4-2 1.5 80 0.05 110 0.07
UNI5-1 3.3 110 0.03 170 0.05
UNI6-1 2.8 50 0.02 30 0.01
UNI11-1 4.4 400 0.09 540 0.12
UNI12-1 2.1 230 0.11 240 0.11
UNI13-1 3.8 300 0.08 550 0.14
UNI14-1 3.8 290 0.08 410 0.11
UNI15-1 4.6 330 0.07 420 0.09
SYP3-1 2.8 130 0.05 70 0.03
SYP4-1 1.6 360 0.23 260 0.16
SYP5-1 1.8 110 0.06 60 0.03
SYP8-1 1.6 70 0.04 40 0.03
SYP10-1 1.9 20 0.01 20 0.01
SYP11-1 1.8 70 0.04 60 0.03
SYP12-1 1.5 40 0.03 100 0.07
A10-32
Survey
Location
Road
width
AM Peak 15 min PM Peak 15 min
Pedestrian
flow
(ped/15-
min)
Population
Density
(pers/m2)
Pedestrian
flow
(ped/15-
min)
Population
Density
(pers/m2)
SYP12-2 1.5 40 0.03 100 0.07
SYP13-1 1.2 90 0.08 50 0.04
SYP14-1 3.2 110 0.03 110 0.03
SYP14-3 3.1 110 0.04 110 0.04
SYP15-1 3.3 230 0.07 240 0.07
SYP15-3 3.3 220 0.07 240 0.07
SYP16-1 3.5 200 0.06 190 0.05
SYP16-3 4.2 210 0.05 180 0.04
SYP17-1 3.8 280 0.07 180 0.05
Note: the yellow-highlighted survey locations are located along the planned delivery routes
4.2.3 Road Population
Also represented in the risk model is the population associated with traffic on
the roads. The traffic density information used in this study is based on the
2000-Based District Traffic Model (BDTM). Where appropriate, data from the
2006 traffic census is used to supplement the BDTM data. A growth of 1% per
year to the year of construction has been assumed in the analysis for delivery
to various points. As the morning delivery will be carried out before 0630, the
AM road population has been reduced by 70% (and 50% in market area where
some early morning loading / unloading activities are envisaged) to account
for the especially light traffic at that time. However, the full peak traffic
density is used for PM period. This is considered to be a conservative
assessment as it will cause a slight overestimate of the risk as the delivery is to
be carried out outside peak hours. Road population density used in this study
is given in Annex C.
A traffic survey was conducted by MCAL in April 2008 to assess the traffic
population densities at 8 key road sections in Sheung Wan, Sai Ying Pun and
Kennedy Town for the transport route (see Annex D). The survey results were
compared with the general traffic population densities from the BDTM model.
Most of the survey data are found comparable to the BDTM data, whilst
noticeable difference was observed for the following sections.
1. Catchick Street between Smithfield Road and Davis Street;
2. Des Voeux Road West between Water Street and Whitty Street for
refinement of the QRA;
3. Queen’s Road West between New Street and Eastern Street.
It was therefore proposed to the use the traffic survey results for the above
sectors for the risk assessment. The traffic population figures presented in
Annex C includes the specific traffic survey results.

A10-33
4.2.4 Building Population
The consequence assessment has determined the maximum hazard zone for
1% fatality level of 42m for the detonation of the 125kg (maximum delivery
quantity) of cartridge explosives in a licensed vehicle. Accordingly,
population within the first 12 floors of a building may be affected.
The hazards due to an explosion during the transport of explosives are
principally overpressure and flying debris. For the purpose of this study, it is
considered that people at the rear of the building facing the road will not be
impacted by overpressure or flying debris.
The hazard footprint was overlaid on the population polygons (road lanes,
pavement areas and building areas) to establish overlap areas from which the
number of fatalities could be estimated. Ideally, a spherical vulnerability
model should be adopted. However, for simplification purpose, a
conservative cylindrical model was used to estimate the number of persons
which could be impacted by each consequence contour. The consequence
distances were estimated and the population up to 36m for transport of
explosives from magazine to delivery point 01, 02, 04 and 07, and 42 m for the
delivery to point 03 , as given in Table 7.8 (assumed to be equivalent to 10
floors and 12 floors respectively) was considered within the cylinder. This
represents the 1% probability of fatality limit.
Figure 4.1 Consideration of Population Inside Building
Population details for buildings along the transport route are given in Annex
C.
4.3 POPULATION CONSIDERED FOR THE USE OF EXPLOSIVES
All the sensitive receivers, including buildings, slopes, utilities and other
structures within a distance of 100m along the blasting route have been
considered in this assessment.
Exposed
Population
Explosion occurs on road during
Delivery
truck
Consequence
Zone

A10-34
This distance is equivalent to a peak particle velocity value of approximately
35 mm/sec based on a worst case scenario of the simultaneous detonation of 6
charges within the blast face. Assuming that the maximum charge per
blasthole is 5kg, then the total maximum simultaneous charge weight is 30 kg.
Therefore, the peak particle velocity at 100m is estimated as (see Section 7.2.6):-
PPV = K (D / Q 0.5) -1.22
PPV= 1200 (100 / 30 0.5) -1.22 = 34.7mm/s
The limit for the cosmetic damage to buildings lies between 25mm/s and
50mm/s depending on its construction. For slopes, this level of PPV will not
cause significant slope movement. This is consistent with GEO Guide 4 [9]
Section 5.7.1 which states “As a general guide, blast vibration from subsurface
works are normally not potentially damaging at distance of more than 50m.”
Figure 4.2 provides a three-dimensional view of the blasting chainage and
sensitive receivers for the WIL alignment considered in the study. Those
features considered as sensitive receivers are described in Section 4.3.1.
The sensitive receivers are represented by a point or a number of points in the
analysis. The whole alignment is also represented by points at every 10-m
chainage interval.
The latitude and longitude (ie ‘Northing’ and ‘Easting’) of every point shown
in Figure 4.2 are based on the ‘Hong Kong 1980 Grid’ coordinate system in
Hong Kong. The plot of ‘Northing’ (y-axis) and ‘Easting’ (x-axis) is shown as
the horizontal plane in this figure. The level of a point refers to the elevation of
the relative receiver with respect to the Principal Datum (the unit is mPD), and
is shown as z-axis in this figure.
Similarly, three-dimensional view of the blasting chainage and sensitive
receivers for the magazine store considered in the study is shown in Figure 4.3.
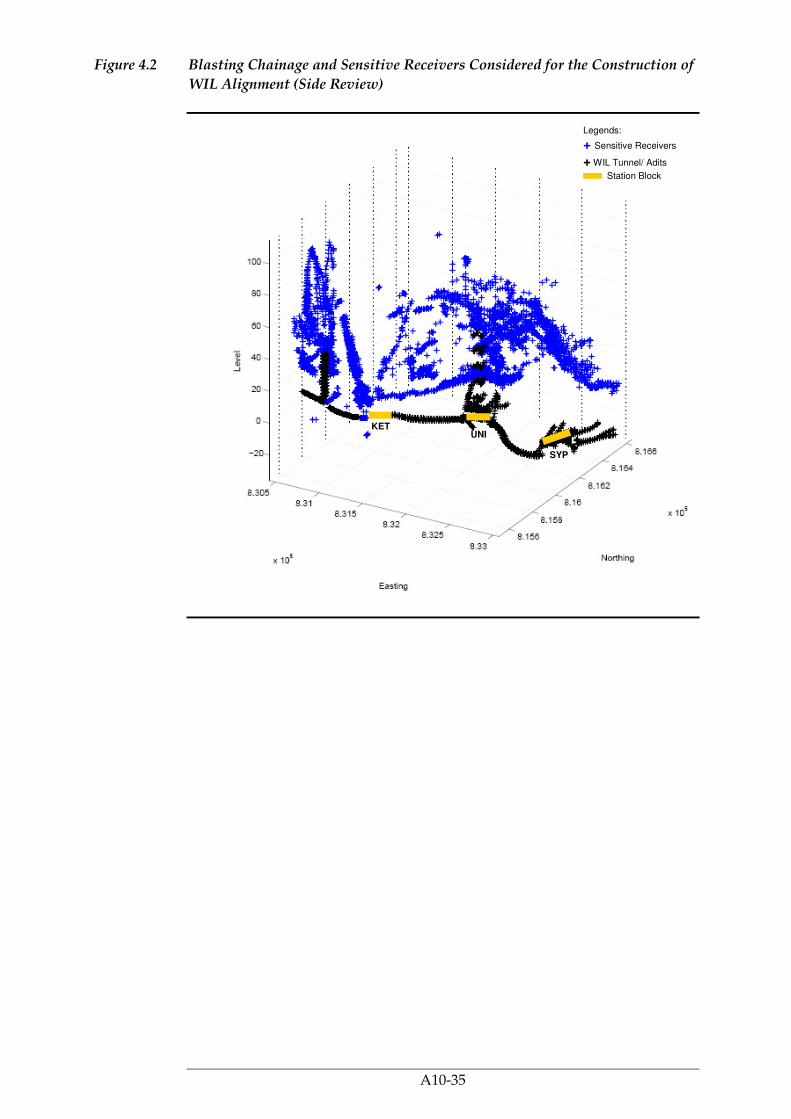
A10-35
Figure 4.2 Blasting Chainage and Sensitive Receivers Considered for the Construction of
WIL Alignment (Side Review)
KET UNI
SYP
Legends:
+ Sensitive Receivers
+ WIL Tunnel/ Adits
Station Block

A10-36
Figure 4.3 Blasting Chainage and Sensitive Receivers Considered for the Construction of
the Magazine (Top View and Side View)
8.3
8.301
8.302
8.303
8.304
8.305
x 105
8.15
8.152
8.154
8.156
8.158
x 105
0
50
100
150
200
NorthingEasting
Level
8.38.301
8.3028.303
8.3048.305
x 105
8.158.152
8.1548.156
8.158
x 105
0
20
40
60
80
100
120
140
160
180
200
EastingNorthing
Level
Legends:
+ Sensitive Receivers
+ Magazine Store
Height from +0 mPD
a) Top View
b) Side View

A10-37
4.3.1 Features Considered for the Study
The following sets of features were considered as sensitive receivers in the
Blast Assessment Report [4]-[6]:
• Man Made Slopes and Retaining walls
These features include cut slopes, fill slopes, retaining walls and a
combination of these. The slopes are covered with all types of facing,
including shotcrete, chunam, stone facing and vegetation.
• Natural Terrain Hillside and Boulders
There are no natural terrain hillsides or pockets of natural terrain within
the influence zone of WIL alignment. In addition there are no boulders
located above the proposed blasting zone. The nearest natural terrain is Lu
Fung Shan which is located more than 100m in plan from the southern
side of UNV station.
The only relevant boulders for the WIL project are located near the
proposed magazine in Mount Davis. Several site inspections of natural
hillside were carried in 2008 as part of blast assessment [4]-[6]. Twenty-
four boulders were identified at the hillside above the magazine.
However, none of them are located above any occupied building and their
conditions have been considered to be well embedded.
• Existing Buildings and structures
Since the WIL alignment is proposed along an urban area and the whole
area has been developed with buildings and structures. This item includes
all buildings and structures within the 100 m from the WIL alignment and
magazine.
• Utilities
There are numerous underground utilities facilities near the proposed
WIL alignment. The facilities include gas pipes, electricity cables,
telephone cables, cable television services, stormwater drains and sewage
pipes, such as gas main, fresh water main
• Other facilities
These refer to features other than those listed above but have been
included in the Blast Assessment Report [4]-[6] as sensitive receivers.
These include elevated roads, disused tunnel networks near SYP and
UNV, etc.
The features were identified by desktop or site survey as part of the Blast
Assessment. Every feature was represented by one or more coordinates in a 3-
dimensional plane (Northing, Easting, and Elevation) based on data given in
the Blast Assessment Report. More than 5000 feature points were identified for
this WIL project.

A10-38
5 HAZARD IDENTIFICATION
5.1 OVERVIEW
Hazard identification consisted of a review of:-
• explosive properties;
• scenarios presented in previous relevant studies;
• historical accidents; and
• discussions with blasting specialists.
In addition, an expert panel review was commissioned by ERM/MTRC to
review the key assumptions/ uncertainty for the risk assessment for the
storage, transport and use of explosives in the context of the WIL Quantitative
Risk Assessment. The review was held at ERM office in Hong Kong on 21-23
July 2008 [10].
5.2 ACCIDENTAL INITIATION DUE TO HAZARD PROPERTIES OF EXPLOSIVE
5.2.1 Hazard Properties of Ammonium Nitrate
The family of emulsion explosives typically contains over 78% ammonium
nitrate, which is a powerful oxidising agent. Ammonium nitrate will not
explode due to friction and impact found in normal handling. However, it can
be detonated under heat and confinement or severe shock, such as that from
an explosive. The sensitivity of ammonium nitrate to detonation is increased
by elevated temperature or by contamination.
In a fire, pools of molten ammonium nitrate may be formed, and if the molten
mass becomes confined it may explode, particularly if it becomes
contaminated. In a fire ammonium nitrate may melt and decompose with the
release of toxic fumes (mainly oxides of nitrogen).
5.2.2 Accidental Initiation of Explosives
Explosives are considered ‘initiated’ when a self sustaining exothermic
reaction is induced. Such a reaction results in either a violent burning with no
progression to explosion, a deflagration or detonation. The main difference
between a deflagration and detonation is that a detonation produces a reaction
front travelling at greater than sonic velocity. Both explosion types can cause
extensive injury and damage. However, the blast wave produced by a
detonation is much more destructive than that associated with deflagration.
Where explosives are stored under controlled conditions in purpose built and
operated magazines or stores, the likelihood of accidental initiation in situ is
remote. This is because the storage environment is unlikely to experience
A10-39
extremes of heat, shock, impact, or vibration in sufficient intensity to initiate
detonation. The most common means of accidental initiation is principally the
introduction of fire. Other means of initiation include severe impact and
friction.
In this study, accidental initiation of explosives has been categorised as either
fire or non-fire induced. The following sections briefly describe the initiation
mechanisms and events judged applicable for this analysis. Those mechanisms
and events excluded are mainly associated with static discharge and exposure
of ‘within specification’ explosives to extremes of ambient air temperature.
Static discharge can be excluded based on the large ignition energy required to
initiate detonation of the cartridged emulsion. For example, the maximum
static discharge from a person is in the order of 30mJ. Whilst this is sufficient
to ignite flammable vapours it is incapable of causing an initiation of
cartridged emulsion. In addition, the explosive magazine is underground so
extremes of ambient temperature are not considered likely within the
magazine. Therefore, static discharge and ambient air temperature extremes
are excluded as it is not considered possible to initiate emulsion based
explosives by these means.
5.2.3 Accidental Initiation by Fire
Numerous tests demonstrate that, when subjected to fire engulfment, many
explosives ignite and burn to deflagration, and in some cases detonate. The
time for an explosive to ignite is dependent upon its physical characteristics,
chemical composition, and the conditions under which it is stored or handled.
Cartridged emulsion is unlikely to be a fire hazard under normal conditions,
because of its high water content. However, when exposed to fire the water
content of the emulsion will be driven off, leading to possible initiation if the
energy levels are high enough and of long duration. It is generally considered
that these explosives are insensitive to fire engulfment as a means of initiation,
and are more likely to burn rather than explode when compared to other
types of explosives.
5.2.4 Accidental Initiation by Means Other Than Fire
Non-fire initiation mechanisms are commonly divided into two distinct
groups; impact and electrical energy. The term ‘impact’ encompasses both
shock and friction initiation, because in most accidental situations, it is
difficult to distinguish between them. It has been recorded that some
explosives can initiate (in the absence of piercing) at an impact velocity as low
as 15 m/s. If the explosives are pierced, for example by a sharp metal object,
then it is likely that the required velocity will be far less than 15 m/s. This is
due to localised heat generation resulting from frictional rubbing between
layers of explosive, and is referred to as ’stab-initiation’. However, the
cartridged emulsion is believed to be insensitive to initiation via impact, as
demonstrated by the bullet impact test from a high velocity projectile.
All explosives have a minimum ignition energy level, above which initiation
will occur. Typically, minimum ignition energy levels range between 0.015 J

A10-40
and 1.26 J. For the vast majority of explosives, including cartridged emulsions,
the required ignition energy level is far exceeded by contact with mains
electricity. In comparison, the energy levels possible from batteries or
alternators fitted to motor vehicles, or that due to static build-up on clothing,
is typically much less than that required to initiate most commercial
explosives (eg 0.02 J or less). Hence, only very sensitive explosives are likely to
ignite from these electrical energy sources. Therefore, electrical energy is not a
possible energy source for explosives intended to be used in this project.
Degraded, damaged or off specification emulsion explosives are less sensitive
to initiation than good quality explosives. Possible degradation of cartridged
emulsion is from water loss and prolonged exposure to higher temperatures,
which leads to potential caking or a change in ammonium nitrate crystalline
state and increase in volume. Both modes of degradation do not lead to the
possible detonation of the cartridged emulsion.
5.2.5 Hazard Properties of Detonating Devices
These detonating devices may detonate when exposed to heat or flame, or
with friction, impact, heat, low-level electrical current or electrostatic energy.
Detonation produces shrapnel. Hazardous gases/vapours produced in fire are
lead fumes, nitrogen oxides and carbon monoxide. However, these gases
depend on the type of material used in the detonators.
5.3 ACCIDENTAL INITIATION ASSOCIATED WITH STORAGE AT MAGAZINE
For the proposed magazines, the possible means of accidental initiation of the
explosives by fire are as follows:
• inadequately controlled maintenance work (eg hot work);
• poor housekeeping (eg ignition of combustible waste from smoking materials);
• inappropriate methods of work;
• electrical fault within the store, which ignites any surrounding combustible material resulting in a fire; or
• arson.
Possible means of accidental initiation of the explosives by means other than
fire are as follows:
• dropping of explosives during handling (for the detonators only);
• crushing of explosives under the wheels of vehicles during loading or off-loading (for detonators, cast boosters and detonating cords only).
The detonators are supplied packaged within plastic separating strips, such
that the initiation of a single detonation will not propagate to the adjacent
detonator. Packaged in this manner the detonators are classified as Class 1.4B
explosives. The total mass of detonators is negligible in terms of explosive
mass.

A10-41
There is no increased risk of explosion of cartridged emulsion packages
arising from misoperation during handling. This is due to the inherently safe
properties of emulsion.
5.4 GROUND VIBRATION ASSOCIATED WITH USE OF EXPLOSIVES
Ground vibration induced by stress wave during rock excavation could be
potentially hazardous if the vibration level is high enough to cause damage.
Peak Particle Velocity (PPV) is generally used as an indicator of vibration
leading to potential damage. It is generally considered that structures in good
condition can withstand a PPV of 50mm/s without any risk of damage [25].
Ground vibration is governed by the distance from the blast face to the feature
and the charge weight (MIC). A plot of the PPV level versus design MIC is
shown in Figure 5.1.
Based on the Blast Assessment Report [4]-[6], the MIC has been designed
according to the defined criterion in terms of PPV, for each category of
features. A PPV of 25mm/s has been adopted for buildings based on MTR
project specification and by the Hong Kong SAR General Specification for
Civil Engineering Works. Utility operators in Hong Kong were consulted for
their criterion during the blast assessment; generally the vibration limits are
lower for some particular sensitive installations, such as water mains, and are
detailed in Table 5.1 below.
It is not expected to have any aboveground buildings subject to a vibration
level higher than 25mm/s in the design.
Nevertheless, high vibration can still occur in the event of accident or
unforeseen ground condition. For example if the actual site ground conditions
significantly deviate from those predicted, an exceedence may be observed.
As shown in Figure 5.1, a feature of a lower acceptable PPV level may become
the controlling sensitive receiver for a particular tunnel section even if it may
not be the nearest feature. It is therefore worth noting that along the WIL
alignment, there is a lot of historical buildings or other critical sensitive
receivers, such as temples and monument, which have a very low maximum
allowance vibration limit (~5mm/s) for the purpose of building preservation.
When these features become the controlling sensitive receivers for the design
of certain tunnel sections, the design MIC will be low and thus the vibration
level susceptible by other feature (such as buildings and slopes) will reduce.
This can be considered as an inherent safe feature for the blasting design.
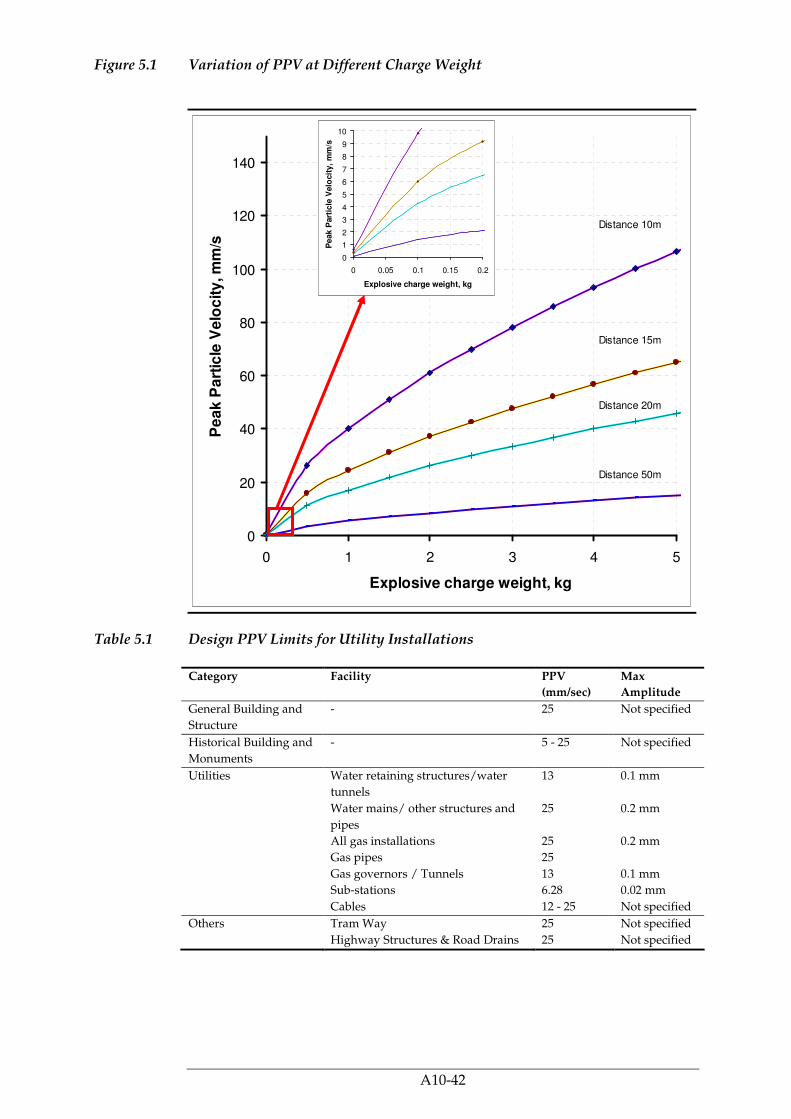
A10-42
Figure 5.1 Variation of PPV at Different Charge Weight
Distance 10m
Distance 15m
Distance 20m
Distance 50m
0
20
40
60
80
100
120
140
0 1 2 3 4 5
Explosive charge weight, kg
Pe
ak
Pa
rtic
le V
elo
cit
y, m
m/s
Table 5.1 Design PPV Limits for Utility Installations
Category Facility PPV
(mm/sec)
Max
Amplitude
General Building and
Structure
- 25 Not specified
Historical Building and
Monuments
- 5 - 25 Not specified
Utilities Water retaining structures/water
tunnels
13 0.1 mm
Water mains/ other structures and
pipes
25 0.2 mm
All gas installations 25 0.2 mm
Gas pipes 25
Gas governors / Tunnels 13 0.1 mm
Sub-stations 6.28 0.02 mm
Cables 12 - 25 Not specified
Others Tram Way 25 Not specified
Highway Structures & Road Drains 25 Not specified
0
1
2
3
4
5
6
7
8
9
10
0 0.05 0.1 0.15 0.2
Explosive charge weight, kg
Pe
ak P
art
icle
Velo
cit
y,
mm
/s

A10-43
5.5 REVIEW OF INCIDENTS
This section presents a review of reported safety incidents involving
explosives (in industrial applications). Records were retrieved mainly from the
UK Health and Safety Executive (UK HSE)’s Explosives Incidents Database
Advisory Service (EIDAS), US Mine Safety and Health Administration
(MHSA) and Western Australia’s Department of Consumer and Employment
Protection (DOCEP). The records provided are also supplemented with
information obtained from various sources. Analysis of accident data are
provided in the following sections.
For the purpose of this study, incidents were sorted according to the following
categories to highlight causative factors to the incidents:
• Incidents involving storage of explosives
• Explosive transport incidents
• Explosive Use Incidents
Annex B provides a summary of relevant incidents for each of the categories
above.
5.5.1 Explosive Storage Incidents
In the UK a study of the risks associated with explosives manufacture and
storage was undertaken based on the 79 major incidents identified during the
period of 1950 to 1997 [21]. A total of 16 were attributed to the storage of
explosives. Thirteen (13) incidents related to the storage of gunpowder,
ammunition, nitroglycerine, and fireworks. A further incident occurred in
1970 involved the storage of detonators and was attributed to corrosion of the
detonators themselves. The remaining two (2) incidents related to the storage
of blasting explosives in 1954 and 1964. One of these incidents involving
blasting explosives was attributed to malicious activity, whilst the cause of the
remaining incident in 1954 was not identified.
Based on the above study, and on the hazards of the explosive materials, it is
apparent that the protection of explosives from human activity, and the
elimination of possible ignition sources are critical to maintaining storage
facilities. From a review of the above records, some of the identified initiating
causes of accidents in storage facilities are listed below:
• Impact;
• Friction;
• Overheating;
• Electrical effects (lightning/static discharges);
• Sparks;
A10-44
• Spontaneous reactions; and,
• Malicious action/mishandling.
Avoidance of incidents in storage area can only be assured by maintaining
good housekeeping practice, eliminating potential ignition source and
allocating safe and secure storage space for explosives.
5.5.2 Explosives Transport Incidents
The UK database identified one transport incident which caused one fatality,
multiple injuries and significant property damage. The 1989 ‘Peterborough
incident’ involved a vehicle carrying mixed explosives (Cerium fusehead and
emulsion) [15]. The explosion was initiated by fire and explosion from a box of
Cerium fusehead combs destined for a local fireworks manufacturer. The
combs were in unauthorised and unsafe packages. This incident initiated
enactment of more stringent safety guidelines in the UK, specifically the Road
Transport (Carriage of Explosives) Regulations of 1989, which came into force
just 3-months after the incident.
Australia is a significant user and transporter of explosives, consuming
approximately 900,000 tonnes of explosives per year (approximately 8% of the
world’s annual consumption of explosives per year). Of this total,
approximately 3000 tonnes (0.3%) is non-bulk explosive (boosters or
cartridged emulsion) (Industry estimates). Western Australia consumes
approximately 30% of Australia’s explosives and publishes accident data [16].
In that time there was one accident reported: a vehicle carrying blasting
explosive and detonators overturned [17]. No ignition (i.e., no fire or no
explosion) occurred.
In that period there were several accidents involving ammonium nitrate or
Ammonium Nitrate Emulsion (UN3375) (Class 5 dangerous goods, used as a
precursor for manufacturing explosives). All thee incidents involved
articulated vehicle overturns with no fire or explosion. None of these incidents
are directly comparable to the situation in HK where explosives vehicles are
not articulated. Some fires involving explosive mixing vehicles were also
recorded, in Western Australia, but none of these incidents has resulted to
fatality or injury.
In the US, explosives transport has had a good safety record. In a recent study
released by National Institute of Occupational Safety and Health (NIOSH)
[18], analysis of data from 1998 to 2006 revealed that accidents related to the
transport of explosives and ammonium nitrate used in mining and
construction have resulted in only 5 major injuries, 11 minor injuries, and no
fatalities. The safe history of explosives and ammonium nitrate transport is
attributed to diligent efforts by government, labour and industry.
5.5.3 Explosive Use Incidents
Annex B provides a summary of incidents arising from use of explosives that
have been caused by mishandling, premature blast, misfiring, overcharging,

A10-45
etc. Other incidents which have led to serious consequence i.e., flyrocks,
damage to property and other severe blast effects, are also included in this
table.
The major hazard from blasting operations has been mainly from flyrocks.
Flyrock is defined by the Institute of Makers of Explosives as a rock that has
been propelled beyond the blast area (which is determined by the blaster) by
the force of an explosion. Flyrock is caused by a mismatch of the distribution
of explosive energy, type of confinement of the explosive charge, and the
mechanical strength of the rock [19]. The lack of security in blast area has also
led to several safety incidents, i.e., due to persons getting struck by blasted
rocks. In the US, injuries from flyrocks and lack of security in the blast area
accounted for more than two-thirds of all injuries, recorded in surface mining
during the period from 1978 to 2002.
Blast doors will be provided over vertical shaft or on adits/ tunnels, and kept
closed during blasting. The effect of flyrock is not considered to have any
potential impact to the public.
Data from Hong Kong, i.e., from incidents recorded by GEO from 1997 to
2007, reveal that out of the 7 incidents, 6 are due to flyrocks (Table 5.2). Three
of which, has caused injuries. One incident is associated with blast induced
slope failure. However, all of these incidents relate to surface blasting
activities and are therefore not applicable to this study.
Table 5.2 Blasting Incidents in Hong Kong (1997-2003)
Year Date Site Incident type / Probable Causes
Consequence
1997 4-Dec-97 Sau Mau Ping, Kowloon
Blast induced slope failure
No injury or damage. Road blocked.
1999 9-Jul-99 Sau Mau Ping, Kowloon
Flyrock (250m) Injury to 1 person
14-Sep-99 Sau Mau Ping, Kowloon
Flyrock (260m) Injury to 3 persons and damage to properties
2001 19-May-01 Sau Mau Ping, Kowloon
Flyrock (250m) No injury or damage
2003 17-Feb-03 Jordan Valley, Kowloon
Flyrock (115m) Damage to properties
6-Jun-03 Jordan Valley, Kowloon
Flyrock (230m) Injury to 9 persons and damage to properties
26-Jun-03 Penny's Bay, Lantau Island
Flyrock (150m) No injury or damage

A10-46
5.6 SCENARIOS FOR HAZARD ASSESSMENT
The following hazardous scenario were identified for the hazard assessment:
5.6.1 Proposed Magazine
The construction of the magazine is covered by Section 5.6.3.
For the operation of the explosives magazine the possible scenarios identified
are:
• A fire leading to the detonation of a full load of explosives within the
magazine access tunnel whilst transferring explosives to or from the
appropriate storage chamber; and
• A fire within any niche causing the detonation of the full quantity stored.
5.6.2 Transport of Explosives
Hazardous scenarios considered for the transport of explosives are:
• Accident involving explosives delivered and transferred from magazine to
delivery point 1
• Accident involving explosives delivered and transferred from magazine to
delivery point 2
• Accident involving explosives delivered and transferred from magazine to
delivery point 3 – Construction Phase 1
• Accident involving explosives delivered and transferred from magazine to
delivery point 3 – Construction Phase 2
• Accident involving explosives delivered and transferred from magazine to
delivery point 4
• Accident involving explosives delivered and transferred from magazine to
delivery point 7
5.6.3 Use of Explosives
Hazardous scenarios considered for the use of explosives are presented below:
Hazards from the Blasting of a Face
The design of the blast face is determined by the permitted vibration level of
the sensitive receivers, and is expected not to cause any damage to the
sensitive receivers. However, potential hazards may arise in the event of
deviations from the confirmed design occurring, which may lead to higher
than expected PPV values.

A10-47
A high-level failure mode analysis of the blasting lifecycle covering
manufacture of detonators and surface connectors, design of the blast,
installation of detonators and surface connectors, and loading of explosives
was carried out. The details are presented in Annex E. The review has
investigated all relevant failure scenarios at the blast face, leading to higher
than expected ground vibration.
The effects of overpressure and debris are not considered to have the potential
to impact members of the public as a blast door will be provided and closed
during blasting of faces. Blast doors fitted either over vertical shafts or on
adits/tunnels are fabricated to withstand a pressure pulse of 2 Bar (29 psi /
200 kPa). The doors are vented to relieve explosion overpressure and their
design is certified by an Independent Checking Engineer (ICE).
The following possible hazardous scenario arising from blasting was
identified for risk assessment:
• Higher vibration generated by the blast face due to human errors and
other reasons such as manufacturing defects causing deviation from the
confirmed design
Hazards from Transport of Explosives to Blast Faces
Bulk emulsion trucks will contain bulk emulsion precursor which is an
oxidising agent and not sensitised to detonation. The truck is provided with
an automatic shutdown system to ensure a safe shutdown of the precursor
pump in case the pump deviates from its operating conditions, such as high
pressure or temperature. Furthermore, the bulk emulsion explosive is quite
insensitive and will not detonate in the absence of the primer. The precursor
and gassing pumps at the truck will not be permitted to operate until all the
detonators and primers have gone into the blastholes. The shock tube will not
be connected to the exploder (electric detonator initiator) until the face has
completed setup and checked, all personnel retreated to safe location, the
truck left the tunnel and the blast door closed.
The cartridge cases delivered to site will be conveyed to the tunnel using
appropriate and certified lifting system (such as man-cage) through the shaft.
The lifting system is provided with safety lock to prevent fall of the explosives
in case of lifting mechanism failure.
The shafts to the tunnel will be located at soft ground and vertical to the
tunnel. The cartridge cases will be transported by a diesel vehicle within the
tunnel.
The following possible scenario was identified for risk assessment:
• Higher vibration and air overpressure due to the detonation of a full load,
125kg, of explosives within the tunnel whilst transferring explosives to the
appropriate blast site.

A10-48
6 FREQUENCY ASSESSMENT
6.1 STORAGE OF EXPLOSIVES
6.1.1 Frequency of Accidental Initiation in Magazine
Estimation of the frequency with which accidental initiation of explosives
occurs is subject to considerable uncertainty. Previous major studies
undertaken in Hong Kong and elsewhere (eg the Hazard Assessment of the
Government Explosives Depot at Kau Shat Wan and the Quantitative Risk
Assessments undertaken for UK Ministry of Defence sites) have attempted to
reduce this uncertainty by identifying the various contributing causes of
accidental initiation and constructing fault trees to estimate the overall
frequency of accidental initiation. Even with this detailed approach significant
uncertainty remains; eg in the frequency of accidental initiation due to out of
specification explosives, or the probability of accidental initiation due to
impact or friction. However, this uncertainty is caused by reliance on
historical data collected on explosives that are not related to the operations or
the explosives that are to be used in the WIL project.
The probability of an explosion within the store depends on several factors
that include:-
a) The inherent sensitivity of the explosive substances stored;
b) The types of handling processes employed;
c) The managerial and procedural safeguards, including safety culture,
training and supervision of staff; and
d) The site security measures employed.
Historical accident records from the UK were used to estimate the frequency
of accidental initiation of explosives under storage conditions. These records
showed that there had been nine (9) major explosions over the period 1950 to
1999. It estimated that 27,000 storehouse-years had accrued over this period
giving:-
9/27,000 = 3 x 10⁻⁴ per storehouse-year.
However, if the dataset was restricted to involving local authority type stores
and the period after the enactment of the Health and Safety at Work Act in
1974 to 1999, then there were three (3) incidents and 15,000 accrued
storehouse-years giving an accident rate of:-
3/ 15,000 = 2 x 10⁻⁴ per storehouse-year.
The UK HSE states that there were considerable uncertainties regarding the
number of stores that were operational over this period. However, the UK
HSE working group on explosives, based on the above data, agreed to use an

A10-49
accident rate of 1 x 10⁻⁴ per storehouse-year.
However, from analysis of the 16 explosives storage incidents it is apparent
that their causes were attributable to:-
a) Unstable explosive material caused by product degradation, corrosion,
and contamination;
b) Escalation of an incident e.g. grass/gorse fire or explosion, elsewhere
on or off the site; and
c) Malicious activities such as vandalism and robbery.
The cartridged emulsion to be used in Hong Kong is stable and is highly
unlikely to undergo initiation due to degradation or impact. Increased
instability caused by manufacturing errors is also considered highly unlikely
due to the nature of the materials on which the emulsion is based. However,
the cartridged emulsion is detonator sensitive, and hence the detonators are to
be stored and transported separately, with a dedicated chamber within the
magazine.
The possible initiation of the magazine storage from an external explosion or
fire event is discounted due to the underground location of the magazine.
Hence, it is considered that the most significant causative event that leads to
an explosion within the magazine is that posed by malicious activities, such as
vandalism or robbery. The proposed security arrangements for the magazine
include:
a) 2.5m high security fence topped with razor wire;
b) Electric flood lights evenly spaced along the security fence;
c) Close Circuit Television (CCTV) camera mounted at 6m above the
magazine ground level;
d) 24hr security patrols with at least two (2) armed guards during the day
and three (3) during the night;
e) Guard dog; and
f) A 3 key system such that the authorised shotfirer, the contractor’s
representative, and the magazine manager have separate keys, with all
three (3) keys required for access to the chamber.
As the major causes of incidents in storage are related to malicious activity,
the UK HSE suggested major accident rate of 1 x 10⁻⁴ per storage building
year, is assumed to apply to the entire magazine storage facility. In addition,
improvements in explosives stability brought by cartridged emulsion, will
reduce the sensitivity of the explosives stored. The proposed security system
will also reduce the frequency of initiation of an explosion due to vandalism
or robbery. Referring to the TNO Purple Book [22] a frequency of 10-5 per year

A10-50
is suggested for explosives storage. However, a more conservative accident
rate of 1x10⁻⁴ yr-1 was adopted for this study although it is acknowledged some
reduction factor could be provided based on the security measures for the
magazine and the more stable type of explosives being stored.
Therefore the following event frequency was adopted for the storage of
explosives:
• Initiation of an explosion within a magazine 1 x 10⁻⁴ yr-1.
6.1.2 Sympathetic detonation between magazine niches
It is considered impossible that an explosion within one chamber will initiate
an explosion within an adjacent chamber. This is based on the results obtained
from the Ardeer Double Cartridge (ADC) Test for cartridged emulsion that
show that beyond a separation distance of 2 cartridge diameters the
consequences of a detonation are not able to propagate.
Therefore, the direct propagation, by blast pressure wave and thermal
radiation effects, of an explosion within one chamber initiating an explosion
within the adjacent chamber is not considered. However, an explosion within
one chamber may cause damage within the adjacent chamber such as rock
spall. This rock spall, which is caused by the transmission of a shock wave in
the surrounding rock, may result in the initiation of the adjacent chamber due
to impact of the explosives with the falling rocks. However, increasing
separation distance will significantly reduce the likelihood of rock spall.
The degree of shock wave transmission through the rock will depend on
factors such as the rock type and the loading density of explosives within the
chamber. Each chamber, with the exception of the detonator chamber, is used
to store 300 kg of explosives. Assuming that the chamber may contain only
high explosives such as the boosters, primers or detonating cord, will mean
that the TNT equivalence ratio is 1. Therefore, the chamber loading density is
300 / 125 = 2.4 kg/m³, based on a design volume of 125 m3 per niche. The US
Department of Defense DOD Ammunition and Explosives Safety Standards
DoD 6055.9-STD [11] indicates that the minimum separation distance, Dcd,
required to prevent hazardous rock spall effects is given by the equation
below (DoD eqn C5.2-4) for moderate to strong rock, with low loading
densities (i.e. below 48.1 kg/m³):-
Dcd = 0.99 Q 1/3
Where Q is the charge mass in kg, and hence the minimum separation
distance between separate chambers is 6.63 m. Above this separation distance
an explosion within one chamber will not result in rock spall within the
adjacent chamber.
The actual chamber separation distance is 11m. Hence, this study does not
consider it is possible to initiate adjacent chamber’s explosives due to rock
spall following an explosion within a magazine chamber.
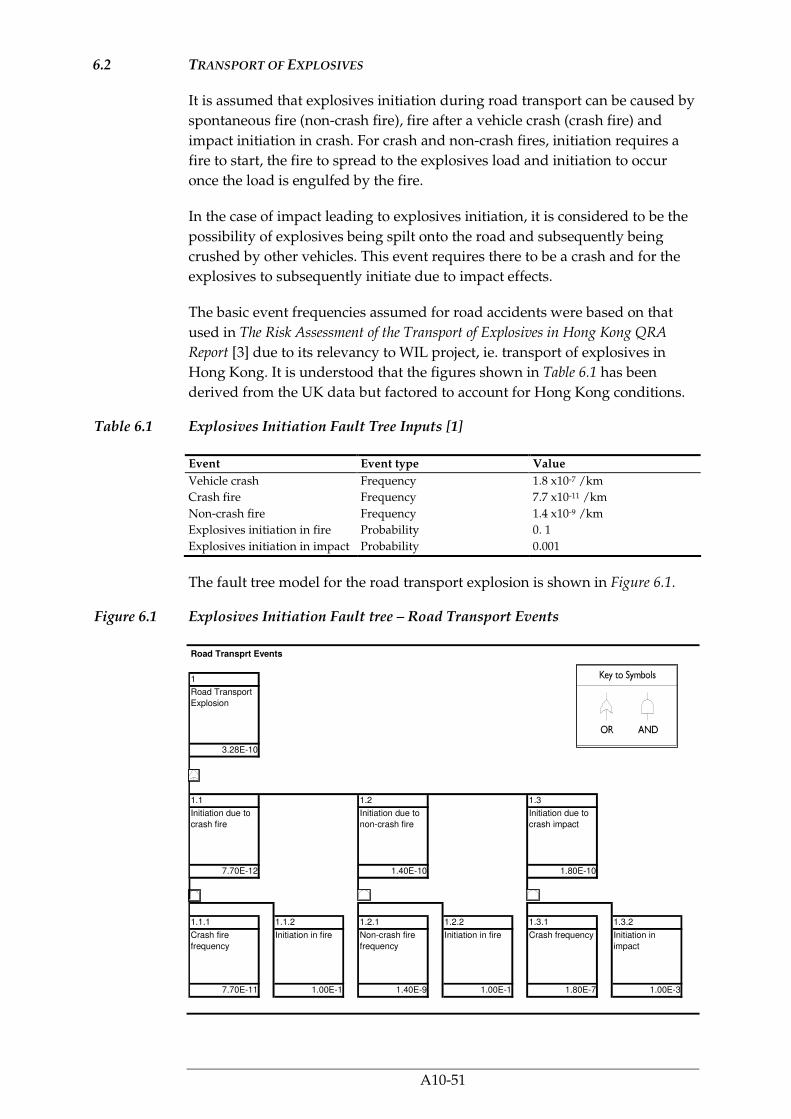
A10-51
6.2 TRANSPORT OF EXPLOSIVES
It is assumed that explosives initiation during road transport can be caused by
spontaneous fire (non-crash fire), fire after a vehicle crash (crash fire) and
impact initiation in crash. For crash and non-crash fires, initiation requires a
fire to start, the fire to spread to the explosives load and initiation to occur
once the load is engulfed by the fire.
In the case of impact leading to explosives initiation, it is considered to be the
possibility of explosives being spilt onto the road and subsequently being
crushed by other vehicles. This event requires there to be a crash and for the
explosives to subsequently initiate due to impact effects.
The basic event frequencies assumed for road accidents were based on that
used in The Risk Assessment of the Transport of Explosives in Hong Kong QRA
Report [3] due to its relevancy to WIL project, ie. transport of explosives in
Hong Kong. It is understood that the figures shown in Table 6.1 has been
derived from the UK data but factored to account for Hong Kong conditions.
Table 6.1 Explosives Initiation Fault Tree Inputs [1]
Event Event type Value
Vehicle crash Frequency 1.8 x10⁻⁷ /km
Crash fire Frequency 7.7 x10⁻¹¹ /km
Non-crash fire Frequency 1.4 x10⁻⁹ /km
Explosives initiation in fire Probability 0. 1
Explosives initiation in impact Probability 0.001
The fault tree model for the road transport explosion is shown in Figure 6.1.
Figure 6.1 Explosives Initiation Fault tree – Road Transport Events
Road Transprt Events
1
Road Transport
Explosion
3.28E-10
1.1 1.2 1.3
Initiation due to
crash fire
Initiation due to
non-crash fire
Initiation due to
crash impact
7.70E-12 1.40E-10 1.80E-10
1.1.1 1.1.2 1.2.1 1.2.2 1.3.1 1.3.2
Crash fire
frequency
Initiation in fire Non-crash fire
frequency
Initiation in fire Crash frequency Initiation in
impact
7.70E-11 1.00E-1 1.40E-9 1.00E-1 1.80E-7 1.00E-3

A10-52
The frequency of explosives initiation during road transport was estimated as
3.31 x10⁻¹⁰/km considering an additional 1% Increase for “unsafe explosives”
(ie a factor of 1.01), as justified below.
The frequency of crash is governed by road traffic accident data. Safety
measures adopted for explosives transport are factored in this assessment
although improvement in recent years can reduce the frequency further. The
likelihood of an explosion given impact following a crash or a fire following a
crash could be conservative.
6.2.1 Unsafe Explosives
Background of Probability of Explosive Initiation in Hong Kong Studies
The source document which assesses the risks associated with the transport of
explosives in previous Hong Kong Transport QRA Studies is “DNV 1997, The
Risk Assessment of the Transport of Explosives in Hong Kong, EPD,
CE63/94”[1]. This assessment considers that the following events can cause an
explosion of the explosives during transport:
• Initiation due to crash impact;
• Initiation due to crash and subsequent fire;
• Initiation due to fire not related to vehicle crash; and
• Initiation due to ‘unsafe explosives’.
The above mentioned assessment, which was subsequently referred in other
EIA studies, considered unsafe explosive frequency to be equal to the assessed
overall frequency of explosions due to other causes (all causes combined)
based on the consideration that worldwide historical accident record shows
that 50% of explosives are initiated by the presence of unsafe explosive
conditions in the load. This accident data set included data even before 1950
which is dominated by nitroglycerine, dynamite, and military explosive
applications. This report also does not distinguish water gel based explosives
and emulsion based explosives. While water gel based explosives can degrade
in an unsafe manner, emulsion based explosives tend to degrade in safe
manner and are therefore inherently safer.
The Hazard to Life Assessment report for WIL uses the same approach but
adopts a modification factor for the probability of initiation due to ‘unsafe
explosives’ on the basis that the type of explosives (ie emulsion) used
nowadays in Hong Kong are safer than those considered in the above
assessment (ie watergels, etc). This section provides the basis for modifying
the probability of explosive initiation due to ‘unsafe explosives’.
It should be noted that in the previous Hong Kong Transport QRA studies the
term ‘unsafe explosives’ is implicitly defined as an initiation of the explosive
load in absence of fire or crash impact since the probabilities of initiation due

A10-53
to crash impact and fire are quantified separately. This definition may differ
from definitions encountered in literature.
Historical Development of Explosives
Where commercial explosives are concerned, the term ‘unsafe explosives’ has
been used historically to describe products such as Dynamite and Gelignite
(generic names for nitroglycerin based explosives) which for one reason or
another have become degraded. These products contain nitroglycerin
( glyceryl trinitrate) which is a powerful explosive composition, highly
sensitive to shock, friction and heat.
Commercial explosives containing nitroglycerin [ C3H5(NO3)3 ] were first
manufactured in the 1860’s and due to the absence of safer technology, were
not replaced by lower sensitivity commercial explosives until the early 1980’s.
When dynamite dries out, it may exude nitroglycerin and also, the various
salts in the explosive mixture may crystalise out, producing sharp crystals that
may be sensitive enough to initiate the free nitroglycerin. In this form, the
explosive is extremely sensitive to heat, impact, shock or static electricity.
The first commercial explosives to be manufactured and commercialized that
did not contain a high risk explosive sensitizer like Nitroglycerine were
manufactured by I. E. du Pont de Nemours and Company and were of the
Tovex ® family of watergel explosives. Tovex ® explosives do contain an
explosive sensitizer called Monomethylamine nitrate (MMAN). However, this
has a much lower sensitivity to shock, friction and heat than Nitroglycerine.
Such explosives were manufactured in Hong Kong at Stonecutters Island for
many years.
Tovex ® explosives were the predecessor of emulsion explosives, the
difference being that watergels were formulated as ‘oil in water’ whereas
emulsion explosives developed from watergels by reversing the process to be
formulated as ‘water in oil’ explosives.
The discovery of emulsion explosives enabled commercial explosives
manufacturers to remove all explosive sensitizers from their formulations thus
inherently reducing risk and improving safety in manufacture, transportation,
storage and use.
It is the emulsion family of explosives that are transported, stored and used in
Hong Kong today. They are by far the safest commercial explosives
manufactured to date and do not degrade or form extremely sensitive by-
products. When degradation does occur (usually due to temperature cycling
above/below 34O C), emulsions become less sensitive and eventually are not
capable of detonating.
Particulars of Unsafe Explosives
In the context of Hong Kong Explosive Transportation studies, an unsafe
explosive is one which:

A10-54
1 Has failed (or would fail) one or more of the tests prescribed in Test
Series 3 and/or Test Series 4 in the United Nations Recommendations on the
Transport of Dangerous Goods - Manual of Tests and Criteria (4th revised
edition), and has thereby been (or would be) excluded from acceptance into
Class 1 on the grounds that it is unsafe to transport; or
2 Is a classified Class 1 explosive which has deteriorated in a manner
which has increased its instability and/or sensitivity to the extent that it might
reasonably be expected to fail one or more of the above-mentioned tests if re-
tested in its deteriorated state. Deterioration may include badly designed,
badly manufactured, badly packaged or which are off-specification in some
other way.
Examples of (1) would be pure nitroglycerine, or triacetone triperoxide
(unless refrigerated).
An example of (2) would be the former ICI Australia ( now Orica ) product
ANGD95 (Ammonium Nitrate Gelatine Dynamite)with substantial
crystallisation and exudation (nitroglycerine) with advanced ageing.
Expert Panel Review
In developing the probability of an explosive initiation during road transport,
an “Unsafe Explosives” probability is commonly used in previous QRA in
Hong Kong.
An expert panel review was commissioned by ERM/MTRC to review the key
assumptions/ uncertainty for the risk assessment for the storage, transport
and use of explosives in the context of the WIL Quantitative Risk Assessment.
The review was held at ERM office in Hong Kong on 21-23 July 2008. [40]
From the review meeting, it was concluded that “Moreton (HSC, 1995)
identifies all potential causes of “Unsafe Explosives” and none of the causes is
applicable to cartridged emulsion transportation.”
There was however no evidence to completely rule out all unforeseen
conditions.
Review of ACDS “Risks from Handling Explosives in Port” (HSC, 1995)
The original paper, HSC Advisory Committee on Dangerous Substances, Risks
from Handling Explosives in Port [20], which defines the term ‘Unsafe
Explosives’ was also reviewed[20] below summarize the findings.
It was found that all potential causes of ‘Unsafe Explosives’ are not directly
applicable to cartridged emulsion transportation. A relevance factor has been
assigned for all the causes which could be applicable, in some circumstances,
to emulsion.
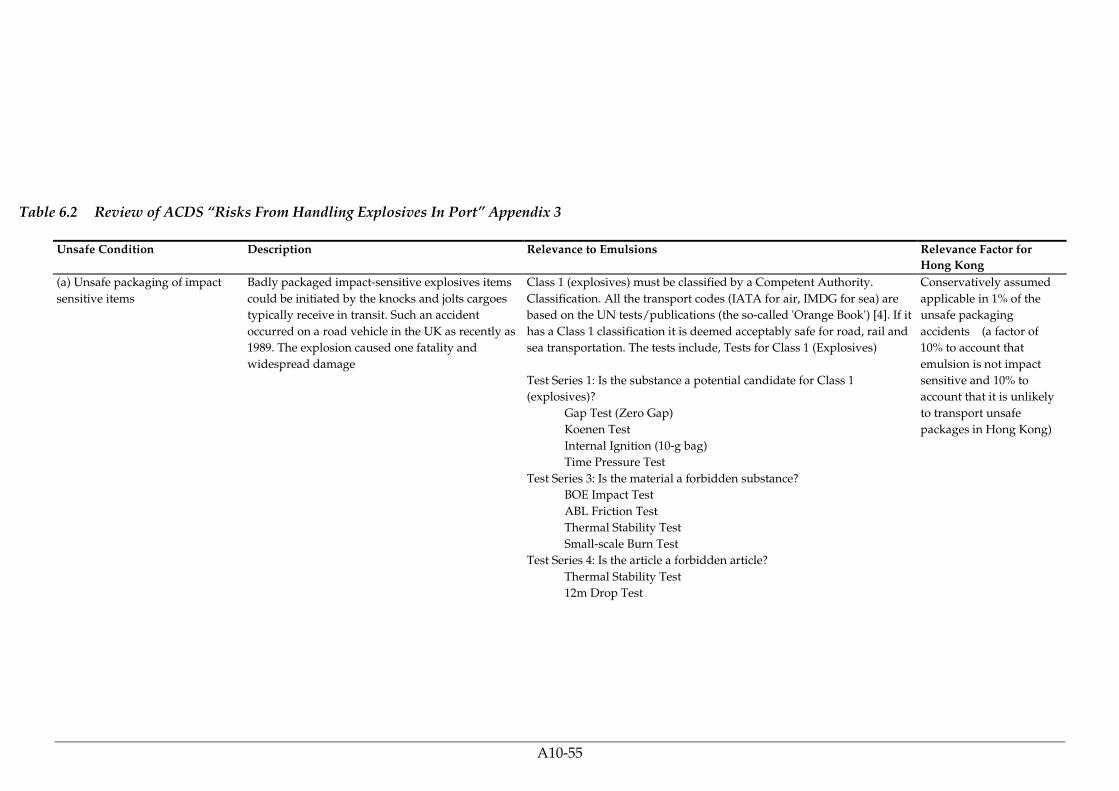
A10-55
Table 6.2 Review of ACDS “Risks From Handling Explosives In Port” Appendix 3
Unsafe Condition Description Relevance to Emulsions Relevance Factor for
Hong Kong
(a) Unsafe packaging of impact
sensitive items
Badly packaged impact-sensitive explosives items
could be initiated by the knocks and jolts cargoes
typically receive in transit. Such an accident
occurred on a road vehicle in the UK as recently as
1989. The explosion caused one fatality and
widespread damage
Class 1 (explosives) must be classified by a Competent Authority.
Classification. All the transport codes (IATA for air, IMDG for sea) are
based on the UN tests/publications (the so-called 'Orange Book') [4]. If it
has a Class 1 classification it is deemed acceptably safe for road, rail and
sea transportation. The tests include, Tests for Class 1 (Explosives)
Test Series 1: Is the substance a potential candidate for Class 1
(explosives)?
Gap Test (Zero Gap)
Koenen Test
Internal Ignition (10-g bag)
Time Pressure Test
Test Series 3: Is the material a forbidden substance?
BOE Impact Test
ABL Friction Test
Thermal Stability Test
Small-scale Burn Test
Test Series 4: Is the article a forbidden article?
Thermal Stability Test
12m Drop Test
Conservatively assumed
applicable in 1% of the
unsafe packaging
accidents (a factor of
10% to account that
emulsion is not impact
sensitive and 10% to
account that it is unlikely
to transport unsafe
packages in Hong Kong)

A10-56
Unsafe Condition Description Relevance to Emulsions Relevance Factor for
Hong Kong
(a) Unsafe packaging of impact
sensitive items
(continued)
Test Series 6: Is the substance or article a Class 1.1, 1.2, 1.3 or 1.4?
Single Package Test
Stack Test
External Fire Test
Princess Incendiary Spark Test
Based on the above Emulsion is not considered sensitive and has
virtually no relevance to this unsafe condition.
Additionally, explosives are subject to manufacturing tests and
verifications: raw material specification tests, product acceptance tests
including cartridge integrity, checking of packages, velocity of
detonation, gap test, and on some samples, friction test, impact test and
bullet test.
It should be noted that the external packaging will be checked before
being accepted on air cargo. It will be checked again when receiving the
packages in Hong Kong and explosives with any damaged package will
be rejected. The packages will be checked again by the shotfirer before
use. Explosives with damaged packages will be rejected.
Based on the above consideration, unsafe explosion due to unsafe
packaging is considered extremely unlikely.
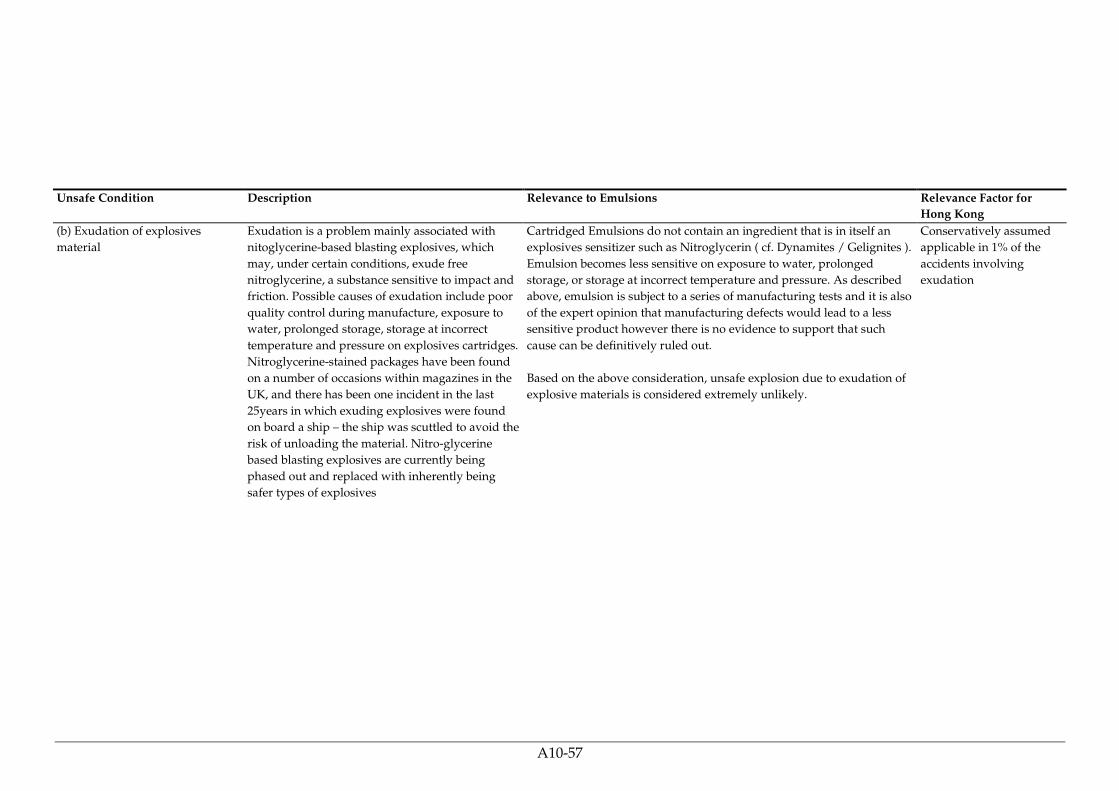
A10-57
Unsafe Condition Description Relevance to Emulsions Relevance Factor for
Hong Kong
(b) Exudation of explosives
material
Exudation is a problem mainly associated with
nitoglycerine-based blasting explosives, which
may, under certain conditions, exude free
nitroglycerine, a substance sensitive to impact and
friction. Possible causes of exudation include poor
quality control during manufacture, exposure to
water, prolonged storage, storage at incorrect
temperature and pressure on explosives cartridges.
Nitroglycerine-stained packages have been found
on a number of occasions within magazines in the
UK, and there has been one incident in the last
25years in which exuding explosives were found
on board a ship – the ship was scuttled to avoid the
risk of unloading the material. Nitro-glycerine
based blasting explosives are currently being
phased out and replaced with inherently being
safer types of explosives
Cartridged Emulsions do not contain an ingredient that is in itself an
explosives sensitizer such as Nitroglycerin ( cf. Dynamites / Gelignites ).
Emulsion becomes less sensitive on exposure to water, prolonged
storage, or storage at incorrect temperature and pressure. As described
above, emulsion is subject to a series of manufacturing tests and it is also
of the expert opinion that manufacturing defects would lead to a less
sensitive product however there is no evidence to support that such
cause can be definitively ruled out.
Based on the above consideration, unsafe explosion due to exudation of
explosive materials is considered extremely unlikely.
Conservatively assumed
applicable in 1% of the
accidents involving
exudation

A10-58
Unsafe Condition Description Relevance to Emulsions Relevance Factor for
Hong Kong
(c) Poor integrity of packaging Poor integrity of packaging may result in spillage
of explosives substances. This in turn may result in
the ignition of fire in the event that the spillage
falls through cracks in the floorboards of a vehicle
and lands on a hot surface, such as an exhaust
manifold. One or two minor explosives events
have occurred within UK manufacturing sites in
recent times, caused by vehicles running over spilt
explosives material, but no such event have
occurred during transport of packaged explosives
goods.
Although Cartridged Emulsions contain up to 14% water, their
composition is very viscous and as such do not spill when the cartridge
is ruptured or pierced. Any liquid exiting the cartridge would be limited
to a solution of Ammonium Nitrate which will not burn and would
evaporate in contact with a hot exhaust. As Emulsions loose water
content, the explosive composition reduces in sensitivity and eventually
the Emulsion becomes insensitive and will not detonate when
stimulated with a primer.
Also referring to above, cartridges are inspected before they leave the
factory and the packages are checked several times during the transport
from the factory to the construction site.
Based on the above consideration, unsafe explosion due to unsafe
packaging is considered extremely unlikely.
Conservatively assumed
applicable in 10% of the
poor integrity packaging
accidents
(d) Propellant with depleted
stabilizer content
Nitrate-ester based propellants with depleted
stabiliser content may ignite spontaneously
through the process of autocatalytic
decomposition. Within the last 25 years there have
been several fires in UK storehouses caused by this
process. Within the last 10years there has been one
incident of fire on a rail wagon caused by
spontaneous ignition of nitrocellulose, a raw
material used in the manufacture of propellants.
None. Military propellant. Not applicable

A10-59
Unsafe Condition Description Relevance to Emulsions Relevance Factor for
Hong Kong
(e) Leaks from munitions
containing white phosphorus
Certain types of munitions contains white
phosphorus, a substance that can spontaneously
ignite on exposure to air. There have been at least
two substances in the UK during the last 45years
when leaks from these munitions have results in
ignition of fire rail transport.
None. Military device. Not applicable
(f) Munitions with contaminated
components
Physical or chemical reaction between
contaminants and explosives filling may lead to
the formation of heat- and impact-sensitive
explosives crystals or compounds within
munitions. These munitions may then become
more susceptible to accidental initiation. Migration
of sensitive compounds into screw threads and
non-continuous welds may further increase the
susceptibility of the munitions to accidental
initiation by impact. There was a major explosion
in UK military port in 1950 caused by impact-
induced ignition of a depth charge that has been
sensitised by the presence of impurities in the main
explosives filling. A similar accident occurred in
Gibraltar a year later.
None. Military propellant / explosives. Not applicable.

A10-60
Unsafe Condition Description Relevance to Emulsions Relevance Factor for
Hong Kong
(g) Munitions with cracked
warheads
The explosives filling of certain types munitions
are prone to cracking. Cracking may result in
migration of explosives dust into screw threads
and non-continuous welds within munitions, and
this may increase the susceptibility of the
munitions to accidental initiation in two ways (i)
impact accidents may result in nipping of dust
between metal surfaces and (ii) the presence of
bare explosives crystals in the cracked surface may
increase the chance of an initiation proceeding to
full detonation. The dangers posed by munitions
with cracked warhead filling are well recognised;
such munitions are normally subjected to
Ordnance Board constraints, which would include
restrictions on the height to which such munitions
can lifted.
None. Military propellant / explosives. Not applicable
(h) Munitions with defective
electrical components
Certain types of munitions, such as torpedoes, are
equipment with power supplies. There is a
possibility that electrical short circuits within these
types if munitions may ignite fires which may in
turn initiate explosives material. So far as is
known, no such accidents have occurred in the UK
in post-war times
None. Military device. Not applicable
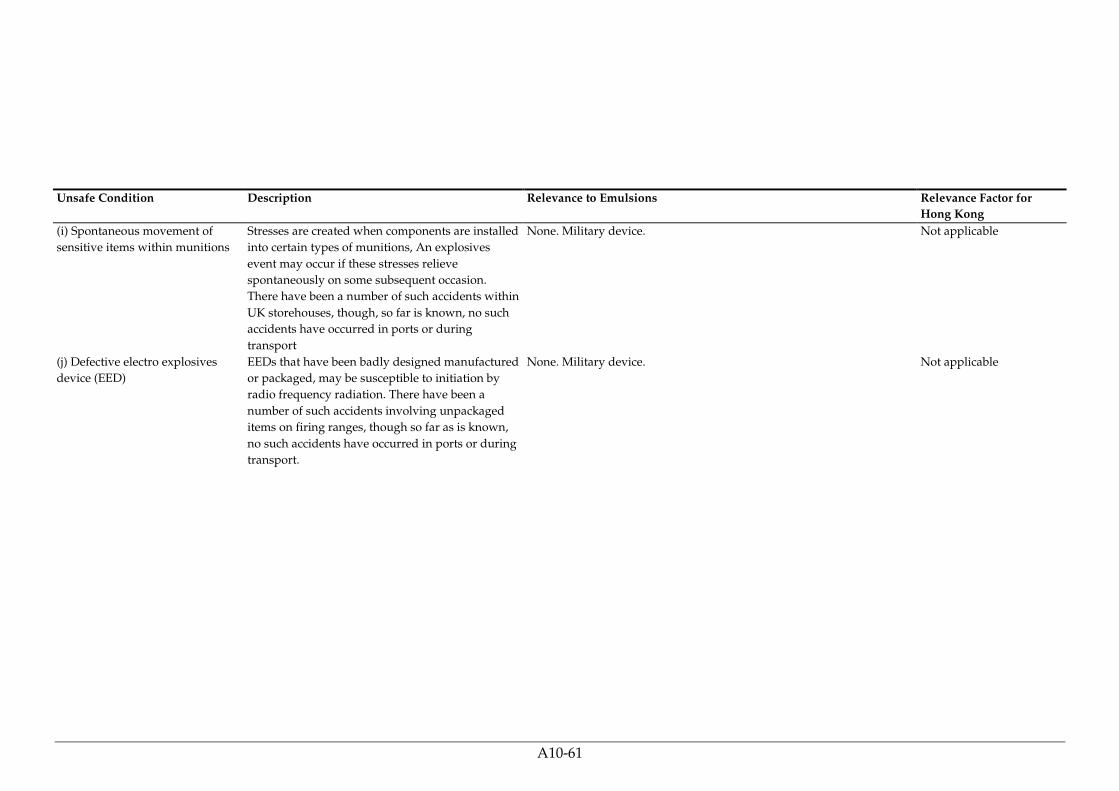
A10-61
Unsafe Condition Description Relevance to Emulsions Relevance Factor for
Hong Kong
(i) Spontaneous movement of
sensitive items within munitions
Stresses are created when components are installed
into certain types of munitions, An explosives
event may occur if these stresses relieve
spontaneously on some subsequent occasion.
There have been a number of such accidents within
UK storehouses, though, so far is known, no such
accidents have occurred in ports or during
transport
None. Military device. Not applicable
(j) Defective electro explosives
device (EED)
EEDs that have been badly designed manufactured
or packaged, may be susceptible to initiation by
radio frequency radiation. There have been a
number of such accidents involving unpackaged
items on firing ranges, though so far as is known,
no such accidents have occurred in ports or during
transport.
None. Military device. Not applicable

A10-62
Unsafe Condition Description Relevance to Emulsions Relevance Factor for
Hong Kong
(k) Fuze defects Munitions fitted with defective fuze may be
vulnerable to the sorts of knocks and jolts that
cargoes typically receive while in transit. There are
three ways in which the safety of a fuze may be
compromised:
(i) mis-assembly in which the fuze is
assembled in a manner which “short
circuits” the intended safety features;
(ii) severe metal corrosion affecting
components such as springs shutters
etc. making inoperative the safety
features that rely on the correct
functioning of these components;
(iii) Chemical reaction in which the
chemical composition of some of the
explosives compounds are changed,
making them more sensitive to
external stimuli, eg reaction of lead
azide with copper to form copper
azide.
None. Military device. Not applicable

A10-63
Table 6.3 Review of ACDS “Historical Accident Record for Transport of Explosives in Great Britain, 1950 -1994” Appendix 2
Appendix 2
Reference
Number
Transport
Type
Date Location Explosive
Type
Cause of
Accident
Relevance to
Emulsions
Relevance Factor
(see previous
table)
1 (i) Military Port 14/07/1950 Bedenham
Hampshire
Ammunition
Depth Charge
Fire None. Military
explosives / device
0%
1 (ii) Military Port 16/06/1955 Portland
Dorset
Ammunition
Experimental Torpedo
Mechanical faults and
bad preparation
None. Military
explosives / device
0%
1 (iii) Port 17/07/1969 Bootle
Merseyside
Unknown
Commercial
Explosives
Unknown
Possible Nitroglycerin
leakage
None. Emulsions do
not contain any
ingredient that in itself
is an explosives
sensitizer
0%
2 (i) Rail 04/09/1951 Feltham
Greater London
Ammunition
Smoke Bombs
Leak of material from
inside Shell
None. Military
explosives / device
0%
2 ( ii ) Rail 23/04/1969 Armathwaite
Cumbria
Ammunition
Artillery Shells
Fire None. Military
explosives / device
0%
2 ( iii ) Rail 14/04/1988 Lancashire Nitrocellulose (this has
been counted as
explosive although
Nitrocellulose is not an
explosive)
Unsafe Explosives
Nitrocellulose caught fire
as it dried out
Although this is not
directly relevant. This
may be conservatively
considered to
correspond to Unsafe
1%

A10-64
Appendix 2
Reference
Number
Transport
Type
Date Location Explosive
Type
Cause of
Accident
Relevance to
Emulsions
Relevance Factor
(see previous
table)
Condition (b) in
previous table
3 ( i ) Road 1952 Unknown Commercial
Explosives
Fire None. The explosives
being used in 1952
would have been of the
Nitroglycerin type
0%
3 ( ii ) Road 1958 Unknown Commercial
Explosives
Fire None. The explosives
being used in 1958
would have been of
high sensitivity type
0%
3 ( iii ) Road 1959 Unknown Commercial
Explosives
Safety Fuse
Fire None. Safety Fuse
contains Gunpowder
which is spark and
friction sensitive
whereas Emulsions
have a low sensitivity
0%
3 ( iv ) Road 1973 Unknown Commercial
Explosives and
Detonators
Fire None. The explosives
being used in 1973
would have been of
high sensitivity type
and explosives were
mixed with detonators
0%

A10-65
Appendix 2
Reference
Number
Transport
Type
Date Location Explosive
Type
Cause of
Accident
Relevance to
Emulsions
Relevance Factor
(see previous
table)
3 ( v ) Road 23/03/1989 Peterborough
Cambridgeshire
Commercial
Explosives, Fuseheads
and Detonators
Unsafe explosives
packaging
Unsafely packages
fuseheads (related to
electric detonators)
ignited by
impact/friction leading
to cargo fire and
subsequent explosion.
This accident related to
Emulsions mixed with
electric detonators.
Both mixed load and
electric detonators are
prohibited in Hong
Kong. Therefore ,
loading MTRC
contractor vehicle with
mixed load of
detonator and emulsion
is a breach of
prohibition with low
probability. Note that
Fuse Heads have a very
high sensitivity
compared to emulsion.
This may be
conservatively
considered to
correspond to Unsafe
Condition (a) in
previous table
1%

A10-66
Background on Unsafe Explosive Parameters Used in Previous Hong Kong Transport
QRA Studies and Conclusion
Based on the review of past accidents which formed the basis for the
probability of explosive initiation due to unsafe explosives, in the source
document which assesses the risk of unsafe explosives in Previous Hong Kong
Transport QRA Studies[1], it is concluded that only two accidents over
eleven (~20%) may have some relevance to transportation of emulsion. Each
accident carries a relevance factor of 1%. This gives an overall probability of
0.2%. This is conservatively rounded up to 1%. Following the approach of
previous Hong Kong QRA Studies, this 1% has been applied to the overall
transport frequency.

A10-67
6.3 TRANSPORTATION WITHIN THE ACCESS TUNNEL OF THE MAGAZINE
The construction of the West Island Line will be undertaken by a total of three
different contractors. These contractors will each be responsible for the deposit
and withdrawal of explosives from their assigned magazine chamber. There
will be only one explosives delivery from the Mines Division per day to the
magazine. On arrival at the magazine the Mines Division vehicle will be
unloaded using the contractor’s vehicles. The Mines Division vehicle shall not
enter the magazine adits. Therefore, the contractor’s will be responsible for
transferring the delivered explosives into the correct magazine niche using
their own vehicles, each permitted to only carry a maximum of 200 kg of
explosives.
The magazine is designed to have capacity to store sufficient explosives for
two days blasting activity. Therefore, the daily consumption of explosives is
1200 kg, which must also be replenished on a daily basis. The maximum
vehicle capacity within the magazine access tunnels is to be limited to 200 kg.
Hence the number of movements of vehicles loaded with explosives that
deposit explosives within a niche is 6. However, the maximum quantity of
explosives that is expected to be withdrawn from the magazine is 125 kg.
Therefore, for the withdrawal of explosives there will be a daily total of
approximately 10 vehicle movements. On an annual basis this equates to a
total of 5,840 vehicle movements.
An overall frequency of accidental initiation of 3.31 × 10 -10 per truck-km is
used for assessing transport of explosives to the magazine, as described in the
Section 6.2. This value is considered conservative for the magazine since the
speed control will be exercised within the magazine, and only one truck will
be allowed in the magazine at any given time. Therefore, reduction factors can
be considered for the fire after a vehicle crash (crash fire) and impact initiation
in crash.
The frequency of the accidental initiation of the explosives within the
magazine access tunnels is based on a section of tunnel length of 30m directly
below the slope 11-SW-A-C293. This 30m section of tunnel was derived based
on geometric separation distance between magazine tunnel and slopes.
Beyond 30m the impact on the slope due to initiation of explosives loaded
onto a vehicle is not considered capable of causing a slope failure (as
discussed in Section 7.3.1). Accidental initiation within the magazine tunnel
will be based on an explosives load of 200 kg, which represents the maximum
amount of explosives that can be transported using the contractor’s vehicles.
The length of the magazine access tunnel that is vulnerable to failure due to an
explosion of a vehicle carrying explosives is 30m. The overall frequency of
accidental initiation (all causes) for the transportation of explosives is 3.31 × 10
-10 per truck-km.

A10-68
6.4 USE OF EXPLOSIVES
The frequency assessment for the use of explosives was derived in two parts.
The first part determined the occurrence frequency of higher ground vibration
generated by 5,660 blasts due to errors in the blasting process. The second part
evaluated the occurrence frequency of higher vibration and air overpressure
due to transport of cartridges from the shaft to the blast site.
6.4.1 Frequency of Higher Vibration due to Errors in the Blasting Process
For all the failure scenarios identified in the high-level failure mode analysis,
majority of the causes are due to human errors during the blasting process.
These could be errors in design, manufacturing, installation, checking and
recovery.
Fault tree analysis was carried out to determine the overall occurrence
frequencies for the failure scenario detailed in Section 5.6.3, whilst human
factor assessment was carried out to derive the human error probabilities for
the base events. The details of the fault tree analysis and human factor
assessment are provided in Annexes E and F respectively.
The overall frequency of failure scenarios leading to higher vibration for the
whole WIL project are summarised as below. It is noted that the occurrence
frequency for simultaneous detonation of 5 and 6 MIC for the whole
alignment from west of SYP to KET overrun tunnel and magazine store
project were assumed same as the 4 MIC case for conservatism.
Table 6.4 Overall Frequency for Failure Scenarios leading to Higher Vibration for the
Whole Project
Occurrence Frequency for multiple MIC detonated at
the same time per Section (Occurrence per Project)
Sections Blast
Linear
Length 2MIC 3MIC 4MIC 5MIC 6MIC
WIL Alignment 9.3 km 4.09E-01 1.16E-03 6.86E-06 6.86E-06 6.86E-06
WIL Magazine Store 0.4 km 1.05E-02 2.73E-05 1.89E-07 1.89E-07 1.89E-07
Overall for WIL
project
9.7 km 4.19E-01 1.19E-03 7.05E-06 7.05E-06 7.05E-06
Notes: The Blast Linear Length refers to the total pull length by the drill and blast operation. For
the WIL alignment, the blast linear length includes the two running tunnels, two station blocks
and associated adits. For the WIL Magazine Store, the blast linear length covers the access tunnel
and 9 niches.
Due to the variation of MIC used for the alignment, the risk assessment for the
use of explosives was carried out at every 10m chainage interval, which is in
line with the interval for the MIC design in the Blast Assessment Reports [4]-
[6]. The frequency of multiple MIC detonated simultaneously on a 10m
interval is summarized in Table 6.5.
Based on the derivation given in Table 6.5, the calculated frequency for a 10 m
section represents the average frequency for an average blast length of 1.7 m
(blast linear length of 9.3 km for 5509 blasts, see Annex E) for WIL alignment.
The consequence assessment (see Section 7.3.3) has identified the relevant
sections of the WIL alignment which may pose object falling hazards due to

A10-69
ground vibration and for those sections, the MIC is generally larger than 3 kg
(see Annex G) which corresponds to a blast length of about 2 m. Therefore, the
average frequency given in Table 6.5 will be slightly higher than the actual,
and considered to be conservative for the sections of concern.
Similarly, the calculated frequency for a 10 m section in Table 6.5 represents
the average frequency for an average blast length of 2.7 m (blast linear length
of 0.4 km for 149 blasts, see Annex E) for WIL magazine store. The blast length
for the concerned sections is about 3 m. Therefore, the estimated frequency
given in Table 6.5 will be similar to the actual.
Table 6.5 Overall Frequency for Failure Scenarios leading to Higher Vibration per 10m
Sections Occurrence Frequency for multiple MIC detonated at the same time
for 10 m (Occurrence per 10m)
2MIC 3MIC 4MIC 5MIC 6MIC
WIL Alignment 4.40E-04 1.25E-06 7.38E-09 7.38E-09 7.38E-09
WIL Magazine Store 2.64E-04 6.83E-07 4.72E-09 4.72E-09 4.72E-09
Overall for WIL
project 4.32E-04 1.23E-06 7.27E-09 7.27E-09 7.27E-09
6.4.2 Frequency of Higher Vibration or Air Overpressure due to Detonation of
Cartridges being Transported in Tunnel
An overall frequency of accidental initiation of 3.31 × 10 -10 per truck-km, as
described in the Section 6.2, was used for assessing transport of cartridges
from the shaft to the blast site via the diesel vehicle. This value is considered
conservative for the tunnel since the speed control will be exercised and traffic
within the tunnel is not heavier than public roads. Reduction factors were not
conservatively considered for the probability of fire following a vehicle crash
(crash fire) and impact initiation in crash.
The transport length will vary as the blasting proceeds. It was assumed as 500
m per delivery.
A10-70
7 CONSEQUENCE ASSESSMENT
7.1 GENERAL
Explosives present a hazard to both property and people. This hazard
manifests itself in the following five ways:
• blast and pressure wave;
• flying fragments or missiles;
• thermal radiation;
• cratering; and
• ground shock.
In the case of bulk explosions, the most damage is usually caused by the blast
effects. However, for small detonations, fragmentation is the most significant
effect and thermal radiation is only of interest in low speed deflagrations.
Three modes of injury can result to people when exposed to blast effects:
• Primary;
• Secondary; and
• Tertiary effects.
Primary effects involve the direct effects of the blast upon sensitive human
organs such as the ears and lungs. Compared with secondary and tertiary
effects, considerable overpressures are required for fatalities to occur, and
consequently people need to be fairly close to the scene of the explosion for
primary effects to be significant.
Secondary effects are associated with building collapse or the impact of debris
and fragments from damaged building structures and the vehicle or container
in which the explosives are held. Predicting injury and fatality levels due to
fragments/debris from high explosives is particularly difficult.
Tertiary blast injuries may occur with whole body impacts, when people are
displaced or swept away, or due to the violent movement of internal organs
within the body. For people outdoors, tertiary effects are dominant.
Thus, for the cartridged emulsions to be transported and stored for this
project, the blast effects will be of most concern. Also of interest are the
detonators used to initiate these explosives. However, provided these are kept
within their original packaging they will only explode 'one-at-a time', and will
not present a mass explosion hazard. Packaged in this way, the detonators
may be classified as UN Class 1.4 S.
A10-71
7.2 PHYSICAL EFFECT MODELLING
7.2.1 Blast and Pressure Wave for Above Ground Explosion
The consequence models used for the assessment of the probability of fatality
due to blast and pressure waves, are based on the most recent UK Explosive
Storage and Transport Committee (ESTC) model defined in the HSC
publication (HSC Advisory Committee on Dangerous Substances [7]).This
model has been previously used as part of the Penny’s Bay Rail Link Hazard
Assessment Report [3] and considers all the effects associated with an above
ground explosion including, fireball, overpressure, flying debris, broken glass,
structure damage, etc.
People Indoors
The ESTC indoor model is based on the analysis of casualty data collated from
records of a number of major incidents of accidental explosion. The data on
which the model is constructed does not distinguish between those killed by
blast and those killed by fragments. It is assumed that blast effects were the
cause of most of the fatalities recorded in these incidents but the model
implicitly makes some allowance for fragment effects. The probability of
fatality for persons located inside conventional buildings for various
quantities of explosives can be estimated by:-
Log P = 1.827 – 3.433 Log S – 0.853 (Log S)2 + 0.356 (Log S)3
Where S is R / Q 1/3 and within limits of 3 < S < 55.
In this study, the indoor consequence model has been assumed to be also
applicable to the population present in vehicles.
People Outdoors
The outdoor model is based on a review of the available literature on primary
and tertiary blast effects. The model gives the probability of death (P) as a
function of range and the quantity of explosives detonated:-
100
047.19785.5.3
1
+
−
=
Q
R
eP
Where R is the distance in m and Q is the explosive charge mass, kg. This
model is valid in the range of 2.5<R/Q 1/3 <5.3.
The distance to probabilities of fatality of 1%, 50% and 90% was estimated.
The criteria adopted in this study is consistent with the previous Penny Bay
Rail Link study [3].

A10-72
7.2.2 Blast and Pressure Wave via Access Tunnel/ Shaft
Operation of Magazine Store
An explosion in an underground storage chamber may produce external
airblast from two possible sources.
• The exit of blast from existing openings i.e. magazine adits; and
• The rupture or breach of the chamber cover by the underground
detonation. However, airblast hazards from a blast that ruptures the earth
cover are negligible relative to the ground shock and debris hazards.
In a single chamber with a straight access tunnel leading from the chamber to
the portal, which is called a ‘shotgun’ magazine, the blast and debris are
channelled to the external area as if fired from a long barrelled gun. In this
situation, the distance versus the over-pressure along the centreline of a single
opening can be evaluated using the DoD 6055.9-STD equation C9.7-16 [11]
R = 220.191 DHYD ((W / VE) 0.5 / Pso) 1/1.4
Where R is the distance from the opening, m
DHYD is the effective hydraulic diameter that controls dynamic flow issuing
from the opening, DHYD = 4 A / P where A is the cross-sectional area of the
opening and P is the perimeter,
Pso is the overpressure at distance R, kPa
W is the charge weight for the maximum credible event, kg
VE is the total volume engulfed by the blast wavefront within the tunnel
system at the time the wavefront arrives at the point of interest, m³.
The distance versus overpressure off the centreline axis of the opening can be
evaluated from equation C9.7-17 of the DoD 6055.9-STD [11]
R(θ) = R(θ = 0) / (1 + (θ / 56)2) 1/1.4
Where R(θ = 0) is the distance along the centerline axis.
However, the above equations are for use when the opening or adit from the
magazine is unobstructed. The proposed design for the magazine incorporates
portal barricades at the magazine entrance and exit openings. A barricade in
front of the entrance or exit into the magazine tunnel will reflect the shock
wave that moves directly out from the portal. The effect of providing
barricades is to reduce overpressures along the extended tunnel axis, and
increase the pressure in the opposite direction. This causes a more circular
overpressure contour that is centred at the opening. The DoD 6055.9-STD
states that a portal barricade will reduce the inhabited building distance along
the tunnel axis by 50%. The inhabited building distance represents the
distance where damage will be caused to unstrengthened buildings, but the
buildings are considered to provide a high degree of protection from death or
serious injury. Therefore, it is assumed that the inhabited building distance
correlates to the 1 psi (7kPa) over-pressure contour.
A10-73
The impact of the portal barricades is to only slightly reduce the total
Inhabited Building Distance area, which will change to a circular area, half of
which is behind the opening [11]. Therefore, the over-pressure contours that
result from a detonation within a chamber of the magazine have been
evaluated as 50% of the calculated value obtained from the DoD equation
C9.7-16 but a circular over-pressure contour is produced.
Overpressure that is sufficient to cause a fatality is based on that resulting in
lung haemorrhage in people located outside. Generally the human body is
capable of adapting to large changes in pressure which occur gradually.
Fugelso, Weiner and Schiffman derived a probit equation based on data
relating to death primarily from lung haemorrhage due to peak overpressure
[8],
Pr = -77.1 + 6.91 ln Po
Where Po is the peak over-pressure generated by the blast, Pa
Therefore, the peak over-pressures that corresponds to a 1%, 50%, and 90%
fatality level are 100 kPa , 140 kPa, and 174 kPa. Therefore, for 100 kPa peak
overpressure the distance is:-
R = 220.191 DHYD ((W / VE) 0.5 / Pso) 1/1.4
R = 220.191 x 6.35 x ((300 / 9337.5) 0.5 / 100) 1/1.4
R = 15 m for the 1% fatality level, 12 m for the 50% fatality level, and 10m for
the 90% fatality level.
However, this is based on an unobstructed portal and does not consider the
impact of the barricades. Therefore, the 1% fatality limit is represented by an
extended circular shape having a radius of 9m, whilst the 50% and 90%
fatality contours have a radius of 7m and 6m respectively.
Victoria Road is approximately 19m distant and 7m above the nearest
magazine opening. Therefore, the over-pressure that would be likely at this
distance is that equivalent to 38m when using the unobstructed DoD equation
C9.7-16 assuming explosion at magazine opening, and is estimated to be 27.9
kPa. However, this value is considered to be conservative due to the raised
level of the road above the magazine, which will offer a degree of protection
to the road users. The impact of this level of over-pressure on the road users
and pedestrians is to be assessed. Therefore, it is assumed that the likelihood
of fatalities due to the reflected over-pressure can be estimated using the ESTC
model for both indoor and outdoor fatalities.
Initiation of explosives in niches have been considered as explosion at the
magazine barricade since no decay factor (eg decay of overpressure due to
bend, reflection) was considered for overpressure wave travelling from niche
to magazine opening. The barricade will however mitigate the ‘shotgun’ effect
from the explosion. Therefore, the effect of explosions inside niches was
considered equivalent to explosions at magazine opening without any
consideration of “shotgun” effect, hence modelled with the ESTC model.
A10-74
For a magazine chamber of 300 kg that is considered to be equivalent to the
charge being detonated at the portal entrance, the probability of death at 19m
is 10% for outdoor populations. The outdoor 90% fatality limit is reached at
17m, 50% fatality reached at 18m and the 1% fatality level is reached at 22m.
It should be noted that ESTC model has conservatively included the effect due
to debris flying although the barricade is designed to capture debris. This
conservative approach has been considered for simplification purpose.
For indoor fatalities, at a scaled distance of 19 / 300 1/3 = 2.84 m/kg 1/3 , the
probability of fatality within a vehicle is 100%, with the 90% fatality limit
reached at 21m, 50% fatality limit reached at 24m, and the 1% fatality limit
reached at 63m. At a distance beyond 63m the effect to people will be limited
to injury only. Therefore, a blast within the explosives magazine will have no
significant consequences on the shipping nearby as the distance from the
shoreline to the magazine portal is about 70m. The navigation channel in the
West Lama Channel or Sulphur Channel is indeed located at 220m away from
the magazine.
For the magazine chamber that is used to store the detonators, the ESTC
Outdoor model yields the 90% fatality limit at 5m, 50% limit is reached at 6m,
whilst the 1% fatality limit extends to 7m. For indoor fatality the 90% fatality
limit is reached at 7m, 50% fatality is reached at 8m whilst the 1% fatality limit
is reached at 20m.
Transport of Explosives during Construction of Tunnel/ Magazine
The blast and overpressure effects for detonation of 125 kg cartridges being
transported by the diesel vehicle in the tunnel can be estimated by the DoD
6055.9-STD equation C9.7-16 stated above. The highest overpressure will be
expected when the accident occurs at the bottom of the shaft.
The length of shaft for the WIL alignment can vary depending on location,
typical range is between 20-40 m, but can be as deep as 80-90 m near UNV
station. The typical diameter of the shaft is at least 6 m. The blasting will
generally commence at the bottom of the shafts. The site boundary will be
located at least 10 m from the edge of the shaft and a hoarding of about 2 m
height will be provided at the boundary.
Using DoD 6055.9-STD equation C9.7-16 stated above, the distances from the
opening corresponding to 1%, 50%, and 90% fatality level are about 14 m, 11
m and 9 m, assuming a shaft diameter of 6m and length of 20 m, with a
blasting point at 50m from the shaft and detonation at the bottom of the shaft.
For a detonation of 125 kg cartridges at the portal of the shaft, the ESTC
Outdoor model yields the 90% fatality limit at 15m, 50% limit is reached at
18m, whilst the 1% fatality limit extends to 42m. For indoor fatality the 90%
fatality limit is reached at 12m, 50% fatality is reached at 13m whilst the 1%
fatality limit is reached at 16m.

A10-75
It can be seen that the hazard distance estimated by ESTC outdoor model is
more conservative than DoD 6055.9-STD equation C9.7-16. Therefore the
consequence distances obtained from the ESTC models have been used to
assess the risk of transporting explosives within the tunnel during
construction of tunnel/ magazine for conservatism.
7.2.3 Flying fragments or missiles
Fatality due to flying fragments or missiles due to above ground explosion is
considered in the ESTC model, therefore no separate model for debris is
required when ESTC is applied. For the proposed magazine, further
consideration is made below in accordance with DoD 6055.9-STD [11] to cover
the opening from magazine adits.
Marine Population near the Proposed Magazine
The storage magazine portals or adits, located below Victoria Road, face
North West, directly over the West Lamma Channel, near the entrance to the
Sulphur Channel that separates Green Island from Hong Kong Island.
From the magazine plot plan, the horizontal distance from the magazine
portal to the coastline is approximately 70m, with an approximate distance to
the ship navigation channel of a further 150m. Therefore, the distance between
the portal and the navigation channel is 220m.
The consequences from an explosion within the magazine are limited by the
provision of re-enforced concrete barriers or portal barricades. These will be
positioned in front of the entrance and exit adits of the magazine. The
barricade should be designed in accordance with the DoD 6055.9-STD. The
barricade will be sloped at an angle of 15° to the vertical to deflect any blast
consequences upwards. The barricade walls are to be faced with a material
designed to retain any possible debris that may be propelled from the
magazine adits and to absorb air overpressure.
The DoD 6055.9-STD paragraph C9.7.2.3.2.1 states that a minimum distance of
550m shall apply within 10 degrees either side of the adit centreline axis
unless positive means are used to prevent or control the debris throw. The
incorporation of portal barricades will significantly effect the distance that
debris is thrown. Paragraph C5.2.3.2.1.6 of the DoD 6055.9-STD states that the
use of barricades will lower the debris hazard to a level where quantity
distance considerations for debris are not required. Also based on ESTC
model, 1% fatality zone of 300kg explosives detonation is 63m and beyond this
distance only effect at injury level will be expected. Therefore, for the purpose
of this study the possibility of debris reaching any marine population at a
distance of 70m from the portal is not considered.
7.2.4 Thermal Radiation
The initiation of an explosion will result in thermal radiation from a fireball as
the explosives detonate. There are relatively little published models in the
literature for high explosive fireballs, or those that may result from a

A10-76
cartridged emulsion detonation. Models that are available describe the fireball
duration and diameter based on TNT or similar explosives e.g. nitroglycerine,
PETN, etc. Therefore, for the purpose of this study it is assumed that the
fireball correlations are applicable to cartridged emulsion containing
ammonium nitrate, fuel oil and aluminium powder.
The diameter and duration of a fireball from a high explosive are given by the
following equations [8]
D = 3.5 M 0.333
td = 0.3 M 0.333
where D is the fireball diameter, m
M is the mass of the explosive, kg TNT equivalent
td is the duration of the fireball, seconds.
Therefore, a fireball that has a radius of 11.7m and lasts for 2 seconds will
result from the explosion of the contents of an entire storage chamber of 300
kg, which is the largest storage quantity of explosive in this project.
The surface emissive power (Ef) can then be calculated from the equation:
dfireball
rs
ftr
HMfE
24π
∆=
Where ∆Hr is the heat released per unit mass of the explosive, kJ/kg, which is
approximately 4.01 MJ/kg for cartridged emulsion.
M is the mass of explosive, kg and
fs is the fraction of the heat that is radiated, a conservative value of 0.4 is taken.
Therefore, the surface emissive power of the fireball is 139.7 kW/m2.
The heat flux received by a receptor at distance from the fireball is estimated
by using the equation:-
aviewf FEq τ."=
Where Ef is the surface emissive power of the fireball, which is either
estimated using the previous equation or is an assumed maximum value. Fview
is the view factor, and τa is the atmospheric transmissivity.
For a vertical surface the view factor can be calculated from the equation [7]:-
( ) 23
22
2)(
fb
fb
view
rX
rXF
+
=
Where X is the distance measured along the ground from the object to a point
directly below the centre of the fireball. This distance must be greater than the
radius of the fireball, because actual development of the fireball often involves
an initial hemispherical shape, which would engulf nearby receptors.
Additionally, as the fireball lifts off the ground, the distance to near field
receptors changes significantly. This means that the radiation estimates in the
near field are of questionable accuracy.

A10-77
At very large distances the above equation for the view factor reduces to
Fview = (r/X)2
The atmospheric transmissivity, τa, reflects the proportion of radiation that is
adsorbed by the water vapour and the carbon dioxide present in the
atmosphere. A correlation for the estimation of transmissivity was published
by F.D. Wayne [23].
( ) ( )[ ] ( ) ( )[ ]
T
dX
T
RHdPX
where
XXXX
CO
o
w
OH
COCOOHOHa
273
165.2
log001164.0log03188.0log02368.0log01171.0006.1
2
2
2222
2
1010
2
1010
=
=
+−−−=τ
RH is the relative humidity and is assumed to be 85% for Hong Kong.
Pow is the vapour pressure of water at the atmospheric temperature, T,
And d is the distance to the fireball surface, or path length.
The probit equation for fatalities due to thermal radiation is proposed by
Eisenberg [8]:
Pr = -14.9 + 2.56 ln L
Where L is the thermal dose or load defined as:
L= t I 4/3
Where I is the thermal radiation flux, kW/m²
And t is the exposure duration
Therefore, the thermal dose units required for a 1%, 50%, and 90% fatality
levels are 956, 2377, and 3920 s.(kW/m²) 4/3 respectively. However, the UK
HSE Safety Report Assessment Guides [24] indicate that the thermal dose
units that correspond to the 1%, 50%, and 90% fatality limits are 1000, 1800,
and 3200 tdu respectively. Therefore, using the HSE thermal dose criteria
limits indicates that the incident radiation fluxes to cause these fatality levels
are 105.7, 164, and 241 kW/m².
These levels of thermal flux will only be realised when in close proximity to
the fireball. Therefore, as discussed above the estimate of a separation distance
will be of questionable accuracy. This can be illustrated by considering the 1%
fatality limit for vulnerable people i.e. children and the elderly, of 500 thermal
dose units based on the UK HSE criteria. This dose level is reached at a
distance of 7m, assuming the fireball is touching the ground. However, at this
distance any person would still be in a position that is within the fireball as it
develops from a hemi-spherical shape into a sphere, before lifting off the
ground. Hence, the probability of a fatality should be taken as 100%.
Therefore, it can be concluded that a fireball that results from the initiation of
cartridged emulsion within the storage magazine will not pose an off-site
hazard.
It is generally the case that the thermal hazards from an explosives detonation

A10-78
event are of less concern than the blast and fragment hazards. Therefore, the
hazards of a fireball are not considered further in this assessment.
7.2.5 Cratering
An explosion in an underground storage chamber may produce external
airblast from two sources; the exit of blast from existing openings such as the
magazine adits, and the rupture or breach of the chamber cover by detonation.
The DoD 6055.9-STD [11] defines a critical chamber cover thickness as:
Cc = 1.0 Q 1/3
The maximum load to be transported within the magazine is 200 kg, therefore
the critical cover thickness is 5.8 m. At the closest approach Victoria Road is
7m above the access tunnel. Therefore, cratering of Victoria Road is not
considered likely in the event of detonation of the full load of a magazine
vehicle directly below.
The shallowest depth of a magazine niche below the surface of Mount Davies
is approximately 85m. Each magazine niche is designed to store up to 300 kg
of explosives, which requires a critical cover thickness of only 6.7m. Hence,
cratering at the surface of Mount Davies due to an initiation within a
particular magazine niche is not considered by this study.
Similarly, cratering is not considered as a credible scenario for use of
explosives during the construction of WIL alignment and magazine.
7.2.6 Ground Shock Generated by Rock Excavation using Explosives
The detonation of solid phase materials liberates energy by a rapid chemical
reaction process, which produces and sustains a shock wave in the material.
The high temperatures and pressure associated with the shock wave cause
almost instantaneous reaction in the material. This reaction produces high
pressures and temperatures in the expanding gas. It is this pressure that
crushes surrounding rock when the explosive material is placed in a drill hole
for blasting.
In areas where the explosive material is less confined the pressure will be
reduced due to the increased volume into which the gases can expand. If the
degree of confinement is reduced eventually the pressure will cease to crush
the rock, but instead will cause rock fractures or cracking. If the level of
confinement is reduced further, the pressure will cease to fracture the rock
and the energy will propagate through the rock as an elastic wave causing the
rock particles to vibrate. The degree of vibration of the rock particles decreases
with increasing distance from the blast. However, the vibration of the rock
particles can cause damage and structural failure to buildings if sufficiently
strong.
The prediction of the Peak Particle Velocity (PPV) follows a propagation law
which has the form [9]:-
V = K Qd R–b

A10-79
Where V is the Peak Particle Velocity, mm/sec
R is the distance between the blasting source and the measuring point, m
Q is the explosive charge weight in TNT equivalence per delay, kg
K, d and b are site specific constants, termed the rock constant, charge
exponent, and attenuation factor respectively. Both theoretical and empirical
methods have been used to estimate values for K, d, and b.
The above equation with values of K = 644 based on the 84% confidence limit, d
= 0.5 and b = -1.22 have been used for the blast design of the WIL project, in
accordance with the general practice in Hong Kong and as per the guidelines
developed by the Mines Division. A limit on PPV of 25 mm/s (for buildings)
and similar values (for other receptors) is used as the criteria for the blast
design as discussed in Section 5.4.
From a risk perspective, if a 84% confidence level is used for calculation of PPV,
there would be a 16% probability that the PPV will exceed the acceptable PPV.
Hence, it is necessary to determine a value for the rock constant, K that is
appropriate for the hazard assessment.
The value for the rock constant, K, is largely related to the rock type, structure
and the confinement of the blast, i.e. K will be larger for an explosive charge
placed in a tight fitting blasthole than for explosives stored in a niche or
chamber. The values of K for granitic and volcanic rocks in Hong Kong are in
the range of 1000 to 1200 for tunnel blasting [9]. Geoguide 4 states that the
values for the charge and attenuation exponents are between 0.6 to 0.8 and 1.2
to 1.6 respectively.
Rearranging the above equation yields:-
V = K (R / Qd/b) -b
Where the ratio of the charge to attenuation exponent (i.e. d/b) lies within the
limits of 0.5 to 0.66.
In the context of QRA, the equation used in GEO Guide 4 [9] was considered
applicable. The parameters used in QRA are as follow:
K = 1200, upper range selected from GEO Guide 4
This value is conservative as it represents an upper limit for PPV for rock
conditions considered applicable for Hong Kong.
d = 0.5 and b = -1.22
This slope is conservative for predicting PPV in far field for which an
attenuation exponent of -1.6 to -1.2 could be considered as per GEO Guide 4.
Effect on buildings
There are various published international standards that relate to the damage
levels that may be apparent from ground vibrations. However, most of these
are concerned with the limit of cosmetic damage to buildings. For example, BS
7385-2:1993 Evaluation and measurement for vibration in buildings – Guide to
damage levels from ground borne vibration [25] states that the probability of

A10-80
damage to buildings tends towards zero at values for the Peak Particle
Velocity at 12.5mm/s or less. In addition for reinforced or framed structures
the PPV value at which cosmetic damage will occur is 50mm/s. This reduces
to 20mm/s for un-reinforced or light buildings at lower frequencies,
increasing to 50 mm/s for frequencies above 40 Hz.
In Hong Kong the value for the peak velocity of 25 mm/s has been used for
many years, and represents the maximum values normally acceptable for a
building, in order to prevent cosmetic damage. However, for the purpose of
this study the value of the peak particle velocity that causes significant
structural damage such that a fatality or multiple fatalities are possible is
required.
In the US Bureau of Mines Bulletin 656 Blasting vibrations and their effects on
structures [26] provide results obtained from blasting undertaken in Sweden.
These results were obtained following blasting where the vibrations were
attenuated very little with distance since both the charge location and the
buildings were set in rock. In order to improve the economy of the blasting,
larger charge weights were used that would result in minor damage. The cost
of repair of the buildings was considered preferable to the use of smaller
charge weights. Hence, there was a large amount of data obtained on damage
to buildings from blasting. The results obtained showed that:
Table 7.1 Damage Level due to Ground Vibration
Damage level Peak particle velocity, mm/s (in/s)
No noticeable damage 70 (2.8) Fine cracking and fall of plaster 110 (4.3) Cracking 160 (6.3) Serious cracking 231 (9.1)
Further information on the damage to buildings is provided by the US
Department of Defence Standard DoD 6055.9-STD 2004 DOD Ammunition
and explosives safety standards [11] Paragraph C9.7.2.3.1.1 states that for the
protection of residential buildings against significant structural damage by
ground shock, the maximum particle velocity induced in the ground at the
building site shall not exceed 9.0 in/sec or 229 mm/s for strong rock.
The explosives magazine storage is to be constructed under Mount Davies,
which comprises cretaceous volcanic rocks, which are dominantly a coarse ash
crystal tuff. Therefore, the ground shock that may result from the accidental
initiation of a storage chamber is considered to be transmitted through strong
rock. The WIL alignment will also be constructed in strong rock.
The criteria for the damage to inhabited buildings shall be based on the US
DoD 6055.9-STD for strong rock. This indicates that a detonation within the
explosive magazine does not result in dangerous peak particle velocities at the
nearest inhabited building and is unlikely to cause cosmetic damage to the
building.

A10-81
Criteria adopted for building risk assessment were summarized as below:
• PPV = 229mm/s – Building structural element collapse threshold.
It represents significant structural damage to a building. Note that
based on expect judgment [10], PPV at this level is not likely to cause
any structural element to collapse.
• PPV = 100mm/s – Object falling threshold.
Based on the discussion below, it is assumed to represent a 1% fatality
level within a building due to vibration causing object falling, but no
major building damage is expected at this level.
A peak particle velocity significantly larger than the assumed threshold limit
value of 229 mm/s, would be required to fail a typical building in Hong Kong
[10]. Hence the above criteria are considered to be conservative.
Building Collapse Models for Explosion/ Earthquake
Estimation of fatalities from falling objects relies on assumptions such as
number of objects with the potential to fall, weight and size of those objects,
probability of fatality when a person is hit etc. Although the number of
fatalities given an object of a given size can be estimated, the probability of
objects falling due to ground vibration particularly at a low threshold value of
100mm/s is uncertain. It would depend on the condition of building, presence
of temporary or unauthorized structures etc.
For the types of buildings considered in the QRA, objects with the potential to
fall are assumed to cover an area of 1 m2. Based on the maximum pedestrian
population density of 0.5 person/m2 estimated in the QRA, the resulting
number of fatalities due to an object falling is one. Even assuming
conservatively that one object will fall on each side of a building, the expected
number of fatalities will be 2 given a 50% chance of fatality for such an object
falling [41].
Since, the assessment of risks due to objects falling due to blast vibrations
involve the assessment of unknown factors, the QRA has used building
collapse correlations applied to the entire building population (assuming full
occupancy) to capture such unknown factors based on the consideration that
building collapse will cause more fatalities than object falling. Building
vulnerability model have been well established and extensively used to
determine the fatality rate due to damage or collapse of buildings caused by
explosion or earthquake.
A review of building damage vulnerability models for partial building
collapse / damage was carried and summarized in Table 7.2.

A10-82
Table 7.2 Review of Building Vulnerability Models
Source Model Type Description Fatality Rate
Gibert,
Lees and
Scilly [8]
Explosion
model
Housing Damage Category Cb - Houses which
are rendered uninhabitable by serious damage
and need repairs so extensive that they must be
postponed until after the war. Examples of
damage resulting from such conditions include
partial or total collapse of roof structures, partial
demolition of one or two external walls up to 25%
of the whole, and severe damage to the load
bearing partitions necessitating demolition and
replacement
0.009
PEER
Survey-
based
NDCF
Fatality
model
[36]
Earthquake
model
Partial collapse includes:
1) Ceiling / roof collapsed
2) Ceiling / roof collapsed + Foundation
destroyed
3) Floors collapsed
4) Floors collapsed + Foundation destroyed
5) Ceiling / roof collapsed + Floors collapsed
6) Ceiling / roof collapsed + Floors collapsed +
Foundation destroyed
0.015
ATC-13
[37]
Earthquake
model
Major damage to building 0.01
HAZUS
® 99SR-2
[38]
Earthquake
model
Extensive – 20-50% of building being damaged 0.00001
If it is assumed that every building experiencing the ‘fine cracking’ or ‘object
falling’ vibration threshold (ie 100mm/s) will result in comparable fatality
modes caused by partial collapse due to heavy explosion or earthquake, then
the building vulnerability model can be used as a basis for this study.
The fatality modes caused by partial collapse will be mainly due to collapse of
roofs, ceilings and walls, which may be considered as the most serious
concern of object falling causing fatality (ie more than one or two fatalities).
Since partial collapse/damage of a building defined in those models refer to
severe building damage, this approach is deemed to be conservative.
The fatality rates calculated from various models for partial collapse of a
building vary from 0.01% to 1.5%. A fatality rate of 1% has therefore been
conservatively considered for fatalities resulting from objects falling.
Review of Historical Incidents
UK HSE has carried a survey to collect all the incidents related to object falling
at work from 2004-2007 [39] irrelevant of the cause.
The results show that a total of 51,092 object falling incidents impacting
persons and 101 fatalities were reported during this period in UK.

A10-83
Based on these statistics, it can be derived that for a given falling object
incident, the chance of killing a person is around 0.1%. This factor can be
increased by one or two orders of magnitude to account for potentially higher
population density, giving a probability range of 1% to 10%. Assuming
conservatively that one object can fall at each side of the building, the number
of fatalities expected is one person.
Based on typical building occupancies of 600 to 800 people, the 1% fatality
criteria has therefore assessed that there could be 6-8 fatalities per building
affected for each blast causing objects to fall. Based on the above discussion,
the expected number of fatalities due to object falling does not exceed one or
two, therefore the assumption of 1% fatality is deemed conservative.
Effect on slopes
The following approach has been developed specific to this project.
A study was performed to determine the vibration level required to lead to
failure of slopes due to earthquakes in Hong Kong [28]. This is based on Sarma 1975 as referred to in GEO Report 15 [12]. The formula for slope
movement is given below (based on [28] which made reference to Sarma 1975
work):
Xm = 0.25 * C * Am * T2 * 10 (1.07-3.83 Ac / Am)
where Xm = slope movement
C is a function of the slope geometry and generally has a value near unity
Am is the peak acceleration,
T is the dominant period of the ground motion, and
Ac is the critical acceleration required to cause sliding.
From blast observations, and according to GEO report 15 [12] the dominant
period is about 1/30 seconds. Also from blast observation it appears that the
peak ground acceleration in mm/s2 is about 670 times the PPV in mm/s (i.e.
for a PPV of 60mm/s the peak acceleration is about 4g or 40,000mm/s2 [10]. It
follows that Xm, the slope movement
( )PPV
PPVc
m xPPVxX83.307.1
10186.0−
=
However, this equation is based on the use of earthquake data, which will
comprise several low frequency pulses instead of a singular pulse at higher
frequency that would result from explosives detonating. From analysis of data
for the El Centro (1940) earthquake [27], it appears that a typical earthquake
consists of at least four (4) separate peaks. Since each peak will cause slope
movement it is considered appropriate to incorporate a factor of 0.25 in the
Sarma equation to allow for the single pulse that would result from explosives
detonation within the magazine. Therefore, the modified Sarma equation to
estimate slope movement from the detonation of explosives is:-
( )PPV
PPVc
m xPPVxX83.307.1
100465.0−
=

A10-84
where PPVc is the critical velocity calculated using the equations supplied in
GEO Report 15 [12] and knowledge of the slope.
PPVc = Kcg/(ωKa)
Where
Kcg = the critical acceleration at which the slope has a factor of safety of 1.0
against failure (ms-2)
g = the acceleration due to gravity (ms-2)
ω = the circular frequency of the ground motion (2̟f)
Ka = the magnification factor
The soil strength values used in determining the PPVc values are those
recommended by GEO Guidance documents and are generally considered to
be a conservative estimate of the actual expected strengths. Additionally while
saprolite may experience a post peak drop in strength this strength drop
requires a significant movement of the slope and is the main contributory
factor leading to the assessment of 100mm being the displacement required to
cause ongoing failure of the slope. If there is no post peak drop in strength the
Sarma method can be used to assess much larger slope movements that will
still cease once the vibration has stopped and therefore not lead to a complete
slope failure.
GEO Report 15 [12] publishes a graphical representation of the Critical Peak
Particle Velocity, PPVc, and the initial static factor of safety for varying joint
displacements at peak stress. This is reproduced in the Figure 7.1 below.
Based on the modified Sarma equation,
( )PPV
PPVc
m xPPVxX83.307.1
100465.0−
=
the peak particle velocity (PPV) required to cause slope movement can be
plotted for each critical peak particle velocity value. This is illustrated in the
Figure 7.2 below for the critical peak particle velocities estimated for the slopes
11-SW-A-C292/3, and the retaining wall 11-SW-A-R782 which will be
impacted by the detonation of explosives within the magazine (see Section
7.3.1) for illustration.
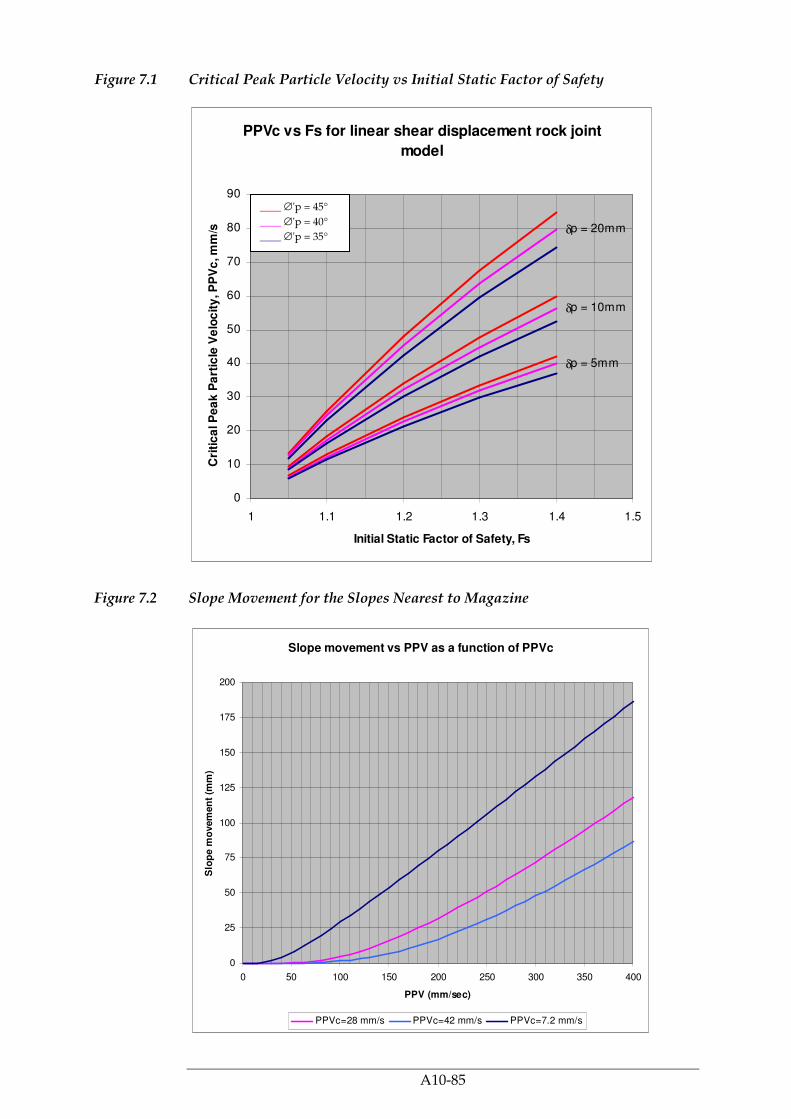
A10-85
Figure 7.1 Critical Peak Particle Velocity vs Initial Static Factor of Safety
Figure 7.2 Slope Movement for the Slopes Nearest to Magazine
PPVc vs Fs for linear shear displacement rock joint
model
δp = 5mm
δp = 10mm
δp = 20mm
0
10
20
30
40
50
60
70
80
90
1 1.1 1.2 1.3 1.4 1.5
Initial Static Factor of Safety, Fs
Cri
tic
al P
ea
k P
art
icle
Ve
loc
ity
, P
PV
c, m
m/s
____ ∅'p = 45°
____ ∅'p = 40°
____ ∅'p = 35°
Slope movement vs PPV as a function of PPVc
0
25
50
75
100
125
150
175
200
0 50 100 150 200 250 300 350 400
PPV (mm/sec)
Slo
pe m
ovem
en
t (m
m)
PPVc=28 mm/s PPVc=42 mm/s PPVc=7.2 mm/s
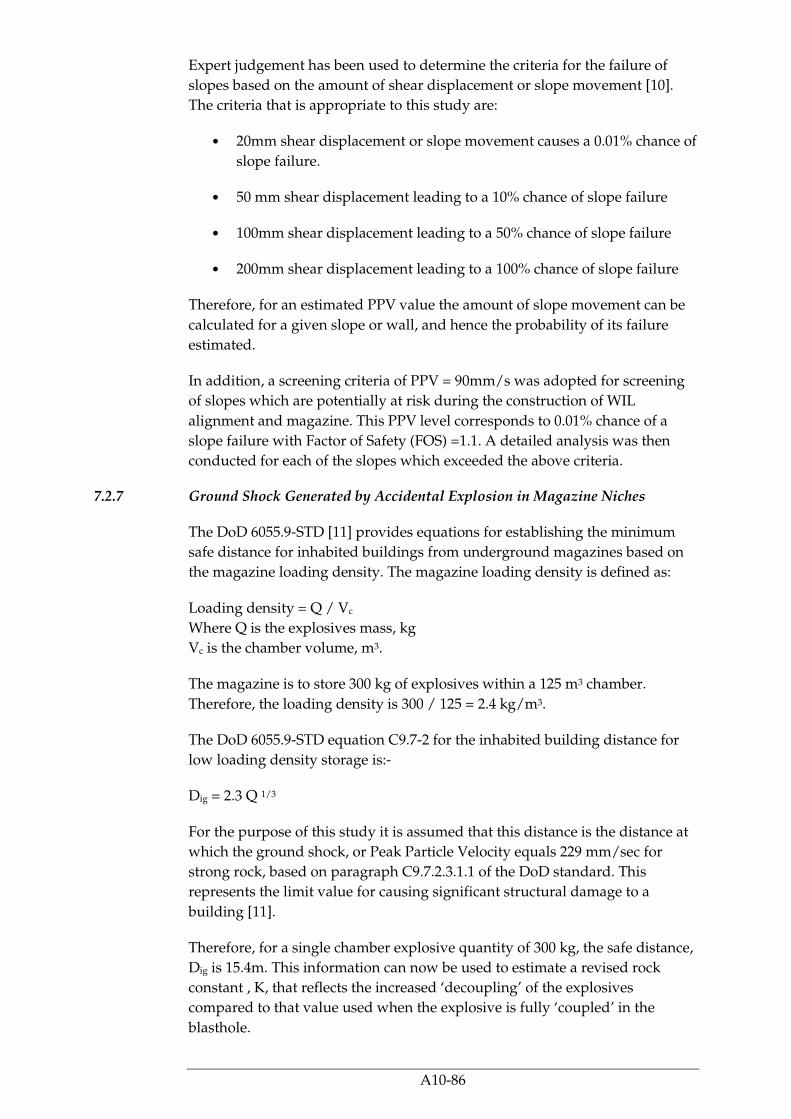
A10-86
Expert judgement has been used to determine the criteria for the failure of
slopes based on the amount of shear displacement or slope movement [10].
The criteria that is appropriate to this study are:
• 20mm shear displacement or slope movement causes a 0.01% chance of
slope failure.
• 50 mm shear displacement leading to a 10% chance of slope failure
• 100mm shear displacement leading to a 50% chance of slope failure
• 200mm shear displacement leading to a 100% chance of slope failure
Therefore, for an estimated PPV value the amount of slope movement can be
calculated for a given slope or wall, and hence the probability of its failure
estimated.
In addition, a screening criteria of PPV = 90mm/s was adopted for screening
of slopes which are potentially at risk during the construction of WIL
alignment and magazine. This PPV level corresponds to 0.01% chance of a
slope failure with Factor of Safety (FOS) =1.1. A detailed analysis was then
conducted for each of the slopes which exceeded the above criteria.
7.2.7 Ground Shock Generated by Accidental Explosion in Magazine Niches
The DoD 6055.9-STD [11] provides equations for establishing the minimum
safe distance for inhabited buildings from underground magazines based on
the magazine loading density. The magazine loading density is defined as:
Loading density = Q / Vc
Where Q is the explosives mass, kg
Vc is the chamber volume, m3.
The magazine is to store 300 kg of explosives within a 125 m3 chamber.
Therefore, the loading density is 300 / 125 = 2.4 kg/m3.
The DoD 6055.9-STD equation C9.7-2 for the inhabited building distance for
low loading density storage is:-
Dig = 2.3 Q 1/3
For the purpose of this study it is assumed that this distance is the distance at
which the ground shock, or Peak Particle Velocity equals 229 mm/sec for
strong rock, based on paragraph C9.7.2.3.1.1 of the DoD standard. This
represents the limit value for causing significant structural damage to a
building [11].
Therefore, for a single chamber explosive quantity of 300 kg, the safe distance,
Dig is 15.4m. This information can now be used to estimate a revised rock
constant , K, that reflects the increased ‘decoupling’ of the explosives
compared to that value used when the explosive is fully ‘coupled’ in the
blasthole.

A10-87
The rock constant, K, that reflects the magazine chamber’s level of
confinement can now be estimated from:-
PPV = K (R / Q 0.5) -1.22
Re-arranging gives
K = PPV / (R / Q 0.5) -1.22
K = 229 / (15.4/ 300 0.5) -1.22
K = 200
Hence, the equation for the estimation of the PPV values that result from an
explosion within a storage chamber involving 300kg of explosives is:
PPV = 200 (R / Q 0.5) -1.22
The effects of buildings and slopes are given in Section 7.2.6.
7.2.8 Landslide Consequence
A landslide consequence classification system was published in the GEO
Report 81 Slope Failures along BRIL Roads: Quantitative Risk Assessment and
Ranking [13]. This provides an equation for the estimation of the number of
fatalities:
V
WFPEAN
∑=
Where W is the width of the landslide plus an adjustment for effective
stopping distance;
F is the frequency of passing passengers, which may be taken as the product
of the Annual Average Daily Traffic (AADT) and the average number of
people in a vehicle;
P is the probability of death due to being caught in the landslide;
E is the extent of the landslide equivalent to the number of lanes affected;
A is an adjustment factor for proportion of normal road usage at the time of
the landslide; and
V is the speed of vehicles.
The following assumptions have been made in applying this model.
• Average speed of the vehicles is taken to be 30 miles/hr (48 km/h)
based on the road conditions at the location of the magazine. It should
be noted that the speed of the vehicles is not particularly sensitive to
the calculation of N since the effect is largely compensated by the
effective stopping distance
• A stopping distance of approximately 23m is assumed based on UK
Highway Code data for a vehicle speed of 30 miles/hr (48 km/h) [29].
This stopping distance includes the reaction time. Higher speeds will
require greater stopping distances. However, it is considered that the

A10-88
road conditions at the site of the magazine prohibit excessive vehicle
speeds.
• The probability of death, P, due to the landslides given in Table 7.3 is
obtained from the GEO Report 81 [13]. GEO has developed the
consequence model and has published papers on this subject [34]. The
past incidents show that for landslides the assumptions are reasonable.
This model has been applied for several studies on landslides in Hong
Kong.
Table 7.3 Probability of Fatality due to Landslide [13]
Proximity to Slope Probability of Death Lane nearest the slope 0.8 2nd lane away from slope 0.6 3rd lane from slope 0.4
• For the failure of a retaining wall, that causes the collapse of a road, the
probability of death is assumed to be 1 for the lanes affected.
• The parameter A can be taken as 0.82 and accounts for the fact that
landslides are most likely to occur during heavy rainfall. However, as
the possible slope failure is caused by explosives detonating it is
assumed that the value for A is unity.
• To allow for the additional risk due to footpaths adjacent to the road,
an adjustment factor is applied to the calculated value of N.
• Victoria Road is comparatively remote, and hence a lower factor than
that recommended for major transportation routes is considered
appropriate. Therefore, to account for pedestrians the calculated N
value is increased by 10%.
The travel distance of landslide debris is influenced by the mechanism of its
failure. For example, it would be expected that a landslide induced by rainfall
will travel further than one caused by blasting as the soil and rock may behave
in a more liquid manner. Therefore, the travel distance for rainfall induced
landslides that involve liquefaction may be based on an apparent angle of
friction of 15 to 30º. This apparent angle of friction or travel angle is defined as
the inclination. The GEO Report 81 [13] indicates that a typical rain induced
landslide that involves a landslide volume less than 2000m³ generally ranges
from 30 to 40°. For conservatism, it is assumed that a slope failure caused by
detonation of explosives will result is a travel angle of 30°.
The relationship of shadow/travel angle and run out distance is illustrated by
the following figure.
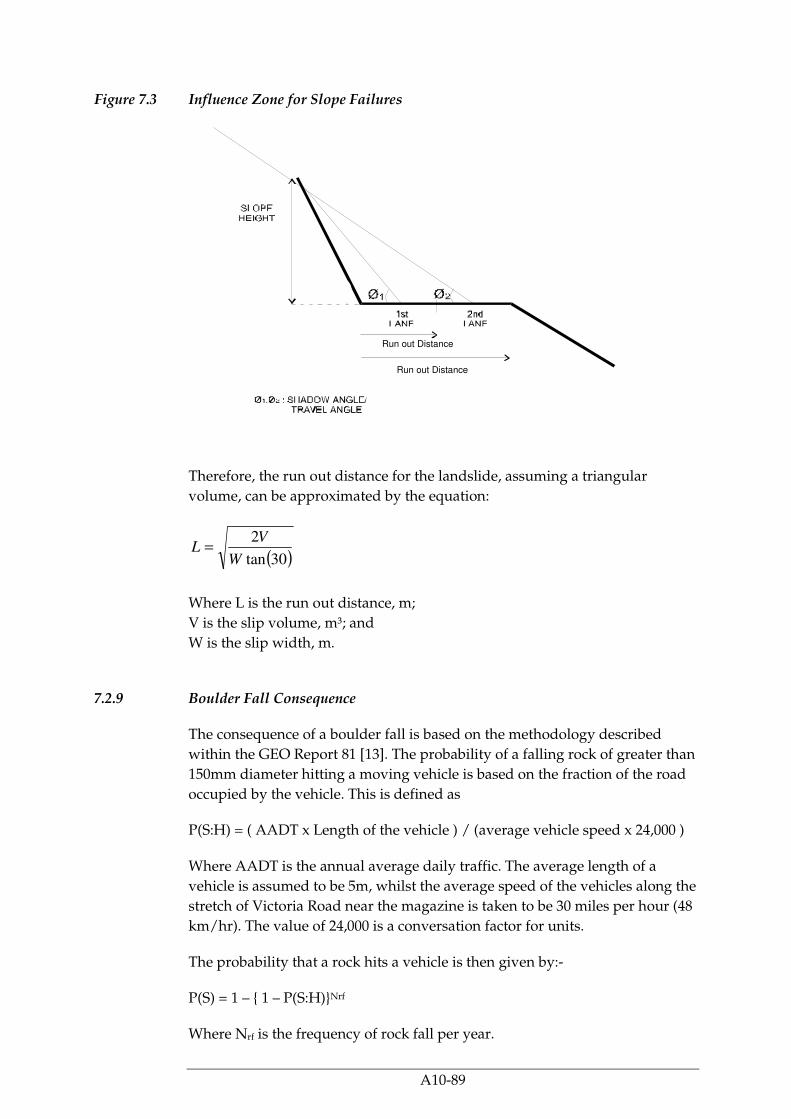
A10-89
Figure 7.3 Influence Zone for Slope Failures
Therefore, the run out distance for the landslide, assuming a triangular
volume, can be approximated by the equation:
( )30tan
2
W
VL =
Where L is the run out distance, m;
V is the slip volume, m³; and
W is the slip width, m.
7.2.9 Boulder Fall Consequence
The consequence of a boulder fall is based on the methodology described
within the GEO Report 81 [13]. The probability of a falling rock of greater than
150mm diameter hitting a moving vehicle is based on the fraction of the road
occupied by the vehicle. This is defined as
P(S:H) = ( AADT x Length of the vehicle ) / (average vehicle speed x 24,000 )
Where AADT is the annual average daily traffic. The average length of a
vehicle is assumed to be 5m, whilst the average speed of the vehicles along the
stretch of Victoria Road near the magazine is taken to be 30 miles per hour (48
km/hr). The value of 24,000 is a conversation factor for units.
The probability that a rock hits a vehicle is then given by:-
P(S) = 1 – { 1 – P(S:H)}Nrf
Where Nrf is the frequency of rock fall per year.
Run out Distance
Run out Distance

A10-90
The probability of loss of life of an occupant given a vehicle is hit by a rock is
assumed to be 0.2 [13]. This probability accounts for the size of the rock, the
number of occupants within the vehicle, the construction of the vehicle.
In addition, the consequence of a vehicle hitting the boulder once it has fallen
can be estimated based on the stopping distance of the vehicle. The stopping
distance can then be substituted as the average length of the vehicle, and a
probability of fatality to an occupant is assumed to be 0.1 [13].
With regard to boulders impacting pedestrians, the Territory Wide
Quantitative Risk Assessment of Boulder Fall Hazards Stage 1 Final Report
[35] has suggested an increase factor of 25% over the fatality estimated based
on road vehicles.
Regarding effects on buildings, there are no boulders that were above the
buildings as identified in the Blast Assessment Reports [4]-[6].
7.3 RESULTS OF CONSEQUENCE ASSESSMENT
7.3.1 Proposed Magazine
The slopes nearest to the magazine are 11-SW-A-C292, 11-SW-A-C293 and the
retaining wall is 11-SW-A-R782 Data for these slopes has been supplied by
MTRC, and is tabulated below:-
Table 7.4 Particulars of the Slopes Nearest to the Magazine
Slope
Identification
Static Factor
of Safety
Slope
length,
m
Slope
angle
Slope
depth,
m
Slope
material
PPVc,
mm/s
Slip
Volume,
m³
Location*
11-SW-A-
C292
1.22 6.8 55 1.5 Soil &
Rock
28 36 Near
eastbound
lane of
Victoria road
11-SW-A-
C293
1.2 28 60 4 Soil &
Rock
42 1640 Near
eastbound
lane of
Victoria road
11-SW-A-
R782
1.27
(overturning
1.46
(sliding)
20 85 5 max Masonry
and
concrete
wall
7.2 32.7 Near
westbound
lane of
Victoria road
*Refer to Table 4.3 for annual average daily traffic (AADT) data
The peak particle velocity that could possibly arise from an initiation within
each magazine chamber has been evaluated for the nearby slopes and
occupied buildings. The results are tabulated below. The slope movement is
read from the respective PPVc curve for the concerned slope/ retaining wall
in Figure 7.2 based on the calculated PPV value.
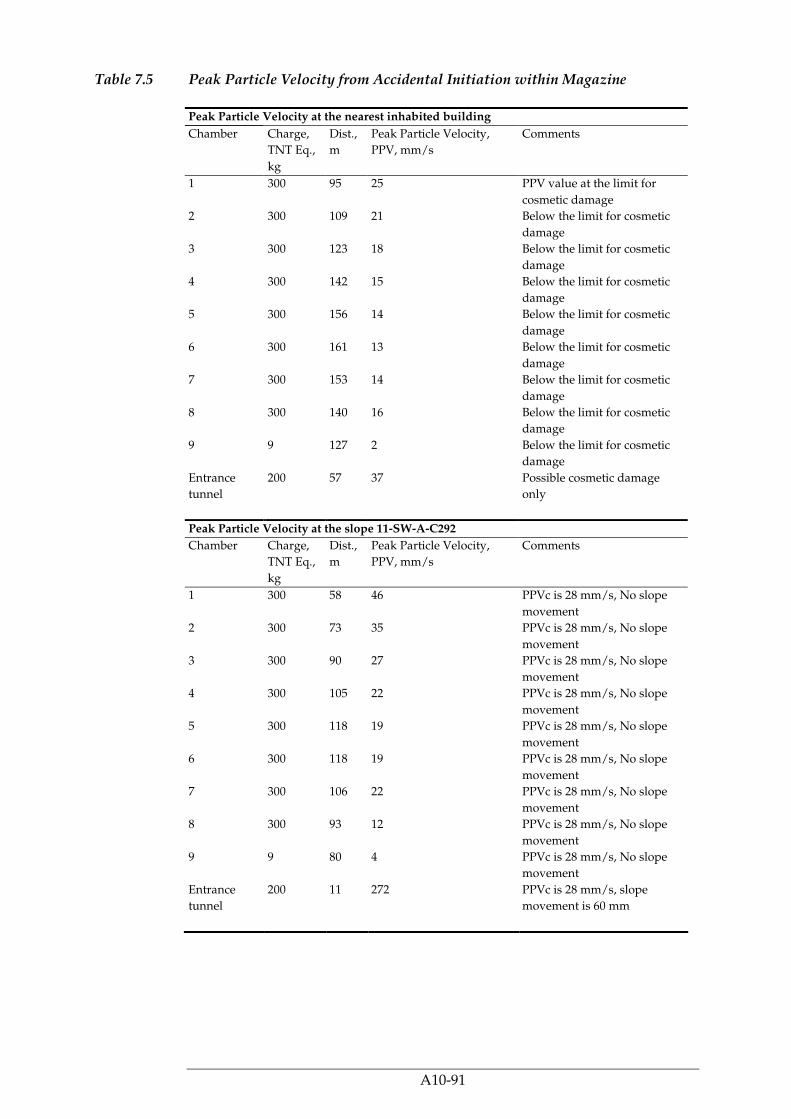
A10-91
Table 7.5 Peak Particle Velocity from Accidental Initiation within Magazine
Peak Particle Velocity at the nearest inhabited building
Chamber Charge,
TNT Eq.,
kg
Dist.,
m
Peak Particle Velocity,
PPV, mm/s
Comments
1 300 95 25 PPV value at the limit for
cosmetic damage
2 300 109 21 Below the limit for cosmetic
damage
3 300 123 18 Below the limit for cosmetic
damage
4 300 142 15 Below the limit for cosmetic
damage
5 300 156 14 Below the limit for cosmetic
damage
6 300 161 13 Below the limit for cosmetic
damage
7 300 153 14 Below the limit for cosmetic
damage
8 300 140 16 Below the limit for cosmetic
damage
9 9 127 2 Below the limit for cosmetic
damage
Entrance
tunnel
200 57 37 Possible cosmetic damage
only
Peak Particle Velocity at the slope 11-SW-A-C292
Chamber Charge,
TNT Eq.,
kg
Dist.,
m
Peak Particle Velocity,
PPV, mm/s
Comments
1 300 58 46 PPVc is 28 mm/s, No slope
movement
2 300 73 35 PPVc is 28 mm/s, No slope
movement
3 300 90 27 PPVc is 28 mm/s, No slope
movement
4 300 105 22 PPVc is 28 mm/s, No slope
movement
5 300 118 19 PPVc is 28 mm/s, No slope
movement
6 300 118 19 PPVc is 28 mm/s, No slope
movement
7 300 106 22 PPVc is 28 mm/s, No slope
movement
8 300 93 12 PPVc is 28 mm/s, No slope
movement
9 9 80 4 PPVc is 28 mm/s, No slope
movement
Entrance
tunnel
200 11 272 PPVc is 28 mm/s, slope
movement is 60 mm

A10-92
Peak Particle Velocity at the slope 11-SW-A-C293
Chamber Charge,
TNT Eq.,
kg
Dist.,
m
Peak Particle Velocity,
PPV, mm/s
Comments
1 300 56 48 PPVc is 42 mm/s, No slope
movement
2 300 71 36 PPVc is 42 mm/s, No slope
movement
3 300 86 28 PPVc is 42 mm/s, No slope
movement
4 300 98 24 PPVc is 42 mm/s, No slope
movement
5 300 97 24 PPVc is 42 mm/s, No slope
movement
6 300 82 30 PPVc is 42 mm/s, No slope
movement
7 300 62 42 PPVc is 42 mm/s, No slope
movement
8 300 50 55 PPVc is 42 mm/s, No slope
movement
9 9 42 8 PPVc is 42 mm/s, No slope
movement
Exit tunnel 200 7 472 PPVc is 42 mm/s, Slope
movement 118mm
Peak Particle Velocity at the retaining wall 11-SW-A-R782
Chamber Charge,
TNT Eq.,
kg
Dist.,
m
Peak Particle Velocity,
PPV, mm/s
Comments
1 300 109 21 PPVc = 7.2 mm/s, <1mm
movement
2 300 124 18 PPVc = 7.2 mm/s, <1mm
movement
3 300 141 15 PPVc = 7.2 mm/s,<1mm
movement
4 300 157 14 PPVc = 7.2 mm/s, <1mm
movement
5 300 168 13 PPVc = 7.2 mm/s, <1mm
movement
6 300 170 12 PPVc = 7.2 mm/s, <1mm
movement
7 300 160 13 PPVc = 7.2 mm/s, <1mm
movement
8 300 145 15 PPVc = 7.2 mm/s, <1mm
movement
9 9 132 2 PPVc = 7.2 mm/s, No
movement
Entrance
tunnel
200 42 53 PPVc = 7.2 mm/s, 9mm
movement
Therefore, based on the above approach the detonation of explosives within
an individual magazine chamber will not result in C292/3 or R782 slope
failure. However, during the transfer of explosives to or from the magazine
chamber there is a risk of slope failure due to detonation of explosives within
the tunnel when the vehicle is close to the slope toe.
Based upon Figure 7.2, the peak particle velocity that results in a 0.01% chance
(i.e. 20 mm slope movement) of slope failure is 165 mm/s, 211 mm/s, and 81

A10-93
mm/s for slopes C292, C293 and R782 respectively. These values for PPV
correspond to a distance of 17m, 14m and 30m for the slopes C292/3 and the
retaining wall R782 based on a 200 kg explosive in a truck. Therefore, beyond
these distances there is considered to be a negligible chance of failure of the
slope or wall due to ground vibration from a blast within the magazine access
tunnel. Based on these limiting distances, the approximate length of the
magazine tunnel which has the potential to cause a slope failure is
approximately 30m for slopes C292 and C293. The access tunnel is over 40m
from the retaining wall R782, hence there is already a less than 0.01% chance
of the wall failing in the event of an explosion at the magazine adit entrance.
For the slope C293, assuming 16 vehicle movements within magazine access
tunnel per day (6 trips for transfer into the niches and 10 trips for taking out
from niches to construction site), the frequency of an initiation of explosives
on a vehicle within the vulnerable 30m sections of the magazine access tunnel
is:-
3.31 x 10-10 x 16 x 365 x 30 / 1000 = 5.8 x 10⁻⁸ yr-1
The estimated PPV value caused by a detonation immediately beneath the
slope is 117mm/s. Therefore, it is conservatively assumed that for the entire
30m tunnel section that there is a 50% chance of failing slope C293 (see section
7.2.6).
However, for the failure of slope C292, only an initiation within the entrance
tunnel will be sufficient to cause possible slope failure, and the frequency of
initiation within the entrance tunnel will be 2.1 x 10⁻⁸ yr-1.
Slopes 11-SW-A-C292/3
For slope 11-SW-A-C292 the landslide run out distance will be 4.3 m, whereas
a slope failure at 11-SW-A-C293 will result in a run out distance of 14.2m.
Immediately adjacent to both slopes is a footpath, and allowing 1.5m for the
footpath and 3.5m for each lane means that a slope failure of C292 would be
expected to affect the Eastbound lane only, whereas a slope failure of C293
would result in both lanes being affected.
For slope 11-SW-A-C292, the number of fatalities is estimated to be:
( )2.0
000,48
118.0)24/33450(238.6=
+=
=∑
xxxxN
V
WFPEAN
Hence, the failure of slope C292 will cause a single fatality.
For slope 11-SW-A-C293, the number of fatalities is estimated to be:-

A10-94
( ) ( )( )37.164.073.0
000,48
126.024/340202328
000,48
128.0)24/33450(2328=+=
++
+=
=∑
xxxxxxxxN
V
WFPEAN
Allowing for the presence of pedestrians then the calculated value of N is 1.37
x 1.1 = 1.5. Therefore, failure of slope C293 will result in 2 fatalities.
Retaining wall 11-SW-A-R782
For the retaining wall 11-SW-A-R782 the landslide run out distance will be 2.4
m. Above the retaining wall is a footpath, and allowing 1.5m for the footpath,
this results in only a partial collapse of the Westbound lane. However, for the
purpose of this study it is assumed that the failure of the retaining wall will
result in the collapse of the Westbound lane of Victoria Road only.
For failure of the retaining wall 11-SW-A-R782, the number of fatalities is
estimated to be:
( )45.0
000,48
111)24/34020(2320=
+=
=∑
xxxxN
V
WFPEAN
Allowing for the presence of pedestrians then the calculated value of N is 0.45
x 1.1 = 0.5. Hence, for the purpose of this study, the failure of the retaining
wall 11-SW-A-R782 will cause a single fatality.
The above analysis is summarised in the table below.
Table 7.6 Summary of Results of Magazine Slope Failure Scenarios
Event Daily
vehicle
movements
Event
frequency
Probability
that C292
fails(1)
Probability
that C293
fails(1)
Probability
that R782
fails
Number
of
fatalities
Frequency
Explosion
within
entrance
adit
6 2.15x10⁻⁸ 0.1 0.5 - 3 1.1x10⁻⁹
- 0.5 - 2 9.9x10⁻⁹
0.1 - - 1 1.1x10⁻⁹
Explosion
within
exit adit
10 3.6x10⁻⁸ - 0.5 - 2 1.8x10⁻⁸
Explosion
at the
entrance
portal
6 -(2) - - 0.0
Notes:
(1) Refer to Section 7.2.6 and Figure 7.2 for the relationship between slope displacement and
slope failure probability
(2) Not evaluated since explosion at entrance portal do not lead to any consequence, ie less
than 0.01% chance of failure of R782
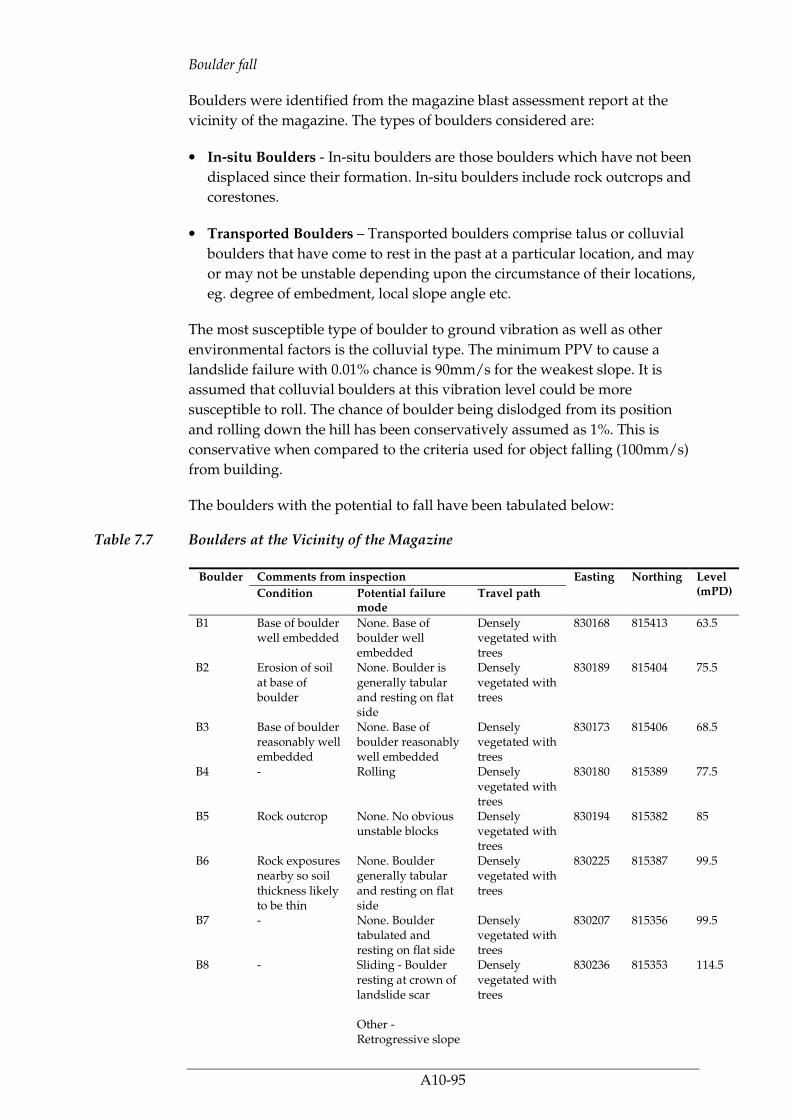
A10-95
Boulder fall
Boulders were identified from the magazine blast assessment report at the
vicinity of the magazine. The types of boulders considered are:
• In-situ Boulders - In-situ boulders are those boulders which have not been
displaced since their formation. In-situ boulders include rock outcrops and
corestones.
• Transported Boulders – Transported boulders comprise talus or colluvial
boulders that have come to rest in the past at a particular location, and may
or may not be unstable depending upon the circumstance of their locations,
eg. degree of embedment, local slope angle etc.
The most susceptible type of boulder to ground vibration as well as other
environmental factors is the colluvial type. The minimum PPV to cause a
landslide failure with 0.01% chance is 90mm/s for the weakest slope. It is
assumed that colluvial boulders at this vibration level could be more
susceptible to roll. The chance of boulder being dislodged from its position
and rolling down the hill has been conservatively assumed as 1%. This is
conservative when compared to the criteria used for object falling (100mm/s)
from building.
The boulders with the potential to fall have been tabulated below:
Table 7.7 Boulders at the Vicinity of the Magazine
Comments from inspection Boulder
Condition Potential failure mode
Travel path
Easting Northing Level (mPD)
B1 Base of boulder well embedded
None. Base of boulder well embedded
Densely vegetated with trees
830168 815413 63.5
B2 Erosion of soil at base of boulder
None. Boulder is generally tabular and resting on flat side
Densely vegetated with trees
830189 815404 75.5
B3 Base of boulder reasonably well embedded
None. Base of boulder reasonably well embedded
Densely vegetated with trees
830173 815406 68.5
B4 - Rolling Densely vegetated with trees
830180 815389 77.5
B5 Rock outcrop None. No obvious unstable blocks
Densely vegetated with trees
830194 815382 85
B6 Rock exposures nearby so soil thickness likely to be thin
None. Boulder generally tabular and resting on flat side
Densely vegetated with trees
830225 815387 99.5
B7 - None. Boulder tabulated and resting on flat side
Densely vegetated with trees
830207 815356 99.5
B8 - Sliding - Boulder resting at crown of landslide scar Other - Retrogressive slope
Densely vegetated with trees
830236 815353 114.5

A10-96
Comments from inspection Boulder
Condition Potential failure mode
Travel path
Easting Northing Level (mPD)
failure results in dislodgement
B9 Loose boulder resting within landslide debris
Erosion of foundation - Boulder resting within landslide debris Other - Reactivation of debris results in further movement
Densely vegetated with trees
830223 815360 105.5
B10 - Rolling and Erosion of foundation
Densely vegetated with trees
830154 815308 75
B11 Existing dentition at base of boulder
None. Existing dentition at base of boulder
Open flat platform
830191 815447 66.5
B12 Boulders appears reasonable well embedded at base
None. Boulder appears well embedded
Densely vegetated with trees
830203 815470 69.5
B13 Boulder almost entirely embedded within soil
None. Boulder almost entirely embedded within soil
Densely vegetated with trees
830229 815478 78.5
B14 Boulder resting on other boulders
Topping - Stability dependent on other boulders
Densely vegetated with trees
830210 815511 60.5
B15 - None. Tabular boulder resting on flat side
Densely vegetated with trees
830226 815537 66
B16 - Rolling Densely vegetated with trees
830156 815431 52.5
B17 Base of boulder well embedded
None. Mostly interlocked and well embedded
Densely vegetated with trees
830202 815413 77
B18 Boulder almost embedded within soil
None. Boulder almost embedded within soil
Densely vegetated with trees
830191 815387 82
B19 Base of boulder well embedded
None. Base of boulder well embedded
Densely vegetated with trees
830200 815370 91
B20 Base of boulder well embedded
None. Base of boulder well embedded
Densely vegetated with trees
830212 815406 84
B21 Base of boulder well embedded
None. Base of boulder well embedded
Densely vegetated with trees
830183 815466 60.5
B22 - None. Boulder is generally tabular and resting on flat side
Densely vegetated with trees
830225 815436 83.5
B23 Rock outcrop None. No obvious unstable block
Densely vegetated with trees
830221 815434 82.5
B24 Rock outcrop None. No obvious unstable block
Densely vegetated with trees
830234 815428 90

A10-97
From the boulder survey, all the boulders are observed to be reasonably well
embedded and travel path of the boulder are all densely vegetated with trees.
Referring to the GEO Report 80, vegetation will help in stopping most
boulders and will limit the rundown distance in the event of boulder fall.
Boulder falling due to accidental initiation of explosives within magazine niches
Considering a detonation of 300kg of explosives within a niche, the impact
distance to 90mm/s (screening criteria) is 33.3m. Base on this, no boulder was
found to be affected as all the boulders are elevated with at least 40m distance
away from magazine niches.
Boulder falling due to accidental initiation of explosives during transfer of explosives
Considering the maximum load of a delivery truck of 200kg of explosives, the
impact distance to 90mm/s (screening criteria) is 27m. Base on this criterion
and the geometric separation of the boulders from the magazine tunnel, only
boulder B16 may have the potential to be dislodged. This potential exists only
for a 30m section of tunnel near the entrance portal and a 20m section of
tunnel near the exit based on separation distances.
Boulder fall frequency:
No. of vehicle movement per day (/day) x Concerned section of the tunnel
(km) x Frequency of explosives initiation (/km) x 365 (day/year) x chance of
boulder failure
= [( 6 x 0.03 x 3.31E-10) + (10 x 0.02 x 3.31E-10)] x 365 x 1% = 4.59E-10 per year
Probability of a falling boulder strikes a vehicle:
P(S) = 1 – [ 1 – (4020 + 3450) x 5 / ( 48 x 24,000 ) ] 4.59E-10 = 1.51E-11 per year
Probability of a vehicle hitting the boulder once it has fallen, assuming
stopping distance of 23m [29]:
P(S) = 1 – [ 1 – (4020 + 3450) x 23 / ( 48 x 24,000 ) ] 4.59E-10 = 7.41E-11 per year
Probability of a falling boulder strikes a person, assuming conservatively a
50% presence factor and avoidance factor:
P(S) = 4.59E-10 x 0.5 = 2.30E-10 per year
Probabilities of fatality to an occupant were assumed to be 20% and 10% for
“boulder strikes a vehicle” and “Vehicle hits the fallen boulder” respectively
based on GEO Report 81. One hundred percent (100%) fatality was assumed
for a boulder hitting a person.
For the boulder B16 of concern, there is no impact to building. Hence, fatality
due to a boulder hitting a building not was considered further.
The event tree below summarized the frequencies and number of fatalities due
to boulder B16 fall:

A10-98
Figure 7.4 Event Tree of a Boulder Fall Scenario
B16 falls Boulder strikes a vehicle 4 fatalities
4.59E-10 1.51E-11 0.2x0.2x0.2 1.21E-13
3 fatalities
(0.2x0.2x0.8)x3 1.45E-12
2 fatality
(0.8x0.8x0.2)x3 5.80E-12
Vehicle hits the fallen boulder 4 fatalities
7.41E-11 0.1x0.1x0.1 7.41E-14
3 fatalities
(0.1x0.1x0.9)x3 2.00E-12
2 fatality
(0.9x0.9x0.1)x3 1.80E-11
Boulder strikes a person 1 fatality
2.30E-10 2.30E-10
Boulder strikes a building
0
Note: A vehicle has assumed to carry no less than 3 passengers and 25% increase in fatality
has been accounted to incorporate additional pedestrian fatality

A10-99
7.3.2 Transport of Explosives
The results for each transport scenario are summarized in Table 7.8.
Table 7.8 Summary of Results for Transport Scenarios
Indoor Outdoor
Scen
ario
Description TNT
eqv.
(kg)
Length.
of the
Road
(km)
Total
Freq in
AM or
PM (/yr)
Harm
Prob.
Impact
distance
(m)
Harm
Prob.
Impact
distance
(m)
R01 77 1.5 1.81E-07 90% 13 90% 11
50% 15 50% 11
Initiation of explosives
during transport of
explosives from
magazine to delivery
point 01 via route 01
1% 36 1% 14
R02 77 1.6 1.93E-07 90% 13 90% 11
50% 15 50% 11
Initiation of explosives
during transport of
explosives from
magazine to delivery
point 02 via route 02
1% 36 1% 14
R03 120 2 4.83E-07 90% 15 90% 12
50% 18 50% 13
Initiation of explosives
during transport of
explosives from
magazine to delivery
point 03 via route 03
1% 42 1% 16
R04 77 3.3 3.98E-07 90% 13 90% 11
50% 15 50% 11
Initiation of explosives
during transport of
explosives from
magazine to delivery
point 04 via route 04
1% 36 1% 14
R07 77 5.7 6.88E-07 90% 13 90% 11
50% 15 50% 11
Initiation of explosives
during transport of
explosives from
magazine to delivery
point 07 via route 07
1% 36 1% 14
7.3.3 Use of Explosives
3-D Review of Features
The ground vibration levels at a given receptor will depend on the distance
between the receptor and the blasting point. The location of the blast site will
move forward every time the proceeding blast completes and the rock spoil is
removed. Therefore, the distance between the features and the blasting site
will vary for each and every blast.
In order to consider the dynamic characteristic of the blasting work, a 3-
dimenional review was carried out to assess the nearest features to the
blasting site. The graphical representation is shown in Figure 4.2 and Figure 4.3
for the WIL alignment and magazine store respectively.
A10-100
Screening of Features for Consequence Assessment
During the review, every feature was represented by one or more coordinates
in a 3-dimensional plane (Northing, Easting, and Elevation) based on data
given in the Blast Assessment Report. Similarly, every 10m-chainage interval
of the alignment and magazine was represented by a single point. The nearest
feature for every 10m-chainge section was then identified.
The vibration level for the nearest feature for every 10m chainage was
assessed for a charge weight equivalent to 2 to 6 times of the base MIC. A
sample calculation is shown in Table 7.9. The charge weight of more than 6
MIC was not considered for a credible case for consequence assessment as the
occurrence frequency is lower than 10-9 for the WIL project (see Appendix 10,
Annex E).
The results show that the PPV value for all building or other features will not
exceed 140mm/s for a charge weight of 6 MIC or less. Therefore, no building
will be subject to failure due to the use of explosive for rock excavation, based
on the limit of 229mm/s required to cause significant structural damage.
It was also found that some buildings or features (excluding slopes and
boulders) will exceed 100 mm/s and some slopes and boulders will exceed 90
mm/s for a charge weight of 4 to 6 MIC. The 90mm/s for the slopes and
boulders was chosen for screening out the relevant slopes and boulders for
further analysis, as mentioned previously. Therefore, each of the concerned
slopes and boulders were further assessed to determine if a failure will occur
at a charge weight of 4 to 6 MIC.
Consequence Assessment for Specific Features
If a feature is susceptible to a vibration level higher than 90 or 100 mm/s from
the nearest chainage, it may also be affected by the adjacent chainage.
Therefore, the effects from the adjacent chainage were also assessed.
With respect to slopes and boulders, the minimum vibration level that will
initiate a slope / boulder failure was assessed for each of them based on their
individual characteristic.
The hazard footprints in terms of PPV were then established for each
particular feature, with respect to a range of chainage that may establish a
footprint of 100 mm/s for buildings or that of the specific minimum vibration
level for failure for slopes and boulders. The chainage was studied at 10-m
interval and those that can establish a hazard footprint on these criteria were
identified.

A10-101
Table 7.9 Sample Calculation of PPV Level for each Feature at 1 or more MIC detonated at the same time
Feature Description Allowable PPV
Min Distance from closest chainage (m)
Closest Blast Chainage
Explosive charge used (kg)
PPV expected (mm/s) - Two charges per delay
PPV expected (mm/s) - Three charges per delay
PPV expected (mm/s) - Four charges per delay
PPV expected (mm/s) - Five charges per delay
PPV expected (mm/s) - Six charges per delay
Building 1 25 33 SYPSHW_EB_100010 4.14 60.72 77.76 92.67 106.19 118.68
Building 2 25 29 SYPSHW_WB_100013 3.55 66.17 84.74 100.99 115.72 129.33
Notes: The PPV level is estimated using K = 1200

A10-102
Risk Summation of Use of Explosives
Although the whole WIL will be constructed in 3 years, it was conservatively
assumed that all the scenarios leading to failure would occur in the same year.
All the buildings that can experience more than 100mm/s and slopes and
boulders that will subject to more than the minimum vibration level assessed
for each individual slope or boulder, were considered as scenarios leading to
failure.
The frequency of occurrence of more than 4, 5 and 6 MIC detonated at the
same time has been derived on a per 10-m basis (see Table 6.5). The relevant
length of the chainage that impact the feature as identified in the consequence
assessment was then used to obtain the frequency of the hazard footprints.
The hazard footprints at each 10m interval of the relevant chainage were then
overlaid on each particular feature to estimate the number of fatalities due to
falling objects in buildings, or failure of slopes/ boulders.
The resulting risk for every 10m interval of the relevant chainage was
summed over to determine the overall risk for a feature and the risks of all
concerned features are summed over to give the overall risk due to blasting
operation for the WIL.
Conservatism in the Consequence Assessment
Due to delay scatter within the realms of manufacturing tolerance, additive
effects can be considered for short time delays.
The combined additive effect based on experience is presented below [32]:
• Instantaneous detonation: 100% PPV Level
• Short Time Delay Detonators (25ms interval): 70% PPV Level
• Long Time Delay Detonators (500ms interval): 30% PPV Level
This is generally applicable to more than 3 MIC detonated at the same time.
However, the reduced additive effects have not been considered in the
consequence assessment for conservatism.
Consequence Assessment Results for Construction of Magazine
Ground Vibration Effect on Buildings or Slopes due to Errors in Blasting Face
It was found that a series of unregistered retaining walls, boulder area and an
empty building could be potentially affected due to an incident during
magazine construction.
Following similar approach described in Section 7.3.1 for slope assessment, the
results of the analysis were summarized as Table 7.10 and Table 7.11 below.

A10-103
Table 7.10 Analysis of Slopes Exceeding Peak Particle Velocity of 90 mm/s due to Accidental Initiation during the Construction of Magazine
Mapsheet Type No. Static F.O.S
Slope length (m) (1)
Slope depth (m) (2)
Slope Material
PPVc (mm/s)
Slip Volume (m)(3)
PPV correspond to 90% slope failure (mm/s)
PPV correspond to 50% slope failure (mm/s)
PPV correspond to 10% slope failure (mm/s)
PPV correspond to 0.01% slope failure (mm/s)
Unregistered Retaining wall 1 1.5 Fill 23.2 84 -(4) 330 230 160
Notes:
(1) Slope length along its own slope
(2) Slope depth measured as a perpendicular distance below the slope surface
(3) It is assumed that the slope failure width is equal to the length and that the volume = ̟*length2*depth/6.
(4) PPV >400mm/s which is unachievable based on the assessment

A10-104
Table 7.11 Features Affected by Higher Vibration Generated by Accidental Initiation
During the Construction of Magazine
Scenario Chainage Features Affected
Scenario Frequency (yr)(6)
Expected Fatality (N)(1)
Remarks
Slope
5MIC detonated at the same time
#338 Series of Unregistered RW
4.72E-09 - (3)
6MIC detonated at the same time
#338 Series of Unregistered RW
4.72E-09 - (3)
6MIC detonated at the same time
#238 Boulder area 4.72E-09 - (2) (4)
Building
6MIC detonated at the same time
#0 Empty building (830135, 815468)
4.72E-09 0 (5)
Notes:
(1) Expected fatality = Population x Fatality rate
(2) No further analysis was made since the slope failing event frequency was low, 3.78E-11
<< 1e-9. In addition, the majority of the boulders observed during the walkover were
reasonably well embedded and all appeared to be stable enough to resist the ground
vibrations produced by the adit blasting.
(3) Although 90mm/s threshold reached, no fatality expected since the observed vibration
level is well below actual 0.01% slope failing threshold 160mm/s
(4) 90mm/s (0.01% chance slope failure) threshold reached
(5) 1% fatality threshold reached
(6) This value is obtained from Table 6.5.
No fatality is expected due to higher vibration generated by the blast face due
to human errors and other reasons such as manufacturing defects causing
deviation from the confirmed design.
Ground Vibration and Air Overpressure Effect due to Detonation of Full Load during
Transferring Explosives within Magazine Adit
The operation of magazine will be commenced following the completion of
the construction work. It is not possible to consider the risk associated with
the operation and construction of magazine to happen simultaneously, rather
they should be one after another.
Since the societal risk is assessed on a per annum basis, the risk derived for the
operational phase for the magazine (see Section 7.3.1) has therefore well
covered the risk associated with the construction phase, since the frequency
for transportation within the access tunnel during the operation of the
magazine has covered that for the construction phase as far as a duration of a
year is concerned.

A10-105
Consequence Assessment for the Construction of Tunnels and Adits for WIL
Alignment
Ground Vibration Effect on Buildings due to Errors in Blasting Face
No building was found exceeding PPV of 140mm/s and thus the building
structural element collapse threshold (PPV = 229mm/s) considering
accidental explosion up to 6MIC is not applicable.
It was found that some features along the alignment would reach the object
falling threshold (PPV = 100mm/s, the 1% fatality threshold), the results are
summarized as below.
Table 7.12 Features Affected by Higher Vibration Generated by Accidental Initiation
during the Construction of Tunnels and Adits Blasting
Scenario/ Chainage Features Affected Scenario Frequency (yr)(1)
Expected Fatality (N)(2,3)
4MIC detonated at the same time SYPSHW_WB_100013 Building No. 426
(833026 ,816513) 7.38E-09 2
General Utilities 7.38E-09 1
SYPSHW_EB_100010 General Utilities 7.38E-09 1
UNVADIT_const_0 Elevated Road 7.38E-09 2
UNVADIT_const_10 Elevated Road 7.38E-09 2
UNVADIT_EnB2_10 Elevated Road 7.38E-09 2
UNVADIT_EnB2_20 Elevated Road 7.38E-09 2
UNVADIT_EnC2_160 Building No. 131 (831833 ,816190)
7.38E-09 7
5MIC detonated at the same time
SYPSHW_WB_100023 Building No. 426 (833026 ,816513)
7.38E-09 2
SYPSHW_WB_100013 Building No. 426 (833026 ,816513)
7.38E-09 2
General Utilities 7.38E-09 1
UNVKET_UP_98128 Building No. 143 (831362 ,815859)
7.38E-09 2
UNVKET_UP_98126 Building No. 143 (831362 ,815859)
1.48E-09 2
SYPSHW_EB_100000 General Utilities 7.38E-09 1
SYPSHW_EB_100010 Building No. 427 (833013 ,816537)
7.38E-09 1
SYPSHW_EB_100020 Building No. 427 (833013 ,816537)
7.38E-09 1
Building No. 426 (833026 ,816513)
2
General Utilities 1
General Utilities 1
UNVADIT_const_0 Elevated Road 7.38E-09 2
UNVADIT_const_10 Elevated Road 7.38E-09 2
UNVADIT_const_20 Elevated Road 7.38E-09 2
UNVADIT_const_30 Elevated Road 7.38E-09 2
UNVADIT_EnB2_10 Elevated Road 7.38E-09 2
UNVADIT_EnB2_20 Elevated Road 7.38E-09 2
UNVADIT_EnC2_150 Building No. 131 (831833 ,816190)
7.38E-09 7

A10-106
Scenario/ Chainage Features Affected Scenario Frequency (yr)(1)
Expected Fatality (N)(2,3)
UNVADIT_EnC2_160 Building No. 131 (831833 ,816190)
7.38E-09 7
6MIC detonated at the same time
SYPSHW_WB_100023 Building No. 426 (833026 ,816513)
7.38E-09 2
General Utilities 1
SYPSHW_WB_100013 Building (833013 ,816537) 7.38E-09 1
Building No. 426 (833026 ,816513)
2
General Utilities 1
SYPSHW_WB_100003 Building No. 426 (833026 ,816513)
7.38E-09 2
General Utilities 1
UNVKET_UP_98128 Building No. 143 (831362 ,815859)
7.38E-09 2
UNVKET_UP_98126 Building No. 143 (831362 ,815859)
1.48E-09 2
SYPSHW_EB_100000 Building No. 427 (833013 ,816537)
7.38E-09 1
General Utilities 1
SYPSHW_EB_100010 Building No. 427 (833013 ,816537)
7.38E-09 1
Building No. 426 (833026 ,816513)
2
General Utilities 1
SYPSHW_EB_100020 Building No. 427 (833013 ,816537)
7.38E-09 1
Building No. 426 (833026 ,816513)
7.38E-09 2
General Utilities 7.38E-09 1
UNVKET_DOW_98131 Building No. 143 (831362 ,815859)
4.43E-09 2
UNVADIT_const_0 Elevated Road 7.38E-09 2
UNVADIT_const_10 Elevated Road 7.38E-09 2
UNVADIT_const_20 Elevated Road 7.38E-09 2
UNVADIT_const_20 Building No. 103 (832047 ,816283)
7.38E-09 3
UNVADIT_const_30 Elevated Road 7.38E-09 2
UNVADIT_EnB2_10 Elevated Road 7.38E-09 2
UNVADIT_EnB2_10 Elevated Road 7.38E-09 2
UNVADIT_EnB2_20 Elevated Road 7.38E-09 2
UNVADIT_EnB2_30 Elevated Road 7.38E-09 2
UNVADIT_EnC2_150 Building No. 131 (831833 ,816190)
7.38E-09 7
UNVADIT_EnC2_160 Building No. 131 (831833 ,816190)
7.38E-09 7
Note:
(1) This value is obtained from Table 6.5. For the concern section which is less than 10 m, the
frequency will be adjusted accordingly
(2) Expected fatality = Population x Fatality rate
(3) 1% fatality threshold reached
Ground Vibration Effect on Slopes due to Errors in Blasting Face
Three slopes 11SW-A/C370, 11SW-A/C110011SW-A/R940 has been screened
out for further assessment, based on the screening criteria of the 90 mm/s.

A10-107
The similar approach described in Section 7.3.1 was applied for assessing these
three slopes, the results of the analysis were summarized as Table 7.13 and
Table 7.14.

A10-108
Table 7.13 Analysis of Slopes Exceeding Peak Particle Velocity of 90 mm/s due to Accidental Initiation during the Construction of Tunnels and Adits
Mapsheet Type(1) No. Static
F.O.S
Slope
length
(m) (2)
Slope
depth
(m) (3)
Slope
Material
PPVc
(mm/s)
Slip
Volume
(m3) (4)
PPV
correspond
to 90%
slope
failure
(mm/s)
PPV
correspond
to 50%
slope
failure
(mm/s)
PPV
correspond
to 10%
slope
failure
(mm/s)
PPV
correspond
to 0.01%
slope
failure
(mm/s)
11SW-A C 370 1.4 30 4.5 Soil 82 2120 - (5) - (5) - (5) 330
11SW-A C 1100 1.394 32.5 3 Soil &
Rock
51.1 1660 - (5) - (5) 340 240
11SW-A R 940 1.493 10 3.5 - 29.8 185 - (5) 370 250 170
Note:
(1) C-Cut Slope, F-Fill Slope, CR/FR – Slope & Retaining Wall, R-Retaining Wall
(2) Slope length along its own slope
(3) Slope depth measured as a perpendicular distance below the slope surface
(4) It is assumed that the slope failure width is equal to the length and that the volume = ̟*length2*depth/6.
(5) PPV >400mm/s which is unachievable based on the assessment

A10-109
Table 7.14 Slopes Exceeding Peak Particle Velocity of 90 mm/s due to Accidental
Initiation during the Construction of Tunnels and Adits
Scenario/ Chainage
Features Affected
Scenario Frequency (yr)(4)
Expected Fatality (N)(5)
Remarks
4MIC Detonated at the same time
UNVKET_DOW_98147 11SW-A/C370 7.38E-09 - (1)
UNVADIT_EnC2_50 11SW-A/C1100 7.38E-09 - (2)
5MIC Detonated at the same time
UNVKET_UP_98148 11SW-A/C370 7.38E-09 - (1)
UNVKET_UP_98138 11SW-A/C370 7.38E-09 - (1)
UNVKET_UP_98128 11SW-A/C370 7.38E-09 - (1)
UNVKET_UP_98126 11SW-A/C370 1.48E-09 - (1)
UNVKET_DOW_98157 11SW-A/C370 7.38E-09 - (1)
UNVKET_DOW_98147 11SW-A/C370 7.38E-09 - (1)
UNVKET_DOW_98137 11SW-A/C370 7.38E-09 - (1)
UNVKET_DOW_98131 11SW-A/C370 4.43E-09 - (1)
UNVADIT_EnC2_40 11SW-A/C1100 7.38E-09 - (2)
UNVADIT_EnC2_50 11SW-A/C1100 7.38E-09 - (2)
UNVADIT_const_30 11SW-A/R940 7.38E-09 - (3)
6MIC Detonated at the same time
UNVKET_UP_98148 11SW-A/C370 7.38E-09 - (1)
UNVKET_UP_98138 11SW-A/C370 7.38E-09 - (1)
UNVKET_UP_98128 11SW-A/C370 7.38E-09 - (1)
UNVKET_UP_98126 11SW-A/C370 1.48E-09 - (1)
UNVKET_DOW_98157 11SW-A/C370 7.38E-09 - (1)
UNVKET_DOW_98147 11SW-A/C370 7.38E-09 - (1)
UNVKET_DOW_98137 11SW-A/C370 7.38E-09 - (1)
UNVKET_DOW_98131 11SW-A/C370 4.43E-09 - (1)
UNVADIT_EnC2_40 11SW-A/C1100 7.38E-09 - (2)
UNVADIT_EnC2_50 11SW-A/C1100 7.38E-09 - (2)
UNVADIT_EnC2_60 11SW-A/C1100 7.38E-09 - (2)
UNVADIT_const_30 11SW-A/R940 7.38E-09 - (3)
UNVADIT_const_40 11SW-A/R940 7.38E-09 - (3)
Note:
(1) Although 90mm/s threshold reached, no fatality expected since the observed vibration
level is well below actual 0.01% slope failing threshold 330mm/s
(2) Although 90mm/s threshold reached, no fatality expected since the observed vibration
level is well below actual 0.01% slope failing threshold 240mm/s
(3) Although 90mm/s threshold reached, no fatality expected since the observed vibration
level is well below actual 0.01% slope failing threshold 170mm/s
(4) This value is obtained from Table 6.5. For the concern section which is less than 10 m, the
frequency will be adjusted accordingly
(5) Expected fatality = Population x Fatality rate

A10-110
Ground Vibration Effect due to Detonation of Full Load during Transferring
Explosives within Tunnel
For the accidental detonation of full load, 125 kg, of explosives within the
tunnel whilst transferring explosives to the appropriate blast site, neither
buildings will be experienced a PPV of 100 mm/s (threshold of 1% fatality),
nor slopes will be susceptible to a PPV of 90 mm/s (screening criteria).
Air Overpressure Effect due to Detonation of Full Load during Transferring
Explosives within Tunnel
Air overpressure effect due to detonation of full load during transferring
explosives within tunnel are summarised in Table 7.15.
Table 7.15 Summary of Air Overpressure Effects associated with Transport of Explosives
within Tunnel
Indoor Outdoor
Scenario Description TNT
eqv.
(kg)
Freq.
(/yr)
Harm
Prob.
Impact
distance
(m)
Harm
Prob.
Impact
distance
(m)
S01 77 6.04E-08 90% 13 90% 11
50% 15 50% 11
Initiation of explosives
at delivery point 01
1% 36 1% 14
S02 77 6.04E-08 90% 13 90% 11
50% 15 50% 11
Initiation of explosives
at delivery point 02
1% 36 1% 14
S03 120 1.21E-07 90% 15 90% 12
50% 18 50% 13
Initiation of explosives
at delivery point 03
1% 42 1% 16
S04 77 6.04E-08 90% 13 90% 11
50% 15 50% 11
Initiation of explosives
at delivery point 04
1% 36 1% 14
S07 77 6.04E-08 90% 13 90% 11
50% 15 50% 11
Initiation of explosives
at delivery point 07
1% 36 1% 14

A10-111
8 RISK SUMMATION
8.1 OVERVIEW
Risk summation combines the estimates of the consequences of an event with
the event probabilities to give an estimate of the resulting frequency of
varying levels of fatalities. The Consultants in-house software RISKPLOTTM
has been used for risk summation.
RISKPLOTTM calculates the number of fatalities from each event with a given
probability of occurrence. The number of fatalities are based upon the
proportion of each population area overlapped by the hazard effect, taking
into account protection factors. Unlike the grid system, which assumes all
occupants of a given grid sector suffer the same degree of impact,
RISKPLOTTM assumes only that proportion of the population with a
polygonal area equivalent to that covered by the hazard effect are affected,
with an accuracy level to the nearest metre. Hence, the modelling exercise is as
realistic as reasonably possible.
8.2 RISK MEASURES
The two types of risk measures considered are societal and individual risks.
8.2.1 Societal Risk
Societal risk is defined as the risk to a group of people due to all hazards
arising from a hazardous installation or activity. The simplest measure of
societal risk is the Rate of Death or Potential Loss of Life (PLL), which
represents the predicted equivalent fatalities per year.
The frequency (f) and fatalities (N) associated with each outcome event are
derived as described in earlier sections. Based on this, the Potential Loss of
Life is calculated as follows:
PLL = f1N1 + f2N2 + f3N3 + + fnNn
Societal risk can also be expressed in the form of an F-N curve, which
represents the cumulative frequency (F) of all event outcomes leading to N or
more fatalities. This representation of societal risk highlights the potential for
accidents involving large numbers of fatalities.
8.2.2 Individual Risk
Individual risk may be defined as the frequency of fatality per individual per
year due to the realisation of specified hazards. Individual Risk may be
derived for a hypothetical individual present at a location 100% of time or a
named individual considering the probability of his presence etc. (the latter
case is known as Personal Individual Risk).

A10-112
8.3 SOCIETAL RISK
8.3.1 Potential Loss of Life
Table 8.1 below shows the overall Potential Loss of Life (PLL) values for the
transport of explosives to the blasting sites.
Table 8.1 Potential Loss of Life Value for WIL Project
Case PLL (Per year)
Percentage Contribution (%)
Storage of Explosives
Proposed magazine, , including transport within the adits 9.04E-08 0.26%
Transport of Explosives
Delivery of explosives from magazine to delivery point 1 1.26E-06 3.66%
Delivery of explosives from magazine to delivery point 2 1.68E-06 4.89%
Delivery of explosives from magazine to delivery point 3 9.39E-06 27.29%
Delivery of explosives from magazine to delivery point 4 6.04E-06 17.57%
Delivery of explosives from magazine to delivery point 7 8.80E-06 25.57%
Use of Explosives
Construction of magazine 1.13E-08 0.03%
Construction of WIL alignment 1.26E-06 3.67%
Detonation of explosives within the tunnel whilst transferring explosives to the blast site at delivery point 1 8.99E-08 0.26%
Detonation of explosives within the tunnel whilst transferring explosives to the blast site at delivery point 2 1.74E-07 0.51%
Detonation of explosives within the tunnel whilst transferring explosives to the blast site at delivery point 3 1.82E-06 5.29%
Detonation of explosives within the tunnel whilst transferring explosives to the blast site at delivery point 4 3.35E-06 9.73%
Detonation of explosives within the tunnel whilst transferring explosives to the blast site at delivery point 7 4.28E-07 1.25%
Total 3.44E-05 100.00%
8.3.2 F-N Curves
The WIL project will last for about 2 to 3 years. The risks during the project
have been estimated based on the following:
a) for transport, the total number of deliveries by truck in one year has
been considered. The deliveries were calculated based on maximum
daily peak which is conservative. Since risks are expressed on an
annualised basis, deliveries for one year period have been considered.
b) storage has been considered at full storage capacity 100% of the time in
a year. There may be variations in storage levels but this has been
ignored. The storage requirements may also vary depending on the
amount of cartridged explosives used but it has been used that the
A10-113
entire blasting will be based on the use of cartridged explosives instead
of a higher mix of bulk emulsion.
c) risks from use have been estimated considering that all blasting
activities will occur in one year period. Since only some buildings and
some sections along the alignment are affected by greater than
100mm/s PPV, and given the likelihood that the work on these
sections may be completed in a one year time span, this assumption
may be reasonable.
Figure 8.1 shows the overall risk due to transport, storage and use of
explosives. During phase 1 of the construction, there is an option to deliver
explosives to point 7 at AM or PM time, whereas deliveries to other points will
be as per the timing indicated (see Table 2.4). The FN curve has been presented
for delivery to point 7 am and pm case separately and it includes delivery to
other points, storage and use as well.
Figure 8.2 and Figure 8.3 show the contribution of transport, storage and use of
explosives to the overall risk individually. The FN curve for transport has
been presented for delivery to pt 7 am and pm case separately and it includes
delivery to other points as well. The FN curve for use of explosives covers
construction of the WIL alignment and the magazine store.
The assessed risks to public due to construction of WIL, as shown in Figure 8.1,
Figure 8.2 and Figure 8.3 are within acceptable region of the HKRG for societal
risk.
It can be seen that transport risk dominates the WIL Project. The reason for the
societal risk lying close to the ALARP at low N range is the risk to the on-road
population, ie people within vehicles in the immediate vicinity of the incident.

A10-114
Figure 8.1 F-N Curve - Storage, Use and Transport of Explosives from Magazine to Point
1, 2, 3, 4 & 7
1.0E-09
1.0E-08
1.0E-07
1.0E-06
1.0E-05
1.0E-04
1.0E-03
1 10 100 1000
Number of Fatalities (N)
Storage, Use and Transport of Explosive from Magazine to pt 1, 2, 3, 4 & 7
(Pt 7 Delivery at AM)
Storage, Use and Transport of Explosive from Magazine to pt 1, 2, 3, 4 & 7
(Pt 7 Delivery at PM)
UNACCEPTABLE
ALARP
ACCEPTABLE

A10-115
Figure 8.2 F-N Curve - Storage, Use and Transport of Explosives from Magazine to Point
1, 2, 3, 4 & 7 (Point 7 delivery at PM)
1.0E-09
1.0E-08
1.0E-07
1.0E-06
1.0E-05
1.0E-04
1.0E-03
1 10 100 1000
Number of Fatalities (N)
Combined Case (Storage, Transport and Use of Explosive)
Transport of Explosives (From Explosive Magazine to Delivery
Point 1, 2, 3, 4 & 7)
Storage of Explosive (Transport within magazine tunnel and
storage)
Use of explosive (Construction of Explosives Magazine and WIL
Alignment)
UNACCEPTABLE
ALARP
ACCEPTABLE

A10-116
Figure 8.3 F-N Curve - Storage, Use and Transport of Explosives from Magazine to Point
1, 2, 3, 4 & 7 (Point 7 delivery at AM)
1.0E-09
1.0E-08
1.0E-07
1.0E-06
1.0E-05
1.0E-04
1.0E-03
1 10 100 1000Number of Fatalities (N)
Combined Case (Storage, Transport and Use of Explosive)
Transport of Explosives (From Explosive Magazine to Delivery
Point 1, 2, 3, 4 & 7)
Storage of Explosive (Transport within magazine tunnel and
storage)
Use of explosive (Construction of Explosives Magazine and WIL
Alignment)
UNACCEPTABLE
ALARP
ACCEPTABLE

A10-117
8.4 INDIVIDUAL RISK
The assessed individual risks for transport and use of explosives were
expressed in terms of outdoor exposure and indoor exposure. The results are
shown in Figure 8.4, Figure 8.5, Figure 8.6 and Figure 8.7. In these figures,
‘indoor’ refers to the population located inside buildings, and ‘outdoor’ refers
to the population located outside buildings ie in open area.
The IR contours for ‘indoor’ and ‘outdoor’ have been presented separately as
the fatality probability is different for indoor and outdoor population. The
current version of the Riskplot model enables to present indoor and outdoor
fatality iso-risk contours separately. This approach is more rigorous than the
equivalent fatality model since the effect distances for indoor and outdoor
fatality could be quite different.
For the delivery routes, it is observed that no section of routes has an IR
exceeding 5 x 10⁻⁸ per year. The highest risk contour of 1 x 10⁻⁷ contour (in red
colour on Figure 8.4, and Figure 8.5) represents the scenario of detonation of a
full load of explosives within the tunnel whilst transferring explosives to the
blast site. Although this scenario is part of ‘use’, it has been drawn in the
figure as it affects the same location.
The IR contour for magazine is a 2 dimensional representation and hence does
not account for relative elevation of the magazine with respect to the receivers.
Hence risk to the user on Victoria Road is slightly conservative. Moreover, a
presence factor of 10% should be applied to calculate the individual risk from
the magazine to account for the time of the most exposed individual to the
risks from the explosives storage. The most exposed population are Victoria
road users which are considered as mobile population. There is no permanent
population in the vicinity. For the most exposed pedestrian walking along
Victoria road, based on a conservative walking speed of 1km/hr for a 300m
section of Victoria road near the magazine 4 times a day, the presence factor
was calculated as 5%. Similarly, for a vehicle travelling at 30km/hr passing by
the section of the road 20 times a day, the presence factor was around 4% (this
includes an idle time of 2min per trip). Therefore, considering a 10% presence
factor, the individual risk from magazine is acceptable.
For rock excavation using explosives, features at risk due to ground vibration
were identified and the maximum risk of fatality to any individual is
estimated as 4.428 x 10⁻¹⁰ per year (See Table 8.2). This is much lower than the
Individual Risk Criteria of 1 x 10⁻⁵ per year.
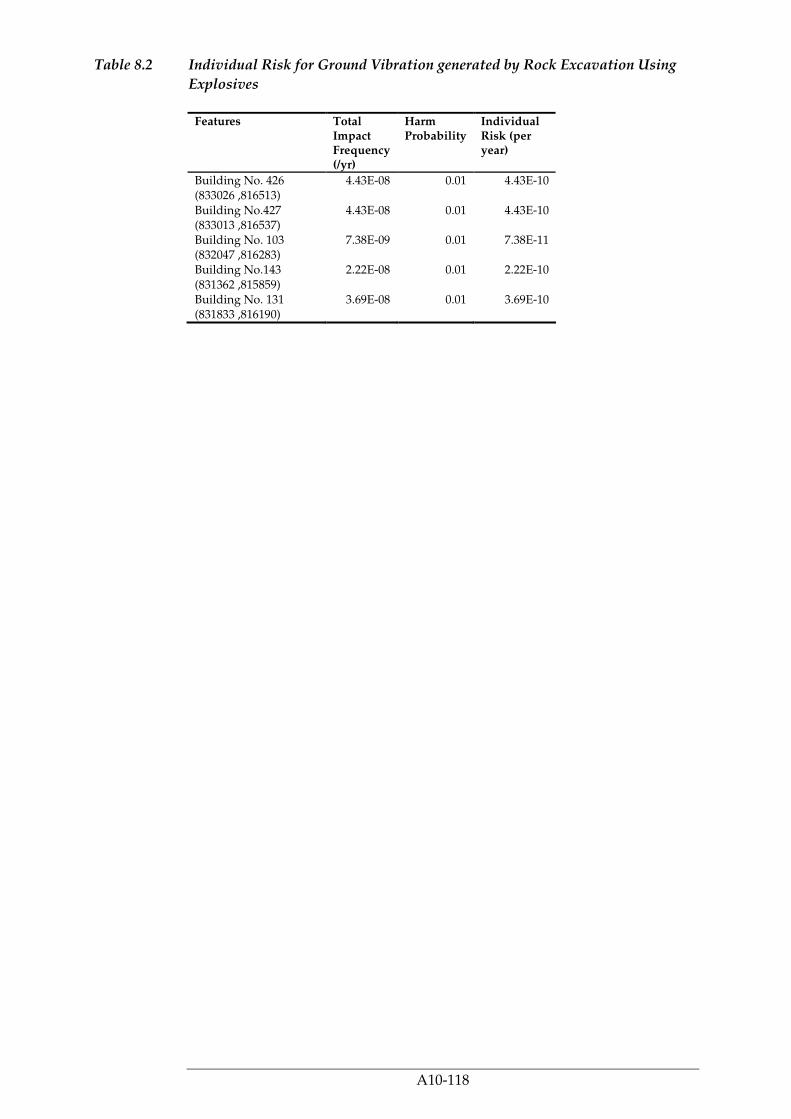
A10-118
Table 8.2 Individual Risk for Ground Vibration generated by Rock Excavation Using
Explosives
Features Total Impact Frequency (/yr)
Harm Probability
Individual Risk (per year)
Building No. 426 (833026 ,816513)
4.43E-08 0.01 4.43E-10
Building No.427 (833013 ,816537)
4.43E-08 0.01 4.43E-10
Building No. 103 (832047 ,816283)
7.38E-09 0.01 7.38E-11
Building No.143 (831362 ,815859)
2.22E-08 0.01 2.22E-10
Building No. 131 (831833 ,816190)
3.69E-08 0.01 3.69E-10

A10-119
Figure 8.4 IR of Delivery Route for Indoor Population

A10-120
Figure 8.5 IR of Delivery Route for Outdoor Population

A10-121
Figure 8.6 IR of the Proposed Magazine for Indoor Population
(Not reached)
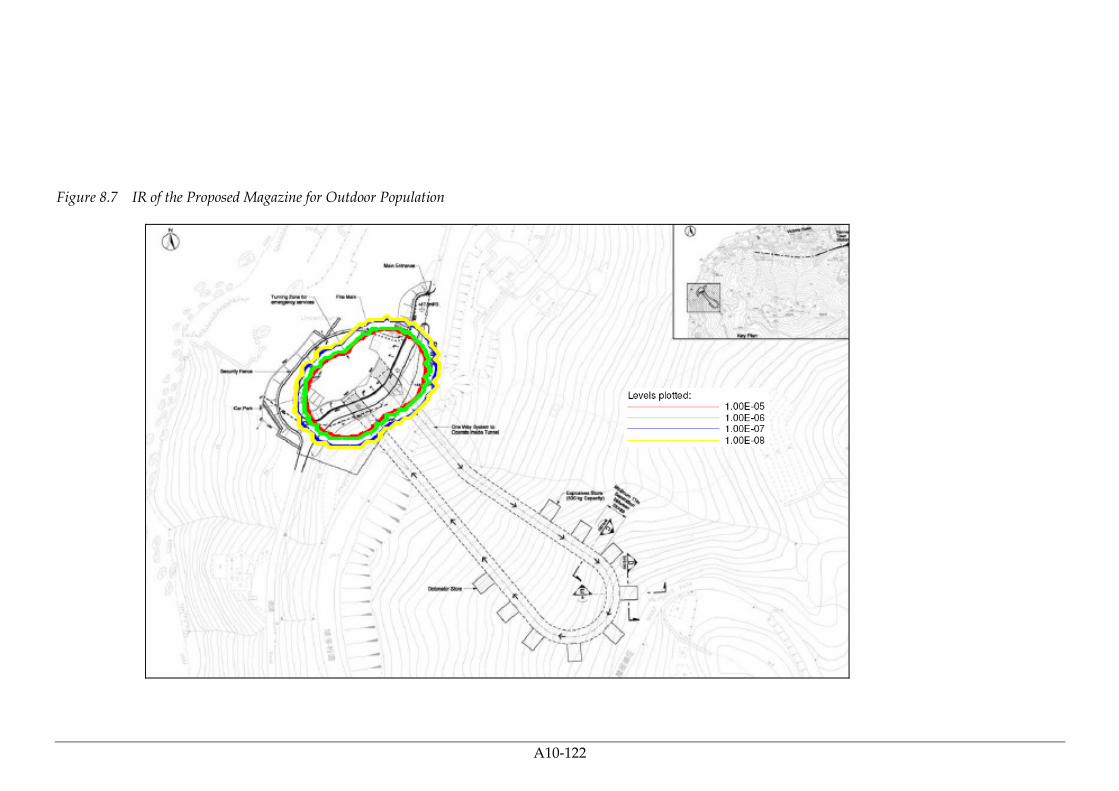
A10-122
Figure 8.7 IR of the Proposed Magazine for Outdoor Population

A10-123
8.5 OPTION ANALYSIS
As per the latest explosives consumption program (as of this study) for WIL /
magazine construction activities, the access shaft at Site at Kennedy Town
Praya (point 3) will have the highest consumption rate of 250kg explosives per
AM or PM. Although the current explosives delivery plan indicates that it will
be done in 2 trips of 125kg loaded truck per AM/PM (base case of this QRA),
the possibility of using a higher load of 250kg per truck has also been explored
in this QRA as an optimized case.
The same input as the base case has been used for the optimized case except
for delivery point 3:
• Consequence distances of 90%, 50% and 1% fatality zone are 19, 22 and 55m
respectively for indoor population and 15, 16 and 20m respectively for
outdoor population calculated by ESTC model based on 250kg explosives.
• Explosive delivery to point 3 reduced from 4 trips per day to 2 trips per day
for 6 days a week.
Figure 8.1 shows that the societal risk of the optimized case. It can be seen that
the societal risk for the optimized case is higher than the base case in the high
fatality region of the curve due to the larger impact zone from the 250kg load
of explosives. The FN curve for the optimized case is close to the ALARP
region.

A10-124
Figure 8.1 F-N Curve (Sensitivity Case)
1.0E-09
1.0E-08
1.0E-07
1.0E-06
1.0E-05
1.0E-04
1.0E-03
1 10 100 1000
Number of Fatalities (N)
Sensitivity Case (Storage, Transport & Use of Explosives)
Sensitivity Case (Transport only)
Base Case (Transport only)
Base Case (Storage, Transport & Use of Explosives)
UNACCEPTABLE
ALARP
ACCEPTABLE
8.6 UNCERTAINTY ANALYSIS AND SENSITIVITY TESTS
The study is based on a number of assumptions as previously highlighted in
various sections of this report.
A discussion on the uncertainties and sensitivity of the results is given below.
8.6.1 Transport of Explosives
Explosion Consequence Model
The employed ESTC model, or any other established TNT explosion model,
tends to overpredict the number of fatalities (or, probability of fatality for an

A10-125
individual) when compared to the actual fatalities in past incidents related to
explosives (See Annex C). It can be seen that no recorded incident involving
road transport had resulted in more than 12 fatalities even in urban location,
while from the assessment, the maximum fatalities due to road transport is
estimated as about 100. There is some conservatism in the model although it is
acknowledged that given the dense urban environment in Hong Kong, the
fatalities estimated during transport of explosives may not be too
conservative.
Escape and Evacuation
In certain circumstance it may be possible for people to escape from the scene
of an accident before the occurrence of an explosion event. This is particularly
true in the case of a fire accident, for example fire on a truck in which
explosives cargo is not initially involved but is only affected after a period of
gradual escalation. However, for the purpose of this study, no credit was
given for people to escape as a conservative assumption.
Accident Frequency for Underground Tunnel Transport
Initiation of explosives during transport includes initiation due to crash fire,
non-crash fire and crash impact. It is should be noted that the crash frequency
used for road transport was derived based on data on public roads, and the
same has been applied for transport within the underground access tunnel, ie
access tunnel to the storage magazine and the blast face. The crash frequency
for transport within the tunnel is however, expected to be much lower due to
speed restrictions inside the tunnel and the absence of other vehicle
movements.
Actual Consumption of Explosives
The WIL construction is likely to use significant quantity of bulk emulsion
instead of cartridge explosives. However, for the risk calculations, only
cartridge explosives have been considered to assess the maximum risks
during transport. The maximum peak daily consumption rate of cartridged
explosives during the project has been applied for all days in a year (to
estimate the annual risks from transport). The total quantity of cartridged
explosives that will be used based on this assumption is approximately equal
to the total explosives required for the WIL construction, while in reality, the
amount of cartridged explosives that will be used is expected to be between 25
to 50%, with the remaining being made up by bulk emulsion. Note that bulk
emulsion is not considered hazardous until it gets sensitized at the blast face,
ie posing negligible risks during road transport. Therefore, the risk estimated
by this study should be regarded as upper bound and the actual risks will be
lower.
8.6.2 Use of Explosives
Ground Vibration Model
In the study, it has been assumed that when more than one blasthole charge is
detonated at the same time, the vibration effect will be equivalent to the

A10-126
summation of all charge weight detonated at the same (ie. the effect will be
additive). However, due to delay scatter within the realms of manufacturing
tolerance, direct summation of charge weight would lead to significant
overestimation of the predicted vibration. Based on experience, this could lead
to an over-prediction of 30% for long time delay detonator and 70% for short
time delay detonator. However, the consequence assessment has considered
the effects to be additive which is conservative.
Impact on Buildings and other Features due to Ground Vibration
It has been conservatively assumed that any building subject to vibration of
more than 100mm/s PPV will experience some damage to non-structural
elements such as brick walls or lead to objects falling off the building
including advertisement signboards, any unauthorised features etc leading to
a fatality. A fatality level of about 1% of the total population inside the
building has been assumed. The maximum PPV affecting any building due to
six MIC charge weight is about 110 to 140mm/s. This assumption of 1%
fatality level for vibration effects of more than 100mm/s PPV is also expected
to account for any impacts on other minor features along the tunnel alignment
including advertising sign, scaffolding etc.
During the analysis, it was noted that the PPV levels for the majority of
buildings and slopes along the alignment are much less than 100mm/s (only
about 5 to 10 buildings/ slopes are subject to more than 100mm/s as against
the more than 1000 buildings and slopes along the WIL alignment, identified
in the Blast Assessment Report). This was because the design charge weight
(MIC) determined for blasting along the route was governed by other
sensitive features, example, historical buildings have a limit of 5 mm/s, some
cables have a limit of 13 mm/s etc. These limits are lower than 25mm/s for
buildings and hence the design provides some implicit safety margin for the
buildings on account of other factors.
Frequency of Blast involving more than one MIC
The frequency of blasts involving more than one MIC has been estimated from
failure mode analysis, fault trees, expert judgement and human error analysis.
There is not sufficient data to compare with the past underground blasting
experience given that the amount of explosives that will be used for the WIL
project is approximately equal to the total quantity of explosives that has been
used for all tunnel blasting to date in Hong Kong. Also, the WIL project will
involve blasting in close proximity to buildings and slopes, more than ever as
compared to previous blasting projects in Hong Kong, with the exception of
blasting undertaken near Quarry Bay. A broad comparison with data on all of
the blasting operations in Hong Kong including surface blasting shows the
results estimated by fault tree analysis is reasonable.
The frequency of 5MIC and 6MIN detonation occurring simultaneously has
been conservatively assumed to be same as 4 MIC. Hence the FN curve for
‘use’ does not extend below a frequency of 9E-8 per year. The frequency of
more than 6MIC is negligible, ie. below 1E-9 per year.

A10-127
8.6.3 Storage of Explosives
Frequency of Explosion
The frequency of explosion has been assumed as 1 x 10⁻⁴ per year based on the
data from the UK HSE. Given that it is an underground storage and the level
of security is higher. The frequency of explosion due to arson or other causes
is expected to be lower than the value assumed.

A10-128
9 CONCLUSION & RECOMMENDATIONS
9.1 CONCLUSIONS
A QRA has been carried out to assess the hazard to life issues arising from the
storage, transport and use of explosives during construction of WIL Project.
Assessment results indicated that the individual and societal risk is within the
acceptable limit of the Risk Guidelines specified in EIAO-TM Criteria.
Nevertheless some general recommendations have been made to minimise
risks further and in accordance with best practices (see Section 9.2).
9.2 RECOMMENDATIONS
9.2.1 General Recommendations
Blasting activities regarding storage, use and transport of explosives should be
supervised and audited by competent site staff to ensure strict compliance
with the blasting permit conditions.
The following general recommendation should also be considered for the use,
storage and transport of explosives:
1. The security plan should address different alert security level to reduce
opportunity for arson / deliberate initiation of explosives. The
corresponding security procedure should be implemented with respect to
prevailing security alert status announced by the Government.
2. Emergency plan shall be developed to address uncontrolled fire in
magazine area and tunnel. The case of fire near to truck in jammed traffic
should also be covered. Drill of the emergency plan should be carried out
at regular intervals.
3. Adverse weather working guideline should be developed to clearly define
procedure for transport and use of explosives during thunderstorm.
4. Contingency plans for misfires and delayed blasts should be developed
and form part of the Method Statement.
Specific recommendations for each of use, transport or storage of explosives
are given below.
9.2.2 Storage of Explosives in Magazine Store
The magazine should be designed, operated and maintained in accordance
with Mines Division guidelines and appropriate industry best practice. In
addition, the following recommendations should be implemented.

A10-129
1. Only one contractor’s vehicle should be allowed within the magazine at
any one time.
2. A speed limit within the magazine access tunnels should be enforced to
reduce the risk of a vehicle impact or incident within the magazine.
3. A suitable work control system should be introduced, such as a Permit-to-
Work system, to ensure that work activities undertaken during the
operation of the magazine are properly controlled.
4. There should be good house-keeping within the magazine to ensure that
combustible materials are not allowed to accumulate.
5. The magazine shall be without open drains, traps, pits or pockets into
which any molten ammonium nitrate could flow and be confined in the
event of a fire.
6. The magazine shall be regularly checked for water seepage through the
roof, walls or floor.
7. Caked explosives shall be disposed of in an appropriate manner.
8. Delivery vehicles shall not be permitted to remain unattended within the
magazine. In addition they shall not be allowed to park overnight or when
not required within the magazine or its adits.
9.2.3 Transport of Explosives
The following measures should also be considered for safe transport of
explosives:
1. Detonators shall not be transported in the same vehicle with other Class 1
explosives. Separation of vehicles should be maintained during the whole
trip.
2. Location for stopping and unloading from truck to be provided as close as
possible to shaft, free from dropped loads, hot work, etc. during time of
unloading.
3. Develop procedure to ensure that parking space on the site is available for
the explosive truck. Confirmation of parking space should be
communicated to truck driver before delivery. If parking space on site
could not be secure, delivery should not commence.
4. During transport of the explosives within the tunnel, hot work or other
activities should not be permitted
5. Ensure lining is provided within the transportation box on the vehicle and
in good condition before transportation.
6. Ensure that UN 1.4B packaging of detonators remains intact until handed
over at blasting site.

A10-130
7. Emergency plan to include activation of fuel isolation switch on vehicle
when fire breaks out to prevent fire spreading and reducing likelihood of
prolonged fire leading to explosion,.
8. Use only experienced driver(s) with good safety record for explosive
vehicle(s).
9. Ensure that cartridged emulsion packages are damage free before and
after every trip.
9.2.4 Use of Explosives
The following recommendations should be considered for the safe use of
explosives.
1. Blast charge weight (MIC) should be limited to a maximum of 5kg per
delay for each blast.
2. Temporary mitigation measures such as blast doors or heavy duty blast
curtains should be installed at the access adits, shafts and at suitable
locations underground to prevent flyrock and control the air
overpressure.
3. Blasting from multiple faces as well as different locations will be carried
out for this project. Good communication and control will need to be
adopted in ensuring that the works are carried out safely.
4. It is intended that complete evacuation of the underground tunnels need
not be carried out and secure refuge areas should be identified workers in
the area.
5. A Chief Shotfirer and a Blasting Coordinator shall be employed in
addition to the normal blasting personnel to ensure that the works are
coordinated between blasting areas and between adjacent contracts.
6. Shotfirer to be provided with a lightning detector, and appropriate control
measures should be in place.
7. Speed limit for the diesel vehicle truck and bulk emulsion truck in the
tunnel should be enforced. The truck may be escorted while underground
to ensure route is clear from hazards and obstructions.
8. Hot work should be suspended during passage of the diesel vehicle truck
and bulk emulsion truck in tunnel.
9. Prior to construction of the magazine, a survey of boulders should be
undertaken based on the likely PPV values that would result from the
initiation of the entire quantity stored in a magazine niche. Boulders
identified within this limit should be numbered and assessed, if required
they should either be strengthened or removed. The remaining boulders

A10-131
identified should then be monitored during the blasting of the magazine
adits and chambers.

A10-132
10 REFERENCES
[1] DNV, The Risk Assessment of the Transport of Explosives in Hong Kong QRA
Report, Environmental Protection Department Hong Kong Government,
1997
[2] Maunsell, Hazard to Life Assessment of Explosive Storage and Handling for
EIA of Ocean Park Development, 2006
[3] ERM, Penny’s Bay Rail Link: Hazard Assessment of Explosive Magazine,
2001
[4] MTR, West Island Line, Consultancy Agreement C703, SYP and UNV
Stations, and SHW to KET Tunnel, Blast Assessment Report, Volume 1-8,
June 2008
[5] MTR, West Island Line, Consultancy Agreement C704, KET Station and
Overrun Tunnel, Modifications to SHW Station, Blast Assessment Report,
Volume 1-3, July 2008
[6] MTR, West Island Line, Consultancy Agreement C703, SYP and UNV
Stations, and SHW to KET Tunnel, Explosives Magazine at Victoria Road
Controlling Blast Report, June 2008
[7] HSC, Selection and Use of Explosion Effects and Consequence Models for
Explosives, Advisory Committee on Dangerous Substances, 2000
[8] FP Lees, Loss Prevention in Process Industries, 2nd Edition, 1996,
[9] CEDD, Geoguide 4 - Guide to Cavern Engineering, Chapter 5, pp77-78
[10] MTR, Summary of Expert Panel Meeting, 23 July 2008.
[11] US Department of Defense, DoD 6055.9-STD, DoD Ammunition and
Explosives Safety Standards, Oct 2004.
[12] CEDD, GEO Report 15, Assessment of Stability of Slopes Subjected to
Blasting Vibration, by H.N. Wong & P.L.R. Pang, 1992
[13] CEDD, GEO Report 81 Slope Failures along BRIL Roads : Quantitative Risk
Assessment and Ranking, by ERM-Hong Kong, Ltd, 1999
[14] Working Paper TT07, Alternative WIL Feeder Option, Traffic Impact
Assessment (Operation Stage), and Pedestrian Assessment
[15] Health and Safety Executive, The Peterborough Explosion – A report of the
investigation by the Health and Safety Executive into the explosion of a vehicle
explosives at Fengate Industrial Estate, Peterborough on 22 March 1989, UK,
1990.
A10-133
[16] DOCEP, Incident Log Reports retrieved from
http://www.docep.wa.gov.au/resourcesSafety/Content/Dangerous_G
oods/Incident_log_reports/index.htm
[17] DOCEP, WA Government Explosives Incident Log 2001, DGEA 01/01
[18] Richard J. Mainiero and James H. Rowland III, A Review of Recent
Accidents Involving Explosives Transport, NIOSH, January 2008.
[19] T.S. Bajpayee, Harry C. Verakis and Thomas E. Lobb, An Analysis and
Prevention of Flyrock Accident in Surface Blasting Operations, NIOSH, 2003.
[20] ACDS, Risk from Handling Explosives in Ports, HSC Advisory Committee
on Dangerous Substances, HMSO, UK, 1995
[21] R. Merrifield, P.A. Moreton, An examination of the major-accident record for
explosives manufacturing and storage in the UK, Journal of Haz. Mats A63
(1998) 107-118.
[22] Guidelines for Quantitative Risk Assessment, TNO Purple Book, CPR18E 1st
Ed, Committee for the Prevention of Disasters
[23] F.D. Wayne, An economical formula for calculating the atmospheric infrared
transmissivities, J. Loss Prev. Process Ind., 1991 Volume 4
[24] HSE, Safety Report Assessment Guide for HFLs,
http://www.hse.gov.uk/comah/sraghfl/images/hflcriteria.pdf
[25] BS 7385-2:1993 Evaluation and measurement for vibration in buildings –
Guide to damage levels from ground borne vibration
[26] US Bureau of Mines Bulletin 656 Blasting vibrations and their effects on
structures
[27] C. H. Dowding, Blast vibration monitoring and control, 1st Ed 1985
[28] J.W. Pappin, A.J.H. Bowden, The likelihood of earthquake induced landslides
in Hong Kong, 1998
[29] UK Highway Code on-line version
http://www.direct.gov.uk/en/TravelAndTransport/Highwaycode/D
G_070304
[30] U-King Li & Su-Yim Ng, Prediction of Vibration and Current Practices of
Measurement in Hong Kong.
[31] Atkins Arup JV, Explosives Magazine at Victoria Road, Draft Operation
Manual
[32] A.B Richards, Vibration Control in Construction Blasting, 1st Australian
Tunnelling Conference, AusIMM, Melbourne.

A10-134
[33] Castle Peak Power Company Limited, Liquefied Natural Gas (LNG)
Receiving Terminal and Associated Facilities, EIA Report No. EIA-
125/2006, October 2006.
[34] Wong H N et al Assessment of Consequences of Landslides, Proceeding of the
Workshop on Landslide Risk, IUGS Working Group on Landslides,
Honolulu, Balkema.
[35] GEO, HKDSAR, Territory Wide Quantitative Risk Assessment of Boulder
Fall Hazards Stage 1 Final Report, April 1999.
[36] Helmut Krawinkler, Van Nuys Hotel Building Testbed Report: Exercising
Seismic Performance Assessment, Pacific Earthquake Engineering Research
Center, Department of Civil and Environmental Engineering, Stanford
University.
[37] Earthquake Damage Evaluation Data for California, Applied Technology
Council Report Number ATC-13, Redwood City, California. (referred by
[36])
[38] Earthquake Loss Estimation Methodology, Service Release 2 (SR2) Technical
Manual, Developed by the Federal Emergency Management Agency
through agreements with the National Institute of Building Sciences,
Washington, D.C (referred by [36])
[39] Health and Safety Executive (HSE), HSE Statistics,
http://hse.gov.uk/statistics/table/table8j.htm
[40] MTR, Summary of Expert Panel Meeting, 23 July 2008
[41] ERM, Hazard to Life Assessment of Construction of an International Theme
Pack in Penny’s Bay of North Lantau: EIA Review Report; 2005

Annex A
Blasting Process

CONTENTS
A1 OVERVIEW OF BLASTING PROCESS 1
A1.1 BLASTING FUNCTION 1
A1.2 SENSITIVE VIBRATION RECEIVERS AND MAXIMUM INSTANTANEOUS CHARGE
(MIC) 1
A1.3 DETONATION SEQUENCE 1
A1.4 EXPLOSIVES TYPES AND CHARGING OF BLASTHOLES 2
A1.5 NON-ELECTRIC DETONATORS 4
A1.6 CAST BOOSTERS 4
A1.7 DETONATING CORD – PERIMETER BLASTHOLES 4
A1.8 PERSONNEL – ROLES & RESPONSIBILITIES 5
A2 BLASTING CYCLE 6
A2.1 BLAST PLANNING & DOCUMENTATION 6
A2.2 ORDERING OF EXPLOSIVES & INITIATION SYSTEMS 6
A2.3 BLASTHOLE CLEANING 7
A2.4 BLASTHOLE MARKING 7
A2.5 DELAY DETONATOR PLACEMENT 7
A2.6 PRIMING CUT, LIFTER & PRODUCTION BLASTHOLES 7
A2.7 LOADING CARTRIDGED EMULSION EXPLOSIVES 8
A2.8 LOADING BULK EMULSION EXPLOSIVES 8
A2.9 LOADING PERIMETER BLASTHOLES 9
A2.10 DETONATOR HOOK-UP 9
A2.11 FINAL CHECKS 9
A2.12 MONITORING PLAN 10
A2.13 BLAST SITE EVACUATION 10
A2.14 BLAST INITIATION 11
A2.15 POST BLAST INSPECTION 11
A2.16 VENTILATION AND RETURN TO WORKING FACE 11
A2.17 POST BLAST SENSITIVE RECEIVER INSPECTION & MONITORING REPORT 12

A10-A1
A1 OVERVIEW OF BLASTING PROCESS
A1.1 BLASTING FUNCTION
The objective of underground blasting is to excavate a void by fragmenting
and ejecting rock. The size of the fragmentation is an important factor and
impacts on efficient removal of the blasted material, the smaller the rock
fragments, the faster the material can be handled by excavation equipment
and the faster it can be removed enabling the drill and blast cycle to progress.
To blast rock a pre-determined quantity of explosives are placed in holes
which have been drilled on a pre-determined pattern. The explosives are
initiated by either a detonator for cartridged emulsion or a small booster
attached to a detonator for bulk emulsion.
The following elements are important functions within the blasting process.
A1.2 SENSITIVE VIBRATION RECEIVERS AND MAXIMUM INSTANTANEOUS CHARGE
(MIC)
Each and every blast is directly influenced by a controlling sensitive receiver
which can be a building, slope or utilities. This controlling sensitive receiver
will have a pre-determined maximum allowable critical peak particle velocity
(PPVc), otherwise known as a maximum allowable ground vibration
expressed in mm/second. This maximum PPV value dictates the amount of
explosives that can be detonated at once i.e. per delay detonator, and is known
as the maximum instantaneous charge (MIC).
A1.3 DETONATION SEQUENCE
The order in which the detonators are initiated is a key component of the
blasting process. Blasts are designed so that no two detonators will initiate at
the same instant in time resulting in a doubling of the MIC. To achieve this
sequential initiation detonators are selected which have different delay
periods (eg. 300, 350,400, 450 milliseconds etc).
All underground tunnel/adit blasts start with a ‘cut’ area which is usually
positioned at the centre lower portion of the face to be blasted. This area is
characterised by 2 or more large diameter drill holes which are not loaded
with explosives. Their purpose of these ‘relief’ holes is to provide a void area
which allows the ejection of the blasted rock, creating a larger void. This
provides the space for the rocks from outer sectors of the blast face to collapse
into following detonation of the explosives within the production holes.
Detonators of different delays are positioned starting from the ‘ cut ‘ area and
their delay time increases radially outwards towards the tunnel/adit
perimeter allowing the face to be blasted in ring like sections.

A10-A2
In larger tunnels/adits the face is divided into 4 or more sections, with at least
two sections having similar delay detonator times. However, the sectors are
separated by further ‘delays’ achieved by the use of bunch blocks (ie 0 ms
surface connectors) and time delay surface connectors (ie 9 ms, 17 ms, etc).
Other than the delay time, difference between the bunch block and time delay
surface connectors is essentially the explosive mass that it contains. A bunch
block contains approximately 0.3 grams of high explosive, which is sufficient
to set off detonating cord. Whereas a time delay surface delay detonator
contains only 0.11 grams of explosives and whilst it is insufficient to initiate
detonating cord, it is sufficient to ignite shock tubes.
All the shock tube tails of the down-the-hole detonators within an individual
sector are ‘bunched’ together and secured with at least two strands of 5
gms/m detonating cord. The detonating cord is connected to a bunch block
having a 0ms delay (no delay element). This ensures the ignition of the
bunched shock tubes that are wrapped by the detonating cord.
The shock tube tail from the bunch block may itself be ignited by a surface
connector, which will typically have a delay time of 9ms or 17ms (i.e. 9 or
17ms delay element). In addition, two or more time delay surface connector
may be linked in series, with their connected bunch blocks in parallel. This
ensures that no two detonations in adjoining sectors will simultaneously fire
with detonations across the entire blast face starting at 0ms and continuing at
9, 17, 26, 34 and 43ms dependant on the number of sectors.
A1.4 EXPLOSIVES TYPES AND CHARGING OF BLASTHOLES
Blastholes may be charged (loaded) with the following explosives types:
• Cartridged emulsion explosives (UN Category 1.1D)
• Bulk emulsion explosives (UN Cat egory1.5D)
A1.4.1 Cartridged Emulsion Explosives
Cartridged Emulsion explosives typically contain:
• 80-85% ammonium/sodium nitrate solution (oxidizer)
• 6-8% fuel or mineral oil (fuel)
• 0.7 – 1.0% surfactant (also a fuel)
• 13.3-6.0% water
• The percentage of fuels can be varied if aluminium powder is added;
the aluminium being used to raise the explosion temperature.
Cartridged Emulsion explosives are packaged in either plastic film (valeron)
or paper wrapped. They have a semi-soft consistency, the softness being
controlled by their water content. Cartridged Emulsions have the appearance

A10-A3
of slightly yellow viscous cream or silver when aluminium is added to the
formulation.
Cartridged Emulsions do not completely fill the blasthole and result in various
degrees of ‘decoupling’ depending on the diameter of the cartridge stick and
the blast hole into which it is placed. This ‘decoupling’ reduces the overall
effectiveness of the explosive as the explosive cartridge is not in total contact
with the blasthole wall, being separated by an air annulus.
Cartridged Emulsion explosives usually have the following technical
parameters:
• Density 1.20 – 1.25 gms/cc
• Velocity of Detonation 4,300-4,500 m/sec
• Detonation Pressure 55.7 – 63.5 kBar
• Sensitivity No. 8 detonator
A1.4.2 Bulk Emulsion Precursor
Bulk Emulsion Precursor has a similar composition to Cartridged Emulsion,
however, these are usually manufactured using mineral oil as the fuel phase
and do not contain aluminium. The bulk emulsion precursor has a density of
1.38-1.40 gms/cc and is an oxidising agent. It is not considered an explosive
and is classified as UN 5.1 and DG Category 7 Strong Supporters of
Combustion.
Bulk Emulsion explosives have the appearance of viscous cream and are
frequently slightly yellow in colour.
A1.4.3 Bulk Emulsion
Bulk Emulsion precursor is sensitised at the blast face where a gassing
solution (usually Acetic/Citric acid) is added to the charging hose
downstream from delivery pump. This gassing solution mixes with the
emulsion precursor, aided by a ‘static mixer’ positioned near the outlet end of
the delivery hose and produces nitrogen bubbles, which in turn results in a
final product density of 0.80-1.10 gms/cc. At this density the Bulk Emulsion
precursor becomes a booster sensitive explosive. Bulk Emulsion will not
reliably detonate if primed only with a No. 8 detonator.
Bulk Emulsion explosives which are pumped into blastholes completely fill
the blasthole and thus are ‘fully coupled’ to the blasthole. This results in
improved explosive performance and enables Bulk Emulsion explosives of
lower power (cf. Cartridged Emulsions) to be utilized, resulting in equal or
better performance over Cartridged Emulsions.
Bulk Emulsion explosives usually have the following technical parameters:
• Density 0.80 – 1.10 gms/cc

A10-A4
• Velocity of Detonation 4,500-4,800 m/sec
• Detonation Pressure 40.7 – 63.6 kBar
• Sensitivity 12 gram cast booster
A1.5 NON-ELECTRIC DETONATORS
The ignition of a non-electric detonator, or blasting cap, is achieved by the use
of a shock tube, which is a small diameter plastic tube that has a light dusting
of combustible explosive powder to the inside surface along its length. When
ignited by a hot, high pressure impulse the explosive powder combusts at a
rate of 2,000 - 2,200 m/s, and causes ignition of the detonator pyrotechnic
delay mixture.
The delay time of a detonator is controlled by the burning time of a
pyrotechnic ignition mixture pressed into a 6.5mm diameter steel tube, which
is the delay element. This element causes the primary explosive, which is
typically a small amount of lead azide, to detonate. This in turn, causes the
secondary, or output, explosive to detonate, which is usually PETN
(Pentaerythrite tetranitrate). The quantity of PETN within each detonator is
approximately 0.8 gram.
Each detonator has a delay time that is based upon the length of steel tube and
the compaction of the pyrotechnic mixture within it.
These type of detonators are insensitive to static electricity, stray currents and
have a higher safety threshold than electric type to being initiated by electrical
impulses resulting from lightning strikes on nearby structures or the ground.
A1.6 CAST BOOSTERS
These devices are only required if bulk emulsion is to be used instead of
cartridged emulsion. They are small devices, usually containing 12 grams in
weight of high explosive into which a detonator is inserted and the whole
assembly is then placed in the end of the blasthole, and once assembled is
called a primer.
Cast Boosters are usually manufactured from a 50/50% mixture of TNT and
PETN, termed Pentolite. Cast Boosters detonate at speeds of 6,000 m/sec and
provide sufficient ‘shock’ energy to reliably detonate the Bulk Emulsion, after
firstly being initiated by the delay detonator.
A1.7 DETONATING CORD – PERIMETER BLASTHOLES
The perimeter blastholes are drilled at 600 mm intervals around the
circumference of the adit/tunnel profile. These blastholes are not loaded with
the equivalent MIC for the blast as this would lead to a substantial amount of
‘overbreak’ of the tunnel profile.
A10-A5
Perimeter blast holes are instead loaded with 80 gms/m of detonating cord (2
x 40 gms/m), and a single stick of cartridged emulsion is placed in the ‘toe’
(bottom) of the blasthole. When these blastholes are initiated the high Velocity
of Detonation (VOD) of the detonating cord (about 7,000 m/sec), and the gas
produced by the single cartridge of emulsion is sufficient to crack the rock
between adjoining blastholes resulting in a smooth tunnel profile. It is not
unusual to see half blastholes around the adit/tunnel perimeter after a blast
indicating a perfect pre-split.
A1.8 PERSONNEL – ROLES & RESPONSIBILITIES
Under current Hong Kong Law a Shotfirer is legally responsible for collecting
the explosives, loading the blast holes, ensuring a blast site has been
evacuated, detonating the blast and for the consequential outcome of that
blast.
The legislation states that the Shotfirer is the only individual that can make up
primer charges and load blastholes and as such, is in control of the physical
blast preparation at the working face.
The Blasting Engineer is responsible for the blast design and for obtaining
endorsements/approvals from the Resident Engineer (RE) and Mines for all
blasts. The blasting engineer’s duties include calculating the required volume
of explosives and initiating systems for the blast, maintaining safety, ensuring
that the monitoring plan is implemented and for supervising the work of the
Shotfirer(s).

A10-A6
A2 BLASTING CYCLE
The following sections describe the complete blasting cycle and the
responsible person(s) for each step.
A2.1 BLAST PLANNING & DOCUMENTATION
Underground adit/tunnel blasts are planned two days in advance. This allows
sufficient time for the Contractors’ Blasting Engineer to submit blast
documentation to the RE and Mines for endorsement. Blast documentation
should be submitted to the RE and Mines by 5:00pm two days before the
intended blast. The RE and Mines will confirm their endorsement by 11:00am
one day before the planned blast.
The required blast documentation comprises the following information, which
is signed by both the Blasting Engineer and the Registered Shotfirer:
• Plan view of the blast face detailing the diameter and position of all
blastholes, the delay detonators to be used within each blasthole in
each face sector, and the surface delays to be used between sectors;
• The total required number of detonators tabulated by delay number
and length;
• The quantity of cartridged or bulk emulsion explosives to be used
within the blast;
• The quantity of mini cast boosters or cartridged emulsion boosters
required;
• The quantity of detonating cord to be used in perimeter blast holes;
• The MIC for the blast;
• The predicted Peak Particle Velocity (PPV) (vibration) and Air
Overpressure (AOP) at the nominated sensitive receivers; and
• Date and estimated time of the subject blast.
A2.2 ORDERING OF EXPLOSIVES & INITIATION SYSTEMS
The detailed blast documentation also forms the explosives and initiating
systems order from the explosives magazine.
When the explosives are required the Registered Shotfirer along with
nominated representatives from the Contractor and the RE will go to the
explosives magazine with the endorsed blast documentation which is
presented to the security chief.
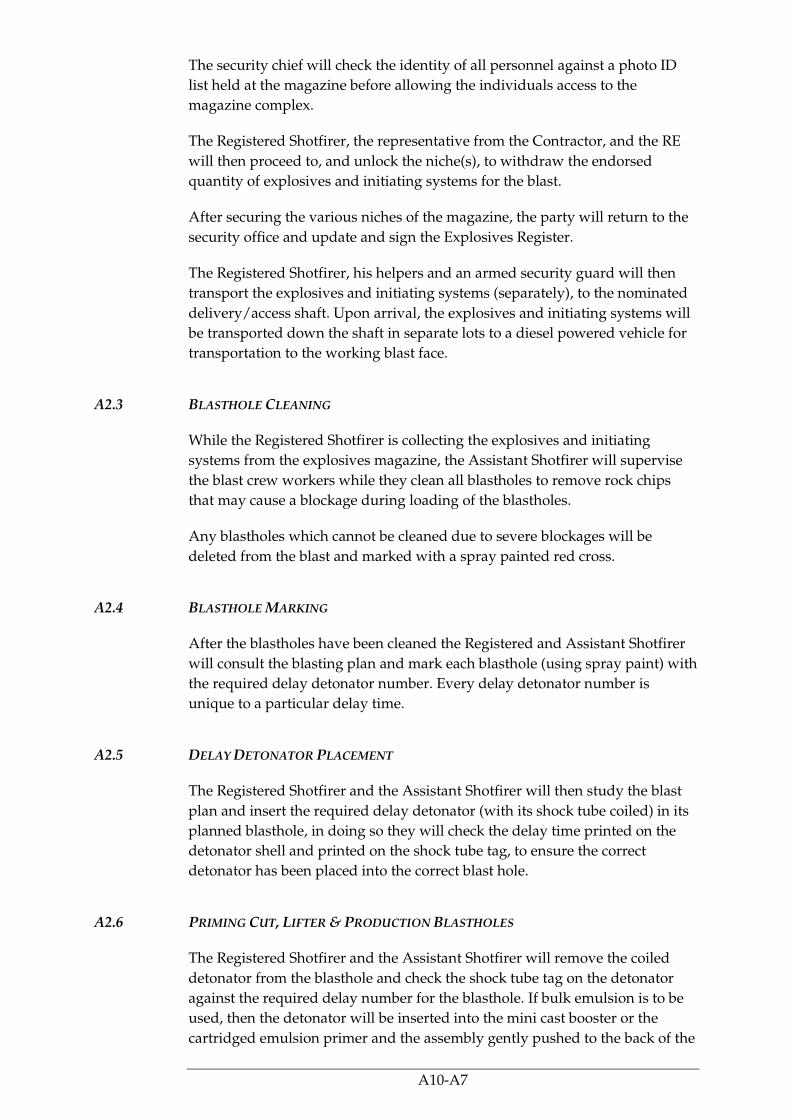
A10-A7
The security chief will check the identity of all personnel against a photo ID
list held at the magazine before allowing the individuals access to the
magazine complex.
The Registered Shotfirer, the representative from the Contractor, and the RE
will then proceed to, and unlock the niche(s), to withdraw the endorsed
quantity of explosives and initiating systems for the blast.
After securing the various niches of the magazine, the party will return to the
security office and update and sign the Explosives Register.
The Registered Shotfirer, his helpers and an armed security guard will then
transport the explosives and initiating systems (separately), to the nominated
delivery/access shaft. Upon arrival, the explosives and initiating systems will
be transported down the shaft in separate lots to a diesel powered vehicle for
transportation to the working blast face.
A2.3 BLASTHOLE CLEANING
While the Registered Shotfirer is collecting the explosives and initiating
systems from the explosives magazine, the Assistant Shotfirer will supervise
the blast crew workers while they clean all blastholes to remove rock chips
that may cause a blockage during loading of the blastholes.
Any blastholes which cannot be cleaned due to severe blockages will be
deleted from the blast and marked with a spray painted red cross.
A2.4 BLASTHOLE MARKING
After the blastholes have been cleaned the Registered and Assistant Shotfirer
will consult the blasting plan and mark each blasthole (using spray paint) with
the required delay detonator number. Every delay detonator number is
unique to a particular delay time.
A2.5 DELAY DETONATOR PLACEMENT
The Registered Shotfirer and the Assistant Shotfirer will then study the blast
plan and insert the required delay detonator (with its shock tube coiled) in its
planned blasthole, in doing so they will check the delay time printed on the
detonator shell and printed on the shock tube tag, to ensure the correct
detonator has been placed into the correct blast hole.
A2.6 PRIMING CUT, LIFTER & PRODUCTION BLASTHOLES
The Registered Shotfirer and the Assistant Shotfirer will remove the coiled
detonator from the blasthole and check the shock tube tag on the detonator
against the required delay number for the blasthole. If bulk emulsion is to be
used, then the detonator will be inserted into the mini cast booster or the
cartridged emulsion primer and the assembly gently pushed to the back of the

A10-A8
cut, lifter or production blasthols. The primer is always positioned so that the
detonator is pointing towards the blasthole collar (i.e. the face of the blast).
A2.7 LOADING CARTRIDGED EMULSION EXPLOSIVES
After priming all the cut, lifter and production blastholes the Registered
Shotfirer and the Assistant Shotfirer will load the blastholes with the required
MIC of cartridged emulsion sticks.
In the case of cartridged emulsion explosives, this will be a pre-calculated
number of ‘sticks’ of the explosive; eg. if the MIC is 1.0 kg and 32 mm x 200
mm cartridged emulsion (.208 kg / stick) is being used, then 5 x cartridges
will be inserted into each blasthole.
A2.8 LOADING BULK EMULSION EXPLOSIVES
When bulk emulsion explosives are utilized, the blast plan will have
determined the required emulsion density. This will be communicated to the
bulk emulsion pump / truck operator. The operator will consult calibration
charts and set the flow rate of the gassing solution chemicals to provide the
correct final bulk emulsion density.
Before pumping bulk emulsion into the blastholes, the pump truck operator
will pump the gassed bulk emulsion into a beaker of known size and weight
(usually 1 litre capacity). The operator will wait for about 5 minutes to allow
the gassing phase to be completed and using a spatula, will wipe the top of
the beaker to remove any excess material. The beaker and its gassed bulk
emulsion contents are then weighed on calibrated laboratory scales to confirm
the final product density.
Should the density require further adjustment, the above process is repeated
until such time as the final product density is achieved.
Once the density is correct the Registered Shotfirer and his Assistant Shotfirer
shall instruct the pump truck operator to provide the required MIC in each
blasthole.
As an added checking method the Blasting Engineer knowing the final bulk
emulsion density and the blasthole diameter, will calculate the length of the
blasthole that will be filled with the MIC. For example, an MIC of 1.43 kg in a
45 mm blasthole at 0.90 gms/cc explosive density, the explosive column will
be 1.0 m long). Typically, the Registered and Assistant Shotfirer will place a
highly visible mark at the required distance from the end of the bulk emulsion
loading hose. When the bulk emulsion is being pumped into the blasthole and
the loading hose slowly withdrawn, the visible mark will appear at the blast
hole collar indicating that the MIC has been loaded. The bulk emulsion pump
should automatically shut down once it has delivered the pre-determined
quantity.

A10-A9
When all blastholes have been loaded the pump truck operator will check the
‘totalizer’ and print out two copies of a certificate detailing the total volume of
bulk emulsion used/loaded for the particular blast. The Blasting Engineer will
sign both copies and will return one copy to the pump truck operator.
A2.9 LOADING PERIMETER BLASTHOLES
The detonating cord and cartridged emulsion booster for the perimeter
blastholes are usually made up along a length of split bamboo, the explosive
components being taped to the bamboo.
After preparation the lengths of bamboo are pushed to the back of the
blastholes. Depending on the MIC for the blast groups of perimeter blastholes
are linked together by 2 x 5 gms/m detonating cord and the ‘group’ of
blastholes are fired by a single delay detonator; eg. for blastholes of 4.2 m in
length with 2 x 40 gms/m detonating cords and a 0.208 kg cartridge emulsion
booster, the charge per blasthole would be 0.544 kg ((4.2 x 40 x 2) + 0.208 kg =
0.544 kg). If the MIC for the blast was 1.7 kg, then three perimeter blastholes
can be detonated at the same time instant (0.544 x 3 = 1.632 kg).
A2.10 DETONATOR HOOK-UP
After all blastholes have been loaded with the required explosive charge
(MIC) the Registered and Assistant Shotfirer proceed to ‘bunch’ together all
the shock tube tails of the down-the-hole detonators within a particular face
sector. The tails are lashed together with 2 x strands of 5 gms/m detonating
cord and tied with a slip proof knot.
A Bunch Block (0 ms delay) is attached to the detonating cord and the
required time delay surface connector (9 or 17 ms) is attached to the shock
tube tail of the Bunch Block.
This process continues until each face sector (4 – 6) is ‘bunched’ with its
accompanying Bunch Block and surface connector. Thereafter the Registered
and Assistant Shotfirer will connect the shock tube tail of the surface
connector to the ‘bunch’ of shock tubes in the sector that is designed to initiate
immediately beforehand.
Sectors will then initiate at times [0, 9, 17 and 26 ms] for a four sector face and
[0 , 9, 17, 26, 34 and 43 ms] if there are six sectors in the face.
A2.11 FINAL CHECKS
The Registered and Assistant Shotfirer, together with the Blasting Engineer
will stand back from the face and visually check for the following:
• That there are no shock tube tails from one sector connected into the
‘bunch’ of another sector;

A10-A10
• That there are no shock tube tails from down-the-hole detonators left
unattached;
• That each sector has a Bunch Block attached to the detonating cord
securing the ‘bunch’ of shock tube tails in a sector;
• That a surface connector is connected to each bunch blokc except in the
0 ms firing sector.
• That the shock tube tail of each surface connector is connected to the
‘bunch’ of shock tube tails of the sector initiating immediately before
that particularly sector;
• That the 9 ms surface connector is connected from the 0 ms firing
sector (bottom left sector) to the bottom right sector and that all other
surface connectors are 17 ms and connected vertically upwards
between sectors;
• That all perimeter blastholes are connected in the intended ‘groups’,
the delay detonators are attached to the first blasthole in every group,
and that the shock tube tail of these detonators are connected into the
correct sector ‘bunch’; and
• That the sector initiating at 0 ms has a bunch block attached to the
detonating cord.
A2.12 MONITORING PLAN
About 1 hour before the blast is to be initiated the Blasting Engineer will
instruct the Instrument Engineer to commence deploying the monitoring
equipment to record vibration (PPV) and air overpressure (AOP) at the
designated monitoring locations for the subject blast.
Once completed the Instrument Engineer will confirm that all instruments
have been deployed and are active.
A2.13 BLAST SITE EVACUATION
At this time the Blasting Engineer will instruct all the Shotfirers’ helpers to
evacuate the blast site and to proceed to their predetermined sentry positions
and to await further instructions.
Once all final checks have been completed the Blasting Engineer shall instruct
the Registered Shotfirer to attach the electric detonator to the shock tube tail of
the Bunch Block in the sector firing at 0 ms. After doing so, the Registered
Shotfirer will attach a reel of firing line wire to the electric detonator and the
face will be evacuated. The Blasting Engineer, the Registered and Assistant
Shotfirer will then retreat to the nominated ‘firing point’ which would
normally be at least 200 m from the blast face.

A10-A11
At this time the Blasting Engineer will give instructions for the blast door(s) to
be closed.
A2.14 BLAST INITIATION
The Blasting Engineer will check that all ‘Gongmen’ (sentries) are at their
designated location and that all affected areas of the underground excavation
have been cleared of personnel.
At this time the Blasting Engineer will ask the Registered Shotfirer to check
the resistance of the electrical circuit connected to the electric detonator and to
verify he is ready to initiate the blast.
The Blasting Engineer will contact each Gongman to verify that their area of
responsibility is secure. When satisfied that the evacuation procedure is
complete and that the safety of all personnel has been secured, the Blasting
Engineer shall instruct the Gongmen to commence beating a ‘slow gong’ and
to wave their red flags.
After a period of about 20 seconds, the Blasting Engineer shall instruct the
Gongmen to beat a ‘fast gong’ and instruct the Registered Shotfirer to connect
the electrical circuit to his exploder (electric detonator initiator).
The Blasting Engineer will then reconfirm that all sentry points are secure and
instruct the Assistant Shotfirer to count down from 10 to 0.
The Registered Shotfirer will then charge the capacitor in his exploder and
when the ‘count’ reaches 0, he will initiate the blast.
A2.15 POST BLAST INSPECTION
After the blast has been initiated, and after the post blast dust and fumes have
diminished, the Registered and Assistant Shotfirer, along with the Blasting
Engineer will inspect the blast site for any ‘misfired’ blastholes.
If no misfires are detected the Blasting Engineer shall give the ‘all clear’ and
the sentries will leave their designated locations and other site personnel will
return to their place of work.
Should a misfire be detected, the Registered Shotfirer will make sure the
misfire is made safe and shall connect an electric detonator to the detonating
cord or shock tube tail. The standard evacuation procedure will again been
completed and the misfire shall be initiated and a further post blast inspection
made.
A2.16 VENTILATION AND RETURN TO WORKING FACE
Once the all clear has been given the ventilation fans will be turned on and the
broken rock from the blast will be watered down to reduce dust emissions.
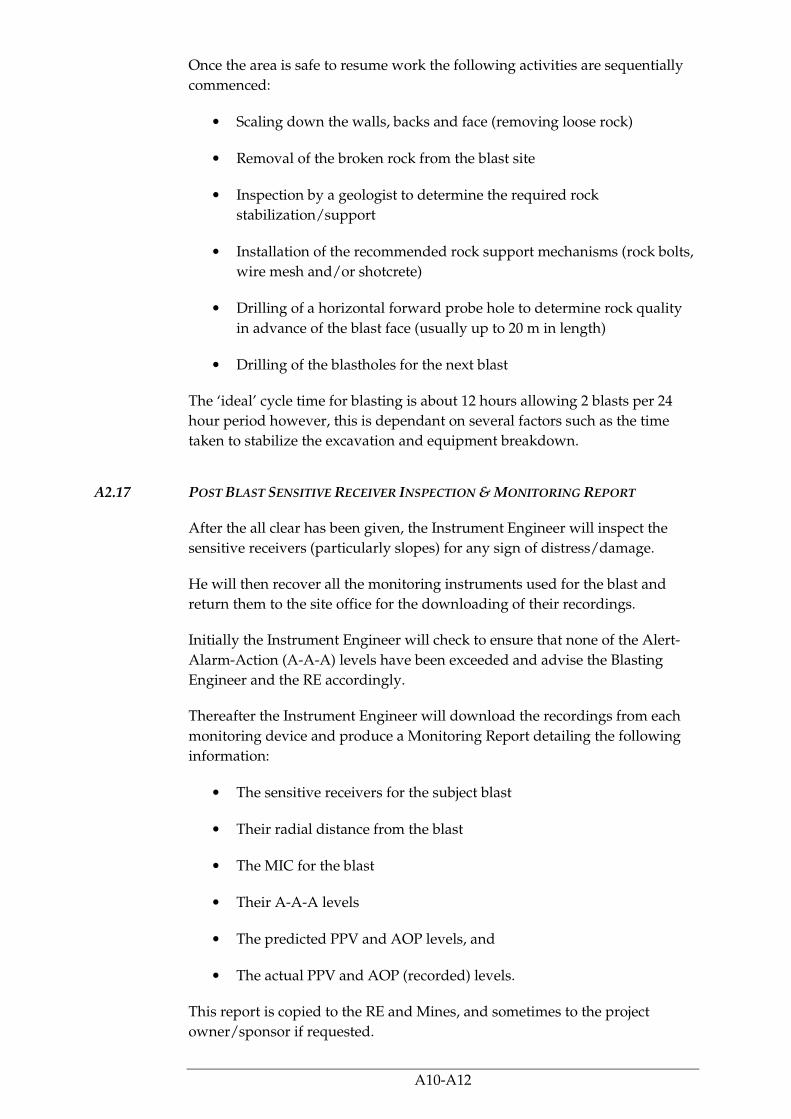
A10-A12
Once the area is safe to resume work the following activities are sequentially
commenced:
• Scaling down the walls, backs and face (removing loose rock)
• Removal of the broken rock from the blast site
• Inspection by a geologist to determine the required rock
stabilization/support
• Installation of the recommended rock support mechanisms (rock bolts,
wire mesh and/or shotcrete)
• Drilling of a horizontal forward probe hole to determine rock quality
in advance of the blast face (usually up to 20 m in length)
• Drilling of the blastholes for the next blast
The ‘ideal’ cycle time for blasting is about 12 hours allowing 2 blasts per 24
hour period however, this is dependant on several factors such as the time
taken to stabilize the excavation and equipment breakdown.
A2.17 POST BLAST SENSITIVE RECEIVER INSPECTION & MONITORING REPORT
After the all clear has been given, the Instrument Engineer will inspect the
sensitive receivers (particularly slopes) for any sign of distress/damage.
He will then recover all the monitoring instruments used for the blast and
return them to the site office for the downloading of their recordings.
Initially the Instrument Engineer will check to ensure that none of the Alert-
Alarm-Action (A-A-A) levels have been exceeded and advise the Blasting
Engineer and the RE accordingly.
Thereafter the Instrument Engineer will download the recordings from each
monitoring device and produce a Monitoring Report detailing the following
information:
• The sensitive receivers for the subject blast
• Their radial distance from the blast
• The MIC for the blast
• Their A-A-A levels
• The predicted PPV and AOP levels, and
• The actual PPV and AOP (recorded) levels.
This report is copied to the RE and Mines, and sometimes to the project
owner/sponsor if requested.

Annex B
Accident Review

A10-B1
B1 ACCIDENT REVIEW
This section presents a review of reported safety incidents involving the use of
explosives (industrial applications). Records were retrieved mainly from the
UK Health and Safety Executive (UK HSE)’s Explosives Incidents Database
Advisory Service (EIDAS), US Mine Safety and Health Administration
(MHSA) and Western Australia’s Department of Consumer and Employment
Protection (DOCEP). The records provided are also supplemented with
information obtained from various sources.
Incidents were sorted according to the following categories to highlight
causative factors to the incidents:
• Incidents involving storage of explosives
• Explosive transport incidents
• Explosive Use Incidents
The Tables 1.1, 1.2 and 1.3 of this Annex provide a summary of relevant
incidents for each of the categories above.

A10-B2
Table 1.1 Explosives Storage Related Incidents
Incident Date
Explosive Type
Event Activity Location Casualties Summary Source Notes
1944 Detonators Explosion Storage Explosive Factory, UK
Fatalities: 0 Injuries: 0
Two wooden carrying boxes containing detonators exploded in an unoccupied varnishing shop of an explosives factory. It is believed that a badly fixed notice board simply fell off the wall onto some detonators causing an explosion. No fatalities/injuries recorded in this incident
UK HSE
1949 Blasting cartridges / detonators
Explosion
Storage Demolition/ Construction Site, UK
Fatalities: 0 Injuries: 1
Blasting cartridges and detonators were left in a shed at a sand pit. There was a lighted slow combustion stove in the building. After a time the explosives ignited and detonated and one person was injured.
EIDAS, UK N1
1949 Blasting cartridges / detonators
Explosion Handling Quarry (UK) Fatalities: 1 Injuries: 0
A fatal accident occurred at a Division B Store. A shotfirer may possibly have dropped a box of explosives onto some detonators. The whole brick and reinforced concrete store was disintegrated. Minor damage occurred to property up to 1000 yards away.
EIDAS, UK N1
1956 Detonators
Explosion
Storage Storage Area, UK
Fatalities: 0 Injuries: 1
A boy aged 11 broke into an explosive store which had last been used in 1923, and the axe he was using struck a detonator which exploded causing minor injuries. A number of other detonators found after this accident were still quite serviceable.
EIDAS, UK N2
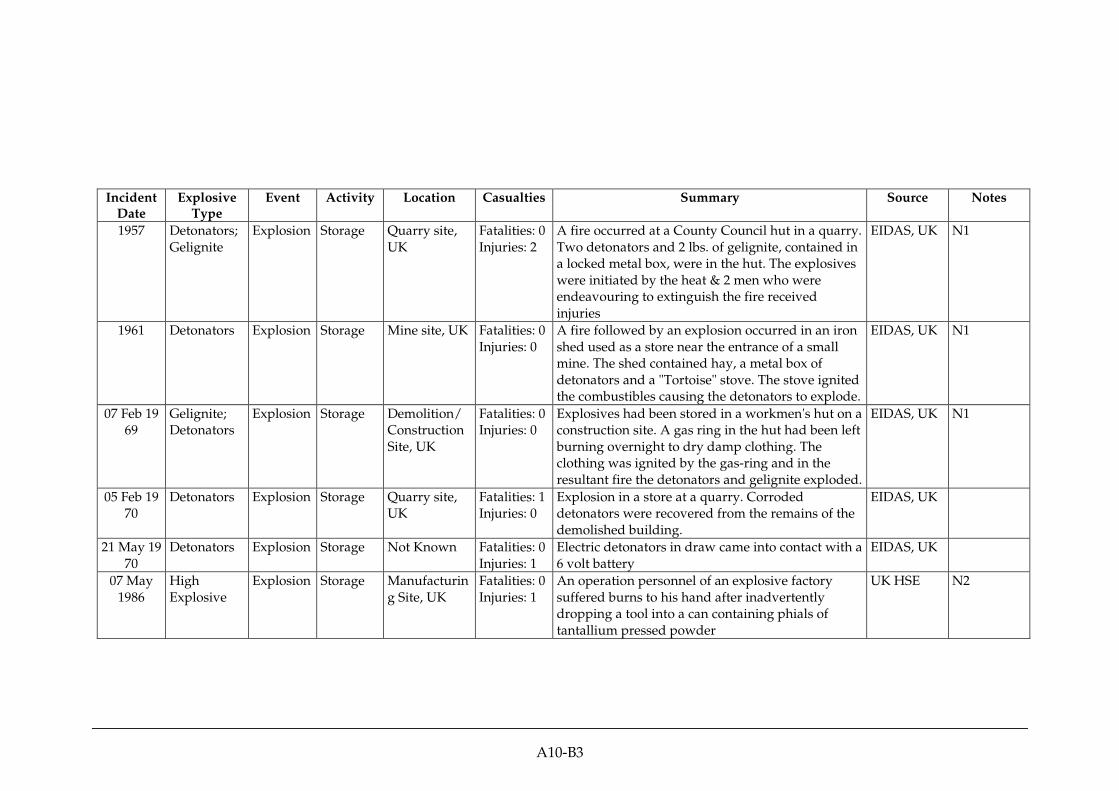
A10-B3
Incident Date
Explosive Type
Event Activity Location Casualties Summary Source Notes
1957 Detonators; Gelignite
Explosion
Storage Quarry site, UK
Fatalities: 0 Injuries: 2
A fire occurred at a County Council hut in a quarry. Two detonators and 2 lbs. of gelignite, contained in a locked metal box, were in the hut. The explosives were initiated by the heat & 2 men who were endeavouring to extinguish the fire received injuries
EIDAS, UK N1
1961 Detonators
Explosion
Storage Mine site, UK Fatalities: 0 Injuries: 0
A fire followed by an explosion occurred in an iron shed used as a store near the entrance of a small mine. The shed contained hay, a metal box of detonators and a "Tortoise" stove. The stove ignited the combustibles causing the detonators to explode.
EIDAS, UK N1
07 Feb 1969
Gelignite; Detonators
Explosion
Storage Demolition/ Construction Site, UK
Fatalities: 0 Injuries: 0
Explosives had been stored in a workmen's hut on a construction site. A gas ring in the hut had been left burning overnight to dry damp clothing. The clothing was ignited by the gas-ring and in the resultant fire the detonators and gelignite exploded.
EIDAS, UK N1
05 Feb 1970
Detonators
Explosion
Storage Quarry site, UK
Fatalities: 1 Injuries: 0
Explosion in a store at a quarry. Corroded detonators were recovered from the remains of the demolished building.
EIDAS, UK
21 May 1970
Detonators
Explosion
Storage Not Known Fatalities: 0 Injuries: 1
Electric detonators in draw came into contact with a 6 volt battery
EIDAS, UK
07 May 1986
High Explosive
Explosion Storage Manufacturing Site, UK
Fatalities: 0 Injuries: 1
An operation personnel of an explosive factory suffered burns to his hand after inadvertently dropping a tool into a can containing phials of tantallium pressed powder
UK HSE N2

A10-B4
Incident Date
Explosive Type
Event Activity Location Casualties Summary Source Notes
16 May 1995
Detonators Explosion Storage Workshop, Australia
Fatalities: 0 Injuries: 1
A man received shrapnel injuries to his chest and lost an eye when detonators located on a work bench were accidentally initiated. The man was repairing a seeding machine when a spark from a grinder ignited two cardboard boxes containing detonators. The man had used the detonators a few weeks earlier and subsequently placed them on the work bench rather than where they were normally stored.
DOCEP, Western Australia
N3
Notes:
1. This involves nitroglycerin based explosives
2. This involves manufacture of non-commercial explosives
3. This is a farming incident.

A10-B5
Table 1.2 Transport Related Incidents
Incident Date
Explosive Type
Event Activity Location Casualties Summary Source Notes
1952 High explosive
Fire Transport Road (UK) Fatalities: Unknown Injuries: Unknown
Fire broke out on non-regulation van carrying 6000lb of blasting explosives. A tarpaulin between the cab and van body was ignited by hot exhaust. There was no fire screen in front of the van body. Only two boxes of explosives were consumed in the fire.
EIDAS, UK N1
1953 Unspecified
explosives
No
Ignition
Transport Mine (UK) Fatalities: 0
Injuries: 3
Local train hit lorry containing explosives,
scattering a large quantity of the explosive along
the line. There was no ignition. Three men were
injured by the collision.
EIDAS, UK N1
1957 High
explosives
No
Ignition
Transport Road (UK) Fatalities: 0
Injuries: 0
A road vehicle carrying a full load of blasting
explosives was found to be on fire at the rear -
presumably due to a puncture in one of the rear
tyres.
EIDAS, UK N1
1958 High
explosive
No
Ignition
Transport Road (UK) Fatalities: 0
Injuries: 0
Fire broke out in engine of truck carrying 7700 lb of
blasting explosive. The fire was confined to the
front of the fire screen but was not extinguished
before severe damage had been caused to the
engine and cab.
EIDAS, UK N1
1959 Safety fuse Fire Transport Road (UK) Fatalities: 0
Injuries: 0
A vehicle carrying 400 cases of safety fuse caught
fire. The fire started in a rear twin tyred wheel.
Possible cause was a deflated tyre or brake drum
heat. Eighty two of the cases were salvaged
EIDAS, UK

A10-B6
Incident Date
Explosive Type
Event Activity Location Casualties Summary Source Notes
19 Oct 197
3
Unspecified Fire/ Explosion
Transport Demolition/
Construction
Site (UK)
Fatalities: 0
Injuries: 0
An unattended Landrover containing detonators
and explosives caught fire on a construction site
and exploded. It is thought that the fire was started
by a discarded cigarette.
EIDAS, UK N1
16 Aug 19
85
Slurry No
Ignition
Transport Manufacturin
g Site (UK)
Fatalities: 0
Injuries: 0
Fork lift truck driven over case of slurry explosive.
Case ruptured but there was no initiation.
EIDAS, UK
22 Mar 19
89
Fuseheads,
Slurry
Fire/ Explosion
Transport Road (UK) Fatalities: 1
Injuries:
107
Van carrying Powergel, Magna Primers, Ammon
Gellit, detonators and fuseheads exploded in an
industrial estate. Unsafely packaged fuseheads
ignited by impact/friction when van went over
ramp. Fire broke out and load exploded 10mins
later killing fireman.
EIDAS, UK
07 Jul 198
9
Slurry No
Ignition
Transport Road (UK) Fatalities: 0
Injuries: 0
SGV carrying 3000 detonators and 260 kg of
Powergel E80 crashed head on with another HGV.
Major incident procedure implemented - local
residents evacuated and roads closed. However on
examination, load was found to be intact.
EIDAS, UK
29 Aug
1989
Detonators No
Ignition
Transport Road
(Australia)
Fatalities: 0
Injuries:
Unknown
Explosives vehicle leaving reserve collided with
passenger which had cut corner. Explosives
unaffected
DOCEP,
Western
Australia
25 Aug
1989
ANFO-P No
Ignition
Transport Road
(Australia)
Fatalities: 0
Injuries: 2
Explosives vehicle ran off bitumen into culvert
injuring driver and co-driver and causing major
vehicle damage. Explosives unaffected
DOCEP,
Western
Australia

A10-B7
Incident Date
Explosive Type
Event Activity Location Casualties Summary Source Notes
20 Jan
1990
Ammonium
Nitrate and
Emulsion
No
Ignition
Transport Mine site
(Australia)
Fatalities: 0
Injuries: 0
Blasting agent mixing vehicle self-propelled over
bench face on mine site spilling ingredients
DOCEP,
Western
Australia
20 May
1990
Emulite
1210
No
ignition
Transport Road
(Australia)
Fatalities: 0
Injuries: 0
15 tonnes of emulsion explosives conveyed on a
dog trailer was spilt when the trailer overturned
and the container ruptured
DOCEP,
Western
Australia
10 Aug
1990
Explosives,
low
sensitivity
No
ignition
Transport Road
(Australia)
Fatalities: 0
Injuries: 0
Bulk explosives vehicle collided with roadside tree-
explosives not involved
DOCEP,
Western
Australia
18 Aug
1990
Detonators No
ignition
Transport Road (Australia)
Fatalities: 0
Injuries: 1
A station wagon conveying detonators rolled over
as the driver negotiated a compound curve.
Detonators remained intact
DOCEP,
Western
Australia
7 Sep
1990
Powergel
2500
(emulsion)
Fire Loading/Un-loading
Mine site
(Australia)
Fatalities: 0
Injuries: 0
A fire occurred on a mobile bulk explosives
pumping unit due to an electrical short circuit.
Examination of the unit revealed that the throttle
cable had worn through the plastic battery cover
and shorted out on the positive terminal causing
overheating and resultant fire. The fire damage was
limited to the battery, cables, alternator and
isolation switch and fortunately did not spread to
the load
DOCEP,
Western
Australia

A10-B8
Incident Date
Explosive Type
Event Activity Location Casualties Summary Source Notes
07 Jan 199
1
High
explosive
No
Ignition
Transport Road (UK) Fatalities: 0
Injuries: 0
Lorry carrying one ton of explosives to an open cast
coal site was involved in a collision with another
lorry. Neither driver was injured. Accident
occurred on the Guyzance bridge over the River
Coquet, near Amble, which was blocked for almost
an hour.
EIDAS, UK
23 Sep
1991
Ammonium
Nitrate
Fire Transport Mine site
(Australia)
Fatalities: 0
Injuries: 0
Exhaust leakage caused fire to cladding in the
engine compartment under the cabin of a blasting
agent mixing vehicle. The fire was quickly
extinguished by hose and caused no damage to the
vehicle beyond the insulation
DOCEP,
Western
Australia
22 May
1992
Low
sensitivity
explosives
No
ignition
Transport Road
(Australia)
Fatalities: 0
Injuries: 0
Tank seam failure due to poor road conditions
resulted in spillage of bulk emulsion explosives
DOCEP,
Western
Australia
06 June
1992
Low
sensitivity
explosives
Fire Loading/
Un-
loading
Mine site
(Australia)
Fatalities: 0
Injuries: 0
Smouldering and small flames were noticed from a
mono pump on an explosives mixing vehicle while
it was being use to load explosives. The vehicle was
being used to self load product, with the mono
pump in reverse mode as the static ground pump
had broken down. Fire extinguishers were used to
extinguish the flames prior to the vehicle being
driven away from the loading area to an isolated
location. The cause of this incident is believed to be
a valve being left open, allowing the mono pump to
draw air which resulted in it not being lubricated
by the product and thereby overheating
DOCEP,
Western
Australia
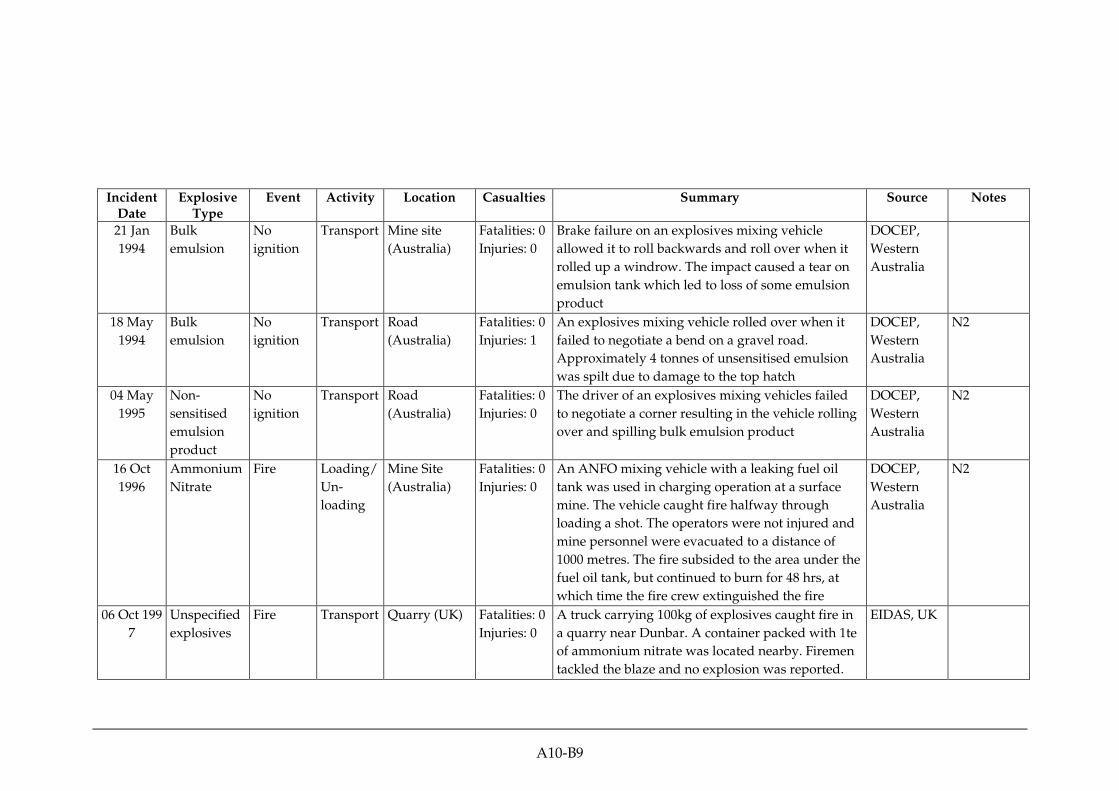
A10-B9
Incident Date
Explosive Type
Event Activity Location Casualties Summary Source Notes
21 Jan
1994
Bulk
emulsion
No
ignition
Transport Mine site
(Australia)
Fatalities: 0
Injuries: 0
Brake failure on an explosives mixing vehicle
allowed it to roll backwards and roll over when it
rolled up a windrow. The impact caused a tear on
emulsion tank which led to loss of some emulsion
product
DOCEP,
Western
Australia
18 May
1994
Bulk
emulsion
No
ignition
Transport Road
(Australia)
Fatalities: 0
Injuries: 1
An explosives mixing vehicle rolled over when it
failed to negotiate a bend on a gravel road.
Approximately 4 tonnes of unsensitised emulsion
was spilt due to damage to the top hatch
DOCEP,
Western
Australia
N2
04 May
1995
Non-
sensitised
emulsion
product
No
ignition
Transport Road
(Australia)
Fatalities: 0
Injuries: 0
The driver of an explosives mixing vehicles failed
to negotiate a corner resulting in the vehicle rolling
over and spilling bulk emulsion product
DOCEP,
Western
Australia
N2
16 Oct
1996
Ammonium
Nitrate
Fire Loading/
Un-
loading
Mine Site
(Australia)
Fatalities: 0
Injuries: 0
An ANFO mixing vehicle with a leaking fuel oil
tank was used in charging operation at a surface
mine. The vehicle caught fire halfway through
loading a shot. The operators were not injured and
mine personnel were evacuated to a distance of
1000 metres. The fire subsided to the area under the
fuel oil tank, but continued to burn for 48 hrs, at
which time the fire crew extinguished the fire
DOCEP,
Western
Australia
N2
06 Oct 199
7
Unspecified
explosives
Fire
Transport Quarry (UK) Fatalities: 0
Injuries: 0
A truck carrying 100kg of explosives caught fire in
a quarry near Dunbar. A container packed with 1te
of ammonium nitrate was located nearby. Firemen
tackled the blaze and no explosion was reported.
EIDAS, UK

A10-B10
Incident Date
Explosive Type
Event Activity Location Casualties Summary Source Notes
08 Aug
1998
Unspecified
explosives
Explosion Transport Road
(Canada)
Fatalities: 0
Injuries: 0
A truck carrying 18,000 kg of blasting explosives
caught fire. People were immediately evacuated
from the site. The truck exploded about 32 to 37
minutes later, causing minor injuries and throwing
debris 2.5km away.
NIOSH
(2008 study)
Sep 2004 Ammonium
Nitrate,
detonators,
and blasting
boosters
No
ignition
Transport Road (US) Fatalities: 0
Injuries: 0
A truck carrying ammonium nitrate and detonators
overturned in I-85. Except for minor spill, the cargo
was unaffected
NIOSH
(2008 study)
13 May
2004
Ammonium
Nitrate-
based liquid
and
detonators
No
ignition
Transport Road (US) Fatalities: 0
Injuries: 0
A truck carrying 1,360 kg of ammonium nitrate
based liquid and detonators overturned. Nearby
homes and business evacuated
NIOSH
(2008 study)
12 Sep
2005
Ammonium
nitrate
Explosion Transport Road (US) Fatalities:
12
Injuries: 43
A large explosion occurred in the village of
Shengangzhai, China. It is unclear what caused the
truck carrying 18MT of ammonium nitrate to
explode
NIOSH
(2008 study)
N3
31 May
2006
Ammonium
Nitrate,
other
explosives
No
ignition
Transport Road (US) Fatalities: 0
Injuries: 0
A truck carrying 18.2MT of ammonium nitrate ,
10,000 blasting caps and several dynamites
overturned in a highway traversing a sparsely
populated area in Utah. Authorities evacuated
homes within 3.3-km (2-mile) radius from the crash
site
NIOSH
(2008 study)
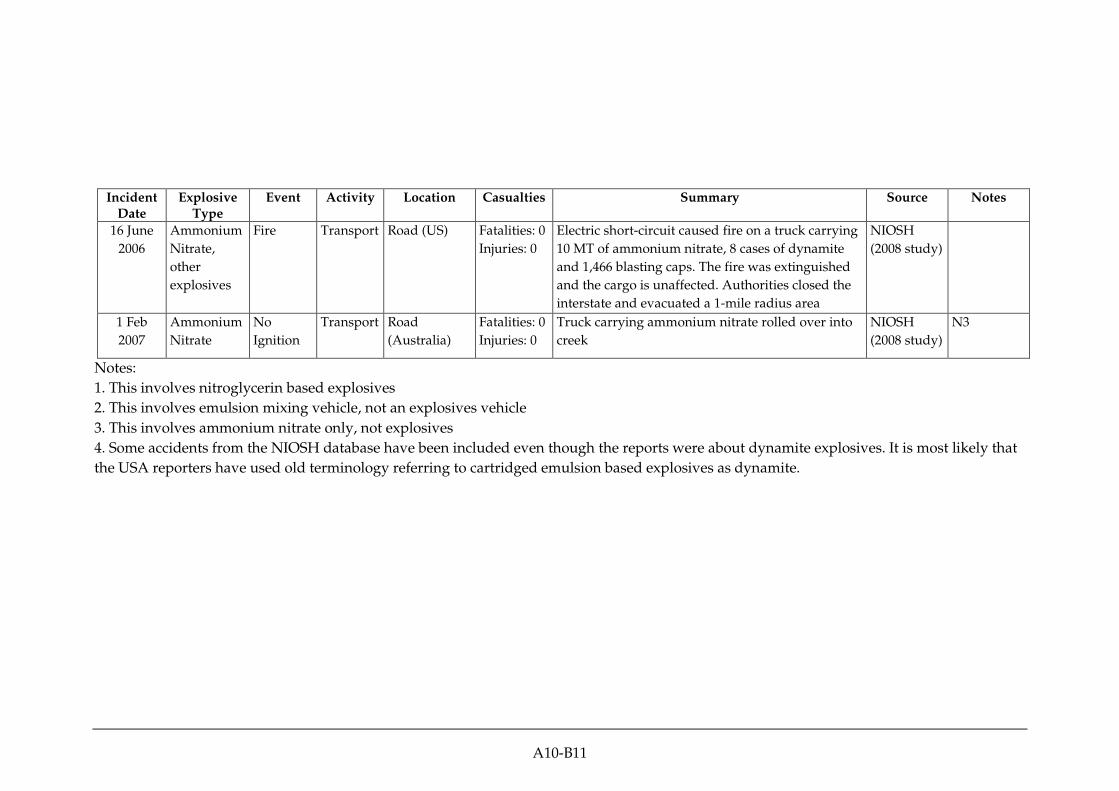
A10-B11
Incident Date
Explosive Type
Event Activity Location Casualties Summary Source Notes
16 June
2006
Ammonium
Nitrate,
other
explosives
Fire Transport Road (US) Fatalities: 0
Injuries: 0
Electric short-circuit caused fire on a truck carrying
10 MT of ammonium nitrate, 8 cases of dynamite
and 1,466 blasting caps. The fire was extinguished
and the cargo is unaffected. Authorities closed the
interstate and evacuated a 1-mile radius area
NIOSH
(2008 study)
1 Feb
2007
Ammonium
Nitrate
No
Ignition
Transport Road
(Australia)
Fatalities: 0
Injuries: 0
Truck carrying ammonium nitrate rolled over into
creek
NIOSH
(2008 study)
N3
Notes:
1. This involves nitroglycerin based explosives
2. This involves emulsion mixing vehicle, not an explosives vehicle
3. This involves ammonium nitrate only, not explosives
4. Some accidents from the NIOSH database have been included even though the reports were about dynamite explosives. It is most likely that
the USA reporters have used old terminology referring to cartridged emulsion based explosives as dynamite.
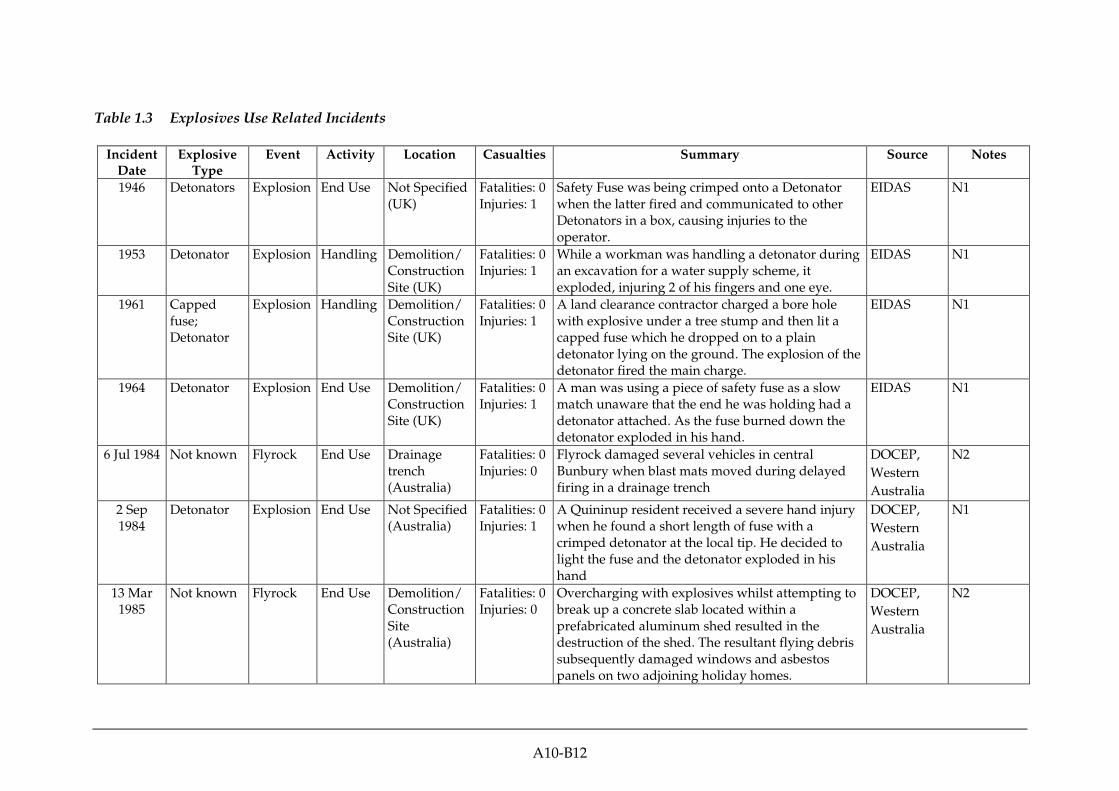
A10-B12
Table 1.3 Explosives Use Related Incidents
Incident Date
Explosive Type
Event Activity Location Casualties Summary Source Notes
1946 Detonators Explosion End Use Not Specified (UK)
Fatalities: 0 Injuries: 1
Safety Fuse was being crimped onto a Detonator when the latter fired and communicated to other Detonators in a box, causing injuries to the operator.
EIDAS N1
1953 Detonator Explosion Handling Demolition/ Construction Site (UK)
Fatalities: 0 Injuries: 1
While a workman was handling a detonator during an excavation for a water supply scheme, it exploded, injuring 2 of his fingers and one eye.
EIDAS N1
1961 Capped fuse; Detonator
Explosion Handling Demolition/ Construction Site (UK)
Fatalities: 0 Injuries: 1
A land clearance contractor charged a bore hole with explosive under a tree stump and then lit a capped fuse which he dropped on to a plain detonator lying on the ground. The explosion of the detonator fired the main charge.
EIDAS N1
1964 Detonator Explosion End Use Demolition/ Construction Site (UK)
Fatalities: 0 Injuries: 1
A man was using a piece of safety fuse as a slow match unaware that the end he was holding had a detonator attached. As the fuse burned down the detonator exploded in his hand.
EIDAS N1
6 Jul 1984 Not known Flyrock End Use Drainage trench (Australia)
Fatalities: 0 Injuries: 0
Flyrock damaged several vehicles in central Bunbury when blast mats moved during delayed firing in a drainage trench
DOCEP,
Western
Australia
N2
2 Sep 1984
Detonator Explosion End Use Not Specified (Australia)
Fatalities: 0 Injuries: 1
A Quininup resident received a severe hand injury when he found a short length of fuse with a crimped detonator at the local tip. He decided to light the fuse and the detonator exploded in his hand
DOCEP,
Western
Australia
N1
13 Mar 1985
Not known Flyrock End Use Demolition/ Construction Site (Australia)
Fatalities: 0 Injuries: 0
Overcharging with explosives whilst attempting to break up a concrete slab located within a prefabricated aluminum shed resulted in the destruction of the shed. The resultant flying debris subsequently damaged windows and asbestos panels on two adjoining holiday homes.
DOCEP,
Western
Australia
N2

A10-B13
Incident Date
Explosive Type
Event Activity Location Casualties Summary Source Notes
3 Dec 1985
Not known Explosion Drilling Not Specified (Australia)
Fatalities: 0 Injuries: 1
An Albany man sustained severe lacerations and shock when an unexploded portion of a charge exploded as he was drilling into an old drill hole
DOCEP,
Western
Australia
16 May 1989
ANFO Flyrock End Use Mine site (Australia)
Fatalities: 0 Injuries: 1
Flyrock damage and injury resulted from overcharging of a blast pattern, believed to have been caused by a lack of supervision
DOCEP,
Western
Australia
N2
5 Jul 1990 Unspecified Flyrock End Use Mine Site (US)
Fatalities: 1 Injuries: 0
A blaster standing on the top of a 200-ft highwall about 505 ft from the blast site was fatally injured by flyrock [MSHA, 1990a]. The highwall could not shield him from flyrock. The employee suffered a massive head injury. The flyrock originated from a toe blast. The toe round consisted of 23 holes ranging in depth from 3 to 5 ft. The holes were loaded with 2-1/2-in diameter packaged explosive product The blaster failed to perceive that flyrock could strike him on the top of a highwall. This accident could have been prevented by using a proper blasting shelter or “matting” the holes.
US MSHA N2
12 Oct 1990
Unspecified Flyrock End Use Mine Site (US)
Fatalities: 1 Injuries: 0
A visitor sustained severe injuries and a miner was fatally injured by flyrock in a surface silica flux mine. The mining company used a blasting contractor for loading and firing the shots. The visitor and the miner were about 150 ft from the edge of the blast. Upon firing the shot, the miner was fatally struck on the back of his head.
US MSHA N2
1 Feb 1992
Unspecified Flyrock End Use Mine Site (US)
Fatalities: 1 Injuries: 0
A blaster was fatally injured in a surface coal mine. The blaster positioned himself under a Ford 9000, 2-1/2-ton truck while firing the shot. Flyrock traveled 750 ft and fatally injured the blaster.
US MSHA N2

A10-B14
Incident Date
Explosive Type
Event Activity Location Casualties Summary Source Notes
24 Mar 1992
Unspecified Flyrock End Use Construction Site (US)
Fatalities: 1 Injuries: 0
An employee was standing next to a front-end loader when a blast was detonated. The blast consisted of 68 holes loaded with 2-in diameter by 16-in long cartridges of explosives. A dirt cover of 4- to 5-ft was used to confine the blast. The employee suffered trauma to his neck and lacerations to his face.
US OSHA N2
25 Apr 1994
Unspecified Flyrock End Use Mine Site (US)
Fatalities: 1 Injuries: 0
A driller/loader was fatally injured by flyrock in a surface coal mine [MSHA, 1994]. The blaster notified the superintendent of an impending blast and cleared other employees from the pit area. The victim and another employee working under the direction of the blaster were about 236 ft from the nearest blasthole. Upon firing the blast, the driller/loader was fatally injured by flyrock.
US MSHA N2
13 Apr
1995
Unspecified Flyrock End Use Construction Site (US)
Fatalities: 1 Injuries: 0
A blaster having 16 years experience was fatally
injured by flyrock. He loaded the blastholes and
took shelter behind a magazine of approximate size
4-ft high by 4-ft wide by 6-ft depth. Upon firing the
shot, a single piece of rock struck the blaster on the
head. He was about 150 ft from the blast site.
US OSHA N2
29 June 1995
Unspecified Flyrock End Use Mine Site (Australia)
Fatalities: 0 Injuries: 2
A receptionist received a scalp laceration and a supervisor bruised ribs when flyrock from a blast struck them. The rock passed through a window, across an empty room then through a closed door before striking the occupants of the office.
DOCEP,
Western
Australia
N2
31 Jan 1998
Unspecified Explosion End Use Mine Site (Australia)
Fatalities: 0 Injuries: 1
A two metre length of safety fuse burnt in less than five seconds resulting in a premature blast.
DOCEP,
Western
Australia
N1

A10-B15
Incident Date
Explosive Type
Event Activity Location Casualties Summary Source Notes
19 Mar 1998
Detonator Air Blast End Use Mine Site (Australia)
Fatalities: 1 Injuries: 0
A leading hand of the scaling crew was fatally injured when he was struck on the head by either the ventilation doors or a ventilation regulator. The deceased had been assisting in charging a long hole raise and had retired behind the ventilation doors in the decline prior to firing. It is believed the air blast associated with the detonation caused the doors to swing and strike him.
DOCEP,
Western
Australia
28 Mar 1998
Detonator Explosion End Use Unspecified (Australia)
Fatalities: 0 Injuries: 1
A teenage boy sustained superficial injuries to his hand and face when he accidentally initiated a detonator.
DOCEP,
Western
Australia
11 Dec 1998
Unspecified Flyrock End Use Unspecified (Australia)
Fatalities: 0 Injuries: 0
Flyrock from a blast landed on occupied residential properties however there were no injuries.
DOCEP,
Western
Australia
N2
21 Dec 1999
Unspecified Flyrock End Use Unspecified (US)
Fatalities1 Injuries: 0
An equipment operator in a pickup truck was guarding an access road to the blast site. The pickup truck was about 800 ft from the blast site. Flyrock entered the cab through the windshield and fatally struck the employee. The highwall face was about 50 ft high and the depth of holes ranged between 49 and 54 ft. The blast round consisted of 22 holes drilled on a 16- by 16-ft pattern. Some of the holes were angled up to 25º toward the highwall to compensate for irregularities in the highwall face. At least one of the holes blew out causing flyrock.
USMSHA N2

A10-B16
Incident Date
Explosive Type
Event Activity Location Casualties Summary Source Notes
15 Aug 2003
Unspecified Explosion End Use Unspecified (Australia)
Fatalities: 0 Injuries: 1
A shot-firer received a flash burn to his hand when he initiated a blast using a Cobra non-electric initiator. It is believed that the shot-firer had failed to ensure that the signal tube was fully engaged on the initiator before firing the shot. The unit was tested and returned to service.
DOCEP,
Western
Australia
Notes:
1. This involves plain detonators and safety fuse or crimping, which are not relevant to this operation
2. This involves surface blasting and flyrock, not relevant to this operation

Annex C
Population Data
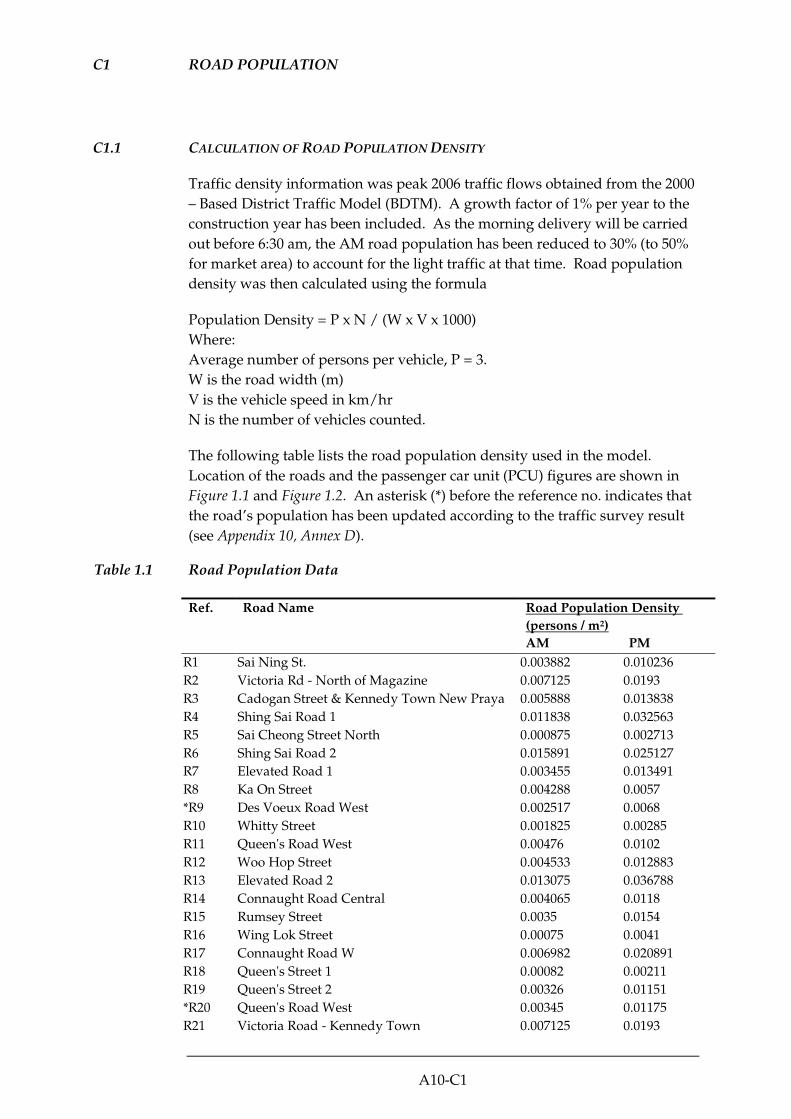
A10-C1
C1 ROAD POPULATION
C1.1 CALCULATION OF ROAD POPULATION DENSITY
Traffic density information was peak 2006 traffic flows obtained from the 2000
– Based District Traffic Model (BDTM). A growth factor of 1% per year to the
construction year has been included. As the morning delivery will be carried
out before 6:30 am, the AM road population has been reduced to 30% (to 50%
for market area) to account for the light traffic at that time. Road population
density was then calculated using the formula
Population Density = P x N / (W x V x 1000)
Where:
Average number of persons per vehicle, P = 3.
W is the road width (m)
V is the vehicle speed in km/hr
N is the number of vehicles counted.
The following table lists the road population density used in the model.
Location of the roads and the passenger car unit (PCU) figures are shown in
Figure 1.1 and Figure 1.2. An asterisk (*) before the reference no. indicates that
the road’s population has been updated according to the traffic survey result
(see Appendix 10, Annex D).
Table 1.1 Road Population Data
Ref. Road Name Road Population Density
(persons / m2)
AM PM
R1 Sai Ning St. 0.003882 0.010236
R2 Victoria Rd - North of Magazine 0.007125 0.0193
R3 Cadogan Street & Kennedy Town New Praya 0.005888 0.013838
R4 Shing Sai Road 1 0.011838 0.032563
R5 Sai Cheong Street North 0.000875 0.002713
R6 Shing Sai Road 2 0.015891 0.025127
R7 Elevated Road 1 0.003455 0.013491
R8 Ka On Street 0.004288 0.0057
*R9 Des Voeux Road West 0.002517 0.0068
R10 Whitty Street 0.001825 0.00285
R11 Queen's Road West 0.00476 0.0102
R12 Woo Hop Street 0.004533 0.012883
R13 Elevated Road 2 0.013075 0.036788
R14 Connaught Road Central 0.004065 0.0118
R15 Rumsey Street 0.0035 0.0154
R16 Wing Lok Street 0.00075 0.0041
R17 Connaught Road W 0.006982 0.020891
R18 Queen's Street 1 0.00082 0.00211
R19 Queen's Street 2 0.00326 0.01151
*R20 Queen's Road West 0.00345 0.01175
R21 Victoria Road - Kennedy Town 0.007125 0.0193

A10-C2
Ref. Road Name Road Population Density
(persons / m2)
AM PM
R22 Victoria Road – South of Magazine 0.005075 0.013575
R23 Mount Davis Road 0.001667 0.005083
R24 Pok Fu Lam Road 1 – from Mount Davis Road 0.008471 0.0226
R25 Pok Fu Lam Road 2 – from bus terminal to
point 5
0.008893 0.02415
R26 Pok Fu Lam Rosd - West of Bonham Road 0.003643 0.00985
R27 Bonham Road - West of Western St 0.007013 0.023188
R28 Bonham Road - East of Western St 0.005713 0.011338
R29 Western St 0.012567 0.016017
R30 High St 0.00165 0.004617
R31 Second St 0.0065 0.006017
R32 Eastern St 0.0059 0.0073
R33 Ka Wai Man Road 0.002063 0.010838
*R34 Catchick St 0.00225 0.006367
R35 Smithfield Rd 0.000917 0.001167

A10-C3
Figure 1.1 PCU Figures on Delivery Routes (1)

A10-C4
Figure 1.2 PCU Figures on Delivery Routes (2)

A10-C5
C2 BUILDING POPULATION
C2.1 OVERVIEW
Population data has been collected by a combination of survey, the Code of
Practice for the Provision of Means of Escape in Case of Fire, Planning
Department Zoning Plans, the census, and Centamap. Assumptions in
estimating building population are:
• Residential building: 3 persons per flat
• Commercial building: 9 m2/person with reference to the minimum
requirement as stated in Code of Practice for the Provision of Means of
Escape in Case of Fire.
• Footpath: 0.5 persons / m2 with reference to the above Code of Practice.
• Educational Institution: 500 persons per hall.
Unless it is marked as commercial, industrial, institutional, community use, a
building is assumed to be residential building.
For residential bldg, the AM population is assumed to be 100% occupancy; for
PM it is assumed to be 50% occupancy. For industrial, commercial and
community uses, the AM population is assumed to be 10% of the maximum
occupancy; for PM it is assumed to be 100% occupancy. The percentage of
occupancy at different time period assumed in the study is consistent or more
conservative than the CLP LNG receiving terminal EIA. (1)
For multi-storeys building, where information on the number of floors is
available, the population in 10 storeys of the building has been used in the
modelling for delivery points 1, 2, 4 and 7, and the population in 12 storeys of
the building has been used for delivery point 3, with the AM and PM effect
considered as above. If there is no information on the number of floors, it is
assumed that 100% population is exposed. The ‘Adjustment Population’ in
Table 2.1 indicates the population for 10 stories. A factor of 1.2 was applied to
obtain the population for 12 stories during the assessment.
The following table lists the building population in the vicinity of the delivery
routes. Locations of the buildings are shown Figure 2.1 to Figure 2.6. The
colour of the blocks in the figures has no physical significance.
(1) Castle Peak Power Company Limited (CLP), Liquefied Natural Gas (LNG) Receiving Terminal and Associated Facilities,
EIA Study Report No. EIA-125/2006, 2006

A10-C6
Table 2.1 Building Population
Adjusted
Population
No. Building
Name
Street Name Flat No. Maximum
Population
AM PM
1 Abandoned
building
410 Victoria
Road
Population
estimate based
on site visit
0 0 0
2 Caritas
Jockey Club
Hostel Mount
Davis
405 Mount
Davis Cottage
Area
Population
estimate based
on site visit,
information on
building size and
facility use
200 200 200
3 Chee Sing
Kok Social
Centre Of
The
Humanity
Life
404 Mount
Davis Cottage
Area
Population
estimate based
on site visit,
information on
building size and
facility use
200 200 200
4 Serene Court 84 Victoria
Road
232 696 696 348
5 Regent
Height
80 Victoria
Road
63 189 189 95
6 Huncliff
Court
70 Victoria
Road
38 114 114 57
7 Petrol Station Victoria Road Population
estimate based
on site visit,
information on
building size and
facility use
10 1 10
8 Kwong Ga
Factory
Building
64 Victoria
Road
Industrial (20
Storey and area =
30x20m)
2667 133 1333
9 Yiuga Factory
Building
62 Victoria
Road
Industrial (24
Storey and area =
15x20m)
1600 67 667
10 Bus Station Victoria Road Population
estimate based
on site visit,
information on
building size and
facility use
10 1 10
11 Workshop 30 Victoria
Road
Population
estimate based
on site visit,
information on
building size and
facility use
10 1 10
12 Carpark Sai See Street Population
estimate based
on site visit,
information on
building size and
facility use
10 1 3
13 Centenary
Mansion
Block 1 & 2
9 - 15 Victoria
Road
608 1824 1824 912

A10-C7
Adjusted
Population
No. Building
Name
Street Name Flat No. Maximum
Population
AM PM
14 Ka Wai Man
Road Garden
Ka Wai Man
Road
Population
estimate based
on site visit,
information on
building size and
facility use
50 50 25
14A Cadogan
Street
Tempoary
Garden
Ka Wai Man
Road
Population
estimate based
on site visit,
information on
building size and
facility use
100 100 50
15 Block 1,
Cayman Rise
29 Ka Wai Man
Road
Population
estimate based
on site visit,
information on
building size and
facility use
100 100 50
16 Block 2,
Cayman Rise
29 Ka Wai Man
Road
Population
estimate based
on site visit,
information on
building size and
facility use
100 100 50
17 Skh Lui Ming
Choi Memory
Primary
School
31 Ka Wai Man
Road
Population
estimate based
on site visit,
information on
building size and
facility use
1242 124 1242
18 Kennedy
Town Jockey
Club Clinic
45 Victoria
Road
Population
estimate based
on site visit,
information on
building size and
facility use
500 50 500
19 St Luke's
Settlement
47 Victoria
Road
Population
estimate based
on site visit,
information on
building size and
facility use
300 300 150
20 Bayanihan
Kennedy
Town Centre
55 Victoria
Road
Population
estimate based
on site visit,
information on
building size and
facility use
300 300 150
21 (Hong Kong
Institute of
Vocation
Education
(Morrison
Hill)
Kennedy
Town Centre)
12 Ka Wai Man
Road
Population
estimate based
on site visit,
information on
building size and
facility use
500 50 500

A10-C8
Adjusted
Population
No. Building
Name
Street Name Flat No. Maximum
Population
AM PM
22 Sai Wan New
Apartments
177 - 185
Belchers Street
109 327 327 164
23 Kai Yuen Lau 158 Belchers
Street
15 45 45 23
24 Kwan Yick
Building
150 - 156
Belchers Street
28 84 84 42
25 Catrick Street
Garden
Catrick Street Population
estimate based
on site visit,
information on
building size and
facility use
20 2 20
26 Cheong Kat
Mansion
98-100 Catrick
Street
66 198 198 99
27 Merton Block
3
Catrick Street Population
estimate based
on site visit,
information on
building size and
facility use
120 120 60
28 Yue On
Building
78 - 86 Catrick
Street
40 120 120 60
29 Shing Tai
Building
70-76 Catrick
Street
28 84 84 42
30 Kam Fu
Mansion
66-68 Kam Fu
Mansion
10 30 30 15
31 Chi Fung
Building
62-64 Catrick
Street
10 30 30 15
32 Kuk Fung
Building
46-60 Catrick
Street
36 108 108 54
33 44 Catrick
Street
44 Catrick
Street
5 15 15 8
34 42 Catrick
Street
42 Catrick
Street
5 15 15 8
35 Kam Fai
House
38-40 Catrick
Street
16 48 48 24
36 Shun Hing
Building
22-34 Catrick
Street
88 264 264 132
37 Tai Tak
House
19 Smithfield 7 21 21 11
38 2 Hau Wo
Street
2 Hau Wo
Street
3 9 9 5
39 4 Hau Wo
Street
4 Hau Wo
Street
2 6 6 3
40 Nam Shan
House
113-119
Belcher's Street
10 30 30 15
41 Carpark Belcher's Street Population
estimate based
on site visit,
information on
building size and
facility use
10 1 10
42 Smithfield
Court Block 1
43 Smithfield 258 774 774 387
43 Luen Tak
Apartments
45 Smithfield 147 441 441 221

A10-C9
Adjusted
Population
No. Building
Name
Street Name Flat No. Maximum
Population
AM PM
44 Smithfield
Complex
(Cooked
Food Centre)
12K Smithfield Population
estimate based
on site visit,
information on
building size and
facility use
500 50 500
45 Man Kwong
Court
12 Smithfield 110 330 330 165
46 Nan Sang
Building
86 Belcher's
Street
54 162 162 81
47 107-111
Belcher's
Street
Belcher's Street 19 57 57 29
48 Markfield
Building
8 Smithfield 150 450 450 225
49 Shanghai
Commerical
Building
47 Catrick
Street
Population
estimate based
on site visit,
information on
building size and
facility use
500 50 500
50 May Sun
Building
55-57 Catrick
Street
21 63 63 32
51 Hing Wong
Building
61 Catrick
Street
Population
estimate based
on site visit,
information on
building size and
facility use
150 150 75
52 Ka Fu
Building
Block B
63 Catrick
Street
46 138 138 69
53 Ka On
Building
Block A
65 Catrick
Street
48 144 144 72
54 Catrick Street 93 Catrick
Street
5 15 15 8
55 Catrick Street 95 Catrick
Street
5 15 15 8
56 Timely Court 99 Catrick
Street
Population
estimate based
on site visit,
information on
building size and
facility use
300 300 150
57 The Merton
Block 1 & 2
38 New Praya
Kennedy Town
Population
estimate based
on site visit,
information on
building size and
facility use
300 300 150
58 Grand
Fortune
Mansion
1-1A Davis
Street
92 276 276 138

A10-C10
Adjusted
Population
No. Building
Name
Street Name Flat No. Maximum
Population
AM PM
59 Manhattan
Heights
71-91 Catchick
Street / 31
Kennedy Town
New Praya
Population
estimate based
on site visit,
information on
building size and
facility use
300 300 150
60 Ka On
Building
Block B
27 New Praya,
Kennedy Town
48 144 144 72
61 Ka On
Building
Block A
25 New Praya,
Kennedy Town
46 138 138 69
62 Hing Wong
Building
23 New Praya,
Kennedy Town
116 348 348 174
63 May Sun
Building
7-8 New Praya,
Kennedy Town
22 66 66 33
64 Kennedy
Town Fire
Station
6 Kennedy
Town Praya
Population
estimate based
on site visit,
information on
building size and
facility use
300 300 300
65 Bus Terminus Shing Sai Road Population
estimate based
on site visit,
information on
building size and
facility use
30 3 30
66 Western
District
Public Cargo
Working
Area
Shing Sai Road Population
estimate based
on site visit,
information on
building size and
facility use
50 5 50
67 Lung Cheung
Garden
26 New Praya,
Kennedy Town
128 384 384 192
68 Block B
Belcher Court
2 Sai Cheung
Street
120 360 360 180
69 Namhung
Mansion
Block A & B
5-5H Belcher's
Street
379 1137 1137 569
70 Yick Fung
Garden Block
A
20 Praya,
Kennedy Town
120 360 360 180
71 Sun Court 3-3A Belcher's
Street
92 276 276 138
72 Carpark Praya, Kennedy
Town
Population
estimate based
on site visit,
information on
building size and
facility use
10 1 5

A10-C11
Adjusted
Population
No. Building
Name
Street Name Flat No. Maximum
Population
AM PM
73 Electricial
Sub-Station
Fung Mat Road Population
estimate based
on site visit,
information on
building size and
facility use
1 0 1
74 Tram Depot Fung Mat Road Population
estimate based
on site visit,
information on
building size and
facility use
10 1 10
75 WSD - Sai
Ying Pun
Fresh Water
Pumping
Station
Fung Mat Road Population
estimate based
on site visit,
information on
building size and
facility use
2 0 2
76 LPG Filling
Station
Fung Mat Road Population
estimate based
on site visit,
information on
building size and
facility use
3 0 3
77 Kwan Yick
Building
Phase 2 Block
A
343 Des Voeux
Road West
240 720 720 360
78 Cheung Ka
Industrial
Building
179-180
Connaught
Road West
Industrial (19
Storey and area =
27x40m)
4560 240 2400
79 Fung Yip
Building
347-349 Des
Voeux Road
West
132 396 396 198
80 Kong Chian
Tower Block
1
351 Des Voeux
Road West
92 276 276 138
81 Lun Fung
Court
363 Des Voeux
Road West
122 366 366 183
82 Des Voeux
Road West
Building
406, 406 A & B
Des Voeux
Road West
104 312 312 156
83 Whitty
Building
22-44 Whitty
Street
168 504 504 252
84 Chong Yip
Centre Block
A
402-404 Des
Voeux Road
184 552 552 276
85 Chong Yip
Centre Block
B
11-21 Whitty
Street
265 795 795 398
86 Chong Yip
Centre Block
C
423-425 Queen's
Road West
184 552 552 276

A10-C12
Adjusted
Population
No. Building
Name
Street Name Flat No. Maximum
Population
AM PM
87 Whitty Street
Substation
Whitty Street Population
estimate based
on site visit,
information on
building size and
facility use
2 0 2
88 Wing Wah
Mansion
Block G-Z
425G-425K
Queen's Road
West
445 1335 1335 668
89 Sang Cheong
Building
427-437 Queen's
Road West
64 192 192 96
90 Hang Lung
Bank Western
Branch
15 Hill Road 52 156 156 78
91 Yip Cheong
Building
4-16 Hill Road 374 1122 1122 561
92 Dragonfair
Garden Block
1
455 Queen's
Road West
112 336 336 168
93 Dragonfair
Garden Block
2
485 Queen's
Road West
108 324 324 162
94 Po Tak
Building
540-546 Queen's
Road West
53 159 159 80
95 Kwok Ga
Building
6-12 Woo Hop
Street
88 264 264 132
96 Green View
Court
14-20 Woo Hop
Street
60 180 180 90
97 Kam Ling
Count Block
A & B
1-3 Woo Hop
Street
220 660 660 330
98 Joy Fat
Mansion
522-530 Queen's
Road West
119 357 357 179
99 Luen Wah
Mansion
518-520 Queen's
Road West
55 165 165 83
100 Centuary
Harbour
View Hotel
508 Queen's
Road West
Population
estimate based
on site visit,
information on
building size and
facility use
300 300 150
101 Sun On
Building
484-496 Queen's
Road West
194 582 582 291
102 Wing Hing
House
476-482 Queen's
Road West
81 243 243 122
103 Shek Tong
Tsui Complex
470 Queen's
Road West
Population
estimate based
on site visit,
information on
building size and
facility use
300 30 300
104 Western
Court
454-456G
Queen's Road
West
160 480 480 240
105 Western
Court
450-452G
Queen's Road
West
160 480 480 240

A10-C13
Adjusted
Population
No. Building
Name
Street Name Flat No. Maximum
Population
AM PM
106 Wah Ming
Centre Block
C
394-400 Des
Voeux Road
West
84 252 252 126
107 Tung Tat
Building
390-392 Des
Voeux Road
West
39 117 117 59
108 Kam Wa
Building
382-388 Des
Voeux Road
West
84 252 252 126
109 380 Des
Voeux Road
West
380 Des Voeux
Road West
4 12 12 6
110 Grace
Mansion
374-376 Des
Voeux Road
West
69 207 207 104
111 Lucky
Building
370-372 Des
Voeux Road
West
32 96 96 48
112 Chung Ah
Mansion
352-366 Des
Voeux Road
West
139 417 417 209
113 South Lane 14 - 4 South
Lane
35 105 105 53
114 Hill Court 28 Hill Road 138 414 414 207
115 11-25 South
Lane
11-25 South
Lane
75 225 225 113
116 Nam Wah
Mansion
5-9 South Lane 52 156 156 78
117 1-3 South
Lane & 34
Hill Road
South Lane 22 66 66 33
118 Jadeview
Court
38 Hill Road 152 456 456 228
119 Nam Cheong
Building
48-52 Hill Road 92 276 276 138
120 Sik On House 54-66 Hill Road 79 237 237 119
121 Graceful
Court
27-37 Hill Road 48 144 144 72
122 Fu Yin Court 39 Hill Road Population
estimate based
on site visit,
information on
building size and
facility use
200 200 100
123 Petrol Station Pok Fu Lam
Road
Population
estimate based
on site visit,
information on
building size and
facility use
10 1 10
124 Petrol Station Pok Fu Lam
Road
Population
estimate based
on site visit,
information on
building size and
facility use
10 1 10

A10-C14
Adjusted
Population
No. Building
Name
Street Name Flat No. Maximum
Population
AM PM
125 Bus Terminus Pok Fu Lam
Road
Population
estimate based
on site visit,
information on
building size and
facility use
30 3 30
126 Academic
Terrace Block
1
101 Pok Fu Lam
Road
216 648 648 324
127 Switching
Station
97 Pok Fu Lam
Road
Population
estimate based
on site visit,
information on
building size and
facility use
2 0 2
128 Pok Fu Lam
Zone
Substation
95 Pok Fu Lam
Road
Population
estimate based
on site visit,
information on
building size and
facility use
2 0 2
129 Starr Hall,
The
University of
Hong Kong
91B Pok Fu Lam
Road
Population
estimate based
on site visit,
information on
building size and
facility use
300 300 150
130 Lady Ho
Tung Hall,
The
University of
Hong Kong
91A Pok Fu
Lam Road
Population
estimate based
on site visit,
information on
building size and
facility use
300 300 150
131 Tower 3, The
Belcher's
89 Pok Fu Lam
Road
Population
estimate based
on site visit,
information on
building size and
facility use
700 700 350
132 University of
Hong Kong -
Yam Pak
Building
79C Pok Fu
Lam Road
Population
estimate based
on site visit,
information on
building size and
facility use
300 300 150
133 Chiu Sheung
School, Hong
Kong
79B Pok Fu Lam
Road
Population
estimate based
on site visit,
information on
building size and
facility use
300 30 300
134 Bauhnia 79 Pok Fu Lam
Road
9 27 27 14
135 Bowie Court 77 Pok Fu Lam
Road
27 81 81 41
136 Fairview
Court
75 Pok Fu Lam
Road
48 144 144 72

A10-C15
Adjusted
Population
No. Building
Name
Street Name Flat No. Maximum
Population
AM PM
137 Charmview
Court
73 Pok Fu Lam
Road
48 144 144 72
138 Tsui On
Court
71 Pok Fu Lam
Road
48 144 144 72
139 93-99 Hill
Road
93-99 Hill Road 10 30 30 15
140 Good Luck
Mansion
10 Hill Road 6 18 18 9
141 Salesians Of
Don Bosco
Provincial
Office / St.
Anthony's
House
69B Pok Fu Lam
Road
Population
estimate based
on site visit,
information on
building size and
facility use
200 20 200
142 University of
Hong Kong -
Hsu Long
Sing
Amenities
Centre
Pok Fu Lam
Road
Population
estimate based
on site visit,
information on
building size and
facility use
200 20 200
143 Podium Pok Fu Lam
Road
Population
estimate based
on site visit,
information on
building size and
facility use
150 15 150
144 University of
Hong Kong -
The Kadoorie
Biological
Science
Building
Pok Fu Lam
Road
Population
estimate based
on site visit,
information on
building size and
facility use
200 20 200
145 University of
Hong Kong -
Pao Siu
Loong
Building
Bonham Road Population
estimate based
on site visit,
information on
building size and
facility use
200 20 200
146 University of
Hong Kong -
Hung Hing
Ying Building
Bonham Road Population
estimate based
on site visit,
information on
building size and
facility use
200 20 200
147 Kingsfield
Tower Block
A & B
64-68 Bonham
Road
Population
estimate based
on site visit,
information on
building size and
facility use
1000 1000 500
148 St Stephen's
Church
Primary
School
71 Bonham
Road
Population
estimate based
on site visit,
information on
building size and
facility use
500 50 500
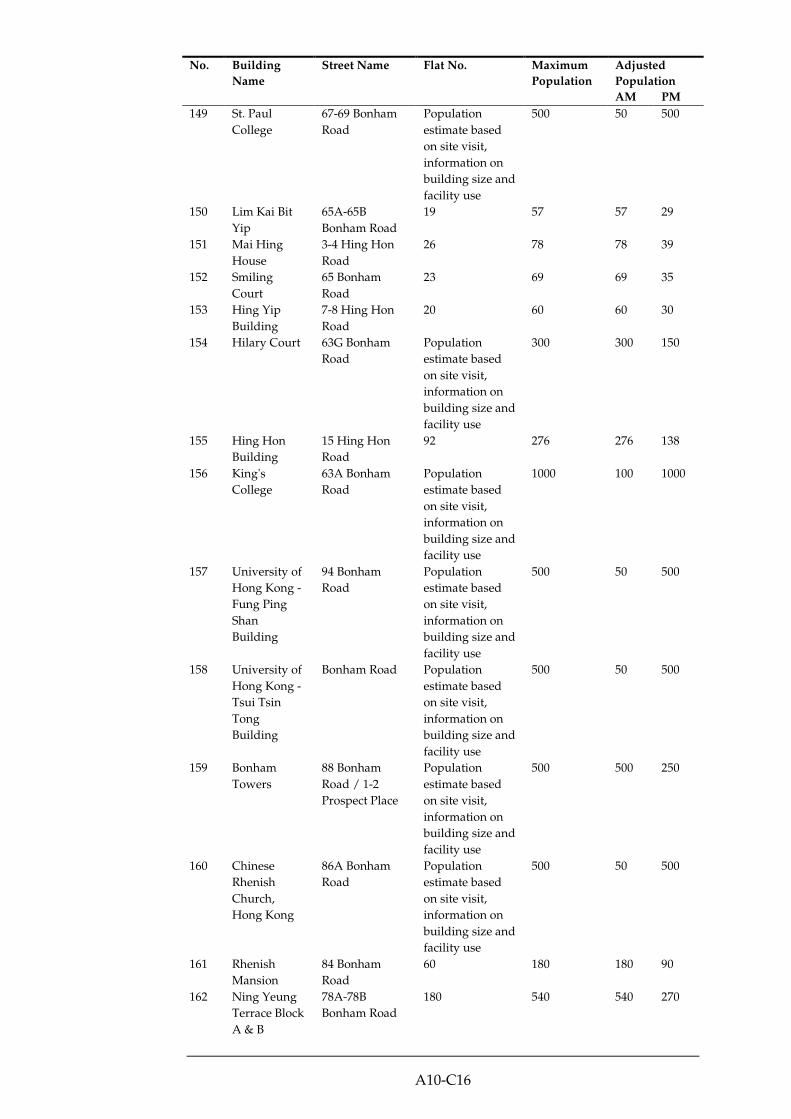
A10-C16
Adjusted
Population
No. Building
Name
Street Name Flat No. Maximum
Population
AM PM
149 St. Paul
College
67-69 Bonham
Road
Population
estimate based
on site visit,
information on
building size and
facility use
500 50 500
150 Lim Kai Bit
Yip
65A-65B
Bonham Road
19 57 57 29
151 Mai Hing
House
3-4 Hing Hon
Road
26 78 78 39
152 Smiling
Court
65 Bonham
Road
23 69 69 35
153 Hing Yip
Building
7-8 Hing Hon
Road
20 60 60 30
154 Hilary Court 63G Bonham
Road
Population
estimate based
on site visit,
information on
building size and
facility use
300 300 150
155 Hing Hon
Building
15 Hing Hon
Road
92 276 276 138
156 King's
College
63A Bonham
Road
Population
estimate based
on site visit,
information on
building size and
facility use
1000 100 1000
157 University of
Hong Kong -
Fung Ping
Shan
Building
94 Bonham
Road
Population
estimate based
on site visit,
information on
building size and
facility use
500 50 500
158 University of
Hong Kong -
Tsui Tsin
Tong
Building
Bonham Road Population
estimate based
on site visit,
information on
building size and
facility use
500 50 500
159 Bonham
Towers
88 Bonham
Road / 1-2
Prospect Place
Population
estimate based
on site visit,
information on
building size and
facility use
500 500 250
160 Chinese
Rhenish
Church,
Hong Kong
86A Bonham
Road
Population
estimate based
on site visit,
information on
building size and
facility use
500 50 500
161 Rhenish
Mansion
84 Bonham
Road
60 180 180 90
162 Ning Yeung
Terrace Block
A & B
78A-78B
Bonham Road
180 540 540 270
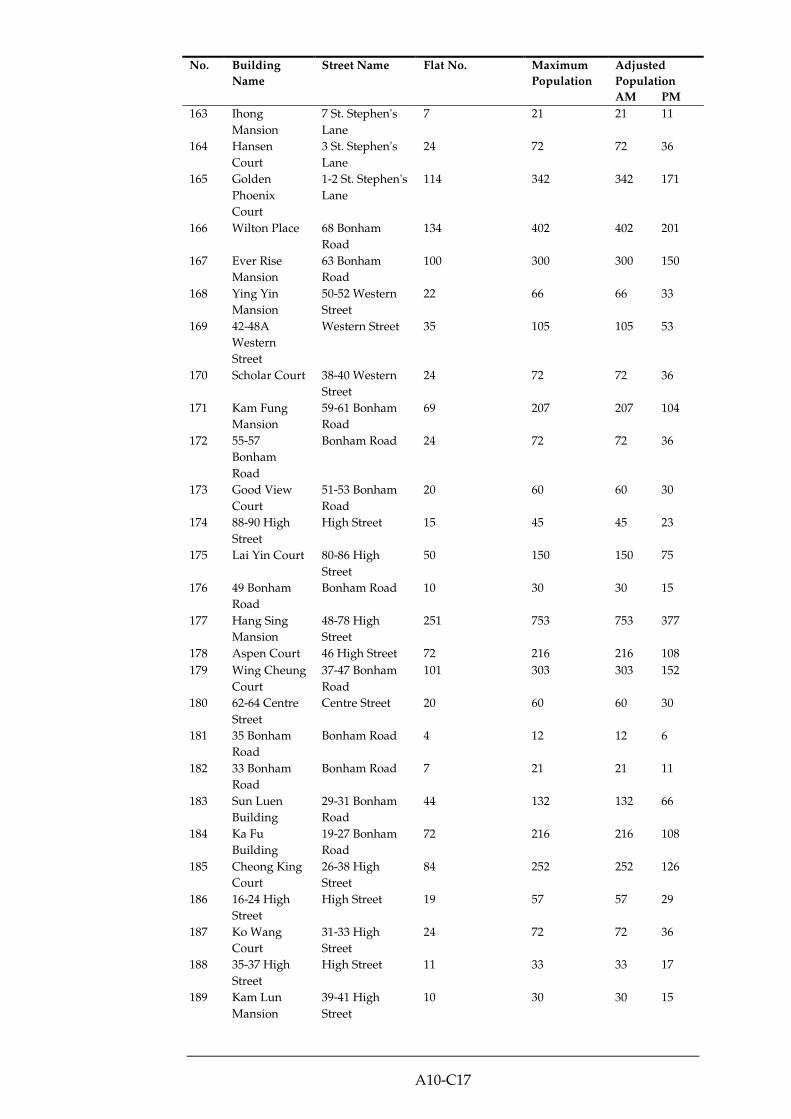
A10-C17
Adjusted
Population
No. Building
Name
Street Name Flat No. Maximum
Population
AM PM
163 Ihong
Mansion
7 St. Stephen's
Lane
7 21 21 11
164 Hansen
Court
3 St. Stephen's
Lane
24 72 72 36
165 Golden
Phoenix
Court
1-2 St. Stephen's
Lane
114 342 342 171
166 Wilton Place 68 Bonham
Road
134 402 402 201
167 Ever Rise
Mansion
63 Bonham
Road
100 300 300 150
168 Ying Yin
Mansion
50-52 Western
Street
22 66 66 33
169 42-48A
Western
Street
Western Street 35 105 105 53
170 Scholar Court 38-40 Western
Street
24 72 72 36
171 Kam Fung
Mansion
59-61 Bonham
Road
69 207 207 104
172 55-57
Bonham
Road
Bonham Road 24 72 72 36
173 Good View
Court
51-53 Bonham
Road
20 60 60 30
174 88-90 High
Street
High Street 15 45 45 23
175 Lai Yin Court 80-86 High
Street
50 150 150 75
176 49 Bonham
Road
Bonham Road 10 30 30 15
177 Hang Sing
Mansion
48-78 High
Street
251 753 753 377
178 Aspen Court 46 High Street 72 216 216 108
179 Wing Cheung
Court
37-47 Bonham
Road
101 303 303 152
180 62-64 Centre
Street
Centre Street 20 60 60 30
181 35 Bonham
Road
Bonham Road 4 12 12 6
182 33 Bonham
Road
Bonham Road 7 21 21 11
183 Sun Luen
Building
29-31 Bonham
Road
44 132 132 66
184 Ka Fu
Building
19-27 Bonham
Road
72 216 216 108
185 Cheong King
Court
26-38 High
Street
84 252 252 126
186 16-24 High
Street
High Street 19 57 57 29
187 Ko Wang
Court
31-33 High
Street
24 72 72 36
188 35-37 High
Street
High Street 11 33 33 17
189 Kam Lun
Mansion
39-41 High
Street
10 30 30 15

A10-C18
Adjusted
Population
No. Building
Name
Street Name Flat No. Maximum
Population
AM PM
190 43-49 High
Street
High Street 20 60 60 30
191 Wealth
Building
53-65 High
Street
90 270 270 135
192 Yin Tak
Building
69-73 High
Street
18 54 54 27
193 Highlight
House
75-79 High
Street
15 45 45 23
194 Lechler Court 97 High Street 80 240 240 120
195 Zion Court 95A-95B High
Street
10 30 30 15
196 81-95 High
Street
High Street 15 45 45 23
197 Kau Yan
Tsung Tsin
Church
97A High Street Population
estimate based
on site visit,
information on
building size and
facility use
100 10 100
198 Western
District
Community
Centre
105 Third Street
/ 36A Western
Street
Population
estimate based
on site visit,
information on
building size and
facility use
100 10 100
199 Yee Fung
Court
101 Third Street 200 600 600 300
200 Yue Sun
Mansion
89-99 Third
Street
98 294 294 147
201 Yee Sun
Mansion
58-66 Second
Street
66 198 198 99
202 48-58 Second
Street
Second Street 19 57 57 29
203 1-7 Tak Sing
Lane
Tak Sing Lane 18 54 54 27
204 1-2, 7-21 Yu
Lok Lane
Yu Lok Lane 32 96 96 48
205 Rest Area Second Street Population
estimate based
on site visit,
information on
building size and
facility use
10 1 10
206 Sui Wah
House
92-98 High
Street & 39-45
Western Street
52 156 156 78
207 31-37
Western
Street
Western Street 20 60 60 30
208 Wing Cheung
Building
19-29 Western
Street
90 270 270 135
209 5-17 Western
Street
Western Street 36 108 108 54
210 96-100
Second Street
Second Street 13 39 39 20
211 102-108
Second Street
Second Street 20 60 60 30

A10-C19
Adjusted
Population
No. Building
Name
Street Name Flat No. Maximum
Population
AM PM
212 Wing Fong
Mansion
107-117 Second
Street
49 147 147 74
213 30-36
Western
Street
Western Street 20 60 60 30
214 Western
Garden
Evergreen
Tower
83 Second Street 216 648 648 324
215 Western
Garden Ivy
Tower
83 Second Street 216 648 648 324
216 Centre Street
Market
44 Centre Street Population
estimate based
on site visit,
information on
building size and
facility use
100 10 100
217 Sai Ying Pun
Market
43-47 Centre
Street
Population
estimate based
on site visit,
information on
building size and
facility use
100 10 100
218 14-32 Second
Street
Second Street 31 93 93 47
219 Tong Nam
Mansion
43-47 Third
Street
120 360 360 180
220 2-10 Second
Street
Second Street 37 111 111 56
221 25-31 Eastern
Street
Eastern Street 20 60 60 30
222 Elite Court 33 Centre Street Population
estimate based
on site visit,
information on
building size and
facility use
350 350 175
223 Tung Cheung
Building
1-11 Second
Street
104 312 312 156
224 Hing Yip
Building
5-23 First Street 44 132 132 66
225 Good Times
Building
230-236 Queen's
Road West
46 138 138 69
226 226-228
Queen's Road
West
Queen's Road
West
15 45 45 23
227 Wing Yin
Building
245-247 Queen's
Road West
Commercial - No
info on no. of
storey ( Area =10
x 18m)
1000 100 1000
228 Nil 239-243 Queen's
Road West
15 45 45 23
229 Nil 235-237 Queen's
Road West
9 27 27 14
230 Nil 227-233 Queen's
Road West
15 45 45 23
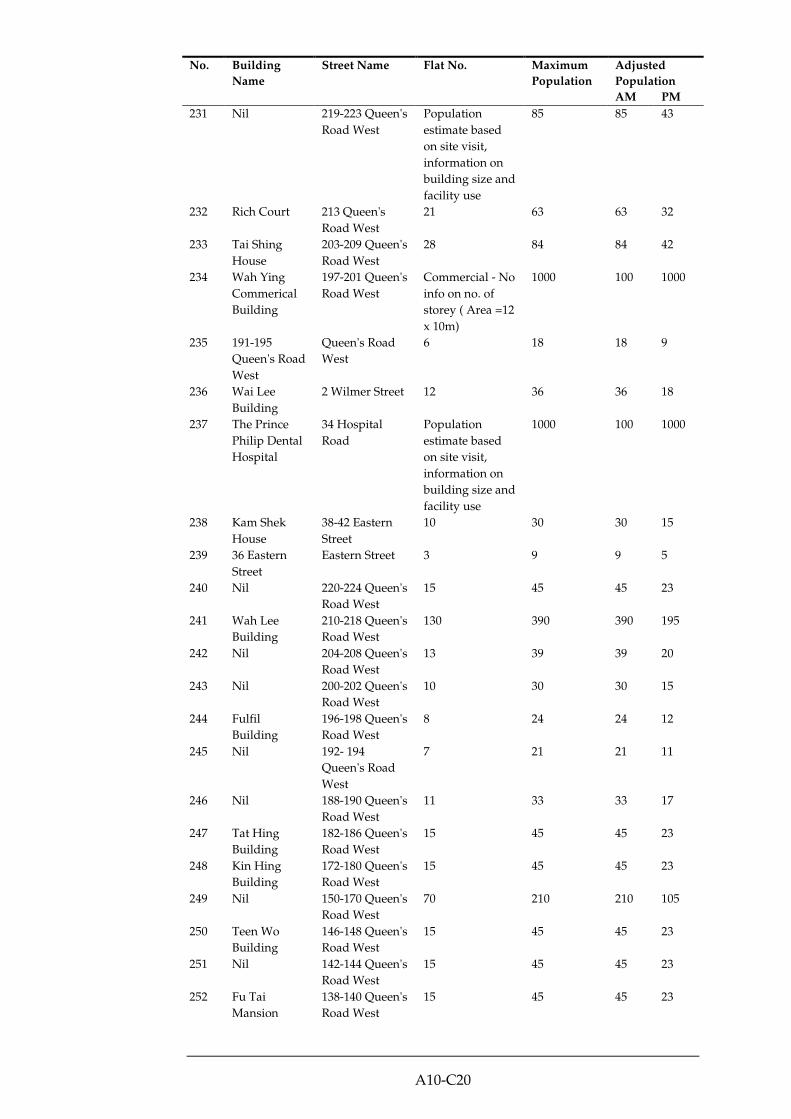
A10-C20
Adjusted
Population
No. Building
Name
Street Name Flat No. Maximum
Population
AM PM
231 Nil 219-223 Queen's
Road West
Population
estimate based
on site visit,
information on
building size and
facility use
85 85 43
232 Rich Court 213 Queen's
Road West
21 63 63 32
233 Tai Shing
House
203-209 Queen's
Road West
28 84 84 42
234 Wah Ying
Commerical
Building
197-201 Queen's
Road West
Commercial - No
info on no. of
storey ( Area =12
x 10m)
1000 100 1000
235 191-195
Queen's Road
West
Queen's Road
West
6 18 18 9
236 Wai Lee
Building
2 Wilmer Street 12 36 36 18
237 The Prince
Philip Dental
Hospital
34 Hospital
Road
Population
estimate based
on site visit,
information on
building size and
facility use
1000 100 1000
238 Kam Shek
House
38-42 Eastern
Street
10 30 30 15
239 36 Eastern
Street
Eastern Street 3 9 9 5
240 Nil 220-224 Queen's
Road West
15 45 45 23
241 Wah Lee
Building
210-218 Queen's
Road West
130 390 390 195
242 Nil 204-208 Queen's
Road West
13 39 39 20
243 Nil 200-202 Queen's
Road West
10 30 30 15
244 Fulfil
Building
196-198 Queen's
Road West
8 24 24 12
245 Nil 192- 194
Queen's Road
West
7 21 21 11
246 Nil 188-190 Queen's
Road West
11 33 33 17
247 Tat Hing
Building
182-186 Queen's
Road West
15 45 45 23
248 Kin Hing
Building
172-180 Queen's
Road West
15 45 45 23
249 Nil 150-170 Queen's
Road West
70 210 210 105
250 Teen Wo
Building
146-148 Queen's
Road West
15 45 45 23
251 Nil 142-144 Queen's
Road West
15 45 45 23
252 Fu Tai
Mansion
138-140 Queen's
Road West
15 45 45 23

A10-C21
Adjusted
Population
No. Building
Name
Street Name Flat No. Maximum
Population
AM PM
253 Nil 136 Queen's
Road West
5 15 15 8
254 Nil 183-189A
Queen's Road
West
23 69 69 35
255 Nil 167-181 Queen's
Road West
38 114 114 57
256 Nil 163-165 Queen's
Road West
10 30 30 15
257 Wo Fu
Building
159-161 Queen's
Road West
10 30 30 15
258 Nil 153-157 Queen's
Road West
8 24 24 12
259 Wing Cheung
Building
141-151 Queen's
Road West
30 90 90 45
260 Nil 135-139 Queen's
Road West
15 45 45 23
261 Nil 129-133 Queen's
Road West
10 30 30 15
262 Hua Chang
Commercial
Building
123 Queen's
Road West
Commercial (
G/F to 22/F and
area = 15x10m)
367 17 167
263 Kam Yu
Mansion
8 Kom U Street 108 324 324 162
264 Kiu Fat
Building
117 Queen's
Road West
Commercial ( No
info on No. of
Storey and area =
20x60m)
1000 100 1000
265 Hua Fu
Commercial
Building
111 Queen's
Road West
Commercial (
upto 16/F and
area = 22x15m)
587 37 367
266 Hollywood
Centre
77-91 Queen's
Road West
Commercial (
G/F to 20/F and
area = 25x15m)
833 42 417
267 Marco
Garden
128 Queen's
Road West
96 288 288 144
268 Construction
works in
Progress
118-122 Queen's
Road West
Population
estimate based
on site visit,
information on
building size and
facility use
50 5 50
269 Nil 108-116 Queen's
Road West
21 63 63 32
270 Chartered
Bank
Building
102-106 Queen's
Road West
Commercial (
upto 12/F and
area = 12x15m)
240 20 200
271 Nil 94-100 Queen's
Road West
20 60 60 30
272 Tung Hing
Court
88 Queen's
Road West
Commercial (
upto 22/F and
area = 26x15m)
953 43 433
273 Nil 250-258
Hollywood
Road
20 60 60 30

A10-C22
Adjusted
Population
No. Building
Name
Street Name Flat No. Maximum
Population
AM PM
274 Nil 248 Hollywood
Road
Commercial (
upto 4/F and
area = 20x15m)
133 13 133
275 Nil 236-244
Hollywood
Road
25 75 75 38
276 Ko Shing
Building
265-267
Hollywood
Road / 78-80
Queen's Road
West
29 87 87 44
277 Nil 58-76 Queen's
Road West
43 129 129 65
278 Lai Yan Lau 42-56 Queen's
Road West
100 300 300 150
279 Tower 3, The
Belcher's
Queen Road Population
estimate based
on site visit,
information on
building size and
facility use
700 700 350
280 Tower 1, The
Belcher's
Queen Road Population
estimate based
on site visit,
information on
building size and
facility use
700 700 350
281 Cooked Food
Market
Queen Road Population
estimate based
on site visit,
information on
building size and
facility use
300 300 150
282 Yien Yieh
Bank Western
Branch
32-36 Des
Voeux Road
West
Commercial (
upto 14/F and
area = 16x20m)
498 36 356
283 Wong House 26-30 Des
Voeux Road
West
Commercial (
upto 13/F and
area = 14x25m)
506 39 389
284 Western
Centre
48 Des Voeux
Road West
Commercial (
upto 21/F and
area =
30x30/2m)
1050 50 500
285 Nil 22-24 Des
Voeux Road
West
6 18 18 9
286 Golden
Crown
Building
18-20 Des
Voeux Road
West
Commercial (
upto 15/F and
area = 12x10m)
200 13 133
287 Hang Wo
Building
72-74 Bonham
Strand West
Commercial (
upto 9/F and
area = 25x12m)
300 33 333
288 Shun Kwong
Commercial
Building
8 Des Voeux
Road West
Commercial (
upto 17/F and
area = 30x10m)
567 33 333
289 Nil 25 Des Voeux
Building
31 93 93 47
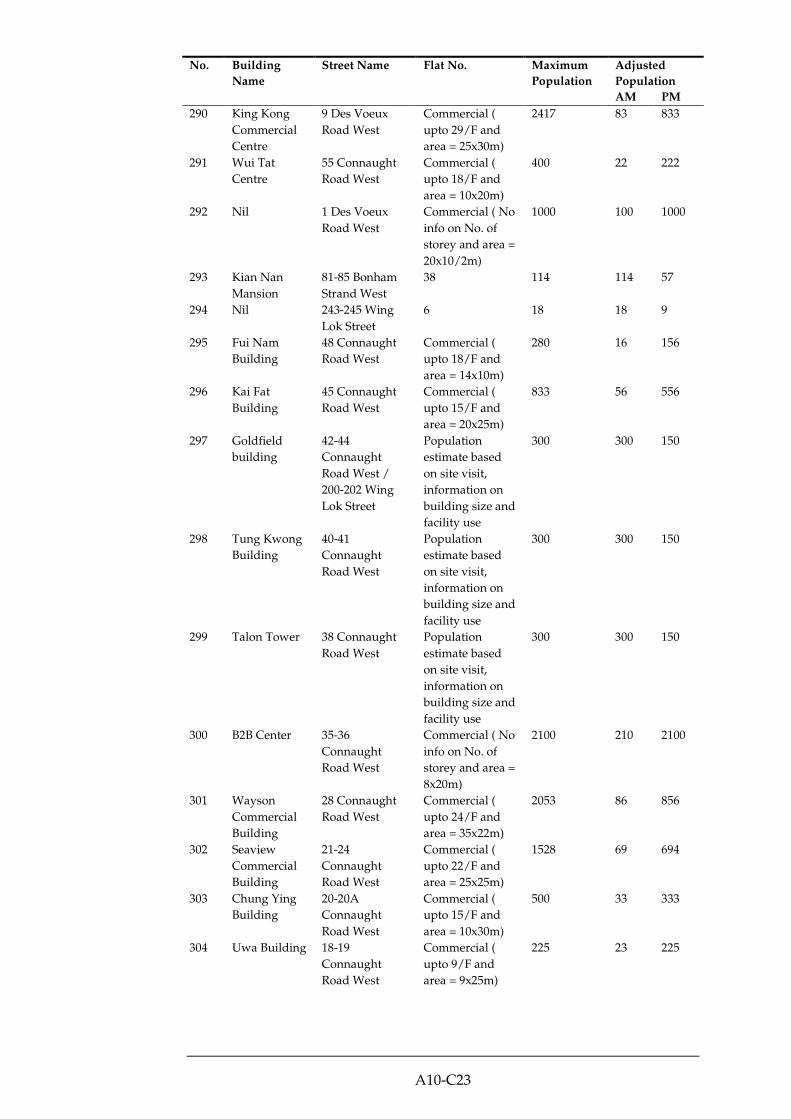
A10-C23
Adjusted
Population
No. Building
Name
Street Name Flat No. Maximum
Population
AM PM
290 King Kong
Commercial
Centre
9 Des Voeux
Road West
Commercial (
upto 29/F and
area = 25x30m)
2417 83 833
291 Wui Tat
Centre
55 Connaught
Road West
Commercial (
upto 18/F and
area = 10x20m)
400 22 222
292 Nil 1 Des Voeux
Road West
Commercial ( No
info on No. of
storey and area =
20x10/2m)
1000 100 1000
293 Kian Nan
Mansion
81-85 Bonham
Strand West
38 114 114 57
294 Nil 243-245 Wing
Lok Street
6 18 18 9
295 Fui Nam
Building
48 Connaught
Road West
Commercial (
upto 18/F and
area = 14x10m)
280 16 156
296 Kai Fat
Building
45 Connaught
Road West
Commercial (
upto 15/F and
area = 20x25m)
833 56 556
297 Goldfield
building
42-44
Connaught
Road West /
200-202 Wing
Lok Street
Population
estimate based
on site visit,
information on
building size and
facility use
300 300 150
298 Tung Kwong
Building
40-41
Connaught
Road West
Population
estimate based
on site visit,
information on
building size and
facility use
300 300 150
299 Talon Tower 38 Connaught
Road West
Population
estimate based
on site visit,
information on
building size and
facility use
300 300 150
300 B2B Center 35-36
Connaught
Road West
Commercial ( No
info on No. of
storey and area =
8x20m)
2100 210 2100
301 Wayson
Commercial
Building
28 Connaught
Road West
Commercial (
upto 24/F and
area = 35x22m)
2053 86 856
302 Seaview
Commercial
Building
21-24
Connaught
Road West
Commercial (
upto 22/F and
area = 25x25m)
1528 69 694
303 Chung Ying
Building
20-20A
Connaught
Road West
Commercial (
upto 15/F and
area = 10x30m)
500 33 333
304 Uwa Building 18-19
Connaught
Road West
Commercial (
upto 9/F and
area = 9x25m)
225 23 225

A10-C24
Adjusted
Population
No. Building
Name
Street Name Flat No. Maximum
Population
AM PM
305 Nil 17 Connaught
Road West/ 33
New Market
Street
Population
estimate based
on site visit,
information on
building size and
facility use
300 300 150
306 China
Merchants
Commercial
Building
15-16
Connaught
Road West /
29-31 New
Market Street
Commercial ( No
info on No. of
Storey and area =
10x25m)
1000 100 1000
307 Ka On
Building
8-14 Connaught
Road West
89 267 267 134
308 Nil 7 Connaught
Road West
Population
estimate based
on site visit,
information on
building size and
facility use
300 300 150
309 Yardley
Commercial
Building
3 Connaught
Road West
Commercial (
upto 23/F and
area = 25x30m)
1917 83 833
310 Western
Market
323 Des Voeux
Road Central
Commercial ( No
info on No. of
Storey and area =
25x45m)
1000 100 1000
311 Kai Tak
Commercial
Building
317-319 Des
Voeux Road
Central
Commercial (
upto 21/F and
area = 14x25m)
817 39 389
312 Hoi Kiu
Commercial
Building
158 Connaught
Road Central
Commercial (
upto 18/F and
area = 16x25m)
800 44 444
313 Ing Tower 308-320 Des
Voeux Road
Central
Commercial (
upto 28/F and
area = 24x30m)
2240 80 800
314 Hong Kong
Telcom CSL
Tower
322 Des Voeux
Road Central
Population
estimate based
on site visit,
information on
building size and
facility use
300 30 300
315 Yue's House 304-306 Des
Voeux Road
Central
Commercial (
upto 9/F and
area = 10x30m)
300 30 300
316 Wah Kit
Commercial
Centre
302 Des Voeux
Road Central
Commercial (
upto 20/F and
area = 10x30m)
667 33 333
317 Chun Yin
House
298 Des Voeux
Road Central
Commercial ( No
info on No. of
Storey and area =
8x30m)
950 95 950
318 Eton Building 288 Des Voeux
Road Central
Commercial (
upto 24/F and
area = 26x14m)
971 40 404
319 Foo Cheong
Building
82-86 Wing Lok
Street
Commercial (
upto 10/F and
area = 12x14m)
187 19 187

A10-C25
Adjusted
Population
No. Building
Name
Street Name Flat No. Maximum
Population
AM PM
320 Nil 78-80 Wing Lok
Street
Population
estimate based
on site visit,
information on
building size and
facility use
300 300 150
321 Winning
House
72-76 Wing Lok
Street
Population
estimate based
on site visit,
information on
building size and
facility use
300 300 150
322 Hing Yip
Commercial
Building
280 Des Voeux
Road Central
Commercial (
upto 23/F and
area = 26x11m)
731 32 318
323 Central
Pointa
68-70 Wing Lok
Street
Population
estimate based
on site visit,
information on
building size and
facility use
300 300 150
324 Cheong Tai
Commercial
Building
60-66 Wing Lok
Street
Commercial (
upto 12/F and
area = 16x14m)
299 25 249
325 Cheong Fat
House
56-58 Wing Lok
Street
Commercial (
upto 4/F and
area = 8x12m)
43 4 43
326 Nil 52-54 Wing Lok
Street
8 24 24 12
327 Nil 46-50 Wing Lok
Street
Population
estimate based
on site visit,
information on
building size and
facility use
450 450 225
328 Hillier
Commercial
Building
89-91 Wing Lok
Street
Commercial ( 1
to 19/F)
422 22 222
329 Nil 69 Bonham
Strand
Population
estimate based
on site visit,
information on
building size and
facility use
550 550 275
330 New Victory
House
93-103 Wing
Lok Street
Commercial ( 2
to 18/F)
576 34 339
331 Nil 77 Bonham
Strand West
Commercial ( 1
to 5/F)
53 5 53
332 Travel Way
Building
105-107 Wing
Lok Street
Population
estimate based
on site visit,
information on
building size and
facility use
500 500 250
333 Bonham
Centre
79-85 Bonham
Strand
Commercial ( 4
to 17/F)
604 43 432

A10-C26
Adjusted
Population
No. Building
Name
Street Name Flat No. Maximum
Population
AM PM
334 Nil 109-111 Wing
Lok Street
4 12 12 6
335 Nil 113-119 Wing
Lok Street
Population
estimate based
on site visit,
information on
building size and
facility use
300 300 150
336 Nil 87 Bonham
Strand East
Population
estimate based
on site visit,
information on
building size and
facility use
300 300 150
337 Man Lok
Building
89 Bonham
Strand East
Commercial ( 2
to 13/F)
243 20 202
338 North East
Commercial
Building
95 Bonham
Strand East
Commercial ( 1
to 5/F)
33 3 33
339 Wing Tat
Commercial
Building
121 Wing Lok
Street
Commercial ( 2
to 14/F)
261 20 201
340 Nil 97 99 Bonham
Strand
Population
estimate based
on site visit,
information on
building size and
facility use
300 300 150
341 Lee Man
Commercial
Building
105 Bonham
Strand East
Commercial
(Ground to 12/F)
187 16 156
342 Fu Lok
Building
131-133 Wing
Lok Street
Commercial (
upto 6/F only)
75 7 75
343 Kai Wah
Building
135-137 Wing
Lok Street
1 3 3 2
344 Wing Hing
Commercial
Building
139 Wing Lok
Street
Commercial (1/F
to 25/F)
467 19 187
345 Nil 145 Wing Lok
Street
Population
estimate based
on site visit,
information on
building size and
facility use
450 450 225
346 Harmony
Court
127 Bonham
Strand
50 150 150 75
347 Nil 113-123
Bonham Strand
26 78 78 39
348 Tung Hip
Commercial
Building
244-248 Des
Voeux Road
Central
Commercial
Area = 462sqm
(No info on no.
of floor)
300 300 150
349 Tung Shing
Commercial
Building
34 Wing Lok
Street
Commercial (2/F
to 20/F)
560 29 295

A10-C27
Adjusted
Population
No. Building
Name
Street Name Flat No. Maximum
Population
AM PM
350 Yien Yieh
Bank
Building
238-242 Des
Voeux Road
Central
Commercial (8/F
to 14/F)
448 45 448
351 Charles L
Corn
Building
26 Wing Lok
Street
3 9 9 5
352 Tak Cheung
Building
22-24 Wing Lok
Street
Commercial
(3/F)
47 5 47
353 Nim Chi Lau 18-20 Wing Lok
Street
Population
estimate based
on site visit,
information on
building size and
facility use
450 450 225
354 Wing Sing
Commercial
Centre
12-16 Wing Lok
Street
Commercial (2/F
to 23/F)
457 21 208
355 Lloyds
Commercial
Centre
8-10 Wing Lok
Street
Commercial (2/F
to 23/F)
327 15 148
356 Hing Loong
Building
6A-8A Wng
Lok Street
Commercial
Area = 140sqm
(No info on no.
of floor)
450 450 225
357 Kwong Fat
Hong
Building
1 Rumsey Street Commercial (6/F
to 23/F)
423 24 235
358 Ngan House 210 Des Voeux
Road Central
Commercial
(upto 19/F and
area = 12x12m)
304 16 160
359 Des Voeux
Commercial
Centre
212-214 Des
Voeux Road
Central
Commercial
(upto 21/F and
area = 8x14m)
261 12 124
360 Sam Cheong
Building
216-220 Des
Voeux Road
Central
Commercial
(upto 14/F and
area = 13x14m)
283 20 202
361 Willie
Building
222-224 Des
Voeux Road
Central
Commercial
(upto 6/F and
area = 8x14m)
75 7 75
362 Ka Wah Bank
Centre
232 Des Voeux
Road Central
Commercial
(upto 10/F and
area = 29x14m)
451 45 451
363 Shum Tower 268 Des Voeux
Road Central
Commercial
(upto 21/F and
area = 16x12m)
448 21 213
364 Yat Chau
Building
262 Des Voeux
Road Central
Commercial
(upto 21/F and
area = 12x14m)
392 19 187
365 Finance
Building
254 Des Voeux
Road Central
Commercial
(upto 14/F and
area = 8x14m)
174 12 124
366 Teda
Building
87 Wing Lok
Street
Commercial
(upto 22/F and
area = 8x24m)
469 21 213
367 On Wing
Building
51-59 Bonham
Strand
88 264 264 132

A10-C28
Adjusted
Population
No. Building
Name
Street Name Flat No. Maximum
Population
AM PM
368 Skyline
Commercial
Centre
77 Wing Lok
Street
Commercial
(upto 25/F and
area = 18x16m)
800 32 320
369 The Strand 47-49 Bonham
Strand East
Commercial
(upto 20/F and
area = 10x15m)
333 17 167
370 Foo Sang
Building
67-69 Wing Lok
Street
Commercial
(upto 5/F and
area = 10x17m)
94 9 94
371 Nil 63-65 Wing Lok
Street
7 21 21 11
372 Nil 59-61 Wing Lok
Street
Population
estimate based
on site visit,
information on
building size and
facility use
300 300 150
373 Mandarin
Building
35-43 Bonham
Road
90 270 270 135
374 Cosco Tower 183 Queen's
Road Central
Commercial
(upto 55/F and
area = 50x32m)
9778 178 1778
375 Golden
Centre
188 Des Voeux
Road Central
Commercial
(upto 27/F and
area = 26x12m)
936 35 347
376 Vicwood
Plaza
199 Des Voeux
Road Central
Commercial
(upto 38/F and
area = 40x45m)
7600 200 2000
377 Wing On
Centre
111 Connaught
Road Central
Commercial
(upto 29/F and
area = 70x48m)
10827 373 3733
378 Rumsey
Street Multi-
Storey Car
Park
2 Rumsey Street Population
estimate based
on site visit,
information on
building size and
facility use
500 50 125
379 Shun Tak
Centre China
Merchants
Tower
168 Connaught
Road Central
Commercial
(upto 40/F and
area = 40x50m)
8889 222 2222
380 Shun Tak
Centre and
West Tower
168-200
Connaught
Road Central
Commercial
(upto 39/F and
area = 118x30m
and 50x40m)
24007 616 6156
381 Recreational
Area and bus
terminus
Connaught
Road Central
Population
estimate based
on site visit,
information on
building size and
facility use
300 30 300
382 Waterfront
Division
Police Station
2 Chung Kong
Road
Population
estimate based
on site visit,
information on
building size and
facility use
500 500 500

A10-C29
Adjusted
Population
No. Building
Name
Street Name Flat No. Maximum
Population
AM PM
383 Sheung Wan
Fire Station
2 Western Fire
Services Street
Population
estimate based
on site visit,
information on
building size and
facility use
500 500 500
384 Islands &
Marine Fire
Command
Headquarters
Western Fire
Service Street
Population
estimate based
on site visit,
information on
building size and
facility use
500 500 500
385 Jade Court 8 High Street 48 144 144 72
386 Nil 6A,6& 4B High
Street
Population
estimate based
on site visit,
information on
building size and
facility use
200 200 100
387 Nil 4 High Street 20 60 60 30
388 Nil 2B-2C High
Street
10 30 30 15
389 Eastern Street
Methadone
Clinic
45 Eastern
Street
Population
estimate based
on site visit,
information on
building size and
facility use
200 20 200
390 Sai Ying Pun
Community
Complex
2 High Street Population
estimate based
on site visit,
information on
building size and
facility use
200 20 200
391 Not used 0 0
392 Nil 21-27A High
Street
63 189 189 95
393 Nil 1-3 Leung I
Fong
6 18 18 9
394 Nil 15-17 High
Street
10 30 30 15
395 Ko Chun
Court
11 High Street 26 78 78 39
396 Ko Nga
Court
9 High Street 226 678 678 339
397 High House 19A-19B High
Street
46 138 138 69
398 Villas
Sorrento
64-64A Mount
Davis Road
Population
estimate based
on site visit,
information on
building size and
facility use
100 100 50

A10-C30
Adjusted
Population
No. Building
Name
Street Name Flat No. Maximum
Population
AM PM
399 Villa
Primavera
188 Victoria
Road
Population
estimate based
on site visit,
information on
building size and
facility use
50 50 25
400 Villa D'Ora 63 Mount Davis
Road
1 10 10 5
401 Block 1 - 8
Felix Villas
61 Mount Davis
Road
Population
estimate based
on site visit,
information on
building size and
facility use
80 80 40
402 Cape
Mansions
Block A
60-62 Mount
Davis Road
33 99 99 50
403 Cape
Mansions
Block B
56-58 Mount
Davis Road
40 120 120 60
404 Canossian
Retreat
House
HoneyVille
57 Mount Davis
Road
Population
estimate based
on site visit,
information on
building size and
facility use
100 100 50
405 Vista Mount
Davis
52-54 Mount
Davis Road
40 120 120 60
406 Bayview
Court
49 Mount Davis
Road
12 36 36 18
407 Ocean View 37 Mount Davis
Road
Population
estimate based
on site visit,
information on
building size and
facility use
36 36 18
408 Greenvale
Block 1
15 Mount Davis
Road
5 15 15 8
409 Greenvale
Block 2
17 Mount Davis
Road
6 18 18 9
410 Greenvale
Block 3
19 Mount Davis
Road
6 18 18 9
411 Greenvale
Block 4
21 Mount Davis
Road
6 18 18 9
412 Greenvale
Block 5
23 Mount Davis
Road
4 12 12 6
413 House A1 to
A7
6 Mount Davis
Road
7 35 35 18
414 Four Winds 4 Mount Davis
Road
49 147 147 74
415 Nil 7 Mount Davis
Road
6 18 18 9
416 Mount Davis
Garden
5 Mount Davis
Road
24 72 72 36
417 Greenery
Garden Block
A to D
2A Mount
Davis Road
112 336 336 168

A10-C31
Adjusted
Population
No. Building
Name
Street Name Flat No. Maximum
Population
AM PM
418 Pok Fu Lam
Road
Playground
Pok Fu Lam
Road
Population
estimate based
on site visit,
information on
building size and
facility use
50 5 50
419 Football Field Pok Fu Lam
Road
Population
estimate based
on site visit,
information on
building size and
facility use
30 3 30
420 Tennis Court University of
Hong Kong
Population
estimate based
on site visit,
information on
building size and
facility use
20 2 20
421 Flora Ho
Sports Centre
University of
Hong Kong
Population
estimate based
on site visit,
information on
building size and
facility use
200 20 200
422 The Lindsay
Ride Sports
Centre
University of
Hong Kong
Population
estimate based
on site visit,
information on
building size and
facility use
200 20 200
423 St. John's
College AW
Boon Haw
Wing
University of
Hong Kong
Population
estimate based
on site visit,
information on
building size and
facility use
300 30 300
424 St. John's
College
Marden Wing
University of
Hong Kong
Population
estimate based
on site visit,
information on
building size and
facility use
300 30 300
425 KET
Swimming
Pool
Sai Cheung
Street North
Population
estimate based
on site visit,
information on
building size and
facility use
1000 100 1000
426 Nil Ko Shing Street
84-86
Commercial (up
to 10/F and area
= 160m2)
184 184 184
427 Nil Des Voeux
Road West 114
Commercial (up
to 12/F and area
= 60m2)
75 75 75

A10-C32
Figure 2.1 Population Distribution (1)

A10-C33
Figure 2.2 Population Distribution (2)

A10-C34
Figure 2.3 Population Distribution (3)

A10-C35
Figure 2.4 Population Distribution (4)

A10-C36
Figure 2.5 Population Distribution (5)

A10-C37
Figure 2.6 Population Distribution (6)

Annex D
Traffic Survey Report
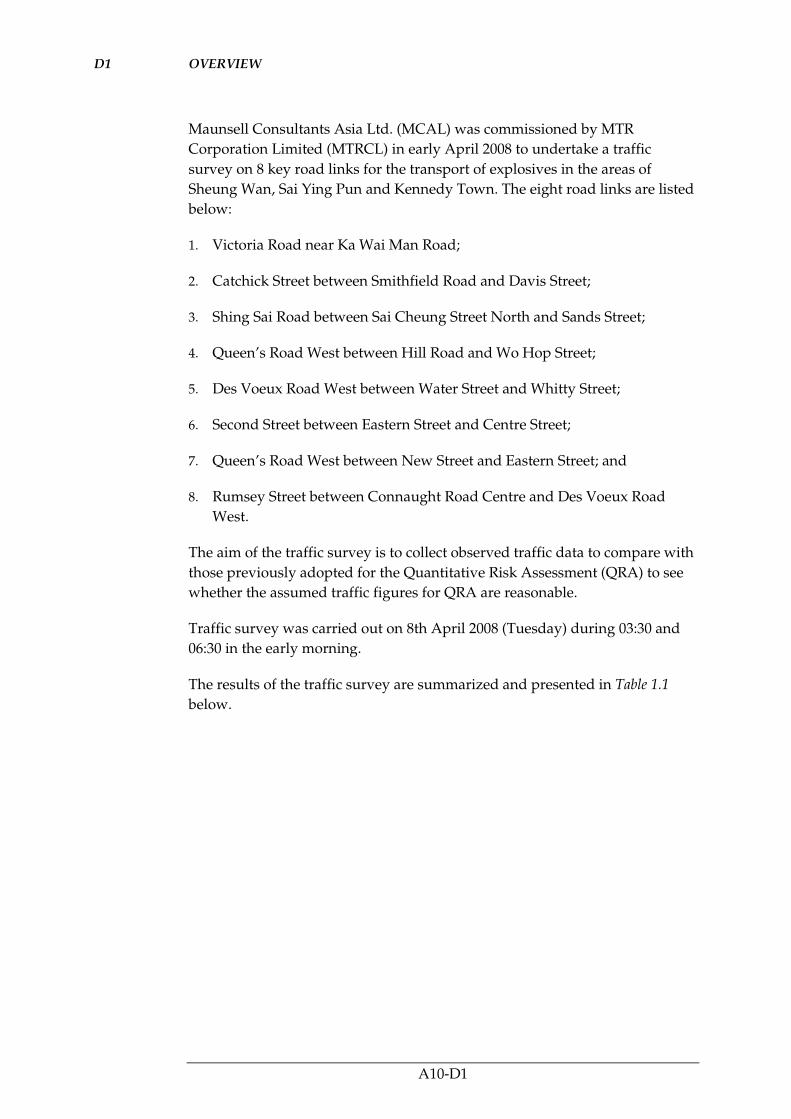
A10-D1
D1 OVERVIEW
Maunsell Consultants Asia Ltd. (MCAL) was commissioned by MTR
Corporation Limited (MTRCL) in early April 2008 to undertake a traffic
survey on 8 key road links for the transport of explosives in the areas of
Sheung Wan, Sai Ying Pun and Kennedy Town. The eight road links are listed
below:
1. Victoria Road near Ka Wai Man Road;
2. Catchick Street between Smithfield Road and Davis Street;
3. Shing Sai Road between Sai Cheung Street North and Sands Street;
4. Queen’s Road West between Hill Road and Wo Hop Street;
5. Des Voeux Road West between Water Street and Whitty Street;
6. Second Street between Eastern Street and Centre Street;
7. Queen’s Road West between New Street and Eastern Street; and
8. Rumsey Street between Connaught Road Centre and Des Voeux Road
West.
The aim of the traffic survey is to collect observed traffic data to compare with
those previously adopted for the Quantitative Risk Assessment (QRA) to see
whether the assumed traffic figures for QRA are reasonable.
Traffic survey was carried out on 8th April 2008 (Tuesday) during 03:30 and
06:30 in the early morning.
The results of the traffic survey are summarized and presented in Table 1.1
below.

A10-D2
Table 1.1 Summary of Traffic Survey Results
Observed Traffic Flows (pcu/hr) Location Road Name Direction
03:30 to 04:30
04:30 to 05:30
05:30 to 06:30
Eastbound 11 15 136 1 Victoria Road near Ka Wai Man Road
Westbound 27 37 140
2 Catchick Street between Smithfield Road and Davis Street
Eastbound 59 107 135
Eastbound 55 69 141 3 Shing Sai Road between Sai Cheung Street North and Sands Street Westbound 128 144 255
4 Queen’s Road West between Hill Road and Wo Hop Street
Westbound 101 118 265
Eastbound 134 169 368 5 Des Voeux Road West between Water Street and Whitty Street
Westbound 20 22 60
6 Second Street between Eastern Street and Centre Street
Westbound 35 45 89
7 Queen’s Road West between New Street and Eastern Street
Westbound 129 160 276
8 Rumsey Street between Connaught Road Centre and Des Voeux Road West
Southbound 141 149 172
Total 840 1035 2037
From Table 1.2, it can be seen that the traffic flows in the hour 05:30 to 06:30
(2037 pcus) were observed to be the peak hourly traffic flows during the
period between 03:30 and 06:30. Therefore the peak hourly traffic flows
observed during 05:30 and 06:30 were selected and presented for the
comparison.
Table 1.2 shows the comparison of the observed traffic flows during 05:30 and
06:30 and the assumed traffic flows for QRA.

A10-D3
Table 1.2 Comparison of Observed Traffic Flows and Assumed Traffic Flows for QRA
Observed Traffic Flows (pcu/hr)
Traffic Flows based on BDTM Model (pcu/hr)
Location Road Name Direction
05:30 to 06:30 05:30 to 06:30
Eastbound 136 323 1 Victoria Road near Ka Wai Man Road
Westbound 140 247
2 Catchick Street between Smithfield Road and Davis Street
Eastbound 135 118
Eastbound 141 588 3 Shing Sai Road between Sai Cheung Street North and Sands Street
Westbound 255 359
4 Queen’s Road West between Hill Road and Wo Hop Street
Westbound 265 476
Eastbound 368 188 5 Des Voeux Road West between Water Street and Whitty Street
Westbound 60 268
6 Second Street between Eastern Street and Centre Street
Westbound 89 390
7 Queen’s Road West between New Street and Eastern Street
Westbound 276 243
8 Rumsey Street between Connaught Road Centre and Des Voeux Road West
Southbound 172 280
As seen from Table 2.2, most of the observed traffic data is smaller than or within ± 10% of the assumed traffic data adopted in the QRA except for the traffic flows at Location 5 - Des Voeux Road West between Water Street and Whitty Street. It is possibly due to the unexpected high and frequent red minibus westbound trips on Des Voeux West during early morning.
In view of the findings of the traffic survey, the observed traffic data for the following locations were used for the study:
• Location 2: Catchick Street between Smithfield Road and Davis Street;
• Location 5: Des Voeux Road West between Water Street and Whitty Street for refinement of the QRA;
• Location 7: Queen’s Road West between New Street and Eastern Street.

Annex E
Use of Explosives -
Frequency Assessment
Details

CONTENTS
E1 ESTIMATION OF NUMBER OF BLASTS FOR WIL 1
E2 FREQUENCY ASSESSMENT OF SCENARIOS LEADING TO HIGHER
GROUND VIBRATION AT A BLAST FACE 2
E2.1 HIGH-LEVEL FAILURE MODE ANALYSIS FOR USE OF EXPLOSIVES 2
E2.2 ASSUMPTIONS FOR FREQUENCY ASSESSMENT 2
E2.3 FAULT TREE ANALYSIS 15
E2.4 OVERALL FREQUENCY FOR FAILURE SCENARIOS 18
E2.5 CONSERVATISM BUILT INTO THE FAULT TREE ANALYSIS 19
E3 REVIEW OF HISTORICAL BLAST DATA IN HONG KONG 20
E3.1 INCIDENT DATA IN HONG KONG 20
E4 REFERENCES 23
Attachment E1 High-Level Failure Mode Analysis
Attachment E2 Fault Tree Models for Use of Explosives

A10-E1
E1 ESTIMATION OF NUMBER OF BLASTS FOR WIL
A total of about 5,660 blasts has been estimated for the West Island Line (WIL)
project, based on a review of the Maximum Instant Charge (MIC) profile and
layout design for the alignment. The breakdown along the WIL sections is
summarized as below.
Table 1.1 Numbers of Blasts for the West Island Line
Section of Alignment No. of sector per face No. of Blasts
Sai Ying Pun (SYP)
Station & Adits
6 sectors 811
4 sectors 186
1 sector 372
University (UNV)
Station & Adits
6 sectors 868
4 sectors 505
1 sector 493
Running Tunnels 6 sectors 90
4 sectors 2,184
Total for WIL Alignment 5,509
Mass Transit Railway
Corporation (MTRC)
Explosives Magazine
6 sectors 113
1 sector 36
Total for WIL Project Magazine 149
Total for WIL Project 5,658
A10-E2
E2 FREQUENCY ASSESSMENT OF SCENARIOS LEADING TO HIGHER
GROUND VIBRATION AT A BLAST FACE
E2.1 HIGH-LEVEL FAILURE MODE ANALYSIS FOR USE OF EXPLOSIVES
A high-level failure mode effect analysis was carried out to systematically
identify failure scenarios associated with use of explosives for the construction
of the tunnel and adits. The analysis focused on those failure modes that could
lead to potential increase in ground vibration, given consideration of human
errors and other causes. The worksheets are enclosed in Attachment F1.
The following failure modes were identified and further investigated in the
subsequent sections.
1. Face freeze caused by cut failure
2. Two MIC detonated at the same time at a blast face
3. Multiple MIC detonated at the same time at a blast face
4. More cartridged sticks/ bulk emulsion explosives loaded into a
production hole than required
5. Unforeseen ground condition
Fault tree analysis was then carried out, as described in Section E2.3 to assess
the casual relationship amongst the failure modes and causes, and evaluate
the probability of occurrence for each failure scenario that could lead to higher
ground vibration.
E2.2 ASSUMPTIONS FOR FREQUENCY ASSESSMENT
The following assumptions were made for assessing the probability of
occurrence for the failure scenarios associated with the use of explosives:
• An analysis of cross section areas for typical section for station caverns,
tunnels and rock adits was carried out to determine the typical design of
the blast faces to facilitate the frequency assessment (see Section E1).
Typical faces of 6 sectors, 4 sectors and 1 sector (bench blasting) were
analysed.
No more than 4 numbers of same time delay detonators for production
holes have been imposed as a design constraint for a blast face having
more than 1 sector. It is not possible to have more than one time delay
detonators with the same delay time within production holes located in
the same sector unless there has been an erroneous permutation,
connection or manufacturer defects. It is therefore not consider possible to
get more than 4 MIC in any blast with 4 or 6 sectors due to erroneous
permutation or connection because of the design constraint.

A10-E3
• Delay surface connectors will be used to provide external time delay to
different sectors so that each sector will be detonated in sequence. If an
external surface connector fails completely, the explosion sequence will
stop onwards.
• There are two connection arrangements from detonators to bunch blocks
(ie 0 ms surface connector). One of them is to use detonating cord to
bundle all detonators in a sector and then connect the detonating cord to a
surface connector. Another arrangement is to connect detonators to a ring
of detonating cord which will connect to the surface connectors. It was
assumed that ring firing will not be permitted as a restriction.
• No failure modes of detonator will result in significant change in time
delay with the exception of manufacture scatter out of tolerance. In case of
failure modes other than manufacture defect, detonation is not expected.
• Perimeter holes are designed such that each of them will be loaded with a
charge less than a MIC and multiple perimeter holes will be detonated at
the same time. Long time delay detonators will be installed at the
perimeter holes.
In case there is a swap of detonators between a perimeter hole and a
production hole, the perimeter hole will be blasted out earlier than
expected but will have minimal effect on vibration as the charge load is
lower than a MIC. For the production hole loaded with a longer time delay
detonator, it will be blasted out when the outer ring comes off and no
significant effect is expected.
A minimum of two permutations are required to put two or more
perimeter detonators of same time delay into the production holes of same
sector, leading to multiple MIC going off together. Perimeter hole
detonators require one further level of error or permutation than
production hole detonators to cause multiple MIC detonated at the same
time, and therefore, perimeter holes were not considered further in the
frequency assessment.
E2.2.1 Face freeze caused by cut failure due to either wrong hole diameter for relief
holes at cut or wrong time delay at cut
A cut is provided for each blast face to provide a void/ relief before other
production holes are blasted, allowing the rock to be blasted out in a ring like
sequence. Three relief holes are provided at the centre of the cut to provide
relief when the 6 cut holes blast out in sequence.
In case the size or location of relief holes is not correctly drilled to an extent
significantly enough to hinder sufficient relief, possible freeze of blast face
may result. The reason for incorrect size or location of relief holes could be
either design or drilling errors. A probability of 0.5 was assumed for such
error significantly enough to cause a face freeze.
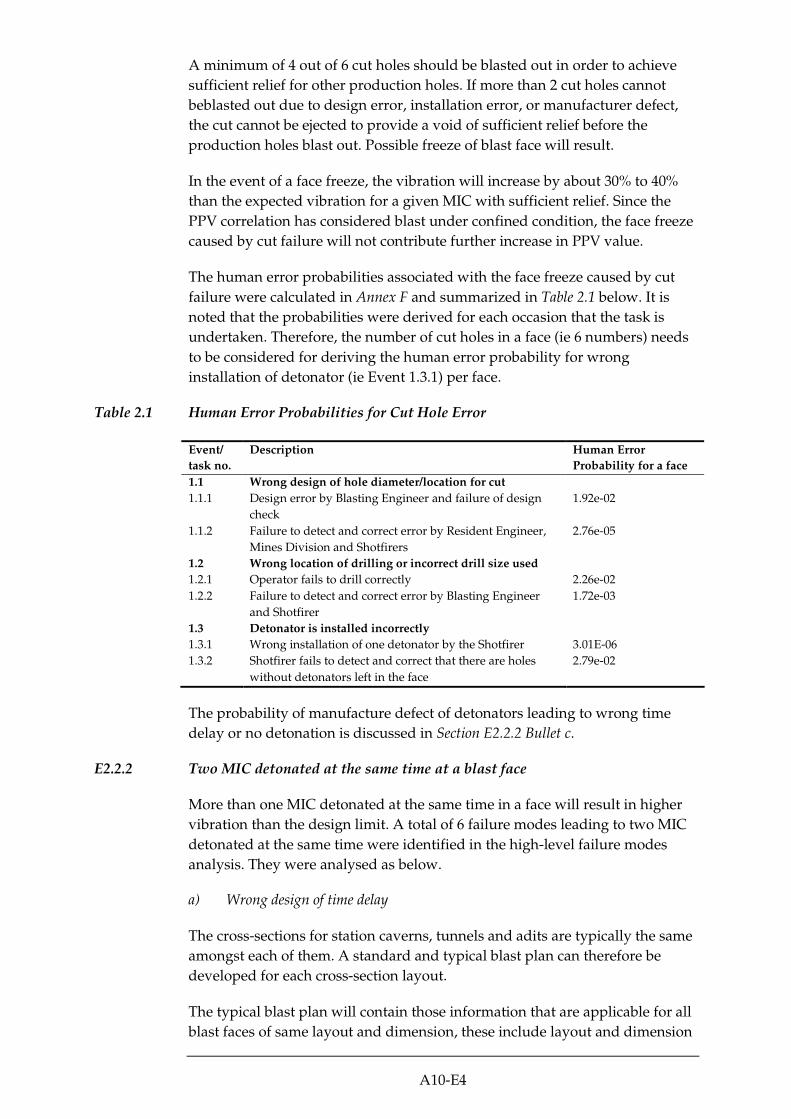
A10-E4
A minimum of 4 out of 6 cut holes should be blasted out in order to achieve
sufficient relief for other production holes. If more than 2 cut holes cannot
beblasted out due to design error, installation error, or manufacturer defect,
the cut cannot be ejected to provide a void of sufficient relief before the
production holes blast out. Possible freeze of blast face will result.
In the event of a face freeze, the vibration will increase by about 30% to 40%
than the expected vibration for a given MIC with sufficient relief. Since the
PPV correlation has considered blast under confined condition, the face freeze
caused by cut failure will not contribute further increase in PPV value.
The human error probabilities associated with the face freeze caused by cut
failure were calculated in Annex F and summarized in Table 2.1 below. It is
noted that the probabilities were derived for each occasion that the task is
undertaken. Therefore, the number of cut holes in a face (ie 6 numbers) needs
to be considered for deriving the human error probability for wrong
installation of detonator (ie Event 1.3.1) per face.
Table 2.1 Human Error Probabilities for Cut Hole Error
Event/
task no.
Description Human Error
Probability for a face
1.1 Wrong design of hole diameter/location for cut
1.1.1 Design error by Blasting Engineer and failure of design
check
1.92e-02
1.1.2 Failure to detect and correct error by Resident Engineer,
Mines Division and Shotfirers
2.76e-05
1.2 Wrong location of drilling or incorrect drill size used
1.2.1 Operator fails to drill correctly 2.26e-02
1.2.2 Failure to detect and correct error by Blasting Engineer
and Shotfirer
1.72e-03
1.3 Detonator is installed incorrectly
1.3.1 Wrong installation of one detonator by the Shotfirer 3.01E-06
1.3.2 Shotfirer fails to detect and correct that there are holes
without detonators left in the face
2.79e-02
The probability of manufacture defect of detonators leading to wrong time
delay or no detonation is discussed in Section E2.2.2 Bullet c.
E2.2.2 Two MIC detonated at the same time at a blast face
More than one MIC detonated at the same time in a face will result in higher
vibration than the design limit. A total of 6 failure modes leading to two MIC
detonated at the same time were identified in the high-level failure modes
analysis. They were analysed as below.
a) Wrong design of time delay
The cross-sections for station caverns, tunnels and adits are typically the same
amongst each of them. A standard and typical blast plan can therefore be
developed for each cross-section layout.
The typical blast plan will contain those information that are applicable for all
blast faces of same layout and dimension, these include layout and dimension
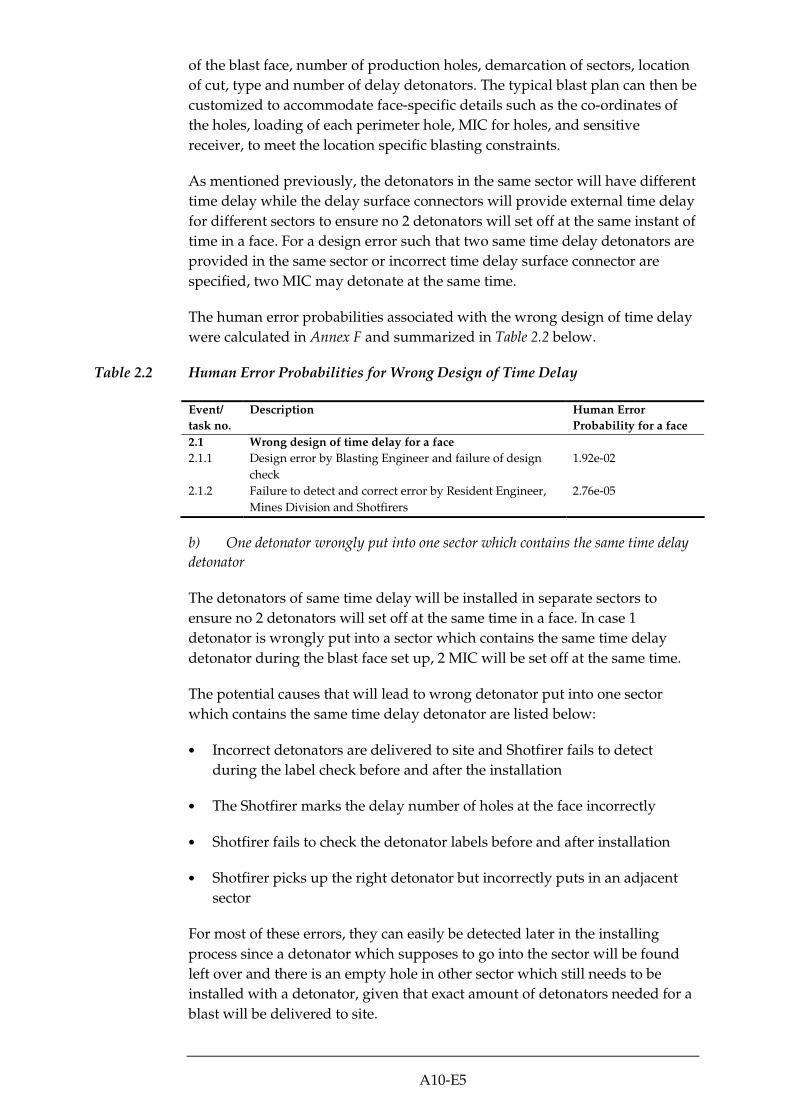
A10-E5
of the blast face, number of production holes, demarcation of sectors, location
of cut, type and number of delay detonators. The typical blast plan can then be
customized to accommodate face-specific details such as the co-ordinates of
the holes, loading of each perimeter hole, MIC for holes, and sensitive
receiver, to meet the location specific blasting constraints.
As mentioned previously, the detonators in the same sector will have different
time delay while the delay surface connectors will provide external time delay
for different sectors to ensure no 2 detonators will set off at the same instant of
time in a face. For a design error such that two same time delay detonators are
provided in the same sector or incorrect time delay surface connector are
specified, two MIC may detonate at the same time.
The human error probabilities associated with the wrong design of time delay
were calculated in Annex F and summarized in Table 2.2 below.
Table 2.2 Human Error Probabilities for Wrong Design of Time Delay
Event/
task no.
Description Human Error
Probability for a face
2.1 Wrong design of time delay for a face
2.1.1 Design error by Blasting Engineer and failure of design
check
1.92e-02
2.1.2 Failure to detect and correct error by Resident Engineer,
Mines Division and Shotfirers
2.76e-05
b) One detonator wrongly put into one sector which contains the same time delay
detonator
The detonators of same time delay will be installed in separate sectors to
ensure no 2 detonators will set off at the same time in a face. In case 1
detonator is wrongly put into a sector which contains the same time delay
detonator during the blast face set up, 2 MIC will be set off at the same time.
The potential causes that will lead to wrong detonator put into one sector
which contains the same time delay detonator are listed below:
• Incorrect detonators are delivered to site and Shotfirer fails to detect
during the label check before and after the installation
• The Shotfirer marks the delay number of holes at the face incorrectly
• Shotfirer fails to check the detonator labels before and after installation
• Shotfirer picks up the right detonator but incorrectly puts in an adjacent
sector
For most of these errors, they can easily be detected later in the installing
process since a detonator which supposes to go into the sector will be found
left over and there is an empty hole in other sector which still needs to be
installed with a detonator, given that exact amount of detonators needed for a
blast will be delivered to site.

A10-E6
The human error probabilities associated with putting a detonator into a
wrong sector were calculated in Annex F. However the probabilities were
derived for the occasion that the task is undertaken. In order to derive the
human error probabilities per face, the number of production holes in a face
needs to be considered for those action tasks detailed in Annex F.
Generally about 70% of the holes at a typical blast face with 4 or 6 sectors are
production holes while the rest are perimeter holes. It was therefore assumed
90 production holes for a blast face with 6 sectors and 60 production holes for
a face with 4 sectors. For a blast face with 1 sector (bench), 40 production holes
were assumed. The details are summarized in Table 2.3 below.
Table 2.3 Number of Holes per a Blast Face
Sectors per Blast Face No. of Holes in Face Number of Production Holes for
Frequency Assessment
6 80-130 90
4 65-80 60
1 30-35 40
The human error probabilities associated with putting a detonator into a
wrong sector on a per face basis is presented in Table 2.4 below.
Table 2.4 Human Error Probabilities for Wrong Design of Time Delay
Event/
task no.
Description Human Error Probability for a
face
6-Sector
face
4 sector
face
1-sector
face
2.2 Detonator put into wrong hole
2.2.1 Delivery of incorrect detonators from the
magazine to the blast site
2.10E-06 2.10E-06 2.10E-06
2.2.2 Installation of one detonator by Shotfirer into a
sector already containing a detonator of that
delay period
4.91E-05 3.27E-05 2.18E-05
2.2.3 Shotfirer fails to check and correct installation
error
2.79E-02 2.79E-02 2.79E-02
The human error probability for delivering incorrect detonators from the
magazine to the blast site (Event 2.2.1) without notice by Shotfirers on site, ie
failure of label check before and after installation of detonator at the same time
(task step no. 2.2.2-5 and 7 in Annex F), was estimated as 1.14E-12. This is
comparatively negligible to Event No. 2.2.2 and hence delivery error was not
considered further in the frequency assessment of this failure mode.
For a 6-sector blast face, the 5th and 6th sector will start with a longer time
delay, ie even though a detonator is installed in a wrong sector, it may go to a
‘safe’ sector which does not contain the same time delay detonator. A
probability of unsafe sector was assumed as 0.5 (ie 3 out of 6 sectors).
For a 4-sector blast face, all wrong sectors will contain the same time delay
detonator, the probability of unsafe sector is 0.75 (ie 3 out of 6 sectors).
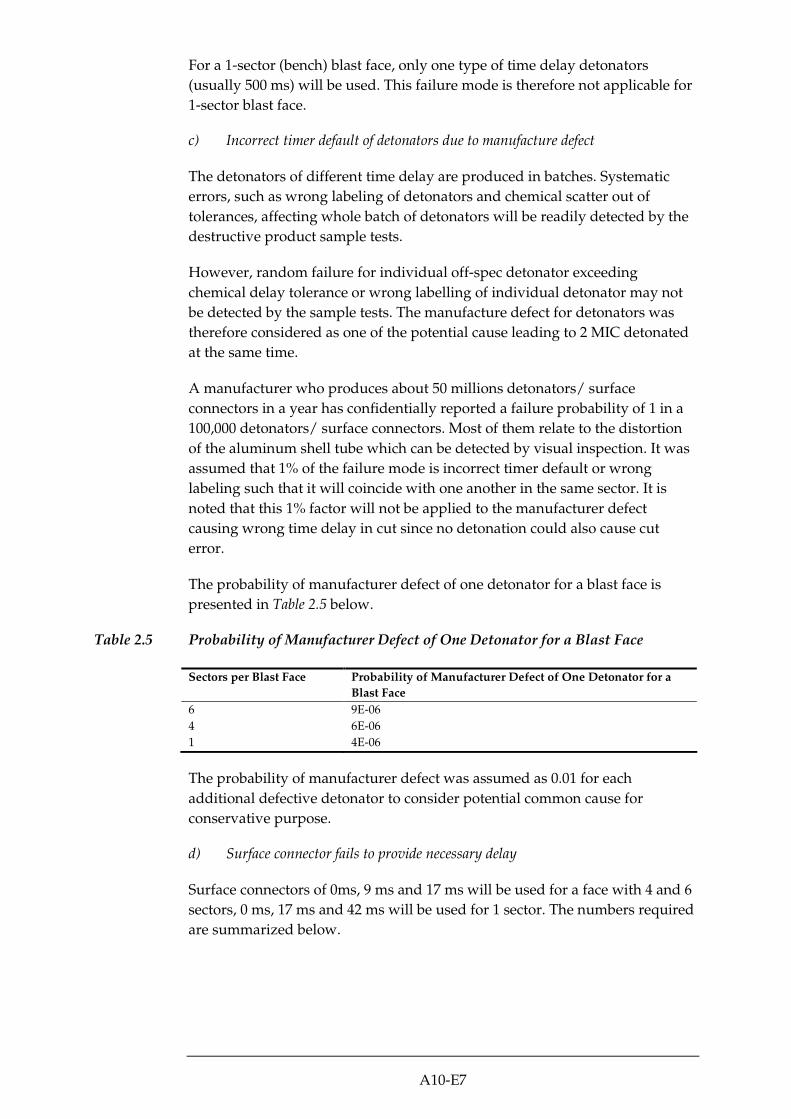
A10-E7
For a 1-sector (bench) blast face, only one type of time delay detonators
(usually 500 ms) will be used. This failure mode is therefore not applicable for
1-sector blast face.
c) Incorrect timer default of detonators due to manufacture defect
The detonators of different time delay are produced in batches. Systematic
errors, such as wrong labeling of detonators and chemical scatter out of
tolerances, affecting whole batch of detonators will be readily detected by the
destructive product sample tests.
However, random failure for individual off-spec detonator exceeding
chemical delay tolerance or wrong labelling of individual detonator may not
be detected by the sample tests. The manufacture defect for detonators was
therefore considered as one of the potential cause leading to 2 MIC detonated
at the same time.
A manufacturer who produces about 50 millions detonators/ surface
connectors in a year has confidentially reported a failure probability of 1 in a
100,000 detonators/ surface connectors. Most of them relate to the distortion
of the aluminum shell tube which can be detected by visual inspection. It was
assumed that 1% of the failure mode is incorrect timer default or wrong
labeling such that it will coincide with one another in the same sector. It is
noted that this 1% factor will not be applied to the manufacturer defect
causing wrong time delay in cut since no detonation could also cause cut
error.
The probability of manufacturer defect of one detonator for a blast face is
presented in Table 2.5 below.
Table 2.5 Probability of Manufacturer Defect of One Detonator for a Blast Face
Sectors per Blast Face Probability of Manufacturer Defect of One Detonator for a
Blast Face
6 9E-06
4 6E-06
1 4E-06
The probability of manufacturer defect was assumed as 0.01 for each
additional defective detonator to consider potential common cause for
conservative purpose.
d) Surface connector fails to provide necessary delay
Surface connectors of 0ms, 9 ms and 17 ms will be used for a face with 4 and 6
sectors, 0 ms, 17 ms and 42 ms will be used for 1 sector. The numbers required
are summarized below.

A10-E8
Table 2.6 Number of Surface Connector per Face
Sectors per Face Time Delay of Surface
Connector 6 Sectors 4 Sectors 1 Sector
0 ms 6 4 1
9 ms 1 1 -
17 ms 4 2 n/2 (Note 1)
42 ms - - n/2 – 1 (Note 1)
Note 1: Where n is the number of blast holes in a face
In order to assess potential failure modes of manufacturing defects leading to
multiple MIC going off at the same time, the design for surface connectors was
examined as below.
A surface connector consists of an aluminum shell, a neoprene sealing plug,
shock tube, a pre-case tube of chemical delay element, primary explosive,
secondary explosive and a moulded plastic outer body.
The dimensions and appearance of the aluminum shell, neoprene sealing
plug, primary explosive and shock tube are the same for all types of time
delay surface connectors. The differences amongst different types of time
delay surface connectors are listed:
• The delay elements are contained in pre-cast tube, which will be
assembled into the aluminum shell at the production line for all time delay
surface connectors except 0 ms. The length of delay elements and
compression/ compaction ratio of the delay elements within the cast tube
will vary depending on the necessary time delay to be achieved. The same
type of surface connectors will have the same length and compression/
compaction ratio but these parameters are within tolerance level due to the
inherent scatter in delay elements.
The delay chemical is a medium to propagate the shock from the shock
tube through to the primary and secondary explosives in a pre-determined
time period (delay) within the surface connectors. In case the chemical
delay is empty in the pre-cast tube, the shock will not propagate to set off
the detonators/ surface connectors connected to it. Hence, no failure
modes of 9 ms, 17 ms or other time delay surface connectors will lead to
detonation at 0 ms time delay.
• The secondary explosive charge for 0ms surface connectors is about 0.300
grams which is strong enough to set off detonating cord. The secondary
explosive charge for other time delay surface connector is about 0.1 grams
which can only set off a maximum of 8 shock tubes from detonators at the
same time. Even when the chemical delay tube is put into a 0 ms surface
connector by error, the neoprene sealing plug cannot be securely installed.
Hence, no failure modes of 0 ms surface connector will lead to detonation
at certain time delay.
A10-E9
Potential manufacturer defects that could lead to multiple MIC going off at the
same time could therefore be incorrect labeling of a 0 ms detonator as 9 ms, 17
ms or other time delay, or chemical scatter out of tolerance for surface
connectors other than 0 ms. Systematic errors, such as wrong colour coding of
surface connectors and chemical scatter out of tolerances, affecting whole
batch of surface connectors are expected to be detected by the destructive
product sample tests. However, random failure for an individual off-spec
surface connector or wrong colour coding of an individual surface connector
could be possible given the sampling nature of the destructive tests.
Similar to the discussion under Bullet c) of this Section E2.2.2, the probability of
manufacturer defect of one surface connector was assumed as 1% of a base
probability of 1 in a 100,000.
The probability of manufacturer defect of one surface connector for a blast
face is presented in Table 2.7 below.
Table 2.7 Probability of Manufacturer Defect of One Surface Connector for a Blast Face
Sectors per Blast Face No. of Time Delay (excluding
0 ms) used per face
Probability of Manufacturer
Defect of One Surface
Connector for a Blast Face
6 5 5E-07
4 3 3E-07
1 39 (assuming 40 production
hole on a face)
3.9E-06
The probability of manufacturer defect was assumed as 0.01 for each
additional defective surface connector to consider potential common cause for
conservative purpose.
e) One detonator of a sector connected wrongly to a surface connector of another
sector (mis-wiring)
The detonators of a sector will be bundled by a detonating cord which will
then be connected to a 0ms surface time delay surface connector. In case one
detonator of a sector is bundled wrongly to another sector which contains the
same time delay detonator, 2 MIC will detonate at the same time.
Considering the possibility that the detonator tube may be incorrectly
connected to either 0 ms or 9/17 ms time delay surface connectors of another
sectors directly, the probability of ‘safe’ sector was not applied.
The human error probabilities associated with detonator of one sector
wrongly connected to a surface connector of a different sector were calculated
in Annex F. As mentioned before, the probabilities were derived for each
occasion that the task is undertaken. In order to derive the human error
probabilities per face, the number of production holes in a face needs to be
considered for those action tasks detailed in Annex F.
The human error probabilities associated with the connecting a detonator into
to a wrong sector on a per face basis is summarized in Table 2.8 below.

A10-E10
Table 2.8 Human Error Probabilities for Connection of a Detonator to a Wrong Surface
Event/
task no.
Description Human Error Probability for a
face
6-Sector
face
4 sector
face
1-sector
face
2. 3 Detonator of one sector wrongly connected to a
surface connector of a different sector
2.3.1 Shotfirer misconnects one detonator to the
wrong surface connector
7.25E-01 4.85E-01 3.25E-01
2.3.2 Failure to detect and correct connection error 1.44E-04 1.44E-04 1.44E-04
For a 6-sector blast face, the 5th and 6th sector will start with a longer time
delay, ie even though a detonator is connected to a wrong sector, it may
connect to a ‘safe’ sector which does not contain the same time delay
detonator. A probability of unsafe sector was assumed as 0.6 (ie 3 out of 5
wrong sectors).
For a 4-sector blast face, all wrong sectors will contain the same time delay
detonator, hence the probability of unsafe sector is 1.
For a 1-sector (bench) blast face, misconnection of several detonators to one
surface connector leading to more than 1 MIC detonated at the same time is
possible, since a surface connector can connect upto a maximum of 8
detonators. This failure mode is therefore considered applicable for blast faces
with 1 sector.
f) Use of a wrong surface connector
Different time delay surface connectors are provided with unique colour
coding. The colour coding system (see Table 2.9) is universal amongst all
manufactures in the world. The permutation of surface connection error of
surface connectors can be easily spotted during the final hook up check.
Table 2.9 Colour Coding of Surface Connectors
Time Delay of Surface Connector Colour
0 ms Dark green/ purple
9 ms Brown
17 ms Yellow
42 ms White
A number of failure modes were analysed as below with regard to use of a
wrong surface connector, these include
• Blast faces with 4 or 6 sectors
o Not all permutation cases between 9 ms and 17 ms will lead to 2 MIC
detonated at the same time. 3 permutation cases are anticipated for
blast face with 6 sectors, and 1 permutation case is anticipated for blast
face with 4 sectors that will lead to 2 MIC detonated at the same time.
o Permutation between 0 ms and 9 ms within a sector or 0 ms and 17 ms
within a sector will not able to set off the sector in concern and other

A10-E11
sectors in subsequent sequence. However, in case three 0 ms are
connected to each other sequentially (ie 0ms from other sector swap
with 9/17 ms of another sector), 2 MIC will detonate at the same time.
5 permutation cases are anticipated for blast face with 6 sectors, 3
permutation cases for blast face with 4 sectors, 1 permutation case for
blast face with 1 sector, that will lead to 2 MIC detonated at the same
time.
o Connection of 0ms surface connector to 0ms or 9/17 ms surface
connectors of other sectors additionally to the one it supposed to
connect to, will also lead to 2 MIC detonated at the same time. This
failure mode does not deal with permutation of surface connectors.
Even single connection error will lead to 2 MIC detonated at the same
time. However, this is the most obvious error which is easily detected
during final hook up check.
o Similar to the discussion under Bullet b) of this Section E2.2.2, the
human probability for delivery of wrong surface connectors are not a
significant issue as color coding check will be carried out prior to
installation. The human error probability for delivering incorrect
surface connectors from the magazine to the blast site (Event 2.2.1)
without notice by Shotfirers on site, ie failure of color coding check
before installation and correction before final hook-up check (task step
no. 2.4.1-1and 2.4.2-2 in Annex F), was estimated as 1.32E-08. This is
comparatively negligible to Event No. 2.4.1 and hence delivery error
was not considered further in the frequency assessment of this failure
mode for blast faces with 4 or 6 sectors.
o The human error probabilities associated with the use of wrong surface
connector on a per occasion basis were calculated in Annex F. The
number of surface connector in a face was considered for those action
tasks detailed in Annex F to derive the human error probabilities on a
per face basis, see Table 2.10 below.
Table 2.10 Human Error Probabilities for Use of a Wrong Surface Connector (4/6-Sector
Faces)
Event/
task no.
Description Human Error Probability for a
face
6-Sector face 4 sector face
2.4 Shot Firer uses a wrong surface connector
2.4.1 Wrong installation of surface connector 1.62E-02 1.03E-02
2.4.2 Shot firer fails to detect and respond 4.24E-02 4.24E-02
2.4.3 Failure to detect and respond during final hook-
up check
1.19E-04 1.19E-04
A10-E12
• Blast faces with 1 sector
o Any permutation between 0, 17 and 42 ms surface connectors will not
lead to two MIC detonated at the same time. However, if a 0 ms
surface connector is delivered instead of a 17/42 ms and this error is
not detected and then the 0ms is used in the installation, 2 MIC
detonated at the same time will occur. The delivery errors are required
to be considered instead of Event 2.4.1 and 2.4.2 for blast face with 1
sector. The human error probabilities on a per face basis are shown in
Table 2.11 below.
Table 2.11 Human Error Probabilities for Use of a Wrong Surface Connector (1-sector
Faces)
Event/
task no.
Description Human Error
Probability for a face
2.4 Shot Firer uses a wrong surface connector
2.2.1 Wrong delivery
of surface connector
2.10E-06
2.4.1-1 Shot firer fails to check surface connector colour before
use
2.95E-02
2.4.2-2 Shot firer fails to correct wrong connection 5.54E-03
2.4.3 Failure to detect and respond during final hook-up check 1.19E-04
E2.2.3 Multiple MIC detonated at the same time at a blast face
As discussed above, no more than 4 numbers of same time delay detonators
will be put into a face as a design constraint. Hence, maximum 4 holes
detonated at the same time are considered for face with 4 or 6 sectors.
The failure mode analysis considers simply the multiple failures of the same
types of failure modes identified for 2 MIC detonated at the same time above,
for example, 3 detonators wrongly put into one sector which contains the
same time delay detonator. In actual, combinations of these failure modes will
also lead to 4 MIC detonated at the same time. These were analysed further
with the assistance of fault tree analysis detailed in Section E2.3.
Nevertheless, in case there are design errors not readily detected by the robust
design check or more number detonators which have time delay coinciding
with the ones already in the face due to manufacturer defect, it is possible to
have more than 4 MIC detonated at the same time. See E2.3.3 for further
discussion.
E2.2.4 More bulk emulsion explosives loaded into a production hole than required
There are three causes that will lead to more bulk emulsion explosives loaded
into a production hole than required:
• Wrong density check of bulk emulsion
o Density checks will be carried out by the truck operator, with results
verified by Chief Shotfirer and Blasting Engineer, prior to loading of
bulk emulsion into holes, in the middle of loading and towards end of

A10-E13
loading. In case the results read low density but the density is actually
high due to human error or mechanical failure of instruments, more
than required bulk emulsion will be loaded into the holes. Considering
the MIC profile of WIL, the density of the bulk emulsion and pull
length of blasts, the holes will be overloaded with double MIC in worst
case.
The gassing flow meter and scales used for the density checks will be
calibrated by certified bodies once every year. The failure rate of erratic
output for flow meter is 2.78E-06 per hour based on OREDA [1]. It was
assumed that the usage of the truck (which can act as proof tests of the
flow meter) is at least once every week. The probability of failure of the
flow meter was evaluated to be 2.4E-04 (ie 2.78E-6 x 168 hours/2). No
reported failure data for scales are available in generic datasource. The
probability of failure of the scales was assumed to be the same as flow
meter. This value is considered conservative based on the engineering
judgment by the Blast Expert who did not observe such failures in his
past experience (ie more than 12,000 blasts).
• Truck operator, Shotfirer, Blasting Engineer do not realise holes are
overloaded
o In case the truck operator inputs incorrect revolutions of bulk
emulsion loading pump (note that each revolution of pump will
deliver a certain amount of bulk emulsion) into PLC or Shotfirer puts
mark on hose in the wrong place, holes overload could be possible.
However, a totaliser is provided on the truck to indicate the total
amount of bulk emulsion delivered for a blast and the reading will be
checked by Truck operator and verified by Blasting Engineer at the
end of loading.
• Wrong design of MIC
o The MIC profile has been defined for the WIL in the Blast Assessment
Reports [1]-[3]. The MIC along the alignment varies with respect to the
type and maximum design PPV of sensitive receivers and distance to
the sensitive receivers from the alignment. Actual site blast trials will
be carried out prior to full scale blasts for the whole alignment to
obtain site specific details for refining the MIC values.
o In case there are any errors in the MIC calculation, a higher charge
load may be defined upto 5 kg which is the maximum MIC specified
for the WIL. However, the MIC profile along the alignment basically
changes gradually (the change of charge load is generally less than one
charge load of the preceding location) and any sudden spike will be
obviously spotted. It was therefore assumed that design error will lead
to no more than double charge.
The human error probabilities associated with more bulk emulsion explosives
loaded into a production hole than required were calculated in Annex F and
summarized in Table 2.12 below.

A10-E14
Table 2.12 Human Error Probabilities for Excess Emulsion Loaded into a Hole
Event/
task no.
Description Human Error
Probability for a face
3.1 Excess emulsion is loaded into a hole
3.1.1 Excess emulsion is loaded due to wrong density 7.95E-11
3.1.2 Shotfirer does not realise hole is overloaded 1.09E-06
3.2 Wrong design of MIC
3.2.1 Design error by Blasting Engineer 8.52E-05
3.2.2 Failure to detect and correct design error 1.06E-03
E2.2.5 More cartridged sticks loaded into a production hole than required
There are four causes that will lead to more cartridged stick loaded into a
production hole than required:
• Shotfirer does not count number of cartridges he has picked up and loads
too many into a hole. This will be detected towards end of the loading
process as the exact amount of cartridges required for a blast will be
delivered to site.
• Cartridges left over from blocked holes may be disposed of incorrectly.
The Shotfirer may load additional cartridges into the lifter holes to ensure
a good blast. This can be seen as a violation of procedure, although the
Shotfirer will be well aware of the risks he is taking. However, the other
Shotfirer and Blasting Engineer will check the cartridges leftover due to
presence of blocked holes at the end of the loading process. The
probability of presence of blocked holes was assumed as once every week,
two blasts every day.
• The Shotfirers may not realize holes are overloaded in case there are excess
amount of cartridges delivered to site, failure to check for remaining
detonator bundles by Shotfirer and Blasting Engineer towards end of
loading process.
It is noted that each storage box will contain 25 kg cartridges ie 120 sticks
at about 0.208 kg per stick. Generally, several full un-open boxes as a
multiple of 25 kg plus loose sticks (for the balance less than 25 kg) will be
delivered to site depending on the necessary amount for a face. For
example, if a blast requires say 215 kg, there would be 8 full un-open box
and 72 sticks to be delivered to site. In the worst case, an additional full
box delivered instead of loose sticks, the overload per hole is expected to
be less than 2 MIC due to the physical limitation by the hole length and
diameter, and not all holes at a face will be overloaded.
• Wrong design of MIC, as discussed in Section E2.2.5
The human error probabilities associated with more cartridged sticks loaded
into a production hole than required were calculated in Annex F and
summarized in Table 2.13 below.

A10-E15
Table 2.13 Human Error Probabilities for Excess Emulsion Loaded into a Hole
Event/
task no.
Description Human Error Probability for a
face
6-Sector
face
4 sector
face
1-sector
face
4.1 Too many cartridges are inserted in holes
4.1.1 SF does not count correctly and load excess
cartridges into holes
6.64E-02 4.43E-02 2.95E-02
4.1.2 Cartridges from blocked holes are not disposed
of correctly
8.13E-03 8.13E-03 8.13E-03
4.1.3 Shotfirers/Blasting Engineer do not realise holes
are overloaded
1.69E-05 1.69E-05 1.69E-05
4.1.4 Shotfirers/Blasting Engineer do not realise
blocked holes are not disposed of
1.21E-03 1.21E-03 1.21E-03
4.2 Wrong design of MIC
4.2.1 Design error by Blasting Engineer 8.52E-05 8.52E-05 8.52E-05
4.2.2 Failure to detect and correct design error 1.06E-03 1.06E-03 1.06E-03
5. Unforeseen ground conditions
The MIC values derived in the Blast Assessment Reports [1]-[3] are based on
site surveys carried out for sensitive receivers and will be refined using the
trial blast results prior to the full scale blast process of the WIL project. A 3As
(Alert-Alarm-Action) monitoring programme will also be implemented to
continuously monitor any potential exceedance of 25 mm/s for every blast.
All potential causes leading to increase in ground vibration level (such as
deviation of geological condition from the base design) will be investigated
and the root cause will be identified. It was assumed that the unforeseen
ground conditions between the blast faces and the sensitive receivers will be
detected by the 3As programme.
As an additional check on forward ground conditions, the geologist will drill a
horizontal forward probe hole to determine rock quality in advance of the
blast face (usually up to 20m in length). This will help to determine the
geographical condition prior to the actual blast.
E2.3 FAULT TREE ANALYSIS
E2.3.1 Overview
Fault Tree Analysis (FTA) was used to estimate the probability of occurrence
for each failure scenario identified in Section E2.1.
FTA is a technique widely applied to estimate the probability of unwanted
events. It is a technique by which the logical relationships between the
circumstances, equipment failure and human error are examined. The
software package, FaultTree+, was used to construct fault trees for the
estimation of probability of occurrence. FaultTree+ calculated the probability
of occurrence using cutset to model multiple levels of protections, checking
and review process.

A10-E16
The gate symbols are listed in Table 2.14 together with their causal relations.
Table 2.14 Gate Symbols for Fault Tree Models
Gate Symbol Name Causal Relation Valid No.
of Inputs
OR Output event occurs if any one of the
input events occur
≥ 2
AND Output event occurs if all input events
occur
≥ 2
The event symbols used in fault tree models are illustrated in Table 2.15
together with their meanings.
Table 2.15 Event Symbols for Fault Tree Models
Event Symbol Name Meaning
BASIC
System or component event description
Basic event for which failure and repair data is available
TRANSFER Indicates that this part of the fault tree is developed in a
different part of the diagram or on a different page
E2.3.2 Fault Tree Models
The fault tree models (see Attachment F2) were developed for each of the
following failure scenarios associated with the use of explosives.
• Higher vibration due to cut hole error (not applicable for blast faces with 1
sector)
• Higher vibration due to 2 MIC detonated at the same time
• Higher vibration due to 3 MIC detonated at the same time
• Higher vibration due to 4 MIC detonated at the same time
Modelling of Overcharge of Emulsion more than Required
Fault tree models were also developed for the following two failure scenarios.
Since either bulk or cartridged emulsion will be used for a blast face, the one
with higher failure probability was considered as an integral part of the above
models. The overload was considered as one of the causes leading to a
maximum of 2 MIC detonated at the same time as mentioned in the previous
section.
• More cartridged sticks loaded into a production hole than required

A10-E17
• More bulk emulsion explosives loaded into a production hole than
required.
Since the overload could be a maximum of 1 MIC or less than that, it has been
considered that
• For 3 MIC case, charge overload with one error other than overload (ie
design error in time delay, detonator put into a wrong sector, manufacture
defect for a detonator, manufacture defect for a surface connector,
incorrect connection of surface connector) will lead to 3 MIC detonated at
the same time.
• For 4 MIC case, either charge overload with one error other than overload,
or charge overload with two errors other than overload will lead to 4 MIC
detonated at the same time.
Configuration of Fault Tree Models
For the construction of the fault tree models, the number of the errors (failure
modes) required and their combinations need to be considered, as shown
bellow.
• One error leading to 2 MIC detonation at the same time
• Two errors leading to 3 MIC detonation at the same time
• Three errors leading to 4 MIC detonation at the same time
Therefore, the trees have been constructed in such a way that:
• For 3 MIC case, the two errors could be of the same type or different types.
• For 4 MIC case, the three errors could be 3 of same types, or 2 of same type
+ 1 different type, or 3 of different types. In addition, it has been assumed
that “Overcharge of emulsion more than required” plus 1 error other than
overcharge will lead to 4 MIC detonation at the same time, as discussed
above.
Potential Dependency of Human Errors
In order to consider potential dependency of human errors, the probability of
the second human error of the same type was conservatively assumed as 0.01.
Taking Event 2.2 for example, if the human error probability for installation of
a detonator into a wrong hole is 2.10E-06 for a 6-Sector face, the human error
probability for installation of another one detonator into a wrong hole will be
0.01.
E2.3.3 Modelling Results
The modelling results are summarised in Table 2.16.
A10-E18
Table 2.16 Probability of Occurrence per Face
Probability of Occurrence Per Face
Scenarios 6 Sectors 4 Sectors 1 Sector
Higher vibration due to cut hole
error
1.97E-05 1.97E-05 -
Higher vibration due to 2 MIC
detonated at the same time
7.53E-05 7.89E-05 5.65E-05
Higher vibration due to 3 MIC
detonated at the same time
2.10E-07 2.46E-07 9.95E-08
Higher vibration due to 4 MIC
detonated at the same time
1.34E-09 1.25E-09 1.04E-09
Others
More cartridged sticks loaded into
a production hole than required
1.91E-06 1.54e-06 7.89E-07
More bulk emulsion explosives
loaded into a production hole than
required
1.24E-06 1.24E-06 1.24E-06
As shown in Table 2.16, the probability of occurrence for overload of bulk
emulsion into holes is higher than that for overload of cartridged sticks into
holes. The overload of bulk emulsion was therefore considered in the models
for the failure scenarios of more than 1 MIC detonated at the same time.
Table 2.16 shows that the probability of occurrence of multiple MIC detonated
at the same time will generally reduce as additional error is required to result
in one more MIC going off together.
As mentioned in Section E2.2.3 above, if there are design errors not readily
detected by the robust design check or more number detonators which have
time delay coinciding with the ones already in the face due to manufacturer
defect, it is possible to have more than 4 MIC detonated at the same time.
Considering the probability of each additional error for either design or
manufacturing of detonator is 0.01, the occurrence probability for each
additional MIC detonated at the same time will be roughly 2 order of
magnitude lower each time, ie the occurrence probability for 5 MIC detonated
at the same of 10-11 per face, that for 6 MIC detonated at the same time will be
in the order of magnitude of 10-13 per face, that for 7 MIC will be in the order
of magnitude of 10-15 per face.
It was conservatively assumed that the occurrence probability of 5 and 6 MIC
detonated at the same time will be the same as that for 4 MIC detonated at the
same time for hazard assessment purpose. For detonation of more than 6 MIC
at the same time, the derived frequencies are very low, ie negligible and hence
will not be considered further.
E2.4 OVERALL FREQUENCY FOR FAILURE SCENARIOS
The overall frequency of failure scenarios leading to higher vibration for the
whole WIL project are summarised as below. It may be noted that blasting
will be spread over a few years.

A10-E19
Table 2.17 Overall Frequency for Failure Scenarios leading to Higher Vibration for the
Whole Project
Occurrence Frequency for multiple MIC detonated at
the same time per Section (Occurrence per project)
Sections Blast
Linear
Length 2MIC 3MIC 4MIC 5MIC 6MIC
WIL Alignment 9.3 km 4.09E-01 1.16E-03 6.86E-06 6.86E-06 6.86E-06
WIL Magazine Store 0.4 km 1.05E-02 2.73E-05 1.89E-07 1.89E-07 1.89E-07
Overall for WIL
project
9.7 km 4.19E-01 1.19E-03 7.05E-06 7.05E-06 7.05E-06
Notes: The Blast Linear Length refers to the total pull length by the drill and blast operation. For
the WIL alignment, the blast linear length includes the two running tunnels, two station blocks
and associated adits. For the WIL Magazine Store, the blast linear length covers the access tunnel
and 9 niches.
E2.5 CONSERVATISM BUILT INTO THE FAULT TREE ANALYSIS
The following conservatism have been built into the models, these include:
• The probability of 5 or 6 MIC detonated at the same time was assumed to
be the same as that of 4 MIC detonated at the same time.
• The estimation of the probability of the overload of cartridges into holes
does not take credit that the amount of over-delivery or number of blocked
holes in a face is limited. In addition ,the probability of a hole being
overloaded and at the same time it has a detonator of same time delay
being misplaced have not been taken into consideration. The maximum
overload of a hole could be 1 MIC or less depending on the charge length
and load. It was however conservatively considered both cases in the fault
models.
• A surface connector once connected to appropriate detonators/ surface
connectors, it will be wrapped by tapes to prevent accidental connection
with other detonators/ surface connectors. It is therefore seldom to have
multiple wrong connections to a surface connector at a time. This has not
been taken into consideration into the fault tree models.
• The blast faces were categorised into 6-sector, 4 sector or 1-sector faces in
the study, however the number of the production holes varies depending
on the cross-sectional area of a face. The biggest cross-section, ie the
maximum number of production holes, of the same face category was
assumed for the study.

A10-E20
E3 REVIEW OF HISTORICAL BLAST DATA IN HONG KONG
E3.1 INCIDENT DATA IN HONG KONG
E3.1.1 Territory-wide Data
According to the Hong Kong SAR Government’s Annual Controlling Officers
Report, there were 36,062 blasts carried out between 1997 and 2007 (see Table
3.1).
Table 3.1 Tonnes of Explosives Consumed and Number of Blasting Activities (1997-
2007)
Year Tonnes of Explosives Consumed No. of Blast Faces
1997 4,172 2,493
1998 3,600 4,865
1999 2,790 8,350
2000 3,250 6,880
2001 2,120 2,164
2002 1,792 1,770
2003 2,083 1,503
2004 2,339 3,409
2005 2,627 3,053
2006 876 711
2007 943 864
Total 26,592 36,062
A summary of the incidents that had taken place during these 36,062 blasts is
presented in Table 3.2. It can be seen that 6 incidents are associated with
flyrock, while one incident relates to blast induced slope failure. All these
incidents had occurred from surface blasting and hence not applicable to this
study.
Table 3.2 Summary of Blasting Incidents (1997 - 2007) [Note 1]
Year Date Site Incident type / Probable Causes [Note 2]
Consequence
1997 4-Dec-97 Sau Mau Ping, Kowloon
Blast induced slope failure
No injury or damage. Road blocked.
1999 9-Jul-99 Sau Mau Ping, Kowloon
Flyrock (250m) Injury to 1 person
14-Sep-99 Sau Mau Ping, Kowloon
Flyrock (260m) Injury to 3 persons and damage to properties
2001 19-May-01 Sau Mau Ping, Kowloon
Flyrock (250m) No injury or damage
2003 17-Feb-03 Jordan Valley, Kowloon
Flyrock (115m) Damage to properties
6-Jun-03 Jordan Valley, Kowloon
Flyrock (230m) Injury to 9 persons and damage to properties
26-Jun-03 Penny's Bay, Lantau Island
Flyrock (150m) No injury or damage
Notes:
[1] Blasting incidents are considered as cases of serious consequence such as flyrock or blast
induced slope failure causing potential injuries, fatality, damage to structures, vehicles etc.
[2] Figure given within bracket is the approximate maximum flyrock distance from the blast
location

A10-E21
All blasts for the WIL will be carried out underground, therefore, flyrock
incidents are not relevant to WIL as blast doors are provided and kept closed
during blasting.
The blast induced slope failure was the result of vibration impacting a water
lubricated sheeting joint above Sau Mau Ping Road, which collapsed on the
road. This incident may be considered as relevant to the WIL, as it was caused
by ground vibration.
The probability of a blast induced slope failure can be estimated as 2.8E-05 per
blast (ie once every 36,062 blasts) based on the above data. However, it is
important to note that the total number of blasts in the last 10 years is only 6
times the number of blasts that will be carried out for the WIL, and therefore it
is not sufficiently large enough to verify the results from the fault tree
analysis.
Details of near miss incidents eg of the type discussed above, are not available,
hence it is not possible to verify the assumptions here. Also details of the
incident that cause slope failure is not available, hence it is not possible to
determine the root cause that led to the blast induced slope failure.
If it is assumed that any failure scenario on a blast face as investigated in
Section E2 lead to this failure, then the probability of a failure will be 5.7E-05
per face assuming benching (1-sector face) blasting, based on the probability
give in Table 2.16. The value predicted by the fault tree analysis is similar to
the historical data.
E3.1.2 Tunnel Blasting Projects in Hong Kong
The territory-wide data presented in Section E3.1 above consist of all types of
blasting activities carried out in Hong Kong. Therefore, specific data for tunnel
projects using drill-and-blast construction method in Hong Kong since 1995
have been scrutinised and detailed in Table 3.3.
It can be seen that more than 8,600 blasts has been carried out for the tunnel
projects in Hong Kong, without any reported cases for vibration induced
damage to buildings or slopes. Since the number of blasts are not significantly
higher than the estimated number of blasts in WIL (ie about 5,660), these data
are not sufficient large enough to draw any conclusion on the occurrence
probability for accident scenarios for blasting.

A10-E22
Table 3.3 Tunnel Projects in Hong Kong since 1995
Explosives Quantities Used Charge Weights Project Drill &
Blast
Tunnel
Lengths
(m)
Rock
Blasting
Quantities
(m³)
From To No of
Blasts /
Rounds
No of
Holes
Fired
High
Explosives
(Kgs)
Emulsion
(Kgs)
Detonators
(nos)
Aver
(kg/delay)
Max
(kg/delay)
Blast
Damage-
related
complaints
MTR Projects
Airport Railway, East Lantau Tunnels 1,940 61,123 Apr-95 Feb-96 552 [Note 2]
Airport Railway, Tsing Yi Tunnels 3,550 [Note 2]
Airport Railway, Lai King Station & Tunnels [Note 2]
QBR, North Point Station Modification &
Tunnels
1,525 170,000 Jun-99 Oct-99 2,997 209,790 126,200 229,634 2.47 6.67 [Note 2]
Tseung Kwan O, Black Hill Tunnels 7,200 1,440,000 Apr-99 May-00 1,200 96,000 None
Tseung Kwan O, Pak Shing Kok Tunnels 7,200 1,440,000 Jul-99 May-00 1,200 96,000 None
Disneyland, Penny’s Bay Line Tunnel 800 160,000 Jul-99 May-00 240 19,200 6,000 38,000 17,000 4.35 5.00 None
Queensway Subway at 3PP 300 65,400 Apr-04 Sep-05 300 24,000 16,438 0 72,228 0.35 0.90 None
Former KCRC Projects
West Rail, DB-350 2,555 279,950 Nov-99 Feb-01 548 85,790 43,444 397,755 93,977 5.03 15.05 None
Highways Dept Projects
Route 9, Eagles Nest Tunnels [Note 2]
Route 9, Shatin Heights Tunnels 1,765 322,381 Oct-03 Jun-05 534 92,916 217,665 84,650 102,208 1.43 3.84 2
(unproven)
[Note 1]
R3 Country Park (Tai Lam) Tunnels – South
drive
[Note 2]
R3 Country Park (Tai Lam) Tunnels - North drive 3,700 490,000 Jun-95 Jul-98 740 134,680 26,000 715,000 135,000 30.00 55.00 None
Others
Ocean Park 1,120 73,610 Oct-07 May-08 290 34,220 13,385 91,249 34,358 3.60 6.40 None
Total 31,655 4,502,464 8,601 792,596 449,132 1,326,654 684,405
Notes:
[1] The two cases are unproven to be blast-related.
[2] No blast induced damage is considered since the reported case in Table 3.2 is not relevant to this project.
[3] No data is available at the time this report is compiled for those entries highlighted in yellow.

A10-E23
E4 REFERENCES
[1] SINTEF Industrial Management, Offshore Reliability Data, 4th edition,
2002.
[2] MTR, West Island Line, Consultancy Agreement C703, SYP and UNV
Stations, and SHW to KET Tunnel, Blast Assessment Report, Volume 1-8,
June 2008
[3] MTR, West Island Line, Consultancy Agreement C704, KET Station and
Overrun Tunnel, Modifications to SHW Station, Blast Assessment Report,
Volume 1-3, July 2008
[4] MTR, West Island Line, Consultancy Agreement C703, SYP and UNV
Stations, and SHW to KET Tunnel, Explosives Magazine at Victoria Road
Controlling Blast Report, June 2008

Attachment E1
High-Level Failure Mode
Analysis

E1 High-Level Failure Mode Analysis
No. Failure Modes
1.1 Wrong hole diameter for
relief holes at cut
1. Wrong design 1. Insufficient relief. Possible freeze of
blast face. Increase vibration (about
30% to 40% increase in vibration than
the expected vibration for a given MIC,
in addition, the vibration at perimeter
of a face will also increase)
1. The blasting plan is checked by
blast engineer/ RE and Mines
Division
2. Wrong location of drilling
or incorrect drill size being
used due to human error
1. Same as consequence for cause 1 1. Only two diameters of holes
will be used. The size of relief
hole is larger than cut and
production holes. Hole position
and diameter checked against
blast plan and actual blast
requirements by blast engineer/
RE and Mines Division.
Obvious situation easy to detect
1. For those critical faces which
have potential exceedance of
acceptable PPV value in case of
face freeze, consider
independent check of the size of
relief holes
1. Diameter of relief holes is 127mm while that
for production and perimeter holes is 45mm
1.2 Wrong time delay at cut 1. Wrong design 1. The cut holes do not detonate at correct
sequence and the cut cannot be ejected
to provide a void for relief before the
production holes detonate. Insufficient
relief. Possible freeze of blast face.
Increase vibration (about 30% to 40%
increase in vibration than the expected
vibration for a given MIC, in addition,
the vibration at perimeter of a face will
also increase)
1. The blasting plan is checked by
blast engineer/ RE and Mines
Division
2. Wrong installation (one
detonator of longer time
delay from other sector put
into the cut due to human
error)
1. The cut will be ejected if only one or
two detonators do not detonate as
required.
1. The detonator delay tag number
will be checked before and after
loading by Shot-Firer
1. Unfolding of the coil of
detonators will be done at the
late stage so label of detonator
can be checked for any incorrect
placement if necessary
3. Manufacture defect of
detonators
1. Detonators does not fire or fire at a
wrong time (The cut will be ejected if
only one or two detonators do not
detonate as required). If the wrong time
delay coincides with the time delay of
another detonators (ie two MIC going
off together), vibration will increase
1. QA/ QC by manufacturer with
certificate provided
Cause Consequence RemarksPotential Mitigation MeasuresDetection
1 of 5
No. Failure Modes Cause Consequence RemarksPotential Mitigation MeasuresDetection
2.1 Two MIC detonated in
phase
1. 1 detonator wrongly put
into one sector which
contains the same time
delay detonator
1. Increased vibration due to two MIC
going off together (if a shorter time
delay detonator put into an outer hole
ie longer time delay hole, about 30%
increase in vibration)
1. The detonator delay tag number
will be checked before and after
loading by Shot-Firer
1. Unfolding of the coil of
detonators will be done at the
late stage so label of detonator
can be checked for any incorrect
placement if necessary
1. Due to inherent manufacture scatter, 50%
chance assumed for MIC of same time delay
detonated at the same time
2. Incorrect timer default of
detonators due to
manufacture defect
1. Increased vibration due to two MIC
going off together
1. QA/ QC by manufacturer with
certificate provided
1. Same remarks for cause 1 above
2. In addition, the defect must be such as it
coincides with another detonator
3. Surface connector fails to
provide necessary delay
1. Increased vibration due to two MIC
going off together.
1. QA/ QC by manufacturer with
certificate provided
1. Same remarks for cause 1 above
4. One detonator of a sector
connected wrongly to a
surface connector of
another sector (mis-wiring)
1. Increased vibration due to two MIC
going off together
1. Final hook-up check will be
carried out by Blast Engineer,
two Shot-Firers and Mines
Department/ER after loading of
emulsion. Obvious situation
easy to detect
1. Unfolding of the coil of
detonators will be done at the
late stage so label of detonator
can be checked for any incorrect
placement if necessary
1. Same remarks for cause 1 above
5. Use of a wrong surface
connector
1. Increased vibration due to two MIC
going off together
1. Colour coding and labelling of
time delay of surface connector.
Obvious situation easy to detect
1. For a face with 3 sectors, if a 17 ms is
wrongly connected from 1st to 3rd sector
instead from 2nd to 3rd sector, two MIC will
go off together.
For a face with 4 sectors, if the 9 ms is
wrongly connected from 2nd to 4th sector,
two MIC will go off together.
For a face with 4 sectors, if the 9 ms is
wrongly connected from 2nd to 4th sector,
3rd to 5th sector, or 4th to 6th sector, then
two MIC will go off together.2. The surface connectors will be
activated sequentially
3. Final hook-up check will be
carried out by Blast Engineer,
two Shot-Firers and Mines
Division/ER after loading of
emulsion.
6. Wrong design in time delay 1. Increased vibration due to two MIC
going off together
1. The blasting plan is checked by
blast engineer/ RE and Mines
Division
2 of 5

No. Failure Modes Cause Consequence RemarksPotential Mitigation MeasuresDetection
3.1 Maximum 4 holes
detonated in phase (for
face with 4 or 6 sectors)
1. 3 detonators wrongly put
into one sector which
contains the same time
delay detonator
1. Increased vibration due to four MIC
going off together. (if a shorter time
delay detonator put into an outer hole
ie longer time delay hole, about 30%
increase in vibration)
1. The detonator delay tag number
will be checked before and after
loading by Shot-Firer
1. Unfolding of the coil of
detonators will be done at the
late stage so label of detonator
can be checked for any incorrect
placement if necessary
1. The detonator for the first blast hole in the
5th and 6th sectors has a longer time delay
than other sectors. It is expected that a
maximum 4 MIC of same time delay will be
used for a face of tunnel
2. Due to inherent manufacture scatter, 50%
chance assumed for MIC of same time delay
detonated at the same time
2. Incorrect timer default of
detonators due to
manufacturer defect
1. Increased vibration due to four MIC
going off together
1. QA/ QC by manufacturer with
certificate provided
1. Same remarks for cause 1 above
2. In addition, the defect must be such as it
coincides with another detonator
3. Surface connector fails to
provide necessary delay
1. Increased vibration due to four MIC
going off together.
1. QA/ QC by manufacturer with
certificate provided
1. Same remarks for cause 1 above
4. Same time delay detonator
of other 3 sectors connected
wrongly to a surface
connector of a sector (mis-
wiring)
1. Increased vibration due to four MIC
going off together
1. Final hook-up check will be
carried out by Blast Engineer,
two Shot-Firers and Mines
Division/ER after loading of
emulsion. Obvious situation
easy to detect
1. Unfolding of the coil of
detonators will be done at the
late stage so label of detonator
can be checked for any incorrect
placement if necessary
1. Same remarks for cause 1 above
5. Use of 3 wrong surface
connectors
1. Increased vibration due to four MIC
going off together
1. Colour coding and labelling of
time delay of surface connector.
Obvious situation easy to detect
1. Not a credible case unless incorrect surface
connector collected from Magazine store
2. The surface connectors will be
activated sequentially
3 of 5

No. Failure Modes Cause Consequence RemarksPotential Mitigation MeasuresDetection
3. Final hook-up check will be
carried out by Blast Engineer,
two Shot-Firers and Mines
Division/ER after loading of
emulsion. Obvious situation
easy to detect
6. Wrong design in time delay 1. Increased vibration due to two MIC
going off together
1. The blasting plan is checked by
blast engineer/RE and Mines
Division
4.1 More cartridged sticks
loaded into a production
hole than required
1. Cartridges left unused since
a hole cannot be loaded due
to unforeseen ground
condition. The cartridges
are loaded into another
hole due to human error
1. Increased vibration due to increase in
MIC
1. Blast Engineer, Shot-Firer and
Mines Division/ER will be
aware that a hole cannot be
loaded due to unforeseen rock
condition during placement of
detonators. Cartridge leftover
are expected at the end of
charging process. They will be
removed from blast face before
firing and destroyed by burning
at site
1. It is unable to load more cartridge than the
hole design. The maximum amount of
emulsion to be loaded will be less than 33%
MIC for a hole
2. Human error in counting
sticks during loading and
leading to more than
required cartridged sticks
in a hole
1. Increased vibration due to increase in
MIC
1. Total number of cartridges for a
face is determined, based on
design
1. Remarks same as Cause 1 above
2. Precise number of cartridges to
be used for a face will be
delivered to site. Insufficient
number of cartridge will be
obvious towards end of loading
process
1. In case excess cartridges in a hole
is identified, it will be removed
6. Wrong MIC calculation in
design
1. The calculated charge may be higher
than the acceptable level that the
sensitive receiver can take
1. The blast assessment report is
checked by blast engineer/ RE
and Mines Division
4.2 More bulk emulsion
explosives loaded into a
production hole than
required
1. Malfunction of totalizer on
the bulk emulsion truck to
check the amount of gassed
bulk emulsion to a hole and
the total amount to a face
1. Increased vibration due to increase in
MIC
1. Loading hose of bulk emulsion
will be marked for charge
length prior to start of the
charging process. The charge
process will be ceased when
mark appears out of hole
1. In case excess bulk emulsion in a
hole is identified, it can be
washed out. The hole will be
recharged correctly
1. It is unable to load bulk emulsion than the
hole design. The maximum amount of
emulsion to be loaded will be less than 2
MIC for a hole
4 of 5
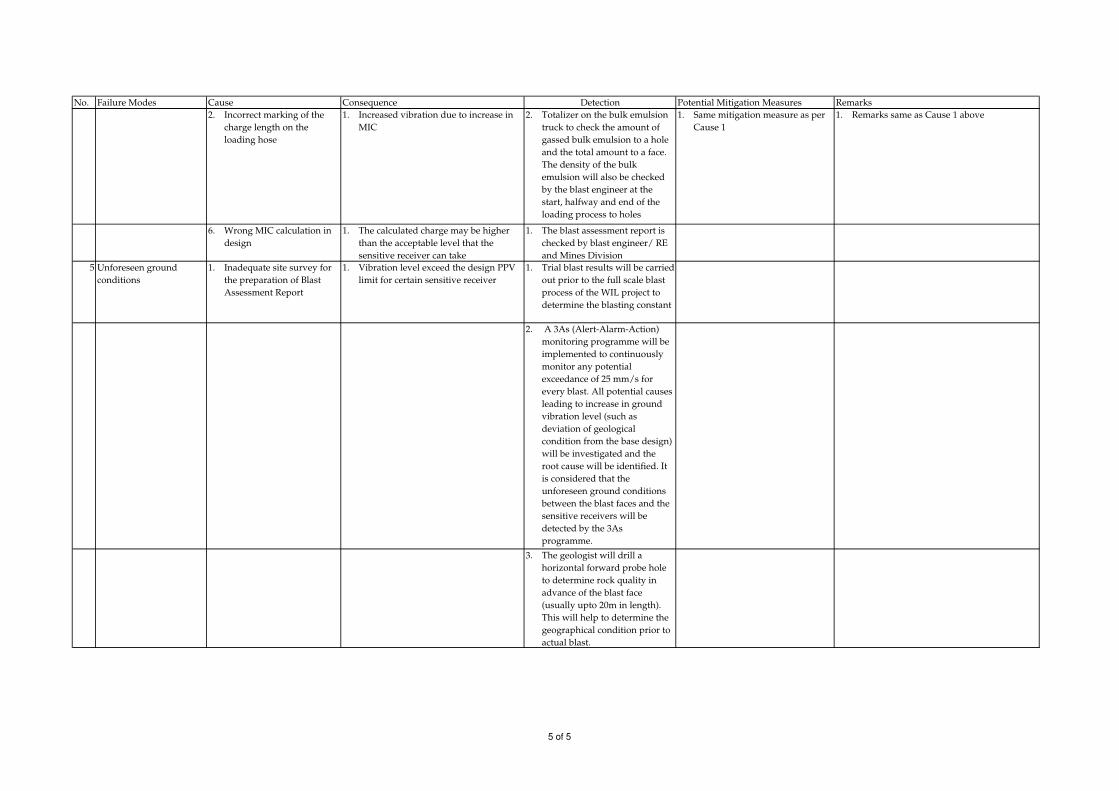
No. Failure Modes Cause Consequence RemarksPotential Mitigation MeasuresDetection
2. Incorrect marking of the
charge length on the
loading hose
1. Increased vibration due to increase in
MIC
2. Totalizer on the bulk emulsion
truck to check the amount of
gassed bulk emulsion to a hole
and the total amount to a face.
The density of the bulk
emulsion will also be checked
by the blast engineer at the
start, halfway and end of the
loading process to holes
1. Same mitigation measure as per
Cause 1
1. Remarks same as Cause 1 above
6. Wrong MIC calculation in
design
1. The calculated charge may be higher
than the acceptable level that the
sensitive receiver can take
1. The blast assessment report is
checked by blast engineer/ RE
and Mines Division
5 Unforeseen ground
conditions
1. Inadequate site survey for
the preparation of Blast
Assessment Report
1. Vibration level exceed the design PPV
limit for certain sensitive receiver
1. Trial blast results will be carried
out prior to the full scale blast
process of the WIL project to
determine the blasting constant
2. A 3As (Alert-Alarm-Action)
monitoring programme will be
implemented to continuously
monitor any potential
exceedance of 25 mm/s for
every blast. All potential causes
leading to increase in ground
vibration level (such as
deviation of geological
condition from the base design)
will be investigated and the
root cause will be identified. It
is considered that the
unforeseen ground conditions
between the blast faces and the
sensitive receivers will be
detected by the 3As
programme.
3. The geologist will drill a
horizontal forward probe hole
to determine rock quality in
advance of the blast face
(usually upto 20m in length).
This will help to determine the
geographical condition prior to
actual blast.
5 of 5

Attachment E2
Fault Tree Models for Use
of Explosives

2-MIC
Higher vibrationdue to 2 MIC
detonated at thesame time
2MIC-WD
Wrong design intime delay ofone detonator
Page 7
W-DETON-2.1
1 detonator w rongly put
into one sector w hich
contains the same time
delay detonator
Page 8
W-DETON-SC-2.1
One detonator of a
sector connected
w rongly to a surface
connector of another
sector
Page 9
W-SC-2.1
Use of a wrongsurface
connector
Page 10
OL-EMULSION
Overcharge ofemulsion morethan required
11,24,25,26,..
W-MD-DETON-2.1
Manufacturer defect of
one detonator such tat
time delay corresponds
to another one
W-MD-SC-2.1
Manufacturer defect of
one surface connector
such tat time delay
corresponds to another
one
OL-C
Too muchcartridged
emulsion loadedinto hole
Page 5
Page 1 of 45

3-MIC
Higher vibrationdue to 3 MIC
detonated at thesame time
3WD
Wrong designin time delay oftwo detonators
Page 17
3W-DETON
2 detonator wrongly put
into one sector which
contains the same time
delay detonator
Page 12
3W-SC
Use of twowrong surface
connectors
Page 14
3W-DETON-SC
Two detonators of other
sectors connected
wrongly to a surface
connector of another
sector
Page 13
3MD-D
Incorrect timerdefault of 2
detonators due tomanufacturer defect
Page 15
3MD-SC
Surface connector
fails to provide
necessary delay due
to manufacturer defect
Page 16
3COMB
3 MIC detonated atthe same time (dueto combination oftwo type of errors)
Page 11
Page 2 of 45

4-MIC
Higher vibrationdue to 4 MIC
detonated at thesame time
4-MIC-WI-1
4 MIC detonated (dueto same error
occurred three times)at the same time
Page 22
4-MIC-WI-2
4 MIC detonated (dueto same error occurred
two times and oneother error) at the
same time
Page 23
4-MIC-WI-3
4 MIC detonated (dueto three different errors
occur at the sametime) at the same time
Page 24
4-MIC-WI-4
4 MIC detonated (dueto charge overload andone other error occurat the same time) at
the same time
Page 25
Page 3 of 45
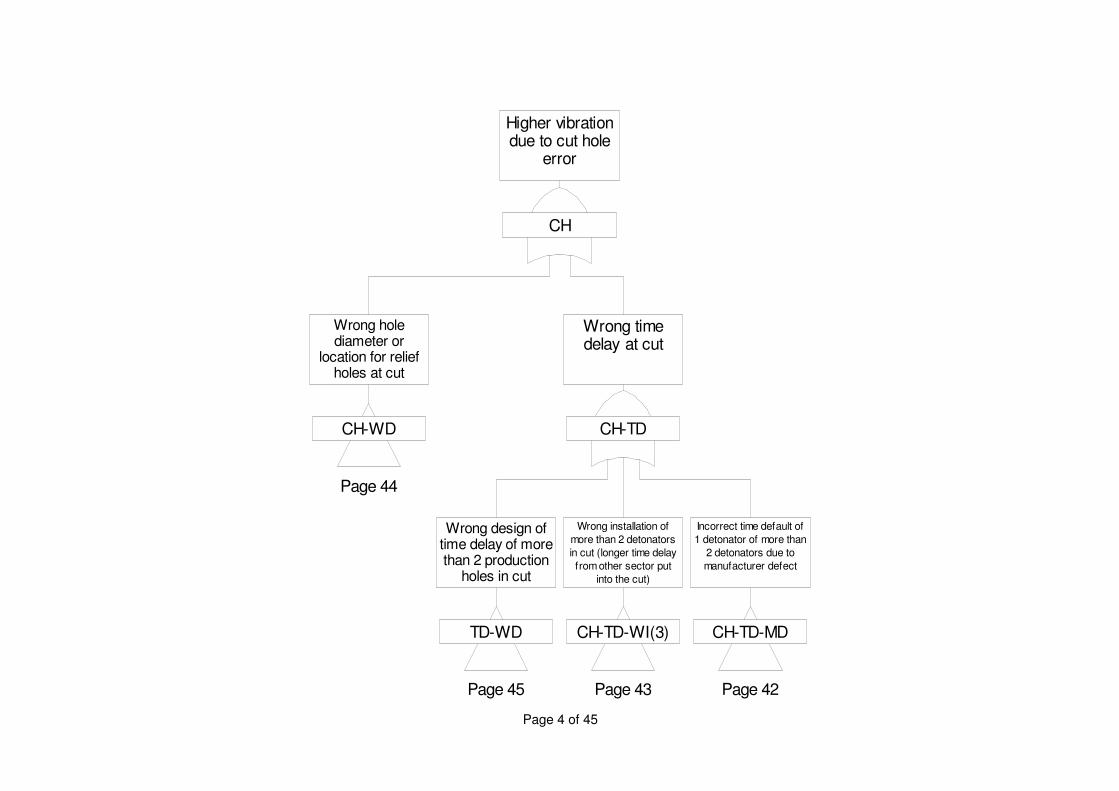
CH
Higher vibrationdue to cut hole
error
CH-WD
Wrong holediameter or
location for reliefholes at cut
Page 44
CH-TD
Wrong timedelay at cut
TD-WD
Wrong design oftime delay of morethan 2 production
holes in cut
Page 45
CH-TD-WI(3)
Wrong installation of
more than 2 detonators
in cut (longer time delay
from other sector put
into the cut)
Page 43
CH-TD-MD
Incorrect time default of
1 detonator of more than
2 detonators due to
manufacturer defect
Page 42
Page 4 of 45

OL-C
Too much cartridgedemulsion loaded into
hole
1,11,24,25,26,28,30,33,35,37
OL-C-E1
Too many
cartridges are
inserted in holes
OL-C-BH-E1
Cartridges fromblocked holes
inserted in otherholes and not
detected
HE-OL-C-BH
Blocked holes
are not
disposed of
OL-C-BH
Probability of
blocked holes
WD-OL
Design error byBlasting Engineer
and failure of designcheck and correction
WD-OL-R
Failure by RE andMD to detect and
correct design error
OL-C-CO
SF does not
count correctly
HE-OL-C-R
SFand BE don't
realise hole is
overloaded
OL-WD
Wrong design
in MIC
6
OL-C-E
Too many cartridgesare inserted in holes
and not realised
OL-C-BH-E
Cartridges fromblocked holes
inserted in otherholes
HE-OL-C-BH-R
SF and BE don't
realise hole is
overloaded
Page 5 of 45

OL-B
Too much bulk
emulsion loaded
into hole
OL-WD
Wrong design
in MIC
5
OL-B-E
Too many bulkemulsion are loaded
in holes and notrealised
OL-DC-1
Wrong density
check due to
human error
OL-B-WG
Scale out of
calibration/
malfunction
HE-B-FM
Gassing flow
meter
malfunction
OL-DC-1
Wrong density
check due to
human error
OL-DC-2
Wrong density checkdue to mechanical
failure
WD-OL
Design error byBlasting Engineer
and failure of designcheck and correction
WD-OL-R
Failure by RE andMD to detect and
correct design error
OL-DC
Incorrect
Density Check
OL-B-HO
TO, SF and BE
don't realise hole
is overloaded
Page 6 of 45
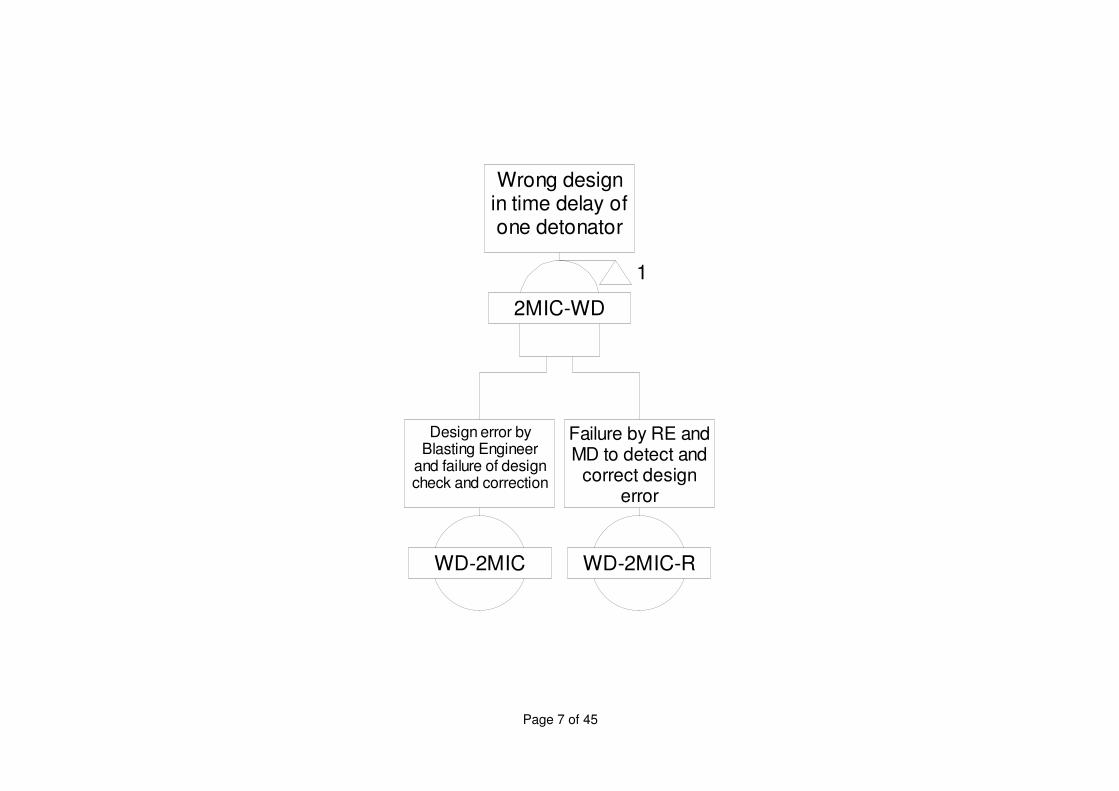
2MIC-WD
Wrong designin time delay ofone detonator
1
WD-2MIC
Design error byBlasting Engineer
and failure of designcheck and correction
WD-2MIC-R
Failure by RE andMD to detect and
correct designerror
Page 7 of 45

W-DETON-2.1
1 detonator wrongly putinto one sector which
contains the same timedelay detonator
1
HE-WS-2.1
Wrong installationof one detonatorin another sector
HE-WS-R-2.1
SF fails todetect &
correct error
HE-WS-US-2.1
The sectorcontains the
same time delaydetonator
Page 8 of 45
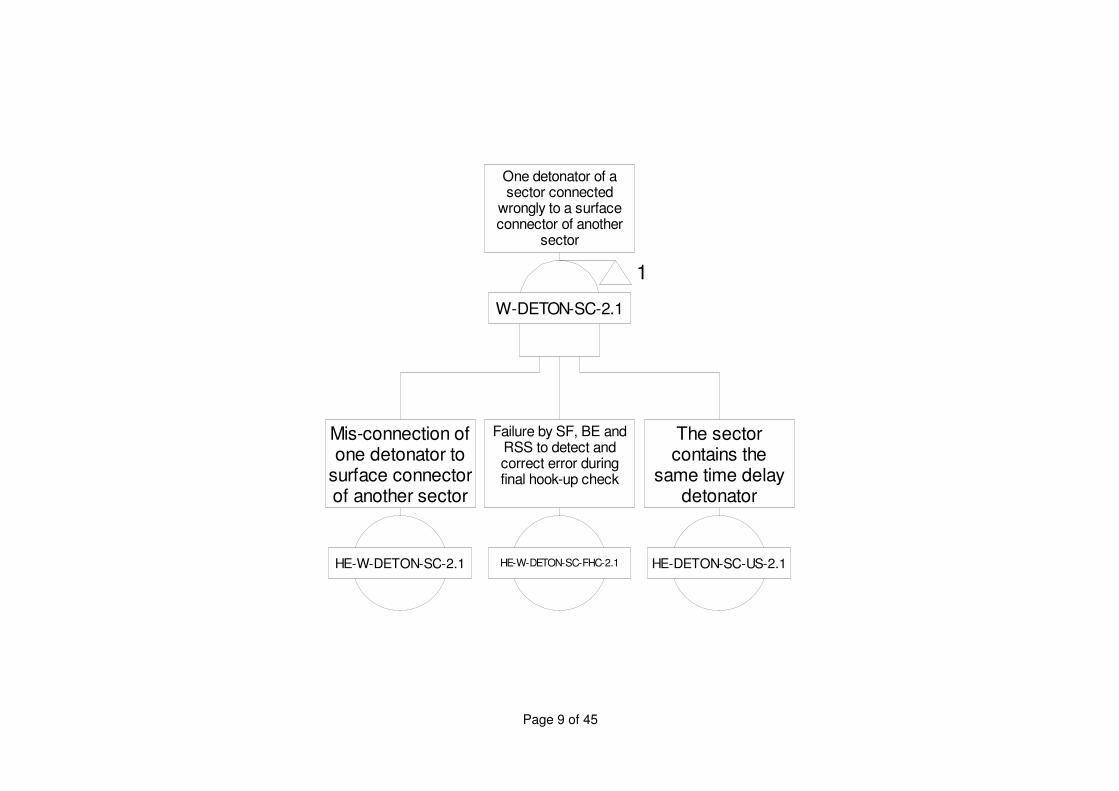
W-DETON-SC-2.1
One detonator of asector connected
wrongly to a surfaceconnector of another
sector
1
HE-W-DETON-SC-2.1
Mis-connection ofone detonator to
surface connectorof another sector
HE-W-DETON-SC-FHC-2.1
Failure by SF, BE andRSS to detect andcorrect error duringfinal hook-up check
HE-DETON-SC-US-2.1
The sectorcontains the
same time delaydetonator
Page 9 of 45

W-SC-2.1
Use of a wrongsurface
connector
1
HE-WSC-2.1
Wrong installationof one surface
connector
HE-WSC-R-2.1
SF fails todetect &
correct error
HE-WSC-FHC-2.1
Failure by SF, BEand MD to detect andcorrect error duringfinal hook-up check
Page 10 of 45

3COMB
2
3 MIC detonated atthe same time (dueto combination oftwo type of errors)
2
OL-C
Too muchcartridged
emulsion loadedinto hole
Page 5
3WD-3.1
Wrong design intime delay ofone detonator
Page 18
W-DETON-3.1
1 detonator w rongly put
into one sector w hich
contains the same time
delay detonator
Page 19
W-DETON-SC-3.1
One detonator of a
sector connected
w rongly to a surface
connector of another
sector
Page 20
W-SC-3.1
Use of a wrongsurface
connector
Page 21
OL-EMULSION
Overcharge ofemulsion morethan required
1,24,25,26,..
W-MD-DETON-3.1
Manufacturer defect of
one detonator such tat
time delay corresponds
to another one
W-MD-SC-3.1
Manufacturer defect of
one surface connector
such tat time delay
corresponds to another
one
Page 11 of 45
3W-DETON
2 detonator w rongly put
into one sector w hich
contains the same time
delay detonator
2
W-DETON-3.1
1 detonator w rongly put
into one sector w hich
contains the same time
delay detonator
Page 19
W-DETON-3.2
1 detonator w rongly put
into one sector w hich
contains the same time
delay detonator
W-DETON-3.2
Wrong installation of one
detonator in another
sector & failure to
detection/correction
HE-WS-US-3.1.2
The sectorcontains the
same time delaydetonator
Page 12 of 45

3W-DETON-SC
Tw o detonators of other
sectors connected
w rongly to a surface
connector of another
sector
2
W-DETON-SC-3.1
One detonator of a
sector connected
w rongly to a surface
connector of another
sector
Page 20
W-DETON-SC-3.2
Another one detonator
of a sector connected
w rongly to a surface
connector of another
sector
W-DETON-SC-3.2
Mis-connection of one
detonator to surface
connector of another
sector and failure to
detection/correction
HE-DETON-SC-US-3.1.2
The sectorcontains the
same time delaydetonator
Page 13 of 45

3W-SC
Use of twowrong surface
connectors
2
W-SC-3.1
Use of a wrongsurface
connector
Page 21
HE-WSC-3.2
Use of a wrongsurface
connector
Page 14 of 45

3MD-D
Incorrect timerdefault of 2
detonators due tomanufacturer defect
2
W-MD-DETON-3.1
Manufacturer defect ofone detonator such tattime delay corresponds
to another one
W-MD-DETON-3.2
Manufacturer defect ofthe another detonatorsuch that time delay
corresponds to anotherone
Page 15 of 45

3MD-SC
Surface connector failsto provide necessary
delay due tomanufacturer defect
2
W-MD-SC-3.1
Manufacturer defect ofone surface connector
such tat time delaycorresponds to another
one
W-MD-SC-3.2
Manufacturer defect ofanother surface
connector such tattime delay corresponds
to another one
Page 16 of 45
3WD
Wrong designin time delay oftwo detonators
2
3WD-3.1
Wrong designin time delay ofone detonator
Page 18
3WD-3.2
Wrong designin time delay ofone detonator
Page 17 of 45

3WD-3.1
Wrong designin time delay ofone detonator
11,17
WD-3.1
Design error byBlasting Engineer
and failure of designcheck and correction
WD-R-3.1
Failure by RE andMD to detect and
correct designerror
Page 18 of 45

W-DETON-3.1
1 detonator wrongly putinto one sector which
contains the same timedelay detonator
11,12
HE-WS-3.1
Wrong installationof one detonatorin another sector
HE-WS-R-3.1
SF fails todetect &
correct error
HE-WS-US-3.1.1
The sectorcontains the
same time delaydetonator
Page 19 of 45

W-DETON-SC-3.1
One detonator of asector connected
wrongly to a surfaceconnector of another
sector
11,13
HE-W-DETON-SC-3.1
Mis-connection ofone detonator to
surface connectorof another sector
HE-W-DETON-SC-FHC-3.1
Failure by SF, BE andRSS to detect andcorrect error duringfinal hook-up check
HE-DETON-SC-US-3.1.1
The sectorcontains the
same time delaydetonator
Page 20 of 45

W-SC-3.1
Use of a wrongsurface
connector
11,14
HE-WSC-3.1
Wrong installationof one surface
connector
HE-WSC-R-3.1
SF fails todetect &
correct error
HE-WSC-FHC-3.1
Failure by SF, BE andRSS to detect andcorrect error duringfinal hook-up check
Page 21 of 45
4-MIC-WI-1
4 MIC detonated (dueto same error
occurred three times)at the same time
3
4WD(3)
Wrong design intime delay of
three detonators
Page 38
4W-DETON(3)
Three detonatorswrongly put into one
sector which containsthe same time delay
detonator
Page 31
4W-DETON-SC(3)
One detonator for eachof three sectors
connected wrongly to asurface connector of
another sector
Page 34
4W-SC(3)
Use of threewrong surface
connectors
Page 36
4MD-D(3)
Incorrect timerdefault of 3
detonators due tomanufacturer defect
Page 27
4MD-SC(3)
3 Surface connectorsfail to provide
necessary delay due tomanufacturer defect
Page 29
Page 22 of 45

4-MIC-WI-2
4 MIC detonated (dueto same error occurred
two times and oneother error) at the
same time
3
4WD(2)+OTH
Wrong design intime delay of two
detonators plus oneother type of errors
Page 37
4W-DETON(2)+OTH
2 detonators wrongly put
into one sector which
contains the same time
delay detonator plus one
other type of errors
Page 30
4W-DETON-SC(2)+OTH
One detonator for each of
two sectors connected
wrongly to a surface
connector of another sector
plus one other error
Page 33
4W-SC(2)+OTH
Use of two wrongsurface connectorsplus one other type
of errors
Page 35
4MD-D(2)+OTH
Incorrect timer defaultof 2 detonators due tomanufacturer defectplus one other type of
errors
Page 26
4MD-SC(2)+OTH
2 Surface connectors fail
to provide necessary
delay due to manufacturer
defect plus one other type
of errors
Page 28
Page 23 of 45

4-MIC-WI-3
3
4 MIC detonated (due to
three different errors
occur at the same time)
at the same time
3
OL-C
Too muchcartridged
emulsion loadedinto hole
Page 5
WD-4.1
Wrong design intime delay ofone detonator
Page 41
4W-DETON-4.1
1 detonator w rongly put
into one sector w hich
contains the same time
delay detonator
Page 32
W-DETON-SC-4.1
One detonator of a
sector connected
w rongly to a surface
connector of another
sector
Page 39
W-SC-4.1
Use of a wrongsurface
connector
Page 40
OL-EMULSION
Overcharge ofemulsion morethan required
1,11,25,26,..
W-MD-DETON-4.1
Manufacturer defect of
one detonator such tat
time delay corresponds
to another one
W-MD-SC-4.1
Manufacturer defect of
one surface connector
such tat time delay
corresponds to another
one
Page 24 of 45
4-MIC-WI-4
4 MIC detonated (due to
charge overload and one
other error occur at the
same time) at the same
time
3
OL-C
Too muchcartridged
emulsion loadedinto hole
Page 5
OL-EMULSION
Overcharge ofemulsion morethan required
1,11,24,26,..
OL-EMULSION-OTH
One error otherthan holeoverload
WD-4.1
Wrong design intime delay ofone detonator
Page 41
4W-DETON-4.1
1 detonator w rongly put
into one sector w hich
contains the same time
delay detonator
Page 32
W-DETON-SC-4.1
One detonator of a
sector connected
w rongly to a surface
connector of another
sector
Page 39
W-SC-4.1
Use of a wrongsurface
connector
Page 40
W-MD-DETON-4.1
Manufacturer defect of
one detonator such tat
time delay corresponds
to another one
W-MD-SC-4.1
Manufacturer defect of
one surface connector
such tat time delay
corresponds to another
one
Page 25 of 45
4MD-D(2)+OTH
Incorrect timer default of 2detonators due to
manufacturer defect plusone other type of errors
23
OL-C
Too much
cartridged
emulsion loaded
into hole
Page 5
W-MD-DETON-4.1
Manufacturer defect of onedetonator such tat timedelay corresponds to
another one
W-MD-DETON-4.2
Manufacturer defect of theanother detonator such
that time delaycorresponds to another
one
4MD-D(2)
Incorrect timer
def ault of 2
detonators due to
manufacturer defect
27
4MD-D(2)-OTH
One error other thanincorrect timer default of 1
detonator due tomanufacturer defect
WD-4.1
Wrong design
in time delay of
one detonator
Page 41
4W-DETON-4.1
1 detonator wrongly putinto one sector which
contains the same timedelay detonator
Page 32
W-DETON-SC-4.1
One detonator of a sectorconnected wrongly to asurface connector of
another sector
Page 39
W-SC-4.1
Use of a wrong
surface
connector
Page 40
OL-EMULSION
Overcharge of
emulsion more
than required
1,11,24,25,..
W-MD-SC-4.1
Manufacturer defect of onesurface connector such tattime delay corresponds to
another one
Page 26 of 45

4MD-D(3)
Incorrect timer
default of 3
detonators due to
manufacturer defect
22
4MD-D(2)
Incorrect timer
default of 2detonators due to
manufacturer defect
26
W-MD-DETON-4.3
Manufacturer defect of
the another detonator
such that time delay
corresponds to another
one
W-MD-DETON-4.1
Manufacturer defect of
one detonator such tat
time delay corresponds
to another one
W-MD-DETON-4.2
Manufacturer defect of
the another detonator
such that time delay
corresponds to another
one
Page 27 of 45

4MD-SC(2)+OTH
2 Surface connectors failto provide necessary delaydue to manufacturer defect
plus one other type oferrors
23
OL-C
Too much
cartridged
emulsion loaded
into hole
Page 5
W-MD-SC-4.1
Manufacturer defect of onesurface connector such tattime delay corresponds to
another one
W-MD-SC-4.2
Manufacturer defect ofanother surface connector
such tat time delaycorresponds to another
one
4MD-SC(2)
2 Surface connectors failto provide necessary delaydue to manufacturer defect
29
4MD-SC(2)-OTH
One error other than asurface connector fail toprovide necessary delay
due to manufacturer defect
WD-4.1
Wrong design
in time delay of
one detonator
Page 41
4W-DETON-4.1
1 detonator wrongly putinto one sector which
contains the same timedelay detonator
Page 32
W-DETON-SC-4.1
One detonator of a sectorconnected wrongly to asurface connector of
another sector
Page 39
W-SC-4.1
Use of a wrong
surface
connector
Page 40
OL-EMULSION
Overcharge of
emulsion more
than required
1,11,24,25,..
W-MD-DETON-4.1
Manufacturer defect of onedetonator such tat timedelay corresponds to
another one
Page 28 of 45

4MD-SC(3)
3 Surface connectors
fail to provide necessary
delay due to
manufacturer defect
22
4MD-SC(2)
2 Surface connectors
fail to provide necessary
delay due to
manufacturer defect
28
W-MD-SC-4.3
Manufacturer defect of
another surface
connector such tat time
delay corresponds to
another one
W-MD-SC-4.1
Manufacturer defect of
one surface connector
such tat time delay
corresponds to another
one
W-MD-SC-4.2
Manufacturer defect of
another surface
connector such tat time
delay corresponds to
another one
Page 29 of 45

4W-DETON(2)+OTH
2 detonators wrongly putinto one sector which
contains the same timedelay detonator plus one
other type of errors
23
OL-C
Too much
cartridged
emulsion loaded
into hole
Page 5
4W-DETON-4.1
1 detonator wrongly putinto one sector which
contains the same timedelay detonator
Page 32
4W-DETON-4.2
1 detonator wrongly putinto one sector which
contains the same timedelay detonator
W-DETON-4.2
Wrong installation of onedetonator in another sector
and failure ofdetection/correction
HE-WS-US-4.1.2
The sector
contains the same
time delay
detonator
4W-DETON(2)
2 detonators wrongly putinto one sector which
contains the same timedelay detonator
31
4W-DETON(2)-OTH
One error other than 1detonator wrongly put intoa sector which contains
the same time delaydetonator
WD-4.1
Wrong design
in time delay of
one detonator
Page 41
W-DETON-SC-4.1
One detonator of a sectorconnected wrongly to asurface connector of
another sector
Page 39
W-SC-4.1
Use of a wrong
surface
connector
Page 40
OL-EMULSION
Overcharge of
emulsion more
than required
1,11,24,25,..
W-MD-DETON-4.1
Manufacturer defect of onedetonator such tat timedelay corresponds to
another one
W-MD-SC-4.1
Manufacturer defect of onesurface connector such tattime delay corresponds to
another one
Page 30 of 45

4W-DETON(3)
Three detonators wronglyput into one sector whichcontains the same time
delay detonator
22
4W-DETON(2)
2 detonators wrongly putinto one sector which
contains the same timedelay detonator
30
4W-DETON-4.3
1 detonator wrongly putinto one sector which
contains the same timedelay detonator
4W-DETON-4.1
1 detonator wrongly putinto one sector which
contains the same timedelay detonator
Page 32
4W-DETON-4.2
1 detonator wrongly putinto one sector which
contains the same timedelay detonator
W-DETON-4.2
Wrong installation of onedetonator in another sector
and failure ofdetection/correction
HE-WS-US-4.1.2
The sector
contains the same
time delay
detonator
W-DETON-4.3
Wrong installation of onedetonator in another sector
and failure ofdetection/correction
HE-WS-US-4.1.3
The sector
contains the same
time delay
detonator
Page 31 of 45

4W-DETON-4.1
1 detonator wrongly putinto one sector which
contains the same timedelay detonator
24,25,26,28,30,31,33,35,37
HE-WS-4.1
Wrong installationof one detonatorin another sector
HE-WS-R-4.1
SF fails todetect &
correct error
HE-WS-US-4.1.1
The sectorcontains the
same time delaydetonator
Page 32 of 45

4W-DETON-SC(2)+OTH
One detonator for each oftwo sectors connectedwrongly to a surfaceconnector of another
sector plus one other error
23
OL-C
Too much
cartridged
emulsion loaded
into hole
Page 5
W-DETON-SC-4.1
One detonator of a sectorconnected wrongly to asurface connector of
another sector
Page 39
W-DETON-SC-4.2
One detonator of a sectorconnected wrongly to asurface connector of
another sector
W-DETON-SC-4.2
Mis-connection of onedetonator to surfaceconnector of anothersector and failure ofdetection/correction
HE-DETON-SC-US-4.1.2
The sector
contains the same
time delay
detonator
4W-DETON-SC(2)
One detonator for each oftwo sectors connectedwrongly to a surfaceconnector of another
sector
34
4W-DETON-SC(2)-OTH
One error other than onedetonator for a sector
connected wrongly to asurface connector of
another sector
WD-4.1
Wrong design
in time delay of
one detonator
Page 41
4W-DETON-4.1
1 detonator wrongly putinto one sector which
contains the same timedelay detonator
Page 32
W-SC-4.1
Use of a wrong
surface
connector
Page 40
OL-EMULSION
Overcharge of
emulsion more
than required
1,11,24,25,..
W-MD-DETON-4.1
Manufacturer defect of onedetonator such tat timedelay corresponds to
another one
W-MD-SC-4.1
Manufacturer defect of onesurface connector such tattime delay corresponds to
another one
Page 33 of 45

4W-DETON-SC(3)
One detonator for each ofthree sectors connected
wrongly to a surfaceconnector of another
sector
22
4W-DETON-SC(2)
One detonator for each oftwo sectors connectedwrongly to a surfaceconnector of another
sector
33
W-DETON-SC-4.3
One detonator of a sectorconnected wrongly to asurface connector of
another sector
W-DETON-SC-4.1
One detonator of a sectorconnected wrongly to asurface connector of
another sector
Page 39
W-DETON-SC-4.2
One detonator of a sectorconnected wrongly to asurface connector of
another sector
W-DETON-SC-4.2
Mis-connection of onedetonator to surfaceconnector of anothersector and failure ofdetection/correction
HE-DETON-SC-US-4.1.2
The sector
contains the same
time delay
detonator
W-DETON-SC-4.3
Mis-connection of onedetonator to surfaceconnector of anothersector and failure ofdetection/correction
HE-WS-US-4.1.6
The sector
contains the same
time delay
detonator
Page 34 of 45

4W-SC(2)+OTH
Use of two wrong
surface connectors
plus one other
type of errors
23
OL-C
Too much
cartridged
emulsion loaded
into hole
Page 5
W-SC-4.1
Use of a wrong
surface
connector
Page 40
W-SC-4.2
Use of a wrong
surface
connector
4W-SC(2)
Use of two
wrong surface
connectors
36
4W-SC(2)-OTH
One error other
than use of a
wrong surface
connector
WD-4.1
Wrong design
in time delay of
one detonator
Page 41
4W-DETON-4.1
1 detonator wrongly putinto one sector which
contains the same timedelay detonator
Page 32
W-DETON-SC-4.1
One detonator of a sectorconnected wrongly to asurface connector of
another sector
Page 39
OL-EMULSION
Overcharge of
emulsion more
than required
1,11,24,25,..
W-MD-DETON-4.1
Manufacturer defect of onedetonator such tat timedelay corresponds to
another one
W-MD-SC-4.1
Manufacturer defect of onesurface connector such tattime delay corresponds to
another one
Page 35 of 45

4W-SC(3)
Use of threewrong surface
connectors
22
4W-SC(2)
Use of twowrong surface
connectors
35
W-SC-4.3
Use of a wrongsurface
connector
W-SC-4.1
Use of a wrongsurface
connector
Page 40
W-SC-4.2
Use of a wrongsurface
connector
Page 36 of 45

4WD(2)+OTH
Wrong design in time
delay of two
detonators plus one
other ty pe of errors
23
OL-C
Too much
cartridged
emulsion loaded
into hole
Page 5
WD-4.1
Wrong design
in time delay of
one detonator
Page 41
WD-4.2
Wrong design
in time delay of
one detonator
4WD(2)
Wrong design
in time delay of
two detonators
38
4WD(2)-OTH
One error other than
one wrong design in
time delay of one
detonator
4W-DETON-4.1
1 detonator wrongly putinto one sector which
contains the same timedelay detonator
Page 32
W-DETON-SC-4.1
One detonator of a sectorconnected wrongly to asurface connector of
another sector
Page 39
W-SC-4.1
Use of a wrong
surface
connector
Page 40
OL-EMULSION
Overcharge of
emulsion more
than required
1,11,24,25,..
W-MD-DETON-4.1
Manufacturer defect of onedetonator such tat timedelay corresponds to
another one
W-MD-SC-4.1
Manufacturer defect of onesurface connector such tattime delay corresponds to
another one
Page 37 of 45

4WD(3)
Wrong design intime delay of
three detonators
22
4WD(2)
Wrong design intime delay of
two detonators
37
WD-4.3
Wrong design intime delay ofone detonator
WD-4.1
Wrong design intime delay ofone detonator
Page 41
WD-4.2
Wrong design intime delay ofone detonator
Page 38 of 45

W-DETON-SC-4.1
One detonator of asector connected
wrongly to a surfaceconnector of another
sector
24,25,26,28,30,33,34,35,37
HE-W-DETON-SC-4.1
Mis-connection ofone detonator to
surface connectorof another sector
HE-W-DETON-SC-FHC-4.1
Failure by SF, BE andRSS to detect andcorrect error duringfinal hook-up check
HE-DETON-SC-US-4.1.1
The sectorcontains the
same time delaydetonator
Page 39 of 45
W-SC-4.1
Use of a wrongsurface
connector
24,25,26,28,30,33,35,36,37
HE-WSC-4.1
Wrong installationof one surface
connector
HE-WSC-R-4.1
SF fails todetect &
correct error
HE-WSC-FHC-4.1
Failure by SF, BE andRSS to detect andcorrect error duringfinal hook-up check
Page 40 of 45

WD-4.1
Wrong designin time delay ofone detonator
24,25,26,28,30,33,35,37,38
WD-4.1
Design error byBlasting Engineer
and failure of designcheck and correction
WD-R-4.1
Failure by RE andMD to detect and
correct designerror
Page 41 of 45

CH-TD-MD
Incorrect time default of1 detonator of more
than 2 detonators dueto manufacturer defect
4
CH-TD-MD-1
Incorrect timedefault of 1
detonator due tomanufacturer defect
CH-TD-MD-2
Incorrect time defaultof 1 additional
detonator due tomanufacturer defect
CH-TD-MD-3
Incorrect time defaultof 1 additional
detonator due tomanufacturer defect
Page 42 of 45
CH-TD-WI(3)
Wrong installation of
more than 2 detonators
in cut (longer time delay
from other sector put
into the cut)
4
CH-TD-WI-1
Wrong installation of 1
detonator in cut (longer
time delay from other
sector put into the cut)
CH-TD-WI-1
Wrong installation of
additional 1 detonator in
cut (longer time delay
from other sector put
into the cut)
CH-TD-WI-2
Wrong installation of
additional 1 detonator in
cut (longer time delay
from other sector put
into the cut)
CH-TD-WI-HE-1
Wronginstallation ofone detonator
CH-TD-WI-HR-1
SF fails todetect & correct
error
Page 43 of 45

CH-WD
Wrong holediameter or
location for reliefholes at cut
4
CH-WD-WD
Wrong designof relief holes
CH-WD-WI
Wrong location of
drilling or incorrectdrill size being used
due to human error
CH-D-HE
Design error by
Blasting Engineer
and failure of design
check and correction
CH-D-HE-R
Failure by REand MD to detect
and correctdesign error
CH-WD-WD-HV-P
Design errorsignificant
enough to causehigher vibration
CH-WD-DO
Operator drillsincorrectly
CH-WD-DO-R
Failure by BE, SFand RSS to detectand correct drilling
error
CH-WD-WI-HV-P
Drilling errorsignificant
enough to causehigher vibration
Page 44 of 45

TD-WD
Wrong design oftime delay of morethan 2 production
holes in cut
4
TD-WD-HE-1
Design error by
Blasting Engineer
and failure of design
check and correction
TD-WD-HE-R-1
Failure by REand MD to detect
and correctdesign error
TD-WD-1
Wrong design oftime delay of 1
production hole incut
TD-WD-2
Wrong design of
time delay of 1additional production
hole in cut
TD-WD-3
Wrong design of
time delay of 1additional production
hole in cut
Page 45 of 45

Annex F
Use of Explosives – Human
Factor Assessment &
Reduction Technique
CONTENTS
F1 HUMAN ERROR ASSESSMENT & REDUCTION TECHNIQUE (HEART) 1
F1.1 OVERVIEW 1
F1.2 METHODOLOGY 1
F2 SCENARIO ONE: CUT FAILURE 4
F2.1 EVENT 1.1: WRONG DESIGN OF HOLE DIAMETER/LOCATION FOR CUT 4
F2.2 EVENT 1.2: WRONG LOCATION OF DRILLING OR INCORRECT DRILL SIZE USED 9
F2.3 EVENT 1.3: DETONATOR IS INSTALLED INCORRECTLY 13
F3 SCENARIO TWO: TWO MIC DETONATED IN THE SAME FACE 20
F3.1 EVENT 2.1: WRONG DESIGN OF TIME DELAY 20
F3.2 EVENT 2.2: DETONATOR PUT INTO WRONG HOLE 25
F3.3 EVENT 2.3: DETONATOR CONNECTED TO A SURFACE CONNECTOR FROM
ANOTHER SECTOR 36
F3.4 EVENT 2.4: SHOTFIRER USES WRONG SURFACE CONNECTOR 46
F4 SCENARIO THREE: MIC EXCEEDED (BULK EMULSION) 53
F4.1 EVENT 3.1: EXCESS EMULSION IS LOADED INTO A HOLE 53
F4.2 EVENT 3.2: WRONG DESIGN OF MIC 61
F5 SCENARIO FOUR: MIC EXCEEDED (CARTRIDGE EMULSION) 66
F5.1 EVENT 4.1: EXCESS CARTRIDGES ARE LOADED INTO HOLES 66
F5.2 EVENT 4.2 WRONG DESIGN OF MIC 75
Attachment F1 Fault Tree Models for Human Reliability Assessment
A10-F1
F1 HUMAN ERROR ASSESSMENT & REDUCTION TECHNIQUE (HEART)
F1.1 OVERVIEW
In order to assess how likely it is that a process will fail based on the potential
for human error, a human reliability assessment (HRA) has been undertaken.
HRA addresses the following questions:
• Which types of human error may occur (e.g. action error, information
retrieval error, communication error, violation)?
• What is estimated frequency of such errors being made?
• What factors may influence this frequency (e.g. time pressure, stress, poor
working environment, low morale)
• How can the identified human errors be prevented in the design or how
can their impact be reduced by additional mitigating controls?
The Human Error Assessment and Reduction Technique (HEART) is a HRA
method based on human performance literature; it has been used in this
assessment to quantify human error probabilities. HEART assesses the
interactions between humans, their specific tasks and performance
shaping/human factors (error producing conditions).
F1.2 METHODOLOGY
The blasting process is inherently complex and is composed of numerous
subtasks, carried out by different individuals. It is therefore important to
identify these subtasks, the roles and responsibilities associated with these
tasks and to assess the risks arising from human performance failure.
In consultation with an experienced Blasting Engineer/Shotfirer, fault trees
were constructed to identify possible sources of human error during four
critical blasting subtasks:
1) Cut failure
2) 2 MICs detonated in the same face
3) Excessive loading of cartridge emulsion
4) Excessive loading of bulk emulsion.
Fault Tree Analysis examines the logical relationship between the
circumstances, failures events, and human/management errors which must
occur in order for these specified undesired events to occur.
A human factors specialist reviewed the assumptions made by the risk
specialist and adapted the fault trees where necessary before undertaking the
HEART assessment. Analyses were undertaken for each scenario to identify
the base human error probability. To ensure all potential human errors were
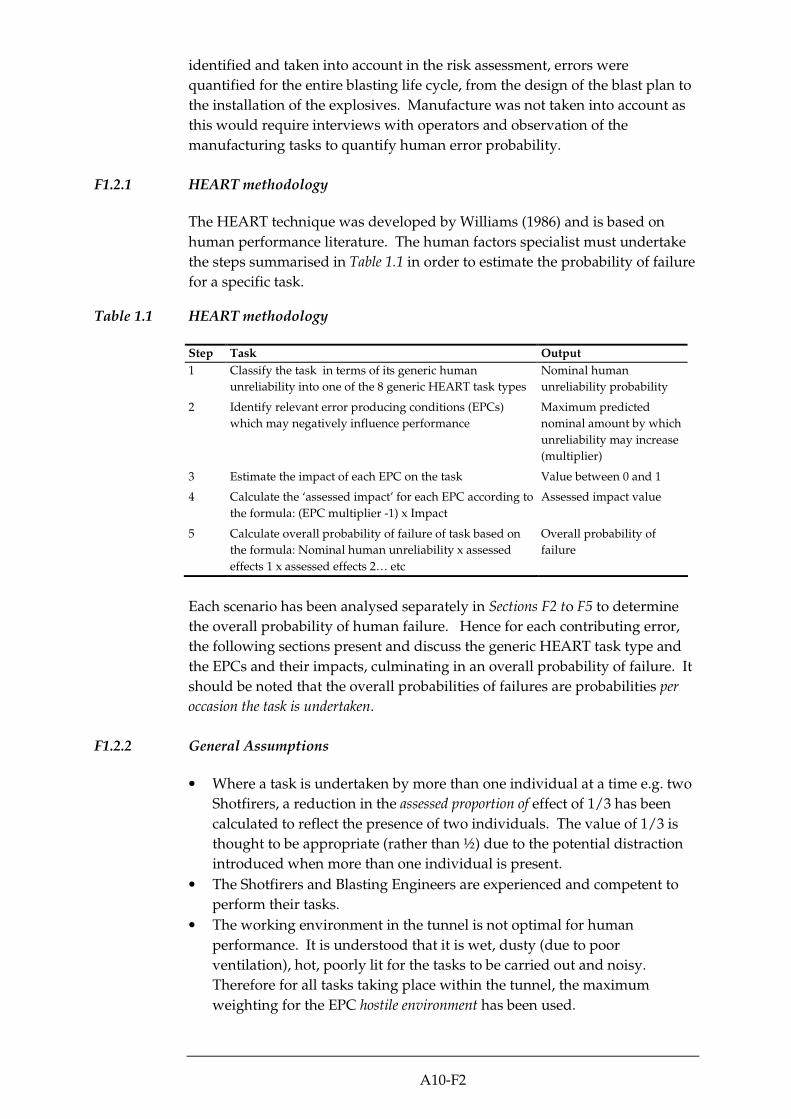
A10-F2
identified and taken into account in the risk assessment, errors were
quantified for the entire blasting life cycle, from the design of the blast plan to
the installation of the explosives. Manufacture was not taken into account as
this would require interviews with operators and observation of the
manufacturing tasks to quantify human error probability.
F1.2.1 HEART methodology
The HEART technique was developed by Williams (1986) and is based on
human performance literature. The human factors specialist must undertake
the steps summarised in Table 1.1 in order to estimate the probability of failure
for a specific task.
Table 1.1 HEART methodology
Step Task Output
1 Classify the task in terms of its generic human
unreliability into one of the 8 generic HEART task types
Nominal human
unreliability probability
2 Identify relevant error producing conditions (EPCs)
which may negatively influence performance Maximum predicted
nominal amount by which
unreliability may increase
(multiplier)
3 Estimate the impact of each EPC on the task Value between 0 and 1
4 Calculate the ‘assessed impact’ for each EPC according to
the formula: (EPC multiplier -1) x Impact
Assessed impact value
5 Calculate overall probability of failure of task based on
the formula: Nominal human unreliability x assessed
effects 1 x assessed effects 2… etc
Overall probability of
failure
Each scenario has been analysed separately in Sections F2 to F5 to determine
the overall probability of human failure. Hence for each contributing error,
the following sections present and discuss the generic HEART task type and
the EPCs and their impacts, culminating in an overall probability of failure. It
should be noted that the overall probabilities of failures are probabilities per
occasion the task is undertaken.
F1.2.2 General Assumptions
• Where a task is undertaken by more than one individual at a time e.g. two
Shotfirers, a reduction in the assessed proportion of effect of 1/3 has been
calculated to reflect the presence of two individuals. The value of 1/3 is
thought to be appropriate (rather than ½) due to the potential distraction
introduced when more than one individual is present.
• The Shotfirers and Blasting Engineers are experienced and competent to
perform their tasks.
• The working environment in the tunnel is not optimal for human
performance. It is understood that it is wet, dusty (due to poor
ventilation), hot, poorly lit for the tasks to be carried out and noisy.
Therefore for all tasks taking place within the tunnel, the maximum
weighting for the EPC hostile environment has been used.

A10-F3
• For all tasks apart from design checking and error correction, a disruption
to sleep has been assumed. Shotfirers work a forward-rotating shift
pattern, and the Blasting Engineer must also be present. The Resident Site
Staff will have to be present at the magazine during the early hours of the
morning; therefore they too will also experience some degree of sleep
disruption.
• The Resident Site Staff will perform the supervisory roles on the blast site.
Mines Division will carry out on-site audit checking for some blasts where
no credit will be taken for the human error assessment.

A10-F4
F2 SCENARIO ONE: CUT FAILURE
Attachment F1 presents the fault tree of human error leading to cut failure. MS
Excel spreadsheet was used to calculate the overall probabilities for events.
F2.1 EVENT 1.1: WRONG DESIGN OF HOLE DIAMETER/LOCATION FOR CUT
The overall probability of the wrong design being released to the project team
is 5.29 E-7, based on the failure of some or all of the tasks analysed below.
F2.1.1 1.1.1: Design error by Blasting Engineer and failure of design check
The overall probability that the wrong blast plan is submitted to the Resident
Engineer and Mines Division for review is 1.92 E-2, based on the failure of all
of the tasks analysed below.
F2.1.2 1.1.1-1 - Design error by Blasting Engineer leads to wrong relief hole diameter
being drilled
If an error is made by the Blasting Engineer during the design process and the
incorrect drawings are distributed to the blasting team, the drilling operator
may utilise what s/he believes to be the correct diameters to drill the relief
holes, when in fact they are incorrect. The generic HEART task type taken to
represent this checking task, utilising a modelling system is “Fairly simple task
performed rapidly or given scant attention” for which the nominal human
unreliability is 0.09. The EPCs and their impacts are shown in Table 2.1.
Table 2.1 HEART calculation
Task Generic task
unreliability
EPCs Multiplier Assessed
Proportion
of Effect
Assessed
Effect
Human
Error
Probability
Shortage of time
available for error
detection &
correction
11 0.01 1.1
Disruption of
normal work-sleep
cycles
1.1 0.1 1.01
High level of
emotional stress
1.3 0.3 1.09
Design
error by
Blasting
Engineer
0.09
Channel capacity
overload
6 0.05 1.25
1.36 E-1
Based on the above estimates, the likelihood of producing an error is 1.36 E-1.

A10-F5
F2.1.3 1.1.1-2/3 - Failure to detect and correct error by Blasting Engineer during
modelling
If the relief hole diameters are calculated incorrectly, the Blasting Engineer
should detect the error during the checking phase, and subsequently correct
the error. However, due to time pressure, stress, lack of sleep and workload,
it is possible that design errors may slip through.
Failure to detect the error
The Blasting Engineer utilises a modelling programme which will highlight
any inconsistencies or mistakes. However, it is possible that the Blasting
Engineer does not detect the errors highlighted by the modelling programme,
or simply does not utilise the software to check the design. The generic
HEART task type taken to represent this checking task, utilising a modelling
system is “Fairly simple task performed rapidly or given scant attention” for which
the nominal human unreliability is 0.09. The EPCs and their impacts are
shown in Table 2.2.
Table 2.2 HEART calculation
Task Generic task
unreliability
EPCs Multiplier Assessed
Proportion
of Effect
Assessed
Effect
Human
Error
Probability
Shortage of time
available for error
detection &
correction
11 0.01 1.1
Disruption of
normal work-
sleep cycles
1.1 0.1 1.01
High level of
emotional stress
1.3 0.3 1.09
Failure to
detect error
by Blasting
Engineer
during
modelling
0.09
Channel capacity
overload
6 0.05 1.25
1.36 E-1
Based on the above estimates, the likelihood of producing an error is 1.36 E-1.
Failure to correct the error
If the Blasting Engineer identifies a problem with the design, there is potential
that he may not act upon this information and fail to rectify the mistake. The
generic HEART task type taken to represent this action task is “Restore or shift
a system to original or new state following procedures, with some checking” for
which the nominal human unreliability is 0.003. The EPCs and their impacts
are shown in Table 2.3.

A10-F6
Table 2.3 HEART calculation
Task Generic task
unreliability
EPCs Multiplier Assessed
Proportion
of Effect
Assessed
Effect
Human
Error
Probability
Shortage of time
available for error
detection &
correction
11 0.01 1.1
Disruption of
normal work-
sleep cycles
1.1 0.1 1.01
Channel capacity
overload
6 0.05 1.25
Failure to
correct
error by
Blasting
Engineer
0.003
High level of
emotional stress
1.3 0.3 1.09
4.54 E-3
Based on the above estimates, the likelihood of producing an error is 4.54 E-3.
F2.1.4 1.1.2: Failure to detect and correct error by Resident Engineer and Mines
Division
The overall probability of failure to detect and correct the design error by the
Resident Engineer and the Mines Division is 2.76 E-5, based on the failure of
all of the tasks analysed below.
1.1.2-1 - Failure to detect error by the Resident Engineer
Once the Blasting Engineer has finalised the design, it is passed to the
Resident Engineer and to the Mines Division. The Resident Engineer should
check the design before giving his endorsement to the Mines Division. It has
been assumed that the Resident Engineer is not as competent or experienced
as the Blasting Engineer as this is not his sole task within the project. The
generic HEART task type taken to represent this manual checking task is
“Routine, highly practised, rapid tasks involving relatively low level of skill” for
which the nominal human unreliability is 0.02. The EPCs and their impacts
are shown in Table 2.4.
Table 2.4 HEART calculation
Task Generic task
unreliability
EPCs Multiplier Assessed
Proportion
of Effect
Assessed
Effect
Human
Error
Probability
Shortage of time
available for error
detection &
correction
11 0.01 1.1
High level of
emotional stress
1.3 0.2 1.06
Failure to
detect
error by
Resident
Engineer
0.02
Channel capacity
overload
6 0.05 1.25
2.92 E-2
Based on the above estimates, the likelihood of producing an error is 2.92 E-2.

A10-F7
1.1.2.-2 - Failure to detect error by Mines Division
As specified earlier, Mines Division will also check the design for errors,
although it is possible that errors may be made during the check which allows
the incorrect design to go unnoticed. The generic HEART task type taken to
represent this manual checking task is “Routine, highly practised, rapid tasks
involving relatively low level of skill” for which the nominal human unreliability
is 0.02. The EPCs and their impacts are shown in Table 2.5.
Table 2.5 HEART calculation
Task Generic task
unreliability
EPCs Multiplier Assessed
Proportion
of Effect
Assessed
Effect
Human
Error
Probability
Shortage of time
available for error
detection &
correction
11 0.01 1.1
High level of
emotional stress
1.3 0.01 1.003
Failure to
detect
error by
Resident
Engineer
0.02
Channel capacity
overload
6 0.05 1.25
2.76 E-2
Based on the above estimates, the likelihood of producing an error is 2.76 E-2.
1.1.2-3 - Failure to correct error by the Resident Engineer
As above, the Resident Engineer may detect the error, but then fail to act on
this to correct the design error. The generic HEART task type taken to
represent this action task is “Restore or shift a system to original or new state
following procedures, with some checking” for which the nominal human
unreliability is 0.003. . The EPCs and their impacts are shown in Table 2.6.
Table 2.6 HEART calculation
Task Generic task
unreliability
EPCs Multiplier Assessed
Proportion
of Effect
Assessed
Effect
Human
Error
Probability
Shortage of time
available for error
detection &
correction
11 0.01 1.1
Channel capacity
overload
6 0.05 1.25
Failure to
correct
error by
Resident
Engineer
0.003
High level of
emotional stress
1.3 0.2 1.06
4.37 E-3
Based on the above estimates, the likelihood of producing an error is 4.37 E-3.
1.1.2-4 – Failure to correct error by Mines Division
As above, the Mines Division may fail to correct the error in the design. The
generic HEART task type taken to represent this action task is “Restore or shift
a system to original or new state following procedures, with some checking” for

A10-F8
which the nominal human unreliability is 0.003. The EPCs and their impacts
are shown in Table 2.7.
Table 2.7 HEART calculation
Task Generic task
unreliability
EPCs Multiplier Assessed
Proportion
of Effect
Assessed
Effect
Human
Error
Probability
Shortage of
time available
for error
detection &
correction
11 0.01 1.1
Channel
capacity
overload
6 0.05 1.25
Failure to
correct
error by
Mines
Division
0.003
High level of
emotional stress
1.3 0.01 1.003
4.14 E-3
Based on the above estimates, the likelihood of producing an error is 4.14 E-3.
1.1.2-5 – Failure to detect error by Shotfirer
The Shotfirer will review the blast plan before blasting commences. The
generic HEART task type taken to represent this manual checking task is
“Routine, highly practised, rapid task involving relatively low level of skill” for
which the nominal human unreliability is 0.02. The EPCs and their impacts
are shown in Table 2.8.
Table 2.8 HEART calculation
Task Generic task
unreliability
EPCs Multiplier Assessed
Proportion
of Effect
Assessed
Effect
Human
Error
Probability
Shortage of
time available
for error
detection &
correction
11 0.003 1.03
Channel
capacity
overload
6 0.015 1.075
Shotfirer
fails to
detect error
0.02
High level of
emotional stress
1.3 0.06 1.018
2.25 E-2
Based on the above estimates, the likelihood of producing an error is 2.25 E-2.
1.1.2-6 – Failure to correct error by Shotfirer
If the Shotfirer identifies an error in the blast plan, he must act to correct the
error before the blast commences. The generic HEART task type taken to
represent this action task is “Restore or shift a system to original or new state
following procedures, with some checking” for which the nominal human
unreliability is 0.003. The EPCs and their impacts are shown in Table 2.9.

A10-F9
Table 2.9 HEART calculation
Task Generic task
unreliability
EPCs Multiplier Assessed
Proportion
of Effect
Assessed
Effect
Human
Error
Probability
Shortage of
time available
for error
detection &
correction
11 0.003 1.03
Channel
capacity
overload
6 0.015 1.075
Shotfirer
fails to
correct
error
0.003
High level of
emotional stress
1.3 0.06 1.018
3.38 E-3
Based on the above estimates, the likelihood of producing an error is 3.38 E-3.
F2.2 EVENT 1.2: WRONG LOCATION OF DRILLING OR INCORRECT DRILL SIZE USED
The overall probability of the wrong location/incorrect drill size being used is
3.89 E-5, based on the failure of some or all of the tasks analysed below.
F2.2.1 1.2.1: Operator fails to drill correctly
The overall probability of the operator failing to drill correctly is 2.26E-2,
based on the failure of all of the tasks analysed below.
1.2.1.-1 - Surveyors calculate incorrect co-ordinates, leading to operator having disc
with incorrect information
The surveyors will pass the co-ordinates to the Blasting Engineer, who will
then programme a computer disc to be used in the drill. However, if the
surveyors miscalculate the co-ordinates, there is potential that the holes will
be drilled incorrectly. The generic HEART task type taken to represent this
action task is “Routine, highly practised, rapid task involving relatively low level of
skill” for which the nominal human unreliability is 0.02. The EPCs and their
impacts are shown in Table 2.10.
Table 2.10 HEART calculation
Task Generic task
unreliability
EPCs Multiplier Assessed
Proportion
of Effect
Assessed
Effect
Human
Error
Probability
Surveyors
calculate
incorrect
co-
ordinates
0.02 Shortage of
time available
for error
detection &
correction
11 0.01 1.1 2.20 E-2
Based on the above estimates, the likelihood of producing an error is 2.20 E-2.

A10-F10
1.2.1-2 - Blasting Engineer inputs wrong information on to disc (typo)
If the surveyors provide the correct information to the Blasting Engineer, it is
possible that he may execute an action error or information retrieval error
when programming the computer disc. The generic HEART task type taken
to represent this action task is “Completely familiar, well designed, highly
practised, routine task occurring several times per hour, performed to highest possible
standards by highly motivated and experienced person, totally aware of the
implications of failure, with time to correct potential error, but without the benefit of
significant job aids” for which the nominal human unreliability is 0.0004. The
EPCs and their impacts are shown in Table 2.11.
Table 2.11 HEART calculation
Task Generic task
unreliability
EPCs Multiplier Assessed
Proportion
of Effect
Assessed
Effect
Human
Error
Probability
Shortage of
time available
for error
detection &
correction
11 0.01 1.1
Disruption of
normal work-
sleep cycles
1.1 0.1 1.01
Channel
capacity
overload
6 0.05 1.25
Blasting
Engineer
inputs
wrong
information
on to disc
0.0004
High level of
emotional
stress
1.3 0.3 1.09
6.05 E-4
Based on the above estimates, the likelihood of producing an error is 6.05 E-4.
F2.2.2 1.2.1: Failure by Blasting Engineer/ Shotfirers to check and correct drilling
error
The overall probability of operator fails to drill correctly is 1.72 E-3, based on
the failure of all of the tasks analysed below.
1.2.2-1 – Blasting Engineer fails to check holes are drilled correctly
Once the cut holes have been drilled, it is expected that the Blasting Engineer
will check the location and size of the holes against the plans. However, it is
possible that the Blasting Engineer will fail to check this, or check it
completely. The generic HEART task type taken to represent this manual
checking task is “Routine, highly practised, rapid task involving relatively low level
of skill” for which the nominal human unreliability is 0.02. The EPCs and their
impacts are shown in Table 2.12.
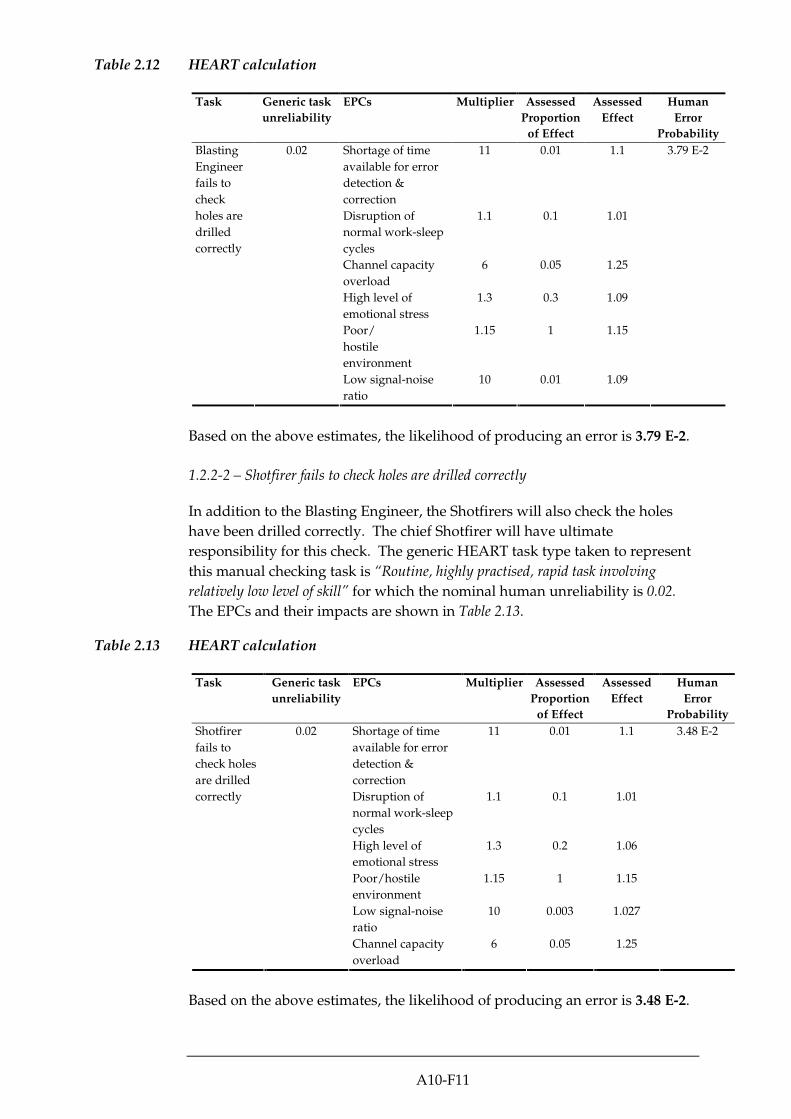
A10-F11
Table 2.12 HEART calculation
Task Generic task
unreliability
EPCs Multiplier Assessed
Proportion
of Effect
Assessed
Effect
Human
Error
Probability
Shortage of time
available for error
detection &
correction
11 0.01 1.1
Disruption of
normal work-sleep
cycles
1.1 0.1 1.01
Channel capacity
overload
6 0.05 1.25
High level of
emotional stress
1.3 0.3 1.09
Poor/
hostile
environment
1.15 1 1.15
Blasting
Engineer
fails to
check
holes are
drilled
correctly
0.02
Low signal-noise
ratio
10 0.01 1.09
3.79 E-2
Based on the above estimates, the likelihood of producing an error is 3.79 E-2.
1.2.2-2 – Shotfirer fails to check holes are drilled correctly
In addition to the Blasting Engineer, the Shotfirers will also check the holes
have been drilled correctly. The chief Shotfirer will have ultimate
responsibility for this check. The generic HEART task type taken to represent
this manual checking task is “Routine, highly practised, rapid task involving
relatively low level of skill” for which the nominal human unreliability is 0.02.
The EPCs and their impacts are shown in Table 2.13.
Table 2.13 HEART calculation
Task Generic task
unreliability
EPCs Multiplier Assessed
Proportion
of Effect
Assessed
Effect
Human
Error
Probability
Shortage of time
available for error
detection &
correction
11 0.01 1.1
Disruption of
normal work-sleep
cycles
1.1 0.1 1.01
High level of
emotional stress
1.3 0.2 1.06
Poor/hostile
environment
1.15 1 1.15
Low signal-noise
ratio
10 0.003 1.027
Shotfirer
fails to
check holes
are drilled
correctly
0.02
Channel capacity
overload
6 0.05 1.25
3.48 E-2
Based on the above estimates, the likelihood of producing an error is 3.48 E-2.

A10-F12
1.2.2-3 – Blasting Engineer fails to correct drilling error
Although the Blasting Engineer may have detected the drilling error, it is
possible that he will not do anything to correct it. This could be due to
increased workload or distraction for example. The generic HEART task type
taken to represent this action task is “Restore or shift a system to original or new
state following procedures, with some checking” for which the nominal human
unreliability is 0.003. The EPCs and their impacts are shown in Table 2.14.
Table 2.14 HEART calculation
Task Generic task
unreliability
EPCs Multiplier Assessed
Proportion
of Effect
Assessed
Effect
Human
Error
Probability
Shortage of time
available for error
detection &
correction
11 0.01 1.1
Disruption of
normal work-sleep
cycles
1.1 0.1 1.01
Channel capacity
overload
6 0.05 1.25
High level of
emotional stress
1.3 0.3 1.09
Blasting
Engineer
fails to
correct
drilling
error
0.003
Poor/
hostile
environment
1.15 1 1.15
5.22 E-3
Based on the above estimates, the likelihood of producing an error is 5.22 E-3.
1.2.2-4 – Shotfirer fails to correct drilling error
The Shotfirer must act to correct the drilling error if it is identified. The
generic HEART task type taken to represent this action task is “Restore or shift
a system to original or new state following procedures, with some checking” for
which the nominal human unreliability is 0.003. The EPCs and their impacts
are shown in Table 2.15.

A10-F13
Table 2.15 HEART calculation
Task Generic task
unreliability
EPCs Multiplier Assessed
Proportion
of Effect
Assessed
Effect
Human
Error
Probability
Shortage of time
available for error
detection &
correction
11 0.01 1.1
Disruption of
normal work-sleep
cycles
1.1 0.1 1.01
High level of
emotional stress
1.3 0.2 1.06
Poor/hostile
environment
1.15 1 1.15
Blasting
Engineer
fails to
correct
drilling
error
0.003
Channel capacity
overload
6 0.05 1.25
5.08 E-3
Based on the above estimates, the likelihood of producing an error is 5.08 E-3.
F2.3 EVENT 1.3: DETONATOR IS INSTALLED INCORRECTLY
The overall probability of a detonator being installed incorrectly based on the
failure of all the tasks analysed below is 1.40 E-8.
F2.3.1 1.3.1: Wrong Installation of one detonator by the Shotfirer
The overall probability of a detonator being wrongly installed is 5.02 E-7,
based on the failure of all of the tasks analysed below.
1.3.1 – 1 Shotfirers mark holes incorrectly
The chief Shotfirer will be responsible for marking the holes correctly,
although the second Shotfirer will assist. There is potential for information
retrieval errors to occur when looking at the plans and transferring this to the
face as well as lapses in concentration when actually marking the holes. The
generic HEART task type taken to represent this action task is “Routine, highly
practised, rapid task involving relatively low level of skill” for which the nominal
human unreliability is 0.02. The EPCs and their impacts are shown in Table
2.16.

A10-F14
Table 2.16 HEART calculation
Task Generic task
unreliability
EPCs Multiplier Assessed
Proportion
of Effect
Assessed
Effect
Human
Error
Probability
Shortage of time
available for error
detection &
correction
11 0.01 1.1
Disruption of
normal work-
sleep cycles
1.1 0.1 1.01
Channel capacity
overload
6 0.05 1.25
High level of
emotional stress
1.3 0.2 1.06
Low signal-noise
ratio
10 0.01 1.09
Shotfirers
fail to mark
holes
correctly
0.02
Poor/
hostile
environment
1.15 1 1.15
3.69 E-2
Based on the above estimates, the likelihood of producing an error is 3.69 E-2.
1.3.1-2 – Shotfirer fails to detect marking error
The Shotfirers should check their own work, and each others. However, there
is potential that one or both Shotfirers to fail to check and therefore fail to
detect the marking error. The generic HEART task type taken to represent
this checking task is “Fairly simple task performed rapidly or given scant attention”
for which the nominal human unreliability is 0.09. The EPCs and their
impacts are shown in Table 2.17.
Table 2.17 HEART calculation
Task Generic task
unreliability
EPCs Multiplier Assessed
Proportion
of Effect
Assessed
Effect
Human
Error
Probability
Shortage of time
available for error
detection &
correction
11 0.003 1.03
Disruption of
normal work-
sleep cycles
1.1 0.03 1.003
Channel capacity
overload
6 0.015 1.075
High level of
emotional stress
1.3 0.06 1.018
Low signal-noise
ratio
10 0.003 1.027
Shotfirers
fails to
detect
marking
error
0.09
Poor/
hostile
environment
1.15 0.33 1.0495
1.10 E-1
Based on the above estimates, the likelihood of producing an error is 1.10 E-1.

A10-F15
1.3.1-3 Shotfirers fails to correct marking error
If the Shotfirers have detected the marking error, they must then correct the
error to ensure it is recovered. The generic HEART task type taken to
represent this action task is “Restore or shift a system to original or new state
following procedures, with some checking” for which the nominal human
unreliability is 0.003. The EPCs and their impacts are shown in Table 2.18.
Table 2.18 HEART calculation
Task Generic task
unreliability
EPCs Multiplier Assessed
Proportion
of Effect
Assessed
Effect
Human
Error
Probability
Shortage of time
available for error
detection &
correction
11 0.003 1.03
Disruption of
normal work-
sleep cycles
1.1 0.03 1.003
High level of
emotional stress
1.3 0.06 1.018
Poor/hostile
environment
1.15 0.3 1.045
Channel capacity
overload
6 0.015 1.075
Shotfirers
fail to
correct
marking
error
0.003
Low signal-noise
ratio
10 0.003 1.027
3.64 E-3
Based on the above estimates, the likelihood of producing an error is 3.64 E-3
1.3.1-4 – Shotfirer picks up detonator of wrong time delay
When the Shotfirers picks up the detonator, they must ensure they choose one
with the correct time delay. Due to an action execution error, the Shotfirer
may pick up the wrong one to the intended one. The generic HEART task
type taken to represent this action task is “Completely familiar, well designed,
highly practised, routine task occurring several times per hour, performed to highest
possible standards by highly motivated and experienced person, totally aware of the
implications of failure, with time to correct potential error, but without the benefit of
significant job aids” for which the nominal human unreliability is 0.0004. The
EPCs and their impacts are shown in Table 2.19.

A10-F16
Table 2.19 HEART calculation
Task Generic task
unreliability
EPCs Multiplier Assessed
Proportion
of Effect
Assessed
Effect
Human
Error
Probability
Shortage of time
available for error
detection &
correction
11 0.01 1.1
Disruption of
normal work-
sleep cycles
1.1 0.1 1.01
Channel capacity
overload
6 0.05 1.25
High level of
emotional stress
1.3 0.2 1.06
Low signal-noise
ratio
10 0.01 1.09
Shotfirer
picks up
detonator
of wrong
time delay
0.0004
Poor/
hostile
environment
1.15 1 1.15
7.38 E-4
Based on the above estimates, the likelihood of producing an error is 7.38 E-4.
1.3.1-5 – Shotfirer fails to check shell & detonator delay tag before placing into the
hole
The Shotfirer should check the shell and detonator delay tag before placing it
in the hole. However, it is possible that due to time pressure, poor lighting etc
that he omits to check before placing the detonator in the hole. The generic
HEART task type taken to represent this manual checking task is “Completely
familiar, well designed, highly practised, routine task occurring several times per
hour, performed to highest possible standards by highly motivated and experienced
person, totally aware of the implications of failure, with time to correct potential error,
but without the benefit of significant job aids” for which the nominal human
unreliability is 0.0004. The EPCs and their impacts are shown in Table 2.20.

A10-F17
Table 2.20 HEART calculation
Task Generic task
unreliability
EPCs Multiplier Assessed
Proportion
of Effect
Assessed
Effect
Human
Error
Probability
Shortage of time
available for error
detection &
correction
11 0.01 1.1
Disruption of
normal work-
sleep cycles
1.1 0.1 1.01
Channel capacity
overload
6 0.05 1.25
High level of
emotional stress
1.3 0.2 1.06
Low signal-noise
ratio
10 0.01 1.09
Shotfirer
fails to
check shell
and
detonator
delay tag
before
inserting
into the
hole
0.0004
Poor/
hostile
environment
1.15 1 1.15
7.38 E-4
Based on the above estimates, the likelihood of producing an error is 7.38 E-4.
1.3.1-6 – Shotfirer puts detonator in a hole not within the cut
Alternatively, the Shotfirer may pick up a detonator but insert it into a hole
not within the cut. The generic HEART task type taken to represent this
manual checking task is “Completely familiar, well designed, highly practised,
routine task occurring several times per hour, performed to highest possible standards
by highly motivated and experienced person, totally aware of the implications of
failure, with time to correct potential error, but without the benefit of significant job
aids” for which the nominal human unreliability is 0.0004. The EPCs and their
impacts are shown in Table 2.21.
Table 2.21 HEART calculation
Task Generic task
unreliability
EPCs Multiplier Assessed
Proportion
of Effect
Assessed
Effect
Human
Error
Probability
Shortage of time
available for error
detection &
correction
11 0.01 1.1
Disruption of
normal work-
sleep cycles
1.1 0.1 1.01
High level of
emotional stress
1.3 0.2 1.06
Channel capacity
overload
6 0.05 1.25
Shotfirer
puts wrong
detonator
in the hole
0.0004
Poor/hostile
environment
1.15 1 1.15
6.77 E-4
Based on the above estimates, the likelihood of producing an error is 6.77 E-4.
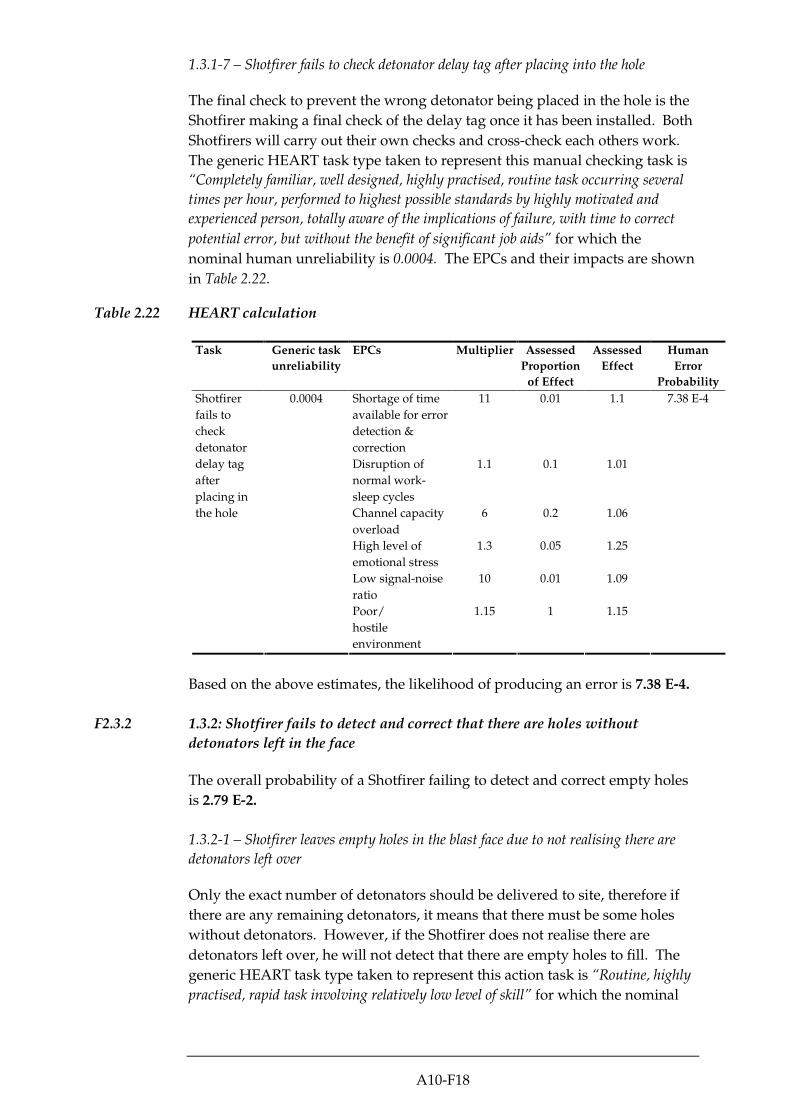
A10-F18
1.3.1-7 – Shotfirer fails to check detonator delay tag after placing into the hole
The final check to prevent the wrong detonator being placed in the hole is the
Shotfirer making a final check of the delay tag once it has been installed. Both
Shotfirers will carry out their own checks and cross-check each others work.
The generic HEART task type taken to represent this manual checking task is
“Completely familiar, well designed, highly practised, routine task occurring several
times per hour, performed to highest possible standards by highly motivated and
experienced person, totally aware of the implications of failure, with time to correct
potential error, but without the benefit of significant job aids” for which the
nominal human unreliability is 0.0004. The EPCs and their impacts are shown
in Table 2.22.
Table 2.22 HEART calculation
Task Generic task
unreliability
EPCs Multiplier Assessed
Proportion
of Effect
Assessed
Effect
Human
Error
Probability
Shortage of time
available for error
detection &
correction
11 0.01 1.1
Disruption of
normal work-
sleep cycles
1.1 0.1 1.01
Channel capacity
overload
6 0.2 1.06
High level of
emotional stress
1.3 0.05 1.25
Low signal-noise
ratio
10 0.01 1.09
Shotfirer
fails to
check
detonator
delay tag
after
placing in
the hole
0.0004
Poor/
hostile
environment
1.15 1 1.15
7.38 E-4
Based on the above estimates, the likelihood of producing an error is 7.38 E-4.
F2.3.2 1.3.2: Shotfirer fails to detect and correct that there are holes without
detonators left in the face
The overall probability of a Shotfirer failing to detect and correct empty holes
is 2.79 E-2.
1.3.2-1 – Shotfirer leaves empty holes in the blast face due to not realising there are
detonators left over
Only the exact number of detonators should be delivered to site, therefore if
there are any remaining detonators, it means that there must be some holes
without detonators. However, if the Shotfirer does not realise there are
detonators left over, he will not detect that there are empty holes to fill. The
generic HEART task type taken to represent this action task is “Routine, highly
practised, rapid task involving relatively low level of skill” for which the nominal

A10-F19
human unreliability is 0.02. The EPCs and their impacts are shown in Table
2.23.
Table 2.23 HEART calculation
Task Generic task
unreliability
EPCs Multiplier Assessed
Proportion
of Effect
Assessed
Effect
Human
Error
Probability
Shortage of time
available for error
detection &
correction
11 0.003 1.03
Disruption of
normal work-
sleep cycles
1.1 0.03 1.003
High level of
emotional stress
1.3 0.06 1.018
Poor/hostile
environment
1.15 0.3 1.045
Low signal-noise
ratio
10 0.003 1.027
Shotfirers
fail to check
if there are
detonators
left over
0.02
Channel capacity
overload
6 0.015 1.075
2.43 E-2
Based on the above estimates, the likelihood of producing an error is 2.43 E-2.
1.3.2-2 – Shotfirer fails to fill empty holes before detonation
If the Shotfirers identify any errors during their final check of the delay tags,
they must rectify these errors. The generic HEART task type taken to
represent this action task is “Restore or shift a system to original or new state
following procedures, with some checking” for which the nominal human
unreliability is 0.003. The EPCs and their impacts are shown in Table 2.24.
Table 2.24 HEART calculation
Task Generic task
unreliability
EPCs Multiplier Assessed
Proportion
of Effect
Assessed
Effect
Human
Error
Probability
Shortage of time
available for error
detection &
correction
11 0.003 1.03
Disruption of
normal work-
sleep cycles
1.1 0.03 1.003
Low signal-noise
ratio
10 0.003 1.027
High level of
emotional stress
1.3 0.06 1.018
Poor/hostile
environment
1.15 0.3 1.045
Shotfirer
fails to
correct
error
0.003
Channel capacity
overload
6 0.015 1.075
3.64 E-3
Based on the above estimates, the likelihood of producing an error is 3.64 E-3.

A10-F20
F3 SCENARIO TWO: TWO MIC DETONATED IN THE SAME FACE
Attachment F1 presents the fault tree of human error leading to two MIC being
detonated in the same face. MS Excel spreadsheet was used to calculate the
overall probabilities for events.
F3.1 EVENT 2.1: WRONG DESIGN OF TIME DELAY
The overall probability of the wrong design being released to the project team
is 5.29 E-7, based on the failure of some or all of the tasks analysed below.
F3.1.1 2.1.1: Design error by Blasting Engineer and failure of design check and
correction
The overall probability of a wrong blast plan submitted to the resident
engineer and Mines Division for review is 1.92 E-2, based on the failure of all
of the tasks analysed below.
2.1.1-1 - Design error by Blasting Engineer
As before, if an error is made by the Blasting Engineer during the design
process and the incorrect drawings are distributed to the blasting team, they
will utilise the plans believing them to be correct when in fact they are
incorrect. The generic HEART task type taken to represent this checking task,
utilising a modelling system is “Fairly simple task performed rapidly or given scant
attention” for which the nominal human unreliability is 0.09. The EPCs and
their impacts are shown in Table 3.1.
Table 3.1 HEART calculation
Task Generic task
unreliability
EPCs Multiplier Assessed
Proportion
of Effect
Assessed
Effect
Human
Error
Probability
Shortage of time
available for error
detection &
correction
11 0.01 1.1
Disruption of
normal work-sleep
cycles
1.1 0.1 1.01
High level of
emotional stress
1.3 0.3 1.09
Design
error by
Blasting
Engineer
0.09
Channel capacity
overload
6 0.05 1.25
1.36 E-1
Based on the above estimates, the likelihood of producing an error is 1.36 E-1.

A10-F21
2.1.1-2/3 - Failure to detect and correct error by Blasting Engineer during modelling
If the time delay is specified incorrectly, the Blasting Engineer should detect
the error during the checking phase, and subsequently correct the error.
However, due to time pressure, stress, lack of sleep and workload, it is
possible that design errors may slip through.
Failure to detect the error
The Blasting Engineer utilises a modelling programme which will highlight
any inconsistencies or mistakes. However, it is possible that the Blasting
Engineer does not detect the errors highlighted by the modelling programme,
or simply does not utilise the software to check the design. The generic
HEART task type taken to represent this checking task, utilising a modelling
system is “Fairly simple task performed rapidly or given scant attention” for which
the nominal human unreliability is 0.09. The EPCs and their impacts are
shown in Table 3.2.
Table 3.2 HEART calculation
Task Generic task
unreliability
EPCs Multiplier Assessed
Proportion
of Effect
Assessed
Effect
Human
Error
Probability
Shortage of time
available for error
detection &
correction
11 0.01 1.1
Disruption of
normal work-
sleep cycles
1.1 0.1 1.01
Channel capacity
overload
6 0.05 1.25
Failure to
detect error
by Blasting
Engineer
during
modelling
0.09
High level of
emotional stress
1.3 0.3 1.09
1.36 E-1
Based on the above estimates, the likelihood of producing an error is 1.36 E-1.
Failure to correct the error
If the Blasting Engineer identifies a problem with the design, there is potential
that he may not act upon this information and fail to rectify the mistake. The
generic HEART task type taken to represent this action task is “Restore or shift
a system to original or new state following procedures, with some checking” for
which the nominal human unreliability is 0.003. The EPCs and their impacts
are shown in Table 3.3.
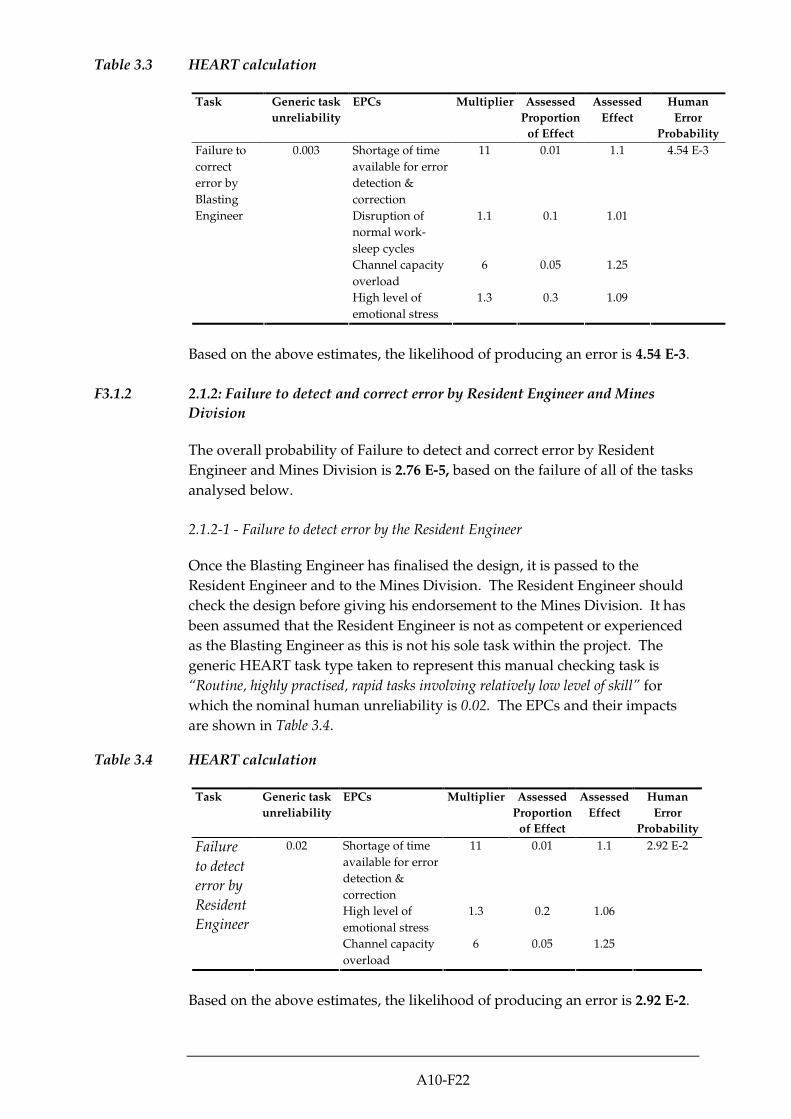
A10-F22
Table 3.3 HEART calculation
Task Generic task
unreliability
EPCs Multiplier Assessed
Proportion
of Effect
Assessed
Effect
Human
Error
Probability
Shortage of time
available for error
detection &
correction
11 0.01 1.1
Disruption of
normal work-
sleep cycles
1.1 0.1 1.01
Channel capacity
overload
6 0.05 1.25
Failure to
correct
error by
Blasting
Engineer
0.003
High level of
emotional stress
1.3 0.3 1.09
4.54 E-3
Based on the above estimates, the likelihood of producing an error is 4.54 E-3.
F3.1.2 2.1.2: Failure to detect and correct error by Resident Engineer and Mines
Division
The overall probability of Failure to detect and correct error by Resident
Engineer and Mines Division is 2.76 E-5, based on the failure of all of the tasks
analysed below.
2.1.2-1 - Failure to detect error by the Resident Engineer
Once the Blasting Engineer has finalised the design, it is passed to the
Resident Engineer and to the Mines Division. The Resident Engineer should
check the design before giving his endorsement to the Mines Division. It has
been assumed that the Resident Engineer is not as competent or experienced
as the Blasting Engineer as this is not his sole task within the project. The
generic HEART task type taken to represent this manual checking task is
“Routine, highly practised, rapid tasks involving relatively low level of skill” for
which the nominal human unreliability is 0.02. The EPCs and their impacts
are shown in Table 3.4.
Table 3.4 HEART calculation
Task Generic task
unreliability
EPCs Multiplier Assessed
Proportion
of Effect
Assessed
Effect
Human
Error
Probability
Shortage of time
available for error
detection &
correction
11 0.01 1.1
High level of
emotional stress
1.3 0.2 1.06
Failure
to detect
error by
Resident
Engineer
0.02
Channel capacity
overload
6 0.05 1.25
2.92 E-2
Based on the above estimates, the likelihood of producing an error is 2.92 E-2.
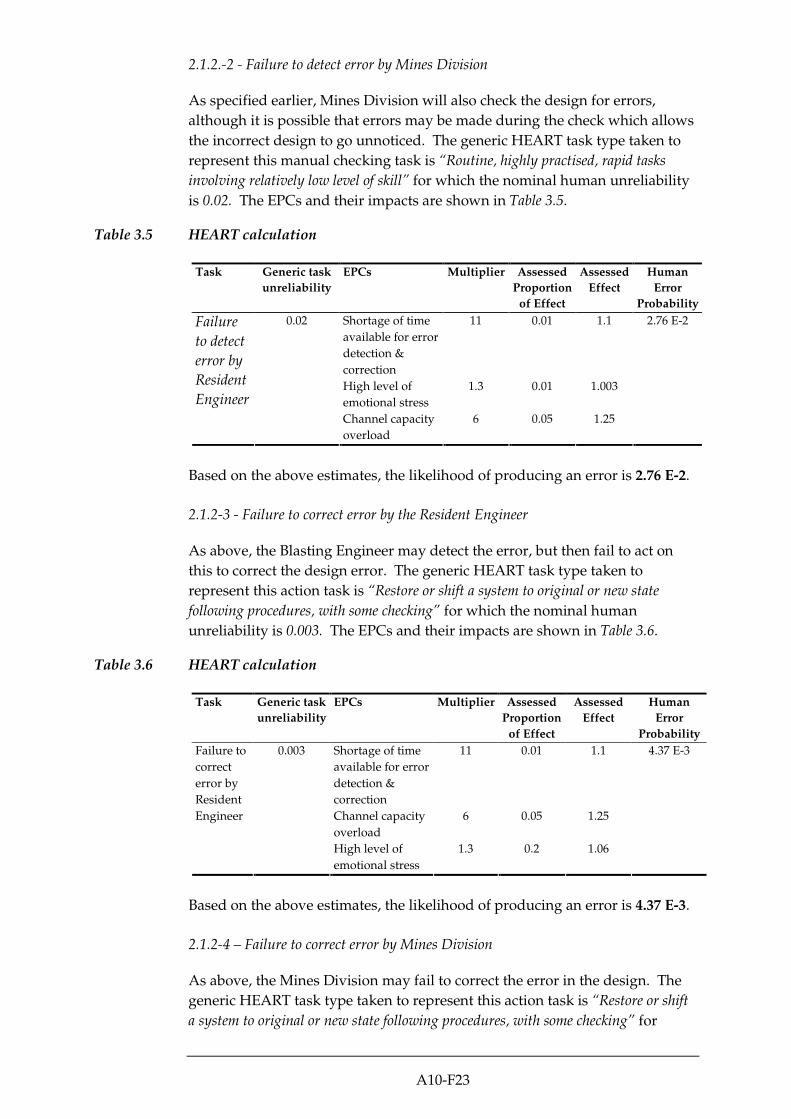
A10-F23
2.1.2.-2 - Failure to detect error by Mines Division
As specified earlier, Mines Division will also check the design for errors,
although it is possible that errors may be made during the check which allows
the incorrect design to go unnoticed. The generic HEART task type taken to
represent this manual checking task is “Routine, highly practised, rapid tasks
involving relatively low level of skill” for which the nominal human unreliability
is 0.02. The EPCs and their impacts are shown in Table 3.5.
Table 3.5 HEART calculation
Task Generic task
unreliability
EPCs Multiplier Assessed
Proportion
of Effect
Assessed
Effect
Human
Error
Probability
Shortage of time
available for error
detection &
correction
11 0.01 1.1
High level of
emotional stress
1.3 0.01 1.003
Failure
to detect
error by
Resident
Engineer
0.02
Channel capacity
overload
6 0.05 1.25
2.76 E-2
Based on the above estimates, the likelihood of producing an error is 2.76 E-2.
2.1.2-3 - Failure to correct error by the Resident Engineer
As above, the Blasting Engineer may detect the error, but then fail to act on
this to correct the design error. The generic HEART task type taken to
represent this action task is “Restore or shift a system to original or new state
following procedures, with some checking” for which the nominal human
unreliability is 0.003. The EPCs and their impacts are shown in Table 3.6.
Table 3.6 HEART calculation
Task Generic task
unreliability
EPCs Multiplier Assessed
Proportion
of Effect
Assessed
Effect
Human
Error
Probability
Shortage of time
available for error
detection &
correction
11 0.01 1.1
Channel capacity
overload
6 0.05 1.25
Failure to
correct
error by
Resident
Engineer
0.003
High level of
emotional stress
1.3 0.2 1.06
4.37 E-3
Based on the above estimates, the likelihood of producing an error is 4.37 E-3.
2.1.2-4 – Failure to correct error by Mines Division
As above, the Mines Division may fail to correct the error in the design. The
generic HEART task type taken to represent this action task is “Restore or shift
a system to original or new state following procedures, with some checking” for
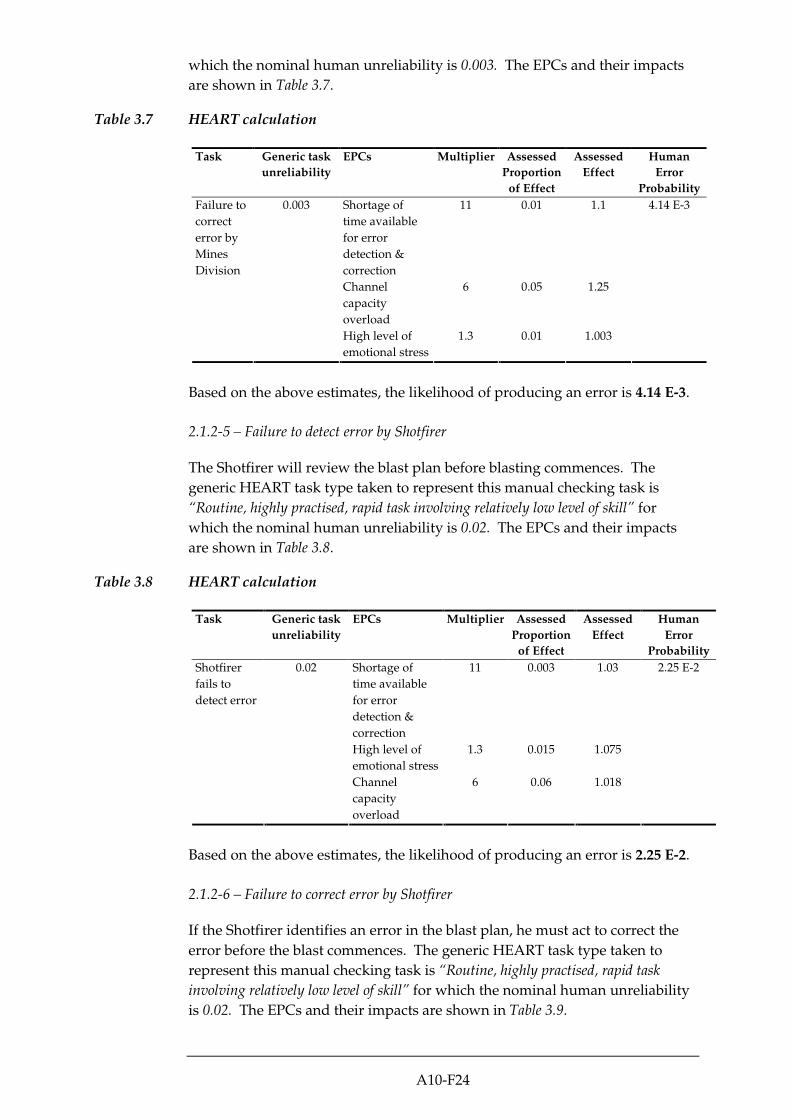
A10-F24
which the nominal human unreliability is 0.003. The EPCs and their impacts
are shown in Table 3.7.
Table 3.7 HEART calculation
Task Generic task
unreliability
EPCs Multiplier Assessed
Proportion
of Effect
Assessed
Effect
Human
Error
Probability
Shortage of
time available
for error
detection &
correction
11 0.01 1.1
Channel
capacity
overload
6 0.05 1.25
Failure to
correct
error by
Mines
Division
0.003
High level of
emotional stress
1.3 0.01 1.003
4.14 E-3
Based on the above estimates, the likelihood of producing an error is 4.14 E-3.
2.1.2-5 – Failure to detect error by Shotfirer
The Shotfirer will review the blast plan before blasting commences. The
generic HEART task type taken to represent this manual checking task is
“Routine, highly practised, rapid task involving relatively low level of skill” for
which the nominal human unreliability is 0.02. The EPCs and their impacts
are shown in Table 3.8.
Table 3.8 HEART calculation
Task Generic task
unreliability
EPCs Multiplier Assessed
Proportion
of Effect
Assessed
Effect
Human
Error
Probability
Shortage of
time available
for error
detection &
correction
11 0.003 1.03
High level of
emotional stress
1.3 0.015 1.075
Shotfirer
fails to
detect error
0.02
Channel
capacity
overload
6 0.06 1.018
2.25 E-2
Based on the above estimates, the likelihood of producing an error is 2.25 E-2.
2.1.2-6 – Failure to correct error by Shotfirer
If the Shotfirer identifies an error in the blast plan, he must act to correct the
error before the blast commences. The generic HEART task type taken to
represent this manual checking task is “Routine, highly practised, rapid task
involving relatively low level of skill” for which the nominal human unreliability
is 0.02. The EPCs and their impacts are shown in Table 3.9.

A10-F25
Table 3.9 HEART calculation
Task Generic task
unreliability
EPCs Multiplier Assessed
Proportion
of Effect
Assessed
Effect
Human
Error
Probability
Shortage of
time available
for error
detection &
correction
11 0.003 1.03
High level of
emotional stress
1.3 0.015 1.075
Shotfirer
fails to
correct
error
0.02
Channel
capacity
overload
6 0.06 1.018
3.38 E-3
Based on the above estimates, the likelihood of producing an error is 3.38 E-3.
F3.2 EVENT 2.2: DETONATOR PUT INTO WRONG HOLE
The overall probability of one detonator being put into a wrong hole is 1.53 E-
8, based on the failure of some or all of the tasks analysed below.
F3.2.1 2.2.1: Delivery of incorrect detonators from the magazine to the blast site
The overall probability of a delivery of incorrect detonators from the
magazine to the blast site is 2.10 E-6, based on the failure of all of the tasks
analysed below. If the Shotfirer fails to check the detonator delay label both
before and after installing, then the delivery error will not be discovered on
site. The overall probability of wrong delivery is insignificant when compared
to the probability that the Shotfirer fails to check the detonator delay label
before installing (even when the delivery is correct); hence it is not considered
in deriving the overall probability for Event 2.2.
2.2.1-1 – Detonators are picked incorrectly by the Shotfirer from the magazine
The Shotfirer must utilise the blast plan to pick the correct detonators from the
magazine. There is potential for the Shotfirer to have a lapse in concentration,
selecting the wrong detonators from the magazine. The generic HEART task
type taken to represent this action task is “Restore or shift a system to original or
new state following procedures, with some checking” for which the nominal human
unreliability is 0.003. The EPCs and their impacts are shown in Table 3.10.

A10-F26
Table 3.10 HEART calculation
Task Generic task
unreliability
EPCs Multiplier Assessed
Proportion
of Effect
Assessed
Effect
Human
Error
Probability
Shortage of
time available
for error
detection &
correction
11 0.01 1.1
Disruption of
normal work-
sleep cycles
1.1 0.1 1.01
Shotfirer
selects
wrong
detonators
at the
magazine
0.003
High level of
emotional stress
1.3 0.2 1.06
3.53 E-3
Based on the above estimates, the likelihood of producing an error is 3.53 E-3.
2.2.1-2 – Shotfirer fails to detect error
The Shotfirer will check that the detonators he has picked are the correct ones.
However, he may misread the information, or forget to check at all. The
generic HEART task type taken to represent this manual checking task is
“Routine, highly practised, rapid task involving relatively low level of skill” for
which the nominal human unreliability is 0.02. The EPCs and their impacts
are shown in Table 3.11.
Table 3.11 HEART calculation
Task Generic task
unreliability
EPCs Multiplier Assessed
Proportion
of Effect
Assessed
Effect
Human
Error
Probability
Shortage of
time available
for error
detection &
correction
11 0.01 1.1
Disruption of
normal work-
sleep cycles
1.1 0.1 1.01
High level of
emotional stress
1.3 0.2 1.06
Shotfirer
fails to
detect error
0.02
Channel
capacity
overload
6 0.05 1.25
2.94 E-2
Based on the above estimates, the likelihood of producing an error is 2.94 E-2.
2.2.1-5 – Shotfirer fails to correct error
If the Shotfirer detects a selection error, he can recover this by acting to change
the detonators to the correct ones. The generic HEART task type taken to
represent this action task is “Restore or shift a system to original or new state
following procedures, with some checking” for which the nominal human
unreliability is 0.003. The EPCs and their impacts are shown in Table 3.12.
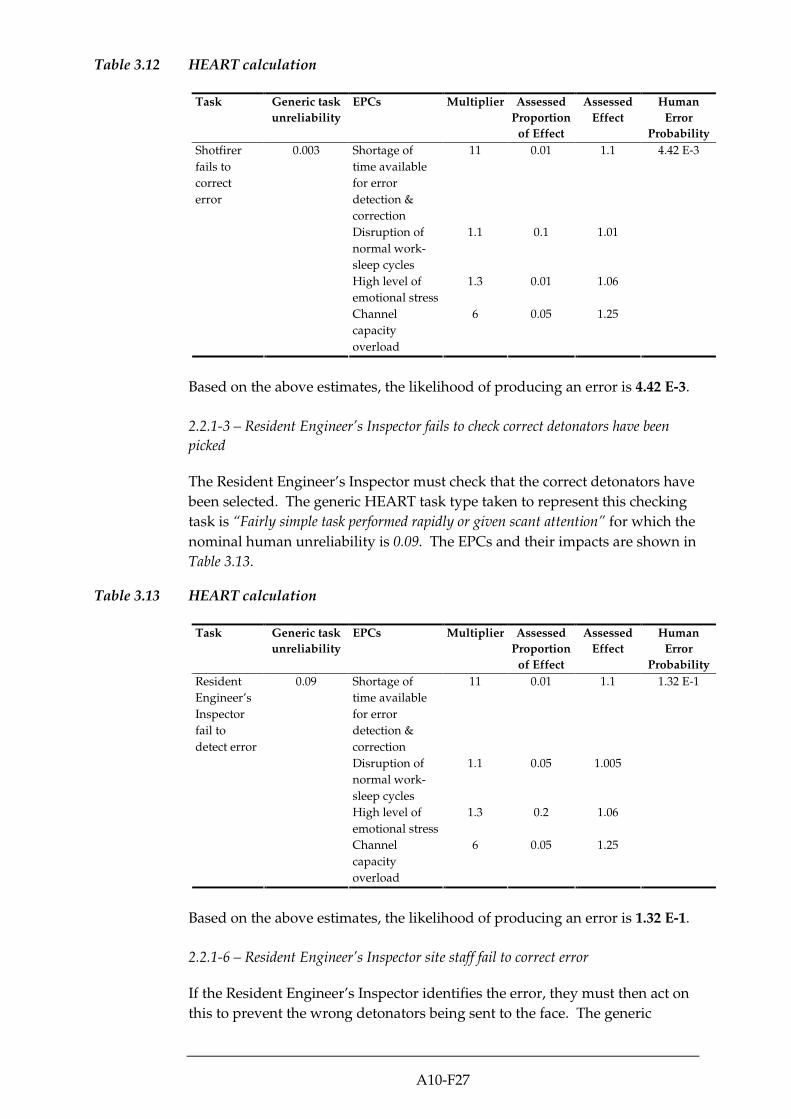
A10-F27
Table 3.12 HEART calculation
Task Generic task
unreliability
EPCs Multiplier Assessed
Proportion
of Effect
Assessed
Effect
Human
Error
Probability
Shortage of
time available
for error
detection &
correction
11 0.01 1.1
Disruption of
normal work-
sleep cycles
1.1 0.1 1.01
High level of
emotional stress
1.3 0.01 1.06
Shotfirer
fails to
correct
error
0.003
Channel
capacity
overload
6 0.05 1.25
4.42 E-3
Based on the above estimates, the likelihood of producing an error is 4.42 E-3.
2.2.1-3 – Resident Engineer’s Inspector fails to check correct detonators have been
picked
The Resident Engineer’s Inspector must check that the correct detonators have
been selected. The generic HEART task type taken to represent this checking
task is “Fairly simple task performed rapidly or given scant attention” for which the
nominal human unreliability is 0.09. The EPCs and their impacts are shown in
Table 3.13.
Table 3.13 HEART calculation
Task Generic task
unreliability
EPCs Multiplier Assessed
Proportion
of Effect
Assessed
Effect
Human
Error
Probability
Shortage of
time available
for error
detection &
correction
11 0.01 1.1
Disruption of
normal work-
sleep cycles
1.1 0.05 1.005
High level of
emotional stress
1.3 0.2 1.06
Resident
Engineer’s
Inspector
fail to
detect error
0.09
Channel
capacity
overload
6 0.05 1.25
1.32 E-1
Based on the above estimates, the likelihood of producing an error is 1.32 E-1.
2.2.1-6 – Resident Engineer’s Inspector site staff fail to correct error
If the Resident Engineer’s Inspector identifies the error, they must then act on
this to prevent the wrong detonators being sent to the face. The generic
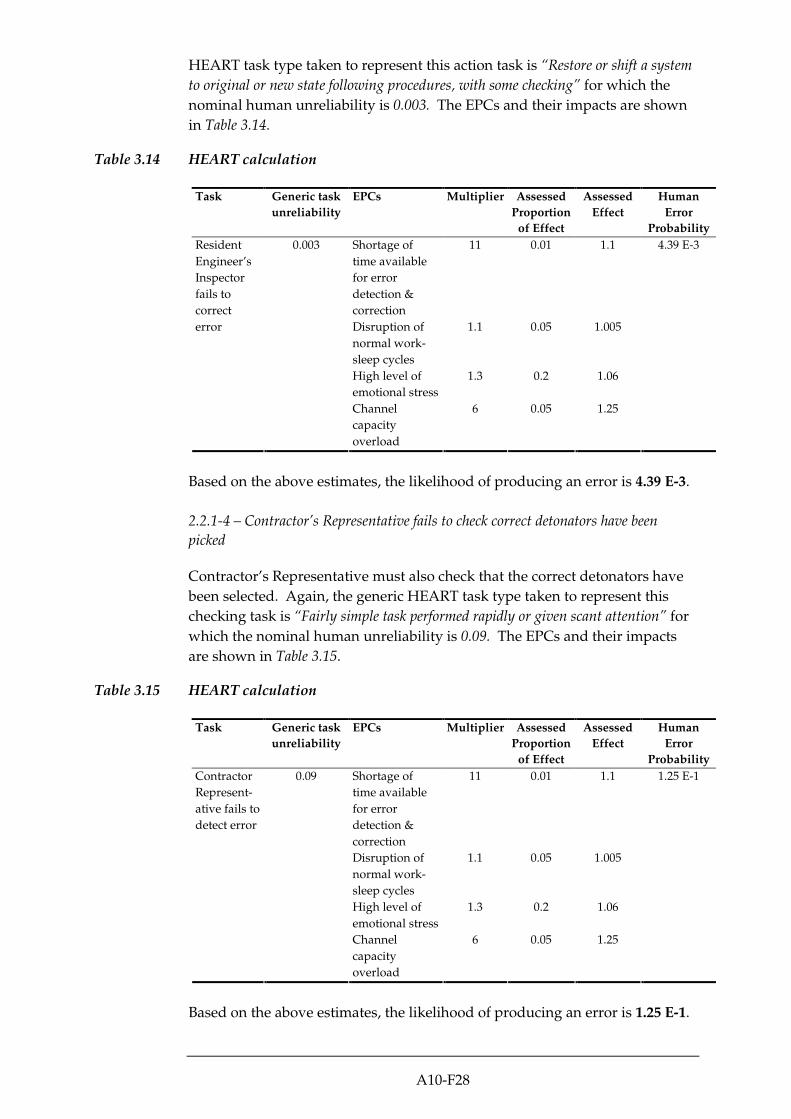
A10-F28
HEART task type taken to represent this action task is “Restore or shift a system
to original or new state following procedures, with some checking” for which the
nominal human unreliability is 0.003. The EPCs and their impacts are shown
in Table 3.14.
Table 3.14 HEART calculation
Task Generic task
unreliability
EPCs Multiplier Assessed
Proportion
of Effect
Assessed
Effect
Human
Error
Probability
Shortage of
time available
for error
detection &
correction
11 0.01 1.1
Disruption of
normal work-
sleep cycles
1.1 0.05 1.005
High level of
emotional stress
1.3 0.2 1.06
Resident
Engineer’s
Inspector
fails to
correct
error
0.003
Channel
capacity
overload
6 0.05 1.25
4.39 E-3
Based on the above estimates, the likelihood of producing an error is 4.39 E-3.
2.2.1-4 – Contractor’s Representative fails to check correct detonators have been
picked
Contractor’s Representative must also check that the correct detonators have
been selected. Again, the generic HEART task type taken to represent this
checking task is “Fairly simple task performed rapidly or given scant attention” for
which the nominal human unreliability is 0.09. The EPCs and their impacts
are shown in Table 3.15.
Table 3.15 HEART calculation
Task Generic task
unreliability
EPCs Multiplier Assessed
Proportion
of Effect
Assessed
Effect
Human
Error
Probability
Shortage of
time available
for error
detection &
correction
11 0.01 1.1
Disruption of
normal work-
sleep cycles
1.1 0.05 1.005
High level of
emotional stress
1.3 0.2 1.06
Contractor
Represent-
ative fails to
detect error
0.09
Channel
capacity
overload
6 0.05 1.25
1.25 E-1
Based on the above estimates, the likelihood of producing an error is 1.25 E-1.

A10-F29
2.2.1-7 Contractor’s Representative fails to correct error
If the Contractor Representative identifies an error, in order to prevent the
wrong detonators being delivered, they must act to correct the error. The
generic HEART task type taken to represent this action task is “Restore or shift
a system to original or new state following procedures, with some checking” for
which the nominal human unreliability is 0.003. The EPCs and their impacts
are shown in Table 3.16.
Table 3.16 HEART calculation
Task Generic task
unreliability
EPCs Multiplier Assessed
Proportion
of Effect
Assessed
Effect
Human
Error
Probability
Shortage of
time available
for error
detection &
correction
11 0.01 1.1
Disruption of
normal work-
sleep cycles
1.1 0.05 1.005
High level of
emotional stress
1.3 0.01 1.003
Contractor
Represent-
ative fails to
correct
error
0.003
Channel
capacity
overload
6 0.05 1.25
4.16 E-3
Based on the above estimates, the likelihood of producing an error is 4.16 E-3.
F3.2.2 2.2.2: Installation of one detonator by Shotfirer into a sector already
containing a detonator of that delay period
The overall probability of a detonator being wrongly installed is 5.47 E-7,
based on the failure of all of the tasks analysed below.
2.2.2 – 1 Shotfirers mark holes incorrectly
The chief Shotfirer will be responsible for marking the holes correctly,
although the junior Shotfirer will assist. There is potential for information
retrieval errors to occur when looking at the plans and transferring this to the
face as well as lapses in concentration when actually marking the holes. The
generic HEART task type taken to represent this action task is “Routine, highly
practised, rapid task involving relatively low level of skill” for which the nominal
human unreliability is 0.02. The EPCs and their impacts are shown in Table
3.17.

A10-F30
Table 3.17 HEART calculation
Task Generic task
unreliability
EPCs Multiplier Assessed
Proportion
of Effect
Assessed
Effect
Human
Error
Probability
Shortage of time
available for error
detection &
correction
11 0.01 1.1
Disruption of
normal work-
sleep cycles
1.1 0.1 1.01
Channel capacity
overload
6 0.05 1.25
High level of
emotional stress
1.3 0.2 1.06
Low signal-noise
ratio
10 0.01 1.09
Shotfirers
fail to mark
holes
correctly
0.02
Poor/
hostile
environment
1.15 1 1.15
3.69 E-2
Based on the above estimates, the likelihood of producing an error is 3.69 E-2.
2.2.2-2 – Shotfirer fails to detect marking error
The Shotfirers should check their own work, and each others. However, there
is potential that one or both Shotfirers fail to check and therefore detect the
marking error. The generic HEART task type taken to represent this checking
task is “Fairly simple task performed rapidly or given scant attention” for which the
nominal human unreliability is 0.09. The EPCs and their impacts are shown in
Table 3.18.
Table 3.18 HEART calculation
Task Generic task
unreliability
EPCs Multiplier Assessed
Proportion
of Effect
Assessed
Effect
Human
Error
Probability
Shortage of time
available for error
detection &
correction
11 0.003 1.03
Disruption of
normal work-
sleep cycles
1.1 0.03 1.003
High level of
emotional stress
1.3 0.06 1.018
Poor/hostile
environment
1.15 0.33 1.0495
Channel capacity
overload
6 0.015 1.075
Shotfirers
fails to
detect
marking
error
0.09
Low signal-noise
ratio
10 0.003 1.027
1.10 E-1
Based on the above estimates, the likelihood of producing an error is 1.10E -01

A10-F31
2.2.2-3 Shotfirers fails to correct marking error
If the Shotfirers have detected the marking error, they must then correct the
error to ensure it is recovered. The generic HEART task type taken to
represent this action task is “Restore or shift a system to original or new state
following procedures, with some checking” for which the nominal human
unreliability is 0.003. The EPCs and their impacts are shown in Table 3.19.
Table 3.19 HEART calculation
Task Generic task
unreliability
EPCs Multiplier Assessed
Proportion
of Effect
Assessed
Effect
Human
Error
Probability
Shortage of time
available for error
detection &
correction
11 0.003 1.03
Disruption of
normal work-
sleep cycles
1.1 0.03 1.003
High level of
emotional stress
1.3 0.06 1.018
Channel capacity
overload
6 0.015 1.075
Poor/hostile
environment
1.15 0.3 1.045
Shotfirers
fail to
correct
marking
error
0.003
Low signal-noise
ratio
10 0.003 1.027
3.64 E-3
Based on the above estimates, the likelihood of producing an error is 3.64 E-3
2.2.2-4 – Shotfirer picks up detonator of wrong time delay
When the Shotfirers pick up the detonator, they must ensure they choose one
with the correct time delay. Due to an action execution error, the Shotfirer
may pick up the wrong one to the intended one. The generic HEART task
type taken to represent this action task is “Completely familiar, well designed,
highly practised, routine task occurring several times per hour, performed to highest
possible standards by highly motivated and experienced person, totally aware of the
implications of failure, with time to correct potential error, but without the benefit of
significant job aids” for which the nominal human unreliability is 0.0004. The
EPCs and their impacts are shown in Table 3.20.

A10-F32
Table 3.20 HEART calculation
Task Generic task
unreliability
EPCs Multiplier Assessed
Proportion
of Effect
Assessed
Effect
Human
Error
Probability
Shortage of time
available for error
detection &
correction
11 0.01 1.1
Disruption of
normal work-
sleep cycles
1.1 0.1 1.01
Channel capacity
overload
6 0.05 1.25
High level of
emotional stress
1.3 0.2 1.06
Low signal-noise
ratio
10 0.01 1.09
Shotfirer
picks up
detonator
of wrong
time delay
0.0004
Poor/
hostile
environment
1.15 1 1.15
7.38 E-4
Based on the above estimates, the likelihood of producing an error is 7.38 E-4.
2.2.2-5 – Shotfirer fails to check shell & detonator delay tag before placing into the
hole
The Shotfirer should check the detonator shell and delay tag before placing it
in the hole. However, it is possible that due to time pressure, poor lighting etc
that he omits to check before placing the detonator in the hole. The generic
HEART task type taken to represent this manual checking task is “Completely
familiar, well designed, highly practised, routine task occurring several times per
hour, performed to highest possible standards by highly motivated and experienced
person, totally aware of the implications of failure, with time to correct potential error,
but without the benefit of significant job aids” for which the nominal human
unreliability is 0.0004. The EPCs and their impacts are shown in Table 3.21.
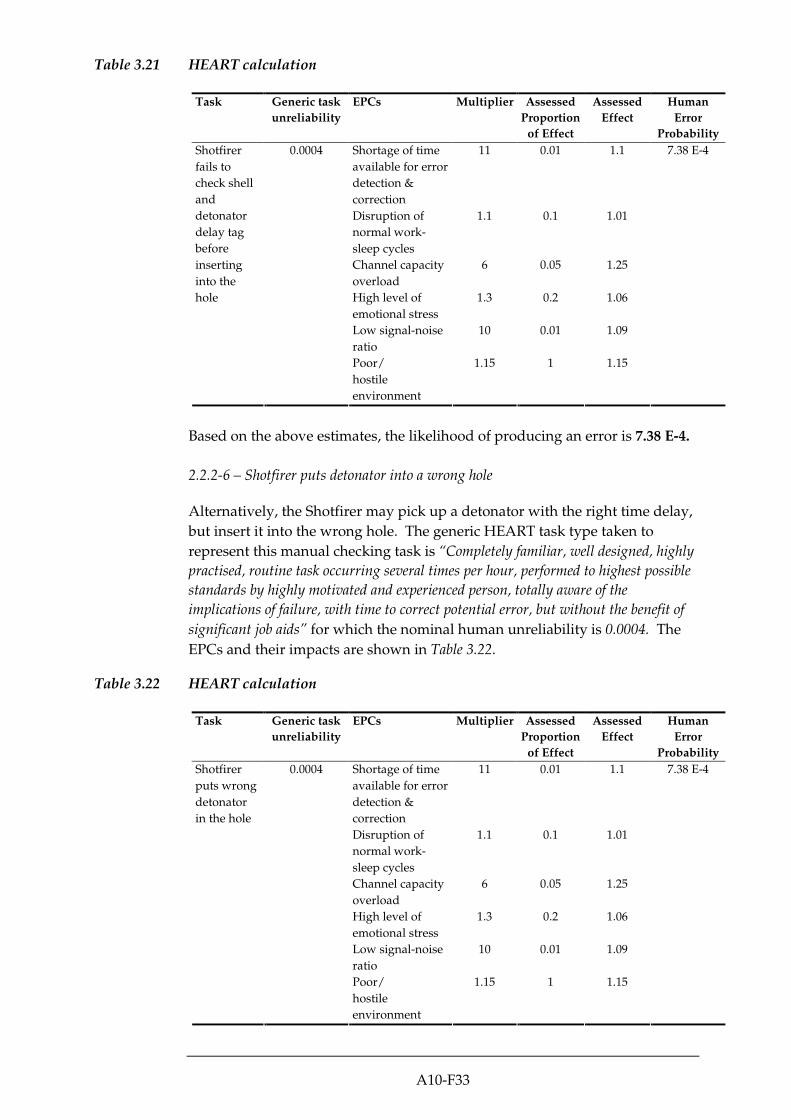
A10-F33
Table 3.21 HEART calculation
Task Generic task
unreliability
EPCs Multiplier Assessed
Proportion
of Effect
Assessed
Effect
Human
Error
Probability
Shortage of time
available for error
detection &
correction
11 0.01 1.1
Disruption of
normal work-
sleep cycles
1.1 0.1 1.01
Channel capacity
overload
6 0.05 1.25
High level of
emotional stress
1.3 0.2 1.06
Low signal-noise
ratio
10 0.01 1.09
Shotfirer
fails to
check shell
and
detonator
delay tag
before
inserting
into the
hole
0.0004
Poor/
hostile
environment
1.15 1 1.15
7.38 E-4
Based on the above estimates, the likelihood of producing an error is 7.38 E-4.
2.2.2-6 – Shotfirer puts detonator into a wrong hole
Alternatively, the Shotfirer may pick up a detonator with the right time delay,
but insert it into the wrong hole. The generic HEART task type taken to
represent this manual checking task is “Completely familiar, well designed, highly
practised, routine task occurring several times per hour, performed to highest possible
standards by highly motivated and experienced person, totally aware of the
implications of failure, with time to correct potential error, but without the benefit of
significant job aids” for which the nominal human unreliability is 0.0004. The
EPCs and their impacts are shown in Table 3.22.
Table 3.22 HEART calculation
Task Generic task
unreliability
EPCs Multiplier Assessed
Proportion
of Effect
Assessed
Effect
Human
Error
Probability
Shortage of time
available for error
detection &
correction
11 0.01 1.1
Disruption of
normal work-
sleep cycles
1.1 0.1 1.01
Channel capacity
overload
6 0.05 1.25
High level of
emotional stress
1.3 0.2 1.06
Low signal-noise
ratio
10 0.01 1.09
Shotfirer
puts wrong
detonator
in the hole
0.0004
Poor/
hostile
environment
1.15 1 1.15
7.38 E-4

A10-F34
Based on the above estimates, the likelihood of producing an error is 7.38 E-4.
2.2.2-7 – Shotfirer fails to check detonator delay tag after placing into the hole
The final check to prevent the wrong detonator being placed in the hole is the
Shotfirer making a final check of the delay tag once it has been installed. Both
Shotfirers will carry out their own checks and cross-check each others work.
The generic HEART task type taken to represent this manual checking task is
“Completely familiar, well designed, highly practised, routine task occurring several
times per hour, performed to highest possible standards by highly motivated and
experienced person, totally aware of the implications of failure, with time to correct
potential error, but without the benefit of significant job aids” for which the
nominal human unreliability is 0.0004. The EPCs and their impacts are shown
in Table 3.23.
Table 3.23 HEART calculation
Task Generic task
unreliability
EPCs Multiplier Assessed
Proportion
of Effect
Assessed
Effect
Human
Error
Probability
Shortage of time
available for error
detection &
correction
11 0.01 1.1
Disruption of
normal work-
sleep cycles
1.1 0.1 1.01
Channel capacity
overload
6 0.05 1.25
High level of
emotional stress
1.3 0.2 1.06
Low signal-noise
ratio
10 0.01 1.09
Shotfirer
fails to
check
detonator
delay tag
after
placing into
the hole
0.0004
Poor/
hostile
environment
1.15 1 1.15
7.38 E-4
Based on the above estimates, the likelihood of producing an error is 7.38 E-4.
F3.2.3 2.2.3: Shotfirer fails to check and correct installation error
The overall probability of the Shotfirer failing to check and correct an
installation error is 2.79 E-2, based on the failure of all of the tasks analysed
below.
2.2.3-1 – Shotfirer leaves empty holes in the blast face due to not realising there are
detonators left over
Only the exact number of detonators should be delivered to site, therefore if
there are any remaining detonators, it means that there must be some holes
without detonators. However, if the Shotfirer does not realise there are
detonators left over, he will not detect that there are empty holes to fill. The

A10-F35
generic HEART task type taken to represent this action task is “Routine, highly
practised, rapid task involving relatively low level of skill” for which the nominal
human unreliability is 0.02. The EPCs and their impacts are shown in Table
3.24.
Table 3.24 HEART calculation
Task Generic task
unreliability
EPCs Multiplier Assessed
Proportion
of Effect
Assessed
Effect
Human
Error
Probability
Shortage of time
available for error
detection &
correction
11 0.003 1.03
Disruption of
normal work-
sleep cycles
1.1 0.03 1.003
High level of
emotional stress
1.3 0.06 1.018
Poor/hostile
environment
1.15 0.3 1.045
Low signal-noise
ratio
10 0.003 1.027
Shotfirers
leaves
empty
holes
0.02
Channel capacity
overload
6 0.015 1.075
2.43 E-2
Based on the above estimates, the likelihood of producing an error is 2.43 E-2.
2.2.3-2 – Shotfirer fails to fill empty holes before detonation
If the Shotfirers identify any errors during their final check of the delay tags,
they must rectify these errors. The generic HEART task type taken to
represent this action task is “Restore or shift a system to original or new state
following procedures, with some checking” for which the nominal human
unreliability is 0.003. The EPCs and their impacts are shown in Table 3.25.

A10-F36
Table 3.25 HEART calculation
Task Generic task
unreliability
EPCs Multiplier Assessed
Proportion
of Effect
Assessed
Effect
Human
Error
Probability
Shortage of time
available for error
detection &
correction
11 0.003 1.03
Disruption of
normal work-
sleep cycles
1.1 0.03 1.003
Channel capacity
overload
6 0.015 1.075
Low signal-noise
ratio
10 0.003 1.027
High level of
emotional stress
1.3 0.06 1.018
Shotfirer
fails to
correct
error
0.003
Poor/
hostile
environment
1.15 0.3 1.045
3.64 E-3
Based on the above estimates, the likelihood of producing an error is 3.64 E-3
F3.3 EVENT 2.3: DETONATOR CONNECTED TO A SURFACE CONNECTOR FROM
ANOTHER SECTOR
The overall probability of one detonator being connected to a surface
connector from another sector is 2.84 E-6, based on the failure of some or all of
the tasks analysed below.
F3.3.1 2.3.1: Shotfirer misconnects one detonator to the wrong surface connector
The overall probability of the Shotfirer making a misconnection is 1.97 E-2,
based on the failure of some or all of the tasks analysed below.
2.3.1-1 – Shotfirer marks sectors incorrectly
The chief Shotfirer will be responsible for marking the sectors correctly,
although the junior Shotfirer will assist. There is potential for information
retrieval errors to occur when looking at the plans and transferring this to the
face as well as lapses in concentration when actually marking the sectors. The
generic HEART task type taken to represent this action task is “Routine, highly
practised, rapid task involving relatively low level of skill” for which the nominal
human unreliability is 0.02. The EPCs and their impacts are shown in Table
3.26.
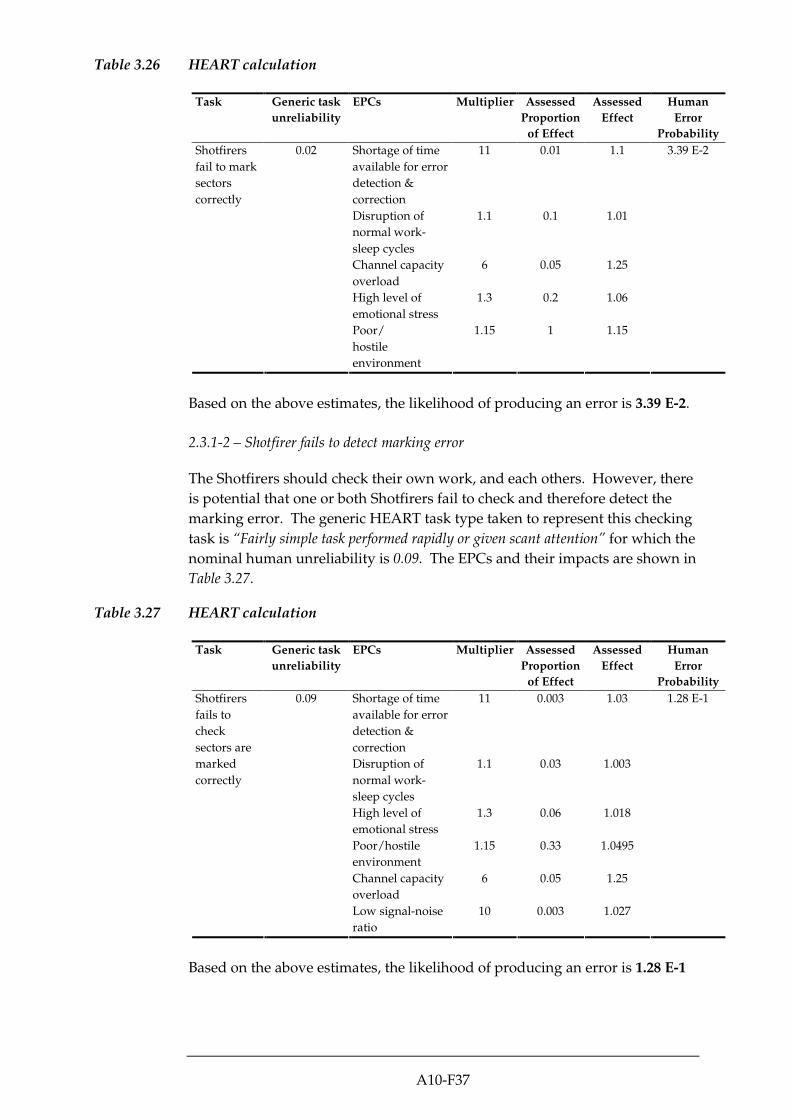
A10-F37
Table 3.26 HEART calculation
Task Generic task
unreliability
EPCs Multiplier Assessed
Proportion
of Effect
Assessed
Effect
Human
Error
Probability
Shortage of time
available for error
detection &
correction
11 0.01 1.1
Disruption of
normal work-
sleep cycles
1.1 0.1 1.01
Channel capacity
overload
6 0.05 1.25
High level of
emotional stress
1.3 0.2 1.06
Shotfirers
fail to mark
sectors
correctly
0.02
Poor/
hostile
environment
1.15 1 1.15
3.39 E-2
Based on the above estimates, the likelihood of producing an error is 3.39 E-2.
2.3.1-2 – Shotfirer fails to detect marking error
The Shotfirers should check their own work, and each others. However, there
is potential that one or both Shotfirers fail to check and therefore detect the
marking error. The generic HEART task type taken to represent this checking
task is “Fairly simple task performed rapidly or given scant attention” for which the
nominal human unreliability is 0.09. The EPCs and their impacts are shown in
Table 3.27.
Table 3.27 HEART calculation
Task Generic task
unreliability
EPCs Multiplier Assessed
Proportion
of Effect
Assessed
Effect
Human
Error
Probability
Shortage of time
available for error
detection &
correction
11 0.003 1.03
Disruption of
normal work-
sleep cycles
1.1 0.03 1.003
High level of
emotional stress
1.3 0.06 1.018
Poor/hostile
environment
1.15 0.33 1.0495
Channel capacity
overload
6 0.05 1.25
Shotfirers
fails to
check
sectors are
marked
correctly
0.09
Low signal-noise
ratio
10 0.003 1.027
1.28 E-1
Based on the above estimates, the likelihood of producing an error is 1.28 E-1
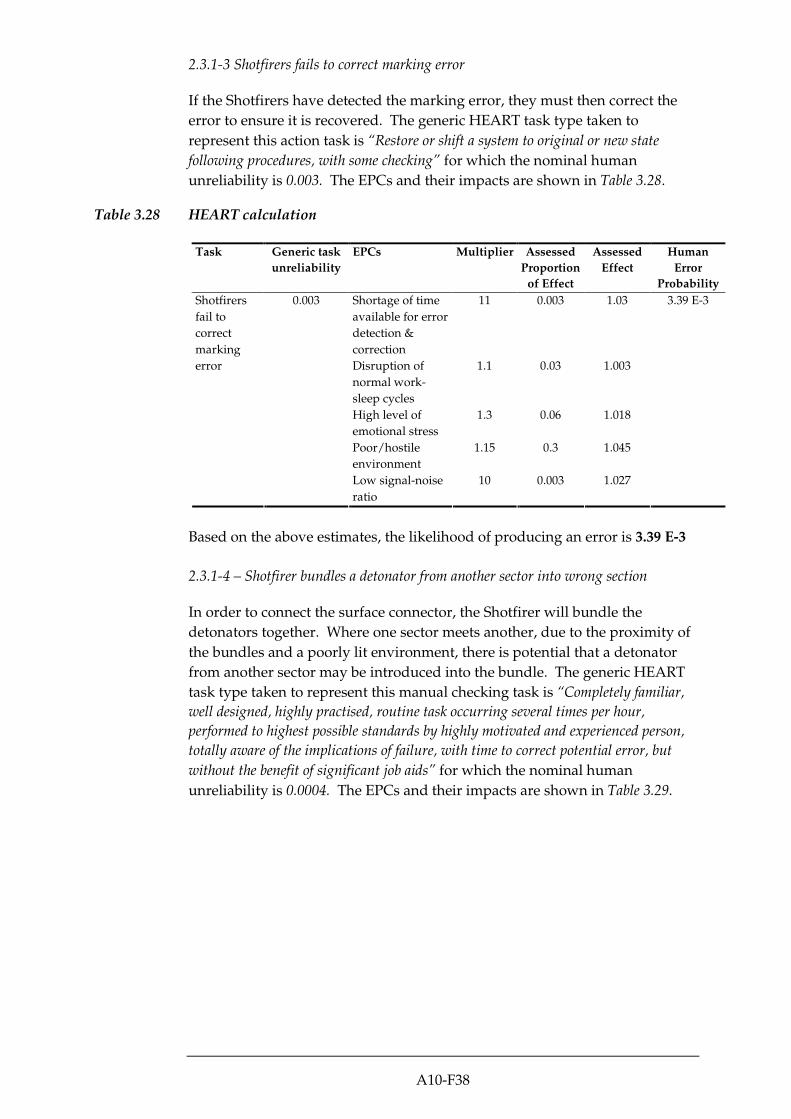
A10-F38
2.3.1-3 Shotfirers fails to correct marking error
If the Shotfirers have detected the marking error, they must then correct the
error to ensure it is recovered. The generic HEART task type taken to
represent this action task is “Restore or shift a system to original or new state
following procedures, with some checking” for which the nominal human
unreliability is 0.003. The EPCs and their impacts are shown in Table 3.28.
Table 3.28 HEART calculation
Task Generic task
unreliability
EPCs Multiplier Assessed
Proportion
of Effect
Assessed
Effect
Human
Error
Probability
Shortage of time
available for error
detection &
correction
11 0.003 1.03
Disruption of
normal work-
sleep cycles
1.1 0.03 1.003
High level of
emotional stress
1.3 0.06 1.018
Poor/hostile
environment
1.15 0.3 1.045
Shotfirers
fail to
correct
marking
error
0.003
Low signal-noise
ratio
10 0.003 1.027
3.39 E-3
Based on the above estimates, the likelihood of producing an error is 3.39 E-3
2.3.1-4 – Shotfirer bundles a detonator from another sector into wrong section
In order to connect the surface connector, the Shotfirer will bundle the
detonators together. Where one sector meets another, due to the proximity of
the bundles and a poorly lit environment, there is potential that a detonator
from another sector may be introduced into the bundle. The generic HEART
task type taken to represent this manual checking task is “Completely familiar,
well designed, highly practised, routine task occurring several times per hour,
performed to highest possible standards by highly motivated and experienced person,
totally aware of the implications of failure, with time to correct potential error, but
without the benefit of significant job aids” for which the nominal human
unreliability is 0.0004. The EPCs and their impacts are shown in Table 3.29.
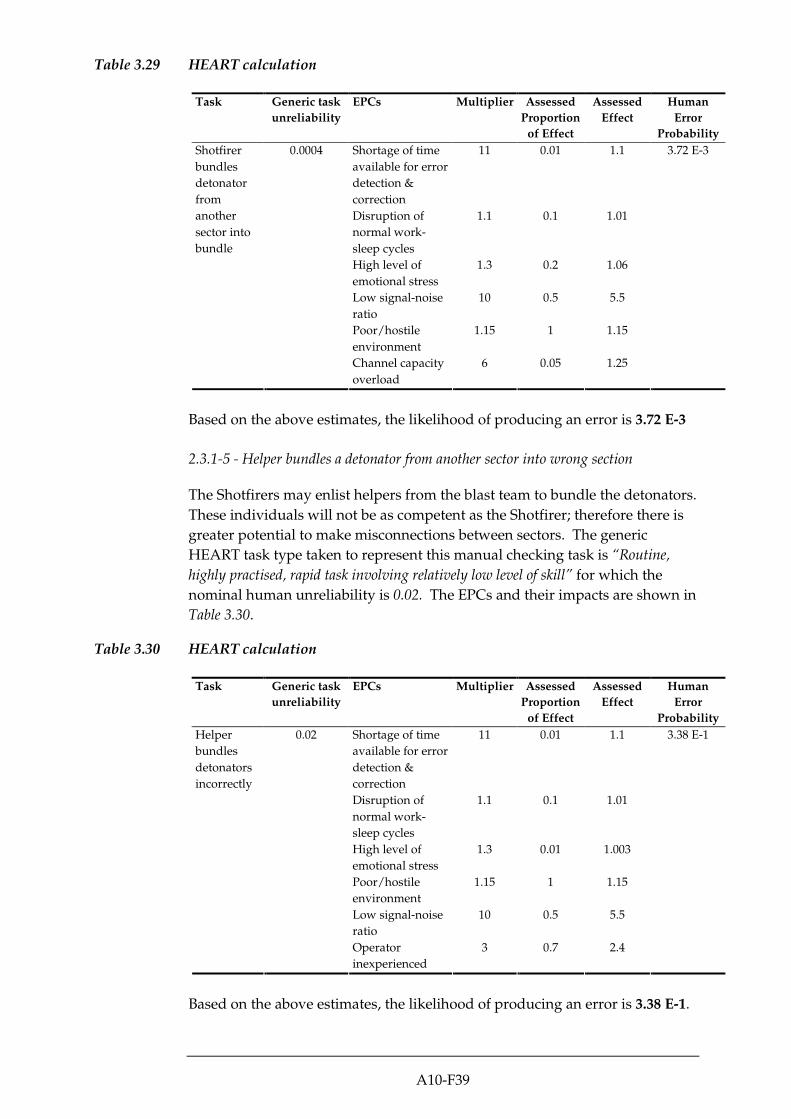
A10-F39
Table 3.29 HEART calculation
Task Generic task
unreliability
EPCs Multiplier Assessed
Proportion
of Effect
Assessed
Effect
Human
Error
Probability
Shortage of time
available for error
detection &
correction
11 0.01 1.1
Disruption of
normal work-
sleep cycles
1.1 0.1 1.01
High level of
emotional stress
1.3 0.2 1.06
Low signal-noise
ratio
10 0.5 5.5
Poor/hostile
environment
1.15 1 1.15
Shotfirer
bundles
detonator
from
another
sector into
bundle
0.0004
Channel capacity
overload
6 0.05 1.25
3.72 E-3
Based on the above estimates, the likelihood of producing an error is 3.72 E-3
2.3.1-5 - Helper bundles a detonator from another sector into wrong section
The Shotfirers may enlist helpers from the blast team to bundle the detonators.
These individuals will not be as competent as the Shotfirer; therefore there is
greater potential to make misconnections between sectors. The generic
HEART task type taken to represent this manual checking task is “Routine,
highly practised, rapid task involving relatively low level of skill” for which the
nominal human unreliability is 0.02. The EPCs and their impacts are shown in
Table 3.30.
Table 3.30 HEART calculation
Task Generic task
unreliability
EPCs Multiplier Assessed
Proportion
of Effect
Assessed
Effect
Human
Error
Probability
Shortage of time
available for error
detection &
correction
11 0.01 1.1
Disruption of
normal work-
sleep cycles
1.1 0.1 1.01
High level of
emotional stress
1.3 0.01 1.003
Poor/hostile
environment
1.15 1 1.15
Low signal-noise
ratio
10 0.5 5.5
Helper
bundles
detonators
incorrectly
0.02
Operator
inexperienced
3 0.7 2.4
3.38 E-1
Based on the above estimates, the likelihood of producing an error is 3.38 E-1.

A10-F40
2.3.1-6 – Shotfirer fails to detect bundling error by helper
The Shotfirers should check that the detonators have been bundled correctly
by the helper. However, due to time pressure for example, one or both may
not carry out the check. The generic HEART task type taken to represent this
manual checking task is “Routine, highly practised, rapid task involving relatively
low level of skill” for which the nominal human unreliability is 0.02. The EPCs
and their impacts are shown in Table 3.31.
Table 3.31 HEART calculation
Task Generic task
unreliability
EPCs Multiplier Assessed
Proportion
of Effect
Assessed
Effect
Human
Error
Probability
Shortage of
time available
for error
detection &
correction
11 0.003 1.03
Disruption of
normal work-
sleep cycles
1.1 0.03 1.003
High level of
emotional stress
1.3 0.006 1.018
Channel
capacity
overload
6 0.05 1.25
Low signal-
noise ratio
10 0.003 1.027
Shotfirer
fails to
detect error
0.02
Poor/
hostile
environment
1.15 0.33 1.0495
2.83 E-2
Based on the above estimates, the likelihood of producing an error is 2.83 E-2.
2.3.1-7 – Shotfirer fails to correct bundling error by helper
If the Shotfirer detects a bundling error, he can recover this by re-bundling the
detonators. The generic HEART task type taken to represent this action task is
“Restore or shift a system to original or new state following procedures, with some
checking” for which the nominal human unreliability is 0.003. The EPCs and
their impacts are shown in Table 3.32.

A10-F41
Table 3.32 HEART calculation
Task Generic task
unreliability
EPCs Multiplier Assessed
Proportion
of Effect
Assessed
Effect
Human
Error
Probability
Shortage of time
available for error
detection &
correction
11 0.003 1.03
Disruption of
normal work-
sleep cycles
1.1 0.03 1.003
High level of
emotional stress
1.3 0.06 1.018
Poor/hostile
environment
1.15 0.3 1.045
Channel capacity
overload
6 0.015 1.075
Shotfirer
fails to
correct
bundling
error
0.003
Low signal-noise
ratio
10 0.003 1.027
3.64 E-3
Based on the above estimates, the likelihood of producing an error is 3.64 E-3.
2.3.1-8 – Shotfirer connects wrong detonator
The final action error is that the Shotfirer connects the wrong detonator, due to
a lapse in concentration. The generic HEART task type taken to represent this
manual checking task is “Completely familiar, well designed, highly practised,
routine task occurring several times per hour, performed to highest possible standards
by highly motivated and experienced person, totally aware of the implications of
failure, with time to correct potential error, but without the benefit of significant job
aids” for which the nominal human unreliability is 0.0004. The EPCs and their
impacts are shown in Table 3.33.
Table 3.33 HEART calculation
Task Generic task
unreliability
EPCs Multiplier Assessed
Proportion
of Effect
Assessed
Effect
Human
Error
Probability
Shortage of time
available for error
detection &
correction
11 0.01 1.1
Disruption of
normal work-
sleep cycles
1.1 0.1 1.01
High level of
emotional stress
1.3 0.2 1.06
Poor/hostile
environment
1.15 1 1.15
Low signal-noise
ratio
10 0.01 1.09
Shotfirer
connects
wrong
detonator
0.0004
Channel capacity
overload
6 0.05 1.25
7.38 E-4
Based on the above estimates, the likelihood of producing an error is 7.38 E-4

A10-F42
F3.3.2 2.3.2 – Failure to detect and correct connection error
The overall probability of failure to detect and correct a connection error is
1.44 E-4, based on the failure of some or all of the tasks analysed below.
2.3.2-1 – Shotfirer fails to detect connection error
The Shotfirers should check that the surface connectors have been connected
correctly. However, due to time pressure, sleep deprivation, and/or the poor
working environment for example, one or both may not carry out the check.
The generic HEART task type taken to represent this manual checking task is
“Routine, highly practised, rapid task involving relatively low level of skill” for
which the nominal human unreliability is 0.02. The EPCs and their impacts
are shown in Table 3.34.
Table 3.34 HEART calculation
Task Generic task
unreliability
EPCs Multiplier Assessed
Proportion
of Effect
Assessed
Effect
Human
Error
Probability
Shortage of
time available
for error
detection &
correction
11 0.003 1.03
Disruption of
normal work-
sleep cycles
1.1 0.03 1.003
High level of
emotional stress
1.3 0.06 1.018
Poor/hostile
environment
1.15 0.33 1.0495
Channel
capacity
overload
6 0.05 1.25
Shotfirer
fails to
detect error
0.02
Low signal-
noise ratio
10 0.003 1.027
2.83 E-2
Based on the above estimates, the likelihood of producing an error is 2.83 E-2.
2.3.2-2 – Shotfirer fails to correct connection error
If the Shotfirer detects a bundling error, he can recover this by re-bundling the
detonators. The generic HEART task type taken to represent this action task is
“Restore or shift a system to original or new state following procedures, with some
checking” for which the nominal human unreliability is 0.003. The EPCs and
their impacts are shown in Table 3.35.

A10-F43
Table 3.35 HEART calculation
Task Generic task
unreliability
EPCs Multiplier Assessed
Proportion
of Effect
Assessed
Effect
Human
Error
Probability
Shortage of time
available for error
detection &
correction
11 0.003 1.03
Disruption of
normal work-
sleep cycles
1.1 0.03 1.003
Channel capacity
overload
6 0.015 1.075
High level of
emotional stress
1.3 0.06 1.018
Poor/hostile
environment
1.15 0.3 1.045
Shotfirer
fails to
correct
connection
error
0.003
Low signal-noise
ratio
10 0.003 1.027
3.64 E-3
Based on the above estimates, the likelihood of producing an error is 3.64 E-3.
2.3.2-3 – Blasting Engineer fails to detect connection error
The Blasting Engineer should check that the surface connectors have been
connected correctly. The generic HEART task type taken to represent this
manual checking task is “Routine, highly practised, rapid task involving relatively
low level of skill” for which the nominal human unreliability is 0.02. The EPCs
and their impacts are shown in Table 3.36.
Table 3.36 HEART calculation
Task Generic task
unreliability
EPCs Multiplier Assessed
Proportion
of Effect
Assessed
Effect
Human
Error
Probability
Shortage of
time available
for error
detection &
correction
11 0.01 1.1
Disruption of
normal work-
sleep cycles
1.1 0.1 1.01
High level of
emotional stress
1.3 0.3 1.09
Channel
capacity
overload
6 1 1.15
Low signal-
noise ratio
10 0.05 1.25
Blasting
Engineer
fails to
detect error
0.02
Poor/
hostile
environment
1.15 0.01 1.09
3.79 E-2
Based on the above estimates, the likelihood of producing an error is 3.79 E-2.

A10-F44
2.3.2-4 – Blasting Engineer fails to correct connection error
Following identification of a connection error, the Blasting Engineer should
take steps to correct the error. However, it is possible that his attention may
be drawn elsewhere due to high workload for example. The generic HEART
task type taken to represent this action task is “Restore or shift a system to
original or new state following procedures, with some checking” for which the
nominal human unreliability is 0.003. The EPCs and their impacts are shown
in Table 3.37.
Table 3.37 HEART calculation
Task Generic task
unreliability
EPCs Multiplier Assessed
Proportion
of Effect
Assessed
Effect
Human
Error
Probability
Shortage of time
available for error
detection &
correction
11 0.01 1.1
Disruption of
normal work-
sleep cycles
1.1 0.1 1.01
High level of
emotional stress
1.3 0.3 1.09
Low signal-noise
ratio
10 0.01 1.09
Poor/hostile
environment
1.15 1 1.15
Blasting
Engineer
fails to
correct
connection
error
0.003
Channel capacity
overload
6 0.05 1.25
4.55 E-3
Based on the above estimates, the likelihood of producing an error is 4.55 E-3.
2.3.2-5 – Resident Site Staff fails to detect connection error
Representatives from the Resident Site Staff must also check that the
detonators have been connected correctly. The generic HEART task type
taken to represent this checking task is “Fairly simple task performed rapidly or
given scant attention” for which the nominal human unreliability is 0.09. The
EPCs and their impacts are shown in Table 3.38.

A10-F45
Table 3.38 HEART calculation
Task Generic task
unreliability
EPCs Multiplier Assessed
Proportion
of Effect
Assessed
Effect
Human
Error
Probability
Shortage of
time available
for error
detection &
correction
11 0.003 1.03
Channel
capacity
overload
6 0.015 1.075
High level of
emotional stress
1.3 0.003 1.0009
Low signal-
noise ratio
10 0.003 1.027
Resident
Site Staff
fails to
detect error
0.09
Disruption of
normal work-
sleep cycles
1.1 0.03 1.003
1.03 E-1
Based on the above estimates, the likelihood of producing an error is 1.03 E-1.
2.3.2-6 – Resident Site Staff fails to correct connection error
Upon detecting a connection error, representatives must act to correct the
error. The generic HEART task type taken to represent this action task is
“Restore or shift a system to original or new state following procedures, with some
checking” for which the nominal human unreliability is 0.003. The EPCs and
their impacts are shown in Table 3.39.
Table 3.39 HEART calculation
Task Generic task
unreliability
EPCs Multiplier Assessed
Proportion
of Effect
Assessed
Effect
Human
Error
Probability
Shortage of
time available
for error
detection &
correction
11 0.003 1.03
High level of
emotional stress
1.3 0.003 1.0009
Low signal-
noise ratio
10 0.003 1.027
Channel
capacity
overload
6 0.015 1.075
Resident
Site Staff
fails to
correct
error
0.003
Disruption of
normal work-
sleep cycles
1.1 0.03 1.003
3.42 E-3
Based on the above estimates, the likelihood of producing an error is 3.42 E-3.

A10-F46
F3.4 EVENT 2.4: SHOTFIRER USES WRONG SURFACE CONNECTOR
The overall probability of the wrong surface connector being used is 7.43 E-9,
based on the failure of all of the tasks analysed below. As specified in Section
F3.2.1, wrong delivery has not been factored into the calculation of the overall
probability of this event due to its very small influence.
F3.4.1 2.4.1: Incorrect installation of surface connector
The overall probability of the Shotfirer making a misconnection is 1.48 E-3, based on
the failure of some or all of the tasks analysed below.
2.4.1-1 – Shotfirer fails to check the colour of the surface connector before installing
The Shotfirer must check the colour of the surface connector before connecting
to the detonator bundle. The generic HEART task type taken to represent this
action task is “Completely familiar, well designed, highly practised, routine task
occurring several times per hour, performed to highest possible standards by highly
motivated and experienced person, totally aware of the implications of failure, with
time to correct potential error, but without the benefit of significant job aids” for
which the nominal human unreliability is 0.0004. The EPCs and their impacts
are shown in Table 3.40.
Table 3.40 HEART calculation
Task Generic task
unreliability
EPCs Multiplier Assessed
Proportion
of Effect
Assessed
Effect
Human
Error
Probability
Shortage of time
available for error
detection &
correction
11 0.01 1.1
Disruption of
normal work-
sleep cycles
1.1 0.1 1.01
Channel capacity
overload
6 0.05 1.25
High level of
emotional stress
1.3 0.2 1.06
Low signal-noise
ratio
10 0.01 1.09
Shotfirer
fails to
check
colour of
surface
connector
0.0004
Poor/
hostile
environment
1.15 1 1.15
7.38 E-4
Based on the above estimates, the likelihood of producing an error is 7.38 E-4.
2.4.1-2 – Shotfirer connects wrong surface connector
The Shotfirer may connect the wrong surface connector due to a lapse in
concentration. The generic HEART task type taken to represent this action
task is “Completely familiar, well designed, highly practised, routine task occurring
several times per hour, performed to highest possible standards by highly motivated
and experienced person, totally aware of the implications of failure, with time to
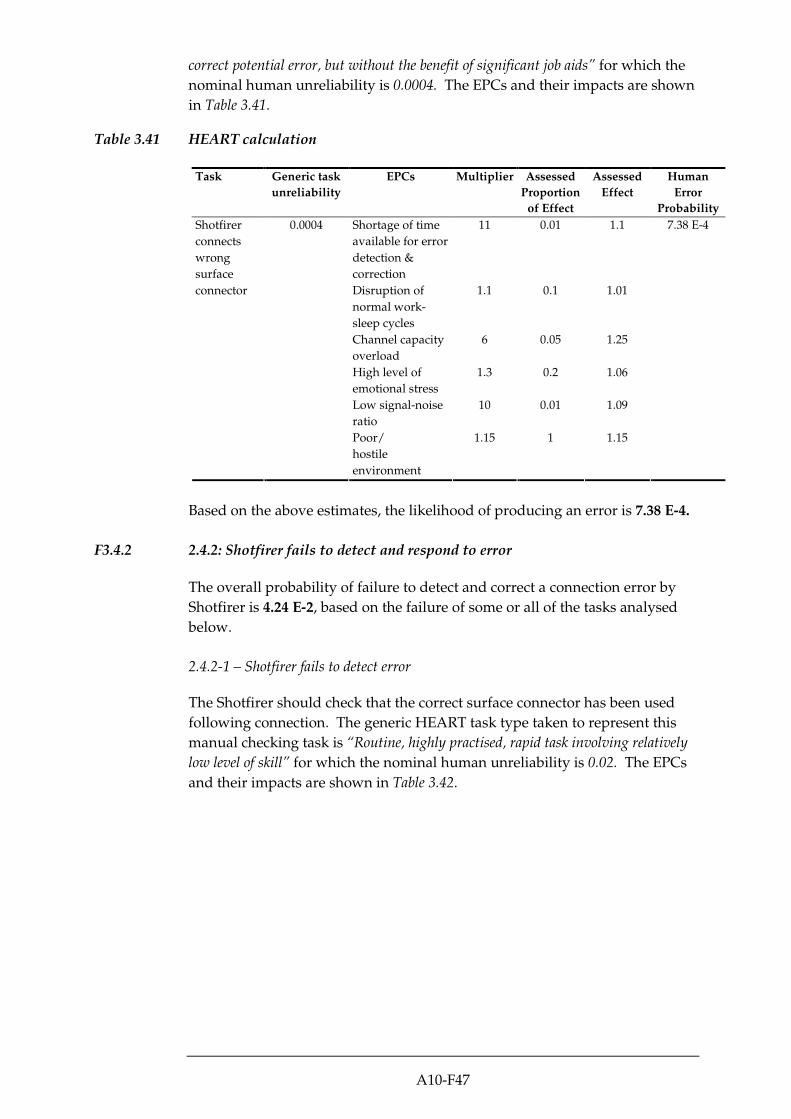
A10-F47
correct potential error, but without the benefit of significant job aids” for which the
nominal human unreliability is 0.0004. The EPCs and their impacts are shown
in Table 3.41.
Table 3.41 HEART calculation
Task Generic task
unreliability
EPCs Multiplier Assessed
Proportion
of Effect
Assessed
Effect
Human
Error
Probability
Shortage of time
available for error
detection &
correction
11 0.01 1.1
Disruption of
normal work-
sleep cycles
1.1 0.1 1.01
Channel capacity
overload
6 0.05 1.25
High level of
emotional stress
1.3 0.2 1.06
Low signal-noise
ratio
10 0.01 1.09
Shotfirer
connects
wrong
surface
connector
0.0004
Poor/
hostile
environment
1.15 1 1.15
7.38 E-4
Based on the above estimates, the likelihood of producing an error is 7.38 E-4.
F3.4.2 2.4.2: Shotfirer fails to detect and respond to error
The overall probability of failure to detect and correct a connection error by
Shotfirer is 4.24 E-2, based on the failure of some or all of the tasks analysed
below.
2.4.2-1 – Shotfirer fails to detect error
The Shotfirer should check that the correct surface connector has been used
following connection. The generic HEART task type taken to represent this
manual checking task is “Routine, highly practised, rapid task involving relatively
low level of skill” for which the nominal human unreliability is 0.02. The EPCs
and their impacts are shown in Table 3.42.
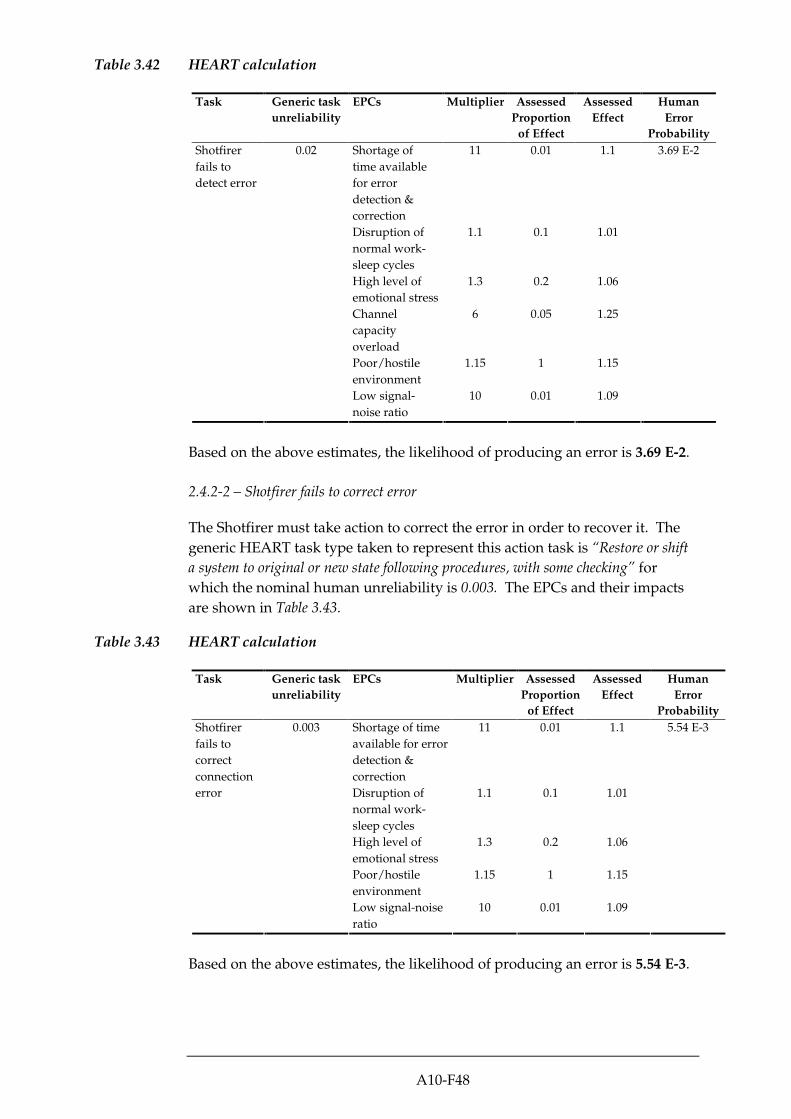
A10-F48
Table 3.42 HEART calculation
Task Generic task
unreliability
EPCs Multiplier Assessed
Proportion
of Effect
Assessed
Effect
Human
Error
Probability
Shortage of
time available
for error
detection &
correction
11 0.01 1.1
Disruption of
normal work-
sleep cycles
1.1 0.1 1.01
High level of
emotional stress
1.3 0.2 1.06
Channel
capacity
overload
6 0.05 1.25
Poor/hostile
environment
1.15 1 1.15
Shotfirer
fails to
detect error
0.02
Low signal-
noise ratio
10 0.01 1.09
3.69 E-2
Based on the above estimates, the likelihood of producing an error is 3.69 E-2.
2.4.2-2 – Shotfirer fails to correct error
The Shotfirer must take action to correct the error in order to recover it. The
generic HEART task type taken to represent this action task is “Restore or shift
a system to original or new state following procedures, with some checking” for
which the nominal human unreliability is 0.003. The EPCs and their impacts
are shown in Table 3.43.
Table 3.43 HEART calculation
Task Generic task
unreliability
EPCs Multiplier Assessed
Proportion
of Effect
Assessed
Effect
Human
Error
Probability
Shortage of time
available for error
detection &
correction
11 0.01 1.1
Disruption of
normal work-
sleep cycles
1.1 0.1 1.01
High level of
emotional stress
1.3 0.2 1.06
Poor/hostile
environment
1.15 1 1.15
Shotfirer
fails to
correct
connection
error
0.003
Low signal-noise
ratio
10 0.01 1.09
5.54 E-3
Based on the above estimates, the likelihood of producing an error is 5.54 E-3.

A10-F49
F3.4.3 2.4.3: Failure to detect and respond during final hook-up check
The overall probability of failure to detect and correct a connection error is
1.10 E-3, based on the failure of some or all of the tasks analysed below.
2.4.3-1 – Blasting Engineer fails to detect error
The Blasting Engineer should check that the correct surface connectors have
been used. The generic HEART task type taken to represent this manual
checking task is “Routine, highly practised, rapid task involving relatively low level
of skill” for which the nominal human unreliability is 0.02. The EPCs and their
impacts are shown in Table 3.44.
Table 3.44 HEART calculation
Task Generic task
unreliability
EPCs Multiplier Assessed
Proportion
of Effect
Assessed
Effect
Human
Error
Probability
Shortage of
time available
for error
detection &
correction
11 0.01 1.1
Disruption of
normal work-
sleep cycles
1.1 0.1 1.01
High level of
emotional stress
1.3 0.3 1.09
Poor/hostile
environment
1.15 1 1.15
Low signal-
noise ratio
10 0.01 1.09
Blasting
Engineer
fails to
detect error
0.02
Channel
capacity
overload
6 0.1 1.5
3.04 E-2
Based on the above estimates, the likelihood of producing an error is 3.04 E-2.
2.4.3-2 – Blasting Engineer fails to correct error
Following identification of a connection error, the Blasting Engineer should
take steps to correct the error. However, it is possible that his attention may
be drawn elsewhere due to high workload for example. The generic HEART
task type taken to represent this action task is “Restore or shift a system to
original or new state following procedures, with some checking” for which the
nominal human unreliability is 0.003. The EPCs and their impacts are shown
in Table 3.45.

A10-F50
Table 3.45 HEART calculation
Task Generic task
unreliability
EPCs Multiplier Assessed
Proportion
of Effect
Assessed
Effect
Human
Error
Probability
Shortage of time
available for error
detection &
correction
11 0.01 1.1
Disruption of
normal work-
sleep cycles
1.1 0.1 1.01
High level of
emotional stress
1.3 0.3 1.09
Low signal-noise
ratio
10 0.01 1.09
Channel capacity
overload
6 0.1 1.5
Blasting
Engineer
fails to
correct
connection
error
0.003
Poor/hostile
environment
1.15 1 1.15
6.83 E-3
Based on the above estimates, the likelihood of producing an error is 6.83 E-3.
2.4.3-3 – Resident Site Staff fails to detect error
Representatives from the Resident Site Staff must also check the correct
surface connectors have been used. The generic HEART task type taken to
represent this checking task is “Fairly simple task performed rapidly or given scant
attention” for which the nominal human unreliability is 0.09. The EPCs and
their impacts are shown in Table 3.46.
Table 3.46 HEART calculation
Task Generic task
unreliability
EPCs Multiplier Assessed
Proportion
of Effect
Assessed
Effect
Human
Error
Probability
Shortage of
time available
for error
detection &
correction
11 0.003 1.03
Channel
capacity
overload
6 0.0175 1.07508
High level of
emotional stress
1.3 0.003 1.0009
Resident
Site Staff
fails to
detect error
0.09
Low signal-
noise ratio
10 0.003 1.027
1.02 E-1
Based on the above estimates, the likelihood of producing an error is 1.02 E-1.
2.4.3-4 – Resident Site Staff fails to correct error
Upon detecting a surface connector error, representatives must act to correct
the error. The generic HEART task type taken to represent this action task is
“Restore or shift a system to original or new state following procedures, with some
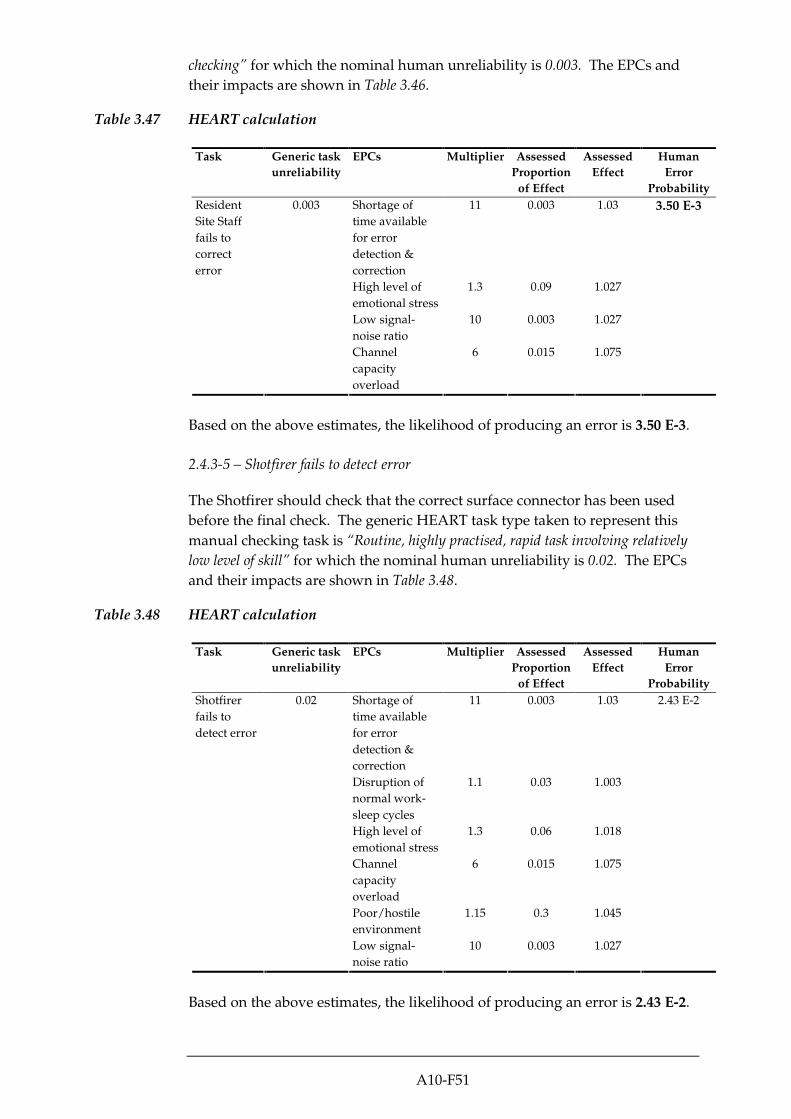
A10-F51
checking” for which the nominal human unreliability is 0.003. The EPCs and
their impacts are shown in Table 3.46.
Table 3.47 HEART calculation
Task Generic task
unreliability
EPCs Multiplier Assessed
Proportion
of Effect
Assessed
Effect
Human
Error
Probability
Shortage of
time available
for error
detection &
correction
11 0.003 1.03
High level of
emotional stress
1.3 0.09 1.027
Low signal-
noise ratio
10 0.003 1.027
Resident
Site Staff
fails to
correct
error
0.003
Channel
capacity
overload
6 0.015 1.075
3.50 E-3
Based on the above estimates, the likelihood of producing an error is 3.50 E-3.
2.4.3-5 – Shotfirer fails to detect error
The Shotfirer should check that the correct surface connector has been used
before the final check. The generic HEART task type taken to represent this
manual checking task is “Routine, highly practised, rapid task involving relatively
low level of skill” for which the nominal human unreliability is 0.02. The EPCs
and their impacts are shown in Table 3.48.
Table 3.48 HEART calculation
Task Generic task
unreliability
EPCs Multiplier Assessed
Proportion
of Effect
Assessed
Effect
Human
Error
Probability
Shortage of
time available
for error
detection &
correction
11 0.003 1.03
Disruption of
normal work-
sleep cycles
1.1 0.03 1.003
High level of
emotional stress
1.3 0.06 1.018
Channel
capacity
overload
6 0.015 1.075
Poor/hostile
environment
1.15 0.3 1.045
Shotfirer
fails to
detect error
0.02
Low signal-
noise ratio
10 0.003 1.027
2.43 E-2
Based on the above estimates, the likelihood of producing an error is 2.43 E-2.

A10-F52
2.4.3-6 – Shotfirer fails to correct error
The Shotfirer must take action to correct the error in order to recover it. The
generic HEART task type taken to represent this action task is “Restore or shift
a system to original or new state following procedures, with some checking” for
which the nominal human unreliability is 0.003. The EPCs and their impacts
are shown in Table 3.49.
Table 3.49 HEART calculation
Task Generic task
unreliability
EPCs Multiplier Assessed
Proportion
of Effect
Assessed
Effect
Human
Error
Probability
Shortage of
time available
for error
detection &
correction
11 0.003 1.03
Disruption of
normal work-
sleep cycles
1.1 0.03 1.003
High level of
emotional stress
1.3 0.06 1.018
Channel
capacity
overload
6 0.015 1.075
Poor/hostile
environment
1.15 0.3 1.045
Shotfirer
fails to
correct
error
0.02
Low signal-
noise ratio
10 0.003 1.027
3.64 E-3
Based on the above estimates, the likelihood of producing an error is 3.6 E-3.

A10-F53
F4 SCENARIO THREE: MIC EXCEEDED (BULK EMULSION)
Attachment F1 presents the fault tree of human error leading to the MIC being
exceeded due to overloading of bulk emulsion. MS Excel spreadsheet was
used to calculate the overall probabilities for events.
F4.1 EVENT 3.1: EXCESS EMULSION IS LOADED INTO A HOLE
The overall probability of excess emulsion being loaded is 1.09 E-6, based on
the failure of some or all of the tasks analysed below.
F4.1.1 3.1.1: Excess emulsion is loaded due to wrong density
The overall probability of excess emulsion being loaded due to it being the
wrong density is 7.95 E-11, based on the failure of some or all of the tasks
analysed below.
3.1.1-1 – Truck Operator sets gassing flow meter incorrectly
The Truck Operator must set the gassing flow meter to the correct setting in
order to provide the correct density of bulk emulsion. The generic HEART
task type taken to represent this action task is “Restore or shift a system to
original or new state following procedures, with some checking” for which the
nominal human unreliability is 0.003. The EPCs and their impacts are shown
in Table 4.1.
Table 4.1 HEART calculation
Task Generic task
unreliability
EPCs Multiplier Assessed
Proportion
of Effect
Assessed
Effect
Human
Error
Probability
Shortage of
time available
for error
detection &
correction
11 0.01 1.1
Disruption of
normal work-
sleep cycles
1.1 0.1 1.01
High level of
emotional stress
1.3 0.1 1.03
Truck
Operator
sets gassing
flow meter
incorrectly
0.003
Poor/hostile
environment
1.15 1 1.15
3.95 E-3
Based on the above estimates, the likelihood of producing an error is 3.95 E-3.
3.1.1-2 – Truck Operator reads density chart incorrectly
Once the flow meter has been set, the operator must make checks utilising a
density chart. The generic HEART task type taken to represent this manual
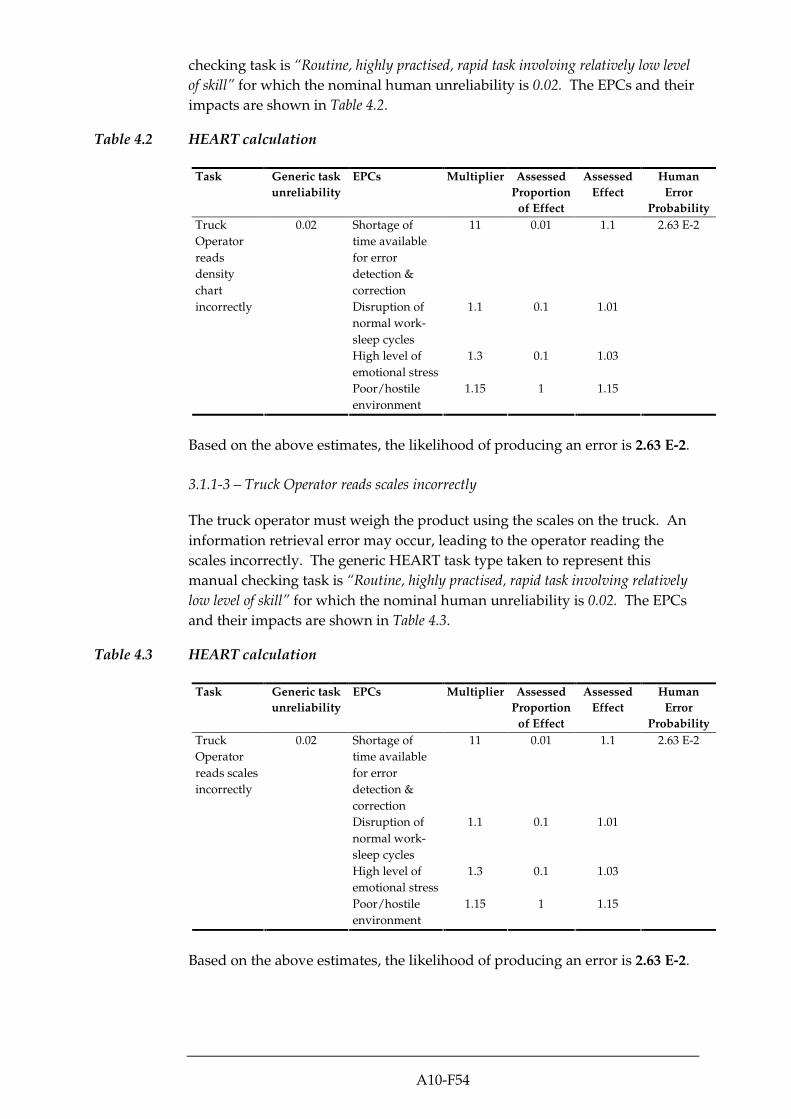
A10-F54
checking task is “Routine, highly practised, rapid task involving relatively low level
of skill” for which the nominal human unreliability is 0.02. The EPCs and their
impacts are shown in Table 4.2.
Table 4.2 HEART calculation
Task Generic task
unreliability
EPCs Multiplier Assessed
Proportion
of Effect
Assessed
Effect
Human
Error
Probability
Shortage of
time available
for error
detection &
correction
11 0.01 1.1
Disruption of
normal work-
sleep cycles
1.1 0.1 1.01
High level of
emotional stress
1.3 0.1 1.03
Truck
Operator
reads
density
chart
incorrectly
0.02
Poor/hostile
environment
1.15 1 1.15
2.63 E-2
Based on the above estimates, the likelihood of producing an error is 2.63 E-2.
3.1.1-3 – Truck Operator reads scales incorrectly
The truck operator must weigh the product using the scales on the truck. An
information retrieval error may occur, leading to the operator reading the
scales incorrectly. The generic HEART task type taken to represent this
manual checking task is “Routine, highly practised, rapid task involving relatively
low level of skill” for which the nominal human unreliability is 0.02. The EPCs
and their impacts are shown in Table 4.3.
Table 4.3 HEART calculation
Task Generic task
unreliability
EPCs Multiplier Assessed
Proportion
of Effect
Assessed
Effect
Human
Error
Probability
Shortage of
time available
for error
detection &
correction
11 0.01 1.1
Disruption of
normal work-
sleep cycles
1.1 0.1 1.01
High level of
emotional stress
1.3 0.1 1.03
Truck
Operator
reads scales
incorrectly
0.02
Poor/hostile
environment
1.15 1 1.15
2.63 E-2
Based on the above estimates, the likelihood of producing an error is 2.63 E-2.

A10-F55
3.1.1-4 – Truck Operator reads density chart incorrectly
Once the product has been weighed, the operator must make a further check
utilising a density chart. The generic HEART task type taken to represent this
manual checking task is “Routine, highly practised, rapid task involving relatively
low level of skill” for which the nominal human unreliability is 0.02
Table 4.4 HEART calculation
Task Generic task
unreliability
EPCs Multiplier Assessed
Proportion
of Effect
Assessed
Effect
Human
Error
Probability
Shortage of
time available
for error
detection &
correction
11 0.01 1.1
Disruption of
normal work-
sleep cycles
1.1 0.1 1.01
High level of
emotional stress
1.3 0.1 1.03
Truck
Operator
reads
density
chart
incorrectly
0.02
Poor/hostile
environment
1.15 1 1.15
2.63 E-2
Based on the above estimates, the likelihood of producing an error is 2.63 E-2.
3.1.1-5 – Failure to detect error by the Blasting Engineer
The Blasting Engineer should check that the density of the emulsion is correct.
However, it is possible that the Blasting Engineer will not carry out this check,
will carry it out incorrectly or may leave it incomplete. The generic HEART
task type taken to represent this checking task is “Fairly simple task performed
rapidly or given scant attention” for which the nominal human unreliability is
0.09. The EPCs and their impacts are shown in Table 4.5.
Table 4.5 HEART calculation
Task Generic task
unreliability
EPCs Multiplier Assessed
Proportion
of Effect
Assessed
Effect
Human
Error
Probability
Shortage of
time available
for error
detection &
correction
11 0.01 1.1
Disruption of
normal work-
sleep cycles
1.1 0.1 1.01
Channel
capacity
overload
6 0.05 1.25
Poor/hostile
environment
1.15 1 1.15
Failure to
detect error
by Blasting
Engineer
0.09
High level of
emotional stress
1.3 0.3 1.09
1.57 E-1

A10-F56
Based on the above estimates, the likelihood of producing an error is 1.57 E-1.
3.1.1-6 – Failure to correct error by Blasting Engineer
Once the error has been identified, the Blasting Engineer must act to rectify
the error. The generic HEART task type taken to represent this action task is
“Restore or shift a system to original or new state following procedures, with some
checking” for which the nominal human unreliability is 0.003. The EPCs and
their impacts are shown in Table 4.6.
Table 4.6 HEART calculation
Task Generic task
unreliability
EPCs Multiplier Assessed
Proportion
of Effect
Assessed
Effect
Human
Error
Probability
Shortage of
time available
for error
detection &
correction
11 0.01 1.1
Poor/hostile
environment
1.15 1 1.15
Disruption of
normal work-
sleep cycles
1.1 0.1 1.01
Channel
capacity
overload
6 0.05 1.25
Failure to
correct
error by
Blasting
Engineer
0.003
High level of
emotional stress
1.3 0.3 1.09
5.22 E-3
Based on the above estimates, the likelihood of producing an error is 5.22 E-3.
3.1.1-7 – Failure to detect error by Shotfirer
The Shotfirer will also check the product density before loading commences.
The generic HEART task type taken to represent this checking task is “Fairly
simple task performed rapidly or given scant attention” for which the nominal
human unreliability is 0.09. The EPCs and their impacts are shown in Table
4.7.
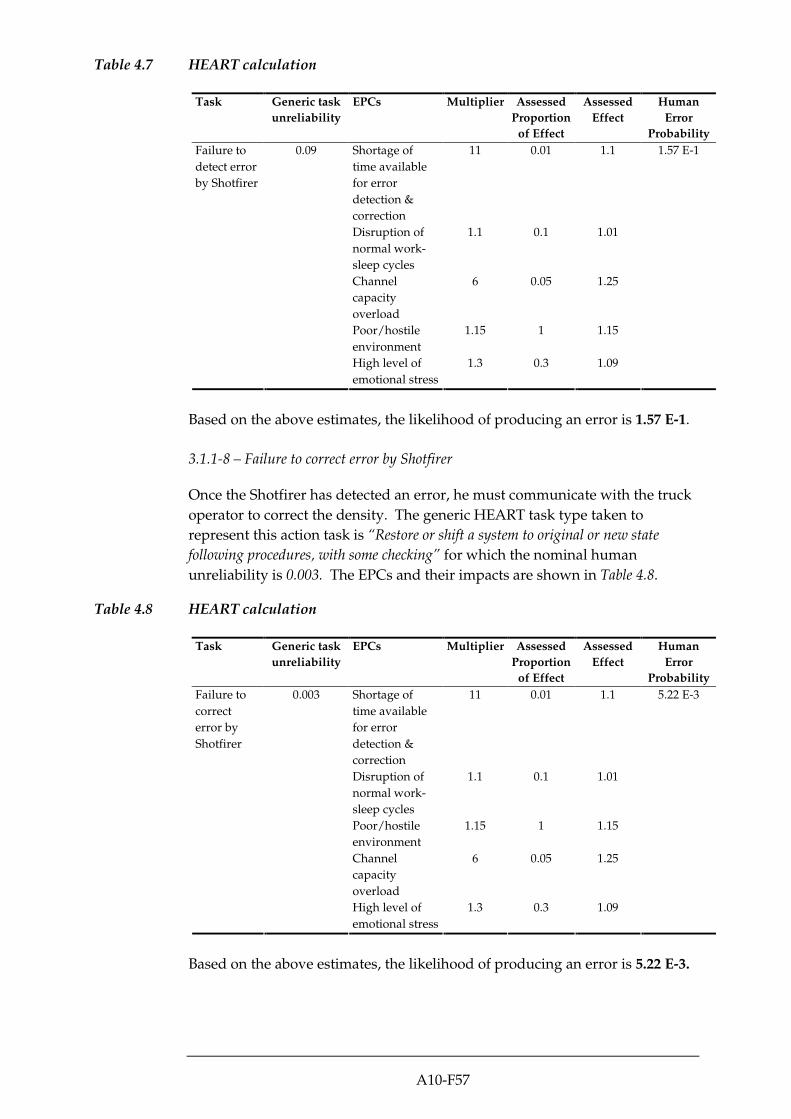
A10-F57
Table 4.7 HEART calculation
Task Generic task
unreliability
EPCs Multiplier Assessed
Proportion
of Effect
Assessed
Effect
Human
Error
Probability
Shortage of
time available
for error
detection &
correction
11 0.01 1.1
Disruption of
normal work-
sleep cycles
1.1 0.1 1.01
Channel
capacity
overload
6 0.05 1.25
Poor/hostile
environment
1.15 1 1.15
Failure to
detect error
by Shotfirer
0.09
High level of
emotional stress
1.3 0.3 1.09
1.57 E-1
Based on the above estimates, the likelihood of producing an error is 1.57 E-1.
3.1.1-8 – Failure to correct error by Shotfirer
Once the Shotfirer has detected an error, he must communicate with the truck
operator to correct the density. The generic HEART task type taken to
represent this action task is “Restore or shift a system to original or new state
following procedures, with some checking” for which the nominal human
unreliability is 0.003. The EPCs and their impacts are shown in Table 4.8.
Table 4.8 HEART calculation
Task Generic task
unreliability
EPCs Multiplier Assessed
Proportion
of Effect
Assessed
Effect
Human
Error
Probability
Shortage of
time available
for error
detection &
correction
11 0.01 1.1
Disruption of
normal work-
sleep cycles
1.1 0.1 1.01
Poor/hostile
environment
1.15 1 1.15
Channel
capacity
overload
6 0.05 1.25
Failure to
correct
error by
Shotfirer
0.003
High level of
emotional stress
1.3 0.3 1.09
5.22 E-3
Based on the above estimates, the likelihood of producing an error is 5.22 E-3.

A10-F58
F4.1.2 3.1.2: Shotfirer does not realise hole is overloaded
The overall probability that the Shotfirer will not realise a hole is overloaded is
1.09 E-6 based on the failure of some or all of the tasks analysed below.
3.1.2-1 – Truck Operator inputs incorrect revolutions/weight into PLC
The Operator must input the appropriate number of revolutions to deliver the
correct amount of bulk emulsion. However, a lapse in concentration could
allow the Operator to make an action error. The generic HEART task type
taken to represent this action task is “Restore or shift a system to original or new
state following procedures, with some checking” for which the nominal human
unreliability is 0.003. The EPCs and their impacts are shown in Table 4.9.
Table 4.9 HEART calculation
Task Generic task
unreliability
EPCs Multiplier Assessed
Proportion
of Effect
Assessed
Effect
Human
Error
Probability
Shortage of
time available
for error
detection &
correction
11 0.01 1.1
Disruption of
normal work-
sleep cycles
1.1 0.1 1.01
High level of
emotional stress
1.3 0.1 1.03
Truck
Operator
inputs
wrong
information
into PLC
0.003
Poor/hostile
environment
1.15 1 1.15
3.95 E-3
Based on the above estimates, the likelihood of producing an error is 3.95 E-3.
3.1.2-2 – Shotfirer puts mark on hose in the wrong place
The Shotfirer must mark the emulsion hose to designate the correct loading
depth. The generic HEART task type taken to represent this manual checking
task is “Routine, highly practised, rapid task involving relatively low level of skill”
for which the nominal human unreliability is 0.02. The EPCs and their
impacts are shown in Table 4.10.
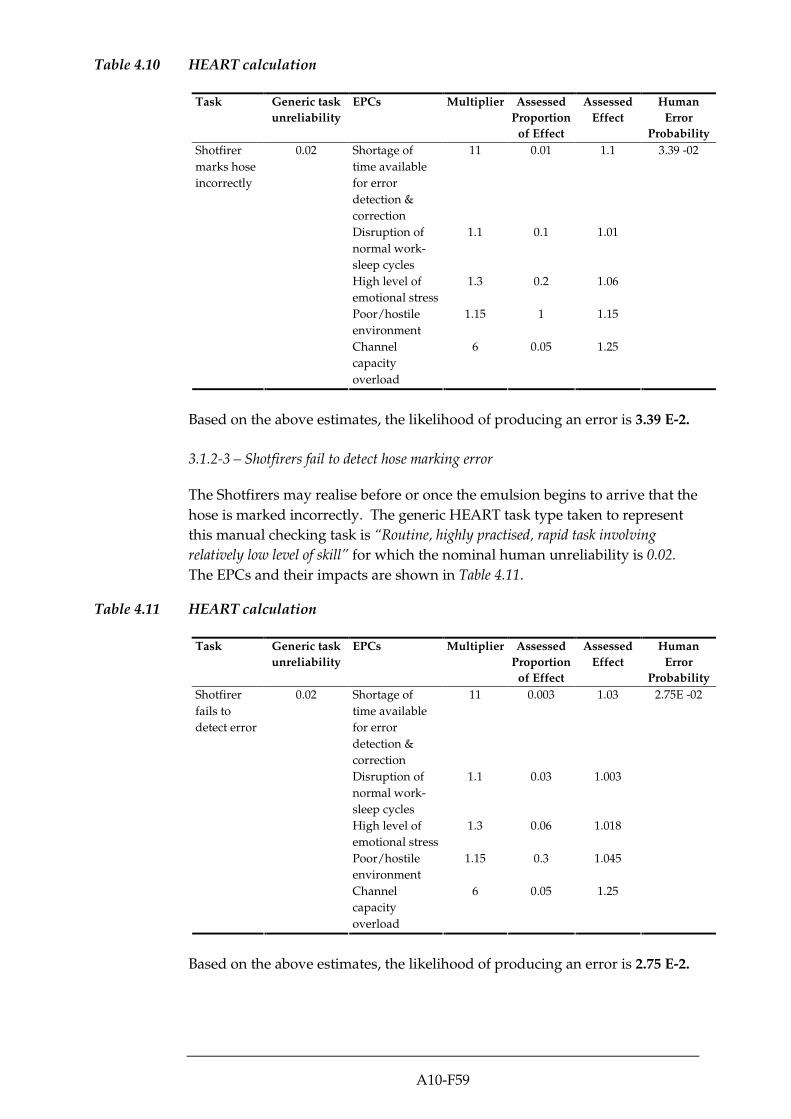
A10-F59
Table 4.10 HEART calculation
Task Generic task
unreliability
EPCs Multiplier Assessed
Proportion
of Effect
Assessed
Effect
Human
Error
Probability
Shortage of
time available
for error
detection &
correction
11 0.01 1.1
Disruption of
normal work-
sleep cycles
1.1 0.1 1.01
High level of
emotional stress
1.3 0.2 1.06
Poor/hostile
environment
1.15 1 1.15
Shotfirer
marks hose
incorrectly
0.02
Channel
capacity
overload
6 0.05 1.25
3.39 -02
Based on the above estimates, the likelihood of producing an error is 3.39 E-2.
3.1.2-3 – Shotfirers fail to detect hose marking error
The Shotfirers may realise before or once the emulsion begins to arrive that the
hose is marked incorrectly. The generic HEART task type taken to represent
this manual checking task is “Routine, highly practised, rapid task involving
relatively low level of skill” for which the nominal human unreliability is 0.02.
The EPCs and their impacts are shown in Table 4.11.
Table 4.11 HEART calculation
Task Generic task
unreliability
EPCs Multiplier Assessed
Proportion
of Effect
Assessed
Effect
Human
Error
Probability
Shortage of
time available
for error
detection &
correction
11 0.003 1.03
Disruption of
normal work-
sleep cycles
1.1 0.03 1.003
High level of
emotional stress
1.3 0.06 1.018
Poor/hostile
environment
1.15 0.3 1.045
Shotfirer
fails to
detect error
0.02
Channel
capacity
overload
6 0.05 1.25
2.75E -02
Based on the above estimates, the likelihood of producing an error is 2.75 E-2.
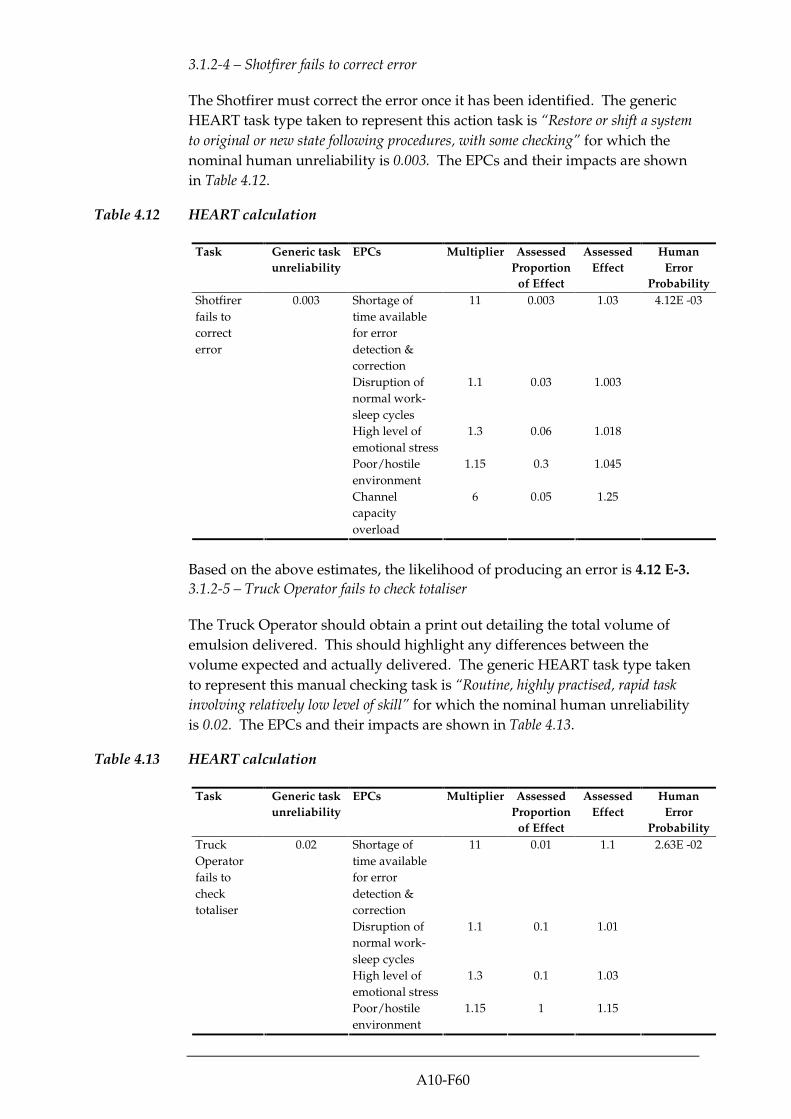
A10-F60
3.1.2-4 – Shotfirer fails to correct error
The Shotfirer must correct the error once it has been identified. The generic
HEART task type taken to represent this action task is “Restore or shift a system
to original or new state following procedures, with some checking” for which the
nominal human unreliability is 0.003. The EPCs and their impacts are shown
in Table 4.12.
Table 4.12 HEART calculation
Task Generic task
unreliability
EPCs Multiplier Assessed
Proportion
of Effect
Assessed
Effect
Human
Error
Probability
Shortage of
time available
for error
detection &
correction
11 0.003 1.03
Disruption of
normal work-
sleep cycles
1.1 0.03 1.003
High level of
emotional stress
1.3 0.06 1.018
Poor/hostile
environment
1.15 0.3 1.045
Shotfirer
fails to
correct
error
0.003
Channel
capacity
overload
6 0.05 1.25
4.12E -03
Based on the above estimates, the likelihood of producing an error is 4.12 E-3.
3.1.2-5 – Truck Operator fails to check totaliser
The Truck Operator should obtain a print out detailing the total volume of
emulsion delivered. This should highlight any differences between the
volume expected and actually delivered. The generic HEART task type taken
to represent this manual checking task is “Routine, highly practised, rapid task
involving relatively low level of skill” for which the nominal human unreliability
is 0.02. The EPCs and their impacts are shown in Table 4.13.
Table 4.13 HEART calculation
Task Generic task
unreliability
EPCs Multiplier Assessed
Proportion
of Effect
Assessed
Effect
Human
Error
Probability
Shortage of
time available
for error
detection &
correction
11 0.01 1.1
Disruption of
normal work-
sleep cycles
1.1 0.1 1.01
High level of
emotional stress
1.3 0.1 1.03
Truck
Operator
fails to
check
totaliser
0.02
Poor/hostile
environment
1.15 1 1.15
2.63E -02
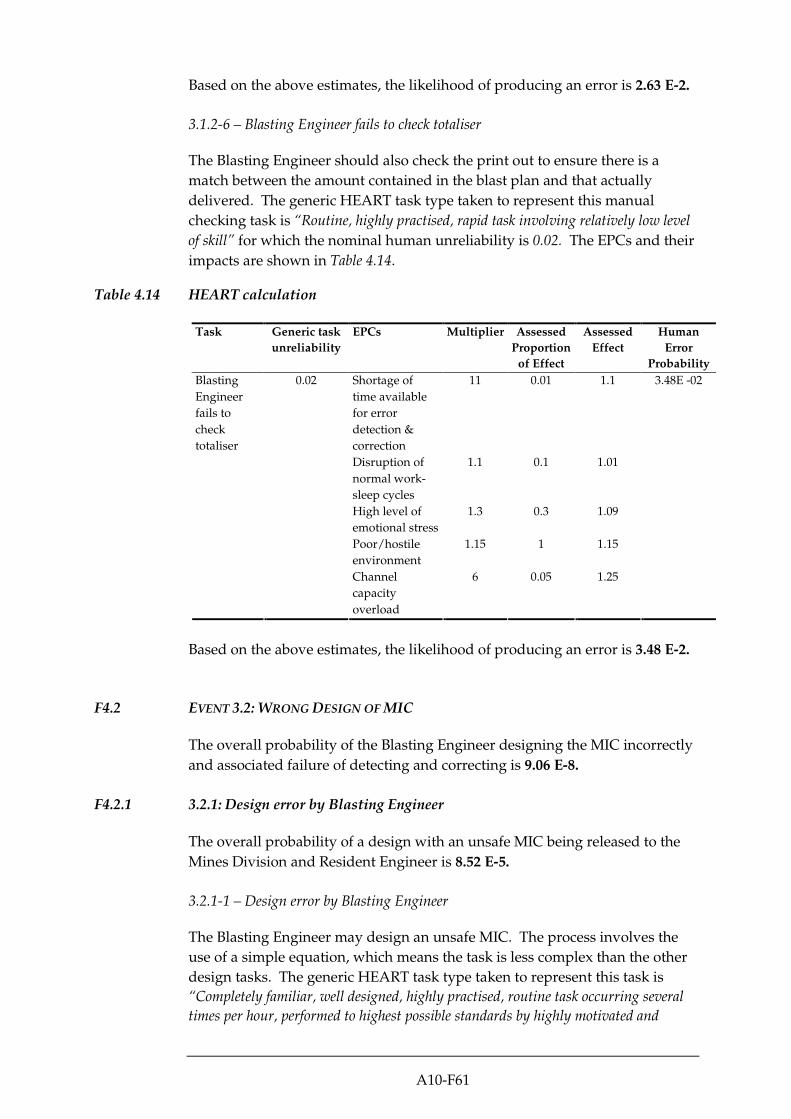
A10-F61
Based on the above estimates, the likelihood of producing an error is 2.63 E-2.
3.1.2-6 – Blasting Engineer fails to check totaliser
The Blasting Engineer should also check the print out to ensure there is a
match between the amount contained in the blast plan and that actually
delivered. The generic HEART task type taken to represent this manual
checking task is “Routine, highly practised, rapid task involving relatively low level
of skill” for which the nominal human unreliability is 0.02. The EPCs and their
impacts are shown in Table 4.14.
Table 4.14 HEART calculation
Task Generic task
unreliability
EPCs Multiplier Assessed
Proportion
of Effect
Assessed
Effect
Human
Error
Probability
Shortage of
time available
for error
detection &
correction
11 0.01 1.1
Disruption of
normal work-
sleep cycles
1.1 0.1 1.01
High level of
emotional stress
1.3 0.3 1.09
Poor/hostile
environment
1.15 1 1.15
Blasting
Engineer
fails to
check
totaliser
0.02
Channel
capacity
overload
6 0.05 1.25
3.48E -02
Based on the above estimates, the likelihood of producing an error is 3.48 E-2.
F4.2 EVENT 3.2: WRONG DESIGN OF MIC
The overall probability of the Blasting Engineer designing the MIC incorrectly
and associated failure of detecting and correcting is 9.06 E-8.
F4.2.1 3.2.1: Design error by Blasting Engineer
The overall probability of a design with an unsafe MIC being released to the
Mines Division and Resident Engineer is 8.52 E-5.
3.2.1-1 – Design error by Blasting Engineer
The Blasting Engineer may design an unsafe MIC. The process involves the
use of a simple equation, which means the task is less complex than the other
design tasks. The generic HEART task type taken to represent this task is
“Completely familiar, well designed, highly practised, routine task occurring several
times per hour, performed to highest possible standards by highly motivated and

A10-F62
experienced person, totally aware of the implications of failure, with time to correct
potential error, but without the benefit of significant job aids” for which the
nominal human unreliability is 0.0004. The EPCs and their impacts are shown
in Table 4.15.
Table 4.15 HEART calculation
Task Generic task
unreliability
EPCs Multiplier Assessed
Proportion
of Effect
Assessed
Effect
Human
Error
Probability
Shortage of
time available
for error
detection &
correction
11 0.01 1.1
Disruption of
normal work-
sleep cycles
1.1 0.1 1.01
High level of
emotional stress
1.3 0.3 1.09
Design
error by
Blasting
Engineer
0.0004
Channel
capacity
overload
6 0.05 1.25
6.05 E-4
Based on the above estimates, the likelihood of producing an error is 6.05 E-4.
3.2.1-2 – Failure to detect error by Blasting Engineer
The Blasting Engineer should utilise a modelling programme to detect any
design errors. The generic HEART task type taken to represent this checking
task, utilising a modelling system is “Fairly simple task performed rapidly or given
scant attention” for which the nominal human unreliability is 0.09. The EPCs
and their impacts are shown in Table 4.16.
Table 4.16 HEART calculation
Task Generic task
unreliability
EPCs Multiplier Assessed
Proportion
of Effect
Assessed
Effect
Human
Error
Probability
Shortage of
time available
for error
detection &
correction
11 0.01 1.1
Disruption of
normal work-
sleep cycles
1.1 0.1 1.01
Channel
capacity
overload
6 0.05 1.25
Failure to
detect
design error
by Blasting
Engineer
0.09
High level of
emotional stress
1.3 0.3 1.09
1.36 E-1
Based on the above estimates, the likelihood of producing an error is 1.36 E-1.
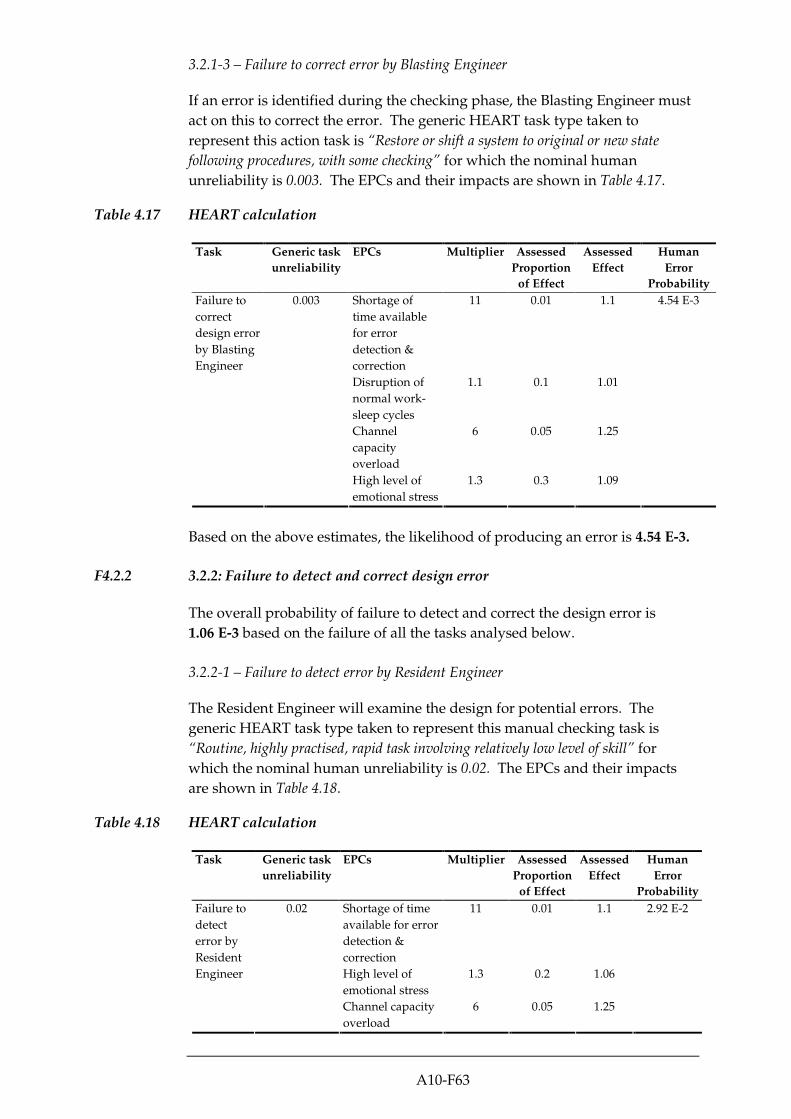
A10-F63
3.2.1-3 – Failure to correct error by Blasting Engineer
If an error is identified during the checking phase, the Blasting Engineer must
act on this to correct the error. The generic HEART task type taken to
represent this action task is “Restore or shift a system to original or new state
following procedures, with some checking” for which the nominal human
unreliability is 0.003. The EPCs and their impacts are shown in Table 4.17.
Table 4.17 HEART calculation
Task Generic task
unreliability
EPCs Multiplier Assessed
Proportion
of Effect
Assessed
Effect
Human
Error
Probability
Shortage of
time available
for error
detection &
correction
11 0.01 1.1
Disruption of
normal work-
sleep cycles
1.1 0.1 1.01
Channel
capacity
overload
6 0.05 1.25
Failure to
correct
design error
by Blasting
Engineer
0.003
High level of
emotional stress
1.3 0.3 1.09
4.54 E-3
Based on the above estimates, the likelihood of producing an error is 4.54 E-3.
F4.2.2 3.2.2: Failure to detect and correct design error
The overall probability of failure to detect and correct the design error is
1.06 E-3 based on the failure of all the tasks analysed below.
3.2.2-1 – Failure to detect error by Resident Engineer
The Resident Engineer will examine the design for potential errors. The
generic HEART task type taken to represent this manual checking task is
“Routine, highly practised, rapid task involving relatively low level of skill” for
which the nominal human unreliability is 0.02. The EPCs and their impacts
are shown in Table 4.18.
Table 4.18 HEART calculation
Task Generic task
unreliability
EPCs Multiplier Assessed
Proportion
of Effect
Assessed
Effect
Human
Error
Probability
Shortage of time
available for error
detection &
correction
11 0.01 1.1
High level of
emotional stress
1.3 0.2 1.06
Failure to
detect
error by
Resident
Engineer
0.02
Channel capacity
overload
6 0.05 1.25
2.92 E-2

A10-F64
Based on the above estimates, the likelihood of producing an error is 2.92 E-2.
3.2.2-2 – Failure to correct error by Resident Engineer
The Resident Engineer may detect the error, but then fail to act on this to
correct the design error. The generic HEART task type taken to represent this
action task is “Restore or shift a system to original or new state following procedures,
with some checking” for which the nominal human unreliability is 0.003. The
EPCs and their impacts are shown in Table 4.19.
Table 4.19 HEART calculation
Task Generic task
unreliability
EPCs Multiplier Assessed
Proportion
of Effect
Assessed
Effect
Human
Error
Probability
Shortage of time
available for error
detection &
correction
11 0.01 1.1
Channel capacity
overload
6 0.05 1.25
Failure to
correct
error by
Resident
Engineer
0.003
High level of
emotional stress
1.3 0.2 1.06
4.37 E-3
Based on the above estimates, the likelihood of producing an error is 4.37 E-3.
3.2.2-3 – Failure to detect error by the Mines Division
The Mines Division will also check the design to ensure a safe MIC is
designed. The generic HEART task type taken to represent this manual
checking task is “Routine, highly practised, rapid tasks involving relatively low level
of skill” for which the nominal human unreliability is 0.02. The EPCs and their
impacts are shown in Table 4.20.
Table 4.20 HEART calculation
Task Generic task
unreliability
EPCs Multiplier Assessed
Proportion
of Effect
Assessed
Effect
Human
Error
Probability
Shortage of time
available for error
detection &
correction
11 0.01 1.1
High level of
emotional stress
1.3 0.01 1.003
Failure to
detect
error by
Resident
Engineer
0.02
Channel capacity
overload
6 0.05 1.25
2.76 E-2
Based on the above estimates, the likelihood of producing an error is 2.76 E-2.
3.2.2-4 – Failure to correct error by the Mines Division
As above, the Mines Division may fail to correct the error in the design. The
generic HEART task type taken to represent this action task is “Restore or shift

A10-F65
a system to original or new state following procedures, with some checking” for
which the nominal human unreliability is 0.003. The EPCs and their impacts
are shown in Table 4.21.
Table 4.21 HEART calculation
Task Generic task
unreliability
EPCs Multiplier Assessed
Proportion
of Effect
Assessed
Effect
Human
Error
Probability
Shortage of
time available
for error
detection &
correction
11 0.01 1.1
Channel
capacity
overload
6 0.05 1.25
Failure to
correct
error by
Mines
Division
0.003
High level of
emotional stress
1.3 0.01 1.003
4.14 E-3
Based on the above estimates, the likelihood of producing an error is 4.14 E-3.
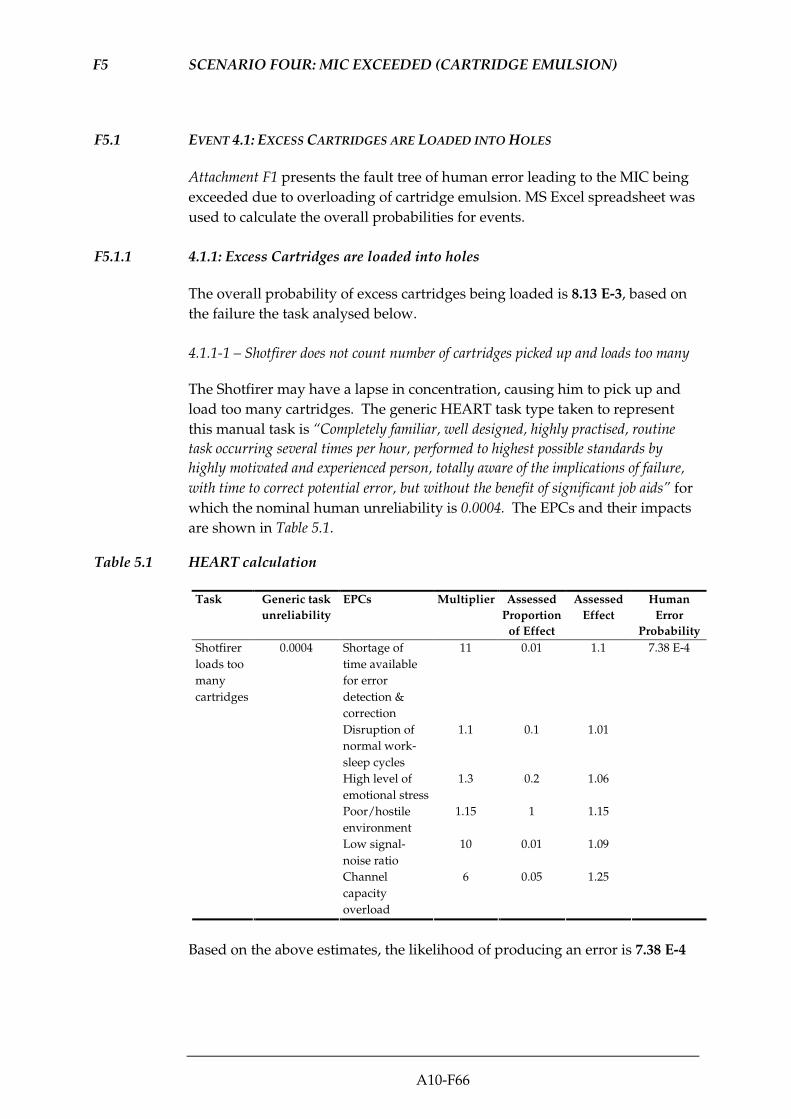
A10-F66
F5 SCENARIO FOUR: MIC EXCEEDED (CARTRIDGE EMULSION)
F5.1 EVENT 4.1: EXCESS CARTRIDGES ARE LOADED INTO HOLES
Attachment F1 presents the fault tree of human error leading to the MIC being
exceeded due to overloading of cartridge emulsion. MS Excel spreadsheet was
used to calculate the overall probabilities for events.
F5.1.1 4.1.1: Excess Cartridges are loaded into holes
The overall probability of excess cartridges being loaded is 8.13 E-3, based on
the failure the task analysed below.
4.1.1-1 – Shotfirer does not count number of cartridges picked up and loads too many
The Shotfirer may have a lapse in concentration, causing him to pick up and
load too many cartridges. The generic HEART task type taken to represent
this manual task is “Completely familiar, well designed, highly practised, routine
task occurring several times per hour, performed to highest possible standards by
highly motivated and experienced person, totally aware of the implications of failure,
with time to correct potential error, but without the benefit of significant job aids” for
which the nominal human unreliability is 0.0004. The EPCs and their impacts
are shown in Table 5.1.
Table 5.1 HEART calculation
Task Generic task
unreliability
EPCs Multiplier Assessed
Proportion
of Effect
Assessed
Effect
Human
Error
Probability
Shortage of
time available
for error
detection &
correction
11 0.01 1.1
Disruption of
normal work-
sleep cycles
1.1 0.1 1.01
High level of
emotional stress
1.3 0.2 1.06
Poor/hostile
environment
1.15 1 1.15
Low signal-
noise ratio
10 0.01 1.09
Shotfirer
loads too
many
cartridges
0.0004
Channel
capacity
overload
6 0.05 1.25
7.38 E-4
Based on the above estimates, the likelihood of producing an error is 7.38 E-4

A10-F67
F5.1.2 4.1.2: Cartridges from blocked holes are not disposed of correctly
The overall probability of holes being overloaded due to incorrect disposal of
additional cartridges is 8.13 E-3.
4.1.2-1 – Shotfirer intentionally overloads lifter holes
If there are any cartridges left over due to the presence of blocked holes, the
Shotfirer may not dispose of them as advised by the Resident Site Staff.
Instead, he may load additional cartridges into the lifter holes to ensure a
good blast. This can be seen as a violation of procedure, although the
Shotfirer will be well aware of the risks he is taking. The generic HEART task
type taken to represent this action task is “Restore or shift a system to original or
new state following procedures, with some checking” for which the nominal human
unreliability is 0.003. The EPCs and their impacts are shown in Table 5.2.
Table 5.2 HEART calculation
Task Generic task
unreliability
EPCs Multiplier Assessed
Proportion
of Effect
Assessed
Effect
Human
Error
Probability
An incentive to
use more
dangerous
procedures
2 1 2
Shortage of
time available
for error
detection &
correction
11 0.01 1.1
Disruption of
normal work-
sleep cycles
1.1 0.1 1.01
High level of
emotional stress
1.3 0.2 1.06
Shotfirer
overloads
lifter
holes
0.003
Poor/hostile
environment
1.15 1 1.15
8.13 E-3
Based on the above estimates, the likelihood of producing an error is 8.13 E-3.
F5.1.3 4.1.3: Shotfirer does not realise holes are overloaded
The overall probability of the Shotfirer not realising that there are some holes
overloaded is 1.69 E-5, based on the failure of some or all of the tasks analysed
below.
4.1.3-1 – Shotfirer collects too many Kgs of cartridge from the magazine
The Shotfirer must only collect the exact amount of cartridges from the
magazine to ensure that he does not overload any holes. The generic HEART
task type taken to represent this manual task is “Completely familiar, well
designed, highly practised, routine task occurring several times per hour, performed to
highest possible standards by highly motivated and experienced person, totally aware
of the implications of failure, with time to correct potential error, but without the

A10-F68
benefit of significant job aids” for which the nominal human unreliability is
0.0004. The EPCs and their impacts are shown in Table 5.3.
Table 5.3 HEART calculation
Task Generic task
unreliability
EPCs Multiplier Assessed
Proportion
of Effect
Assessed
Effect
Human
Error
Probability
Shortage of
time available
for error
detection &
correction
11 0.01 1.1
Disruption of
normal work-
sleep cycles
1.1 0.1 1.01
High level of
emotional stress
1.3 0.2 1.06
Shotfirer
collects
too many
cartridges
from the
magazine
0.0004
Channel
capacity
overload
6 0.05 1.25
5.89 E-4
Based on the above estimates, the likelihood of producing an error is 5.89 E-4.
4.1.3-2 – Shotfirer fails to detect collection error
The Shotfirer should check that he has selected the correct amount of
cartridges for delivery to the site. The generic HEART task type taken to
represent this manual checking task is “Routine, highly practised, rapid task
involving relatively low level of skill” for which the nominal human unreliability
is 0.02. The EPCs and their impacts are shown in Table 5.4.
Table 5.4 HEART calculation
Task Generic task
unreliability
EPCs Multiplier Assessed
Proportion
of Effect
Assessed
Effect
Human
Error
Probability
Shortage of
time available
for error
detection &
correction
11 0.01 1.1
Disruption of
normal work-
sleep cycles
1.1 0.1 1.01
High level of
emotional stress
1.3 0.2 1.06
Shotfirer
fails to
detect
collection
error
0.02
Channel
capacity
overload
6 0.05 1.25
2.94 E-2
Based on the above estimates, the likelihood of producing an error is 2.94 E-2.

A10-F69
4.1.3-3 – Shotfirer fails to correct collection error
If the Shotfirer detects the error, he must correct it to ensure only the exact
number of cartridges are delivered to the blasting site. The generic HEART
task type taken to represent this action task is “Restore or shift a system to
original or new state following procedures, with some checking” for which the
nominal human unreliability is 0.003. The EPCs and their impacts are shown
in Table 5.5.
Table 5.5 HEART calculation
Task Generic task
unreliability
EPCs Multiplier Assessed
Proportion
of Effect
Assessed
Effect
Human
Error
Probability
Shortage of
time available
for error
detection &
correction
11 0.01 1.1
Disruption of
normal work-
sleep cycles
1.1 0.1 1.01
High level of
emotional stress
1.3 0.2 1.06
Shotfirer
fails to
correct
collection
error
0.003
Channel
capacity
overload
6 0.05 1.25
4.42 E-3
Based on the above estimates, the likelihood of producing an error is 4.42 E-3.
4.1.3-4 – Resident Engineer’s Inspector fails to detect error
The Resident Engineer’s Inspector should check the number of cartridges
selected before they leave the magazine. The generic HEART task type taken
to represent this checking task is “Fairly simple task performed rapidly or given
scant attention” for which the nominal human unreliability is 0.09. The EPCs
and their impacts are shown in Table 5.6.

A10-F70
Table 5.6 HEART calculation
Task Generic task
unreliability
EPCs Multiplier Assessed
Proportion
of Effect
Assessed
Effect
Human
Error
Probability
Shortage of
time available
for error
detection &
correction
11 0.01 1.1
Disruption of
normal work-
sleep cycles
1.1 0.05 1.005
High level of
emotional
stress
1.3 0.2 1.06
Resident
Engineer’s
Inspector
fails to
detect
collection
error
0.09
Channel
capacity
overload
6 0.05 1.25
1.32 E-1
Based on the above estimates, the likelihood of producing an error is 1.32 E-1.
4.1.3-5 – Resident Engineer’s Inspector fails to correct collection error
The Resident Engineer’s Inspector must act to correct any errors identified
during the checking process. The generic HEART task type taken to represent
this action task is “Restore or shift a system to original or new state following
procedures, with some checking” for which the nominal human unreliability is
0.003. The EPCs and their impacts are shown in Table 5.7.
Table 5.7 HEART calculation
Task Generic task
unreliability
EPCs Multiplier Assessed
Proportion
of Effect
Assessed
Effect
Human
Error
Probability
Shortage of
time available
for error
detection &
correction
11 0.01 1.1
Disruption of
normal work-
sleep cycles
1.1 0.05 1.005
High level of
emotional
stress
1.3 0.2 1.06
Resident
Engineer’s
Inspector
fails to
correct
collection
error
0.003
Channel
capacity
overload
6 0.05 1.25
4.39 E-3
Based on the above estimates, the likelihood of producing an error is 4.39 E-3.
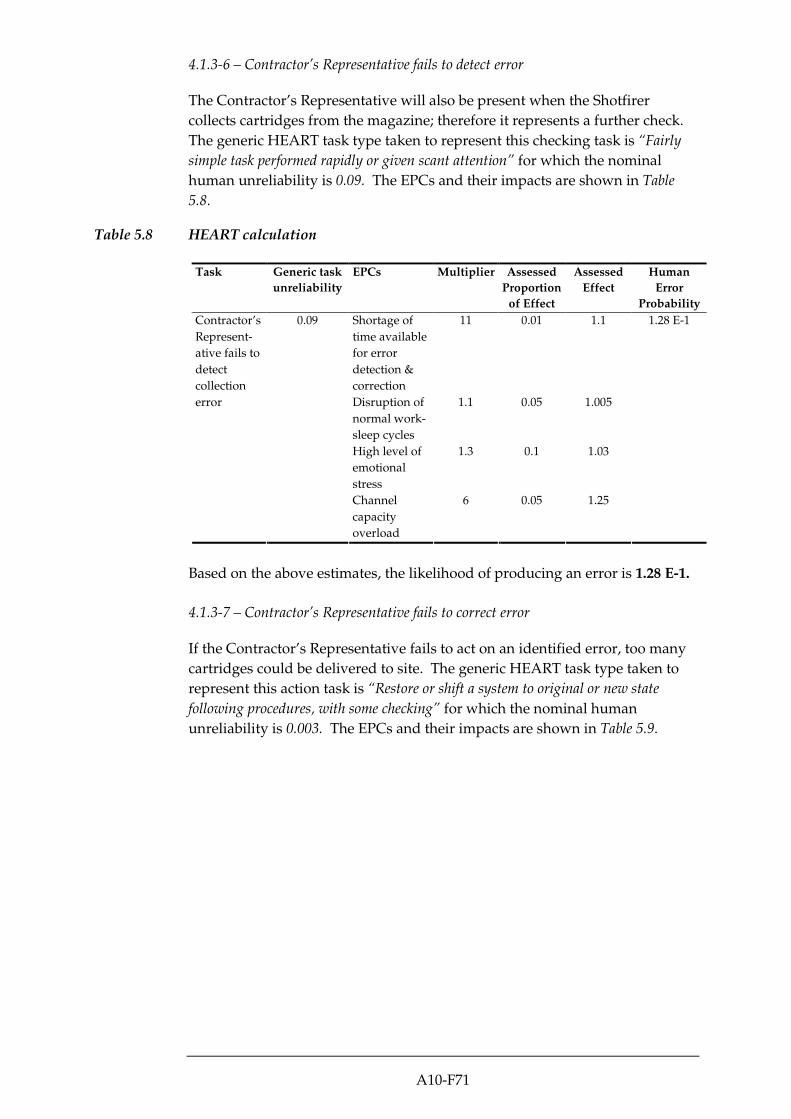
A10-F71
4.1.3-6 – Contractor’s Representative fails to detect error
The Contractor’s Representative will also be present when the Shotfirer
collects cartridges from the magazine; therefore it represents a further check.
The generic HEART task type taken to represent this checking task is “Fairly
simple task performed rapidly or given scant attention” for which the nominal
human unreliability is 0.09. The EPCs and their impacts are shown in Table
5.8.
Table 5.8 HEART calculation
Task Generic task
unreliability
EPCs Multiplier Assessed
Proportion
of Effect
Assessed
Effect
Human
Error
Probability
Shortage of
time available
for error
detection &
correction
11 0.01 1.1
Disruption of
normal work-
sleep cycles
1.1 0.05 1.005
High level of
emotional
stress
1.3 0.1 1.03
Contractor’s
Represent-
ative fails to
detect
collection
error
0.09
Channel
capacity
overload
6 0.05 1.25
1.28 E-1
Based on the above estimates, the likelihood of producing an error is 1.28 E-1.
4.1.3-7 – Contractor’s Representative fails to correct error
If the Contractor’s Representative fails to act on an identified error, too many
cartridges could be delivered to site. The generic HEART task type taken to
represent this action task is “Restore or shift a system to original or new state
following procedures, with some checking” for which the nominal human
unreliability is 0.003. The EPCs and their impacts are shown in Table 5.9.
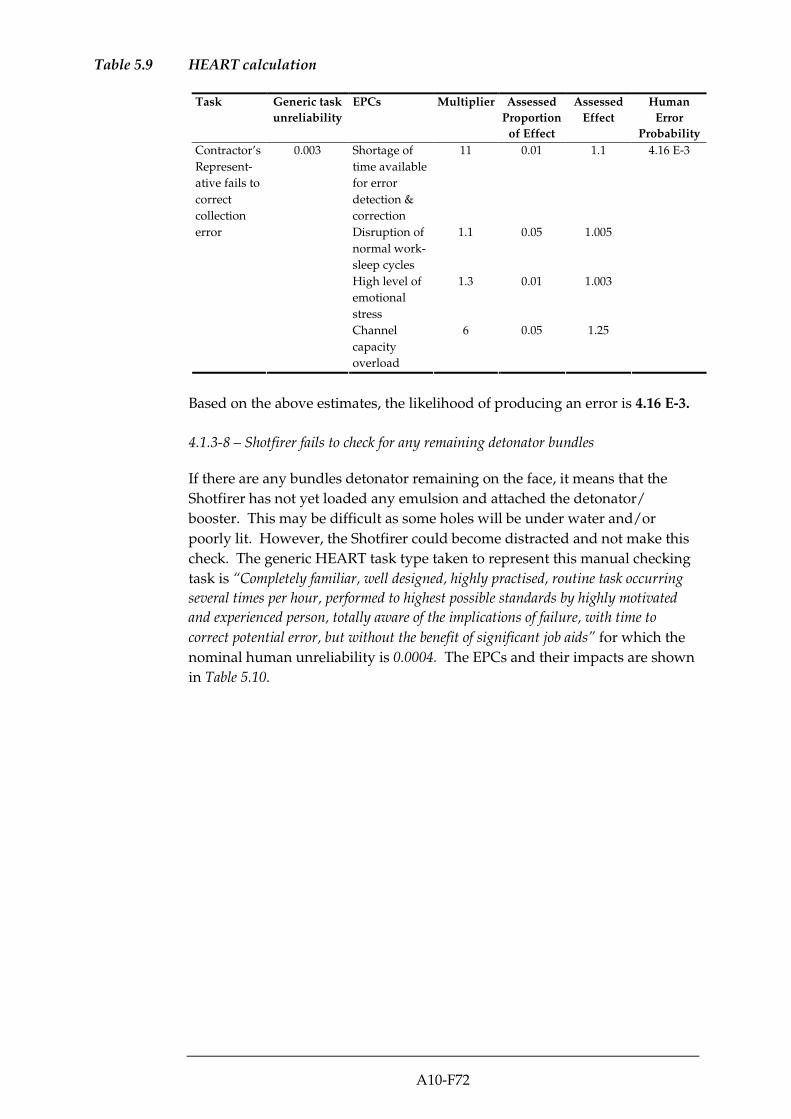
A10-F72
Table 5.9 HEART calculation
Task Generic task
unreliability
EPCs Multiplier Assessed
Proportion
of Effect
Assessed
Effect
Human
Error
Probability
Shortage of
time available
for error
detection &
correction
11 0.01 1.1
Disruption of
normal work-
sleep cycles
1.1 0.05 1.005
High level of
emotional
stress
1.3 0.01 1.003
Contractor’s
Represent-
ative fails to
correct
collection
error
0.003
Channel
capacity
overload
6 0.05 1.25
4.16 E-3
Based on the above estimates, the likelihood of producing an error is 4.16 E-3.
4.1.3-8 – Shotfirer fails to check for any remaining detonator bundles
If there are any bundles detonator remaining on the face, it means that the
Shotfirer has not yet loaded any emulsion and attached the detonator/
booster. This may be difficult as some holes will be under water and/or
poorly lit. However, the Shotfirer could become distracted and not make this
check. The generic HEART task type taken to represent this manual checking
task is “Completely familiar, well designed, highly practised, routine task occurring
several times per hour, performed to highest possible standards by highly motivated
and experienced person, totally aware of the implications of failure, with time to
correct potential error, but without the benefit of significant job aids” for which the
nominal human unreliability is 0.0004. The EPCs and their impacts are shown
in Table 5.10.
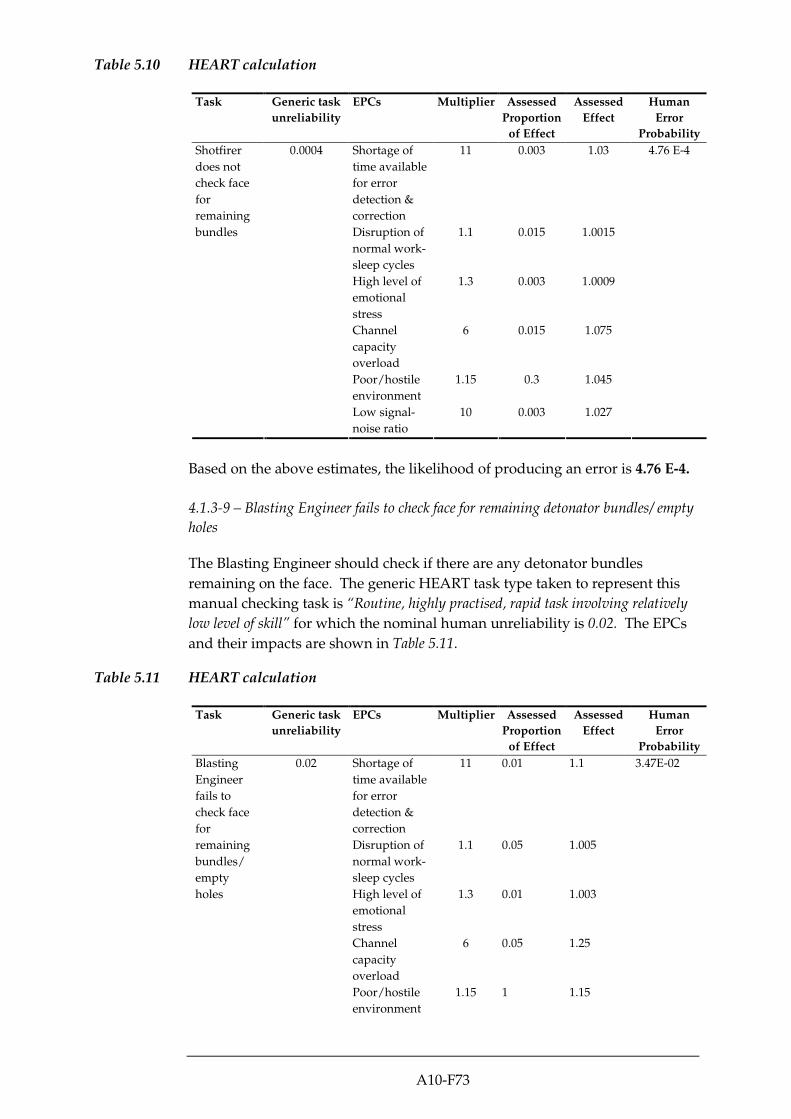
A10-F73
Table 5.10 HEART calculation
Task Generic task
unreliability
EPCs Multiplier Assessed
Proportion
of Effect
Assessed
Effect
Human
Error
Probability
Shortage of
time available
for error
detection &
correction
11 0.003 1.03
Disruption of
normal work-
sleep cycles
1.1 0.015 1.0015
High level of
emotional
stress
1.3 0.003 1.0009
Channel
capacity
overload
6 0.015 1.075
Poor/hostile
environment
1.15 0.3 1.045
Shotfirer
does not
check face
for
remaining
bundles
0.0004
Low signal-
noise ratio
10 0.003 1.027
4.76 E-4
Based on the above estimates, the likelihood of producing an error is 4.76 E-4.
4.1.3-9 – Blasting Engineer fails to check face for remaining detonator bundles/ empty
holes
The Blasting Engineer should check if there are any detonator bundles
remaining on the face. The generic HEART task type taken to represent this
manual checking task is “Routine, highly practised, rapid task involving relatively
low level of skill” for which the nominal human unreliability is 0.02. The EPCs
and their impacts are shown in Table 5.11.
Table 5.11 HEART calculation
Task Generic task
unreliability
EPCs Multiplier Assessed
Proportion
of Effect
Assessed
Effect
Human
Error
Probability
Shortage of
time available
for error
detection &
correction
11 0.01 1.1
Disruption of
normal work-
sleep cycles
1.1 0.05 1.005
High level of
emotional
stress
1.3 0.01 1.003
Channel
capacity
overload
6 0.05 1.25
Blasting
Engineer
fails to
check face
for
remaining
bundles/
empty
holes
0.02
Poor/hostile
environment
1.15 1 1.15
3.47E-02

A10-F74
Low signal-
noise ratio
10 0.01 1.09
Based on the above estimates, the likelihood of producing an error is 3.47 E-2.
F5.1.4 4.1.4: Shotfirer/ Blasting Engineer do not realise the cartridges left over due to
presence of blocked holes are not disposed of
The overall probability of the Shotfirer/ Blasting Engineer not realising that
the cartridges left over due to presence of blocked holes are not disposed of is
1.21 E-3, based on the failure of some or all of the tasks analysed below.
4.1.4-1 – Shotfirer fails to check for remaining cartridges leftover due to blocked holes
A Shotfirer may not dispose of the cartridges left over due to the presence of
blocked holes and load additional cartridges into the lifter holes. However, the
other Shotfirer will be aware of the presence of blocked and attempt to locate
the left over. The generic HEART task type taken to represent this manual
checking task is “Routine, highly practised, rapid task involving relatively low level
of skill” for which the nominal human unreliability is 0.02. The EPCs and their
impacts are shown in Table 5.14.
Table 5.12 HEART calculation
Task Generic task
unreliability
EPCs Multiplier Assessed
Proportion
of Effect
Assessed
Effect
Human
Error
Probability
Shortage of
time available
for error
detection &
correction
11 0.01 1.1
Disruption of
normal work-
sleep cycles
1.1 0.05 1.005
High level of
emotional
stress
1.3 0.01 1.003
Channel
capacity
overload
6 0.05 1.25
Poor/hostile
environment
1.15 1 1.15
Shotfirer
fails to
check for
remaining
cartridges
leftover due
to blocked
holes
0.02
Low signal-
noise ratio
10 0.01 1.09
3.47E-02
Based on the above estimates, the likelihood of producing an error is 3.47 E-2.
4.1.3-2 – Blast Engineer fails to check for remaining cartridges leftover due to blocked
holes
The Blast Engineer will also be aware of the presence of blocked holes and will
check the cartridges will be disposed of correctly. The generic HEART task
type taken to represent this manual checking task is “Routine, highly practised,
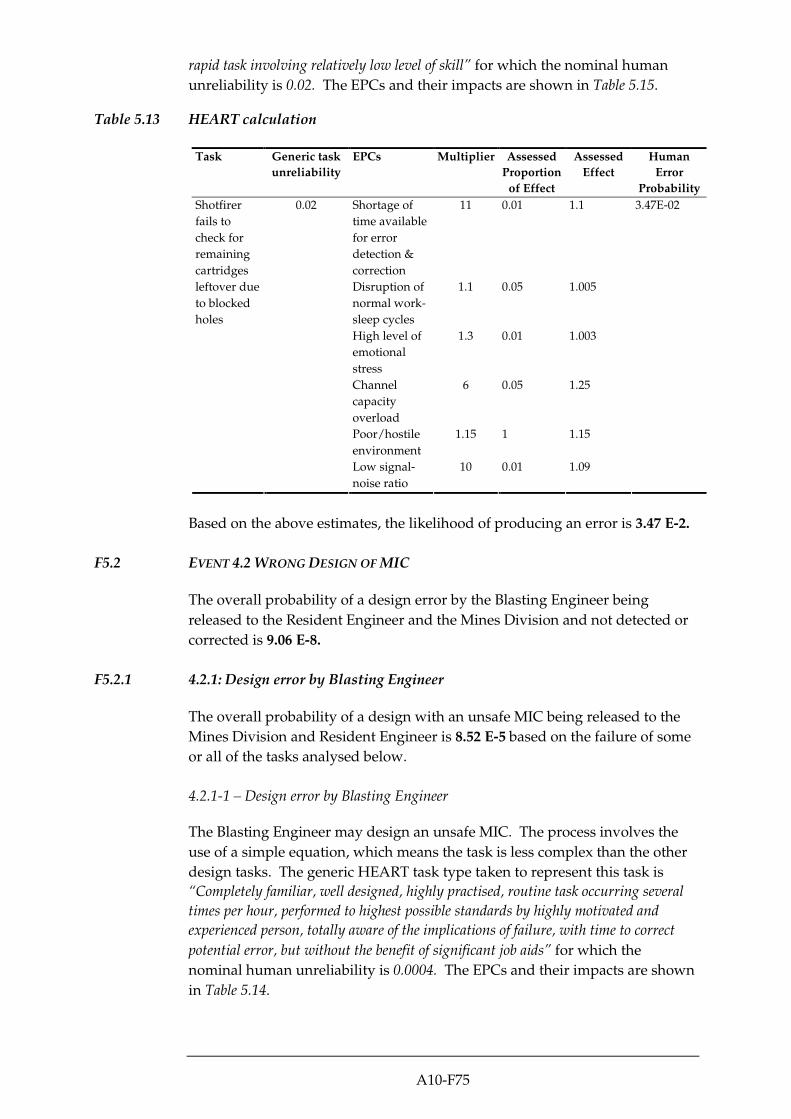
A10-F75
rapid task involving relatively low level of skill” for which the nominal human
unreliability is 0.02. The EPCs and their impacts are shown in Table 5.15.
Table 5.13 HEART calculation
Task Generic task
unreliability
EPCs Multiplier Assessed
Proportion
of Effect
Assessed
Effect
Human
Error
Probability
Shortage of
time available
for error
detection &
correction
11 0.01 1.1
Disruption of
normal work-
sleep cycles
1.1 0.05 1.005
High level of
emotional
stress
1.3 0.01 1.003
Channel
capacity
overload
6 0.05 1.25
Poor/hostile
environment
1.15 1 1.15
Shotfirer
fails to
check for
remaining
cartridges
leftover due
to blocked
holes
0.02
Low signal-
noise ratio
10 0.01 1.09
3.47E-02
Based on the above estimates, the likelihood of producing an error is 3.47 E-2.
F5.2 EVENT 4.2 WRONG DESIGN OF MIC
The overall probability of a design error by the Blasting Engineer being
released to the Resident Engineer and the Mines Division and not detected or
corrected is 9.06 E-8.
F5.2.1 4.2.1: Design error by Blasting Engineer
The overall probability of a design with an unsafe MIC being released to the
Mines Division and Resident Engineer is 8.52 E-5 based on the failure of some
or all of the tasks analysed below.
4.2.1-1 – Design error by Blasting Engineer
The Blasting Engineer may design an unsafe MIC. The process involves the
use of a simple equation, which means the task is less complex than the other
design tasks. The generic HEART task type taken to represent this task is
“Completely familiar, well designed, highly practised, routine task occurring several
times per hour, performed to highest possible standards by highly motivated and
experienced person, totally aware of the implications of failure, with time to correct
potential error, but without the benefit of significant job aids” for which the
nominal human unreliability is 0.0004. The EPCs and their impacts are shown
in Table 5.14.

A10-F76
Table 5.14 HEART calculation
Task Generic task
unreliability
EPCs Multiplier Assessed
Proportion
of Effect
Assessed
Effect
Human
Error
Probability
Shortage of
time available
for error
detection &
correction
11 0.01 1.1
Disruption of
normal work-
sleep cycles
1.1 0.1 1.01
High level of
emotional stress
1.3 0.3 1.09
Design
error by
Blasting
Engineer
0.0004
Channel
capacity
overload
6 0.05 1.25
6.05 E-4
Based on the above estimates, the likelihood of producing an error is 6.05 E-4.
4.2.1-2 – Failure to detect error by Blasting Engineer
The Blasting Engineer should utilise a modelling programme to detect any
design errors. The generic HEART task type taken to represent this checking
task, utilising a modelling system is “Fairly simple task performed rapidly or given
scant attention” for which the nominal human unreliability is 0.09. The EPCs
and their impacts are shown in Table 5.15.
Table 5.15 HEART calculation
Task Generic task
unreliability
EPCs Multiplier Assessed
Proportion
of Effect
Assessed
Effect
Human
Error
Probability
Shortage of
time available
for error
detection &
correction
11 0.01 1.1
Disruption of
normal work-
sleep cycles
1.1 0.1 1.01
Channel
capacity
overload
6 0.05 1.25
Failure to
detect
design error
by Blasting
Engineer
0.09
High level of
emotional stress
1.3 0.3 1.09
1.36 E-1
Based on the above estimates, the likelihood of producing an error is 1.36 E-1.
4.2.1-3 – Failure to correct error by Blasting Engineer
If an error is identified during the checking phase, the Blasting Engineer must
act on this to correct the error. The generic HEART task type taken to

A10-F77
represent this action task is “Restore or shift a system to original or new state
following procedures, with some checking” for which the nominal human
unreliability is 0.003. The EPCs and their impacts are shown in Table 5.16.
Table 5.16 HEART calculation
Task Generic task
unreliability
EPCs Multiplier Assessed
Proportion
of Effect
Assessed
Effect
Human
Error
Probability
Shortage of
time available
for error
detection &
correction
11 0.01 1.1
Disruption of
normal work-
sleep cycles
1.1 0.1 1.01
Channel
capacity
overload
6 0.05 1.25
Failure to
correct
design error
by Blasting
Engineer
0.003
High level of
emotional stress
1.3 0.3 1.09
4.54 E-3
Based on the above estimates, the likelihood of producing an error is 4.54 E-3.
F5.2.2 4.2.2: Failure to detect and correct design error
The overall probability of failure to detect and correct the design error is 1.06
E-3 based on the failure of all the tasks analysed below.
4.2.2-1 – Failure to detect error by Resident Engineer
The Resident Engineer will examine the design for potential errors. The
generic HEART task type taken to represent this manual checking task is
“Routine, highly practised, rapid task involving relatively low level of skill” for
which the nominal human unreliability is 0.02. The EPCs and their impacts
are shown in Table 5.17.
Table 5.17 HEART calculation
Task Generic task
unreliability
EPCs Multiplier Assessed
Proportion
of Effect
Assessed
Effect
Human
Error
Probability
Shortage of time
available for error
detection &
correction
11 0.01 1.1
High level of
emotional stress
1.3 0.2 1.06
Failure
to detect
error by
Resident
Engineer
0.02
Channel capacity
overload
6 0.05 1.25
2.92 E-2
Based on the above estimates, the likelihood of producing an error is 2.92 E-2.
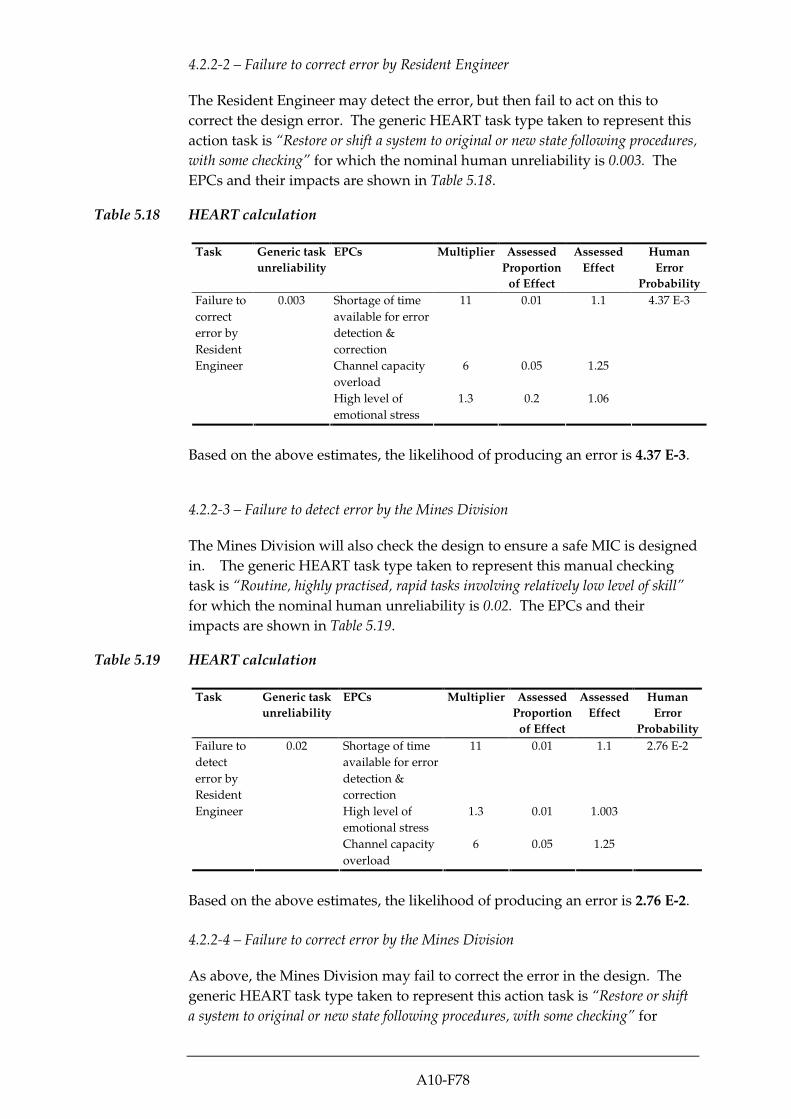
A10-F78
4.2.2-2 – Failure to correct error by Resident Engineer
The Resident Engineer may detect the error, but then fail to act on this to
correct the design error. The generic HEART task type taken to represent this
action task is “Restore or shift a system to original or new state following procedures,
with some checking” for which the nominal human unreliability is 0.003. The
EPCs and their impacts are shown in Table 5.18.
Table 5.18 HEART calculation
Task Generic task
unreliability
EPCs Multiplier Assessed
Proportion
of Effect
Assessed
Effect
Human
Error
Probability
Shortage of time
available for error
detection &
correction
11 0.01 1.1
Channel capacity
overload
6 0.05 1.25
Failure to
correct
error by
Resident
Engineer
0.003
High level of
emotional stress
1.3 0.2 1.06
4.37 E-3
Based on the above estimates, the likelihood of producing an error is 4.37 E-3.
4.2.2-3 – Failure to detect error by the Mines Division
The Mines Division will also check the design to ensure a safe MIC is designed
in. The generic HEART task type taken to represent this manual checking
task is “Routine, highly practised, rapid tasks involving relatively low level of skill”
for which the nominal human unreliability is 0.02. The EPCs and their
impacts are shown in Table 5.19.
Table 5.19 HEART calculation
Task Generic task
unreliability
EPCs Multiplier Assessed
Proportion
of Effect
Assessed
Effect
Human
Error
Probability
Shortage of time
available for error
detection &
correction
11 0.01 1.1
High level of
emotional stress
1.3 0.01 1.003
Failure to
detect
error by
Resident
Engineer
0.02
Channel capacity
overload
6 0.05 1.25
2.76 E-2
Based on the above estimates, the likelihood of producing an error is 2.76 E-2.
4.2.2-4 – Failure to correct error by the Mines Division
As above, the Mines Division may fail to correct the error in the design. The
generic HEART task type taken to represent this action task is “Restore or shift
a system to original or new state following procedures, with some checking” for

A10-F79
which the nominal human unreliability is 0.003. The EPCs and their impacts
are shown in Table 5.20.
Table 5.20 HEART calculation
Task Generic task
unreliability
EPCs Multiplier Assessed
Proportion
of Effect
Assessed
Effect
Human
Error
Probability
Shortage of
time available
for error
detection &
correction
11 0.01 1.1
Channel
capacity
overload
6 0.05 1.25
Failure to
correct
error by
Mines
Division
0.003
High level of
emotional stress
1.3 0.01 1.003
4.14 E-3
Based on the above estimates, the likelihood of producing an error is 4.14 E-3.

Attachment F1
Fault Tree Models for
Human Reliability
Assessment

1.1.1
Design error by Blasting
Engineer and failure of
design check and
correction (Cut)
1.1.1-2
Failure to detecterror by BlastingEngineer during
modelling
1.1.1-3
Failure to correcterror by Blasting
Engineer
1.1.1-G1
Failure to detect orcorrect error by
Blasting Engineer
1.1.1-1
Design error byBlastingEngineer
Page 1 of 29
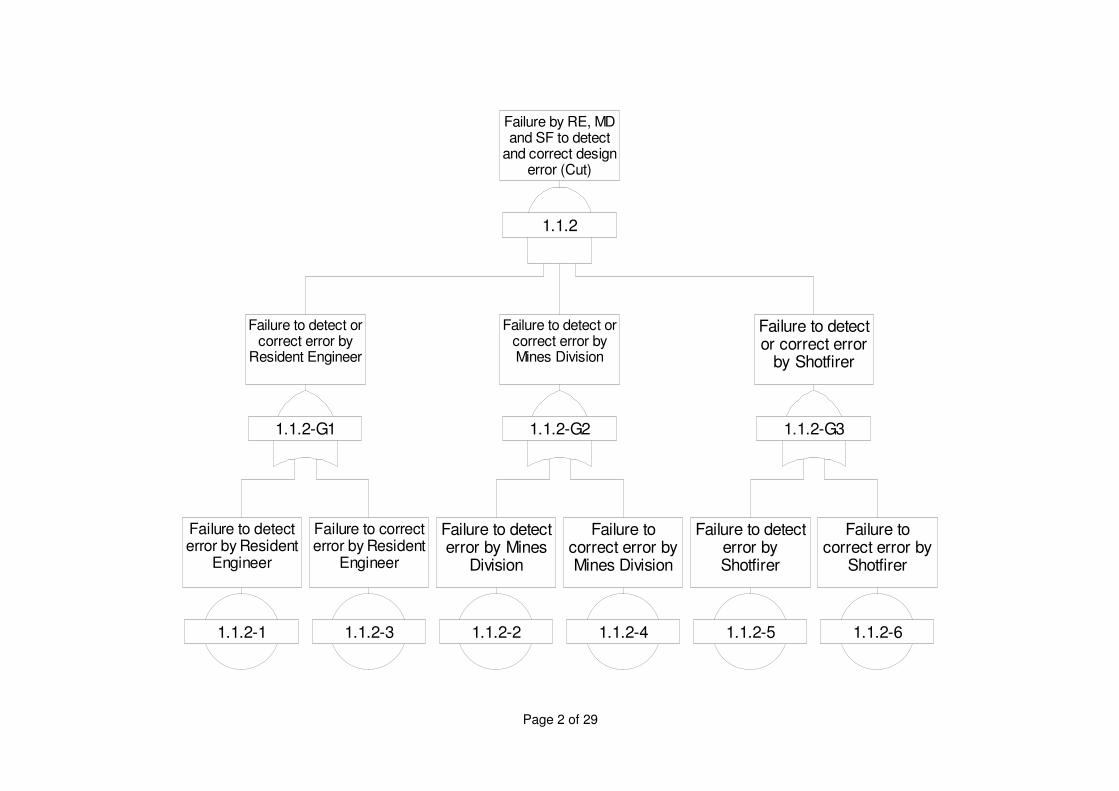
1.1.2
Failure by RE, MDand SF to detect
and correct designerror (Cut)
1.1.2-G1
Failure to detect orcorrect error by
Resident Engineer
1.1.2-G2
Failure to detect orcorrect error byMines Division
1.1.2-G3
Failure to detector correct error
by Shotfirer
1.1.2-1
Failure to detecterror by Resident
Engineer
1.1.2-3
Failure to correcterror by Resident
Engineer
1.1.2-2
Failure to detecterror by Mines
Division
1.1.2-4
Failure tocorrect error byMines Division
1.1.2-5
Failure to detecterror byShotfirer
1.1.2-6
Failure tocorrect error by
Shotfirer
Page 2 of 29

1.2.1
Operator drillsincorrectly
1.2.1-1
Surveyors calculateincorrect co-ordinates,
leading to operatorhaving disc with
incorrect information.
1.2.1-2
Blasting Engineerinputs wrong
information on todisc (typo)
Page 3 of 29

1.2.2
Failure by BE andSF to detect andcorrect drilling
error
1.2.2-G1
Failure to detect orcorrect error by
Blasting Engineer
1.2.2-G2
Failure to detector correct error
by Shotfirer
1.2.2-1
BlastingEngineer fails tocheck holes aredrilled correctly
1.2.2-3
BlastingEngineer fails tocorrect drilling
error
1.2.2-2
Shotfirer fails tocheck holes aredrilled correctly
1.2.2-4
Shotfirer fails tocorrect drilling
error
Page 4 of 29

1.3.1
Wrong
installation of
one detonator
1.3.1-G5
Shotfirer failsto detect or
correct markingerror
1.3.1-1
Shotfirer marks
holes
incorrectly
1.3.1-G4
Shotfirer marks holesincorrectly and fails todetect and correct the
error
1.3.1.4
Shotfirer picksup detonator
with wrong timedelay
1.3.1-2
Shotfirer fails
to detect
marking error
1.3.1-3
Shotfirer fails
to correct
marking error
1.3.1-G3
Shotfirer picks updetonator with
wrong time delayafter marking
1.3.1.5
Shotfirer fails tocheck detonatordelay tag before
placing into the hole
1.3.1-G1
Wrong installationof one detonator
before label checkafter the installation
1.3.1.7
Shotfirer fails tocheck detonatordelay tag after
placing into the hole
1.3.1-G2
Shotfirer fails to checkdetonator delay tag
before placing into thehole after marking
1.3.1.6
Shotfirer puts
detonator not
within cut
Page 5 of 29

1.3.2
Shotfirer failsto detect &
correct error
1.3.2-1
Shotfirer failsto realise wrong
installation
1.3.2-2
Shotfirer fails tocorrect errorbefore final
hook-up check
Page 6 of 29

2.1.1
Design error by Blasting
Engineer and failure of
design check and
correction for time delay
2.1.1-2
Failure to detecterror by BlastingEngineer during
modelling
2.1.1-3
Failure to correcterror by Blasting
Engineer
2.1.1-G1
Failure to detect orcorrect error by
Blasting Engineer
2.1.1-1
Design error byBlastingEngineer
Page 7 of 29

2.1.2
Failure by RE, MDand SF to detect
and correct designerror for time delay
2.1.2-G1
Failure to detect orcorrect error by
Resident Engineer
2.1.2-G2
Failure to detect orcorrect error byMines Division
2.1.2-G3
Failure to detector correct error
by Shotfirer
2.1.2-1
Failure to detecterror by Resident
Engineer
2.1.2-3
Failure to correcterror by Resident
Engineer
2.1.2-2
Failure to detecterror by Mines
Division
2.1.2-4
Failure tocorrect error byMines Division
2.1.2-5
Failure to detecterror byShotfirer
2.1.2-6
Failure tocorrect error by
Shotfirer
Page 8 of 29

2.2.1
Wrong delivery
of detonators
2.2.1-G1
Failure to detect
ad correct
selection error
2.2.1-1
Detonators are
picked incorrectly
by Shotfirer from
magazine
2.2.1-2
Shotfirer fails
to detect error
2.2.1-5
Shotfirer fails
to correct
selection error
2.2.1-3
Resident Engineer'sInspector fails to checkcorrect detonators have
been picked
2.2.1-6
Resident
Engineer's
Inspector fails to
correct error
2.2.1-4
Contractor'sRepresentative fails to
check correct detonatorshave been picked
2.2.1-7
Contractor's
Representative
fails to correct error
2.2.1-G2
Shotfirer fails to
detect or correct
selection error
2.2.1-G3
Resident Engineer'sInspector fails to checkcorrect detonators havebeen picked and correct
the error
2.2.1-G4
Contractor'sRepresentative fails to
check correct detonatorshave been picked and
correct the error
Page 9 of 29
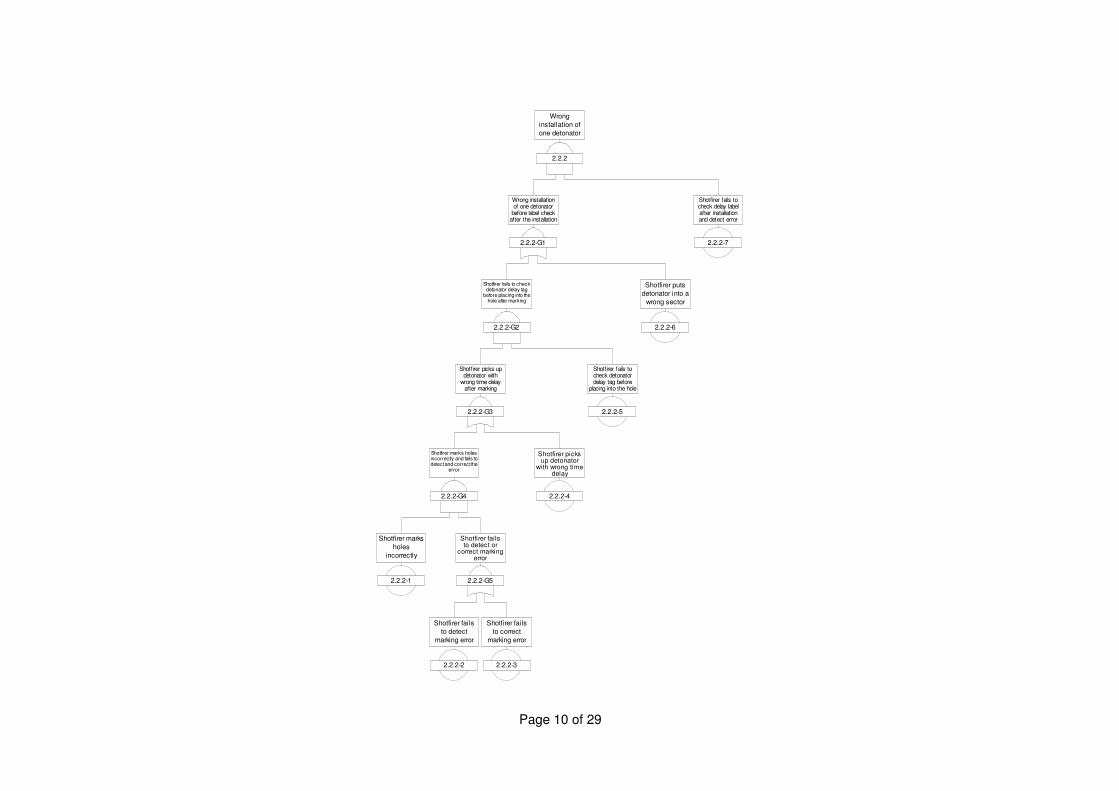
2.2.2
Wrong
installation of
one detonator
2.2.2-G5
Shotfirer failsto detect or
correct markingerror
2.2.2-1
Shotfirer marks
holes
incorrectly
2.2.2-G4
Shotfirer marks holesincorrectly and fails todetect and correct the
error
2.2.2-4
Shotfirer picksup detonator
with wrong timedelay
2.2.2-2
Shotfirer fails
to detect
marking error
2.2.2-3
Shotfirer fails
to correct
marking error
2.2.2-G3
Shotfirer picks updetonator with
wrong time delayafter marking
2.2.2-5
Shotfirer fails tocheck detonatordelay tag before
placing into the hole
2.2.2-G1
Wrong installationof one detonator
before label checkafter the installation
2.2.2-7
Shotfirer fails tocheck delay labelafter installationand detect error
2.2.2-G2
Shotfirer fails to checkdetonator delay tag
before placing into thehole after marking
2.2.2-6
Shotfirer puts
detonator into a
wrong sector
Page 10 of 29

2.2.3
Shotfirer fails todetect & correctinstallation error
of detonator
2.2.3-1
Shotfirer failsto realise wrong
installation
2.2.3-2
Shotfirer fails tocorrect errorbefore final
hook-up check
Page 11 of 29

2.3.1
Detonator of onesector wrongly
connected to a surfaceconnector of adifferent sector
2.3.1-G4
Shotfirer fails todetect or correctmarking error
2.3.1-1
Shotfirer markssectors
incorrectly
2.3.1-G2
Shotfirer marks sectorincorrectly and fails todetect and correct the
error
2.3.1-G3
Shotfirer/ helperbundles a detonatorfrom another sectioninto wrong section
2.3.1-2
Shotfirer fails todetect marking
error
2.3.1-3
Shotfirer fails tocorrect marking
error
2.3.1-G1
Shotfirer bundles adetonator from another
section into wrongsection after marking
2.3.1-8
Shotfirer connects
wrong surface
connector
2.3.1-G5
Helper bundles adetonator fromanother section
into wrong section
2.3.1-4
Shotfirer bundlesa detonator fromanother section
into wrong section
2.3.1-G6
Shotfirer fails todetect or correctbundling error
2.3.1-5
Helper bundles adetonator fromanother section
into wrong section
2.3.1-6
Shotfirer fails todetect bundling
error
2.3.1-7
Shotfirer fails tocorrect bundling
error
Page 12 of 29

2.3.2
Failure to detect detonator
of one sector wrongly
connected to a surface
connector and respond
during f inal hook up chec
2.3.2-G1
Shotfirer fails todetect or correctconnection error
2.3.2-G2
Blasting Engineerfails to check or
correct connectionerror
2.3.2-G3
RSS fail tocheck or correct
connection
2.3.2-1
Shotfirer fails todetect
connection error
2.3.2-2
Shotfirer fails tocorrect
connection error
2.3.2-3
BlastingEngineer fails tocheck connection
error
2.3.2-4
BlastingEngineer fails to
correctconnection error
2.3.2-5
RSS fail tocheck error
2.3.2-6
RSS fail tocorrect error
Page 13 of 29

2.4.1
Wrong installationof surfaceconnector
2.4.1-1
Shotfirer fails tocheck surface
connector colourbefore use
2.4.1-2
Shotfirerconnects wrong
surface connector
Page 14 of 29

2.4.2
Shotfirer fails to detectwrong installation of
surface connector andrespond
2.4.2-1
Shotfirer fails todetect wrong
surface connectorafter installation
2.4.2-2
Shotfirer fails tocorrect wrong
conection
Page 15 of 29

2.4.3
Failure to detect w rong
installation of surface
connector and respond
during final hook up
check
2.4.3-G1
Shotfirer fails todetect or correctconnection error
2.4.3-G2
Blasting Engineerfails to check or
correct connectionerror
2.4.3-G3
RSS fail tocheck or correct
connection
2.4.3-5
Shotfirer fails todetect
connection error
2.4.3-6
Shotfirer fails tocorrect
connection error
2.4.3-1
BlastingEngineer fails tocheck connection
error
2.4.3-2
BlastingEngineer fails to
correctconnection error
2.4.3-3
RSS fail to checkconnection errorduring final hook
up
2.4.3-4
RSS fail tocorrect error
Page 16 of 29

3.1.1
Too much emulsion
loaded into hole due
to wrong density
check
3.1.1-G1
Truck operator sets
gassing flow meteror read density chart
incorrectly
3.1.1-G2
Truck operatorreads scales or
density chartincorrectly
3.1.1-1
Truck operatorsets gassing flowmeter incorrectly
3.1.1-2
Truck operatorreads density
chart incorrectly
3.1.1-G3
Truck operator reads
scales or density chart
incorrectly and not
detected/ corrected by
BE/SF (prior to loading)
Page 18
3.1.1-G4
Truck operator reads scales
or density chart incorrectly
and not detected/corrected
by BE/SF (in the middle of
loading)
Page 19
3.1.1-G5
Truck operator reads scales
or density chart incorrectly
and not detected/ corrected
by BE/SF (towards end of
loading)
Page 20
Page 17 of 29

3.1.1-G3
Truck operator readsscales or density chart
incorrectly and notdetected/ corrected by
BE/SF (prior to loading)
17
3.1.1-3-1
Truck operator
reads scales
incorrectly
3.1.1-4-1
Truck operator
reads density
chart incorrectly
3.1.1-G8
Failure to detect or
correct error by
Blasting Engineer
3.1.1-G9
Failure to detect
or correct error
by Shotfirer
3.1.1-5-1
Failure to detect
error by Blasting
Engineer
3.1.1-6-1
Failure to correct
error by Blasting
Engineer
3.1.1-7-1
Failure to
detect error by
Shotfirer
3.1.1-8-1
Failure to
correct error by
Shotfirer
3.1.1-G6
Truck operator reads
scales or density
chart incorrectly
(prior to loading)
3.1.1-G7
Failure to detect or correctdensity check error byBlasting Engineer/
Shotfirer
Page 18 of 29

3.1.1-G4
Truck operator readsscales or density chart
incorrectly and notdetected/corrected by
BE/SF (in the middle ofloading)
17
3.1.1-3-2
Truck operator
reads scales
incorrectly
3.1.1-4-2
Truck operator
reads density
chart incorrectly
3.1.1-G10
Truck operator readsscales or density chart
incorrectly (in the middleof loading)
3.1.1-G11
Failure to detect or correctdensity check error byBlasting Engineer/
Shotfirer
3.1.1-G12
Failure to detect or
correct error by
Blasting Engineer
3.1.1-G13
Failure to detect
or correct error
by Shotfirer
3.1.1-5-2
Failure to detect
error by Blasting
Engineer
3.1.1-6-2
Failure to correct
error by Blasting
Engineer
3.1.1-7-2
Failure to
detect error by
Shotfirer
3.1.1-8-2
Failure to
correct error by
Shotfirer
Page 19 of 29
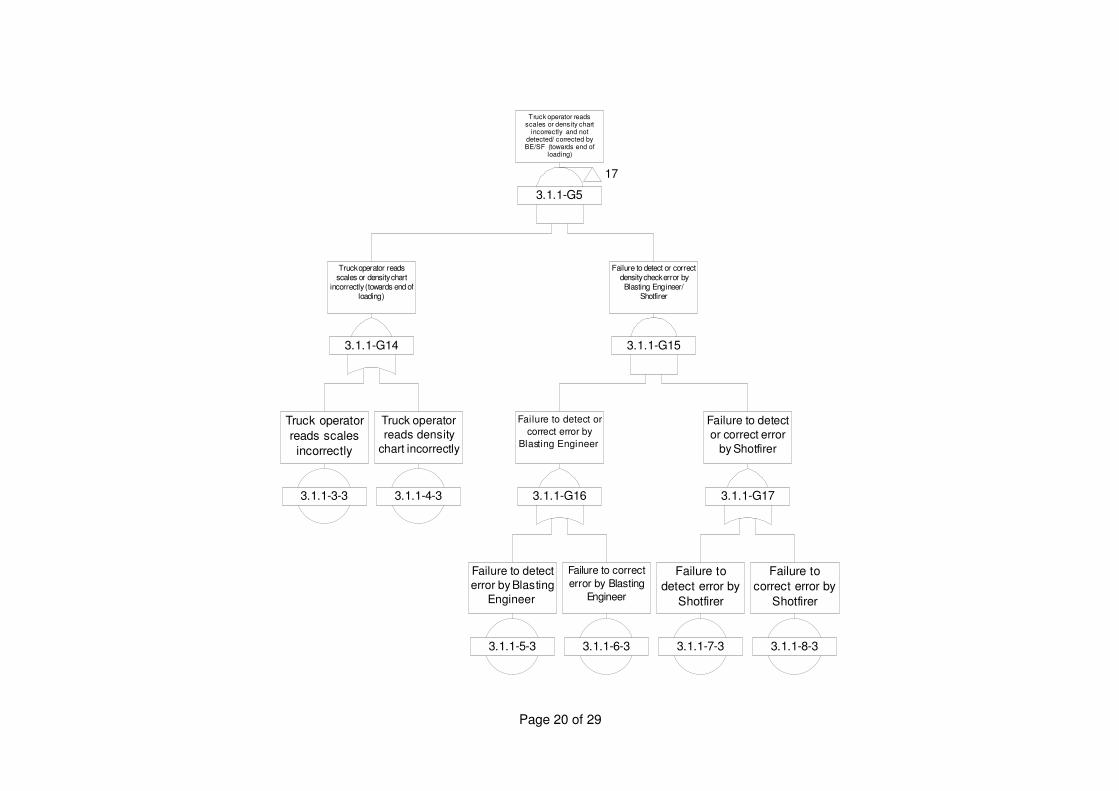
3.1.1-G5
Truck operator readsscales or density chart
incorrectly and notdetected/ corrected byBE/SF (towards end of
loading)
17
3.1.1-3-3
Truck operator
reads scales
incorrectly
3.1.1-4-3
Truck operator
reads density
chart incorrectly
3.1.1-G14
Truck operator readsscales or density chart
incorrectly (towards end ofloading)
3.1.1-G15
Failure to detect or correctdensity check error byBlasting Engineer/
Shotfirer
3.1.1-G16
Failure to detect or
correct error by
Blasting Engineer
3.1.1-G17
Failure to detect
or correct error
by Shotfirer
3.1.1-5-3
Failure to detect
error by Blasting
Engineer
3.1.1-6-3
Failure to correct
error by Blasting
Engineer
3.1.1-7-3
Failure to
detect error by
Shotfirer
3.1.1-8-3
Failure to
correct error by
Shotfirer
Page 20 of 29
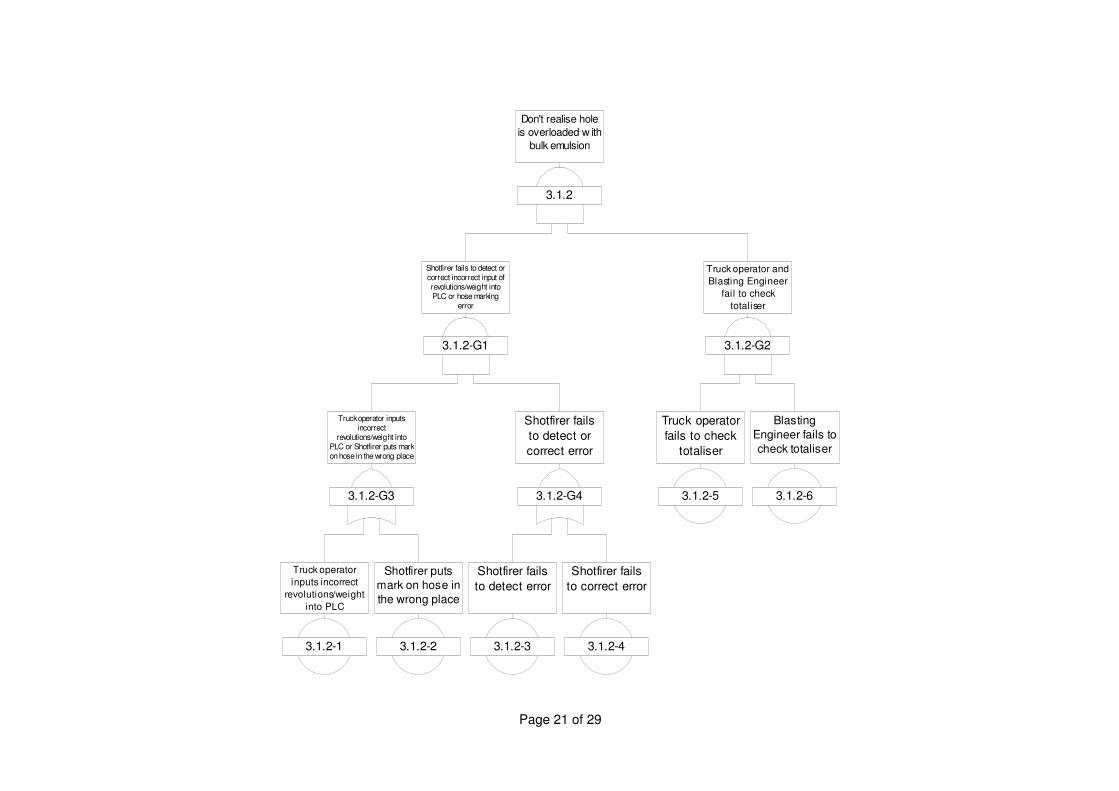
3.1.2
Don't realise hole
is overloaded w ith
bulk emulsion
3.1.2-G1
Shotfirer fails to detect orcorrect incorrect input ofrevolutions/weight intoPLC or hose marking
error
3.1.2-G2
Truck operator and
Blasting Engineer
fail to check
totaliser
3.1.2-5
Truck operator
fails to check
totaliser
3.1.2-6
Blasting
Engineer fails to
check totaliser
3.1.2-1
Truck operator
inputs incorrect
revolutions/weight
into PLC
3.1.2-2
Shotfirer puts
mark on hose in
the wrong place
3.1.2-3
Shotfirer fails
to detect error
3.1.2-4
Shotfirer fails
to correct error
3.1.2-G3
Truck operator inputsincorrect
revolutions/weight intoPLC or Shotfirer puts markon hose in the wrong place
3.1.2-G4
Shotfirer fails
to detect or
correct error
Page 21 of 29

3.2.1
Design error of MIC
by Blasting Engineer
and failure of design
check and correction
3.2.1-2
Failure to detecterror by BlastingEngineer during
modelling
3.2.1-3
Failure to correcterror by Blasting
Engineer
3.2.1-G1
Failure to detect orcorrect error by
Blasting Engineer
3.2.1-1
Design error byBlastingEngineer
Page 22 of 29
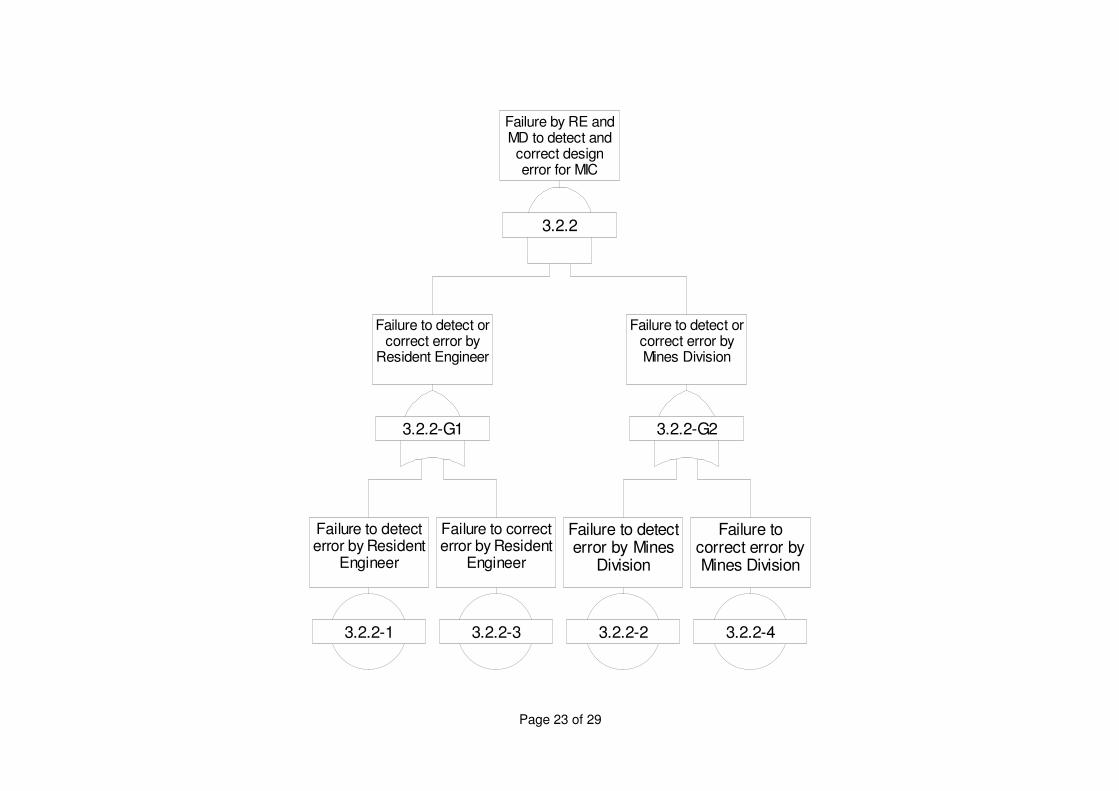
3.2.2
Failure by RE andMD to detect andcorrect designerror for MIC
3.2.2-G1
Failure to detect orcorrect error by
Resident Engineer
3.2.2-G2
Failure to detect orcorrect error byMines Division
3.2.2-1
Failure to detecterror by Resident
Engineer
3.2.2-3
Failure to correcterror by Resident
Engineer
3.2.2-2
Failure to detecterror by Mines
Division
3.2.2-4
Failure tocorrect error byMines Division
Page 23 of 29

4.1.1
SF does notcount correctly
4.1.1-1
Shotfirer does notcount number ofcartridges he has
picked up and loadstoo many
Page 24 of 29

4.1.2
Blocked holesare not
disposed of
4.1.2-1
Cartridges left overfrom blocked holes aredisposed of incorrectly
(used in lifters)
Page 25 of 29

4.1.3
Doesn't realise holesare over-loaded withcartridge emulsion
4.1.3-G1
Too many Kg ofcartridge from
magazine deliveredto site
4.1.3-G2
Shotfirer and Blasting
Engineer fail to check
for remaining
bundles/ empty holes
4.1.3-G3
Shotfirer, RSS andContractor's
Representative fail todetect or correctcollection error
4.1.3-1
Shotfirer collects toomany Kg of cartridge
from magazine
4.1.3-2
Shotfirer fails
to detect
collection error
4.1.3-3
Shotfirer fails
to correct
collection error
4.1.3-4
Resident site stafffail to detect
collection error
4.1.3-5
Resident site stafffail to correct
collection error
4.1.3-6
Contractor'sRepresentative failsto detect collection
error
4.1.3-7
Contractor'sRepresentative failsto correct collection
error
4.1.3-G4
Shotf irer f ails to
detect or correct
collection error
4.1.3-G5
Resident site stafffail to detect or
correct collectionerror
4.1.3-G6
Contractor'sRepresentative failsto detect or correct
collection error
4.1.3-8
Shotfirer fails tocheck for remaining
bundles
4.1.3-9
Blasting Engineerfails to check for
empty holes
Page 26 of 29

4.1.4
Doesn't realiseblocked holes arenot disposed of
4.1.3-10
Shotfirer fails tocheck for remainingcartridges leftover
due to blocked holes
4.1.3-11
Blasting Engineer failsto check for remainingcartridges leftover due
to blocked holes
Page 27 of 29

4.2.1
Design error for MIC
by Blasting Engineer
and failure of design
check and correction
4.2.1-2
Failure to detecterror by BlastingEngineer during
modelling
4.2.1-3
Failure to correcterror by Blasting
Engineer
4.2.1-G1
Failure to detect orcorrect error by
Blasting Engineer
4.2.1-1
Design error byBlastingEngineer
Page 28 of 29

4.2.2
Failure by RE andMD to detect andcorrect designerror for MIC
4.2.2-G1
Failure to detect orcorrect error by
Resident Engineer
4.2.2-G2
Failure to detect orcorrect error byMines Division
4.2.2-1
Failure to detecterror by Resident
Engineer
4.2.2-3
Failure to correcterror by Resident
Engineer
4.2.2-2
Failure to detecterror by Mines
Division
4.2.2-4
Failure tocorrect error byMines Division
Page 29 of 29

Annex G
Use of Explosives – Blasting
Route and Slopes Details

G1
G1.1
Table 1.1
*Description Chainage Actual
Explosive per
Charge (kg)
1 West Island Line - SYP to SHW Westbound (Volume 2), Chainage 100023 100023 3.2
2 West Island Line - SYP to SHW Westbound (Volume 2), Chainage 100013 100013 3.6
3 West Island Line - SYP to SHW Westbound (Volume 2), Chainage 100003 100003 2.9
4 West Island Line - SYP to SHW Westbound (Volume 2), Chainage 99993 99993 2.3
5 West Island Line - SYP to SHW Westbound (Volume 2), Chainage 99983 99983 1.8
6 West Island Line - SYP to SHW Westbound (Volume 2), Chainage 99973 99973 1.3
7 West Island Line - SYP to SHW Westbound (Volume 2), Chainage 99963 99963 1.0
8 West Island Line - SYP to SHW Westbound (Volume 2), Chainage 99953 99953 0.8
9 West Island Line - SYP to SHW Westbound (Volume 2), Chainage 99943 99943 0.6
10 West Island Line - SYP to SHW Westbound (Volume 2), Chainage 99933 99933 0.6
11 West Island Line - SYP to SHW Westbound (Volume 2), Chainage 99923 99923 0.7
12 West Island Line - SYP to SHW Westbound (Volume 2), Chainage 99913 99913 0.6
13 West Island Line - SYP to SHW Westbound (Volume 2), Chainage 99903 99903 0.6
14 West Island Line - SYP to SHW Westbound (Volume 2), Chainage 99893 99893 0.5
15 West Island Line - SYP to SHW Westbound (Volume 2), Chainage 99883 99883 0.5
16 West Island Line - SYP to SHW Westbound (Volume 2), Chainage 99873 99873 0.5
17 West Island Line - SYP to SHW Westbound (Volume 2), Chainage 99863 99863 0.5
18 West Island Line - SYP to SHW Westbound (Volume 2), Chainage 99853 99853 0.6
19 West Island Line - SYP to SHW Westbound (Volume 2), Chainage 99843 99843 0.7
20 West Island Line - SYP to SHW Westbound (Volume 2), Chainage 99833 99833 0.9
21 West Island Line - SYP to SHW Westbound (Volume 2), Chainage 99823 99823 0.7
22 West Island Line - SYP to SHW Westbound (Volume 2), Chainage 99813 99813 0.6
23 West Island Line - SYP to SHW Westbound (Volume 2), Chainage 99803 99803 0.6
24 West Island Line - SYP to SHW Westbound (Volume 2), Chainage 99793 99793 0.7
25 West Island Line - SYP to SHW Westbound (Volume 2), Chainage 99783 99783 0.8
26 West Island Line - SYP to SHW Westbound (Volume 2), Chainage 99773 99773 1.0
27 West Island Line - SYP to SHW Westbound (Volume 2), Chainage 99763 99763 1.1
28 West Island Line - SYP to SHW Westbound (Volume 2), Chainage 99758 99758 1.1
29 West Island Line - SYP to SHW Eastbound (Volume 2), Chainage 99747 99747 1.4
30 West Island Line - SYP to SHW Eastbound (Volume 2), Chainage 99750 99750 1.3
31 West Island Line - SYP to SHW Eastbound (Volume 2), Chainage 99760 99760 1.1
32 West Island Line - SYP to SHW Eastbound (Volume 2), Chainage 99770 99770 0.9
33 West Island Line - SYP to SHW Eastbound (Volume 2), Chainage 99780 99780 0.7
34 West Island Line - SYP to SHW Eastbound (Volume 2), Chainage 99790 99790 0.7
35 West Island Line - SYP to SHW Eastbound (Volume 2), Chainage 99800 99800 0.7
36 West Island Line - SYP to SHW Eastbound (Volume 2), Chainage 99810 99810 0.8
37 West Island Line - SYP to SHW Eastbound (Volume 2), Chainage 99820 99820 0.7
38 West Island Line - SYP to SHW Eastbound (Volume 2), Chainage 99830 99830 0.6
39 West Island Line - SYP to SHW Eastbound (Volume 2), Chainage 99840 99840 0.5
40 West Island Line - SYP to SHW Eastbound (Volume 2), Chainage 99850 99850 0.5
41 West Island Line - SYP to SHW Eastbound (Volume 2), Chainage 99860 99860 0.6
42 West Island Line - SYP to SHW Eastbound (Volume 2), Chainage 99870 99870 0.7
43 West Island Line - SYP to SHW Eastbound (Volume 2), Chainage 99880 99880 0.7
44 West Island Line - SYP to SHW Eastbound (Volume 2), Chainage 99890 99890 0.8
45 West Island Line - SYP to SHW Eastbound (Volume 2), Chainage 99900 99900 0.9
46 West Island Line - SYP to SHW Eastbound (Volume 2), Chainage 99910 99910 0.9
47 West Island Line - SYP to SHW Eastbound (Volume 2), Chainage 99920 99920 1.0
48 West Island Line - SYP to SHW Eastbound (Volume 2), Chainage 99930 99930 1.0
49 West Island Line - SYP to SHW Eastbound (Volume 2), Chainage 99940 99940 1.1
50 West Island Line - SYP to SHW Eastbound (Volume 2), Chainage 99950 99950 1.2
51 West Island Line - SYP to SHW Eastbound (Volume 2), Chainage 99960 99960 1.5
52 West Island Line - SYP to SHW Eastbound (Volume 2), Chainage 99970 99970 1.8
53 West Island Line - SYP to SHW Eastbound (Volume 2), Chainage 99980 99980 2.3
USE OF EXPLOSIVES - BLASTING ROUTE AND SLOPES DETAILS
Use of Explosives – Blasting Route Details
Charge of Explosives Per Blasthole Along Chainage
A10-G1

*Description Chainage Actual
Explosive per
Charge (kg)
54 West Island Line - SYP to SHW Eastbound (Volume 2), Chainage 99990 99990 2.8
55 West Island Line - SYP to SHW Eastbound (Volume 2), Chainage 100000 100000 3.4
56 West Island Line - SYP to SHW Eastbound (Volume 2), Chainage 100010 100010 4.1
57 West Island Line - SYP to SHW Eastbound (Volume 2), Chainage 100020 100020 4.8
58 West Island Line - SYP Station Central Track (Volume 3), Chainage 99727 99727 1.3
59 West Island Line - SYP Station Central Track (Volume 3), Chainage 99717 99717 1.6
60 West Island Line - SYP Station Central Track (Volume 3), Chainage 99707 99707 1.5
61 West Island Line - SYP Station Central Track (Volume 3), Chainage 99697 99697 1.3
62 West Island Line - SYP Station Central Track (Volume 3), Chainage 99687 99687 1.1
63 West Island Line - SYP Station Central Track (Volume 3), Chainage 99677 99677 1.0
64 West Island Line - SYP Station Central Track (Volume 3), Chainage 99667 99667 0.9
65 West Island Line - SYP Station Central Track (Volume 3), Chainage 99657 99657 1.0
66 West Island Line - SYP Station Central Track (Volume 3), Chainage 99647 99647 1.0
67 West Island Line - SYP Station Central Track (Volume 3), Chainage 99637 99637 1.1
68 West Island Line - SYP Station Central Track (Volume 3), Chainage 99627 99627 1.1
69 West Island Line - SYP Station Central Track (Volume 3), Chainage 99617 99617 1.0
70 West Island Line - SYP Station Central Track (Volume 3), Chainage 99607 99607 0.9
71 West Island Line - SYP Station Central Track (Volume 3), Chainage 99597 99597 1.0
72 West Island Line - SYP Station Central Track (Volume 3), Chainage 99587 99587 1.1
73 West Island Line - SYP Station Central Track (Volume 3), Chainage 99577 99577 1.3
74 West Island Line - SYP Station Central Track (Volume 3), Chainage 99567 99567 1.6
75 West Island Line - SYP Station Central Track (Volume 3), Chainage 99557 99557 1.9
76 West Island Line - SYP Station Central Track (Volume 3), Chainage 99547 99547 2.3
77 West Island Line - SYP Station Central Track (Volume 3), Chainage 99537 99537 2.8
78 West Island Line - SYP Station Central Track (Volume 3), Chainage 99527 99527 3.0
79 West Island Line - SYP Station Central Track (Volume 3), Chainage 99517 99517 2.9
80 West Island Line - SYP Station Central Track (Volume 3), Chainage 99507 99507 2.9
81 West Island Line - SYP Station Central Track (Volume 3), Chainage 99497 99497 2.9
82 West Island Line - SYP Station Down Track (Volume 3), Chainage 99758 99758 1.1
83 West Island Line - SYP Station Down Track (Volume 3), Chainage 99750 99750 1.1
84 West Island Line - SYP Station Down Track (Volume 3), Chainage 99740 99740 1.2
85 West Island Line - SYP Station Down Track (Volume 3), Chainage 99730 99730 1.5
86 West Island Line - SYP Station Down Track (Volume 3), Chainage 99720 99720 1.4
87 West Island Line - SYP Station Down Track (Volume 3), Chainage 99710 99710 1.2
88 West Island Line - SYP Station Down Track (Volume 3), Chainage 99700 99700 1.1
89 West Island Line - SYP Station Down Track (Volume 3), Chainage 99690 99690 1.1
90 West Island Line - SYP Station Down Track (Volume 3), Chainage 99680 99680 1.0
91 West Island Line - SYP Station Down Track (Volume 3), Chainage 99670 99670 1.0
92 West Island Line - SYP Station Down Track (Volume 3), Chainage 99660 99660 1.2
93 West Island Line - SYP Station Down Track (Volume 3), Chainage 99650 99650 1.3
94 West Island Line - SYP Station Down Track (Volume 3), Chainage 99640 99640 1.2
95 West Island Line - SYP Station Down Track (Volume 3), Chainage 99630 99630 1.1
96 West Island Line - SYP Station Down Track (Volume 3), Chainage 99620 99620 1.1
97 West Island Line - SYP Station Down Track (Volume 3), Chainage 99610 99610 1.1
98 West Island Line - SYP Station Down Track (Volume 3), Chainage 99600 99600 1.2
99 West Island Line - SYP Station Down Track (Volume 3), Chainage 99590 99590 1.4
100 West Island Line - SYP Station Down Track (Volume 3), Chainage 99580 99580 1.7
101 West Island Line - SYP Station Down Track (Volume 3), Chainage 99570 99570 2.0
102 West Island Line - SYP Station Down Track (Volume 3), Chainage 99560 99560 2.4
103 West Island Line - SYP Station Down Track (Volume 3), Chainage 99550 99550 2.9
104 West Island Line - SYP Station Down Track (Volume 3), Chainage 99540 99540 3.3
105 West Island Line - SYP Station Down Track (Volume 3), Chainage 99530 99530 3.3
106 West Island Line - SYP Station Down Track (Volume 3), Chainage 99520 99520 3.2
107 West Island Line - SYP Station Down Track (Volume 3), Chainage 99510 99510 3.3
108 West Island Line - SYP Station Up Track (Volume 3), Chainage 99745 99745 1.4
109 West Island Line - SYP Station Up Track (Volume 3), Chainage 99737 99737 1.5
110 West Island Line - SYP Station Up Track (Volume 3), Chainage 99727 99727 1.5
111 West Island Line - SYP Station Up Track (Volume 3), Chainage 99717 99717 1.8
112 West Island Line - SYP Station Up Track (Volume 3), Chainage 99707 99707 1.7
113 West Island Line - SYP Station Up Track (Volume 3), Chainage 99697 99697 1.5
114 West Island Line - SYP Station Up Track (Volume 3), Chainage 99687 99687 1.3
115 West Island Line - SYP Station Up Track (Volume 3), Chainage 99677 99677 1.1
116 West Island Line - SYP Station Up Track (Volume 3), Chainage 99667 99667 1.0
A10-G2

*Description Chainage Actual
Explosive per
Charge (kg)
117 West Island Line - SYP Station Up Track (Volume 3), Chainage 99657 99657 1.0
118 West Island Line - SYP Station Up Track (Volume 3), Chainage 99647 99647 1.0
119 West Island Line - SYP Station Up Track (Volume 3), Chainage 99637 99637 1.1
120 West Island Line - SYP Station Up Track (Volume 3), Chainage 99627 99627 1.1
121 West Island Line - SYP Station Up Track (Volume 3), Chainage 99617 99617 1.0
122 West Island Line - SYP Station Up Track (Volume 3), Chainage 99607 99607 1.0
123 West Island Line - SYP Station Up Track (Volume 3), Chainage 99597 99597 1.0
124 West Island Line - SYP Station Up Track (Volume 3), Chainage 99587 99587 1.1
125 West Island Line - SYP Station Up Track (Volume 3), Chainage 99577 99577 1.3
126 West Island Line - SYP Station Up Track (Volume 3), Chainage 99567 99567 1.6
127 West Island Line - SYP Station Up Track (Volume 3), Chainage 99557 99557 1.9
128 West Island Line - SYP Station Up Track (Volume 3), Chainage 99547 99547 2.3
129 West Island Line - SYP Station Up Track (Volume 3), Chainage 99537 99537 2.8
130 West Island Line - SYP Station Up Track (Volume 3), Chainage 99527 99527 2.8
131 West Island Line - SYP Station Up Track (Volume 3), Chainage 99517 99517 2.7
132 West Island Line - SYP Station Up Track (Volume 3), Chainage 99507 99507 2.7
133 West Island Line - SYP Station Up Track (Volume 3), Chainage 99497 99497 2.7
134 West Island Line - SYP Adit A1-4 (Volume 4), Chainage 0 0 0.3
135 West Island Line - SYP Adit A1-4 (Volume 4), Chainage 10 10 0.3
136 West Island Line - SYP Adit A1-4 (Volume 4), Chainage 20 20 0.3
137 West Island Line - SYP Adit A1-4 (Volume 4), Chainage 30 30 0.3
138 West Island Line - SYP Adit A1-4 (Volume 4), Chainage 40 40 0.3
139 West Island Line - SYP Adit A1-4 (Volume 4), Chainage 50 50 0.5
140 West Island Line - SYP Adit A1-4 (Volume 4), Chainage 60 60 0.4
141 West Island Line - SYP Adit A1-4 (Volume 4), Chainage 70 70 0.5
142 West Island Line - SYP Adit A1-4 (Volume 4), Chainage 80 80 0.5
143 West Island Line - SYP Adit A1-4 (Volume 4), Chainage 90 90 0.5
144 West Island Line - SYP Adit A1-4 (Volume 4), Chainage 100 100 0.5
145 West Island Line - SYP Adit A1-4 (Volume 4), Chainage 110 110 0.6
146 West Island Line - SYP Adit A1-4 (Volume 4), Chainage 120 120 0.8
147 West Island Line - SYP Adit A1-4 (Volume 4), Chainage 130 130 0.7
148 West Island Line - SYP Adit A1-4 (Volume 4), Chainage 140 140 0.6
149 West Island Line - SYP Adit A1-4 (Volume 4), Chainage 150 150 0.6
150 West Island Line - SYP Adit A1-4 (Volume 4), Chainage 160 160 0.6
151 West Island Line - SYP Adit A1-4 (Volume 4), Chainage 170 170 0.7
152 West Island Line - SYP Adit A1-4 (Volume 4), Chainage 180 180 0.8
153 West Island Line - SYP Adit A1-4 (Volume 4), Chainage 190 190 1.1
154 West Island Line - SYP Adit A1-4 (Volume 4), Chainage 200 200 1.2
155 West Island Line - SYP Adit A1-4 (Volume 4), Chainage 210 210 1.2
156 West Island Line - SYP Adit A1-4 (Volume 4), Chainage 220 220 1.1
157 West Island Line - SYP Adit A1-4 (Volume 4), Chainage 230 230 1.1
158 West Island Line - SYP Adit A1-4 (Volume 4), Chainage 240 240 1.1
159 West Island Line - SYP Adit A1-4 (Volume 4), Chainage 250 250 1.1
160 West Island Line - SYP Adit A1-4 (Volume 4), Chainage 260 260 1.1
161 West Island Line - SYP Adit B1-3 (Volume 4), Chainage 0 0 1.3
162 West Island Line - SYP Adit B1-3 (Volume 4), Chainage 10 10 1.0
163 West Island Line - SYP Adit B1-3 (Volume 4), Chainage 20 20 0.9
164 West Island Line - SYP Adit B1-3 (Volume 4), Chainage 30 30 0.7
165 West Island Line - SYP Adit B1-3 (Volume 4), Chainage 40 40 0.7
166 West Island Line - SYP Adit B1-3 (Volume 4), Chainage 50 50 0.7
167 West Island Line - SYP Adit B1-3 (Volume 4), Chainage 60 60 0.7
168 West Island Line - SYP Adit B1-3 (Volume 4), Chainage 70 70 0.9
169 West Island Line - SYP Adit B1-3 (Volume 4), Chainage 80 80 1.1
170 West Island Line - SYP Adit B1-3 (Volume 4), Chainage 90 90 1.3
171 West Island Line - SYP Adit B1-3 (Volume 4), Chainage 100 100 1.3
172 West Island Line - SYP Adit B1-3 (Volume 4), Chainage 110 110 1.3
173 West Island Line - SYP Adit B1-3 (Volume 4), Chainage 120 120 1.2
174 West Island Line - SYP Adit B1-3 (Volume 4), Chainage 127 126.5 1.2
175 West Island Line - SYP Adit C1 (Volume 4), Chainage -10 -10 1.9
176 West Island Line - SYP Adit C1 (Volume 4), Chainage 0 0 2.0
177 West Island Line - SYP Adit C1 (Volume 4), Chainage 10 10 2.0
178 West Island Line - SYP Adit C1 (Volume 4), Chainage 20 20 2.0
179 West Island Line - SYP Adit C1 (Volume 4), Chainage 30 30 2.1
A10-G3

*Description Chainage Actual
Explosive per
Charge (kg)
180 West Island Line - SYP Adit C1 (Volume 4), Chainage 40 40 2.2
181 West Island Line - SYP Adit C1 (Volume 4), Chainage 50 50 2.4
182 West Island Line - SYP Adit C1 (Volume 4), Chainage 60 60 2.6
183 West Island Line - SYP Adit C1 (Volume 4), Chainage 70 70 2.2
184 West Island Line - SYP Adit C1 (Volume 4), Chainage 80 80 2.0
185 West Island Line - SYP Adit C1 (Volume 4), Chainage 90 90 1.7
186 West Island Line - SYP Adit C1 (Volume 4), Chainage 96 96 1.6
187 West Island Line - SYP Adit C2-3 (Volume 4), Chainage -10 -10 1.6
188 West Island Line - SYP Adit C2-3 (Volume 4), Chainage 0 0 1.7
189 West Island Line - SYP Adit C2-3 (Volume 4), Chainage 10 10 1.8
190 West Island Line - SYP Adit C2-3 (Volume 4), Chainage 20 20 1.9
191 West Island Line - SYP Adit C2-3 (Volume 4), Chainage 30 30 2.0
192 West Island Line - SYP Adit C2-3 (Volume 4), Chainage 40 40 2.2
193 West Island Line - SYP Adit C2-3 (Volume 4), Chainage 50 50 2.5
194 West Island Line - SYP Adit C2-3 (Volume 4), Chainage 60 60 2.9
195 West Island Line - SYP Adit C2-3 (Volume 4), Chainage 70 70 3.4
196 West Island Line - SYP Adit C2-3 (Volume 4), Chainage 80 80 3.9
197 West Island Line - SYP Adit C2-3 (Volume 4), Chainage 90 90 4.5
198 West Island Line - SYP Adit C2-3 (Volume 4), Chainage 100 100 4.7
199 West Island Line - SYP Adit C2-3 (Volume 4), Chainage 110 110 4.8
200 West Island Line - SYP Adit C2-3 (Volume 4), Chainage 120 120 4.8
201 West Island Line - SYP Adit C2-3 (Volume 4), Chainage 130 130 4.4
202 West Island Line - SYP Adit C2-3 (Volume 4), Chainage 140 140 4.1
203 West Island Line - SYP Adit C2-3 (Volume 4), Chainage 148 148 3.4
204 West Island Line - SYP Adit C4 (Volume 4), Chainage 0 0 4.1
205 West Island Line - SYP Adit C4 (Volume 4), Chainage 10 10 4.2
206 West Island Line - SYP Adit C4 (Volume 4), Chainage 20 20 3.7
207 West Island Line - SYP Adit C4 (Volume 4), Chainage 30 30 3.5
208 West Island Line - SYP Adit C4 (Volume 4), Chainage 40 40 3.2
209 West Island Line - SYP Adit C4 (Volume 4), Chainage 50 50 3.0
210 West Island Line - SYP Adit C4 (Volume 4), Chainage 55 55 3.0
211 West Island Line - SYP Station Adit C5 (Volume 4), Chainage 0 0 1.3
212 West Island Line - SYP Station Adit C5 (Volume 4), Chainage 10 10 1.5
213 West Island Line - SYP Station Adit C5 (Volume 4), Chainage 20 20 1.5
214 West Island Line - SYP Station Adit C5 (Volume 4), Chainage 30 30 1.3
215 West Island Line - SYP Station Adit C5 (Volume 4), Chainage 35 35 1.2
216 West Island Line - SYP Adit C6-7 (Volume 4), Chainage 0 0 1.6
217 West Island Line - SYP Adit C6-7 (Volume 4), Chainage 10 10 1.5
218 West Island Line - SYP Adit C6-7 (Volume 4), Chainage 20 20 1.5
219 West Island Line - SYP Adit C6-7 (Volume 4), Chainage 30 30 1.6
220 West Island Line - SYP Adit C6-7 (Volume 4), Chainage 40 40 1.6
221 West Island Line - SYP Adit C6-7 (Volume 4), Chainage 50 50 1.6
222 West Island Line - SYP Adit C6-7 (Volume 4), Chainage 60 60 1.7
223 West Island Line - SYP Adit C6-7 (Volume 4), Chainage 70 70 1.4
224 West Island Line - SYP Adit C6-7 (Volume 4), Chainage 80 80 1.3
225 West Island Line - SYP Adit C6-7 (Volume 4), Chainage 90 90 1.2
226 West Island Line - SYP Adit C6-7 (Volume 4), Chainage 100 100 1.2
227 West Island Line - SYP Adit C6-7 (Volume 4), Chainage 110 110 1.3
228 West Island Line - SYP Adit C6-7 (Volume 4), Chainage 114 114 1.2
229 West Island Line - SYP Station Adit C8-11 (Volume 4), Chainage 0 0 1.6
230 West Island Line - SYP Station Adit C8-11 (Volume 4), Chainage 10 10 1.4
231 West Island Line - SYP Station Adit C8-11 (Volume 4), Chainage 20 20 1.8
232 West Island Line - SYP Station Adit C8-11 (Volume 4), Chainage 30 30 1.5
233 West Island Line - SYP Station Adit C8-11 (Volume 4), Chainage 40 40 1.6
234 West Island Line - SYP Station Adit C8-11 (Volume 4), Chainage 50 50 1.6
235 West Island Line - SYP Station Adit C8-11 (Volume 4), Chainage 60 60 1.6
236 West Island Line - SYP Station Adit C8-11 (Volume 4), Chainage 70 70 1.7
237 West Island Line - SYP Station Adit C8-11 (Volume 4), Chainage 80 80 1.8
238 West Island Line - SYP Station Adit C8-11 (Volume 4), Chainage 90 90 1.9
239 West Island Line - SYP Station Adit C8-11 (Volume 4), Chainage 100 100 1.7
240 West Island Line - SYP Station Adit C8-11 (Volume 4), Chainage 110 110 1.6
241 West Island Line - SYP Station Adit C8-11 (Volume 4), Chainage 120 120 1.6
242 West Island Line - SYP Station Adit C8-11 (Volume 4), Chainage 130 130 1.6
A10-G4
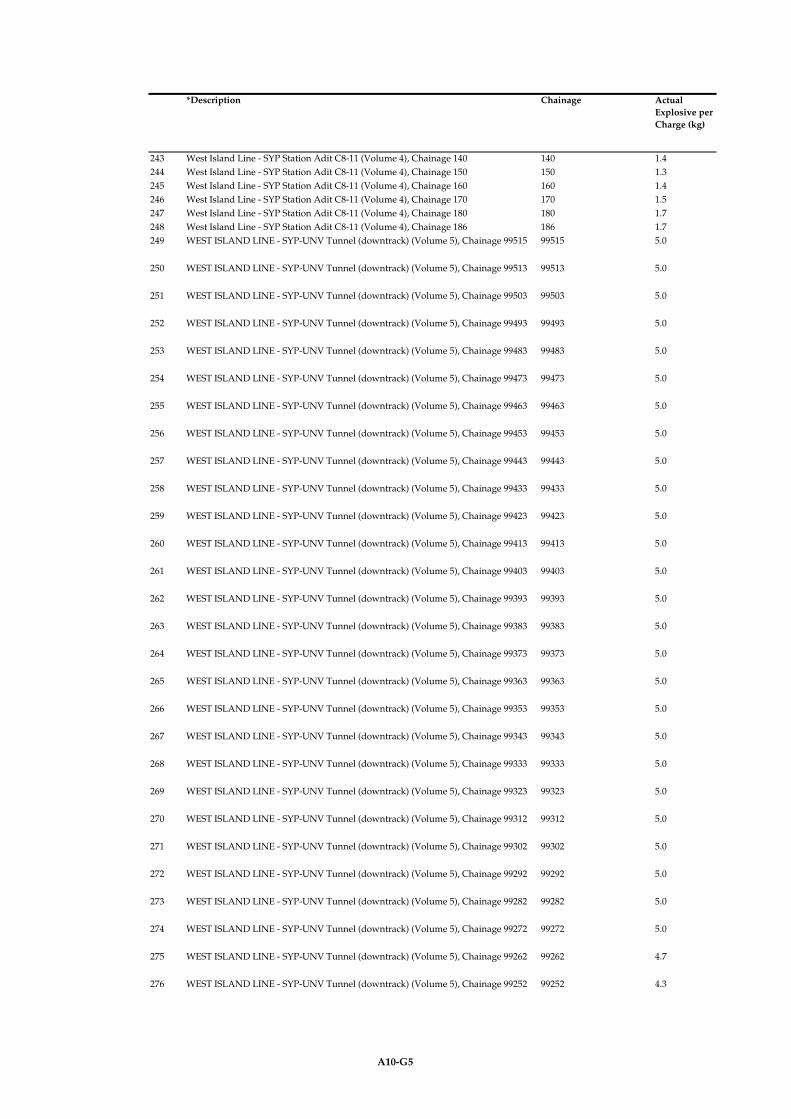
*Description Chainage Actual
Explosive per
Charge (kg)
243 West Island Line - SYP Station Adit C8-11 (Volume 4), Chainage 140 140 1.4
244 West Island Line - SYP Station Adit C8-11 (Volume 4), Chainage 150 150 1.3
245 West Island Line - SYP Station Adit C8-11 (Volume 4), Chainage 160 160 1.4
246 West Island Line - SYP Station Adit C8-11 (Volume 4), Chainage 170 170 1.5
247 West Island Line - SYP Station Adit C8-11 (Volume 4), Chainage 180 180 1.7
248 West Island Line - SYP Station Adit C8-11 (Volume 4), Chainage 186 186 1.7
249 WEST ISLAND LINE - SYP-UNV Tunnel (downtrack) (Volume 5), Chainage 99515 99515 5.0
250 WEST ISLAND LINE - SYP-UNV Tunnel (downtrack) (Volume 5), Chainage 99513 99513 5.0
251 WEST ISLAND LINE - SYP-UNV Tunnel (downtrack) (Volume 5), Chainage 99503 99503 5.0
252 WEST ISLAND LINE - SYP-UNV Tunnel (downtrack) (Volume 5), Chainage 99493 99493 5.0
253 WEST ISLAND LINE - SYP-UNV Tunnel (downtrack) (Volume 5), Chainage 99483 99483 5.0
254 WEST ISLAND LINE - SYP-UNV Tunnel (downtrack) (Volume 5), Chainage 99473 99473 5.0
255 WEST ISLAND LINE - SYP-UNV Tunnel (downtrack) (Volume 5), Chainage 99463 99463 5.0
256 WEST ISLAND LINE - SYP-UNV Tunnel (downtrack) (Volume 5), Chainage 99453 99453 5.0
257 WEST ISLAND LINE - SYP-UNV Tunnel (downtrack) (Volume 5), Chainage 99443 99443 5.0
258 WEST ISLAND LINE - SYP-UNV Tunnel (downtrack) (Volume 5), Chainage 99433 99433 5.0
259 WEST ISLAND LINE - SYP-UNV Tunnel (downtrack) (Volume 5), Chainage 99423 99423 5.0
260 WEST ISLAND LINE - SYP-UNV Tunnel (downtrack) (Volume 5), Chainage 99413 99413 5.0
261 WEST ISLAND LINE - SYP-UNV Tunnel (downtrack) (Volume 5), Chainage 99403 99403 5.0
262 WEST ISLAND LINE - SYP-UNV Tunnel (downtrack) (Volume 5), Chainage 99393 99393 5.0
263 WEST ISLAND LINE - SYP-UNV Tunnel (downtrack) (Volume 5), Chainage 99383 99383 5.0
264 WEST ISLAND LINE - SYP-UNV Tunnel (downtrack) (Volume 5), Chainage 99373 99373 5.0
265 WEST ISLAND LINE - SYP-UNV Tunnel (downtrack) (Volume 5), Chainage 99363 99363 5.0
266 WEST ISLAND LINE - SYP-UNV Tunnel (downtrack) (Volume 5), Chainage 99353 99353 5.0
267 WEST ISLAND LINE - SYP-UNV Tunnel (downtrack) (Volume 5), Chainage 99343 99343 5.0
268 WEST ISLAND LINE - SYP-UNV Tunnel (downtrack) (Volume 5), Chainage 99333 99333 5.0
269 WEST ISLAND LINE - SYP-UNV Tunnel (downtrack) (Volume 5), Chainage 99323 99323 5.0
270 WEST ISLAND LINE - SYP-UNV Tunnel (downtrack) (Volume 5), Chainage 99312 99312 5.0
271 WEST ISLAND LINE - SYP-UNV Tunnel (downtrack) (Volume 5), Chainage 99302 99302 5.0
272 WEST ISLAND LINE - SYP-UNV Tunnel (downtrack) (Volume 5), Chainage 99292 99292 5.0
273 WEST ISLAND LINE - SYP-UNV Tunnel (downtrack) (Volume 5), Chainage 99282 99282 5.0
274 WEST ISLAND LINE - SYP-UNV Tunnel (downtrack) (Volume 5), Chainage 99272 99272 5.0
275 WEST ISLAND LINE - SYP-UNV Tunnel (downtrack) (Volume 5), Chainage 99262 99262 4.7
276 WEST ISLAND LINE - SYP-UNV Tunnel (downtrack) (Volume 5), Chainage 99252 99252 4.3
A10-G5
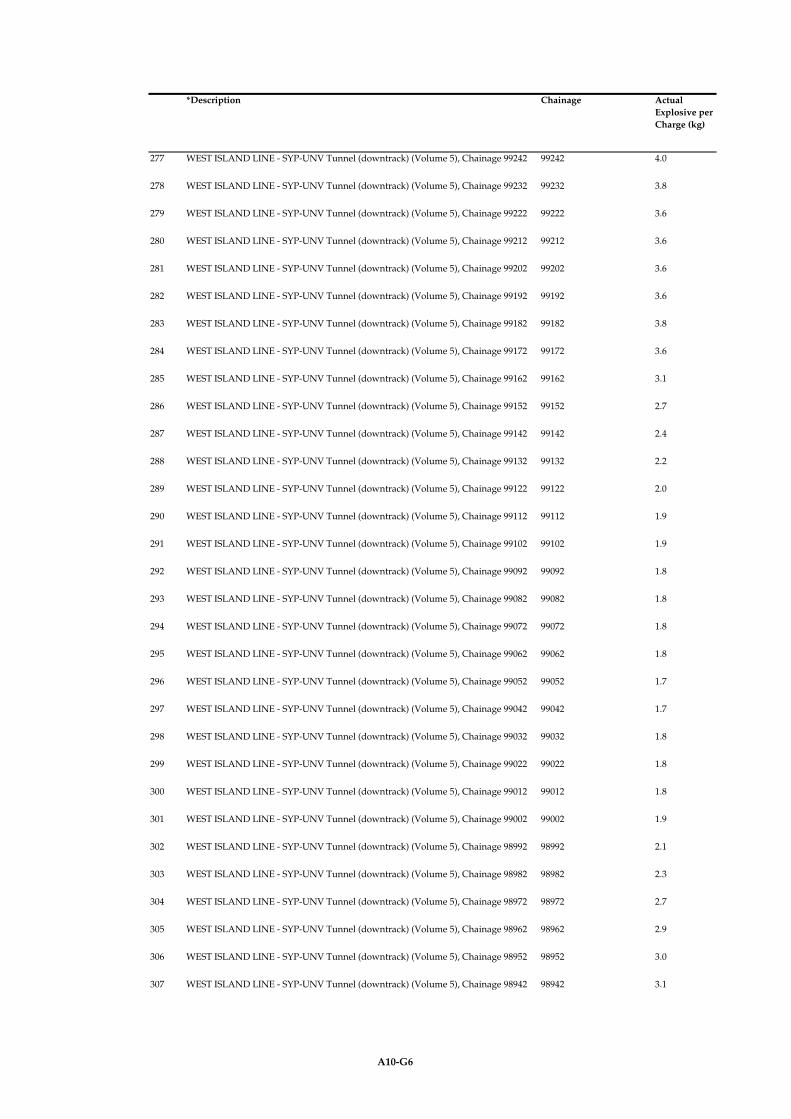
*Description Chainage Actual
Explosive per
Charge (kg)
277 WEST ISLAND LINE - SYP-UNV Tunnel (downtrack) (Volume 5), Chainage 99242 99242 4.0
278 WEST ISLAND LINE - SYP-UNV Tunnel (downtrack) (Volume 5), Chainage 99232 99232 3.8
279 WEST ISLAND LINE - SYP-UNV Tunnel (downtrack) (Volume 5), Chainage 99222 99222 3.6
280 WEST ISLAND LINE - SYP-UNV Tunnel (downtrack) (Volume 5), Chainage 99212 99212 3.6
281 WEST ISLAND LINE - SYP-UNV Tunnel (downtrack) (Volume 5), Chainage 99202 99202 3.6
282 WEST ISLAND LINE - SYP-UNV Tunnel (downtrack) (Volume 5), Chainage 99192 99192 3.6
283 WEST ISLAND LINE - SYP-UNV Tunnel (downtrack) (Volume 5), Chainage 99182 99182 3.8
284 WEST ISLAND LINE - SYP-UNV Tunnel (downtrack) (Volume 5), Chainage 99172 99172 3.6
285 WEST ISLAND LINE - SYP-UNV Tunnel (downtrack) (Volume 5), Chainage 99162 99162 3.1
286 WEST ISLAND LINE - SYP-UNV Tunnel (downtrack) (Volume 5), Chainage 99152 99152 2.7
287 WEST ISLAND LINE - SYP-UNV Tunnel (downtrack) (Volume 5), Chainage 99142 99142 2.4
288 WEST ISLAND LINE - SYP-UNV Tunnel (downtrack) (Volume 5), Chainage 99132 99132 2.2
289 WEST ISLAND LINE - SYP-UNV Tunnel (downtrack) (Volume 5), Chainage 99122 99122 2.0
290 WEST ISLAND LINE - SYP-UNV Tunnel (downtrack) (Volume 5), Chainage 99112 99112 1.9
291 WEST ISLAND LINE - SYP-UNV Tunnel (downtrack) (Volume 5), Chainage 99102 99102 1.9
292 WEST ISLAND LINE - SYP-UNV Tunnel (downtrack) (Volume 5), Chainage 99092 99092 1.8
293 WEST ISLAND LINE - SYP-UNV Tunnel (downtrack) (Volume 5), Chainage 99082 99082 1.8
294 WEST ISLAND LINE - SYP-UNV Tunnel (downtrack) (Volume 5), Chainage 99072 99072 1.8
295 WEST ISLAND LINE - SYP-UNV Tunnel (downtrack) (Volume 5), Chainage 99062 99062 1.8
296 WEST ISLAND LINE - SYP-UNV Tunnel (downtrack) (Volume 5), Chainage 99052 99052 1.7
297 WEST ISLAND LINE - SYP-UNV Tunnel (downtrack) (Volume 5), Chainage 99042 99042 1.7
298 WEST ISLAND LINE - SYP-UNV Tunnel (downtrack) (Volume 5), Chainage 99032 99032 1.8
299 WEST ISLAND LINE - SYP-UNV Tunnel (downtrack) (Volume 5), Chainage 99022 99022 1.8
300 WEST ISLAND LINE - SYP-UNV Tunnel (downtrack) (Volume 5), Chainage 99012 99012 1.8
301 WEST ISLAND LINE - SYP-UNV Tunnel (downtrack) (Volume 5), Chainage 99002 99002 1.9
302 WEST ISLAND LINE - SYP-UNV Tunnel (downtrack) (Volume 5), Chainage 98992 98992 2.1
303 WEST ISLAND LINE - SYP-UNV Tunnel (downtrack) (Volume 5), Chainage 98982 98982 2.3
304 WEST ISLAND LINE - SYP-UNV Tunnel (downtrack) (Volume 5), Chainage 98972 98972 2.7
305 WEST ISLAND LINE - SYP-UNV Tunnel (downtrack) (Volume 5), Chainage 98962 98962 2.9
306 WEST ISLAND LINE - SYP-UNV Tunnel (downtrack) (Volume 5), Chainage 98952 98952 3.0
307 WEST ISLAND LINE - SYP-UNV Tunnel (downtrack) (Volume 5), Chainage 98942 98942 3.1
A10-G6
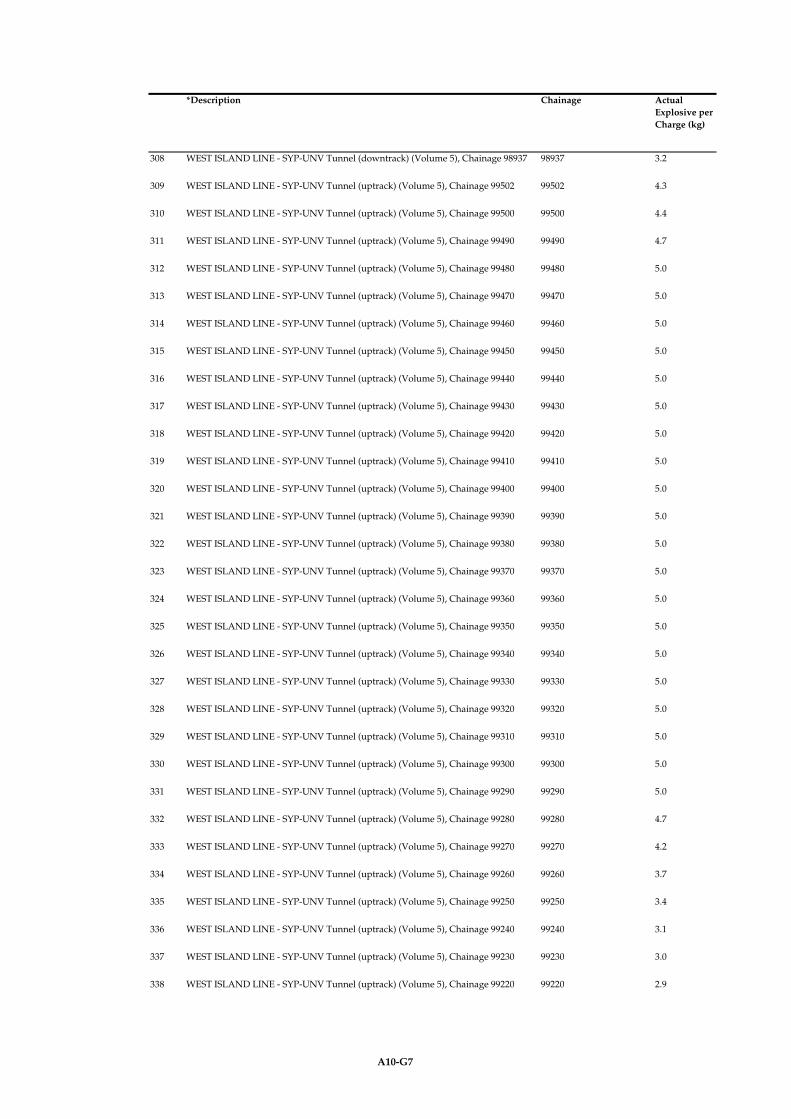
*Description Chainage Actual
Explosive per
Charge (kg)
308 WEST ISLAND LINE - SYP-UNV Tunnel (downtrack) (Volume 5), Chainage 98937 98937 3.2
309 WEST ISLAND LINE - SYP-UNV Tunnel (uptrack) (Volume 5), Chainage 99502 99502 4.3
310 WEST ISLAND LINE - SYP-UNV Tunnel (uptrack) (Volume 5), Chainage 99500 99500 4.4
311 WEST ISLAND LINE - SYP-UNV Tunnel (uptrack) (Volume 5), Chainage 99490 99490 4.7
312 WEST ISLAND LINE - SYP-UNV Tunnel (uptrack) (Volume 5), Chainage 99480 99480 5.0
313 WEST ISLAND LINE - SYP-UNV Tunnel (uptrack) (Volume 5), Chainage 99470 99470 5.0
314 WEST ISLAND LINE - SYP-UNV Tunnel (uptrack) (Volume 5), Chainage 99460 99460 5.0
315 WEST ISLAND LINE - SYP-UNV Tunnel (uptrack) (Volume 5), Chainage 99450 99450 5.0
316 WEST ISLAND LINE - SYP-UNV Tunnel (uptrack) (Volume 5), Chainage 99440 99440 5.0
317 WEST ISLAND LINE - SYP-UNV Tunnel (uptrack) (Volume 5), Chainage 99430 99430 5.0
318 WEST ISLAND LINE - SYP-UNV Tunnel (uptrack) (Volume 5), Chainage 99420 99420 5.0
319 WEST ISLAND LINE - SYP-UNV Tunnel (uptrack) (Volume 5), Chainage 99410 99410 5.0
320 WEST ISLAND LINE - SYP-UNV Tunnel (uptrack) (Volume 5), Chainage 99400 99400 5.0
321 WEST ISLAND LINE - SYP-UNV Tunnel (uptrack) (Volume 5), Chainage 99390 99390 5.0
322 WEST ISLAND LINE - SYP-UNV Tunnel (uptrack) (Volume 5), Chainage 99380 99380 5.0
323 WEST ISLAND LINE - SYP-UNV Tunnel (uptrack) (Volume 5), Chainage 99370 99370 5.0
324 WEST ISLAND LINE - SYP-UNV Tunnel (uptrack) (Volume 5), Chainage 99360 99360 5.0
325 WEST ISLAND LINE - SYP-UNV Tunnel (uptrack) (Volume 5), Chainage 99350 99350 5.0
326 WEST ISLAND LINE - SYP-UNV Tunnel (uptrack) (Volume 5), Chainage 99340 99340 5.0
327 WEST ISLAND LINE - SYP-UNV Tunnel (uptrack) (Volume 5), Chainage 99330 99330 5.0
328 WEST ISLAND LINE - SYP-UNV Tunnel (uptrack) (Volume 5), Chainage 99320 99320 5.0
329 WEST ISLAND LINE - SYP-UNV Tunnel (uptrack) (Volume 5), Chainage 99310 99310 5.0
330 WEST ISLAND LINE - SYP-UNV Tunnel (uptrack) (Volume 5), Chainage 99300 99300 5.0
331 WEST ISLAND LINE - SYP-UNV Tunnel (uptrack) (Volume 5), Chainage 99290 99290 5.0
332 WEST ISLAND LINE - SYP-UNV Tunnel (uptrack) (Volume 5), Chainage 99280 99280 4.7
333 WEST ISLAND LINE - SYP-UNV Tunnel (uptrack) (Volume 5), Chainage 99270 99270 4.2
334 WEST ISLAND LINE - SYP-UNV Tunnel (uptrack) (Volume 5), Chainage 99260 99260 3.7
335 WEST ISLAND LINE - SYP-UNV Tunnel (uptrack) (Volume 5), Chainage 99250 99250 3.4
336 WEST ISLAND LINE - SYP-UNV Tunnel (uptrack) (Volume 5), Chainage 99240 99240 3.1
337 WEST ISLAND LINE - SYP-UNV Tunnel (uptrack) (Volume 5), Chainage 99230 99230 3.0
338 WEST ISLAND LINE - SYP-UNV Tunnel (uptrack) (Volume 5), Chainage 99220 99220 2.9
A10-G7
*Description Chainage Actual
Explosive per
Charge (kg)
339 WEST ISLAND LINE - SYP-UNV Tunnel (uptrack) (Volume 5), Chainage 99210 99210 2.8
340 WEST ISLAND LINE - SYP-UNV Tunnel (uptrack) (Volume 5), Chainage 99200 99200 2.9
341 WEST ISLAND LINE - SYP-UNV Tunnel (uptrack) (Volume 5), Chainage 99190 99190 3.1
342 WEST ISLAND LINE - SYP-UNV Tunnel (uptrack) (Volume 5), Chainage 99180 99180 3.3
343 WEST ISLAND LINE - SYP-UNV Tunnel (uptrack) (Volume 5), Chainage 99170 99170 3.3
344 WEST ISLAND LINE - SYP-UNV Tunnel (uptrack) (Volume 5), Chainage 99160 99160 2.9
345 WEST ISLAND LINE - SYP-UNV Tunnel (uptrack) (Volume 5), Chainage 99150 99150 2.6
346 WEST ISLAND LINE - SYP-UNV Tunnel (uptrack) (Volume 5), Chainage 99140 99140 2.3
347 WEST ISLAND LINE - SYP-UNV Tunnel (uptrack) (Volume 5), Chainage 99130 99130 2.1
348 WEST ISLAND LINE - SYP-UNV Tunnel (uptrack) (Volume 5), Chainage 99120 99120 2.0
349 WEST ISLAND LINE - SYP-UNV Tunnel (uptrack) (Volume 5), Chainage 99110 99110 1.9
350 WEST ISLAND LINE - SYP-UNV Tunnel (uptrack) (Volume 5), Chainage 99100 99100 1.9
351 WEST ISLAND LINE - SYP-UNV Tunnel (uptrack) (Volume 5), Chainage 99090 99090 1.8
352 WEST ISLAND LINE - SYP-UNV Tunnel (uptrack) (Volume 5), Chainage 99080 99080 1.8
353 WEST ISLAND LINE - SYP-UNV Tunnel (uptrack) (Volume 5), Chainage 99070 99070 1.8
354 WEST ISLAND LINE - SYP-UNV Tunnel (uptrack) (Volume 5), Chainage 99060 99060 1.8
355 WEST ISLAND LINE - SYP-UNV Tunnel (uptrack) (Volume 5), Chainage 99050 99050 1.7
356 WEST ISLAND LINE - SYP-UNV Tunnel (uptrack) (Volume 5), Chainage 99040 99040 1.7
357 WEST ISLAND LINE - SYP-UNV Tunnel (uptrack) (Volume 5), Chainage 99030 99030 1.7
358 WEST ISLAND LINE - SYP-UNV Tunnel (uptrack) (Volume 5), Chainage 99020 99020 1.7
359 WEST ISLAND LINE - SYP-UNV Tunnel (uptrack) (Volume 5), Chainage 99010 99010 1.8
360 WEST ISLAND LINE - SYP-UNV Tunnel (uptrack) (Volume 5), Chainage 99000 99000 1.9
361 WEST ISLAND LINE - SYP-UNV Tunnel (uptrack) (Volume 5), Chainage 98990 98990 2.1
362 WEST ISLAND LINE - SYP-UNV Tunnel (uptrack) (Volume 5), Chainage 98980 98980 2.2
363 WEST ISLAND LINE - SYP-UNV Tunnel (uptrack) (Volume 5), Chainage 98970 98970 2.1
364 WEST ISLAND LINE - SYP-UNV Tunnel (uptrack) (Volume 5), Chainage 98960 98960 2.1
365 WEST ISLAND LINE - SYP-UNV Tunnel (uptrack) (Volume 5), Chainage 98950 98950 2.2
366 WEST ISLAND LINE - SYP-UNV Tunnel (uptrack) (Volume 5), Chainage 98940 98940 2.3
367 WEST ISLAND LINE - SYP-UNV Tunnel (uptrack) (Volume 5), Chainage 98938 98938 2.4
368 WEST ISLAND LINE - UNV STATION (CENTRE PORTION) (Volume 6), Chainage
98938
98938 3.0
369 WEST ISLAND LINE - UNV STATION (CENTRE PORTION) (Volume 6), Chainage
98928
98928 2.8
A10-G8

*Description Chainage Actual
Explosive per
Charge (kg)
370 WEST ISLAND LINE - UNV STATION (CENTRE PORTION) (Volume 6), Chainage
98918
98918 2.5
371 WEST ISLAND LINE - UNV STATION (CENTRE PORTION) (Volume 6), Chainage
98908
98908 2.3
372 WEST ISLAND LINE - UNV STATION (CENTRE PORTION) (Volume 6), Chainage
98898
98898 2.3
373 WEST ISLAND LINE - UNV STATION (CENTRE PORTION) (Volume 6), Chainage
98888
98888 2.6
374 WEST ISLAND LINE - UNV STATION (CENTRE PORTION) (Volume 6), Chainage
98878
98878 2.5
375 WEST ISLAND LINE - UNV STATION (CENTRE PORTION) (Volume 6), Chainage
98868
98868 2.4
376 WEST ISLAND LINE - UNV STATION (CENTRE PORTION) (Volume 6), Chainage
98858
98858 2.4
377 WEST ISLAND LINE - UNV STATION (CENTRE PORTION) (Volume 6), Chainage
98848
98848 2.5
378 WEST ISLAND LINE - UNV STATION (CENTRE PORTION) (Volume 6), Chainage
98838
98838 2.4
379 WEST ISLAND LINE - UNV STATION (CENTRE PORTION) (Volume 6), Chainage
98828
98828 2.3
380 WEST ISLAND LINE - UNV STATION (CENTRE PORTION) (Volume 6), Chainage
98818
98818 2.3
381 WEST ISLAND LINE - UNV STATION (CENTRE PORTION) (Volume 6), Chainage
98808
98808 2.4
382 WEST ISLAND LINE - UNV STATION (CENTRE PORTION) (Volume 6), Chainage
98798
98798 2.3
383 WEST ISLAND LINE - UNV STATION (CENTRE PORTION) (Volume 6), Chainage
98788
98788 2.3
384 WEST ISLAND LINE - UNV STATION (CENTRE PORTION) (Volume 6), Chainage
98778
98778 2.3
385 WEST ISLAND LINE - UNV STATION (CENTRE PORTION) (Volume 6), Chainage
98768
98768 2.4
386 WEST ISLAND LINE - UNV STATION (CENTRE PORTION) (Volume 6), Chainage
98758
98758 2.6
387 WEST ISLAND LINE - UNV STATION (CENTRE PORTION) (Volume 6), Chainage
98748
98748 2.8
388 WEST ISLAND LINE - UNV STATION (CENTRE PORTION) (Volume 6), Chainage
98738
98738 3.1
389 WEST ISLAND LINE - UNV STATION (CENTRE PORTION) (Volume 6), Chainage
98728
98728 3.5
390 WEST ISLAND LINE - UNV STATION (CENTRE PORTION) (Volume 6), Chainage
98718
98718 3.9
391 WEST ISLAND LINE - UNV STATION (CENTRE PORTION) (Volume 6), Chainage
98708
98708 4.4
392 WEST ISLAND LINE - UNV STATION (CENTRE PORTION) (Volume 6), Chainage
98698
98698 5.0
393 WEST ISLAND LINE - UNV STATION (CENTRE PORTION) (Volume 6), Chainage
98687
98687 5.0
394 V6_WEST ISLAND LINE - UNV STATION ( DOWN TRACK), Chainage 98937 98937 3.2
395 V6_WEST ISLAND LINE - UNV STATION ( DOWN TRACK), Chainage 98927 98927 2.7
396 V6_WEST ISLAND LINE - UNV STATION ( DOWN TRACK), Chainage 98917 98917 2.4
397 V6_WEST ISLAND LINE - UNV STATION ( DOWN TRACK), Chainage 98907 98907 2.2
398 V6_WEST ISLAND LINE - UNV STATION ( DOWN TRACK), Chainage 98897 98897 2.2
399 V6_WEST ISLAND LINE - UNV STATION ( DOWN TRACK), Chainage 98887 98887 2.4
400 V6_WEST ISLAND LINE - UNV STATION ( DOWN TRACK), Chainage 98877 98877 2.8
A10-G9
*Description Chainage Actual
Explosive per
Charge (kg)
401 V6_WEST ISLAND LINE - UNV STATION ( DOWN TRACK), Chainage 98867 98867 2.9
402 V6_WEST ISLAND LINE - UNV STATION ( DOWN TRACK), Chainage 98857 98857 2.8
403 V6_WEST ISLAND LINE - UNV STATION ( DOWN TRACK), Chainage 98847 98847 2.7
404 V6_WEST ISLAND LINE - UNV STATION ( DOWN TRACK), Chainage 98837 98837 2.7
405 V6_WEST ISLAND LINE - UNV STATION ( DOWN TRACK), Chainage 98827 98827 2.7
406 V6_WEST ISLAND LINE - UNV STATION ( DOWN TRACK), Chainage 98817 98817 2.7
407 V6_WEST ISLAND LINE - UNV STATION ( DOWN TRACK), Chainage 98807 98807 2.7
408 V6_WEST ISLAND LINE - UNV STATION ( DOWN TRACK), Chainage 98797 98797 2.7
409 V6_WEST ISLAND LINE - UNV STATION ( DOWN TRACK), Chainage 98787 98787 2.7
410 V6_WEST ISLAND LINE - UNV STATION ( DOWN TRACK), Chainage 98777 98777 2.7
411 V6_WEST ISLAND LINE - UNV STATION ( DOWN TRACK), Chainage 98767 98767 2.8
412 V6_WEST ISLAND LINE - UNV STATION ( DOWN TRACK), Chainage 98757 98757 3.0
413 V6_WEST ISLAND LINE - UNV STATION ( DOWN TRACK), Chainage 98747 98747 3.2
414 V6_WEST ISLAND LINE - UNV STATION ( DOWN TRACK), Chainage 98737 98737 3.5
415 V6_WEST ISLAND LINE - UNV STATION ( DOWN TRACK), Chainage 98727 98727 3.9
416 V6_WEST ISLAND LINE - UNV STATION ( DOWN TRACK), Chainage 98717 98717 4.3
417 V6_WEST ISLAND LINE - UNV STATION ( DOWN TRACK), Chainage 98707 98707 4.9
418 V6_WEST ISLAND LINE - UNV STATION ( DOWN TRACK), Chainage 98697 98697 5.0
419 V6_WEST ISLAND LINE - UNV STATION ( DOWN TRACK), Chainage 98687 98687 5.0
420 WEST ISLAND LINE - UNV STATION ( UP TRACK) (Volume 6), Chainage 98938 98938 2.6
421 WEST ISLAND LINE - UNV STATION ( UP TRACK) (Volume 6), Chainage 98928 98928 2.6
422 WEST ISLAND LINE - UNV STATION ( UP TRACK) (Volume 6), Chainage 98918 98918 2.6
423 WEST ISLAND LINE - UNV STATION ( UP TRACK) (Volume 6), Chainage 98908 98908 2.8
424 WEST ISLAND LINE - UNV STATION ( UP TRACK) (Volume 6), Chainage 98898 98898 2.9
425 WEST ISLAND LINE - UNV STATION ( UP TRACK) (Volume 6), Chainage 98888 98888 2.9
426 WEST ISLAND LINE - UNV STATION ( UP TRACK) (Volume 6), Chainage 98878 98878 2.5
427 WEST ISLAND LINE - UNV STATION ( UP TRACK) (Volume 6), Chainage 98868 98868 2.3
428 WEST ISLAND LINE - UNV STATION ( UP TRACK) (Volume 6), Chainage 98858 98858 2.4
429 WEST ISLAND LINE - UNV STATION ( UP TRACK) (Volume 6), Chainage 98848 98848 2.5
430 WEST ISLAND LINE - UNV STATION ( UP TRACK) (Volume 6), Chainage 98838 98838 2.3
431 WEST ISLAND LINE - UNV STATION ( UP TRACK) (Volume 6), Chainage 98828 98828 2.2
A10-G10

*Description Chainage Actual
Explosive per
Charge (kg)
432 WEST ISLAND LINE - UNV STATION ( UP TRACK) (Volume 6), Chainage 98818 98818 2.2
433 WEST ISLAND LINE - UNV STATION ( UP TRACK) (Volume 6), Chainage 98808 98808 2.2
434 WEST ISLAND LINE - UNV STATION ( UP TRACK) (Volume 6), Chainage 98798 98798 2.1
435 WEST ISLAND LINE - UNV STATION ( UP TRACK) (Volume 6), Chainage 98788 98788 2.0
436 WEST ISLAND LINE - UNV STATION ( UP TRACK) (Volume 6), Chainage 98778 98778 2.1
437 WEST ISLAND LINE - UNV STATION ( UP TRACK) (Volume 6), Chainage 98768 98768 2.1
438 WEST ISLAND LINE - UNV STATION ( UP TRACK) (Volume 6), Chainage 98758 98758 2.3
439 WEST ISLAND LINE - UNV STATION ( UP TRACK) (Volume 6), Chainage 98748 98748 2.5
440 WEST ISLAND LINE - UNV STATION ( UP TRACK) (Volume 6), Chainage 98738 98738 2.8
441 WEST ISLAND LINE - UNV STATION ( UP TRACK) (Volume 6), Chainage 98728 98728 3.2
442 WEST ISLAND LINE - UNV STATION ( UP TRACK) (Volume 6), Chainage 98718 98718 3.6
443 WEST ISLAND LINE - UNV STATION ( UP TRACK) (Volume 6), Chainage 98708 98708 4.2
444 WEST ISLAND LINE - UNV STATION ( UP TRACK) (Volume 6), Chainage 98698 98698 4.7
445 WEST ISLAND LINE - UNV STATION ( UP TRACK) (Volume 6), Chainage 98687 98687 5.0
446 West Island Line - SYP Station Construction Adit (Volume 7), Chainage 0 0 4.5
447 West Island Line - SYP Station Construction Adit (Volume 7), Chainage 10 10 4.3
448 West Island Line - SYP Station Construction Adit (Volume 7), Chainage 20 20 4.2
449 West Island Line - SYP Station Construction Adit (Volume 7), Chainage 30 30 4.1
450 West Island Line - SYP Station Construction Adit (Volume 7), Chainage 40 40 3.9
451 West Island Line - SYP Station Construction Adit (Volume 7), Chainage 50 50 4.0
452 West Island Line - SYP Station Construction Adit (Volume 7), Chainage 60 60 4.0
453 West Island Line - SYP Station Construction Adit (Volume 7), Chainage 70 70 4.1
454 West Island Line - SYP Station Construction Adit (Volume 7), Chainage 80 80 4.0
455 West Island Line - SYP Station Construction Adit (Volume 7), Chainage 90 90 4.1
456 West Island Line - SYP Station Construction Adit (Volume 7), Chainage 100 100 4.1
457 West Island Line - SYP Station Construction Adit (Volume 7), Chainage 110 110 3.7
458 West Island Line - SYP Station Construction Adit (Volume 7), Chainage 120 120 3.3
459 West Island Line - SYP Station Construction Adit (Volume 7), Chainage 130 130 3.0
460 West Island Line - SYP Station Construction Adit (Volume 7), Chainage 140 140 2.5
461 West Island Line - SYP Station Construction Adit (Volume 7), Chainage 150 150 2.3
462 West Island Line - SYP Station Construction Adit (Volume 7), Chainage 160 160 2.0
463 West Island Line - SYP Station Construction Adit (Volume 7), Chainage 170 170 1.7
464 West Island Line - SYP Station Construction Adit (Volume 7), Chainage 180 180 1.6
465 West Island Line - SYP Station Construction Adit (Volume 7), Chainage 190 190 1.5
466 West Island Line - SYP Station Construction Adit (Volume 7), Chainage 200 200 1.5
467 West Island Line - SYP Station Construction Adit (Volume 7), Chainage 210 210 1.4
468 West Island Line - SYP Station Construction Adit (Volume 7), Chainage 220 220 1.4
469 West Island Line - SYP Station Construction Adit (Volume 7), Chainage 230 230 1.5
470 West Island Line - SYP Station Construction Adit (Volume 7), Chainage 240 240 1.5
471 West Island Line - SYP Station Construction Adit (Volume 7), Chainage 250 250 1.3
472 West Island Line - SYP Station Construction Adit (Volume 7), Chainage 260 260 1.2
473 West Island Line - SYP Station Construction Adit (Volume 7), Chainage 270 270 1.1
474 West Island Line - SYP Station Construction Adit (Volume 7), Chainage 280 280 1.1
475 West Island Line - SYP Station Construction Adit (Volume 7), Chainage 290 290 1.1
476 West Island Line - SYP Station Construction Adit (Volume 7), Chainage 300 300 1.1
477 West Island Line - SYP Station Construction Adit (Volume 7), Chainage 310 310 1.1
478 West Island Line - SYP Station Construction Adit (Volume 7), Chainage 320 320 1.1
479 West Island Line - SYP Station Construction Adit (Volume 7), Chainage 330 330 1.1
480 West Island Line - SYP Station Construction Adit (Volume 7), Chainage 340 340 1.2
A10-G11

*Description Chainage Actual
Explosive per
Charge (kg)
481 West Island Line - SYP Station Construction Adit (Volume 7), Chainage 350 350 1.3
482 West Island Line - SYP Station Construction Adit (Volume 7), Chainage 360 360 1.4
483 West Island Line - SYP Station Construction Adit (Volume 7), Chainage 370 370 1.6
484 West Island Line - SYP Station Construction Adit (Volume 7), Chainage 380 380 1.8
485 West Island Line - SYP Station Construction Adit (Volume 7), Chainage 386 386 1.9
486 WEST ISLAND LINE - UNV TO KET TUNNEL (UP TRACK) (Volume 8), Chainage
98687
98687 5.0
487 WEST ISLAND LINE - UNV TO KET TUNNEL (UP TRACK) (Volume 8), Chainage
98678
98678 5.0
488 WEST ISLAND LINE - UNV TO KET TUNNEL (UP TRACK) (Volume 8), Chainage
98668
98668 5.0
489 WEST ISLAND LINE - UNV TO KET TUNNEL (UP TRACK) (Volume 8), Chainage
98658
98658 5.0
490 WEST ISLAND LINE - UNV TO KET TUNNEL (UP TRACK) (Volume 8), Chainage
98648
98648 4.4
491 WEST ISLAND LINE - UNV TO KET TUNNEL (UP TRACK) (Volume 8), Chainage
98638
98638 3.8
492 WEST ISLAND LINE - UNV TO KET TUNNEL (UP TRACK) (Volume 8), Chainage
98628
98628 3.4
493 WEST ISLAND LINE - UNV TO KET TUNNEL (UP TRACK) (Volume 8), Chainage
98618
98618 3.0
494 WEST ISLAND LINE - UNV TO KET TUNNEL (UP TRACK) (Volume 8), Chainage
98608
98608 2.7
495 WEST ISLAND LINE - UNV TO KET TUNNEL (UP TRACK) (Volume 8), Chainage
98598
98598 2.4
496 WEST ISLAND LINE - UNV TO KET TUNNEL (UP TRACK) (Volume 8), Chainage
98588
98588 2.3
497 WEST ISLAND LINE - UNV TO KET TUNNEL (UP TRACK) (Volume 8), Chainage
98578
98578 2.2
498 WEST ISLAND LINE - UNV TO KET TUNNEL (UP TRACK) (Volume 8), Chainage
98568
98568 2.3
499 WEST ISLAND LINE - UNV TO KET TUNNEL (UP TRACK) (Volume 8), Chainage
98558
98558 2.4
500 WEST ISLAND LINE - UNV TO KET TUNNEL (UP TRACK) (Volume 8), Chainage
98548
98548 2.5
501 WEST ISLAND LINE - UNV TO KET TUNNEL (UP TRACK) (Volume 8), Chainage
98538
98538 2.8
502 WEST ISLAND LINE - UNV TO KET TUNNEL (UP TRACK) (Volume 8), Chainage
98528
98528 2.7
503 WEST ISLAND LINE - UNV TO KET TUNNEL (UP TRACK) (Volume 8), Chainage
98518
98518 2.6
504 WEST ISLAND LINE - UNV TO KET TUNNEL (UP TRACK) (Volume 8), Chainage
98508
98508 2.6
505 WEST ISLAND LINE - UNV TO KET TUNNEL (UP TRACK) (Volume 8), Chainage
98498
98498 2.4
506 WEST ISLAND LINE - UNV TO KET TUNNEL (UP TRACK) (Volume 8), Chainage
98488
98488 2.0
507 WEST ISLAND LINE - UNV TO KET TUNNEL (UP TRACK) (Volume 8), Chainage
98478
98478 1.6
508 WEST ISLAND LINE - UNV TO KET TUNNEL (UP TRACK) (Volume 8), Chainage
98468
98468 1.3
509 WEST ISLAND LINE - UNV TO KET TUNNEL (UP TRACK) (Volume 8), Chainage
98458
98458 1.1
510 WEST ISLAND LINE - UNV TO KET TUNNEL (UP TRACK) (Volume 8), Chainage
98448
98448 0.9
511 WEST ISLAND LINE - UNV TO KET TUNNEL (UP TRACK) (Volume 8), Chainage
98438
98438 0.8
512 WEST ISLAND LINE - UNV TO KET TUNNEL (UP TRACK) (Volume 8), Chainage
98428
98428 0.8
513 WEST ISLAND LINE - UNV TO KET TUNNEL (UP TRACK) (Volume 8), Chainage
98418
98418 0.8
514 WEST ISLAND LINE - UNV TO KET TUNNEL (UP TRACK) (Volume 8), Chainage
98408
98408 0.8
A10-G12

*Description Chainage Actual
Explosive per
Charge (kg)
515 WEST ISLAND LINE - UNV TO KET TUNNEL (UP TRACK) (Volume 8), Chainage
98398
98398 1.0
516 WEST ISLAND LINE - UNV TO KET TUNNEL (UP TRACK) (Volume 8), Chainage
98388
98388 1.1
517 WEST ISLAND LINE - UNV TO KET TUNNEL (UP TRACK) (Volume 8), Chainage
98378
98378 1.4
518 WEST ISLAND LINE - UNV TO KET TUNNEL (UP TRACK) (Volume 8), Chainage
98368
98368 1.7
519 WEST ISLAND LINE - UNV TO KET TUNNEL (UP TRACK) (Volume 8), Chainage
98358
98358 1.7
520 WEST ISLAND LINE - UNV TO KET TUNNEL (UP TRACK) (Volume 8), Chainage
98348
98348 1.8
521 WEST ISLAND LINE - UNV TO KET TUNNEL (UP TRACK) (Volume 8), Chainage
98338
98338 1.9
522 WEST ISLAND LINE - UNV TO KET TUNNEL (UP TRACK) (Volume 8), Chainage
98328
98328 2.1
523 WEST ISLAND LINE - UNV TO KET TUNNEL (UP TRACK) (Volume 8), Chainage
98318
98318 2.4
524 WEST ISLAND LINE - UNV TO KET TUNNEL (UP TRACK) (Volume 8), Chainage
98308
98308 2.7
525 WEST ISLAND LINE - UNV TO KET TUNNEL (UP TRACK) (Volume 8), Chainage
98298
98298 2.7
526 WEST ISLAND LINE - UNV TO KET TUNNEL (UP TRACK) (Volume 8), Chainage
98288
98288 2.5
527 WEST ISLAND LINE - UNV TO KET TUNNEL (UP TRACK) (Volume 8), Chainage
98278
98278 2.3
528 WEST ISLAND LINE - UNV TO KET TUNNEL (UP TRACK) (Volume 8), Chainage
98268
98268 2.2
529 WEST ISLAND LINE - UNV TO KET TUNNEL (UP TRACK) (Volume 8), Chainage
98258
98258 2.2
530 WEST ISLAND LINE - UNV TO KET TUNNEL (UP TRACK) (Volume 8), Chainage
98248
98248 2.0
531 WEST ISLAND LINE - UNV TO KET TUNNEL (UP TRACK) (Volume 8), Chainage
98238
98238 1.9
532 WEST ISLAND LINE - UNV TO KET TUNNEL (UP TRACK) (Volume 8), Chainage
98228
98228 1.8
533 WEST ISLAND LINE - UNV TO KET TUNNEL (UP TRACK) (Volume 8), Chainage
98218
98218 1.8
534 WEST ISLAND LINE - UNV TO KET TUNNEL (UP TRACK) (Volume 8), Chainage
98208
98208 1.8
535 WEST ISLAND LINE - UNV TO KET TUNNEL (UP TRACK) (Volume 8), Chainage
98198
98198 2.0
536 WEST ISLAND LINE - UNV TO KET TUNNEL (UP TRACK) (Volume 8), Chainage
98188
98188 2.2
537 WEST ISLAND LINE - UNV TO KET TUNNEL (UP TRACK) (Volume 8), Chainage
98177
98177 2.5
538 WEST ISLAND LINE - UNV TO KET TUNNEL (UP TRACK) (Volume 8), Chainage
98168
98168 2.9
539 WEST ISLAND LINE - UNV TO KET TUNNEL (UP TRACK) (Volume 8), Chainage
98158
98158 3.3
540 WEST ISLAND LINE - UNV TO KET TUNNEL (UP TRACK) (Volume 8), Chainage
98148
98148 3.9
541 WEST ISLAND LINE - UNV TO KET TUNNEL (UP TRACK) (Volume 8), Chainage
98138
98138 4.4
542 WEST ISLAND LINE - UNV TO KET TUNNEL (UP TRACK) (Volume 8), Chainage
98128
98128 4.3
543 WEST ISLAND LINE - UNV TO KET TUNNEL (UP TRACK) (Volume 8), Chainage
98126
98126 4.3
544 WEST ISLAND LINE - UNV TO KET TUNNEL (DOWN TRACK) (Volume 8),
Chainage 98687
98687 5.0
545 WEST ISLAND LINE - UNV TO KET TUNNEL (DOWN TRACK) (Volume 8),
Chainage 98678
98678 5.0
A10-G13

*Description Chainage Actual
Explosive per
Charge (kg)
546 WEST ISLAND LINE - UNV TO KET TUNNEL (DOWN TRACK) (Volume 8),
Chainage 98667
98667 5.0
547 WEST ISLAND LINE - UNV TO KET TUNNEL (DOWN TRACK) (Volume 8),
Chainage 98657
98657 5.0
548 WEST ISLAND LINE - UNV TO KET TUNNEL (DOWN TRACK) (Volume 8),
Chainage 98647
98647 4.8
549 WEST ISLAND LINE - UNV TO KET TUNNEL (DOWN TRACK) (Volume 8),
Chainage 98637
98637 4.3
550 WEST ISLAND LINE - UNV TO KET TUNNEL (DOWN TRACK) (Volume 8),
Chainage 98627
98627 3.9
551 WEST ISLAND LINE - UNV TO KET TUNNEL (DOWN TRACK) (Volume 8),
Chainage 98617
98617 3.5
552 WEST ISLAND LINE - UNV TO KET TUNNEL (DOWN TRACK) (Volume 8),
Chainage 98607
98607 3.3
553 WEST ISLAND LINE - UNV TO KET TUNNEL (DOWN TRACK) (Volume 8),
Chainage 98597
98597 3.1
554 WEST ISLAND LINE - UNV TO KET TUNNEL (DOWN TRACK) (Volume 8),
Chainage 98587
98587 3.0
555 WEST ISLAND LINE - UNV TO KET TUNNEL (DOWN TRACK) (Volume 8),
Chainage 98577
98577 3.0
556 WEST ISLAND LINE - UNV TO KET TUNNEL (DOWN TRACK) (Volume 8),
Chainage 98567
98567 3.0
557 WEST ISLAND LINE - UNV TO KET TUNNEL (DOWN TRACK) (Volume 8),
Chainage 98557
98557 3.2
558 WEST ISLAND LINE - UNV TO KET TUNNEL (DOWN TRACK) (Volume 8),
Chainage 98547
98547 3.1
559 WEST ISLAND LINE - UNV TO KET TUNNEL (DOWN TRACK) (Volume 8),
Chainage 98537
98537 2.9
560 WEST ISLAND LINE - UNV TO KET TUNNEL (DOWN TRACK) (Volume 8),
Chainage 98527
98527 2.7
561 WEST ISLAND LINE - UNV TO KET TUNNEL (DOWN TRACK) (Volume 8),
Chainage 98517
98517 2.6
562 WEST ISLAND LINE - UNV TO KET TUNNEL (DOWN TRACK) (Volume 8),
Chainage 98507
98507 2.5
563 WEST ISLAND LINE - UNV TO KET TUNNEL (DOWN TRACK) (Volume 8),
Chainage 98497
98497 2.0
564 WEST ISLAND LINE - UNV TO KET TUNNEL (DOWN TRACK) (Volume 8),
Chainage 98487
98487 1.6
565 WEST ISLAND LINE - UNV TO KET TUNNEL (DOWN TRACK) (Volume 8),
Chainage 98477
98477 1.4
566 WEST ISLAND LINE - UNV TO KET TUNNEL (DOWN TRACK) (Volume 8),
Chainage 98467
98467 1.1
567 WEST ISLAND LINE - UNV TO KET TUNNEL (DOWN TRACK) (Volume 8),
Chainage 98457
98457 1.0
568 WEST ISLAND LINE - UNV TO KET TUNNEL (DOWN TRACK) (Volume 8),
Chainage 98447
98447 0.9
569 WEST ISLAND LINE - UNV TO KET TUNNEL (DOWN TRACK) (Volume 8),
Chainage 98437
98437 0.9
570 WEST ISLAND LINE - UNV TO KET TUNNEL (DOWN TRACK) (Volume 8),
Chainage 98427
98427 0.9
571 WEST ISLAND LINE - UNV TO KET TUNNEL (DOWN TRACK) (Volume 8),
Chainage 98417
98417 0.9
572 WEST ISLAND LINE - UNV TO KET TUNNEL (DOWN TRACK) (Volume 8),
Chainage 98407
98407 1.1
573 WEST ISLAND LINE - UNV TO KET TUNNEL (DOWN TRACK) (Volume 8),
Chainage 98397
98397 1.3
574 WEST ISLAND LINE - UNV TO KET TUNNEL (DOWN TRACK) (Volume 8),
Chainage 98387
98387 1.5
575 WEST ISLAND LINE - UNV TO KET TUNNEL (DOWN TRACK) (Volume 8),
Chainage 98377
98377 1.9
576 WEST ISLAND LINE - UNV TO KET TUNNEL (DOWN TRACK) (Volume 8),
Chainage 98367
98367 2.3
A10-G14

*Description Chainage Actual
Explosive per
Charge (kg)
577 WEST ISLAND LINE - UNV TO KET TUNNEL (DOWN TRACK) (Volume 8),
Chainage 98357
98357 2.8
578 WEST ISLAND LINE - UNV TO KET TUNNEL (DOWN TRACK) (Volume 8),
Chainage 98347
98347 3.1
579 WEST ISLAND LINE - UNV TO KET TUNNEL (DOWN TRACK) (Volume 8),
Chainage 98337
98337 3.3
580 WEST ISLAND LINE - UNV TO KET TUNNEL (DOWN TRACK) (Volume 8),
Chainage 98327
98327 3.5
581 WEST ISLAND LINE - UNV TO KET TUNNEL (DOWN TRACK) (Volume 8),
Chainage 98317
98317 3.8
582 WEST ISLAND LINE - UNV TO KET TUNNEL (DOWN TRACK) (Volume 8),
Chainage 98307
98307 3.2
583 WEST ISLAND LINE - UNV TO KET TUNNEL (DOWN TRACK) (Volume 8),
Chainage 98297
98297 2.7
584 WEST ISLAND LINE - UNV TO KET TUNNEL (DOWN TRACK) (Volume 8),
Chainage 98287
98287 2.6
585 WEST ISLAND LINE - UNV TO KET TUNNEL (DOWN TRACK) (Volume 8),
Chainage 98277
98277 2.4
586 WEST ISLAND LINE - UNV TO KET TUNNEL (DOWN TRACK) (Volume 8),
Chainage 98267
98267 2.1
587 WEST ISLAND LINE - UNV TO KET TUNNEL (DOWN TRACK) (Volume 8),
Chainage 98257
98257 1.9
588 WEST ISLAND LINE - UNV TO KET TUNNEL (DOWN TRACK) (Volume 8),
Chainage 98247
98247 1.7
589 WEST ISLAND LINE - UNV TO KET TUNNEL (DOWN TRACK) (Volume 8),
Chainage 98237
98237 1.6
590 WEST ISLAND LINE - UNV TO KET TUNNEL (DOWN TRACK) (Volume 8),
Chainage 98227
98227 1.6
591 WEST ISLAND LINE - UNV TO KET TUNNEL (DOWN TRACK) (Volume 8),
Chainage 98217
98217 1.6
592 WEST ISLAND LINE - UNV TO KET TUNNEL (DOWN TRACK) (Volume 8),
Chainage 98207
98207 1.8
593 WEST ISLAND LINE - UNV TO KET TUNNEL (DOWN TRACK) (Volume 8),
Chainage 98197
98197 2.0
594 WEST ISLAND LINE - UNV TO KET TUNNEL (DOWN TRACK) (Volume 8),
Chainage 98187
98187 2.2
595 WEST ISLAND LINE - UNV TO KET TUNNEL (DOWN TRACK) (Volume 8),
Chainage 98177
98177 2.6
596 WEST ISLAND LINE - UNV TO KET TUNNEL (DOWN TRACK) (Volume 8),
Chainage 98167
98167 3.0
597 WEST ISLAND LINE - UNV TO KET TUNNEL (DOWN TRACK) (Volume 8),
Chainage 98157
98157 3.5
598 WEST ISLAND LINE - UNV TO KET TUNNEL (DOWN TRACK) (Volume 8),
Chainage 98147
98147 4.1
599 WEST ISLAND LINE - UNV TO KET TUNNEL (DOWN TRACK) (Volume 8),
Chainage 98137
98137 3.9
600 WEST ISLAND LINE - UNV TO KET TUNNEL (DOWN TRACK) (Volume 8),
Chainage 98131
98131 3.9
601 WEST ISLAND LINE - UNV ADITS - Shaft VS-Z4, Chainage 0 0 4.3
602 WEST ISLAND LINE - UNV ADITS - Shaft VS-Z4, Chainage 10 10 4.9
603 WEST ISLAND LINE - UNV ADITS - Shaft VS-Z4, Chainage 20 20 5.0
604 WEST ISLAND LINE - UNV ADITS - Shaft VS-Z4, Chainage 30 30 5.0
605 WEST ISLAND LINE - UNV ADITS - Shaft VS-Z4, Chainage 40 40 4.9
606 WEST ISLAND LINE - UNV ADITS - Shaft VS-Z4, Chainage 50 50 4.3
607 WEST ISLAND LINE - UNV ADITS - Shaft VS-Z4, Chainage 60 60 3.7
608 WEST ISLAND LINE - UNV ADITS - Shaft VS-Z4, Chainage 70 70 3.3
609 WEST ISLAND LINE - UNV ADITS - Shaft VS-Z4, Chainage 80 80 2.8
610 WEST ISLAND LINE - UNV ADITS - Shaft VS-Z4, Chainage 90 90 2.5
611 WEST ISLAND LINE - UNV ADITS - Shaft VS-Z4, Chainage 100 100 2.2
612 WEST ISLAND LINE - UNV ADITS - Shaft VS-Z4, Chainage 110 110 2.0
613 WEST ISLAND LINE - UNV ADITS - Shaft VS-Z4, Chainage 120 120 1.8
614 WEST ISLAND LINE - UNV ADITS - Shaft VS-Z4, Chainage 130 130 1.8
615 WEST ISLAND LINE - UNV ADITS - Shaft VS-Z4, Chainage 140 140 1.8
A10-G15

*Description Chainage Actual
Explosive per
Charge (kg)
616 WEST ISLAND LINE - UNV ADITS - Shaft VS-Z4, Chainage 150 150 1.8
617 WEST ISLAND LINE - UNV ADITS - Shaft VS-Z4, Chainage Shaft VS-Z4 (40mPD) Shaft VS-Z4 (40mPD) 0.2
618 WEST ISLAND LINE - UNV ADITS - Shaft VS-Z4, Chainage Shaft VS-Z4 (40mPD) Shaft VS-Z4 (40mPD) 0.3
619 WEST ISLAND LINE - UNV ADITS - Shaft VS-Z4, Chainage Shaft VS-Z4 (40mPD) Shaft VS-Z4 (40mPD) 0.4
620 WEST ISLAND LINE - UNV ADITS - Shaft VS-Z4, Chainage Shaft VS-Z4 (40mPD) Shaft VS-Z4 (40mPD) 0.2
621 WEST ISLAND LINE - UNV ADITS - Shaft VS-Z4, Chainage Shaft VS-Z4 (30mPD) Shaft VS-Z4 (30mPD) 0.3
622 WEST ISLAND LINE - UNV ADITS - Shaft VS-Z4, Chainage Shaft VS-Z4 (30mPD) Shaft VS-Z4 (30mPD) 0.5
623 WEST ISLAND LINE - UNV ADITS - Shaft VS-Z4, Chainage Shaft VS-Z4 (30mPD) Shaft VS-Z4 (30mPD) 0.5
624 WEST ISLAND LINE - UNV ADITS - Shaft VS-Z4, Chainage Shaft VS-Z4 (30mPD) Shaft VS-Z4 (30mPD) 0.3
625 WEST ISLAND LINE - UNV ADITS - Shaft VS-Z4, Chainage Shaft VS-Z4 (20mPD) Shaft VS-Z4 (20mPD) 0.4
626 WEST ISLAND LINE - UNV ADITS - Shaft VS-Z4, Chainage Shaft VS-Z4 (20mPD) Shaft VS-Z4 (20mPD) 0.6
627 WEST ISLAND LINE - UNV ADITS - Shaft VS-Z4, Chainage Shaft VS-Z4 (20mPD) Shaft VS-Z4 (20mPD) 0.6
628 WEST ISLAND LINE - UNV ADITS - Shaft VS-Z4, Chainage Shaft VS-Z4 (20mPD) Shaft VS-Z4 (20mPD) 0.4
629 WEST ISLAND LINE - UNV ADITS - Shaft VS-Z4, Chainage Shaft VS-Z4 (10mPD) Shaft VS-Z4 (10mPD) 0.5
630 WEST ISLAND LINE - UNV ADITS - Shaft VS-Z4, Chainage Shaft VS-Z4 (10mPD) Shaft VS-Z4 (10mPD) 0.9
631 WEST ISLAND LINE - UNV ADITS - Shaft VS-Z4, Chainage Shaft VS-Z4 (10mPD) Shaft VS-Z4 (10mPD) 0.8
632 WEST ISLAND LINE - UNV ADITS - Shaft VS-Z4, Chainage Shaft VS-Z4 (10mPD) Shaft VS-Z4 (10mPD) 0.6
633 WEST ISLAND LINE - UNV ADITS - Shaft VS-Z4, Chainage Shaft VS-Z4 (0mPD) Shaft VS-Z4 (0mPD) 0.7
634 WEST ISLAND LINE - UNV ADITS - Shaft VS-Z4, Chainage Shaft VS-Z4 (0mPD) Shaft VS-Z4 (0mPD) 1.1
635 WEST ISLAND LINE - UNV ADITS - Shaft VS-Z4, Chainage Shaft VS-Z4 (0mPD) Shaft VS-Z4 (0mPD) 1.1
636 WEST ISLAND LINE - UNV ADITS - Shaft VS-Z4, Chainage Shaft VS-Z4 (0mPD) Shaft VS-Z4 (0mPD) 0.9
A10-G16
*Description Chainage Actual
Explosive per
Charge (kg)
637 WEST ISLAND LINE - UNV ADITS - Shaft VS-Z4, Chainage Shaft VS-Z4 (-11mPD) Shaft VS-Z4 (-11mPD) 1.3
638 WEST ISLAND LINE - UNV ADITS - Shaft VS-Z4, Chainage Shaft VS-Z4 (-11mPD) Shaft VS-Z4 (-11mPD) 1.5
639 WEST ISLAND LINE - UNV ADITS - Shaft VS-Z4, Chainage Shaft VS-Z4 (-11mPD) Shaft VS-Z4 (-11mPD) 1.5
640 WEST ISLAND LINE - UNV ADITS - Shaft VS-Z4, Chainage Shaft VS-Z4 (-11mPD) Shaft VS-Z4 (-11mPD) 1.3
641 WEST ISLAND LINE - UNV ADITS - Shaft VS-Z4, Chainage 160 160 2.0
642 WEST ISLAND LINE - UNV ADITS - Shaft VS-Z4, Chainage 170 170 2.2
643 WEST ISLAND LINE - UNV ADITS - Shaft VS-Z4, Chainage 180 180 2.4
644 WEST ISLAND LINE - UNV ADITS - Shaft VS-Z4, Chainage 190 190 2.5
645 WEST ISLAND LINE - UNV ADITS - Shaft VS-Z4, Chainage 200 200 2.7
646 WEST ISLAND LINE - UNV ADITS - Shaft VS-Z4, Chainage 210 210 3.1
647 WEST ISLAND LINE - UNV ADITS - Shaft VS-Z4, Chainage 220 220 3.2
648 WEST ISLAND LINE - UNV ADITS - Shaft VS-Z4, Chainage 230 230 2.9
649 WEST ISLAND LINE - UNV ADITS - Shaft VS-Z4, Chainage 240 240 2.6
650 WEST ISLAND LINE - UNV ADITS - Shaft VS-Z4, Chainage 250 250 2.3
651 WEST ISLAND LINE - UNV ADITS - Shaft VS-Z4, Chainage 260 260 2.1
652 WEST ISLAND LINE - UNV ADITS - Shaft VS-Z4, Chainage 270 270 2.0
653 WEST ISLAND LINE - UNV ADITS - Shaft VS-Z4, Chainage 280 280 2.0
654 WEST ISLAND LINE - UNV ADITS - Shaft VS-Z4, Chainage 290 290 2.0
655 WEST ISLAND LINE - UNV ADITS - Shaft VS-Z4, Chainage 299 299.04 2.1
656 WEST ISLAND LINE - UNV ADITS - Access Shaft of KET Praya (Volume 7),
Chainage 0
0 4.1
657 WEST ISLAND LINE - UNV ADITS - Access Shaft of KET Praya (Volume 7),
Chainage 10
10 3.4
658 WEST ISLAND LINE - UNV ADITS - Access Shaft of KET Praya (Volume 7),
Chainage 20
20 3.0
659 WEST ISLAND LINE - UNV ADITS - Access Shaft of KET Praya (Volume 7),
Chainage 30
30 2.9
660 WEST ISLAND LINE - UNV ADITS - Access Shaft of KET Praya (Volume 7),
Chainage 40
40 3.2
661 WEST ISLAND LINE - UNV ADITS - Access Shaft of KET Praya (Volume 7),
Chainage 50
50 3.8
662 WEST ISLAND LINE - UNV ADITS - Access Shaft of KET Praya (Volume 7),
Chainage 60
60 4.7
663 WEST ISLAND LINE - UNV ADITS - Access Shaft of KET Praya (Volume 7),
Chainage 70
70 4.7
664 WEST ISLAND LINE - UNV ADITS - Access Shaft of KET Praya (Volume 7),
Chainage 80
80 4.5
665 WEST ISLAND LINE - UNV ADITS - Access Shaft of KET Praya (Volume 7),
Chainage 90
90 3.9
666 WEST ISLAND LINE - UNV ADITS - Access Shaft of KET Praya (Volume 7),
Chainage 100
100 2.8
667 WEST ISLAND LINE - UNV ADITS - Access Shaft of KET Praya (Volume 7),
Chainage 110
110 2.0
668 WEST ISLAND LINE - UNV ADITS - Access Shaft of KET Praya (Volume 7),
Chainage 120
120 1.5
669 WEST ISLAND LINE - UNV ADITS - Access Shaft of KET Praya (Volume 7),
Chainage 130
130 1.4
670 WEST ISLAND LINE - UNV ADITS - Access Shaft of KET Praya (Volume 7),
Chainage 140
140 1.6
671 WEST ISLAND LINE - UNV ADITS - Access Shaft of KET Praya (Volume 7),
Chainage 150
150 2.0
672 WEST ISLAND LINE - UNV ADITS - Access Shaft of KET Praya (Volume 7),
Chainage 160
160 2.7
673 WEST ISLAND LINE - UNV ADITS - Access Shaft of KET Praya (Volume 7),
Chainage 170
170 3.1
A10-G17

*Description Chainage Actual
Explosive per
Charge (kg)
674 WEST ISLAND LINE - UNV ADITS - Access Shaft of KET Praya (Volume 7),
Chainage 180
180 2.3
675 WEST ISLAND LINE - UNV ADITS - Access Shaft of KET Praya (Volume 7),
Chainage 190
190 1.9
676 WEST ISLAND LINE - UNV ADITS - Access Shaft of KET Praya (Volume 7),
Chainage 200
200 1.6
677 WEST ISLAND LINE - UNV ADITS - Access Shaft of KET Praya (Volume 7),
Chainage 210
210 1.4
678 WEST ISLAND LINE - UNV ADITS - Access Shaft of KET Praya (Volume 7),
Chainage 220
220 1.2
679 WEST ISLAND LINE - UNV ADITS - Access Shaft of KET Praya (Volume 7),
Chainage 230
230 1.2
680 WEST ISLAND LINE - UNV ADITS - Access Shaft of KET Praya (Volume 7),
Chainage 240
240 1.4
681 WEST ISLAND LINE - UNV ADITS - Access Shaft of KET Praya (Volume 7),
Chainage 250
250 1.8
682 WEST ISLAND LINE - UNV ADITS - Access Shaft of KET Praya (Volume 7),
Chainage 260
260 2.5
683 WEST ISLAND LINE - UNV ADITS - Access Shaft of KET Praya (Volume 7),
Chainage 270
270 3.1
684 WEST ISLAND LINE - UNV ADITS - Access Shaft of KET Praya (Volume 7),
Chainage 280
280 3.2
685 WEST ISLAND LINE - UNV ADITS - Access Shaft of KET Praya (Volume 7),
Chainage 290
290 3.4
686 WEST ISLAND LINE - UNV ADITS - Access Shaft of KET Praya (Volume 7),
Chainage 300
300 3.7
687 WEST ISLAND LINE - UNV ADITS - Access Shaft of KET Praya (Volume 7),
Chainage 310
310 4.0
688 WEST ISLAND LINE - UNV ADITS - Access Shaft of KET Praya (Volume 7),
Chainage 320
320 4.4
689 WEST ISLAND LINE - UNV ADITS - Access Shaft of KET Praya (Volume 7),
Chainage 330
330 4.9
690 WEST ISLAND LINE - UNV ADITS - Access Shaft of KET Praya (Volume 7),
Chainage 340
340 5.0
691 WEST ISLAND LINE - UNV ADITS - Access Shaft of KET Praya (Volume 7),
Chainage 350
350 5.0
692 WEST ISLAND LINE - UNV ADITS - Access Shaft of KET Praya (Volume 7),
Chainage 351
351.08 5.0
693 WEST ISLAND LINE - UNV CONSTRUCTION ADIT (Volume 7), Chainage 0 0 1.1
694 WEST ISLAND LINE - UNV CONSTRUCTION ADIT (Volume 7), Chainage 10 10 1.8
695 WEST ISLAND LINE - UNV CONSTRUCTION ADIT (Volume 7), Chainage 20 20 1.9
696 WEST ISLAND LINE - UNV CONSTRUCTION ADIT (Volume 7), Chainage 30 30 1.6
697 WEST ISLAND LINE - UNV CONSTRUCTION ADIT (Volume 7), Chainage 40 40 1.2
698 WEST ISLAND LINE - UNV CONSTRUCTION ADIT (Volume 7), Chainage 50 50 0.9
699 WEST ISLAND LINE - UNV CONSTRUCTION ADIT (Volume 7), Chainage 60 60 0.6
700 WEST ISLAND LINE - UNV CONSTRUCTION ADIT (Volume 7), Chainage 70 70 0.5
701 WEST ISLAND LINE - UNV CONSTRUCTION ADIT (Volume 7), Chainage 80 80 0.4
702 WEST ISLAND LINE - UNV CONSTRUCTION ADIT (Volume 7), Chainage 90 90 0.4
703 WEST ISLAND LINE - UNV CONSTRUCTION ADIT (Volume 7), Chainage 100 100 0.4
704 WEST ISLAND LINE - UNV CONSTRUCTION ADIT (Volume 7), Chainage 110 110 0.6
705 WEST ISLAND LINE - UNV CONSTRUCTION ADIT (Volume 7), Chainage 120 120 0.8
A10-G18

*Description Chainage Actual
Explosive per
Charge (kg)
706 WEST ISLAND LINE - UNV CONSTRUCTION ADIT (Volume 7), Chainage 130 130 1.1
707 WEST ISLAND LINE - UNV CONSTRUCTION ADIT (Volume 7), Chainage 140 140 1.5
708 WEST ISLAND LINE - UNV CONSTRUCTION ADIT (Volume 7), Chainage 150 150 1.9
709 WEST ISLAND LINE - UNV CONSTRUCTION ADIT (Volume 7), Chainage 160 160 2.4
710 WEST ISLAND LINE - UNV CONSTRUCTION ADIT (Volume 7), Chainage 170 170 2.9
711 WEST ISLAND LINE - UNV CONSTRUCTION ADIT (Volume 7), Chainage 180 180 3.0
712 WEST ISLAND LINE - UNV CONSTRUCTION ADIT (Volume 7), Chainage 186 185.57 2.9
713 WEST ISLAND LINE - UNV ADITS - ENTRANCE A (Volume 7), Chainage Shaft A
(40mPD)
Shaft A (40mPD) 0.7
714 WEST ISLAND LINE - UNV ADITS - ENTRANCE A (Volume 7), Chainage Shaft A
(40mPD)
Shaft A (40mPD) 0.5
715 WEST ISLAND LINE - UNV ADITS - ENTRANCE A (Volume 7), Chainage Shaft A
(40mPD)
Shaft A (40mPD) 0.5
716 WEST ISLAND LINE - UNV ADITS - ENTRANCE A (Volume 7), Chainage Shaft A
(40mPD)
Shaft A (40mPD) 1.5
717 WEST ISLAND LINE - UNV ADITS - ENTRANCE A (Volume 7), Chainage Shaft A
(30mPD)
Shaft A (30mPD) 1.0
718 WEST ISLAND LINE - UNV ADITS - ENTRANCE A (Volume 7), Chainage Shaft A
(30mPD)
Shaft A (30mPD) 0.9
719 WEST ISLAND LINE - UNV ADITS - ENTRANCE A (Volume 7), Chainage Shaft A
(30mPD)
Shaft A (30mPD) 1.2
720 WEST ISLAND LINE - UNV ADITS - ENTRANCE A (Volume 7), Chainage Shaft A
(30mPD)
Shaft A (30mPD) 1.8
721 WEST ISLAND LINE - UNV ADITS - ENTRANCE A (Volume 7), Chainage Shaft A
(20mPD)
Shaft A (20mPD) 1.3
722 WEST ISLAND LINE - UNV ADITS - ENTRANCE A (Volume 7), Chainage Shaft A
(20mPD)
Shaft A (20mPD) 1.5
723 WEST ISLAND LINE - UNV ADITS - ENTRANCE A (Volume 7), Chainage Shaft A
(20mPD)
Shaft A (20mPD) 2.1
724 WEST ISLAND LINE - UNV ADITS - ENTRANCE A (Volume 7), Chainage Shaft A
(20mPD)
Shaft A (20mPD) 2.1
725 WEST ISLAND LINE - UNV ADITS - ENTRANCE A (Volume 7), Chainage Shaft A
(10mPD)
Shaft A (10mPD) 1.8
726 WEST ISLAND LINE - UNV ADITS - ENTRANCE A (Volume 7), Chainage Shaft A
(10mPD)
Shaft A (10mPD) 2.3
727 WEST ISLAND LINE - UNV ADITS - ENTRANCE A (Volume 7), Chainage Shaft A
(10mPD)
Shaft A (10mPD) 2.9
728 WEST ISLAND LINE - UNV ADITS - ENTRANCE A (Volume 7), Chainage Shaft A
(10mPD)
Shaft A (10mPD) 2.6
729 WEST ISLAND LINE - UNV ADITS - ENTRANCE A (Volume 7), Chainage Shaft A (-
1mPD)
Shaft A (-1mPD) 2.4
730 WEST ISLAND LINE - UNV ADITS - ENTRANCE A (Volume 7), Chainage Shaft A (-
1mPD)
Shaft A (-1mPD) 2.7
731 WEST ISLAND LINE - UNV ADITS - ENTRANCE A (Volume 7), Chainage Shaft A (-
1mPD)
Shaft A (-1mPD) 3.6
732 WEST ISLAND LINE - UNV ADITS - ENTRANCE A (Volume 7), Chainage Shaft A (-
1mPD)
Shaft A (-1mPD) 3.3
733 WEST ISLAND LINE - UNV ADITS - ENTRANCE A (Volume 7), Chainage 0 0 2.8
734 WEST ISLAND LINE - UNV ADITS - ENTRANCE A (Volume 7), Chainage 10 10 2.8
735 WEST ISLAND LINE - UNV ADITS - ENTRANCE A (Volume 7), Chainage 20 20 2.6
736 WEST ISLAND LINE - UNV ADITS - ENTRANCE A (Volume 7), Chainage 30 30 2.3
737 WEST ISLAND LINE - UNV ADITS - ENTRANCE A (Volume 7), Chainage 40 40 2.1
738 WEST ISLAND LINE - UNV ADITS - ENTRANCE A (Volume 7), Chainage 50 50 2.0
739 WEST ISLAND LINE - UNV ADITS - ENTRANCE A (Volume 7), Chainage 60 60 1.9
740 WEST ISLAND LINE - UNV ADITS - ENTRANCE A (Volume 7), Chainage 70 70 2.0
741 WEST ISLAND LINE - UNV ADITS - ENTRANCE A (Volume 7), Chainage 80 80 2.3
A10-G19

*Description Chainage Actual
Explosive per
Charge (kg)
742 WEST ISLAND LINE - UNV ADITS - ENTRANCE A (Volume 7), Chainage 90 90 2.7
743 WEST ISLAND LINE - UNV ADITS - ENTRANCE A (Volume 7), Chainage 100 100 3.1
744 WEST ISLAND LINE - UNV ADITS - ENTRANCE A (Volume 7), Chainage 107 106.68 3.0
745 WEST ISLAND LINE - UNV ADITS - ENTRANCE B1 (Volume 7), Chainage 0 0 0.2
746 WEST ISLAND LINE - UNV ADITS - ENTRANCE B1 (Volume 7), Chainage 3 3 0.2
747 WEST ISLAND LINE - UNV ADITS - ENTRANCE B1 (Volume 7), Chainage 13 13 0.2
748 WEST ISLAND LINE - UNV ADITS - ENTRANCE B1 (Volume 7), Chainage 23 23 0.1
749 WEST ISLAND LINE - UNV ADITS - ENTRANCE B1 (Volume 7), Chainage 33 33 0.1
750 WEST ISLAND LINE - UNV ADITS - ENTRANCE B1 (Volume 7), Chainage 43 43 0.3
751 WEST ISLAND LINE - UNV ADITS - ENTRANCE B1 (Volume 7), Chainage 53 53 0.4
752 WEST ISLAND LINE - UNV ADITS - ENTRANCE B1 (Volume 7), Chainage 63 63 0.3
753 WEST ISLAND LINE - UNV ADITS - ENTRANCE B1 (Volume 7), Chainage 73 73 0.4
754 WEST ISLAND LINE - UNV ADITS - ENTRANCE B1 (Volume 7), Chainage 83 83 0.5
755 WEST ISLAND LINE - UNV ADITS - ENTRANCE B1 (Volume 7), Chainage 93 93 0.6
756 WEST ISLAND LINE - UNV ADITS - ENTRANCE B1 (Volume 7), Chainage 103 103 0.9
757 WEST ISLAND LINE - UNV ADITS - ENTRANCE B1 (Volume 7), Chainage 113 113 1.2
758 WEST ISLAND LINE - UNV ADITS - ENTRANCE B1 (Volume 7), Chainage 123 123 1.5
759 WEST ISLAND LINE - UNV ADITS - ENTRANCE B1 (Volume 7), Chainage 133 133 2.0
760 WEST ISLAND LINE - UNV ADITS - ENTRANCE B1 (Volume 7), Chainage 142 141.82 2.1
761 WEST ISLAND LINE - UNV ADITS - ENTRANCE B2 (Volume 7), Chainage 0 0 1.0
762 WEST ISLAND LINE - UNV ADITS - ENTRANCE B2 (Volume 7), Chainage 10 10 1.5
763 WEST ISLAND LINE - UNV ADITS - ENTRANCE B2 (Volume 7), Chainage 20 20 1.6
764 WEST ISLAND LINE - UNV ADITS - ENTRANCE B2 (Volume 7), Chainage 30 30 1.9
765 WEST ISLAND LINE - UNV ADITS - ENTRANCE B2 (Volume 7), Chainage 40 40 1.6
766 WEST ISLAND LINE - UNV ADITS - ENTRANCE B2 (Volume 7), Chainage 50 50 1.4
767 WEST ISLAND LINE - UNV ADITS - ENTRANCE B2 (Volume 7), Chainage 60 60 1.4
768 WEST ISLAND LINE - UNV ADITS - ENTRANCE B2 (Volume 7), Chainage 70 70 1.5
769 WEST ISLAND LINE - UNV ADITS - ENTRANCE B2 (Volume 7), Chainage 80 80 1.8
770 WEST ISLAND LINE - UNV ADITS - ENTRANCE B2 (Volume 7), Chainage 90 90 1.9
771 WEST ISLAND LINE - UNV ADITS - ENTRANCE B2 (Volume 7), Chainage 100 100 1.9
772 WEST ISLAND LINE - UNV ADITS - ENTRANCE B2 (Volume 7), Chainage 110 110 2.1
773 WEST ISLAND LINE - UNV ADITS - ENTRANCE B2 (Volume 7), Chainage 120 120 2.6
774 WEST ISLAND LINE - UNV ADITS - ENTRANCE B2 (Volume 7), Chainage 130 130 2.4
A10-G20
*Description Chainage Actual
Explosive per
Charge (kg)
775 WEST ISLAND LINE - UNV ADITS - ENTRANCE B2 (Volume 7), Chainage 140 140 2.2
776 WEST ISLAND LINE - UNV ADITS - ENTRANCE B2 (Volume 7), Chainage 145 144.91 2.3
777 WEST ISLAND LINE - UNV ADITS - ENTRANCE C1 & SHAFT (Volume 7),
Chainage C1-1 (40mPD)
C1-1 (40mPD) 1.1
778 WEST ISLAND LINE - UNV ADITS - ENTRANCE C1 & SHAFT (Volume 7),
Chainage C1-2 (40mPD)
C1-2 (40mPD) 0.6
779 WEST ISLAND LINE - UNV ADITS - ENTRANCE C1 & SHAFT (Volume 7),
Chainage C1-3 (40mPD)
C1-3 (40mPD) 1.3
780 WEST ISLAND LINE - UNV ADITS - ENTRANCE C1 & SHAFT (Volume 7),
Chainage C1-41 (40mPD)
C1-41 (40mPD) 0.8
781 WEST ISLAND LINE - UNV ADITS - ENTRANCE C1 & SHAFT (Volume 7),
Chainage C1-5 (40mPD)
C1-5 (40mPD) 1.5
782 WEST ISLAND LINE - UNV ADITS - ENTRANCE C1 & SHAFT (Volume 7),
Chainage C1-6 (40mPD)
C1-6 (40mPD) 1.1
783 WEST ISLAND LINE - UNV ADITS - ENTRANCE C1 & SHAFT (Volume 7),
Chainage C1-7 (40mPD)
C1-7 (40mPD) 1.4
784 WEST ISLAND LINE - UNV ADITS - ENTRANCE C1 & SHAFT (Volume 7),
Chainage C1-8 (40mPD)
C1-8 (40mPD) 1.3
785 WEST ISLAND LINE - UNV ADITS - ENTRANCE C1 & SHAFT (Volume 7),
Chainage C1-1 (30mPD)
C1-1 (30mPD) 1.2
786 WEST ISLAND LINE - UNV ADITS - ENTRANCE C1 & SHAFT (Volume 7),
Chainage C1-2 (30mPD)
C1-2 (30mPD) 0.7
787 WEST ISLAND LINE - UNV ADITS - ENTRANCE C1 & SHAFT (Volume 7),
Chainage C1-3 (30mPD)
C1-3 (30mPD) 1.3
788 WEST ISLAND LINE - UNV ADITS - ENTRANCE C1 & SHAFT (Volume 7),
Chainage C1-41 (30mPD)
C1-41 (30mPD) 0.9
789 WEST ISLAND LINE - UNV ADITS - ENTRANCE C1 & SHAFT (Volume 7),
Chainage C1-5 (30mPD)
C1-5 (30mPD) 1.6
790 WEST ISLAND LINE - UNV ADITS - ENTRANCE C1 & SHAFT (Volume 7),
Chainage C1-6 (30mPD)
C1-6 (30mPD) 1.2
791 WEST ISLAND LINE - UNV ADITS - ENTRANCE C1 & SHAFT (Volume 7),
Chainage C1-7 (30mPD)
C1-7 (30mPD) 1.6
792 WEST ISLAND LINE - UNV ADITS - ENTRANCE C1 & SHAFT (Volume 7),
Chainage C1-8 (30mPD)
C1-8 (30mPD) 1.3
793 WEST ISLAND LINE - UNV ADITS - ENTRANCE C1 & SHAFT (Volume 7),
Chainage C1-1 (20mPD)
C1-1 (20mPD) 0.8
794 WEST ISLAND LINE - UNV ADITS - ENTRANCE C1 & SHAFT (Volume 7),
Chainage C1-2 (20mPD)
C1-2 (20mPD) 0.9
795 WEST ISLAND LINE - UNV ADITS - ENTRANCE C1 & SHAFT (Volume 7),
Chainage C1-3 (20mPD)
C1-3 (20mPD) 1.5
796 WEST ISLAND LINE - UNV ADITS - ENTRANCE C1 & SHAFT (Volume 7),
Chainage C1-41 (20mPD)
C1-41 (20mPD) 1.0
797 WEST ISLAND LINE - UNV ADITS - ENTRANCE C1 & SHAFT (Volume 7),
Chainage C1-5 (20mPD)
C1-5 (20mPD) 1.8
798 WEST ISLAND LINE - UNV ADITS - ENTRANCE C1 & SHAFT (Volume 7),
Chainage C1-6 (20mPD)
C1-6 (20mPD) 1.3
799 WEST ISLAND LINE - UNV ADITS - ENTRANCE C1 & SHAFT (Volume 7),
Chainage C1-7 (20mPD)
C1-7 (20mPD) 1.7
800 WEST ISLAND LINE - UNV ADITS - ENTRANCE C1 & SHAFT (Volume 7),
Chainage C1-8 (20mPD)
C1-8 (20mPD) 1.5
801 WEST ISLAND LINE - UNV ADITS - ENTRANCE C1 & SHAFT (Volume 7),
Chainage C1-1 (10mPD)
C1-1 (10mPD) 0.7
802 WEST ISLAND LINE - UNV ADITS - ENTRANCE C1 & SHAFT (Volume 7),
Chainage C1-2 (10mPD)
C1-2 (10mPD) 0.8
803 WEST ISLAND LINE - UNV ADITS - ENTRANCE C1 & SHAFT (Volume 7),
Chainage C1-3 (10mPD)
C1-3 (10mPD) 1.7
804 WEST ISLAND LINE - UNV ADITS - ENTRANCE C1 & SHAFT (Volume 7),
Chainage C1-41 (10mPD)
C1-41 (10mPD) 1.2
805 WEST ISLAND LINE - UNV ADITS - ENTRANCE C1 & SHAFT (Volume 7),
Chainage C1-5 (10mPD)
C1-5 (10mPD) 2.0
A10-G21

*Description Chainage Actual
Explosive per
Charge (kg)
806 WEST ISLAND LINE - UNV ADITS - ENTRANCE C1 & SHAFT (Volume 7),
Chainage C1-6 (10mPD)
C1-6 (10mPD) 1.5
807 WEST ISLAND LINE - UNV ADITS - ENTRANCE C1 & SHAFT (Volume 7),
Chainage C1-7 (10mPD)
C1-7 (10mPD) 1.9
808 WEST ISLAND LINE - UNV ADITS - ENTRANCE C1 & SHAFT (Volume 7),
Chainage C1-8 (10mPD)
C1-8 (10mPD) 1.7
809 WEST ISLAND LINE - UNV ADITS - ENTRANCE C1 & SHAFT (Volume 7),
Chainage C1-1 (0mPD)
C1-1 (0mPD) 0.9
810 WEST ISLAND LINE - UNV ADITS - ENTRANCE C1 & SHAFT (Volume 7),
Chainage C1-2 (0mPD)
C1-2 (0mPD) 1.0
811 WEST ISLAND LINE - UNV ADITS - ENTRANCE C1 & SHAFT (Volume 7),
Chainage C1-3 (0mPD)
C1-3 (0mPD) 2.0
812 WEST ISLAND LINE - UNV ADITS - ENTRANCE C1 & SHAFT (Volume 7),
Chainage C1-41 (0mPD)
C1-41 (0mPD) 1.5
813 WEST ISLAND LINE - UNV ADITS - ENTRANCE C1 & SHAFT (Volume 7),
Chainage C1-5 (0mPD)
C1-5 (0mPD) 2.3
814 WEST ISLAND LINE - UNV ADITS - ENTRANCE C1 & SHAFT (Volume 7),
Chainage C1-6 (0mPD)
C1-6 (0mPD) 1.8
815 WEST ISLAND LINE - UNV ADITS - ENTRANCE C1 & SHAFT (Volume 7),
Chainage C1-7 (0mPD)
C1-7 (0mPD) 2.2
816 WEST ISLAND LINE - UNV ADITS - ENTRANCE C1 & SHAFT (Volume 7),
Chainage C1-8 (0mPD)
C1-8 (0mPD) 2.0
817 WEST ISLAND LINE - UNV ADITS - ENTRANCE C1 & SHAFT (Volume 7),
Chainage C1-1 (-3mPD)
C1-1 (-3mPD) 1.0
818 WEST ISLAND LINE - UNV ADITS - ENTRANCE C1 & SHAFT (Volume 7),
Chainage C1-2 (-3mPD)
C1-2 (-3mPD) 1.1
819 WEST ISLAND LINE - UNV ADITS - ENTRANCE C1 & SHAFT (Volume 7),
Chainage C1-3 (-3mPD)
C1-3 (-3mPD) 2.1
820 WEST ISLAND LINE - UNV ADITS - ENTRANCE C1 & SHAFT (Volume 7),
Chainage C1-4 (-3mPD)
C1-4 (-3mPD) 1.6
821 WEST ISLAND LINE - UNV ADITS - ENTRANCE C1 & SHAFT (Volume 7),
Chainage C1-5 (-3mPD)
C1-5 (-3mPD) 2.4
822 WEST ISLAND LINE - UNV ADITS - ENTRANCE C1 & SHAFT (Volume 7),
Chainage C1-6 (-3mPD)
C1-6 (-3mPD) 1.9
823 WEST ISLAND LINE - UNV ADITS - ENTRANCE C1 & SHAFT (Volume 7),
Chainage C1-7 (-3mPD)
C1-7 (-3mPD) 2.3
824 WEST ISLAND LINE - UNV ADITS - ENTRANCE C1 & SHAFT (Volume 7),
Chainage C1-8 (-3mPD)
C1-8 (-3mPD) 2.1
825 WEST ISLAND LINE - UNV ADITS - ENTRANCE C2 (Volume 7), Chainage 0 0 0.1
826 WEST ISLAND LINE - UNV ADITS - ENTRANCE C2 (Volume 7), Chainage 10 10 0.3
827 WEST ISLAND LINE - UNV ADITS - ENTRANCE C2 (Volume 7), Chainage 20 20 0.8
828 WEST ISLAND LINE - UNV ADITS - ENTRANCE C2 (Volume 7), Chainage 30 30 1.5
829 WEST ISLAND LINE - UNV ADITS - ENTRANCE C2 (Volume 7), Chainage 40 40 2.5
830 WEST ISLAND LINE - UNV ADITS - ENTRANCE C2 (Volume 7), Chainage 50 50 2.8
831 WEST ISLAND LINE - UNV ADITS - ENTRANCE C2 (Volume 7), Chainage 60 60 2.2
832 WEST ISLAND LINE - UNV ADITS - ENTRANCE C2 (Volume 7), Chainage 70 70 1.7
833 WEST ISLAND LINE - UNV ADITS - ENTRANCE C2 (Volume 7), Chainage 80 80 0.9
834 WEST ISLAND LINE - UNV ADITS - ENTRANCE C2 (Volume 7), Chainage 90 90 0.5
835 WEST ISLAND LINE - UNV ADITS - ENTRANCE C2 (Volume 7), Chainage 100 100 0.3
836 WEST ISLAND LINE - UNV ADITS - ENTRANCE C2 (Volume 7), Chainage 110 110 0.5
837 WEST ISLAND LINE - UNV ADITS - ENTRANCE C2 (Volume 7), Chainage 120 120 1.0
A10-G22
*Description Chainage Actual
Explosive per
Charge (kg)
838 WEST ISLAND LINE - UNV ADITS - ENTRANCE C2 (Volume 7), Chainage 130 130 1.8
839 WEST ISLAND LINE - UNV ADITS - ENTRANCE C2 (Volume 7), Chainage 140 140 2.9
840 WEST ISLAND LINE - UNV ADITS - ENTRANCE C2 (Volume 7), Chainage 150 150 3.5
841 WEST ISLAND LINE - UNV ADITS - ENTRANCE C2 (Volume 7), Chainage 160 160 3.7
842 WEST ISLAND LINE - UNV ADITS - ENTRANCE C2 (Volume 7), Chainage 170 170 3.9
843 WEST ISLAND LINE - UNV ADITS - ENTRANCE C2 (Volume 7), Chainage 180 180 4.2
844 WEST ISLAND LINE - UNV ADITS - ENTRANCE C2 (Volume 7), Chainage 190 190 4.7
845 WEST ISLAND LINE - UNV ADITS - ENTRANCE C2 (Volume 7), Chainage 200 200 5.0
846 WEST ISLAND LINE - UNV ADITS - ENTRANCE C2 (Volume 7), Chainage 210 210 4.7
847 WEST ISLAND LINE - UNV ADITS - ENTRANCE C2 (Volume 7), Chainage 220 220 4.0
848 WEST ISLAND LINE - UNV ADITS - ENTRANCE C2 (Volume 7), Chainage 230 230 3.4
849 WEST ISLAND LINE - UNV ADITS - ENTRANCE C2 (Volume 7), Chainage 240 240 2.9
850 WEST ISLAND LINE - UNV ADITS - ENTRANCE C2 (Volume 7), Chainage 250 250 2.4
851 WEST ISLAND LINE - UNV ADITS - ENTRANCE C2 (Volume 7), Chainage 260 260 2.0
852 WEST ISLAND LINE - UNV ADITS - ENTRANCE C2 (Volume 7), Chainage 270 270 1.7
853 WEST ISLAND LINE - UNV ADITS - ENTRANCE C2 (Volume 7), Chainage 280 280 1.5
854 WEST ISLAND LINE - UNV ADITS - ENTRANCE C2 (Volume 7), Chainage 290 290 1.3
855 WEST ISLAND LINE - UNV ADITS - ENTRANCE C2 (Volume 7), Chainage 300 300 1.1
856 WEST ISLAND LINE - UNV ADITS - ENTRANCE C2 (Volume 7), Chainage 310 310 1.3
857 WEST ISLAND LINE - UNV ADITS - ENTRANCE C2 (Volume 7), Chainage 320 320 1.6
858 WEST ISLAND LINE - UNV ADITS - ENTRANCE C2 (Volume 7), Chainage 328 328.37 1.9
859 WEST ISLAND LINE - KET station and adits (1), Chainage 97219 97219.22 0.3
860 WEST ISLAND LINE - KET station and adits (1), Chainage 97221 97221.22 0.3
861 WEST ISLAND LINE - KET station and adits (1), Chainage 97223 97223.22 0.3
862 WEST ISLAND LINE - KET station and adits (1), Chainage 97225 97225.22 0.3
863 WEST ISLAND LINE - KET station and adits (1), Chainage 97227 97227.22 0.3
864 WEST ISLAND LINE - KET station and adits (1), Chainage 97229 97229.22 0.3
865 WEST ISLAND LINE - KET station and adits (1), Chainage 97231 97231.22 0.3
866 WEST ISLAND LINE - KET station and adits (1), Chainage 97233 97233.22 0.3
867 WEST ISLAND LINE - KET station and adits (1), Chainage 97235 97235.22 0.3
868 WEST ISLAND LINE - KET station and adits (1), Chainage 97237 97237.22 0.2
869 WEST ISLAND LINE - KET station and adits (1), Chainage 97239 97239.22 0.2
870 WEST ISLAND LINE - KET station and adits (1), Chainage 97241 97241.22 0.2
871 WEST ISLAND LINE - KET station and adits (1), Chainage 97243 97243.22 0.2
872 WEST ISLAND LINE - KET station and adits (1), Chainage 97245 97245.22 0.2
873 WEST ISLAND LINE - KET station and adits (1), Chainage 97247 97247.22 0.2
874 WEST ISLAND LINE - KET station and adits (1), Chainage 97249 97249.22 0.2
875 WEST ISLAND LINE - KET station and adits (1), Chainage 97251 97251.22 0.2
876 WEST ISLAND LINE - KET station and adits (1), Chainage 97253 97253.22 0.2
877 WEST ISLAND LINE - KET station and adits (1), Chainage 97255 97255.22 0.2
878 WEST ISLAND LINE - KET station and adits (1), Chainage 97257 97257.22 0.2
879 WEST ISLAND LINE - KET station and adits (1), Chainage 97259 97259.22 0.2
A10-G23

*Description Chainage Actual
Explosive per
Charge (kg)
880 WEST ISLAND LINE - KET station and adits (1), Chainage 97261 97261.22 0.2
881 WEST ISLAND LINE - KET station and adits (1), Chainage 97263 97263.22 0.2
882 WEST ISLAND LINE - KET station and adits (1), Chainage 97265 97265.22 0.2
883 WEST ISLAND LINE - KET station and adits (1), Chainage 97267 97267.22 0.2
884 WEST ISLAND LINE - KET station and adits (1), Chainage 97269 97269.22 0.2
885 WEST ISLAND LINE - KET station and adits (1), Chainage 97271 97271.22 0.2
886 WEST ISLAND LINE - KET station and adits (1), Chainage 97273 97273.22 0.3
887 WEST ISLAND LINE - KET station and adits (1), Chainage 97275 97275.22 0.3
888 WEST ISLAND LINE - KET station and adits (1), Chainage 97277 97277.22 0.3
889 WEST ISLAND LINE - KET station and adits (1), Chainage 97279 97279.22 0.3
890 WEST ISLAND LINE - KET station and adits (1), Chainage 97281 97281.22 0.3
891 WEST ISLAND LINE - KET station and adits (1), Chainage 97283 97283.22 0.3
892 WEST ISLAND LINE - KET station and adits (1), Chainage 97285 97285.22 0.3
893 WEST ISLAND LINE - KET station and adits (1), Chainage 97287 97287.22 0.3
894 WEST ISLAND LINE - KET station and adits (1), Chainage 97289 97289.22 0.3
895 WEST ISLAND LINE - KET station and adits (1), Chainage 97291 97291.22 0.3
896 WEST ISLAND LINE - KET station and adits (1), Chainage 97293 97293.22 0.4
897 WEST ISLAND LINE - KET station and adits (1), Chainage 97295 97295.22 0.4
898 WEST ISLAND LINE - KET station and adits (1), Chainage 97297 97297.22 0.4
899 WEST ISLAND LINE - KET station and adits (1), Chainage 97299 97299.22 0.4
900 WEST ISLAND LINE - KET station and adits (1), Chainage 97301 97301.22 0.4
901 WEST ISLAND LINE - KET station and adits (1), Chainage 97303 97303.22 0.4
902 WEST ISLAND LINE - KET station and adits (1), Chainage 97305 97305.22 0.4
903 WEST ISLAND LINE - KET station and adits (1), Chainage 97307 97307.22 0.4
904 WEST ISLAND LINE - KET station and adits (1), Chainage 97309 97309.22 0.4
905 WEST ISLAND LINE - KET station and adits (1), Chainage 97311 97311.22 0.4
906 WEST ISLAND LINE - KET station and adits (1), Chainage 97313 97313.22 0.4
907 WEST ISLAND LINE - KET station and adits (1), Chainage 97315 97315.22 0.4
908 WEST ISLAND LINE - KET station and adits (1), Chainage 97317 97317.22 0.4
909 WEST ISLAND LINE - KET station and adits (1), Chainage 97319 97319.22 0.4
910 WEST ISLAND LINE - KET station and adits (1), Chainage 97321 97321.22 0.5
911 WEST ISLAND LINE - KET station and adits (1), Chainage 97323 97323.22 0.5
912 WEST ISLAND LINE - KET station and adits (1), Chainage 97325 97325.22 0.5
913 WEST ISLAND LINE - KET station and adits (1), Chainage 97327 97327.22 0.5
914 WEST ISLAND LINE - KET station and adits (1), Chainage 97329 97329.22 0.5
915 WEST ISLAND LINE - KET station and adits (1), Chainage 97331 97331.22 0.5
916 WEST ISLAND LINE - KET station and adits (1), Chainage 97333 97333.22 0.5
917 WEST ISLAND LINE - KET station and adits (1), Chainage 97335 97335.22 0.5
918 WEST ISLAND LINE - KET station and adits (1), Chainage 97337 97337.22 0.6
919 WEST ISLAND LINE - KET station and adits (1), Chainage 97339 97339.22 0.6
920 WEST ISLAND LINE - KET station and adits (1), Chainage 97341 97341.22 0.6
921 WEST ISLAND LINE - KET station and adits (1), Chainage 97343 97343.22 0.5
922 WEST ISLAND LINE - KET station and adits (1), Chainage 97345 97345.22 0.5
923 WEST ISLAND LINE - KET station and adits (1), Chainage 97347 97347.22 0.5
924 WEST ISLAND LINE - KET station and adits (1), Chainage 97349 97349.22 0.4
925 WEST ISLAND LINE - KET station and adits (1), Chainage 97351 97351.22 0.4
926 WEST ISLAND LINE - KET station and adits (1), Chainage 97353 97353.22 0.4
927 WEST ISLAND LINE - KET station and adits (1), Chainage 97355 97355.22 0.4
928 WEST ISLAND LINE - KET station and adits (1), Chainage 97357 97357.22 0.4
929 WEST ISLAND LINE - KET station and adits (1), Chainage 97359 97359.22 0.4
930 WEST ISLAND LINE - KET station and adits (1), Chainage 97361 97361.22 0.4
931 WEST ISLAND LINE - KET station and adits (1), Chainage 97363 97363.22 0.4
932 WEST ISLAND LINE - KET station and adits (1), Chainage 97365 97365.22 0.3
933 WEST ISLAND LINE - KET station and adits (1), Chainage 97367 97367.22 0.3
934 WEST ISLAND LINE - KET station and adits (1), Chainage 97369 97369.22 0.4
935 WEST ISLAND LINE - KET station and adits (1), Chainage 97371 97371.22 0.4
936 WEST ISLAND LINE - KET station and adits (1), Chainage 97373 97373.22 0.4
937 WEST ISLAND LINE - KET station and adits (1), Chainage 97375 97375.22 0.4
938 WEST ISLAND LINE - KET station and adits (1), Chainage 97377 97377.22 0.4
939 WEST ISLAND LINE - KET station and adits (1), Chainage 97379 97379.22 0.4
940 WEST ISLAND LINE - KET station and adits (1), Chainage 97381 97381.22 0.4
941 WEST ISLAND LINE - KET station and adits (1), Chainage 97383 97383.22 0.4
942 WEST ISLAND LINE - KET station and adits (1), Chainage 97385 97385.22 0.5
A10-G24

*Description Chainage Actual
Explosive per
Charge (kg)
943 WEST ISLAND LINE - KET station and adits (1), Chainage 97387 97387.22 0.5
944 WEST ISLAND LINE - KET station and adits (1), Chainage 97389 97389.22 0.5
945 WEST ISLAND LINE - KET station and adits (1), Chainage 97391 97391.22 0.5
946 WEST ISLAND LINE - KET station and adits (1), Chainage 97393 97393.22 0.6
947 WEST ISLAND LINE - KET station and adits (1), Chainage 97395 97395.22 0.6
948 WEST ISLAND LINE - KET station and adits (1), Chainage 97397 97397.22 0.6
949 WEST ISLAND LINE - KET station and adits (1), Chainage 97399 97399.22 0.7
950 WEST ISLAND LINE - KET station and adits (1), Chainage 97401 97401.22 0.7
951 WEST ISLAND LINE - KET station and adits (1), Chainage 97403 97403.22 0.7
952 WEST ISLAND LINE - KET station and adits (1), Chainage 97405 97405.22 0.8
953 WEST ISLAND LINE - KET station and adits (1), Chainage 97407 97407.22 0.8
954 WEST ISLAND LINE - KET station and adits (1), Chainage 97409 97409.22 0.8
955 WEST ISLAND LINE - KET station and adits (1), Chainage 97411 97411.22 0.9
956 WEST ISLAND LINE - KET station and adits (1), Chainage 97413 97413.22 0.9
957 WEST ISLAND LINE - KET station and adits (1), Chainage 97415 97415.22 0.9
958 WEST ISLAND LINE - KET station and adits (1), Chainage 97417 97417.22 1.0
959 WEST ISLAND LINE - KET station and adits (1), Chainage 97419 97419.22 1.0
960 WEST ISLAND LINE - KET station and adits (1), Chainage 97421 97421.22 1.1
961 WEST ISLAND LINE - KET station and adits (1), Chainage 97423 97423.22 1.1
962 WEST ISLAND LINE - KET station and adits (1), Chainage 97425 97425.22 1.2
963 WEST ISLAND LINE - KET station and adits (1), Chainage 97427 97427.22 1.2
964 WEST ISLAND LINE - KET station and adits (1), Chainage 97429 97429.22 1.3
965 WEST ISLAND LINE - KET station and adits (1), Chainage 97431 97431.22 1.3
966 WEST ISLAND LINE - KET station and adits (1), Chainage 97433 97433.22 1.4
967 WEST ISLAND LINE - KET station and adits (1), Chainage 97435 97435.22 1.4
968 WEST ISLAND LINE - KET station and adits (1), Chainage 97437 97437.22 1.5
969 WEST ISLAND LINE - KET station and adits (1), Chainage 97439 97439.22 1.6
970 WEST ISLAND LINE - KET station and adits (1), Chainage 97441 97441.22 1.7
971 WEST ISLAND LINE - KET station and adits (1), Chainage 97443 97443.22 1.8
972 WEST ISLAND LINE - KET station and adits (1), Chainage 97445 97445.22 1.9
973 WEST ISLAND LINE - KET station and adits (1), Chainage 97447 97447.22 2.0
974 WEST ISLAND LINE - KET station and adits (1), Chainage 97449 97449.22 1.9
975 WEST ISLAND LINE - KET station and adits (1), Chainage 97451 97451.22 1.9
976 WEST ISLAND LINE - KET station and adits (1), Chainage 97453 97453.22 1.9
977 WEST ISLAND LINE - KET station and adits (1), Chainage 97455 97455.22 1.8
978 WEST ISLAND LINE - KET station and adits (1), Chainage 97457 97457.22 1.8
979 WEST ISLAND LINE - KET station and adits (1), Chainage 97459 97459.22 1.8
980 WEST ISLAND LINE - KET station and adits (1), Chainage 97461 97461.22 1.8
981 WEST ISLAND LINE - KET station and adits (1), Chainage 97463 97463.22 1.8
982 WEST ISLAND LINE - KET station and adits (1), Chainage 97465 97465.22 1.7
983 WEST ISLAND LINE - KET station and adits (1), Chainage 97467 97467.22 1.7
984 WEST ISLAND LINE - KET station and adits (1), Chainage 97469 97469.22 1.7
985 WEST ISLAND LINE - KET station and adits (1), Chainage 97471 97471.22 1.7
986 WEST ISLAND LINE - KET station and adits (1), Chainage 97473 97473.22 1.6
987 WEST ISLAND LINE - KET station and adits (1), Chainage 97475 97475.22 1.6
988 WEST ISLAND LINE - KET station and adits (1), Chainage 97477 97477.22 1.6
989 WEST ISLAND LINE - KET station and adits (1), Chainage 97479 97479.22 1.5
990 WEST ISLAND LINE - KET station and adits (1), Chainage 97481 97481.22 1.5
991 WEST ISLAND LINE - KET station and adits (1), Chainage 97483 97483.22 1.5
992 WEST ISLAND LINE - KET station and adits (1), Chainage 97485 97485.22 1.4
993 WEST ISLAND LINE - KET station and adits (1), Chainage 97487 97487.22 1.4
994 WEST ISLAND LINE - KET station and adits (1), Chainage 97489 97489.22 1.4
995 WEST ISLAND LINE - KET station and adits (1), Chainage 97491 97491.22 1.4
996 WEST ISLAND LINE - KET station and adits (1), Chainage 97493 97493.22 1.3
997 WEST ISLAND LINE - KET station and adits (1), Chainage 97495 97495.22 1.3
998 WEST ISLAND LINE - KET station and adits (1), Chainage 97497 97497.22 1.3
999 WEST ISLAND LINE - KET station and adits (1), Chainage 97499 97499.22 1.3
1000 WEST ISLAND LINE - KET station and adits (1), Chainage 97501 97501.22 1.3
1001 WEST ISLAND LINE - KET station and adits (1), Chainage 97503 97503.22 1.3
1002 WEST ISLAND LINE - KET station and adits (1), Chainage 97503 97503.303 1.3
1003 WEST ISLAND LINE - KET station and adits (1), Chainage 97505 97505.22 1.3
1004 WEST ISLAND LINE - KET station and adits (1), Chainage 97507 97507.22 1.3
1005 WEST ISLAND LINE - KET station and adits (1), Chainage 97509 97509.22 1.3
A10-G25

*Description Chainage Actual
Explosive per
Charge (kg)
1006 WEST ISLAND LINE - KET station and adits (1), Chainage 97511 97511.22 1.3
1007 WEST ISLAND LINE - KET station and adits (1), Chainage 97513 97513.22 1.3
1008 WEST ISLAND LINE - KET station and adits (1), Chainage 97515 97515.22 1.3
1010 WEST ISLAND LINE - KET station and adits (2), Chainage 97575 97575.22 1.7
1011 WEST ISLAND LINE - KET station and adits (2), Chainage 97577 97577.22 1.7
1012 WEST ISLAND LINE - KET station and adits (2), Chainage 97579 97579.22 1.8
1013 WEST ISLAND LINE - KET station and adits (2), Chainage 97581 97581.22 1.8
1014 WEST ISLAND LINE - KET station and adits (2), Chainage 97583 97583.22 1.9
1015 WEST ISLAND LINE - KET station and adits (2), Chainage 97585 97585.22 1.9
1016 WEST ISLAND LINE - KET station and adits (2), Chainage 97587 97587.22 2.0
1017 WEST ISLAND LINE - KET station and adits (2), Chainage 97589 97589.22 2.1
1018 WEST ISLAND LINE - KET station and adits (2), Chainage 97591 97591.22 2.1
1019 WEST ISLAND LINE - KET station and adits (2), Chainage 97593 97593.22 2.2
1020 WEST ISLAND LINE - KET station and adits (2), Chainage 97595 97595.22 2.3
1021 WEST ISLAND LINE - KET station and adits (2), Chainage 97597 97597.22 2.3
1022 WEST ISLAND LINE - KET station and adits (2), Chainage 97599 97599.22 2.4
1023 WEST ISLAND LINE - KET station and adits (2), Chainage 97601 97601.22 2.5
1024 WEST ISLAND LINE - KET station and adits (2), Chainage 97603 97603.22 2.6
1025 WEST ISLAND LINE - KET station and adits (2), Chainage 97605 97605.22 2.7
1026 WEST ISLAND LINE - KET station and adits (2), Chainage 97607 97607.22 2.8
1027 WEST ISLAND LINE - KET station and adits (2), Chainage 97609 97609.22 2.8
1028 WEST ISLAND LINE - KET station and adits (2), Chainage 97611 97611.22 2.9
1029 WEST ISLAND LINE - KET station and adits (2), Chainage 97613 97613.22 3.0
1030 WEST ISLAND LINE - KET station and adits (2), Chainage 97615 97615.22 3.1
1031 WEST ISLAND LINE - KET station and adits (2), Chainage 97617 97617.22 3.0
1032 WEST ISLAND LINE - KET station and adits (2), Chainage 97619 97619.22 2.9
1033 WEST ISLAND LINE - KET station and adits (2), Chainage 97621 97621.22 2.8
1034 WEST ISLAND LINE - KET station and adits (2), Chainage 97623 97623.22 2.8
1035 WEST ISLAND LINE - KET station and adits (2), Chainage 97625 97625.22 2.7
1036 WEST ISLAND LINE - KET station and adits (2), Chainage 97627 97627.22 2.6
1037 WEST ISLAND LINE - KET station and adits (2), Chainage 97629 97629.22 2.5
1038 WEST ISLAND LINE - KET station and adits (2), Chainage 97631 97631.22 2.5
1039 WEST ISLAND LINE - KET station and adits (2), Chainage 97633 97633.22 2.4
1040 WEST ISLAND LINE - KET station and adits (2), Chainage 97635 97635.22 2.3
1041 WEST ISLAND LINE - KET station and adits (2), Chainage 97637 97637.22 2.3
1042 WEST ISLAND LINE - KET station and adits (2), Chainage 97639 97639.22 2.2
1043 WEST ISLAND LINE - KET station and adits (2), Chainage 97641 97641.22 2.1
1044 WEST ISLAND LINE - KET station and adits (2), Chainage 97643 97643.22 2.1
1045 WEST ISLAND LINE - KET station and adits (2), Chainage 97645 97645.22 2.0
1046 WEST ISLAND LINE - KET station and adits (2), Chainage 97647 97647.22 2.0
1047 WEST ISLAND LINE - KET station and adits (2), Chainage 97649 97649.22 1.9
1048 WEST ISLAND LINE - KET station and adits (2), Chainage 97651 97651.22 1.9
1049 WEST ISLAND LINE - KET station and adits (2), Chainage 97653 97653.22 1.8
1050 WEST ISLAND LINE - KET station and adits (2), Chainage 97655 97655.22 1.8
1051 WEST ISLAND LINE - KET station and adits (2), Chainage 97657 97657.22 1.7
1052 WEST ISLAND LINE - KET station and adits (2), Chainage 97659 97659.22 1.7
1053 WEST ISLAND LINE - KET station and adits (2), Chainage 97661 97661.22 1.7
1054 WEST ISLAND LINE - KET station and adits (2), Chainage 97663 97663.22 1.6
1055 WEST ISLAND LINE - KET station and adits (2), Chainage 97665 97665.22 1.6
1056 WEST ISLAND LINE - KET station and adits (2), Chainage 97667 97667.22 1.6
1057 WEST ISLAND LINE - KET station and adits (2), Chainage 97669 97669.22 1.5
1058 WEST ISLAND LINE - KET station and adits (2), Chainage 97671 97671.22 1.5
1059 WEST ISLAND LINE - KET station and adits (2), Chainage 97673 97673.22 1.5
1060 WEST ISLAND LINE - KET station and adits (2), Chainage 97675 97675.22 1.5
1061 WEST ISLAND LINE - KET station and adits (2), Chainage 97677 97677.22 1.4
1062 WEST ISLAND LINE - KET station and adits (2), Chainage 97679 97679.22 1.4
1063 WEST ISLAND LINE - KET station and adits (2), Chainage 97681 97681.22 1.4
1064 WEST ISLAND LINE - KET station and adits (2), Chainage 97683 97683.22 1.4
1065 WEST ISLAND LINE - KET station and adits (2), Chainage 97685 97685.22 1.3
1066 WEST ISLAND LINE - KET station and adits (2), Chainage 97687 97687.22 1.3
1067 WEST ISLAND LINE - KET station and adits (2), Chainage 97689 97689.22 1.2
1068 WEST ISLAND LINE - KET station and adits (2), Chainage 97691 97691.22 1.2
1069 WEST ISLAND LINE - KET station and adits (2), Chainage 97693 97693.22 1.1
A10-G26
*Description Chainage Actual
Explosive per
Charge (kg)
1070 WEST ISLAND LINE - KET station and adits (2), Chainage 97695 97695.22 1.1
1071 WEST ISLAND LINE - KET station and adits (2), Chainage 97697 97697.22 1.1
1072 WEST ISLAND LINE - KET station and adits (2), Chainage 97699 97699.22 1.0
1073 WEST ISLAND LINE - KET station and adits (2), Chainage 97701 97701.22 1.0
1074 WEST ISLAND LINE - KET station and adits (2), Chainage 97703 97703.22 1.0
1075 WEST ISLAND LINE - KET station and adits (2), Chainage 97705 97705.22 0.9
1076 WEST ISLAND LINE - KET station and adits (2), Chainage 97707 97707.22 0.9
1077 WEST ISLAND LINE - KET station and adits (2), Chainage 97709 97709.22 0.9
1078 WEST ISLAND LINE - KET station and adits (2), Chainage 97711 97711.22 0.9
1079 WEST ISLAND LINE - KET station and adits (2), Chainage 97713 97713.22 0.9
1080 WEST ISLAND LINE - KET station and adits (2), Chainage 97715 97715.22 0.9
1081 WEST ISLAND LINE - KET station and adits (2), Chainage 97717 97717.22 0.9
1082 WEST ISLAND LINE - KET station and adits (2), Chainage 97719 97719.22 0.8
1083 WEST ISLAND LINE - KET station and adits (2), Chainage 97721 97721.22 0.8
1084 WEST ISLAND LINE - KET station and adits (2), Chainage 97723 97723.22 0.8
1085 WEST ISLAND LINE - KET station and adits (2), Chainage 97725 97725.22 0.8
1086 WEST ISLAND LINE - KET station and adits (2), Chainage 97727 97727.22 0.8
1087 WEST ISLAND LINE - KET station and adits (2), Chainage 97729 97729.22 0.8
1088 WEST ISLAND LINE - KET station and adits (2), Chainage 97731 97731.22 0.8
1089 WEST ISLAND LINE - KET station and adits (2), Chainage 97733 97733.22 0.8
1090 WEST ISLAND LINE - KET station and adits (2), Chainage 97735 97735.22 0.8
1091 WEST ISLAND LINE - KET station and adits (2), Chainage 97737 97737.22 0.7
1092 WEST ISLAND LINE - KET station and adits (2), Chainage 97739 97739.22 0.7
1093 WEST ISLAND LINE - KET station and adits (2), Chainage 97741 97741.22 0.7
1094 WEST ISLAND LINE - KET station and adits (2), Chainage 97743 97743.22 0.7
1095 WEST ISLAND LINE - KET station and adits (2), Chainage 97745 97745.22 0.7
1096 WEST ISLAND LINE - KET station and adits (2), Chainage 97747 97747.22 0.7
1097 WEST ISLAND LINE - KET station and adits (2), Chainage 97749 97749.22 0.6
1098 WEST ISLAND LINE - KET station and adits (2), Chainage 97751 97751.22 0.6
1099 WEST ISLAND LINE - KET station and adits (2), Chainage 97753 97753.22 0.6
1100 WEST ISLAND LINE - KET station and adits (2), Chainage 97755 97755.22 0.6
1101 WEST ISLAND LINE - KET station and adits (2), Chainage 97757 97757.22 0.6
1102 WEST ISLAND LINE - KET station and adits (2), Chainage 97759 97759.22 0.5
1103 WEST ISLAND LINE - KET station and adits (2), Chainage 97761 97761.22 0.5
1104 WEST ISLAND LINE - KET station and adits (2), Chainage 97763 97763.22 0.5
1105 WEST ISLAND LINE - KET station and adits (2), Chainage 97765 97765.22 0.5
1106 WEST ISLAND LINE - KET station and adits (2), Chainage 97767 97767.22 0.5
1107 WEST ISLAND LINE - KET station and adits (2), Chainage 97769 97769.22 0.4
1108 WEST ISLAND LINE - KET station and adits (2), Chainage 97771 97771.22 0.4
1109 WEST ISLAND LINE - KET station and adits (2), Chainage 97773 97773.22 0.4
1110 WEST ISLAND LINE - KET station and adits (2), Chainage 97775 97775.22 0.4
1111 WEST ISLAND LINE - KET station and adits (2), Chainage 97777 97777.22 0.4
1112 WEST ISLAND LINE - KET station and adits (2), Chainage 97779 97779.22 0.4
1113 WEST ISLAND LINE - KET station and adits (2), Chainage 97781 97781.22 0.4
1114 WEST ISLAND LINE - KET station and adits (2), Chainage 97783 97783.22 0.4
1115 WEST ISLAND LINE - KET station and adits (2), Chainage 97785 97785.22 0.4
1116 WEST ISLAND LINE - KET station and adits (2), Chainage 97787 97787.22 0.4
1117 WEST ISLAND LINE - KET station and adits (2), Chainage 97789 97789.22 0.4
1118 WEST ISLAND LINE - KET station and adits (2), Chainage 97791 97791.22 0.4
1119 WEST ISLAND LINE - KET station and adits (2), Chainage 97793 97793.22 0.4
1120 WEST ISLAND LINE - KET station and adits (2), Chainage 97795 97795.22 0.4
1121 WEST ISLAND LINE - KET station and adits (2), Chainage 97797 97797.22 0.4
1122 WEST ISLAND LINE - KET station and adits (2), Chainage 97799 97799.22 0.4
1123 WEST ISLAND LINE - KET station and adits (2), Chainage 97801 97801.22 0.4
1124 WEST ISLAND LINE - KET station and adits (2), Chainage 97803 97803.22 0.4
1125 WEST ISLAND LINE - KET station and adits (2), Chainage 97804 97803.649 0.3
1126 WEST ISLAND LINE - KET station and adits (2), Chainage 97805 97805.22 0.3
1127 WEST ISLAND LINE - KET station and adits (2), Chainage 97807 97807.22 0.3
1128 WEST ISLAND LINE - KET station and adits (2), Chainage 97809 97809.22 0.2
1129 WEST ISLAND LINE - KET station and adits (2), Chainage 97811 97811.22 0.2
1130 WEST ISLAND LINE - KET station and adits (2), Chainage 97813 97813.22 0.2
1131 WEST ISLAND LINE - KET station and adits (2), Chainage 97815 97815.22 0.2
1132 WEST ISLAND LINE - KET station and adits (2), Chainage 97817 97817.22 0.1
A10-G27

*Description Chainage Actual
Explosive per
Charge (kg)
1133 WEST ISLAND LINE - KET station and adits (2), Chainage 97819 97819.22 0.1
1134 WEST ISLAND LINE - KET station and adits (2), Chainage 97821 97821.22 0.1
1135 WEST ISLAND LINE - KET station and adits (2), Chainage 97823 97823.22 0.1
1136 WEST ISLAND LINE - KET station and adits (2), Chainage 97825 97825.22 0.1
1137 WEST ISLAND LINE - KET station and adits (2), Chainage 97827 97827.22 0.1
1138 WEST ISLAND LINE - KET station and adits (2), Chainage 97829 97829.22 0.1
1139 WEST ISLAND LINE - KET station and adits (2), Chainage 97831 97831.22 0.1
1140 WEST ISLAND LINE - KET station and adits (2), Chainage 0 0 1.6
1141 WEST ISLAND LINE - KET station and adits (2), Chainage 2 2 1.7
1142 WEST ISLAND LINE - KET station and adits (2), Chainage 4 4 1.7
1143 WEST ISLAND LINE - KET station and adits (2), Chainage 6 6 1.7
1144 WEST ISLAND LINE - KET station and adits (2), Chainage 8 8 1.6
1145 WEST ISLAND LINE - KET station and adits (2), Chainage 10 10 1.5
1146 WEST ISLAND LINE - KET station and adits (2), Chainage 12 12 1.4
1147 WEST ISLAND LINE - KET station and adits (2), Chainage 14 14 1.3
1148 WEST ISLAND LINE - KET station and adits (2), Chainage 16 16 1.2
1149 WEST ISLAND LINE - KET station and adits (2), Chainage 18 18 1.1
1150 WEST ISLAND LINE - KET station and adits (2), Chainage 20 20 1.0
1151 WEST ISLAND LINE - KET station and adits (2), Chainage 22 22 1.0
1152 WEST ISLAND LINE - KET station and adits (2), Chainage 24 24 0.9
1153 WEST ISLAND LINE - KET station and adits (2), Chainage 26 26 0.2
1154 WEST ISLAND LINE - KET station and adits (2), Chainage 28 28 0.0
1155 WEST ISLAND LINE - KET station and adits (2), Chainage 8 8.081 0.4
1156 WEST ISLAND LINE - KET station and adits (2), Chainage 8 8.081 0.3
1157 WEST ISLAND LINE - KET station and adits (2), Chainage 8 8.081 0.4
1158 WEST ISLAND LINE - KET station and adits (2), Chainage 8 8.081 0.4
1159 WEST ISLAND LINE - KET station and adits (2), Chainage 8 8.081 0.4
1160 WEST ISLAND LINE - KET station and adits (2), Chainage 8 8.081 0.5
1161 WEST ISLAND LINE - KET station and adits (2), Chainage 8 8.081 0.5
1162 WEST ISLAND LINE - KET station and adits (2), Chainage 8 8.081 0.5
1163 WEST ISLAND LINE - KET station and adits (2), Chainage 8 8.081 0.6
1164 WEST ISLAND LINE - KET station and adits (2), Chainage 8 8.081 0.6
1165 WEST ISLAND LINE - KET station and adits (2), Chainage 8 8.081 0.6
1166 WEST ISLAND LINE - KET station and adits (2), Chainage 8 8.081 0.7
1167 WEST ISLAND LINE - KET station and adits (2), Chainage 8 8.081 0.7
1168 WEST ISLAND LINE - KET station and adits (2), Chainage 8 8.081 0.8
1169 WEST ISLAND LINE - KET station and adits (2), Chainage 8 8.081 0.8
1170 WEST ISLAND LINE - KET station and adits (2), Chainage 8 8.081 0.9
1171 WEST ISLAND LINE - KET station and adits (2), Chainage 8 8.081 0.9
1172 WEST ISLAND LINE - KET station and adits (2), Chainage 8 8.081 0.9
1173 WEST ISLAND LINE - KET station and adits (2), Chainage 8 8.081 0.8
1174 WEST ISLAND LINE - KET station and adits (2), Chainage 8 8.081 0.8
1175 WEST ISLAND LINE - KET station and adits (2), Chainage 8 8.081 0.8
1176 WEST ISLAND LINE - KET station and adits (2), Chainage 8 8.081 0.7
1177 WEST ISLAND LINE - KET station and adits (2), Chainage 8 8.081 0.7
1178 WEST ISLAND LINE - KET station and adits (2), Chainage 8 8.081 0.7
1179 WEST ISLAND LINE - KET station and adits (2), Chainage 8 8.081 0.6
1180 WEST ISLAND LINE - KET station and adits (2), Chainage 8 8.081 0.6
1181 WEST ISLAND LINE - KET station and adits (2), Chainage 8 8.081 0.6
1182 WEST ISLAND LINE - KET station and adits (2), Chainage 8 8.081 0.5
1183 WEST ISLAND LINE - KET station and adits (2), Chainage 8 8.081 0.5
1184 WEST ISLAND LINE - KET station and adits (2), Chainage 8 8.081 0.4
1185 WEST ISLAND LINE - KET station and adits (2), Chainage 10 10.081 0.4
1186 WEST ISLAND LINE - KET station and adits (2), Chainage 10 10.081 0.3
1187 WEST ISLAND LINE - KET station and adits (2), Chainage 10 10.081 0.3
1188 WEST ISLAND LINE - KET station and adits (2), Chainage 10 10.081 0.4
1189 WEST ISLAND LINE - KET station and adits (2), Chainage 10 10.081 0.4
1190 WEST ISLAND LINE - KET station and adits (2), Chainage 10 10.081 0.4
1191 WEST ISLAND LINE - KET station and adits (2), Chainage 10 10.081 0.4
1192 WEST ISLAND LINE - KET station and adits (2), Chainage 10 10.081 0.5
1193 WEST ISLAND LINE - KET station and adits (2), Chainage 10 10.081 0.5
1194 WEST ISLAND LINE - KET station and adits (2), Chainage 10 10.081 0.5
1195 WEST ISLAND LINE - KET station and adits (2), Chainage 10 10.081 0.6
A10-G28
*Description Chainage Actual
Explosive per
Charge (kg)
1196 WEST ISLAND LINE - KET station and adits (2), Chainage 10 10.081 0.6
1197 WEST ISLAND LINE - KET station and adits (2), Chainage 10 10.081 0.7
1198 WEST ISLAND LINE - KET station and adits (2), Chainage 10 10.081 0.7
1199 WEST ISLAND LINE - KET station and adits (2), Chainage 10 10.081 0.7
1200 WEST ISLAND LINE - KET station and adits (2), Chainage 10 10.081 0.8
1201 WEST ISLAND LINE - KET station and adits (2), Chainage 10 10.081 0.9
1202 WEST ISLAND LINE - KET station and adits (2), Chainage 10 10.081 0.8
1203 WEST ISLAND LINE - KET station and adits (2), Chainage 10 10.081 0.8
1204 WEST ISLAND LINE - KET station and adits (2), Chainage 10 10.081 0.7
1205 WEST ISLAND LINE - KET station and adits (2), Chainage 10 10.081 0.7
1206 WEST ISLAND LINE - KET station and adits (2), Chainage 10 10.081 0.7
1207 WEST ISLAND LINE - KET station and adits (2), Chainage 10 10.081 0.6
1208 WEST ISLAND LINE - KET station and adits (2), Chainage 10 10.081 0.6
1209 WEST ISLAND LINE - KET station and adits (2), Chainage 10 10.081 0.6
1211 WEST ISLAND LINE - KET station and adits (3), Chainage 10 10.081 0.5
1212 WEST ISLAND LINE - KET station and adits (3), Chainage 10 10.081 0.5
1213 WEST ISLAND LINE - KET station and adits (3), Chainage 10 10.081 0.5
1214 WEST ISLAND LINE - KET station and adits (3), Chainage 10 10.081 0.5
1215 WEST ISLAND LINE - KET station and adits (3), Chainage 10 10.081 0.4
1216 WEST ISLAND LINE - KET station and adits (3), Chainage 12 12.081 0.3
1217 WEST ISLAND LINE - KET station and adits (3), Chainage 12 12.081 0.3
1218 WEST ISLAND LINE - KET station and adits (3), Chainage 12 12.081 0.3
1219 WEST ISLAND LINE - KET station and adits (3), Chainage 12 12.081 0.3
1220 WEST ISLAND LINE - KET station and adits (3), Chainage 12 12.081 0.4
1221 WEST ISLAND LINE - KET station and adits (3), Chainage 12 12.081 0.4
1222 WEST ISLAND LINE - KET station and adits (3), Chainage 12 12.081 0.4
1223 WEST ISLAND LINE - KET station and adits (3), Chainage 12 12.081 0.4
1224 WEST ISLAND LINE - KET station and adits (3), Chainage 12 12.081 0.4
1225 WEST ISLAND LINE - KET station and adits (3), Chainage 12 12.081 0.5
1226 WEST ISLAND LINE - KET station and adits (3), Chainage 12 12.081 0.5
1227 WEST ISLAND LINE - KET station and adits (3), Chainage 12 12.081 0.6
1228 WEST ISLAND LINE - KET station and adits (3), Chainage 12 12.081 0.6
1229 WEST ISLAND LINE - KET station and adits (3), Chainage 12 12.081 0.7
1230 WEST ISLAND LINE - KET station and adits (3), Chainage 12 12.081 0.7
1231 WEST ISLAND LINE - KET station and adits (3), Chainage 12 12.081 0.7
1232 WEST ISLAND LINE - KET station and adits (3), Chainage 12 12.081 0.8
1233 WEST ISLAND LINE - KET station and adits (3), Chainage 12 12.081 0.8
1234 WEST ISLAND LINE - KET station and adits (3), Chainage 12 12.081 0.7
1235 WEST ISLAND LINE - KET station and adits (3), Chainage 12 12.081 0.7
1236 WEST ISLAND LINE - KET station and adits (3), Chainage 12 12.081 0.6
1237 WEST ISLAND LINE - KET station and adits (3), Chainage 12 12.081 0.6
1238 WEST ISLAND LINE - KET station and adits (3), Chainage 12 12.081 0.6
1239 WEST ISLAND LINE - KET station and adits (3), Chainage 12 12.081 0.5
1240 WEST ISLAND LINE - KET station and adits (3), Chainage 12 12.081 0.5
1241 WEST ISLAND LINE - KET station and adits (3), Chainage 12 12.081 0.5
1242 WEST ISLAND LINE - KET station and adits (3), Chainage 12 12.081 0.5
1243 WEST ISLAND LINE - KET station and adits (3), Chainage 12 12.081 0.4
1244 WEST ISLAND LINE - KET station and adits (3), Chainage 12 12.081 0.4
1245 WEST ISLAND LINE - KET station and adits (3), Chainage 12 12.081 0.4
1246 WEST ISLAND LINE - KET station and adits (3), Chainage 14 14.081 0.3
1247 WEST ISLAND LINE - KET station and adits (3), Chainage 14 14.081 0.3
1248 WEST ISLAND LINE - KET station and adits (3), Chainage 14 14.081 0.3
1249 WEST ISLAND LINE - KET station and adits (3), Chainage 14 14.081 0.3
1250 WEST ISLAND LINE - KET station and adits (3), Chainage 14 14.081 0.3
1251 WEST ISLAND LINE - KET station and adits (3), Chainage 14 14.081 0.3
1252 WEST ISLAND LINE - KET station and adits (3), Chainage 14 14.081 0.3
1253 WEST ISLAND LINE - KET station and adits (3), Chainage 14 14.081 0.4
1254 WEST ISLAND LINE - KET station and adits (3), Chainage 14 14.081 0.4
1255 WEST ISLAND LINE - KET station and adits (3), Chainage 14 14.081 0.4
1256 WEST ISLAND LINE - KET station and adits (3), Chainage 14 14.081 0.5
1257 WEST ISLAND LINE - KET station and adits (3), Chainage 14 14.081 0.5
1258 WEST ISLAND LINE - KET station and adits (3), Chainage 14 14.081 0.6
1259 WEST ISLAND LINE - KET station and adits (3), Chainage 14 14.081 0.6
A10-G29
*Description Chainage Actual
Explosive per
Charge (kg)
1260 WEST ISLAND LINE - KET station and adits (3), Chainage 14 14.081 0.6
1261 WEST ISLAND LINE - KET station and adits (3), Chainage 14 14.081 0.7
1262 WEST ISLAND LINE - KET station and adits (3), Chainage 14 14.081 0.8
1263 WEST ISLAND LINE - KET station and adits (3), Chainage 14 14.081 0.7
1264 WEST ISLAND LINE - KET station and adits (3), Chainage 14 14.081 0.7
1265 WEST ISLAND LINE - KET station and adits (3), Chainage 14 14.081 0.6
1266 WEST ISLAND LINE - KET station and adits (3), Chainage 14 14.081 0.6
1267 WEST ISLAND LINE - KET station and adits (3), Chainage 14 14.081 0.5
1268 WEST ISLAND LINE - KET station and adits (3), Chainage 14 14.081 0.5
1269 WEST ISLAND LINE - KET station and adits (3), Chainage 14 14.081 0.5
1270 WEST ISLAND LINE - KET station and adits (3), Chainage 14 14.081 0.5
1271 WEST ISLAND LINE - KET station and adits (3), Chainage 14 14.081 0.4
1272 WEST ISLAND LINE - KET station and adits (3), Chainage 14 14.081 0.4
1273 WEST ISLAND LINE - KET station and adits (3), Chainage 14 14.081 0.4
1274 WEST ISLAND LINE - KET station and adits (3), Chainage 14 14.081 0.4
1275 WEST ISLAND LINE - KET station and adits (3), Chainage 14 14.081 0.4
1276 WEST ISLAND LINE - KET station and adits (3), Chainage 16 16.081 0.3
1277 WEST ISLAND LINE - KET station and adits (3), Chainage 16 16.081 0.2
1278 WEST ISLAND LINE - KET station and adits (3), Chainage 16 16.081 0.2
1279 WEST ISLAND LINE - KET station and adits (3), Chainage 16 16.081 0.2
1280 WEST ISLAND LINE - KET station and adits (3), Chainage 16 16.081 0.3
1281 WEST ISLAND LINE - KET station and adits (3), Chainage 16 16.081 0.3
1282 WEST ISLAND LINE - KET station and adits (3), Chainage 16 16.081 0.3
1283 WEST ISLAND LINE - KET station and adits (3), Chainage 16 16.081 0.3
1284 WEST ISLAND LINE - KET station and adits (3), Chainage 16 16.081 0.3
1285 WEST ISLAND LINE - KET station and adits (3), Chainage 16 16.081 0.4
1286 WEST ISLAND LINE - KET station and adits (3), Chainage 16 16.081 0.4
1287 WEST ISLAND LINE - KET station and adits (3), Chainage 16 16.081 0.5
1288 WEST ISLAND LINE - KET station and adits (3), Chainage 16 16.081 0.5
1289 WEST ISLAND LINE - KET station and adits (3), Chainage 16 16.081 0.6
1290 WEST ISLAND LINE - KET station and adits (3), Chainage 16 16.081 0.6
1291 WEST ISLAND LINE - KET station and adits (3), Chainage 16 16.081 0.6
1292 WEST ISLAND LINE - KET station and adits (3), Chainage 16 16.081 0.7
1293 WEST ISLAND LINE - KET station and adits (3), Chainage 16 16.081 0.7
1294 WEST ISLAND LINE - KET station and adits (3), Chainage 16 16.081 0.6
1295 WEST ISLAND LINE - KET station and adits (3), Chainage 16 16.081 0.6
1296 WEST ISLAND LINE - KET station and adits (3), Chainage 16 16.081 0.5
1297 WEST ISLAND LINE - KET station and adits (3), Chainage 16 16.081 0.5
1298 WEST ISLAND LINE - KET station and adits (3), Chainage 16 16.081 0.5
1299 WEST ISLAND LINE - KET station and adits (3), Chainage 16 16.081 0.4
1300 WEST ISLAND LINE - KET station and adits (3), Chainage 16 16.081 0.4
1301 WEST ISLAND LINE - KET station and adits (3), Chainage 16 16.081 0.4
1302 WEST ISLAND LINE - KET station and adits (3), Chainage 16 16.081 0.4
1303 WEST ISLAND LINE - KET station and adits (3), Chainage 16 16.081 0.3
1304 WEST ISLAND LINE - KET station and adits (3), Chainage 16 16.081 0.3
1305 WEST ISLAND LINE - KET station and adits (3), Chainage 16 16.081 0.3
1306 WEST ISLAND LINE - KET station and adits (3), Chainage 18 18.081 0.2
1307 WEST ISLAND LINE - KET station and adits (3), Chainage 18 18.081 0.2
1308 WEST ISLAND LINE - KET station and adits (3), Chainage 18 18.081 0.2
1309 WEST ISLAND LINE - KET station and adits (3), Chainage 18 18.081 0.2
1310 WEST ISLAND LINE - KET station and adits (3), Chainage 18 18.081 0.2
1311 WEST ISLAND LINE - KET station and adits (3), Chainage 18 18.081 0.2
1312 WEST ISLAND LINE - KET station and adits (3), Chainage 18 18.081 0.2
1313 WEST ISLAND LINE - KET station and adits (3), Chainage 18 18.081 0.3
1314 WEST ISLAND LINE - KET station and adits (3), Chainage 18 18.081 0.3
1315 WEST ISLAND LINE - KET station and adits (3), Chainage 18 18.081 0.3
1316 WEST ISLAND LINE - KET station and adits (3), Chainage 18 18.081 0.4
1317 WEST ISLAND LINE - KET station and adits (3), Chainage 18 18.081 0.4
1318 WEST ISLAND LINE - KET station and adits (3), Chainage 18 18.081 0.5
1319 WEST ISLAND LINE - KET station and adits (3), Chainage 18 18.081 0.5
1320 WEST ISLAND LINE - KET station and adits (3), Chainage 18 18.081 0.6
1321 WEST ISLAND LINE - KET station and adits (3), Chainage 18 18.081 0.6
1322 WEST ISLAND LINE - KET station and adits (3), Chainage 18 18.081 0.7
A10-G30

*Description Chainage Actual
Explosive per
Charge (kg)
1323 WEST ISLAND LINE - KET station and adits (3), Chainage 18 18.081 0.6
1324 WEST ISLAND LINE - KET station and adits (3), Chainage 18 18.081 0.6
1325 WEST ISLAND LINE - KET station and adits (3), Chainage 18 18.081 0.5
1326 WEST ISLAND LINE - KET station and adits (3), Chainage 18 18.081 0.5
1327 WEST ISLAND LINE - KET station and adits (3), Chainage 18 18.081 0.5
1328 WEST ISLAND LINE - KET station and adits (3), Chainage 18 18.081 0.4
1329 WEST ISLAND LINE - KET station and adits (3), Chainage 18 18.081 0.4
1330 WEST ISLAND LINE - KET station and adits (3), Chainage 18 18.081 0.4
1331 WEST ISLAND LINE - KET station and adits (3), Chainage 18 18.081 0.3
1332 WEST ISLAND LINE - KET station and adits (3), Chainage 18 18.081 0.3
1333 WEST ISLAND LINE - KET station and adits (3), Chainage 18 18.081 0.3
1334 WEST ISLAND LINE - KET station and adits (3), Chainage 18 18.081 0.3
1335 WEST ISLAND LINE - KET station and adits (3), Chainage 18 18.081 0.3
1336 WEST ISLAND LINE - KET station and adits (3), Chainage 20 20.081 0.2
1337 WEST ISLAND LINE - KET station and adits (3), Chainage 20 20.081 0.2
1338 WEST ISLAND LINE - KET station and adits (3), Chainage 20 20.081 0.2
1339 WEST ISLAND LINE - KET station and adits (3), Chainage 20 20.081 0.2
1340 WEST ISLAND LINE - KET station and adits (3), Chainage 20 20.081 0.2
1341 WEST ISLAND LINE - KET station and adits (3), Chainage 20 20.081 0.2
1342 WEST ISLAND LINE - KET station and adits (3), Chainage 20 20.081 0.2
1343 WEST ISLAND LINE - KET station and adits (3), Chainage 20 20.081 0.2
1344 WEST ISLAND LINE - KET station and adits (3), Chainage 20 20.081 0.3
1345 WEST ISLAND LINE - KET station and adits (3), Chainage 20 20.081 0.3
1346 WEST ISLAND LINE - KET station and adits (3), Chainage 20 20.081 0.3
1347 WEST ISLAND LINE - KET station and adits (3), Chainage 20 20.081 0.4
1348 WEST ISLAND LINE - KET station and adits (3), Chainage 20 20.081 0.4
1349 WEST ISLAND LINE - KET station and adits (3), Chainage 20 20.081 0.5
1350 WEST ISLAND LINE - KET station and adits (3), Chainage 20 20.081 0.5
1351 WEST ISLAND LINE - KET station and adits (3), Chainage 20 20.081 0.6
1352 WEST ISLAND LINE - KET station and adits (3), Chainage 20 20.081 0.6
1353 WEST ISLAND LINE - KET station and adits (3), Chainage 20 20.081 0.6
1354 WEST ISLAND LINE - KET station and adits (3), Chainage 20 20.081 0.5
1355 WEST ISLAND LINE - KET station and adits (3), Chainage 20 20.081 0.5
1356 WEST ISLAND LINE - KET station and adits (3), Chainage 20 20.081 0.5
1357 WEST ISLAND LINE - KET station and adits (3), Chainage 20 20.081 0.4
1358 WEST ISLAND LINE - KET station and adits (3), Chainage 20 20.081 0.4
1359 WEST ISLAND LINE - KET station and adits (3), Chainage 20 20.081 0.3
1360 WEST ISLAND LINE - KET station and adits (3), Chainage 20 20.081 0.3
1361 WEST ISLAND LINE - KET station and adits (3), Chainage 20 20.081 0.3
1362 WEST ISLAND LINE - KET station and adits (3), Chainage 20 20.081 0.3
1363 WEST ISLAND LINE - KET station and adits (3), Chainage 20 20.081 0.3
1364 WEST ISLAND LINE - KET station and adits (3), Chainage 20 20.081 0.2
1365 WEST ISLAND LINE - KET station and adits (3), Chainage 20 20.081 0.2
1366 WEST ISLAND LINE - KET station and adits (3), Chainage 22 22.081 0.1
1367 WEST ISLAND LINE - KET station and adits (3), Chainage 22 22.081 0.1
1368 WEST ISLAND LINE - KET station and adits (3), Chainage 22 22.081 0.1
1369 WEST ISLAND LINE - KET station and adits (3), Chainage 22 22.081 0.1
1370 WEST ISLAND LINE - KET station and adits (3), Chainage 22 22.081 0.1
1371 WEST ISLAND LINE - KET station and adits (3), Chainage 22 22.081 0.2
1372 WEST ISLAND LINE - KET station and adits (3), Chainage 22 22.081 0.2
1373 WEST ISLAND LINE - KET station and adits (3), Chainage 22 22.081 0.2
1374 WEST ISLAND LINE - KET station and adits (3), Chainage 22 22.081 0.2
1375 WEST ISLAND LINE - KET station and adits (3), Chainage 22 22.081 0.3
1376 WEST ISLAND LINE - KET station and adits (3), Chainage 22 22.081 0.3
1377 WEST ISLAND LINE - KET station and adits (3), Chainage 22 22.081 0.3
1378 WEST ISLAND LINE - KET station and adits (3), Chainage 22 22.081 0.4
1379 WEST ISLAND LINE - KET station and adits (3), Chainage 22 22.081 0.5
1380 WEST ISLAND LINE - KET station and adits (3), Chainage 22 22.081 0.5
1381 WEST ISLAND LINE - KET station and adits (3), Chainage 22 22.081 0.5
1382 WEST ISLAND LINE - KET station and adits (3), Chainage 22 22.081 0.6
1383 WEST ISLAND LINE - KET station and adits (3), Chainage 22 22.081 0.6
1384 WEST ISLAND LINE - KET station and adits (3), Chainage 22 22.081 0.5
1385 WEST ISLAND LINE - KET station and adits (3), Chainage 22 22.081 0.5
A10-G31

*Description Chainage Actual
Explosive per
Charge (kg)
1386 WEST ISLAND LINE - KET station and adits (3), Chainage 22 22.081 0.4
1387 WEST ISLAND LINE - KET station and adits (3), Chainage 22 22.081 0.4
1388 WEST ISLAND LINE - KET station and adits (3), Chainage 22 22.081 0.3
1389 WEST ISLAND LINE - KET station and adits (3), Chainage 22 22.081 0.3
1390 WEST ISLAND LINE - KET station and adits (3), Chainage 22 22.081 0.3
1391 WEST ISLAND LINE - KET station and adits (3), Chainage 22 22.081 0.3
1392 WEST ISLAND LINE - KET station and adits (3), Chainage 22 22.081 0.2
1393 WEST ISLAND LINE - KET station and adits (3), Chainage 22 22.081 0.2
1394 WEST ISLAND LINE - KET station and adits (3), Chainage 22 22.081 0.2
1395 WEST ISLAND LINE - KET station and adits (3), Chainage 22 22.081 0.2
1396 WEST ISLAND LINE - KET station and adits (3), Chainage 24 24.081 0.1
1397 WEST ISLAND LINE - KET station and adits (3), Chainage 24 24.081 0.1
1398 WEST ISLAND LINE - KET station and adits (3), Chainage 24 24.081 0.1
1399 WEST ISLAND LINE - KET station and adits (3), Chainage 24 24.081 0.1
1400 WEST ISLAND LINE - KET station and adits (3), Chainage 24 24.081 0.1
1401 WEST ISLAND LINE - KET station and adits (3), Chainage 24 24.081 0.1
1402 WEST ISLAND LINE - KET station and adits (3), Chainage 24 24.081 0.1
1403 WEST ISLAND LINE - KET station and adits (3), Chainage 24 24.081 0.2
1404 WEST ISLAND LINE - KET station and adits (3), Chainage 24 24.081 0.2
1405 WEST ISLAND LINE - KET station and adits (3), Chainage 24 24.081 0.2
1406 WEST ISLAND LINE - KET station and adits (3), Chainage 24 24.081 0.3
1407 WEST ISLAND LINE - KET station and adits (3), Chainage 24 24.081 0.3
1408 WEST ISLAND LINE - KET station and adits (3), Chainage 24 24.081 0.4
1409 WEST ISLAND LINE - KET station and adits (3), Chainage 24 24.081 0.4
1410 WEST ISLAND LINE - KET station and adits (3), Chainage 24 24.081 0.5
1412 WEST ISLAND LINE - KET station and adits (4), Chainage 24 24.081 0.5
1413 WEST ISLAND LINE - KET station and adits (4), Chainage 24 24.081 0.6
1414 WEST ISLAND LINE - KET station and adits (4), Chainage 24 24.081 0.5
1415 WEST ISLAND LINE - KET station and adits (4), Chainage 24 24.081 0.5
1416 WEST ISLAND LINE - KET station and adits (4), Chainage 24 24.081 0.4
1417 WEST ISLAND LINE - KET station and adits (4), Chainage 24 24.081 0.4
1418 WEST ISLAND LINE - KET station and adits (4), Chainage 24 24.081 0.4
1419 WEST ISLAND LINE - KET station and adits (4), Chainage 24 24.081 0.3
1420 WEST ISLAND LINE - KET station and adits (4), Chainage 24 24.081 0.3
1421 WEST ISLAND LINE - KET station and adits (4), Chainage 24 24.081 0.3
1422 WEST ISLAND LINE - KET station and adits (4), Chainage 24 24.081 0.2
1423 WEST ISLAND LINE - KET station and adits (4), Chainage 24 24.081 0.2
1424 WEST ISLAND LINE - KET station and adits (4), Chainage 24 24.081 0.2
1425 WEST ISLAND LINE - KET station and adits (4), Chainage 24 24.081 0.2
1426 WEST ISLAND LINE - KET station and adits (4), Chainage 24 24.081 0.2
1427 WEST ISLAND LINE - KET station and adits (4), Chainage 26 26.081 0.1
1428 WEST ISLAND LINE - KET station and adits (4), Chainage 26 26.081 0.1
1429 WEST ISLAND LINE - KET station and adits (4), Chainage 26 26.081 0.1
1430 WEST ISLAND LINE - KET station and adits (4), Chainage 26 26.081 0.1
1431 WEST ISLAND LINE - KET station and adits (4), Chainage 26 26.081 0.1
1432 WEST ISLAND LINE - KET station and adits (4), Chainage 26 26.081 0.1
1433 WEST ISLAND LINE - KET station and adits (4), Chainage 26 26.081 0.1
1434 WEST ISLAND LINE - KET station and adits (4), Chainage 26 26.081 0.1
1435 WEST ISLAND LINE - KET station and adits (4), Chainage 26 26.081 0.2
1436 WEST ISLAND LINE - KET station and adits (4), Chainage 26 26.081 0.2
1437 WEST ISLAND LINE - KET station and adits (4), Chainage 26 26.081 0.3
1438 WEST ISLAND LINE - KET station and adits (4), Chainage 26 26.081 0.3
1439 WEST ISLAND LINE - KET station and adits (4), Chainage 26 26.081 0.3
1440 WEST ISLAND LINE - KET station and adits (4), Chainage 26 26.081 0.4
1441 WEST ISLAND LINE - KET station and adits (4), Chainage 26 26.081 0.4
1442 WEST ISLAND LINE - KET station and adits (4), Chainage 26 26.081 0.5
1443 WEST ISLAND LINE - KET station and adits (4), Chainage 26 26.081 0.5
1444 WEST ISLAND LINE - KET station and adits (4), Chainage 26 26.081 0.5
1445 WEST ISLAND LINE - KET station and adits (4), Chainage 26 26.081 0.5
1446 WEST ISLAND LINE - KET station and adits (4), Chainage 26 26.081 0.4
1447 WEST ISLAND LINE - KET station and adits (4), Chainage 26 26.081 0.4
1448 WEST ISLAND LINE - KET station and adits (4), Chainage 26 26.081 0.3
1449 WEST ISLAND LINE - KET station and adits (4), Chainage 26 26.081 0.3
A10-G32

*Description Chainage Actual
Explosive per
Charge (kg)
1450 WEST ISLAND LINE - KET station and adits (4), Chainage 26 26.081 0.3
1451 WEST ISLAND LINE - KET station and adits (4), Chainage 26 26.081 0.2
1452 WEST ISLAND LINE - KET station and adits (4), Chainage 26 26.081 0.2
1453 WEST ISLAND LINE - KET station and adits (4), Chainage 26 26.081 0.2
1454 WEST ISLAND LINE - KET station and adits (4), Chainage 26 26.081 0.2
1455 WEST ISLAND LINE - KET station and adits (4), Chainage 26 26.081 0.1
1456 WEST ISLAND LINE - KET station and adits (4), Chainage 26 26.081 0.1
1457 WEST ISLAND LINE - KET station and adits (4), Chainage 28 28.081 0.1
1458 WEST ISLAND LINE - KET station and adits (4), Chainage 28 28.081 0.0
1459 WEST ISLAND LINE - KET station and adits (4), Chainage 28 28.081 0.0
1460 WEST ISLAND LINE - KET station and adits (4), Chainage 28 28.081 0.1
1461 WEST ISLAND LINE - KET station and adits (4), Chainage 28 28.081 0.1
1462 WEST ISLAND LINE - KET station and adits (4), Chainage 28 28.081 0.1
1463 WEST ISLAND LINE - KET station and adits (4), Chainage 28 28.081 0.1
1464 WEST ISLAND LINE - KET station and adits (4), Chainage 28 28.081 0.1
1465 WEST ISLAND LINE - KET station and adits (4), Chainage 28 28.081 0.2
1466 WEST ISLAND LINE - KET station and adits (4), Chainage 28 28.081 0.2
1467 WEST ISLAND LINE - KET station and adits (4), Chainage 28 28.081 0.2
1468 WEST ISLAND LINE - KET station and adits (4), Chainage 28 28.081 0.3
1469 WEST ISLAND LINE - KET station and adits (4), Chainage 28 28.081 0.3
1470 WEST ISLAND LINE - KET station and adits (4), Chainage 28 28.081 0.4
1471 WEST ISLAND LINE - KET station and adits (4), Chainage 28 28.081 0.4
1472 WEST ISLAND LINE - KET station and adits (4), Chainage 28 28.081 0.5
1473 WEST ISLAND LINE - KET station and adits (4), Chainage 28 28.081 0.5
1474 WEST ISLAND LINE - KET station and adits (4), Chainage 28 28.081 0.5
1475 WEST ISLAND LINE - KET station and adits (4), Chainage 28 28.081 0.4
1476 WEST ISLAND LINE - KET station and adits (4), Chainage 28 28.081 0.4
1477 WEST ISLAND LINE - KET station and adits (4), Chainage 28 28.081 0.4
1478 WEST ISLAND LINE - KET station and adits (4), Chainage 28 28.081 0.3
1479 WEST ISLAND LINE - KET station and adits (4), Chainage 28 28.081 0.3
1480 WEST ISLAND LINE - KET station and adits (4), Chainage 28 28.081 0.2
1481 WEST ISLAND LINE - KET station and adits (4), Chainage 28 28.081 0.2
1482 WEST ISLAND LINE - KET station and adits (4), Chainage 28 28.081 0.2
1483 WEST ISLAND LINE - KET station and adits (4), Chainage 28 28.081 0.1
1484 WEST ISLAND LINE - KET station and adits (4), Chainage 28 28.081 0.1
1485 WEST ISLAND LINE - KET station and adits (4), Chainage 28 28.081 0.1
1486 WEST ISLAND LINE - KET station and adits (4), Chainage 28 28.081 0.1
1487 WEST ISLAND LINE - KET station and adits (4), Chainage 30 30.081 0.0
1488 WEST ISLAND LINE - KET station and adits (4), Chainage 30 30.081 0.0
1489 WEST ISLAND LINE - KET station and adits (4), Chainage 30 30.081 0.0
1490 WEST ISLAND LINE - KET station and adits (4), Chainage 30 30.081 0.0
1491 WEST ISLAND LINE - KET station and adits (4), Chainage 30 30.081 0.1
1492 WEST ISLAND LINE - KET station and adits (4), Chainage 30 30.081 0.1
1493 WEST ISLAND LINE - KET station and adits (4), Chainage 30 30.081 0.1
1494 WEST ISLAND LINE - KET station and adits (4), Chainage 30 30.081 0.1
1495 WEST ISLAND LINE - KET station and adits (4), Chainage 30 30.081 0.1
1496 WEST ISLAND LINE - KET station and adits (4), Chainage 30 30.081 0.2
1497 WEST ISLAND LINE - KET station and adits (4), Chainage 30 30.081 0.2
1498 WEST ISLAND LINE - KET station and adits (4), Chainage 30 30.081 0.3
1499 WEST ISLAND LINE - KET station and adits (4), Chainage 30 30.081 0.3
1500 WEST ISLAND LINE - KET station and adits (4), Chainage 30 30.081 0.4
1501 WEST ISLAND LINE - KET station and adits (4), Chainage 30 30.081 0.4
1502 WEST ISLAND LINE - KET station and adits (4), Chainage 30 30.081 0.4
1503 WEST ISLAND LINE - KET station and adits (4), Chainage 30 30.081 0.5
1504 WEST ISLAND LINE - KET station and adits (4), Chainage 30 30.081 0.5
1505 WEST ISLAND LINE - KET station and adits (4), Chainage 30 30.081 0.4
1506 WEST ISLAND LINE - KET station and adits (4), Chainage 30 30.081 0.4
1507 WEST ISLAND LINE - KET station and adits (4), Chainage 30 30.081 0.3
1508 WEST ISLAND LINE - KET station and adits (4), Chainage 30 30.081 0.3
1509 WEST ISLAND LINE - KET station and adits (4), Chainage 30 30.081 0.3
1510 WEST ISLAND LINE - KET station and adits (4), Chainage 30 30.081 0.2
1511 WEST ISLAND LINE - KET station and adits (4), Chainage 30 30.081 0.2
1512 WEST ISLAND LINE - KET station and adits (4), Chainage 30 30.081 0.2
A10-G33

*Description Chainage Actual
Explosive per
Charge (kg)
1513 WEST ISLAND LINE - KET station and adits (4), Chainage 30 30.081 0.1
1514 WEST ISLAND LINE - KET station and adits (4), Chainage 30 30.081 0.1
1515 WEST ISLAND LINE - KET station and adits (4), Chainage 30 30.081 0.1
1516 WEST ISLAND LINE - KET station and adits (4), Chainage 30 30.081 0.1
1517 WEST ISLAND LINE - KET station and adits (4), Chainage 32 32.081 0.0
1518 WEST ISLAND LINE - KET station and adits (4), Chainage 32 32.081 0.0
1519 WEST ISLAND LINE - KET station and adits (4), Chainage 32 32.081 0.0
1520 WEST ISLAND LINE - KET station and adits (4), Chainage 32 32.081 0.0
1521 WEST ISLAND LINE - KET station and adits (4), Chainage 32 32.081 0.0
1522 WEST ISLAND LINE - KET station and adits (4), Chainage 32 32.081 0.1
1523 WEST ISLAND LINE - KET station and adits (4), Chainage 32 32.081 0.1
1524 WEST ISLAND LINE - KET station and adits (4), Chainage 32 32.081 0.1
1525 WEST ISLAND LINE - KET station and adits (4), Chainage 32 32.081 0.1
1526 WEST ISLAND LINE - KET station and adits (4), Chainage 32 32.081 0.2
1527 WEST ISLAND LINE - KET station and adits (4), Chainage 32 32.081 0.2
1528 WEST ISLAND LINE - KET station and adits (4), Chainage 32 32.081 0.3
1529 WEST ISLAND LINE - KET station and adits (4), Chainage 32 32.081 0.3
1530 WEST ISLAND LINE - KET station and adits (4), Chainage 32 32.081 0.3
1531 WEST ISLAND LINE - KET station and adits (4), Chainage 32 32.081 0.3
1532 WEST ISLAND LINE - KET station and adits (4), Chainage 32 32.081 0.3
1533 WEST ISLAND LINE - KET station and adits (4), Chainage 32 32.081 0.4
1534 WEST ISLAND LINE - KET station and adits (4), Chainage 32 32.081 0.3
1535 WEST ISLAND LINE - KET station and adits (4), Chainage 32 32.081 0.3
1536 WEST ISLAND LINE - KET station and adits (4), Chainage 32 32.081 0.3
1537 WEST ISLAND LINE - KET station and adits (4), Chainage 32 32.081 0.3
1538 WEST ISLAND LINE - KET station and adits (4), Chainage 32 32.081 0.3
1539 WEST ISLAND LINE - KET station and adits (4), Chainage 32 32.081 0.2
1540 WEST ISLAND LINE - KET station and adits (4), Chainage 32 32.081 0.2
1541 WEST ISLAND LINE - KET station and adits (4), Chainage 32 32.081 0.2
1542 WEST ISLAND LINE - KET station and adits (4), Chainage 32 32.081 0.1
1543 WEST ISLAND LINE - KET station and adits (4), Chainage 32 32.081 0.1
1544 WEST ISLAND LINE - KET station and adits (4), Chainage 32 32.081 0.1
1545 WEST ISLAND LINE - KET station and adits (4), Chainage 32 32.081 0.1
1546 WEST ISLAND LINE - KET station and adits (4), Chainage 32 32.081 0.1
1547 WEST ISLAND LINE - KET station and adits (4), Chainage 34 34.081 0.0
1548 WEST ISLAND LINE - KET station and adits (4), Chainage 34 34.081 0.0
1549 WEST ISLAND LINE - KET station and adits (4), Chainage 34 34.081 0.0
1550 WEST ISLAND LINE - KET station and adits (4), Chainage 34 34.081 0.0
1551 WEST ISLAND LINE - KET station and adits (4), Chainage 34 34.081 0.0
1552 WEST ISLAND LINE - KET station and adits (4), Chainage 34 34.081 0.1
1553 WEST ISLAND LINE - KET station and adits (4), Chainage 34 34.081 0.1
1554 WEST ISLAND LINE - KET station and adits (4), Chainage 34 34.081 0.1
1555 WEST ISLAND LINE - KET station and adits (4), Chainage 34 34.081 0.1
1556 WEST ISLAND LINE - KET station and adits (4), Chainage 34 34.081 0.2
1557 WEST ISLAND LINE - KET station and adits (4), Chainage 34 34.081 0.2
1558 WEST ISLAND LINE - KET station and adits (4), Chainage 34 34.081 0.2
1559 WEST ISLAND LINE - KET station and adits (4), Chainage 34 34.081 0.2
1560 WEST ISLAND LINE - KET station and adits (4), Chainage 34 34.081 0.2
1561 WEST ISLAND LINE - KET station and adits (4), Chainage 34 34.081 0.2
1562 WEST ISLAND LINE - KET station and adits (4), Chainage 34 34.081 0.2
1563 WEST ISLAND LINE - KET station and adits (4), Chainage 34 34.081 0.3
1564 WEST ISLAND LINE - KET station and adits (4), Chainage 34 34.081 0.2
1565 WEST ISLAND LINE - KET station and adits (4), Chainage 34 34.081 0.2
1566 WEST ISLAND LINE - KET station and adits (4), Chainage 34 34.081 0.2
1567 WEST ISLAND LINE - KET station and adits (4), Chainage 34 34.081 0.2
1568 WEST ISLAND LINE - KET station and adits (4), Chainage 34 34.081 0.2
1569 WEST ISLAND LINE - KET station and adits (4), Chainage 34 34.081 0.2
1570 WEST ISLAND LINE - KET station and adits (4), Chainage 34 34.081 0.2
1571 WEST ISLAND LINE - KET station and adits (4), Chainage 34 34.081 0.2
1572 WEST ISLAND LINE - KET station and adits (4), Chainage 34 34.081 0.1
1573 WEST ISLAND LINE - KET station and adits (4), Chainage 34 34.081 0.1
1574 WEST ISLAND LINE - KET station and adits (4), Chainage 34 34.081 0.1
1575 WEST ISLAND LINE - KET station and adits (4), Chainage 34 34.081 0.1
A10-G34

*Description Chainage Actual
Explosive per
Charge (kg)
1576 WEST ISLAND LINE - KET station and adits (4), Chainage 34 34.081 0.0
* Reference to Blast Assessment Report (BAR)
A10-G35
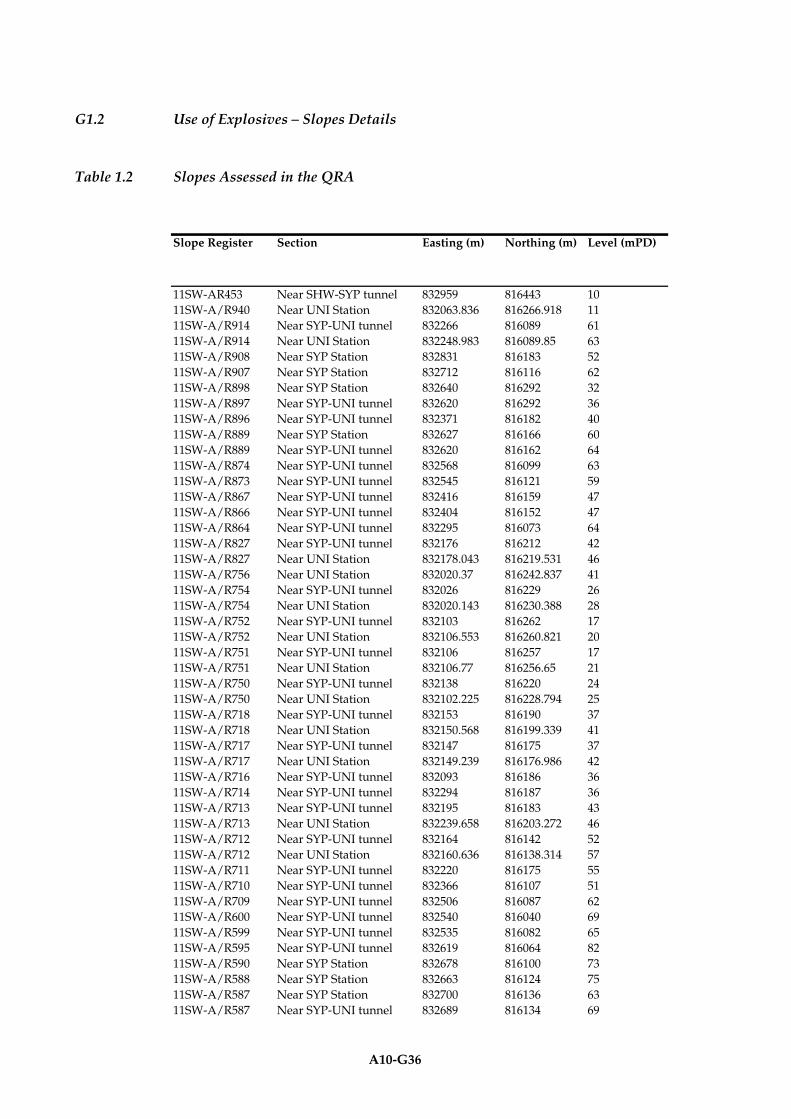
G1.2 Use of Explosives – Slopes Details
Table 1.2 Slopes Assessed in the QRA
Slope Register Section Easting (m) Northing (m) Level (mPD)
11SW-AR453 Near SHW-SYP tunnel 832959 816443 10
11SW-A/R940 Near UNI Station 832063.836 816266.918 11
11SW-A/R914 Near SYP-UNI tunnel 832266 816089 61
11SW-A/R914 Near UNI Station 832248.983 816089.85 63
11SW-A/R908 Near SYP Station 832831 816183 52
11SW-A/R907 Near SYP Station 832712 816116 62
11SW-A/R898 Near SYP Station 832640 816292 32
11SW-A/R897 Near SYP-UNI tunnel 832620 816292 36
11SW-A/R896 Near SYP-UNI tunnel 832371 816182 40
11SW-A/R889 Near SYP Station 832627 816166 60
11SW-A/R889 Near SYP-UNI tunnel 832620 816162 64
11SW-A/R874 Near SYP-UNI tunnel 832568 816099 63
11SW-A/R873 Near SYP-UNI tunnel 832545 816121 59
11SW-A/R867 Near SYP-UNI tunnel 832416 816159 47
11SW-A/R866 Near SYP-UNI tunnel 832404 816152 47
11SW-A/R864 Near SYP-UNI tunnel 832295 816073 64
11SW-A/R827 Near SYP-UNI tunnel 832176 816212 42
11SW-A/R827 Near UNI Station 832178.043 816219.531 46
11SW-A/R756 Near UNI Station 832020.37 816242.837 41
11SW-A/R754 Near SYP-UNI tunnel 832026 816229 26
11SW-A/R754 Near UNI Station 832020.143 816230.388 28
11SW-A/R752 Near SYP-UNI tunnel 832103 816262 17
11SW-A/R752 Near UNI Station 832106.553 816260.821 20
11SW-A/R751 Near SYP-UNI tunnel 832106 816257 17
11SW-A/R751 Near UNI Station 832106.77 816256.65 21
11SW-A/R750 Near SYP-UNI tunnel 832138 816220 24
11SW-A/R750 Near UNI Station 832102.225 816228.794 25
11SW-A/R718 Near SYP-UNI tunnel 832153 816190 37
11SW-A/R718 Near UNI Station 832150.568 816199.339 41
11SW-A/R717 Near SYP-UNI tunnel 832147 816175 37
11SW-A/R717 Near UNI Station 832149.239 816176.986 42
11SW-A/R716 Near SYP-UNI tunnel 832093 816186 36
11SW-A/R714 Near SYP-UNI tunnel 832294 816187 36
11SW-A/R713 Near SYP-UNI tunnel 832195 816183 43
11SW-A/R713 Near UNI Station 832239.658 816203.272 46
11SW-A/R712 Near SYP-UNI tunnel 832164 816142 52
11SW-A/R712 Near UNI Station 832160.636 816138.314 57
11SW-A/R711 Near SYP-UNI tunnel 832220 816175 55
11SW-A/R710 Near SYP-UNI tunnel 832366 816107 51
11SW-A/R709 Near SYP-UNI tunnel 832506 816087 62
11SW-A/R600 Near SYP-UNI tunnel 832540 816040 69
11SW-A/R599 Near SYP-UNI tunnel 832535 816082 65
11SW-A/R595 Near SYP-UNI tunnel 832619 816064 82
11SW-A/R590 Near SYP Station 832678 816100 73
11SW-A/R588 Near SYP Station 832663 816124 75
11SW-A/R587 Near SYP Station 832700 816136 63
11SW-A/R587 Near SYP-UNI tunnel 832689 816134 69
A10-G36

Slope Register Section Easting (m) Northing (m) Level (mPD)
11SW-A/R584 Near SYP-UNI tunnel 832551 816079 65
11SW-A/R583 Near SYP-UNI tunnel 832592 816084 69
11SW-A/R579 Near SYP Station 832598 816140 72
11SW-A/R578 Near SYP Station 832618 816155 67
11SW-A/R578 Near SYP-UNI tunnel 832616 816155 64
11SW-A/R577 Near SYP Station 832690 816172 57
11SW-A/R563 Near SYP-UNI tunnel 832392 816145 48
11SW-A/R561 Near SYP-UNI tunnel 832333 816203 40
11SW-A/R559 Near SYP-UNI tunnel 832464 816201 44
11SW-A/R558 Near SYP-UNI tunnel 832428 816164 47
11SW-A/R557 Near SYP-UNI tunnel 832495 816137 59
11SW-A/R556 Near SYP-UNI tunnel 832529 816168 51
11SW-A/R555 Near SYP-UNI tunnel 832519 816152 51
11SW-A/R552 Near SYP Station 832760 816194 52
11SW-A/R551 Near SYP Station 832775 816188 51
11SW-A/R543 Near SYP Station 832890 816193 57
11SW-A/R542 Near SYP-UNI tunnel 832284 816241 46
11SW-A/R527 Near SYP-UNI tunnel 832472 816204 44
11SW-A/R526 Near SYP-UNI tunnel 832512 816213 42
11SW-A/R525 Near SYP-UNI tunnel 832428 816221 42
11SW-A/R507 Near SYP Station 832606 816279 35
11SW-A/R507 Near SYP-UNI tunnel 832626 816278 45
11SW-A/R504 Near SYP-UNI tunnel 832595 816294 32
11SW-A/R503 Near SYP Station 832671 816289 33
11SW-A/R503 Near SYP-UNI tunnel 832674 816290 32
11SW-A/R502 Near SYP Station 832669 816275 40
11SW-A/R502 Near SYP-UNI tunnel 832677 816275 37
11SW-A/R501 Near SYP-UNI tunnel 832564 816218 53
11SW-A/R500 Near SYP Station 832620 816232 56
11SW-A/R499 Near SYP Station 832678 816216 47
11SW-A/R499 Near SYP-UNI tunnel 832663 816216 49
11SW-A/R498 Near SYP Station 832755 816201 47
11SW-A/R498 Near SYP-UNI tunnel 832730 816202 55
11SW-A/R490 Near SYP Station 832745 816329 32
11SW-A/R489 Near SYP Station 832675 816328 25
11SW-A/R486 Near SHW-SYP tunnel 832812 816340 24
11SW-A/R483 Near SYP Station 832723 816232 46
11SW-A/R482 Near SYP Station 832762 816226 39
11SW-A/R481 Near SYP Station 832778 816216 47
11SW-A/R479 Near SYP Station 832800 816245 40
11SW-A/R478 Near SYP Station 832834 816212 45
11SW-A/R476 Near SYP Station 832887 816206 54
11SW-A/R473 Near SYP Station 832845 816243 41
11SW-A/R472 Near SYP Station 832851 816329 37
11SW-A/R471 Near SYP Station 832860 816325 37
11SW-A/R470 Near SYP Station 832890 816351 37
11SW-A/R469 Near SYP Station 832892 816342 37
11SW-A/R461 Near SHW-SYP tunnel 832875 816404 24
11SW-A/R458 Near SYP Station 832952 816390 28
11SW-A/R457 Near SHW-SYP tunnel 832905 816420 19
11SW-A/R349 Near SYP-UNI tunnel 832145 816161 41
11SW-A/R349 Near UNI Station 832144.474 816160.852 43
11SW-A/R346 Near UNI Station 831933.874 816138.914 64
11SW-A/R345 Near UNI-KET Tunnel 831543.917 815889.176 42
A10-G37
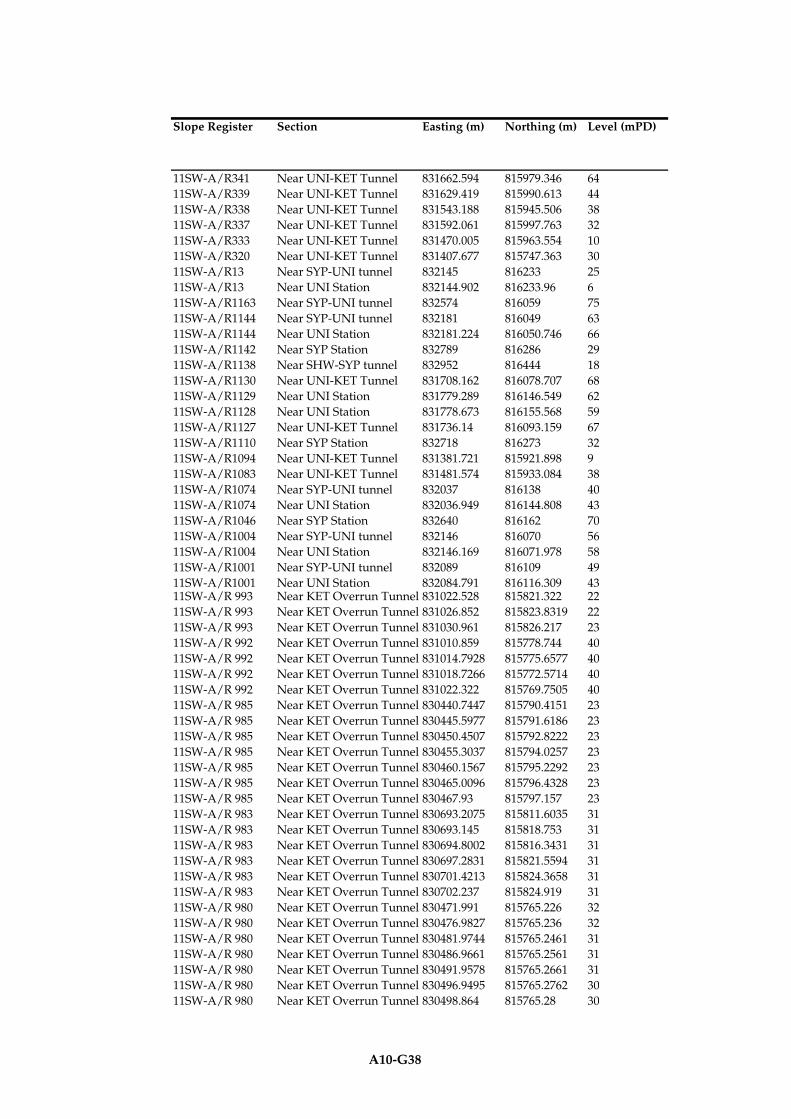
Slope Register Section Easting (m) Northing (m) Level (mPD)
11SW-A/R341 Near UNI-KET Tunnel 831662.594 815979.346 64
11SW-A/R339 Near UNI-KET Tunnel 831629.419 815990.613 44
11SW-A/R338 Near UNI-KET Tunnel 831543.188 815945.506 38
11SW-A/R337 Near UNI-KET Tunnel 831592.061 815997.763 32
11SW-A/R333 Near UNI-KET Tunnel 831470.005 815963.554 10
11SW-A/R320 Near UNI-KET Tunnel 831407.677 815747.363 30
11SW-A/R13 Near SYP-UNI tunnel 832145 816233 25
11SW-A/R13 Near UNI Station 832144.902 816233.96 6
11SW-A/R1163 Near SYP-UNI tunnel 832574 816059 75
11SW-A/R1144 Near SYP-UNI tunnel 832181 816049 63
11SW-A/R1144 Near UNI Station 832181.224 816050.746 66
11SW-A/R1142 Near SYP Station 832789 816286 29
11SW-A/R1138 Near SHW-SYP tunnel 832952 816444 18
11SW-A/R1130 Near UNI-KET Tunnel 831708.162 816078.707 68
11SW-A/R1129 Near UNI Station 831779.289 816146.549 62
11SW-A/R1128 Near UNI Station 831778.673 816155.568 59
11SW-A/R1127 Near UNI-KET Tunnel 831736.14 816093.159 67
11SW-A/R1110 Near SYP Station 832718 816273 32
11SW-A/R1094 Near UNI-KET Tunnel 831381.721 815921.898 9
11SW-A/R1083 Near UNI-KET Tunnel 831481.574 815933.084 38
11SW-A/R1074 Near SYP-UNI tunnel 832037 816138 40
11SW-A/R1074 Near UNI Station 832036.949 816144.808 43
11SW-A/R1046 Near SYP Station 832640 816162 70
11SW-A/R1004 Near SYP-UNI tunnel 832146 816070 56
11SW-A/R1004 Near UNI Station 832146.169 816071.978 58
11SW-A/R1001 Near SYP-UNI tunnel 832089 816109 49
11SW-A/R1001 Near UNI Station 832084.791 816116.309 4311SW-A/R 993 Near KET Overrun Tunnel 831022.528 815821.322 22
11SW-A/R 993 Near KET Overrun Tunnel 831026.852 815823.8319 22
11SW-A/R 993 Near KET Overrun Tunnel 831030.961 815826.217 23
11SW-A/R 992 Near KET Overrun Tunnel 831010.859 815778.744 40
11SW-A/R 992 Near KET Overrun Tunnel 831014.7928 815775.6577 40
11SW-A/R 992 Near KET Overrun Tunnel 831018.7266 815772.5714 40
11SW-A/R 992 Near KET Overrun Tunnel 831022.322 815769.7505 40
11SW-A/R 985 Near KET Overrun Tunnel 830440.7447 815790.4151 23
11SW-A/R 985 Near KET Overrun Tunnel 830445.5977 815791.6186 23
11SW-A/R 985 Near KET Overrun Tunnel 830450.4507 815792.8222 23
11SW-A/R 985 Near KET Overrun Tunnel 830455.3037 815794.0257 23
11SW-A/R 985 Near KET Overrun Tunnel 830460.1567 815795.2292 23
11SW-A/R 985 Near KET Overrun Tunnel 830465.0096 815796.4328 23
11SW-A/R 985 Near KET Overrun Tunnel 830467.93 815797.157 23
11SW-A/R 983 Near KET Overrun Tunnel 830693.2075 815811.6035 31
11SW-A/R 983 Near KET Overrun Tunnel 830693.145 815818.753 31
11SW-A/R 983 Near KET Overrun Tunnel 830694.8002 815816.3431 31
11SW-A/R 983 Near KET Overrun Tunnel 830697.2831 815821.5594 31
11SW-A/R 983 Near KET Overrun Tunnel 830701.4213 815824.3658 31
11SW-A/R 983 Near KET Overrun Tunnel 830702.237 815824.919 31
11SW-A/R 980 Near KET Overrun Tunnel 830471.991 815765.226 32
11SW-A/R 980 Near KET Overrun Tunnel 830476.9827 815765.236 32
11SW-A/R 980 Near KET Overrun Tunnel 830481.9744 815765.2461 31
11SW-A/R 980 Near KET Overrun Tunnel 830486.9661 815765.2561 31
11SW-A/R 980 Near KET Overrun Tunnel 830491.9578 815765.2661 31
11SW-A/R 980 Near KET Overrun Tunnel 830496.9495 815765.2762 30
11SW-A/R 980 Near KET Overrun Tunnel 830498.864 815765.28 30
A10-G38

Slope Register Section Easting (m) Northing (m) Level (mPD)
11SW-A/R 979 Near KET Overrun Tunnel 830425.7111 815755.4997 33
11SW-A/R 979 Near KET Overrun Tunnel 830429.1924 815756.4802 33
11SW-A/R 979 Near KET Overrun Tunnel 830434.0052 815757.8356 33
11SW-A/R 979 Near KET Overrun Tunnel 830438.818 815759.191 33
11SW-A/R 838 Near KET Overrun Tunnel 831097.374 815805.629 8
11SW-A/R 838 Near KET Overrun Tunnel 831106.425 815811.1077 8
11SW-A/R 838 Near KET Overrun Tunnel 831111.3416 815812.0176 8
11SW-A/R 838 Near KET Overrun Tunnel 831116.2581 815812.9274 8
11SW-A/R 838 Near KET Overrun Tunnel 831121.1746 815813.8373 8
11SW-A/R 838 Near KET Overrun Tunnel 831126.0911 815814.7472 8
11SW-A/R 838 Near KET Overrun Tunnel 831131.0076 815815.657 8
11SW-A/R 838 Near KET Overrun Tunnel 831135.9241 815816.5669 8
11SW-A/R 838 Near KET Overrun Tunnel 831140.8407 815817.4767 8
11SW-A/R 838 Near KET Overrun Tunnel 831145.7572 815818.3866 8
11SW-A/R 838 Near KET Overrun Tunnel 831150.6737 815819.2965 8
11SW-A/R 838 Near KET Overrun Tunnel 831155.5902 815820.2063 8
11SW-A/R 838 Near KET Overrun Tunnel 831160.5067 815821.1162 8
11SW-A/R 838 Near KET Overrun Tunnel 831165.4233 815822.0261 8
11SW-A/R 838 Near KET Overrun Tunnel 831170.3398 815822.9359 8
11SW-A/R 838 Near KET Overrun Tunnel 831173.8677 815823.5888 8
11SW-A/R 830 Near KET Overrun Tunnel 831023.0013 815808.5846 26
11SW-A/R 830 Near KET Overrun Tunnel 831024.0419 815803.6941 26
11SW-A/R 830 Near KET Overrun Tunnel 831025.0824 815798.8035 26
11SW-A/R 830 Near KET Overrun Tunnel 831026.123 815793.913 26
11SW-A/R 776 Near KET Overrun Tunnel 830447.208 815771.5235 30
11SW-A/R 776 Near KET Overrun Tunnel 830448.7352 815771.6228 30
11SW-A/R 776 Near KET Overrun Tunnel 830453.7247 815771.9471 30
11SW-A/R 776 Near KET Overrun Tunnel 830458.7141 815772.2714 30
11SW-A/R 776 Near KET Overrun Tunnel 830463.7036 815772.5957 30
11SW-A/R 775 Near KET Overrun Tunnel 830479.127 815784.653 22
11SW-A/R 775 Near KET Overrun Tunnel 830483.3938 815787.2596 22
11SW-A/R 775 Near KET Overrun Tunnel 830487.6606 815789.8662 22
11SW-A/R 775 Near KET Overrun Tunnel 830491.9274 815792.4728 22
11SW-A/R 775 Near KET Overrun Tunnel 830492.468 815792.803 22
11SW-A/R 773 Near KET Overrun Tunnel 830546.784 815770.845 47
11SW-A/R 773 Near KET Overrun Tunnel 830551.7601 815770.3803 47
11SW-A/R 773 Near KET Overrun Tunnel 830556.7362 815769.9156 47
11SW-A/R 773 Near KET Overrun Tunnel 830561.7123 815769.451 47
11SW-A/R 773 Near KET Overrun Tunnel 830566.6884 815768.9863 47
11SW-A/R 773 Near KET Overrun Tunnel 830571.6645 815768.5216 47
11SW-A/R 773 Near KET Overrun Tunnel 830576.6406 815768.0569 47
11SW-A/R 773 Near KET Overrun Tunnel 830581.6166 815767.5922 46
11SW-A/R 773 Near KET Overrun Tunnel 830584.532 815767.32 46
11SW-A/R 323 Near KET Overrun Tunnel 831107.077 815765.433 18
11SW-A/R 323 Near KET Overrun Tunnel 831111.991 815766.3565 18
11SW-A/R 323 Near KET Overrun Tunnel 831121.8189 815768.2034 18
11SW-A/R 323 Near KET Overrun Tunnel 831126.7329 815769.1268 18
11SW-A/R 323 Near KET Overrun Tunnel 831131.6469 815770.0503 18
11SW-A/R 323 Near KET Overrun Tunnel 831136.5609 815770.9738 18
11SW-A/R 323 Near KET Overrun Tunnel 831141.4749 815771.8972 18
11SW-A/R 323 Near KET Overrun Tunnel 831145.438 815772.642 18
11SW-A/R 322 Near KET Overrun Tunnel 831160.496 815779.37 13
11SW-A/R 322 Near KET Overrun Tunnel 831165.4113 815780.2863 13
11SW-A/R 322 Near KET Overrun Tunnel 831170.3266 815781.2026 13
A10-G39
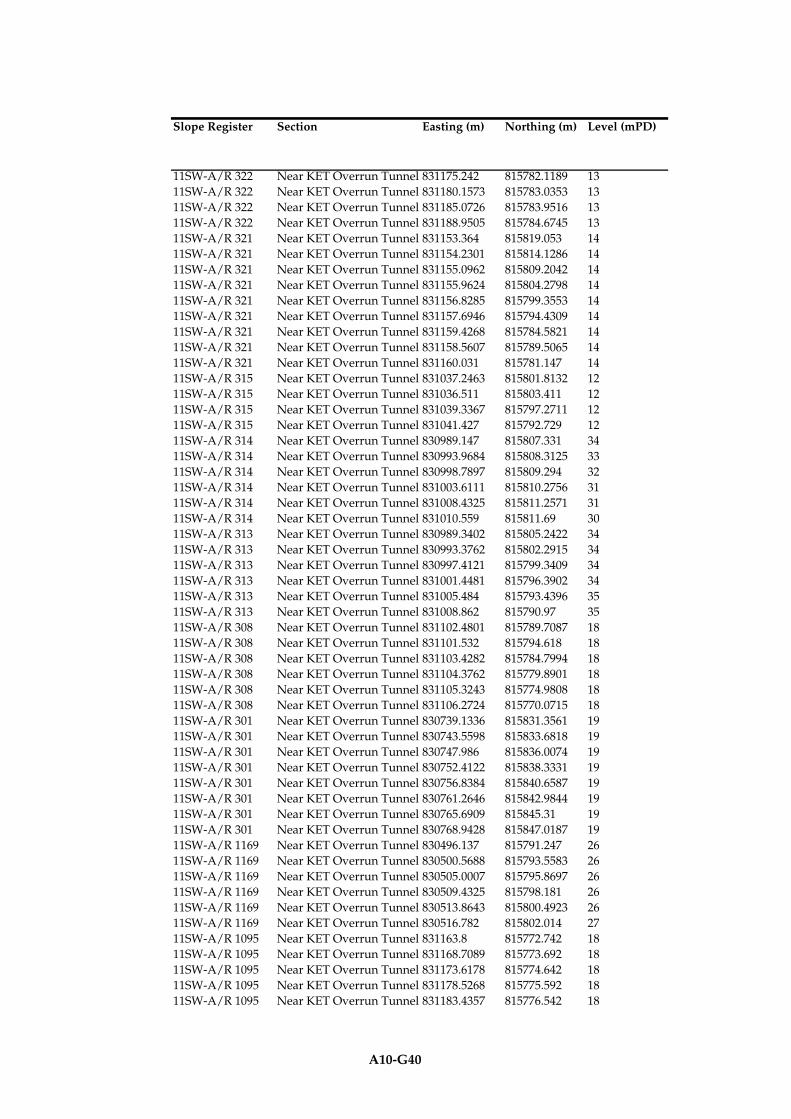
Slope Register Section Easting (m) Northing (m) Level (mPD)
11SW-A/R 322 Near KET Overrun Tunnel 831175.242 815782.1189 13
11SW-A/R 322 Near KET Overrun Tunnel 831180.1573 815783.0353 13
11SW-A/R 322 Near KET Overrun Tunnel 831185.0726 815783.9516 13
11SW-A/R 322 Near KET Overrun Tunnel 831188.9505 815784.6745 13
11SW-A/R 321 Near KET Overrun Tunnel 831153.364 815819.053 14
11SW-A/R 321 Near KET Overrun Tunnel 831154.2301 815814.1286 14
11SW-A/R 321 Near KET Overrun Tunnel 831155.0962 815809.2042 14
11SW-A/R 321 Near KET Overrun Tunnel 831155.9624 815804.2798 14
11SW-A/R 321 Near KET Overrun Tunnel 831156.8285 815799.3553 14
11SW-A/R 321 Near KET Overrun Tunnel 831157.6946 815794.4309 14
11SW-A/R 321 Near KET Overrun Tunnel 831159.4268 815784.5821 14
11SW-A/R 321 Near KET Overrun Tunnel 831158.5607 815789.5065 14
11SW-A/R 321 Near KET Overrun Tunnel 831160.031 815781.147 14
11SW-A/R 315 Near KET Overrun Tunnel 831037.2463 815801.8132 12
11SW-A/R 315 Near KET Overrun Tunnel 831036.511 815803.411 12
11SW-A/R 315 Near KET Overrun Tunnel 831039.3367 815797.2711 12
11SW-A/R 315 Near KET Overrun Tunnel 831041.427 815792.729 12
11SW-A/R 314 Near KET Overrun Tunnel 830989.147 815807.331 34
11SW-A/R 314 Near KET Overrun Tunnel 830993.9684 815808.3125 33
11SW-A/R 314 Near KET Overrun Tunnel 830998.7897 815809.294 32
11SW-A/R 314 Near KET Overrun Tunnel 831003.6111 815810.2756 31
11SW-A/R 314 Near KET Overrun Tunnel 831008.4325 815811.2571 31
11SW-A/R 314 Near KET Overrun Tunnel 831010.559 815811.69 30
11SW-A/R 313 Near KET Overrun Tunnel 830989.3402 815805.2422 34
11SW-A/R 313 Near KET Overrun Tunnel 830993.3762 815802.2915 34
11SW-A/R 313 Near KET Overrun Tunnel 830997.4121 815799.3409 34
11SW-A/R 313 Near KET Overrun Tunnel 831001.4481 815796.3902 34
11SW-A/R 313 Near KET Overrun Tunnel 831005.484 815793.4396 35
11SW-A/R 313 Near KET Overrun Tunnel 831008.862 815790.97 35
11SW-A/R 308 Near KET Overrun Tunnel 831102.4801 815789.7087 18
11SW-A/R 308 Near KET Overrun Tunnel 831101.532 815794.618 18
11SW-A/R 308 Near KET Overrun Tunnel 831103.4282 815784.7994 18
11SW-A/R 308 Near KET Overrun Tunnel 831104.3762 815779.8901 18
11SW-A/R 308 Near KET Overrun Tunnel 831105.3243 815774.9808 18
11SW-A/R 308 Near KET Overrun Tunnel 831106.2724 815770.0715 18
11SW-A/R 301 Near KET Overrun Tunnel 830739.1336 815831.3561 19
11SW-A/R 301 Near KET Overrun Tunnel 830743.5598 815833.6818 19
11SW-A/R 301 Near KET Overrun Tunnel 830747.986 815836.0074 19
11SW-A/R 301 Near KET Overrun Tunnel 830752.4122 815838.3331 19
11SW-A/R 301 Near KET Overrun Tunnel 830756.8384 815840.6587 19
11SW-A/R 301 Near KET Overrun Tunnel 830761.2646 815842.9844 19
11SW-A/R 301 Near KET Overrun Tunnel 830765.6909 815845.31 19
11SW-A/R 301 Near KET Overrun Tunnel 830768.9428 815847.0187 19
11SW-A/R 1169 Near KET Overrun Tunnel 830496.137 815791.247 26
11SW-A/R 1169 Near KET Overrun Tunnel 830500.5688 815793.5583 26
11SW-A/R 1169 Near KET Overrun Tunnel 830505.0007 815795.8697 26
11SW-A/R 1169 Near KET Overrun Tunnel 830509.4325 815798.181 26
11SW-A/R 1169 Near KET Overrun Tunnel 830513.8643 815800.4923 26
11SW-A/R 1169 Near KET Overrun Tunnel 830516.782 815802.014 27
11SW-A/R 1095 Near KET Overrun Tunnel 831163.8 815772.742 18
11SW-A/R 1095 Near KET Overrun Tunnel 831168.7089 815773.692 18
11SW-A/R 1095 Near KET Overrun Tunnel 831173.6178 815774.642 18
11SW-A/R 1095 Near KET Overrun Tunnel 831178.5268 815775.592 18
11SW-A/R 1095 Near KET Overrun Tunnel 831183.4357 815776.542 18
A10-G40
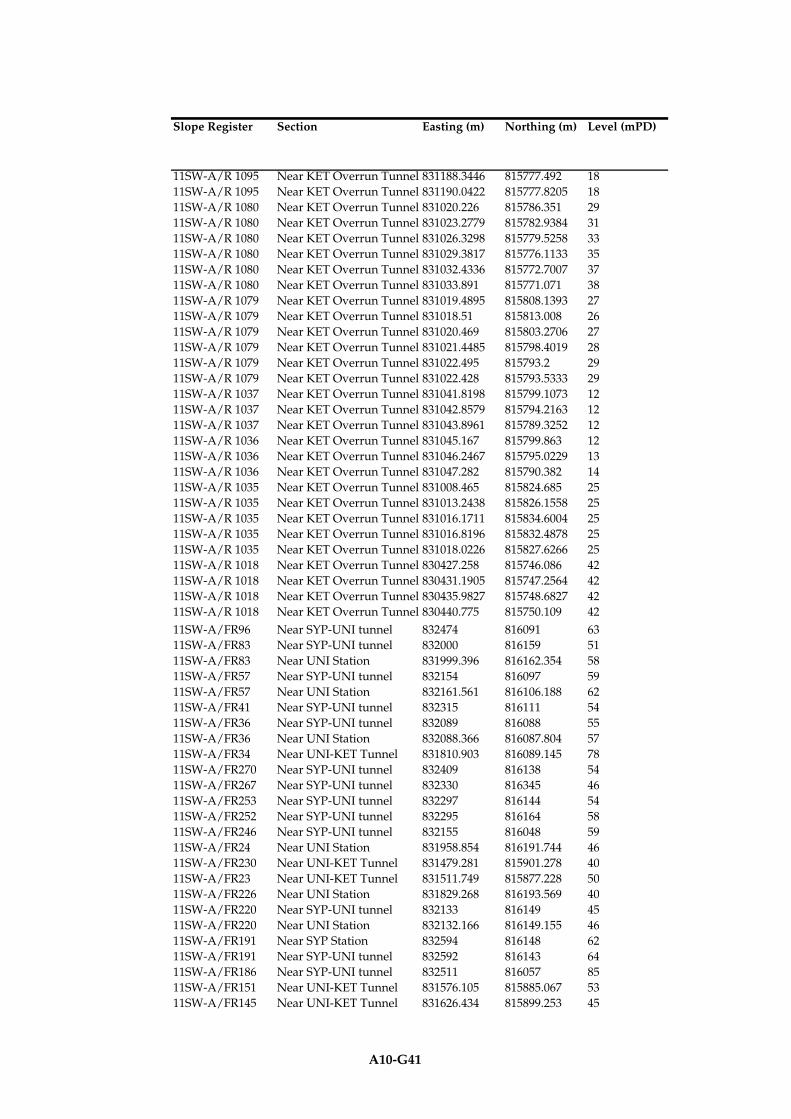
Slope Register Section Easting (m) Northing (m) Level (mPD)
11SW-A/R 1095 Near KET Overrun Tunnel 831188.3446 815777.492 18
11SW-A/R 1095 Near KET Overrun Tunnel 831190.0422 815777.8205 18
11SW-A/R 1080 Near KET Overrun Tunnel 831020.226 815786.351 29
11SW-A/R 1080 Near KET Overrun Tunnel 831023.2779 815782.9384 31
11SW-A/R 1080 Near KET Overrun Tunnel 831026.3298 815779.5258 33
11SW-A/R 1080 Near KET Overrun Tunnel 831029.3817 815776.1133 35
11SW-A/R 1080 Near KET Overrun Tunnel 831032.4336 815772.7007 37
11SW-A/R 1080 Near KET Overrun Tunnel 831033.891 815771.071 38
11SW-A/R 1079 Near KET Overrun Tunnel 831019.4895 815808.1393 27
11SW-A/R 1079 Near KET Overrun Tunnel 831018.51 815813.008 26
11SW-A/R 1079 Near KET Overrun Tunnel 831020.469 815803.2706 27
11SW-A/R 1079 Near KET Overrun Tunnel 831021.4485 815798.4019 28
11SW-A/R 1079 Near KET Overrun Tunnel 831022.495 815793.2 29
11SW-A/R 1079 Near KET Overrun Tunnel 831022.428 815793.5333 29
11SW-A/R 1037 Near KET Overrun Tunnel 831041.8198 815799.1073 12
11SW-A/R 1037 Near KET Overrun Tunnel 831042.8579 815794.2163 12
11SW-A/R 1037 Near KET Overrun Tunnel 831043.8961 815789.3252 12
11SW-A/R 1036 Near KET Overrun Tunnel 831045.167 815799.863 12
11SW-A/R 1036 Near KET Overrun Tunnel 831046.2467 815795.0229 13
11SW-A/R 1036 Near KET Overrun Tunnel 831047.282 815790.382 14
11SW-A/R 1035 Near KET Overrun Tunnel 831008.465 815824.685 25
11SW-A/R 1035 Near KET Overrun Tunnel 831013.2438 815826.1558 25
11SW-A/R 1035 Near KET Overrun Tunnel 831016.1711 815834.6004 25
11SW-A/R 1035 Near KET Overrun Tunnel 831016.8196 815832.4878 25
11SW-A/R 1035 Near KET Overrun Tunnel 831018.0226 815827.6266 25
11SW-A/R 1018 Near KET Overrun Tunnel 830427.258 815746.086 42
11SW-A/R 1018 Near KET Overrun Tunnel 830431.1905 815747.2564 42
11SW-A/R 1018 Near KET Overrun Tunnel 830435.9827 815748.6827 42
11SW-A/R 1018 Near KET Overrun Tunnel 830440.775 815750.109 42
11SW-A/FR96 Near SYP-UNI tunnel 832474 816091 63
11SW-A/FR83 Near SYP-UNI tunnel 832000 816159 51
11SW-A/FR83 Near UNI Station 831999.396 816162.354 58
11SW-A/FR57 Near SYP-UNI tunnel 832154 816097 59
11SW-A/FR57 Near UNI Station 832161.561 816106.188 62
11SW-A/FR41 Near SYP-UNI tunnel 832315 816111 54
11SW-A/FR36 Near SYP-UNI tunnel 832089 816088 55
11SW-A/FR36 Near UNI Station 832088.366 816087.804 57
11SW-A/FR34 Near UNI-KET Tunnel 831810.903 816089.145 78
11SW-A/FR270 Near SYP-UNI tunnel 832409 816138 54
11SW-A/FR267 Near SYP-UNI tunnel 832330 816345 46
11SW-A/FR253 Near SYP-UNI tunnel 832297 816144 54
11SW-A/FR252 Near SYP-UNI tunnel 832295 816164 58
11SW-A/FR246 Near SYP-UNI tunnel 832155 816048 59
11SW-A/FR24 Near UNI Station 831958.854 816191.744 46
11SW-A/FR230 Near UNI-KET Tunnel 831479.281 815901.278 40
11SW-A/FR23 Near UNI-KET Tunnel 831511.749 815877.228 50
11SW-A/FR226 Near UNI Station 831829.268 816193.569 40
11SW-A/FR220 Near SYP-UNI tunnel 832133 816149 45
11SW-A/FR220 Near UNI Station 832132.166 816149.155 46
11SW-A/FR191 Near SYP Station 832594 816148 62
11SW-A/FR191 Near SYP-UNI tunnel 832592 816143 64
11SW-A/FR186 Near SYP-UNI tunnel 832511 816057 85
11SW-A/FR151 Near UNI-KET Tunnel 831576.105 815885.067 53
11SW-A/FR145 Near UNI-KET Tunnel 831626.434 815899.253 45
A10-G41

Slope Register Section Easting (m) Northing (m) Level (mPD)
11SW-A/FR141 Near SYP Station 832800 816112 72
11SW-A/FR14 Near SYP Station 832952 816255 45
11SW-A/FR116 Near SYP-UNI tunnel 832141 816269 16
11SW-A/FR116 Near UNI Station 832142.483 816272.781 1611SW-A/FR 79 Near KET Overrun Tunnel 830802.4825 815718.111 72
11SW-A/FR 79 Near KET Overrun Tunnel 830807.4799 815718.2419 72
11SW-A/FR 79 Near KET Overrun Tunnel 830812.4773 815718.3727 72
11SW-A/FR 79 Near KET Overrun Tunnel 830813.2135 815718.392 73
11SW-A/FR 79 Near KET Overrun Tunnel 830818.0091 815716.9771 72
11SW-A/FR 79 Near KET Overrun Tunnel 830821.565 815715.928 72
11SW-A/FR 79 Near KET Overrun Tunnel 830824.9186 815719.3336 71
11SW-A/FR 79 Near KET Overrun Tunnel 830828.2722 815722.7392 69
11SW-A/FR 79 Near KET Overrun Tunnel 830831.6258 815726.1448 68
11SW-A/FR 79 Near KET Overrun Tunnel 830832.141 815726.668 68
11SW-A/FR 50 Near KET Overrun Tunnel 831046.433 815765.296 38
11SW-A/FR 50 Near KET Overrun Tunnel 831047.0182 815765.4773 38
11SW-A/FR 50 Near KET Overrun Tunnel 831051.758 815766.946 38
11SW-A/FR 49 Near KET Overrun Tunnel 831004.197 815747.8445 52
11SW-A/FR 49 Near KET Overrun Tunnel 831007.6025 815751.181 50
11SW-A/FR 49 Near KET Overrun Tunnel 831011.0079 815754.5176 49
11SW-A/FR 49 Near KET Overrun Tunnel 831014.4134 815757.8541 47
11SW-A/FR 49 Near KET Overrun Tunnel 831017.758 815761.131 46
11SW-A/FR 47 Near KET Overrun Tunnel 830948.775 815772.981 59
11SW-A/FR 47 Near KET Overrun Tunnel 830952.5533 815769.7062 59
11SW-A/FR 47 Near KET Overrun Tunnel 830956.3316 815766.4314 59
11SW-A/FR 47 Near KET Overrun Tunnel 830960.1099 815763.1566 59
11SW-A/FR 47 Near KET Overrun Tunnel 830963.8882 815759.8817 59
11SW-A/FR 47 Near KET Overrun Tunnel 830965.457 815758.522 59
11SW-A/FR 47 Near KET Overrun Tunnel 830968.2127 815762.0545 57
11SW-A/FR 47 Near KET Overrun Tunnel 830970.9684 815765.587 55
11SW-A/FR 47 Near KET Overrun Tunnel 830973.7241 815769.1195 52
11SW-A/FR 47 Near KET Overrun Tunnel 830974.1468 815769.6613 52
11SW-A/FR 47 Near KET Overrun Tunnel 830984.153 815768.8992 50
11SW-A/FR 47 Near KET Overrun Tunnel 830986.1745 815772.1016 47
11SW-A/FR 47 Near KET Overrun Tunnel 830988.196 815775.304 44
11SW-A/FR 47 Near KET Overrun Tunnel 830990.2175 815778.5065 41
11SW-A/FR 184 Near KET Overrun Tunnel 830997.378 815752.292 51
11SW-A/FR 184 Near KET Overrun Tunnel 831000.2873 815756.2642 50
11SW-A/FR 184 Near KET Overrun Tunnel 831003.1966 815760.2363 49
11SW-A/FR 184 Near KET Overrun Tunnel 831006.1059 815764.2085 48
11SW-A/FR 184 Near KET Overrun Tunnel 831009.0151 815768.1807 47
11SW-A/FR 183 Near KET Overrun Tunnel 831030.453 815786.34 38
11SW-A/FR 183 Near KET Overrun Tunnel 831033.6091 815786.9686 34
11SW-A/FR 183 Near KET Overrun Tunnel 831036.7652 815787.5973 30
11SW-A/FR 183 Near KET Overrun Tunnel 831039.9213 815788.2259 27
11SW-A/FR 183 Near KET Overrun Tunnel 831040.68 815788.377 26
11SW-A/FR 181 Near KET Overrun Tunnel 830935.33 815788.9825 59
11SW-A/FR 181 Near KET Overrun Tunnel 830939.0112 815791.3684 57
11SW-A/FR 181 Near KET Overrun Tunnel 830942.6923 815793.7542 54
11SW-A/FR 181 Near KET Overrun Tunnel 830946.3735 815796.1401 52
11SW-A/FR 181 Near KET Overrun Tunnel 830950.0546 815798.5259 50
11SW-A/FR 181 Near KET Overrun Tunnel 830951.593 815799.523 49
11SW-A/FR 180 Near KET Overrun Tunnel 830983.7368 815759.8285 49
11SW-A/FR 180 Near KET Overrun Tunnel 830986.3718 815763.4411 47
A10-G42

Slope Register Section Easting (m) Northing (m) Level (mPD)
11SW-A/FR 180 Near KET Overrun Tunnel 830989.0068 815767.0537 44
11SW-A/FR 180 Near KET Overrun Tunnel 830991.6418 815770.6663 42
11SW-A/FR 180 Near KET Overrun Tunnel 830994.2768 815774.2789 40
11SW-A/FR 180 Near KET Overrun Tunnel 830996.9119 815777.8915 38
11SW-A/FR 140 Near KET Overrun Tunnel 830954.203 815795.34 49
11SW-A/FR 140 Near KET Overrun Tunnel 830957.6067 815797.7955 46
11SW-A/FR 140 Near KET Overrun Tunnel 830961.0105 815800.2511 43
11SW-A/FR 140 Near KET Overrun Tunnel 830964.4142 815802.7066 40
11SW-A/FR 140 Near KET Overrun Tunnel 830967.818 815805.1622 38
11SW-A/F99 Near SYP-UNI tunnel 832486 816032 82
11SW-A/F78 Near UNI-KET Tunnel 831739.5 816142.351 55
11SW-A/F46 Near SYP-UNI tunnel 832519 816041 81
11SW-A/F39 Near UNI-KET Tunnel 831659.685 816057.867 51
11SW-A/F37 Near SYP-UNI tunnel 832051 816132 43
11SW-A/F37 Near UNI Station 832055.806 816136.375 46
11SW-A/F28 Near UNI Station 831695.364 816197.643 33
11SW-A/F229 Near UNI-KET Tunnel 831702.613 816160.258 50
11SW-A/F228 Near UNI-KET Tunnel 831734.25 816179.137 43
11SW-A/F227 Near UNI Station 831766.758 816224.228 50
11SW-A/F217 Near SYP-UNI tunnel 832415 816126 56
11SW-A/F147 Near SYP-UNI tunnel 832030 816109 50
11SW-A/F147 Near UNI Station 832029.802 816110.268 5511SW-A/F 257 Near KET Overrun Tunnel 830562.627 815733.544 66
11SW-A/F 257 Near KET Overrun Tunnel 830563.197 815735.508 65
11SW-A/F 257 Near KET Overrun Tunnel 830564.1051 815733.1103 66
11SW-A/F 257 Near KET Overrun Tunnel 830564.8025 815736.2494 65
11SW-A/F 257 Near KET Overrun Tunnel 830568.8809 815731.7092 66
11SW-A/F 257 Near KET Overrun Tunnel 830573.6567 815730.3081 67
11SW-A/F 257 Near KET Overrun Tunnel 830578.4325 815728.907 67
11SW-A/F 257 Near KET Overrun Tunnel 830583.2082 815727.5058 68
11SW-A/F 257 Near KET Overrun Tunnel 830587.984 815726.1047 68
11SW-A/F 257 Near KET Overrun Tunnel 830622.8835 815722.4475 58
11SW-A/F 257 Near KET Overrun Tunnel 830622.9168 815724.7598 59
11SW-A/F 257 Near KET Overrun Tunnel 830622.987 815729.64 60
11SW-A/F 248 Near KET Overrun Tunnel 830545.429 815751.5 55
11SW-A/F 248 Near KET Overrun Tunnel 830546.397 815748.168 56
11SW-A/F 248 Near KET Overrun Tunnel 830551.0443 815749.2975 58
11SW-A/F 248 Near KET Overrun Tunnel 830554.873 815750.228 59
11SW-A/F 231 Near KET Overrun Tunnel 830668.221 815799.304 38
11SW-A/F 231 Near KET Overrun Tunnel 830673.1784 815798.6841 38
11SW-A/F 231 Near KET Overrun Tunnel 830675.6906 815798.3699 39
11SW-A/F 231 Near KET Overrun Tunnel 830680.0482 815800.8006 38
11SW-A/F 231 Near KET Overrun Tunnel 830684.4058 815803.2314 38
11SW-A/F 231 Near KET Overrun Tunnel 830687.797 815805.123 38
11SW-A/F 138 Near KET Overrun Tunnel 830458.246 815799.431 23
11SW-A/F 138 Near KET Overrun Tunnel 830462.0118 815811.1118 25
11SW-A/F 138 Near KET Overrun Tunnel 830463.1121 815798.449 24
11SW-A/F 138 Near KET Overrun Tunnel 830463.4805 815807.0378 25
11SW-A/F 138 Near KET Overrun Tunnel 830465.1598 815802.3799 24
11SW-A/F 138 Near KET Overrun Tunnel 830466.3975 815797.786 24
11SW-A/F 138 Near KET Overrun Tunnel 830466.839 815797.722 23
11SW-A/DT8 Near SYP-UNI tunnel 832418 816014 9011SW-A/DT 6 Near KET Overrun Tunnel 830652.6004 815715.8528 56
11SW-A/DT 6 Near KET Overrun Tunnel 830654.1225 815716.9077 56
A10-G43

Slope Register Section Easting (m) Northing (m) Level (mPD)
11SW-A/DT 6 Near KET Overrun Tunnel 830658.2308 815719.7548 56
11SW-A/DT 6 Near KET Overrun Tunnel 830662.339 815722.602 57
11SW-A/DT 6 Near KET Overrun Tunnel 830662.917 815717.755 56
11SW-A/CR87 Near SYP-UNI tunnel 832593 816105 67
11SW-A/CR86 Near SYP-UNI tunnel 832549 816098 59
11SW-A/CR750 Near UNI-KET Tunnel 831684.923 815988.713 29
11SW-A/CR713 Near SYP-UNI tunnel 832016 816082 58
11SW-A/CR713 Near UNI Station 832006.767 816081.573 61
11SW-A/CR711 Near SYP-UNI tunnel 832030 816134 40
11SW-A/CR711 Near UNI Station 832028.369 816135.576 42
11SW-A/CR597 Near SYP-UNI tunnel 832013 816185 33
11SW-A/CR597 Near UNI Station 832010.77 816195.035 37
11SW-A/CR595 Near UNI-KET Tunnel 831620.543 816088.181 24
11SW-A/CR388 Near SYP-UNI tunnel 832391 816036 58
11SW-A/CR243 Near UNI Station 831937.798 816248.408 20
11SW-A/CR241 Near UNI Station 831984.153 816237.688 17
11SW-A/CR198 Near SYP-UNI tunnel 832435 816056 81
11SW-A/CR155 Near UNI-KET Tunnel 831704.652 816255.509 14
11SW-A/CR146 Near UNI Station 831873.562 816134.083 76
11SW-A/CR146 Near UNI Station 831923.562 816134.083 76
11SW-A/CR131 Near UNI-KET Tunnel 831485.468 815785.292 30
11SW-A/CR1167 Near SYP-UNI tunnel 832478 816082 6511SW-A/CR 8 Near KET Overrun Tunnel 830905.485 815710.42 104
11SW-A/CR 8 Near KET Overrun Tunnel 830908.8385 815706.9737 105
11SW-A/CR 8 Near KET Overrun Tunnel 830910.381 815705.3885 106
11SW-A/CR 8 Near KET Overrun Tunnel 831049.4015 815756.0395 43
11SW-A/CR 8 Near KET Overrun Tunnel 831051.5989 815753.003 44
11SW-A/CR 8 Near KET Overrun Tunnel 831056.4149 815753.9232 43
11SW-A/CR 8 Near KET Overrun Tunnel 831061.2309 815754.8433 42
11SW-A/CR 8 Near KET Overrun Tunnel 831066.0469 815755.7635 41
11SW-A/CR 8 Near KET Overrun Tunnel 831078.9903 815760.0729 40
11SW-A/CR 8 Near KET Overrun Tunnel 831081.172 815760.831 40
11SW-A/CR 8 Near KET Overrun Tunnel 831080.945 815763.8786 38
11SW-A/CR 657 Near KET Overrun Tunnel 831071.938 815786.128 27
11SW-A/CR 657 Near KET Overrun Tunnel 831076.4045 815786.006 26
11SW-A/CR 641 Near KET Overrun Tunnel 830725.036 815828.369 20
11SW-A/CR 641 Near KET Overrun Tunnel 830727.237 815824.404 20
11SW-A/CR 641 Near KET Overrun Tunnel 830728.1486 815824.9038 22
11SW-A/CR 641 Near KET Overrun Tunnel 830730.416 815826.147 26
11SW-A/CR 566 Near KET Overrun Tunnel 831075.8125 815766.5101 37
11SW-A/CR 566 Near KET Overrun Tunnel 831077.9718 815767.4064 37
11SW-A/CR 566 Near KET Overrun Tunnel 831079.6718 815764.3823 40
11SW-A/CR 559 Near KET Overrun Tunnel 830556.46 815759.809 55
11SW-A/CR 559 Near KET Overrun Tunnel 830561.4277 815759.2425 55
11SW-A/CR 559 Near KET Overrun Tunnel 830566.3953 815758.6759 56
11SW-A/CR 559 Near KET Overrun Tunnel 830571.363 815758.1094 56
11SW-A/CR 559 Near KET Overrun Tunnel 830576.3307 815757.5429 56
11SW-A/CR 559 Near KET Overrun Tunnel 830581.2984 815756.9763 56
11SW-A/CR 559 Near KET Overrun Tunnel 830582.8225 815756.8025 56
11SW-A/CR 558 Near KET Overrun Tunnel 830542.5795 815738.4755 59
11SW-A/CR 558 Near KET Overrun Tunnel 830546.2495 815735.4758 61
11SW-A/CR 558 Near KET Overrun Tunnel 830550.395 815737.715 62
11SW-A/CR 557 Near KET Overrun Tunnel 830535.219 815731.885 59
11SW-A/CR 557 Near KET Overrun Tunnel 830537.703 815736.2165 59
A10-G44
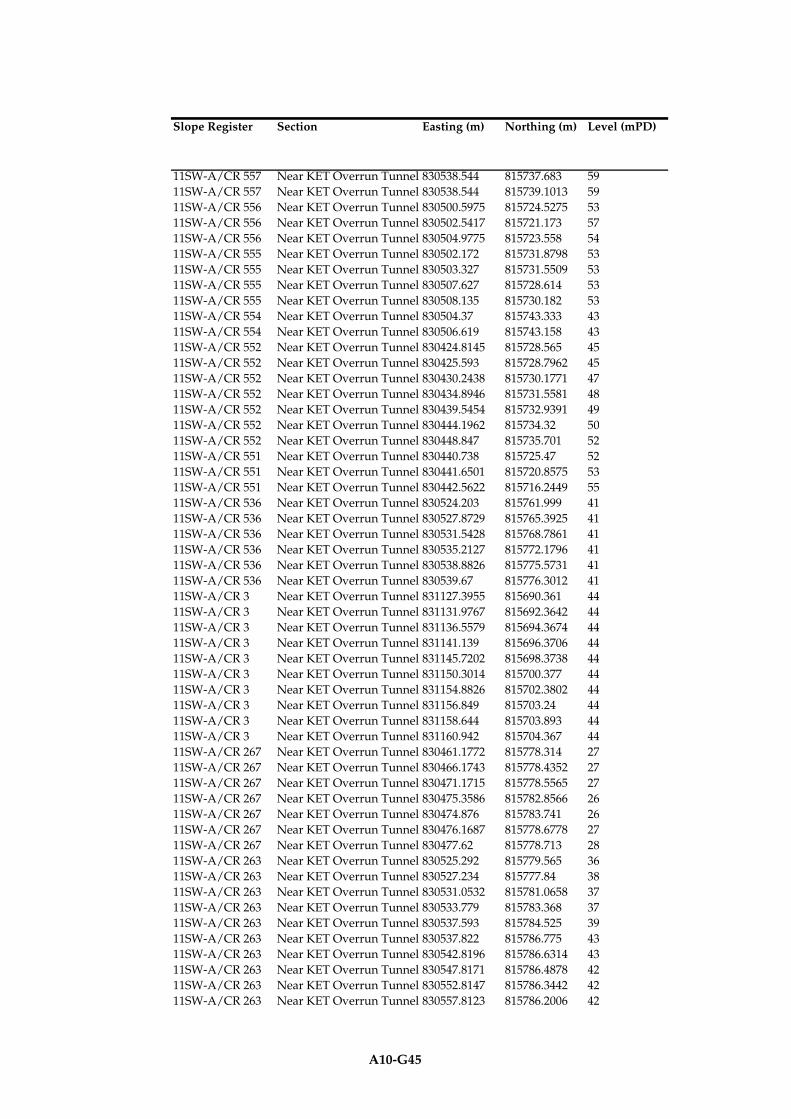
Slope Register Section Easting (m) Northing (m) Level (mPD)
11SW-A/CR 557 Near KET Overrun Tunnel 830538.544 815737.683 59
11SW-A/CR 557 Near KET Overrun Tunnel 830538.544 815739.1013 59
11SW-A/CR 556 Near KET Overrun Tunnel 830500.5975 815724.5275 53
11SW-A/CR 556 Near KET Overrun Tunnel 830502.5417 815721.173 57
11SW-A/CR 556 Near KET Overrun Tunnel 830504.9775 815723.558 54
11SW-A/CR 555 Near KET Overrun Tunnel 830502.172 815731.8798 53
11SW-A/CR 555 Near KET Overrun Tunnel 830503.327 815731.5509 53
11SW-A/CR 555 Near KET Overrun Tunnel 830507.627 815728.614 53
11SW-A/CR 555 Near KET Overrun Tunnel 830508.135 815730.182 53
11SW-A/CR 554 Near KET Overrun Tunnel 830504.37 815743.333 43
11SW-A/CR 554 Near KET Overrun Tunnel 830506.619 815743.158 43
11SW-A/CR 552 Near KET Overrun Tunnel 830424.8145 815728.565 45
11SW-A/CR 552 Near KET Overrun Tunnel 830425.593 815728.7962 45
11SW-A/CR 552 Near KET Overrun Tunnel 830430.2438 815730.1771 47
11SW-A/CR 552 Near KET Overrun Tunnel 830434.8946 815731.5581 48
11SW-A/CR 552 Near KET Overrun Tunnel 830439.5454 815732.9391 49
11SW-A/CR 552 Near KET Overrun Tunnel 830444.1962 815734.32 50
11SW-A/CR 552 Near KET Overrun Tunnel 830448.847 815735.701 52
11SW-A/CR 551 Near KET Overrun Tunnel 830440.738 815725.47 52
11SW-A/CR 551 Near KET Overrun Tunnel 830441.6501 815720.8575 53
11SW-A/CR 551 Near KET Overrun Tunnel 830442.5622 815716.2449 55
11SW-A/CR 536 Near KET Overrun Tunnel 830524.203 815761.999 41
11SW-A/CR 536 Near KET Overrun Tunnel 830527.8729 815765.3925 41
11SW-A/CR 536 Near KET Overrun Tunnel 830531.5428 815768.7861 41
11SW-A/CR 536 Near KET Overrun Tunnel 830535.2127 815772.1796 41
11SW-A/CR 536 Near KET Overrun Tunnel 830538.8826 815775.5731 41
11SW-A/CR 536 Near KET Overrun Tunnel 830539.67 815776.3012 41
11SW-A/CR 3 Near KET Overrun Tunnel 831127.3955 815690.361 44
11SW-A/CR 3 Near KET Overrun Tunnel 831131.9767 815692.3642 44
11SW-A/CR 3 Near KET Overrun Tunnel 831136.5579 815694.3674 44
11SW-A/CR 3 Near KET Overrun Tunnel 831141.139 815696.3706 44
11SW-A/CR 3 Near KET Overrun Tunnel 831145.7202 815698.3738 44
11SW-A/CR 3 Near KET Overrun Tunnel 831150.3014 815700.377 44
11SW-A/CR 3 Near KET Overrun Tunnel 831154.8826 815702.3802 44
11SW-A/CR 3 Near KET Overrun Tunnel 831156.849 815703.24 44
11SW-A/CR 3 Near KET Overrun Tunnel 831158.644 815703.893 44
11SW-A/CR 3 Near KET Overrun Tunnel 831160.942 815704.367 44
11SW-A/CR 267 Near KET Overrun Tunnel 830461.1772 815778.314 27
11SW-A/CR 267 Near KET Overrun Tunnel 830466.1743 815778.4352 27
11SW-A/CR 267 Near KET Overrun Tunnel 830471.1715 815778.5565 27
11SW-A/CR 267 Near KET Overrun Tunnel 830475.3586 815782.8566 26
11SW-A/CR 267 Near KET Overrun Tunnel 830474.876 815783.741 26
11SW-A/CR 267 Near KET Overrun Tunnel 830476.1687 815778.6778 27
11SW-A/CR 267 Near KET Overrun Tunnel 830477.62 815778.713 28
11SW-A/CR 263 Near KET Overrun Tunnel 830525.292 815779.565 36
11SW-A/CR 263 Near KET Overrun Tunnel 830527.234 815777.84 38
11SW-A/CR 263 Near KET Overrun Tunnel 830531.0532 815781.0658 37
11SW-A/CR 263 Near KET Overrun Tunnel 830533.779 815783.368 37
11SW-A/CR 263 Near KET Overrun Tunnel 830537.593 815784.525 39
11SW-A/CR 263 Near KET Overrun Tunnel 830537.822 815786.775 43
11SW-A/CR 263 Near KET Overrun Tunnel 830542.8196 815786.6314 43
11SW-A/CR 263 Near KET Overrun Tunnel 830547.8171 815786.4878 42
11SW-A/CR 263 Near KET Overrun Tunnel 830552.8147 815786.3442 42
11SW-A/CR 263 Near KET Overrun Tunnel 830557.8123 815786.2006 42
A10-G45

Slope Register Section Easting (m) Northing (m) Level (mPD)
11SW-A/CR 263 Near KET Overrun Tunnel 830562.8099 815786.057 42
11SW-A/CR 263 Near KET Overrun Tunnel 830565.975 815785.966 42
11SW-A/CR 260 Near KET Overrun Tunnel 830591.3252 815807.3636 32
11SW-A/CR 260 Near KET Overrun Tunnel 830596.1179 815808.7884 32
11SW-A/CR 260 Near KET Overrun Tunnel 830597.58 815809.223 32
11SW-A/CR 255 Near KET Overrun Tunnel 830659.18 815815.114 35
11SW-A/CR 255 Near KET Overrun Tunnel 830664.1758 815814.9094 35
11SW-A/CR 255 Near KET Overrun Tunnel 830669.1716 815814.7047 35
11SW-A/CR 255 Near KET Overrun Tunnel 830670.068 815814.668 35
11SW-A/CR 253 Near KET Overrun Tunnel 830664.463 815843.194 23
11SW-A/CR 253 Near KET Overrun Tunnel 830669.4573 815842.9559 23
11SW-A/CR 253 Near KET Overrun Tunnel 830670.651 815842.899 23
11SW-A/CR 253 Near KET Overrun Tunnel 830672.091 815844.616 21
11SW-A/CR 253 Near KET Overrun Tunnel 830674.642 815845.395 21
11SW-A/CR 248 Near KET Overrun Tunnel 830693.476 815832.3145 23
11SW-A/CR 248 Near KET Overrun Tunnel 830698.4588 815831.9979 23
11SW-A/CR 248 Near KET Overrun Tunnel 830699.8335 815831.9105 23
11SW-A/CR 118 Near KET Overrun Tunnel 831106.234 815720.799 46
11SW-A/CR 118 Near KET Overrun Tunnel 831108.408 815712.33 52
11SW-A/CR 118 Near KET Overrun Tunnel 831108.283 815712.735 51
11SW-A/CR 118 Near KET Overrun Tunnel 831108.161 815714.504 48
11SW-A/CR 118 Near KET Overrun Tunnel 831107.6343 815716.2244 47
11SW-A/CR 118 Near KET Overrun Tunnel 831109.011 815711.47 52
11SW-A/CR 118 Near KET Overrun Tunnel 831109.1055 815718.8672 46
11SW-A/CR 118 Near KET Overrun Tunnel 831109.944 815710.886 52
11SW-A/CR 118 Near KET Overrun Tunnel 831111.783 815709.719 53
11SW-A/CR 118 Near KET Overrun Tunnel 831112.3972 815715.1036 46
11SW-A/CR 118 Near KET Overrun Tunnel 831113.8308 815705.2293 52
11SW-A/CR 118 Near KET Overrun Tunnel 831115.8787 815700.7397 51
11SW-A/CR 118 Near KET Overrun Tunnel 831115.6889 815711.34 46
11SW-A/CR 118 Near KET Overrun Tunnel 831117.384 815709.402 46
11SW-A/CR 118 Near KET Overrun Tunnel 831117.9265 815696.25 51
11SW-A/CR 118 Near KET Overrun Tunnel 831119.3264 815704.7947 46
11SW-A/CR 118 Near KET Overrun Tunnel 831119.9743 815691.7603 50
11SW-A/CR 118 Near KET Overrun Tunnel 831121.2688 815700.1874 46
11SW-A/CR 118 Near KET Overrun Tunnel 831121.949 815687.431 49
11SW-A/CR 118 Near KET Overrun Tunnel 831122.804 815686.24 48
11SW-A/CR 118 Near KET Overrun Tunnel 831123.2113 815695.5802 46
11SW-A/CR 118 Near KET Overrun Tunnel 831125.063 815691.188 46
11SW-A/CR 1119 Near KET Overrun Tunnel 830642.932 815786.866 41
11SW-A/CR 1119 Near KET Overrun Tunnel 830645.283 815781.428 39
11SW-A/CR 1119 Near KET Overrun Tunnel 830644.8204 815782.4979 40
11SW-A/CR 109 Near KET Overrun Tunnel 830943.437 815800.393 44
11SW-A/CR 109 Near KET Overrun Tunnel 830942.8744 815804.9322 42
11SW-A/CR 109 Near KET Overrun Tunnel 830942.6626 815806.6406 42
11SW-A/CR 109 Near KET Overrun Tunnel 830945.115 815800.199 44
11SW-A/CR 109 Near KET Overrun Tunnel 830945.3884 815800.75 44
11SW-A/CR 109 Near KET Overrun Tunnel 830947.584 815805.175 43
11SW-A/CR 109 Near KET Overrun Tunnel 830948.53 815805.787 42
11SW-A/CR 109 Near KET Overrun Tunnel 830951.1314 815806.2134 41
11SW-A/CR 109 Near KET Overrun Tunnel 830953.852 815802.209 42
11SW-A/CR 109 Near KET Overrun Tunnel 830956.556 815802.893 41
11SW-A/CR 109 Near KET Overrun Tunnel 830957.298 815803.523 41
11SW-A/CR 109 Near KET Overrun Tunnel 830958.0425 815806.3423 39
A10-G46

Slope Register Section Easting (m) Northing (m) Level (mPD)
11SW-A/CR 109 Near KET Overrun Tunnel 830957.934 815811.025 38
11SW-A/CR 107 Near KET Overrun Tunnel 830672.028 815746.857 45
11SW-A/CR 107 Near KET Overrun Tunnel 830672.8988 815745.9555 46
11SW-A/CR 107 Near KET Overrun Tunnel 830675.3466 815743.4212 50
11SW-A/CR 107 Near KET Overrun Tunnel 830676.4444 815749.2012 45
11SW-A/CR 107 Near KET Overrun Tunnel 830677.7945 815740.8869 54
11SW-A/CR 107 Near KET Overrun Tunnel 830680.2423 815738.3526 57
11SW-A/CR 107 Near KET Overrun Tunnel 830680.8608 815751.5454 45
11SW-A/CR 107 Near KET Overrun Tunnel 830682.6902 815735.8183 61
11SW-A/CR 107 Near KET Overrun Tunnel 830685.138 815733.284 64
11SW-A/CR 107 Near KET Overrun Tunnel 830685.2773 815753.8896 45
11SW-A/CR 107 Near KET Overrun Tunnel 830686.669 815732.995 64
11SW-A/CR 107 Near KET Overrun Tunnel 830690.34 815733.8389 64
11SW-A/CR 107 Near KET Overrun Tunnel 830689.6937 815756.2337 45
11SW-A/CR 107 Near KET Overrun Tunnel 830693.638 815720.501 74
11SW-A/CR 107 Near KET Overrun Tunnel 830694.1101 815758.5779 45
11SW-A/CR 107 Near KET Overrun Tunnel 830695.1012 815724.4208 71
11SW-A/CR 107 Near KET Overrun Tunnel 830695.204 815734.957 64
11SW-A/CR 107 Near KET Overrun Tunnel 830695.6801 815717.0194 77
11SW-A/CR 107 Near KET Overrun Tunnel 830696.752 815715.192 79
11SW-A/CR 107 Near KET Overrun Tunnel 830696.5644 815728.3406 69
11SW-A/CR 107 Near KET Overrun Tunnel 830697.395 815734.034 66
11SW-A/CR 107 Near KET Overrun Tunnel 830697.914 815731.956 66
11SW-A/CR 107 Near KET Overrun Tunnel 830697.857 815733.168 66
11SW-A/CR 107 Near KET Overrun Tunnel 830698.5265 815760.9221 45
11SW-A/CR 107 Near KET Overrun Tunnel 830700.858 815715.455 80
11SW-A/CR 107 Near KET Overrun Tunnel 830702.943 815763.2663 45
11SW-A/CR 107 Near KET Overrun Tunnel 830704.077 815713.7506 83
11SW-A/CR 107 Near KET Overrun Tunnel 830704.2113 815763.9395 45
11SW-A/CR 107 Near KET Overrun Tunnel 830704.617 815713.4647 84
11SW-A/CR 107 Near KET Overrun Tunnel 830708.275 815764.893 45
11SW-A/CR 107 Near KET Overrun Tunnel 830708.7369 815711.1909 86
11SW-A/CR 107 Near KET Overrun Tunnel 830712.7645 815709.2395 88
11SW-A/CR 107 Near KET Overrun Tunnel 830713.0827 815764.3432 43
11SW-A/CR 107 Near KET Overrun Tunnel 830715.41 815706.8 89
11SW-A/CR 107 Near KET Overrun Tunnel 830717.2094 815703.2491 91
11SW-A/CR 107 Near KET Overrun Tunnel 830717.3068 815761.4135 43
11SW-A/CR 107 Near KET Overrun Tunnel 830719.3205 815699.0828 93
11SW-A/CR 107 Near KET Overrun Tunnel 830721.4317 815694.9165 94
11SW-A/CR 107 Near KET Overrun Tunnel 830721.3717 815758.5019 43
11SW-A/CR 107 Near KET Overrun Tunnel 830723.5428 815690.7503 96
11SW-A/CR 107 Near KET Overrun Tunnel 830725.4365 815755.5904 43
11SW-A/CR 107 Near KET Overrun Tunnel 830725.654 815686.584 98
11SW-A/CR 107 Near KET Overrun Tunnel 830728.192 815686.353 98
11SW-A/CR 107 Near KET Overrun Tunnel 830729.5014 815752.6788 43
11SW-A/CR 107 Near KET Overrun Tunnel 830731.497 815687.1863 95
11SW-A/CR 107 Near KET Overrun Tunnel 830733.5662 815749.7673 43
11SW-A/CR 107 Near KET Overrun Tunnel 830735.4313 815688.1782 92
11SW-A/CR 107 Near KET Overrun Tunnel 830737.631 815746.8557 43
11SW-A/CR 107 Near KET Overrun Tunnel 830739.3657 815689.1701 89
11SW-A/CR 107 Near KET Overrun Tunnel 830741.6959 815743.9442 43
11SW-A/CR 107 Near KET Overrun Tunnel 830743.3 815690.162 87
11SW-A/CR 107 Near KET Overrun Tunnel 830744.899 815691.0762 86
11SW-A/CR 107 Near KET Overrun Tunnel 830745.7607 815741.0326 43
A10-G47

Slope Register Section Easting (m) Northing (m) Level (mPD)
11SW-A/CR 107 Near KET Overrun Tunnel 830748.951 815693.393 84
11SW-A/CR 107 Near KET Overrun Tunnel 830749.781 815738.153 43
11SW-A/CR 107 Near KET Overrun Tunnel 830751.2562 815695.5364 82
11SW-A/CR 107 Near KET Overrun Tunnel 830754.2229 815698.295 79
11SW-A/CR 107 Near KET Overrun Tunnel 830754.3764 815736.1826 43
11SW-A/CR 107 Near KET Overrun Tunnel 830757.1896 815701.0535 76
11SW-A/CR 107 Near KET Overrun Tunnel 830760.1564 815703.8121 73
11SW-A/CR 107 Near KET Overrun Tunnel 830760.6899 815734.6934 43
11SW-A/CR 107 Near KET Overrun Tunnel 830763.0405 815706.7016 70
11SW-A/CR 107 Near KET Overrun Tunnel 830765.7063 815709.7942 68
11SW-A/CR 107 Near KET Overrun Tunnel 830765.6097 815733.8017 43
11SW-A/CR 107 Near KET Overrun Tunnel 830767.76 815712.1086 66
11SW-A/CR 107 Near KET Overrun Tunnel 830767.992 815733.37 43
11SW-A/CR 107 Near KET Overrun Tunnel 830768.5095 815713.046 65
11SW-A/CR 107 Near KET Overrun Tunnel 830769.2997 815714.1165 64
11SW-A/CR 107 Near KET Overrun Tunnel 830771.7068 815717.2557 61
11SW-A/CR 107 Near KET Overrun Tunnel 830772.7559 815734.8884 43
11SW-A/CR 107 Near KET Overrun Tunnel 830774.1139 815720.3948 58
11SW-A/CR 107 Near KET Overrun Tunnel 830776.521 815723.534 55
11SW-A/CR 107 Near KET Overrun Tunnel 830777.5197 815736.4069 43
11SW-A/CR 107 Near KET Overrun Tunnel 830779.061 815725.468 55
11SW-A/CR 107 Near KET Overrun Tunnel 830779.2757 815725.5549 55
11SW-A/CR 107 Near KET Overrun Tunnel 830782.2836 815737.9253 43
11SW-A/CR 107 Near KET Overrun Tunnel 830783.09 815727.099 58
11SW-A/CR 107 Near KET Overrun Tunnel 830785.8625 815727.568 59
11SW-A/CR 107 Near KET Overrun Tunnel 830787.0474 815739.4438 43
11SW-A/CR 107 Near KET Overrun Tunnel 830790.4067 815728.3367 61
11SW-A/CR 107 Near KET Overrun Tunnel 830791.8113 815740.9622 43
11SW-A/CR 107 Near KET Overrun Tunnel 830794.9508 815729.1053 63
11SW-A/CR 107 Near KET Overrun Tunnel 830796.5751 815742.4807 43
11SW-A/CR 107 Near KET Overrun Tunnel 830799.495 815729.874 66
11SW-A/CR 107 Near KET Overrun Tunnel 830801.339 815743.9991 43
11SW-A/CR 107 Near KET Overrun Tunnel 830803.4381 815731.3995 65
11SW-A/CR 107 Near KET Overrun Tunnel 830804.0755 815731.8063 67
11SW-A/CR 107 Near KET Overrun Tunnel 830806.1028 815745.5176 43
11SW-A/CR 107 Near KET Overrun Tunnel 830806.4138 815765.1161 43
11SW-A/CR 107 Near KET Overrun Tunnel 830808.074 815733.493 67
11SW-A/CR 107 Near KET Overrun Tunnel 830808.2882 815760.4807 43
11SW-A/CR 107 Near KET Overrun Tunnel 830809.2138 815734.2749 65
11SW-A/CR 107 Near KET Overrun Tunnel 830809.3713 815762.0848 46
11SW-A/CR 107 Near KET Overrun Tunnel 830810.2841 815746.8503 43
11SW-A/CR 107 Near KET Overrun Tunnel 830810.1626 815755.8454 43
11SW-A/CR 107 Near KET Overrun Tunnel 830811.9336 815736.8567 61
11SW-A/CR 107 Near KET Overrun Tunnel 830812.037 815751.21 43
11SW-A/CR 107 Near KET Overrun Tunnel 830812.3676 815758.9577 48
11SW-A/CR 107 Near KET Overrun Tunnel 830814.6535 815739.4385 58
11SW-A/CR 107 Near KET Overrun Tunnel 830815.3639 815755.8305 51
11SW-A/CR 107 Near KET Overrun Tunnel 830815.944 815742.2855 57
11SW-A/CR 107 Near KET Overrun Tunnel 830817.9349 815746.6775 56
11SW-A/CR 107 Near KET Overrun Tunnel 830818.3602 815752.7034 53
11SW-A/CR 107 Near KET Overrun Tunnel 830819.9257 815751.0695 55
11SW-A/C89 Near SYP-UNI tunnel 832659 816078 81
11SW-A/C747 Near UNI-KET Tunnel 831435.903 815920.953 30
11SW-A/C714 Near SYP-UNI tunnel 832018 816170 33
A10-G48

Slope Register Section Easting (m) Northing (m) Level (mPD)
11SW-A/C714 Near UNI Station 832017.299 816169.853 35
11SW-A/C594 Near UNI-KET Tunnel 831631.05 816048.583 33
11SW-A/C567 Near UNI-KET Tunnel 831497.012 815826.347 70
11SW-A/C565 Near UNI-KET Tunnel 831409.187 815898.749 30
11SW-A/C389 Near SYP-UNI tunnel 832463 816101 65
11SW-A/C370 Near UNI-KET Tunnel 831411.853 815840.053 30
11SW-A/C242 Near UNI Station 831903.881 816212.049 44
11SW-A/C240 Near UNI Station 831996.405 816233.826 20
11SW-A/C199 Near SYP-UNI tunnel 832380 816076 65
11SW-A/C154 Near UNI-KET Tunnel 831661.055 816190.836 30
11SW-A/C132 Near UNI-KET Tunnel 831540.642 815823.836 71
11SW-A/C130 Near UNI-KET Tunnel 831497.372 815853.805 62
11SW-A/C124 Near UNI-KET Tunnel 831443.304 815750.571 40
11SW-A/C1125 Near SYP-UNI tunnel 832346 816058 71
11SW-A/C1122 Near SYP-UNI tunnel 832331 816032 88
11SW-A/C1110 Near SYP-UNI tunnel 832289 816098 55
11SW-A/C1109 Near SYP-UNI tunnel 832190 816120 59
11SW-A/C1109 Near UNI Station 832189.006 816122.189 62
11SW-A/C1103 Near UNI-KET Tunnel 831574.98 815926.909 40
11SW-A/C1102 Near UNI-KET Tunnel 831653.054 816023.525 51
11SW-A/C1100 Near UNI-KET Tunnel 831736.114 816248.229 25
11SW-A/C1099 Near UNI Station 831796.433 816230.183 34
11SW-A/C1098 Near UNI-KET Tunnel 831689.072 816147.222 54
11SW-A/C1096 Near UNI-KET Tunnel 831673.926 816090.34 6411SW-A/C 746 Near KET Overrun Tunnel 831143.85 815747.074 34
11SW-A/C 746 Near KET Overrun Tunnel 831144.043 815750.949 32
11SW-A/C 746 Near KET Overrun Tunnel 831143.9563 815752.0768 31
11SW-A/C 746 Near KET Overrun Tunnel 831143.656 815755.985 28
11SW-A/C 746 Near KET Overrun Tunnel 831144.0826 815757.6931 26
11SW-A/C 746 Near KET Overrun Tunnel 831145.2065 815743.1798 37
11SW-A/C 746 Near KET Overrun Tunnel 831144.9338 815761.101 23
11SW-A/C 746 Near KET Overrun Tunnel 831145.769 815741.565 38
11SW-A/C 746 Near KET Overrun Tunnel 831150.7256 815765.2775 19
11SW-A/C 746 Near KET Overrun Tunnel 831155.6662 815766.046 19
11SW-A/C 746 Near KET Overrun Tunnel 831160.6068 815766.8145 19
11SW-A/C 746 Near KET Overrun Tunnel 831165.5474 815767.583 19
11SW-A/C 746 Near KET Overrun Tunnel 831170.4879 815768.3515 19
11SW-A/C 746 Near KET Overrun Tunnel 831175.4285 815769.12 19
11SW-A/C 746 Near KET Overrun Tunnel 831180.3691 815769.8885 19
11SW-A/C 746 Near KET Overrun Tunnel 831185.3097 815770.657 19
11SW-A/C 746 Near KET Overrun Tunnel 831190.2503 815771.4255 19
11SW-A/C 746 Near KET Overrun Tunnel 831190.5449 815771.4713 19
11SW-A/C 718 Near KET Overrun Tunnel 830789.0885 815704.0035 76
11SW-A/C 718 Near KET Overrun Tunnel 830790.7282 815705.9804 75
11SW-A/C 718 Near KET Overrun Tunnel 830793.489 815709.3091 72
11SW-A/C 718 Near KET Overrun Tunnel 830794.3335 815707.4835 74
11SW-A/C 718 Near KET Overrun Tunnel 830795.498 815709.027 73
11SW-A/C 718 Near KET Overrun Tunnel 830797.3255 815704.4044 77
11SW-A/C 718 Near KET Overrun Tunnel 830799.0035 815702.6775 78
11SW-A/C 718 Near KET Overrun Tunnel 830803.7003 815702.6775 80
11SW-A/C 718 Near KET Overrun Tunnel 830806.9596 815705.7238 78
11SW-A/C 718 Near KET Overrun Tunnel 830811.1356 815703.0771 79
11SW-A/C 718 Near KET Overrun Tunnel 830814.3545 815701.037 80
11SW-A/C 718 Near KET Overrun Tunnel 830829.489 815699.979 74
A10-G49

Slope Register Section Easting (m) Northing (m) Level (mPD)
11SW-A/C 718 Near KET Overrun Tunnel 830830.4004 815704.0845 71
11SW-A/C 718 Near KET Overrun Tunnel 830830.5 815704.533 71
11SW-A/C 718 Near KET Overrun Tunnel 830832.094 815704.66 71
11SW-A/C 718 Near KET Overrun Tunnel 830832.829 815700.056 74
11SW-A/C 718 Near KET Overrun Tunnel 830832.7569 815700.5078 74
11SW-A/C 569 Near KET Overrun Tunnel 830815.005 815760.002 52
11SW-A/C 569 Near KET Overrun Tunnel 830819.7299 815761.2595 53
11SW-A/C 569 Near KET Overrun Tunnel 830824.038 815762.406 54
11SW-A/C 569 Near KET Overrun Tunnel 830825.8288 815767.073 54
11SW-A/C 569 Near KET Overrun Tunnel 830827.6197 815771.74 54
11SW-A/C 569 Near KET Overrun Tunnel 830828.084 815772.95 54
11SW-A/C 562 Near KET Overrun Tunnel 831099.7707 815731.877 36
11SW-A/C 562 Near KET Overrun Tunnel 831101.561 815727.239 36
11SW-A/C 562 Near KET Overrun Tunnel 831101.948 815736.378 36
11SW-A/C 562 Near KET Overrun Tunnel 831105.592 815735.593 36
11SW-A/C 545 Near KET Overrun Tunnel 830528.813 815748.795 50
11SW-A/C 545 Near KET Overrun Tunnel 830532.9235 815750.5139 52
11SW-A/C 545 Near KET Overrun Tunnel 830534.863 815751.325 53
11SW-A/C 544 Near KET Overrun Tunnel 830510.345 815725.243 53
11SW-A/C 544 Near KET Overrun Tunnel 830513.784 815727.6835 52
11SW-A/C 544 Near KET Overrun Tunnel 830515.754 815723.7 51
11SW-A/C 544 Near KET Overrun Tunnel 830515.8488 815728.6016 50
11SW-A/C 544 Near KET Overrun Tunnel 830515.9065 815731.5815 50
11SW-A/C 542 Near KET Overrun Tunnel 830594.574 815717.718 71
11SW-A/C 542 Near KET Overrun Tunnel 830599.1295 815715.7718 71
11SW-A/C 542 Near KET Overrun Tunnel 830599.9522 815715.4203 70
11SW-A/C 542 Near KET Overrun Tunnel 830602.467 815712.499 71
11SW-A/C 542 Near KET Overrun Tunnel 830607.295 815711.5097 70
11SW-A/C 542 Near KET Overrun Tunnel 830612.123 815710.5204 69
11SW-A/C 542 Near KET Overrun Tunnel 830616.951 815709.5312 69
11SW-A/C 542 Near KET Overrun Tunnel 830619.3505 815709.0395 68
11SW-A/C 541 Near KET Overrun Tunnel 830624.003 815722.155 58
11SW-A/C 541 Near KET Overrun Tunnel 830624.4875 815725.1705 58
11SW-A/C 541 Near KET Overrun Tunnel 830627.8295 815721.7861 58
11SW-A/C 538 Near KET Overrun Tunnel 830586.406 815760.007 51
11SW-A/C 538 Near KET Overrun Tunnel 830591.3863 815759.5949 51
11SW-A/C 538 Near KET Overrun Tunnel 830593.41 815758.27 54
11SW-A/C 538 Near KET Overrun Tunnel 830593.451 815759.424 51
11SW-A/C 538 Near KET Overrun Tunnel 830598.087 815757.577 54
11SW-A/C 538 Near KET Overrun Tunnel 830598.367 815758.567 53
11SW-A/C 538 Near KET Overrun Tunnel 830603.3265 815757.9341 53
11SW-A/C 538 Near KET Overrun Tunnel 830608.286 815757.3013 53
11SW-A/C 538 Near KET Overrun Tunnel 830608.9153 815757.221 53
11SW-A/C 537 Near KET Overrun Tunnel 830539.071 815778.852 43
11SW-A/C 537 Near KET Overrun Tunnel 830542.1523 815775.9079 43
11SW-A/C 537 Near KET Overrun Tunnel 830546.998 815777.1325 43
11SW-A/C 537 Near KET Overrun Tunnel 830551.08 815777.2381 43
11SW-A/C 537 Near KET Overrun Tunnel 830556.0784 815777.3674 43
11SW-A/C 537 Near KET Overrun Tunnel 830561.0767 815777.4967 43
11SW-A/C 537 Near KET Overrun Tunnel 830566.075 815777.626 43
11SW-A/C 535 Near KET Overrun Tunnel 830522.019 815745.451 46
11SW-A/C 535 Near KET Overrun Tunnel 830525.2614 815749.2568 46
11SW-A/C 535 Near KET Overrun Tunnel 830528.5038 815753.0626 46
11SW-A/C 535 Near KET Overrun Tunnel 830531.7461 815756.8683 45
A10-G50
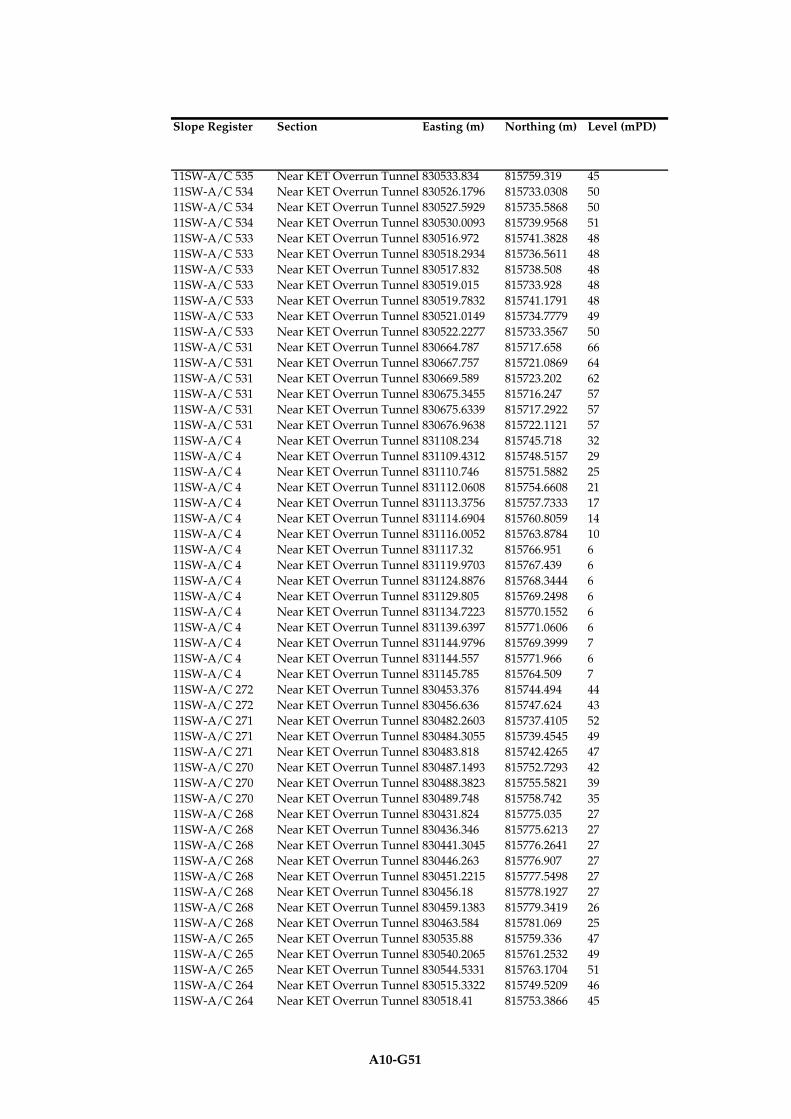
Slope Register Section Easting (m) Northing (m) Level (mPD)
11SW-A/C 535 Near KET Overrun Tunnel 830533.834 815759.319 45
11SW-A/C 534 Near KET Overrun Tunnel 830526.1796 815733.0308 50
11SW-A/C 534 Near KET Overrun Tunnel 830527.5929 815735.5868 50
11SW-A/C 534 Near KET Overrun Tunnel 830530.0093 815739.9568 51
11SW-A/C 533 Near KET Overrun Tunnel 830516.972 815741.3828 48
11SW-A/C 533 Near KET Overrun Tunnel 830518.2934 815736.5611 48
11SW-A/C 533 Near KET Overrun Tunnel 830517.832 815738.508 48
11SW-A/C 533 Near KET Overrun Tunnel 830519.015 815733.928 48
11SW-A/C 533 Near KET Overrun Tunnel 830519.7832 815741.1791 48
11SW-A/C 533 Near KET Overrun Tunnel 830521.0149 815734.7779 49
11SW-A/C 533 Near KET Overrun Tunnel 830522.2277 815733.3567 50
11SW-A/C 531 Near KET Overrun Tunnel 830664.787 815717.658 66
11SW-A/C 531 Near KET Overrun Tunnel 830667.757 815721.0869 64
11SW-A/C 531 Near KET Overrun Tunnel 830669.589 815723.202 62
11SW-A/C 531 Near KET Overrun Tunnel 830675.3455 815716.247 57
11SW-A/C 531 Near KET Overrun Tunnel 830675.6339 815717.2922 57
11SW-A/C 531 Near KET Overrun Tunnel 830676.9638 815722.1121 57
11SW-A/C 4 Near KET Overrun Tunnel 831108.234 815745.718 32
11SW-A/C 4 Near KET Overrun Tunnel 831109.4312 815748.5157 29
11SW-A/C 4 Near KET Overrun Tunnel 831110.746 815751.5882 25
11SW-A/C 4 Near KET Overrun Tunnel 831112.0608 815754.6608 21
11SW-A/C 4 Near KET Overrun Tunnel 831113.3756 815757.7333 17
11SW-A/C 4 Near KET Overrun Tunnel 831114.6904 815760.8059 14
11SW-A/C 4 Near KET Overrun Tunnel 831116.0052 815763.8784 10
11SW-A/C 4 Near KET Overrun Tunnel 831117.32 815766.951 6
11SW-A/C 4 Near KET Overrun Tunnel 831119.9703 815767.439 6
11SW-A/C 4 Near KET Overrun Tunnel 831124.8876 815768.3444 6
11SW-A/C 4 Near KET Overrun Tunnel 831129.805 815769.2498 6
11SW-A/C 4 Near KET Overrun Tunnel 831134.7223 815770.1552 6
11SW-A/C 4 Near KET Overrun Tunnel 831139.6397 815771.0606 6
11SW-A/C 4 Near KET Overrun Tunnel 831144.9796 815769.3999 7
11SW-A/C 4 Near KET Overrun Tunnel 831144.557 815771.966 6
11SW-A/C 4 Near KET Overrun Tunnel 831145.785 815764.509 7
11SW-A/C 272 Near KET Overrun Tunnel 830453.376 815744.494 44
11SW-A/C 272 Near KET Overrun Tunnel 830456.636 815747.624 43
11SW-A/C 271 Near KET Overrun Tunnel 830482.2603 815737.4105 52
11SW-A/C 271 Near KET Overrun Tunnel 830484.3055 815739.4545 49
11SW-A/C 271 Near KET Overrun Tunnel 830483.818 815742.4265 47
11SW-A/C 270 Near KET Overrun Tunnel 830487.1493 815752.7293 42
11SW-A/C 270 Near KET Overrun Tunnel 830488.3823 815755.5821 39
11SW-A/C 270 Near KET Overrun Tunnel 830489.748 815758.742 35
11SW-A/C 268 Near KET Overrun Tunnel 830431.824 815775.035 27
11SW-A/C 268 Near KET Overrun Tunnel 830436.346 815775.6213 27
11SW-A/C 268 Near KET Overrun Tunnel 830441.3045 815776.2641 27
11SW-A/C 268 Near KET Overrun Tunnel 830446.263 815776.907 27
11SW-A/C 268 Near KET Overrun Tunnel 830451.2215 815777.5498 27
11SW-A/C 268 Near KET Overrun Tunnel 830456.18 815778.1927 27
11SW-A/C 268 Near KET Overrun Tunnel 830459.1383 815779.3419 26
11SW-A/C 268 Near KET Overrun Tunnel 830463.584 815781.069 25
11SW-A/C 265 Near KET Overrun Tunnel 830535.88 815759.336 47
11SW-A/C 265 Near KET Overrun Tunnel 830540.2065 815761.2532 49
11SW-A/C 265 Near KET Overrun Tunnel 830544.5331 815763.1704 51
11SW-A/C 264 Near KET Overrun Tunnel 830515.3322 815749.5209 46
11SW-A/C 264 Near KET Overrun Tunnel 830518.41 815753.3866 45
A10-G51

Slope Register Section Easting (m) Northing (m) Level (mPD)
11SW-A/C 264 Near KET Overrun Tunnel 830521.4877 815757.2523 44
11SW-A/C 264 Near KET Overrun Tunnel 830524.114 815760.551 44
11SW-A/C 262 Near KET Overrun Tunnel 830563.839 815799.472 37
11SW-A/C 262 Near KET Overrun Tunnel 830568.6471 815800.8438 37
11SW-A/C 262 Near KET Overrun Tunnel 830572.118 815801.834 37
11SW-A/C 261 Near KET Overrun Tunnel 830494.856 815794.112 24
11SW-A/C 261 Near KET Overrun Tunnel 830499.4213 815796.131 24
11SW-A/C 261 Near KET Overrun Tunnel 830503.9866 815798.15 25
11SW-A/C 261 Near KET Overrun Tunnel 830508.5519 815800.1689 25
11SW-A/C 261 Near KET Overrun Tunnel 830513.1173 815802.1879 25
11SW-A/C 261 Near KET Overrun Tunnel 830517.6826 815804.2069 25
11SW-A/C 261 Near KET Overrun Tunnel 830522.2479 815806.2259 26
11SW-A/C 261 Near KET Overrun Tunnel 830526.8132 815808.2449 26
11SW-A/C 261 Near KET Overrun Tunnel 830531.3785 815810.2639 26
11SW-A/C 261 Near KET Overrun Tunnel 830535.9438 815812.2828 27
11SW-A/C 261 Near KET Overrun Tunnel 830540.5091 815814.3018 27
11SW-A/C 261 Near KET Overrun Tunnel 830545.0745 815816.3208 27
11SW-A/C 261 Near KET Overrun Tunnel 830549.6398 815818.3398 27
11SW-A/C 261 Near KET Overrun Tunnel 830554.2051 815820.3588 28
11SW-A/C 261 Near KET Overrun Tunnel 830558.7704 815822.3778 28
11SW-A/C 259 Near KET Overrun Tunnel 830630.127 815759.018 51
11SW-A/C 259 Near KET Overrun Tunnel 830633.5372 815760.2856 48
11SW-A/C 259 Near KET Overrun Tunnel 830634.8 815760.755 47
11SW-A/C 258 Near KET Overrun Tunnel 830628.8739 815751.001 54
11SW-A/C 258 Near KET Overrun Tunnel 830628.564 815752.132 53
11SW-A/C 258 Near KET Overrun Tunnel 830630.17 815746.27 55
11SW-A/C 258 Near KET Overrun Tunnel 830630.6042 815745.8139 55
11SW-A/C 258 Near KET Overrun Tunnel 830633.982 815742.266 54
11SW-A/C 258 Near KET Overrun Tunnel 830637.19 815742.336 52
11SW-A/C 257 Near KET Overrun Tunnel 830649.813 815730.4437 52
11SW-A/C 257 Near KET Overrun Tunnel 830651.1031 815726.4918 56
11SW-A/C 257 Near KET Overrun Tunnel 830650.9311 815727.0186 55
11SW-A/C 257 Near KET Overrun Tunnel 830651.9383 815724.8723 54
11SW-A/C 257 Near KET Overrun Tunnel 830652.6513 815723.4362 54
11SW-A/C 257 Near KET Overrun Tunnel 830655.999 815724.214 55
11SW-A/C 257 Near KET Overrun Tunnel 830656.737 815737.241 42
11SW-A/C 257 Near KET Overrun Tunnel 830660.4125 815723.0899 56
11SW-A/C 257 Near KET Overrun Tunnel 830661.43 815723.774 56
11SW-A/C 257 Near KET Overrun Tunnel 830660.701 815740.2863 42
11SW-A/C 257 Near KET Overrun Tunnel 830664.6651 815743.3317 42
11SW-A/C 257 Near KET Overrun Tunnel 830668.6291 815746.377 42
11SW-A/C 257 Near KET Overrun Tunnel 830669.22 815746.831 42
11SW-A/C 256 Near KET Overrun Tunnel 830647.3345 815778.1556 39
11SW-A/C 256 Near KET Overrun Tunnel 830646.6555 815780.9165 39
11SW-A/C 256 Near KET Overrun Tunnel 830648.5073 815773.3873 40
11SW-A/C 256 Near KET Overrun Tunnel 830649.68 815768.619 41
11SW-A/C 256 Near KET Overrun Tunnel 830663.572 815769.707 42
11SW-A/C 256 Near KET Overrun Tunnel 830668.0263 815771.9784 42
11SW-A/C 256 Near KET Overrun Tunnel 830672.4806 815774.2498 42
11SW-A/C 256 Near KET Overrun Tunnel 830676.9349 815776.5212 41
11SW-A/C 256 Near KET Overrun Tunnel 830681.3892 815778.7926 41
11SW-A/C 256 Near KET Overrun Tunnel 830685.8434 815781.064 41
11SW-A/C 256 Near KET Overrun Tunnel 830690.2977 815783.3354 41
11SW-A/C 256 Near KET Overrun Tunnel 830694.752 815785.6068 41
A10-G52
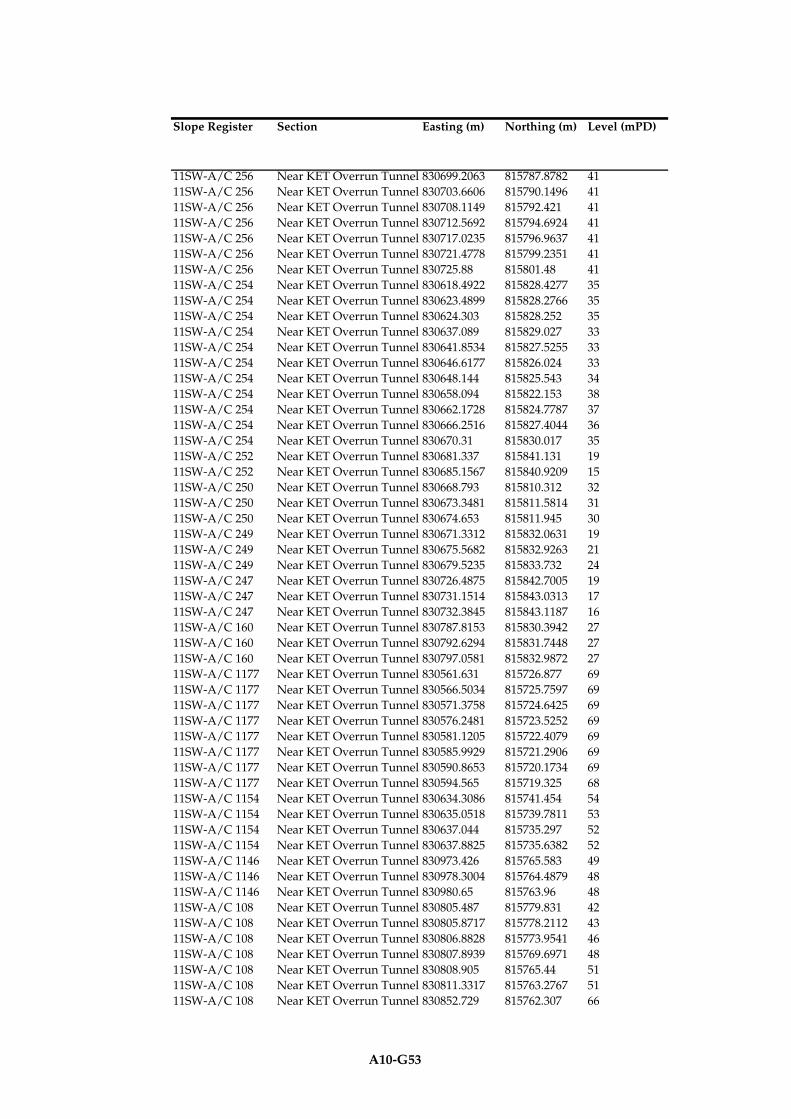
Slope Register Section Easting (m) Northing (m) Level (mPD)
11SW-A/C 256 Near KET Overrun Tunnel 830699.2063 815787.8782 41
11SW-A/C 256 Near KET Overrun Tunnel 830703.6606 815790.1496 41
11SW-A/C 256 Near KET Overrun Tunnel 830708.1149 815792.421 41
11SW-A/C 256 Near KET Overrun Tunnel 830712.5692 815794.6924 41
11SW-A/C 256 Near KET Overrun Tunnel 830717.0235 815796.9637 41
11SW-A/C 256 Near KET Overrun Tunnel 830721.4778 815799.2351 41
11SW-A/C 256 Near KET Overrun Tunnel 830725.88 815801.48 41
11SW-A/C 254 Near KET Overrun Tunnel 830618.4922 815828.4277 35
11SW-A/C 254 Near KET Overrun Tunnel 830623.4899 815828.2766 35
11SW-A/C 254 Near KET Overrun Tunnel 830624.303 815828.252 35
11SW-A/C 254 Near KET Overrun Tunnel 830637.089 815829.027 33
11SW-A/C 254 Near KET Overrun Tunnel 830641.8534 815827.5255 33
11SW-A/C 254 Near KET Overrun Tunnel 830646.6177 815826.024 33
11SW-A/C 254 Near KET Overrun Tunnel 830648.144 815825.543 34
11SW-A/C 254 Near KET Overrun Tunnel 830658.094 815822.153 38
11SW-A/C 254 Near KET Overrun Tunnel 830662.1728 815824.7787 37
11SW-A/C 254 Near KET Overrun Tunnel 830666.2516 815827.4044 36
11SW-A/C 254 Near KET Overrun Tunnel 830670.31 815830.017 35
11SW-A/C 252 Near KET Overrun Tunnel 830681.337 815841.131 19
11SW-A/C 252 Near KET Overrun Tunnel 830685.1567 815840.9209 15
11SW-A/C 250 Near KET Overrun Tunnel 830668.793 815810.312 32
11SW-A/C 250 Near KET Overrun Tunnel 830673.3481 815811.5814 31
11SW-A/C 250 Near KET Overrun Tunnel 830674.653 815811.945 30
11SW-A/C 249 Near KET Overrun Tunnel 830671.3312 815832.0631 19
11SW-A/C 249 Near KET Overrun Tunnel 830675.5682 815832.9263 21
11SW-A/C 249 Near KET Overrun Tunnel 830679.5235 815833.732 24
11SW-A/C 247 Near KET Overrun Tunnel 830726.4875 815842.7005 19
11SW-A/C 247 Near KET Overrun Tunnel 830731.1514 815843.0313 17
11SW-A/C 247 Near KET Overrun Tunnel 830732.3845 815843.1187 16
11SW-A/C 160 Near KET Overrun Tunnel 830787.8153 815830.3942 27
11SW-A/C 160 Near KET Overrun Tunnel 830792.6294 815831.7448 27
11SW-A/C 160 Near KET Overrun Tunnel 830797.0581 815832.9872 27
11SW-A/C 1177 Near KET Overrun Tunnel 830561.631 815726.877 69
11SW-A/C 1177 Near KET Overrun Tunnel 830566.5034 815725.7597 69
11SW-A/C 1177 Near KET Overrun Tunnel 830571.3758 815724.6425 69
11SW-A/C 1177 Near KET Overrun Tunnel 830576.2481 815723.5252 69
11SW-A/C 1177 Near KET Overrun Tunnel 830581.1205 815722.4079 69
11SW-A/C 1177 Near KET Overrun Tunnel 830585.9929 815721.2906 69
11SW-A/C 1177 Near KET Overrun Tunnel 830590.8653 815720.1734 69
11SW-A/C 1177 Near KET Overrun Tunnel 830594.565 815719.325 68
11SW-A/C 1154 Near KET Overrun Tunnel 830634.3086 815741.454 54
11SW-A/C 1154 Near KET Overrun Tunnel 830635.0518 815739.7811 53
11SW-A/C 1154 Near KET Overrun Tunnel 830637.044 815735.297 52
11SW-A/C 1154 Near KET Overrun Tunnel 830637.8825 815735.6382 52
11SW-A/C 1146 Near KET Overrun Tunnel 830973.426 815765.583 49
11SW-A/C 1146 Near KET Overrun Tunnel 830978.3004 815764.4879 48
11SW-A/C 1146 Near KET Overrun Tunnel 830980.65 815763.96 48
11SW-A/C 108 Near KET Overrun Tunnel 830805.487 815779.831 42
11SW-A/C 108 Near KET Overrun Tunnel 830805.8717 815778.2112 43
11SW-A/C 108 Near KET Overrun Tunnel 830806.8828 815773.9541 46
11SW-A/C 108 Near KET Overrun Tunnel 830807.8939 815769.6971 48
11SW-A/C 108 Near KET Overrun Tunnel 830808.905 815765.44 51
11SW-A/C 108 Near KET Overrun Tunnel 830811.3317 815763.2767 51
11SW-A/C 108 Near KET Overrun Tunnel 830852.729 815762.307 66
A10-G53

Slope Register Section Easting (m) Northing (m) Level (mPD)
11SW-A/C 108 Near KET Overrun Tunnel 830857.6784 815763.0162 66
11SW-A/C 108 Near KET Overrun Tunnel 830861.557 815763.572 66
11SW-A/C 108 Near KET Overrun Tunnel 830878.2145 815763.0545 69
11SW-A/C 108 Near KET Overrun Tunnel 830882.9065 815764.7806 69
11SW-A/C 108 Near KET Overrun Tunnel 830887.5985 815766.5068 69
11SW-A/C 108 Near KET Overrun Tunnel 830892.2905 815768.2329 69
11SW-A/C 108 Near KET Overrun Tunnel 830896.9825 815769.959 69
11SW-A/C 108 Near KET Overrun Tunnel 830901.6745 815771.6851 69
11SW-A/C 108 Near KET Overrun Tunnel 830906.3665 815773.4113 69
11SW-A/C 108 Near KET Overrun Tunnel 830909.697 815774.6365 69
11SW-A/C 106 Near KET Overrun Tunnel 830723.196 815771.786 42
11SW-A/C 106 Near KET Overrun Tunnel 830724.324 815769.461 42
11SW-A/C 106 Near KET Overrun Tunnel 830733.214 815776.166 43
11SW-A/C 106 Near KET Overrun Tunnel 830736.2544 815774.4731 43
11SW-A/C 106 Near KET Overrun Tunnel 830736.932 815777.5298 41
11SW-A/C 106 Near KET Overrun Tunnel 830740.6212 815772.0415 43
11SW-A/C 106 Near KET Overrun Tunnel 830740.7551 815774.6459 39
11SW-A/C 106 Near KET Overrun Tunnel 830744.9879 815769.61 43
11SW-A/C 106 Near KET Overrun Tunnel 830744.5782 815771.7621 38
11SW-A/C 106 Near KET Overrun Tunnel 830748.4013 815768.8782 37
11SW-A/C 106 Near KET Overrun Tunnel 830749.3547 815767.1785 42
11SW-A/C 106 Near KET Overrun Tunnel 830752.2244 815765.9943 35
11SW-A/C 106 Near KET Overrun Tunnel 830753.418 815765.094 35
11SW-A/C 106 Near KET Overrun Tunnel 830753.7215 815764.747 42
11SW-A/C 106 Near KET Overrun Tunnel 830758.0883 815762.3155 42
11SW-A/C 106 Near KET Overrun Tunnel 830757.9506 815762.9833 35
11SW-A/C 106 Near KET Overrun Tunnel 830759.623 815762.2045 35
11SW-A/C 106 Near KET Overrun Tunnel 830762.455 815759.884 42
11SW-A/C 106 Near KET Overrun Tunnel 830764.5626 815761.4298 35
11SW-A/C 106 Near KET Overrun Tunnel 830765.9736 815761.2085 35
11SW-A/C 106 Near KET Overrun Tunnel 830766.8218 815757.4525 42
11SW-A/C 106 Near KET Overrun Tunnel 830771.1886 815755.021 42
11SW-A/C 106 Near KET Overrun Tunnel 830770.538 815761.425 35
11SW-A/C 106 Near KET Overrun Tunnel 830774.6224 815764.2393 34
11SW-A/C 106 Near KET Overrun Tunnel 830775.7061 815756.2606 42
11SW-A/C 106 Near KET Overrun Tunnel 830778.7069 815767.0536 33
11SW-A/C 106 Near KET Overrun Tunnel 830780.5054 815757.5775 43
11SW-A/C 106 Near KET Overrun Tunnel 830782.7913 815769.8679 33
11SW-A/C 106 Near KET Overrun Tunnel 830785.3047 815758.8944 43
11SW-A/C 106 Near KET Overrun Tunnel 830786.8758 815772.6822 32
11SW-A/C 106 Near KET Overrun Tunnel 830790.104 815760.2113 44
11SW-A/C 106 Near KET Overrun Tunnel 830790.9602 815775.4965 32
11SW-A/C 106 Near KET Overrun Tunnel 830792.5163 815764.0471 44
11SW-A/C 106 Near KET Overrun Tunnel 830793.225 815777.057 31
11SW-A/C 106 Near KET Overrun Tunnel 830797.1678 815765.8812 44
11SW-A/C 106 Near KET Overrun Tunnel 830796.5994 815780.641 30
11SW-A/C 106 Near KET Overrun Tunnel 830796.8492 815783.6461 30
11SW-A/C 106 Near KET Overrun Tunnel 830799.65 815766.86 44
11SW-A/C 106 Near KET Overrun Tunnel 830802.054 815769.31 44
11SW-A/C 106 Near KET Overrun Tunnel 830806.132 815767.665 44
11SW-A/C 105 Near KET Overrun Tunnel 830725.416 815801.741 39
11SW-A/C 105 Near KET Overrun Tunnel 830726.2135 815805.7588 36
11SW-A/C 105 Near KET Overrun Tunnel 830727.011 815809.7766 33
11SW-A/C 105 Near KET Overrun Tunnel 830727.363 815811.55 32
A10-G54
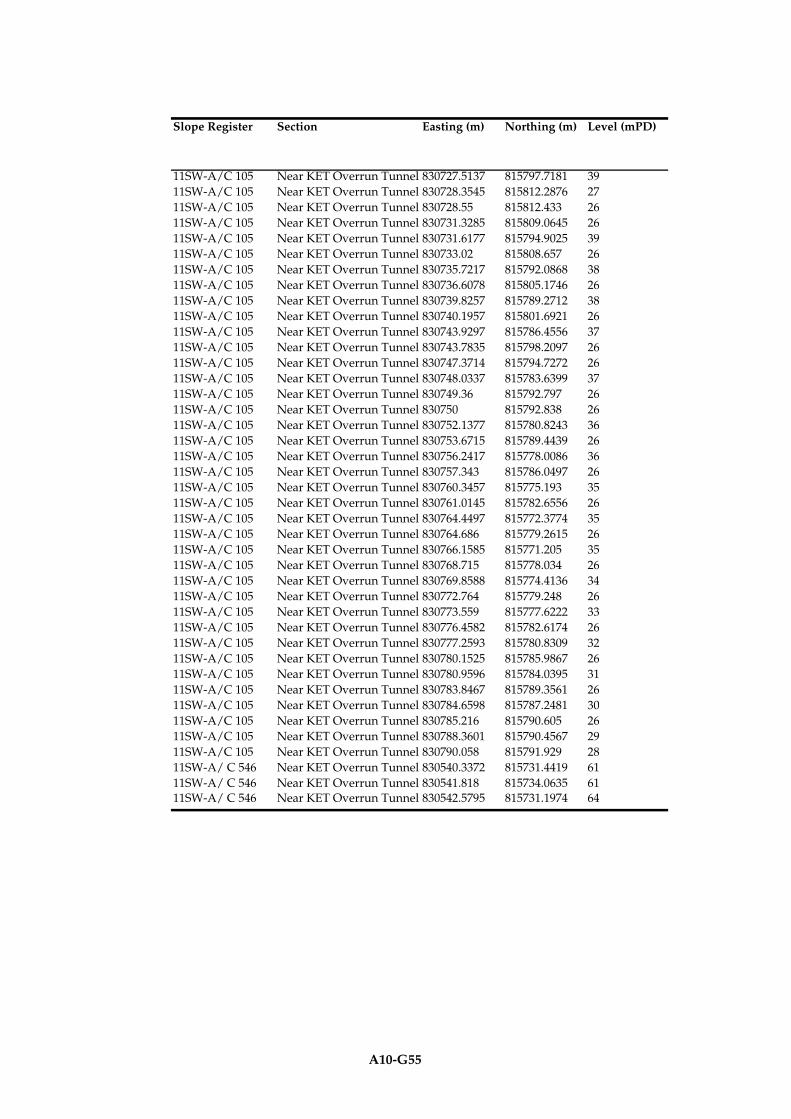
Slope Register Section Easting (m) Northing (m) Level (mPD)
11SW-A/C 105 Near KET Overrun Tunnel 830727.5137 815797.7181 39
11SW-A/C 105 Near KET Overrun Tunnel 830728.3545 815812.2876 27
11SW-A/C 105 Near KET Overrun Tunnel 830728.55 815812.433 26
11SW-A/C 105 Near KET Overrun Tunnel 830731.3285 815809.0645 26
11SW-A/C 105 Near KET Overrun Tunnel 830731.6177 815794.9025 39
11SW-A/C 105 Near KET Overrun Tunnel 830733.02 815808.657 26
11SW-A/C 105 Near KET Overrun Tunnel 830735.7217 815792.0868 38
11SW-A/C 105 Near KET Overrun Tunnel 830736.6078 815805.1746 26
11SW-A/C 105 Near KET Overrun Tunnel 830739.8257 815789.2712 38
11SW-A/C 105 Near KET Overrun Tunnel 830740.1957 815801.6921 26
11SW-A/C 105 Near KET Overrun Tunnel 830743.9297 815786.4556 37
11SW-A/C 105 Near KET Overrun Tunnel 830743.7835 815798.2097 26
11SW-A/C 105 Near KET Overrun Tunnel 830747.3714 815794.7272 26
11SW-A/C 105 Near KET Overrun Tunnel 830748.0337 815783.6399 37
11SW-A/C 105 Near KET Overrun Tunnel 830749.36 815792.797 26
11SW-A/C 105 Near KET Overrun Tunnel 830750 815792.838 26
11SW-A/C 105 Near KET Overrun Tunnel 830752.1377 815780.8243 36
11SW-A/C 105 Near KET Overrun Tunnel 830753.6715 815789.4439 26
11SW-A/C 105 Near KET Overrun Tunnel 830756.2417 815778.0086 36
11SW-A/C 105 Near KET Overrun Tunnel 830757.343 815786.0497 26
11SW-A/C 105 Near KET Overrun Tunnel 830760.3457 815775.193 35
11SW-A/C 105 Near KET Overrun Tunnel 830761.0145 815782.6556 26
11SW-A/C 105 Near KET Overrun Tunnel 830764.4497 815772.3774 35
11SW-A/C 105 Near KET Overrun Tunnel 830764.686 815779.2615 26
11SW-A/C 105 Near KET Overrun Tunnel 830766.1585 815771.205 35
11SW-A/C 105 Near KET Overrun Tunnel 830768.715 815778.034 26
11SW-A/C 105 Near KET Overrun Tunnel 830769.8588 815774.4136 34
11SW-A/C 105 Near KET Overrun Tunnel 830772.764 815779.248 26
11SW-A/C 105 Near KET Overrun Tunnel 830773.559 815777.6222 33
11SW-A/C 105 Near KET Overrun Tunnel 830776.4582 815782.6174 26
11SW-A/C 105 Near KET Overrun Tunnel 830777.2593 815780.8309 32
11SW-A/C 105 Near KET Overrun Tunnel 830780.1525 815785.9867 26
11SW-A/C 105 Near KET Overrun Tunnel 830780.9596 815784.0395 31
11SW-A/C 105 Near KET Overrun Tunnel 830783.8467 815789.3561 26
11SW-A/C 105 Near KET Overrun Tunnel 830784.6598 815787.2481 30
11SW-A/C 105 Near KET Overrun Tunnel 830785.216 815790.605 26
11SW-A/C 105 Near KET Overrun Tunnel 830788.3601 815790.4567 29
11SW-A/C 105 Near KET Overrun Tunnel 830790.058 815791.929 28
11SW-A/ C 546 Near KET Overrun Tunnel 830540.3372 815731.4419 61
11SW-A/ C 546 Near KET Overrun Tunnel 830541.818 815734.0635 6111SW-A/ C 546 Near KET Overrun Tunnel 830542.5795 815731.1974 64
A10-G55