Guideline for implementing the SaMBA Tool - Alpine Space
42
The SaMBA project is co-financed by the European Regional Development Fund through the Interreg Alpine Space programme. INTERREG Alpine Space Project “Sustainable Mobility Behaviours in the Alpine Region – SaMBA” Guideline for implementing the SaMBA Tool (June 2021)
-
Upload
khangminh22 -
Category
Documents
-
view
0 -
download
0
Transcript of Guideline for implementing the SaMBA Tool - Alpine Space

The SaMBA project is co-financed by the European Regional Development Fund through the Interreg Alpine Space
programme.
INTERREG Alpine Space Project
“Sustainable Mobility Behaviours in the Alpine Region –
SaMBA”
Guideline for implementing the SaMBA Tool
(June 2021)

2
The SaMBA project is co-financed by the European Regional Development Fund through the Interreg
Alpine Space programme.
Short Description
“Guideline for implementing (parts of) the SamBA simulation tool in other organisations/
regions/ countries. The guideline will include a content-based description and manual in
order to facilitate its use and potential customization.” (Project Application Form
23/09/2020)
Document Details
Project SaMBA
Action WP T1
Activity A.T5.1
Deliverable D.T1.5.1 Concept for SaMBA simulation tool
Due date 2021.06
Delivery date 2021.06
Dissemination PPs
Origin PP RSA
Authors Johanna Schmitt, Dagmar Lahnsteiner
Version Date Author Organization
Final 30th June 2021 Johanna Schmitt,
Dagmar Lahnsteiner
RSA FG - Research Studio iSPACE

3
The SaMBA project is co-financed by the European Regional Development Fund through the Interreg
Alpine Space programme.
Table of content
1. Introduction .................................................................................................................... 4
1. Tool concept ................................................................................................................... 5
a) Goals .......................................................................................................................... 5
b) Tool structure and building blocks ............................................................................... 6
2. Implementation of the Excel component ......................................................................... 9
a) Overview of the sheets ............................................................................................... 9
b) Information for developers .........................................................................................13
3. Implementation of the GIS component ..........................................................................20
a) Spatial data and statistics ..........................................................................................20
b) Parameters ................................................................................................................21
c) Modelling results ........................................................................................................27
4. Outlook and contact info ................................................................................................37
Annex: Overview of all implemented measures ....................................................................38

4
The SaMBA project is co-financed by the European Regional Development Fund through the Interreg
Alpine Space programme.
1. Introduction
Within the scope of the SaMBA project, a tool to provide decision support for planning ex-
perts and public authorities regarding mobility has been developed.
The deliverable at hand (D.T1.5.1) belongs to WP T1 (“Policy impact estimation”) and contrib-
utes to the work package’s output O.T1.1 (“Behaviour change policies impact estimation and
tool”). The tool guideline presented within this document is created as a manual for the im-
plementation and customization of the SaMBA tool for finding policies & estimating im-
pacts in terms of mobility behaviour change.
Figure 1: Placement of this deliverable within the project
The generated output (O.T1.1) should be of use for a broad target group consisting of local,
regional and national public authorities, sectoral agencies and higher education and research.
The responsible partner of this work package is RSA iSPACE together with the lead partner
Piedmont Region. In addition, twelve project-partners are involved within this work package.
This document presents the guideline for the SaMBA tool. It starts with a summary of the un-
derlying tool concept and describes the implementation of the Excel and the GIS components.
Furthermore, it explains how the components can be adapted and enhanced, e.g. to increase
the number of included measures or to fit the characteristics of a target area. Therefore, this
guideline mainly addresses people who want to implement or customize the SaMBA tool for a
specific purpose or a specific target area.

5
The SaMBA project is co-financed by the European Regional Development Fund through the Interreg
Alpine Space programme.
1. Tool concept
This chapter describes the underlying concept of the tool. The detailed version is provided in
deliverable D.T1.2.3.
a) Goals
The objective of the SaMBA tool is to promote low carbon mobility and to raise awareness
of the value of behaviour change policies. It helps to promote sustainable modes of
transport, to achieve a modal shift and to increase options for low carbon mobility by new
policies.
Therefore, the tool aims at the support of decision-making processes and the choice of
appropriate measures and incentives to encourage residents to change their mobility in favour
of sustainable modes of transportation. The selection of measures depends on a goal defined
by the user and a set of parameters, which describe regional characteristics with influence on
mobility. The tool also helps to estimate impacts of measures with the help of indicators taken
from best practice examples.
The tool concept is designed for transnational applicability, which means that the goals and
parameters have no regional specification. Furthermore, it is important to note that a measure
may not have the same effects in different target regions. The impacts depend on many factors
and details beyond the scope of the SaMBA project. Therefore, the tool provides experiences
and reported effects of best practices.
As an optional add-on, a GIS-based framework is included to improve and substitute user-
input by pre-processed spatial statistics and data. Besides, GIS methods on potential mobility
demand and action areas for behaviour change policies have been developed.
The tool primarily addresses planning experts, policy makers and public authorities. Fur-
thermore, it can be interesting for sectoral agencies dealing with transport, sustainable de-
velopment or land use planning, higher education and research and infrastructure and
service providers. It also addresses the general public since the recommended measures
and incentives are designed for the citizens. Therefore, with the help of national workshops, a
Report on user needs (D.T1.2.1) has been developed. It provides a list of aspects that stake-
holders consider important for the tool, e.g. a user-friendly interface, an export function, easy
communicable results (e.g. through maps or lists) and best practices as results.
The SaMBA tool is open to a wide audience without any restrictions and can be used
without specific IT expert knowledge. However, for implementing the optional GIS frame-
work for a specific region, it is recommended to involve a GIS expert.

6
The SaMBA project is co-financed by the European Regional Development Fund through the Interreg
Alpine Space programme.
b) Tool structure and building blocks
The structure of the tool and the linkage of different inputs and outputs and the Excel and GIS
components can be seen in Figure 2.
Figure 2: Overview of the structure of the SaMBA tool
Figure 3 provides an overview of the central building blocks of the SaMBA tool, which include
goals, parameters, measures/incentives and impacts.
Figure 3: Central building blocks of the SaMBA tool
7
The SaMBA project is co-financed by the European Regional Development Fund through the Interreg
Alpine Space programme.
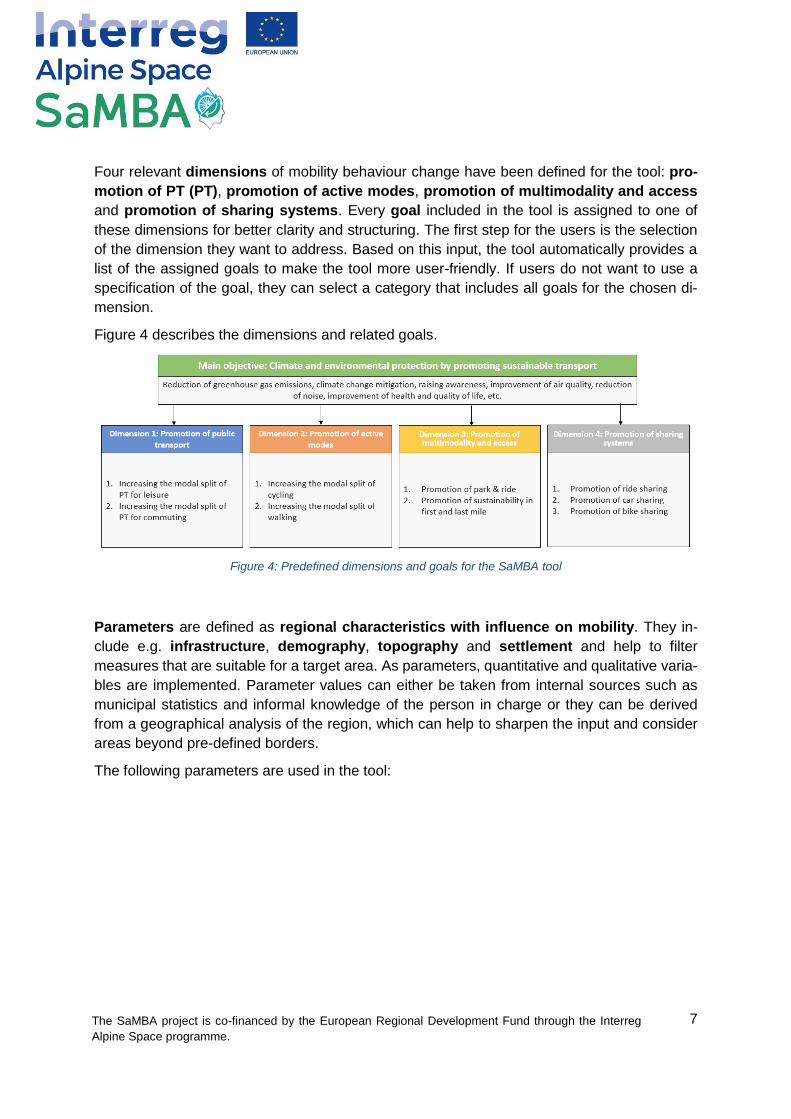
Four relevant dimensions of mobility behaviour change have been defined for the tool: pro-
motion of PT (PT), promotion of active modes, promotion of multimodality and access
and promotion of sharing systems. Every goal included in the tool is assigned to one of
these dimensions for better clarity and structuring. The first step for the users is the selection
of the dimension they want to address. Based on this input, the tool automatically provides a
list of the assigned goals to make the tool more user-friendly. If users do not want to use a
specification of the goal, they can select a category that includes all goals for the chosen di-
mension.
Figure 4 describes the dimensions and related goals.
Figure 4: Predefined dimensions and goals for the SaMBA tool
Parameters are defined as regional characteristics with influence on mobility. They in-
clude e.g. infrastructure, demography, topography and settlement and help to filter
measures that are suitable for a target area. As parameters, quantitative and qualitative varia-
bles are implemented. Parameter values can either be taken from internal sources such as
municipal statistics and informal knowledge of the person in charge or they can be derived
from a geographical analysis of the region, which can help to sharpen the input and consider
areas beyond pre-defined borders.
The following parameters are used in the tool:

8
The SaMBA project is co-financed by the European Regional Development Fund through the Interreg
Alpine Space programme.
Table 1: Parameters
In the context of the SaMBA tool, measures can be described as policies that include an
incentive/reward that motivates citizens to change their mobility behaviour in favour of
sustainable modes of transportation. The tool at first provides a simple list of the recom-
mended measures and incentives based on the goal and the parameter values. Further details
regarding implementation and the impacts can additionally be seen when the user clicks on a
best practice example. For the case that no measure suits the target area, general suggestions
(e.g. that it is required to improve the infrastructure before implementing behaviour change
measures) are provided.
An impact of a measure demonstrates its effect with the help of an indicator (e.g. changes in
the modal split or the amount of CO2 saved). For the SaMBA tool, quantitative impacts are
of major importance. Unfortunately, in many cases there are no specific studies on the impact
and, therefore, no quantitative data. Therefore, also the qualitative impact, which can at least
show a tendency, is presented.

9
The SaMBA project is co-financed by the European Regional Development Fund through the Interreg
Alpine Space programme.
2. Implementation of the Excel component
The Excel component uses database technologies to filter and assess an existing list of
measures with their according impacts in regard of local or regional circumstances. The results
are presented in an easy to read overview table, which includes measures, best practices and
impacts to narrow down the flood of information to the most suitable solutions.
a) Overview of the sheets
Sheets for users
The tool starts with a sheet including an introduction with some background information re-
garding the SaMBA project, the tool purpose and relevant target groups. It also provides some
brief instructions regarding the tool usage.
Figure 5: Introduction
The second sheet includes the main user interface of the tool, in which the user provides the
inputs dimension, goal and parameters to characterise the target area and receive recom-
mended measures as output.

10
The SaMBA project is co-financed by the European Regional Development Fund through the Interreg
Alpine Space programme.
Figure 6: Main user interface of the tool
In an overview of all measures and best practice examples, which is included in the third
sheet, interested users can get a more detailed overview of the contents of the tool. It also
includes a system to filter measures by a goal. The sheet not only includes measures and their
best practice examples, but also the goals they are assigned to, suitable spatial dimensions, a
description of the implementation, impacts and a link.
Figure 7: Measure overview
11
The SaMBA project is co-financed by the European Regional Development Fund through the Interreg
Alpine Space programme.
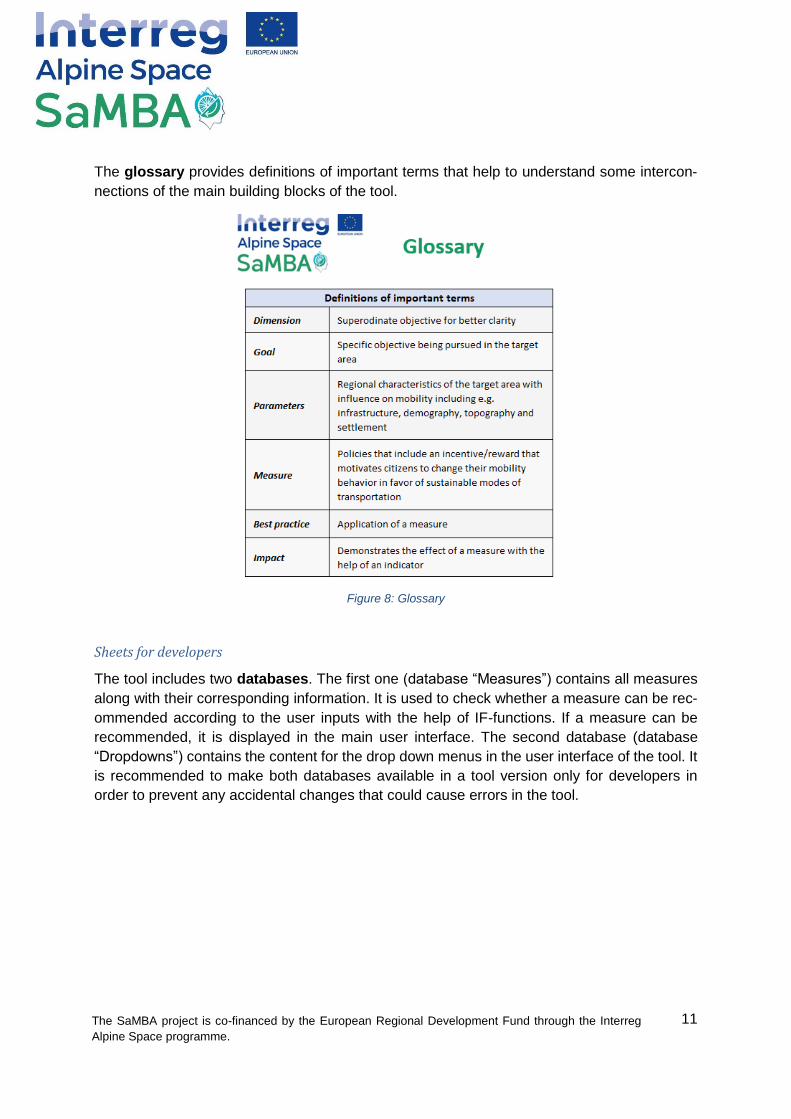
The glossary provides definitions of important terms that help to understand some intercon-
nections of the main building blocks of the tool.
Figure 8: Glossary
Sheets for developers
The tool includes two databases. The first one (database “Measures”) contains all measures
along with their corresponding information. It is used to check whether a measure can be rec-
ommended according to the user inputs with the help of IF-functions. If a measure can be
recommended, it is displayed in the main user interface. The second database (database
“Dropdowns”) contains the content for the drop down menus in the user interface of the tool. It
is recommended to make both databases available in a tool version only for developers in
order to prevent any accidental changes that could cause errors in the tool.

12
The SaMBA project is co-financed by the European Regional Development Fund through the Interreg
Alpine Space programme.
Figure 9: Database “Measures”
Figure 10: Database “Dropdowns”

13
The SaMBA project is co-financed by the European Regional Development Fund through the Interreg
Alpine Space programme.
b) Information for developers
This chapter provides technical information and is intended to be used by developers. It de-
scribes important tool functionalities in more detail and demonstrates how the tool can be ex-
tended. The functionalities of the tool are implemented with the programming language Visual
Basic (VBA) or with functions and formulas implemented in the cells.
Customizing dimensions and goals
At first, the user selects a dimension and a goal pursued in the target area. Both are imple-
mented as drop down menus.
Figure 11: Selecting dimension and goal
Since the tool only provides goals that are assigned to the selected dimension, the dropdown
menu containing these goals has to be dependent on the first. The content of the dropdowns
is included in the database “Dropdowns” of the tool. An additional dimension can be added
easily to the first menu since it is a “standard” dropdown menu defined by a simple list in the
data validation.
However, adding more goals requires additional changes. The goals in the list that is included
in the dropdown database are sorted by dimension. If e.g. a new goal for the promotion of PT
has to be included, it is easiest to place it below the two already implemented goals for this
dimension. It has to be noted, that also the starting positions of the dimensions and the number
of elements per dimension change if new goals are included.
Figure 12: Adding a new goal

14
The SaMBA project is co-financed by the European Regional Development Fund through the Interreg
Alpine Space programme.
The dropdown menu is defined in the data validation with the help of the following Excel func-
tions:
=OFFSET(Dropdowns!$F$1,VLOOKUP(B13,Dropdowns!$A$2:$C$5,2,FALSE),0,
VLOOKUP(B13,Dropdowns!$A$2:$C$5,3,FALSE),1)
For adding only new goals to existing dimensions, the formula does not have to be adapted.
However, if a new dimension with new goals is implemented, the cell values defining the range
of the dropdown menus in both VLOOKUP functions have to be changed according to the
updated dimension list in the database.
Customizing parameters
After entering dimension and goal, the user has to enter parameter values for the characteri-
sation of the target area with the help of dropdown menus. For the recommendation of
measures, the parameter values need to have certain categories (e.g. yes/no for the presence
of a certain feature in the target area).
Figure 13: Filling in the parameter values
When entering the values, a further explanation regarding each parameter is provided in an
input message.
The tool only asks the user to enter values for parameters that are relevant to the chosen
goal. This means that irrelevant parameters are hidden as soon as the user selects a goal
from the list. For this, a VBA code is used in a new module. The code below defines the lines
in the Excel sheet containing the parameters that have to be visible, if the user selects the goal
“Promotion of PT for leisure”. It uses the name of a goal as the basis and defines which pa-
rameters have to be visible and hidden.

15
The SaMBA project is co-financed by the European Regional Development Fund through the Interreg
Alpine Space programme.
Figure 14: Hiding and displaying parameters
To automatically start this function, it has to be called with a VBA code in the sheet.
Figure 15: Calling a macro automatically
A new parameter has to be added at the end of the parameter list in the database “Measures”.
The parameters that are visible or hidden have to be defined according to the example above.
Customizing measures and impacts
Based on these user inputs, the tool in the background filters the implemented measures and
provides a list with recommendations along with the best practices they are based on. Further-
more, some indicators that are influenced by the best practices are listed. Users can get addi-
tional information when they click on a best practice name.
Figure 16: Tool output with additional information opened

16
The SaMBA project is co-financed by the European Regional Development Fund through the Interreg
Alpine Space programme.
In the first database (Database “Measures”), the tool checks whether a measure can be rec-
ommended according to the user inputs. This is done with the help of IF-statements in which
the goal and the entered parameter values are considered. If a measure can be recommended,
the value in the first column of the database changes from “no” to “yes” and the measure along
with its additional information is displayed in the main user interface.
Figure 17: Identification of suitable measures in the database
In the following example, the tool checks whether a specific measure for increasing the modal
split of PT for leisure activities can be recommended. The measure should also be displayed
when the user does not want to distinguish between PT for leisure activities and PT for com-
muting.
=IF(AND(OR(Tool!D13="Increasing the modal split of PT for leisure"; Tool!D13="All PT solu-
tions"); Tool!C17="Urban"; OR(Tool!C21="High";Tool!C21="Medium")); "yes"; "no")
This formula refers to the cells in the main user interface that contain the user defined goal
and the parameter values that are relevant to this measure. The required parameter values
need to be reached on order for the measure to be recommendable. AND-statements are used
to connect several conditions. Some parameters with dropdown menus can have more than
one suitable category. In this case, the OR-function is used to define every appropriate param-
eter value category.
New measures have to be added to the database “Measures” of the tool along with best prac-
tice examples and their impact. IF-statements have to be defined separately for each measure.
However, some measures belonging to the same goal might have the same requirements.
Some measures also are assigned to more than one goal. In this case, the formula has to be
defined separately for each of these goals.
Recommended measures are shown in the user interface with the help of this formula:
{=IFERROR(INDEX(Database!$B$1:$B$78,SMALL(IF(Database!$A$1:$A$78="Yes",
ROW(Database!$B$1:$B$78)),ROW(Database!B1))),"")}
The best practice example and the documented impacts are implemented with the same for-
mula, but it needs to refer to the columns C (best practices) and D (impacts) in the database
sheet. This formula needs to be included in every cell that should be able to show recom-
mended measures from column B in the first database. It is an array that needs to be confirmed
with Ctrl + Shift + Enter. Information regarding best practices and impacts in the two columns
next to the measure name is displayed in the same way, however with reference to columns
17
The SaMBA project is co-financed by the European Regional Development Fund through the Interreg
Alpine Space programme.
C and D in the database. When adding additional goals in the database, the range of cells the
formula refers to needs to be adapted accordingly.
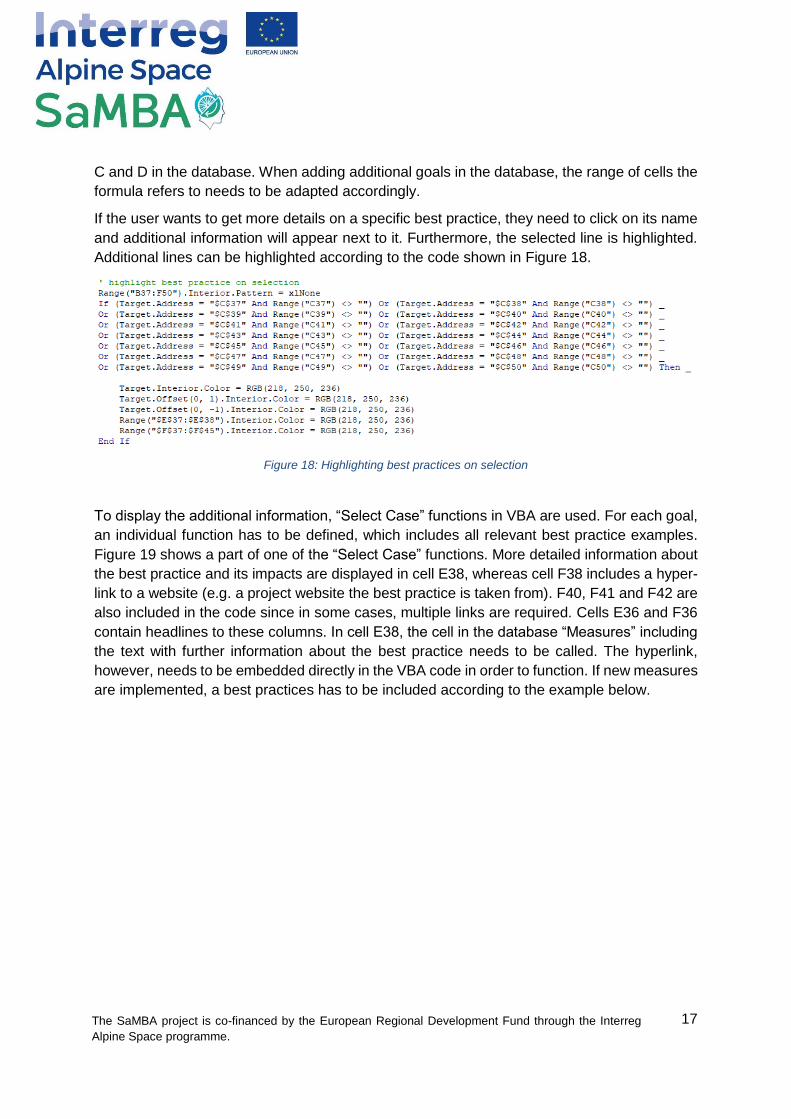
If the user wants to get more details on a specific best practice, they need to click on its name
and additional information will appear next to it. Furthermore, the selected line is highlighted.
Additional lines can be highlighted according to the code shown in Figure 18.
Figure 18: Highlighting best practices on selection
To display the additional information, “Select Case” functions in VBA are used. For each goal,
an individual function has to be defined, which includes all relevant best practice examples.
Figure 19 shows a part of one of the “Select Case” functions. More detailed information about
the best practice and its impacts are displayed in cell E38, whereas cell F38 includes a hyper-
link to a website (e.g. a project website the best practice is taken from). F40, F41 and F42 are
also included in the code since in some cases, multiple links are required. Cells E36 and F36
contain headlines to these columns. In cell E38, the cell in the database “Measures” including
the text with further information about the best practice needs to be called. The hyperlink,
however, needs to be embedded directly in the VBA code in order to function. If new measures
are implemented, a best practices has to be included according to the example below.

18
The SaMBA project is co-financed by the European Regional Development Fund through the Interreg
Alpine Space programme.
Figure 19: Excerpt of a Select Case function
Additional functionalities
The main user interface includes two buttons: one for resetting the tool and one for exporting
the sheet as PDF. Both are implemented by a VBA code in the module.
The reset button resets the entire main user interface. This affects dimension, goal, parameter
values and some entries that are part of the recommended measures:
Figure 20: Implementation of the reset button
The second button saves the entire sheet as PDF. It is implemented in the same module as
the reset button with the following code:

19
The SaMBA project is co-financed by the European Regional Development Fund through the Interreg
Alpine Space programme.
Figure 21: Implementation of the save button
The overview of all measures and best practices (third sheet) includes a filtering system that
allows to highlight measures by goal by selecting it with the help of a dropdown menu. This is
implemented by conditional formatting with the following formula:
=AND(NOT(ISBLANK($C$4));SEARCH($C$4;$A7&$B7&$C7&$D7&$E7&$F7&$G7&$H7&$I
7&$J7&$K7))
C4 is used as a search field. The SEARCH-function finds measures appropriate for the
selected goal.
Additional measures can be added to this overview. To include them in the search function,
the cell range has to be adapted in the conditional formatting menue.
Figure 22: Measures selected by goal in the best practice overview

20
The SaMBA project is co-financed by the European Regional Development Fund through the Interreg
Alpine Space programme.
3. Implementation of the GIS component
The optional GIS component of the SaMBA tool was created to get a detailed geographical
analysis of a region, which can support a user by filling in parameters in the Excel tool. The
optional GIS framework also includes methods for assessing the potential mobility demand
and potential action areas for mode-specific mobility behaviour change policies. Routing
algorithms, spatial statistics and analysis results are used to assess potential trip lengths and
affected target groups and to localise hotspots of potential modes. Based on these information,
potential action areas for specific mobility behaviour change policies can be derived. Hence,
this information supports the use of the Excel tool by identifying the planning dimensions and
goals (comp. Chapter 1b).
The GIS component was implemented and tested in a part of the Salzburg Region Tennengau.
Therefore, the visualisation in form of maps concentrates on this pilot region. This guideline
works as a manual to implement the GIS component also in other regions. While the Excel
part of the tool in many cases can be used without any adaptions, it is recommended to involve
a GIS expert in order to implement the optional GIS framework for a specific region. The fol-
lowing models and calculations were done in ArcGIS, but described textually so that they can
be implemented in any other GIS software.
Figure 23: Overview of aims and tasks of the GIS component
a) Spatial data and statistics
The basis for analysing a region with the help of the GIS component are spatial and statistic
data. The required data can be divided into four topics (cf. Figure 24
Structural data on the area of investigation like topography, dominant settlement
structure or existence of points of interest like schools

21
The SaMBA project is co-financed by the European Regional Development Fund through the Interreg
Alpine Space programme.
Transport data like a road network for routing and infrastructures like bike lanes, PT
stops, P&R sites etc.
Demographic data: number of citizens structured by age
Commuter data in form of a origin-destination-matrix
Figure 24: Categories of data needed for implementing the GIS component
b) Parameters
The GIS component of the SaMBA tool includes GIS-based methods for modelling the re-
quired input parameters in space. Thus, parameters, which have an influence on mobility
and on the selection of measures and incentives within the SaMBA Excel tool (comp. Chapter
1b), can be modelled and visualised, based on geo-data and spatial analysis methods. Never-
theless, in some cases there can be different data or other ways to implement a parameter
spatially.
According to the Excel tool, every parameter was taken and modelled based on spatial data.
The solutions listed below fit best according to own assumptions and can be used with the
available data in Austria/Salzburg. A few parameters that cannot be modelled spatially remain
because of missing or not accessible data. In other pilot cases and countries, the availability
of data differs strongly, so the list can be seen as orientation and as a guideline to find other
solutions.
Figure 25 shows the complementarity of the GIS framework for modelling spatial parameters
and the list of required input parameters of the SaMBA Excel tool. In summary, the implemen-
tation of the GIS framework allows the focus on smaller areas that are not integrated in
official statistics. In addition, the data derived from the standardised analysis framework are
a good basis for a decision-making process as spatial areas can be compared.

22
The SaMBA project is co-financed by the European Regional Development Fund through the Interreg
Alpine Space programme.
Figure 25: The GIS framework includes methods for modelling the parameters in space
The following table gives an overview of relevant parameters used within in the Excel tool.
Parameter (Excel Input) Ex-
cel GIS
Spatially modelled parameter (on 250m
Grid)
Type of the target area [Ur-
ban/Suburban/Rural] ✔ ✔ Urban-Rural- Typology
Topography [flat/hilly/steep] ✔ ✔ Slope
Quality of footpaths and side-
walks (Based on density of foot-
paths, presence of sidewalks,
street lightning, etc.) [high/me-
dium/low]
✔ ✔ Topography/(walkability)
Quality of cycling infrastructure
(Density of bicycle lanes, street
lighting, pavement quality, pres-
ence of adequate bicycle park-
ing facilities, etc.) [high/me-
dium/low]
✔ ✔ Bikeability index
Quality of PT (Based on fre-
quency, vehicle type, share of
persons living within walking
distance to a PT stop, etc.)
[high/medium/low]
✔ ✔
ÖV- Güteklassen (standardised, Austria-wide
assessment scheme 2019)
Service areas around PT stops (500m walk-
ing distance, number of residents aggre-
gated)
Presence of high commuter
flows (in and out, based on the
total number of employed per-
sons) [yes/no]
✔ ✔ 𝐸𝑚𝑝𝑙𝑜𝑦𝑒𝑑 𝑝𝑒𝑜𝑝𝑙𝑒 𝑐𝑜𝑚𝑚𝑢𝑡𝑖𝑛𝑔 𝑜𝑢𝑡 𝑜𝑓 𝑟𝑒𝑠𝑖𝑑𝑒𝑛𝑡𝑖𝑎𝑙 𝑚𝑢𝑛𝑖𝑐𝑖𝑝𝑎𝑙𝑖𝑡𝑖𝑒𝑠
𝑇𝑜𝑡𝑎𝑙 𝑛𝑢𝑚𝑏𝑒𝑟 𝑜𝑓 𝑐𝑜𝑚𝑚𝑢𝑡𝑒𝑟𝑠

23
The SaMBA project is co-financed by the European Regional Development Fund through the Interreg
Alpine Space programme.
Presence of a university or a
university catchment area ✔ ✘
Not included in the GIS models because of
later addition/modification
possible way: calculating service areas
around universities
Access to a primary school
[yes/no] ✔ ✔
Service areas around primary schools
(1.250m walking distance)
Access to a secondary school
[yes/no] ✔ ✔
Service areas around secondary schools
(1.250m walking distance)
Presence of a bike sharing sys-
tem ✔ ✘ No data available
Presence of a car sharing sys-
tem ✔ ✘ No data available
Presence of a park & ride sys-
tem ✔ ✔ P&R locations
Table 2: Spatial modelling of parameters
Type of the target area
The type of target area can be modelled spatially by using existing typologies available for
European countries:
Urban-Rural-Typology of the European Commission on NUTS 3 regions1
Degree of Urbanisation of the European Commission on municipality level2
For implementing the GIS component in Salzburg, the national and more detailed Urban-Rural-
Typology on municipality level (OGD, Statistik Austria 2020)3 was used. The database provides
a value for every municipality in Austria. In the next step, the municipality value was spatially
joined to every 250m grid cell within the municipality (used tool in ArcGIS: “Spatial Join - Have
their centre in”). In order to meet the categorisation of the SaMBA tool (Urban–suburban–rural),
the values had to be reclassified according to own assumptions:
Type Description Tool category
101 Urban main centres Urban
102 Urban medium centres Urban
103 Urbane small centres Urban
210 Regional centres, central Suburban
220 Regional centres, intermediary Suburban
310 Rural areas in the surrounding region of centers, central Suburban
320 Rural areas in the surrounding region of centers, intermediary Rural
1 https://ec.europa.eu/eurostat/statistics-explained/index.php/Territorial_typologies_manual_-_urban-rural_typology 2 https://ec.europa.eu/eurostat/web/degree-of-urbanisation/background 3 https://www.statistik.at/web_de/klassifikationen/regionale_gliederungen/stadt_land/index.html

24
The SaMBA project is co-financed by the European Regional Development Fund through the Interreg
Alpine Space programme.
330 Rural areas in the surrounding region of centers, peripheral Rural
410 Rural areas, central Rural
420 Rural areas, intermediary Rural
430 Rural areas, peripheral Rural
Table 3: Modelling target area type
Topography
Topography is an important parameter with strong impact on our mobility behaviour. It can be
derived from different sources. In the case of Salzburg, the slope was calculated based on a
digital terrain model (DTM) with a resolution of 5m. A bilinear interpolation was used when
extracting multi values to points to derive the slope from the DTM to values for every 250m
grid cell (used tool in ArcGIS: “Extract Multi Values to Points”).
The slope values were then reclassified according to own assumptions presented in the fol-
lowing table (used tools in ArcGIS: “Reclassify”):
Parameter Values Category in SaMBA tool
Topography (Slope)
≤ 15 flat
15 < x ≤ 45 hilly
> 45 steep
Table 4: Modelling topography
Quality of footpaths and sidewalks
This parameter is very difficult to model completely and automatically because it is qualitative
and can be interpreted in different ways. In the case of Salzburg, the parameter “topography”
was used to describe also the quality for walking, named “walkability”. This is based on the
assumption that a flat terrain is more “walkable” than hilly or steep ways, which require more
time and physical effort. It would be interesting to refine/ extend the walkability with safety and
quality aspects like the presence of sidewalks for example, but in our case, there is no sufficient
data available.
Quality of cycling infrastructure (Bikeability)
This parameter can be modelled spatially using data on the presence and density of bicycle
lanes and other infrastructure for cyclists like street lighting, bicycle parking facilities, etc. For
Salzburg the “bikeability index”4 is an adequate data base for representing the parameter
„Quality of cycling infrastructure“. This is an index, developed by the University of Salzburg –
4 https://gimobility.sbg.ac.at/wordpress/uml-bikeability/

25
The SaMBA project is co-financed by the European Regional Development Fund through the Interreg
Alpine Space programme.
ZGIS – GI_Mobility Lab, for assessing the road space regarding its suitability for cycling. All
road-related information is stored in the graph integration platform (GIP) including slope, road
surface, road category, bike speed, etc. and allows a uniform comparability on the basis of
official data. The derived indicator that influences suitability for cycling (bikeability) is calculated
for every segment of a road network or aggregated on raster cells. In the project the original
range of values between 0 (best) and 1 (poorest quality) is reclassified to the qualitative cate-
gories Excellent, Good and Basic.
Parameter Bikeability Index Category in SaMBA tool
Quality of cycling infrastructure
0 ≤ x ≤ 0.55 Excellent
0.55 < x ≤ 0.65 Good
0.65 < x ≤ 1.00 Basic
Table 5: Modelling quality of cycling infrastructure
Quality of public transport (PT)
Whereas the user of the Excel tool has to make his personal evaluation of the quality of PT in
the region under investigation, the parameter can me modelled spatially based on PT data and
a road network. The presentation of this parameter for the pilot case of Salzburg is divided into
two parts:
At first, the quality of PT is presented by the presence of PT stops and their quality in terms of
vehicle type and frequency. These characterisations are summarized within the “ÖV-Güteklas-
sen”, a classification scheme for PT in Austria, which determines the quality of a PT stop based
on vehicle type, interval and pedestrian access5. For getting the information on PT quality on
raster basis, the classification scheme on polygon level was joined to the 250m grid cells (used
tool in ArcGIS: “Spatial Join”) and the “ÖV-Güteklassen” from A to G were reclassified to the
categories Excellent, Good and Basic (used tool in ArcGIS: “Reclassify”).
Parameter Category (ÖV-Güteklassen) Category in SaMBA tool
Quality of PT
A, B Excellent
C, D, E Good
F, G Basic
Table 6: Modelling quality of PT
If such a classification scheme and the required detailed information on the PT infrastructure
are not available, the quality of PT for a distinct region can be presented by the share of people
living within 500m of a PT stop in the total number of citizens. This can be calculated by mod-
elling service areas of 500m around PT stops on a road network (including footpaths). The
500m radius was chosen in order to present a distance, which can be easily covered by foot.
5 https://www.oerok.gv.at/fileadmin/user_upload/Bilder/2.Reiter-Raum_u._Region/1.OEREK/O-EREK_2011/PS_RO_Verkehr/OeV-G%C3%BCteklassen_Bericht_Final_2017-04-12.pdf

26
The SaMBA project is co-financed by the European Regional Development Fund through the Interreg
Alpine Space programme.
By intersecting the number of citizens (number of people with primary residence on grid cells)
with the calculated 500m service areas, the share of persons living within 500m of a PT stop
can be derived as follows (used tools in ArcGIS: “Summary Statistics”):
𝑁𝑢𝑚𝑏𝑒𝑟 𝑜𝑓 𝑝𝑒𝑜𝑝𝑙𝑒 𝑤𝑖𝑡ℎ 𝑝𝑟𝑖𝑚𝑎𝑟𝑦 𝑟𝑒𝑠𝑖𝑑𝑒𝑛𝑐𝑒 𝑎𝑛𝑑 𝑚𝑎𝑥. 500𝑚 𝑑𝑖𝑠𝑡𝑎𝑛𝑐𝑒 𝑡𝑜 𝑎 𝑃𝑇 𝑠𝑡𝑜𝑝
𝑁𝑢𝑚𝑏𝑒𝑟 𝑜𝑓 𝑝𝑒𝑜𝑝𝑙𝑒 𝑤𝑖𝑡ℎ 𝑝𝑟𝑖𝑚𝑎𝑟𝑦 𝑟𝑒𝑠𝑖𝑑𝑒𝑛𝑐𝑒
The classification can also be used for modelling other means of transport (bike & ride or park
& ride / kiss & ride) by modifying the service areas (change speed, enlarge radius) in connec-
tion with the quality of the route for the selected means of transport (e.g. Quality of cycling
infrastructure).
Presence of high commuter flows
Since this parameter was added later during the refining phase of the tool, it was not included
in the model for the GIS component.
There are several solutions for modelling this parameter spatially. It may be an appropriate
solution to refer to the share of commuters, who commute out of their residential municipality,
which can be calculated on the basis of nationwide statistic data on commuters:
𝐸𝑚𝑝𝑙𝑜𝑦𝑒𝑑 𝑝𝑒𝑜𝑝𝑙𝑒 𝑐𝑜𝑚𝑚𝑢𝑡𝑖𝑛𝑔 𝑜𝑢𝑡 𝑜𝑓 𝑡ℎ𝑒𝑖𝑟 𝑟𝑒𝑠𝑖𝑑𝑒𝑛𝑡𝑖𝑎𝑙 𝑚𝑢𝑛𝑖𝑐𝑖𝑝𝑎𝑙𝑖𝑡𝑖𝑒𝑠
𝑇𝑜𝑡𝑎𝑙 𝑛𝑢𝑚𝑏𝑒𝑟 𝑜𝑓 𝑐𝑜𝑚𝑚𝑢𝑡𝑒𝑟𝑠
Using this approach, threshold values have to be applied to define which share of commuters
corresponds to high commuter flows.
Presence of a university or a university catchment area
Since this parameter was added later during the refining phase of the tool, it was not included
in the model for the GIS component. An easy way to implement this parameter is to calculate
service areas around universities with an appropriate radius that can be defined with the help
of literature research.
Access to a primary school
This parameter presents the existence of a primary school within walking distance. This can
be calculated by modelling service areas on a road network (including footpaths) based on a
distance of 1.250m around primary schools. The 1.250m radius was chosen in order to present
a distance, which pupils in the age of 6-10 years can cover easily by foot. The service areas
were then joined on a 250m grid, so that every grid cell has the information “Access to a pri-
mary school within 1.250m” or “No access to a primary school within 1.250m”.
For Salzburg, Open Geo Data (Land Salzburg 2020) on school locations and a road network
including footpaths were used to model this parameter (used tool in ArcGIS: Network Analyst
tools like “New service area”, “Spatial join - Have their centre in”).

27
The SaMBA project is co-financed by the European Regional Development Fund through the Interreg
Alpine Space programme.
Access to a secondary school
This parameter presents the existence of a secondary school within walking distance. The
data, thresholds and tools used for the calculation are the same as for the parameter above
(Access to a primary school).
Presence of a bike sharing system
For modelling this parameter, no adequate data for the area of investigation was available.
If there is available data, the parameter could be modelled in the same way as the parameter
“Presence of a park & ride system” (see below): first defining a distance or travel time, then
calculating service areas and joining the information of having a bike sharing system within a
defined network distance or travel time to every grid cell.
Presence of a car sharing system
For modelling this parameter, no adequate data for the area of investigation was available.
If there is available data, the parameter could be modelled in the same way as the parameter
“Presence of a park & ride system” (see below): first defining a distance or travel time, then
calculating service areas and joining the information of having a bike sharing system within a
defined network distance or travel time to every grid cell.
Presence of a park & ride system
For this parameter, available data on P&R locations at PT stops was used. Service areas from
2 to 15min travel time were calculated. These values were chosen because it is assumed and
most probable that a person, who has to drive more than 2 minutes and less than 15 minutes,
will use a P&R. The service areas were then joined on a 250m grid, so that every grid cell has
the information “Presence of a P&R within 2 to 15 minutes travel time” [yes/no] (Used tools in
ArcGIS: Network Analyst tools like “New service area”, “Spatial join – Have their centre in”).
c) Modelling results
As a result, the GIS component does not recommend measures like the Excel component.
This could be a further step. Using the spatial dimension in this case leads to a more complex
result: On the one hand, the potential demand and attractive mobility solutions are calcu-
lated and on the other hand, the framing conditions for the implementation of different
transport modes are modelled according to predefined evaluation schemes. The result
shows areas with high potentials for mobility behaviour change measures which are pre-
sented as maps in the next chapter.

28
The SaMBA project is co-financed by the European Regional Development Fund through the Interreg
Alpine Space programme.
Modelling the potential demand and attractive mobility solutions (as a basis for modelling results)
The potential demand for mobility offers is an important aspect when thinking about mobility
behaviour change measures. In the Salzburg example, this demand was calculated on a com-
muter matrix. This is a database for the province of Salzburg, containing the he number of
commuters and students including the “from” (place of residence) and “where” (place of work
/ school) information on a grid basis.
Based on this matrix, a routing of all commuter connections was done in order to get the routes
connected with a travel time information. Then these travel time information was classified in
order to join it with potential attractive mobility solutions. As a result the most attractive solu-
tions (transport modes) for every route according to distance, travel time, changing, waiting
time, etc. are carried out.
Pointing out areas with high potential for mobility behaviour change measures
By assessing the framing conditions for different transport modes like settlement structure or
quality of existing infrastructure, areas with high potential for mobility behaviour change
measures can be pointed out. Following the assumption that measures and incentives can
only work if there is already an appropriate infrastructure quality, existing infrastructures are
assessed and evaluated together with other aspects in order to derive potentials. The results
can be used as decision support for taking measures, providing incentives and supporting a
distinct transport mode.
The following evaluation schemes were created for assessing the potential for the three com-
binations (mobility solutions) PT + bike & ride, PT + walking and PT+ kiss & ride:
Evaluation scheme for the potential of PT & Bike and Ride based on PT quality, urban-
rural typology and quality of the bike infrastructure
Figure 26: Evaluation scheme for the potential of PT & Bike and Ride
Evaluation scheme for the potential of PT & walking based on PT quality, urban-rural ty-
pology and topography

29
The SaMBA project is co-financed by the European Regional Development Fund through the Interreg
Alpine Space programme.
Figure 27: Evaluation scheme for the potential of PT & walking
Evaluation scheme for the potential of PT & Kiss and Ride based on PT quality and urban-
rural typology
Figure 28: Evaluation scheme for the potential of PT & Kiss and Ride

30
The SaMBA project is co-financed by the European Regional Development Fund through the Interreg
Alpine Space programme.
Visualizing and interpreting results
The GIS component has been tested in the Tennengau region near the City of Salzburg. The
following maps show parameters and calculated results in form of potentials for the municipal-
ities Hallein and Kuchl.
Figure 29: Transport and settlement structure in the Tennengau Region
It is recommended to start with an overview of the target area. Therefore, the first map repre-
sents general information about transport and settlement structure in the municipalities Hallein
and Kuchl. It shows an overview of train stations and train lines, bus stops, streets, municipal-
ities and residential areas.

31
The SaMBA project is co-financed by the European Regional Development Fund through the Interreg
Alpine Space programme.
Figure 30: Quality of transport infrastructure
Parameters with influence on our mobility behaviour are modelled on the basis of a raster with
a cell size of 250m. In the map example, the quality of PT is represented based on the “ÖV-
Güteklassen” and the walking distance to a PT stop. Most residents at least have access to
PT with basic quality.

32
The SaMBA project is co-financed by the European Regional Development Fund through the Interreg
Alpine Space programme.
Figure 31: Share of citizens with access to a PT stop within walking distance
Parameters can also be visualised based on polygons. In this case, additionally, the share of
persons living within 500m distance to a PT stop based on settlement cores has been calcu-
lated.

33
The SaMBA project is co-financed by the European Regional Development Fund through the Interreg
Alpine Space programme.
Figure 32: Potential for policies promoting P&R
This map shows the potential of behaviour change policies that promote P&R based on settle-
ment cores. An important foundation for P&R is a high quality of PT.
34
The SaMBA project is co-financed by the European Regional Development Fund through the Interreg
Alpine Space programme.
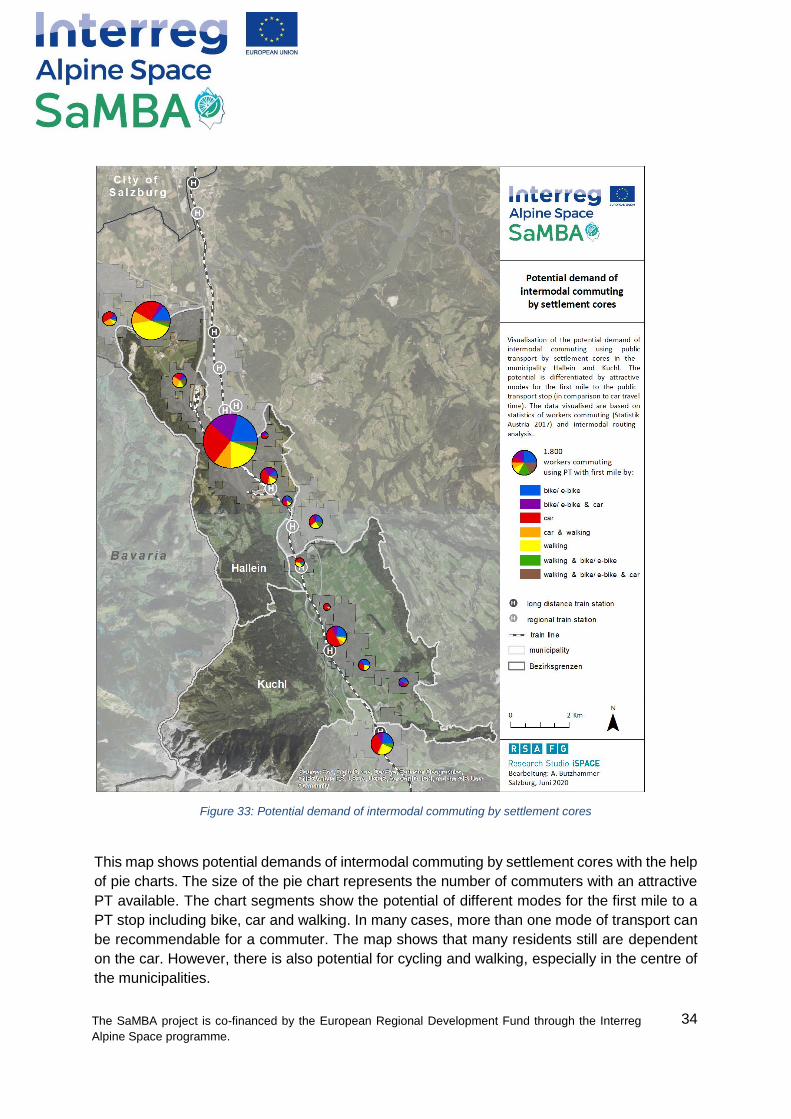
Figure 33: Potential demand of intermodal commuting by settlement cores
This map shows potential demands of intermodal commuting by settlement cores with the help
of pie charts. The size of the pie chart represents the number of commuters with an attractive
PT available. The chart segments show the potential of different modes for the first mile to a
PT stop including bike, car and walking. In many cases, more than one mode of transport can
be recommendable for a commuter. The map shows that many residents still are dependent
on the car. However, there is also potential for cycling and walking, especially in the centre of
the municipalities.
35
The SaMBA project is co-financed by the European Regional Development Fund through the Interreg
Alpine Space programme.
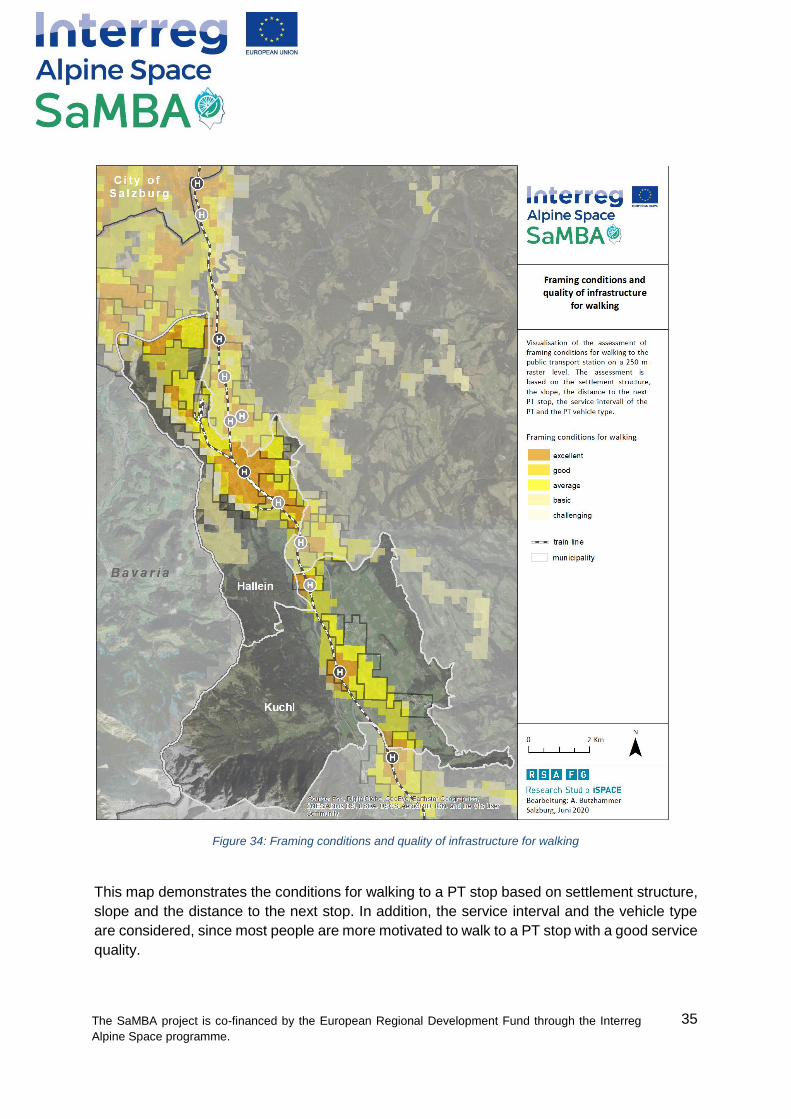
Figure 34: Framing conditions and quality of infrastructure for walking
This map demonstrates the conditions for walking to a PT stop based on settlement structure,
slope and the distance to the next stop. In addition, the service interval and the vehicle type
are considered, since most people are more motivated to walk to a PT stop with a good service
quality.

36
The SaMBA project is co-financed by the European Regional Development Fund through the Interreg
Alpine Space programme.
Figure 35: Potential action areas
In the next step, the framing conditions for walking have been combined with potential modes
for the first mile to PT stops for commuters. This visual comparison helps to determine action
areas for measures that promote PT and walking in the first mile. In this case, a potential action
area in the north of the study region could be identified.
Potential action area for public transport with
walking in the first mile

37
The SaMBA project is co-financed by the European Regional Development Fund through the Interreg
Alpine Space programme.
4. Outlook and contact info
The SaMBA tool can be used to ease the choice of suitable incentives and their applicability
as a first step helping public authorities in planning their strategies to engage the public in
choosing sustainable means of transport more often.
Future enhancements, especially by making use of geographical data, can also support the
development of regional analytics to compare possible target areas for certain measures and
the overall regional impact of the application of such measures especially if interconnected
with traffic information, commuting traffic and calculating overall effects on modal split and
CO2.
If you want to know more details about the implementation of the tool, please contact:
Dagmar Lahnsteiner: [email protected]
Johanna Schmitt: [email protected]
38
The SaMBA project is co-financed by the European Regional Development Fund through the Interreg
Alpine Space programme.
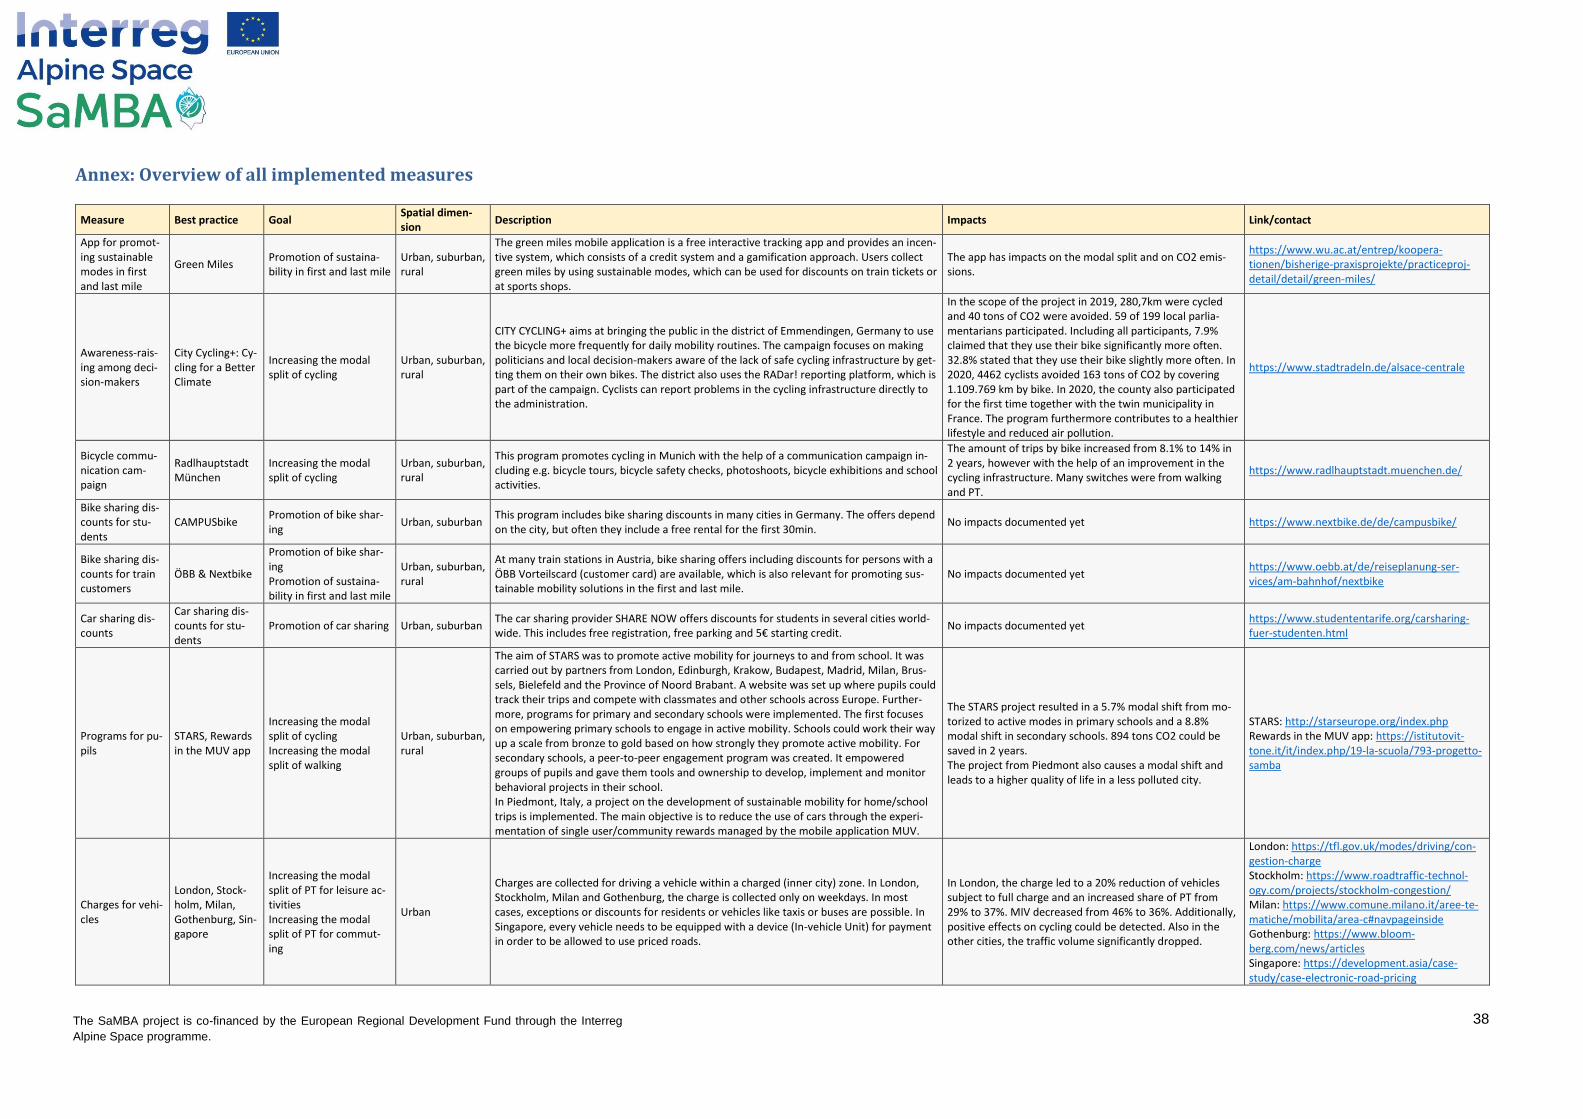
Annex: Overview of all implemented measures
Measure Best practice Goal Spatial dimen-sion
Description Impacts Link/contact
App for promot-ing sustainable modes in first and last mile
Green Miles Promotion of sustaina-bility in first and last mile
Urban, suburban, rural
The green miles mobile application is a free interactive tracking app and provides an incen-tive system, which consists of a credit system and a gamification approach. Users collect green miles by using sustainable modes, which can be used for discounts on train tickets or at sports shops.
The app has impacts on the modal split and on CO2 emis-sions.
https://www.wu.ac.at/entrep/koopera-tionen/bisherige-praxisprojekte/practiceproj-detail/detail/green-miles/
Awareness-rais-ing among deci-sion-makers
City Cycling+: Cy-cling for a Better Climate
Increasing the modal split of cycling
Urban, suburban, rural
CITY CYCLING+ aims at bringing the public in the district of Emmendingen, Germany to use the bicycle more frequently for daily mobility routines. The campaign focuses on making politicians and local decision-makers aware of the lack of safe cycling infrastructure by get-ting them on their own bikes. The district also uses the RADar! reporting platform, which is part of the campaign. Cyclists can report problems in the cycling infrastructure directly to the administration.
In the scope of the project in 2019, 280,7km were cycled and 40 tons of CO2 were avoided. 59 of 199 local parlia-mentarians participated. Including all participants, 7.9% claimed that they use their bike significantly more often. 32.8% stated that they use their bike slightly more often. In 2020, 4462 cyclists avoided 163 tons of CO2 by covering 1.109.769 km by bike. In 2020, the county also participated for the first time together with the twin municipality in France. The program furthermore contributes to a healthier lifestyle and reduced air pollution.
https://www.stadtradeln.de/alsace-centrale
Bicycle commu-nication cam-paign
Radlhauptstadt München
Increasing the modal split of cycling
Urban, suburban, rural
This program promotes cycling in Munich with the help of a communication campaign in-cluding e.g. bicycle tours, bicycle safety checks, photoshoots, bicycle exhibitions and school activities.
The amount of trips by bike increased from 8.1% to 14% in 2 years, however with the help of an improvement in the cycling infrastructure. Many switches were from walking and PT.
https://www.radlhauptstadt.muenchen.de/
Bike sharing dis-counts for stu-dents
CAMPUSbike Promotion of bike shar-ing
Urban, suburban This program includes bike sharing discounts in many cities in Germany. The offers depend on the city, but often they include a free rental for the first 30min.
No impacts documented yet https://www.nextbike.de/de/campusbike/
Bike sharing dis-counts for train customers
ÖBB & Nextbike
Promotion of bike shar-ing Promotion of sustaina-bility in first and last mile
Urban, suburban, rural
At many train stations in Austria, bike sharing offers including discounts for persons with a ÖBB Vorteilscard (customer card) are available, which is also relevant for promoting sus-tainable mobility solutions in the first and last mile.
No impacts documented yet https://www.oebb.at/de/reiseplanung-ser-vices/am-bahnhof/nextbike
Car sharing dis-counts
Car sharing dis-counts for stu-dents
Promotion of car sharing Urban, suburban The car sharing provider SHARE NOW offers discounts for students in several cities world-wide. This includes free registration, free parking and 5€ starting credit.
No impacts documented yet https://www.studententarife.org/carsharing-fuer-studenten.html
Programs for pu-pils
STARS, Rewards in the MUV app
Increasing the modal split of cycling Increasing the modal split of walking
Urban, suburban, rural
The aim of STARS was to promote active mobility for journeys to and from school. It was carried out by partners from London, Edinburgh, Krakow, Budapest, Madrid, Milan, Brus-sels, Bielefeld and the Province of Noord Brabant. A website was set up where pupils could track their trips and compete with classmates and other schools across Europe. Further-more, programs for primary and secondary schools were implemented. The first focuses on empowering primary schools to engage in active mobility. Schools could work their way up a scale from bronze to gold based on how strongly they promote active mobility. For secondary schools, a peer-to-peer engagement program was created. It empowered groups of pupils and gave them tools and ownership to develop, implement and monitor behavioral projects in their school. In Piedmont, Italy, a project on the development of sustainable mobility for home/school trips is implemented. The main objective is to reduce the use of cars through the experi-mentation of single user/community rewards managed by the mobile application MUV.
The STARS project resulted in a 5.7% modal shift from mo-torized to active modes in primary schools and a 8.8% modal shift in secondary schools. 894 tons CO2 could be saved in 2 years. The project from Piedmont also causes a modal shift and leads to a higher quality of life in a less polluted city.
STARS: http://starseurope.org/index.php Rewards in the MUV app: https://istitutovit-tone.it/it/index.php/19-la-scuola/793-progetto-samba
Charges for vehi-cles
London, Stock-holm, Milan, Gothenburg, Sin-gapore
Increasing the modal split of PT for leisure ac-tivities Increasing the modal split of PT for commut-ing
Urban
Charges are collected for driving a vehicle within a charged (inner city) zone. In London, Stockholm, Milan and Gothenburg, the charge is collected only on weekdays. In most cases, exceptions or discounts for residents or vehicles like taxis or buses are possible. In Singapore, every vehicle needs to be equipped with a device (In-vehicle Unit) for payment in order to be allowed to use priced roads.
In London, the charge led to a 20% reduction of vehicles subject to full charge and an increased share of PT from 29% to 37%. MIV decreased from 46% to 36%. Additionally, positive effects on cycling could be detected. Also in the other cities, the traffic volume significantly dropped.
London: https://tfl.gov.uk/modes/driving/con-gestion-charge Stockholm: https://www.roadtraffic-technol-ogy.com/projects/stockholm-congestion/ Milan: https://www.comune.milano.it/aree-te-matiche/mobilita/area-c#navpageinside Gothenburg: https://www.bloom-berg.com/news/articles Singapore: https://development.asia/case-study/case-electronic-road-pricing

39
The SaMBA project is co-financed by the European Regional Development Fund through the Interreg
Alpine Space programme.
Collecting points for sustainable mobility behav-ior
TrafficO2
Increasing the modal split of PT for leisure ac-tivities Increasing the modal split of PT for commut-ing Increasing the modal split of cycling
Urban, suburban, rural
A mobile application provides challenges and information to promote sustainable transport. It was tested in Palermo. Routes are described according to the distance trav-elled, cost in €, CO2, calories burned and O2 points (as credits). The app tracks personal sustainability goals based on the user's habits. The users can win prizes and discount cou-pons based on the O2 points.
In six months, 300 testers registered over 18.000km and saved 55kg CO2.
www.traffico2.com
Commuter chal-lenges for reduc-ing traffic during peaks
MOBI
Increasing the modal split of PT for commut-ing Increasing the modal split of cycling Promotion of ride shar-ing
Urban, suburban, rural
MOBI was implemented by partners from the Netherlands, Belgium, UK, Bulgaria, Romania and Portugal. It encourages a travel behaviour change in order to reduce traffic during peak hours. The users get feedback and information on saved energy and play as a team competing against other teams to see how many sustainable trips are made each week.
The project resulted in an increased share of sustainable modes from 58% to 80% among participants and a reduced share of MIV from 65% to 42%. PT increased from 19% to 28%, cycling from 4% to 8% and carpooling from 5% to 16%.
http://www.mobi-project.eu/
Comprehensive car sharing offers
Car sharing all in-clusive
Promotion of car sharing Urban, suburban The car sharing provider ELOOP provides all offers with free charging, free parking, in-cluded kilometres, etc.
No impacts documented yet https://eloop.at/de/preise/
Encourage the use of carpooling in tourism
Carpooling and hitchhiking - A new way of mov-ing
Promotion of ride shar-ing
Rural
This measure is implemented in a regional park in the Auvergne-Rhône-Alpes Region, France. The goal is to reduce the number of cars on the road by increasing the number of persons in per car by carpooling and hitchhiking services. To encourage the locals, commu-nication tools and incentives were developed. Concerning the tourists, a network of hosts and tourism professionals is set up to create measures to make customers come to the park with alternative modes. Stories are built to show how visitors can come and move in the region without a car. The park is collaborating with organizers of cultural and sports events to encourage the public to use carpooling for coming to these events (reserved parking, gratification, etc.).
The program increases the number of people per car and reduces the number of cars on the road, which also reduces car-related problems like noise, congestion and pollution. Carpooling leads to increasing social links and solidarity and improves the image of the territory.
https://www.rezopouce.fr/terri-toire/PNR_du_Vercors
Free bike sharing for pupils
Bike sharing in Stirling
Promotion of bike shar-ing
Urban, suburban In Stirling, UK, pupils aged 14 and over get a free bike sharing membership for 12 months. The idea is to promote sustainable transport options starting from a young age to help to form habits that last a lifetime.
No impacts documented yet https://www.nextbike.co.uk/en/news/stirling-schools-bike-share-scheme-is-uk-first/
Free cargo bikes Grätzlrad Wien Promotion of bike shar-ing
Urban, suburban In Vienna, free cargo bikes can be booked online. Only a deposit is required. No impacts documented yet https://www.mobilitaetsagentur.at/jahresak-tion/graetzlrad-wien/
Improvement of PT and fare sys-tems
Hospital 'Madre Teresa Di Calcut-ta'
Increasing the modal split of PT for commut-ing
Urban, suburban, rural
The main focus of this program from the municipalities Monselice and Este in the Province of Padova, Italy is to improve PT connections to the Hospital Madre Teresa di Calcutta. 5 pairs of journeys were moved to the Monselice train station in connection with the Pa-dova–Bologna line. The program also includes a new reward/pricing scheme and an adver-tising campaign to promote the initiatives. The fare modification includes a new ticket at the cost of 1€ valid for 4 hours.
The project led to an increase of the use of PT (276 transport users on 31 journeys with an increase by 33%). 20-25 students daily go to the hospital by bus after their train journey to the Monselice railway station. 140 transport users have the hospital as origin/destination (in-crease by 2.2%).
https://www.provincia.padova.it/samba-sus-tainable-mobility-behaviours-alpine-region-0
Incentives for residents to use less MIV
In motion pro-gram
Increasing the modal split of PT for leisure ac-tivities Increasing the modal split of PT for commut-ing Increasing the modal split of walking
Urban, suburban
This program was implemented in King County, Washington and provided residents with incentives to drive less and raised individual awareness on alternative travel options. Par-ticipants committed to change 2 trips per week from MIV to another mode for 12 weeks and for every successful week they received a voucher to purchase PT tickets, biking and walking gear or gasoline for carpooling.
Participants reduced MIV trips by 24%. Most trips were converted from MIV to PT (40%), but the program had also high positive effects on walking (25%).
https://www.nctr.usf.edu/wp-content/up-loads/2013/12/77947.pdf
Including mobil-ity offers in building projects
Building project Kendlerpark and refurbishment project Friedrich-Inhauser-Straße
Increasing the modal split of PT for leisure ac-tivities Increasing the modal split of PT for commut-ing Increasing the modal split of cycling
Urban, suburban, rural
The goal of this program is to foster sustainable mobility behaviour of new residents of new building projects in the City of Salzburg and to change the modal split. Following tools and information materials are conveyed: information and communication to citizens, awareness-raising (including an interactive cycling station, consulting services for the Salz-burg transport app and a mobility consultation station), an information brochure and indi-vidual mobility advice for all interested residents. These activities are supported by incen-tives like brochures, but also financial ones like free tickets for the local transport and shopping vouchers. Further goodies include cloth bags filled with smaller incentives.
The project increases the usage of sustainable alternative modes and leads to a modal shift. It helps to reduce car-re-lated problems like noise, pollution and congestion and contributes to an increase of contacts and social exchange between residents. Overall, this project contributes to an improvement of the quality of life in the city, a healthier lifestyle and the achievement of climate goals.
MMag. Gerhard Ainz SaMBA Project management City of Salzburg [email protected]
40
The SaMBA project is co-financed by the European Regional Development Fund through the Interreg
Alpine Space programme.
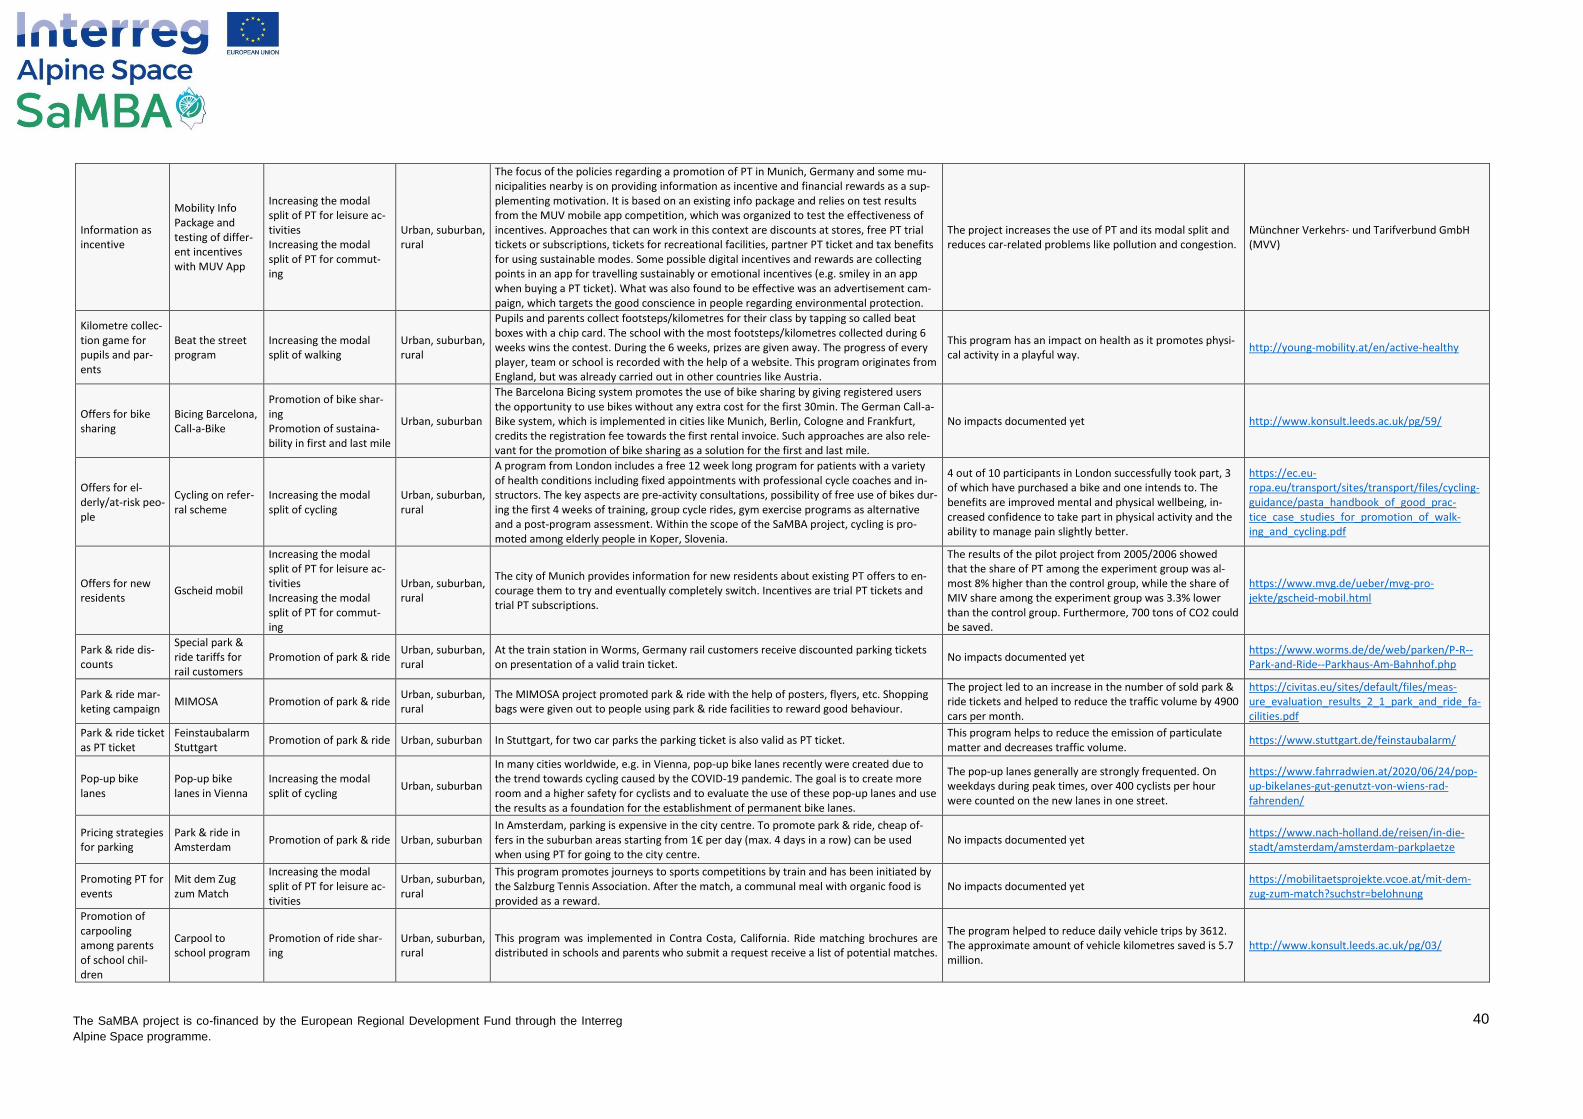
Information as incentive
Mobility Info Package and testing of differ-ent incentives with MUV App
Increasing the modal split of PT for leisure ac-tivities Increasing the modal split of PT for commut-ing
Urban, suburban, rural
The focus of the policies regarding a promotion of PT in Munich, Germany and some mu-nicipalities nearby is on providing information as incentive and financial rewards as a sup-plementing motivation. It is based on an existing info package and relies on test results from the MUV mobile app competition, which was organized to test the effectiveness of incentives. Approaches that can work in this context are discounts at stores, free PT trial tickets or subscriptions, tickets for recreational facilities, partner PT ticket and tax benefits for using sustainable modes. Some possible digital incentives and rewards are collecting points in an app for travelling sustainably or emotional incentives (e.g. smiley in an app when buying a PT ticket). What was also found to be effective was an advertisement cam-paign, which targets the good conscience in people regarding environmental protection.
The project increases the use of PT and its modal split and reduces car-related problems like pollution and congestion.
Münchner Verkehrs- und Tarifverbund GmbH (MVV)
Kilometre collec-tion game for pupils and par-ents
Beat the street program
Increasing the modal split of walking
Urban, suburban, rural
Pupils and parents collect footsteps/kilometres for their class by tapping so called beat boxes with a chip card. The school with the most footsteps/kilometres collected during 6 weeks wins the contest. During the 6 weeks, prizes are given away. The progress of every player, team or school is recorded with the help of a website. This program originates from England, but was already carried out in other countries like Austria.
This program has an impact on health as it promotes physi-cal activity in a playful way.
http://young-mobility.at/en/active-healthy
Offers for bike sharing
Bicing Barcelona, Call-a-Bike
Promotion of bike shar-ing Promotion of sustaina-bility in first and last mile
Urban, suburban
The Barcelona Bicing system promotes the use of bike sharing by giving registered users the opportunity to use bikes without any extra cost for the first 30min. The German Call-a-Bike system, which is implemented in cities like Munich, Berlin, Cologne and Frankfurt, credits the registration fee towards the first rental invoice. Such approaches are also rele-vant for the promotion of bike sharing as a solution for the first and last mile.
No impacts documented yet http://www.konsult.leeds.ac.uk/pg/59/
Offers for el-derly/at-risk peo-ple
Cycling on refer-ral scheme
Increasing the modal split of cycling
Urban, suburban, rural
A program from London includes a free 12 week long program for patients with a variety of health conditions including fixed appointments with professional cycle coaches and in-structors. The key aspects are pre-activity consultations, possibility of free use of bikes dur-ing the first 4 weeks of training, group cycle rides, gym exercise programs as alternative and a post-program assessment. Within the scope of the SaMBA project, cycling is pro-moted among elderly people in Koper, Slovenia.
4 out of 10 participants in London successfully took part, 3 of which have purchased a bike and one intends to. The benefits are improved mental and physical wellbeing, in-creased confidence to take part in physical activity and the ability to manage pain slightly better.
https://ec.eu-ropa.eu/transport/sites/transport/files/cycling-guidance/pasta_handbook_of_good_prac-tice_case_studies_for_promotion_of_walk-ing_and_cycling.pdf
Offers for new residents
Gscheid mobil
Increasing the modal split of PT for leisure ac-tivities Increasing the modal split of PT for commut-ing
Urban, suburban, rural
The city of Munich provides information for new residents about existing PT offers to en-courage them to try and eventually completely switch. Incentives are trial PT tickets and trial PT subscriptions.
The results of the pilot project from 2005/2006 showed that the share of PT among the experiment group was al-most 8% higher than the control group, while the share of MIV share among the experiment group was 3.3% lower than the control group. Furthermore, 700 tons of CO2 could be saved.
https://www.mvg.de/ueber/mvg-pro-jekte/gscheid-mobil.html
Park & ride dis-counts
Special park & ride tariffs for rail customers
Promotion of park & ride Urban, suburban, rural
At the train station in Worms, Germany rail customers receive discounted parking tickets on presentation of a valid train ticket.
No impacts documented yet https://www.worms.de/de/web/parken/P-R--Park-and-Ride--Parkhaus-Am-Bahnhof.php
Park & ride mar-keting campaign
MIMOSA Promotion of park & ride Urban, suburban, rural
The MIMOSA project promoted park & ride with the help of posters, flyers, etc. Shopping bags were given out to people using park & ride facilities to reward good behaviour.
The project led to an increase in the number of sold park & ride tickets and helped to reduce the traffic volume by 4900 cars per month.
https://civitas.eu/sites/default/files/meas-ure_evaluation_results_2_1_park_and_ride_fa-cilities.pdf
Park & ride ticket as PT ticket
Feinstaubalarm Stuttgart
Promotion of park & ride Urban, suburban In Stuttgart, for two car parks the parking ticket is also valid as PT ticket. This program helps to reduce the emission of particulate matter and decreases traffic volume.
https://www.stuttgart.de/feinstaubalarm/
Pop-up bike lanes
Pop-up bike lanes in Vienna
Increasing the modal split of cycling
Urban, suburban
In many cities worldwide, e.g. in Vienna, pop-up bike lanes recently were created due to the trend towards cycling caused by the COVID-19 pandemic. The goal is to create more room and a higher safety for cyclists and to evaluate the use of these pop-up lanes and use the results as a foundation for the establishment of permanent bike lanes.
The pop-up lanes generally are strongly frequented. On weekdays during peak times, over 400 cyclists per hour were counted on the new lanes in one street.
https://www.fahrradwien.at/2020/06/24/pop-up-bikelanes-gut-genutzt-von-wiens-rad-fahrenden/
Pricing strategies for parking
Park & ride in Amsterdam
Promotion of park & ride Urban, suburban In Amsterdam, parking is expensive in the city centre. To promote park & ride, cheap of-fers in the suburban areas starting from 1€ per day (max. 4 days in a row) can be used when using PT for going to the city centre.
No impacts documented yet https://www.nach-holland.de/reisen/in-die-stadt/amsterdam/amsterdam-parkplaetze
Promoting PT for events
Mit dem Zug zum Match
Increasing the modal split of PT for leisure ac-tivities
Urban, suburban, rural
This program promotes journeys to sports competitions by train and has been initiated by the Salzburg Tennis Association. After the match, a communal meal with organic food is provided as a reward.
No impacts documented yet https://mobilitaetsprojekte.vcoe.at/mit-dem-zug-zum-match?suchstr=belohnung
Promotion of carpooling among parents of school chil-dren
Carpool to school program
Promotion of ride shar-ing
Urban, suburban, rural
This program was implemented in Contra Costa, California. Ride matching brochures are distributed in schools and parents who submit a request receive a list of potential matches.
The program helped to reduce daily vehicle trips by 3612. The approximate amount of vehicle kilometres saved is 5.7 million.
http://www.konsult.leeds.ac.uk/pg/03/

41
The SaMBA project is co-financed by the European Regional Development Fund through the Interreg
Alpine Space programme.
Promotion of carpooling to work
Carpooling to Work Makes You Get a Lot
Promotion of ride shar-ing
Urban
The Department of Isère, France, has developed and opened an incentive platform to pro-vide incentives for shifting to alternative mobility modes for everyday travels. It makes people gain points, which can be traded for rewards, gifts and commercial offers on the in-tegrated online shop. In a new project, a new service of carpooling lines has been con-nected to the platform. This carpooling line concept includes a geo-located mobile app and live information of drivers arriving and passengers waiting. Drivers receive points for pro-posing seats in their car and additional points for every passenger picked up. Passengers also get points for every travel.
The project helps to reduce congestion and the numbers of cars on the streets. It also promotes environmental protec-tion.
https://illicov.fr/ligne/bievre/
Promotion of PT in touristic re-gions
Mobility in Gorenjska Re-gion
Increasing the modal split of PT for leisure
Rural
Main focus in Bohinj, Slovenia is to decrease traffic by personal cars from the lake shores in and to enable sustainable travelling to the starting points of the hiking trails. Sustainable touristic mobility is promoted by improving PT, linking buses with hiking trails, hop on hop off systems, regional public buses and skiing buses. Public passenger services are planned to be free for local residents and visitors are encouraged to leave their cars at P&R places. Furthermore, active mobility is promoted and traffic safety is improved. The municipality Tržič aims at lowering the peak-hour occupancy below 85% on all municipal parking spaces by the introduction of paid and short-term parking regimes.
The project helps to decrease the number of cars on the street and leads to a modal shift, especially in tourism. It also decreases emissions and pollution caused by traffic.
https://www.bohinj.si/en/mobility/
Promotion of walking to school
Walking bus Increasing the modal split of walking
Urban, suburban, rural
A walking bus is a program for young children to walk to school together with volunteering adults as leaders. This walking bus follows a fixed route with several stops on the way. Chil-dren can receive small presents like stickers as a reward for walking. The idea originates from Australia, but walking buses have been implemented in many other counties like Ger-many, France, Italy, Austria, Switzerland, Luxembourg, the UK and Canada. Within the scope of the SaMBA project, they are implemented in Koper, Slovenia.
Walking buses help to promote traffic safety, health and contribute to the reduction of traffic volume.
General information: http://www.walkingschoolbus.org/re-sources.html Walking bus in Koper: http://www.etmkoper.si/pesbus.html
Rewards for avoiding peaks
MIMOSA, Spitsmijden
Increasing the modal split of PT for commut-ing
Urban
In the MIMOSA project, Participants receive 4€ when they avoid main traffic axes roads during 6 and 10 AM. In the Spitsmijden program, commuters get rewards for avoiding car travel during peaks. They receive 7€ for avoiding the entire morning peak and 3€ for avoiding 7:30 to 8 and 9 to 9:30. The program was tested on the Dutch A12 motorway corridor from Zoetermeer to-wards The Hague.
The MIMOSA project helped to reduce the traffic volume between 500 and 700 cars during the morning rush hour in Utrecht. The Spitsmijden program led to a decline of total car-use from 70% to 65% mainly due to an increased use of PT.
MIMOSA: https://civitas.eu/content/mimosa Spitsmijden: https://www.vtpi.org/spitsmijden.pdf
Rewards for car-poolers
Fahr mit Promotion of ride shar-ing
Rural
This project initiates carpooling by creating ride-sharing stops. People searching for lifts need to stand at designated places marked with green arrows and wait to be picked up. Drivers are encouraged to participate with the help of rewards during the starting phase. This program was developed for the Tennengau area in the Austrian federal state Salzburg.
No impacts documented yet https://mobilitaetsprojekte.vcoe.at/fahr-mit-2019?
Rewards for chil-dren using sus-tainable modes on the way to school
Traffic Snake Game
Increasing the modal split of PT for commut-ing Increasing the modal split of walking Promotion of ride shar-ing
Urban, suburban, rural
This project was implemented in a great number of European countries. Children received a sticker for every day they walked, cycled, used PT or shared a car journey to school. The goal was to collect as many stickers on a banner as possible. The children got rewards for reaching key points on the banner (e.g. no homework) and completing it (e.g. cycling tour).
The project led to a reduction of CO2 emissions and had the greatest impact on the modal split of walking with a total increase of 9% across the participating countries. Carpool-ing increased by 4% and PT by 1%.
https://www.trafficsnakegame.eu/
Rewards for commuters go-ing by bike
Cycling kilo-metric allowance
Increasing the modal split of cycling
Urban, suburban Employees who commute to work by bike got a financial reward. They received 0.25€ per kilometre and up to 200€ annually. A pilot study was carried out in 18 French companies.
The program led to a 50% increase in the number of active cyclists, which rose to 125% after one year. However, most switches were from PT, but also 20% switched from MIV and 9% from moped or motorcycle. 2.7 tons of CO2 could be saved in 6 months.
https://ec.eu-ropa.eu/transport/sites/transport/files/cycling-guidance/pasta_handbook_of_good_prac-tice_case_studies_for_promotion_of_walk-ing_and_cycling.pdf
Rewards for giv-ing up the pri-vate car
MOBILIS Promotion of car sharing Urban, suburban Participants received financial rewards for scrapping their personal car and using car shar-ing instead. This involved a bonus to be used within 2 years to cover costs related to kilo-metric consumption only. The program was implemented in Venice.
Besides the reward system, the project also included the improvement of the existing car sharing scheme. Alto-gether, it led to an increase of car sharing users by almost 50% and, thus, an increase of car sharing mileage.
https://civitas.eu/content/mobilis
Rewards for not using a parking space
Parking cash out program
Increasing the modal split of PT for commut-ing Promotion of ride shar-ing
Urban, suburban Employees are given the choice between a free parking space and cash. Parking cash out programs are e.g. implemented in California.
An analysis of 8 Californian companies shows that with the help of this program the modal split among participants de-creased from 76% to 63%, while the modal split of PT (6% to 9%) and carpooling (14% to 23%) increased.
https://www.nctr.usf.edu/wp-content/up-loads/2013/12/77947.pdf

42
The SaMBA project is co-financed by the European Regional Development Fund through the Interreg
Alpine Space programme.
Rewards for sus-tainable mobility during holiday
Käse für Kilome-teraskese, Sanfte Mobilität im Ur-laub
Promotion of bike shar-ing
Urban, suburban, rural
The program Käse für Kilometeraskese is offered by a hotel in Mittelberg, Austria. Hotel guests leave their car keys at the reception and receive a free parking space, a free rental bike and a piece of cheese at the end of the holiday. Tourists arriving by train also receive a free rental bike. Furthermore, the use of the free Walser Bus is promoted. The program Sanfte Mobilität im Urlaub was offered by a hotel in Zell am See, Austria. The hotel offered to pick up guests at the train station and provided rental bikes. Every guest got a green mile pass and a present as a reward. At the end of the year, the guest with most green miles received a prize.
With the help of the program Käse für Kilometeraskese, be-tween 8000 and 10000 car trips can be saved per year.
Käse für Kilometeraskese: https://mobilitaetsprojekte.vcoe.at/kaese-fuer-kilometeraskese Sanfte Mobilität im Urlaub: https://mobilitaetsprojekte.vcoe.at/sanfte-mo-bilitaet-im-urlaub
Rewards for us-ing fewer cars per household
One less car pro-gram
Increasing the modal split of PT for leisure ac-tivities Increasing the modal split of PT for commut-ing Increasing the modal split of cycling Increasing the modal split of walking
Urban, suburban, rural
The goal of this program was for households to park one of their cars and use other modes instead. Participants received 85$ per week as a compensation for recording their data and as an economic incentive. The program was implemented in Seattle with 86 households over a period of 6-9 weeks.
The program helped to reduce drive-alone car miles of par-ticipants by 27%. The mileage of cycling (38%), walking (30%), PT (25%) and carpooling (23%) strongly increased.
https://www.nctr.usf.edu/wp-content/up-loads/2014/11/77947_508.pdf
Voucher pro-grams
Transit voucher program
Increasing the modal split of PT for leisure ac-tivities Increasing the modal split of PT for commut-ing
Urban, suburban
Third-party benefit administrators and/or transit agencies issue vouchers that riders give to participating transportation providers to acquire fare media. Employers may subsidized the costs of the vouchers to create an incentive to use PT. Transit voucher programs are implemented in many US cities, e.g. San Francisco, Philadelphia and New York.
An analysis shows that commuter trips shifted by 20% from MIV to PT.
https://www.nctr.usf.edu/wp-content/up-loads/2013/12/77947.pdf