GGGI Strategic Outcomes Guideline
104
GGGI Strategic Outcomes Guideline Frameworks and Methodologies for Development Impact Estimation GGGI Technical Guideline No. 6 December 2019
-
Upload
khangminh22 -
Category
Documents
-
view
0 -
download
0
Transcript of GGGI Strategic Outcomes Guideline

GGGI Strategic Outcomes GuidelineFrameworks and Methodologies for Development Impact Estimation
GGGI Technical Guideline No. 6
December 2019

Part of GGGI’s technical guidelines series
Copyright © 2019
Global Green Growth InstituteJeongdong Building 19F21-15 Jeongdong-gilJung-gu, Seoul 04518Republic of Korea
The Global Green Growth Institute does not make any warranty, either express or implied, or assume any legal liability or responsibility for the accuracy, completeness, or any third party’s use or the results of such use of any information, apparatus, product, or process disclosed of the information contained herein or represents that its use would not infringe privately owned rights. The views and opinions of the authors expressed herein do not necessarily state or reflect those of the Global Green Growth Institute.
Cover Image © GGGI
1. Green Growth Planning Guidelines, Jin Young Kim, Robert Mukiza, Mohammed Angawi and Nobert Maass, 2016.
2. Green City Development Guidelines, Nguyet Minh Pham, Daniel Buckley, Adam Ward, Okju Jeong and Julie Robles, 2016.
3. Pro-poor, Inclusive Green Growth: Experience and a New Agenda, Steve Bass, Paul Steele, Camilla Toulmin, Oliver Greenfield, Chris Hopkins, Inhee Chung, Thomas Nielsen, 2016.
4. Green Energy Development, Dereje Senshaw, 2017.
5. NDC Implementation Roadmap Development: Guidelines for Small Island Developing States, Douglas Marett, Marc André Marr, Katerina Syngellakis, Kristin Deason, 2018.
6. GGGI Strategic Outcomes Guideline: Frameworks and Methodologies for Development Impact Estimation, Baruah, P.J. Rijsberman, F., and Quezada,, D., 2019.

IIIAcknowledgementsGGGI Strategic Outcomes Guideline
ACKNOWLEDGEMENTSThis guideline was prepared by the GGGI as part of the organization’s efforts to develop frameworks and methodologies for development impact estimation of its country-level and global activities.
Lead authors: Pranab Baruah, Frank Rijsberman, Diana Quezada Avila
Reviewers and contributors: Aaron Drayer, Adam Ward, Ahmed Al Amra, Annaka Peterson, Annawati Van Paddenburg, Arrabothu Dheeraj, Carolina Jaramillo, Chan Ho Park, Christophe Assicot, Dagmar Zwebe, Dauda Foday Suma, Donovan Storey, Hyejung Kim, Hyesu Yoon, Hyun S. Lee, Ingvild Solvang, Jaeseung Lee, Jan Stelter, Jerome Fakhry, Karolien Casaer, Katerina Syngellakis, Khan Ram-Indra, Mahamadou Tounkara, Malle Fofana, Mamadou Konate, Marcel Silvius, Marijke Vermaak, Mohammed Angawi, Monica Moon, Muharrem Kemal Askin, Nicole Perkins, Okechukwu Daniel Ogbonnaya, Orestes Anastasia, Pablo Martinez, Romain Brillie, Rowan Fraser, Sakiusa Tuisolia, Shantanu Gotmare, Shomi Kim, Siddhartha Nauduri, Stephan Gill, Tran Ngoc Thinh, Wona Lee
Copy editor: Marijke Vermaak
Design and graphics: Formato Verde
Publication Coordinator: Nera Mariz Puyo
Please cite as: Baruah, P.J., Rijsberman, F., and Quezada, D. (2019) GGGI Strategic Outcomes Guideline: Frameworks and Methodologies for Development Impact Estimation (Version 1.0), Global Green Growth Institute: Seoul.
Disclaimer: The Global Green Growth Institute does not make any warranty, either express or implied; or assumes any legal liability or responsibility for the accuracy, completeness, or any third party’s use or the results of such use of any information, apparatus, product, or process disclosed of the information contained herein; or represents that its use by any third party would not infringe privately owned rights. The views and opinions of the authors expressed herein do not necessarily state or reflect those of the Global Green Growth Institute.

IV
AbbreviationsGGGI Strategic Outcomes Guideline V
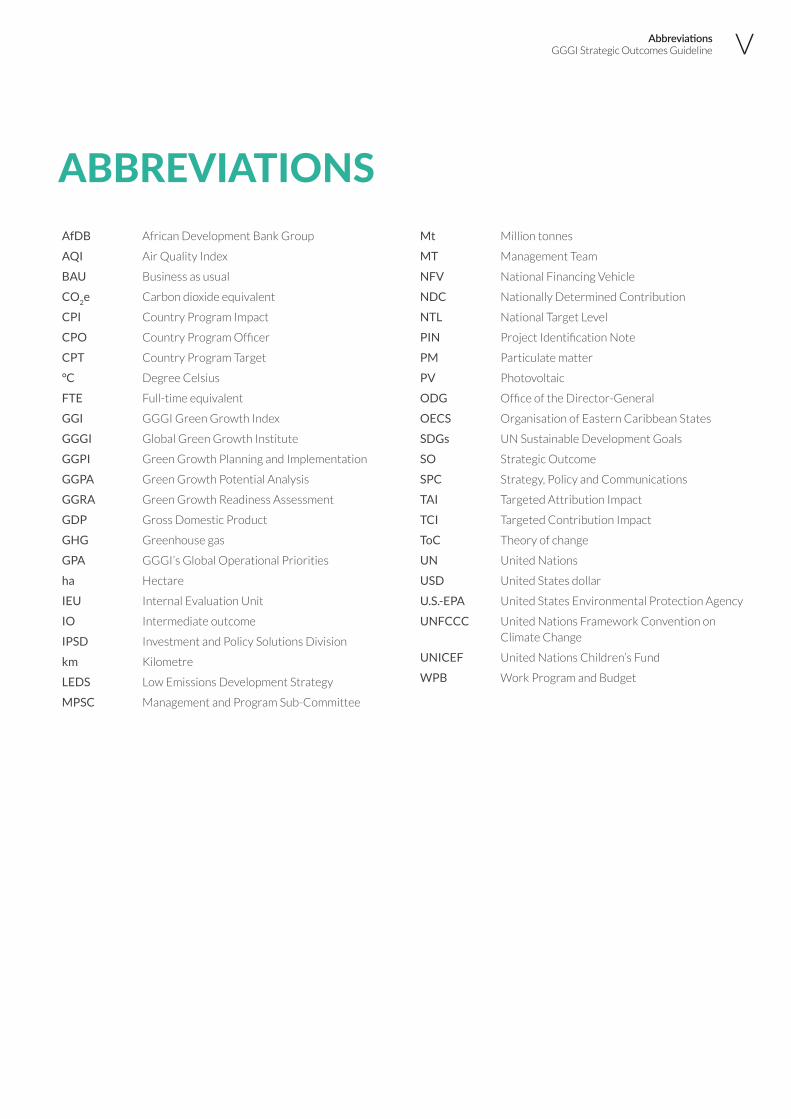
ABBREVIATIONSAfDB African Development Bank Group
AQI Air Quality Index
BAU Business as usual
CO2e Carbon dioxide equivalent
CPI Country Program Impact
CPO Country Program Officer
CPT Country Program Target
°C Degree Celsius
FTE Full-time equivalent
GGI GGGI Green Growth Index
GGGI Global Green Growth Institute
GGPI Green Growth Planning and Implementation
GGPA Green Growth Potential Analysis
GGRA Green Growth Readiness Assessment
GDP Gross Domestic Product
GHG Greenhouse gas
GPA GGGI’s Global Operational Priorities
ha Hectare
IEU Internal Evaluation Unit
IO Intermediate outcome
IPSD Investment and Policy Solutions Division
km Kilometre
LEDS Low Emissions Development Strategy
MPSC Management and Program Sub-Committee
Mt Million tonnes
MT Management Team
NFV National Financing Vehicle
NDC Nationally Determined Contribution
NTL National Target Level
PIN Project Identification Note
PM Particulate matter
PV Photovoltaic
ODG Office of the Director-General
OECS Organisation of Eastern Caribbean States
SDGs UN Sustainable Development Goals
SO Strategic Outcome
SPC Strategy, Policy and Communications
TAI Targeted Attribution Impact
TCI Targeted Contribution Impact
ToC Theory of change
UN United Nations
USD United States dollar
U.S.-EPA United States Environmental Protection Agency
UNFCCC United Nations Framework Convention on Climate Change
UNICEF United Nations Children’s Fund
WPB Work Program and Budget
ContentsGGGI Strategic Outcomes Guideline
832 Managing the continuous SO process
within the organization1
6
3
4
5
2
7
9
Annexes
Introduction 01
1.1 Green growth: the pathway to sustainable development
01
1.2 On measuring green growth transition progress 02
Acknowledgements iii
Abbreviations v
List of figures and tables vii
Estimating SO impact and targetoutcomes – approach and methodology
18
6.1 Bottom-up approach for SO impact estimation 20
6.2 Top-down approach for SO impact estimation 22
The Strategic Outcomes and GGGI’sTheory of Change
05
Strategic Outcome Indicators 09
Description of the Strategic Outcomes 11
5.1 Strategic Outcome 1: Greenhouse gas emissions reduction
11
5.2 Strategic Outcome 2: Creation of green jobs 12
5.3 Strategic Outcome 3: Access to sustainable services
13
5.4 Strategic Outcome 4: Improved air quality 15
Strategic Outcome 5: Adequate maintenance of natural capital
17
5.5 Strategic Outcome 6: Enhanced adaptation to climate change
17
About this guideline 03
26 Estimating Targeted Attribution Impacts and Targeted Contribution Impacts for GGGI Strategy 2030
38 Annex I. GGGI Intermediate Outcomes
39 Annex II. Qualifying Projects/Outputs
41 Annex III. SOs as a green growth planning, monitoring and communications tool for NDC and SDG implementation
42 Annex IV. Mapping of SOs and indicatorsof GGGI’s green growth analysis tools
47 Annex V. Methodology guidance sheet for Strategic Outcome 1 — Greenhouse gas reductions
56 Annex VI. Methodology guidance sheet for Strategic Outcome 2 — Creation of green jobs
61 Annex VII. Methodology guidance sheet for Strategic Outcome 3.1 — Access to clean and affordable energy
65 Annex VIII. Methodology guidance sheet for Strategic Outcome 3.2 — Access to improved sanitation
68 Annex IX. Methodology guidance sheet for Strategic Outcome 3.3 —Access to sustainable waste management services
72 Annex X. Methodology guidance sheet for Strategic Outcome 3.4 — Access to sustainable public transportation
76 Annex XI. Methodology guidance sheet for Strategic Outcome 5 — Adequate maintenance of natural capital
81 Annex XII. Methodology guidance sheet for Strategic Outcome 6 — Adaptation to climate change
86 Annex XIII. Example SO template for reporting CPI and CPT impact estimates
35 Reporting and verification of SO impacts36 9.1 Reporting ex-ante impacts of projects/ou-
tputs for planning and annual reporting
36 9.2 Reporting ex-post impacts reporting of pro-jects/outputs for under implementation
CONTENTS
VI
VII
Figure A-1. Qualifying project and output categories by
Intermediate Outcomes
39
Figure A-2. Examples of GGGI projects and outputs for which
SO impact estimation is required
40
Figure A-3. Role of the SO framework in green growth planning,
monitoring and implementation
41
Figure 1.Description of sections in this guideline
04
Figure 2.GGGI Theory of Change
06
Figure 3.Impact links between GGGI’s Global Operational
Priorities (GPAs) and Strategic Outcomes (SOs)
07
Figure 4.GHG emissions targets set out by different GGGI
countries in their NDCs
12
Figure 5.Share of national population with access to
electricity in GGGI countries
13
Figure 6.Share of national population with access to
improved sanitation in GGGI countries
14
Figure 7.Daily estimates of U.S. EPA Air Quality Index (AQI)
during 2014-16 based on 24-hour rolling average PM2.5 data received from a monitoring station in
the capital of a GGGI member country
16
Figure 8.GGGI Strategic Outcome Impact Estimation
19
Figure 9. Country Program Impact (CPI) and Country
Program Target (CPT) in the context of the National Target Level (NTL)
20
Figure 10.Projects/outputs that qualify as having direct causal
links with the Strategic Outcomes
21
Figure 11.2030 NTL estimate for Mexico for SO1 (reduced
GHG emission)
24
Figure 12.2030 NTL estimate for Burkina Faso for SO 3.1
(access to clean, affordable energy)
24
Figure 13.2030 NTL estimate for Nepal for SO3.2 (access to
improved sanitation)
24
Figure 14.2030 NTL estimate for Lao PDR for SO3.3 (access
to sustainable waste management)
25
Figure 15.Recommended CPI estimation and reporting steps
36
08 Table 1.Alignment of GGGI SOs with major SDGs
10 Table 2.Indicators and units of GGGI SOs
28 Table 3.Investment Multipliers used for estimating Targeted Attribution Impacts (TAIs)
29 Table 4.GGGI’s Targeted Attribution Impacts (TAIs) by investment options using the top-down approach
31 Table 5.GGGI’s Targeted Contribution Impacts (TCIs) by region using the top-down approach
33 Table 6.Primary tasks and recommended responsibilities in the SO processes
36 Table 7.Recommended modalities for SO impact reporting
42 Table A-1. Indicators in GGGI Green Growth Index and Green Growth Readiness Assessment with links to the SOs
44 Table A-2. Indicators in GGGI’s Green Growth Potential Assessment (GGPA) that correspond to the SOs
86 Table A-3.Investment Multipliers used to estimate TAIs outlined in GGGI Strategy 2030.
LIST OFFIGURES
LIST OFTABLES
VIIList of Figures and tablesGGGI Strategic Outcomes Guideline

1 1. IntroductionGGGI Strategic Outcomes Guideline
1. Introduction
1.1 Green growth: a pathway to sustainable development
Sustained economic growth can be a major driver of poverty reduction and human development, especially in countries at early stages of development. For example, China’s economic growth enabled more than 850 million people to escape from extreme poverty1 and the country’s poverty rate fell from 88 percent to less than 1 percent in just over three decades (1981-2015)2. However, evidence from the past two centuries shows that an economic growth model based on natural resources, including fossil fuels, results in unequal and unsustainable consumption patterns.
Maintaining the current model of growth poses an imminent threat to the safe operating space of the planet3 in the form of climate change, biodiversity loss, and ocean acidification4.
1 The international extreme poverty level is defined as an income of USD1.90 or less per day (2011 Purchasing Power Parity terms)
2 World Bank World Development Indicators (ID: SI.POV.DDAY; accessed October 10, 2019), https://data.worldbank.org/indicator/SI.POV.DDAY?locations=CN
3 The safe operating space is an approximate first-order estimate of safe boundaries of planetary life support systems that are essential for human survival.
4 Rockström et al., “Planetary Boundaries: Exploring the Safe Operating Space for Humanity,” Ecology and Society 14, no 2 (2009). http://www.ecologyandsociety.org/vol14/iss2/art32
Human activities have already contributed to 1°C warming of the planet above pre-industrial levels. Even with current policies and pledges in place to tackle the existential threat from climate change, warming is predicted to reach 3°C by the end of the century5. This is double the 1.5°C limit on the increase in average global temperatures considered necessary to prevent runaway and dangerous climate change, unleashing devastating consequences on society. A sixth mass extinction that will impact the sustainability of the planet’s life-supporting cycles is already underway. The oceans have become approximately 30 percent more acidic during the past 200 years, faster than any known change in the past 50 million years6. If current pollution patterns continue, there could be more plastic than fish by weight in our oceans by the year 2050. Climate change and rapid overexploitation of renewable natural resources, such as fish stocks, are threatening food security worldwide. These trends are projected to bring further, irreversible negative impacts if corrective actions are not taken urgently.
5 According to Climate Action Tracker analysis, current policies in place are projected to lead to a 3.2°C warming above pre-industrial levels. The unconditional pledges and targets by countries, including in NDCs, would lead to 2.9°C warming above pre-in-dustrial levels. “Temperatures”, Climate Action Tracker, updated September 19, 2019, https://climateactiontracker.org/global/temperatures/
6 “Ocean acidification”, Smithsonian Institute, updated April 2018, https://ocean.si.edu/ocean-life/invertebrates/ocean-acidification
1

21. IntroductionGGGI Strategic Outcomes Guideline
While there has been a considerable decrease in extreme poverty over the past few decades, the pace of the decrease has slowed. Almost half of the world population’s basic needs remain unmet. This keeps the imperative for economic growth for poverty reduction and human development strong. However, the current model of growth has not brought universal benefits. Inequality across and within nations has emerged as a defining challenge of our time. Rising population and urbanization accelerate environmental pollution, climate change and biodiversity loss. The poor and vulnerable are affected disproportionately, therefore diminishing development gains made in the past decades. In this context, greener and more inclusive approaches to economic growth are rapidly gaining traction, particularly in economies undergoing or at the cusp of rapid growth aimed at poverty alleviation and human development.
The Global Green Growth Institute (GGGI) was established with the sole mandate of advancing the green and inclusive economic growth model in emerging and developing economies. GGGI aims to assist its Member and partner countries to convert existing and emerging developmental and environmental challenges, including climate change, into opportunities for sustainable development. The institute does so by formulating, promoting and implementing approaches to economic growth that are both environmentally sustainable and socially inclusive. Green growth approaches therefore serve as pathways to sustainable development.
Climate action and the transition to a low carbon economy are central tenets of the green growth agenda, as they provide an integrated approach to simultaneously deliver economic development, climate resilience and environmental protection. Since the adoption of the UN Sustainable Development Goals (SDGs) and the Paris climate agreement in 2015, green growth has been pursued within these two global frameworks as a solution to the pressing economic, social and environmental challenges facing developing and emerging economies. Interest in the concept of green growth is growing, especially among developing and emerging country governments, development financiers and countries seeking to diversify their economies.
Concepts and practices such as ‘eco-innovation’, ‘eco-efficiency’ and ‘circular economy’ are therefore important areas within the green growth agenda. These practices have the potential to create low-carbon, resource-efficient, and pollution-reducing alternatives to producing goods and services and to spur local innovation, job creation and diversification of economies.
1.2 Measuring green growth progress
An analytical framework for measuring the progress and impact of green growth should balance aspects of poverty reduction, social inclusion and equity, environmental sustainability and economic growth7 especially in the developing country context. A premise of green growth is that these issues are interlinked, and that there are opportunities for synergies across them. Explicit consideration of synergies and trade-offs across economic sectors, and active engagement and empowerment of diverse stakeholders are necessary in developing green growth solutions.
Taking this into consideration, GGGI has defined a set of organizational objectives, termed Strategic Outcomes (SOs), that reflect the key aspects of poverty reduction, social inclusion, environmental sustainability and economic growth. These end goals are directly aligned to the national development goals of Member and partner country governments that GGGI aims to contribute to. The SOs are intended as a framework for common planning, monitoring and communications both at GGGI country program level and the organization level.
Concurrently, the institute has been developing and employing a set of bespoke tools and frameworks intended for country-specific green growth planning and cross-country comparison of green growth readiness and transition. These include the Green Growth Potential Assessment (GGPA)8, GGGI Green Growth Index (GGI)9 and in partnership with the African Development Bank Group (AfDB), the AfDB-GGGI Green Growth Readiness Assessment (GGRA)10.
7 Traditional approaches often emphasize a single outcome such as GDP, and environmental sustainability and social inclusion issues are not effectively internalized.
8 GGGI, Green Growth Potential Assessment Synthesis Report, December 2018, https://www.greengrowthknowledge.org/sites/default/files/downloads/resource/GGPA-Synthesis-Report.pdf
9 GGGI, Green Growth Index Technical Report, October 2019, https://gggi.org/report/green-growth-index-technical-report/
10 Under publication. GGRA is a joint initiative by GGGI and the AfDB. The first assessment included an in-depth study of the green growth state, trends and readiness of seven African countries.
3
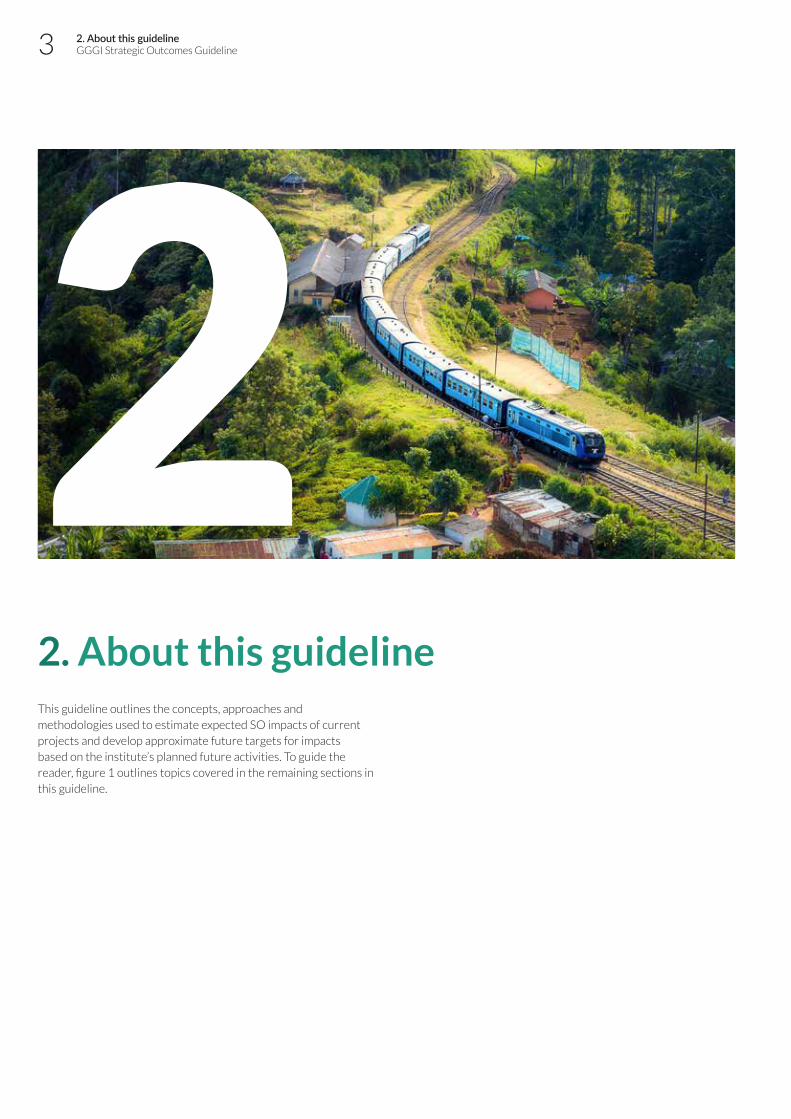
2. About this guidelineThis guideline outlines the concepts, approaches and methodologies used to estimate expected SO impacts of current projects and develop approximate future targets for impacts based on the institute’s planned future activities. To guide the reader, figure 1 outlines topics covered in the remaining sections in this guideline.
2. About this guidelineGGGI Strategic Outcomes Guideline
2

4
Figure 1. Description of sections in this guideline
Methodological aspects, such as the technical definition, sectoral boundaries, analytical steps and suggested mathematical formulations for the SO impact assessment, are outlined in section 6 and related Annexes. Relevant indicative examples are available throughout the document, especially in the guidance sheets in Annexes V to XII.
Section 8 outlines the approach and the assumptions used for estimating the targeted impacts set out in the organization’s long-term Strategy 2030.
The guideline should be considered a living document and can be updated as deemed necessary by the institute. Recommended modalities to update the approaches, methodologies, estimations and reporting modalities are outlined in section 8 and 9.
Section 3How are the SOs placed within the organization’s Theory of Change (ToC), and aligned with its priority activity areas and major SDGs?
Section 4 & 5What key green growth and development challenges does each SO represent? Which indicators are used to estimate and communicate SO impacts and intended targets?
Section 6What approaches and methodologies can be used to estimate SO impact and target outcomes? Further details on SO-specific methodo-logies are available in the SO guidance sheets in Annex V to XIII.
Section 7How are intended SO targets estimated in the GGGI Strategy 2030?
Section 8How will the SO impact and target estimation processes be managed within the organization?
Section 9How will the SO impacts of projects/outputs in GGGI countries be reported?
AnnexesProvide further details, including SO-specific guidance notes (Annex V to XIII)
2. About this guidelineGGGI Strategic Outcomes Guideline

5 3. The Strategic Outcomes and GGGI’s Theory of ChangeGGGI Strategic Outcomes Guideline
3. The Strategic Outcomes and GGGI’s Theory of ChangeGGGI has two sets of development outcomes, the Intermediate Outcomes (IOs) and the Strategic Outcomes (SOs). IOs are realized in the short to medium-term through the delivery of GGGI’s outputs, and capture GGGI’s success in creating the conditions for green growth in Member and partner countries through:
• Mainstreaming green growth concepts in national, sub-national, and sectoral plans and policies;
• Supporting realization of green growth plans and policies through development and financial structuring of bankable projects, financial instruments and financing vehicles; and
• Improving capacity development, knowledge development and knowledge sharing in support of the above areas.
GGGI’s Corporate Results Framework provides a set of indicators linking the impact of GGGI’s activities and outputs to the IOs at an annual or biennial basis. Refer to Annex I for further information on IOs.
SOs represent the end-goals that GGGI aims to achieve through its activities in support of the green growth transition in its Member and partner countries. The six SOs are aligned to GGGI’s Member and partner countries’ long-term national development goals. Ex‑ante estimations of SO impacts provide evidence of impacts from GGGI’s activities. GGGI’s implementation activities, specifically related to bankable projects, are designed to have direct causal links to SOs, and all GGGI activities should contribute to the achievement of one or more of the SOs in the longer term.
Figure 2 depicts GGGI’s Theory of Change (ToC), the logical steps whereby the institute’s activities on policy, financing, projects and knowledge sharing and lead to the desired positive impacts on the SO indicators. It shows how the institute’s primary work areas and outputs deliver the IOs, that are the vehicles through which GGGI achieves the SOs. This happens through a process of change leading to the achievement of the SOs that capture the ultimate objectives of green growth and sustainable development on the ground.
3

63. The Strategic Outcomes and GGGI’s Theory of ChangeGGGI Strategic Outcomes Guideline
Fig
ure
2. G
GG
I Th
eory
of C
han
ge
Sour
ce: G
GG
I Str
ateg
y 2
03
0Ou
tpu
ts
Dem
and
driv
en te
chni
cal a
nd p
olic
y ad
viso
ry
assi
gnm
ents
com
plet
ed a
nd d
eliv
ered
for
enha
nced
gr
een
grow
th s
olut
ions
mai
nstr
eam
ed in
to n
atio
nal
and
sub-
nati
onal
pla
nnin
g pr
oces
ses
and
tool
s.
Stra
tegi
c pa
rtn
ersh
ips/
net
wo
rkin
g, k
no
wle
dge
tr
ansf
er a
nd
cap
acit
y b
uild
ing
del
iver
ed t
o e
nab
le
mem
ber
s an
d lo
cal a
nd
ext
ern
al a
gen
ts t
o d
rive
, im
plem
ent
and
exp
and
nat
ion
al, r
egio
nal
& g
lob
al
gree
n g
row
th a
mb
itio
ns.
Mem
ber
and
par
tner
cou
ntri
es d
emon
stra
te
stro
ng m
ains
trea
min
g of
pov
erty
red
ucti
on a
nd
gend
er e
qua
lity
in o
ur g
reen
gro
wth
inte
rven
tion
s.
Secu
re s
usta
inab
le &
div
ersi
fied
fund
ing
wit
h st
rong
don
or s
uppo
rt, a
nd d
rive
and
inte
grat
e ec
onom
y, e
ffici
ency
, eff
ecti
vene
ss a
nd e
qui
ty in
the
man
agem
ent a
nd in
vest
men
t of G
GG
Is r
esou
rces
.
Ban
kabl
e in
tegr
ated
and
incl
usiv
e bu
sine
ss
solu
tion
s de
velo
ped
to tr
ansl
ate
gree
n gr
owth
pla
ns
& s
trat
egie
s in
to g
reen
inve
stm
ents
pla
ns fo
r pu
blic
an
d pr
ivat
e se
ctor
s in
nova
tive
clim
ate
finan
cing
.
Our
mem
bers
hav
e st
reng
then
ed p
olic
y,
plan
ning
and
reg
ulat
ory
fram
ewor
ks a
nd
inst
itut
iona
l cap
acit
y to
ach
ieve
gre
en
grow
th o
utco
mes
.
Nat
ion
al, r
egio
nal
an
d g
lob
al c
apac
ity
to
dri
ve a
nd
exp
and
gre
en g
row
th
amb
itio
ns
is e
nh
ance
d.
Gre
en g
row
th s
olut
ions
hav
e ac
cele
rate
d pr
ogre
ss o
f our
cou
ntry
pro
gram
s in
po
vert
y er
adic
atio
n an
d ge
nder
equ
alit
y.
Sust
aina
ble
fina
ncia
l gro
wth
sup
port
s q
ualit
y d
eliv
ery
of G
GG
I com
mit
men
ts
to M
emb
er a
nd p
artn
er c
ount
ries
.
Cat
alyz
ed a
nd
acc
eler
ated
acc
ess
to
clim
ate
finan
ce/g
reen
inve
stm
ents
for
mem
ber
s pu
blic
an
d p
riva
te s
ecto
rs.
Inte
rmed
iate
Ou
tco
mes
1 2 3 4 5
Acc
eler
ated
acc
ess
to
clim
ate
finan
ce s
upp
ort
s th
e am
bit
iou
s N
DC
im
plem
enta
tio
n,
com
bin
ed w
ith
incr
ease
d
inst
itu
tio
nal
cap
acit
ies
and
hu
man
cap
ital
to
tr
ansf
orm
th
e ec
on
om
ies
of o
ur
mem
ber
co
un
trie
s in
to a
low
car
bo
n a
nd
re
silie
nt
eco
no
mic
d
evel
opm
ent
to
max
imiz
e th
eir
gree
n
gro
wth
ou
tco
mes
.
Pro
cess
of C
han
ge
SO1
Red
uce
d G
HG
em
issi
on
Stra
tegi
c O
utc
om
es (S
Os)
SO2
Cre
atio
n o
f gre
en jo
bs
SO3
Incr
ease
d a
cces
s to
su
stai
nab
le s
ervi
ces
SO4
Impr
oved
air
qu
alit
y
SO5
Ad
equ
ate
mai
nte
nan
ce
of n
atu
ral c
apit
al
SO6
En
han
ced
ad
apta
tio
n t
o
clim
ate
chan
ge
Rel
ated
SD
Gs
CLIM
ATE
ACTI
ON
DECE
NT W
ORK
AND
ECON
OMIC
GRO
WTH
AFFO
RDAB
LE A
ND
CLEA
N EN
ERGY
CLEA
N W
ATER
AND
SANI
TATI
ONSU
STAI
NABL
E CIT
IES
AND
COMM
UNIT
IES
SUST
AINA
BLE C
ITIE
S AN
D CO
MMUN
ITIE
S
CLEA
N W
ATER
AND
SANI
TATI
ONLI
FE
ON L
AND
ZERO
HUNG
ERSU
STAI
NABL
E CIT
IES
AND
COMM
UNIT
IES
CLIM
ATE
ACTI
ON
NO
POVE
RTY
GEND
EREQ
UALI
TY
BIE
NN
IUM
LON
GE
R-T
ER
M

7 3. The Strategic Outcomes and GGGI’s Theory of ChangeGGGI Strategic Outcomes Guideline
GGGI’s Global Operational Priorities (GPAs) are the institute’s focus areas. Activities in these focus areas lead to achievement of the targeted SO impacts. Figure 3 depicts the alignment between GGGI’s GPAs and the SOs and relevant SDGs.
Figure 3. Impact links between GGGI’s Global Operational Priorities (GPAs) and Strategic Outcomes (SOs)
Source: GGGI Strategy 2030
ZEROHUNGER
SUSTAINABLE CITIES AND COMMUNITIES
CLIMATEACTION
SUSTAINABLE CITIES AND COMMUNITIES
CLEAN WATERAND SANITATION
AFFORDABLE AND CLEAN ENERGY
DECENT WORK AND ECONOMIC GROWTH
CLIMATEACTION
SO1Reduced GHG
emission
SO2Creation ofgreen jobs
SO4Improved air
quality
NO POVERTY
GENDEREQUALITY
SO3Increased access to
sustainable services
SUSTAINABLE CITIES AND COMMUNITIES
CLEAN WATERAND SANITATION
LIFE ON LAND
SO5Adequate
maintenance of natural capital
SO6Enhanced
adaptation to climate change
SDGs
Strategic Outcomes
(SOs)
Global Operational
Priorities
Catalyzing and accelerating access to climate finance/green investments for memeber’s public and private sectors.
1 Supporting our members in strengthening policy, planning and regulatory frameworks and institutional capacity to achieve green growth outcomes.
2 Achieving sustainable and circular bio-economy and secure healthy natural systems.
3 Making cities and communities sustainable, livable and resilient, supported through green jobs, services and green infrastructure.
4 Accelerating progress in our country programs in poverty eradication and gender equality through our operations.
5
6
7
8
Developing a sustainable, stronger and more diversified funding for our operations.
Driving, growing and empowering green growth communities through knowledge transfer.
Maintaining an efficient, high performing and agile organization.

83. The Strategic Outcomes and GGGI’s Theory of Change GGGI Strategic Outcomes Guideline
In addition to their direct impact on specific SDGs, SOs are also indirectly linked to further SDGs, as outlined in table 1.
Table 1. Alignment of GGGI SOs with major SDGs
Strategic Outcome (SO)
Major contributing thematic area
SDGs directly linked to the SO indicator
Other linked SDGs
SO1: Reduced GHG emission
Energy SDG 13 — Climate action SDG 6 — Clean water and sanitation SDG 7 — Affordable and clean energySDG 9 — Industry, innovation, and infrastructureSDG 11 — Sustainable cities and communitiesSDG 15 — Life on land SDG 17 — Partnerships for the goals
Green cities
Landscapes
Water
SO2: Creation of green jobs
Energy SDG 8 — Decent work and economic growth
SDG 1 — No poverty SDG 2 — Zero hungerSDG 5 — Gender equalitySDG 9 — Industry, innovation, and infrastructureSDG 10 — Reduced inequality
Green cities
Landscapes
Water
SO3: Increased access to sustainable services (energy, sanitation, waste management, and public transport)
Energy SDG 6 — Clean water and sanitationSDG 7 — Affordable and clean energySDG 11 — Sustainable cities and communities
SDG 3 — Good health and well-beingSDG 5 — Gender equalitySDG 8 — Decent work and economic growthSDG 10 — Reduced inequalitySDG 13 — Climate action
Green cities
Water
SO4: Improved air quality
Energy SDG 11 — Sustainable cities and communities
SDG 3 — Good health and well-beingSDG 7 — Affordable and clean energySDG 9 — Industry, Innovation, and Infrastructure
Green cities
SO5: Adequate maintenance of natural capital
Green cities SDG 6 — Clean water and sanitationSDG 15 — Life and land
SDG 3 — Good health and well-beingSDG 11 — Sustainable cities and communitiesSDG 14 — Life below water
Landscapes
Water
SO6: Enhanced adaptation to climate change
Energy SDG 2 — Zero hungerSDG 11 — Sustainable cities and communitiesSDG 13 — Climate action
SDG 7 — Affordable and clean energySDG 14 — Life below waterSDG 15 — Life and landSDG 17 — Partnerships for the goals
Green cities
Landscapes
Water
Annex III covers how the SO framework links different analytical tools and frameworks by GGGI and serves as the institute’s primary high-level green growth planning, monitoring and communication tool with regard to its activities in Member and partner countries.

9 4. Strategic Outcome indicatorsGGGI Strategic Outcomes Guideline
4. Strategic Outcome indicators
Through its country programs and activities, GGGI contributes to the achievement of many outcomes. Most of these can be captured and conveyed either directly or indirectly through the six SOs. The following principles underpin the SOs framework:
• SOs capture key aspects of the green growth transition in GGGI Member and partner countries. Broadly, these aspects are; poverty reduction, social inclusion, environmental sustainability and economic growth.
• SOs represent green growth in the context of the achievement of the Nationally Determined Contributions (NDCs) under the Paris Agreement and the UN SDGs.
• SOs are not intended to be comprehensive. They are a concise set of outcomes with a simple set of indicators. This enables
effective communication of the institute’s impacts at country level and enables the aggregation of country-level impacts at the organization level.
• SOs are easily relatable to both policymakers and the general public.
Table 2 lists the six SOs, and the indicators and units of measurement selected for each. This set of SO indicators is not intended to comprehensively capture all aspects of GGGI’s four thematic areas or country specific objectives, and it is recognized that regional and country circumstances are different. For the purpose of detailed country-level and intra-country analyses required for policy planning and analysis, the GGPA, GGI and GGRA can be applied. Annex IV provides a mapping of the indicators in the GGPA, GGI and GGRA that relate to the SOs.
4

104. Strategic Outcome indicatorsGGGI Strategic Outcomes Guideline
Table 2. Indicators and units of GGGI SOs
Strategic Outcomes Impact indicators
SO1. Reduced GHG emission Greenhouse gas (GHG) emissions reduction, million tonnes CO2
equivalent (Mt CO2e)
SO2. Creation of green jobs Number of green jobs, Full-time equivalent (FTEs)
SO3.1 Clean affordable energy Number of people who gained access to clean energy, millions
SO3.2 Improved sanitation Number of people who gained access to improved sanitation, millions
SO3.3 Sustainable waste management Number of people who gained access to waste management services, millions
SO3.4 Sustainable public transport Passengers carried by public transport, million passenger-kms
SO4. Improved air quality Number of annual days above U.S.-EPA ‘Orange’ Air Quality Index (AQI), days
SO5. Adequate maintenance of natural capital Area of avoided degradation, restoration, and improvement of forests, grasslands, wetlands, and agricultural lands, million ha
SO6. Enhanced adaptation to climate change Number of people supported to cope with the effects of climate change, millions

11 5. Description of the Strategic OutcomesGGGI Strategic Outcomes Guideline
5. Description of the Strategic OutcomesThis section describes each of the SOs, specifically the green growth and development challenges that underpin them, their technical definition and sectoral scope. The methodology for each SO is provided in section 6 and detailed methodology guidance sheets can be found in Annexes V – XII.
5.1 Strategic Outcome 1: Reduced GHG Emission
Climate action is a UN SDG (SDG 13) and the primary objective of the Paris Agreement. GHG emissions reduction for climate change mitigation is linked to the achievement and sustenance of all major SDGs, making it a cross-cutting indicator of green growth transition. Elevated levels of GHGs in the atmosphere compared to long-term historic averages are responsible for climate change and ocean acidification. Therefore, decoupling GHG emissions from economic growth, urbanization, and population growth is central to the green growth agenda. Most economies need to undergo deep decarbonization of their economic activities and societal practices in order to stay within the safe 1.5°C level of average global temperature rise by 2100.
SO1 captures GGGI’s activities supporting the achievement of Member and partner countries’ NDCs and progress on major SDGs linked to it. Currently, GGGI countries are responsible for over 30 percent of global GHG emissions. Emissions reduction involves activities such as moving away from an economy based on fossil fuels toward an economy based on clean energy, using resources more efficiently and reducing deforestation. Program activities in renewable energy, energy efficiency, green cities and land-use thematic areas are designed to contribute to this outcome. Nine out of eleven focus investment areas in GGGI’s Strategy 2030 directly contribute to SO1 impact.
Figure 4 compares estimates of GHG emissions reduction target values based on relevant information available in the NDCs of GGGI countries.
5

125. Description of the Strategic OutcomesGGGI Strategic Outcomes Guideline
5.2 Strategic Outcome 2: Creation of green jobs
The creation of new economic opportunities and jobs is an important indicator of the success of the inclusive economic growth approach. Equitable approaches to achieve SDG8 (decent work and economic growth) has direct links to achievements of SDG1(no poverty), SDG2 (zero hunger), SDG5 (gender equality), and SDG10 (reduced inequalities). In most GGGI Member and partner countries, a sizeable proportion of the population remains below the poverty line, and the challenges of youth unemployment and the participation of women in the economy persist. Green growth approaches in these countries must lead to creation of sufficient decent employment which will further support economic growth in the process. There is ample empirical evidence that green growth can be a net creator of green jobs compared to business as usual (BAU) growth paradigms. The New Climate Economy estimates that low-carbon and green growth could generate over 65 million additional jobs globally by 2030 compared to a BAU scenario12. Transitioning to a low carbon energy system is a central theme to the green growth agenda. The International
11 Emissions reduction target in 2030 is estimated as the difference between the BAU emissions and the conditional or unconditional targets (whichever is lower).
12 The New Climate Economy, Unlocking the Inclusive Growth Story of the 21st Century, August 2018. Access on October 10, 2019, https://newclimateeconomy.report/2018/
Renewable Energy Agency estimates that global employment generation in renewable energy is steadily growing and employment in the sector reached 11 million jobs at the end of 2018. Studies on individual countries have reached similar conclusions. For example, a 2011 study finds that the number of green jobs created in the natural resources management sector in South Africa could be approximately ten times higher in the longer term compared to the short term13.
Green growth approaches can create jobs in the greening of traditional sectors, such as manufacturing, construction, waste management, services and agriculture, and in new and emerging green sectors, such as renewable energy, energy efficiency and clean transportation.
Although job creation is crucial to the green growth and development agenda, economy-wide assessments on the potential for green jobs in GGGI Member and partner countries is limited. Only 8 out of 40 countries have economy-wide green jobs assessments, making it challenging for governments to conduct related planning and target-setting.
13 Maia et al., “Green Jobs: An Estimate of the Direct Employment Potential of a Green-ing South African Economy,” Industrial Development Corporation, Development Bank of Southern Africa, Trade and Industrial Policy Strategies, 2011, https://bit.ly/2LIIhf2
Figure 4. GHG emissions targets (absolute values in MtCO2e) set out by different GGGI member and partner countries in their NDCs
and used in the estimation of target emission reductions.11
Source: Compiled by GGGI based on information from country NDCs and estimates by various entities.
1,000
900
800
700
15,000 20
1510
50
10,000
5,000
0600
500
400
300
200
100
0
GH
G E
mis
sions
by
year
203
0, M
tCO
2e
Papua New G
uinea
Mexico
Viet Nam
Thailand
Paraguay
UAE
Colom
bia
Ethio
pia
Myanm
arPeru
Uzbeskistan
Philippin
es
Qata
r
Moro
cco
Burkin
a Faso
China
India
Indonesia
Costa R
ica
Rwanda
Cambodia Fiji
Vanuatu
Tonga
Kiribati
Uganda
Mozam
bique
Sri Lanka
Nepal
Mongolia
Jordan
Lao PDR
Guyana
Senegal
Conditional Target NDC Emissions Unconditional Target NDC Emissions BAU 2030 Emissions Estimation

13
5.3 Strategic Outcome 3: Increased access to sustainable services
For green growth to be inclusive and transformative, access to sustainable services, particularly clean energy, improved sanitation, waste management, and public transportation, needs to be universal. This SO is aligned to SDG 6 (clean water and sanitation), SDG 7 (affordable and clean energy) and SDG 11 (sustainable cities and communities).
5.3.1 Strategic Outcome 3.1: Clean affordable energy
Despite significant progress in past decades, close to 1 billion people are still without access to electricity, primarily in developing Africa and Asia. There is also a large gap between access to electricity in rural and urban areas in many countries, hindering much needed rural development and poverty reduction
efforts. Progress has been more limited on clean cooking methods, with more than 2.6 billion people still lacking access to clean cooking methods, relying instead on unhealthy biomass, coal or kerosene-based cooking14.
This SO primarily focuses on access to electricity and clean cooking as drivers of development and economic growth. SO3.1 is also relevant to SDGs on health, education and the empowerment of women.
Figure 5 shows the share of national population (total and rural) with access to electricity in GGGI countries. GGGI’s work is geared towards increasing on-grid and/or off-grid renewable electricity capacity in Member and partner countries that can meet the triple goal of energy security, energy equity and environmental sustainability, while also contributing to poverty reduction, empowerment of vulnerable groups, and resilience to climate change. GGGI recognizes that realizing a sustainable energy mix in its Member and partner countries is central to achievement of the Paris Agreement and major SDGs.
14 “SDG7: data and projections”, International Energy Agency, November 2018,
Figure 5. Share of national population in 2016 with access to electricity in GGGI member and partner countries
Source: World Bank World Development Indicators.
100
90
80
70
60
50
40
30
20
10
0Shar
e (%
) of p
opul
ation
with
acc
ess
to e
lect
ricity
Kiribati
Burkin
a Faso
Papua New G
uinea
Mozam
bique
Uganda
Rwanda
Ethio
pia
Cambodia
Myanm
ar
Vanuatu
Senegal
Mongolia
India
Guyana
Lao PDR
Philippin
es
Sri Lanka
Indonesia Fiji
China
Viet Nam
Thailand
HungaryUAE
Percentage of total population Percentage of rural population
NepalPeru
Tonga
Paraguay
Colom
bia
Moro
cco
Mexico
Costa R
ica
Qata
r
Jordan
Uzbekistan
5. Description of the Strategic OutcomesGGGI Strategic Outcomes Guideline
14
5.3.2 Strategic Outcome 3.2: Improved sanitation
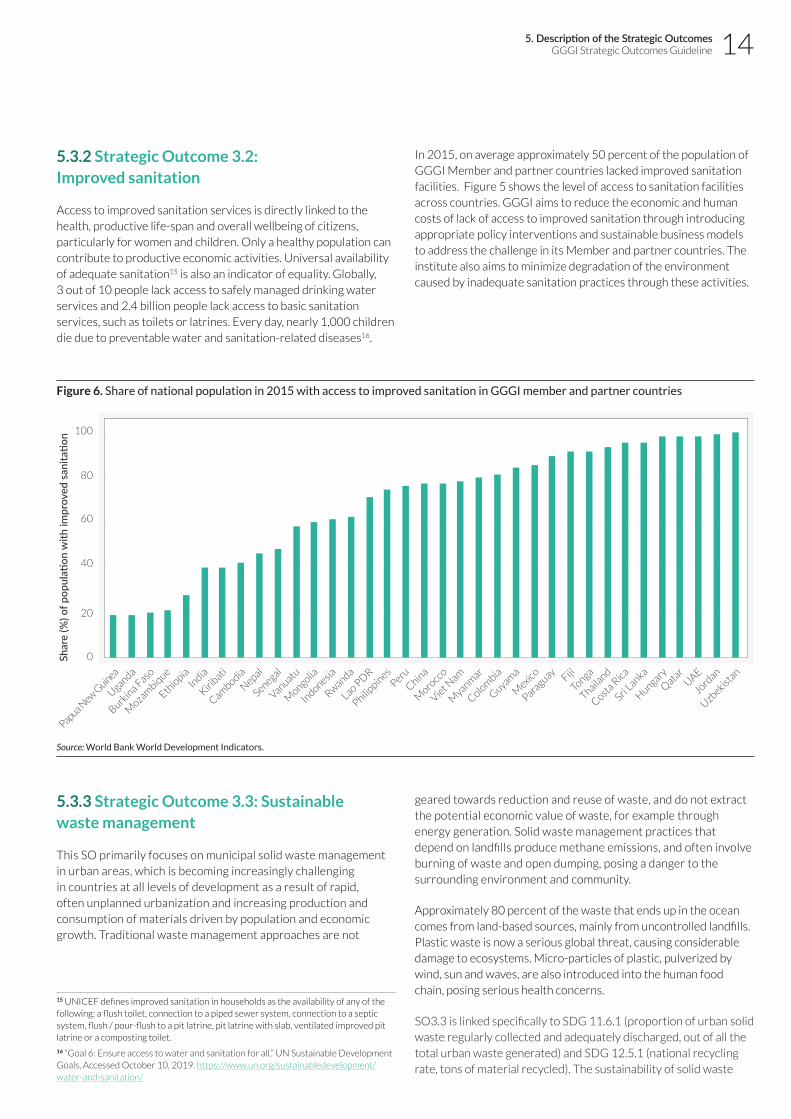
Access to improved sanitation services is directly linked to the health, productive life-span and overall wellbeing of citizens, particularly for women and children. Only a healthy population can contribute to productive economic activities. Universal availability of adequate sanitation15 is also an indicator of equality. Globally, 3 out of 10 people lack access to safely managed drinking water services and 2.4 billion people lack access to basic sanitation services, such as toilets or latrines. Every day, nearly 1,000 children die due to preventable water and sanitation-related diseases16.
15 UNICEF defines improved sanitation in households as the availability of any of the following: a flush toilet, connection to a piped sewer system, connection to a septic system, flush / pour-flush to a pit latrine, pit latrine with slab, ventilated improved pit latrine or a composting toilet.
16 “Goal 6: Ensure access to water and sanitation for all,” UN Sustainable Development Goals, Accessed October 10, 2019. https://www.un.org/sustainabledevelopment/water-and-sanitation/
In 2015, on average approximately 50 percent of the population of GGGI Member and partner countries lacked improved sanitation facilities. Figure 5 shows the level of access to sanitation facilities across countries. GGGI aims to reduce the economic and human costs of lack of access to improved sanitation through introducing appropriate policy interventions and sustainable business models to address the challenge in its Member and partner countries. The institute also aims to minimize degradation of the environment caused by inadequate sanitation practices through these activities.
Figure 6. Share of national population in 2015 with access to improved sanitation in GGGI member and partner countries
Source: World Bank World Development Indicators.
100
80
60
40
20
0Shar
e (%
) of p
opul
ation
with
impr
oved
san
itatio
n
Rwanda
Papua New G
uinea
Uganda
Burkin
a Faso
Mozam
bique
Ethio
piaIn
dia
Kiribati
Cambodia
Nepal
Senegal
Vanuatu
Indonesia
Mongolia
Lao PDR
Peru
Moro
cco
Myanm
ar
Guyama
Paraguay
Tonga
Costa R
ica
HungaryUAE
Philippin
es
China
Viet Nam
Colom
bia
Mexico Fiji
Thailand
Sri Lanka
Qata
r
Jordan
Uzbekistan
5.3.3 Strategic Outcome 3.3: Sustainable waste management
This SO primarily focuses on municipal solid waste management in urban areas, which is becoming increasingly challenging in countries at all levels of development as a result of rapid, often unplanned urbanization and increasing production and consumption of materials driven by population and economic growth. Traditional waste management approaches are not
geared towards reduction and reuse of waste, and do not extract the potential economic value of waste, for example through energy generation. Solid waste management practices that depend on landfills produce methane emissions, and often involve burning of waste and open dumping, posing a danger to the surrounding environment and community.
Approximately 80 percent of the waste that ends up in the ocean comes from land-based sources, mainly from uncontrolled landfills. Plastic waste is now a serious global threat, causing considerable damage to ecosystems. Micro-particles of plastic, pulverized by wind, sun and waves, are also introduced into the human food chain, posing serious health concerns.
SO3.3 is linked specifically to SDG 11.6.1 (proportion of urban solid waste regularly collected and adequately discharged, out of all the total urban waste generated) and SDG 12.5.1 (national recycling rate, tons of material recycled). The sustainability of solid waste
5. Description of the Strategic OutcomesGGGI Strategic Outcomes Guideline

15
management is also essential to achieving SDG12 (sustainable production and consumption) and it positively affects SDG13 (climate action), SDG15 (life on land) through minimization of pollution from waste, and SDG3 (good health and wellbeing) by minimizing the health impacts from open burning.
Sustainable solid waste management approaches are fundamental to reducing GHG emissions and achieving a circular economy and are vital to ensuring better human health and cleaner air, water and soil. GGGI aims to help its Member and partner countries increase their waste collection coverage and to identify new opportunities to turn waste into a resource. GGGI assists local governments to identify sustainable business opportunities together with local micro-entrepreneurs. Sustainable waste management is also a means to enhance social inclusion through converting jobs in the informal economy to decent jobs. Millions of informal waste pickers around the world make a living collecting, sorting, recycling and selling valuable material disposed of as waste. Improving their working conditions can reduce poverty and enhance social inclusion.
5.3.4 Strategic Outcome 3.4: Sustainable public transport
Transport infrastructure, such as roads and vehicles, is essential for inclusive economic growth as it enables the movement of goods and services, regional connectivity and social mobility. However, fossil-fuel driven transport modes are a major source of air pollution and congestion in cities and contribute to acidification, eutrophication and climate change. These effects have serious implications for human health and the economy.
In contrast, public transportation systems, such as mass rapid transit systems and buses, minimize environmental impacts and maximize economic efficiency and system effectiveness (by reducing congestion). They provide a safe and affordable means of transport to the general population, enabling greater social mobility and access to markets, employment, recreation, education, healthcare and other key services. Through these immediate benefits, public transport encourages inclusiveness, creates economic opportunities, and improves resilience to climate change.
According to the American Public Transportation Association, every USD invested in public transportation generates approximately USD4 in economic returns and creates more than 50 thousand jobs.17 Moreover, by reducing commuting times, it allows people to increase their productivity and quality of life.
Sustainable public transportation is linked to several other SDGs, including SDG3 (good health and wellbeing) through better road safety from reduced car usage, SDG7 (affordable and clean energy) through energy efficiency, SDG9 (industry, innovation and infrastructure) , SDG11 (sustainable cities and communities) through better transport access, and SDG13 (climate action) through reduced GHG emissions. GGGI projects that support
17 “Public Transportation Facts,” American Public Transportation Association, Accessed October 9, 2019. https://www.apta.com/news-publications/public-transportation-facts/
public transportation include support for scaling e-mobility solutions for public transport and design and the implementation of mass rapid systems.
5.4 Strategic Outcome 4: Improved air quality
Globally, poor air quality, both indoor and outdoor, is ranked among the top ten risk factors for premature deaths. Approximately 95percent of the world’s population lives in conditions that exceed the World Health Organization Guideline for healthy air18. Air quality is linked to seven SDGs and is related to key economic sectors such as energy, transport and construction.
Indoor air quality is a critical health risk in low- and middle-income countries, especially to woman and children, due to the reliance on coal and biomass for domestic lighting and cooking. Women also spend a considerable amount of time sourcing such cooking fuels, hindering their participation in more productive activities. Indoor air pollution enhances the risk of chronic obstructive pulmonary disease, low birth weight, and acute respiratory infections in childhood, the most important causes of deaths among children under the age of five in developing countries.
Approximately 7 million pre-mature deaths are attributed to air pollution every year. Of this, outdoor air pollution is found to be responsible for over 3.4 million annual premature deaths and this could double by the year 2050 according to current economic growth projections19. Improvement in air quality reduces the disease burden and increases healthy life years and the productivity of the population, thereby directly contributing to the competitiveness of economies. For example, in China, a 10 point increase in the air quality index costs the economy approximately USD2.2 billion in productivity loss, in addition to the loss of human life in the longer term20.
18 Health Effects Institute. State of Global Air 2018 Special Report. Boston, 2018, https://www.stateofglobalair.org/sites/default/files/soga-2018-report.pdf
19 E.E. van der Wall, “Air pollution: 6.6 million premature deaths in 2050!” Netherlands Heart Journal 23, no. 12 (December 2015): 557–558, https://link.springer.com/article/10.1007%2Fs12471-015-0763-9
20 Chang et al., “The Effect of Pollution on Worker Productivity: Evidence from Call Center Workers in China,” University of Southern California, June 2016, https://greeninitiatives.cn/img/white_papers/1523185339584_China_worker_productivity_study.pdf
5. Description of the Strategic OutcomesGGGI Strategic Outcomes Guideline

16
Figure 7. Tile plot of U.S.-EPA Air Quality Index (AQI)21 values during 2014-16 based on 24-hour rolling average PM2.5 data received from a monitoring station in the capital of a GGGI Member country22
Source: Relevant GGGI Country office, modelled with Air Quality Mosaic Tool developed by the GGGI Mexico Program.
M January February March April Mai June July August September October November December
W 1 2 3 4 5 6 7 8 9 10 11 12 13 14 15 16 17 18 19 20 21 22 23 24 25 26 27 28 29 30 31 32 33 34 35 36 37 38 39 40 41 42 43 44 45 46 47 48 49 50 51 52 53 54
2014
Mon
Tue
Wed
Thu
Fri
Sat
Sun
2015
Mon
Tue
Wed
Thu
Fri
Sat
Sun
2016Mon
Tue
Wed
Thu
Fri
Sat
Sun
2017
Improved air quality is therefore a major outcome of climate action, and green growth approaches include investment in areas such as cleaner forms of transport and energy generation, better management of traffic congestion, and adoption of cleaner manufacturing, agricultural and construction practices.
Figure 7 shows US-EPA Air Quality Index values estimated with granular hourly data from a monitoring station in a GGGI member country. AQI estimates can be used to determine the number of annual days above ‘Orange’ AQI level (with a PM2.5 range of 40.5-65.4 micro-g/m3, considered unhealthy for sensitive groups). Such estimations can provide the basis for setting air quality improvement targets for a city.
21 U.S. Environmental Protection Agency, Air Quality Index; a guide to air quality and your health, February 2014, https://www3.epa.gov/airnow/aqi_brochure_02_14.pdf
22 White cells in the diagram indicate missing data.
This SO primarily focuses on the improvement in outdoor air quality. GGGI’s programmatic activities in the energy, green cities and sustainable landscape areas contribute to this outcome as they all contribute to reducing emissions. Reductions in indoor air pollution, primarily resulting from the use of dirty fuel sources in cooking, are directly linked to the achievement of SO 3.1 (clean cooking in access to affordable, clean energy).
5. Description of the Strategic OutcomesGGGI Strategic Outcomes Guideline
Good (AQI: 0-50) Moderate (AQI: 51-100) Unhealthy for sensitive groups (AQI: 101-150)
Very Unhealthy (AQI: 201-300)Unhealthy (AQI: 151-200) Hazardous (300+)
17
5.5 Strategic Outcome 5: Adequate maintenance of natural capital
Natural capital supplies ecosystem services such as the provision of food, clean water, and clean air, meeting basic human needs. It also helps to regulate the climate, diseases and floods. Ecosystem services are essentially public goods that are vital to human wellbeing. The global value of ecosystem services was estimated to be over USD120 trillion per year in 2011, greater than the global GDP at the time of USD73 trillion. However, the value of ecosystem services was found to be declining by around USD4-20 trillion a year from 1997 to 2011 on average23.
The degradation or loss of essential ecosystem services has significant social and economic impacts. Low- middle-income economies are more reliant on ecosystem services and a major portion of their GDP depends on them. The loss of natural capital could trigger irreversible damages to flora and fauna that both underpin and rely on ecosystem services, further compounding the potential economic losses. Such a loss would mean that citizens who formerly received such services for free would have to pay for them. Ensuring the correct monetary valuation and sustainable use of natural capital is thus important for long-term economic growth and wellbeing.
Ensuring adequate supply of ecosystem services requires restoration of degraded ecosystems and prevention of further loss of intact natural ecosystems. Sustainable use of natural capital would also lower GHG emissions and contribute to climate resilience.
Coral reefs, forests, grasslands and wetlands are among the largest sources of ecosystem services on earth. Agriculture, deforestation and other land-uses are responsible for 24 percent of global GHG emissions24. Forests, grassland, and wetlands are among nature’s primary carbon capture and storage mechanisms. The protection and restoration of wetlands are an increasing priority due to their rapid loss, especially from urbanization.
Similarly, grasslands and rangelands are important sources of ecosystems services in regions where they occur. Grasslands are significant carbon sinks and store most of their carbon underground in soil. Protecting the health of grasslands also enhances soil health. In grassland regions, their sustainable use also supports livestock often critical to the livelihoods of the poor.
23 Costanza et al., “Changes in the Global Value of Ecosystem Services,” Global Environmental Change 26 (May 2014). https://www.sciencedirect.com/science/article/abs/pii/S0959378014000685?via%3Dihub
24 The Intergovernmental Panel on Climate Change, AR5 Climate Change 2014: Mitigation of Climate Change, 2014, https://www.ipcc.ch/report/ar5/wg3/
In agricultural land, unsustainable practices could release organic carbon from the soil, degrade soil biodiversity and impact the soil’s capacity for water retention. Sustainable practices could therefore improve the production of crops and livestock. Globally, soil biodiversity is valued as providing USD1.5-13 trillion worth of ecosystems services annually25.
GGGI aims to support Member and partner countries to improve the sustainable utilization of natural capital that supports economically productive activities (for example, sustainable forest management and climate smart agriculture). Activities in this area directly support the achievement of SDG 15 (life on land) and SDG 13 (climate action) and supports adaptation targets within the NDCs.
5.6 Strategic Outcome 6: Enhanced adaptation to climate change
Adaptation refers to “adjustments in ecological, social, or economic systems in response to actual or expected climatic stimuli and their effects or impacts”26. Climate change is already posing adaptation-related challenges in the form of increased droughts, floods, land degradation, deforestation, sea level rise and variable rainfall. Globally, approximately 200 million people could be displaced as a consequence of climate change impacts. Such impacts will disproportionately impact poor communities, coastal areas, and countries vulnerable to rising sea levels, such as the small island states. Low-income communities and countries are also faced with lower resources and limited capacities to adapt.
Without effective adaptation or climate resilience strategies, communities, enterprises, and countries could lose development gains achieve in past decades. On the other hand, investment in adaptation can deliver high rates of return, bringing multiple benefits to people and the economy. The Global Commission on Adaptation found that investing USD1.8 trillion globally in five areas of adaptation in the next decade could generate USD7.1 trillion in total net benefits27.
GGGI’s work in sustainable landscapes, water and sanitation, green cities and clean energy contributes to supporting adaptation in Member and partner governments. Activities in this area are directly linked to the achievement of NDCs and SDG 2 (zero hunger), SDG 11 (sustainable cities and communities) and SDG 13 (climate action).
25 Laban et al., Soil Biodiversity and Soil Organic Carbon: keeping drylands alive, IUCN, 2018, https://portals.iucn.org/library/sites/library/files/documents/2018-004-En.pdf
26 “What do adaptation to climate change and climate resilience mean?”, UNFCCC, accessed October 10, 2019. https://bit.ly/2RADznm,
27 The five adaptation focus areas outlined are early warning systems, climate-resilient infrastructure, improved dryland agriculture, mangrove protection, and resilient water resources management. Global Commission on Adaptation, Adapt Now: A Global Call for Leadership on Climate Resilience, September 2019, https://gca.org/global-commission-on-adaptation/report
5. Description of the Strategic OutcomesGGGI Strategic Outcomes Guideline

18
6. Estimating SO impact and target outcomes — approach and methodologyThe approaches and methodologies presented in this section are aimed at guiding estimation of ex‑ante expected impacts resulting from activities by GGGI’s country programs and approximation of targeted impacts, for example from targeted green investment mobilization. These expected impact and targeted impact outcomes are estimated at two levels:
1. Attributed impact outcomes: These are impacts resulting from GGGI’s activities that have direct causal links to the SOs. Not all GGGI activities have direct causal links to the SOs. Activities that have direct causal links to the SOs include the development of bankable projects for which GGGI has received investor commitment, and design and implementation of National Financing Vehicles (NFVs) for the mobilization and disbursement of green investments. Projects or outputs with direct causal links are referred to as Qualifying Projects/Outputs. Further detail is provided in section 6.1.1 and Annex II.
2. Contributed impact outcomes: These capture the level of contributions that GGGI makes towards achieving its Member and partner countries’ NDC and SDG targets. Contributed
impacts are identified through priorities which are mutually agreed with the Member or partner government set out by the country program planning documents, or with development partners in GGGI’s policy, investment, knowledge sharing and capacity development activities.
The existing gaps to achieving NDC and SDG targets of Member and partner countries, relevant to the SOs, determine GGGI’s contributed impact outcome. This gap, termed the National Target Level (NTL), is further explained in section 6.2.3.
Both the attributed and the contributed impact outcomes are relevant in evaluating GGGI’s work and in capturing impacts from the organization’s efforts. The contributed impact outcome attempts to estimate the potential impacts from the institute’s policy, capacity development and knowledge sharing work, in addition to the directly attributable outcomes. Contributed outcomes will therefore be much larger than the attributed outcomes and will by their nature be shared with many other partners that also contribute to achieving the impacts.
6. Estimating SO impact and target outcomes — approach and methodologyGGGI Strategic Outcomes Guideline
6

19 6. Estimating SO impact and target outcomes — approach and methodologyGGGI Strategic Outcomes Guideline
Figure 8. GGGI Strategic Outcome Impact Estimation
Example:
GGGI is working in a Member country where the Country Planning Framework (CPF) and current Work Program and Budget (WPB) define industrial energy efficiency as one of the core areas of work. The Member country’s NDC pledges a 30 percent GHG emissions reduction below the BAU level by 2030. The industrial sector contributes 20 percent of this pledged target, estimated in absolute terms at 80 MtCO
2e of cumulative
GHG emissions reduction by 2030. Relevant investment projects in the country program’s current WPB are projected to reduce 2 MtCO
2e of emissions in the industrial sector over the lifetime of
the projects and by 2030 (ex‑ante estimation).
In this example, GGGI’s Attributed Impact outcome for SO1 will be the 2 MtCO
2e of emissions reduction, and GGGI is
considered to be contributing to a share of the 80 MtCO2e
GHG reduction through its policy, projects and knowledge sharing work in the industry sector, together with other development partners.
Two approaches are used to estimate the expected impacts and targeted impacts: a bottom-up approach and a top-down approach. These are detailed in the following sections. Figure 8 depicts the attributed and contributed impacts under the bottom-up and top-down approaches.
Bankable projects & green investment
mobilization
Strategy & policy adoption and
mainstreaming
Strategy and policy
formulation
Knowledge, tools and systems
development
Knowledge sharing and capacity development
AT
TR
IBU
TE
DC
ON
TR
IBU
TE
D
Bottom-up approach(refer to section 6.1)
Top-down approach(refer to section 6.2)
Attributed impact outcome (refer to section 6)
Contributed impact outcome(refer to section 6)
Country Program Impact (CPI): Expected impact from specific attributable interventions currently undertaken by a GGGI country program (refer to section 6.1.2, and SO-specific guidance sheets in Annexes)
Country Program Target (CPT): Expected impacts from scaled-up scenario of specific attributable interventions currently undertaken by a GGGI country program (refer to section 6.1.3, and SO-specific guidance sheets in Annexes)
N/A
Targeted Attribution Impact (TAI): Cumulative impact of targeted green investment mobilization. Approximated using investment multipliers, unit outcome per USD invested for a particular SO, for specified intervention options. For example. in climate-smart agriculture or rooftop solar PV.(refer to section 6.2.1)
Targeted Contribution Impacts (TCI): The share of the National Target Level (NTL), that GGGI activities are targeted to contribute to.
National Target Level (NTL): The approximated gap toward NDC and SDG targets that are relevant to the SOs.(refer to sections 6.2.2 – 6.2.4)
All expected impacts and targeted outcomes refer to ex ante estimations unless otherwise specified.
206. Estimating SO impact and target outcomes — approach and methodologyGGGI Strategic Outcomes Guideline
6.1 Bottom-up approach for SO impact estimation
This approach is used to estimate ex‑ante expected impacts from GGGI projects/outputs that have direct causal links to the SOs and are hence attributable to GGGI, the attributed impact outcome.
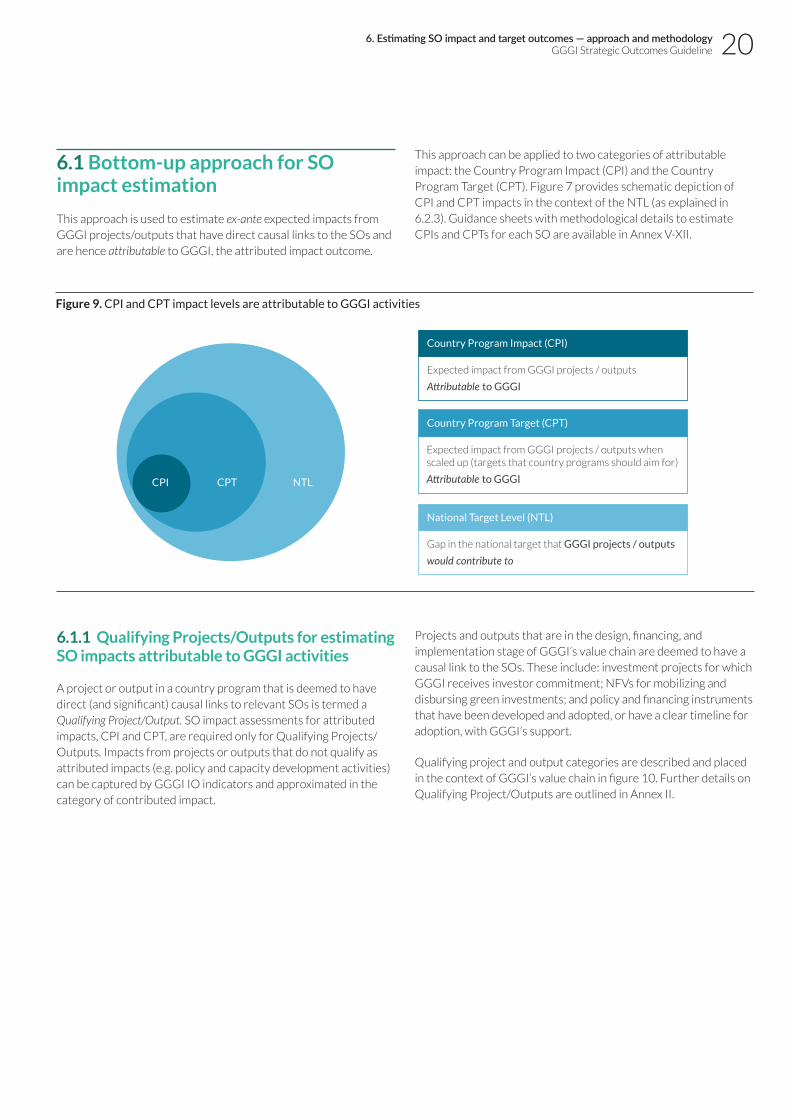
This approach can be applied to two categories of attributable impact: the Country Program Impact (CPI) and the Country Program Target (CPT). Figure 7 provides schematic depiction of CPI and CPT impacts in the context of the NTL (as explained in 6.2.3). Guidance sheets with methodological details to estimate CPIs and CPTs for each SO are available in Annex V-XII.
Figure 9. CPI and CPT impact levels are attributable to GGGI activities
Country Program Impact (CPI)
Expected impact from GGGI projects / outputs
Attributable to GGGI
Country Program Target (CPT)
Expected impact from GGGI projects / outputs when scaled up (targets that country programs should aim for)
Attributable to GGGI
National Target Level (NTL)
Gap in the national target that GGGI projects / outputs
would contribute to
CPI CPT NTL
6.1.1 Qualifying Projects/Outputs for estimating SO impacts attributable to GGGI activities
A project or output in a country program that is deemed to have direct (and significant) causal links to relevant SOs is termed a Qualifying Project/Output. SO impact assessments for attributed impacts, CPI and CPT, are required only for Qualifying Projects/Outputs. Impacts from projects or outputs that do not qualify as attributed impacts (e.g. policy and capacity development activities) can be captured by GGGI IO indicators and approximated in the category of contributed impact.
Projects and outputs that are in the design, financing, and implementation stage of GGGI’s value chain are deemed to have a causal link to the SOs. These include: investment projects for which GGGI receives investor commitment; NFVs for mobilizing and disbursing green investments; and policy and financing instruments that have been developed and adopted, or have a clear timeline for adoption, with GGGI’s support.
Qualifying project and output categories are described and placed in the context of GGGI’s value chain in figure 10. Further details on Qualifying Project/Outputs are outlined in Annex II.

21
6.1.2 Country Program Impact (CPI) estimation using the bottom-up approach
The CPI measures the ex‑ante expected impact estimates from qualifying projects/outputs by a country program. These impacts are attributable to the country program and to GGGI. For example, the projects and outputs of a country program developing bankable projects on renewable energy and implementation of a payment for ecosystem services scheme aimed at reducing deforestation qualify for SO1 impact estimation, and the CPI for SO1 needs to be reported.
SO impacts from qualifying projects and outputs in a country program require aggregation prior to reporting.
Figure 10. Project/output categories that qualify as having direct causal links to the Strategic Outcomes, and their position within the GGGI Value Chain
where, CPI_SOji is the impact of a GGGI qualifying project/output during its specified lifetime or implementation period for SO ‘j’ and project/output ‘i’
n is the number of projects/outputs in the country program for which SOj estimation is required
CPIc captures the impacts that are counted more than once for the projects/outputs relevant to the SO. In a case where there are two projects in a country within the same project lifetime with similar overall catchment areas, only estimate the unique population covered. An example of such a program could be one project building a floodwall to protect from climate-induced rainfall events, and another installing an early warning system.
Steps to estimate the CPI of a project/output in a particular SO:
• Step 1: Establish the counterfactual. For example, the number of people impacted in the intervention area without the GGGI project/output;
• Step 2: Estimate the effect of the project/output. For example, the expected number of people impacted as a result of the project/output; and
• Step 3: Calculate the impact from the project/output. This is the difference between the counterfactual and the project/output effect.
6.1.3 Country Program Target (CPT) estimation using the bottom-up approach
The CPT is the ex‑ante impact of a country program in a future target year (e.g. 2030) based on projections of expanding current or recently undertaken initiatives by the program. These impacts can be attributed to the country program and to GGGI.
The CPT provides the basis for estimating targeted impacts by a country program in a future year based on the scenarios of intended or already planned expansion of current or recently undertaken projects.
The CPI estimated for Qualifying Projects/Outputs forms the basis for estimating the impact of scaled up scenarios, potentially at a regional or national level. Expanding on the CPI example provided
6. Estimating SO impact and target outcomes — approach and methodologyGGGI Strategic Outcomes Guideline
Development,economic growthand sustainabilitydiagnosis
Sectoralgreen impactassessment and priorization
Macroeconomic impactassessment
Policy andinstitutionsanalysis
Analysisof costs andinvestmentrequirments
Developmentof sectoral/sub-sectoralinvestment plansand selection
Design:Project and policypreparation
Financing:Identification of possiblefinancialstructures
Implementation
GREEN IMPACT ASSESSMENT SECTOR/SUB-SECTOR STRATEGY & PLANNING DESIGN, FINANCING & IMPLEMENTATIONDIAGNOSIS
Action plans and other outputs
Projects or outputs corresponding to Intermediate Outcome 1 (policy, financing strategy, and planning frameworks) but have concrete follow-up plans leading to Intermediate Outcome 2 (green investment flows).
Policy or financing instrument
Policies or financing instruments that:
• are adopted and implemented or have a clear implementation pathway,
• have specific, legally binding, target components.
Mechanisms for mobilization & disbursement of financing
Projects or outputs corresponding to Intermediate Outcome 2 (green investment flows) where GGGI activities directly involve:
• design (including feasibility studies);
• preparation (including direct capacity development);
• operationalization, including institutional set-up) of mechanisms for mobilization, and/or;
• disbursement of finance for green growth.
Bankableprojects
Outputs corresponding to Intermediate Outcome 2 (green investment flows) where GGGI activities directly involve:
• design (including feasibility studies);
• preparation (including direct capacity development), and/or;
• structuring, and financing of bankable projects.
Σ CPI_SOji – CPIC
n
i
22
in 6.1.2, if there is a scenario in which the renewable energy and payment for ecosystem services work of the country program can be replicated or scaled up in the future, the resulting SO1 impacts will constitute the SO1 CPT for the country program.
Steps to estimate CPT for the country program:
• Step 1: Develop the targeted scaled-up or replication scenario for the existing projects or outputs by the country program. This should be conducted for all projects/outputs planned for scale-up or replication for all relevant SOs;
• Step 2: Estimate the attributed impacts in relevant SOs for the scaled or replication scenarios; and
• Step 3: Aggregate the impacts for each relevant SO.
Annex XIII provides an example of reported SO3.3 CPI and CPT estimates by a country program for existing qualifying projects/outputs.
6.1.4 Limitations of the bottom-up impact estimation approach
The ex‑ante attributed impact estimates with the bottom-up approach requires project or output specific data, assumptions and scenarios for each relevant SO. The following factors can affect the estimates:
1. Accuracy of the socio-economic and environmental data and assumptions used to estimate the CPI for the qualifying projects/outputs;
2. Appropriateness and robustness of the methodology utilized to estimate the CPI. This guidance note provides recommended approaches and methodologies in the Annexes; and
3. Deviation of assumed scale-up scenarios and data used to estimate CPT from the actual future result.
6.2 Top-down approach for SO impact estimation
CPTs can serve as the basis for formulating targeted impacts of a country program in a future year (e.g. 2030) based on scenarios for the scaling up of current and recently undertaken projects and outputs within a two to four-year timeframe28. This relatively short timeframe poses limitations to determining organization-wide impact targets29 as it is challenging to assess how the program will develop in the longer term. This is a
28 The timeframe of projects implemented under the biennual WPB or earmarked projects in countries.
29 In 2019, several country programs piloted estimations of CPTs based on existing projects. However, these were not sufficient to formulate organization-wide intended targets.
particularly important consideration when defining targeted impacts for the institute that are aligned with the 2030 UN SDG timeframe.
An alternative top-down approach to approximate targeted impacts by the organization in a future year can be used to address this challenge. Unlike the bottom-up approach, the top-down approach does not extrapolate the expected impacts of specific projects or outcomes in the current portfolio, but sets approximate strategic SO targets, with precision to an order of magnitude. Top-down targeting approaches can be used for making strategic choices about GGGI’s organizational priorities.
The top-down approach is described in sections 6.2.1, 6.2.2 and 6.2.3.
6.2.1 Targeted Attribution Impact (TAI) estimation using the top-down approach
A TAI is an intended impact approximated using a scenario of GGGI’s targeted green investment mobilization during a future period, using a specific green investment intervention option. These investment interventions need to meet the criteria of Qualifying Projects/Outputs as outlined in section 6.1.1. The period specified and specific investment intervention options are defined by the organization’s long-term strategy.
The allocation of the investments should be made at the country level where GGGI expects to engage in each intervention, or the countries where GGGI is currently present, presuming that this is a representative sample of our future country portfolio.
SOj = INV
j * IM
j,
where, SOj is the approximated targeted impact from the green
investment intervention ‘j’ in the relevant SO, INV is amount of
investment mobilized (USD) in the green investment option, and IM is the respective Investment Multiplier, or unit outcome per USD invested for that SO.
6. Estimating SO impact and target outcomes — approach and methodologyGGGI Strategic Outcomes Guideline
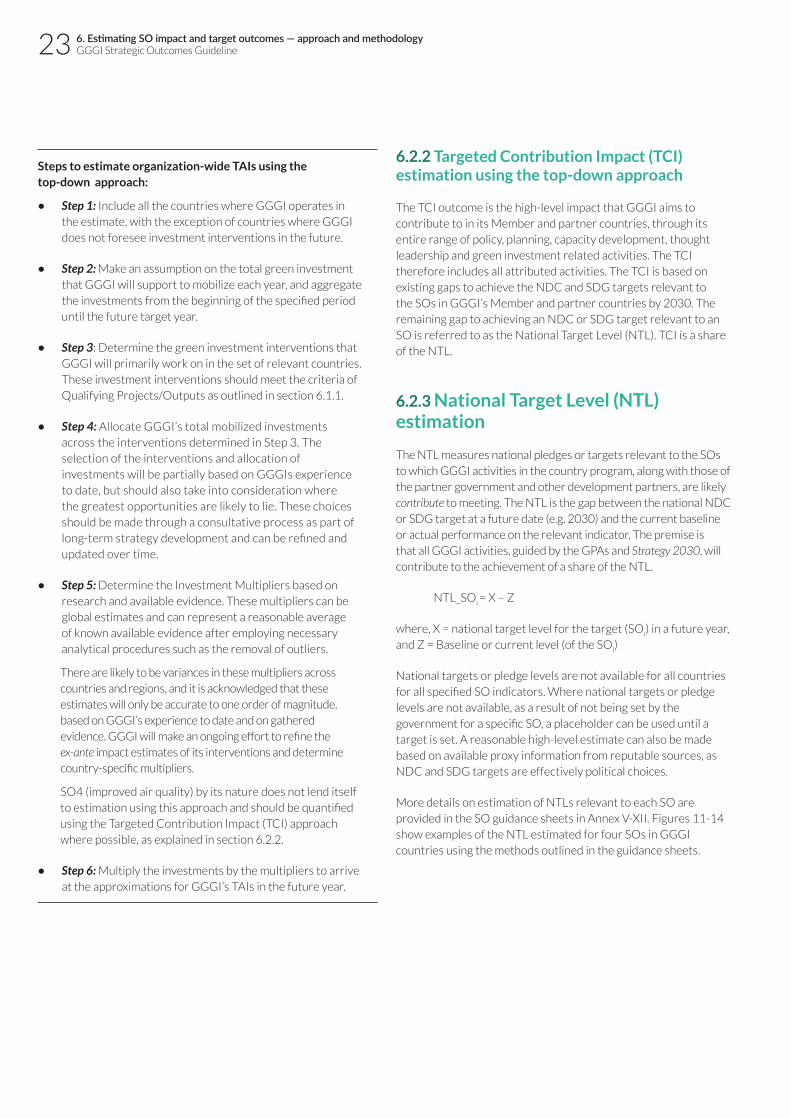
23
Steps to estimate organization-wide TAIs using the top‑down approach:
• Step 1: Include all the countries where GGGI operates in the estimate, with the exception of countries where GGGI does not foresee investment interventions in the future.
• Step 2: Make an assumption on the total green investment that GGGI will support to mobilize each year, and aggregate the investments from the beginning of the specified period until the future target year.
• Step 3: Determine the green investment interventions that GGGI will primarily work on in the set of relevant countries. These investment interventions should meet the criteria of Qualifying Projects/Outputs as outlined in section 6.1.1.
• Step 4: Allocate GGGI’s total mobilized investments across the interventions determined in Step 3. The selection of the interventions and allocation of investments will be partially based on GGGIs experience to date, but should also take into consideration where the greatest opportunities are likely to lie. These choices should be made through a consultative process as part of long-term strategy development and can be refined and updated over time.
• Step 5: Determine the Investment Multipliers based on research and available evidence. These multipliers can be global estimates and can represent a reasonable average of known available evidence after employing necessary analytical procedures such as the removal of outliers.
There are likely to be variances in these multipliers across countries and regions, and it is acknowledged that these estimates will only be accurate to one order of magnitude, based on GGGI’s experience to date and on gathered evidence. GGGI will make an ongoing effort to refine the ex‑ante impact estimates of its interventions and determine country-specific multipliers.
SO4 (improved air quality) by its nature does not lend itself to estimation using this approach and should be quantified using the Targeted Contribution Impact (TCI) approach where possible, as explained in section 6.2.2.
• Step 6: Multiply the investments by the multipliers to arrive at the approximations for GGGI’s TAIs in the future year.
6.2.2 Targeted Contribution Impact (TCI) estimation using the top-down approach
The TCI outcome is the high-level impact that GGGI aims to contribute to in its Member and partner countries, through its entire range of policy, planning, capacity development, thought leadership and green investment related activities. The TCI therefore includes all attributed activities. The TCI is based on existing gaps to achieve the NDC and SDG targets relevant to the SOs in GGGI’s Member and partner countries by 2030. The remaining gap to achieving an NDC or SDG target relevant to an SO is referred to as the National Target Level (NTL). TCI is a share of the NTL.
6.2.3 National Target Level (NTL) estimation
The NTL measures national pledges or targets relevant to the SOs to which GGGI activities in the country program, along with those of the partner government and other development partners, are likely contribute to meeting. The NTL is the gap between the national NDC or SDG target at a future date (e.g. 2030) and the current baseline or actual performance on the relevant indicator. The premise is that all GGGI activities, guided by the GPAs and Strategy 2030, will contribute to the achievement of a share of the NTL.
NTL_SOi = X – Z
where, X = national target level for the target (SOi) in a future year,
and Z = Baseline or current level (of the SOi)
National targets or pledge levels are not available for all countries for all specified SO indicators. Where national targets or pledge levels are not available, as a result of not being set by the government for a specific SO, a placeholder can be used until a target is set. A reasonable high-level estimate can also be made based on available proxy information from reputable sources, as NDC and SDG targets are effectively political choices.
More details on estimation of NTLs relevant to each SO are provided in the SO guidance sheets in Annex V-XII. Figures 11-14 show examples of the NTL estimated for four SOs in GGGI countries using the methods outlined in the guidance sheets.
6. Estimating SO impact and target outcomes — approach and methodologyGGGI Strategic Outcomes Guideline
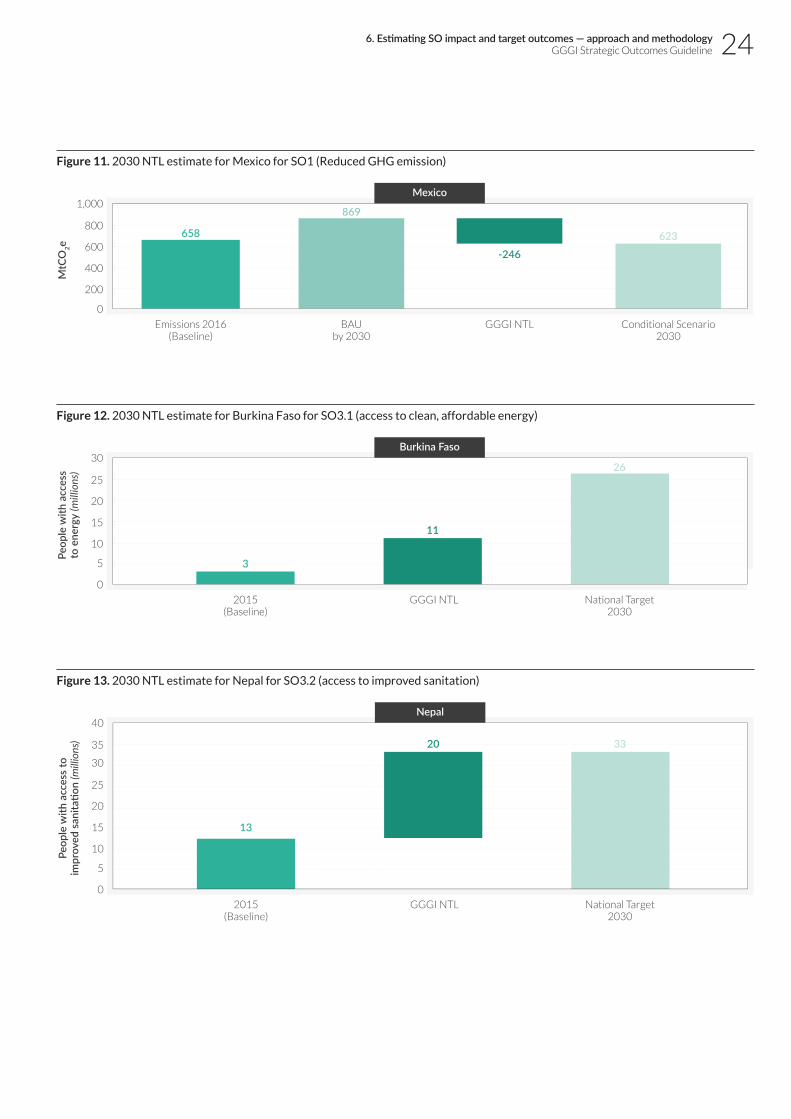
24
Figure 11. 2030 NTL estimate for Mexico for SO1 (Reduced GHG emission)
Figure 12. 2030 NTL estimate for Burkina Faso for SO3.1 (access to clean, affordable energy)
1,000
800
600
400
200
0
MtC
O2e
Emissions 2016(Baseline)
BAUby 2030
GGGI NTL Conditional Scenario2030
658
869
-246623
Mexico
30
25
20
15
10
5
0
Peop
le w
ith a
cces
sto
ene
rgy
(mill
ions
)
2015(Baseline)
GGGI NTL National Target2030
Burkina Faso
3
11
26
Figure 13. 2030 NTL estimate for Nepal for SO3.2 (access to improved sanitation)
30
35
40
25
20
15
10
5
0
Peop
le w
ith a
cces
s to
impr
oved
san
itatio
n (m
illio
ns)
Nepal
2015(Baseline)
GGGI NTL National Target2030
13
20 33
6. Estimating SO impact and target outcomes — approach and methodologyGGGI Strategic Outcomes Guideline
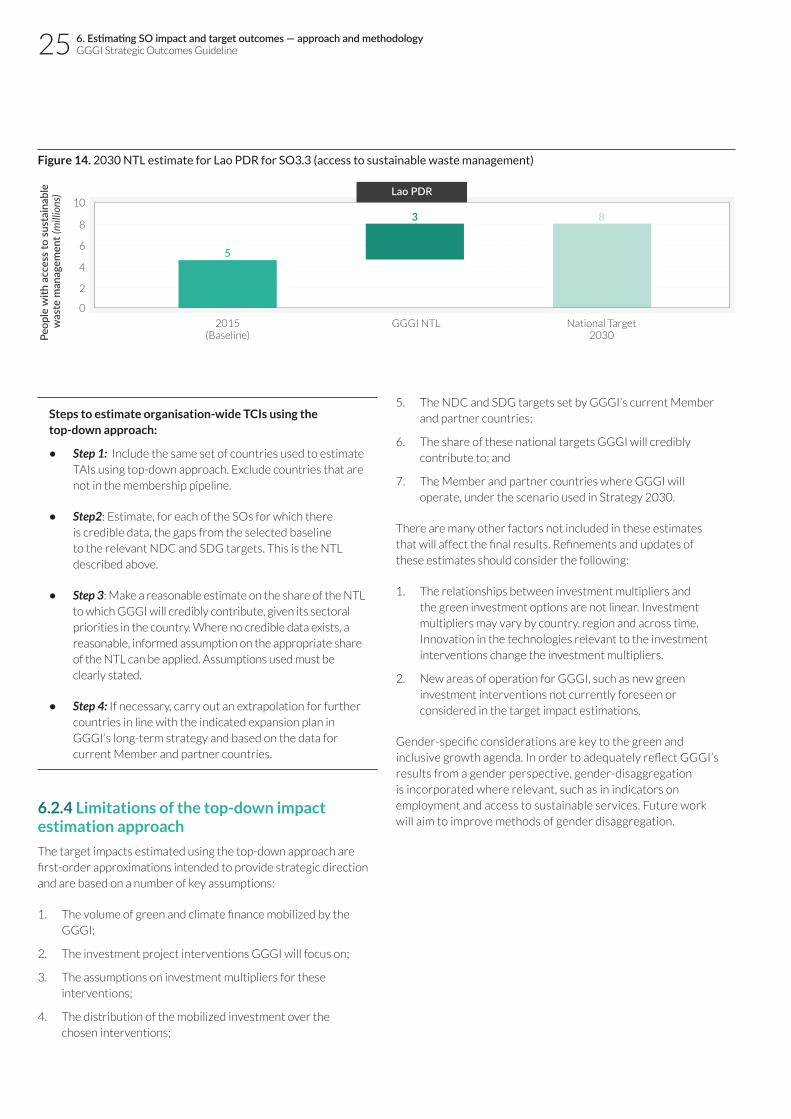
25
Figure 14. 2030 NTL estimate for Lao PDR for SO3.3 (access to sustainable waste management)
10
8
6
4
2
0
Lao PDR
Peop
le w
ith a
cces
s to
sus
tain
able
was
te m
anag
emen
t (m
illio
ns)
2015(Baseline)
GGGI NTL National Target2030
5
3 8
Steps to estimate organisation-wide TCIs using the top‑down approach:
• Step 1: Include the same set of countries used to estimate TAIs using top-down approach. Exclude countries that are not in the membership pipeline.
• Step2: Estimate, for each of the SOs for which there is credible data, the gaps from the selected baseline to the relevant NDC and SDG targets. This is the NTL described above.
• Step 3: Make a reasonable estimate on the share of the NTL to which GGGI will credibly contribute, given its sectoral priorities in the country. Where no credible data exists, a reasonable, informed assumption on the appropriate share of the NTL can be applied. Assumptions used must be clearly stated.
• Step 4: If necessary, carry out an extrapolation for further countries in line with the indicated expansion plan in GGGI’s long-term strategy and based on the data for current Member and partner countries.
6.2.4 Limitations of the top-down impact estimation approach
The target impacts estimated using the top-down approach are first-order approximations intended to provide strategic direction and are based on a number of key assumptions:
1. The volume of green and climate finance mobilized by the GGGI;
2. The investment project interventions GGGI will focus on;
3. The assumptions on investment multipliers for these interventions;
4. The distribution of the mobilized investment over the chosen interventions;
5. The NDC and SDG targets set by GGGI’s current Member and partner countries;
6. The share of these national targets GGGI will credibly contribute to; and
7. The Member and partner countries where GGGI will operate, under the scenario used in Strategy 2030.
There are many other factors not included in these estimates that will affect the final results. Refinements and updates of these estimates should consider the following:
1. The relationships between investment multipliers and the green investment options are not linear. Investment multipliers may vary by country, region and across time. Innovation in the technologies relevant to the investment interventions change the investment multipliers.
2. New areas of operation for GGGI, such as new green investment interventions not currently foreseen or considered in the target impact estimations.
Gender-specific considerations are key to the green and inclusive growth agenda. In order to adequately reflect GGGI’s results from a gender perspective, gender-disaggregation is incorporated where relevant, such as in indicators on employment and access to sustainable services. Future work will aim to improve methods of gender disaggregation.
6. Estimating SO impact and target outcomes — approach and methodologyGGGI Strategic Outcomes Guideline

26
7. Estimating Targeted Attribution Impacts (TAIs) and Targeted Contribution Impacts (TCIs) for GGGI Strategy 2030The estimates for the GGGI Strategy 2030 TAIs and TCIs for the year 2030, are explained in this section. The estimation included GGGI’s Member and partner countries where GGGI conducts programmatic activities30 Due to lack of data and related projects, impact estimates for SO4 (improved air quality) were not carried out.
30 Developed GGGI Member countries where GGGI doesn’t have programmatic activities are excluded.
7. Estimating Targeted Attribution Impacts (TAIs) and Targeted Contribution Impacts (TCIs) for GGGI Strategy 2030GGGI Strategic Outcomes Guideline
7

27 7. Estimating Targeted Attribution Impacts (TAIs) and Targeted Contribution Impacts (TCIs) for GGGI Strategy 2030GGGI Strategic Outcomes Guideline
TAIs by 2030 were estimated as below and by following the steps outlined in section 6.2.1.
• Step 1: A total of 35 countries where GGGI operates in 2019 were included in this estimation31.
• Step 2: Using GGGI Strategy 2030 scenario analysis, green investment mobilization by GGGI was USD500 million in 2017 and 2018, respectively. This is targeted to increase linearly to USD2 billion by the year 2030. This amounts to a target investment mobilization of USD16.5 billion over the period of 2017-203032.
• Step 3: The Strategy 2030 process involved extensive consultations to identify priority focus areas for GGGI during the period 2017-30. Based on these consultations, it was agreed that GGGI will focus primarily on the following green investment interventions during 2017-30 in Member and partner countries:
1. Solar PV that contributes to air quality improvement, but not necessarily energy access (primarily related to rooftop, utility, mini-grid interventions);
2. Solar PV aimed at energy access (primarily off-grid solar power solutions);
3. Energy efficiency in the industry sector;
4. Energy efficiency in buildings (green buildings);
5. E-mobility (primarily through electric buses, motorbikes and associated infrastructure);Municipal waste-management, that would also contribute to improving air quality;
31 China and Costa Rica are excluded as GGGI currently does not foresee green investment projects here. The OECS member states are counted as one country in this list. The Western Balkans are included in Hungary.
32 Green investment mobilization scenarios and distribution across countries and interventions were separately conducted as part of Strategy 2030 development. Refer to Strategy 2030 for details.
6. Agricultural/industrial waste management including biomass waste to energy solutions;
7. Improving sanitation in urban and peri-urban areas;
8. Climate smart agriculture / agricultural value chains as the primary investment to maintain natural capital, climate change adaptation measures, and creating employment in rural areas; and
9. Solar pumping / irrigation that contributes to climate adaptation and rural jobs creation.
• Step 4: Existing evidence related to the investment multipliers was collected and qualitative screenings were conducted for scope and outliers. Table 3 lists the investment multipliers and sources of data that were used to determine these.
• Step 5: The Strategy 2030 scenario exercise involved distribution of the targeted investment of USD16.5 billion across the identified priority areas indicated in Step 3. The distribution was conducted taking into account the relative priority of the investment interventions. Table 4 shows the distribution across the green investment interventions.
• Step 6: The TAIs are approximated by multiplying the targeted investments in each intervention with the respective investment multipliers. Table 4 provides the approximate targeted impacts per SO and green investment option.

287. Estimating Targeted Attribution Impacts (TAIs) and Targeted Contribution Impacts (TCIs) for GGGI Strategy 2030GGGI Strategic Outcomes Guideline
Table 3. Investment multipliers used for estimating Targeted Attribution Impacts (TAIs)
Primary green investment intervention
SO1:
Red
uced
GH
G
emiss
ions
USD
/to
n C
O2e
SO2:
Cre
ation
of g
reen
jo
bs33
Job
s/ M
illio
n U
SD
SO3.
1:Cl
ean
and
affor
dabl
e en
ergy
B
enefi
ciar
ies
/Mill
ion
USD
SO3.
2:Im
prov
ed s
anita
tion
Ben
efici
arie
s /M
illio
n U
SD
SO3.
3: S
usta
inab
le w
aste
m
anag
emen
t B
enefi
ciar
ies
/Mill
ion
USD
SO3.
4: S
usta
inab
le p
ublic
tr
ansp
ort
Ben
efici
arie
s /M
illio
n U
SD
SO5:
Ade
quat
e m
aint
enan
ce
of n
atur
al c
apita
lU
SD /
ha
SO6:
Enh
ance
d ad
apta
tion
to c
limat
e ch
ange
Peo
ple/
Mill
ion
USD
Solar PV (utility scale) 29.00 1.22 - - - - - -
Solar PV (off-grid systems for energy access)
24.00 30.00 33,126.87 - - - - -
Energy efficiency in industry (13.61) 5.70 - - - - - -
Energy efficiency in buildings (27.90) 8.60 - - - - - -
E-mobility & sustainable public transport infrastructure
13.30 52.00 - - - 8,589.39 - -
Municipal Waste-management (17.30) 12.86 - - 38,928.76 - - -
Waste management (Agri / Industry)
(18.60) - - - - - - -
Sanitation - 54.50 - 27,151.52
Climate smart agriculture/ Enhancement of agricultural value chains / Natural capital conservation
12.00 448.25 - - - - 6,710.00 2,498.68
Solar pumping for irrigation 20.00 10.00 - - - - - -
Cost (USD) per beneficiary - - 30.19 36.83 25.69 - - 400.21
33 Only for direct jobs. Excludes indirect and induced jobs

29
Table 4. GGGI’s Targeted Attribution Impacts (TAIs) by intervention option, estimated using the top-down approach
Green investment project intervention options
Targ
et in
vest
men
t m
obili
sed
durin
g 20
17‑3
0 (m
illio
n U
SD)
SO1:
Red
uced
GH
G
emiss
ion
(Mt C
O2e)
SO2:
Cre
ation
of G
reen
Jo
bs (m
illio
ns o
f job
s)
SO3.
1: C
lean
affo
rdab
le
ener
gy (m
illio
ns o
f peo
ple)
SO3.
2: Im
prov
ed
sani
tatio
n (m
illio
ns o
f pe
ople
)
SO3.
3: S
usta
inab
le w
aste
m
anag
emen
t (m
illio
ns o
f pe
ople
)
SO3.
3: S
usta
inab
le
publ
ic tr
ansp
ort (
mill
ion
pass
enge
r‑km
)
SO4:
Air
Impr
oved
Air
Qua
lity
(day
s be
low
AQ
I ‘o
rang
e’ le
vel)
SO5:
Ade
quat
e m
aint
enan
ce o
f nat
ural
ca
pita
l (m
illio
ns o
f ha)
SO6:
Ada
ptati
on to
cl
imat
e ch
ange
(mill
ions
of
peo
ple)
Solar PV (Utility Scale) 3,000 103 0.004 - - - - - - -
Solar PV (Off-Grid
Systems for Energy
Access)
1,000 42 0.03 33.13 - - - - - -
Energy Efficiency in
Industries
1,000 73 0.01 - - - - - - -
Energy Efficiency in
Buildings
1,500 54 0.01 - - - - - - -
E-mobility & Sustainable
Public Transport
Infrastructure
2,500 188 0.13 - - - 21.47 - - -
Municipal
Waste-Management
2,000 116 0.03 - - 77.86 - - - -
Waste Management
(Agri / Industry)
1,000 54 - - - - - - - -
Sanitation 500 - 0.03 - 13.58 - - - - -
Climate Smart
Agriculture/
Enhancement of
Agricultural Value
Chains / Natural Capital
Conservation
3,000 251 1.34 - - - - - 4.47 7.50
Solar Pumping for
Irrigation
1,000 50 0.01 - - - - - - -
GGGI Targeted
Attribution Impacts
estimated for 2017-30
16,500 931 1.59 33.13 13.58 77.86 21.47 - 0.45 7.50
Adopted Targeted
Attribution Impacts for
2017-30
- 1,000 2.00 30 10 80 20 - 0.50 8
TAIs estimated using the top-down approach and at country level are a first step toward matching with the attributed country and project level impact estimates using the bottom-up approach. However, for the purpose of Strategy 2030, only organization-wide targets were estimated. Country level targets will be developed in collaboration with the country programs.
7. Estimating Targeted Attribution Impacts (TAIs) and Targeted Contribution Impacts (TCIs) for GGGI Strategy 2030GGGI Strategic Outcomes Guideline

30
TCIs by 2030 in Strategy 2030 were estimated using the top-down approach, following the steps outlined in section 6.2.2.
• Step 1: The same set of 35 countries used to develop the TAIs was considered for estimating the TCIs.
• Step2: Only countries with credible relevant data on NDC and SDG targets linked to the six SOs were considered. Due to data availability constraints, it was only possible to estimate NTLs for the below SOs.
SO1: The greenhouse gas emissions reductions contribution was calculated as 50% of the difference between the BAU Emissions projection in 2030 and the total unconditional NDC emissions target by 2030. Where a country did not have unconditional or conditional NDC Targets, the BAU emissions in 2016 was used to calculate the gap..
·SO3.1: The gap (in millions of people) to the target access to electricity by 2030 was estimated as follows:
Total number of people without access to electricity in 2030 = (Target share of population with access to electricity by 203034) * (projected population of the country in 203035) - (Share of population with access in 201636) * (population of the country in 201637)
A total of 18 countries were included in the analysis. Countries where GGGI does not have plans for energy access projects were excluded.
SO3.2: The gap (in millions of people) to the targeted level of access to improved sanitation by 2030 was estimated as follows:
Total number of people without access to improved sanitation in 2030 = (Target share of population with access to improved sanitation by 2030) * (projected population of the country in 2030) - (Share of population with access to improved sanitation in 201538) * (population of the country in 2015)
A total of 11 countries were included in the analysis. Countries where GGGI does not have plans for improved sanitation projects were excluded.
34 This can be found in National Development Plans per Country and- or Individual National Energy Plans
35 UN Department of Economic and Social Affairs Population Division, World Population Prospects 2019, Revised in 2019. https://population.un.org/wpp/
36 World Bank World Development Indicators (ID: EG.ELC.ACCS.ZS; accessed October 10, 2019), https://data.worldbank.org/indicator/EG.ELC.ACCS.ZS
37 UN Department of Economic and Social Affairs Population Division, World Population Prospects 2019, Revised in 2019. https://population.un.org/wpp/
38 World Bank World Development Indicators (ID: SH.STA.SMSS.ZS; accessed October 10, 2019), https://data.worldbank.org/indicator/SH.STA.SMSS.ZS
SO3.3: The gap (in millions of people) to the targeted level of access to sustainable waste management by 2030 was estimated with proxy data. The estimation was carried out as follows:
Total number of people without access to sustainable waste management services in 2030 = [(Waste Generation in 2030) × (percentage of waste not collected by 2030)] / (Waste generation rate per capita by 2030)
Regional averages for waste generation rates and waste collection rates by 2030 were used.
SO5: The target natural capital area (in million ha) of avoided degradation, restoration, and improvement was estimated only for forests due to availability of data. The gap was estimated as follows:
Unique forest area reforested and avoided deforestation by 2030 = [ (Country target expressed as % of land area covered by forest) × (Forest Area in 2015 in Ha) / % of land area covered by forest in 2015)] - Forest Area in 2015 in Ha.
Example: Costa Rica aims to increase its forest cover from 52% (equivalent 2,756,000 hectares39) in 2015 to 60%40. Reaching the target would result in forest cover of 3,180,000 hectares. Thus, the country would need to increase its forest coverage by 424,000 hectares.
Relevant data, such as on target forest coverage by 2030, was available, collated and analyzed for 18 countries.
SO6: Target number (in millions of people) to be covered for adaptation to the negative effects of climate change was estimated as:
Total number of people requiring adaptation to climate change in 2030 = Projected population of the country in 2030 * Share of people affected by climate-related disasters in 2017 41
The share of population affected by climate change in 2017 was assumed to remain the same in 2030, however this is a conservative assumption as in reality the share is likely to increase. The target for climate adaptation coverage is assumed to be 100 percent of the vulnerable population for all considered countries, and the current coverage was assumed as nil.
39 World Bank World Development Indicators. Forest Area (Sq. Km). Last Updated November 11, 2018. https://datacatalog.worldbank.org/dataset/world-development-indicators
40 Climate Home News. Costa Rica targets electric cars and forest growth in 2050 climate strategy. Revised in 2019. https://www.climatechangenews.com/2019/02/25/costa-rica-targets-electric-cars-forest-growth-2050-climate-strategy/
41 UN Sustainable Development Goal Indicators, Last updated October 3 2017, https://unstats.un.org/sdgs/indicators/database/
7. Estimating Targeted Attribution Impacts (TAIs) and Targeted Contribution Impacts (TCIs) for GGGI Strategy 2030GGGI Strategic Outcomes Guideline

31
• Step 3: For SO3.1, SO3.2, SO3.3, SO5 and SO6, the TCIs from all of GGGI’s activities, including on policy, investment, knowledge sharing and capacity development, was assumed as 20 percent of the NTL approximations calculated in step 2.
For SO1, the TCI was assumed to be 50 percent of the NTL values for all analyzed countries where data was available. GGGI energy, natural capital and waste projects address sectors that represent more than 60 percent of the total emissions of each country assessed.
• Step 4: The sum of all the estimates in the previous steps was used as the aggregate TCI for Strategy 2030. Table 5 shows the TCI estimates by region. Considering GGGI’s expected expansion of operations into additional Member and partner countries by 2030, this target impact can be considered a conservative estimate of GGGI’s target contribution.
Table 5. GGGI’s Targeted Contribution Impacts (TCIs) by region estimated using the top-down approach
Region
SO1:
GH
G e
miss
ion
redu
ction
(MtC
O2e)
SO2:
Cre
ation
of g
reen
jobs
(M
illio
ns o
f job
s)
SO3.
1: C
lean
affo
rdab
le
ener
gy a
cces
s (M
illio
ns o
f pe
ople
)
SO3.
2: Im
prov
ed s
anita
tion
acce
ss (M
illio
ns o
f peo
ple)
SO3.
3: S
usta
inab
le w
aste
m
anag
emen
t acc
ess
(Mill
ions
of p
eopl
e)
SO5:
Ade
quat
e m
aint
enan
ce o
f nat
ural
ca
pita
l (M
illio
ns o
f ha
of
avoi
ded
degr
adat
ion
and/
or
impr
oved
)
SO6:
Enh
ance
d ad
apta
tion
to c
limat
e ch
ange
(Mill
ion
peop
le s
uppo
rted
to c
ope
with
th
e ef
fect
s of
clim
ate
chan
ge)
Central Asia 10.88 - - - 2.39 0.03 -
East Africa 98.37 32.69 36.07 60.41 9.30 0.91
East Asia 3.58 1.85 0.13 - 132.24 3.69 2.40
Europe 6.82 - - - 0.23 - 6E-4
Latin America & Caribbean 266.06 0.24 0.03 - 9.38 1.68 0.17
North Africa 34.41 - - - 2.41 0.02 0.12
Pacific Islands 45.07 - 1.02 0.78 1.25 0.00 0.22
South Asia 183.65 1.30 47.44 3.58 176.97 5.49 7.34
Southeast Asia 787.10 0.50 7.44 5.00 56.85 2.99 1.44
West Africa 10.83 - 5.72 6.68 6.99 0.20 0.42
Western Asia 95.72 - - - 0.75 - 4E-4
GGGI Targeted Contribution Impacts estimated for 2017‑2030
1,542.50 3.88 94.47 52.12 449.85 23.37 13.03
Adopted Targeted Contribution Impacts 2017‑2030
1,600 4 90 50 400 20 16
7. Estimating Targeted Attribution Impacts (TAIs) and Targeted Contribution Impacts (TCIs) for GGGI Strategy 2030GGGI Strategic Outcomes Guideline

32
8. Managing the continuous SO process within the organizationThe SO framework was adopted and introduced in GGGI’s Refreshed Strategic Plan 2015‑2042. Since then, the framework has been gradually introduced in the GGGI’s strategic narratives and operational planning. The publication of Strategy 2030 and this guideline, together with monitoring of project and output level SO impacts through GGGI Online43, will facilitate greater mainstreaming of the framework.
The development and refinement of the SO framework and methods and the target estimation efforts outlined in this guideline involved years of extensive and iterative consultations within the organization. Future revisions to the methods and estimates will involve three major categories of tasks: research and development, review and consultation by relevant stakeholders, and revision and finalization. The Investment and Policy Solutions Division (IPSD) at GGGI has been supporting relevant research and development and
42 GGGI, Refreshed Strategic Plan 2015‑20, 2017, http://gggi.org/site/assets/uploads/2017/11/GGGI-Refreshed-Strategic-Plan-2015-2020.pdf
43 GGGI Online is GGGI’s internal web-based platform to manage project proposal development, planning and progress management.
efforts to mainstream SOs by working closely with GGGI’s senior management and the Office of the Director-General and Green Growth Planning and Implementation (GGPI) divisions.
Table 6 provides an overview of the primary tasks and prescribed roles envisioned in the methodology update and impact estimation and monitoring processes. These tasks should be integrated into GGGI’s existing and planned systems and processes as much as possible in order to streamline and minimize time and resource requirements. Resources needed to fulfill these tasks should be considered in annual planning and budgeting processes. GGGI’s Management Team (MT) have final discretion on these details based on their assessment of current requirements and context.
8. Managing the continuous SO process within the organizationGGGI Strategic Outcomes Guideline
8

33 8. Managing the continuous SO process within the organizationGGGI Strategic Outcomes Guideline
Table 6. Primary tasks and recommended responsibilities in the SO processes
Primary task
Sub‑
task
Whe
n sh
ould
th
e ta
sk b
e ca
rrie
d ou
t?
Indi
cativ
e du
ratio
n to
be
allo
cate
d
Task
co
ordi
natio
n le
ad (e
.g. l
iais
on
with
cou
ntry
te
ams)
Task
tech
nica
l le
ad (e
.g.
anal
ysis
, tra
inin
g et
c.)
Div
ision
s /
entiti
es to
be
cons
ulte
d
Revi
ew a
nd
sign-
off
Analytical approach and methods
Revision of estimation approaches in guideline
As deemed necessary by GGGI MT
Six months for updates and consultations
SO focal in ODG
SO focal in SPC
GGGI MT, MPSC, Council
GGGI MT, Council
Revision of prescribed methods in guideline
As deemed necessary by GGGI MT
Six months for updates and consultations
SO focal in ODG
SO focal in SPC
GGGI MT, MPSC, IPSD thematic leads, CRs
GGGI MT, Council
Top-down impact target estimates
Preparation of NTL estimates and assumptions at country level
Target-estimation for long-term strategy development
One person-week
SO focal in SPC
SO focal in SPC
SO focal in ODG
SO focals in SPC and ODG
Preparation or revision of unit outcome / investment multipliers
Target-estimation for long-term strategy development
Two person-weeks
SO focal in SPC
SO focal in SPC
IPSD thematic heads
SO focals in SPC and ODG
Finalisation of the Top-down target impact estimates by intervention/country
Long-term strategy development
One week after target impact estimation
SO focal in ODG
SO focal in SPC
GIS, ODG, GGGI MT
GGGI MT
Bottom-up impact target estimates
Determining Qualifying Projects/Outputs
PIN / project proposal preparation
Less than one day
GGPI CPO/Country program
GGPI country program
SO focals in SPC and SPC
Respective GGPI CPO, Regional office
Preparation of CPI estimates and assumptions of project
PIN / project proposal preparation
One person-day per project with relevant assumptions
GGPI CPO/Country Program
GGPI country program
SO focals in SPC and ODG, respective government / development partners
Respective GGPI CPO, regional office
Preparation of CPT estimates and assumptions of project
Target-estimation for long-term strategy development
One person-day per project with relevant assumptions
GGPI CPO/Country Program
GGPI country program
SO focals in SPC and ODG
Respective GGPI CPO, regional office
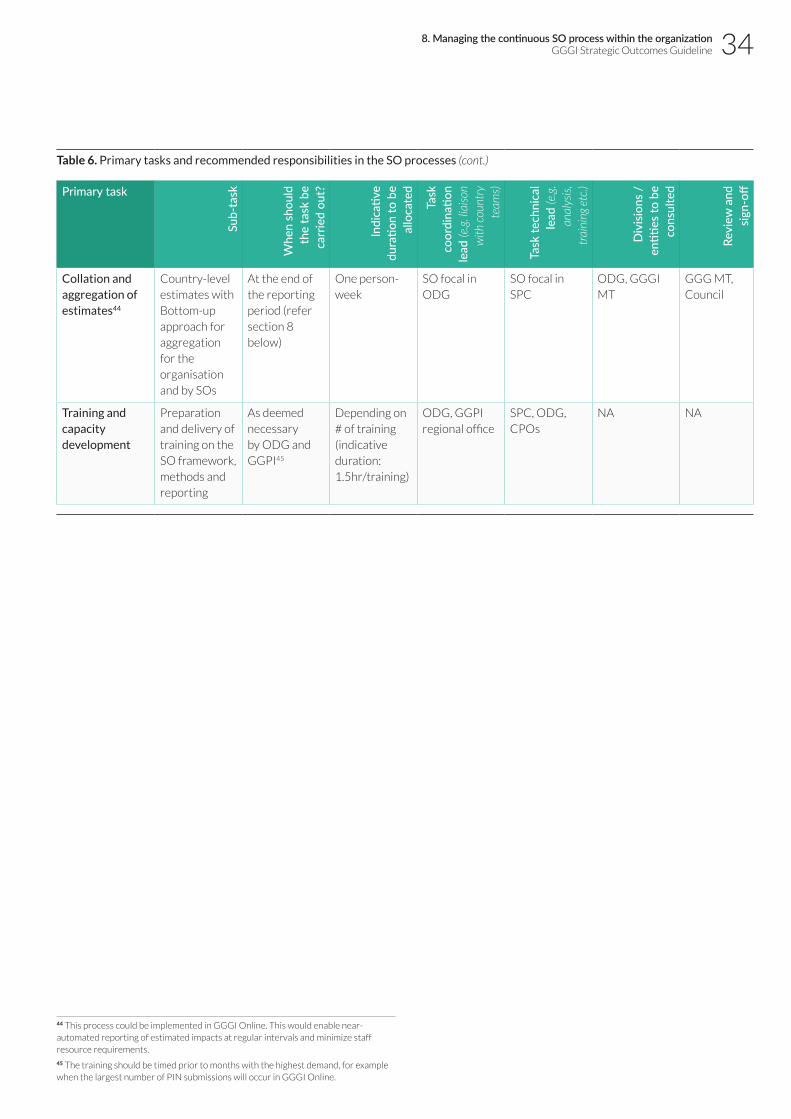
348. Managing the continuous SO process within the organizationGGGI Strategic Outcomes Guideline
Table 6. Primary tasks and recommended responsibilities in the SO processes (cont.)
Primary task
Sub‑
task
Whe
n sh
ould
th
e ta
sk b
e ca
rrie
d ou
t?
Indi
cativ
e du
ratio
n to
be
allo
cate
d
Task
co
ordi
natio
n le
ad (e
.g. l
iais
on
with
cou
ntry
te
ams)
Task
tech
nica
l le
ad (e
.g.
anal
ysis
, tr
aini
ng e
tc.)
Div
ision
s /
entiti
es to
be
cons
ulte
d
Revi
ew a
nd
sign-
off
Collation and aggregation of estimates44
Country-level estimates with Bottom-up approach for aggregation for the organisation and by SOs
At the end of the reporting period (refer section 8 below)
One person-week
SO focal in ODG
SO focal in SPC
ODG, GGGI MT
GGG MT, Council
Training and capacity development
Preparation and delivery of training on the SO framework, methods and reporting
As deemed necessary by ODG and GGPI45
Depending on # of training (indicative duration: 1.5hr/training)
ODG, GGPI regional office
SPC, ODG, CPOs
NA NA
44 This process could be implemented in GGGI Online. This would enable near-automated reporting of estimated impacts at regular intervals and minimize staff resource requirements.
45 The training should be timed prior to months with the highest demand, for example when the largest number of PIN submissions will occur in GGGI Online.

35
9. Reporting and verification of SO impactsRecommended modalities for reporting of estimated impacts are outlined in Table 7. GGGI’s MT have final discretion on these modalities based on their assessment of current requirements and context.
9. Reporting and verification of SO impactsGGGI Strategic Outcomes Guideline
9

36
Table 7. Recommended modalities for SO impact reporting
SO impactcategory
Reportingtime
Reportedby
Reportingto
Verification responsibility
Reportingformat
Bottom-up CPI estimates
During submission of PIN/project proposal to GGGI Online
Country program
GGGI Online CPO/regional office focal
Template as in Annex XIV / GGGI online
Bottom-up CPT estimates
During next long-term Strategy update
Country program
Email to SO focals at SPC and ODG
SO focals at SPC and ODG
Template as in Annex XIV / GGGI Online
Top-down NTL estimates
Review for necessary changes, if any, at the beginning of each year46
SO focal at SPC
(share with ODG) SO focals at SPC and ODG
Excel sheet with calculations
Top-down TAI and TCI estimates
During next long-term Strategy update
SO focal at SPC
(share with ODG) SO focals at SPC and ODG
Excel sheet with calculations
46 It is only necessary to update NTLs when a country changes its targets or when changes in the reference year are made.
Figure 15. Suggested CPI estimation and reporting steps
Review and sign-off by the regional office / CPO
Review & approval of estimated SO impacts during PIN review
Submit SO impacts along with project particulars in GGGI online
Ex-ante SO-CPI estimates conducted by PIN / proposal developmemt team
9.1 Reporting ex-ante impacts of projects/outputs for planning and annual reporting
In order to achieve the targeted green investment mobilization and the resulting TAIs and TCIs set out in Strategy 2030, reporting and tracking ex‑ante impacts of active projects is a useful tool for planning and course correction.
Mainstreaming the SOs in GGGI’s operational planning process will also require that the SO impact estimation and reporting process is integrated into GGGI’s regular project/PIN development and approval process. This will enable systematic annual reporting of ex‑ante impacts from active projects.
Figure 15 outlines the recommended process for the estimation and reporting of ex‑ante attributed project/output impact, or CPI.
The templates for reporting CPI and CPT estimates are provided in Annex XIII. This template can be captured in GGGI Online for reporting CPI estimates.
9.2 Reporting ex-post impacts of projects/outputs after implementation
Ex‑post SO impact estimation is recommended every year after the implementation of a project or output has begun. An assessment of potential SO impacts from multi-year activities in a country program should be conducted during periodic country program evaluation by GGGI’s Internal Evaluation Unit (IEU) unit. Such an evaluation should include an ex‑post assessment of implemented projects/outputs by the country program. Further guidelines will be provided on ex‑post evaluation at a later date.
9. Reporting and verification of SO impactsGGGI Strategic Outcomes Guideline

37 AnnexesGGGI Strategic Outcomes Guideline
Annexes
© P
ran
ab B
aru
ah

38
Annex I. GGGI Intermediate OutcomesGGGI Strategy 2030 outlines five Intermediate Outcomes, of which three (3) are outlined here.
Intermediate Outcome 1: (Increased green investment flows) This outcome results from projects/outputs that includes green bankable projects, financing mobilized/disbursed under an NFV, etc.
Intermediate Outcome 2: (Strengthened national, sub-national, local green growth planning, financing, and institutional frameworks) This outcome is primarily an enabling one, and results from projects/outputs that includes supports of strategies, roadmaps, monitoring systems, as well as institutional arrangements for green growth planning and implementation.
Intermediate Outcome 3: (National, regional and global capacity, and improved multi-directional knowledge sharing and learning between South-South and South-North-South countries on green growth) This outcome is primarily an enabling one, and results from projects/outputs that includes capacity development, knowledge sharing and activities aimed at raising the green growth agenda among stakeholders e.g. green growth forums, training programs, green jobs assessment, etc.
Example project and outputs that correspond to Intermediate Outcome 1: Project: Four bankable projects developed and financing arranged for rural energy access.
Output/Activities:
1.1 Pre-feasibility study and preparation of project concept
1.2 Feasibility study
1.3 Solicit financier and carry out deal (e.g. secure a Letter of Intent)
Example project and outputs that correspond to Intermediate Outcome 2:Project: Develop a solid waste management strategy for the city of X.
Output/Activities:
1.1 Assess solid-waste management situation and review existing related initiatives and programs
1.2 Develop a technical working group of relevance agencies and development partners
1.2 Develop draft strategy; consultation for feedback
1.3 Submit to government for endorsement and adoption
Example project and outputs that correspond to Intermediate Outcome 2:Project: Energy ministries strengthened for SDG 7 (energy access) implementation.
Output/Activities:
2.1 Assessment of current political economy and institutional arrangement (gap analysis)
2.2. Consultations and final recommendations
2.3 Operationalize institutional framework including an inter-ministerial committee
Annex I. GGGI Intermediate outcomesGGGI Strategic Outcomes Guideline

39 Annex II. Qualifying Projects/OutputsGGGI Strategic Outcomes Guideline
Figure A-1. Qualifying project and output categories by Intermediate Outcomes
A. What are Qualifying Projects/Outputs?
Qualifying Projects/Outputs in a country program are the ones that have direct and significant causal links to the relevant SOs.
A project or output with in the Design, Financing, and Implementation stage of the GGGI Value Chain should be designed to have a causal linkage to at least one relevant SO. The following Work Program and Budget (WPB) project/output categories are
deemed to such direct causal link to the relevant SOs:
• C-1) Bankable projects: Projects/outputs corresponding to Intermediate Outcome 2 (green investment flows) where GGGI activities are directly related to design (including feasibility study), preparation (including direct capacity development), structuring, and financing of bankable projects.
• C-2) Mechanisms for mobilization and disbursement of financing (e.g. through a national financing vehicle): Projects/outputs corresponding to Intermediate Outcome 2 (green investment flows) where GGGI activities are directly on design (including feasibility study), preparation (including direct capacity development), and operationalization (e.g. including institutional set-up) of mechanisms for mobilization and/or disbursement of finance for green growth projects
Example: Support for institutional setup of a national financing vehicle will directly contribute to facilitating financing of projects on the ground, and will qualify for SO impact assessment.
• C-3) Policies, targets, financing/regulatory instruments: Projects/outputs that deliver policy or financing
instruments that are adopted or implemented or has a clear implementation pathway, and that has (legally binding) target components.
Examples: 1. Development of an energy policy with a renewable electricity target in a future year, endorsed by the government with a clear adoption timeline; 2. A sustainable forest management policy developed with a deforestation target in a future year, adopted by the government with a clear adoption timeline; 3. Direct support to revise a financial incentive system that is endorsed by the government, such as a renewable feed in tariff system or a payment for ecosystem services.
Similarly, support for the development of a financing support scheme (for example, a feasibility study for a renewable feed-in-tariff system) qualifies for impact assessment of relevant SOs.
• C-4) Action Plans and Other Outputs: Other projects/outputs corresponding to Intermediate Outcome 1, for example policy, financing strategy, and planning frameworks, that have follow-up plans that should lead to outputs in Intermediate Outcome 2, for example bankable project development.
Example: A GGGI country program will develop a roadmap to implement the country’s energy target in the NDC. The roadmap will include project pipeline particulars, and the country program has plans to pursue bankable project development for a number of energy access and energy efficiency projects in the roadmap. With the project pipeline and a project development plan, the roadmap project/output qualifies for and requires impact assessment in SO1 (reducing GHG emission), SO3.1 (affordable clean energy), and SO2 (creation of green jobs).
Projects/outputs corresponding to
Intermediate Outcome 1
(C-1) Bankable investment projects
(C-2) Mechanisms for mobilization and disbursement of financing
Design (incl. feasibility study), preparation (incl. capacity development), structuring and financing of bankable investment projects (many times infrastructure-related projects e.g. renewable electricity production, green BRT systems).
Design (incl. feasibility study), preparation (incl. capacity development), and operationalization (incl. institutional set-up) of funds / financing schemes to mobilization and/or disburse finance to climate action and green growth projects.
Projects/outputs corresponding to
Intermediate Outcome 2
(C-3) Policies, targets, financing/regulatory instruments
(C-4)Action plans andother outputs
Design, development, and/or implementation of policies, targets or financing / regulatory instruments (e.g. PES, renewable FiT, GHG reduction target), that are expected to be adopted and / or implemented within the SO reporting period or have clear implementation pathway.
Policy, action plans, investment strategy, planning frameworks etc. that have concrete implementation components(e.g. a project pipelines) and / or concrete follow-up plans linked to Intermediate Outcome 1 (e.g. to develop bankable projects).
Annex II. Qualifying Projects/Outputs

40Annex II. Qualifying Projects/OutputsGGGI Strategic Outcomes Guideline
B. What information is used to identify Qualifying Projects/Outputs?
Projects/outputs in a country program are outlined in GGGI’s Work Program and Budget (WPB) and should be aligned to GGGI’s Intermediate Outcomes. A description of three GGGI Intermediate Outcomes and corresponding example outputs are provided in Annex I.
Qualifying Projects/Outputs are identified based on the project and output level information provided in the WPB. Output level information in the WPB should be used as the basis to identify outputs with direct causal links to achieving at least one of the SOs. If sufficient information is not available at the output level, project-level information should be used to determine causal linkages with the SOs.
Figure A-2 provides example GGGI WPB/GGGI Online project/outputs and relevant SOs identified for which impact estimation is required.
C. How are relevant SOs to Qualifying Projects/Outputs determined?
Each GGGI project/output belongs to one or more Global Operational Priorities (GPAs). Figure 2 in section 3 of the Strategic Outcomes guideline depicts which SOs are likely to be significantly impacted by GGGI GPAs. The description of each Qualifying Project/Output should be used to identify which GPAs and SOs are most relevant.
Impact assessment is only carried out for SOs identified as relevant to the Qualifying Project/Output.
D. Which projects/outputs do not require SO impact assessment?
Projects/outputs aimed at Intermediate Outcome 1 (policy, planning etc.) and Intermediate Outcome 3 (knowledge sharing) are important enablers to advance and mainstream green growth. However, unless these projects/outputs include plans for activities that directly link to Design, Financing, and Implementation components of the GGGI Value Chain, SO impact assessment is not required. Projects/outputs in this category would include support for policy/strategy/framework development; monitoring system development; sustainability and safeguards systems development; research and analysis; advocacy; and knowledge sharing.
Figure A-2. Examples of GGGI projects and outputs for which SO impact estimation is required
Project scope Outputs indicatedin the WPB
Criteria that determine directcausal links to GGGI SOs
Relevant SOs for estimating impacts (e.g. CPT, CPI, NTL etc.)
Green Cities Development
• Develop financing mechanism to facilitate uptake of EVs in Lao PDR;
• Sustainable solid waste management action plan in Vientiane (with follow-up plan for bankable projects based on this);
Financing mechanism 3.4 Access to sustainable transport
Action plan to be followed up by concrete plan for bankable projects
3.3 Access to waste management
Planning, financing and budgeting for Green Growth
• Development of national MRV system for GHG measurement;
• Public expenditure review on climate change, guidelines for planning, budgeting, and expenditure tracking;
No direct causal links of the outputs to SOs
-

41 Annex III. Strategic Outcomes as a green growth planning, monitoring and communications tool for NDC and SDG implementationGGGI Strategic Outcomes Guideline
Annex III. Strategic Outcomes as a green growth planning, monitoring and communications tool for NDC and SDG implementationFigure A-3. Role of the SO framework in green growth planning, monitoring and implementation
SOs capture the essence of linked dimensions of green growth - people, planet, and the economy. Individually, SOs are effective in advocating for and communicating important aspects linked to NDCs and SDGs.
SOs provide the opportunity for a common NDC and SDG implementation monitoring framework across GGGI member and partner countries.
Data and analyses used to estimated SOs at project and program level would provide critical evidence for target-setting for key national SDGs where there is lack of sufficient evidence, such as around green jobs, air quality, and adaptation to climate change.
SOs are mapped to GGGI analytical tools and frameworks to provide a common
linking green growth framework
Impact assessment & communicaon
framework
CommonNDC/SDG
trackingframework
SOs guide planning and program alignment for SDG and NDC
implementation; GGGI's long-term strategy outlines SO targets.
StrategicOutcomes
Developevidence in
key SDGs
Strategicplanning
Commonframework
linking GGGItools

42Annex IV. Mapping of SOs and indicators to GGGI’s green growth analysis toolsGGGI Strategic Outcomes Guideline
Annex IV. Mapping of SOs and indicators to GGGI’s green growth analysis toolsTable A-1. Indicators in GGGI Green Growth Index and Green Growth Readiness Assessment with links to the SOs
Strategic Outcome Related indicators from GGGI Global Green Growth Index (GGI)
Related indicators from GGGI-AfDB Green Growth Readiness Assessment (GGRA)
SO1: Reduced GHG emission
• GE1: Ratio of CO2 emissions to population,
excluding AFOLU (Metric tons per capita)
• EE2: Share of renewable to total final energy consumption (Percent)
• Share of GHG emission in total global emissions (%)
• Production based CO2 productivity (GDP per
unit of energy-related CO2 emissions)
• CO2 emissions/GDP (kg per PPP $ of GDP)
• CO2 Emissions/Capita (metric tons per capita)
• Renewable electricity (% of total electricity generation)
• Renewable energy supply in % total primary energy supply (TPES)
SO2: Creation of green jobs
• GJ1: Share of green employment in total manufacturing employment (Percent)
• SE3: Share of youth not in education, employment or training, aged 15-24 years (Percent)
• Employment to population ratio (age 15-24) (%)
• Ratio of female to male labor force participation rate (%)
• Value added to agriculture (% of total value added)
SO3: Increased access to sustainable services (clean, affordable energy; improved sanitation; sustainable waste management; sustainable public transport
• AB2: Population with access to electricity and clean fuels/technology (Percent)
• AB1: Population with access to safely managed water and sanitation (Percent)
• SE2: Ratio of urban to rural, access to safely managed water/sanitation & electricity (Percent)
• EQ2: DALY rate due to unsafe water sources (DALY lost per 100,000 persons
• EQ3: Municipal solid waste (MSW) generation per capita (Ton per year per capita)
• Share of rural population with access to electricity (% population)
• Share of population with access to clean cooking solutions (% population)
• Access to safely managed sanitation facilities (% of population)
• Access to drinking water source (% of population)

43 Annex IV. Mapping of SOs and indicators to GGGI’s green growth analysis toolsGGGI Strategic Outcomes Guideline
Table A-1. Indicators in GGGI Green Growth Index and Green Growth Readiness Assessment with links to the SOs (cont.)
Strategic Outcome Related indicators from GGGI Global Green Growth Index (GGI)
Related indicators from GGGI-AfDB Green Growth Readiness Assessment (GGRA)
SO4: Improved air quality • EQ1: PM2.5 air pollution, mean annual population-weighted exposure (Micrograms per m3)
• Population-weighted mean annual exposure to PM2.5 (µg / m3)
SO5: Adequate supply of ecosystems rendered
• BE1: Average proportion of Key Biodiversity Areas covered by protected areas (Percent)
• BE2: Share of forest area to total land area (Percent)
• CV3: Share of terrestrial and marine protected areas to total territorial areas (Percent)
• ME2: Total material footprint (MF) per capita (MF tons per capita)
• BE3: Soil biodiversity, potential level of diversity living in soils (Index)
• CV1: Red list index (Index)
• CV2: Tourism and recreation in coastal and marine areas (Score)
• CV1: Red list index (Index)
• Total bio-capacity (gha per capita)
• Ecological deficit / reserve (gha per capita)
• Forest area as % of total land area
• Red list index score (global biodiversity)
SO6: Enhanced adaptation to climate change
• AB1: Population with access to safely managed water and sanitation (Percent)
• BE1: Average proportion of Key Biodiversity Areas covered by protected areas (Percent)
• BE2: Share of forest area to total land area (Percent)
• CV3: Share of terrestrial and marine protected areas to total territorial areas (Percent)
• ME1: Total domestic material consumption (DMC) per unit of GDP (DMC kg per GDP)
• SP3: Proportion of urban population living in slums (Percent)
• EW1: Water use efficiency (USD per m3)
• Adaptive capacity Index (ND-GAIN)
• Fatalities per 100 000 inhabitants (annual avg) from extreme weather events (Germanwatch)
• Losses per unit GDP (%) from extreme weather events (Germanwatch)
• Losses in million US$ (PPP) from extreme weather events (Germanwatch)
• Proportion of urban population in slums (% of population)

44Annex IV. Mapping of SOs and indicators to GGGI’s green growth analysis toolsGGGI Strategic Outcomes Guideline
Table A-2. Indicators in GGGI’s Green Growth Potential Assessment (GGPA) that correspond to the SOs
SO1:
Red
uced
G
HG
em
issio
n
SO2:
Cre
ation
of
gree
n jo
bs
SO3:
Incr
ease
d ac
cess
to
sust
aina
ble
serv
ices
(ene
rgy,
sa
nita
tion,
was
te
man
agem
ent,
publ
ic tr
ansp
ort)
SO4:
Impr
oved
ai
r qua
lity
SO5:
Ade
quat
e m
aint
enan
ce o
f na
tura
l cap
ital
SO6:
Enh
ance
d ad
apta
tion
to
clim
ate
chan
ge
Total Final Consumption by fuel and by sector
Share of population having attained upper secondary
Passenger and freight km by transport mode
- Change in above-ground biomass in forest per hectare
Adaptive capacity to climate change
Conversion efficiency of fossil-fired electricity generation
Share of population having attained a bachelor’s degree
% of Road Network Paved
Disability-adjusted life years (DALYs) due to ambient particulate matter pollution
Forest area annual net change rate
Climate Risk Index
CO2 emissions from
manufacturing industries and construction
Government expenditure on tertiary education per student
Compliance with Multilateral Environmental Agreements
Access to clean fuels and technologies for cooking
Fertilizers use per area of cropland
Damage from natural disasters
Carbon intensity Government expenditure per student
Passengers cars per 1,000 people
- Proportion of forest area with a long-term management plan
Disaster Risk Reduction
Energy intensity Unemployment rate Disability-adjusted life years (DALYs) due to unsafe water source
Population-weighted exposure to PM2.5
Change in forest cover
Electricity mix
Energy use per capita
Primary education completion rate
Occurrences of electrical outages
Mortality rate attributed to household and ambient air pollution
Forest area as a proportion of total land area
Exposure to climate change
Total CO2 emissions Government
expenditure on secondary education per student
Municipal solid waste generation intensity
Trends in Soil Health Index
Financial losses from relevant natural loss events
Energy intensity of the industry sector
Youth employment rate
- Population weighted annual mean levels of fine particulate matter in urban areas
Change in primary forest cover
Fossil fuel subsidies
Energy intensity of road transport
Proportion and number of children aged 5–17 years engaged in child labor
Proportion of population with access to electricity
Disability-adjusted life years (DALYs) due to ambient ozone pollution
Total primary forest cover
Notre Dame Global Adaptation Initiative (ND-Gain) Index

45
Table A-2. Indicators in GGGI’s Green Growth Potential Assessment (GGPA) that correspond to the SOs (cont.)
SO1:
Red
uced
G
HG
em
issio
n
SO2:
Cre
ation
of
gree
n jo
bs
SO3:
Incr
ease
d ac
cess
to
sust
aina
ble
serv
ices
(ene
rgy,
sa
nita
tion,
was
te
man
agem
ent,
publ
ic tr
ansp
ort)
SO4:
Impr
oved
ai
r qua
lity
SO5:
Ade
quat
e m
aint
enan
ce o
f na
tura
l cap
ital
SO6:
Enh
ance
d ad
apta
tion
to
clim
ate
chan
ge
CO2 emissions per
capitaGovernment expenditure on primary education per student
Road traffic death rate
Disability-adjusted life years (DALYs) due to household air pollution from solid fuels
Proportion of forest area within legally established protected areas
Proportion of local governments that adopt and implement local disaster risk reduction strategies in line with national disaster risk reduction strategies (%) (SDG 1.5.4)
Total Primary Energy Supply by fuel
Lower secondary education completion rate
Busses per 1,000 people
Mortality rate attributed to unsafe water, unsafe sanitation and lack of hygiene
Total forest cover Sensitivity to climate change
CO2 emissions from
transportGovernment expenditure on education
Recycling rate of municipal solid waste
Pesticides use per area of cropland
Share of exports of extractive industry in total export
CO2 emissions from
electricity and heat production
- Disability-adjusted life years (DALYs) due to unsafe sanitation
- Red List Index Share of extractive industry in total GDP
Electricity mix - Motorcycles per 1,000 people
- Proportion of forest area certified under an independently verified certification scheme (SDG 15.2.1)
Share of population made homeless by natural disasters
Change in carbon intensity
- Water Quality Index - Aquaculture
Change in CO2
emissions per capita
- Share of population with access to improved sanitation
- Captured fish
Change in CO2
emissions from manufacturing and construction
- Mortality rate attributed to unsafe water, unsafe sanitation and lack of hygiene
- Coverage of protected areas in relation to marine areas
-
CO2 emissions from
‘other’ sectors
- Percentage of population with access to improved drinking water
- Fish stocks -
Change in total CO2
emissions
- Proportion of population using safely managed sanitation services
- Proportion of important sites for terrestrial and freshwater biodiversity that are covered by protected areas (SDG 15.1.2)
-
Annex IV. Mapping of SOs and indicators to GGGI’s green growth analysis toolsGGGI Strategic Outcomes Guideline
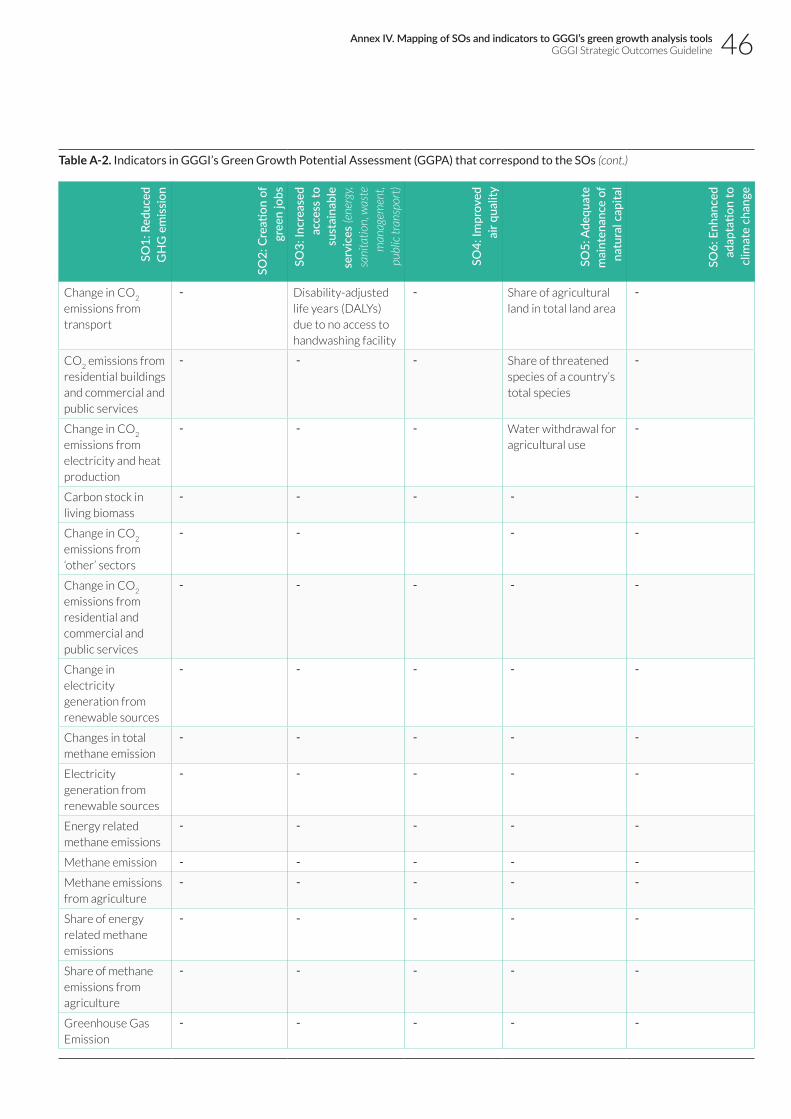
46
Table A-2. Indicators in GGGI’s Green Growth Potential Assessment (GGPA) that correspond to the SOs (cont.)SO
1: R
educ
ed
GH
G e
miss
ion
SO2:
Cre
ation
of
gree
n jo
bs
SO3:
Incr
ease
d ac
cess
to
sust
aina
ble
serv
ices
(ene
rgy,
sa
nita
tion,
was
te
man
agem
ent,
publ
ic tr
ansp
ort)
SO4:
Impr
oved
ai
r qua
lity
SO5:
Ade
quat
e m
aint
enan
ce o
f na
tura
l cap
ital
SO6:
Enh
ance
d ad
apta
tion
to
clim
ate
chan
ge
Change in CO2
emissions from transport
- Disability-adjusted life years (DALYs) due to no access to handwashing facility
- Share of agricultural land in total land area
-
CO2 emissions from
residential buildings and commercial and public services
- - - Share of threatened species of a country’s total species
-
Change in CO2
emissions from electricity and heat production
- - - Water withdrawal for agricultural use
-
Carbon stock in living biomass
- - - - -
Change in CO2
emissions from ‘other’ sectors
- - - -
Change in CO2
emissions from residential and commercial and public services
- - - - -
Change in electricity generation from renewable sources
- - - - -
Changes in total methane emission
- - - - -
Electricity generation from renewable sources
- - - - -
Energy related methane emissions
- - - - -
Methane emission - - - - -
Methane emissions from agriculture
- - - - -
Share of energy related methane emissions
- - - - -
Share of methane emissions from agriculture
- - - - -
Greenhouse Gas Emission
- - - - -
Annex IV. Mapping of SOs and indicators to GGGI’s green growth analysis toolsGGGI Strategic Outcomes Guideline
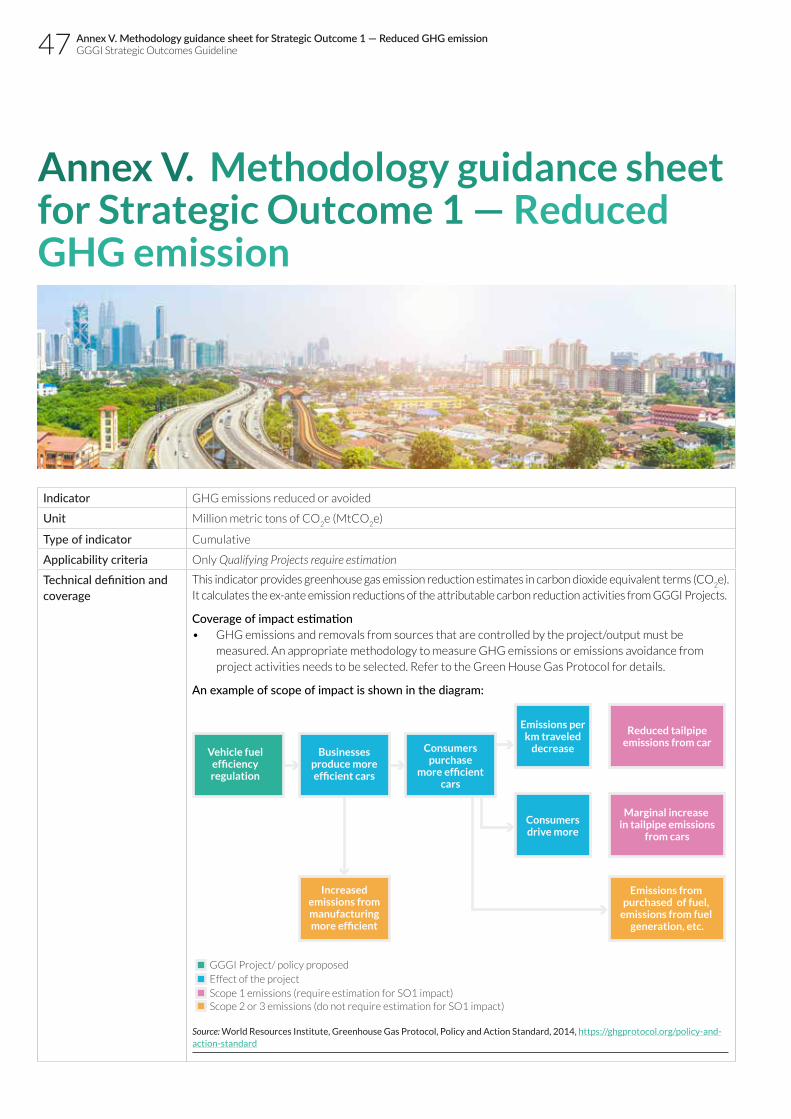
47 Annex V. Methodology guidance sheet for Strategic Outcome 1 — Reduced GHG emissionGGGI Strategic Outcomes Guideline
Annex V. Methodology guidance sheet for Strategic Outcome 1 — Reduced GHG emission
Indicator GHG emissions reduced or avoided
Unit Million metric tons of CO2e (MtCO
2e)
Type of indicator Cumulative
Applicability criteria Only Qualifying Projects require estimation
Technical definition and coverage
This indicator provides greenhouse gas emission reduction estimates in carbon dioxide equivalent terms (CO2e).
It calculates the ex-ante emission reductions of the attributable carbon reduction activities from GGGI Projects.
Coverage of impact estimation • GHG emissions and removals from sources that are controlled by the project/output must be
measured. An appropriate methodology to measure GHG emissions or emissions avoidance from project activities needs to be selected. Refer to the Green House Gas Protocol for details.
An example of scope of impact is shown in the diagram:
Source: World Resources Institute, Greenhouse Gas Protocol, Policy and Action Standard, 2014, https://ghgprotocol.org/policy-and-action-standard
Vehicle fuelefficiencyregulation
Businessesproduce moreefficient cars
Consumerspurchase
more efficientcars
Emissions perkm traveled
decrease
Reduced tailpipeemissions from car
Marginal increase in tailpipe emissions
from cars
Emissions from purchased of fuel,
emissions from fuel generation, etc.
Consumersdrive more
Increasedemissions frommanufacturingmore efficient
GGGI Project/ policy proposedEffect of the projectScope 1 emissions (require estimation for SO1 impact)Scope 2 or 3 emissions (do not require estimation for SO1 impact)
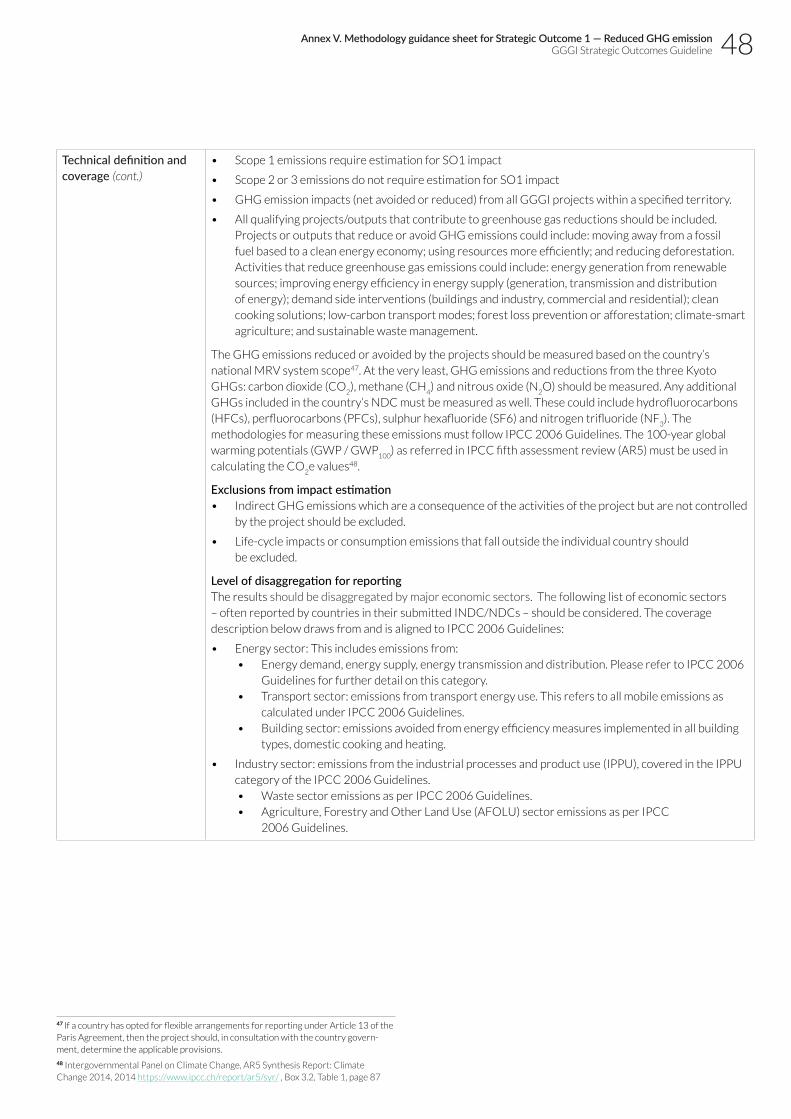
48Annex V. Methodology guidance sheet for Strategic Outcome 1 — Reduced GHG emissionGGGI Strategic Outcomes Guideline
Technical definition and coverage (cont.)
• Scope 1 emissions require estimation for SO1 impact
• Scope 2 or 3 emissions do not require estimation for SO1 impact
• GHG emission impacts (net avoided or reduced) from all GGGI projects within a specified territory.
• All qualifying projects/outputs that contribute to greenhouse gas reductions should be included. Projects or outputs that reduce or avoid GHG emissions could include: moving away from a fossil fuel based to a clean energy economy; using resources more efficiently; and reducing deforestation. Activities that reduce greenhouse gas emissions could include: energy generation from renewable sources; improving energy efficiency in energy supply (generation, transmission and distribution of energy); demand side interventions (buildings and industry, commercial and residential); clean cooking solutions; low-carbon transport modes; forest loss prevention or afforestation; climate-smart agriculture; and sustainable waste management.
The GHG emissions reduced or avoided by the projects should be measured based on the country’s national MRV system scope47. At the very least, GHG emissions and reductions from the three Kyoto GHGs: carbon dioxide (CO
2), methane (CH
4) and nitrous oxide (N
2O) should be measured. Any additional
GHGs included in the country’s NDC must be measured as well. These could include hydrofluorocarbons (HFCs), perfluorocarbons (PFCs), sulphur hexafluoride (SF6) and nitrogen trifluoride (NF
3). The
methodologies for measuring these emissions must follow IPCC 2006 Guidelines. The 100-year global warming potentials (GWP / GWP
100) as referred in IPCC fifth assessment review (AR5) must be used in
calculating the CO2e values48.
Exclusions from impact estimation • Indirect GHG emissions which are a consequence of the activities of the project but are not controlled
by the project should be excluded.
• Life-cycle impacts or consumption emissions that fall outside the individual country should be excluded.
Level of disaggregation for reporting The results should be disaggregated by major economic sectors. The following list of economic sectors – often reported by countries in their submitted INDC/NDCs – should be considered. The coverage description below draws from and is aligned to IPCC 2006 Guidelines:
• Energy sector: This includes emissions from: • Energy demand, energy supply, energy transmission and distribution. Please refer to IPCC 2006
Guidelines for further detail on this category.• Transport sector: emissions from transport energy use. This refers to all mobile emissions as
calculated under IPCC 2006 Guidelines. • Building sector: emissions avoided from energy efficiency measures implemented in all building
types, domestic cooking and heating.
• Industry sector: emissions from the industrial processes and product use (IPPU), covered in the IPPU category of the IPCC 2006 Guidelines.• Waste sector emissions as per IPCC 2006 Guidelines.• Agriculture, Forestry and Other Land Use (AFOLU) sector emissions as per IPCC
2006 Guidelines.
47 If a country has opted for flexible arrangements for reporting under Article 13 of the Paris Agreement, then the project should, in consultation with the country govern-ment, determine the applicable provisions.
48 Intergovernmental Panel on Climate Change, AR5 Synthesis Report: Climate Change 2014, 2014 https://www.ipcc.ch/report/ar5/syr/ , Box 3.2, Table 1, page 87

49
Technical definition and coverage (cont.)
Level of attribution (only applies to CPI and CPT)• The total emissions reduced from a project (limited to Scope 1 emission as described above) will be
attributed to GGGI, regardless of whether or not it is the leading institution or primary financer of the project.
Timescale of GHG estimation• This SO indicator measures the expected (ex-ante) GHG emissions reduced or avoided for the full
lifetime of the project.
Type of Indicator• Annual – This indicator measures the annual ex-ante estimates for the GHG emissions reduced or
avoided from the project each calendar year in tons of CO2 equivalent (tCO
2e).
• Cumulative – total impact over the complete timeframe of projects/outputs (applies to CPI and CPT). This is not GGGI project duration, but lifetime of the project GGGI is initiating/implementing (e.g. lifetime of a bankable project).
Methodology for calculation Country Program Impact (CPI)
This indicator provides ex-ante attributable impact estimates of SO1 impact for relevant projects/outputs in a country program.
The ex‑ante estimates are calculated using standardized methodologies following the International Financial Institution (IFI) Framework for a Harmonized Approach to Greenhouse Gas Accounting of the UNFCCC.
During project implementation, ex-post GHG emissions avoidance and removals will be monitored.
For each project, the following scenarios will be established:1. Baseline scenario (X): The baseline or business-as-usual scenario will describe the existing conditions,
without implementation of the proposed project. This baseline enables the estimation of GHG emissions compared to a case where there is no project activity. For example, this may include business-as-usual GHG emissions from use of fossil-fuels, or methane emissions from landfills, or reduced capacity to absorb the GHG emissions from forests.
2. Project scenario (Z): In this scenario, the project and its interventions will be established, indicating how the proposed activities will reduce or avoid GHG emissions. For example, a biomass-based power project may avoid the use of fossil fuels, or an improved energy-efficiency measure may reduce their usage, thereby avoiding GHG emissions; or a reforestation project may increase the absorptive capacity to capture and store GHGs.
Refer to the following tools and guidelines for estimation in the respective sectors:1. Renewable energy and energy efficiency projects: Guidelines for Estimating Greenhouse Gas Emissions
of Asian Development Bank Projects – Additional Guidance for Clean Energy Projects, https://www.adb.org/sites/default/files/institutional-document/296466/guidelines-estimating-ghg.pdf
2. Transport projects: Guidelines for Estimating Greenhouse Gas Emissions of Asian Development Bank Projects – Additional Guidance for Transport Projects, https://www.adb.org/sites/default/files/institutional-document/219791/guidelines-estimating-ghg-emissions-transport.pdf
3. Solid waste management projects: Institute for Global Environmental Strategies GHG calculator for solid waste, https://iges.or.jp/en/pub/ghg-calculator-solid-waste-ver-ii-2013
4. AFOLU projects: Food and Agriculture Organization carbon balance tool for AFOLU projects, http://www.fao.org/tc/exact/carbon-balance-tool-ex-act/en/
This methodology follows a scenario approach to estimate CPI by following the below steps: A.) Estimate emissions under a baseline scenario 1. Demarcate the GHG emissions reduction boundary considering significant impact areas and
identify the GHG sources/sinks within the boundary.
2. Define the baseline scenario that represents conditions most likely to occur in the absence of the project/output, within the assessment boundary. This should be for the sources and sink categories and reporting categories outlined.
3. Estimate baseline emissions and removals over the assessment period for each source/sink category and greenhouse gas included in the GHG assessment boundary. Assessment period is the specified lifetime for the project/output.
4. Apply global warming potential (GWP) values provided by the IPCC based on a 100-year time horizon to convert all gases to CO
2e.
Annex V. Methodology guidance sheet for Strategic Outcome 1 — Reduced GHG emissionGGGI Strategic Outcomes Guideline

50
Methodology for calculation Country Program Impact (CPI) (cont.)
B.) Estimate ex‑ante emissions in the scenario where the GGGI project/output is delivered 1. Define the scenario that represents the conditions most likely to occur in the presence of a
project for each source or sink category included in the GHG baseline scenario
2. Estimate new scenario emissions for each source or sink category
General Equation for GHG emissions avoided or reduced: Net change in GHG emissions = X — Z
Where:X = Baseline emissions scenario (to be determined by individual project or output cases)Z = Ex‑ante GHG emissions scenario (a scenario where a qualifying GGGI project is implemented)
Example – Renewable Energy in the Industrial Sector
GGGI is working on implementing solar PV in an industrial park in Ethiopia. The following details about the program are known.
Baseline scenario• The project’s industrial park currently depends on hydro-powered electricity; however, only 9MW
is supplied to the park due to an electricity shortage from the national grid. (A load factor of 35.6% is assumed).
• Fossil-fuel-powered generators, or power plants, are used to support the project’s industrial park which has about 33MW demand at full operation. (A load factor of 95% is assumed, an efficiency of 50% of the power plant is assumed, assuming it works with natural gas).
In this baseline scenario, the GHG emissions targeted are CO2 emissions emanating from the use of fossil
fuel in the generators and the CO2e emissions connected to the consumption of grid electricity.
Baseline Emissions – Grid electricityGHG Baseline Emissions = EC × Eelec /(1 – %L)
Where:EC = Electricity consumption, MWh/yearE
elec = Electricity emission factor, tCO
2/MWh; if electricity is from the grid, this refers to the grid
emission factor%L = Transmission and distribution losses, expressed as decimal equivalent (i.e. 10% loss assumed for this example is expressed as 0.1)
Baseline electricity generation from grid9MW × 8,760hrs/yr × 35.6% = 28,067.04 MWh/yr
Grid Emission factor for Ethiopia: 0.061 tCO2/MWh
Recommended Emission Factors are available in the IFI Interim dataset of HarmonizedGrid Factors: http://greeninvestmentgroup.com/media/185865/ifi_interim_dataset_of_harmonized_grid_factors_v1-0-with-cover.xlsx
Baseline emissions from grid28,067MWh/yr × 0.061 tCO
2/MWh ÷(1 – 0.1) = 1,712.09/0.9 tCO
2/yr = 1,902.22 tCO
2/yr
Baseline Emissions – Fossil‑Fuel Power Generators (Power Plant)If electricity is from a specific source, or identified power plant, the following equation must be used.
Eelec
= (Efuel
÷ n) × 3.6Where:E
elec = Electricity emission factor (for specific power plant or technology), tCO
2/GWh
Efuel
= Emission factor of fuel used in power plant, tCO2/TJ
n = thermal efficiency of power plantsConversion factor: 3.6 TJ/GWh
Baseline electricity generation from power plant33MW × 8,760hrs/yr × 85% = 245,718 MWh/yr
Emission factor for natural gas: 56.1 kgCO2e/GJ = 0.0561 tCO
2e/GJ
Recommended Emission Factors are available in the IFI Interim dataset of Harmonized Grid Factors: http://greeninvestmentgroup.com/media/185865/ifi_interim_dataset_of_harmonized_ grid_factors_v1-0-with-cover.xlsx
Annex V. Methodology guidance sheet for Strategic Outcome 1 — Reduced GHG emissionGGGI Strategic Outcomes Guideline

51
Methodology for calculation Country Program Impact (CPI) (cont.)
Example – Renewable Energy in the Industrial Sector (cont.)
Fuel consumption of power plant(245,718 MWh/yr ÷ 35%) × 3.6 GJ/MWh = 2,527,385.14 GJ/yr
Baseline emissions from power plant2,527,385.14 GJ/yr × 0.0561 tCO
2/GJ = 141,786.31 tCO
2e/ yr
Total baseline emissions: 1,902.22 tCO2e/yr +141,786.31 tCO
2e/ yr = 143,688.53 tCO
2e/yr
Project scenario• The project focuses on replacing the 30MW power generator with solar PV.• Emissions from solar PV system construction are not considered.
Project emissions ‑ PV
It is assumed that a solar PV system will replace the existing fossil fuel power generator.It is assumed that PV capacity has to be at least 0.1 GW.
Electricity generation from solar PV capacity factors per region = 17% (average 2008 - 2012 (International Energy Agency)
100 MW × 8,760hrs/yr × 17% = 148,920 MWh/yrEmissions from solar PV: 148, 920 MWh/yr × 0 tCO
2e/MWh = 0 (Assumes the system is not connected into
the grid)
Electricity generation from the generator =245,718 - 148,920 = 96,798 MWh/yrFuel consumption of power plant= (96, 798MWh/yr ÷ 35%) × 3.6 GJ/MWh = 995,636.57 GJ/yrBaseline emissions from power plant =2,527,385.14 GJ/yr × 0.0561 tCO /GJ = 55,855.21 tCO
2e/ yr
Project emissions ‑ Grid
The project will continue to be connected to the grid and draw 9MW of power.Therefore, the emissions associated with the grid will occur in the project scenario aswell, and hence they are accounted for in this case as well.
Electricity generation from grid9MW X 8,760hrs/yr × 35.6% = 28,067.04 MWh/yr
Emissions from grid28,067.04 MWh/yr × 0.061 tCO
2/MWh ÷(1 – 0.1) = 1,902.22 tCO
2e/yr
Project Emissions: 1,902.22.09 tCO2/yr + 55,855.21 tCO
2e/ yr = 57,757.53 tCO
2e/yr
Net change in GHG emissions = 143,688.53 tCO2e/yr - 57, 757.53 tCO
2e/yr = 85,930.99 tCO
2e/yr
The lifetime of the project is 25 years. Thus CPI = 85,930.99tCO2/yr × 25 yr = 2,148,274.96.75 tCO
2e
Example – Energy Efficiency in the Building Sector
GGGI is working on implementing energy efficiency measures in Mongolian residential buildings.
It is assumed that the program will replace 3,200 Coal-fire Heat-Only Boilers (HOB) in residential buildings with boilers using a blend of renewable and non-renewable sources (for example, heat pumps and electric boilers). It is assumed that a coal fire boiler needs 20 tons of coal per year. It is assumed that an electric boiler generates 3,928 kWh/year.
Baseline scenarioIn the absence of the proposed project intervention, the residential buildings will continue to use coal-fired HOBs. The emissions targeted are CO
2e emissions from fossil fuels (coke) used in the HOBs.
Baseline emissionsFuel-consuming equipment/ boilers:
BEf = FCb × NCV × EFfuel
BEf = Baseline emissions for fuel-consuming equipment, tCO
2e/year
FCb= Annual fuel consumption before project implementation, tons/year or liters/year; if there is more than
one piece of equipment, then FCb is the total consumption of all concerned fuel consuming equipment.
Annex V. Methodology guidance sheet for Strategic Outcome 1 — Reduced GHG emissionGGGI Strategic Outcomes Guideline
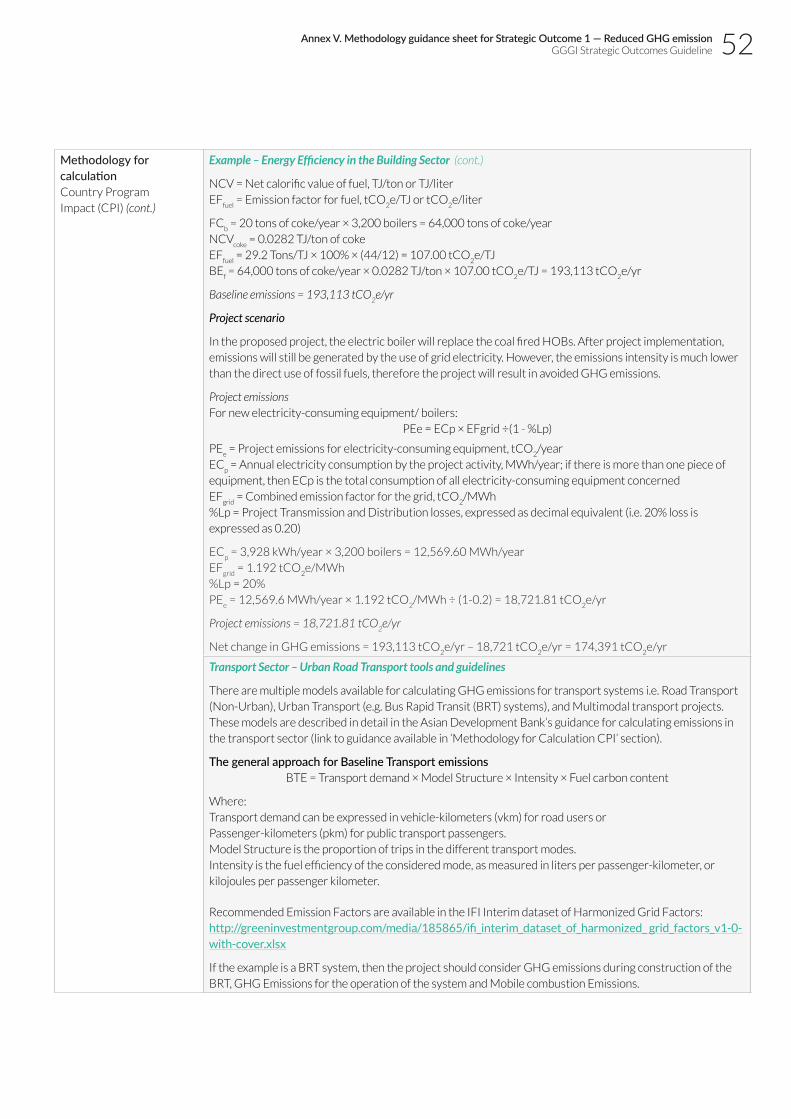
52
Methodology for calculation Country Program Impact (CPI) (cont.)
Example – Energy Efficiency in the Building Sector (cont.)
NCV = Net calorific value of fuel, TJ/ton or TJ/literEF
fuel = Emission factor for fuel, tCO
2e/TJ or tCO
2e/liter
FCb = 20 tons of coke/year × 3,200 boilers = 64,000 tons of coke/year
NCVcoke
= 0.0282 TJ/ton of cokeEF
fuel = 29.2 Tons/TJ × 100% × (44/12) = 107.00 tCO
2e/TJ
BEf = 64,000 tons of coke/year × 0.0282 TJ/ton × 107.00 tCO
2e/TJ = 193,113 tCO
2e/yr
Baseline emissions = 193,113 tCO2e/yr
Project scenario
In the proposed project, the electric boiler will replace the coal fired HOBs. After project implementation, emissions will still be generated by the use of grid electricity. However, the emissions intensity is much lower than the direct use of fossil fuels, therefore the project will result in avoided GHG emissions.
Project emissionsFor new electricity-consuming equipment/ boilers:
PEe = ECp × EFgrid ÷(1 - %Lp)
PEe = Project emissions for electricity-consuming equipment, tCO
2/year
ECp = Annual electricity consumption by the project activity, MWh/year; if there is more than one piece of
equipment, then ECp is the total consumption of all electricity-consuming equipment concernedEF
grid = Combined emission factor for the grid, tCO
2/MWh
%Lp = Project Transmission and Distribution losses, expressed as decimal equivalent (i.e. 20% loss is expressed as 0.20)
ECp = 3,928 kWh/year × 3,200 boilers = 12,569.60 MWh/year
EFgrid
= 1.192 tCO2e/MWh
%Lp = 20%PE
e = 12,569.6 MWh/year × 1.192 tCO
2/MWh ÷ (1-0.2) = 18,721.81 tCO
2e/yr
Project emissions = 18,721.81 tCO2e/yr
Net change in GHG emissions = 193,113 tCO2e/yr – 18,721 tCO
2e/yr = 174,391 tCO
2e/yr
Transport Sector – Urban Road Transport tools and guidelines
There are multiple models available for calculating GHG emissions for transport systems i.e. Road Transport (Non-Urban), Urban Transport (e.g. Bus Rapid Transit (BRT) systems), and Multimodal transport projects. These models are described in detail in the Asian Development Bank’s guidance for calculating emissions in the transport sector (link to guidance available in ‘Methodology for Calculation CPI’ section).
The general approach for Baseline Transport emissionsBTE = Transport demand × Model Structure × Intensity × Fuel carbon content
Where:Transport demand can be expressed in vehicle-kilometers (vkm) for road users orPassenger-kilometers (pkm) for public transport passengers.Model Structure is the proportion of trips in the different transport modes.Intensity is the fuel efficiency of the considered mode, as measured in liters per passenger-kilometer, or kilojoules per passenger kilometer.
Recommended Emission Factors are available in the IFI Interim dataset of Harmonized Grid Factors:http://greeninvestmentgroup.com/media/185865/ifi_interim_dataset_of_harmonized_ grid_factors_v1-0-with-cover.xlsx
If the example is a BRT system, then the project should consider GHG emissions during construction of the BRT, GHG Emissions for the operation of the system and Mobile combustion Emissions.
Annex V. Methodology guidance sheet for Strategic Outcome 1 — Reduced GHG emissionGGGI Strategic Outcomes Guideline

53
Methodology for calculation Country Program Target (CPT)
This indicator provides the ex-ante attributable impact in a country program if the SO1-relevant projects/ outputs outlined in CPI are scaled up by GGGI (at national/ regional level). It will measure the impacts achievable within the period to 2030.
When calculating the CPT, it is necessary to minimize the potential for double counting emissions from other projects or programs in the same region or country and with the same or similar objectives.
GHG reductions from overlapping policies and projects should not be aggregated to determine total emissions or reductions in a given region or country.
This is because when multiple policies/ projects interact, the combined effect of implementing the policies together might be less than the sum of the individual effects of implementing them separately.
Type of relationships that could exist between projects:49
• Independent – Projects independent from each other. The combined effect of the projects is equal to the sum of their individual effects.
• Overlapping - Projects that have the same or complementary goals (For example, national and subnational energy efficiency standards), and counteracting projects (For example, fuel taxes and fuel subsidies). The combined effect of the projects is less than the sum of their individual effects when implemented separately.
• Reinforcing – Interacting projects. The combined effect of the projects is greater than the sum of their individual effects when implementing them separately.
• Overlapping and reinforcing – Projects with overlapping and reinforcing interactions. The combined effect of the projects, when implemented together, may be greater than or less than the sum of the individual effects of implementing them separately.
Example - possible areas of double-counting
If an energy efficiency program in a certain country implements 1) a subsidy program for home insulation and 2) an information campaign to educate residents on the financial benefits of installing insulation. Both policies are intended to reduce household energy use and emissions. Thus, they would only be independent if one set of households responds to the subsidy, while a separate set of households responds to the information campaign. Otherwise, these projects will overlap if some households would install insulation in either scenario (if either the subsidy were in place or if the information campaign were in place). As a consequence, GHG emissions reduction cannot be added individually. These projects might also be reinforcing if some households would only install insulation if both the subsidy and the information campaign were implemented.
Example – Renewable Energy / Industry Sector
GGGI will roll out a program for solar PV in all industrial parks of Ethiopia (i.e. it will scale up the project example described above). It is assumed that there is no other GGGI project working on renewable energy incentives for the industrial sector.
It is known that the industrial sector will be the highest contributor GHG emissions growth, increasing from 4 MtCO
2e in 2010 to 71 MtCO
2e in 2030. It is assumed that the 6 new industrial parks will be built with
GGGI’s support. It is assumed that each industrial park will consume 500MW of energy. (To simplify this example, it is assumed that 40% of the required energy will come from the grid and 60% will come from power plants).
Baseline EmissionsGHG Baseline Emissions = EC × E
elec ÷(1 – %L)
Where: EC = electricity consumption, MWh/year E
elec = electricity emission factor, tCO
2/MWh: if electricity is from the grid, this refers to the grid emission
factor; if electricity is from specific, identified power plant, the below equation should be used.%L = T&D losses expressed as decimal equivalent (i.e. 20% loss is expressed as 0.20)
49 World Resources Institute, Greenhouse Gas Protocol, Policy and Action Standard, 2014, https://ghgprotocol.org/policy-and-action-standard
Annex V. Methodology guidance sheet for Strategic Outcome 1 — Reduced GHG emissionGGGI Strategic Outcomes Guideline

54
Methodology for calculation Country Program Target (CPT) (cont.)
Eelec
= (Efuel
÷n) × 3.6Where:E
elec = electricity emission factor (for specific power plant/technology), tCO
2/GWh
Efuel
= emission factor of fuel used in power plant, tCO2/TJ
n = thermal efficiency of power plants Conversion factor: 3.6 TJ/GWh
Baseline electricity generation from grid: 500MW × 0.40 × 8,760hrs/yr × 35.6% = 623,712 MWh/yrBaseline electricity generation from power plant: 500MW × 0.60 × 8,760hrs/yr × 85% = 2,233,800 MWh/yrEmission factor for natural gas: 56.1 kgCO
2/GJ = 0.0561 tCO2/GJ
Grid Emission factor for Ethiopia: 0.061 tCO2/MWh
Fuel consumption of power plant: (2,233,800 MWh/yr ÷ 35%) × 3.6 GJ/MWh = 22,976,228.57 GJ/yrBaseline emissions from grid: 623,712 MWh/yr × 0.061 tCO
2/MWh = 38,046 tCO
2/yr
Baseline emissions from power plant: 22,976,228.57 GJ/yr × 0.0561 tCO2/GJ= 1,288,966.42 tCO
2/ yr
Baseline Emissions per industrial park: 38,046tCO2/yr +1,288,966.42 tCO2/ yr = 1,327,012 tCO2/yrTOTAL BASELINE EMISSIONS: 1,327,012 tCO2/yr × 6 industrial parks= 7,962,072 tCO2/yr
Ex-ante Emissions
It is assumed that a solar PV system will replace the existing fossil fuel power generators. Thus, the PV capacity to be installed is at least 0.91GW in order to generate the same electricity as a 300MW fossil- fuel power plant. (This example will not consider back-up energy sources from fossil fuel).
Electricity generation from solar PV: 2,233,800 MWh/yrElectricity generation from grid: 623,712 MWh/yrEmissions from grid: 38,046 tCO
2/yr
Emissions from solar PV: 2,233,800 MWh/yr × 0 tCO2/MWh = 0 (assumes the system is not connected into
the grid)Ex‑ante emissions per industrial park: 38,046 tCO
2/yr
Total EX-ante emissions: 38,046 tCO2/yr × 6 industrial parks = 228, 276 tCO
2/yr
Net change in GHG emissions = 7,962,072 tCO2/yr - 228, 276 tCO
2/yr = 7,733,796 tCO
2/ yr
The lifetime of the project is 25 years. Thus CPT = 7,733,796 tCO2/yr × 25 years 193 Million tCO
2
Methodology for calculation National Target Level (NTL)
This indicator measures the level at which GGGI activities could contribute to the pledge national target in the target year. Thus, it measures the GHG emissions reduction in the target year below a specific reference level, and it is not a cumulative estimate of GHG emissions over a number of years.
NTL = X — Z
Where X = Baseline emissions in the target yearZ= Emission in the GHG reduction scenario
Baseline emission is the emission in a business-as-usual (BAU) or reference scenario as outlined in a country’s NDC.
Target year is the year 2030.
Most countries’ NDCs outline emission reduction targets in below-BAU terms in a future year. Where reduction targets are not available in such form (e.g. rather in cumulative form), reasonable approximations should be made to translate to reductions in year 2030. If reduction targets are available for a year other than 2030, an approximation should be made for year 2030.
Annex V. Methodology guidance sheet for Strategic Outcome 1 — Reduced GHG emissionGGGI Strategic Outcomes Guideline

55
Methodology for calculation National Target Level (NTL) (cont.)
Example
Mexico has pledged to reduce its emissions by 623 MtCO2e. by 2030 (Conditional goal). Under the current
policy scenario (BAU) Mexico would produce 868 MtCO2e. by 2030. Thus, GGGI activities will contribute to
the required emissions reduction of 246 MtCO2e.
Sources of Data and Data availability
For CPI and CPT:Relevant tools and guidelines for calculating avoided or reduced GHG emissions are indicated in ‘Methodology for Calculation CPI’ section.
For NTL:• INDCs/ NDCs, National Communications, Biennial Update Reports• National GHG emissions inventories
Reporting Period and Estimation Scope
• The reporting period is the specified period within the WPB.• Reporting is required for each project, at the country program level.• For CPI and CPT: Qualifying outputs in the current WPB. If an output is an extension of a project/ output
from previous WPB cycle, reporting is required for the scope extension. Continuing projects/outputs from previous WPB cycle with no change in scope do not require reporting.
1,000
800
600
400
200
0
MtC
O2e
Emissions 2016(Baseline)
658.12
BAUby 2030
868.84
GGGI NTL
-245.84
Conditional Scenario2030
623
Mexico
Annex V. Methodology guidance sheet for Strategic Outcome 1 — Reduced GHG emissionGGGI Strategic Outcomes Guideline

56
Annex VI. Methodology guidance sheet for Strategic Outcome 2 — Creation of green jobs
Indicator Number of direct green jobs created
Unit Full Time Equivalent (FTE) job-years
Technical definition, coverage and categories of reporting
This indicator captures the ex‑ante estimates of the direct number of green jobs created as a result of green growth activities and interventions.
Here, jobs and employment are used interchangeably.
Depending on the estimation methodology and estimation needs, the number of green jobs created refers to either of the following:• Estimate of direct employment from green growth activities and interventions in certain sectors• Estimate of net employment gains at economy-wide level from a pathway with green growth
interventions compared to a baseline conventional growth pathway
The methodology section describes the relevant methodologies.
Coverage Direct employment: This refers to gross direct employment in environment-related sectors as outlined by the International Labour Organization (ILO)50. Only when feasible and available, estimates of indirect employment and induced employment should be included as well. In most cases, indirect and induced employment created could be many times greater than direct employment created.
Net employment gains: Such estimates should be at economy-wide level or covering major economic sectors. The estimate should be for a defined green growth pathway when compared to a baseline conventional growth pathway. All additional jobs created as a result of the green growth pathway are considered green jobs.
Green jobs included in estimates are required to meet the criteria for decent jobs. However, in developing countries with a large informal economy and a lack of relevant data, an assessment against decent jobs criteria can be challenging. Where such estimates are not possible due to methodological and data limitations, this should be clearly stated in the reporting of this outcome.
All jobs involved in economic activities that are more environmentally friendly compared to conventional alternatives are included, regardless of the level of environment-friendliness of the concerned activities. As such, new or additional jobs created from greening (for example, the creation of a recycling business in informal settlements), greening of existing jobs (for example, moving from coal mining to renewable energy), as well as jobs involved in improving the environmental performance of production or consumption processes in firms and entities (for example, improving energy efficiency of an industry) are included.
50 Andrew Jarvis, Adarsh Varma and Justin Ram, Assessing green jobs potential in developing countries: A practitioner’s guide (International Labour Organization, 2011), https://www.ilo.org/global/publications/books/WCMS_153458/lang--en/index.htm.
Annex VI. Methodology guidance sheet for Strategic Outcome 2 — Creation of green jobsGGGI Strategic Outcomes Guideline

57 Annex VI. Methodology guidance sheet for Strategic Outcome 2 — Creation of green jobsGGGI Strategic Outcomes Guideline
Technical definition, coverage and categories of reporting (cont.)
Only projects/outputs with a direct causal relationship to creating green jobs, and a contribution deemed significant to SO2 are required to be considered for estimation (refer to the guidance on qualifying outputs/projects for target-setting in Annex II).
DefinitionsFull time equivalent (FTE) is an employee’s scheduled hours divided by employees hours for a full-time workweek. If an employee works 20 hours where work-week is defined as 35 hours, FTE would be 20/35=0.57.
An FTE jobs-year is full-time employment for one person during one year. Where country specific work hours is not known for estimating FTE, a standard 2,080 hour of employment/year can be assumed.
Green jobs refer to the employment created from green growth interventions and include employment in the environmental services and goods (ESG) industry.
The decent jobs criteria are based on the ILO’s basic conventions defining socially responsible production. For example, waste management jobs that don’t guarantee a decent wage and involves unhygienic and dangerous conditions hazardous to health of the workers are not considered decent jobs. Decent working conditions depend on the following factors (depending on data availability): (a) an adequate monthly wage; (b) work stability and security; (c) occupational hazard level involved; (c) decent working hours; and (d) availability of social protection schemes (for example, social security). Work that uses child labour and bonded labour do not qualify as decent work.
The environmental services and goods (ESG) industry refers to the industries that produce services and goods to measure, prevent, limit, minimize or correct environmental damage to water, air and soil, and problems related to waste, noise and eco-systems. This includes technologies, products and services that reduce environmental risk and minimize pollution and resource consumption51.
Green growth activities and interventions are economic growth activities and opportunities that are low-carbon and climate resilient, prevent or remediate pollution, minimize use of raw materials and natural resources, maintain healthy and productive ecosystems, and reduce poverty and enhance social inclusion52. Example sectoral areas that have large green employment creation potential include the following:
• Renewable electric and clean cooking solutions;• Sustainable forestry activities: tree plantation, forest certification, national voluntary certifications;• Sustainable agriculture: organic agriculture, bee-keeping, climate-smart agricultural practices;• Sustainable construction: clean water access, improved sanitation access, waste-water treatment, green
building design and construction, renewable energy infrastructure, public transportation access;• Waste management: waste processing, recycling and reuse of waste; and• Sustainable tourism: ecotourism, certified hotels
Level of disaggregation of reporting categories • Net employment or gross direct employment (required)• Indirect and induced employment (optional)• Total of direct, indirect, and induced green jobs (optional)• Share of female employed in reported estimates (required)
Level of attribution • Green jobs from a project or output should be attributed to GGGI, regardless of whether it is the
leading institution or a primary financer of the project or output.
Type of Indicator• Cumulative – total impact over the complete timeframe of projects/outputs (applies to CPI and CPT).
This is not GGGI project duration, but lifetime of the project GGGI is initiating/implementing (e.g. lifetime of a bankable project).
51 OECD/Eurostat, The Environmental Goods and Services Industry: Manual for Data Collection and Analysis, (Paris: OECD Publishing, 1999), https://doi.org/10.1787/9789264173651-en.52 GGGI, Refreshed Strategic Plan 2015-20, 2017, http://gggi.org/site/assets/uplo-ads/2017/11/GGGI-Refreshed-Strategic-Plan-2015-2020.pdf.

58Annex VI. Methodology guidance sheet for Strategic Outcome 2 — Creation of green jobsGGGI Strategic Outcomes Guideline
Methodology for calculation Country Program Impact (CPI)
This indicator measures the ex-ante attributable impact of projects / outputs in a country program.
Method 1: Employment factor approach (for gross employment estimation)
This approach is suggested where gross direct employment generation from projects/outputs in environment-related sectors is required (e.g. direct employment created in the renewable energy sector). This approach requires delineating the boundaries of sector and defining the scope of the green jobs. This approach cannot account for inter-sectoral feedbacks and dependencies.
Gross jobs from projects/outputs in the country program = Σ in Ji x Ai
Where,Ai is total amount of jobs creation activity during the lifetime of the project/output i (e.g. GW solar PV projects installed and operating)Ji is the gross jobs per unit of activity by the project/output i (e.g. jobs per GWh of solar power generated) n is the number of projects relevant to SO2 in the country program to which Method 1 is applied.
Employment factors specific to the sector and the country should be applied where available. In the absence of country specific employment factors, employment factors available from comparable economies or global studies can be used, however the source and rationale for the employment factors used should be clearly stated in the reporting template. Where a range is available, the average of the range should be used. GGGI country assessments on green jobs should be consulted and cited where available.
Refer to the following sources for employment factors in various sectors:
1. Renewable energy employment factors, refer to Table 1 – OECD Average Employment factors in the 2015 methodology for calculating energy sector jobs from the Institute for Sustainable Futures, University of Technology Sydney, https://opus.lib.uts.edu.au/handle/10453/43718. Table 2 ‑ Regional Multipliers to be applied to employment factors can be used to calculate region-specific employment factors.
2. Energy efficiency employment factor of 0.29 jobs/GWH can be used, from a 2009 Institute for Sustainable Futures, University of Technology Sydney report, Energy sector jobs to 2030: a global analysis, https://docplayer.net/13805775-Energy-sector-jobs-to-2030-a-global-analysis.html
3. Public transport employment factors:
• A factor of 30 jobs are created for each $1.4 million invested in public transport infrastructure, and 57 jobs for the same level of investment on the transit operations side, according to the Millennium Institute ITUC green jobs assessments research project - Methodology Overview, April 2012, https://www.ituc-csi.org/IMG/pdf/methodology_report_mi_apr2012.pdf
• A factor of 21,800 jobs per year per $1 Billion USD of annual spending on public transport is put forward by the American Public Transportation Association, Economic Impact of Public Transportation Investment 2014 Update, 2014, https://www.apta.com/wp-content/uploads/Resources/resources/reportsandpublications/Documents/Economic-Impact-Public-Transportation-Investment-APTA.pdf
4. Waste management employment factors are available in Table 5 – Job Production Estimates by Management Activity from the Tellus Institute with Sound Resource Management, More Jobs, Less Pollution: Growing the Recycling Economy in the U.S., 2008, https://www.nrdc.org/sites/default/files/glo_11111401a.pdf53
5. Water infrastructure employment factor – The Value of Water Campaign’s 2017 study on The Economic Benefits of Investing in Water Infrastructure finds that investing $ 1 Million USD in Water Infrastructure will generate 6.1 direct jobs, 9.4 indirect and induced jobs in the U.S. (refer to Figure 7) TheValueofWater.org/resources
6. Forestry employment factors can be found in the table in the 2009 report from the Food and Agriculture Organization (FAO), http://www.fao.org/3/i1025e/i1025e02.htm#table
53 In addition, the U.S. Environmental Protection Agency provides employment factors 10,000 tonnes of waste: 1 job can be created if incinerated, 6 jobs if landfilled, 36 jobs if recycled, and up to 296 if refurbished and re-used. U.S. Environmental Protection Agency, Resource Conservation Challenge: Campaigning Against Waste, September 2002, https://nepis.epa.gov/Exe/ZyPURL.cgi?Dockey=10000KXG.txt

59
Methodology for calculation Country Program Impact (CPI) (cont.)
Only use the range of sector-specific employment factors when appropriate country specific employment factors are not available for the country for which the estimations are made.
Method 2: Input-Output (and social accounting matrix) approach
This method is suitable for an ex-ante impact estimation of a project or output that targets an entire sector (for example, employment created from greening of the energy sector) or a number of environment-related sectors. It is suitable for macro-economic impact estimation of a green growth strategy or an action plan involving a number of environment-related sectors. This method can additionally estimate the indirect and induced effects of greening of employment.
The method requires delineating the boundaries of the sector and defining the scope of estimation of green jobs created. The availability or construction of a recent national Input-Output table or social accounting matrix, depicting the production and consumption flows of the economy, is a pre-requisite for this assessment.
A social accounting matrix is an extension of the Input-Output method and includes the complete circular flow of income in the economy, thereby providing capacity to assess impacts on different income groups.
This method requires delineating boundaries for green jobs, which jobs are considered green and which are not, and can also estimate indirect and induced green employment in different sectors.
Refer to the 2011 ILO practitioner’s guide54 for detailed steps for carrying out an IO-based assessment in developing countries.
Method 3: Macro‑economic modelling approach
This approach is employed when an ex-ante macro-economic impact estimation of a green growth strategy or an action plan consisting of set of policies or intervention is required.
Computable general equilibrium (CGE) or systems dynamics model can be used to make macro-economic impact estimations. These models are time-consuming to build, and are data-intensive and complex, requiring specialized expertise.
This approach generally produces impact estimates in terms of net employment and doesn’t require defining boundaries of green jobs. The specific green growth pathway does need to be defined.
Net employment gain = (A ‑ B)i
Where:A = cumulative number of jobs created in a green growth pathway by future year i (e.g. year 2030)B = cumulative number of jobs created in a baseline conventional growth pathway by future year i
Example of direct jobs creation for Ethiopia using Method 1
Example in renewable energy for productive uses
GGGI is working on implementing solar PV in an industrial park in Ethiopia. The following details about the program are known.
Baseline scenario• The project’s industrial park currently depends on hydro-powered electricity; however, only 9MW is
supplied to the park due to electricity shortage from the national grid. • Fossil-fuel-powered generators are used to support the project’s industrial park which has about 33MW
demand at full operation.• The project focuses on replacing the 30 MW power generator with solar PV. • It is assumed that the construction of the system will take 1 year
54 Andrew Jarvis, Adarsh Varma and Justin Ram, Assessing green jobs potential in de-veloping countries: A practitioner’s guide (International Labour Organization, 2011), https://www.ilo.org/global/publications/books/WCMS_153458/lang--en/index.htm.
Annex VI. Methodology guidance sheet for Strategic Outcome 2 — Creation of green jobsGGGI Strategic Outcomes Guideline

60
Methodology for calculation Country Program Impact (CPI) (cont.)
Using the employment factor below:
Technology Construction Time Construction/ Installation
Manufacturing O&M
Years Jobs-years/MW Jobs-years/MW Jobs/MW
Solar PV 1 13.0 6.7 0.7
• Direct jobs = Construction/ installation + Manufacturing + O&M = 390.00 + 201.00 + 22.05 = 613 jobs • Construction/ installation = 1300 × 30MW = 390 Jobs• Manufacturing = 6.7 × 30 = 201• O&M = 0.7 × 30 = 22
• Indirect Jobs = Region multipliers × Direct JobsAfrica multiplier: 5.7Indirect jobs = 5.7 × 262.05 = 1,493 Jobs
Source of the employment factors: OECD Average Employment factors in Table 1 of Rutovitz et al. (2015)
Rutovitz, J., Dominish, E. and Downes, J. 2015. Calculating global energy sector jobs: 2015 methodology. Prepared for Greenpeace International by the Institute for Sustainable Futures, University of Technology Sydney.
Methodology for calculation Country Program Target (CPT)
This indicator provides the ex-ante attributable impact estimates for a country program, if the SO2-relevant projects or outputs estimated through the CPI are scaled up by GGGI (at national or regional level or in a future year).
Steps to estimate country program aggregate:1. Develop a brief narrative on the level of the scaling up for each project/solution by the country program.
For example, expanding the scope of a national renewable fund in terms of larger fund size and greater number of eligible technologies by 2025.
2. Estimate the potential SO2 impacts for the scale-up narrative (in this case, Method 1 OR Method 2 can be used). Aggregate the total potential impact for all projects in the country program.
Methodology for calculation National Target Level (NTL)
This indicator measures the level at which GGGI activities in the country program could contribute to a national target. The national target for green jobs creation will be at sectoral or economy-wide level - estimated for an green growth related strategy or action plan (e.g. a submitted INDC/NDC, Low Emissions Development Strategy (LEDS), green economy action plan) by the government or a recognized academic/research institute or intergovernmental organisation.
Base year is 2015, or a year as close as possible to it (within 2 years). A base year other than 2015 should be clearly indicated and be accompanied by a rationale (e.g. most recent year with available data). Where reasonable estimates are not available or could not be made, the baseline can be assumed to be zero for SO2.
Target year is 2030. If national targets are available in a year other than 2030, such as 2020, 2025 or 2050, approximations can be made with a simple forecast or regression calculation. Where no targets are available, this should be indicated.
Sources of Data and Data availability
For CPI, CPT and NTL: • National studies by international entities, such as GGGI, ILO, New Climate Economy on green jobs
estimation and projection
• Sectoral studies by intergovernmental organisations by entities such as IRENA
Reporting and estimation scope
• Reporting period is the specified period within WPB
• Reporting is required for each project and at country program level
• For CPI and CPT: Qualifying outputs in the current WPB. (If an output is an extension of a project/output from a previous WPB cycle, reporting is required for the scope that has changed. Continuing projects/outputs from a previous WPB cycle with no change in scope do not require reporting.)
• Impact periods / year for reporting:
• CPI: Impacts from the lifetime of the project/output • CPT: Impacts from the lifetime of the project/output that is envisioned to be scaled up, or by a future
year, whichever applies• NTL: by 2030
Annex VI. Methodology guidance sheet for Strategic Outcome 2 — Creation of green jobsGGGI Strategic Outcomes Guideline
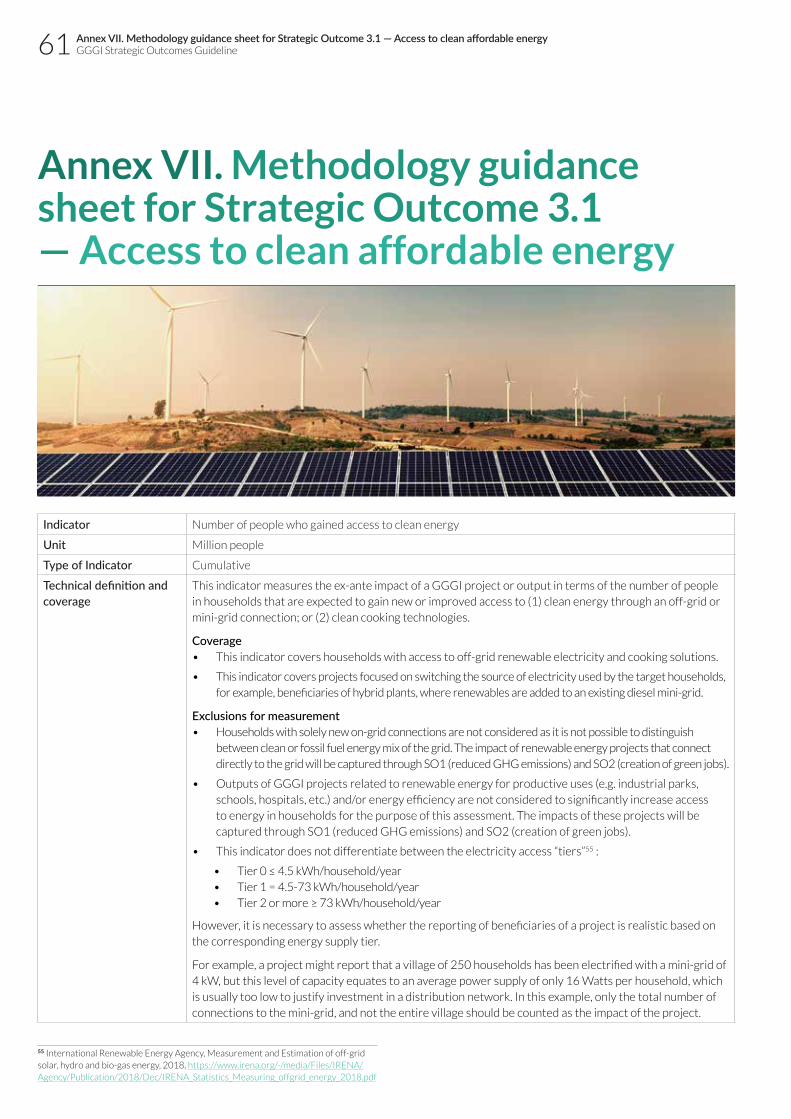
61
Annex VII. Methodology guidance sheet for Strategic Outcome 3.1 — Access to clean affordable energy
Indicator Number of people who gained access to clean energy
Unit Million people
Type of Indicator Cumulative
Technical definition and coverage
This indicator measures the ex-ante impact of a GGGI project or output in terms of the number of people in households that are expected to gain new or improved access to (1) clean energy through an off-grid or mini-grid connection; or (2) clean cooking technologies.
Coverage • This indicator covers households with access to off-grid renewable electricity and cooking solutions.
• This indicator covers projects focused on switching the source of electricity used by the target households, for example, beneficiaries of hybrid plants, where renewables are added to an existing diesel mini-grid.
Exclusions for measurement• Households with solely new on-grid connections are not considered as it is not possible to distinguish
between clean or fossil fuel energy mix of the grid. The impact of renewable energy projects that connect directly to the grid will be captured through SO1 (reduced GHG emissions) and SO2 (creation of green jobs).
• Outputs of GGGI projects related to renewable energy for productive uses (e.g. industrial parks, schools, hospitals, etc.) and/or energy efficiency are not considered to significantly increase access to energy in households for the purpose of this assessment. The impacts of these projects will be captured through SO1 (reduced GHG emissions) and SO2 (creation of green jobs).
• This indicator does not differentiate between the electricity access “tiers”55 :
• Tier 0 ≤ 4.5 kWh/household/year • Tier 1 = 4.5-73 kWh/household/year• Tier 2 or more ≥ 73 kWh/household/year
However, it is necessary to assess whether the reporting of beneficiaries of a project is realistic based on the corresponding energy supply tier.
For example, a project might report that a village of 250 households has been electrified with a mini-grid of 4 kW, but this level of capacity equates to an average power supply of only 16 Watts per household, which is usually too low to justify investment in a distribution network. In this example, only the total number of connections to the mini-grid, and not the entire village should be counted as the impact of the project.
55 International Renewable Energy Agency, Measurement and Estimation of off-grid solar, hydro and bio-gas energy, 2018, https://www.irena.org/-/media/Files/IRENA/Agency/Publication/2018/Dec/IRENA_Statistics_Measuring_offgrid_energy_2018.pdf
Annex VII. Methodology guidance sheet for Strategic Outcome 3.1 — Access to clean affordable energyGGGI Strategic Outcomes Guideline

62
Technical definition and coverage (cont.)
Definitions• Clean energy, as defined by the International Energy Agency (IEA), refers to energy from renewable
sources (i.e. geothermal, solar, wind, hydro, tide and wave energy), nuclear power, biofuels (i.e. biogas, ethanol and biodiesel), biomass (fuelwood, vegetal waste, pulp and paper waste, animal waste, bagasse), municipal waste (waste produced by the residential, commercial and public service sectors that are collected by the local authorities for disposal), and industrial waste.
Note: GGGI projects exclude nuclear, big scale hydro, tide and wave energy.
• New access to clean energy refers to households with no previous access to electricity Improved access to clean energy refers to households with previously poor and/ or unaffordable access to electricity. GGGI’s project will directly improve the accessibility and affordability to energy.
Categories of reporting • Only the number of direct beneficiaries of the project should be estimated. Direct beneficiaries are the
population belonging to households that have received access to electricity as a result of the project
• Indirect and/ or secondary beneficiaries impacted should not be included in the estimate. Examples of indirect beneficiaries are people benefitting from access to electricity not provided to their household, including electrification of schools, health clinics, or neighbors that share services as a result of electrification.
Level of disaggregation of reporting categories • Total direct beneficiaries (required)• Total direct female beneficiaries (required)• Total direct beneficiaries in rural areas (optional)• Total direct beneficiaries below the national poverty line (optional)
Level of attribution (only applies to CPI and CPT)• The total number of direct beneficiaries of a project or output are attributed to GGGI regardless of
whether it is the leading institution or a primary financer of the project or output.
Type of Indicator• Cumulative – sum unique beneficiaries over the complete timeframe of projects/outputs (applies
to CPI and CPT). This is not GGGI project duration, but lifetime of the project GGGI is initiating/implementing (e.g. lifetime of a bankable project).
Methodology for calculation Country Program Impact (CPI)
This indicator measures the ex-ante impact at project/ output level.
Steps1. Estimate the number of households that gain new or improved access to clean, affordable energy as a
result of the project or output2. Identify household type i.e. rural vs urban 3. Convert the number of households into the number of people by multiplying the data on average
household size by the number of households expected to be reached. Data on average household size and household size per type (rural vs urban) should be sourced from the most recent national census.
A.) Estimate the baseline The baseline is considered to be zero unless the project is a continuation of an already existing project.
B.) Ex‑ante impact estimate of the project/output Number of people with access to clean energy or clean cooking system = X x Z
Where:X = Number of households with new or improved off — grid clean energy connection OR households with clean cooking systemsZ = Average number of people per household
Where sometimes X = D/EE = Average level of household power supply
D= Total Installed Capacity of the project or energy access program or facilities as mini grid (energy system capacity) (MW)
C.) In the case of a continuation of a project, CPI_SO3.1 = (B) – (A)
Annex VII. Methodology guidance sheet for Strategic Outcome 3.1 — Access to clean affordable energyGGGI Strategic Outcomes Guideline
56 The International Renewable Energy Agency uses the assumption that a mini-grid supplies 100W per household. This assumption can be utilized here.
Watts( (
Household56

63
Methodology for calculation Country Program Impact (CPI) (cont.)
Example
GGGI Uganda aims to distribute Solar Home Systems ((SHS) to benefit low-income, urban households and SMEs in two secondary cities: Gulu and Mbarara. Gulu has 24,868 households with an average household size of 5.0. Additionally, it is known that only 5.4% of households have access to electricity. In Mbarara the number of households is 112,772 with an average household size of 4.1 where 33.5% of households have access to electricity. It is assumed that SHS will be provided to all households with no access to electricity.
A.) Baseline scenario No beneficiaries
B.) Ex‑ante scenarioNumber of beneficiaries from SHS = 24,868×(1-0.054) × 5 + 112,772 ×(1-.0.335) × 4.1 = 425,098Source: National Population and Housing Census 2014 for the Gulu district and the Mbarara district
Methodology for calculation Country Program Target (CPT)
This indicator measures the ex-ante impact if the project or output above is scaled up at a national or regional level. It measures the impacts by year 2030.
Steps to estimate SO3.1-CPT for the country program:1. Develop a brief narrative on the level of the scaling up for each project/solution by the country
program relevant to SO3.1. 2. Estimate the potential SO3.1 impacts for the scaled-up narrative. 3. Summarize total potential scaled-up impacts for all projects/outputs by the country program.
Method 1 (with number of households as assumptions)1. Select the level of the scale-up i.e. the number of communities that can benefit from the same type of
project at a regional or national level.2. Based on the latest census data, determine the total number of households without energy access or
with current access to diesel generators, within the target region. 3. Convert the number of households to number of people utilizing the CPI formula.
Method 2 (with assumption of population targeted)CPT = (X-Z) x W
Where:X = Population with access to off‑grid renewable electricity by 2030Z = Population with access to electricity in the base yearW = share (%) of the energy access gap that GGGI country program targets to address
Where Z = F x GF = Total country population in the 2016 base year (million people)G = Share of the population with access to renewables in the base year (%)
Example
In Burkina Faso, the share of renewables in total electricity generation in the base year 2016 is approximately 21.6%, serving less than 1% of the population. The government has set a target of 50% renewable energy in the electricity mix of the grid by 2030 (without considering biomass). Also by 2030, the government plans to expand off-grid electrification to 50% of the population, mainly in rural areas. It is assumed that 80% of the off-grid electrification will be from renewable energy sources.
Population of the country in 2016 and 2030 are 16.781 million and 21.906 million respectively.
Therefore, energy access gap=(21.906× 0.50 × 0.80)-(16.781×.0.01)=9.67 million people
By 2030, GGGI country program targets to provide energy access to 50% of existing gap through its activities. As such,
CPT=9.67×0.50=4.84 million people
Method 3 (with investment directed as scale‑up)The expected additional investment or economic resources required to scale up a project or launch a country program can also be used to approximate the CPT as follows.
1. If a project at a small scale required an investment of B and resulted in C number of beneficiaries, an investment increase of D (% increase in investment expressed in decimal format) will result in E beneficiaries.
E = [(B+ (B x D)] x C]/B
Annex VII. Methodology guidance sheet for Strategic Outcome 3.1 — Access to clean affordable energyGGGI Strategic Outcomes Guideline

64
Methodology for calculation Country Program Target (CPT) (cont.)
This indicator measures the level at which GGGI activities could contribute to the pledged national target. NTL is the aggregate gap to achieving the pledged national target compared with the base year.
NTL = Net change in total population with access to electricity = X ‑ Z
Where:X = Target population with access to electricity in year 2030Z = Population with access to electricity in base year
Where X = C x DC = Total country population by 2030 (million people)D = Target of the population with access to electricity by 2030 (%)
Base year is 2015, or a year as close as possible to it (within 2 years). A base year other than 2015 should be clearly indicated and be accompanied by a rationale (e.g. most recent year with available data). Where reasonable estimates are not available or could not be made, the baseline can be assumed to be zero for SO3.1.
Target year is 2030. If national targets are available in a year other than 2030, such 2020, 2025, or 2050, approximations can be made using a simple forecast or regression calculation.
Example
GGGI is working to set up and run a fund aimed at scaling-up off-grid renewable electricity access in Burkina Faso. The government’s target is to provide electricity access to 95% of the population by 2030 (from the current 19.16 % in the base year, 2016). Based on UN Data, the population of Burkina Faso’s population is forecasted to be 27.38249 million people in 2030 and the population in 2016 was 18.64643 million people.
In Burkina Faso, GGGI activities related to SO3.1 can therefore contribute to providing clean energy access to a maximum of 22.36 million people by 2030
Burkina Faso NTL = (27.38249 X 0.95) ‑ (18.64643 x 0.1916) = 22.36 million people
An NTL can also be calculated for the rural population in Burkina Faso. In 2016 0.77% of the rural population had access to energy and the target for 2030 is 50% access. Applying the above formula, we know that GGGI activities can contribute to providing energy access to 10.82 million people in rural areas.
NTL = (Rural Pop_2030 x target % of rural pop with access to electricity_2016)
Burkina Faso NTL = (21.90 x 0.50) ‑ (16.78 x 0.0077) = 10.82 million people
Sources of Data and Data availability
For CPI:• Latest household census
For CPT:• Latest household census
For NTL:• World Development Indicators• INDCs/ NDCs• National energy plans• UN population projections
Reporting Period • Reporting period is the specified period within WPB
• Reporting is required for each project and at country program level
• For CPI and CPT: Qualifying outputs in the current WPB. (If an output is an extension of a project/output from a previous WPB cycle, reporting is required for the scope that has changed. Continuing projects/outputs from a previous WPB cycle with no change in scope do not require reporting.)
• Impact period / year for reporting:
• CPI: Impacts from the lifetime of the project/output
• CPT: Impacts from the lifetime of the project/output that is envisioned to be scaled up, or by a future year, whichever applies
• NTL: by 2030
Annex VII. Methodology guidance sheet for Strategic Outcome 3.1 — Access to clean affordable energyGGGI Strategic Outcomes Guideline

65 Annex VIII. Methodology guidance sheet for Strategic Outcome 3.2 — Access to improved sanitationGGGI Strategic Outcomes Guideline
Annex VIII. Methodology guidance sheet for Strategic Outcome 3.2 — Access to improved sanitation
Indicator Number of people who gained access to improved sanitation
Unit Million people
Type of indicator Cumulative
Technical definition and coverage
This indicator measures the ex-ante impact of a GGGI project or output in terms of the number of people that are expected to gain improved access to improved sanitation or domestic/ community wastewater management services.
Coverage of impact estimationThe number of people using safely managed sanitation services, including handwashing facilities with soap and water is included (as in SDG 6.2.1).
Only direct beneficiaries that have gained access to improved sanitation as a result of a GGGI project or output and who did not previously have the improved access should be accounted for.
Exclusions for measurementN/A
Definitions• UNICEF defines improved sanitation as any of the following: flush toilet, connection to a piped sewer
system, connection to a septic system, flush / pour-flush to a pit latrine, pit latrine with slab, ventilated improved pit latrine (abbreviated as VIP latrine) or a composting toilet. Improved sanitation does not necessarily include sustainable sanitation.
• Improved access means households previously had a shared or public sanitation facility or facilities not connected to a sewer of septic tank or open defecation.
Level of disaggregation of reporting categories • Total direct beneficiaries of improved sanitation in millions (required)• Total direct female beneficiaries in millions (required)• Total direct beneficiaries below the national poverty line (optional) • Total direct beneficiaries in urban and rural areas in millions (optional)

66Annex VIII. Methodology guidance sheet for Strategic Outcome 3.2 — Access to improved sanitationGGGI Strategic Outcomes Guideline
Technical definition and coverage (cont.)
Level of attribution (only applies to CPI and CPT)The total number of direct beneficiaries of a project or output are attributed to GGGI regardless of whether it is the leading institution or a primary financer of the project or output.
Type of Indicator• Cumulative – total impact over the complete timeframe of projects/outputs (applies to CPI and CPT).
This is not GGGI project duration, but lifetime of the project GGGI is initiating/implementing (e.g. lifetime of a bankable project).
Methodology for calculation Country Program Impact (CPI)
This indicator measures the ex-ante direct beneficiary estimates of the number of people with access to improved sanitation.
This indicator measures the ex-ante impact at project/ output level.
StepsWhen project data is available at household level, follow the below steps:1. Estimate the number of households that gain access to improved sanitation as a result of the project
or output2. Identify household type i.e. rural vs urban 3. Convert the number of households into the number of people by multiplying the data on average
household size by the number of households expected to be reach. Data on average household size and household size per type (rural vs urban) should be sourced from the most recent national census.
A.) Estimate the baseline The baseline is considered to be zero unless the project is a continuation of an already existing project.
B.) Ex‑ante impact estimate of the project/outputNumber of people with access to improved sanitation = X x Z
Where:X = Number of households with improved sanitationZ = Average number of people per household
C.) In the case of a continuation of a project or baseline different from zero, CPI_SO3.2 = (B) – (A)
Methodology for calculation Country Program Target (CPT)
This indicator measures the ex-ante impact if the project or output above is scaled up at a national or regional level. It measures the impacts by year 2030.
Steps to estimate SO3.2-CPT for the country program:1. Develop a brief narrative on the level of the scaling up for each project/solution by the country
program impacting SO3.2. 2. Estimate the potential SO3.2 impacts for the scale-up narrative. 3. Summarize total potential scaled-up impacts for all projects/outputs by the country program.
Method 1 (with number of households as assumptions)1. Select the level to scale-up i.e. the number of communities that can benefit from the same type of
project at a regional or national level.2. Based on the latest census determine the total number of households without improved sanitation. 3. Convert the number of households to the number of people utilizing the CPI formula.
Method 2 (with investment directed as scale‑up)The expected additional investment or economic resources required to scale up a project or launch a country program can also be used to approximate the CPT as follows.
1. If a project at a small scale required an investment of B and resulted in C number of beneficiaries, an investment increase of D (% increase in investment expressed in decimal format) will result in E beneficiaries.
E = [(B + (B x D)] x C]/B Where:
C = X : ZWhere: X = Total investment required in sanitation by 2030 or prospective investment to be mobilized by GGGI by 2030 in sanitationZ = Current cost per capita of providing improved sanitation services

67
Methodology for calculation Country Program Target (CPT) (cont.)
Example
The cost of providing sanitation in South East Asian countries varies between USD 4 to USD 7 per capita according to the World Health Organization. We know that the GGGI program in Nepal aims to invest approximately USD 0. 75 million by 2030 in sanitation projects. However, GGGI aims to mobilize triple the initial investment in a scale-up scenario i.e. USD 2.25 million.
CPTmax= [0.75+(0.75×200%)]×(0.75/4)]÷0.75 =562,500 people
CPTmin= [0.75+(0.75×200%)]×(0.75/7)]÷0.75 =321,429 people
Methodology for calculation National Target Level (NTL)
This indicator measures the level at which GGGI activities in the country program could contribute to the pledged national target.
Thus, it measures the net change in total population with access to improved sanitation
NTL = Net change in total population with access to improved sanitation = X ‑ ZWhere:X = Population with access to improved sanitation by 2030Z= Population with access to improved sanitation in base year
Where X = C x DC = Total country population by 2030 (million people)D = Target of population with access to improved sanitation by 2030 (%)
Example
GGGI is working to set up and run a fund aimed at scaling-up improved sanitation facilities in Nepal. In 2015 (base year), 46% of the population has access to improved sanitation in Nepal and the government aims to provide universal access by 2030. Populations in 2016 and 2030 are estimated at 28.656 million and 33.167 million. Thus, in Nepal GGGI activities related to SO 3.2 can contribute to provide improved sanitation to a maximum of 19.99 million people by 2030.
NTL=(33.167×1)‑ (28.656× 0.46)=19.99 million people
Base year is 2015, or a year as close as possible to it (within 2 years). A base year other than 2015 should be clearly indicated and be accompanied by a rationale (e.g. most recent year with available data). Where reasonable estimates are not available or could not be made, the baseline can be assumed to be zero for SO3.2.
Target year is 2030. If national targets are available in a year other than 2030, such 2020, 2025, or 2050, approximations can be made using a simple forecast or regression calculation.
Sources of Data and Data availability
For CPI:• Households information according to the latest household census
For CPT:• WHO/ “How much would it cost to Act” (www.who.int/water_sanitation_health/watandmacr3.pdf)• World Bank (Private Investments per sector) (ppi.worldbank.org/snapshots/country)• http://pubdocs.worldbank.org/en/444801485298673631/WSP-EndYear2016-Report-02122016.pdf• Government budget in sectors.
For NTL:• WHO/UNICEF Joint Monitoring Programme (www.wssinfo.org) • World Development Indicators
Reporting and estimation scope
• Reporting period is the specified period within WPB
• Reporting is required for each project and at country program level
• For CPI and CPT: Qualifying outputs in the current WPB. (If an output is an extension of a project/output from a previous WPB cycle, reporting is required for the scope that has changed. Continuing projects/outputs from a previous WPB cycle with no change in scope do not require reporting.)
• Impact period / year for reporting:
• CPI: Impacts from the lifetime of the project/output
• CPT: Impacts from the lifetime of the project/output that is envisioned to be scaled up, or by a future year, whichever applies
• NTL: by 2030
Annex VIII. Methodology guidance sheet for Strategic Outcome 3.2 — Access to improved sanitationGGGI Strategic Outcomes Guideline

68Annex IX. Methodology guidance sheet for Strategic Outcome 3.3 — Access to sustainable waste managementGGGI Strategic Outcomes Guideline
Annex IX. Methodology guidance sheet for Strategic Outcome 3.3 — Access to sustainable waste management
Indicator Number of people that gained access to solid waste management
Unit Million people
Type of indicator Cumulative
Technical definition and coverage
This indicator measures the ex-ante impact of a GGGI project/ output in terms of the number of people that gain access to municipal solid waste management (MSW) services to adequately disposed waste (e.g. waste collection services for unregulated / unsanitary dumps, or dirty incinerators are not considered adequate disposal)
Coverage This indicator measures the number of people with access to MSW collection services in urban and rural municipalities, where collected waste is also adequately disposed.
Exclusions for measurementGGGI projects or outcomes related to non-municipal waste i.e. agricultural waste, hazardous waste, management of waste in water streams, etc. are not included in this measurement.
DefinitionsSolid waste management services refer to processes that include: collection; transportation; proper disposal or recycling; monitoring of waste by public or private enterprises; and energy production from waste.
Proper disposal includes burning or burial at landfill sites and recycling.
A GGGI project or output could cover all or part of these processes. The population covered as a result of these processes needs to be estimated.
Access to waste management considers acceptability (whether waste service options are considered suitable to users), availability/temporal accessibility (whether waste services options exist at the location and time users require) and affordability. If the service exists and it is acceptable, available and affordable it is considered access even if it is not used by the end user.
This indicator covers MSW management as defined by the UN Statistical Division, which includes waste originating from households, commerce and trade, small businesses, office buildings and institutions (such as schools, hospitals, government buildings). It also includes: bulky waste (e.g. white goods, old furniture, mattresses); and waste from selected municipal services (e.g. waste from park and garden maintenance, and street cleaning services, the content of litter containers, market cleansing waste) if managed as waste. The definition excludes waste from the municipal sewage network and treatment, and municipal construction and demolition waste.

69 Annex IX. Methodology guidance sheet for Strategic Outcome 3.3 — Access to sustainable waste managementGGGI Strategic Outcomes Guideline
Technical definition and coverage (cont.)
The definition of waste and MSW can differ depending on the country.
The scope of this indicator is limited to urban areas.
Categories of reporting (for each of the 3 levels of impact)• Only direct beneficiaries of the project/output estimated need estimation
Level of disaggregation of reporting categories • Total direct beneficiaries (required)• Total direct female beneficiaries (required)• Total direct beneficiaries below the national poverty line (optional)
Level of attribution (only applies to CPI and CPT)The total number of direct beneficiaries of a project or output are attributed to GGGI regardless of whether it is the leading institution or a primary financer of the project or output.
Type of IndicatorCumulative – total impact over the complete timeframe of projects/outputs (applies to CPI and CPT). This is not GGGI project duration, but lifetime of the project GGGI is initiating/implementing (e.g. lifetime of a bankable project).
Methodology for calculation Country Program Impact (CPI)
This indicator measures the ex-ante impact at project/ output level.
Steps:A.) Estimate the baseline The baseline is considered to be zero unless the project is a continuation of an already existing project.
B.) Ex‑ante impact estimate of the project/output Number of people with access to waste management = X x (Z ‑ Y)
Where:X = Current populationY = Current waste management coverage rateZ = Collection coverage target to be reached as a result of GGGI’s project
C.) In the case of a continuation of a project, CPI_SO3.3 = (B) – (A)This calculation approach assumes all waste generated will be covered by a single stream of collection i.e. waste managed by or for municipalities. The methodology does not take into account waste disposal by generators (self- disposal), waste managed by entities other than municipalities, and recycling managed by other actors such as informal sector actors.
Example
GGGI is working to set up a sustainable solid waste management system in Lao PDR. In 2015 Lao PDR had a waste generation rate of 0.65 kg per capita per day equivalent to 237.25 kg per capita per year. We also know that the current waste collection coverage is 44% (although it can vary from 30 to 50%). GGGI’s will focus on providing waste management services to 70% of the population living in the city of Vientiane. The current population is 0.783 million inhabitants.
With the above, the number of people that the GGGI country program can support to access sustainable waste management is:
CPI = 0.783 x (0.70 ‑ 0.44) = 0.234 million people
Methodology for calculation Country Program Target (CPT)
This indicator measures the ex-ante impact if the project/ output above is scaled up at a national or regional level. It measures the impacts by year 2030.
The method for estimation is as follows:Number of people with access to sustainable waste management in 2030 (based on expected population growth)
= CPT = Σ X i (Zi ‑ Yi)
Where:i = City or urban area to be addressedX = Population in 2030 per city or urban area to be addressedZ = Collection coverage target to be reached for the city or urban area if GGGI’s project scaled upY = Baseline or current coverage rate in the target area
i

70Annex IX. Methodology guidance sheet for Strategic Outcome 3.3 — Access to sustainable waste managementGGGI Strategic Outcomes Guideline
Methodology for calculation Country Program Target (CPT) (cont.)
Example
GGGI aims to expand its sustainable solid waste management system in Lao PDR. Today, Lao PDR’s waste collection coverage is 44%. It is assumed that GGGI project will help to reach 100% of coverage to the city by 2030. The population by 2025 is expected to be 1.6 million.
CPT = 1.6 x (1 ‑ 0.44) = 0.896 million people
This method uses the current waste collection rate.
Methodology for calculation National Target Level (NTL)
This indicator measures the level at which GGGI activities can contribute to the pledged national target.
NTL is the aggregate gap to achieving the pledged national target compared to the base year.
If there is no available data regarding the “% population served by municipal waste collection” (commonly available in UN stats) or “Municipal solid waste collection coverage by city” (commonly available on the SDG Goals Website) then an approximation can be calculated as follows:
• Use data on waste generation per capita per day in base year and the total population in base year to calculate total waste generation in base year as follows:
Waste Generation= (Waste generation in Kg per capita per day for base year)X ( Population_Base year)
• Use the waste generation figure calculated and data on total waste collection coverage per region or city in the base year to calculate the total waste collected in base year
Total waste collected= (Waste generation)X ( Waste collection coverage per region)
• Calculate the number of people with access to waste collection services
C = Number of people with access to sustainable waste management
Having estimated figures for total waste collected and waste generation per capita, it is now possible to calculate the NTL.
NTL = Net change in total population with access to sustainable waste management = (A x B) - C
Where:A = Total country population by 2030B = Target % of pop. with access to waste management in target yearC = Number of people with access to waste management services in baseline
Baseline is the population with adequate access to waste management services in base year. Base year is 2015, or a year closer to it (more or less than 2 years). Base year other than 2015 should be clearly indicated with rationale (e.g. most recent year with available data). Where reasonable estimates are not available or could not be made, base year can be assumed to be zero for SO3.3.
Target year is 2030. If national targets are available in a year other than 2030, such 2020, 2025, 2050 approximations can be made with simple forecast or regression excel calculation.
= Total waste collectedWaste generation per capita
( (
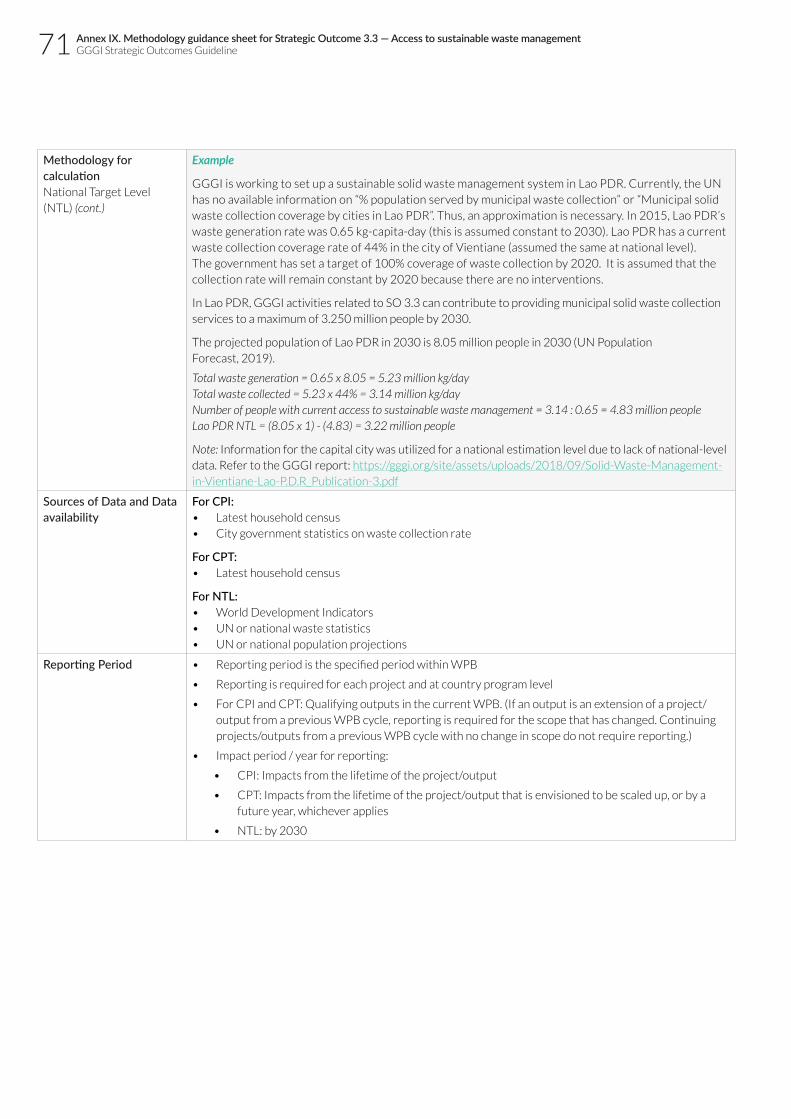
71
Methodology for calculation National Target Level (NTL) (cont.)
Example
GGGI is working to set up a sustainable solid waste management system in Lao PDR. Currently, the UN has no available information on “% population served by municipal waste collection” or “Municipal solid waste collection coverage by cities in Lao PDR”. Thus, an approximation is necessary. In 2015, Lao PDR’s waste generation rate was 0.65 kg-capita-day (this is assumed constant to 2030). Lao PDR has a current waste collection coverage rate of 44% in the city of Vientiane (assumed the same at national level). The government has set a target of 100% coverage of waste collection by 2020. It is assumed that the collection rate will remain constant by 2020 because there are no interventions.
In Lao PDR, GGGI activities related to SO 3.3 can contribute to providing municipal solid waste collection services to a maximum of 3.250 million people by 2030.
The projected population of Lao PDR in 2030 is 8.05 million people in 2030 (UN Population Forecast, 2019).
Total waste generation = 0.65 x 8.05 = 5.23 million kg/dayTotal waste collected = 5.23 x 44% = 3.14 million kg/dayNumber of people with current access to sustainable waste management = 3.14 : 0.65 = 4.83 million peopleLao PDR NTL = (8.05 x 1) ‑ (4.83) = 3.22 million people
Note: Information for the capital city was utilized for a national estimation level due to lack of national-level data. Refer to the GGGI report: https://gggi.org/site/assets/uploads/2018/09/Solid-Waste-Management-in-Vientiane-Lao-P.D.R_Publication-3.pdf
Sources of Data and Data availability
For CPI:• Latest household census• City government statistics on waste collection rate
For CPT:• Latest household census
For NTL:• World Development Indicators• UN or national waste statistics• UN or national population projections
Reporting Period • Reporting period is the specified period within WPB
• Reporting is required for each project and at country program level
• For CPI and CPT: Qualifying outputs in the current WPB. (If an output is an extension of a project/output from a previous WPB cycle, reporting is required for the scope that has changed. Continuing projects/outputs from a previous WPB cycle with no change in scope do not require reporting.)
• Impact period / year for reporting:
• CPI: Impacts from the lifetime of the project/output
• CPT: Impacts from the lifetime of the project/output that is envisioned to be scaled up, or by a future year, whichever applies
• NTL: by 2030
Annex IX. Methodology guidance sheet for Strategic Outcome 3.3 — Access to sustainable waste managementGGGI Strategic Outcomes Guideline

72Annex X. Methodology guidance sheet for Strategic Outcome 3.4 — Access to sustainable public transportGGGI Strategic Outcomes Guideline
Annex X. Methodology guidance sheet for Strategic Outcome 3.4 — Access to sustainable public transport
Indicator Passengers with access to sustainable public transport modes, in annual passenger-kilometers
Unit Million passenger-kilometers
Type of indicator Annual value
Technical definition and coverage
This indicator refers to ex-ante estimates of passenger-kilometers on sustainable public transport modes. A passenger-kilometer is defined as the transport of one passenger by a defined mode of transport (road, rail, air, sea, inland waterways etc.) over the distance of one kilometer.
CoverageThe indicator measures impacts from projects or outputs related to increasing access to sustainable public transport. Examples include: the development of new Bus Rapid Transit systems, municipal buses, tram, metro, rail, or any other public transport mode (bike sharing and e-scooter sharing); enhancement of feeder public transport; electrification of public transport mode including taxis, tuk-tuks; and switching of existing public transport modes to cleaner forms of fuels (e.g. converting to Compressed Natural Gas).
In Small Island Developing States (SIDS), inter-island maritime transport plays a key role. SIDS pay a greater share of transport costs on their imports compared to the world average. Therefore, passenger maritime transport modes than enhance capacity and affordability, and freight maritime transport modes that use cleaner forms of fuel can be included.
Exclusions for measurementOnly projects that directly address access to public and sustainable modes of transport modes will be measured. Any project or output related to private vehicles should not be included, even if the project or output contributes to sustainable transport.
The following types of project and outputs are excluded:
• Promotion of motorized modes of transport that encourages greater utilization per vehicle but is confined to private modes of transport e.g. car-sharing and car-pooling;
• Implementation of transport standards to reduce pollutants and increase efficiency (e.g. Euro VI);• Road rehabilitation programs that could lead to greater movement of public transport vehicles.
57 “English Oxford Living Dictionaries,” Dictionary.com, Oxford University Press, accessed January 25, 2019, https://www.lexico.com/en
73 Annex X. Methodology guidance sheet for Strategic Outcome 3.4 — Access to sustainable public transportGGGI Strategic Outcomes Guideline
Technical definition and coverage (cont.)
DefinitionsPublic transport is defined as the transport of passengers by group travel systems available for use by the general public, typically managed on a schedule, operated on established routes, and that charge a posted fare per journey.
These include two broader public transport groups: rail-based transit such as metros or trains, and road-based transit such as buses or trams. This definition excludes collective passenger transport such as car-sharing and on-street car hire schemes, car-pooling to maximize car occupancy and bike or scooter sharing.57
Passenger transport data capture the total movement of passengers using a transport on a given network or transport mode (passenger cars, buses or coaches). This can be measured per trip, per day.
Sustainable public transport, as defined by the European Union Council of Ministers of Transport:
• Includes all modes of public transport which limit GHG emissions and waste within the planet’s capacity to absorb them;
• Uses renewable resources at or below their rates of generation; • Uses non-renewable resources at or below the rates of development of renewable substitutes, while
minimizing the impact on the use of land and the generation of noise. (i.e. CNG buses, electric trams and trains where electricity may not be primarily from renewables); and
• Is affordable, operates fairly & efficiently, and offers a choice of transport modes.
Access to public transport is measured here in terms of usage, in passenger-kilometers. Access is defined as transportation options that accommodate users’ abilities, including people with disabilities and special needs. However, this indicator does not consider convenience, or how far non-physically disabled transit users can be expected to walk to access a public transport mode.58
The definitions for this indicator do not consider acceptability (whether public transportation options are considered suitable to users), nor availability/temporal accessibility (whether transportation options exist at the location and time users require), nor affordability (although a sustainable public transport must be affordable, it is not a criterion for this specific indicator).
Categories of reporting • Passenger-kilometers traveled by direct beneficiaries of the public transport project or output
Level of disaggregation of reporting categories • Passenger-kilometers traveled by beneficiaries of the project or output (required)
Level of attribution (only applies to CPI and CPT)The total number of direct impacts of a project or output are attributed to GGGI regardless of whether it is the leading institution or a primary financer of the project or output.
Type of Indicator• Non-Cumulative – average distance traveled by passengers using a specific public transport system in
a year
This indicator measures the ex-ante attributable impact estimates of SO3.4-relevant projects or outputs in a country program (e.g. expected capacity of the public transport system after the project or output is implemented)
Ex‑ante Project Scenario • Calculated based on primary data from impact or financial studies
58 This indicator does not measure convenient access to public transport (as in SDG 11.2), which has the criterion that an officially recognized transport stop is accessible within a distance of 0.5 km from a reference point such as a home, school, workplace, market, etc. ‘Convenient’ poses a stricter access criterion in terms of population. For example, in 80 European cities 83% of the population have access to public transport, however only 66% of the population has convenient access. For basic access, at least one round-trip per day is considered.

74Annex X. Methodology guidance sheet for Strategic Outcome 3.4 — Access to sustainable public transportGGGI Strategic Outcomes Guideline
Technical definition and coverage (cont.)
Example
GGGI will contribute to the implementation of low carbon vehicles in the BRT system in Vientiane, Lao PDR. The BRT system in Laos is not yet in place. As of now, the available public transport uses old diesel buses.
Ex‑ante scenarioThe data on the maximum movement of passengers in the BRT is available in its feasibility study. It is known that the BRT system in Vientiane will mobilize additional public transport usage of 72,566,306 passenger-kilometers.
If data is not available, use the following formula:Annual passenger ‑ kilometers = (B x A)
A = Maximum number of passengers transported per trip per yearB = Distance traveled per passenger in a year
Where:Annual passenger ‑ kilometers = (Maximum number of buses per hour per lane × Persons per bus × Saturation × Number of Lanes) × (Average length of a trip × Number of trips in a year)
Note: Saturation of the lane is the maximum accepted level to avoid unstable vehicle flow, commonly set as 90 (Asian Development Bank financial analysis on Laos PDR BRT: https://www.adb.org/sites/default/files/linked-documents/45041-002-fa.pdf)
Methodology for calculation Country Program Impact (CPI)
This indicator measures the ex-ante attributable impact in a country program by year 2030, if the projects/outputs outlined in the CPI are scaled up by GGGI at a regional or national level. In the example of an expansion of the BRT system in terms of number of buses or routes:
Ex‑ante ScenarioCountry Program Target (CPT) = Σ (Zn x Wn x Yn x Fn)
Where:n = number of new sustainable public transport modes, or existing buses, trams, cars, rail or other public transport modes replaced with cleaner fuel alternativesZ = maximum passenger capacity per transport mode (bus, tram, rail, etc.)W = trips per dayY = kilometers per tripF = capacity factor (if unknown, assume 100% capacity)
Methodology for calculation National Target Level (NTL)
This indicator measures the level at which GGGI activities in the country program could contribute to the pledged national target.
It measures the gap to achieving the targeted million passenger -kilometers from public transport (either sustainable as defined above or not).
Baseline year is 2015 or within 2 years of it.
Target year is 2030. If national targets are available in a year other than 2030, such 2020, 2025, 2050 approximations can be made with simple forecast or regression excel calculation.
NTL = Gap between current passenger ‑ km of public transport and the forecasted passenger ‑ km of public transport in 2030 = (Y) ‑ (X)
Where:X = Total million passenger ‑ km public transport in baseline yearY = Total million passenger ‑ km public transport in year 2030
Example
GGGI is working to develop a sustainable public transport programme in Lao PDR. The Lao PDR program is. The assumptions for Vientiane will be used to calculate the national target as it is the biggest city in the country and the only city with available information. As no data for year 2015 is available, data for 2011 and 2012 are used.
Baseline data:• The current share of public transport (as a % of total road transport) in Vientiane is reported as 0.6%
in the 2011 ADB estimate (with estimates up to 4% by the Japan International Cooperation Agency on the high end).
• In 2012 the total road passenger transport was 2,618.9 million passenger-kms, according to the IRF World Statistics.
n

75 Annex X. Methodology guidance sheet for Strategic Outcome 3.4 — Access to sustainable public transportGGGI Strategic Outcomes Guideline
Methodology for calculation National Target Level (NTL) (cont.)
Data for 2030:• The latest national strategy document from Lao PDR establishes a goal of reaching a 30% share of
public transport by 2020. (It is assumed that the share of public transport will remain constant from 2020 until 2030).
• The road passenger-kms is expected to reach 119,500 million passenger-km by 2050, according to Clean Air Asia.
• Using the Compound Annual Growth Rate formula, it is estimated that Lao PDR’s road passenger- kms will increase by 11% per year, reaching 5,853.754 million passenger-kms in 2020 and 15,998.488 million passenger kms by 2030).
Based on the data above, GGGI actions can contribute to increasing the share of public transport by 26 percentage points on the low end and 29.4 percentage points on the high end. (Increase in the share of public transport in percentage points = Target share of public transport – Current = (30% - 4%) or (30% - 0.6%))
NTL= Gap between current passenger‑km of public transport and the forecasted passenger km of public transport in 2030 = (X x Z) - (Y x W)
X (Baseline Year) = Total Million passenger‑km inland transport = 2,618.9 Million passenger‑km
Z (Baseline Year) = Share of public transport = 0.6% to 4%Y2030= Total Million Passenger‑km road transport = 15,998.488 Million passenger‑kmW2030= Share of public transport = 30%
NTLmax = (15,998.488 x 30%) ‑ (2,618.900 x 0.6%) = 4,783 million passenger ‑ kmNTLmin = (15,998.488 x30%) ‑ (2,618.900 x 4%) = 4,694 million passenger ‑ km
Sources of Data and Data availability
For CPI:• Project impact studies or financial feasibility Studies of the transport project being assessed
For CPT:• Latest Transport Strategy Document available for the country or city• NAMAs in country
For NTL:• International Association of Public Transport (UITP) • Latest transport strategy document available for the country or city
Reporting Period • Reporting period is the specified period within WPB
• Reporting is required for each project and at country program level
• For CPI and CPT: Qualifying outputs in the current WPB. (If an output is an extension of a project/output from a previous WPB cycle, reporting is required for the scope that has changed. Continuing projects/outputs from a previous WPB cycle with no change in scope do not require reporting.)
• Impact periods / year for reporting:
• CPI: Impacts from the lifetime of the project/output
• CPT: Impacts from the lifetime of the project/output that is envisioned to be scaled up, or by a future year, whichever applies
• NTL: by 2030
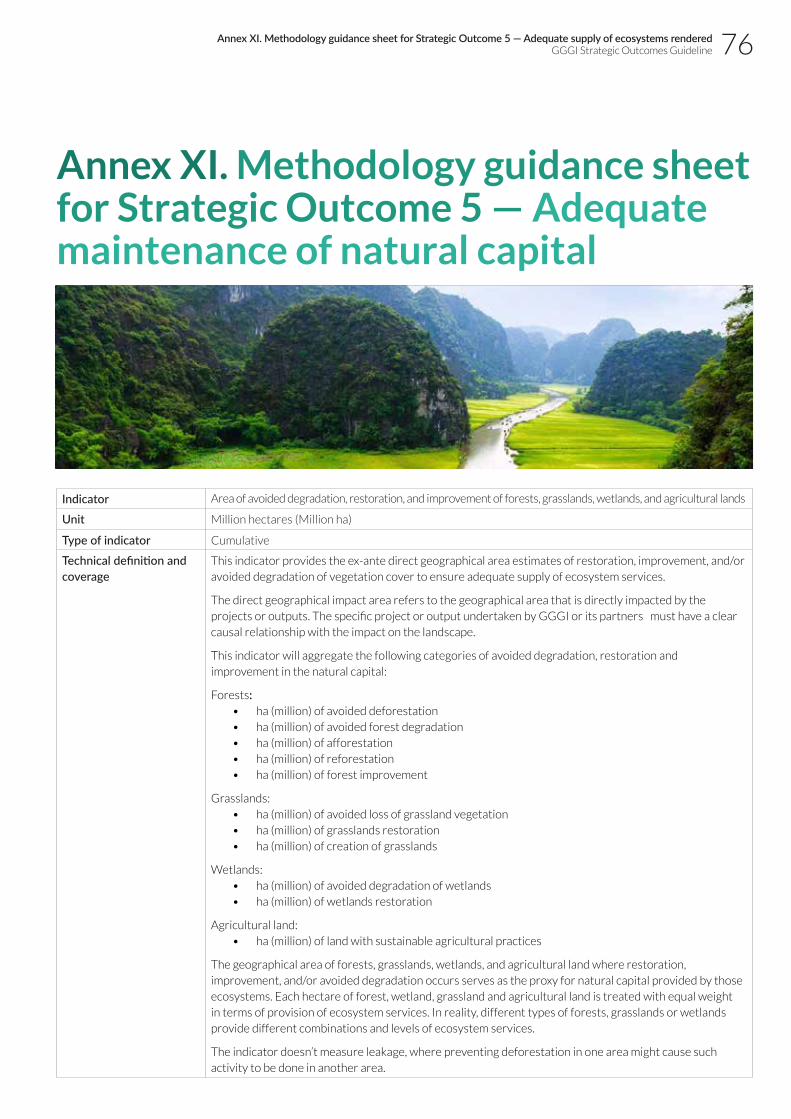
76Annex XI. Methodology guidance sheet for Strategic Outcome 5 — Adequate supply of ecosystems renderedGGGI Strategic Outcomes Guideline
Annex XI. Methodology guidance sheet for Strategic Outcome 5 — Adequate maintenance of natural capital
Indicator Area of avoided degradation, restoration, and improvement of forests, grasslands, wetlands, and agricultural lands
Unit Million hectares (Million ha)
Type of indicator Cumulative
Technical definition and coverage
This indicator provides the ex-ante direct geographical area estimates of restoration, improvement, and/or avoided degradation of vegetation cover to ensure adequate supply of ecosystem services.
The direct geographical impact area refers to the geographical area that is directly impacted by the projects or outputs. The specific project or output undertaken by GGGI or its partners must have a clear causal relationship with the impact on the landscape.
This indicator will aggregate the following categories of avoided degradation, restoration and improvement in the natural capital:
Forests: • ha (million) of avoided deforestation• ha (million) of avoided forest degradation• ha (million) of afforestation• ha (million) of reforestation• ha (million) of forest improvement
Grasslands:• ha (million) of avoided loss of grassland vegetation• ha (million) of grasslands restoration• ha (million) of creation of grasslands
Wetlands:• ha (million) of avoided degradation of wetlands• ha (million) of wetlands restoration
Agricultural land:• ha (million) of land with sustainable agricultural practices
The geographical area of forests, grasslands, wetlands, and agricultural land where restoration, improvement, and/or avoided degradation occurs serves as the proxy for natural capital provided by those ecosystems. Each hectare of forest, wetland, grassland and agricultural land is treated with equal weight in terms of provision of ecosystem services. In reality, different types of forests, grasslands or wetlands provide different combinations and levels of ecosystem services.
The indicator doesn’t measure leakage, where preventing deforestation in one area might cause such activity to be done in another area.
77 Annex XI. Methodology guidance sheet for Strategic Outcome 5 — Adequate supply of ecosystems renderedGGGI Strategic Outcomes Guideline
Technical definition and coverage (cont.)
DefinitionNatural capital is defined as the living and non-living components of ecosystems, other than people and components manufactured by people, that contribute to the generation ecosystem services of value for people.
Ecosystem services are the contributions that ecosystems make to human well-being which include various provisioning, regulating, supporting, and cultural services. Examples of provisioning services include clean air; fresh water; food; timber; and fiber. Examples of supporting services include nutrient cycling; water cycling; and photosynthesis. Examples of regulating services include carbon storage and sequestration; watershed protection; protection from storm and storm surges; protection from soil erosion; and pollination by bees. Cultural services include nature-based recreation and cultural traditional value, and often not traded. (EU, 2014; OECD, 2010; UNEP, 2014)59.
For definitions of forests, forest degradation, afforestation, reforestation, and forest improvement, refer to the Convention for Biological Diversity: https://www.cbd.int/forest/definitions.shtml
For definitions of inland and coastal wetlands, refer to the Ramsar Convention: http://www.environment.gov.au/water/wetlands/ramsar
In line with the Food and Agriculture Organization (FAO) definition, agricultural land refers to the land area that is arable either for permanent crops or permanent pastures for grazing of animals. Arable land includes land used to grow temporary crops such as cereals; temporary meadows for mowing or for pasture; land used to grow market or kitchen gardens; and temporarily fallow land. Permanent crops refer to crops that occupy the land for long periods and need not be replanted after each harvest, such as coffee, fruit trees, and vineyards. Permanent pastures refer to land used permanently (for five years or more) to grow forage crops for livestock, either cultivated or growing wild.
Sustainable agriculture approaches utilize integrated management of water, land and ecosystems at the landscape scale to increase productivity and system resilience, while reducing environmental impacts such as greenhouse gas emissions. Sustainable agricultural practices lead to the maintenance or enhancement of the soil organic carbon and biodiversity. Climate Smart Agriculture (CSA) is considered to be a form of sustainable agriculture. Refer to the SO6 guidance note for the definition and coverage of CSA.
Coverage a. Although services are provided by a range of ecosystems, the indicator only includes activities related
to avoided degradation, restoration and improvement of the following natural capital domains: forests, grasslands, inland and coastal wetlands (includes bogs, coastal mangroves and peat lands), and agricultural land.
b. Only projects or outputs with direct causal relationship to SO5 require SO impact estimation. Refer to the guidance document and Annex II on qualifying outputs/projects for impact assessment.
c. Projects or outputs aimed at enhancing climate resiliency of the agriculture sector (e.g. through climate smart agricultural practices) will have enhanced ecosystem services as co-benefits (for example through improvement in soil carbon and soil biodiversity) and should be included. During reporting of SO5 impacts, SO5 geographical areas that are also reported under SO6 should be indicated.
d. Only direct geographical impact areas of the projects or outputs should be included in impact estimation.
59 European Union, Adaptation to Climate Change, December 2014, https://ec.europa.eu/clima/sites/clima/files/docs/factsheet_adaptation_2014_en.pdf; Organization for Economic Cooperation and Development, Strategic Environmental Assessment and ecosystem services, November 2010;United Nations Environment Programme, World Conservation Monitoring Centre, Measuring ecosystem services: Guidance on developing ecosystem service indicators, 2014, https://www.unep-wcmc.org/resources-and-data/measuring-ecosystemservices--guidance-on-developing-ecosystem-service-indicators.

78Annex XI. Methodology guidance sheet for Strategic Outcome 5 — Adequate supply of ecosystems renderedGGGI Strategic Outcomes Guideline
Technical definition and coverage (cont.)
Examples of the direct geographical impact area of GGGI are:• Peat land area protected as a result of a farmer payment scheme designed and implemented by GGGI;• Forest area protected as a result of REDD+ scheme developed by GGGI and project partners that has
received funding for implementation; and• Area under sustainable agricultural practices introduced by GGGI and partners that enhance soil
carbon and biodiversity and enhances climate resilience.
Exclusions from impact estimation• Human-made wetlands and forests are excluded.• Indirect geographical areas should not be included.
Examples of indirect geographical impact area:• Area of a watershed where the water quality will be improved as a result of the protection of
upstream forests and wetlands as a result of GGGI activities.• Area of a watershed where water and soil quality would be improved as a result of reduced pesticide
use. Except for item (c) under “Coverage of impact estimation”, projects/outputs with potential SO5 impact as co-benefits, but not solely aimed at avoided degradation, restoration and improvement of forests, grasslands, wetlands, and agricultural land do not require impact estimation for SO5.
Level of disaggregation for reporting• Total direct impact area in million ha (required)• Direct impact areas in the following categories: forests, grasslands, wetlands, agricultural land
(required)• Direct impact areas that are also eligible to be reported under SO6 in following categories: forests,
grasslands, wetlands, agricultural land (required)
Level of attribution (only applies to CPI and CPT)Total direct impact of a project or output is attributed to GGGI regardless of whether it is the leading institution or a primary financer of the project or output.
Type of IndicatorCumulative – total impact over the complete timeframe of projects/outputs (applies to CPI and CPT). This is not GGGI project duration, but lifetime of the project that GGGI is initiating/implementing (e.g. lifetime of a bankable project).
Methodology for calculation Country Program Impact (CPI)
This is a methodology for ex-ante attributable impact estimates of projects or outputs in a country program relevant to SO5.
Aggregating impacts at country program level:The CPI of all projects/outputs in the country program attributable to SO5 =
Σ in CPI_SO5i – CPIC
where:CPI_SO5 is the impact from a GGGI project or output during its specified lifetime or implementation periodi is the project or output for which CPI is estimatedn is the number of projects or outputs in the country program relevant to SO5CPIc is the extent of geographical area (million ha) that is counted more than once in SO5‑relevant projects by the country program
Steps for estimating CPI_SO5 for a project or output:• Step 1: Establish the counterfactual for the most likely economic activity in the absence of the project/
output (e.g. conversion of natural forest to an oil palm plantation)• Step 2: Estimate the expected effect of the project or output (e.g. expected land use as a result of the
project or output)• Step 3: Calculate the impact as the difference between counterfactual and the effect or the project or
output effect
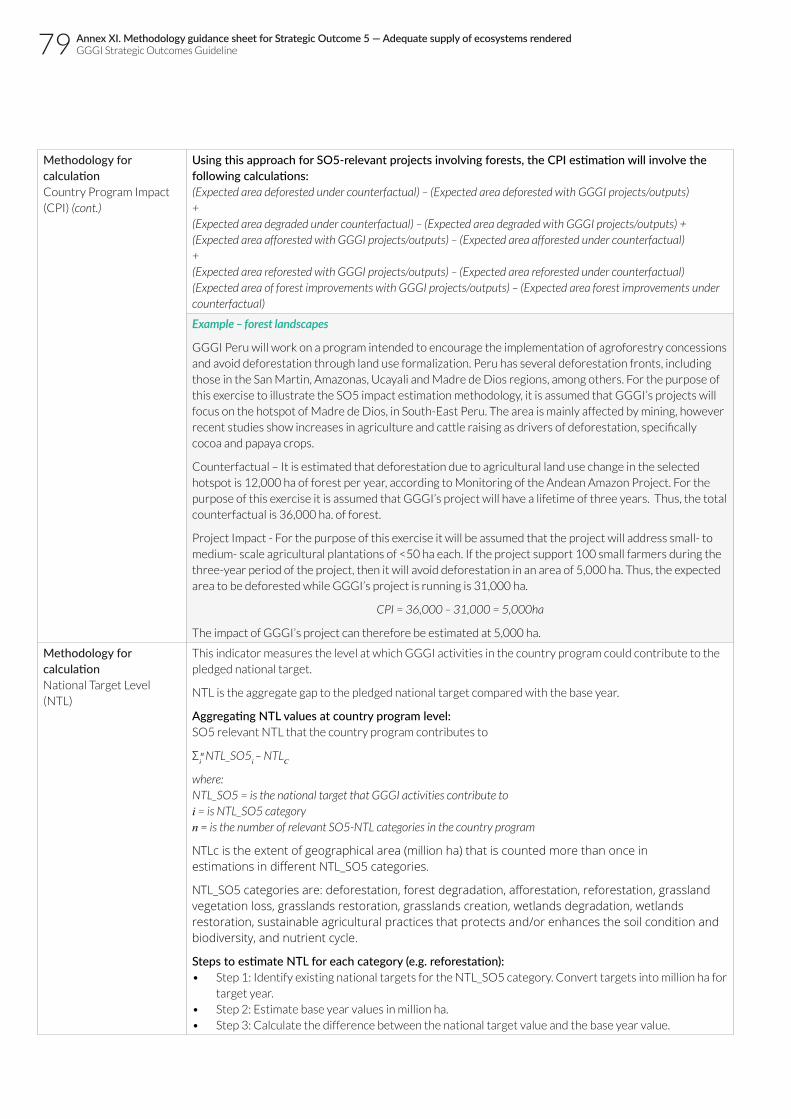
79
Methodology for calculation Country Program Impact (CPI) (cont.)
Using this approach for SO5-relevant projects involving forests, the CPI estimation will involve the following calculations:(Expected area deforested under counterfactual) – (Expected area deforested with GGGI projects/outputs)+(Expected area degraded under counterfactual) – (Expected area degraded with GGGI projects/outputs) +(Expected area afforested with GGGI projects/outputs) – (Expected area afforested under counterfactual)+(Expected area reforested with GGGI projects/outputs) – (Expected area reforested under counterfactual)(Expected area of forest improvements with GGGI projects/outputs) – (Expected area forest improvements under counterfactual)
Example – forest landscapes
GGGI Peru will work on a program intended to encourage the implementation of agroforestry concessions and avoid deforestation through land use formalization. Peru has several deforestation fronts, including those in the San Martin, Amazonas, Ucayali and Madre de Dios regions, among others. For the purpose of this exercise to illustrate the SO5 impact estimation methodology, it is assumed that GGGI’s projects will focus on the hotspot of Madre de Dios, in South-East Peru. The area is mainly affected by mining, however recent studies show increases in agriculture and cattle raising as drivers of deforestation, specifically cocoa and papaya crops.
Counterfactual – It is estimated that deforestation due to agricultural land use change in the selected hotspot is 12,000 ha of forest per year, according to Monitoring of the Andean Amazon Project. For the purpose of this exercise it is assumed that GGGI’s project will have a lifetime of three years. Thus, the total counterfactual is 36,000 ha. of forest.
Project Impact - For the purpose of this exercise it will be assumed that the project will address small- to medium- scale agricultural plantations of <50 ha each. If the project support 100 small farmers during the three-year period of the project, then it will avoid deforestation in an area of 5,000 ha. Thus, the expected area to be deforested while GGGI’s project is running is 31,000 ha.
CPI = 36,000 – 31,000 = 5,000ha
The impact of GGGI’s project can therefore be estimated at 5,000 ha.
Methodology for calculation National Target Level (NTL)
This indicator measures the level at which GGGI activities in the country program could contribute to the pledged national target.
NTL is the aggregate gap to the pledged national target compared with the base year.
Aggregating NTL values at country program level:SO5 relevant NTL that the country program contributes to
Σ in NTL_SO5i – NTLC
where:NTL_SO5 = is the national target that GGGI activities contribute toi = is NTL_SO5 categoryn = is the number of relevant SO5‑NTL categories in the country program
NTLc is the extent of geographical area (million ha) that is counted more than once inestimations in different NTL_SO5 categories.
NTL_SO5 categories are: deforestation, forest degradation, afforestation, reforestation, grassland vegetation loss, grasslands restoration, grasslands creation, wetlands degradation, wetlands restoration, sustainable agricultural practices that protects and/or enhances the soil condition and biodiversity, and nutrient cycle.
Steps to estimate NTL for each category (e.g. reforestation):• Step 1: Identify existing national targets for the NTL_SO5 category. Convert targets into million ha for
target year.• Step 2: Estimate base year values in million ha.• Step 3: Calculate the difference between the national target value and the base year value.
Annex XI. Methodology guidance sheet for Strategic Outcome 5 — Adequate supply of ecosystems renderedGGGI Strategic Outcomes Guideline

80
Methodology for calculation National Target Level (NTL) (cont.)
With the above approach, for projects relevant to SO5 in forests for example, the NTL estimation will involve the following calculations:
NTL of avoided deforestation = (Forested area in base year) – (Forested area in target year)NTL of avoided forest degradation = (Degraded forest area in base year) – (Degraded forest area in target year)NTL for afforestation = (Forested area in target year) – (Forested area in base year)NTL for reforestation = (Forested area in target year) – (Forested area in base year)
Base year is 2015, or a year closer to it (more or less than 2 years). A base year other than 2015 should be clearly indicated with rationale (e.g. most recent year with available data). Where reasonable estimates are not available or could not be made, the base year can be assumed to be zero for SO5.
Target year is 2030. If national targets are available in a year other than 2030, such 2020, 2025, 2050 approximations can be made with a simple forecast or regression excel calculation.
NTL = X ‑ YA
1 = X ‑ (X x Z)Ai = Ai‑1 ‑ (Ai‑1 x Z)
Where:X = Forested area in the base yearY = Forested area in target year (assuming reduced area due to deforestation)Z = Average annual deforestation rateA = Forest coverage at year in = number of years till target year
Example
Peru’s annual deforestation rate is 0.13% (average from 2000 to 2005). The 2030 national goal is to reduce deforestation. If the 2017 forest area is 73. 973 million ha, by 2030 the total forest area will be 72.732 million ha. (assuming the annual deforestation rate does not decrease, and there is no additional afforestation in the coming years).
NTL = (73.973 – 72.732) million ha
In Peru, GGGI activities related to SO5 can contribute to avoiding a total deforestation of 1.240 million ha over the period of 13 years.
Sources of Data and Dataavailability
For CPI, CPT and NTL:• National and sub-national land use assessments, such as from the Food and Agriculture Organisation
(FAO)’s Global Forest Resources Assessment (FRA)
Reporting and estimation scope
• Reporting period is the specified period within WPB• Reporting is required for each project and at country program level• For CPI and CPT: Qualifying outputs in the current WPB. (If an output is an extension of a project/
output from a previous WPB cycle, reporting is required for the scope that has changed. Continuing projects/outputs from a previous WPB cycle with no change in scope do not require reporting.)
• Impact period / year for reporting:• CPI: Impacts from the lifetime of the project/output• CPT: Impacts from the lifetime of the project/output that is envisioned to be scaled up, or by a
future year, whichever applies• NTL: by 2030
Annex XI. Methodology guidance sheet for Strategic Outcome 5 — Adequate supply of ecosystems renderedGGGI Strategic Outcomes Guideline

81 Annex XII. Methodology guidance sheet for Strategic Outcome 6 — Enhanced adaptation to climate changeGGGI Strategic Outcomes Guideline
Annex XII. Methodology guidance sheet for Strategic Outcome 6 — Enhanced adaptation to climate change
Indicator Number of people, within the national population of a country, supported to cope with the effects of climate change
Unit Million people
Type of indicator Cumulative
Technical definition and coverage
This indicator measures the ex-ante direct beneficiary estimates of number of people supported to cope with the effects of climate change.
Coverage(a) Estimation is applied to the population exposed to the likely negative effects of climate change.
(b) Impact estimation is only required for projects or outputs with a direct causal relationship to SO6. Refer to the guidance on qualifying outputs/projects in the guideline and Annex II.
(b) Only direct beneficiaries of the projects/outputs are included in impact estimation.
Direct beneficiaries are defined as households or individuals that directly receive the outcome of a given intervention. There needs to be clear causal relationship between the beneficiaries’ involvement and the specific program or project activities undertaken by GGGI or its partners. The beneficiaries covered should be consulted and their needs included in the project’s design. Examples of direct beneficiaries include:
• People (including government officials) who directly participate in training or a capacity development program that reduces their vulnerability to the effects of climate change
• People with sustained access to clean drinking water, energy access, and improved sanitation access as a result of a project
• People receiving benefits from sustainable and climate resilient interventions such as Climate Smart Agriculture (CSA) approaches
• People in the catchment area of an infrastructure project (e.g. flood wall)• People in the catchment area of a climate information system or early warning system• People protected from the effects of climate change from nature-based green infrastructure
approaches (e.g. mangrove conservation to maximize protection from flood or storm surges, nature-based storm water management in cities)

82Annex XII. Methodology guidance sheet for Strategic Outcome 6 — Enhanced adaptation to climate changeGGGI Strategic Outcomes Guideline
Technical definition and coverage (cont.)
(c) All direct beneficiaries of disaster risk reduction projects or outputs are included.
(d) The following categories of approaches can all be considered: hard measure approaches such as enhancement of concrete flood defenses; soft measure approaches such as adjustments to zoning regulations, communication systems for early warning, crop insurance systems to cope with the effects of climate change, and nature-based approaches that use green infrastructure and natural ecosystem management approaches to maintain and enhance resilience.
Examples of nature-based or green infrastructure approaches include mangrove conservation for protection against coastal erosion and inundation from a rising sea level and natural approaches to climate-proof urban storm water management.
(e) Further examples of adaptation projects and programs that qualify for SO6 impact estimation are provided below:
• Water and sanitation sector: access to clean drinking water, efficient use of scarce water resources including rainwater harvesting and use, community water storage and community reservoirs
• Productive sectors active in rural areas: Agro-/agri-business with interventions promoting a sustainable bio-economy with reduced climate risks and vulnerability:
• CSA that enhances resiliency to climate change, increases productivity reduces emissions and secures soil organic carbon. CSA measures could include the adoption of one or more of the following: use of drought/heat/saline tolerant crop varieties, crop rotation, use of renewable energy irrigation systems (e.g. solar PV powered drip irrigation systems), weather insurance systems, and weather information systems.
• Sustainable mangrove-based fisheries, that for instance enhance coastal protection, reduces saltwater intrusion and protects sea level rise, while boosting livelihoods and the economy. Measures include implementing conservation/restoration agreements in conjunction with the application of technologies and processing facilities to develop value-added products. All projects/outputs that will improve food security, enhance the sustainable bio-economy, reduce climate risks in areas, and for communities, and enterprises that are vulnerable and exposed to the adverse effects of climate change.
• Projects and programs in the urban areas: Use of natural measures for climate-proofing urban storm water management, change of building codes to take into account future climate conditions and extreme weather events, green buildings that minimize heat island effects and the use of scarce resources, early warning systems and awareness of personal measures that can be taken to be informed and protected from extreme heat impacts.
• Other: Ecotourism directed at enhancing local conservation and livelihoods, climate-information and early warning systems, zoning of risk areas to reduce exposure the climate change, construction / enhancement / modification of physical assets to protect against the effects of climate change (construction of flood defenses, enhancing the plinth level of houses, upgrading the levees etc.), choosing tree species and forestry practices that increase the resiliency of an area to storms and fires, etc.
(f) Impacts that are counted in other SOs, and can be included as SO6 impact:
• Access to clean energy contributes to the enhancement of economic and climate resilience of a population. GGGI SO3.1 estimates the impact of projects and programs in this area. Within SO3.1, a population with improved access to electricity (excluding access to clean cooking) is included in the estimation of SO6.
• Improved sanitation directly contributes to enhancing adaptation of vulnerable communities to climate change (due to the direct link of poor sanitation to health risks from climate change). GGGI SO3.2 estimates the impact of projects and programs in this area and is included in SO6 estimation.
• Projects/outputs contributing to SO5 (adequate maintenance of natural capital for ecosystem services) could qualify for this outcome as well. Protection and enhancement of natural capital and ecosystem services could contribute to the enhancement of economic and climate resilience of a population. For example, if sustainable forest management, sustainable agriculture, and/or coastal zone management counted under SO5 also directly enhances the climate resilience of a population, this can be counted towards SO6. Level of impacts, in terms of the population covered, counted towards SO6 and also contributing to SO5 should be clearly indicated.

83
Technical definition and coverage (cont.)
(b) Most of the development interventions with poverty and vulnerability reduction outcomes generally enhance the adaptive capacity of the population to the effects of climate change. However, only activities and outputs that directly mitigate climate risk and vulnerability and enhances adaptation to the effects of climate change should be considered here.
GGGI projects and programs on policy and strategy development (e.g. development of a forest management plan, a plan for climate resilient cities, etc.), knowledge sharing, advocacy etc. are excluded. However, projects and programs implemented as a result of plans and strategies and that have clear components focused on direct beneficiaries should be counted.
DefinitionsExposure refers to the presence of people and assets in areas that could be adversely affected by climate hazards, according to the OECD definition.
‘Hazard’ refers to the potentially damaging climate influence that may adversely affect a valued attribute of a system at the national and local level, according to the OECD definition.
‘Effects of climate change’ refers to the effects of existing climate variability and impacts from future changes in climate. These include vulnerabilities to changes to precipitation patterns, rising temperatures and sea levels, heat and cold waves, storms, floods, droughts, landslides, saltwater intrusion, coastal inundation, and loss of biodiversity.
‘People supported’ corresponds to discrete individuals, households, and populations having a clearly discernible relationship with an intervention designed or implemented by GGGI and its intended impact/s (after PPCR, 2018).
Level of disaggregation of reporting categories • Total direct beneficiaries (required)• Contributions from access to electricity (SO3.1) and from access to sanitation (SO3.2)• Total direct beneficiaries from projects that are also counted under SO5 (required)• Total direct male and female beneficiaries (required)• Total direct beneficiaries who are below 5 years of age and above 65 years of age (optional)• Total direct beneficiaries below the national poverty line (optional)
Provided that data are available, disaggregation in the following categories will provide additional insights:
• type of climate change effect (e.g. flood, extreme heat)• administrative regions (where the project or output is implemented
Level of attribution (only applies to CPI and CPT)The total number of direct impacts of a project or output are attributed to GGGI regardless of whether it is the leading institution or a primary financer of the project or output.
Type of IndicatorCumulative – total impact over the complete timeframe of projects/outputs (applies to CPI and CPT). This is not GGGI project duration, but lifetime of the project GGGI is initiating/implementing (e.g. lifetime of a bankable project).
Methodology for calculation Country Program Impact (CPI)
This is the methodology for estimating the ex-ante attributable impact estimates of SO6-relevant projects / outputs in a country program.
Aggregation of impacts at country program level:The CPI of a country program’s activities that are attributable to SO6
Σ in CPI_SO6i – CPIC
where:CPI_SO6 = is the impact from a GGGI project or output during its specified lifetime or implementation periodi = is the project/output for which the CPI is estimatedn = is the number of projects/outputs in the country program that contribute to SO6 impactCPIc = is the number of people (millions) that that is counted more than once in SO6‑relevant projects in the country program
Annex XII. Methodology guidance sheet for Strategic Outcome 6 — Enhanced adaptation to climate changeGGGI Strategic Outcomes Guideline

84
Methodology for calculation Country Program Impact (CPI) (cont.)
Steps for estimating CPI_SO6 for a project/output:• Step 1: Establish the counterfactual - the number of people that will be supported in the intervention
area without the implementation GGGI project or output. This can be assumed zero where no relevant information is available to make a reasonable estimate.
• Step 2: Estimate the expected effect of the project or output. This is the expected number of people supported as a result of the project/output.
• Step 3: Calculate the expected impact of the project or output. This is the difference between the counterfactual and the project/output effect.
Example:
During the current reporting period, GGGI Country Program X includes implementation of a national green and resilient urban strategy that involves the development of project pipelines for improving access to clean water in a secondary city and to implement climate-proofing of storm-water management in the country’s largest city.
The project to improve access to clean water and the storm-water management system is a qualifying output under CPI_SO6. It is estimated that the clean water access projects in the pipeline will provide access to 5,000 households by 2022. This translates to access for 25,000 people by 2022 (the projected average household size in 2030 is 5 people). The first phase of the implementation of the climate-proof storm-water management plan will cover a catchment area of 100,000 population by 2020 (taking into account average population growth). Thus, total number of people supported to cope with the effects of climate change by the SO6 relevant projects is: 25,000 + 100,000 = 0.125 million people.
Methodology for calculation National Target Level (NTL)
This is the methodology for estimating the ex-ante targeted impact of a country program, if GGGI scales or replicates projects or outputs included in the CPI at regional or national level or by a future year.
Steps to estimate SO6-CPT for the country program:• Develop a brief narrative on the level of the scaling or replication by the country program for each
project or output relevant to SO6. • Estimate the potential SO6 impacts of the scaling or replication activities. • Aggregate the total potential scaled/replicated impacts for all projects/outputs by the
country program.
Example:
During the current reporting period, GGGI Country Program Z has a project for mobilizing finance to implement a climate-proof storm-water management system in its largest city. This first project (Project 1) will cover a population of 100,000 by 2020. The country program aims to scale the management system to a catchment area of a further 5 more neighborhoods with a population of 150,000 by 2022 (Project 2). Thus, the SO6 SPT for the country program would include the following: Impact from Project 1 + Impact from envisioned scaling (Project 2) = 100,000 + 150,000 = 0.25 million people
This indicator measures the level at which GGGI activities in the country program could contribute to the national pledges or targets.
NTLSO6 = Gap to national target on adaptation in terms of total population supported t = X ‑ Z
Where:X = Target population to be supported to cope with effects of climate change in 2030Z = Baseline population supported to cope with effects of climate change
Baseline is the population supported in the base year. Base year is 2015 or a year closer to it (more or less than 2 years). Base year other than 2015 should be clearly indicated with rationale (e.g. most recent year with available data). Where reasonable estimates are not available or could not be made, base year can be assumed to be zero for SO6.
Target year is 2030. If national targets are available in a year other than 2030, such as 2020, 2025, or 2050, approximations can be made with a simple forecast or regression calculation.
Availability of national targetNational targets for the total population to be supported in coping with the effects of climate change are unlikely to be available. In this case, reasonable approximations of the vulnerable population at the intervention region/sector should be scoped and indicated as a plausible national target.
Annex XII. Methodology guidance sheet for Strategic Outcome 6 — Enhanced adaptation to climate changeGGGI Strategic Outcomes Guideline

85
Methodology for calculation National Target Level (NTL) (cont.)
Example:
Country X has a project supporting the development and implementation of a disaster risk reduction plan for the most climate vulnerable province of the country. It is estimated that 85% of the population of the country is vulnerable to the effects of climate change. The population of the province is estimated to be 2.3 million by 2030. Assuming that 85% of the population of the province is vulnerable to the effects of climate change, a plausible NTL for SO6 for the country program is 0.85 × 2.3 = 1.96 million.
Sources of Data and Dataavailability
For the CPI:• Population data from the latest household census
For the CPT:• Population data from the latest household census
For the NTL:• National targets for the total population to be supported in coping with the effects of climate change
are unlikely to be available. Possible sources for estimates at sectoral level include:• INDCs/ NDCs• National strategies / plans (for energy access, access to clean drinking water, access to sanitation,
coverage of climate smart agriculture)• Population data from UN population projections.
Reporting and estimation scope
• Reporting period is the specified period within WPB• Reporting is required for each project and at country program level• For CPI and CPT: Qualifying outputs in the current WPB. (If an output is an extension of a project/
output from a previous WPB cycle, reporting is required for the scope that has changed. Continuing projects/outputs from a previous WPB cycle with no change in scope do not require reporting.)
• Impact project / year for reporting: • CPI: Impacts from the lifetime of the project/output • CPT: Impacts from the lifetime of the project/output that is envisioned to be scaled up, or by a
future year, whichever applies• NTL: by 2030
Annex XII. Methodology guidance sheet for Strategic Outcome 6 — Enhanced adaptation to climate changeGGGI Strategic Outcomes Guideline

86Annex XIII. Sources of the Investment Multipliers values used in approximating the Targeted Attribution Impacts (TAIs) outlined in GGGI Strategy 2030GGGI Strategic Outcomes Guideline
Annex XIII. Sources of the Investment Multipliers values used in approximating the Targeted Attribution Impacts (TAIs) outlined in GGGI Strategy 2030Table A-3. Investment Multipliers used to estimate TAIs outlined in GGGI Strategy 2030. Identifiers given to investment interventions and Investment Multipliers are shown in brackets e.g. (GI-3-SO2)
Primary green investment intervention
SO1:
GH
G e
miss
ions
re
ducti
onU
SD /t
on C
O2e
SO2:
Cre
ation
of
gree
n jo
bs60
Num
ber
of J
obs/
mill
ion
USD
SO3.
1: A
cces
s to
cl
ean
and
affor
dabl
e en
ergy
Ben
efici
arie
s /
mill
ion
USD
SO3.
2: A
cces
s to
im
prov
ed s
anita
tion
Ben
efici
arie
s / m
illio
n U
SD
SO3.
3: A
cces
s to
w
aste
man
agem
ent
Ben
efici
arie
s / m
illio
n U
SD
SO3.
4: A
cces
s to
su
stai
nabl
e tr
ansp
ort
Pass
enge
r‑km
/ m
illio
n U
SD
SO5:
Mai
nten
ance
of
natu
ral C
apita
lU
SD /
ha
SO6:
Ada
ptati
on
to c
limat
e ch
ange
Pe
ople
/ Mill
ion
USD
(GI‑1) Solar PV (utility scale)
(GI-1-SO1) 29.00
(GI-1-SO2) 1.22
- - - - - -
(GI‑2) Solar PV (off-grid systems for energy access)
(GI-2-SO1) 24.00
(GI-2-SO2) 30.00
(GI-2-SO3.1) 33,126.87
- - - - -
(GI‑3) Energy efficiency in Industry
(GI-3-SO1) (13.61)
(GI-3-SO2) 5.70
- - - - - -
(GI‑4) Energy efficiency in buildings
(GI-4-SO1) (27.90)
(GI-4-SO2) 8.60
- - - - - -
(GI‑5) E‑mobility & sustainable public transport infrastructure
(GI-5-SO1) 13.30
(GI-5-SO2) 52.00
- - - (GI-5-SO3.4) 8,589.39
- -
(GI‑6) Municipal waste‑management
(GI-6-SO1) (17.30)
(GI-6-SO2) 12.86
- - (GI-6-SO3.3) 38,928.76
- - -
60 Only for direct jobs; excludes indirect and induced jobs

87 Annex XIII. Sources of the Investment Multipliers values used in approximating the Targeted Attribution Impacts (TAIs) outlined in GGGI Strategy 2030GGGI Strategic Outcomes Guideline
Table A-3. Investment Multipliers used to estimate TAIs outlined in GGGI Strategy 2030. Identifiers given to investment interventions and Investment Multipliers are shown in brackets e.g. (GI-3-SO2) (cont.)
Primary green investment intervention
SO1:
GH
G e
miss
ions
re
ducti
onU
SD /t
on C
O2e
SO2:
Cre
ation
of
gree
n jo
bs15
Num
ber
of J
obs/
mill
ion
USD
SO3.
1: A
cces
s to
cl
ean
and
affor
dabl
e en
ergy
Ben
efici
arie
s /
mill
ion
USD
SO3.
2: A
cces
s to
im
prov
ed s
anita
tion
Ben
efici
arie
s / m
illio
n U
SD
SO3.
3: A
cces
s to
w
aste
man
agem
ent
Ben
efici
arie
s / m
illio
n U
SD
SO3.
4: A
cces
s to
su
stai
nabl
e tr
ansp
ort
Pass
enge
r‑km
/ m
illio
n U
SD
SO5:
Mai
nten
ance
of
natu
ral c
apita
lU
SD /
ha
SO6:
Ada
ptati
on
to c
limat
e ch
ange
Pe
ople
/ Mill
ion
USD
(GI‑7) Waste management (Agri / Industry)
(GI-7-SO1) (18.60)
- - - - - - -
(GI‑8) Sanitation
- (GI-8-SO2) 54.50
- (GI-8-SO3.2) 27,151.52
- - - -
(GI‑9) Climate smart agriculture/ Enhancement of agricultural value chains / Natural capital conservation
(GI-9-SO1) 12.00
(GI-9-SO2) 448.25
- - - - (GI-9-SO5) 6710.00
(GI-9-SO6) 2,498.68
(GI‑10) Solar pumping for irrigation
(GI-10-SO1) 20.00
(GI-10-SO2) 10.00
- - - - - -
Cost per one beneficiary
- - 30.19 36.83 25.69 - - 400.21
Diverse data sources underpin the assumed values of the Investment Multipliers (IMs). As the purpose of the analysis is the first-order estimation of impacts, a number of broad assumptions are made in determining the values of the IM, based on supporting evidence.
The IM values are assumed to be uniform across regions and countries. Evidence from recent years, for example for jobs created per million USD or beneficiaries per million USD, are assumed
to apply for present and future years. For estimations requiring greater accuracy, such as for evaluation of project impacts at country level using the top-down approach, these factors need to be considered.
Information on supporting evidence is provided below for each IM, represented by the respective identifiers provided in brackets in the table.

88Annex XIII. Sources of the Investment Multipliers values used in approximating the Targeted Attribution Impacts (TAIs) outlined in GGGI Strategy 2030GGGI Strategic Outcomes Guideline
GI-1-SO1
Gillingham, Kenneth, and James Stock, “The Cost of Reducing Greenhouse Gas Emissions,” Journal of Economic Perspectives (forthcoming) https://scholar.harvard.edu/files/stock/files/gillingham_stock_cost_080218_posted.pdf
Refer to Table 1 in Page 7.
GI-1-SO2
Schwartz, Jordan, Luis Andrés and Georget Dragoiu, “Crisis in Latin America Infrastructure Investment, Employment and the Expectations of Stimulus,” The World Bank, Policy Research Working Paper Series, 2009. https://www.researchgate.net/publication/46443800_Crisis_in_Latin_America_Infrastructure_Investment_Employment_and_the_Expectations_of_Stimulus
Refer to Figure 3 on Page 9.
Aggregate direct employment value (per USD 1 Billion) indicated for solar power infrastructure projects in Latin America in 2009.
GI-2-SO2
Climate Investment Funds, Program Approval Request for the Project Renewable Energy Mini-grids and Distributed Power Generation. https://www.climateinvestmentfunds.org/sites/cif_enc/files/140508%20ADB%20CTF%20Proposal%20-%20RE%20Mini-Grids%20Program%20PUBLIC_1.pdf
Refer to page I and III for project data.
Authors’ estimation; based on information of investment capital and estimation of direct jobs created in 3 projects on renewable energy mini-grids and distributed power generation in India, Indonesia and Philippines.
GI-2-SO3.1
Symbiotics, “New USD 32.5 million facility for ZOLA Tanzania’s expansion,” Plumseeds (blog), Symbiotics, December 11, 2018. https://www.plumseeds.com/blog/10
The World Bank. “Projects and Operations,” https://projects.worldbank.org/
Refer to Energy Sector, Theme: Rural services and infrastructure, Project IDs: P103037; P108444; P110978; P111567; P110075; and P092211.
Comments: Authors’ estimation; average of “beneficiaries per one million USD invested” values available for (1) seven finalized World Bank projects related to renewable energy access in developing countries, and (2) one private sector led energy access project in Tanzania (USD 32.5 million facility for ZOLA Tanzania’s expansion) in year 2018.
GI-5-SO3.4
Edilberto, Lopez Bernal, “Evaluaci Expost e Impacto de Transmilenio” CDIM-ESAP, 2006. https://www.yumpu.com/es/document/read/19226486/evaluacion-expost-e-impact-de-transmilenio-cdim-esap
Refer to Page 73; Section 8.4 “Economic Impact”
The Green Climate Fund, Funding Proposal FP085: Green BRT Karachi, November 2018, https://www.greenclimate.fund/documents/20182/574760/Funding_Proposal_-_FP085_-_ADB_-_Pakistan.pdf/82760637-bab2-18af-9a76-1ec6b5eed556
Refer to Page 7, Table B.2. Data on Total Project FinancingRefer to Page 6, Table B.1 on number of residents benefited
Lobo, Adriana, “$150 million to transform sustainable public transport in Mexico City” TheCityFix (blog), World Resources Institute, March 17, 2015, https://thecityfix.com/blog/investment-sustainable-accessible-mexico-city-metrobus-brt-adriana-lobo/
The World Bank. “Projects and Operations,” https://projects.worldbank.org/
Refer to Project ID: P114012
Comments: Authors’ estimation; the average of “beneficiaries per one million USD invested” values available for the four (4) transport projects: (1) an urban transport sector project from the World Bank focused on increase use of less energy intensive transport modes; (2) a project in Mexico aimed at inducing policy changes for promoting sustainable transport; (3) a project funded by GCF to implement BRT system in Karachi, Pakistan. (4) Colombia Transmilenio BRT System project.
GI-6-SO3
The World Bank. “Projects and Operations,” https://projects.worldbank.org/
Refer to Energy Sector, Theme: urban services and housing for the poor & other urban development. Project IDs: P124664; P112626; and P115664
Comments: Authors’ estimation; the average of “beneficiaries per one million USD invested” values from three (3) finalized World Bank projects aimed at increasing the provision of solid waste services and volume of collected and disposed waste.
GI-3-SO1
McKinsey & Company, Pathways to a Low-Carbon Economy, Version 2 of the Global Greenhouse Gas Abatement Cost Curve, 2009, https://www.mckinsey.com/~/media/McKinsey/Business%20Functions/Sustainability/Our%20Insights/Pathways%20to%20a%20low%20carbon%20economy/Pathways%20to%20a%20low%20carbon%20economy.ashx
Refer to pages 67, 74 and 81
https://www.yumpu.com/es/document/read/19226486/evaluacion-expost-e-impact-de-transmilenio-cdim-esap
https://www.yumpu.com/es/document/read/19226486/evaluacion-expost-e-impact-de-transmilenio-cdim-esap
https://www.yumpu.com/es/document/read/19226486/evaluacion-expost-e-impact-de-transmilenio-cdim-esap
https://thecityfix.com/blog/investment-sustainable-accessible-mexico-city-metrobus-brt-adriana-lobo/
https://thecityfix.com/blog/investment-sustainable-accessible-mexico-city-metrobus-brt-adriana-lobo/
https://thecityfix.com/blog/investment-sustainable-accessible-mexico-city-metrobus-brt-adriana-lobo/

89
Comments: Authors’ estimation; the average of 2015 GHG abatement costs of the following industries: Petroleum and Gas, Cement, Iron and Steel, and Chemicals.
GI-4-SO1
McKinsey & Company, Pathways to a Low-Carbon Economy, Version 2 of the Global Greenhouse Gas Abatement Cost Curve, 2009, https://www.mckinsey.com/~/media/McKinsey/Business%20Functions/Sustainability/Our%20Insights/Pathways%20to%20a%20low%20carbon%20economy/Pathways%20to%20a%20low%20carbon%20economy.ashx
Refer to page 109
Comments: Authors’ estimation; the average of 2015 GHG average abatement cost for energy efficiency measures in buildings.
GI-5-SO1
McKinsey & Company, Pathways to a Low-Carbon Economy, Version 2 of the Global Greenhouse Gas Abatement Cost Curve, 2009, https://www.mckinsey.com/~/media/McKinsey/Business%20Functions/Sustainability/Our%20Insights/Pathways%20to%20a%20low%20carbon%20economy/Pathways%20to%20a%20low%20carbon%20economy.ashx
Refer to page 101
Comments: Authors’ estimation; the average of 2015 GHG average abatement cost for sustainable transport modes and measures. In sustainable road transport modes and measures such as behavioral changes by LDV consumers, commercial transport improvements for MDVs and HDVs, and traffic system improvements for all vehicle types are considered.
GI-6-SO1
McKinsey & Company, Pathways to a Low-Carbon Economy, Version 2 of the Global Greenhouse Gas Abatement Cost Curve, 2009, https://www.mckinsey.com/~/media/McKinsey/Business%20Functions/Sustainability/Our%20Insights/Pathways%20to%20a%20low%20carbon%20economy/Pathways%20to%20a%20low%20carbon%20economy.ashx
Refer to page 115
Comments: Authors’ estimate; the average of 2015 GHG average abatement cost for waste management interventions. The following municipal waste management interventions are considered: direct use of landfill gas, waste recycling, electricity generation with landfill gas and composting of wastes.
GI-7-SO1
McKinsey & Company, Pathways to a Low-Carbon Economy, Version 2 of the Global Greenhouse Gas Abatement Cost Curve, 2009, https://www.mckinsey.com/~/media/McKinsey/Business%20Functions/Sustainability/Our%20Insights/Pathways%20to%20a%20low%20carbon%20economy/Pathways%20to%20a%20low%20carbon%20economy.ashx
Refer to page 115
Comments: The 2015 GHG average abatement cost for waste recycling (which includes industrial waste) intervention.
GI-9-SO1
McKinsey & Company, Pathways to a Low-Carbon Economy, Version 2 of the Global Greenhouse Gas Abatement Cost Curve, 2009, https://www.mckinsey.com/~/media/McKinsey/Business%20Functions/Sustainability/Our%20Insights/Pathways%20to%20a%20low%20carbon%20economy/Pathways%20to%20a%20low%20carbon%20economy.ashx
Comments: The 2015 GHG average abatement cost for natural capital conservation. Natural capital conservation includes forestry interventions such as forest Management, reforestation and afforestation.
No information is available for climate smart agriculture or enhancement of agriculture value chain interventions.
GI-3-SO2
Environmental Protection Agency, Estimating the Multiple Benefits of Energy Efficiency and Renewable Energy, 2018, https://www.epa.gov/sites/production/files/2018-07/documents/mbg_2-5_economicbenefits.pdf
Refer to Part 2: Quantifying the Benefits: Framework, Methods, and Tools. Chapter 5: Estimating the Economic Benefits of Energy Efficiency and Renewable Energy, Page 5-5, Table 5-2
Comments: Value of employment impact in one US project related to expenditure on energy efficiency technology manufacturing and installation.
GI-4-SO2
Environmental Protection Agency, Estimating the Multiple Benefits of Energy Efficiency and Renewable Energy, 2018, https://www.epa.gov/sites/production/files/2018-07/documents/mbg_2-5_economicbenefits.pdf
Refer to Part 2: Quantifying the Benefits: Framework, Methods, and Tools. Chapter 5: Estimating the Economic Benefits of Energy Efficiency and Renewable Energy, Page 5-5, Table 5-2
Comments: Authors’ estimation; the average of direct employment factors for energy efficiency interventions in the residential buildings in multiple studies in the US.
Annex XIII. Sources of the Investment Multipliers values used in approximating the Targeted Attribution Impacts (TAIs) outlined in GGGI Strategy 2030GGGI Strategic Outcomes Guideline

90
GI-5-SO2
International Finance Corporation, Estimating the Socioeconomic Impact of IFC Financing: Macro case studies from Ghana, Jordan, Sri Lanka and Tunisia, 2012.worldbank.org/curated/en/502471468040513178/pdf/820400BRI0Soci00Box379851B00PUBLIC0.pdf
Refer to page 1, Figure 1 & 2
Comments: Authors’ estimate; average of direct employment effects in sustainable transport interventions in Tunisia and Sri Lanka.
GI-8-SO2
International Finance Corporation, Estimating the Socioeconomic Impact of IFC Financing: Macro case studies from Ghana, Jordan, Sri Lanka and Tunisia, 2012.worldbank.org/curated/en/502471468040513178/pdf/820400BRI0Soci00Box379851B00PUBLIC0.pdf
Refer to page 1, Figure 1 & 2
Comments: Authors’ estimate; average of direct employment effects of interventions in the utilities sector (which includes electricity, gas manufacture & distribution, and water) in Tunisia and Sri Lanka.
GI-6-SO2
Kaza, Silpa, Lisa C. Yao, Perinaz Bhada-Tata, and Frank van Woerden. What a Waste 2.0: A Global Snapshot of Solid Waste Management to 2050. Washington, DC: World Bank, 2018. https://openknowledge.worldbank.org/handle/10986/30317
Refer to page 105, Table 5.2
Environmental Protection Agency, Resource conservation challenge: campaigning against waste, 2002, https://nepis.epa.gov/Exe/ZyPURL.cgi?Dockey=10000KXG.txt
Refer to page 2
Comments: Authors’ estimate; based on the maximum level of typical waste management costs by disposable type in upper middle-income countries (USD/ton) in the World Bank report and the jobs created per ton created if trash is recycled or retrieved from a study in the US in the EPA report.
GI-8-SO3.2
Hutchings, P., M. Johns, D. Jornet, C. Scott, and Z. Van den Bossche, “A systematic assessment of the pro-poor reach of development bank investments in urban sanitation.” Journal of Water, Sanitation and Hygiene for Development, Vol 8, Issue 3 (April 2019): 402-414. https://doi.org/10.2166/washdev.2018.147
Refer to Table 3
Hutton, Guy, and Laurence Haller. Evaluation of the Costs and Benefits of Water and Sanitation Improvements at the Global Level. Geneva: World Health Organization, 2004. https://www.who.int/water_sanitation_health/wsh0404.pdf
Refer to page 8
Comments: Authors’ estimate; the average for the following is used: (1) initial investment cost per capita (USD in Year 2000) for simple pit latrines in the regions of Africa, Asia, and LA&C (Hutchings et al., 2018), and (2) impact investment effect of development banks in urban sanitation projects.
GI-9-SO2
International Finance Corporation, Estimating the Socioeconomic Impact of IFC Financing: Macro case studies from Ghana, Jordan, Sri Lanka and Tunisia, 2012.worldbank.org/curated/en/502471468040513178/pdf/820400BRI0Soci00Box379851B00PUBLIC0.pdf
Refer to page 1, Figure 1 & 2
International Finance Corporation, Socio-Economic Impact of IFC Financing in Ghana, 2012, http://documents.worldbank.org/curated/en/136231468249312550/pdf/820360WP0SEIA000Box379851B00PUBLIC0.pdf
International Finance Corporation, Socio-Economic Impact of IFC Financing in Jordan, 2012, http://documents.worldbank.org/curated/en/564371468038676446/pdf/820370WP0SEIA000Box379851B00PUBLIC0.pdf
Comments: Authors’ estimate; assumed to be the average of the direct employment potential in interventions in the agricultural sector (which includes crop agriculture, forestry and fishing) in Tunisia and Sri Lanka (refer to IFC 2012, page 1, Figure 1 & 2), Ghana (refer to page 22, Table 6 in the Ghana report), and Jordan (refer to Page 20, Table 6 in the Jordan report).
GI-10-SO1
Olsson, Alexander, “An evaluation of solar powered irrigation as carbon offset projects” (licentiate thesis in Chemical Engineering, KTH Royal Institute of Technology, 2016). https://pdfs.semanticscholar.org/e324/b2ae82ffef75814e02d6b97e55ffd74ebc0c.pdf
Refer to page 14
Comments: GHG emissions reduction estimate available for a solar pumping project in China.
Annex XIII. Sources of the Investment Multipliers values used in approximating the Targeted Attribution Impacts (TAIs) outlined in GGGI Strategy 2030GGGI Strategic Outcomes Guideline

91
GI-10-SO2
Environmental and Climate Change Research Institute, Socio-economic Impacts of Solar Pumping System in Term of Local Job and Value Creation in Egypt, 2017, (initial draft report) https://energypedia.info/images/0/00/Socio-economic_Impacts_of_Solar_Pumping_System_in_Term_of_Local_Job_and_Value_Creation_in_Egypt.pdf
Refer to page 69
Comments: Direct jobs creation estimate available for a solar pumping project in Cairo, Egypt.
GI-9-SO5
International Institute for Sustainability, “The Economics of Restoration Costs, benefits, scale and spatial aspects” Power-Point presentation, CBD meeting, Linhares, March 2014. https://www.cbd.int/doc/meetings/ecr/cbwecr-sa-01/other/cbwecr-sa-01-iis-en.pdf
Refer to Slide 4
Comments: Authors’ estimate; calculated as the average of typical restoration costs for mangroves, inland wetlands, lakes/rivers, tropical forests, other forests, woodland, and grasslands.
GI-9-SO6
The World Bank. “Projects and Operations,” https://projects.worldbank.org/
Refer to Energy Sector, Theme: Rural services and infrastructure. Project IDs: P118838, P128905; P096556; and P123457
Comments: Authors’ estimate; the average of “beneficiaries per one million USD invested” in four (4) finalized World Bank projects related to increasing agricultural productivity and eco-farming in developing countries is taken.
Annex XIII. Sources of the Investment Multipliers values used in approximating the Targeted Attribution Impacts (TAIs) outlined in GGGI Strategy 2030GGGI Strategic Outcomes Guideline

92Annex XIV. Example SO template for reporting CPI and CPT impact estimatesGGGI Strategic Outcomes Guideline
Annex XIV. Example SO template for reporting CPI and CPT impact estimatesREQUIRED Country
AUTOMATIC Region
Project #1
REQUIRED Project name
REQUIRED GGGI Online Project Code
REQUIRED Strategic Outcome #3.3
AUTOMATIC Indicator
AUTOMATIC Units of Indicator
ONLY IF APPLICABLE Sector of Category of reporting
REQUIRED
REQUIRED
Country X
Asia
Wastewater and Solid Waste Treatment Capacity Building Project for City EnvironmentImprovement in Country X
XX 09
SO 3.3‑ Access to sustainable waste management
Number of people who gained access to solid waste management services
Million people
Summary of Results RESULT Country Project Impact (CPI) RESULT Country Program Target (CPT)
Total direct beneficiaries 0.0181 0.1656
Total direct beneficiaries who are female
0
0
0
Country Project Impact (CPI)
Primary Data Use
120,999 inhabitants in target area (ZZ district in Capital YY)
Assumptions
Trucks for waste collection are not accesible.
References or Links to primary data
Population of target area: The 4th Population and Housing Census (PHC) 2015
Calculations
120,999 inhabitants x 15%=18,150 inhabitants

93 Annex XIV. Example SO template for reporting CPI and CPT impact estimatesGGGI Strategic Outcomes Guideline
Country Program Target (CPT)
Primary Data Use
Projected population in 2030: 1,141,911 inhabitants in YY Capital
Assumptions
In 2013, waste collection coverage and waste collection rate of YY Capital is 71% and 20.5%, respectively.Waste collection rate taget by 2020 is 40.2%.Assuming that (1) by 2030, waste collection coverage in YY Capital increases by 50% of non-serviced area in 2013; (2) waste collection rate target by 2020 (40.2%) is achieved; (3) and this waste collection rate additionally increases by 50% of the households residing in service areas without waste collection contract by 2030, estimated waste collection rate by 2030 = 40.2+[{71+ (100-71)*0.5} - 40.2]*0.5 = 62.85 (%)If GGGI intervenes to expand waste collection service coverage in the remaining non-serviced area with full collection contract, which accounts for 14.5% = 100-{71+(100-71)*0.5} of all households in the city, estimated waste collection rate by 2030 = 62.85 + 14.5 = 77.35 (%)
References or Links to primary data
1) Population projection: XX population projections 2015-2045’. We gained this report directly from UNFPA2) Waste collection rate (baseline 2013):p3-19 XX Pilot Program for Narrowing the Development Gap. available at: http://XX.com
Calculations
1,141,911 inhabitants x (77.35% - 62.85%)=165,577 inhabitants


ABOUT THE GLOBAL GREEN GROWTH INSTITUTE
The Global Green Growth Institute was founded to support and promote a model of economic growth known as “green growth”, which targets key aspects of economic performance such as poverty reduction, job creation, social inclusion and environmental sustainability.
Headquartered in Seoul, Republic of Korea, GGGI also has representation in a number of partner countries.
Member Countries: Australia, Cambodia, Costa Rica, Denmark, Ethiopia, Fiji, Guyana, Hungary, Indonesia, Jordan, Kiribati, Republic of Korea, Mexico, Mongolia, Norway, Papua New Guinea, Paraguay, Philippines, Qatar, Rwanda, Senegal, Thailand, United Arab Emirates, United Kingdom, Vanuatu, Vietnam
Operations: Cambodia, China, Colombia, Ethiopia, Fiji, India, Indonesia, Jordan, Laos, Mexico, Mongolia, Morocco, Mozambique, Myanmar, Nepal, Peru, Philippines, Rwanda, Senegal, Thailand, Uganda, United Arab Emirates, Vanuatu, Vietnam

ChapterGGGI Strategic Outcomes Guideline97
Follow our activities on Facebook and Twitter
www. gggi.org