Guideline - Edelweiss
44
Guideline
-
Upload
khangminh22 -
Category
Documents
-
view
0 -
download
0
Transcript of Guideline - Edelweiss
Guideline
Contents
1. System configuration required for TX3. 1
2. Now get All Pre-Login!! 1
3. How to Login? 2
4. User Watchlist 4
4A. Creating a Watchlist 4
4B. Adding Scrip in Watchlist 4
4C. Pre-defined Watchlist 4
4D. Adding/Deleting Column in Watchlist 4
5. Adding Indices 6
6. Order Placement 7
6A. Exchange Segment 7
6B. Instrument types for derivatives segment - NFO, CDS 7
6C. Option types under the derivatives segment - NFO, CDS 7
6D. Product Type 7
6E. Order type 8
6F. Validity 8
7. Snap Quote 8
8. Buy Order 9
9. Sell Order 9
10. After Market Orders (AMOs) 9
11. Cover Order 10
12. Basket Orders 11
13. Order Book 11
13A. Viewing Orders Placed 11
13B. Modifying Orders 11
13C. Cancelling Pending Orders 11
13D. Cancelling Cover Orders 11
Contents
14. Trade Book 12
14A. View Completed Orders 12
14B. Position Conversion 12
15. Position Book/Net Position 12
15A. Squaring-off open positions 12
16. Portfolio 13
17. Holdings 13
18. Limits 14
18A. Understanding each item in Limits Section 14
19. Fund Transfer 15
20. My Reports 17
21. Research 17
22. User Setting 19
22A. Market Watch 19
22B. Order Placement 20
23. Market Stats 21
23A. Sector Performance 21
23B. Market Map 22
23C. AD Ratio 23
23D. Index Pullers and Draggers 23
23E. FII and DII flow 24
23F. Seasonality Analysis 24
23G. Equity Market Analysis 25
23H. Futures Market Analysis 26
23I. Options Market Analysis 26
24. Charting 28
24A. Features available in Charting 30
24B. Charting Shortcuts 34
Contents
25. Tools 35
25A. Set Alerts 35
25B. Option Calculator with What-if Analysis 36
25C. Event Calendar 37
26. Stock Quote Page 38
27. Implied Volatility (IV) 40
28. Link to Excel 40
29. Share Feedback 40
30. For further queries on TX3 40
Terminal X3 (TX3)
1
1. System configuration required for TX3?Kindly note the minimum system configuration required for Xtreme Trader:
2. Now get All Pre-Login!!Now login in only if you want to trade and see your reports. Track Market watch, analytical data and do technical analysis without logging in. You can create device Watchlist and add stocks you want to track in this Watchlist without logging in. You need to login if you want to see the Watchlist which you have created on any other platform (Xtreme Trader, EMT, etc.) and this will be synced across all platforms.
TX3 (Client) - Desktop RequirementsIntel(R) i3 ProcessorIntegrated Broadcom(R) 10/100/1000 LOM(BCM5787)4GB(1x1GB) NECC DDR 667MHz SDRAM Memory8x DVD-ROM DriveKeyboard, Mouse, Monitor80GB SATA/SAS Hard DriveOS: Microsoft(R) Windows 7 with latest Windows updatesNorton Antivirus Corporate EditionPower Cord, Network Cord
Back to Content Page
2Back to Content Page
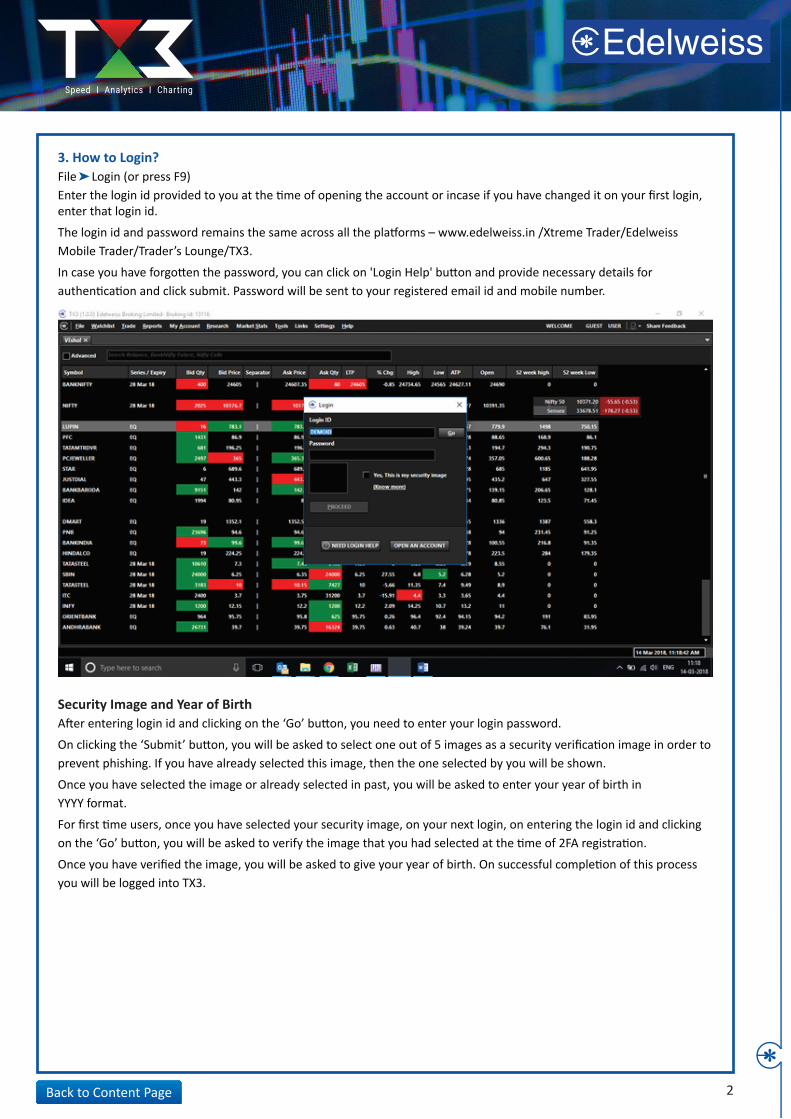
3. How to Login?File Login (or press F9)Enter the login id provided to you at the time of opening the account or incase if you have changed it on your first login, enter that login id.
The login id and password remains the same across all the platforms – www.edelweiss.in /Xtreme Trader/Edelweiss Mobile Trader/Trader’s Lounge/TX3.
In case you have forgotten the password, you can click on 'Login Help' button and provide necessary details for authentication and click submit. Password will be sent to your registered email id and mobile number.
Security Image and Year of BirthAfter entering login id and clicking on the ‘Go’ button, you need to enter your login password.
On clicking the ‘Submit’ button, you will be asked to select one out of 5 images as a security verification image in order to prevent phishing. If you have already selected this image, then the one selected by you will be shown.
Once you have selected the image or already selected in past, you will be asked to enter your year of birth inYYYY format.
For first time users, once you have selected your security image, on your next login, on entering the login id and clicking on the ‘Go’ button, you will be asked to verify the image that you had selected at the time of 2FA registration.
Once you have verified the image, you will be asked to give your year of birth. On successful completion of this process you will be logged into TX3.

After which your name is displayed at the upper right corner of the application with drop down menu. If you click on drop down menu you get access to your RM details like name, phone number and email id and link to access your profile or logout option.
3Back to Content Page
4. User Watchlist4A. Creating a Watchlist1. Click on the Watchlist menu item and select create Watchlist (or CTRL + V) 2. Enter the desired name and click ‘Ok’.Since everything is available, pre-login Watchlist will be created either on:
4B. Adding Scrip in WatchlistHow do I add Scrips to the Market watch?1. Select the Watchlist in which you would like to add scrips or contracts 2. Under search bar enter the name of the stock/contract and select the desired stock from the list of option and press ‘Enter’3. Repeat this step for adding another scrip or contract to the market watch 4. Once all the scrips are added to the market watch, it will be auto saved. While exiting the TX3 application it will again ask you whether you want to save Watchlist then click on ‘Yes’.
NoteWe have two types of search bars. They are:
4C. Pre-defined WatchlistIf you want to track stocks of any particular indices then you can load the index constituents from pre-defined Watchlist feature.For F&O trader we have created separate category ‘F&O stocks’ which can load list of stock traded in F&O segment. User has facility either to load underlying or specific expiry contracts.
4D. Adding/Deleting Column in WatchlistYou can add/delete various columns in the Watchlist. This can be done by doing a right click on any header you will get list of columns available select/unselect to add/delete.You can set security alert, view charts, get stock quote page and many more options in the right click menu bar. Just right click on any stock in Watchlist to get details of all other features available.
By default, it will be a global search bar where securities with all asset class will be listed in a single screen where you can switch older search experience by clicking on advanced search option.
Device (i.e., Device specific Watchlist)Or your login credential (i.e., as per user ID)
IMP NOTEDevice Watchlist will be specific to your device and can be accessible only on the PC on which you have installed TX3 Login specific Watchlist can be synced across all platform and any modification made on any platform (EMT, Xtreme) will be applied automatically in otherAny Watchlist created before login will be considered as Device Watchlist by default, unless the user saves after logging in. Similarly, any Watchlist created post login will be considered as user id specific and will be synced across all the Edelweiss platform.
Global SearchAdvanced Search (similar to Xtreme Trader)
4Back to Content Page
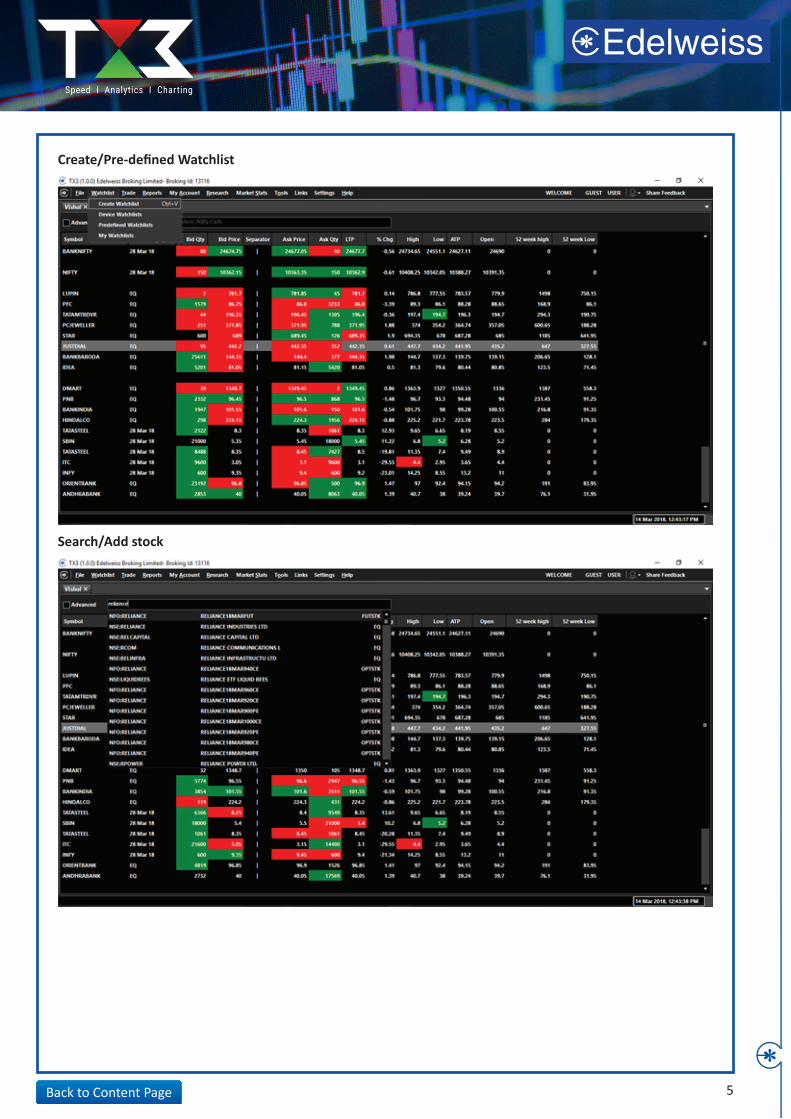
Create/Pre-defined Watchlist
Search/Add stock
5Back to Content Page
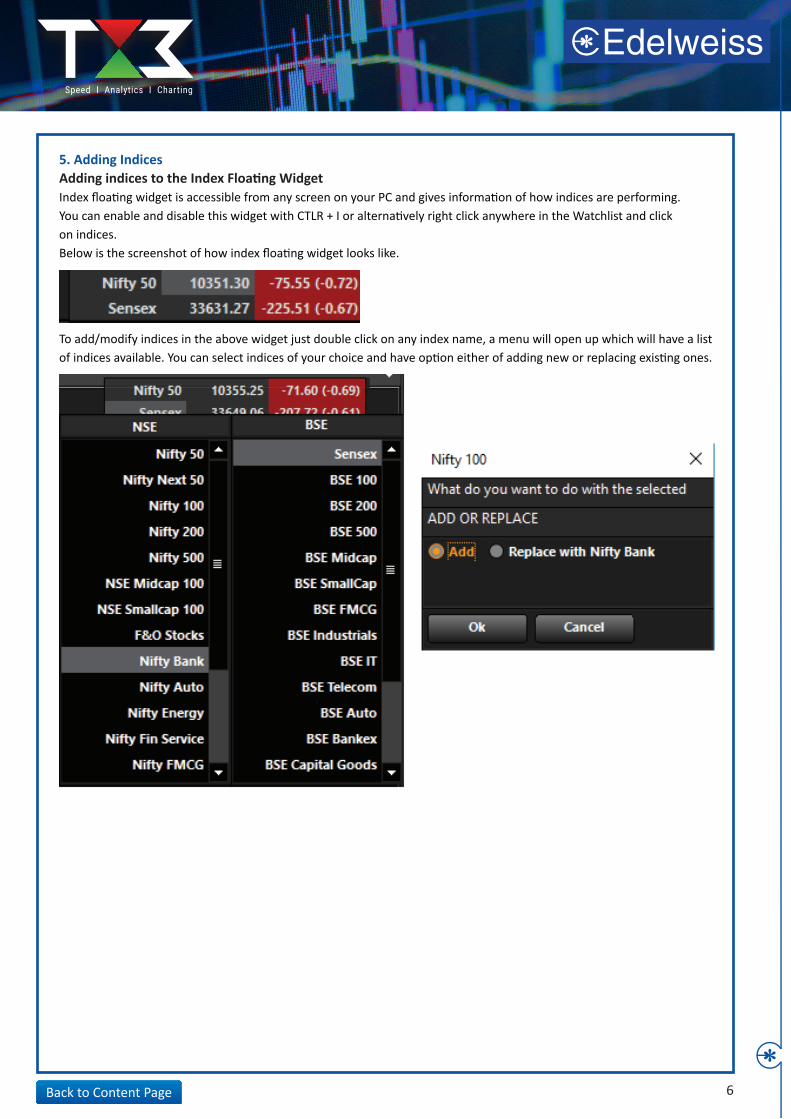
5. Adding IndicesAdding indices to the Index Floating WidgetIndex floating widget is accessible from any screen on your PC and gives information of how indices are performing. You can enable and disable this widget with CTLR + I or alternatively right click anywhere in the Watchlist and clickon indices.Below is the screenshot of how index floating widget looks like.
To add/modify indices in the above widget just double click on any index name, a menu will open up which will have a list of indices available. You can select indices of your choice and have option either of adding new or replacing existing ones.
6Back to Content Page
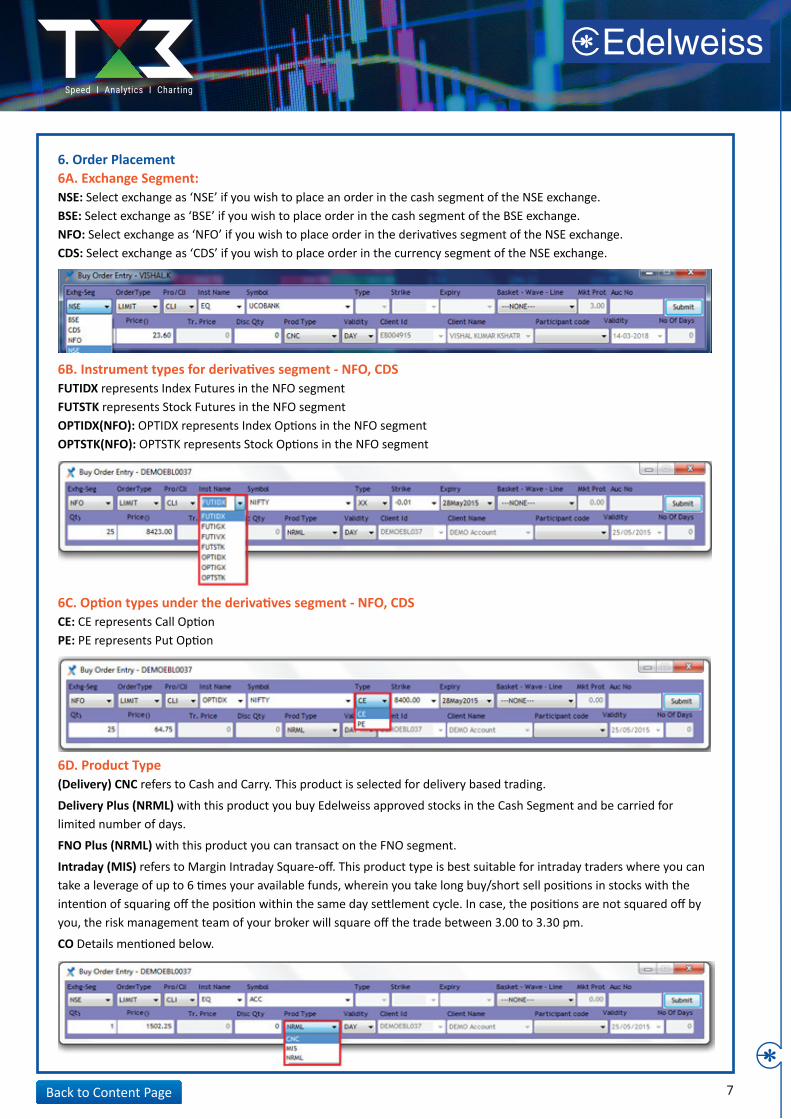
6. Order Placement6A. Exchange Segment:NSE: Select exchange as ‘NSE’ if you wish to place an order in the cash segment of the NSE exchange.BSE: Select exchange as ‘BSE’ if you wish to place order in the cash segment of the BSE exchange.NFO: Select exchange as ‘NFO’ if you wish to place order in the derivatives segment of the NSE exchange.CDS: Select exchange as ‘CDS’ if you wish to place order in the currency segment of the NSE exchange.
6D. Product Type(Delivery) CNC refers to Cash and Carry. This product is selected for delivery based trading.
Delivery Plus (NRML) with this product you buy Edelweiss approved stocks in the Cash Segment and be carried for limited number of days.
FNO Plus (NRML) with this product you can transact on the FNO segment.
Intraday (MIS) refers to Margin Intraday Square-off. This product type is best suitable for intraday traders where you can take a leverage of up to 6 times your available funds, wherein you take long buy/short sell positions in stocks with the intention of squaring off the position within the same day settlement cycle. In case, the positions are not squared off by you, the risk management team of your broker will square off the trade between 3.00 to 3.30 pm.
CO Details mentioned below.
6B. Instrument types for derivatives segment - NFO, CDSFUTIDX represents Index Futures in the NFO segmentFUTSTK represents Stock Futures in the NFO segment OPTIDX(NFO): OPTIDX represents Index Options in the NFO segment OPTSTK(NFO): OPTSTK represents Stock Options in the NFO segment
6C. Option types under the derivatives segment - NFO, CDSCE: CE represents Call OptionPE: PE represents Put Option
7Back to Content Page
8Back to Content Page
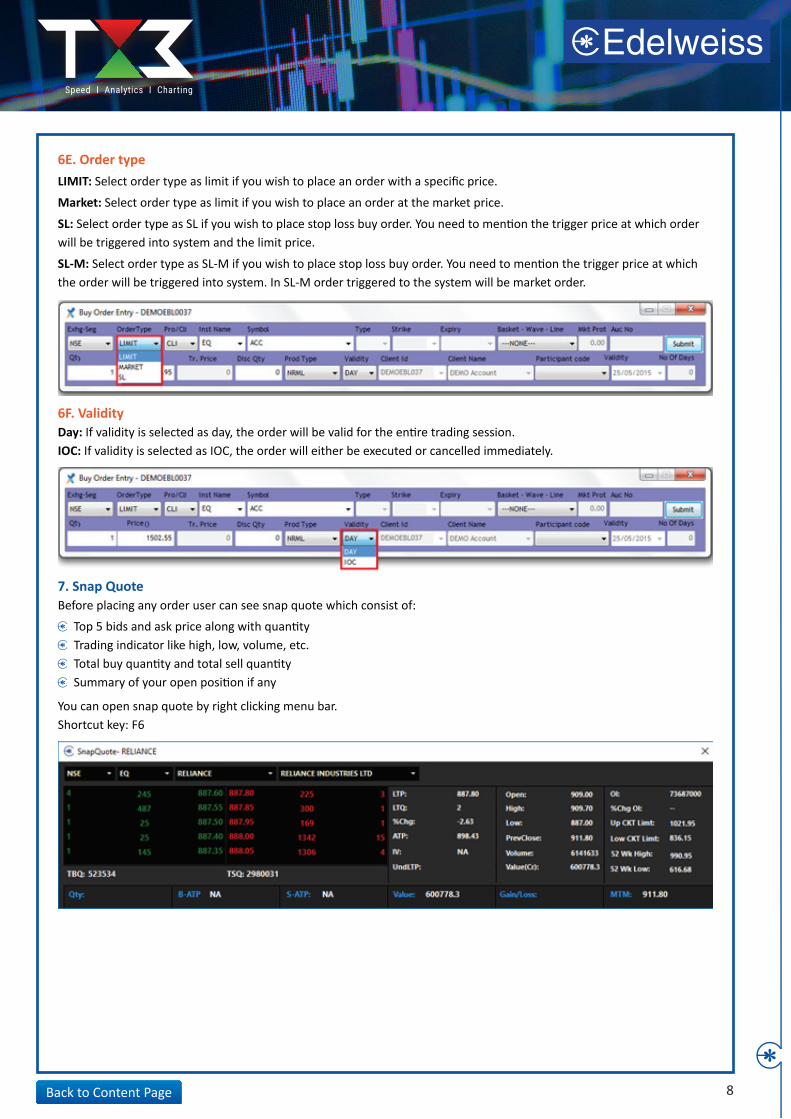
6E. Order typeLIMIT: Select order type as limit if you wish to place an order with a specific price.
Market: Select order type as limit if you wish to place an order at the market price.
SL: Select order type as SL if you wish to place stop loss buy order. You need to mention the trigger price at which order will be triggered into system and the limit price.
SL-M: Select order type as SL-M if you wish to place stop loss buy order. You need to mention the trigger price at which the order will be triggered into system. In SL-M order triggered to the system will be market order.
7. Snap QuoteBefore placing any order user can see snap quote which consist of:
You can open snap quote by right clicking menu bar. Shortcut key: F6
6F. ValidityDay: If validity is selected as day, the order will be valid for the entire trading session.IOC: If validity is selected as IOC, the order will either be executed or cancelled immediately.
Top 5 bids and ask price along with quantityTrading indicator like high, low, volume, etc.Total buy quantity and total sell quantitySummary of your open position if any
9
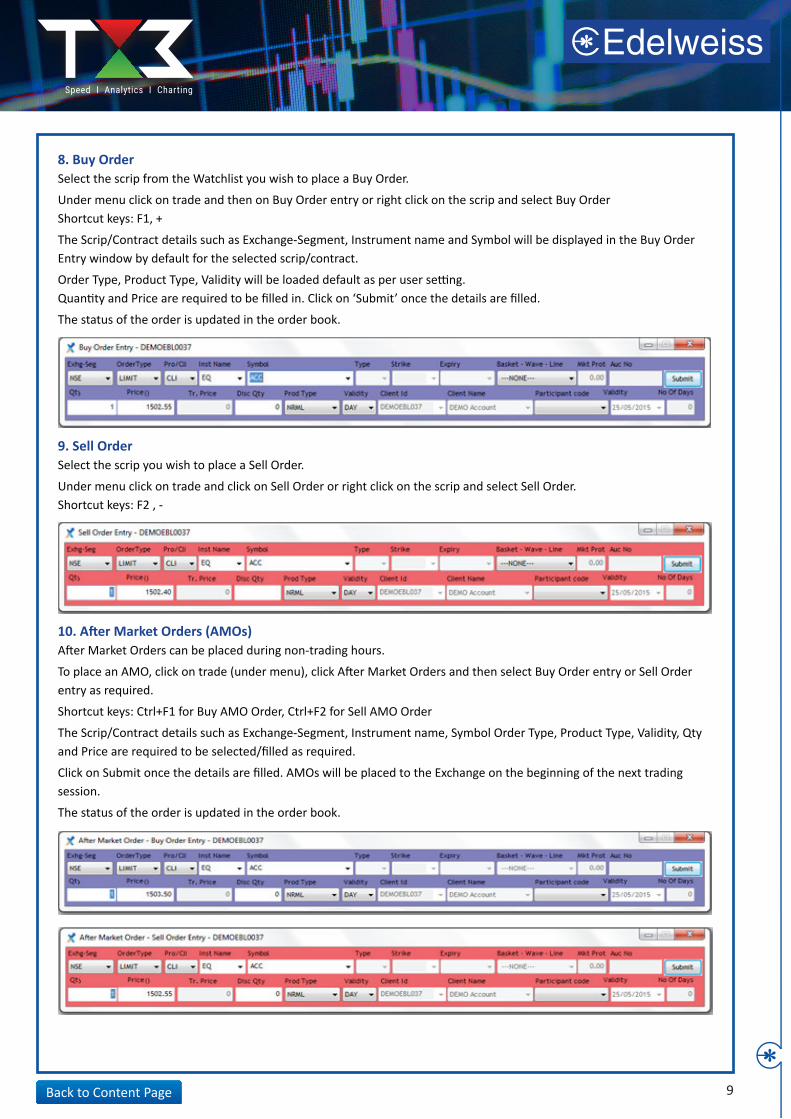
8. Buy OrderSelect the scrip from the Watchlist you wish to place a Buy Order.
Under menu click on trade and then on Buy Order entry or right click on the scrip and select Buy Order Shortcut keys: F1, +
The Scrip/Contract details such as Exchange-Segment, Instrument name and Symbol will be displayed in the Buy Order Entry window by default for the selected scrip/contract.
Order Type, Product Type, Validity will be loaded default as per user setting. Quantity and Price are required to be filled in. Click on ‘Submit’ once the details are filled.
The status of the order is updated in the order book.
10. After Market Orders (AMOs)After Market Orders can be placed during non-trading hours.
To place an AMO, click on trade (under menu), click After Market Orders and then select Buy Order entry or Sell Order entry as required.
Shortcut keys: Ctrl+F1 for Buy AMO Order, Ctrl+F2 for Sell AMO Order
The Scrip/Contract details such as Exchange-Segment, Instrument name, Symbol Order Type, Product Type, Validity, Qty and Price are required to be selected/filled as required.
Click on Submit once the details are filled. AMOs will be placed to the Exchange on the beginning of the next trading session.
The status of the order is updated in the order book.
9. Sell OrderSelect the scrip you wish to place a Sell Order.
Under menu click on trade and click on Sell Order or right click on the scrip and select Sell Order. Shortcut keys: F2 , -
Back to Content Page
10
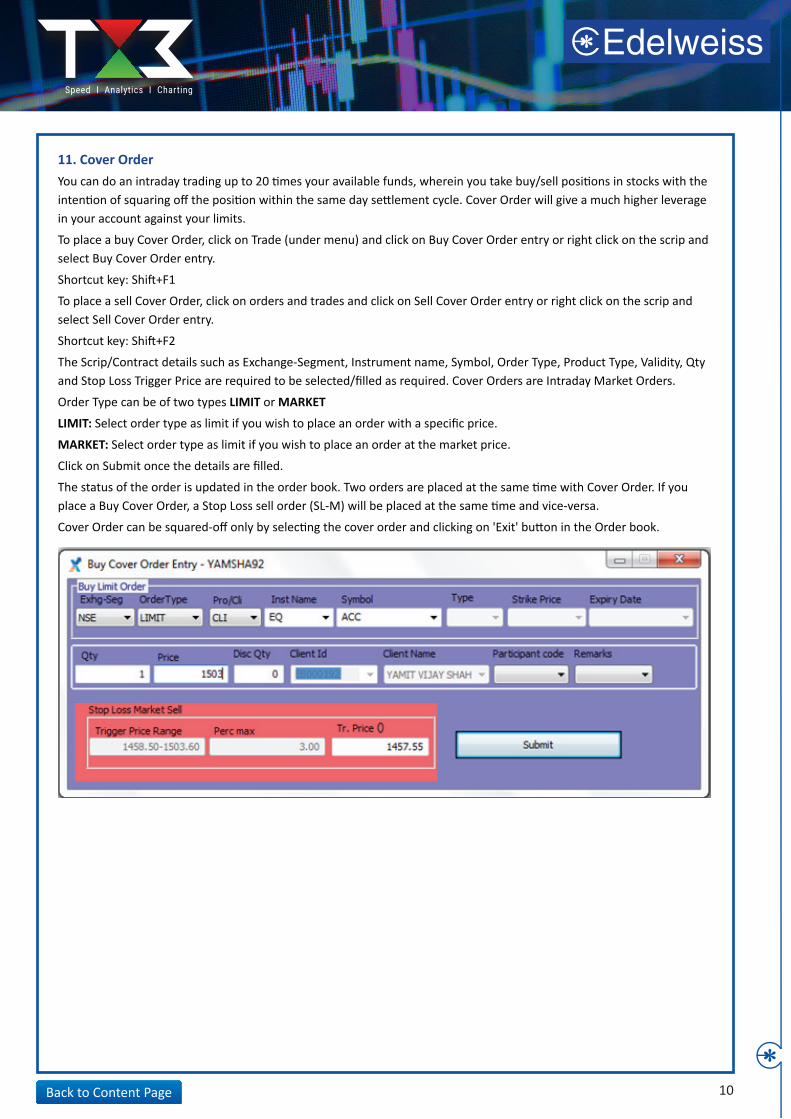
11. Cover OrderYou can do an intraday trading up to 20 times your available funds, wherein you take buy/sell positions in stocks with the intention of squaring off the position within the same day settlement cycle. Cover Order will give a much higher leverage in your account against your limits.
To place a buy Cover Order, click on Trade (under menu) and click on Buy Cover Order entry or right click on the scrip and select Buy Cover Order entry.
Shortcut key: Shift+F1
To place a sell Cover Order, click on orders and trades and click on Sell Cover Order entry or right click on the scrip and select Sell Cover Order entry.
Shortcut key: Shift+F2
The Scrip/Contract details such as Exchange-Segment, Instrument name, Symbol, Order Type, Product Type, Validity, Qty and Stop Loss Trigger Price are required to be selected/filled as required. Cover Orders are Intraday Market Orders.
Order Type can be of two types LIMIT or MARKET
LIMIT: Select order type as limit if you wish to place an order with a specific price.
MARKET: Select order type as limit if you wish to place an order at the market price.
Click on Submit once the details are filled.
The status of the order is updated in the order book. Two orders are placed at the same time with Cover Order. If you place a Buy Cover Order, a Stop Loss sell order (SL-M) will be placed at the same time and vice-versa.
Cover Order can be squared-off only by selecting the cover order and clicking on 'Exit' button in the Order book.
Back to Content Page
11
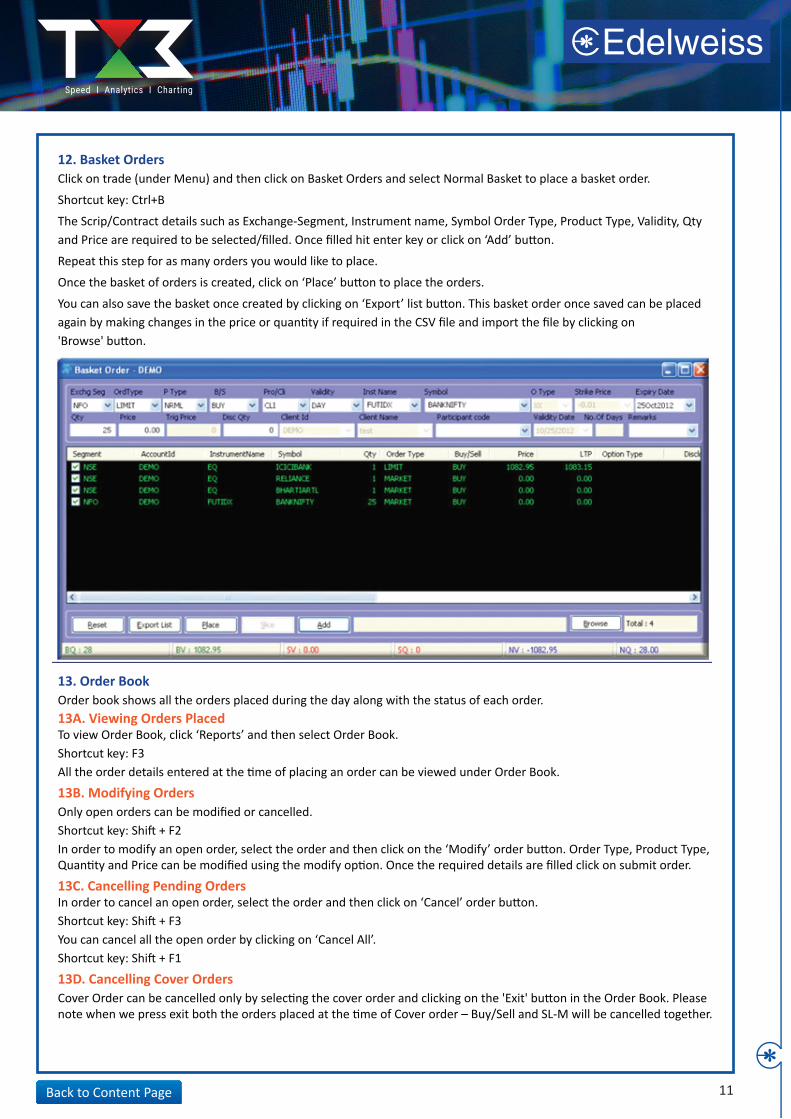
12. Basket OrdersClick on trade (under Menu) and then click on Basket Orders and select Normal Basket to place a basket order.
Shortcut key: Ctrl+B
The Scrip/Contract details such as Exchange-Segment, Instrument name, Symbol Order Type, Product Type, Validity, Qty and Price are required to be selected/filled. Once filled hit enter key or click on ‘Add’ button.
Repeat this step for as many orders you would like to place.
Once the basket of orders is created, click on ‘Place’ button to place the orders.
You can also save the basket once created by clicking on ‘Export’ list button. This basket order once saved can be placed again by making changes in the price or quantity if required in the CSV file and import the file by clicking on'Browse' button.
13. Order BookOrder book shows all the orders placed during the day along with the status of each order.13A. Viewing Orders PlacedTo view Order Book, click ‘Reports’ and then select Order Book. Shortcut key: F3All the order details entered at the time of placing an order can be viewed under Order Book.
13B. Modifying OrdersOnly open orders can be modified or cancelled.Shortcut key: Shift + F2In order to modify an open order, select the order and then click on the ‘Modify’ order button. Order Type, Product Type, Quantity and Price can be modified using the modify option. Once the required details are filled click on submit order.
13C. Cancelling Pending OrdersIn order to cancel an open order, select the order and then click on ‘Cancel’ order button.Shortcut key: Shift + F3You can cancel all the open order by clicking on ‘Cancel All’.Shortcut key: Shift + F1
13D. Cancelling Cover OrdersCover Order can be cancelled only by selecting the cover order and clicking on the 'Exit' button in the Order Book. Please note when we press exit both the orders placed at the time of Cover order – Buy/Sell and SL-M will be cancelled together.
Back to Content Page
12
14. Trade BookThe Trade Book shows all the completed orders during the day.
14A. View Completed OrdersTo view Trade Book, click on ‘Reports’ and then select Trade Book. Shortcut key: F8
14B. Position ConversionTo convert a position from Intraday (MIS) to Delivery (NRML/CNC) or from Delivery (CNC/NRML) to Intraday (MIS), select the trade from the Trade Book window and then click on the 'Position Conversion' button.
15. Position Book/Net PositionPosition book can be viewed by clicking on ‘Reports’ and then selecting Net Positions.
Shortcut key: Alt + F6
It contains details of all open positions in Derivatives and any position taken today in the cash market.
Some of the details which are available in Net Position are Buy Quantity, Buy Average Price, Sell Quantity, Sell Average Price Net Quantity, Realised profit/loss, Unrealised profit/loss, MTM.
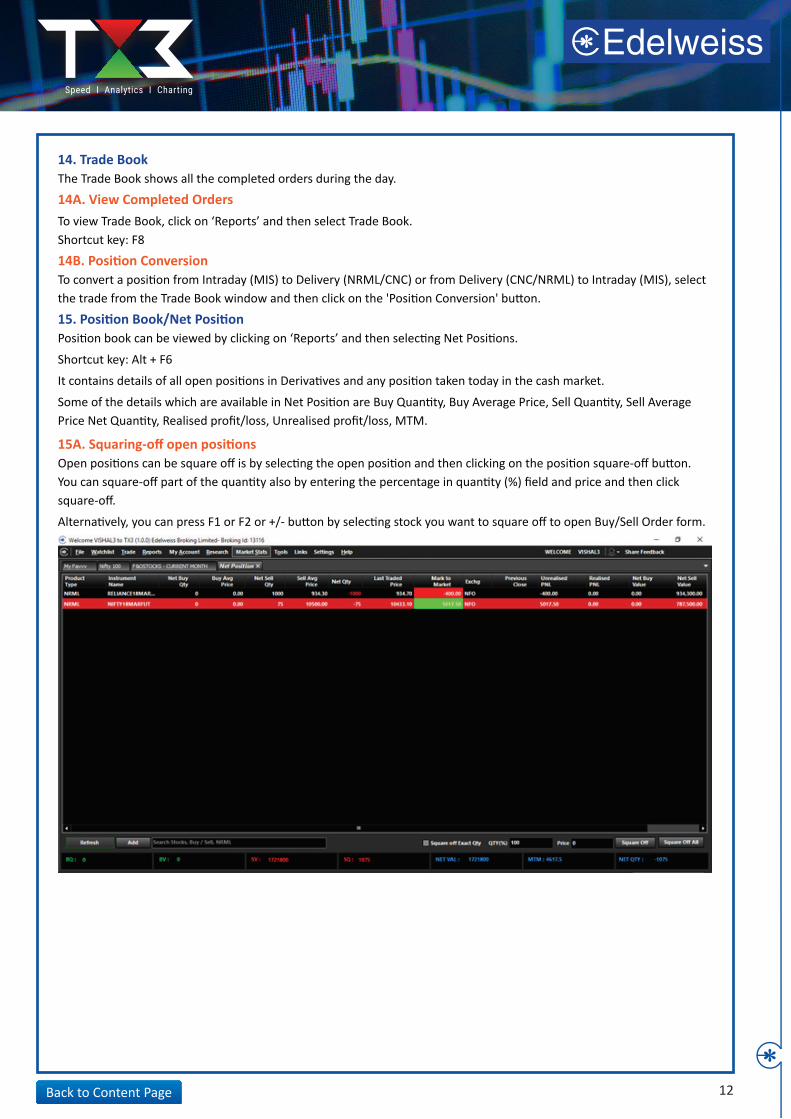
15A. Squaring-off open positions Open positions can be square off is by selecting the open position and then clicking on the position square-off button. You can square-off part of the quantity also by entering the percentage in quantity (%) field and price and then click square-off.
Alternatively, you can press F1 or F2 or +/- button by selecting stock you want to square off to open Buy/Sell Order form.
Back to Content Page

13
16. PortfolioPortfolio is the screen where you can see performance of all your stocks/MF/NCD holding. This is the window where you will be able to get various information of your holding across asset classed.
Some of the information which are available in this are:
You can also get details of the date when you have purchased the stock (i.e., transaction history) of stocks you hold in portfolio just by double clicking on the stock.
Refer below screenshot of Portfolio.
17. HoldingsHolding is the screen where you can see stocks you are holding in your demat account.Click on ‘Reports’, Select Holdings to open Holding report.Shortcut key: Alt + F9
Back to Content Page
Stock name/MF scheme your holdQuantityAverage Buying priceInvestment and Current ValueRealised and Unrealised PnL (stock wise and total)Day’s gain/loss (stock wise and total)
Total quantity column represents the total quantity of holdings in your demat account which is calculated after taking into account used and T1 quantity
Used quantity represents the quantity that is sold during the day or for which a sell order is in open status
T1 quantity represents the expected number of shares to be received today or tomorrow. These are the shares which you have bought yesterday or day before.
14
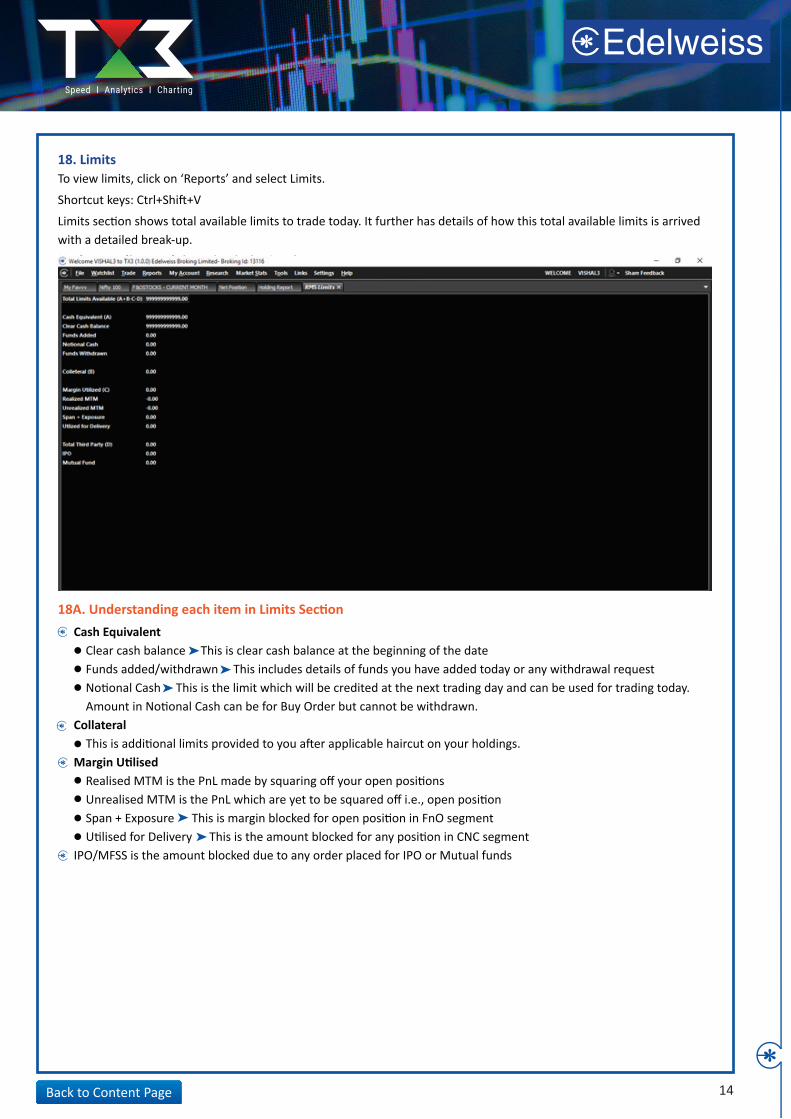
18. LimitsTo view limits, click on ‘Reports’ and select Limits.
Shortcut keys: Ctrl+Shift+V
Limits section shows total available limits to trade today. It further has details of how this total available limits is arrived with a detailed break-up.
Understanding each item in Limits Section
18A. Understanding each item in Limits Section
Back to Content Page
Cash Equivalent Clear cash balance This is clear cash balance at the beginning of the date Funds added/withdrawn This includes details of funds you have added today or any withdrawal request Notional Cash This is the limit which will be credited at the next trading day and can be used for trading today. Amount in Notional Cash can be for Buy Order but cannot be withdrawn.Collateral This is additional limits provided to you after applicable haircut on your holdings.Margin Utilised Realised MTM is the PnL made by squaring off your open positions Unrealised MTM is the PnL which are yet to be squared off i.e., open position Span + Exposure This is margin blocked for open position in FnO segment Utilised for Delivery This is the amount blocked for any position in CNC segmentIPO/MFSS is the amount blocked due to any order placed for IPO or Mutual funds
15Back to Content Page
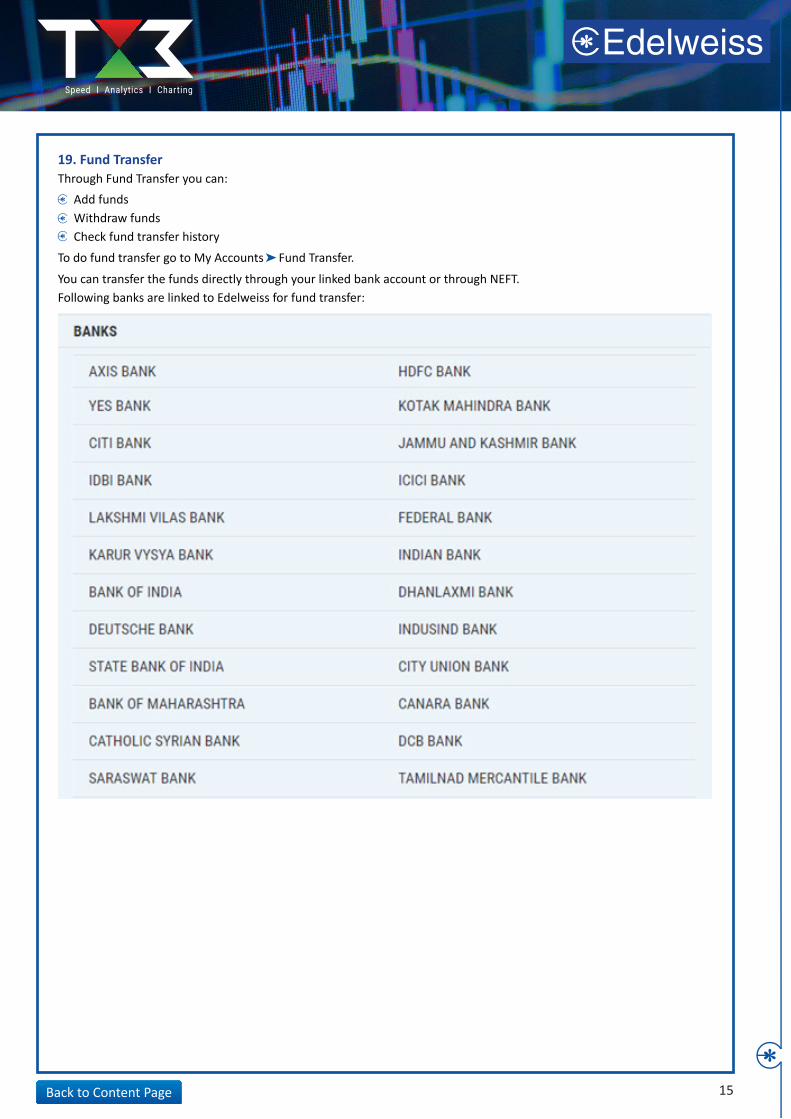
19. Fund TransferThrough Fund Transfer you can:
To do fund transfer go to My Accounts Fund Transfer.
You can transfer the funds directly through your linked bank account or through NEFT.Following banks are linked to Edelweiss for fund transfer:
Add fundsWithdraw fundsCheck fund transfer history

If your linked bank account is not there in the above list you can do an RTGS/NEFT. Below is the details for the same.
16Back to Content Page
Fund Transfer StatusYou can fund transfer status in the same screen of RHS. Select the data range and click on the ‘Submit’ button to get status and history of the fund transfer done by you.
17
20. My ReportsYou can get all the reports related to your account under the ‘My Account’ section.
All the reports will open in the TX3 application itself under separate tab. Select date range and click on submit to get details. All these reports can be downloaded on Excel/PDF.
Following reports are available under My Account section:
21. ResearchResearch section consist of all Edelweiss research content. Research has been classified into:
Back to Content Page
Ledger Summary version Detailed versionTransaction historyProfit and Loss report Contract notes and statementsSubscription plansOther Charges Cost Delayed payment charges DP bills Inter settlement chargesOther Reports Days pending for long term gain Dividend views
Research Recommendation Research Report
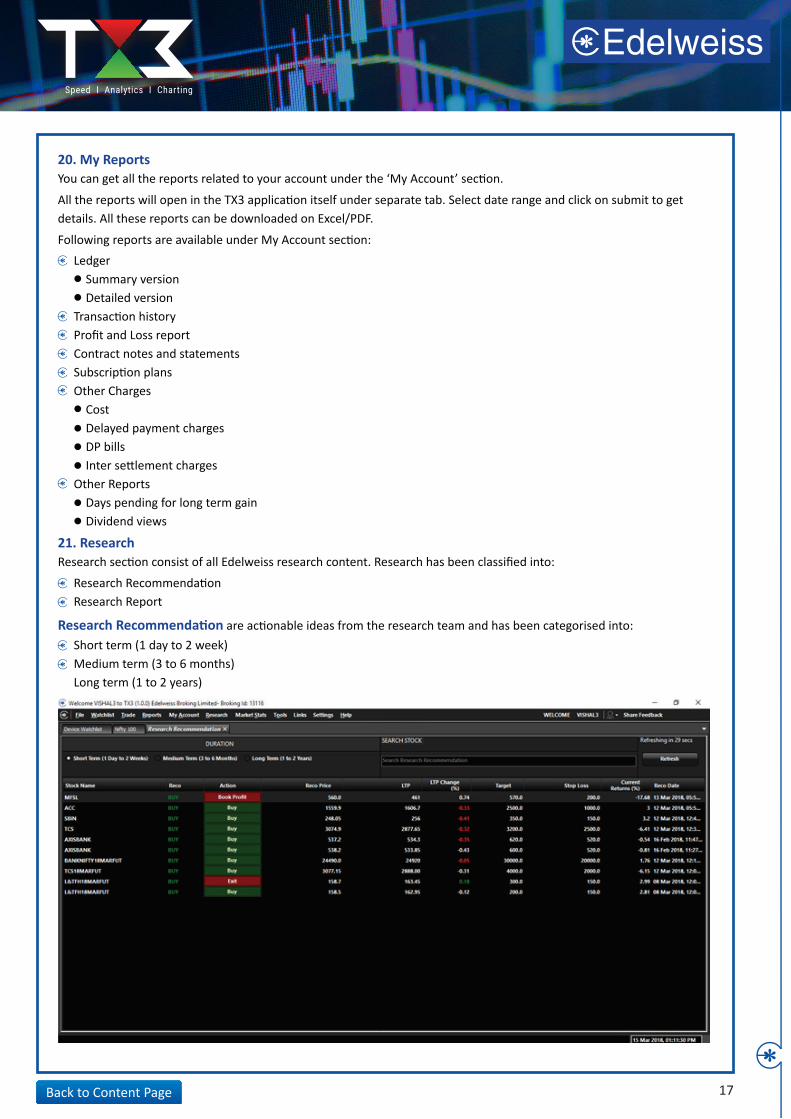
Research Recommendation are actionable ideas from the research team and has been categorised into:
Short term (1 day to 2 week)Medium term (3 to 6 months)Long term (1 to 2 years)
18
You can directly place the order from the research recommendation section by clicking on action button given next to each of the calls. This will populate the order form enter quantity and price and submit the order.
Get detailed information of each call listed by doing double click.
Right click on individual call to open right menu bar. You can set alerts or go to charts.
Research reports section consists of a list of all research reports released by the Edelweiss research team. You can click on each report to open in a PDF format. If needed you can also download these reports for future references.
Back to Content Page
19Back to Content Page
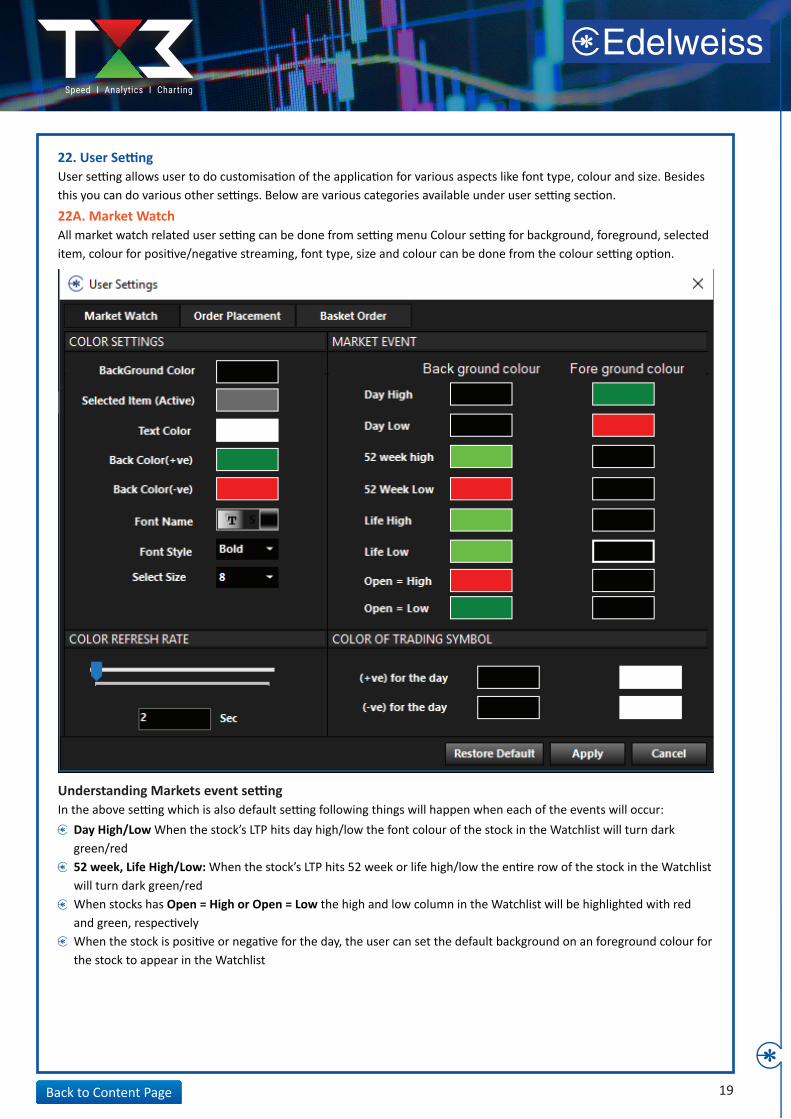
22. User SettingUser setting allows user to do customisation of the application for various aspects like font type, colour and size. Besides this you can do various other settings. Below are various categories available under user setting section.
22A. Market WatchAll market watch related user setting can be done from setting menu Colour setting for background, foreground, selected item, colour for positive/negative streaming, font type, size and colour can be done from the colour setting option.
Understanding Markets event settingIn the above setting which is also default setting following things will happen when each of the events will occur:
Day High/Low When the stock’s LTP hits day high/low the font colour of the stock in the Watchlist will turn dark green/red 52 week, Life High/Low: When the stock’s LTP hits 52 week or life high/low the entire row of the stock in the Watchlist will turn dark green/redWhen stocks has Open = High or Open = Low the high and low column in the Watchlist will be highlighted with red and green, respectively When the stock is positive or negative for the day, the user can set the default background on an foreground colour for the stock to appear in the Watchlist
20Back to Content Page
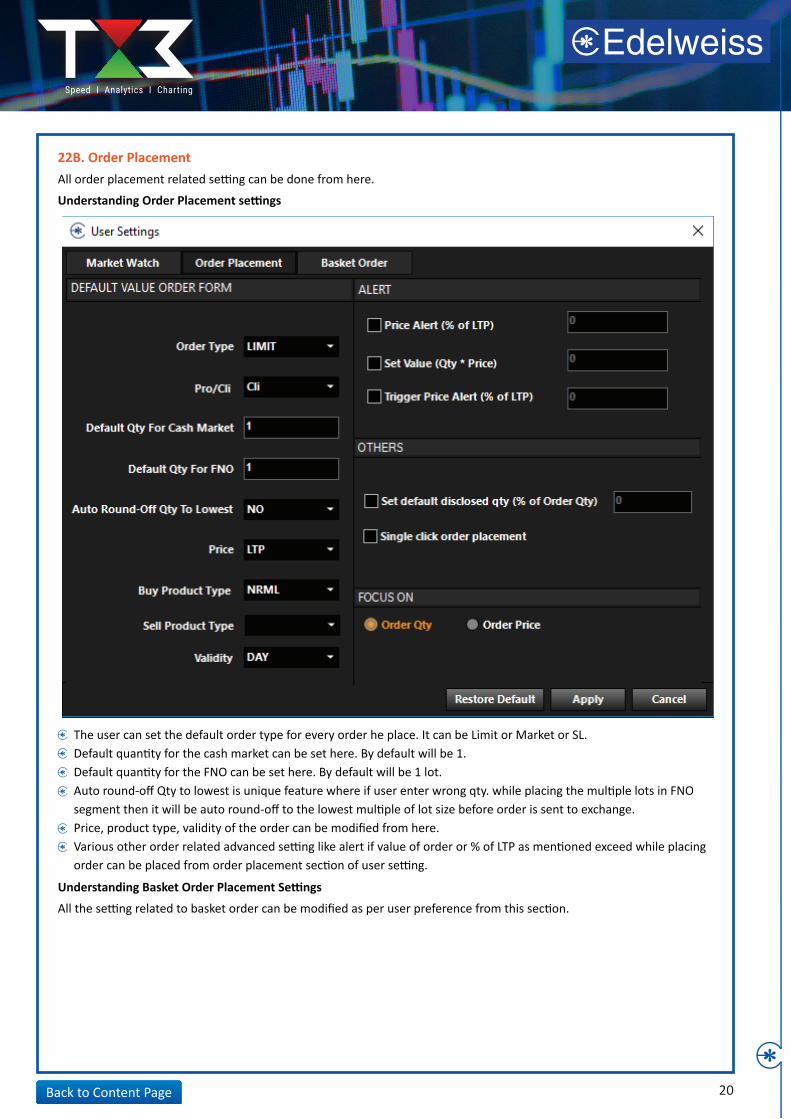
22B. Order PlacementAll order placement related setting can be done from here.
Understanding Order Placement settings
Understanding Basket Order Placement Settings
All the setting related to basket order can be modified as per user preference from this section.
The user can set the default order type for every order he place. It can be Limit or Market or SL.Default quantity for the cash market can be set here. By default will be 1. Default quantity for the FNO can be set here. By default will be 1 lot.Auto round-off Qty to lowest is unique feature where if user enter wrong qty. while placing the multiple lots in FNO segment then it will be auto round-off to the lowest multiple of lot size before order is sent to exchange.Price, product type, validity of the order can be modified from here.Various other order related advanced setting like alert if value of order or % of LTP as mentioned exceed while placing order can be placed from order placement section of user setting.
23. Market StatsMarket stats contains all market related analytical data. This data points are provided in such a manner that it helps you to take trading decision for traders. Below are item wise details for each market data available in the market stats section:
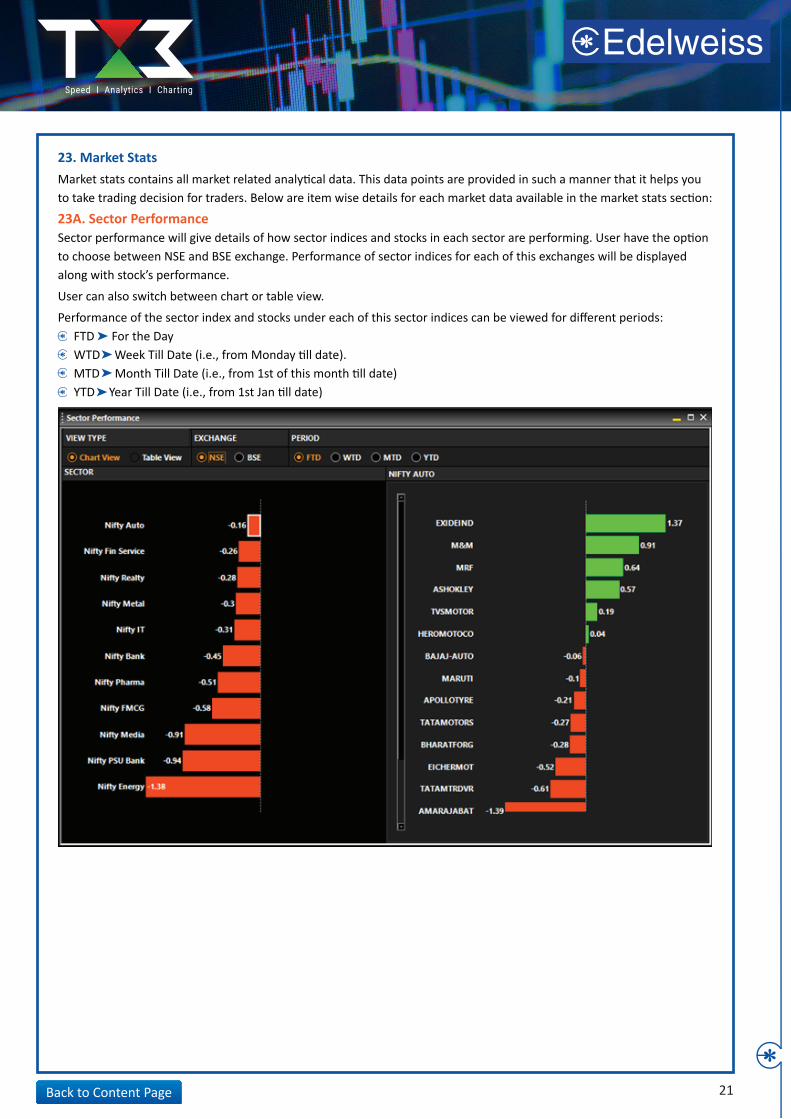
23A. Sector PerformanceSector performance will give details of how sector indices and stocks in each sector are performing. User have the option to choose between NSE and BSE exchange. Performance of sector indices for each of this exchanges will be displayed along with stock’s performance.
User can also switch between chart or table view.
Performance of the sector index and stocks under each of this sector indices can be viewed for different periods:
21Back to Content Page
FTD For the DayWTD Week Till Date (i.e., from Monday till date).MTD Month Till Date (i.e., from 1st of this month till date)YTD Year Till Date (i.e., from 1st Jan till date)
22Back to Content Page
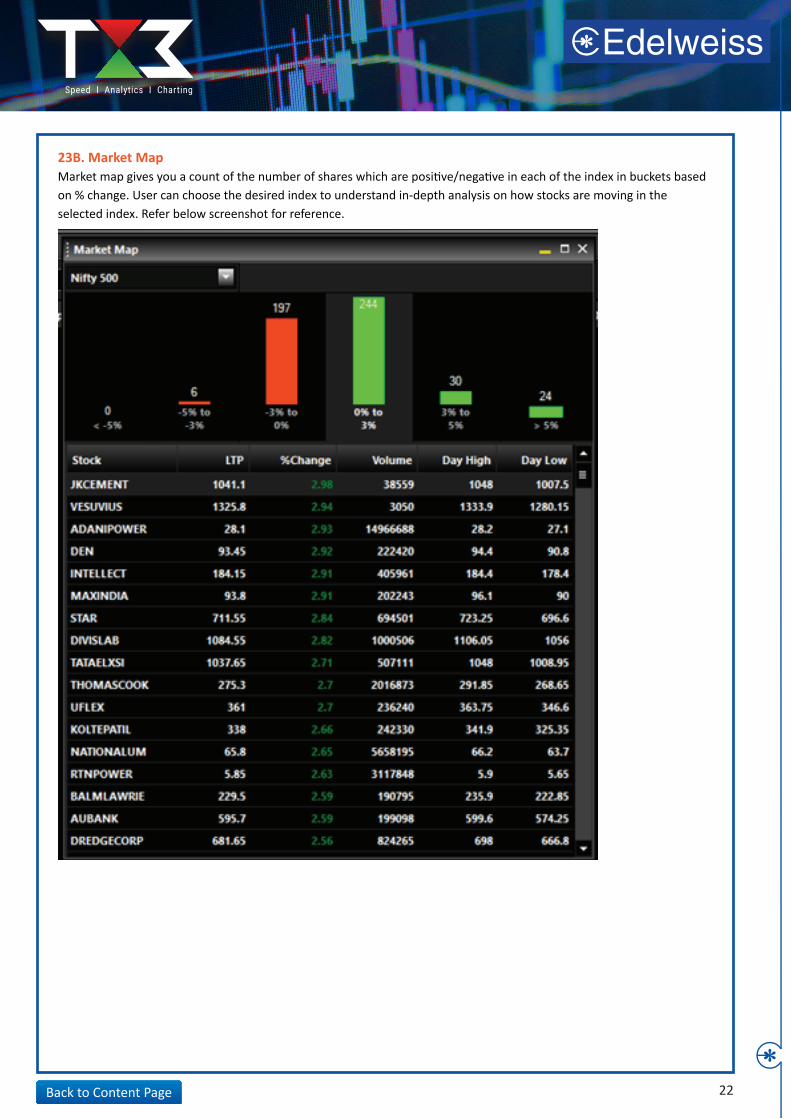
23B. Market MapMarket map gives you a count of the number of shares which are positive/negative in each of the index in buckets based on % change. User can choose the desired index to understand in-depth analysis on how stocks are moving in the selected index. Refer below screenshot for reference.
23Back to Content Page
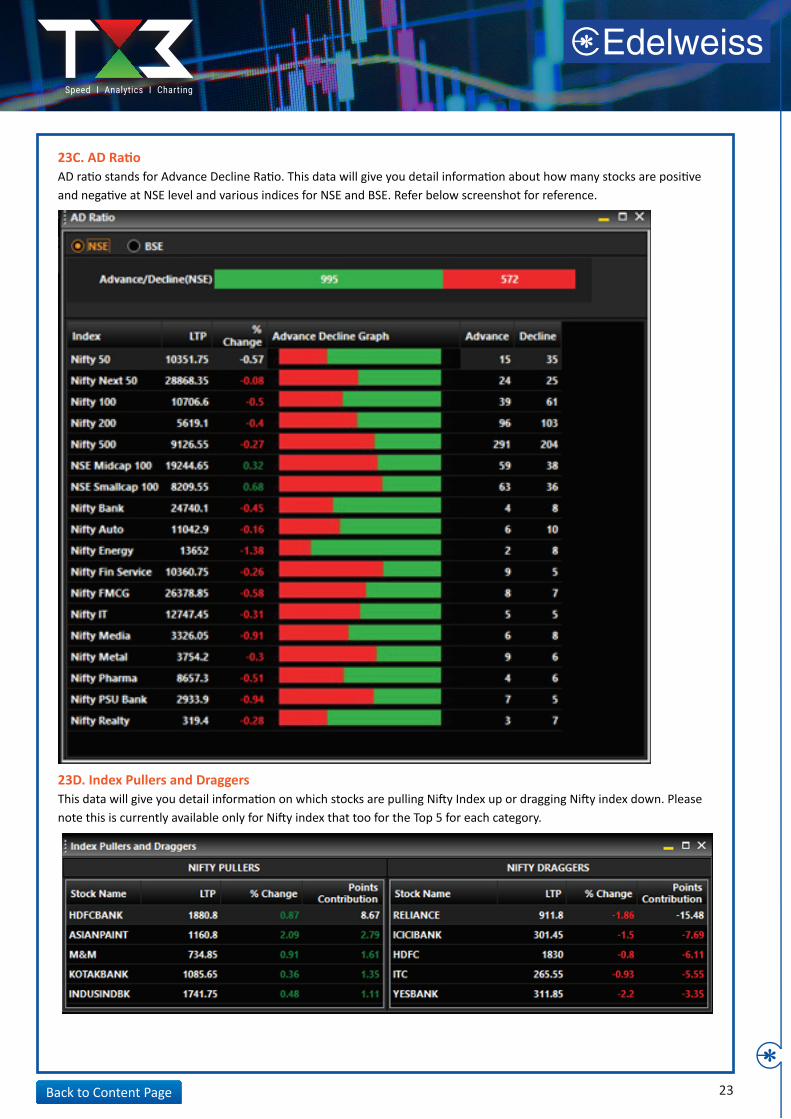
23C. AD RatioAD ratio stands for Advance Decline Ratio. This data will give you detail information about how many stocks are positive and negative at NSE level and various indices for NSE and BSE. Refer below screenshot for reference.
23D. Index Pullers and DraggersThis data will give you detail information on which stocks are pulling Nifty Index up or dragging Nifty index down. Please note this is currently available only for Nifty index that too for the Top 5 for each category.
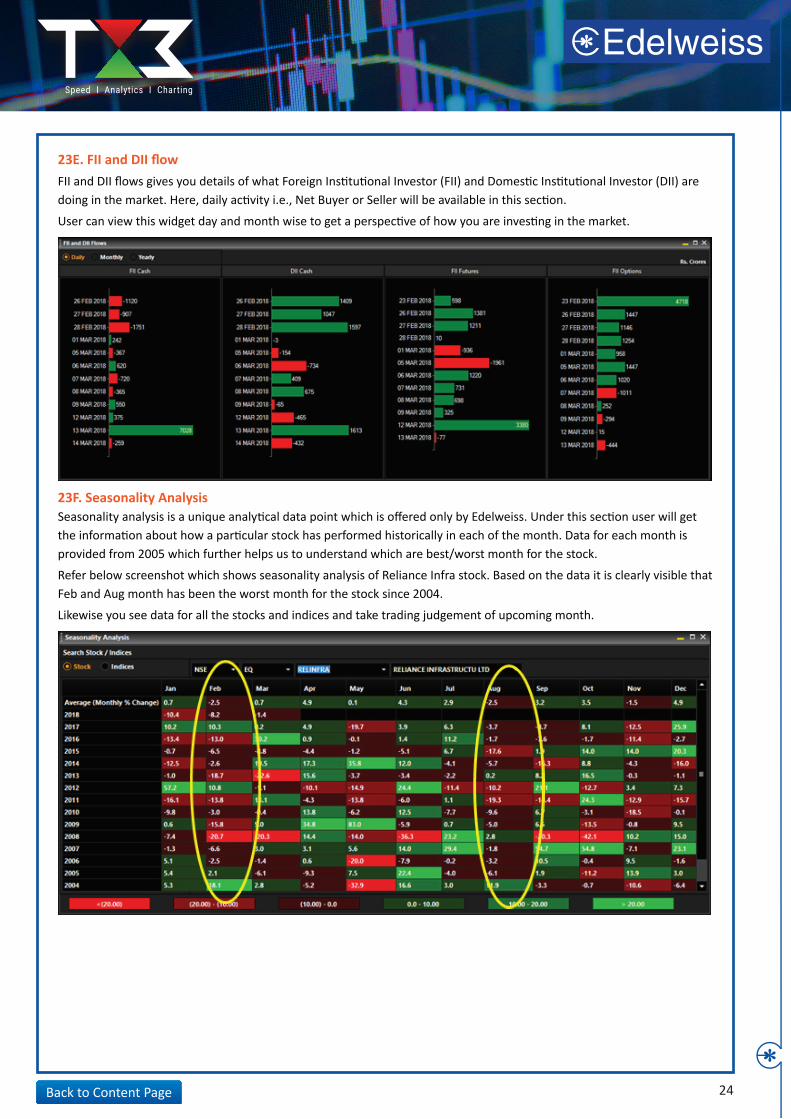
23E. FII and DII flowFII and DII flows gives you details of what Foreign Institutional Investor (FII) and Domestic Institutional Investor (DII) are doing in the market. Here, daily activity i.e., Net Buyer or Seller will be available in this section.
User can view this widget day and month wise to get a perspective of how you are investing in the market.
23F. Seasonality AnalysisSeasonality analysis is a unique analytical data point which is offered only by Edelweiss. Under this section user will get the information about how a particular stock has performed historically in each of the month. Data for each month is provided from 2005 which further helps us to understand which are best/worst month for the stock.
Refer below screenshot which shows seasonality analysis of Reliance Infra stock. Based on the data it is clearly visible that Feb and Aug month has been the worst month for the stock since 2004.
Likewise you see data for all the stocks and indices and take trading judgement of upcoming month.
24Back to Content Page

25Back to Content Page
23G. Equity Market AnalysisThis section gives analytical insights of the equity market. This will help user to not only understand how the markets are performing but also assist in making trading decisions.
Refer to the below screenshot on equity market analysis. Data points available are shown upfront. User can right click on any stock he wants to open charts, quote page or set alert. Alternatively, all the shortcuts like F6 (snap quote), F1, F2, Ctrl+C will work on selected scrip in the window.
User can see the equity stats on any index of NSE or BSE, by default will be NSE 500. Also he can further change the period for which he wants to analyse the data. Below are the period option available:
Screenshot of Equity Stats
FTD For the DayWTD Week Till Date (i.e., from Monday till date).MTD Month Till Date (i.e., from 1st of this month till date)YTD Year Till Date (i.e., from 1st January till date)
26Back to Content Page
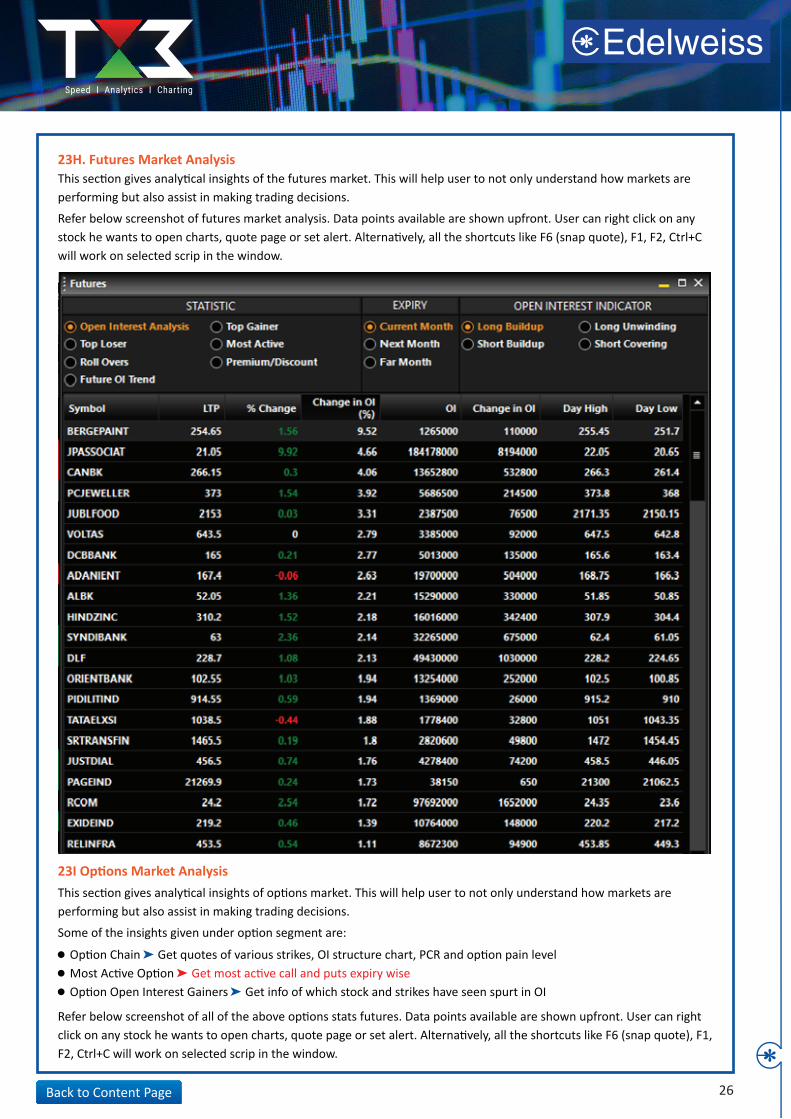
23H. Futures Market AnalysisThis section gives analytical insights of the futures market. This will help user to not only understand how markets are performing but also assist in making trading decisions.
Refer below screenshot of futures market analysis. Data points available are shown upfront. User can right click on any stock he wants to open charts, quote page or set alert. Alternatively, all the shortcuts like F6 (snap quote), F1, F2, Ctrl+C will work on selected scrip in the window.
23I Options Market AnalysisThis section gives analytical insights of options market. This will help user to not only understand how markets are performing but also assist in making trading decisions.
Some of the insights given under option segment are:
Refer below screenshot of all of the above options stats futures. Data points available are shown upfront. User can right click on any stock he wants to open charts, quote page or set alert. Alternatively, all the shortcuts like F6 (snap quote), F1, F2, Ctrl+C will work on selected scrip in the window.
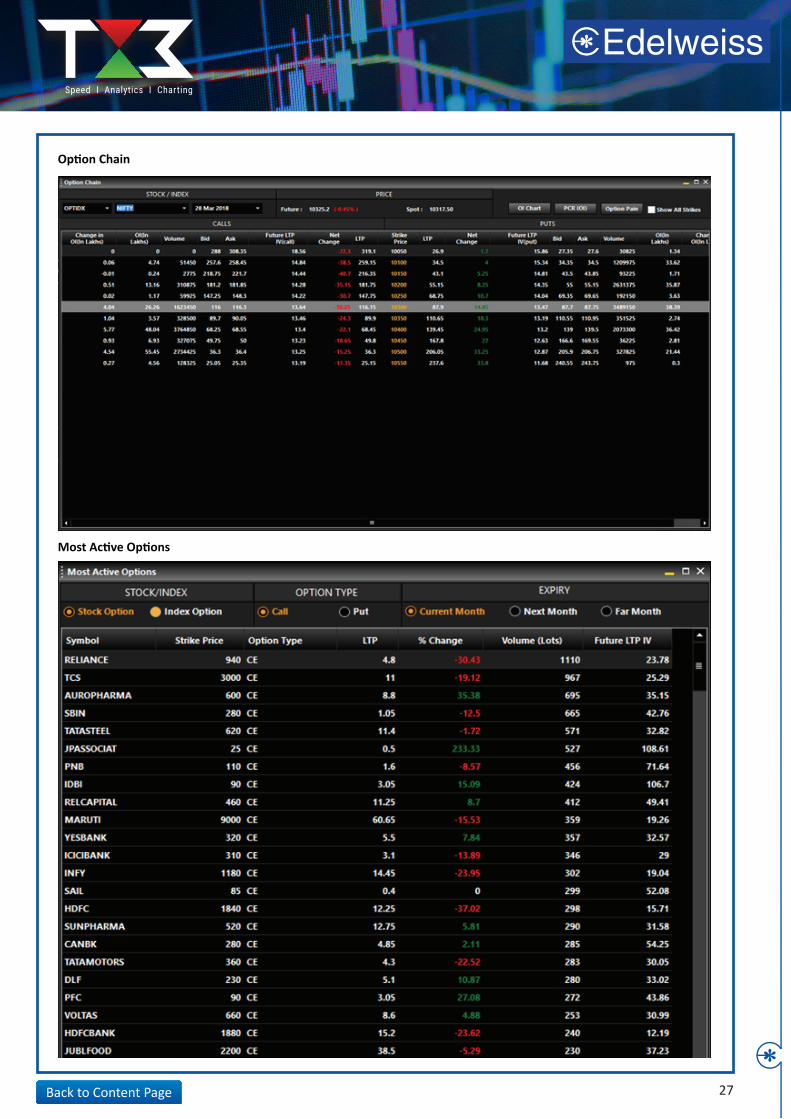
Option Chain Get quotes of various strikes, OI structure chart, PCR and option pain level Most Active Option Get most active call and puts expiry wise Option Open Interest Gainers Get info of which stock and strikes have seen spurt in OI
27Back to Content Page
Option Chain
Most Active Options

28Back to Content Page
Options Open Interest Gainers
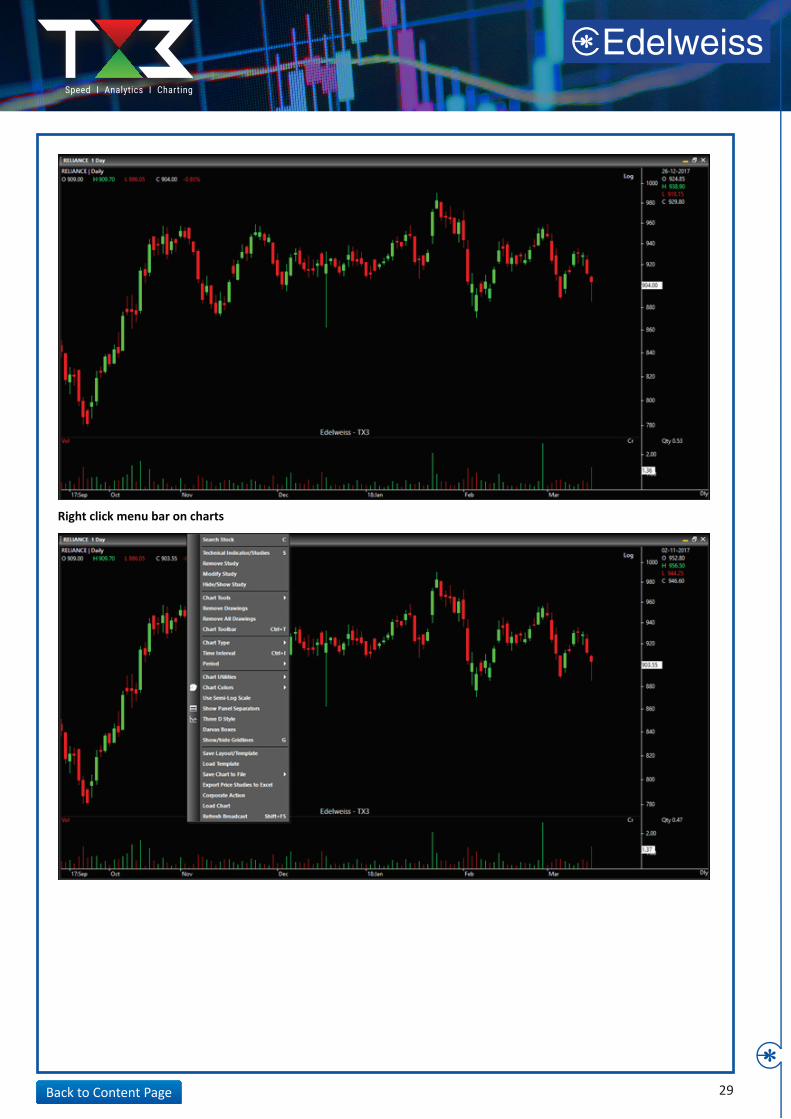
24. ChartingTechnical analysis has become the most important way of analysing markets for all traders today. To fulfill the need for trader TX3 has given the most advanced feature in charting and at the same time make sure that it is clutter free anduser friendly.
Shortcut keys:
Chart can also be opened from the right click menu bar. Charting option is available on all the right click option from the Watchlist, market stats, portfolio etc. All the charting feature are available on the right click option in the charting area. Alternatively, the most frequent used feature have shortcut keys for faster accessibility.
Ctrl + C to open chart from any screenZ to enable/disable full screen
29Back to Content Page
Right click menu bar on charts
1 minute 3 minutes 5 minutes 15 minutes 30 minutes1 hourDailyWeeklyMonthly
1D 5D 1M3M 1Y YTD
Right click menu bar Time Interval (this will open widget with above option)Shortcut key Ctrl + I
30Back to Content Page
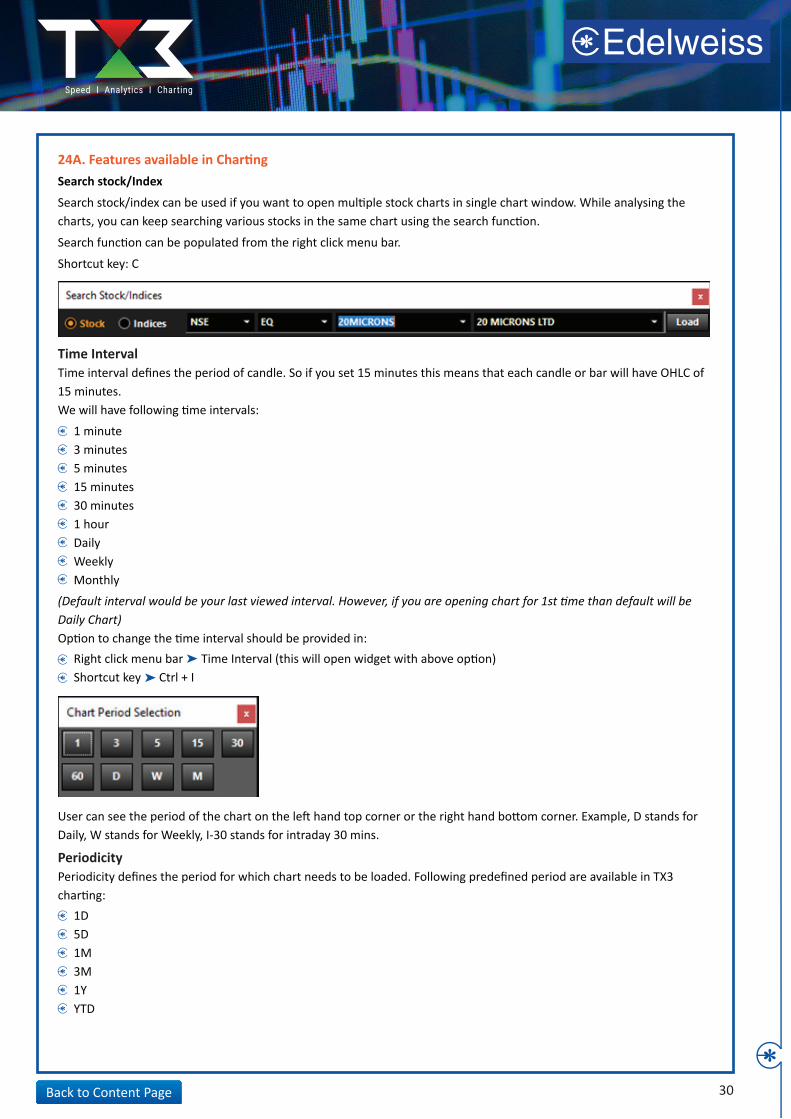
24A. Features available in ChartingSearch stock/Index
Search stock/index can be used if you want to open multiple stock charts in single chart window. While analysing the charts, you can keep searching various stocks in the same chart using the search function.
Search function can be populated from the right click menu bar.
Shortcut key: C
Time IntervalTime interval defines the period of candle. So if you set 15 minutes this means that each candle or bar will have OHLC of 15 minutes.We will have following time intervals:
PeriodicityPeriodicity defines the period for which chart needs to be loaded. Following predefined period are available in TX3 charting:
(Default interval would be your last viewed interval. However, if you are opening chart for 1st time than default will be Daily Chart) Option to change the time interval should be provided in:
User can see the period of the chart on the left hand top corner or the right hand bottom corner. Example, D stands for Daily, W stands for Weekly, I-30 stands for intraday 30 mins.
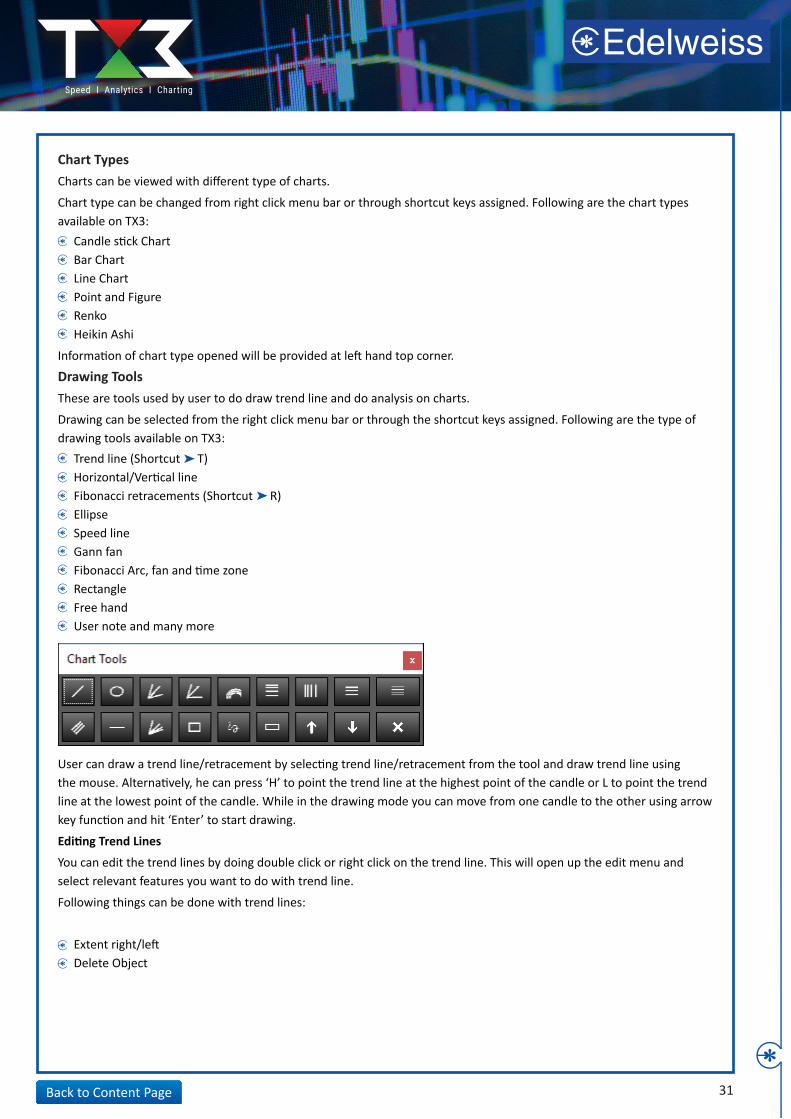
Candle stick ChartBar ChartLine ChartPoint and FigureRenkoHeikin Ashi
Trend line (Shortcut T)Horizontal/Vertical lineFibonacci retracements (Shortcut R)EllipseSpeed lineGann fanFibonacci Arc, fan and time zoneRectangleFree hand User note and many more
Extent right/leftDelete Object
31Back to Content Page
Chart TypesCharts can be viewed with different type of charts.
Chart type can be changed from right click menu bar or through shortcut keys assigned. Following are the chart types available on TX3:
Information of chart type opened will be provided at left hand top corner.
Drawing ToolsThese are tools used by user to do draw trend line and do analysis on charts.
Drawing can be selected from the right click menu bar or through the shortcut keys assigned. Following are the type of drawing tools available on TX3:
User can draw a trend line/retracement by selecting trend line/retracement from the tool and draw trend line usingthe mouse. Alternatively, he can press ‘H’ to point the trend line at the highest point of the candle or L to point the trend line at the lowest point of the candle. While in the drawing mode you can move from one candle to the other using arrow key function and hit ‘Enter’ to start drawing.
Editing Trend Lines
You can edit the trend lines by doing double click or right click on the trend line. This will open up the edit menu and select relevant features you want to do with trend line.
Following things can be done with trend lines:
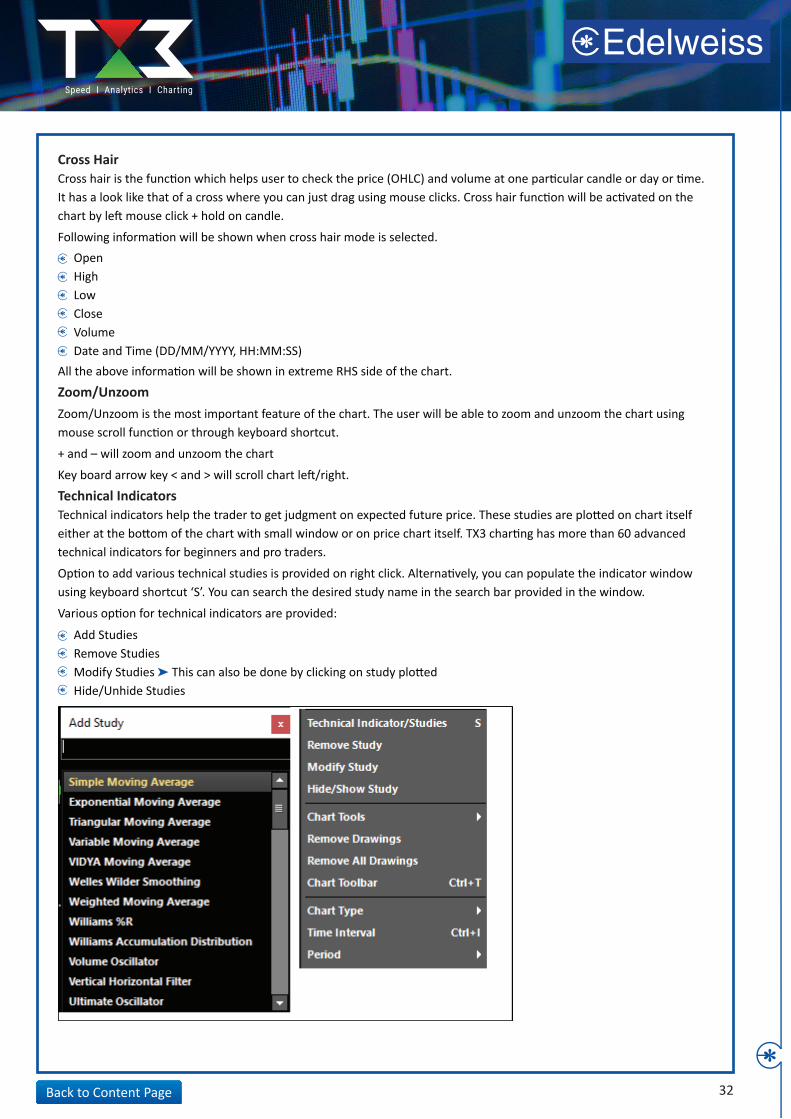
Cross HairCross hair is the function which helps user to check the price (OHLC) and volume at one particular candle or day or time. It has a look like that of a cross where you can just drag using mouse clicks. Cross hair function will be activated on the chart by left mouse click + hold on candle.
Following information will be shown when cross hair mode is selected.
All the above information will be shown in extreme RHS side of the chart.
Zoom/UnzoomZoom/Unzoom is the most important feature of the chart. The user will be able to zoom and unzoom the chart using mouse scroll function or through keyboard shortcut.
+ and – will zoom and unzoom the chart
Key board arrow key < and > will scroll chart left/right.
Technical IndicatorsTechnical indicators help the trader to get judgment on expected future price. These studies are plotted on chart itself either at the bottom of the chart with small window or on price chart itself. TX3 charting has more than 60 advanced technical indicators for beginners and pro traders.
Option to add various technical studies is provided on right click. Alternatively, you can populate the indicator window using keyboard shortcut ‘S’. You can search the desired study name in the search bar provided in the window.
Various option for technical indicators are provided:
OpenHighLowCloseVolumeDate and Time (DD/MM/YYYY, HH:MM:SS)
Add StudiesRemove StudiesModify Studies This can also be done by clicking on study plottedHide/Unhide Studies
32Back to Content Page
Save Layout/TemplateYou can save your favourite/preferred layout and can load the same layout every time when you are on the charts. How can you save layout/template?
Save ChartsYou can save chart as a picture in JPEG/PNG format and can use this later for your reference or share.To save chart, select save chart to file from right click menu bar and select the desired format and location.
Export Price study to ExcelCharting on TX3 has facility where you can save the historical price study like open, high, low, close and volume to Excel.
To do this select export price study to excel from right click menu bar and select the desired location where you want to save. All the data will be saved in CSV format.
Chart Utilities, Colours and GridlinesUnder this section you can change the chart colour for foreground, background, font type, font size and various other customisation as per your preference.
You can also add gridlines to the chart by selecting show/hide gridlines option from right click menu bar. Alternatively, you can hit keyboard.
Shortcut key: Ctrl + G
How can I load/apply my saved template?
First open the chart and plot all the studies on the chart Once you are done with plotting all studies and indicators right click and click sane layout/template from the menu barYou will be asked to give the name of the template. Give the name you desired and it will be saved in the user folderof TX3
Right click on charts and click on load templateSelect the template you want to open from the list and hit enter
33Back to Content Page
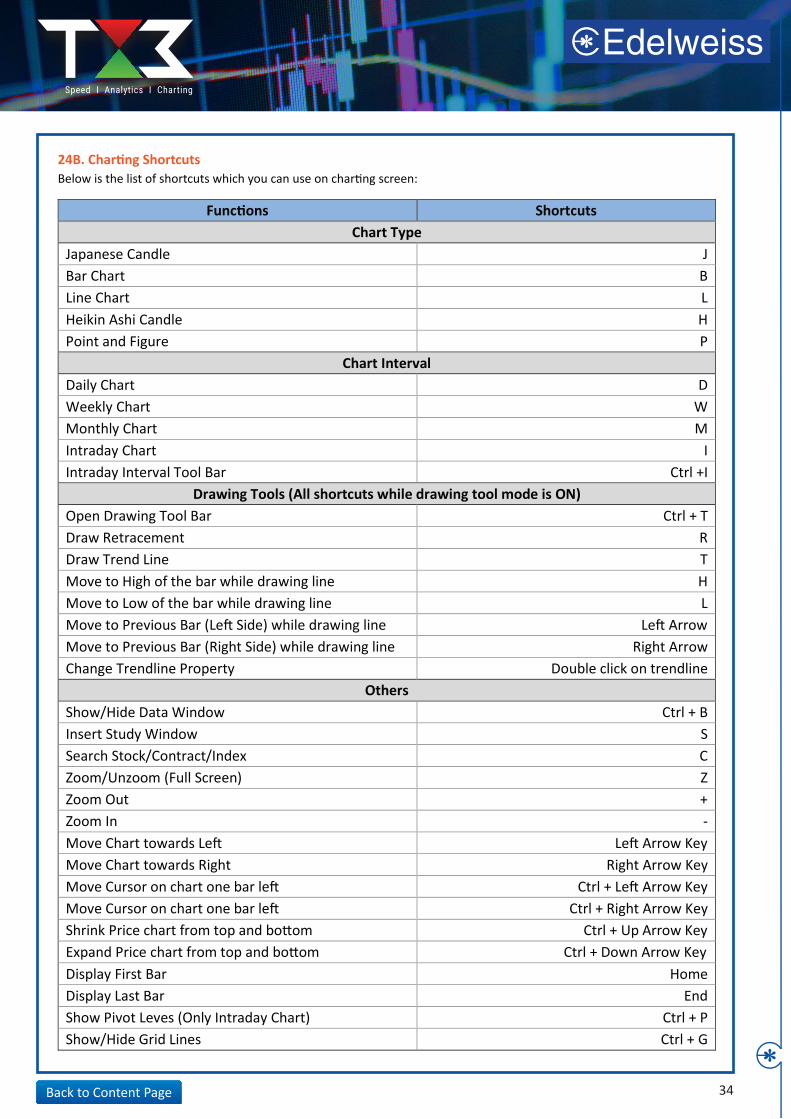
24B. Charting ShortcutsBelow is the list of shortcuts which you can use on charting screen:
34Back to Content Page
Functions Shortcuts Chart Type
Japanese Candle J Bar Chart B Line Chart L Heikin Ashi Candle H Point and Figure P
Chart Interval Daily Chart D Weekly Chart W Monthly Chart M Intraday Chart I Intraday Interval Tool Bar Ctrl +I
Drawing Tools (All shortcuts while drawing tool mode is ON) Open Drawing Tool Bar Ctrl + T Draw Retracement R Draw Trend Line T Move to High of the bar while drawing line H Move to Low of the bar while drawing line L Move to Previous Bar (Left Side) while drawing line Left Arrow Move to Previous Bar (Right Side) while drawing line Right Arrow Change Trendline Property Double click on trendline
Others Show/Hide Data Window Ctrl + B Insert Study Window S Search Stock/Contract/Index C Zoom/Unzoom (Full Screen) Z Zoom Out + Zoom In - Move Chart towards Left Left Arrow Key Move Chart towards Right Right Arrow Key Move Cursor on chart one bar left Ctrl + Left Arrow Key Move Cursor on chart one bar left Ctrl + Right Arrow Key Shrink Price chart from top and bottom Ctrl + Up Arrow Key Expand Price chart from top and bottom Ctrl + Down Arrow Key Display First Bar Home Display Last Bar End Show Pivot Leves (Only Intraday Chart) Ctrl + P Show/Hide Grid Lines Ctrl + G
25. ToolsTools contains various trading tools which helps trader to find trading opportunities or assist in taking trading decision. These are value added services beside normal offerings.
Some of the tools which are available on TX3 are:
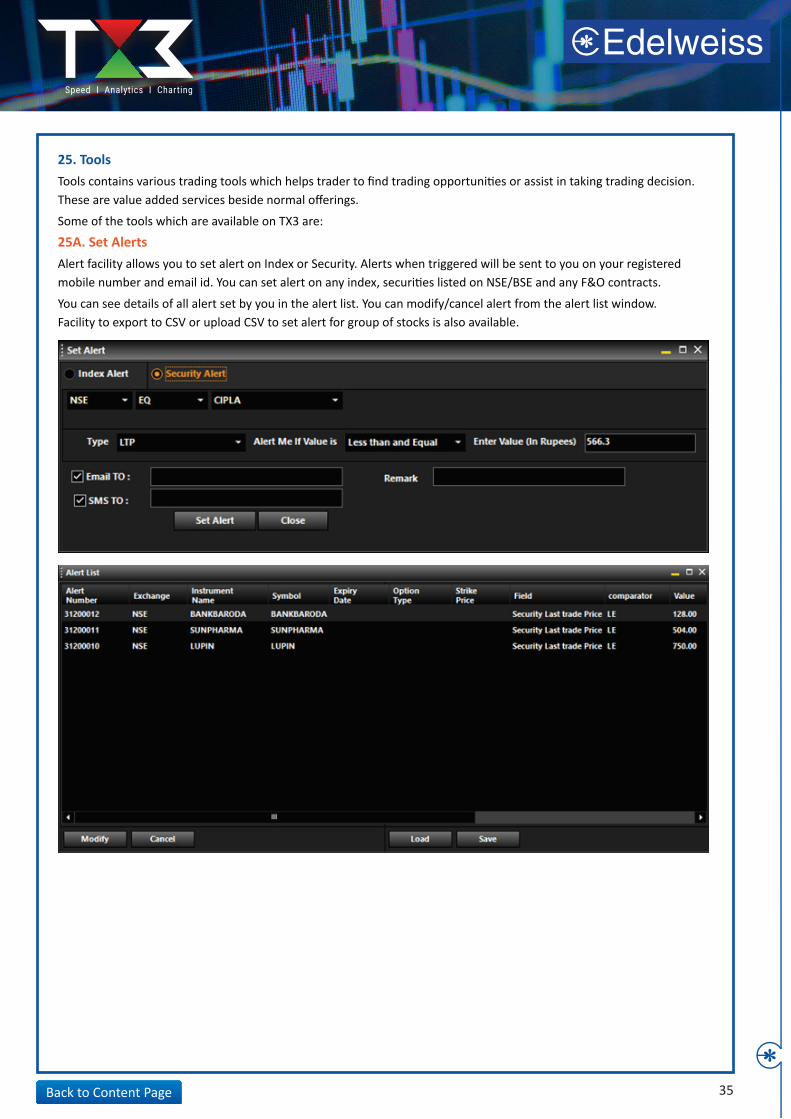
25A. Set Alerts Alert facility allows you to set alert on Index or Security. Alerts when triggered will be sent to you on your registered mobile number and email id. You can set alert on any index, securities listed on NSE/BSE and any F&O contracts.
You can see details of all alert set by you in the alert list. You can modify/cancel alert from the alert list window. Facility to export to CSV or upload CSV to set alert for group of stocks is also available.
35Back to Content Page
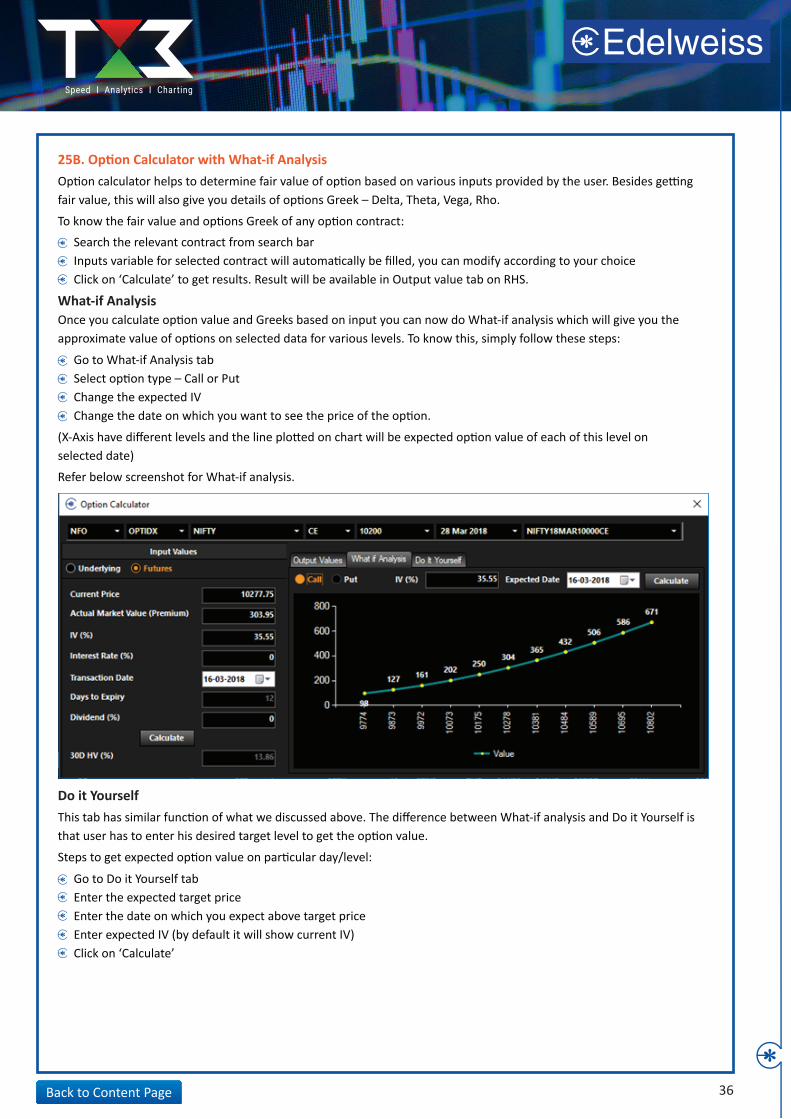
25B. Option Calculator with What-if AnalysisOption calculator helps to determine fair value of option based on various inputs provided by the user. Besides getting fair value, this will also give you details of options Greek – Delta, Theta, Vega, Rho.
To know the fair value and options Greek of any option contract:
36Back to Content Page
Search the relevant contract from search barInputs variable for selected contract will automatically be filled, you can modify according to your choice Click on ‘Calculate’ to get results. Result will be available in Output value tab on RHS.
Go to What-if Analysis tabSelect option type – Call or PutChange the expected IVChange the date on which you want to see the price of the option.
Go to Do it Yourself tabEnter the expected target priceEnter the date on which you expect above target priceEnter expected IV (by default it will show current IV)Click on ‘Calculate’
What-if AnalysisOnce you calculate option value and Greeks based on input you can now do What-if analysis which will give you the approximate value of options on selected data for various levels. To know this, simply follow these steps:
Do it YourselfThis tab has similar function of what we discussed above. The difference between What-if analysis and Do it Yourself is that user has to enter his desired target level to get the option value.
Steps to get expected option value on particular day/level:
(X-Axis have different levels and the line plotted on chart will be expected option value of each of this level onselected date)
Refer below screenshot for What-if analysis.
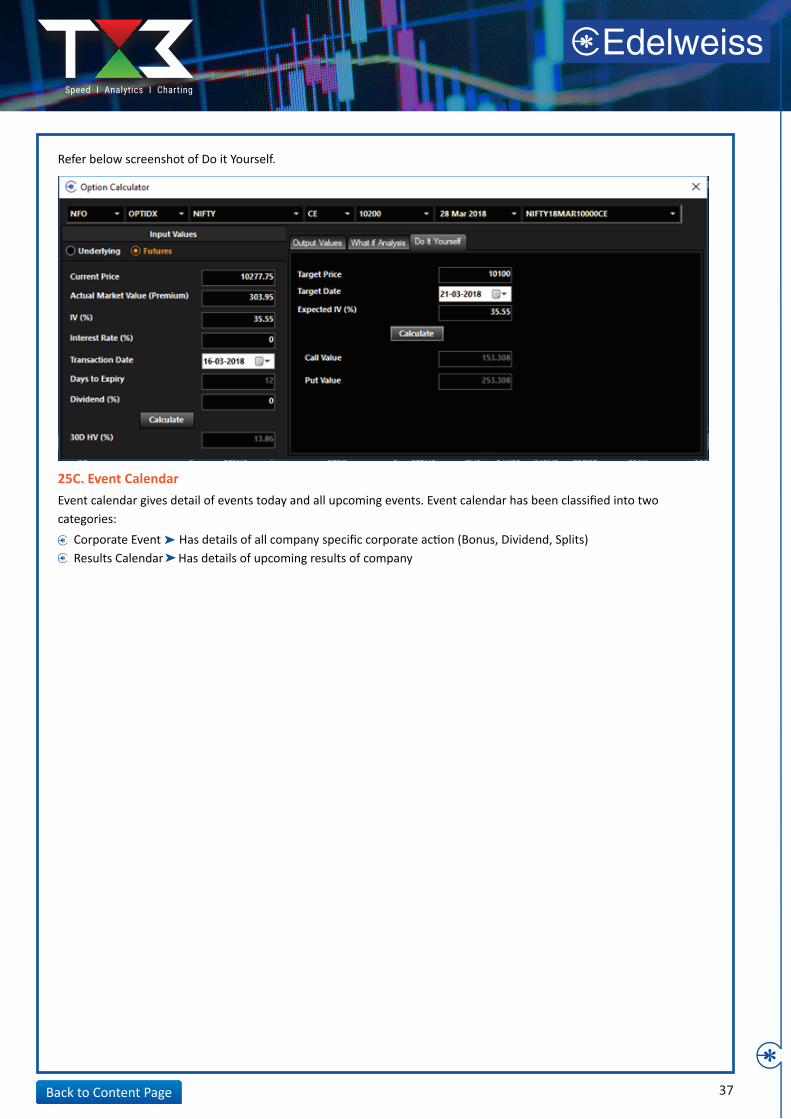
Refer below screenshot of Do it Yourself.
37Back to Content Page
25C. Event CalendarEvent calendar gives detail of events today and all upcoming events. Event calendar has been classified into two categories:
Corporate Event Has details of all company specific corporate action (Bonus, Dividend, Splits)Results Calendar Has details of upcoming results of company
38Back to Content Page
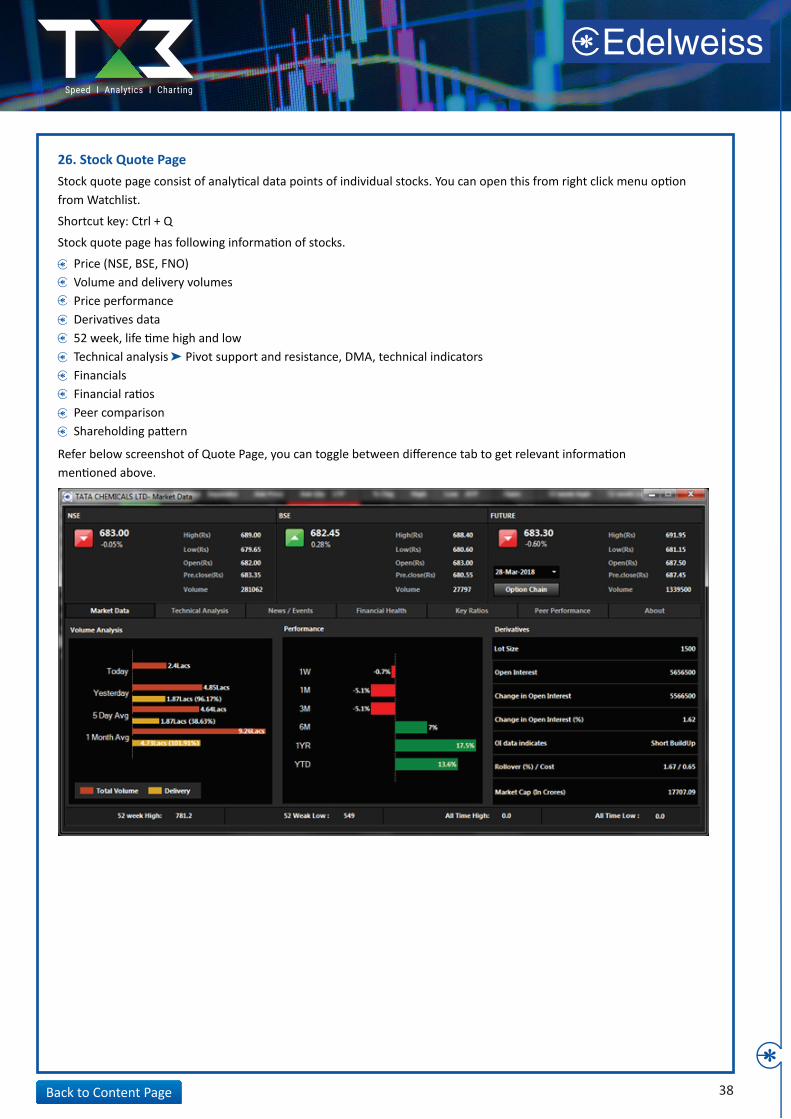
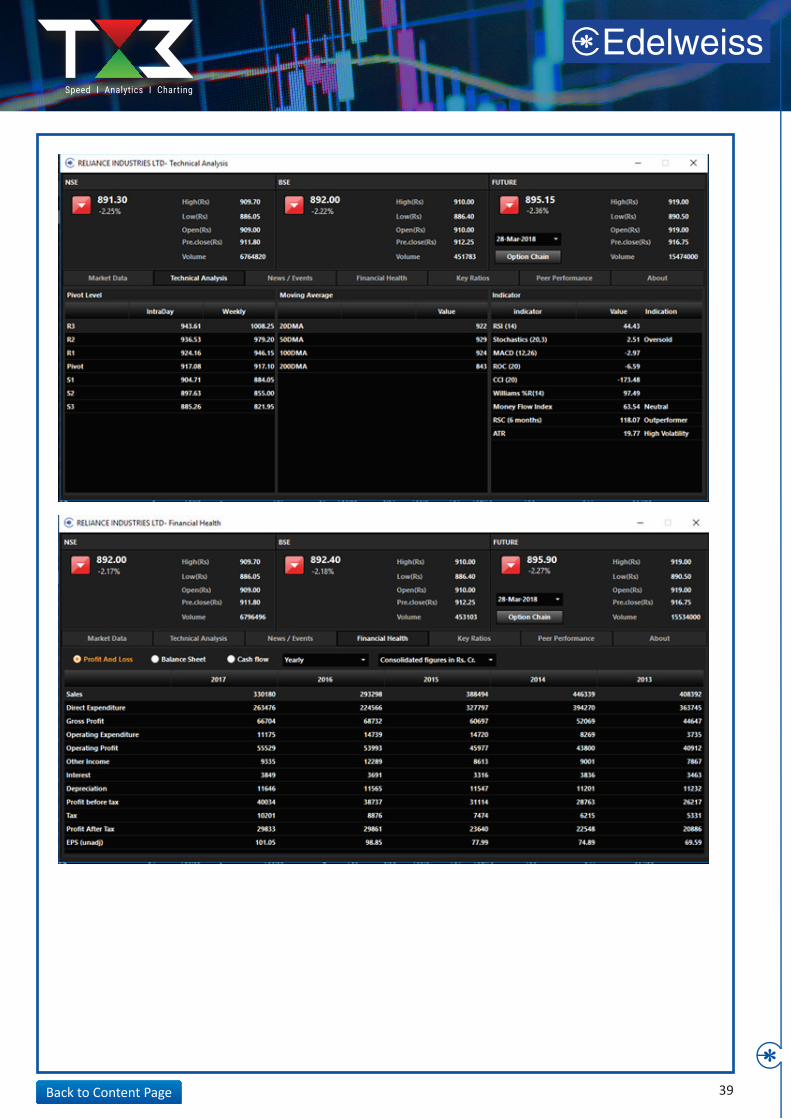
26. Stock Quote PageStock quote page consist of analytical data points of individual stocks. You can open this from right click menu option from Watchlist.
Shortcut key: Ctrl + Q
Stock quote page has following information of stocks.
Refer below screenshot of Quote Page, you can toggle between difference tab to get relevant informationmentioned above.
Price (NSE, BSE, FNO) Volume and delivery volumesPrice performance Derivatives data52 week, life time high and lowTechnical analysis Pivot support and resistance, DMA, technical indicatorsFinancialsFinancial ratiosPeer comparisonShareholding pattern
39Back to Content Page
40Back to Content Page
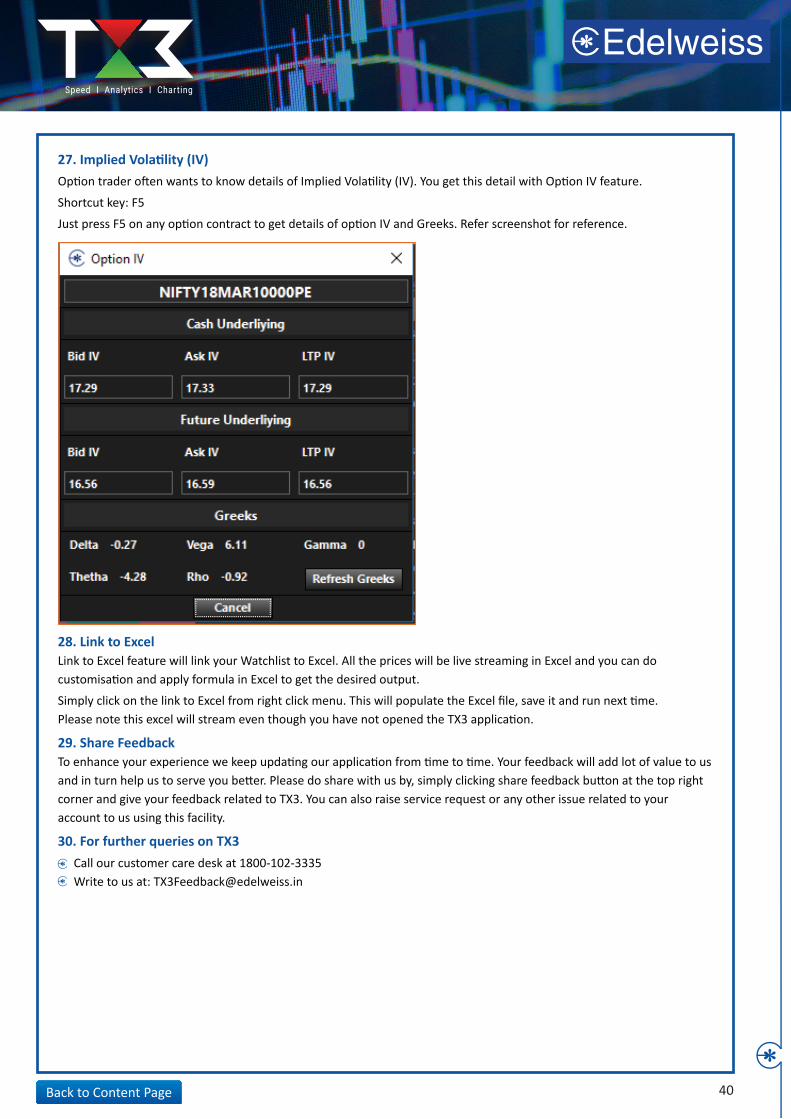
27. Implied Volatility (IV)Option trader often wants to know details of Implied Volatility (IV). You get this detail with Option IV feature.
Shortcut key: F5
Just press F5 on any option contract to get details of option IV and Greeks. Refer screenshot for reference.
28. Link to ExcelLink to Excel feature will link your Watchlist to Excel. All the prices will be live streaming in Excel and you can do customisation and apply formula in Excel to get the desired output.
Simply click on the link to Excel from right click menu. This will populate the Excel file, save it and run next time.Please note this excel will stream even though you have not opened the TX3 application. 29. Share FeedbackTo enhance your experience we keep updating our application from time to time. Your feedback will add lot of value to us and in turn help us to serve you better. Please do share with us by, simply clicking share feedback button at the top right corner and give your feedback related to TX3. You can also raise service request or any other issue related to your account to us using this facility.
30. For further queries on TX3Call our customer care desk at 1800-102-3335 Write to us at: [email protected]