The EUROclass trial: defining subgroups in common variable immunodeficiency
Upload
independentCategory
view
6download
0
TITLE PAGE
GROWTH HORMONE RESPONSE TO ARGININE TEST DIFFERENTIATES TWO SUBGROUPS
OF HUNTINGTON’S DISEASE PATIENTS
Address correspondence and reprint requests to:
Prof. Giuseppe De Michele, MD
Dipartimento di Scienze Neurologiche
Università degli Studi di Napoli Federico II
Via Pansini 5, 80131, Napoli
Tel: +39-081-7463711
Fax: +39-081-5469861
e-mail: [email protected]
Elena Salvatore,1*MD, PhD; Carlo Rinaldi,1*MD; Tecla Tucci,1 MD; Luigi Di Maio,1 MD; Carolina Di
Somma,2 MD, PhD; Silvia Savastano,3 MD, PhD; Gaetano Lombardi,3 MD; Alessandro Filla,1 MD;
Annamaria Colao,3 MD, PhD; Giuseppe De Michele,1 MD.
1 Dipartimento di Scienze Neurologiche, Università degli Studi di Napoli ‘‘Federico II’’, Napoli, Italia. 2 IRCCS Fondazione SDN, Istituto di Ricerca Diagnostica e Nucleare, Napoli, Italia. 3 Dipartimento di Endocrinologia ed Oncologia Molecolare e Clinica, Università degli Studi di Napoli
‘‘Federico II’’, Napoli, Italia.
*These two authors contributed equally to the study, and both should be considered as
first authors.
Keywords: Huntington’s Disease; Neuroendocrinology; Growth Hormone; arginine test
Text word count: 2079
Number Tables: 4
Number of Figures: 1
peer
-005
8577
7, v
ersi
on 1
- 14
Apr
201
1Author manuscript, published in "J Neurol Neurosurg Psychiatry 82, 5 (2010) 543"
DOI : 10.1136/jnnp.2010.208553
ABSTRACT
Huntington’s disease (HD) is an autosomal dominant disorder characterized by motor, cognitive,
and psychiatric disturbances. Several studies have demonstrated that hypothalamic dysfunction is
part of the phenotypic spectrum. Aim of the study was to evaluate the growth hormone (GH)
response to arginine infusion in a cohort of HD patients, to search for an in vivo biomarker of
hypothalamic dysfunction. We investigated 17 HD patients and 17 age, sex, and body mass index
(BMI) matched healthy controls. Clinical assessment of patients was performed using the Unified
Huntington’s Disease Rating Scale (UHDRS) motor section and the Total Function Capacity (TFC).
Metabolic and endocrine investigations included total, LDL and HDL cholesterol, basal insulin, GH,
insulin-like growth factor 1 (IGF-1), Standard Deviation Score IGF-1 (SDS IGF-1) and the GH
response to arginine stimulation. HD patients showed lower plasma IGF-1 and SDS IGF-1 levels
and higher baseline GH in comparison to control subjects. The arginine test induced a normal GH
peak in 9 patients (53%; Arg+), whereas the response was absent in the remaining 8 (47%; Arg-).
Arg+ and Arg- also showed two distinct endocrine/metabolic profiles with differences in insulin and
lipid metabolism. It remains to be clarified if these two subgroups of patients according to GH
response to arginine, correspond to different disease stages or to different patterns of
neurodegeneration.
INTRODUCTION
Huntington’s disease (HD) is an autosomal dominant, neurodegenerative disorder caused
by an expanded CAG repeat within the HD gene.[1] It is characterized by the triad of motor
disturbances, personality changes, and cognitive decline. Hypothalamic dysfunction may also
contribute to the clinical spectrum of HD, as several studies, both in animals and humans, have
underlined. Hypothalamic atrophy has been shown to occur in the early stages of the disease by
voxel-based MRI studies.[2] Loss of cells, especially in the somatostatin-containing neurons of the
NTL (nucleus tuberalis lateralis) of the hypothalamus, has also been demonstrated.[3, 4]
Hypothalamic dysfunction in HD may account for several well known manifestations of the disease
such as weight loss,[5] sleep disorders,[6, 7] hyperactivity of the hypothalamic-pituitary-adrenal
axis,[8] and decreased levels of luteinizing hormone and testosterone in male patients.[9]
Circulating growth hormone (GH) and insulin-like growth factor-1 (IGF-1) levels have
recently been found higher in HD patients.[10] GH secretion from the pituitary gland is stimulated
by the GH-Releasing Hormone (GHRH) and inhibited by Somatostatin (SS): both these
hypothalamic neurohormones have a pulsatile secretion modulated mainly by noradrenergic and
cholinergic networks.[11, 12] Both clonidine, an α2-adrenoceptor agonist, and arginine, an amino
acid activating the cholinergic system, induce GH release, the former by stimulation of GHRH, the
peer
-005
8577
7, v
ersi
on 1
- 14
Apr
201
1
latter by inhibition of SS release, and they have been widely used to evaluate pituitary GH
secretion and reserve.[13] The aim of our study was to evaluate the GH response to arginine in a
cohort of molecularly confirmed HD patients, in order to look for an in vivo demonstration of
hypothalamic dysfunction in HD. We also investigated the relationship between the GH response
and clinical, metabolic, and endocrine variables, to understand if GH response abnormalities may
represent a biomarker of disease progression.
MATERIALS AND METHODS
Study participants (n=17, 10 males, 7 females) were recruited among consecutive patients
afferent to the HD Clinics at the Department of Neurological Sciences, from February 2008 to
February 2009. Disease specific inclusion criteria were: age between 18-70 years, manifest signs
and symptoms of the disease, and positive molecular test for the presence of a CAG triplet repeat
number > 35 in the HD gene. Exclusion criteria were: history of endocrine disorders, chronic
systemic diseases, substance abuse, or inability to cooperate to the study. Eleven patients were
drug-naïve. To avoid possible interactions, administration of antipsychotic agents or any other
dopamine receptor blockers was interrupted at least 2 weeks before the test in further four
patients. One patient was allowed to take 25 mg/day of tetrabenazine and another 5 mg/day of
olanzapine. The age of onset was considered the time when motor symptoms were first noticed.
The phenotype at onset was also defined as psychiatric, if psychiatric disturbances were present
prior to motor onset, as motor, if only motor symptoms were present at onset, and mixed, if motor
and psychiatric symptoms appeared together. Motor symptoms and Total Function Capacity (TFC)
were evaluated by one experienced neurologist using the Unified Huntington’s Disease Rating
Scale (UHDRS).[14] The motor component of the UHDRS scale consists of 31 questions rated on
a 0- to 4-point scale with 4 indicating the most severe impairment. The TFC is a standardized scale
(range 0-13) most sensitive to early changes in disability with higher scores indicating better
function.[15] Disease stage was determined according to TFC: stage I represents scores from 11
to 13; stage II, from 7 to 10; stage III, from 3 to 6; stage IV, from 1 to 2; and stage V, a score of
0.[16] Control subjects (n=17, 10 males and 7 females) were recruited among healthy volunteers
matched to the patients according to age (± 2 yrs), sex, and body mass index (BMI; ± 2). The only
exception was for a male patient aged 67 yrs with BMI of 16.0, who was matched with a man with
a BMI of 20.3, as it was not possible to find a healthy control of that age with a similar BMI. Control
subjects were free from any neurological and endocrine disease and none of them was taking
medications. The study protocol was approved by the local Ethic Committee and informed consent
was obtained from all the study participants. For HD patients lacking capacity of making decisions,
the informed consent was obtained from the relatives.
In the early morning, after a 12-hour fasting, patients and control subjects underwent
routine investigations and an endocrine study, inclusive of basal insulin, total cholesterol, LDL and
peer
-005
8577
7, v
ersi
on 1
- 14
Apr
201
1
HDL determination, and the arginine test. After subjects had rested in a supine position for at least
30 minutes, baseline samples (T0) were collected from a cannulated antecubital vein. Then 30 g of
arginine (arginine hydrochloride, 30% solution, Salf, Italy) were infused intravenously over 30
minutes, and blood was sampled every 30 minutes for 1 hour (T30, T60, and T90) thereafter.
Blood pressure and heart rate were monitored through the test. Blood samples were centrifugated
immediately after sampling and the supernatants stored at -80°C until analysis. Assays were
performed according to the manufacturer’s instructions. Serum GH was measured with
commercially available immunoradiometric kit (Chematil, Italy). The sensitivity of the assay is 0.015
ng/mL. A peak serum GH lower than 1.4 ng/mL at T60 or T90 time points was considered
abnormal, as for guidelines for adult GH deficiency (GHD) diagnosis.[17] Basal IGF-1 was also
measured, using a chemoluminescent IGF-1 assay (Immunolite 2000, Medical System, Italy) with
the limit of detection of 20 μg/L. Homeostatis model assessment of insulin resistance (HOMA-IR)
was computed as follows: fasting insulin (μIU/ml) x fasting glucose (mmol/ml)/22.5. Inter- and intra-
group analyses were performed using Yates chi-square test and t-test (paired or unpaired), when
appropriated. Relationships between variables are expressed by the Pearson correlation
coefficient. Differences were considered statistically significant when p<0.01. All analyses were
conducted using the STATA 10 for Windows Package (Stata Corporation, College Station, TX,
USA).
RESULTS
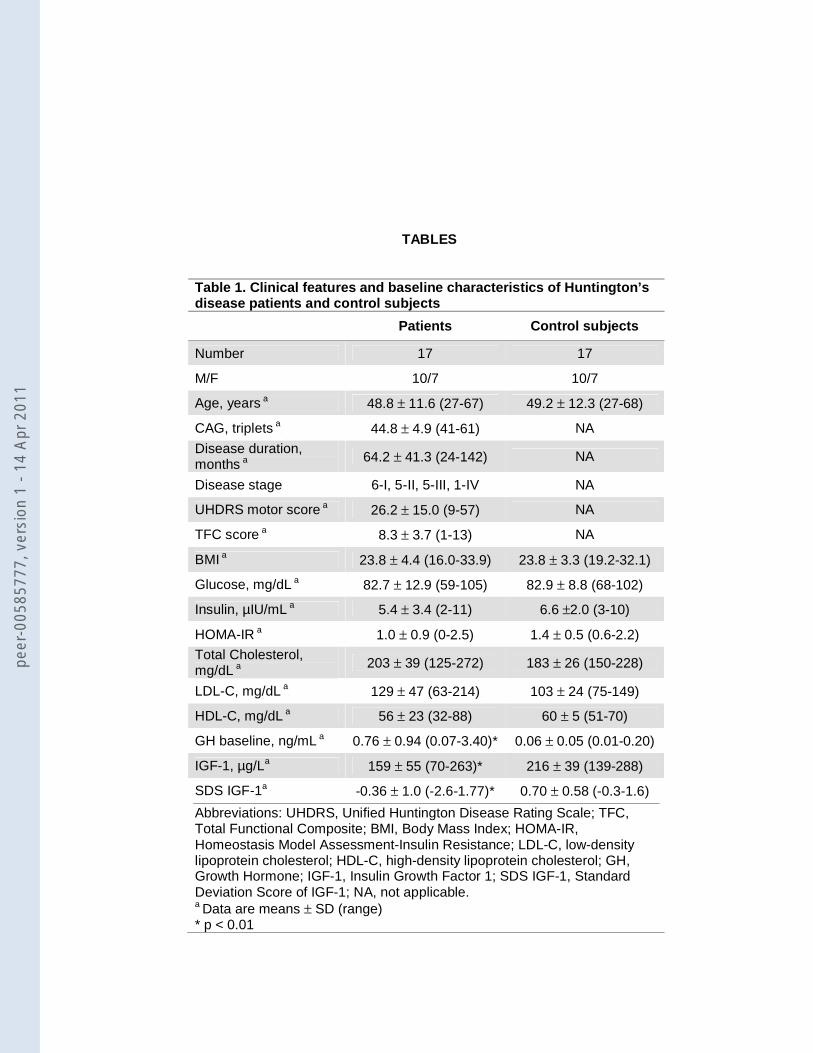
Demographic, clinical, and laboratory data of the patients and the controls are summarized
in table 1. Disease severity was mild to moderate in most. Compared with control subjects, the HD
patients showed higher baseline GH and lower IGF-1 and SDS IGF-1 serum levels. During
arginine infusion no changes in blood pressure or heart rate were observed in any group. The
arginine test induced a GH peak higher than 1.4 ng/mL in all control subjects (mean peak value ±
SD: 16.6 ng/mL ± 8.3; 35% of the subjects at T30, 65% at T60) and in 9 patients (53%) (16.4
ng/mL ± 8.8; 67% at T60, 33% at T90). In the remaining 8 patients (47%) the GH response to
arginine stimulation test was blunted (0.6 ng/mL ± 0.4) (figure 1).
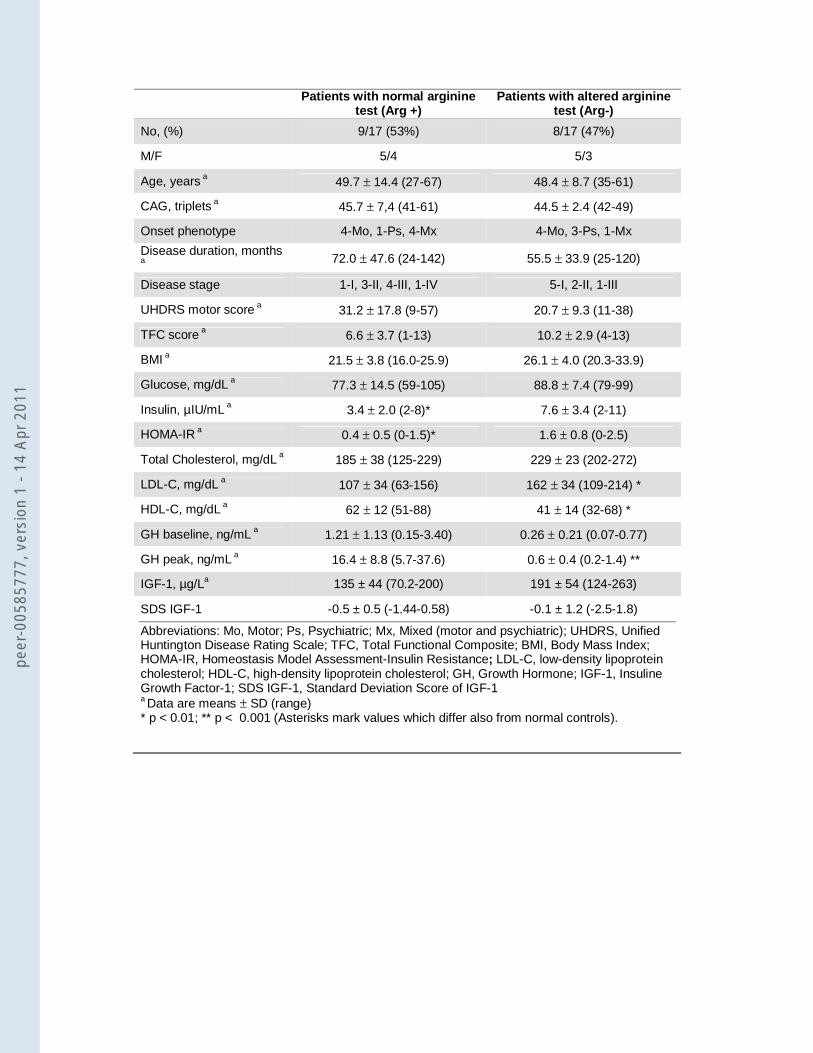
Among the two subgroups of patients (with normal GH response to arginine, Arg+, and with
absent GH response, Arg-) there were no differences in age, sex distribution, CAG triplet repeats,
phenotype at onset, disease duration and stage, and UHDRS motor score; a slightly lower TFC
score (p=0.04) and BMI (p=0.02) value were observed in Arg+ patients (table 2). Previous
exposition to neuroleptics did not affect GH response to arginine since six drug-naïve patients
were Arg+ and five were Arg-. The patient who was still taking olanzapine had a normal GH peak,
whereas the patient who was still taking tetrabenazine showed a blunted response. Arg- patients
showed higher LDL cholesterol and lower HDL cholesterol compared to Arg+ patients (table 2).
Arg+ patients showed lower insulin and HOMA-IR compared to Arg- (table 2). Table 3 shows the
peer
-005
8577
7, v
ersi
on 1
- 14
Apr
201
1
relationship between clinical and laboratory variables in the 17 HD patients. As expected, BMI
showed to correlate positively with total cholesterol and insulin and negatively with baseline GH. A
positive correlation between baseline and peak value GH was found. Also expected was the
negative correlation between TFC score and UHDRS motor score.
DISCUSSION
Several signs of a hypothalamic-endocrine dysfunction have been reported in HD.[5-7, 10,
18] Hypothalamic involvement in HD has been confirmed by neuropathological studies, showing a
dramatic neuronal loss primarily of somatostatin-containing neurons in the NTL.[3, 4] Recently,
higher levels of circulating GH in HD patients have been found in a large case-control study,
showing a correlation with disease severity and weight loss.[10] GH is a protein hormone
synthesized and secreted by the somatotroph cells of the anterior pituitary gland, under two
hypothalamic hormones controllers: GHRH and SS. It is a major participant in several complex
physiologic processes, including growth and metabolism, exerting its role either directly on target
cells or mediated by its peripheral effector, IGF-1.[11, 12]
The present study was aimed to investigate the metabolic/endocrine profile and the GH
response after the arginine stimulation test in a cohort of HD patients and controls. The arginine
test was chosen, because it induces GH release by inhibition of somatostatin release, thus
potentially representing a marker of hypothalamic dysfunction in vivo. Moreover it is a safe test and
has been widely used to evaluate pituitary GH secretion and reserve.[13, 17]
As patients not fully cooperative and those under heavy drug treatment were excluded from
the study, recruitment was biased for the inclusion mostly of patients in early disease stages. HD
patients showed higher basal GH values, as already shown in previous reports,[10, 19] and lower
IGF-1 and SDS IGF-1 levels in comparison with age-, sex- and BMI-matched healthy controls. The
last finding does not confirm the results of a recent paper,[10] which described a slight IGF-1
increase in HD patients. It is noteworthy that IGF-1 levels of the French HD cohort [10] are
comparable to ours (153 ± 48 vs. 159 ± 55 μg/L), but the values of their control subjects, recruited
among patients’ spouses and relatives, are lower than ours, which are healthy volunteers (141 ±
42 vs. 216 ± 39 μg/L). As previously reported,[10] BMI was significantly related with baseline GH
levels and was independent from motor and functional score.
The most relevant result of our study was that almost half of our patients showed no GH
response to arginine infusion. The remaining patients had a normal peak, although somewhat
delayed (at T90 in a third of them) in comparison with controls. Differences in insulin and
cholesterol metabolism were also observed in the two groups.
These findings are unexpected and puzzling. We could speculate that the hypothalamic
dysfunction primarily in somatostatin-containing neurons may determine the lack of response of
peer
-005
8577
7, v
ersi
on 1
- 14
Apr
201
1
GH to arginine stimulus in the Arg- patients. The unbalance in GH/IGF-1 axis regulation may also
be responsible for the impaired lipid profile in this subgroup of patients.
On the other side, in Arg+ patients, a situation of negative energy balance appears to be likely for
the following reasons: 1) high GH levels with reduced IGF-1, insulin and HOMA-IR levels are a
frequent finding in critical illness and catabolic state and it has been proposed that GH
hypersecretion may be driven by decreased circulating IGF-1 through a feedback mechanism in
states of chronic starvation,[20, 21] 2) IGF-1 levels are a good index of nutritional status per se,[22]
3) BMI values are slightly lower than Arg- patients. The clinical picture of this subgroup of patients
also appears to be slighlty more severe, according to the TFC score, suggesting that GH response
is not a useful progression biomarker.
The evidence of these two sharply outlined endocrine/metabolic profiles in HD is difficult to
understand. These results may reflect two different stages of the disease. Otherwise, we found no
differences in age, sex distribution, CAG triplet size, phenotype at onset, and disease stage
between the two groups. Another possible explanation is that the GH response to arginine infusion
may disclose two different patterns of hypothalamic involvement in HD. It has been recently
assessed in an in vivo PET study that hypothalamic changes in HD occur in almost 50% of HD
patients and pre-manifest carriers, without correlation with disease duration and striatal
dysfunction.[23] In this view, the degree of hypothalamic dysfunction may be different among
patients, as well as the motor, cognitive or psychiatric phenotype may be largely heterogeneous in
HD.
In conclusion, our data clearly demonstrate a dysfunction in the somatotropic axis in HD.
According to the GH responses to arginine stimulation, we observed two distinct
metabolic/endocrine profiles in our cohort of patients. The main limitation of our study is the
relative small number of patients, partially due to the rigorous inclusion criteria. To confirm the
data, replication of the study with larger numbers of patients together with further
neuropathological studies and extensively neuroendocrine assessment should be performed.
Prospective studies are also necessary to determine whether these changes occur at an early
stage and whether they are linked to disease progression.
ACKNOWLEDGEMENTS
We would like to thank all patients and families for participation to the study and the
European Huntington’s Disease Network (Euro-HD) for the support.
AUTHORS’ ROLES
1. Research project: A. Conception, B. Organization, C. Execution;
2. Statistical analysis: A. Design, B. Execution, C. Review and Critique;
3. Manuscript: A. Writing of the draft, B. Review and Critique.
peer
-005
8577
7, v
ersi
on 1
- 14
Apr
201
1
Salvatore: 1A, 1B, 1C, 2A, 3A; Rinaldi: 1A, 1B, 1C, 2A, 2B, 3A; Tucci: 1B, 1C; Di Maio: 1B, 1C; Di
Somma: 1B, 1C; Savastano: 1B, 1C; Lombardi: 3B; Filla: 2C, 3B; Colao: 1A, 3B; De Michele: 1A,
2A, 2B, 2C, 3A, 3B
FINANCIAL DISCLOSURES RELATED TO RESEARCH COVERED IN THIS ARTICLE:
All authors report no disclosures.
COPYRIGHT LICENCE STATEMENT
I Giuseppe De Michele, the Corresponding Author of this article has the right to grant on behalf of
all authors and does grant on behalf of all authors, an exclusive licence (or non-exclusive for
government employees) on a worldwide basis to the BMJ Group and co-owners or contracting
owning societies (where published by the BMJ Group on their behalf), and its Licensees to permit
this article (if accepted) to be published in Journal of Neurology, Neurosurgery & Psychiatry and
any other BMJ Group products and to exploit all subsidiary rights, as set out in our licence set out
at: http://jnnp.bmj.com/site/about/licence.pdf.
REFERENCES
1. The Huntington’s Disease Collaborative Research Group. A novel gene containing a
trinucleotide repeat that is expanded and unstable on Huntington’s disease chromosomes. Cell
1993;72:817–818.
2. Kassubek J, Juengling FD, Kioschies, et al. Topography of cerebral atrophy in early
Huntington’s disease: a voxel based morphometric MRI study. J Neurol Neurosurg Psychiatry
2004;75:213–220.
3. Kremer HP, Roos RA, Dingjan GM, et al. The hypothalamic lateral tuberal nucleus and the
characteristics of neuronal loss in Huntington’s disease. Neurosci Lett 1991;132:101–104.
4. Timmers HJ, Swaab DF, van de Nes JA, et al. Somatostatin 1–12 immunoreactivity is
decreased in the hypothalamic lateral tuberal nucleus of Huntington’s disease patients. Brain Res
1996;728:141–148.
peer
-005
8577
7, v
ersi
on 1
- 14
Apr
201
1
5. Morales LM, Estevez J, Suarez H, et al. Nutritional evaluation of Huntington disease patients.
Am J Clin Nutr 1989;50:145–150.
6. Arnulf I, Nielsen J, Lohmann E, et al. Rapid eye movement sleep disturbances in Huntington
disease. Arch Neurol 2008;65:482-488.
7. Morton AJ, Wood NI, Hastings MH, et al. Disintegration of the sleep-wake cycle and circadian
timing in Huntington’s disease. J Neurosci 2005;25:157–163.
8. Aziz NA, Pijl H, Frolich M, van der Graaf AW, et al. Increased hypothalamic-pituitary-adrenal
axis activity in Huntington’s disease. J Clin Endocrinol Metab 2009;94:1223-1228.
9. Markianos M, Panas M, Kalfakis N, et al. Plasma testosterone in male patients with Huntington’s
disease: relations to severity of illness and dementia. Ann Neurol 2005;57:520–525.
10. Saleh N, Moutereau S, Durr A, et al. Neuroendocrine disturbances in Huntington’s disease.
Plos ONE. Published ondine: 25 March 2009. doi:10.1371/journal.pone.0004962.
11. Muller EE, Locatelli V, Cocchi D. Neuroendocrine control of growth hormone secretion. Physiol
Rev 1999;79:511-607.
12. Giustina A, Veldhuis JD. Pathophysiology of the neuroregulation of growth hormone secretion
in experimental animals and the human. Endocr Rev 1998;19:717-797.
13. Growth Hormone Research Society. Consensus guidelines for the diagnosis and treatment of
adults with growth hormone deficiency: summary statement of the Growth Hormone Research
Society workshop on adult growth hormone deficiency. J Clin Endocrinol Metab 1998;83:379-381.
peer
-005
8577
7, v
ersi
on 1
- 14
Apr
201
1
14. Huntington Study Group. Unified Huntington’s Disease Rating Scale: reliability and
consistency. Mov Disord 1996;11:136-142.
15. Shoulson I, Odoroff C, Oakes D, et al. A controlled clinical trial of baclofen as protective
therapy in early Huntington's disease. Ann Neurol 1989;25:252-259.
16. Marder K, Zhao H, Myers RH, et al. Rate of functional decline in Huntington’s disease.
Neurology 2000;54:452-458.
17. Biller BM, Samuels MH, Zagar A, et al. Sensitivity and specificity of six tests for the diagnosis
of adult GH deficiency. J Clin Endocrinol Metab 2002;87:2067-2079.
18. Petersen A, Bjorkqvist M. Hypothalamic-endocrine aspects in Huntington’s disease. Eur J
Neurosci 2006;24:961–967.
19. Phillipson OT, Bird ED. Plasma growth hormone concentrations in Huntington’s chorea. Clin
Sci Mol Med 1976;50:551–554.
20. Grottoli S, Gasco V, Ragazzoni F, et al. Hormonal diagnosis of GH hypersecretory states. J
Endocrinol Invest. 2003;26,27-35.
21. Botfield C, Ross RJ, Hinds CJ. The role of IGFs in catabolism. Baillieres Clin Endocrinol
Metab. 1997;11:679-697.
22. Hawker FH, Stewart PM, Baxter RC, et al. Relationship of somatomedin-C/insulin-like growth
factor I levels to conventional nutritional indices in critically ill patients. Crit Care Med. 1987;15:732-
736.
peer
-005
8577
7, v
ersi
on 1
- 14
Apr
201
1

23. Politis M, Pavese N, Yen F Tai, et al. Hypothalamic involvement in Huntington’s disease: an in
vivo PET study. Brain 2008;131:2860-2869.
FIGURE LEGEND
Figure 1. Serum concentration of GH (mean ± SEM) at baseline, 30, 60, and 90 minutes after
arginine infusion. According to the results of the stimulation test, HD patients can be divided in two
groups: Arg+ (n=9), with a normal GH response, and Arg- (n=8), with a blunted response
compared to controls (n=17).
peer
-005
8577
7, v
ersi
on 1
- 14
Apr
201
1
TABLES
Table 1. Clinical features and baseline characteristics of Huntington’s disease patients and control subjects
Patients Control subjects
Number 17 17
M/F 10/7 10/7
Age, years a 48.8 ± 11.6 (27-67) 49.2 ± 12.3 (27-68)
CAG, triplets a 44.8 ± 4.9 (41-61) NA
Disease duration, months a
64.2 ± 41.3 (24-142) NA
Disease stage 6-I, 5-II, 5-III, 1-IV NA
UHDRS motor score a 26.2 ± 15.0 (9-57) NA
TFC score a 8.3 ± 3.7 (1-13) NA
BMI a 23.8 ± 4.4 (16.0-33.9) 23.8 ± 3.3 (19.2-32.1)
Glucose, mg/dL a 82.7 ± 12.9 (59-105) 82.9 ± 8.8 (68-102)
Insulin, µIU/mL a 5.4 ± 3.4 (2-11) 6.6 ±2.0 (3-10)
HOMA-IR a 1.0 ± 0.9 (0-2.5) 1.4 ± 0.5 (0.6-2.2)
Total Cholesterol, mg/dL a
203 ± 39 (125-272) 183 ± 26 (150-228)
LDL-C, mg/dL a 129 ± 47 (63-214) 103 ± 24 (75-149)
HDL-C, mg/dL a 56 ± 23 (32-88) 60 ± 5 (51-70)
GH baseline, ng/mL a 0.76 ± 0.94 (0.07-3.40)* 0.06 ± 0.05 (0.01-0.20)
IGF-1, µg/La 159 ± 55 (70-263)* 216 ± 39 (139-288)
SDS IGF-1a -0.36 ± 1.0 (-2.6-1.77)* 0.70 ± 0.58 (-0.3-1.6)
Abbreviations: UHDRS, Unified Huntington Disease Rating Scale; TFC, Total Functional Composite; BMI, Body Mass Index; HOMA-IR, Homeostasis Model Assessment-Insulin Resistance; LDL-C, low-density lipoprotein cholesterol; HDL-C, high-density lipoprotein cholesterol; GH, Growth Hormone; IGF-1, Insulin Growth Factor 1; SDS IGF-1, Standard Deviation Score of IGF-1; NA, not applicable. a Data are means ± SD (range) * p < 0.01
peer
-005
8577
7, v
ersi
on 1
- 14
Apr
201
1

Table 2. Clinical features of Huntington’s disease patients according to GH response to arginine
peer
-005
8577
7, v
ersi
on 1
- 14
Apr
201
1
Patients with normal arginine test (Arg +)
Patients with altered arginine test (Arg-)
No, (%) 9/17 (53%) 8/17 (47%)
M/F 5/4 5/3
Age, years a 49.7 ± 14.4 (27-67) 48.4 ± 8.7 (35-61)
CAG, triplets a 45.7 ± 7,4 (41-61) 44.5 ± 2.4 (42-49)
Onset phenotype 4-Mo, 1-Ps, 4-Mx 4-Mo, 3-Ps, 1-Mx
Disease duration, months
a
72.0 ± 47.6 (24-142) 55.5 ± 33.9 (25-120)
Disease stage 1-I, 3-II, 4-III, 1-IV 5-I, 2-II, 1-III
UHDRS motor score a 31.2 ± 17.8 (9-57) 20.7 ± 9.3 (11-38)
TFC score a 6.6 ± 3.7 (1-13) 10.2 ± 2.9 (4-13)
BMI a 21.5 ± 3.8 (16.0-25.9) 26.1 ± 4.0 (20.3-33.9)
Glucose, mg/dL a 77.3 ± 14.5 (59-105) 88.8 ± 7.4 (79-99)
Insulin, µIU/mL a 3.4 ± 2.0 (2-8)* 7.6 ± 3.4 (2-11)
HOMA-IR a 0.4 ± 0.5 (0-1.5)* 1.6 ± 0.8 (0-2.5)
Total Cholesterol, mg/dL a 185 ± 38 (125-229) 229 ± 23 (202-272)
LDL-C, mg/dL a 107 ± 34 (63-156) 162 ± 34 (109-214) *
HDL-C, mg/dL a 62 ± 12 (51-88) 41 ± 14 (32-68) *
GH baseline, ng/mL a 1.21 ± 1.13 (0.15-3.40) 0.26 ± 0.21 (0.07-0.77)
GH peak, ng/mL a 16.4 ± 8.8 (5.7-37.6) 0.6 ± 0.4 (0.2-1.4) **
IGF-1, µg/La 135 ± 44 (70.2-200) 191 ± 54 (124-263)
SDS IGF-1 -0.5 ± 0.5 (-1.44-0.58) -0.1 ± 1.2 (-2.5-1.8)
Abbreviations: Mo, Motor; Ps, Psychiatric; Mx, Mixed (motor and psychiatric); UHDRS, Unified Huntington Disease Rating Scale; TFC, Total Functional Composite; BMI, Body Mass Index; HOMA-IR, Homeostasis Model Assessment-Insulin Resistance; LDL-C, low-density lipoprotein cholesterol; HDL-C, high-density lipoprotein cholesterol; GH, Growth Hormone; IGF-1, Insuline Growth Factor-1; SDS IGF-1, Standard Deviation Score of IGF-1 a Data are means ± SD (range) * p < 0.01; ** p < 0.001 (Asterisks mark values which differ also from normal controls).
peer
-005
8577
7, v
ersi
on 1
- 14
Apr
201
1
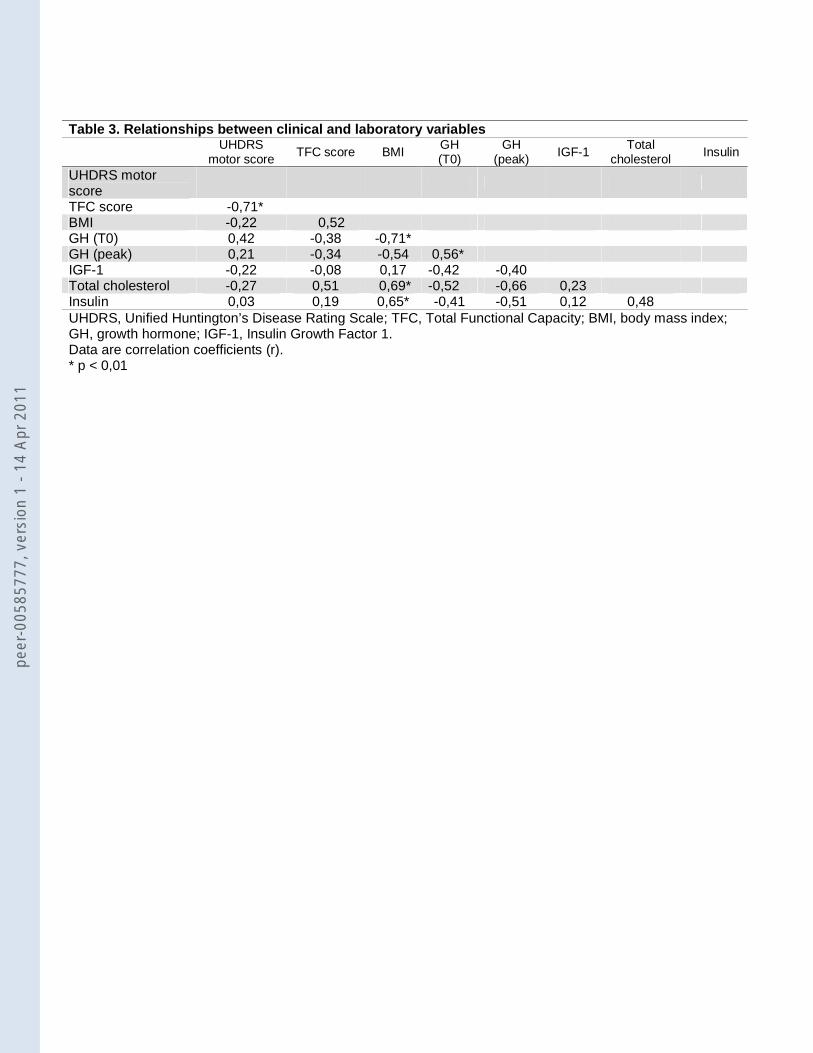
Table 3. Relationships between clinical and laboratory variables
UHDRS
motor score TFC score BMI
GH (T0)
GH (peak) IGF-1
Total cholesterol
Insulin
UHDRS motor score
TFC score -0,71* BMI -0,22 0,52 GH (T0) 0,42 -0,38 -0,71* GH (peak) 0,21 -0,34 -0,54 0,56* IGF-1 -0,22 -0,08 0,17 -0,42 -0,40 Total cholesterol -0,27 0,51 0,69* -0,52 -0,66 0,23 Insulin 0,03 0,19 0,65* -0,41 -0,51 0,12 0,48 UHDRS, Unified Huntington’s Disease Rating Scale; TFC, Total Functional Capacity; BMI, body mass index; GH, growth hormone; IGF-1, Insulin Growth Factor 1. Data are correlation coefficients (r). * p < 0,01
peer
-005
8577
7, v
ersi
on 1
- 14
Apr
201
1
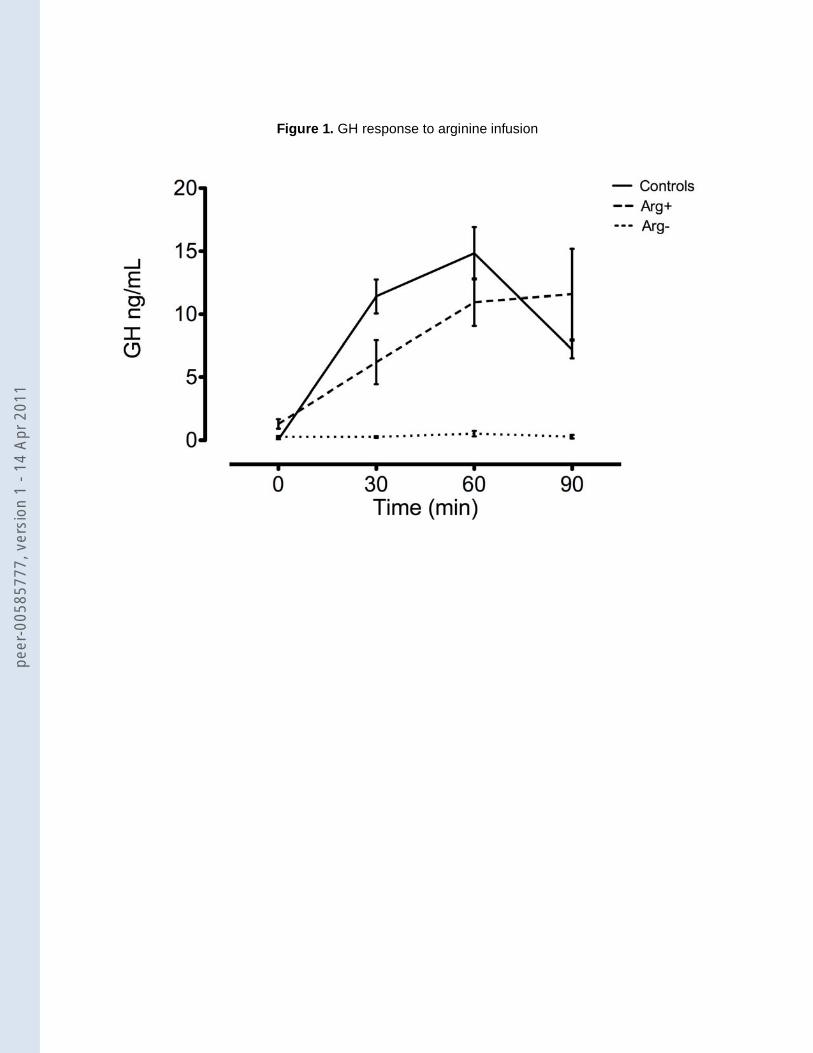
Figure 1. GH response to arginine infusion
peer
-005
8577
7, v
ersi
on 1
- 14
Apr
201
1
Copyright © 2022 FDOKUMEN


![Quaternionic root systems and subgroups of the Aut(F[sub 4])](https://static.fdokumen.com/doc/165x107/63253551584e51a9ab0b749a/quaternionic-root-systems-and-subgroups-of-the-autfsub-4.jpg)