Endothelial dysfunction and erectile dysfunction in the aging man
Upload
independentCategory
view
5download
0
letters to nature
544 NATURE | VOL 403 | 3 FEBRUARY 2000 | www.nature.com
17. Wong, L. S., Johnson, M. S., Zhulin, I. B. & Taylor, B. L. Role of methylation in aerotaxis in Bacillus
subtilis. J. Bacteriol. 177, 3985±3991 (1995).
18. Taylor, B. L. & Zhulin, I. B. PAS domains: internal sensors of oxygen, redox potential, and light.
Microbiol. Mol. Biol. Rev. 63, 479±506 (1999).
19. Zhulin, I. B. & Taylor, B. L. Correlation of PAS domains with electron transport-associated proteins in
completely sequenced microbial genomes. Mol. Microbiol. 29, 1522±1523 (1998).
20. Gilles-Gonzalez, M. A., Ditta, G. S. & Helinski, D. R. A haemoprotein with kinase activity encoded by
the oxygen sensor of Rhizobium meliloti. Nature 350, 170±172 (1991).
21. Monson, E. K., Weinstein, M., Ditta, G. S. & Helinski, D. R. The FixL protein of Rhizobium meliloti can
be separated into a heme-binding oxygen-sensing domain and a functional C-terminal kinase
domain. Proc. Natl Acad. Sci. USA 89, 4280±4284 (1992).
22. Zhulin, I. B., Taylor, B. L. & Dixon, R. PAS domain S-boxes in Archaea, Bacteria and sensors for oxygen
and redox. Trends Biochem. Sci. 22, 331±333 (1997).
23. Gong, W. et al. Structure of a biological oxygen sensor: a new mechanism for heme-driven signal
transduction. Proc. Natl Acad. Sci. USA 95, 15177±15182 (1998).
24. Rebbapragada, A. et al. The Aer protein and the serine chemoreceptor Tsr independently sense
intracellular energy levels and transduce oxygen, redox, and energy signals for Escherichia coli
behavior. Proc. Natl Acad. Sci. USA 94, 10541±10546 (1997).
25. Bibikov, S. I., Biran, R., Rudd, K. E. & Parkinson, J. S. A signal transducer for aerotaxis in Escherichia
coli. J. Bacteriol. 179, 4075±4079 (1997).
26. Vagner, V., Dervyn, E. & Ehrlich, S. D. A vector for systematic gene inactivation in Bacillus subtilis.
Microbiology 144, 3097±3104 (1998).
27. Leonhardt, H. & Alonso, J. C. Construction of a shuttle vector for inducible gene expression in
Escherichia coli and Bacillus subtilis. J. Gen. Microbiol. 134, 605±609 (1988).
28. Alam, M. & Hazelbauer, G. L. Structural features of methyl-accepting taxis proteins conserved
between archaebacteria and eubacteria revealed by antigenic cross-reation. J. Bacteriol. 173, 5837±
5842 (1991).
Acknowledgements
We thank H. G. deCouet, S. Donachie, G. L. Hazelbauer, M. Manson and O. R. Zaborskyfor helpful comments on the manuscript, A. Brooun for the hemAT-Hs deletion strains,H. Chen and J. Yang for participation in the initial stage of protein puri®cation, T. Freitasfor preparing Fig. 1, and J. Spudich for the shuttle vector pKJ427. This investigation wassupported by National Science Foundation CAREER grant to M.A. HemAT-Hs (HtB) hasbeen given GenBank accession number U75436, and HemAT-Bs (YhfV) GenBankaccession number Y14084.
Correspondence and requests for materials should be addressed to M.A.(e-mail [email protected]).
.................................................................Motor disorder in Huntington'sdisease begins as a dysfunctionin error feedback controlMaurice A. Smith*, Jason Brandt² & Reza Shadmehr*
* Department of Biomedical Engineering and ² Department of Psychiatry and
Behavioral Sciences, Johns Hopkins University, Baltimore, Maryland 21205-2195,
USA
..............................................................................................................................................
A steady progression of motor dysfunction takes place in Hun-tington's disease1 (HD). The origin of this disturbance withrelation to the motor control process is not understood. Herewe studied reaching movements in asymptomatic HD gene-carriers (AGCs) and subjects with manifest HD. We found thatmovement jerkiness, which characterizes the smoothness andef®ciency of motion, was a sensitive indicator of presymptomaticHD progression. A large fraction of AGCs displayed elevated jerkeven when more than seven years remained until predicted diseaseonset. Movement termination was disturbed much more thaninitiation and was highly variable from trial to trial. Analysis ofthis variability revealed that the sensitivity of end-movement jerkto subtle, self-generated early-movement errors was greater in HDsubjects than in controls. Additionally, we found that HD correc-tive responses to externally-generated force pulses were greatlydisturbed, indicating that HD subjects display aberrant responsesto both external and self-generated errors. Because feedbackcorrections are driven by error and are delayed such that they
predominantly affect movement termination, these ®ndings sug-gest that a dysfunction in error correction characterizes the motorcontrol de®cit in early HD. This dysfunction may be observedyears before clinical disease onset and grows worse as the diseaseprogresses.
Huntington's disease is an autosomal dominant inherited neuro-logic disorder caused by a glutamate repeat expansion in the IT15gene2. Disease symptoms appear in the fourth or ®fth decade of life1,
(B) (P) (S)
(A) (B) (C)
(A) (G) (K)
(B) (K) (L)
(B) (P) (S)
(A) (B) (C)
(A) (G) (K)
(B) (K) (L)
Man
ifest
HD
Gen
e ca
rrie
rsG
ene-
neg
cont
rols
Age
-mat
ched
con
trol
s M
anife
st H
DG
ene
carr
iers
Gen
e-ne
g co
ntro
lsA
ge-m
atch
ed c
ontr
ols
a
10 cm
b
Figure 1 Hand paths from selected subjects after 200 practice trials (movements 201±
300). a, The two most regular movements in each direction. b, The two least regular
movements each direction. Movement regularity was determined by the correlation
coef®cient6 of the velocity pro®le with the velocity pro®le of that subject's typical
movement. The typical movement was de®ned as the movement in each direction with the
highest average correlation to other movements. Hand paths are plotted from the centre
out relative to their starting positions. Points are spaced 30 ms apart in time. The distance
between consecutive points is proportional to the movement speed during that interval.
Top row, subjects with manifest HD. Second row, asymptomatic gene-carriers. Third row,
controls who have a parent with HD but who are mutation negative. Bottom row, controls
age-matched to the asymptomatic gene-carriers. The letter that labels each subject
identi®es him or her within each group in Fig. 2.
© 2000 Macmillan Magazines Ltd

letters to nature
NATURE | VOL 403 | 3 FEBRUARY 2000 | www.nature.com 545
and then progress steadily during the succeeding 10±20 years.Signi®cant, progressive atrophy of the basal ganglia is evident inHD (ref. 3), and may even be detectable before clinical onset4. Itsidentifying motor sign is chorea: the occurrence of rapid, irregular,and arrhythmic complex involuntary movements. Along withchorea, substantial impairment of voluntary movement alsooccurs1, and it may be of greater functional importance in thelives of patients5. Two control processes take part in the execution ofarm movements. Feedforward control is the generation of motorcommands based a priori on the desired action and an internalmodel of the system's response6,7, whereas feedback control entailsthe `mid-¯ight' correction of these commands based on errorsdetected during their execution8. To study these processes in HD,we used a high-performance manipulandum9 to record visuallyguided reaching arm movements in patients with HD and pre-symptomatic individuals with the HD mutation up to 18 years frompredicted disease onset.
Figure 1 displays hand paths of the two most regular and two leastregular movements in each direction, for several subjects after 200practice movements. The range of movement quality is generallymuch larger in HD patients than in controls. Some movementsmade by symptomatic HD subjects appear normal whereas othersare markedly irregular. Speci®cally, many HD movements have largechanges in direction, smooth or abrupt, when approaching thetarget, whereas almost all movements fail to stop ef®ciently andsmoothly. One way to characterize these irregularities is to quantifythe smoothness of each movement. Smoothness can be de®ned asthe lack of abrupt change; thus a trajectory that minimizes abruptchanges in a variable will maximize its smoothness. Human reach-ing movements are of near-maximal acceleration smoothness,quanti®ed by minimal cumulative squared acceleration change10,also referred to as minimum total squared jerk.
Figure 2a shows that all HD patients and several AGCs mademovements with above-normal jerk. All HD subjects reduced theirmovement jerk with practice, although not nearly to control levels.The smoothness of movements increased over time even in subjectswho were markedly more jerky than normal. To compare theinitiation and completion of movement, we split each movementat the peak in the speed pro®le. This is roughly the point at whichmovement towards the target switches from acceleration todeceleration. Comparison of the total squared jerk before andafter the peak in the speed pro®le (Fig. 2b) reveals that althoughfewer than half of the HD patients have high jerk during both partsof the movement, all have above-normal post-peak jerk. Only 2 of16 AGCs show above-normal pre-peak jerk, but most have highpost-peak jerk. To assess disease progression in AGCs, we used anestimate of disease onset age based on each subject's parental onsetage and glutamate repeat length4. The amount of post-peak jerkcorrelated signi®cantly (r = -0.62) with estimated time to diseaseonset for AGCs whereas the pre-peak jerk did not (r = 0.02). Post-peak jerk was above normal in 4 of 5 close-to-onset (,7 years)subjects and in 3 of 9 far-from-onset subjects (.7 years). As groups,both HD patients and AGCs had signi®cantly higher than normalpost-peak jerk (P , 10-6, P , 0.00012; see Fig. 2e). Moreover, AGCswho were close to predicted disease onset had signi®cantly higherjerk in the third set than far-from-onset subjects (P , 0.0062) whoin turn had signi®cantly higher jerk than controls (P , 0.013).
Figure 2c shows that initial aiming is not greatly disturbed in HD.Average directional aiming bias (see Methods section) is normal in 9of 11 HD patients. Aiming variability is in the control range for amajority (6 of 11) of patients, although, as a group, subjects withmanifest HD display increased aiming variability. All AGCs havenormal aiming biases of 3±78 and none has above-normal aimingvariability.
These results suggest that HD movements often begin normally,but become jerky and irregular at some point during their course.Comparison of the average time course of raw squared jerk pro®les
between groups for movements in different speed ranges (Fig. 3)reveals a strikingly consistent pattern. At each speed range, the HDjerk pro®le closely matches the control pro®le during the beginningof movement, but begins to separate from it 200±300 ms after onset.Note that the end-movement squared jerk is 10±30 times greater inHDs than controls.
Why do HD movements begin to become irregular 200±300 msinto their course and not before? Corrective actions based onvisual11,12 and proprioceptive13 information acquired during reach-ing movements begin to take place at about the time at which HDmovements become irregular, so one possibility is that the systemthat generates these corrective actions is disturbed. Alternatively,there may be a disturbance in decelerating movement or anotherend-movement process independent of error correction.
To distinguish between these possibilities, we characterized theperformance of the error feedback control system in HD. If thesystem that generates corrective actions during movement (thefeedback controller) is affected in HD, then a strong relationshipshould exist between magnitude of error early in the movement andsize of disturbance later. Error, the difference between desiredsystem state and actual state, is the primary input to a feedbackcontroller. If the error during a movement is small, then large
1 2 3Post-peak jerk
1 2 3
Age<32Age>32
GPA11+GPA8-11
GPA7-HD7-HD7+
CONGPA
HD
Pre-peak jerk
1 1.5 2 3 4 5
0.8
1
1.2
1.6
2
2.4
3
G
A
BC
DE
FGHJ
KL
M
E
AAB
C
A
B
C
DSF
L
HJ
K
P
RB
C
D
EFG
H
J
KN
L
M
Total jerk (movements 1–100)
Tota
l jer
k (m
ovem
ents
201
–300
)
0.8 1 1.2 1.50.6
1
1.4
2
3
4
AB CDE
F
GH
J
KL M
GC
AB
C
A
BC
D
E
F S
HJ K
L
R B
AD
EFG
H
JP
KL
M
N
Pre-peak jerk
Pos
t-p
eak
jerk
4 7 10 15
1
2
4
7
10
G
A
B C
DE
F
GHJ K LM
E
A
A
BC
A B
C
D
SF
LH
J
K
P
R
BCDE
F
G
HJK N
LM
Aiming variability
Aim
ing
bia
sa
c e
b
d
Figure 2 Quanti®cation of movement properties. Red, subjects with manifest HD. Orange,
asymptomatic gene-carriers. Blue, age-matched controls. Green, gene-negative
individuals having a parent with HD. a±c are plotted on a logarithmic scale for clarity.
The blue dotted lines show the 95% con®dence intervals for the control distribution (mean
6 1.96 standard deviations). The black diagonal line in a represents the axis of equality
(y = x). a, The mean of the normalized total squared jerk for all subjects in the ®rst 100
movements and in movements 201±300. All symptomatic subjects and a subset of
asymptomatic gene-carriers have higher than normal jerk. b, The mean of normalized jerk
(in movements 201±300) before and after the peak in the movement speed. The pre-
peak segment, which re¯ects movement initiation, appears much less disturbed in HD
than the post-peak segment, which re¯ects movement completion. c, Aiming bias and
aiming variability. We refer to aiming as the direction of travel with respect to the initial
target direction, during the pre-peak movement segment. Like pre-peak jerk, aiming
re¯ects the quality of movement. d,e, Group-wise comparisons of normalized pre-peak
and post-peak jerk, respectively. Asterisks indicate signi®cantly worse performance than
control subjects. * P , 0.05. ** P , 0.01. *** P , 0.001. **** P , 0.0001. HD7+,
subjects with manifest HD for more than 7 years. HD7±, subjects with manifest HD for
less than 7 years. GPA7±, gene-carriers less than 7 years from predicted onset. GPA7±
11, gene-carriers 7 to 11 years from predicted onset. GPA11+, gene-carriers more than
11 years from predicted onset. Age . 32, controls more than 32 years old. Age , 32,
controls less than 32 years old.
© 2000 Macmillan Magazines Ltd

letters to nature
546 NATURE | VOL 403 | 3 FEBRUARY 2000 | www.nature.com
100
101
102
103Peak speed = 0.21 to 0.25 m s–1
Mea
n sq
uare
d je
rk (m
2 s–6
)
Peak speed = 0.25 to 0.29 m s–1
0 0.5 1
100
101
102
103Peak speed = 0.29 to 0.33 m s–1
0 0.5 1
Peak speed = 0.33 to 0.37 m s–1
Time (s)
0 0.5 1
Peak speed = 0.37 to 0.41 m s–1
Symptomatic HDAsymptomatic gene (+) HDAge-matched controls Younger controls
Figure 3 Squared jerk pro®les for different movement speeds. Average raw squared jerk
6 standard error is plotted on a logarithmic scale as function of time since movement
onset for movements in each speed range, in different subject groups. For reference, the
second peak in the squared jerk pro®le approximately corresponds to the peak in the
speed pro®le. Note that at all speed ranges the separate groups have quite similar jerk
pro®les until 300 ms, but HD subjects have very different pro®les after this point.
Controls
–10-505
10
0 5 10 15 20 250
1
2
3
Distance from centre to PSP (%)
Pos
t-p
eak
jerk
0 5 10 15 20 250
2
4
6
× 10–3
Distance from centre to PSP (%)
Den
sity
(× 1
0–3 m
m–2
)
Gene (+) asymptomatic HD
Pos
ition
per
pen
dic
ular
to
targ
et (%
)
–10–505
10
Symptomatic HD
Position toward target (%)30 40 50 60 70
–10–505
10
0 5 10
CON
GPA
HDS
Average PSP displacement (% of target distance)0 0.02 0.04 0.06 0.08
CON
GPA
HDS
Average jerk/PSP Sensitivity
0
1
2
3
45
01
2
3
45
× 10–301
2
3
45
× 10–3
0
0.5
1
1.5
0
0.5
1
1.5
0
1
2
3Symptomatic HD
Position toward target (%)30 40 50 60 70
–10–505
10
Gene (+) asymptomatic HD
–10–505
10
Controls
–10–505
10
a b
c d
e f
g h
i j
Figure 4 Errors that occur early in the movement, before the hand reaches its peak speed,
predict jerk that occurs later. a,c,e, The two-dimensional probability densities of peak
speed positions (PSPs) for each group during movements 301±400. This is the likelihood
of the peak speed occurring at each position. The x-axes are in the target direction and the
y-axes are in the direction perpendicular to the target. PSPs are clustered near the
movement midway point. g, Summary of a,c,e: the average probability density at a given
displacement between the PSP and movement midway point (50%, 0%). Large values for
the distance from midway point to peak-speed position indicate large early-movement
errors, which are uncommon. The similarity of these distributions indicates that there are
not large differences in the pattern of error recorded from the three subject groups early in
the movement. b,d,f, End-movement jerk as a function of peak-speed position. When
large early movement errors occur, as indicated by large PSP displacements (near the
image boundaries), the post-peak jerk is increased for all groups, but the increase is
greater for asymptomatic and symptomatic HD subjects than controls. White colour on
images indicates no data. h, Summary of b,d,f: the average end-movement jerk at a given
displacement between the PSP and movement midway point. i, Average PSP
displacement for each group. j, Sensitivity of end-movement jerk to PSP, measured as the
slope of the relationship between them. Asterisks indicate signi®cantly worse
performance than control subjects. * P , 0.05. ** P , 0.01. *** P , 0.001.
© 2000 Macmillan Magazines Ltd
letters to nature
NATURE | VOL 403 | 3 FEBRUARY 2000 | www.nature.com 547
corrective actions are not necessary and dysfunction in feedbackcontrol might have only minimal effects. However, if errors arelarge, substantial corrective actions are required, and dysfunctionalfeedback control may cause signi®cant problems with movement.
Although we can measure actual movements quite accurately, wehave no reliable way of estimating the desired motion state within asingle movement. This makes direct estimation of error infeasible. Iferrors are symmetrically distributed, then the average movementpro®le should approximate the average motion plan (that is, theaverage intended movement of the subject). However, subjects mayplan to move slightly faster on one trial, then slower on the next, andthese variations in the plan may be as large as the typical errorsbetween plan and action. Although the motor plan might changeacross trials, a few of its properties are invariant. Velocity pro®lesof reaching movements are symmetric and unimodal: the peak inthe velocity pro®le occurs very close to the movement's midwaypoint, regardless of amplitude, direction or speed14. Therefore, thedistance between the midway point and the position where the peakspeed occurs can be used as an indicator of error early in themovement.
The relationship between error early in movement and jerk late inmovement is shown in Fig. 4. The probability distributions of peak-speed positions (PSPs) do not differ markedly between groups(Fig.4 a,c,e,g and i). This implies that amount of error early in themovement is comparable between groups. However, the reaction tothis error is very different between groups. Figure 4 b,d,f,h and jshows that the jerk that occurs after the hand reaches the PSP variesconsiderably with PSP in all subject groups. When the PSP is farfrom the midway point, indicating large error early in the move-ment, post-peak jerk is high. However, the sensitivity of post-peakjerk to PSP is much greater in HD patients and AGCs than controls.Figure 4h shows that the difference in mean post-peak jerk between
controls and AGCs is much greater at large PSP displacements thanat small displacements. Subjects with manifest HD (P = 0.006) andAGCs (P = 0.04) display signi®cantly higher sensitivity in theirresponse of end-movement jerk to early-movement error than docontrols, as measured by slope in this relationship. The sensitivity ofpost-peak jerk to PSP displacement indicates the degree to whichend-movement smoothness depends on early-movement error. Theincrease in this sensitivity in HD subjects with and without clinicallymanifest symptoms suggests that an error-dependent control pro-cess is disturbed early in the disease course and further deteriorateswith disease progression.
Previous reports have shown that cortical sensorimotor pathwaysare affected in patients with manifest HD. Whereas short-loopre¯exes that are mediated by spinal mechanisms are normal, long-loop re¯exes, which involve the transfer of proprioceptive informa-tion through cortical pathways, are reduced or absent in HD15,16).Cortical responses to peripheral nerve stimulation, as measured bysomatosensory evoked potentials (SEPs), are also reduced inHD15,17,18, suggesting that diminished cortical sensory input isresponsible for the long-loop re¯ex reduction16. In addition, astrong correlation exists between SEP deterioration and striatalglucose metabolism early in the course of HD17, hinting at a possibleinvolvement of the striatum in the pathology of the SEPs and long-loop re¯exes. As cortical sensorimotor pathways have a large role inmediating error correction during voluntary movement, disruptionof these pathways could lead to dysfunctional feedback controlduring movement.
Our analysis of the response to internal, self-generated errorssuggested that error correction in general might be disturbed in HD.To test this hypothesis we externally imposed errors upon move-ments of these subjects via an occasional brief (70 ms) force pulseshortly after movement initiation. These pulses were given
0 N
12 N
18 N
HDS: 1 HDS: 2 GPA: 3 CON: 4 CBL: 5 CBL: 6 CBL: 7
18 N force pulses 12 N force pulses0
100
200
300
400
500
Pos
t-p
ertu
rbat
ion
jerk
(%)
18 N force pulses 12 N force pulses0
20
40
60
80
100
Pos
t-p
ertu
rbat
ion
pat
h le
ngth
(%)
HDS - Symptomatic HD GPA - Gene (+) asymptomatic HD CON - Control CBL - Cerebellar dysfunction
a
b
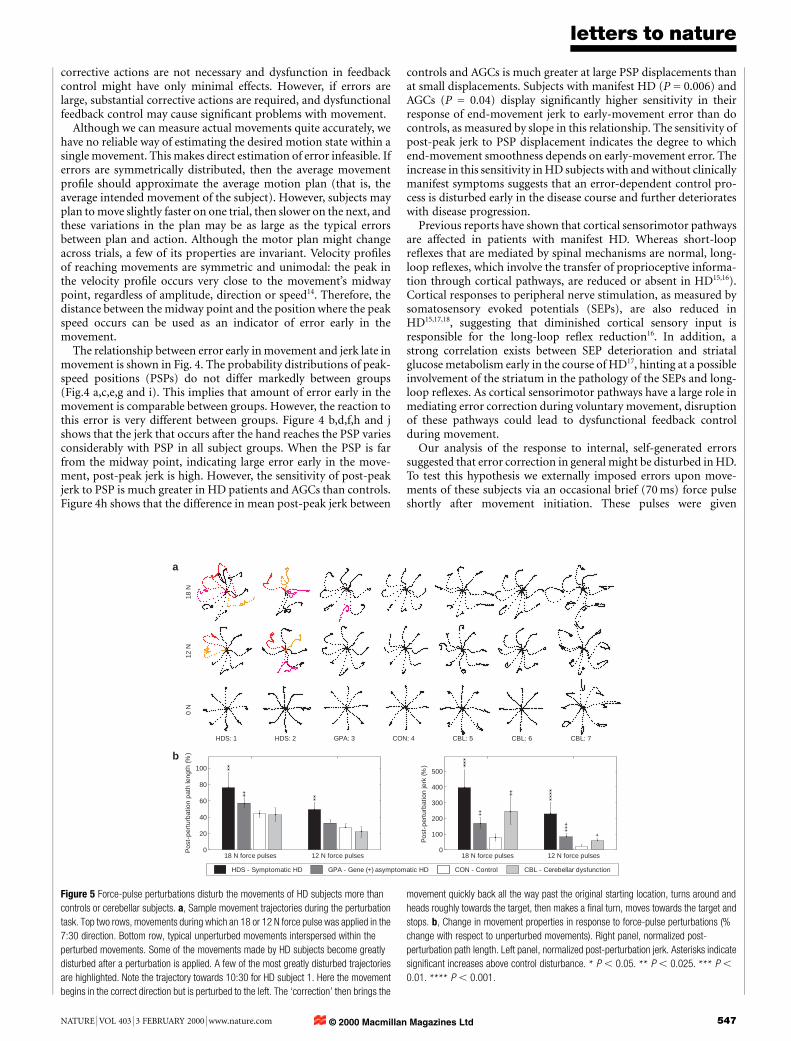
Figure 5 Force-pulse perturbations disturb the movements of HD subjects more than
controls or cerebellar subjects. a, Sample movement trajectories during the perturbation
task. Top two rows, movements during which an 18 or 12 N force pulse was applied in the
7:30 direction. Bottom row, typical unperturbed movements interspersed within the
perturbed movements. Some of the movements made by HD subjects become greatly
disturbed after a perturbation is applied. A few of the most greatly disturbed trajectories
are highlighted. Note the trajectory towards 10:30 for HD subject 1. Here the movement
begins in the correct direction but is perturbed to the left. The `correction' then brings the
movement quickly back all the way past the original starting location, turns around and
heads roughly towards the target, then makes a ®nal turn, moves towards the target and
stops. b, Change in movement properties in response to force-pulse perturbations (%
change with respect to unperturbed movements). Right panel, normalized post-
perturbation path length. Left panel, normalized post-perturbation jerk. Asterisks indicate
signi®cant increases above control disturbance. * P , 0.05. ** P , 0.025. *** P ,
0.01. **** P , 0.001.
© 2000 Macmillan Magazines Ltd

letters to nature
548 NATURE | VOL 403 | 3 FEBRUARY 2000 | www.nature.com
randomly on a minority of trials, and could be in eight differentdirections (indicated by the times corresponding to clockfacedirections) and of three different magnitudes (6, 12 and 18 Npeak force). In addition to subjects with HD, we studied theperformance of individuals with cerebellar de®cits on this task.Hand paths of two symptomatic HD, one AGC, one control andthree cerebellar subjects for movements perturbed with force pulsesof 12 and 18 N are shown in Fig. 5a. These perturbations aresubstantial: trajectories can be altered by up to 5 cm (movementdistance is 10 cm). Control subjects correct the perturbationssmoothly and ef®ciently, but extremely large successive overshootsare seen during certain HD movements. Not all HD movementcorrections appear irregular, but some are so markedly disturbedthat they bear little qualitative similarity to any movements that werecorded from controls.
Several movements made by cerebellar subjects appear to haveirregular and inef®cient corrections, but close inspection of many ofthese trajectories reveals a striking similarity between the pattern ofovershoots in these movements and the overshoots present inunperturbed movements in the same direction. This suggests thatthe irregularity that exists in these perturbed movements has astronger relationship to the direction of movement than to thepresence of perturbation. We note that such movements toward3:00, 4:30 and 7:30 for subjects 5 and 7.
HD subjects appear to have dysfunctional reactions to movementerrors caused by external perturbations. During the post-perturba-tion movement segment (the corrective period), jerk and pathlength relatively increase over unperturbed movements signi®cantlymore for HD subjects than for controls (see Fig. 5b) for both 12- and18-N perturbations. The error-correction performance of AGCsgenerally falls between that of controls and subjects with manifestHD. Cerebellar subjects, like symptomatic HD patients, had worseunperturbed movement performance than controls, but the decre-ment in their performance when perturbations were given wasgenerally more like that of controls than HD subjects. This suggeststhat subjects with HD generally have greater de®cits in error feed-back control than do cerebellar patients.
Previously, assessments of motor, cognitive or psychiatric func-tion in HD have revealed only subtle de®cits in presymptomaticsubject groups19±21 if any22,23. When changes have been detected, theywere not suf®ciently speci®c to permit discrimination betweenmutation-positive and mutation-negative individuals, or even reli-able identi®cation of people with early-stage manifest HD. Incontrast, low glucose metabolism in the basal ganglia has beenreported in about two-thirds of asymptomatic at-risk individualstested17,24,25 and basal ganglia volumes may be reduced years beforeclinical onset4, suggesting that brain pathology precedes manifesta-tion of the behavioural dysfunction previously studied. However,end-movement jerk appears to be a sensitive indicator of HDprogression, suggesting the existence of a direct behavioural corre-late to the early brain pathology of HD.
Our results, which suggest relatively unaffected feedforwardcontrol but dysfunctional feedback control in HD, may help toexplain the pattern of motor learning de®cits reported: learningrotary pursuit, which involves long continuous movements underclosed-loop feedback control, is more impaired than mirror tracingwith short discrete movements that are more open-loop in nature26.Real-time error feedback control presents a formidable challenge tothe CNS because of the large sensorimotor delays that occur27. Oneway to improve the performance of such a time-delayed system is toinclude a component that can effectively predict away the delay andallow ef®cient error correction. This sort of predictor has beenreferred to as a forward model of system dynamics8,28. Neurons inthe basal ganglia have been shown to predict reward by ®ringvigorously in advance of reward upon completion of the require-ments for reward attainment29, hinting that predictive capacity maybe a general feature of some basal ganglia structures. The main
output of the basal ganglia modulates the action of the thalamus,which relays sensory information to the cortex. This informationstream is likely to participate in error feedback control. M
MethodsSubjects
Eleven patients positive for the IT-15 mutation and symptomatic with Huntington'sdisease, sixteen mutation-positive presymptomatic subjects, three mutation-negativesubjects who had a parent with HD and twelve other age-matched controls participated inthe ®rst experiment. Five symptomatic and nine presymptomatic HD subjects, eight age-matched controls and six subjects with cerebellar lesions participated in the secondexperiment. All subjects used their dominant hand, and all but one presymptomaticsubject in the ®rst experiment were right-handed. The direct gene test for IT-15 mutationwas conducted at the Johns Hopkins Huntington's Disease Project. The number of CAG(glutamate) trinucleotide repeats was determined, and subjects with .37 repeats werecalled mutation-positive. Subjects with ,34 were called mutation-negative. All cerebellarsubjects that we studied had been diagnosed clinically with cerebellar dysfunction, and allhad lesions localized to the cerebellum on MRI. Four patients had generalized cerebellaratrophy, and two had suffered strokes of the right posterior inferior cerebellar artery(PICA). One of these patients also had a left PICA and a right superior cerebellar arterystroke.
Task
Subjects made quick reaching movements to targets spaced 10 cm away while grasping alightweight two-joint manipulandum. The 1-cm square targets and a small cursorindicating the subject's hand position were displayed on a computer monitor in front ofthe subject6. We de®ne the end of the movement as the beginning of the ®rst time intervalafter movement onset when hand velocity always remained below a threshold of 0.03 m s-1
for 200 ms. During the ®rst experiment, the training took place in two sessions and withinsessions it was subdivided into 100-movement sets. In the ®rst session, subjects completedthree sets of training. After a break of 3±4 hours, they began the second session, whichconsisted of a single set. The robot arm remained passive for all movements in both sets.During the second experiment the robot produced a 70-ms bell-shaped force pulse on aminority of randomly pre-selected trials (with a probability of one in four). The forcepulse could be in any one of eight directions and of magnitude 6, 12 or 18 N. One forcepulse in each direction and of each magnitude was given for each direction of movement.During both experiments we used a sling suspended from the ceiling to support thesubject's upper arm in the horizontal plane. This helped to regularize the subjects' armposition and minimize the effort required to support the arm against gravity.
Analysis
We characterized aiming direction by de®ning angular aiming error as the differencebetween target direction and the direction of travel up to the peak speed point. Aimingerror for a given movement can be positive or negative. Aiming bias for each subject wasde®ned as the average of the magnitude of the average aiming error in each direction.Similarly, aiming variability for each subject was de®ned as the average of the standarddeviation of aiming error in each direction.
Jerk is de®ned as the rate of change of acceleration with respect to time. To minimize theeffect of discretization noise on the differentiation of the velocity signal, jerk was estimatedby applying a Savitsky±Golay ®lter. The minimum total squared jerk (TSJ) required for apoint-to-point movement is proportional to the ®fth power of the movement speed andinversely proportional to the third power of movement excursion. Because of the strengthof the relationship between these variables and TSJ, it is critical to normalize movementspeed and excursion appropriately when comparing the amount of jerk between twomovements. To account for the effect of speed and excursion on a movement's typical jerk,we normalized the TSJ measured for each movement by the average TSJ for movementsmade after practice by a large separate group of controls (n=35), at the appropriate speedand excursion. Similarly, we normalized the TSJ in the pre-peak and post-peak movementsegments by the average values of these quantities for control movements of the same peakspeed and excursion, and we refer to these quantities as pre-peak jerk and post-peak jerk.
As the trajectories of perturbed movements were often quite irregular, and the peakspeed was often strongly in¯uenced by the presence and direction of the perturbing forcepulse, normalization of jerk by peak speed was no longer appropriate for these move-ments. Instead, we normalized the jerk measured after a perturbation offset for a givenmovement by dividing by the minimum possible jerk required to make the movementstate transition characteristic of that movement segment. We refer to this quantity as post-perturbation jerk. Similarly, we de®ne post-perturbation path length as the path lengthbetween the point of perturbation offset and the end point of movement divided by thestraight-line distance between these two points. We compare the values of these quantitiesfor movements during which perturbations were given to unperturbed movements. Forunperturbed movements, we de®ne the time point of `perturbation offset' as that timewhen perturbation offset would have occurred had a perturbation been given.
Analytical methods
The position and velocity of the joints of the robot arm were recorded at 100 Hz fromabsolute and relative joint position encoders with resolution of 5.5 ´ 10-3degreesand 8.0 ´ 10-4 degrees, respectively. This produced estimates of hand position and
© 2000 Macmillan Magazines Ltd
letters to nature
NATURE | VOL 403 | 3 FEBRUARY 2000 | www.nature.com 549
velocity in cartesian coordinates with accuracy greater than 0.1 mm and 1.3 mm s-1,respectively.
Jerk was estimated by applying a fourth-order Savitsky±Golay ®lter on a 250-mswindow of velocity data. This ®lter is equivalent to taking the second derivative at thewindow's centre of the continuous least-squares best-®t fourth-order polynomial. Thisfourth-order polynomial ®t is a low-pass ®lter with a cutoff frequency of 6.83 Hz. Powerspectra of mean subtracted velocity pro®les of very fast 10-cm reaching movements showthat 99.9% of the power is below 6 Hz.
We assessed motion state transition ef®ciency using cumulative squared jerk tocharacterize the ef®ciency of recovery after perturbation offset. To accomplish this, wecompared the amount of jerk that occurred between two different motion states within thesame movement, with the jerk that would occur for a maximally smooth transitionbetween those two states in the elapsed time. The minimum jerk trajectory between twomotion states (state = [position, velocity, acceleration]) is given by a ®fth-orderpolynomial in time:
x�t� � C5�t=t f �5� C4�t=tf �
4� C3�t=tf �
3� C2�t=t f �
2� C1�t=tf � � C0
Where position is represented by x(t), t is time and tf is the ®nal time. Cks are parametersthat depend on the boundary motion states and on the time between them, tf. They can befound by solving the boundary conditions on the motion state.
Once the coef®cients are determined the cumulative squared jerk can be computed bysimply integrating the squared jerk pro®le.
j�t� � x�t� � �60C5�t=t f �2� 24C4�t=tf � � 6C3�=t
3f
Cumulative Squared Jerk � #tf
0
j 2�t�dt
Received 26 August; accepted 3 November 1999.
1. Folstein, S. E. Huntington's Disease a Disorder of Families (Johns Hopkins Univ. Press, Baltimore,
1989).
2. The Huntington's Disease Collaborative Research Group. A novel gene containing a trinucleotide
repeat that is expanded and unstable on Huntington's disease chromosomes. Cell 72, 971±983 (1993).
3. Aylward, E. H. et al. Longitudinal change in basal ganglia volume in patients with Huntington's
disease. Neurology 48, 394±399 (1997).
4. Aylward, E. H. et al. Basal ganglia volume and proximity to onset in presymptomatic Huntington
disease. Arch Neurol. 53, 1293±1296 (1996).
5. Brandt, J. et al. Clinical correlates of dementia and disability in Huntington's disease. J. Clin.
Neuropsychol. 6, 401±412 (1984).
6. Shadmehr, R. & Mussa-Ivaldi, F. A. Adaptive representation of dynamics during learning of a motor
task. J. Neurosci. 14, 3208±3224 (1994).
7. Shidara, M., Kawano, K., Gomi, H. & Kawato, M. Inverse-dynamics model eye movement control by
Purkinje cells in the cerebellum. Nature 365, 50±52 (1993).
8. Bhushan, N. & Shadmehr, R. Computational nature of human adaptive control during learning of
reaching movements in force ®elds. Biol. Cybern. 81, 39±60 (1999).
9. Shadmehr, R. & Brashers-Krug, T. Functional stages in the formation of human long-term motor
memory. J. Neurosci. 17, 409±419 (1997).
10. Flash, T. & Hogan, N. The coordination of arm movements: an experimentally con®rmed mathe-
matical model. J. Neurosci. 5, 1688±1703 (1985).
11. Miall, R. C., Weir, D. J. & Stein, J. F. Manual tracking of visual targets by trained monkeys. Behav. Brain
Res. 20, 185±201 (1986).
12. Wolpert, D. M., Ghahramani, Z. & Jordan, M. I. Are arm trajectories planned in kinematic or dynamic
coordinates? An adaptation study. Exp. Brain Res. 103, 460±470 (1995).
13. Cordo, P. J. Kinesthetic control of a multijoint movement sequence. J. Neurophysiol. 63, 161±172
(1990).
14. Atkeson, C. G. & Hollerbach, J. M. Kinematic features of unrestrained vertical arm movements.
J. Neurosci. 59, 2318±2330 (1985).
15. Meyer, B. U. et al. Motor responses evoked by magnetic brain stimulation in Huntington's Disease.
Electroencephalogr. Clin. Neurophysiol. 85, 197±208 (1992).
16. Noth, J., Podoll, K. & Friedemann, H. H. Long-loop re¯exes in small hand muscles studied in normal
subjects and in patients with Huntington's Disease. Brain 108, 65±80 (1985).
17. Kuwert, T. et al. Comparison of somatosensory evoked potentials with striatal glucose consumption
measured by positron emission tomography in the early diagnosis of Huntington's Disease. Mov.
Disord. 8, 98±106 (1993).
18. Topper, R., Schwarz, M., Podoll, K., Domges, F. & Noth, J. Absence of frontal somatosensory evoked
potentials in Huntington's Disease. Brain 116, 87±101 (1993).
19. Foroud, T. et al. Cognitive scores in carriers of Huntington's disease gene compared to noncarriers.
Ann. Neurol. 37, 657±664 (1995).
20. de Boo, G. M. et al. Early cognitive and motor symptoms in identi®ed carriers of the gene for
Huntington disease. Arch. Neurol. 54, 1353±1357 (1997).
21. Siemers, E. et al. Motor changes in presymptomatic Huntington disease gene carriers. Arch. Neurol.
53, 487±492 (1996).
22. Rothlind, J. C., Brandt, J., Zee, D., Codori, A. M. & Folstein, S. Unimpaired verbal memory and
oculomotor control in asymptomatic adults with the genetic marker for Huntington's disease. Arch.
Neurol. 50, 799±802 (1993).
23. Blackmore, L., Simpson, S. A. & Crawford, J. R. Cognitive performance in UK sample of
presymptomatic people carrying the gene for Huntington's disease. J. Med. Genet. 32, 358±362 (1995).
24. Kuwert, T. et al. Striatal glucose consumption in chorea-free subjects at risk of Huntington's disease.
J. Neurol. 241, 31±36 (1993).
25. Mazziotta, J. C. et al. Reduced cerebral glucose metabolism in asymptomatic subjects at risk for
Huntington's Disease. N. Engl. J. Med. 316, 357±362 (1987).
26. Gabrieli, J. D., Stebbins, G. T., Singh, J. Willingham, D. B. & Goetz, C. G. Intact mirror-tracing and
impaired rotary-pursuit skill learning in patients with Huntington's Disease: Evidence for dissociable
memory systems in skill learning. Neuropsychology 11, 272±281 (1997).
27. Hogan, N. in Multiple Muscle Systems (eds Winters, J. M. & Woo, S. L. Y.) 149±164 (Springer, New
York, 1990).
28. Miall, R. C. & Wolpert, D. M. Forward models for physiologic motor control. Neur. Net. 9, 1265±1279
(1996).
29. Schultz, W., Dayan, P. & Montague, P. R. A neural substrate of prediction and reward. Science 275,
1593±1599 (1997).
Acknowledgements
We thank K. Thoroughman and N. Bhushan. R.S. and M.S. conceived of the experiments,M.S. collected the data, and designed and carried out the data analysis guided byinteraction with R.S., J.B., N.B. and K.T. M.S. and R.S. wrote the manuscript. The JohnsHopkins HD Center (director C. A. Ross) arranged patient visits and clinical assessment ofHD patients. The work was supported by grants from the Whitaker Foundation (R.S.) andthe National Institutes of Health (R.S. and J.B.), and a pre-doctoral fellowship from theNational Institute of General Medical Sciences to M.S.
Correspondence and requests for materials should be addressed to M.S. (e-mail:[email protected]).
.................................................................A neuronal analogue ofstate-dependent learningD. E. Shulz*, R. Sosnik², V. Ego*, S. Haidarliu² & E. Ahissar²
² Department of Neurobiology, The Weizmann Institute of Science,76100 Rehovot, Israel
* Equipe Cognisciences, UNIC, Institut A. Fessard, CNRS, 91198 Gif sur Yvette,
France
..............................................................................................................................................
State-dependent learning is a phenomenon in which the retrievalof newly acquired information is possible only if the subject is inthe same sensory context and physiological state as during theencoding phase1. In spite of extensive behavioural and phar-macological characterization2, no cellular counterpart of thisphenomenon has been reported. Here we describe a neuronalanalogue of state-dependent learning in which cortical neuronsshow an acetylcholine-dependent expression of an acetylcholine-induced functional plasticity. This was demonstrated on neuronsof rat somatosensory `barrel' cortex, whose tunings to the tem-poral frequency of whisker de¯ections were modi®ed by cellularconditioning. Pairing whisker stimulation with acetylcholineapplied iontophoretically yielded selective lasting modi®cationof responses, the expression of which depended on the presence ofexogenous acetylcholine. Administration of acetylcholine duringtesting revealed frequency-speci®c changes in response that werenot expressed when tested without acetylcholine or when themuscarinic antagonist, atropine, was applied concomitantly. Ourresults suggest that both acquisition and recall can be controlledby the cortical release of acetylcholine.
The ascending cholinergic system3 has long been considered to bea candidate for mediating behavioural control of neuronal plasticity4±9.This hypothesis is supported by behavioural and neurophysiologicalstudies in the auditory10±13 and somatosensory systems14±18.Whereas these studies demonstrated the permissive role ofacetylcholine (ACh) during the induction of cortical plasticity10±14,they did not address the possibility that ACh is also involved in theexpression of the induced modi®cations. To examine this potentialrole of ACh, single- (n = 99) and multi-unit (n = 85) activities wererecorded extracellularly from the barrel ®eld19 of anaesthetized adultrats, using a multi-electrode array composed of one or two tungsten-in-glass electrodes and one combined electrode for recording andiontophoresis of ACh. Temporal-frequency tuning curves (TFTCs)
© 2000 Macmillan Magazines Ltd
Copyright © 2022 FDOKUMEN