Growth and yield response of winter wheat to soil warming and rainfall patterns
14
CLIMATE CHANGE AND AGRICULTURE PAPER Growth and yield response of winter wheat to soil warming and rainfall patterns R.H. PATIL 1,2 *, M.LAEGDSMAND 1 , J.E. OLESEN 1 AND J.R. PORTER 2 1 Department of Agroecology and Environment, Faculty of Agricultural Sciences, Aarhus University, 8830 Tjele, Foulum, Denmark 2 Department of Agriculture and Ecology, Faculty of Life Sciences, Copenhagen University, 2630 Taastrup, Denmark (Revised MS received 9 March 2010; Accepted 6 April 2010; First published online 1 July 2010) SUMMARY It is predicted that climate change will increase not only seasonal air and soil temperatures in northern Europe but also the variability of rainfall patterns. This may influence temporal soil moisture regimes and the growth and yield of winter wheat. A lysimeter experiment was carried out in 2008/09 with three factors: rainfall amount, rainfall frequency and soil warming (two levels in each factor), on sandy loam soil in Denmark. The soil warming treatment included non-heated as the control and an increase in soil temperature by 5 xC at 100 mm depth as heated. The rainfall treatment included the site mean for 1961–90 as the control and the projected monthly mean change for 2071–2100 under the International Panel on Climate Change (IPCC) A2 scenario for the climate change treatment. Projected monthly mean changes in rainfall compared to the reference period 1961–90 show, on average, 31 % increase during winter (November–March) and 24 % decrease during summer (July–September) with no changes during spring (April–June). The rainfall frequency treatment in- cluded mean monthly rainy days for 1961–90 as the control and a reduced frequency treatment with only half the number of rainy days of the control treatment, without altering the monthly mean rainfall amount. Mobile rain-out shelters, automated irrigation system and insulated heating cables were used to impose the treatments. Soil warming hastened crop development during early stages (until stem elongation) and shortened the total crop growing season by 12 days without reducing the period taken for later development stages. Soil warming increased green leaf area index (GLAI) and above-ground biomass during early growth, which was accompanied by an increased amount of nitrogen (N) in plants. However, the plant N concentration and its dilution pattern during later developmental stages followed the same pattern in both heated and control plots. Increased soil moisture deficit was observed only during the period when crop growth was significantly enhanced by soil warming. However, soil warming reduced N concentration in above-ground biomass during the entire growing period, except at harvest, by advancing crop development. Soil warming had no effect on the number of tillers, but reduced ear number and increased 1000 grain weight. This did not affect grain yield and total above- ground biomass compared with control. This suggests that genotypes with a longer vegetative period would probably be better adapted to future warmer conditions. The rainfall pattern treatments imposed in the present study did not influence either soil moisture regimes or performance of winter wheat, though the crop receiving future rainfall amount tended to retain more green leaf area. There was no significant interaction between the soil warming and rainfall treatments on crop growth. * To whom all correspondence should be addressed. Email: [email protected] Journal of Agricultural Science (2010), 148, 553–566. f Cambridge University Press 2010 553 doi:10.1017/S0021859610000419
-
Upload
independent -
Category
Documents
-
view
0 -
download
0
Transcript of Growth and yield response of winter wheat to soil warming and rainfall patterns
CLIMATE CHANGE AND AGRICULTURE PAPER
Growth and yield response of winter wheat to soil
warming and rainfall patterns
R. H. PATIL 1,2*, M. LAEGDSMAND 1, J. E. OLESEN1AND J. R. PORTER 2
1Department of Agroecology and Environment, Faculty of Agricultural Sciences, Aarhus University, 8830 Tjele,Foulum, Denmark
2Department of Agriculture and Ecology, Faculty of Life Sciences, Copenhagen University,2630 Taastrup, Denmark
(Revised MS received 9 March 2010; Accepted 6 April 2010; First published online 1 July 2010)
SUMMARY
It is predicted that climate change will increase not only seasonal air and soil temperatures in northernEurope but also the variability of rainfall patterns. This may influence temporal soil moisture regimesand the growth and yield of winter wheat. A lysimeter experiment was carried out in 2008/09 withthree factors: rainfall amount, rainfall frequency and soil warming (two levels in each factor), onsandy loam soil in Denmark. The soil warming treatment included non-heated as the control and anincrease in soil temperature by 5 xC at 100 mm depth as heated. The rainfall treatment included thesite mean for 1961–90 as the control and the projected monthly mean change for 2071–2100 under theInternational Panel on Climate Change (IPCC) A2 scenario for the climate change treatment.Projected monthly mean changes in rainfall compared to the reference period 1961–90 show, onaverage, 31% increase during winter (November–March) and 24% decrease during summer(July–September) with no changes during spring (April–June). The rainfall frequency treatment in-cluded mean monthly rainy days for 1961–90 as the control and a reduced frequency treatment withonly half the number of rainy days of the control treatment, without altering the monthly meanrainfall amount. Mobile rain-out shelters, automated irrigation system and insulated heating cableswere used to impose the treatments.Soil warming hastened crop development during early stages (until stem elongation) and shortened
the total crop growing season by 12 days without reducing the period taken for later developmentstages. Soil warming increased green leaf area index (GLAI) and above-ground biomass duringearly growth, which was accompanied by an increased amount of nitrogen (N) in plants. However,the plant N concentration and its dilution pattern during later developmental stages followed thesame pattern in both heated and control plots. Increased soil moisture deficit was observed onlyduring the period when crop growth was significantly enhanced by soil warming. However, soilwarming reduced N concentration in above-ground biomass during the entire growing period, exceptat harvest, by advancing crop development. Soil warming had no effect on the number of tillers, butreduced ear number and increased 1000 grain weight. This did not affect grain yield and total above-ground biomass compared with control. This suggests that genotypes with a longer vegetative periodwould probably be better adapted to future warmer conditions. The rainfall pattern treatmentsimposed in the present study did not influence either soil moisture regimes or performance ofwinter wheat, though the crop receiving future rainfall amount tended to retain more green leaf area.There was no significant interaction between the soil warming and rainfall treatments on cropgrowth.
* To whom all correspondence should be addressed. Email : [email protected]
Journal of Agricultural Science (2010), 148, 553–566. f Cambridge University Press 2010 553doi:10.1017/S0021859610000419
INTRODUCTION
Global mean air temperature has risen, on average,between 0.6 and 0.8 xC during the 20th century and ifcurrent conditions continue, it is projected to rise be-tween 1.1 and 6.4 xC, with local variations, by the endof the 21st century (Solomon et al. 2007). With cli-mate change, global atmospheric circulation patternsand hydrological processes are expected to alter inter-and intra-annual variability of precipitation regimesat global (Trenberth et al. 2007) and regional scales(Christensen et al. 2007).During the 20th century, precipitation over
northern Europe increased by 10–40%, while in partsof southern Europe it decreased by 20% (Klein Tanket al. 2002). For the International Panel on ClimateChange (IPCC) A2 high emission scenario for2071–2100, the projected precipitation pattern fornorthern Europe suggests significant increase in pre-cipitation during winter (October–March) with lesschange in spring and early summer (April–June), anddecreases during late summer and early autumn(July–September) (Christensen & Christensen 2007).For the period 2000–2008, Denmark has witnessed aconsiderable increase in both average winter(+1.5 xC) and summer (+1.1 xC) temperatures com-pared with the averages for the period 1961–90.Similarly, recent decades show a trend of increasedprecipitation during winter, while it has remainedunchanged during summer (Kristensen et al. in press).These changes in air temperature, altering seasonal
soil temperature as well as leading to increased vari-ability in intra-annual precipitation, can greatly affectthe soil moisture variability, soil nitrogen (N) contentand availability to plants, and so influence the re-sponse of crop production (Hlavinka et al. 2009).Increased rainfall during winter under temperate cli-mates, when evapotranspiration is minimal, maycause waterlogging (Vartapetian & Jackson 1997) andhas been reported to affect yields of winter wheat byreducing tiller and ear numbers (Cannell et al. 1984;Dickin & Wright 2008), but very few studies have re-ported the impact of greater intra-annual precipi-tation variability on winter cereals (e.g. Dickin et al.2009) and the implications of extremes in precipi-tation events have received little attention (Jentschet al. 2007).The response of a given terrestrial ecosystem to
increased variability in precipitation patterns isexpected to be different from the response to otherclimate change factors, including rising air tempera-ture and CO2 concentrations (Easterling et al. 2000;Parmesan 2006). This may also be the case withwinter cereals, but few studies have considered this(e.g. Semenov et al. 1996).Low soil temperature is often a constraint in tem-
perate climates during the early stages of cropgrowth, limiting shoot and root growth, nutrient and
water uptake (Bowen 1991) and possibly retardingdevelopment. Large changes in plant growth, biomassaccumulation and nutrient absorption rates havebeen reported in response to small increases in soiltemperature (Moorby & Nye 1984; Clarkson et al.1992; Engels & Marschner 1992; Gavito et al. 2001),which is expected to increase with rising air tempera-tures. However, relatively little attention has beenpaid to the effects of soil temperature under changingclimates. Only very few in situ studies have been car-ried out elsewhere on the effects of increased soiltemperature, e.g. peanut (Awal & Ikeda 2003; Prasadet al. 2006), maize (Stone et al. 1999) and winterwheat (Gavito et al. 2001). This could also be due tothe fact that soil temperature is difficult to manipulate(Gavito et al. 2001). In the past two decades, manystudies have been directed at understanding the effectsof projected increases in air temperature and CO2
concentration on the response of field crops (e.g.Leaky et al. 2009), whereas surprisingly little efforthas been focused on how anticipated changes in pre-cipitation patterns and elevated soil temperaturesmight affect winter cereals in temperate climates.Thus, a lysimeter experiment was carried out in
order to study the effects of varying rainfall amounts,number of rainy days and soil warming on temporalsoil moisture dynamics, crop phenology, growth andyield of winter wheat.
MATERIALS AND METHODS
Experimental facility
The experiment was carried out in concrete lysimetersat an experimentation facility located at AarhusUniversity, Faculty of Agricultural Sciences, Foulum,Denmark (56x29kN, 9x34kE). Each lysimeter was1.5 m3 (surface area 1r1, depth 1.5 m); the bottom100 mm was filled with coarse gravel to allow freedrainage to a collection point for measurement, whilethe remainder was filled with the local Foulum loamysand soil (Table 1). All the lysimeters were epoxyconcrete coated to prevent seepage through and con-tamination from the concrete blocks and were builtlevel with the surrounding field. Annual mean tem-perature at the site (1961–90) was 7.3 xC, with maxi-mum and minimum monthly means of 15.4 xC (July)and x0.5 xC (January and February), respectively,and the site received, on average, 627 mm of rainfallper year. However, during the study period (October2008–September 2009), the annual mean temperaturerecorded was 8.6 xCwith the maximum and minimummonthly means of 16.1 xC (July–August) andx0.7 xC(January–February).An automated mobile rain-out shelter covered
all the lysimeters only when it rained. A computer-controlled irrigation system allowed an automaticirrigation machine to locate any of the chosen
554 R. H. PAT IL ET AL.
lysimeters and apply a targeted amount of water at arequired intensity to match that of natural rain. Thewater treatment schedule started on 1 November 2008and continued until harvest. The irrigation water hada pH of 7.5.Each lysimeter had eight rows of wheat crop spaced
125 mm apart (details below). In each of the heatedplots an insulated heating cable was placed in the croprows at a depth of 100 mm and connected to a powersupply. The heating cable was installed during tillage.Soil in the unheated (control) plots was disturbed in asimilar way, but no heating cables were placed inthem. A computer-programmed automatic systemcontrolled the soil warming and the soil temperaturewasmonitored using sensors (Campbell Scientific Inc.,Germany) placed horizontally between the heatingcable rows at a depth of 100 mm in all the plots, and at50 and 250 mm deep in all the heated plots and in onecontrol plot. Temperature sensors from all the plotsand depths were connected to a data logger, whichmonitored the temperature every 15 s, and a heatermaintained the temperature at 100 mm in the heatedplots at 5 xC above their respective control plots. Thetemperature was continuously recorded in 15 minsegments, stored and later averaged for each day.
Experimental design and treatments
The experiment was laid out in a split-split plot designwith three factors and two levels in each factor.Factor 1 was number of rainy days (RD) assigned tomain plots comprising normal (RD0) and reduced(RD1) number of rainy days. Factor 2 was rainfallamount (RF) assigned to sub plots and comprisedpresent (RF0) and future (RF1) rainfall amounts.Factor 3 was soil warming (SW) assigned to sub-subplots and consisted of unheated as control (SW0) andsoil heating (SW1) at 5 xC above control at 100 mm.The total of eight treatment combinations was re-plicated four times using 32 lysimeters.Rainfall data for the period 1961–90 from the
Foulum weather station (56x29kN, 9x34kE), located1200 m away from the lysimeter study site, was con-sidered as reference period for defining the rain-fall treatment. A day (0.00–24.00 h) with a minimum
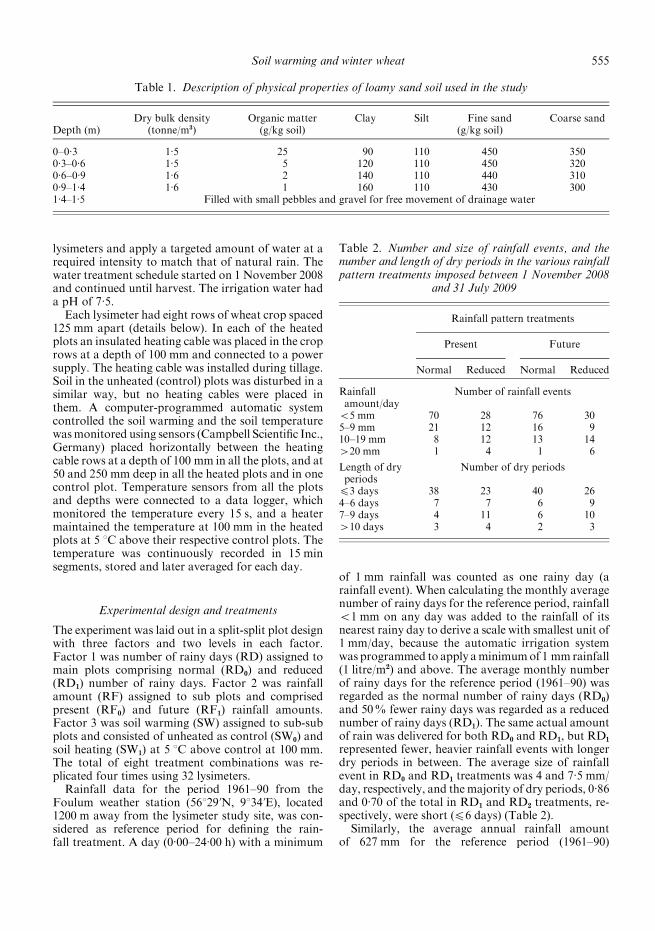
of 1 mm rainfall was counted as one rainy day (arainfall event). When calculating the monthly averagenumber of rainy days for the reference period, rainfall<1 mm on any day was added to the rainfall of itsnearest rainy day to derive a scale with smallest unit of1 mm/day, because the automatic irrigation systemwas programmed to apply aminimumof 1 mmrainfall(1 litre/m2) and above. The average monthly numberof rainy days for the reference period (1961–90) wasregarded as the normal number of rainy days (RD0)and 50% fewer rainy days was regarded as a reducednumber of rainy days (RD1). The same actual amountof rain was delivered for both RD0 and RD1, but RD1
represented fewer, heavier rainfall events with longerdry periods in between. The average size of rainfallevent in RD0 and RD1 treatments was 4 and 7.5 mm/day, respectively, and the majority of dry periods, 0.86and 0.70 of the total in RD1 and RD2 treatments, re-spectively, were short (f6 days) (Table 2).Similarly, the average annual rainfall amount
of 627 mm for the reference period (1961–90)
Table 1. Description of physical properties of loamy sand soil used in the study
Depth (m)Dry bulk density
(tonne/m3)Organic matter
(g/kg soil)Clay Silt Fine sand Coarse sand
(g/kg soil)
0–0.3 1.5 25 90 110 450 3500.3–0.6 1.5 5 120 110 450 3200.6–0.9 1.6 2 140 110 440 3100.9–1.4 1.6 1 160 110 430 3001.4–1.5 Filled with small pebbles and gravel for free movement of drainage water
Table 2. Number and size of rainfall events, and thenumber and length of dry periods in the various rainfallpattern treatments imposed between 1 November 2008
and 31 July 2009
Rainfall pattern treatments
Present Future
Normal Reduced Normal Reduced
Rainfallamount/day
Number of rainfall events
<5 mm 70 28 76 305–9 mm 21 12 16 910–19 mm 8 12 13 14>20 mm 1 4 1 6
Length of dryperiods
Number of dry periods
f3 days 38 23 40 264–6 days 7 7 6 97–9 days 4 11 6 10>10 days 3 4 2 3
Soil warming and winter wheat 555

was regarded as the present rainfall amount(RF0). The projection made for Denmark for theperiod 2071–2100 (658 mm) under the IPCC A2 highemission scenario (Christensen & Christensen 2007)was regarded as future rainfall amount (RF1). Duringthe study period (November–July), a total of 400 and450 mm water was applied in RF0 and RF1 rainfallamount treatments, respectively (Table 3). The higherrainfall of RF1 treatment occurred during winter(November–March).On 23 October 2008, the soil heating system was
turned on and the soil temperature in all the heatedplots (SW1) was maintained at 5 xC above the tem-perature of control plots (SW0) at 100 mm through-out the study period.
Wheat crop management
Winter wheat (Triticum aestivum L. cv. Ambition)seeds were sown at 300 seeds/m2 on 10 October 2008with a row spacing of 125 mm, accommodating eightrows in each plot. Since sowing coincided with asudden drop in air temperature, the germination ofseeds and seedling emergence was severely affected.Gaps due to failed germination were filled in withwheat seedlings raised in soil trays under controlledconditions, which were transplanted at full emerg-ence of the first leaf to obtain a final plant stand ofc. 150/m2. This was in the lower range of that nor-mally found in the field. Inorganic compound ferti-lizer in granular form, which contained 91 g NO3-N/kg, 115 g NH4-N/kg, 26 g P/kg, 96 g K/kg, 36 g S/kg,11 g Mg/kg and 0.2 g Bo/kg, was applied on the soilsurface to supply a total of 170 kg N/ha over the cropcycle. On 27 February and 21 March, 10 kg N/ha wasapplied, while the remaining 150 kg N/ha was appliedin two equal splits on 3 April and 1 May. Lucerne(alfalfa) was grown as the previous crop in all lysi-meters during 2008 without applying fertilizers andon 1 October 2008 the above-ground vegetative part,including stubble, was cut and removed from theplots. Major roots from the plough layer were also
removed to allow a uniform seed bed and to properlyplace the heating cables. Tillage was performed man-ually by turning the top 0.2 m of soil upside down.Disease levels were low during the crop growth period,although powdery mildew (Blumeria graminis) wasobserved in significantly higher levels during earlyspring in the heated plots compared with unheatedplots. A mixture of Flexity (Metratenon) at 0.4 l/haand Rubric (Epoxiconazol) at 0.4 l/ha fungicides wassprayed on 17 May to control powdery mildew.Pirimor aphicide (Pirimicarb) at 0.25 kg/ha wassprayed for cereal aphids, while weeds were con-trolled by spraying a mixture of Express (Tribenuron-methyl) at 1.5 kg/ha and Starane XL (Fluroxpyrmethyl heptyl ester) at 1.8 l/ha on 4 June.
Measurements
A commercially available cable tester (CampbellScientific Inc., Germany) connected to a portablebattery and time domain reflectometry (TDR) probeswere used to measure soil moisture (m3/m3). TheTDR probes were installed (1 November 2008) verti-cally into the soil at the centre of each plot in tworeplications (16 plots) only, to monitor soil moistureat depths of 0–0.2, 0–0.5 and 0–1.0 m. One pair wasinstalled at each depth and measurements were re-corded from 7 November 2008 until the crop washarvested, on average three times a week.During the present study, soil heating was turned on
13 days after sowing (23October 2008). Hence, the soilin both heated and control plots had the same soil tem-perature during seed germination and seedling emerg-ence. The crop phenology during the study periodwas monitored on the Biologische Bundesanstalt,Bundessortenamt and Chemical industry (BBCH)scale for cereals (Lancashire et al. 1991) by recordingthe dates on which the crop had completed theprincipal growth stages (GS0–92). For plant andagronomy measurements, destructive above-groundbiomass sampling was done on four dates: 28 April,15 June, 15 July 2009 and at maturity, by cutting the
Table 3. Soil water (mm) at the start of rainfall pattern treatments and after the crop harvest in top 1 m soil layer,rainfall amount (mm) applied during winter and spring/summer and the total water lost through drainage (mm)
between 1 November 2008 and 31 July 2009 in the different rainfall treatments
Treatments
Soil water (mm) in0–1.0 m depth
Rainfall applied(mm) Drainage
water (mm)At start At harvest Nov–Mar Apr–Jul Total Nov–Jul
Present rainfallNormal rainy days 237 150 200 200 400 150Reduced rainy days 228 135 202 200 402 161
Future rainfallNormal rainy days 235 128 256 194 450 197Reduced rainy days 235 136 263 193 456 215
556 R. H. PAT IL ET AL.

plants at the soil surface from an area of 0.1 m2, fromonly two replications each time. These samples wereused to count shoots on 28 April and ears on 15 June,15 July and at harvest (number/m2). The total above-ground biomass and its partitioning into green leaf,diseased leaf and stem was recorded on 28 April,while on other sampling dates the plants were parti-tioned into green leaf, senesced (yellow) leaf, stem,glume (i.e. chaff) and grain (glume+grain=ear; onlyon 15 June) and dried in an oven (80 xC for 48 h) toobtain weight in g/m2.Before the plant fractions were oven dried, the
green leaf area index (GLAI) and diseased leaf areaindex on 28 April, and GLAI and senesced (yellow)leaf area index (YLAI) on 15 June and 15 July weremeasured using an LI-3100 Leaf Area Meter(LI-COR, Inc., Lincoln, Nebraska USA). On eachbiomass sampling date, a representative sample fromthe partitioned plant parts was ground to a finepowder and analysed for plant N concentration(mg/g) using LECO CNS-1000 Elemental Analyser(LECO Corporation, USA). The N concentration(mg/g) in various plant parts was multiplied with theirrespective oven dried biomass (g/m2) to derive Namount in various plant parts (g N/m2).At harvest, in addition to sampling from 0.1 m2
area (see above paragraph), the total above-groundbiomass and grain yield were also recorded by har-vesting the crop at the soil surface (0.4 m2 area/plot)from the other two replications, in order to gain amore representative sample from each plot, and thedry matter was expressed in t/ha (referred to as grossplots in Table 8). The grains at harvest from these tworeplications were recorded for mean grain weight (mg)and number of grains/m2. Hence, the observationsfrom 0.1 m2 area/plot (Table 7), and those from0.4 m2 area/plot (Table 8) are not identical.
Statistical analyses
Data were subjected to analysis of variance usingsplit–split-plot design with Genstat version 8.1(Lawes Agricultural Trust, Rothamsted Experimen-tal Station, UK). Where significant, the means ofmain factor effects and of their interactions werecompared using standard error of means. The smal-lest unit in the ANOVA model was a lysimeter plotthat was treated as an independent ‘covariate’. In-teractions are presented in the tables only when foundto be significant (Pf0.05).
RESULTS
Rainfall patterns and soil moisture
Neither number of rainy days (RD) nor rainfallamounts (RF) had any significant effect on averagesoil moisture deficit (SMD) measured at 0–0.2, 0–0.5and 0–1.0 m depths for four sampling periodsT
able4.AverageSMD(m
m)at0–0. 2,0–0. 5and0–1. 0
mdepthsfortheperiodbetweentwoabove-groundbiomasssamplingdatesstartingfrom
sowingand
endingatharvest.
S.E.M.,standard
errorofmeans;
D.F.,degrees
offreedom
Treatm
ents
Sowing–28Apr
29Apr–15Jun
16Jun–15Jul
16Jul–harvest
0–0. 2
m0–0. 5
m0–1. 0
m0–0. 2
m0–0. 5
m0–1. 0
m0–0. 2
m0–0. 5
m0–1. 0
m0–0. 2
m0–0. 5
m0–1. 0
m
Rainydays
Norm
al(R
D0)
3. 6
7. 2
9. 1
24
55
73
23
66
107
26
70
115
Reduced(R
D1)
3. 9
7. 1
9. 6
25
54
72
24
65
108
27
69
117
S.E.M.(1
D.F.)
0. 30
0. 12
0. 35
0. 9
2. 0
8. 5
1. 5
0. 8
11. 7
1. 1
2. 4
15. 0
Rainfallamount
Present(R
F0)
3. 6
8. 3
9. 9
23
55
71
23
66
106
25
69
112
Future
(RF
1)3. 9
5. 9
8. 8
26
54
74
24
66
109
28
70
120
S.E.M.(1
D.F.)
0. 38
0. 22
0. 15
0. 5
3. 9
6. 3
0. 4
2. 8
11. 7
0. 8
3. 6
13. 4
Soilwarm
ing
Control(SW
0)3. 5
5. 9
7. 9
25
47
62
24
62
104
28
66
113
Heated(SW
1)4. 0
8. 3
10. 9
24
62
82
22
69
111
26
74
119
S.E.M.(3
D.F.)
0. 49
0. 12
0. 75
1. 5
0. 9
3. 2
0. 7
1. 9
7. 6
1. 7
2. 6
9. 5
Soil warming and winter wheat 557
(Table 4). None of the interactions were statisticallysignificant. Soil warming significantly increased theSMD for the period between sowing and 28 April at0–0.5 m depth (P<0.001) and for the period between29 April and 15 June at 0–0.5 m (P=0.002) and at0–1.0 m (P=0.022) depths, compared with the soil incontrol plots at their respective depths. However, after15 June no significant effect of soil warming on SMDwas recorded across the soil depths (Table 4).
Soil warming system and its effect on crop phenology
The soil warming system in heated plots maintained amean temperature difference of 5¡0.005 xC (n=277)above control plots at 100 mm depth. The soil inheated plots did not freeze, while the soil temperaturein control plots went below zero on several timesduring several days. In heated plots at 50 and 250 mmdepths, the mean temperature difference was c. 4.0and 2.5 xC, respectively, above the correspondingdepths in control plots, which indicated that soilwarming affected a large part of the soil volume. Themean air temperature of heated plots (measured at100–150 mm above the soil surface) was 0.19 xChigher than that of control plots, with minimum andmaximum mean differences of 0.02 xC (March) and0.43 xC (July), respectively.Soil warming greatly affected crop phenology dur-
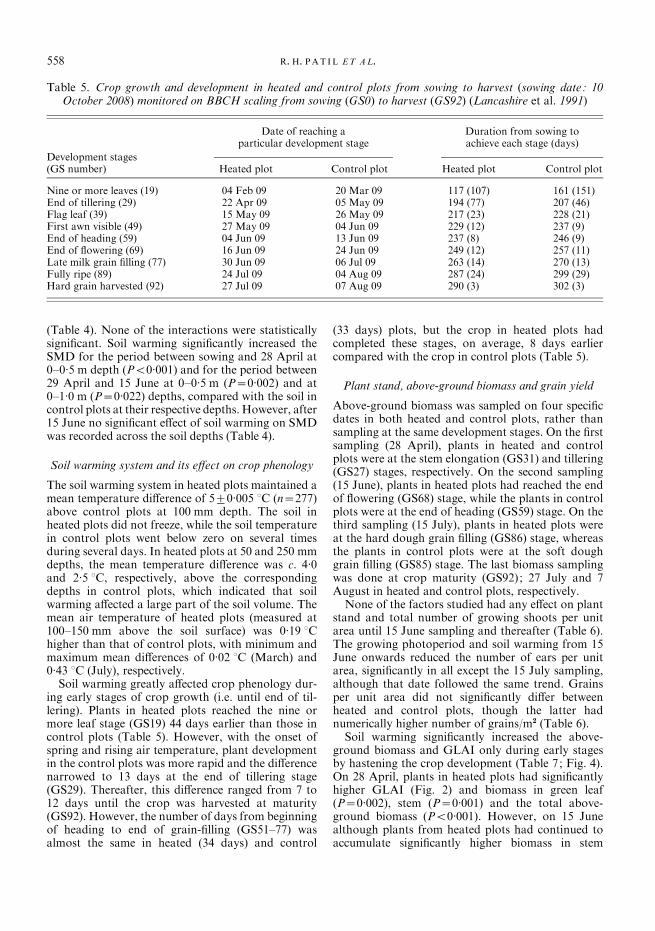
ing early stages of crop growth (i.e. until end of til-lering). Plants in heated plots reached the nine ormore leaf stage (GS19) 44 days earlier than those incontrol plots (Table 5). However, with the onset ofspring and rising air temperature, plant developmentin the control plots was more rapid and the differencenarrowed to 13 days at the end of tillering stage(GS29). Thereafter, this difference ranged from 7 to12 days until the crop was harvested at maturity(GS92). However, the number of days from beginningof heading to end of grain-filling (GS51–77) wasalmost the same in heated (34 days) and control
(33 days) plots, but the crop in heated plots hadcompleted these stages, on average, 8 days earliercompared with the crop in control plots (Table 5).
Plant stand, above-ground biomass and grain yield
Above-ground biomass was sampled on four specificdates in both heated and control plots, rather thansampling at the same development stages. On the firstsampling (28 April), plants in heated and controlplots were at the stem elongation (GS31) and tillering(GS27) stages, respectively. On the second sampling(15 June), plants in heated plots had reached the endof flowering (GS68) stage, while the plants in controlplots were at the end of heading (GS59) stage. On thethird sampling (15 July), plants in heated plots wereat the hard dough grain filling (GS86) stage, whereasthe plants in control plots were at the soft doughgrain filling (GS85) stage. The last biomass samplingwas done at crop maturity (GS92); 27 July and 7August in heated and control plots, respectively.None of the factors studied had any effect on plant
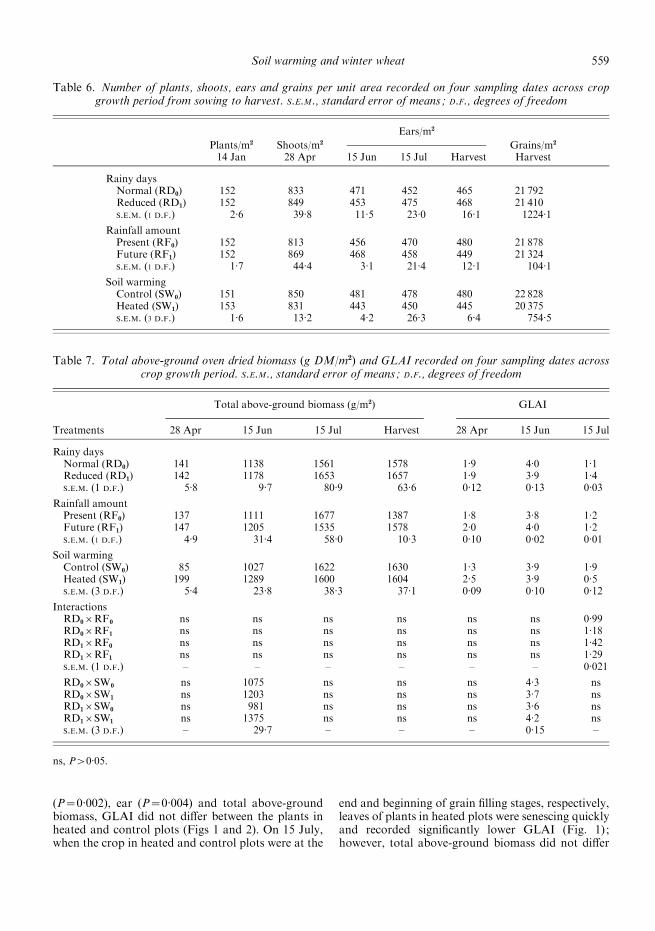
stand and total number of growing shoots per unitarea until 15 June sampling and thereafter (Table 6).The growing photoperiod and soil warming from 15June onwards reduced the number of ears per unitarea, significantly in all except the 15 July sampling,although that date followed the same trend. Grainsper unit area did not significantly differ betweenheated and control plots, though the latter hadnumerically higher number of grains/m2 (Table 6).Soil warming significantly increased the above-
ground biomass and GLAI only during early stagesby hastening the crop development (Table 7; Fig. 4).On 28 April, plants in heated plots had significantlyhigher GLAI (Fig. 2) and biomass in green leaf(P=0.002), stem (P=0.001) and the total above-ground biomass (P<0.001). However, on 15 Junealthough plants from heated plots had continued toaccumulate significantly higher biomass in stem
Table 5. Crop growth and development in heated and control plots from sowing to harvest (sowing date: 10October 2008) monitored on BBCH scaling from sowing (GS0) to harvest (GS92) (Lancashire et al. 1991)
Development stages
Date of reaching aparticular development stage
Duration from sowing toachieve each stage (days)
(GS number) Heated plot Control plot Heated plot Control plot
Nine or more leaves (19) 04 Feb 09 20 Mar 09 117 (107) 161 (151)End of tillering (29) 22 Apr 09 05 May 09 194 (77) 207 (46)Flag leaf (39) 15 May 09 26 May 09 217 (23) 228 (21)First awn visible (49) 27 May 09 04 Jun 09 229 (12) 237 (9)End of heading (59) 04 Jun 09 13 Jun 09 237 (8) 246 (9)End of flowering (69) 16 Jun 09 24 Jun 09 249 (12) 257 (11)Late milk grain filling (77) 30 Jun 09 06 Jul 09 263 (14) 270 (13)Fully ripe (89) 24 Jul 09 04 Aug 09 287 (24) 299 (29)Hard grain harvested (92) 27 Jul 09 07 Aug 09 290 (3) 302 (3)
558 R. H. PAT IL ET AL.
(P=0.002), ear (P=0.004) and total above-groundbiomass, GLAI did not differ between the plants inheated and control plots (Figs 1 and 2). On 15 July,when the crop in heated and control plots were at the
end and beginning of grain filling stages, respectively,leaves of plants in heated plots were senescing quicklyand recorded significantly lower GLAI (Fig. 1) ;however, total above-ground biomass did not differ
Table 6. Number of plants, shoots, ears and grains per unit area recorded on four sampling dates across cropgrowth period from sowing to harvest. S.E.M., standard error of means; D.F., degrees of freedom
Plants/m2 Shoots/m2
Ears/m2
Grains/m2
14 Jan 28 Apr 15 Jun 15 Jul Harvest Harvest
Rainy daysNormal (RD0) 152 833 471 452 465 21 792Reduced (RD1) 152 849 453 475 468 21 410S.E.M. (1 D.F.) 2.6 39.8 11.5 23.0 16.1 1224.1
Rainfall amountPresent (RF0) 152 813 456 470 480 21 878Future (RF1) 152 869 468 458 449 21 324S.E.M. (1 D.F.) 1.7 44.4 3.1 21.4 12.1 104.1
Soil warmingControl (SW0) 151 850 481 478 480 22 828Heated (SW1) 153 831 443 450 445 20 375S.E.M. (3 D.F.) 1.6 13.2 4.2 26.3 6.4 754.5
Table 7. Total above-ground oven dried biomass (g DM/m2) and GLAI recorded on four sampling dates acrosscrop growth period. S.E.M., standard error of means; D.F., degrees of freedom
Treatments
Total above-ground biomass (g/m2) GLAI
28 Apr 15 Jun 15 Jul Harvest 28 Apr 15 Jun 15 Jul
Rainy daysNormal (RD0) 141 1138 1561 1578 1.9 4.0 1.1Reduced (RD1) 142 1178 1653 1657 1.9 3.9 1.4S.E.M. (1 D.F.) 5.8 9.7 80.9 63.6 0.12 0.13 0.03
Rainfall amountPresent (RF0) 137 1111 1677 1387 1.8 3.8 1.2Future (RF1) 147 1205 1535 1578 2.0 4.0 1.2S.E.M. (1 D.F.) 4.9 31.4 58.0 10.3 0.10 0.02 0.01
Soil warmingControl (SW0) 85 1027 1622 1630 1.3 3.9 1.9Heated (SW1) 199 1289 1600 1604 2.5 3.9 0.5S.E.M. (3 D.F.) 5.4 23.8 38.3 37.1 0.09 0.10 0.12
InteractionsRD0rRF0 ns ns ns ns ns ns 0.99RD0rRF1 ns ns ns ns ns ns 1.18RD1rRF0 ns ns ns ns ns ns 1.42RD1rRF1 ns ns ns ns ns ns 1.29S.E.M. (1 D.F.) – – – – – – 0.021
RD0rSW0 ns 1075 ns ns ns 4.3 nsRD0rSW1 ns 1203 ns ns ns 3.7 nsRD1rSW0 ns 981 ns ns ns 3.6 nsRD1rSW1 ns 1375 ns ns ns 4.2 nsS.E.M. (3 D.F.) – 29.7 – – – 0.15 –
ns, P>0.05.
Soil warming and winter wheat 559

between heated and control plots (Table 7). Theplants receiving future rainfall amount had signifi-cantly higher GLAI on only 15 July sampling(P=0.044) compared with those receiving presentrainfall amount (Table 7). Among the interactions,significantly lower biomass and GLAI were found forRD1rSW0 on 15 June sampling, whereas signifi-cantly higher biomass was found for RD1rSW1 andsignificantly higher GLAI for RD0rSW0 andRD1rSW1 (Table 7).Neither rainfall pattern (amount and rainy days)
nor soil warming had any significant effect on finalgrain yield, total above-ground biomass, harvest in-dex (HI) or grain N at harvest (Table 8). However,soil warming significantly increasedmean grainweightand there was a significantly higher total above-ground biomass with the RF0rRD1 treatment.
Plant nitrogen
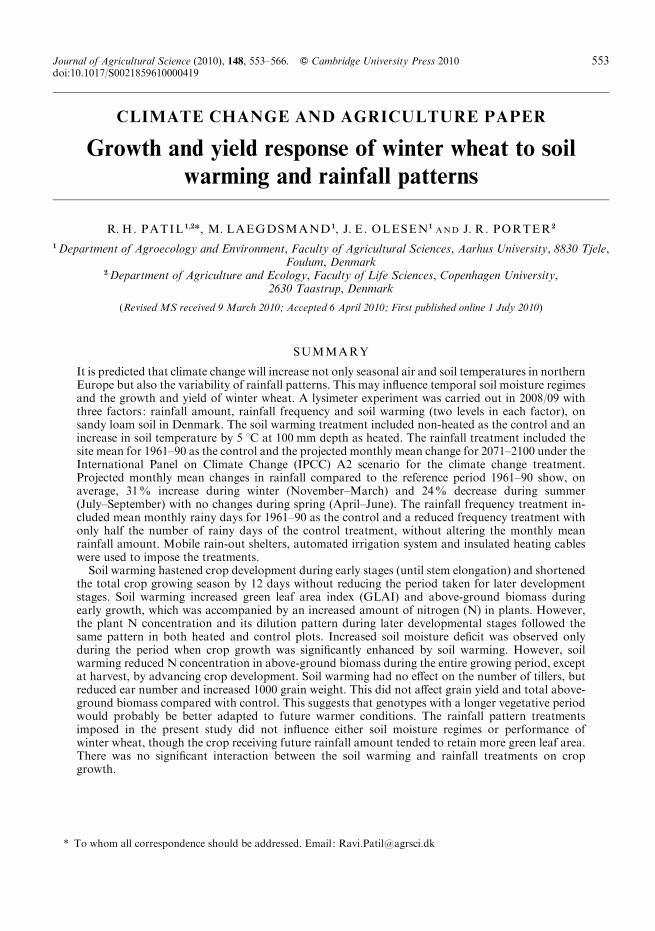
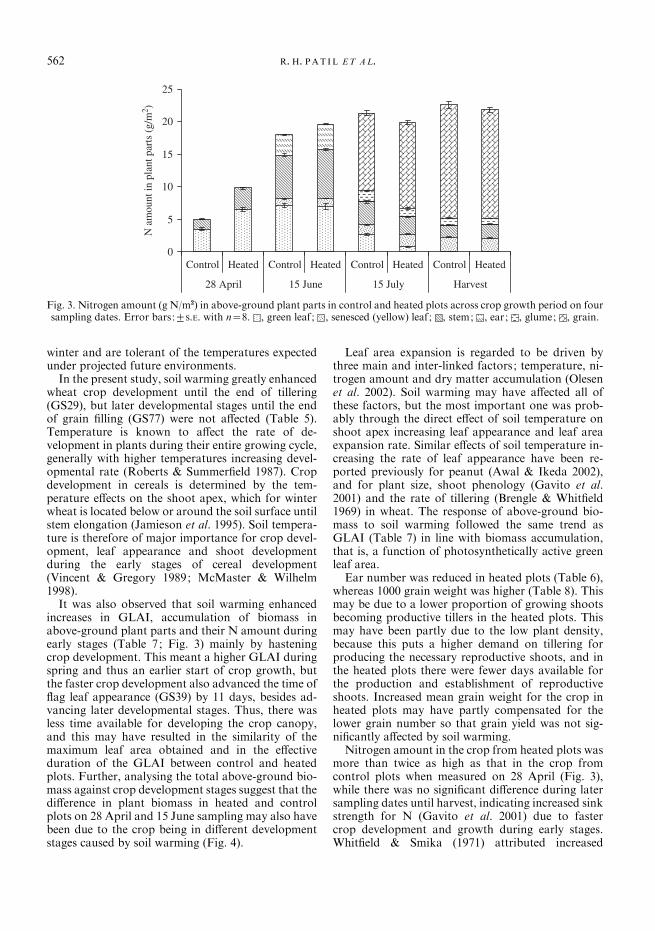
Plants in heated plots had significantly lower N con-centration in above-ground biomass throughoutthe growing season, except at harvest (Table 9). On28 April sampling, the plants in heated plots had sig-nificantly higher amount of N in stem biomass(P<0.001) and green leaves (P=0.001), while on15 July, a significant but opposite trend was recordedas the green leaves from plants grown in control plotshad significantly higher amount of N (P<0.001) thanthe one from heated plots (Fig. 3).The effect of number of rainy days on N amount
was significant only on 15 July sampling as the greenleaves from the plants receiving reduced number ofrainy days had significantly higher (P=0.018) amountof N (1.86 g N/m2) than those receiving normal
Control Heated Control Heated Control Heated
0
1
2
3
4
5
28 April
Lea
f ar
ea in
dex
15 June 15 July
Fig. 1. GLAI and YLAI in control and heated plots across crop growth period on three sampling dates. On 28 April,sampling senesced leaf area represents mildew infected leaf area. Error bars:¡S.E. with n=8. , green leaf; , senesced leaf.
0
200
400
600
800
1000
1200
1400
1600
1800
Abo
ve-g
roun
d bi
omas
s (g
d.w
./m2 )
Control Heated Control Heated Control Heated Control Heated
28 April 15 June 15 July Harvest
Fig. 2. Above-ground biomass of plant parts (g DM/m2) in control and heated plots across crop growth period on foursampling dates. Biomass in senesced leaf on 28 April represents biomass of mildew infected leaves. Error bars:¡S.E. withn=8. , green leaf; , senesced leaf; , stem; , ear; , glume; , grain.
560 R. H. PAT IL ET AL.
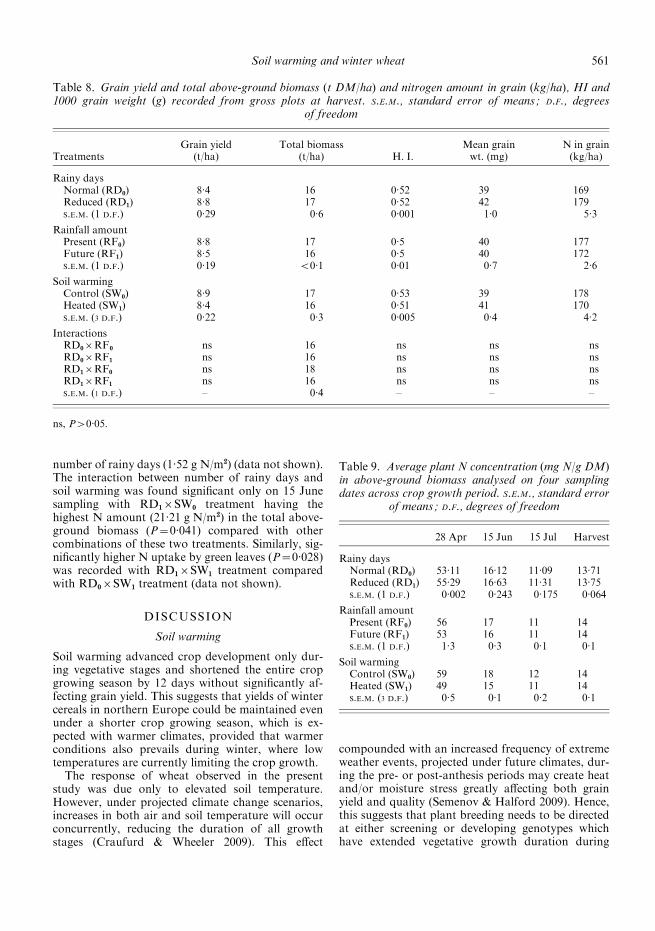
number of rainy days (1.52 g N/m2) (data not shown).The interaction between number of rainy days andsoil warming was found significant only on 15 Junesampling with RD1rSW0 treatment having thehighest N amount (21.21 g N/m2) in the total above-ground biomass (P=0.041) compared with othercombinations of these two treatments. Similarly, sig-nificantly higher N uptake by green leaves (P=0.028)was recorded with RD1rSW1 treatment comparedwith RD0rSW1 treatment (data not shown).
DISCUSSION
Soil warming
Soil warming advanced crop development only dur-ing vegetative stages and shortened the entire cropgrowing season by 12 days without significantly af-fecting grain yield. This suggests that yields of wintercereals in northern Europe could be maintained evenunder a shorter crop growing season, which is ex-pected with warmer climates, provided that warmerconditions also prevails during winter, where lowtemperatures are currently limiting the crop growth.The response of wheat observed in the present
study was due only to elevated soil temperature.However, under projected climate change scenarios,increases in both air and soil temperature will occurconcurrently, reducing the duration of all growthstages (Craufurd & Wheeler 2009). This effect
compounded with an increased frequency of extremeweather events, projected under future climates, dur-ing the pre- or post-anthesis periods may create heatand/or moisture stress greatly affecting both grainyield and quality (Semenov & Halford 2009). Hence,this suggests that plant breeding needs to be directedat either screening or developing genotypes whichhave extended vegetative growth duration during
Table 8. Grain yield and total above-ground biomass (t DM/ha) and nitrogen amount in grain (kg/ha), HI and1000 grain weight (g) recorded from gross plots at harvest. S.E.M., standard error of means; D.F., degrees
of freedom
TreatmentsGrain yield
(t/ha)Total biomass
(t/ha) H. I.Mean grainwt. (mg)
N in grain(kg/ha)
Rainy daysNormal (RD0) 8.4 16 0.52 39 169Reduced (RD1) 8.8 17 0.52 42 179S.E.M. (1 D.F.) 0.29 0.6 0.001 1.0 5.3
Rainfall amountPresent (RF0) 8.8 17 0.5 40 177Future (RF1) 8.5 16 0.5 40 172S.E.M. (1 D.F.) 0.19 <0.1 0.01 0.7 2.6
Soil warmingControl (SW0) 8.9 17 0.53 39 178Heated (SW1) 8.4 16 0.51 41 170S.E.M. (3 D.F.) 0.22 0.3 0.005 0.4 4.2
InteractionsRD0rRF0 ns 16 ns ns nsRD0rRF1 ns 16 ns ns nsRD1rRF0 ns 18 ns ns nsRD1rRF1 ns 16 ns ns nsS.E.M. (1 D.F.) – 0.4 – – –
ns, P>0.05.
Table 9. Average plant N concentration (mg N/g DM)in above-ground biomass analysed on four samplingdates across crop growth period. S.E.M., standard error
of means; D.F., degrees of freedom
28 Apr 15 Jun 15 Jul Harvest
Rainy daysNormal (RD0) 53.11 16.12 11.09 13.71Reduced (RD1) 55.29 16.63 11.31 13.75S.E.M. (1 D.F.) 0.002 0.243 0.175 0.064
Rainfall amountPresent (RF0) 56 17 11 14Future (RF1) 53 16 11 14S.E.M. (1 D.F.) 1.3 0.3 0.1 0.1
Soil warmingControl (SW0) 59 18 12 14Heated (SW1) 49 15 11 14S.E.M. (3 D.F.) 0.5 0.1 0.2 0.1
Soil warming and winter wheat 561
winter and are tolerant of the temperatures expectedunder projected future environments.In the present study, soil warming greatly enhanced
wheat crop development until the end of tillering(GS29), but later developmental stages until the endof grain filling (GS77) were not affected (Table 5).Temperature is known to affect the rate of de-velopment in plants during their entire growing cycle,generally with higher temperatures increasing devel-opmental rate (Roberts & Summerfield 1987). Cropdevelopment in cereals is determined by the tem-perature effects on the shoot apex, which for winterwheat is located below or around the soil surface untilstem elongation (Jamieson et al. 1995). Soil tempera-ture is therefore of major importance for crop devel-opment, leaf appearance and shoot developmentduring the early stages of cereal development(Vincent & Gregory 1989; McMaster & Wilhelm1998).It was also observed that soil warming enhanced
increases in GLAI, accumulation of biomass inabove-ground plant parts and their N amount duringearly stages (Table 7; Fig. 3) mainly by hasteningcrop development. This meant a higher GLAI duringspring and thus an earlier start of crop growth, butthe faster crop development also advanced the time offlag leaf appearance (GS39) by 11 days, besides ad-vancing later developmental stages. Thus, there wasless time available for developing the crop canopy,and this may have resulted in the similarity of themaximum leaf area obtained and in the effectiveduration of the GLAI between control and heatedplots. Further, analysing the total above-ground bio-mass against crop development stages suggest that thedifference in plant biomass in heated and controlplots on 28 April and 15 June sampling may also havebeen due to the crop being in different developmentstages caused by soil warming (Fig. 4).
Leaf area expansion is regarded to be driven bythree main and inter-linked factors; temperature, ni-trogen amount and dry matter accumulation (Olesenet al. 2002). Soil warming may have affected all ofthese factors, but the most important one was prob-ably through the direct effect of soil temperature onshoot apex increasing leaf appearance and leaf areaexpansion rate. Similar effects of soil temperature in-creasing the rate of leaf appearance have been re-ported previously for peanut (Awal & Ikeda 2002),and for plant size, shoot phenology (Gavito et al.2001) and the rate of tillering (Brengle & Whitfield1969) in wheat. The response of above-ground bio-mass to soil warming followed the same trend asGLAI (Table 7) in line with biomass accumulation,that is, a function of photosynthetically active greenleaf area.Ear number was reduced in heated plots (Table 6),
whereas 1000 grain weight was higher (Table 8). Thismay be due to a lower proportion of growing shootsbecoming productive tillers in the heated plots. Thismay have been partly due to the low plant density,because this puts a higher demand on tillering forproducing the necessary reproductive shoots, and inthe heated plots there were fewer days available forthe production and establishment of reproductiveshoots. Increased mean grain weight for the crop inheated plots may have partly compensated for thelower grain number so that grain yield was not sig-nificantly affected by soil warming.Nitrogen amount in the crop from heated plots was
more than twice as high as that in the crop fromcontrol plots when measured on 28 April (Fig. 3),while there was no significant difference during latersampling dates until harvest, indicating increased sinkstrength for N (Gavito et al. 2001) due to fastercrop development and growth during early stages.Whitfield & Smika (1971) attributed increased
0
5
10
15
20
25
N a
mou
nt in
pla
nt p
arts
(g/
m2 )
Control Heated Control Heated Control Heated Control Heated
28 April 15 June 15 July Harvest
Fig. 3. Nitrogen amount (g N/m2) in above-ground plant parts in control and heated plots across crop growth period on foursampling dates. Error bars:¡S.E. with n=8. , green leaf; , senesced (yellow) leaf; , stem; , ear; , glume; , grain.
562 R. H. PAT IL ET AL.
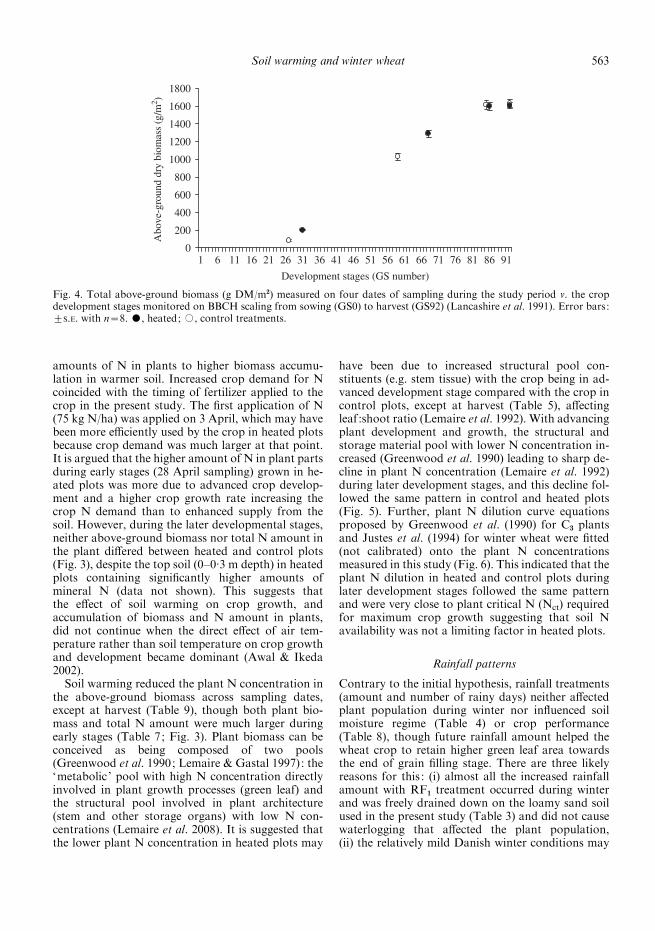
amounts of N in plants to higher biomass accumu-lation in warmer soil. Increased crop demand for Ncoincided with the timing of fertilizer applied to thecrop in the present study. The first application of N(75 kg N/ha) was applied on 3 April, which may havebeen more efficiently used by the crop in heated plotsbecause crop demand was much larger at that point.It is argued that the higher amount of N in plant partsduring early stages (28 April sampling) grown in he-ated plots was more due to advanced crop develop-ment and a higher crop growth rate increasing thecrop N demand than to enhanced supply from thesoil. However, during the later developmental stages,neither above-ground biomass nor total N amount inthe plant differed between heated and control plots(Fig. 3), despite the top soil (0–0.3 m depth) in heatedplots containing significantly higher amounts ofmineral N (data not shown). This suggests thatthe effect of soil warming on crop growth, andaccumulation of biomass and N amount in plants,did not continue when the direct effect of air tem-perature rather than soil temperature on crop growthand development became dominant (Awal & Ikeda2002).Soil warming reduced the plant N concentration in
the above-ground biomass across sampling dates,except at harvest (Table 9), though both plant bio-mass and total N amount were much larger duringearly stages (Table 7; Fig. 3). Plant biomass can beconceived as being composed of two pools(Greenwood et al. 1990; Lemaire & Gastal 1997): the‘metabolic ’ pool with high N concentration directlyinvolved in plant growth processes (green leaf) andthe structural pool involved in plant architecture(stem and other storage organs) with low N con-centrations (Lemaire et al. 2008). It is suggested thatthe lower plant N concentration in heated plots may
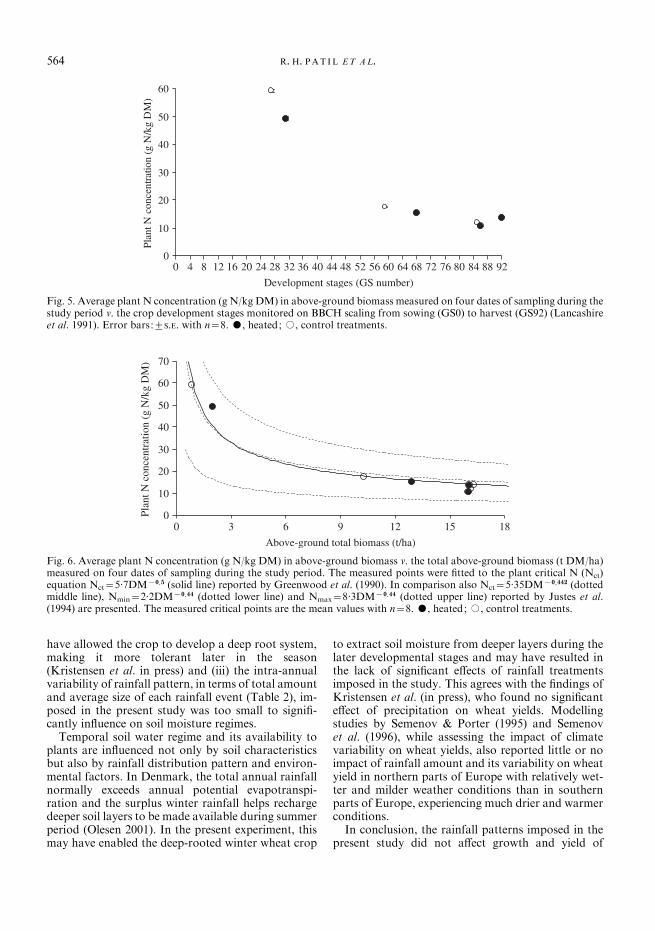
have been due to increased structural pool con-stituents (e.g. stem tissue) with the crop being in ad-vanced development stage compared with the crop incontrol plots, except at harvest (Table 5), affectingleaf:shoot ratio (Lemaire et al. 1992). With advancingplant development and growth, the structural andstorage material pool with lower N concentration in-creased (Greenwood et al. 1990) leading to sharp de-cline in plant N concentration (Lemaire et al. 1992)during later development stages, and this decline fol-lowed the same pattern in control and heated plots(Fig. 5). Further, plant N dilution curve equationsproposed by Greenwood et al. (1990) for C3 plantsand Justes et al. (1994) for winter wheat were fitted(not calibrated) onto the plant N concentrationsmeasured in this study (Fig. 6). This indicated that theplant N dilution in heated and control plots duringlater development stages followed the same patternand were very close to plant critical N (Nct) requiredfor maximum crop growth suggesting that soil Navailability was not a limiting factor in heated plots.
Rainfall patterns
Contrary to the initial hypothesis, rainfall treatments(amount and number of rainy days) neither affectedplant population during winter nor influenced soilmoisture regime (Table 4) or crop performance(Table 8), though future rainfall amount helped thewheat crop to retain higher green leaf area towardsthe end of grain filling stage. There are three likelyreasons for this : (i) almost all the increased rainfallamount with RF1 treatment occurred during winterand was freely drained down on the loamy sand soilused in the present study (Table 3) and did not causewaterlogging that affected the plant population,(ii) the relatively mild Danish winter conditions may
0
200
400
600
800
1000
1200
1400
1600
1800
1 6 11 16 21 26 31 36 41 46 51 56 61 66 71 76 81 86 91
Development stages (GS number)
Abo
ve-g
roun
d dr
y bi
omas
s (g
/m2 )
Fig. 4. Total above-ground biomass (g DM/m2) measured on four dates of sampling during the study period v. the cropdevelopment stages monitored on BBCH scaling from sowing (GS0) to harvest (GS92) (Lancashire et al. 1991). Error bars:¡S.E. with n=8. $, heated; #, control treatments.
Soil warming and winter wheat 563
have allowed the crop to develop a deep root system,making it more tolerant later in the season(Kristensen et al. in press) and (iii) the intra-annualvariability of rainfall pattern, in terms of total amountand average size of each rainfall event (Table 2), im-posed in the present study was too small to signifi-cantly influence on soil moisture regimes.Temporal soil water regime and its availability to
plants are influenced not only by soil characteristicsbut also by rainfall distribution pattern and environ-mental factors. In Denmark, the total annual rainfallnormally exceeds annual potential evapotranspi-ration and the surplus winter rainfall helps rechargedeeper soil layers to be made available during summerperiod (Olesen 2001). In the present experiment, thismay have enabled the deep-rooted winter wheat crop
to extract soil moisture from deeper layers during thelater developmental stages and may have resulted inthe lack of significant effects of rainfall treatmentsimposed in the study. This agrees with the findings ofKristensen et al. (in press), who found no significanteffect of precipitation on wheat yields. Modellingstudies by Semenov & Porter (1995) and Semenovet al. (1996), while assessing the impact of climatevariability on wheat yields, also reported little or noimpact of rainfall amount and its variability on wheatyield in northern parts of Europe with relatively wet-ter and milder weather conditions than in southernparts of Europe, experiencing much drier and warmerconditions.In conclusion, the rainfall patterns imposed in the
present study did not affect growth and yield of
0
10
20
30
40
50
60
Development stages (GS number)
Plan
t N c
once
ntra
tion
(g N
/kg
DM
)
0 4 8 12 16 20 24 28 32 36 40 44 48 52 56 60 64 68 72 76 80 84 88 92
Fig. 5. Average plant N concentration (g N/kg DM) in above-ground biomass measured on four dates of sampling during thestudy period v. the crop development stages monitored on BBCH scaling from sowing (GS0) to harvest (GS92) (Lancashireet al. 1991). Error bars:¡S.E. with n=8. $, heated; #, control treatments.
0
10
20
30
40
50
60
70
0 3 6 9 12 15 18
Above-ground total biomass (t/ha)
Plan
t N c
once
ntra
tion
(g N
/kg
DM
)
Fig. 6. Average plant N concentration (g N/kg DM) in above-ground biomass v. the total above-ground biomass (t DM/ha)measured on four dates of sampling during the study period. The measured points were fitted to the plant critical N (Nct)equation Nct=5.7DMx0.5 (solid line) reported by Greenwood et al. (1990). In comparison also Nct=5.35DMx0.442 (dottedmiddle line), Nmin=2.2DMx0.44 (dotted lower line) and Nmax=8.3DMx0.44 (dotted upper line) reported by Justes et al.(1994) are presented. The measured critical points are the mean values with n=8. $, heated; #, control treatments.
564 R. H. PAT IL ET AL.
wheat. Soil warming accelerated crop growth anddevelopment, leading to greater above-ground bio-mass during vegetative stages. However, soil warmingshortened the total crop growing cycle by 12 dayswithout affecting the crop development period duringlater stages, hence grain yield was not affected by soilwarming. This suggests that under future warmerclimates yield levels of winter wheat could be main-tained even under shorter growing period. To takeadvantage of this situation to realize higher yields,
genotypes that respond to warmer winter temperatureby extending their vegetative period without advanc-ing reproductive stages are likely to be better adaptedto future warmer conditions.
The authors wish to thank Kristian Kristensen fortechnical advice on statistical analysis, Morten Skovfor programming the automated soil warming systemand Holger Bak for technical help during the studyperiod.
REFERENCES
AWAL, M. A. & IKEDA, T. (2002). Effects of changes in soiltemperature on seedling emergence and phenological de-velopment in field-grown stands of peanut (Arachis hy-poagea). Environmental and Experimental Botany 47,101–113.
AWAL, M. A. & IKEDA, T. (2003). Effect of elevated soiltemperature on radiation-use efficiency in peanut stands.Agricultural and Forest Meteorology 118, 63–74.
BOWEN, G. D. (1991). Soil temperature, root growthand plant function. In Plant Roots: the Hidden Half (EdsY. Waisel, A. Eshel & U. Kafkaki), pp. 309–330. NewYork: Plenum Press.
BRENGLE, K. G. & WHITFIELD, C. J. (1969). Effect of soiltemperature on growth of spring wheat with and withoutwheat straw mulch. Agronomy Journal 61, 377–379.
CANNELL, R. Q., BELFORD, R. K., GALES, K., THOMSON, R. J.& WEBSTER, C. P. (1984). Effects of waterlogging anddrought on winter wheat and winter barley grown on clayand sandy loam soil. I. Crop growth & yield. Plant andSoil 80, 53–66.
CHRISTENSEN, J. H. & CHRISTENSEN, O. B. (2007). A sum-mary of the PRUDENCEmodel projections of changes inEuropean climate by the end of this century. ClimaticChange 81(Suppl. 1), 7–30.
CHRISTENSEN, J. H., HEWITSON, B., BUSULOC, A., CHEN, A.,GAO, X., HEID, I., JONES, R., KOLLI, R. K., KOWN, W. T.,LAPRISE, R., RUEDA, V. M., MEARNS, L., MENENDEZ,C. G., RAISANEN, J., RINKE, A., SARR, A. & WHETTON, P.(2007). Regional climate projections. In Climate Change2007: The Physical Science Basis. Contribution ofWorking Group I to the Fourth Assessment Report of theIntergovernmental Panel on Climate Change (EdsS. Solomon, D. Qin, M. Manning, Z. Chen, M. Marquis,K. B. Averyt, M. Tigor & H. L. Miller), pp. 847–940.Cambridge, UK and New York, NY: CambridgeUniversity Press.
CLARKSON, D. T., JONES, L. H. P. & PURVES, J. V. (1992).Absorption of nitrate and ammonium ions by Loliumperenne from flowing solution cultures at low root tem-peratures. Plant, Cell and Environment 15, 99–106.
CRAUFURD, P. Q. & WHEELER, T. R. (2009). Climate changeand the flowering time of annual crops. Journal ofExperimental Botany 60, 2529–2539.
DICKIN, E. & WRIGHT, D. (2008). The effects of winter wa-terlogging and summer drought on the growth and yieldof winter wheat (Triticum aestivum L.). European Journalof Agronomy 28, 234–244.
DICKIN, E., BENNETT, S. & WRIGHT, D. (2009). Growthand yield responses of UK wheat cultivars to winter
waterlogging. Journal of Agricultural Science, Cambridge147, 127–140.
EASTERLING, D. R., MEEHL, G. A., PARMESAN, C.,CHANGNON, S. A., KARL, T. R. & MEARNS, L. O. (2000).Climate extremes: observations, modeling, and impacts.Science 289, 2068–2074.
ENGELS, C. & MARSCHNER, H. (1992). Root to shoot trans-location of macronutrients in relation to shoot demand inmaize (Zea mays L.) grown at different root zone tem-peratures. Zeitschrift fur Pflanzenernahrung undBodenkunde 155, 121–128.
GAVITO, M. E., CURTIS, P. S., MIKKELSEN, T. N. & JAKOBSEN,I. (2001). Interactive effects of soil temperature, atmos-pheric carbon dioxide and soil N on root development,biomass and nutrient uptake of winter wheat during veg-etative growth. Journal of Experimental Botany 52,1913–1923.
GREENWOOD, D. J., LEMAIRE, G., GOSSE, G., CRUZ, P.,DRAYCOTT, A. & NEETESON, J. J. (1990). Decline in per-centage N of C3 and C4 crops with increasing plant mass.Annals of Botany 66, 425–436.
HLAVINKA, P., TRNKA, P., SEMERADOVA, D., DUBROSKY, M.,ZALUD, Z. &MOZNY,M. (2009). Effect of drought on yieldvariability of key crops in Czech Republic. Agriculturaland Forest Meteorology 149, 431–442.
JAMIESON, P. D., BROOKING, I. R., PORTER, J. R. & WILSON,D. R. (1995). Prediction of leaf appearance in wheat: aquestion of temperature. Field Crops Research 41, 35–44.
JENTSCH, A., KREYLING, J. & BEIERKUHNLEIN, C. (2007).A new generation of climate change experiments : events,not trends. Frontiers in Ecology and the Environment 5,365–374.
JUSTES, E., MARY, B., MEYNARD, J. M., MACHET, J. M. &THELIER-HUCHE, L. (1994). Determination of a criticalnitrogen dilution curve for winter wheat crops. Annals ofBotany 74, 397–407.
KLEIN TANK, A. M. G., WIJNGAARD, J. B., KONNEN, G. P.,BOHM, R., DEMAREE, G., GOCHEVA, A., MILETA, M.,PASHIARDIS, S., HEJKRLIK, L., KERN-HANSEN, C., HEINO,R., BESSEMOULIN, P., MULLER-WESTERMEIER, G.,TZANAKOU, M., SZALAI, S., PALSDOTTIR, T., FITZGERALD,D., RUBIN, S., CAPALDO, M., MAUGERI, M., LEITASS, A.,BUKANTIS, A., ABERFELD, R., VAN ENGELEN, A. F. V.,FORLAND, E., MIETUS, M., COELHO, F., MARES, C.,RAZUVAEV, V., NIEPLOVA, E., CEGNAR, T., LOPEZ, J. A.,DAHLSTROM, B., MOBERG, A., KIRCHHOFER, W., CEYLAN,A., PACHALJUK, O., ALEXANDER, L. V. & PETROVIC, P.(2002). Daily dataset of 20th-century surface air tem-perature and precipitation series for the European
Soil warming and winter wheat 565
Climate Assessment. International Journal of Climatology22, 1441–1453.
KRISTENSEN, K., SCHELDE, K. & OLESEN, J. E. (in press).Winter wheat yield response to climate variability inDenmark. Journal of Agricultural Science, Cambridge.
LANCASHIRE, P. D., BLEIHOLDER, H., LANGELUDDECKE, P.,STAUSS, R., VAN DEN BOOM, T., WEBER, E. &WITZEN-BERGER, A. (1991). An uniform decimal code forgrowth stages of crops and weeds. Annals of AppliedBiology 119, 561–601.
LEAKY, A. D. B., AINSWORTH, E. A., BERNACCHI, C. J.,ROGERS, A., LONG, S. P. & ORT, D. R. (2009). ElevatedCO2 effects on plant carbon, nitrogen and water relations:six important lessons from FACE. Journal ofExperimental Botany 60, 2859–2876.
LEMAIRE, G. & GASTAL, F. (1997). N uptake and distributionin plant canopies. In Diagnosis on the Nitrogen Statusin Crops (Ed. G. Lemaire), pp. 3–43. Heidelberg:Springer-Verlag.
LEMAIRE, G., KHAITY, M., ONILLON, B., ALLIRAND, J. M.,CHARTIER, M. & GOSSE, G. (1992). Dynamics of accumu-lation and partitioning of N in leaves, stems and roots oflucerne (Medicago sativa L.) in a dense canopy. Annals ofBotany 70, 429–435.
LEMAIRE, G., JEUFFROY, M. H. & GASTAL, F. (2008).Diagnosis tool for plant and crop N status in vegetativestage: theory and practices for crop N management.European Journal of Agronomy 28, 614–624.
MCMASTER, G. S. & WILHELM, W. W. (1998). Is soil tem-perature better than air temperature for predicting winterwheat phenology? Agronomy Journal 90, 602–607.
MOORBY, H. & NYE, P. H. (1984). The effect of tempera-ture variation over the root system on root extensionand phosphate uptake by rape. Plant and Soil 78,283–293.
OLESEN, J. E. (2001). Climate change and agriculture inDenmark. In Climate Change Research – DanishContributions (Eds A. M. K. Jorgensen, J. Fenger &K. Halsnaes), pp. 191–206. Copenhagen: Gads Forlag.
OLESEN, J. E., BERNTSEN, J., HANSEN, E. M., PETERSEN, B. M.& PETERSEN, J. (2002). Crop nitrogen demand and canopyarea expansion in winter wheat during vegetative growth.European Journal of Agronomy 16, 279–296.
PARMESAN, C. (2006). Ecological and evolutionary responsesto recent climate change. Annual Review of Ecology,Evolution and Systematics 37, 637–669.
PRASAD, P. V. V., BOOTE, K. J., THOMAS, J. M. G., ALLEN,L. H. Jr & GORBET, D. W. (2006). Influence of soil tem-perature on seedling emergence and early growth of pea-nut cultivars in field conditions. Journal of Agronomy andCrop Science 192, 168–177.
ROBERTS, E. H. & SUMMERFIELD, R. J. (1987). Measurementand prediction of flowering in annual crops. In
Manipulation of Flowering (Ed. J. G. Atherton), pp.17–50. London: Butterworths.
SEMENOV, M. A. & HALFORD, N. G. (2009). Identifying tar-get traits and molecular mechanisms for wheat breedingunder a changing climate. Journal of Experimental Botany60, 2791–2804.
SEMENOV, M. A. & PORTER, J. R. (1995). Climatic variabilityand the modelling of crop yields. Agricultural and ForestMeteorology 73, 265–283.
SEMENOV, M. A., WOLF, J., EVANS, L. G., ECKERSTEN, H. &IGLESIAS, A. (1996). Comparison of wheat simulationmodels under climate change. II. Application of climatechange scenarios. Climate Research 7, 271–281.
SOLOMON, S., QIN, D., MANNING, M., ALLEY, R. B.,BERNTSEN, T., BINDOFF, N. L., CHEN, Z., CHIDTHAISONG,A., GREGORY, J. M., HEGERL, G. C., HEIMANN, M.,HEWITSON, B., HOSKINS, B. J., JOOS, F., JOUZEL, J.,KATTSOV, V., LOHMANN, U., MATSUNO, T., MOLINA, M.,NICHOLLS, N., OVERPECK, J., RAGA, G., RAMASWAMY, V.,REN, J., RUSTICUCCI, M., SOMERVILLE, R., STOCKER, T. F.,WHETTON, P., WOOD, R. A. & WRATT, D. (2007).Technical summary. In Climate Change 2007: ThePhysical Science Basis. Contribution of Working Group Ito the Fourth Assessment Report of the IntergovernmentalPanel on Climate Change (Eds S. Solomon, D. Qin, M.Manning, Z. Chen, M. Marquis, K. B. Averyt, M. Tignor& H. L. Miller), pp. 21–91. Cambridge, UK: CambridgeUniversity Press.
STONE, P. J., SORENSEN, I. B. & JAMIESON, P. D. (1999). Effectof soil temperature on phenology, canopy development,biomass and yield of maize in a cool-temperate climate.Field Crops Research 63, 169–178.
TRENBERTH, K. E., JONES, P. D., AMBENJE, P. G., BOJARIU,R., EASTERLING, D. R., KLEIN TANK, A. M. G., PARKER,D. E., RAHIMZADEH, F., RENWICK, J. A., RUSTICUCCI,M. M., SODEN, B. J. & ZHAI, P. M. (2007). Observations:surface and atmospheric climate change. In Chapter 3 ofClimate Change 2007. The Science of Climate Change.Contribution of WG 1 to the Third Assessment Report ofthe Intergovernmental Panel on Climate Change (EdsS. Solomon, D. Qin & M. Manning), pp. 237–336.Cambridge, UK: Cambridge University Press.
VARTAPETIAN, B. B. & JACKSON, M. B. (1997). Plant adap-tations to anaerobic stress.Annals of Botany 79 (Suppl. A),3–20.
VINCENT, C. D. & GREGORY, P. J. (1989). Effects of tem-perature on the development and growth of winter wheatroots I. Controlled glasshouse studies of temperature,nitrogen and irradiance. Plant and Soil 119, 87–97.
WHITFIELD, C. J. & SMIKA, D. E. (1971). Soil temperatureand residue effects on growth components and nutrientuptake of four wheat varieties. Agronomy Journal 63,297–300.
566 R. H. PAT IL ET AL.