Deep-drainage control and yield: the trade-off between trees and crops in agroforestry systems in...
16
CSIRO PUBLISHING www.publish.csiro.au/journals/ajar Australian Journal of Agricultural Research, 2005, 56, 1011–1026 Deep-drainage control and yield: the trade-off between trees and crops in agroforestry systems in the medium to low rainfall areas of Australia Y. M. Oliver A,D , E. C. Lefroy A , R. Stirzaker B , and C. L. Davies C A CSIRO Sustainable Ecosystems, Private Bag 5 PO, Wembley, WA 6913, Australia. B CSIRO Land and Water, Land and Water, PO Box 1666, ACT 2601, Australia. C CLIMA/UWA, Mail Bag MO80, 35 Stirling Hwy, Crawley, WA 6009, Australia. D Corresponding author. Email: [email protected] Abstract. In the dryland cropping areas of southern Australia, at risk from dryland salinity, tree belts can improve water management by taking up water unused by crops, with the risk that crop yield will be reduced through competition. As there are few direct markets for tree products grown in the medium to low rainfall areas, the design of agroforestry systems becomes important in reducing the trade-off in crop yield. This study examined some factors that influence the trade-off between crop yield and deep-drainage control in order to develop design guidelines for medium to low rainfall agroforestry. Twenty-one sites in the grain-growing region of Western Australia and southern New South Wales were surveyed over 2 years for crop yields, tree leaf area index, and estimated recharge, providing data from 32 tree–crop interfaces on the relative influence of environmental factors and farming system characteristics on the trade-off between water management and crop yield. The factors most strongly correlated with higher yields were water-gaining sites, orientation that provided shelter from southerly to north-westerly (S, SW, W, NW) winds, and tree age (< 10 years). The factors most strongly correlated with the area of cropped land protected against deep drainage were tree age (> 10 years), lighter soil types, and low rainfall (<400 mm). Economic analysis of the trade-off required to produce a particular deep- drainage reduction target produced 3 groups of sites: (1) those where trees resulted in a gross margin increase of $15/ha and an estimated deep-drainage reduction of 52% (n = 3), (2) those with a gross margin loss of $49/ha and estimated deep-drainage reduction of 47% (n = 11), and (3) those with a gross margin loss of $163/ha and a deep-drainage reduction of 37% (n = 18). None of the 3 sites in the first group were in the most favourable class in both years, highlighting the vulnerability of a relatively fixed farming system to climate variability. Additional keywords: no-recharge-zone, no-yield-zone, complementarity, alley farming. Introduction The greatest opportunity for agroforestry exists where trees capture resources under-utilised by crops without compromising crop yield (Sanchez 1995; Cannell et al. 1996; Ong and Leakey 1999). If such complementarity can be reliably demonstrated under Australian conditions, it has 2 potential benefits for the sustainability of our farming systems: improved crop yield through a more favourable microclimate and more complete water use resulting in better management of dryland salinity and erosion. Stirzaker et al. (1999) proposed the theoretical conditions under which trees would be best integrated, segregated, or rotated with crops. Ideally, trees in spaced belts would reduce deep drainage and salinity risk while allowing crops to be grown profitably in the alleys between. The challenge is to identify whether there is likely to be a trade-off or benefit in crop yield, and to determine the extent of any reduction in deep drainage. The degree of trade-off between water management and production goals in a tree–crop system can be determined from the relative size of the no-yield-zone (NYZ) and the no-recharge-zone (NRZ) (Fig. 1) (Ellis et al. 1999; Lefroy et al. 2001; Stirzaker et al. 2002). The NYZ is defined as the lateral distance from the trees over which they effectively reduce yield to zero, and the NRZ is the distance from the trees over which they effectively reduce deep drainage to zero or to a level similar to native vegetation. The NRZ is the terminology used by Lefroy et al. (2001) but is used here to explain a reduction in drainage below the root-zone, which may not necessarily relate to a reduction in recharge. In water-limiting environments, successful design of agroforestry systems for salinity management (such as windbreaks and alley cropping) depends on managing the interface between the trees and crops to optimise the value of the trees, minimise competition, and reduce deep drainage © CSIRO 2005 10.1071/AR04213 0004-9409/05/101011
Transcript of Deep-drainage control and yield: the trade-off between trees and crops in agroforestry systems in...
CSIRO PUBLISHING
www.publish.csiro.au/journals/ajar Australian Journal of Agricultural Research, 2005, 56, 1011–1026
Deep-drainage control and yield: the trade-off between trees and cropsin agroforestry systems in the medium to low rainfall areas of Australia
Y. M. OliverA,D, E. C. LefroyA, R. StirzakerB, and C. L. DaviesC
ACSIRO Sustainable Ecosystems, Private Bag 5 PO, Wembley, WA 6913, Australia.BCSIRO Land and Water, Land and Water, PO Box 1666, ACT 2601, Australia.
CCLIMA/UWA, Mail Bag MO80, 35 Stirling Hwy, Crawley, WA 6009, Australia.DCorresponding author. Email: [email protected]
Abstract. In the dryland cropping areas of southern Australia, at risk from dryland salinity, tree belts can improvewater management by taking up water unused by crops, with the risk that crop yield will be reduced throughcompetition. As there are few direct markets for tree products grown in the medium to low rainfall areas, the designof agroforestry systems becomes important in reducing the trade-off in crop yield.
This study examined some factors that influence the trade-off between crop yield and deep-drainage controlin order to develop design guidelines for medium to low rainfall agroforestry. Twenty-one sites in the grain-growingregion of Western Australia and southern New South Wales were surveyed over 2 years for crop yields, tree leaf areaindex, and estimated recharge, providing data from 32 tree–crop interfaces on the relative influence of environmentalfactors and farming system characteristics on the trade-off between water management and crop yield.
The factors most strongly correlated with higher yields were water-gaining sites, orientation that provided shelterfrom southerly to north-westerly (S, SW, W, NW) winds, and tree age (<10 years). The factors most stronglycorrelated with the area of cropped land protected against deep drainage were tree age (>10 years), lighter soiltypes, and low rainfall (<400 mm). Economic analysis of the trade-off required to produce a particular deep-drainage reduction target produced 3 groups of sites: (1) those where trees resulted in a gross margin increase of$15/ha and an estimated deep-drainage reduction of 52% (n = 3), (2) those with a gross margin loss of $49/haand estimated deep-drainage reduction of 47% (n = 11), and (3) those with a gross margin loss of $163/ha anda deep-drainage reduction of 37% (n = 18). None of the 3 sites in the first group were in the most favourable classin both years, highlighting the vulnerability of a relatively fixed farming system to climate variability.
Additional keywords: no-recharge-zone, no-yield-zone, complementarity, alley farming.
IntroductionThe greatest opportunity for agroforestry exists wheretrees capture resources under-utilised by crops withoutcompromising crop yield (Sanchez 1995; Cannell et al. 1996;Ong and Leakey 1999). If such complementarity can bereliably demonstrated under Australian conditions, it has2 potential benefits for the sustainability of our farmingsystems: improved crop yield through a more favourablemicroclimate and more complete water use resulting in bettermanagement of dryland salinity and erosion.
Stirzaker et al. (1999) proposed the theoretical conditionsunder which trees would be best integrated, segregated, orrotated with crops. Ideally, trees in spaced belts would reducedeep drainage and salinity risk while allowing crops to begrown profitably in the alleys between. The challenge is toidentify whether there is likely to be a trade-off or benefit incrop yield, and to determine the extent of any reduction indeep drainage.
The degree of trade-off between water management andproduction goals in a tree–crop system can be determinedfrom the relative size of the no-yield-zone (NYZ) and theno-recharge-zone (NRZ) (Fig. 1) (Ellis et al. 1999; Lefroyet al. 2001; Stirzaker et al. 2002). The NYZ is defined as thelateral distance from the trees over which they effectivelyreduce yield to zero, and the NRZ is the distance from thetrees over which they effectively reduce deep drainage tozero or to a level similar to native vegetation. The NRZis the terminology used by Lefroy et al. (2001) but isused here to explain a reduction in drainage below theroot-zone, which may not necessarily relate to a reductionin recharge.
In water-limiting environments, successful design ofagroforestry systems for salinity management (such aswindbreaks and alley cropping) depends on managing theinterface between the trees and crops to optimise the valueof the trees, minimise competition, and reduce deep drainage
© CSIRO 2005 10.1071/AR04213 0004-9409/05/101011
1012 Australian Journal of Agricultural Research Y. M. Oliver et al.
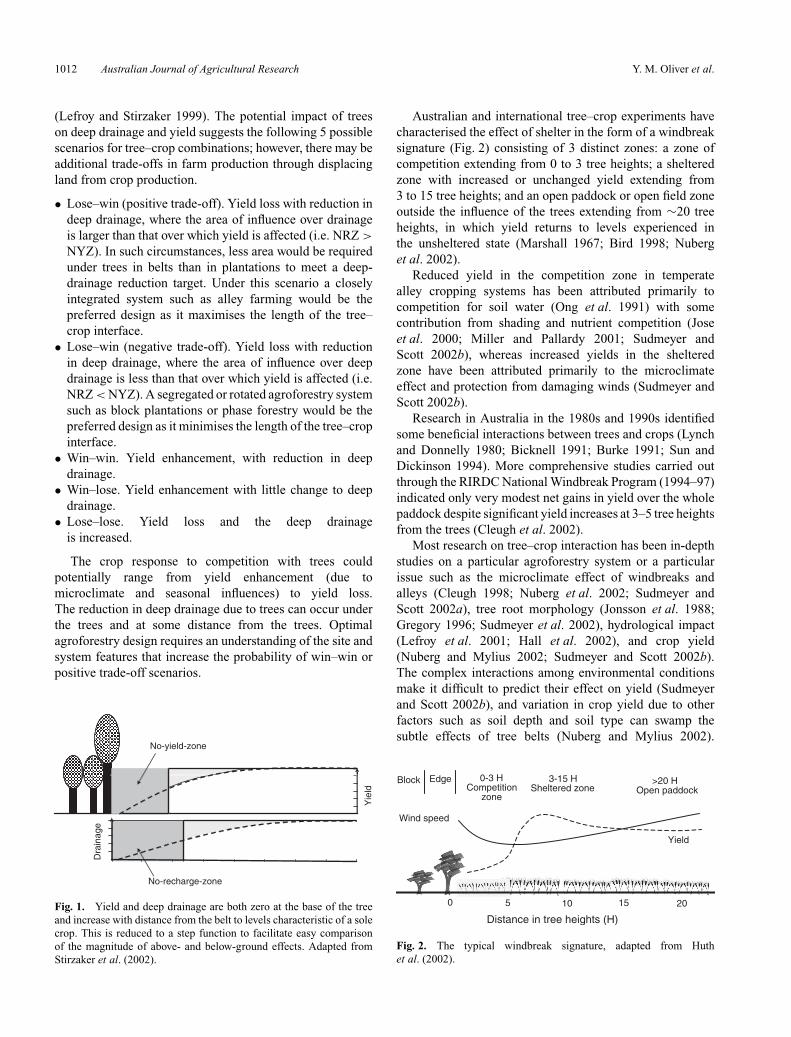
(Lefroy and Stirzaker 1999). The potential impact of treeson deep drainage and yield suggests the following 5 possiblescenarios for tree–crop combinations; however, there may beadditional trade-offs in farm production through displacingland from crop production.
• Lose–win (positive trade-off). Yield loss with reduction indeep drainage, where the area of influence over drainageis larger than that over which yield is affected (i.e. NRZ >
NYZ). In such circumstances, less area would be requiredunder trees in belts than in plantations to meet a deep-drainage reduction target. Under this scenario a closelyintegrated system such as alley farming would be thepreferred design as it maximises the length of the tree–crop interface.
• Lose–win (negative trade-off). Yield loss with reductionin deep drainage, where the area of influence over deepdrainage is less than that over which yield is affected (i.e.NRZ < NYZ). A segregated or rotated agroforestry systemsuch as block plantations or phase forestry would be thepreferred design as it minimises the length of the tree–cropinterface.
• Win–win. Yield enhancement, with reduction in deepdrainage.
• Win–lose. Yield enhancement with little change to deepdrainage.
• Lose–lose. Yield loss and the deep drainageis increased.
The crop response to competition with trees couldpotentially range from yield enhancement (due tomicroclimate and seasonal influences) to yield loss.The reduction in deep drainage due to trees can occur underthe trees and at some distance from the trees. Optimalagroforestry design requires an understanding of the site andsystem features that increase the probability of win–win orpositive trade-off scenarios.
Yie
ld
No-yield-zone
Dra
inag
e
No-recharge-zone
Fig. 1. Yield and deep drainage are both zero at the base of the treeand increase with distance from the belt to levels characteristic of a solecrop. This is reduced to a step function to facilitate easy comparisonof the magnitude of above- and below-ground effects. Adapted fromStirzaker et al. (2002).
Australian and international tree–crop experiments havecharacterised the effect of shelter in the form of a windbreaksignature (Fig. 2) consisting of 3 distinct zones: a zone ofcompetition extending from 0 to 3 tree heights; a shelteredzone with increased or unchanged yield extending from3 to 15 tree heights; and an open paddock or open field zoneoutside the influence of the trees extending from ∼20 treeheights, in which yield returns to levels experienced inthe unsheltered state (Marshall 1967; Bird 1998; Nuberget al. 2002).
Reduced yield in the competition zone in temperatealley cropping systems has been attributed primarily tocompetition for soil water (Ong et al. 1991) with somecontribution from shading and nutrient competition (Joseet al. 2000; Miller and Pallardy 2001; Sudmeyer andScott 2002b), whereas increased yields in the shelteredzone have been attributed primarily to the microclimateeffect and protection from damaging winds (Sudmeyer andScott 2002b).
Research in Australia in the 1980s and 1990s identifiedsome beneficial interactions between trees and crops (Lynchand Donnelly 1980; Bicknell 1991; Burke 1991; Sun andDickinson 1994). More comprehensive studies carried outthrough the RIRDC National Windbreak Program (1994–97)indicated only very modest net gains in yield over the wholepaddock despite significant yield increases at 3–5 tree heightsfrom the trees (Cleugh et al. 2002).
Most research on tree–crop interaction has been in-depthstudies on a particular agroforestry system or a particularissue such as the microclimate effect of windbreaks andalleys (Cleugh 1998; Nuberg et al. 2002; Sudmeyer andScott 2002a), tree root morphology (Jonsson et al. 1988;Gregory 1996; Sudmeyer et al. 2002), hydrological impact(Lefroy et al. 2001; Hall et al. 2002), and crop yield(Nuberg and Mylius 2002; Sudmeyer and Scott 2002b).The complex interactions among environmental conditionsmake it difficult to predict their effect on yield (Sudmeyerand Scott 2002b), and variation in crop yield due to otherfactors such as soil depth and soil type can swamp thesubtle effects of tree belts (Nuberg and Mylius 2002).
0-3 HCompetition
zone
3-15 HSheltered zone
>20 HOpen paddock
Distance in tree heights (H)
0 5 10 15 20
Block Edge
Wind speed
Yield
Fig. 2. The typical windbreak signature, adapted from Huthet al. (2002).
Deep drainage control and yield Australian Journal of Agricultural Research 1013
Because of this difficulty, very few studies have looked atthe combined effects of trees on yield and deep drainage toproduce specifications for agroforestry aimed at water andsalinity management.
Australian and international research therefore suggestsa need to understand how agroforestry design could achievenatural resource management outcomes at minimal cost toshort-term productivity. To do this requires an understandingof the above-ground and below-ground effects of adding treesto a cropping system, and the trade-off that occurs betweenthe yield and deep-drainage control.
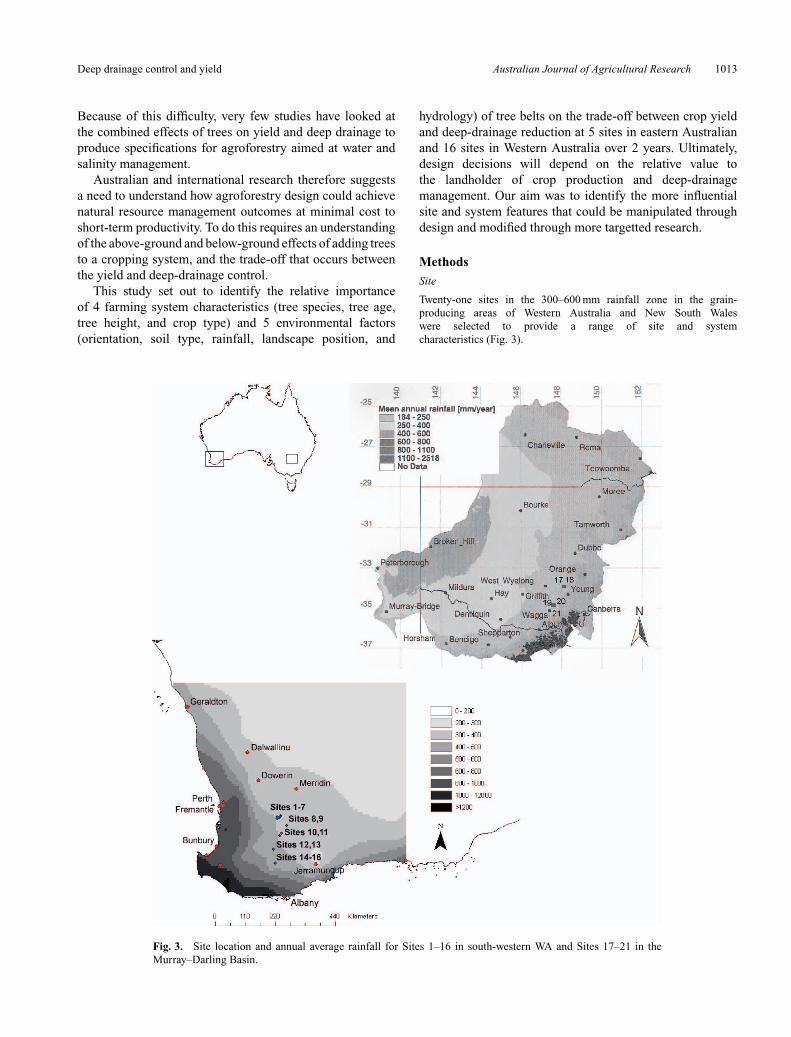
This study set out to identify the relative importanceof 4 farming system characteristics (tree species, tree age,tree height, and crop type) and 5 environmental factors(orientation, soil type, rainfall, landscape position, and
Fig. 3. Site location and annual average rainfall for Sites 1–16 in south-western WA and Sites 17–21 in theMurray–Darling Basin.
hydrology) of tree belts on the trade-off between crop yieldand deep-drainage reduction at 5 sites in eastern Australianand 16 sites in Western Australia over 2 years. Ultimately,design decisions will depend on the relative value tothe landholder of crop production and deep-drainagemanagement. Our aim was to identify the more influentialsite and system features that could be manipulated throughdesign and modified through more targetted research.
MethodsSite
Twenty-one sites in the 300–600 mm rainfall zone in the grain-producing areas of Western Australia and New South Waleswere selected to provide a range of site and systemcharacteristics (Fig. 3).
1014 Australian Journal of Agricultural Research Y. M. Oliver et al.
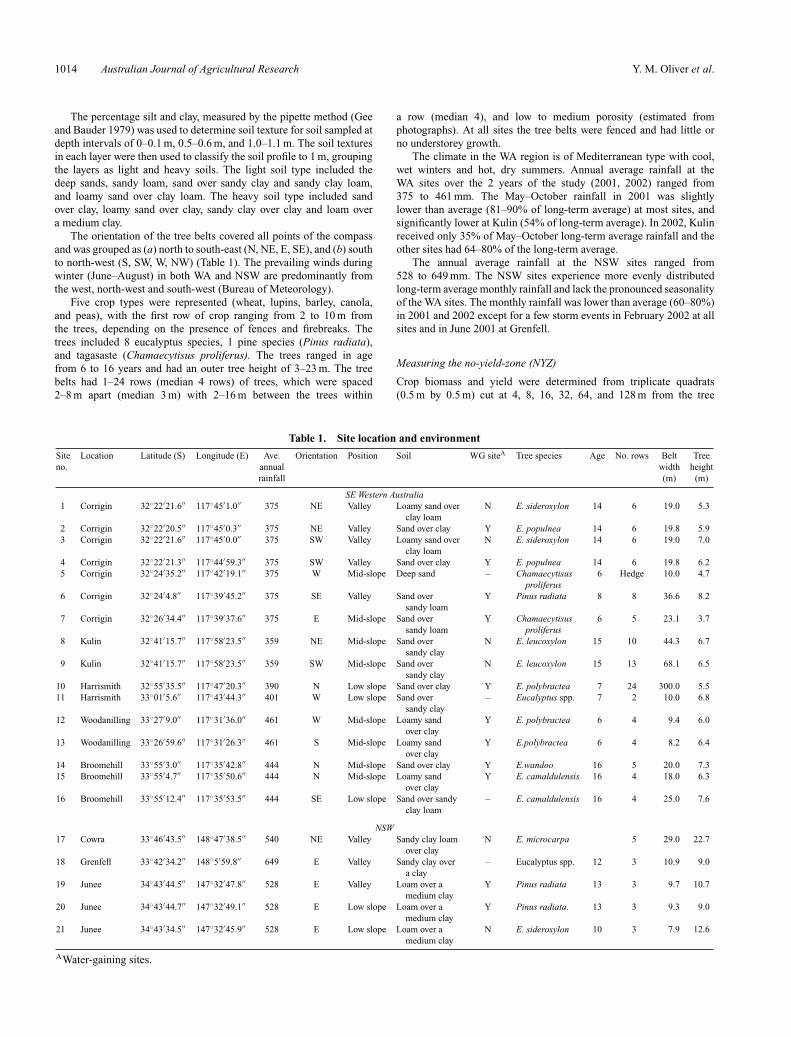
The percentage silt and clay, measured by the pipette method (Geeand Bauder 1979) was used to determine soil texture for soil sampled atdepth intervals of 0–0.1 m, 0.5–0.6 m, and 1.0–1.1 m. The soil texturesin each layer were then used to classify the soil profile to 1 m, groupingthe layers as light and heavy soils. The light soil type included thedeep sands, sandy loam, sand over sandy clay and sandy clay loam,and loamy sand over clay loam. The heavy soil type included sandover clay, loamy sand over clay, sandy clay over clay and loam overa medium clay.
The orientation of the tree belts covered all points of the compassand was grouped as (a) north to south-east (N, NE, E, SE), and (b) southto north-west (S, SW, W, NW) (Table 1). The prevailing winds duringwinter (June–August) in both WA and NSW are predominantly fromthe west, north-west and south-west (Bureau of Meteorology).
Five crop types were represented (wheat, lupins, barley, canola,and peas), with the first row of crop ranging from 2 to 10 m fromthe trees, depending on the presence of fences and firebreaks. Thetrees included 8 eucalyptus species, 1 pine species (Pinus radiata),and tagasaste (Chamaecytisus proliferus). The trees ranged in agefrom 6 to 16 years and had an outer tree height of 3–23 m. The treebelts had 1–24 rows (median 4 rows) of trees, which were spaced2–8 m apart (median 3 m) with 2–16 m between the trees within
Table 1. Site location and environment
Site Location Latitude (S) Longitude (E) Ave. Orientation Position Soil WG siteA Tree species Age No. rows Belt Treeno. annual width height
rainfall (m) (m)
SE Western Australia1 Corrigin 32◦22′21.6′′ 117◦45′1.0′′ 375 NE Valley Loamy sand over N E. sideroxylon 14 6 19.0 5.3
clay loam2 Corrigin 32◦22′20.5′′ 117◦45′0.3′′ 375 NE Valley Sand over clay Y E. populnea 14 6 19.8 5.93 Corrigin 32◦22′21.6′′ 117◦45′0.0′′ 375 SW Valley Loamy sand over N E. sideroxylon 14 6 19.0 7.0
clay loam4 Corrigin 32◦22′21.3′′ 117◦44′59.3′′ 375 SW Valley Sand over clay Y E. populnea 14 6 19.8 6.25 Corrigin 32◦24′35.2′′ 117◦42′19.1′′ 375 W Mid-slope Deep sand – Chamaecytisus 6 Hedge 10.0 4.7
proliferus6 Corrigin 32◦24′4.8′′ 117◦39′45.2′′ 375 SE Valley Sand over Y Pinus radiata 8 8 36.6 8.2
sandy loam7 Corrigin 32◦26′34.4′′ 117◦39′37.6′′ 375 E Mid-slope Sand over Y Chamaecytisus 6 5 23.1 3.7
sandy loam proliferus8 Kulin 32◦41′15.7′′ 117◦58′23.5′′ 359 NE Mid-slope Sand over N E. leucoxylon 15 10 44.3 6.7
sandy clay9 Kulin 32◦41′15.7′′ 117◦58′23.5′′ 359 SW Mid-slope Sand over N E. leucoxylon 15 13 68.1 6.5
sandy clay10 Harrismith 32◦55′35.5′′ 117◦47′20.3′′ 390 N Low slope Sand over clay Y E. polybractea 7 24 300.0 5.511 Harrismith 33◦01′5.6′′ 117◦43′44.3′′ 401 W Low slope Sand over – Eucalyptus spp. 7 2 10.0 6.8
sandy clay12 Woodanilling 33◦27′9.0′′ 117◦31′36.0′′ 461 W Mid-slope Loamy sand Y E. polybractea 6 4 9.4 6.0
over clay13 Woodanilling 33◦26′59.6′′ 117◦31′26.3′′ 461 S Mid-slope Loamy sand Y E.polybractea 6 4 8.2 6.4
over clay14 Broomehill 33◦55′3.0′′ 117◦35′42.8′′ 444 N Mid-slope Sand over clay Y E.wandoo 16 5 20.0 7.315 Broomehill 33◦55′4.7′′ 117◦35′50.6′′ 444 N Mid-slope Loamy sand Y E. camaldulensis 16 4 18.0 6.3
over clay16 Broomehill 33◦55′12.4′′ 117◦35′53.5′′ 444 SE Low slope Sand over sandy – E. camaldulensis 16 4 25.0 7.6
clay loam
NSW17 Cowra 33◦46′43.5′′ 148◦47′38.5′′ 540 NE Valley Sandy clay loam N E. microcarpa 5 29.0 22.7
over clay18 Grenfell 33◦42′34.2′′ 148◦5′59.8′′ 649 E Valley Sandy clay over – Eucalyptus spp. 12 3 10.9 9.0
a clay19 Junee 34◦43′44.5′′ 147◦32′47.8′′ 528 E Valley Loam over a Y Pinus radiata 13 3 9.7 10.7
medium clay20 Junee 34◦43′44.7′′ 147◦32′49.1′′ 528 E Low slope Loam over a Y Pinus radiata. 13 3 9.3 9.0
medium clay21 Junee 34◦43′34.5′′ 147◦32′45.9′′ 528 E Low slope Loam over a N E. sideroxylon 10 3 7.9 12.6
medium clay
AWater-gaining sites.
a row (median 4), and low to medium porosity (estimated fromphotographs). At all sites the tree belts were fenced and had little orno understorey growth.
The climate in the WA region is of Mediterranean type with cool,wet winters and hot, dry summers. Annual average rainfall at theWA sites over the 2 years of the study (2001, 2002) ranged from375 to 461 mm. The May–October rainfall in 2001 was slightlylower than average (81–90% of long-term average) at most sites, andsignificantly lower at Kulin (54% of long-term average). In 2002, Kulinreceived only 35% of May–October long-term average rainfall and theother sites had 64–80% of the long-term average.
The annual average rainfall at the NSW sites ranged from528 to 649 mm. The NSW sites experience more evenly distributedlong-term average monthly rainfall and lack the pronounced seasonalityof the WA sites. The monthly rainfall was lower than average (60–80%)in 2001 and 2002 except for a few storm events in February 2002 at allsites and in June 2001 at Grenfell.
Measuring the no-yield-zone (NYZ)
Crop biomass and yield were determined from triplicate quadrats(0.5 m by 0.5 m) cut at 4, 8, 16, 32, 64, and 128 m from the tree
Deep drainage control and yield Australian Journal of Agricultural Research 1015
base, perpendicular to the tree line. In 2001, crop biomass and yieldwere monitored at 16 sites in WA and at 5 in NSW. Due to croprotations and drought, only 9 sites in WA and 2 in NSW were croppedin 2002.
The open paddock yield was determined from the average of thetriplicate measurements of the yield at 64 m and 128 m, because formost sites (30 out of 32) there was no significant difference betweenthe average yield at 64 m and 128 m. The yield at each distance wasconverted to relative yield by dividing by the open paddock yield.Relative yields were used to enable comparison among different states,tree species, and orientation by removing the variation in crop yieldsdue to crop species, rainfall zone, soil, and agronomic practices.Distance was also converted to tree heights for each site by dividingthe distance by the height of the outer tree row.
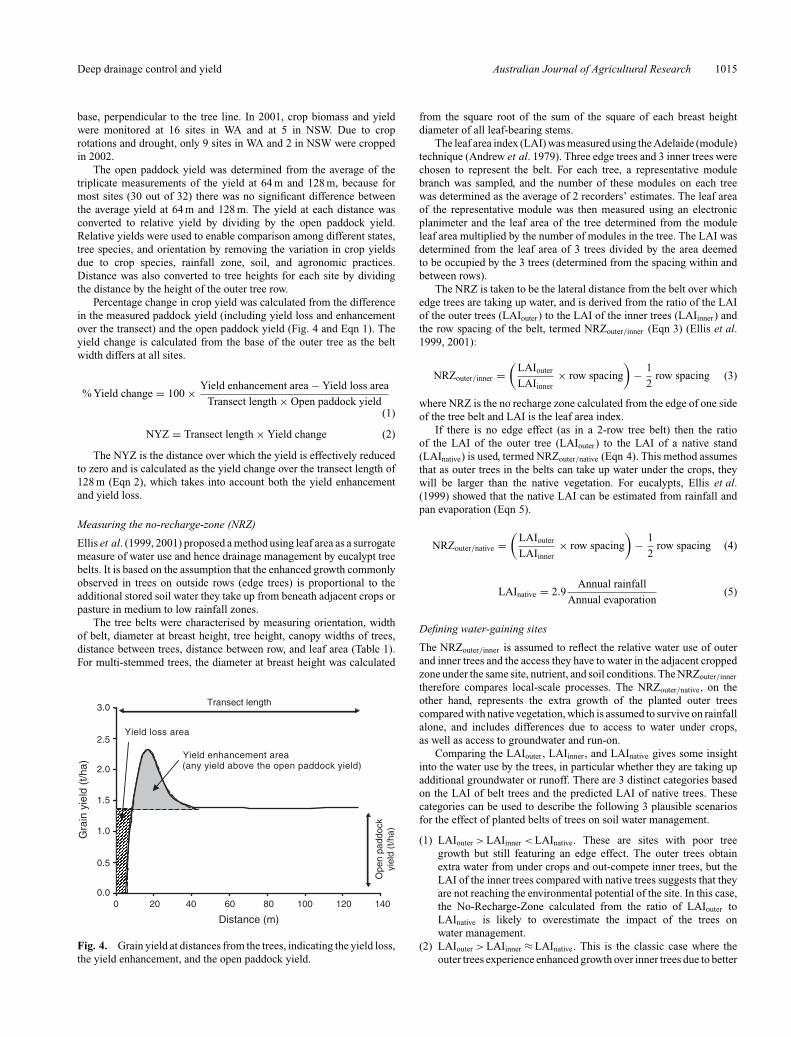
Percentage change in crop yield was calculated from the differencein the measured paddock yield (including yield loss and enhancementover the transect) and the open paddock yield (Fig. 4 and Eqn 1). Theyield change is calculated from the base of the outer tree as the beltwidth differs at all sites.
% Yield change = 100 × Yield enhancement area − Yield loss area
Transect length × Open paddock yield(1)
NYZ = Transect length × Yield change (2)
The NYZ is the distance over which the yield is effectively reducedto zero and is calculated as the yield change over the transect length of128 m (Eqn 2), which takes into account both the yield enhancementand yield loss.
Measuring the no-recharge-zone (NRZ)
Ellis et al. (1999, 2001) proposed a method using leaf area as a surrogatemeasure of water use and hence drainage management by eucalypt treebelts. It is based on the assumption that the enhanced growth commonlyobserved in trees on outside rows (edge trees) is proportional to theadditional stored soil water they take up from beneath adjacent crops orpasture in medium to low rainfall zones.
The tree belts were characterised by measuring orientation, widthof belt, diameter at breast height, tree height, canopy widths of trees,distance between trees, distance between row, and leaf area (Table 1).For multi-stemmed trees, the diameter at breast height was calculated
0.0
0.5
1.0
1.5
2.0
2.5
3.0
0 20 40 60 80 100 120 140
Transect length
Distance (m)
Yield loss area
Yield enhancement area(any yield above the open paddock yield)
Ope
n pa
ddoc
kyi
eld
(t/h
a)Gra
in y
ield
(t/h
a)
Fig. 4. Grain yield at distances from the trees, indicating the yield loss,the yield enhancement, and the open paddock yield.
from the square root of the sum of the square of each breast heightdiameter of all leaf-bearing stems.
The leaf area index (LAI) was measured using the Adelaide (module)technique (Andrew et al. 1979). Three edge trees and 3 inner trees werechosen to represent the belt. For each tree, a representative modulebranch was sampled, and the number of these modules on each treewas determined as the average of 2 recorders’ estimates. The leaf areaof the representative module was then measured using an electronicplanimeter and the leaf area of the tree determined from the moduleleaf area multiplied by the number of modules in the tree. The LAI wasdetermined from the leaf area of 3 trees divided by the area deemedto be occupied by the 3 trees (determined from the spacing within andbetween rows).
The NRZ is taken to be the lateral distance from the belt over whichedge trees are taking up water, and is derived from the ratio of the LAIof the outer trees (LAIouter) to the LAI of the inner trees (LAIinner) andthe row spacing of the belt, termed NRZouter/inner (Eqn 3) (Ellis et al.1999, 2001):
NRZouter/inner =(
LAIouter
LAIinner× row spacing
)− 1
2row spacing (3)
where NRZ is the no recharge zone calculated from the edge of one sideof the tree belt and LAI is the leaf area index.
If there is no edge effect (as in a 2-row tree belt) then the ratioof the LAI of the outer tree (LAIouter) to the LAI of a native stand(LAInative) is used, termed NRZouter/native (Eqn 4). This method assumesthat as outer trees in the belts can take up water under the crops, theywill be larger than the native vegetation. For eucalypts, Ellis et al.(1999) showed that the native LAI can be estimated from rainfall andpan evaporation (Eqn 5).
NRZouter/native =(
LAIouter
LAIinner× row spacing
)− 1
2row spacing (4)
LAInative = 2.9Annual rainfall
Annual evaporation(5)
Defining water-gaining sites
The NRZouter/inner is assumed to reflect the relative water use of outerand inner trees and the access they have to water in the adjacent croppedzone under the same site, nutrient, and soil conditions. The NRZouter/inner
therefore compares local-scale processes. The NRZouter/native, on theother hand, represents the extra growth of the planted outer treescompared with native vegetation, which is assumed to survive on rainfallalone, and includes differences due to access to water under crops,as well as access to groundwater and run-on.
Comparing the LAIouter , LAIinner , and LAInative gives some insightinto the water use by the trees, in particular whether they are taking upadditional groundwater or runoff. There are 3 distinct categories basedon the LAI of belt trees and the predicted LAI of native trees. Thesecategories can be used to describe the following 3 plausible scenariosfor the effect of planted belts of trees on soil water management.
(1) LAIouter > LAIinner < LAInative. These are sites with poor treegrowth but still featuring an edge effect. The outer trees obtainextra water from under crops and out-compete inner trees, but theLAI of the inner trees compared with native trees suggests that theyare not reaching the environmental potential of the site. In this case,the No-Recharge-Zone calculated from the ratio of LAIouter toLAInative is likely to overestimate the impact of the trees onwater management.
(2) LAIouter > LAIinner ≈ LAInative. This is the classic case where theouter trees experience enhanced growth over inner trees due to better
1016 Australian Journal of Agricultural Research Y. M. Oliver et al.
access to resources, and the growth of inner trees approximatesthat of native vegetation. The NRZ calculated from either the ratioof LAIouter to LAIinner or the ratio of LAIouter to LAInative shouldequally describe the influence of the trees on soil water underthe crops.
(3) LAIouter > LAIinner > LAInative. This indicates enhanced treegrowth, with an edge effect. Both inner and outer trees take upadditional water (groundwater, near-surface aquifers, or run-on),with the outer trees also taking up water under the crops. TheNRZouter/inner may be high but does not include the groundwatertranspired. The NRZouter/native includes both groundwater and thewater under the crops. The inner trees may also have been shadedby the outer trees, which would cause the NRZouter/inner to behigh. For this analysis we have assumed that the trees, which are6 years old and greater, have used any water that accumulated atdepth since the original vegetation was removed. However, it ispossible that both inner and outer trees are taking up stored soilwater, but this is more likely to occur at sites with young and newlyplanted trees.
Sites in Category 3 are referred to from here on as water-gainingsites, as the trees obtain more water than is available from rainfall inaddition to stored soil water under adjacent crops.
Statistical analysis
To understand the relative influences of environmental and farmingsystem characteristics the data were separated to compare 2 features ata time. The groups were: (a) all sites, (b) WA v. NSW sites, (c) Eucalypt v.non-Eucalypt, (d) cereal v. non-cereal crops, (e) orientation thatprotected crops from north to south-east winds (N, NE, E, SE) v. southto north-west winds (S, SW, W, NW), ( f ) high landscape position (mid-slope to high) v. low landscape position (lower slope to valley), (g) heavysoils (sand over clay and loam over clay) v. light soils (deep sands andsand over sandy loam/sandy clay/sandy clay loam), (h) water gainingsites, (i) tree height (<8 m v. >8 m), ( j ) age of tree (<10 years v.>10 years) and (k) rainfall (>400 mm v. <400 mm).
The relative yield at 4 m, 8 m, 16 m, and 32 m was averaged forall replicates and all sites for each grouping. The average relativeyield at each distance was compared between the groupings usingANOVA statistics. For example, the average relative yield at 4 m forall the NSW sites was statistically compared with the average relativeyield at 4 m for the WA sites. The NYZ was calculated using theaverage yield at each distance for each grouping and also comparedstatistically. The average NRZ for each site was similarly grouped andthen compared.
Gross margin analysis
The assumptions used in calculating gross margins and deep drainagereduction were as follows. Tree belts were assumed to be part ofa uniform alley system, with belts 15 m wide and spaced 100 m apart,leaving 85 m of arable land between belts. The gross margin calculationsused on-farm prices of $180/t for barley, $190/t for wheat, $195/tfor lupins, $210/t for peas, and $385/t for canola, with variable costsof $180/ha. Deep drainage reduction and net yield were based onEqns 6 and 7. The NYZ and NRZ were doubled to incorporate the effectof trees on both sides of a belt.
% Recharge reduction = (2 × NRZ + Belt width)
Tree spacing(6)
Adjusted yield
= [Tree spacing − (2 × NYZ + Belt width)] × Open paddock yield
Tree spacing(7)
Gross margin of alley system ($) = Adjusted yield × $Crop value− (0.85 × $Cost) (8)
The costs were multiplied by 0.85 because only 85 m out of 100 mwould have incurred cropping cost.
Results and discussion
The effect of trees on the crop yield
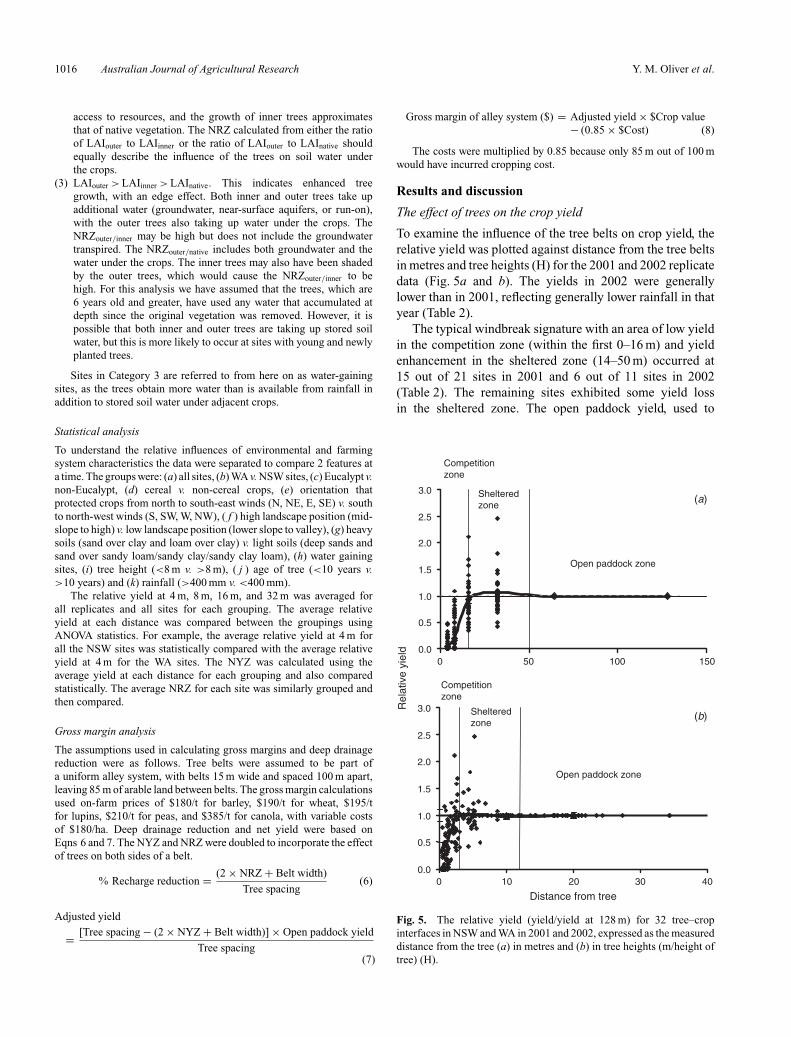
To examine the influence of the tree belts on crop yield, therelative yield was plotted against distance from the tree beltsin metres and tree heights (H) for the 2001 and 2002 replicatedata (Fig. 5a and b). The yields in 2002 were generallylower than in 2001, reflecting generally lower rainfall in thatyear (Table 2).
The typical windbreak signature with an area of low yieldin the competition zone (within the first 0–16 m) and yieldenhancement in the sheltered zone (14–50 m) occurred at15 out of 21 sites in 2001 and 6 out of 11 sites in 2002(Table 2). The remaining sites exhibited some yield lossin the sheltered zone. The open paddock yield, used to
0.0
0.5
1.0
1.5
2.0
2.5
3.0
0 50 100 150
Competitionzone
0.0
0.5
1.0
1.5
2.0
2.5
3.0
0 10 20 30 40
Distance from tree
Rel
ativ
e yi
eld
Open paddock zone
Shelteredzone
Competitionzone
Shelteredzone
Open paddock zone
(a)
(b)
Fig. 5. The relative yield (yield/yield at 128 m) for 32 tree–cropinterfaces in NSW and WA in 2001 and 2002, expressed as the measureddistance from the tree (a) in metres and (b) in tree heights (m/height oftree) (H).
Deep drainage control and yield Australian Journal of Agricultural Research 1017
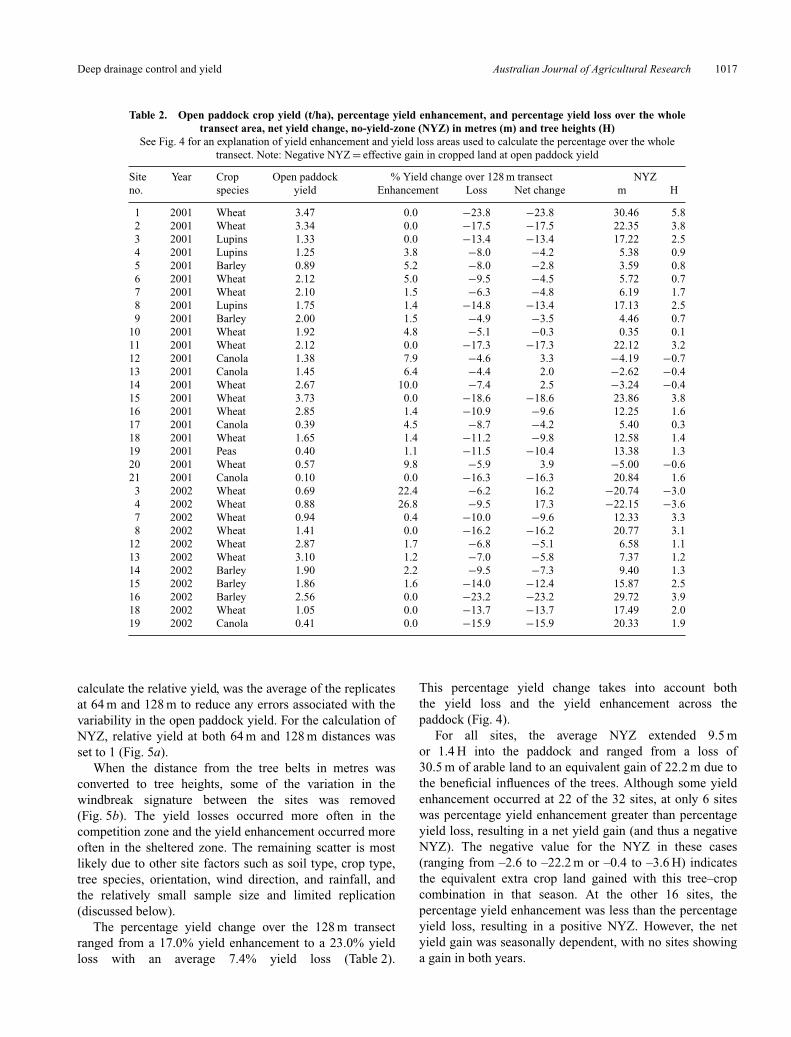
Table 2. Open paddock crop yield (t/ha), percentage yield enhancement, and percentage yield loss over the wholetransect area, net yield change, no-yield-zone (NYZ) in metres (m) and tree heights (H)
See Fig. 4 for an explanation of yield enhancement and yield loss areas used to calculate the percentage over the wholetransect. Note: Negative NYZ = effective gain in cropped land at open paddock yield
Site Year Crop Open paddock % Yield change over 128 m transect NYZno. species yield Enhancement Loss Net change m H
1 2001 Wheat 3.47 0.0 −23.8 −23.8 30.46 5.82 2001 Wheat 3.34 0.0 −17.5 −17.5 22.35 3.83 2001 Lupins 1.33 0.0 −13.4 −13.4 17.22 2.54 2001 Lupins 1.25 3.8 −8.0 −4.2 5.38 0.95 2001 Barley 0.89 5.2 −8.0 −2.8 3.59 0.86 2001 Wheat 2.12 5.0 −9.5 −4.5 5.72 0.77 2001 Wheat 2.10 1.5 −6.3 −4.8 6.19 1.78 2001 Lupins 1.75 1.4 −14.8 −13.4 17.13 2.59 2001 Barley 2.00 1.5 −4.9 −3.5 4.46 0.7
10 2001 Wheat 1.92 4.8 −5.1 −0.3 0.35 0.111 2001 Wheat 2.12 0.0 −17.3 −17.3 22.12 3.212 2001 Canola 1.38 7.9 −4.6 3.3 −4.19 −0.713 2001 Canola 1.45 6.4 −4.4 2.0 −2.62 −0.414 2001 Wheat 2.67 10.0 −7.4 2.5 −3.24 −0.415 2001 Wheat 3.73 0.0 −18.6 −18.6 23.86 3.816 2001 Wheat 2.85 1.4 −10.9 −9.6 12.25 1.617 2001 Canola 0.39 4.5 −8.7 −4.2 5.40 0.318 2001 Wheat 1.65 1.4 −11.2 −9.8 12.58 1.419 2001 Peas 0.40 1.1 −11.5 −10.4 13.38 1.320 2001 Wheat 0.57 9.8 −5.9 3.9 −5.00 −0.621 2001 Canola 0.10 0.0 −16.3 −16.3 20.84 1.6
3 2002 Wheat 0.69 22.4 −6.2 16.2 −20.74 −3.04 2002 Wheat 0.88 26.8 −9.5 17.3 −22.15 −3.67 2002 Wheat 0.94 0.4 −10.0 −9.6 12.33 3.38 2002 Wheat 1.41 0.0 −16.2 −16.2 20.77 3.1
12 2002 Wheat 2.87 1.7 −6.8 −5.1 6.58 1.113 2002 Wheat 3.10 1.2 −7.0 −5.8 7.37 1.214 2002 Barley 1.90 2.2 −9.5 −7.3 9.40 1.315 2002 Barley 1.86 1.6 −14.0 −12.4 15.87 2.516 2002 Barley 2.56 0.0 −23.2 −23.2 29.72 3.918 2002 Wheat 1.05 0.0 −13.7 −13.7 17.49 2.019 2002 Canola 0.41 0.0 −15.9 −15.9 20.33 1.9
calculate the relative yield, was the average of the replicatesat 64 m and 128 m to reduce any errors associated with thevariability in the open paddock yield. For the calculation ofNYZ, relative yield at both 64 m and 128 m distances wasset to 1 (Fig. 5a).
When the distance from the tree belts in metres wasconverted to tree heights, some of the variation in thewindbreak signature between the sites was removed(Fig. 5b). The yield losses occurred more often in thecompetition zone and the yield enhancement occurred moreoften in the sheltered zone. The remaining scatter is mostlikely due to other site factors such as soil type, crop type,tree species, orientation, wind direction, and rainfall, andthe relatively small sample size and limited replication(discussed below).
The percentage yield change over the 128 m transectranged from a 17.0% yield enhancement to a 23.0% yieldloss with an average 7.4% yield loss (Table 2).
This percentage yield change takes into account boththe yield loss and the yield enhancement across thepaddock (Fig. 4).
For all sites, the average NYZ extended 9.5 mor 1.4 H into the paddock and ranged from a loss of30.5 m of arable land to an equivalent gain of 22.2 m due tothe beneficial influences of the trees. Although some yieldenhancement occurred at 22 of the 32 sites, at only 6 siteswas percentage yield enhancement greater than percentageyield loss, resulting in a net yield gain (and thus a negativeNYZ). The negative value for the NYZ in these cases(ranging from –2.6 to –22.2 m or –0.4 to –3.6 H) indicatesthe equivalent extra crop land gained with this tree–cropcombination in that season. At the other 16 sites, thepercentage yield enhancement was less than the percentageyield loss, resulting in a positive NYZ. However, the netyield gain was seasonally dependent, with no sites showinga gain in both years.
1018 Australian Journal of Agricultural Research Y. M. Oliver et al.
The influence of the trees on the NRZ
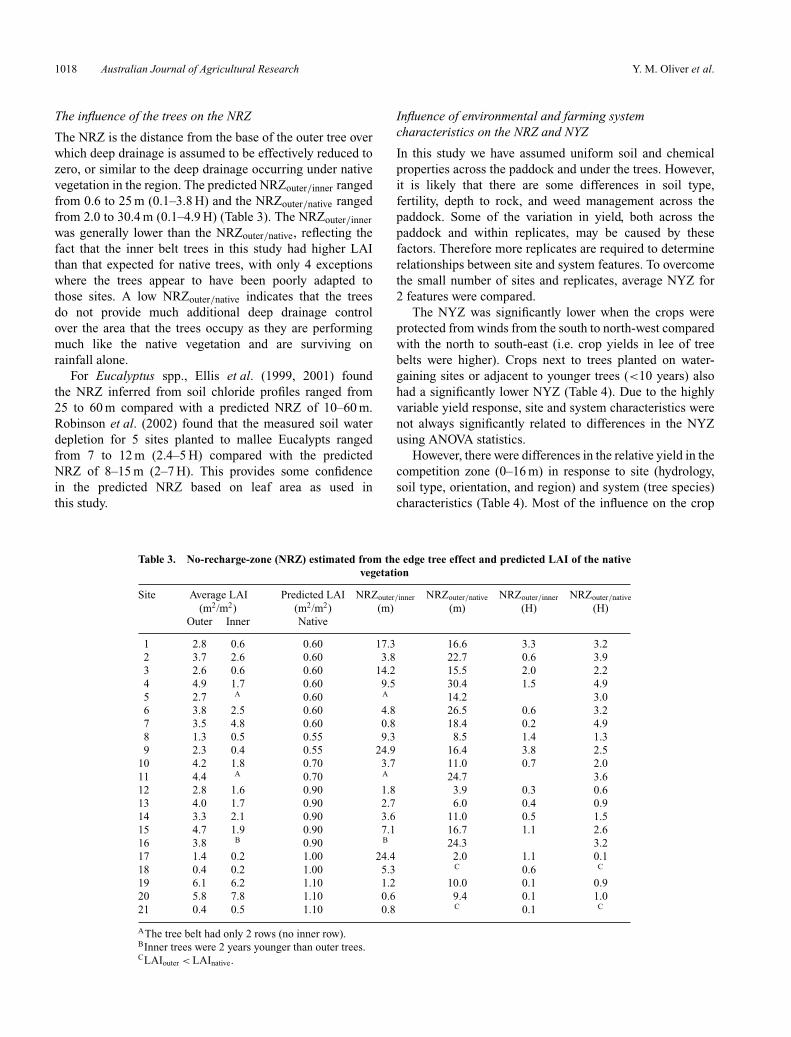
The NRZ is the distance from the base of the outer tree overwhich deep drainage is assumed to be effectively reduced tozero, or similar to the deep drainage occurring under nativevegetation in the region. The predicted NRZouter/inner rangedfrom 0.6 to 25 m (0.1–3.8 H) and the NRZouter/native rangedfrom 2.0 to 30.4 m (0.1–4.9 H) (Table 3). The NRZouter/innerwas generally lower than the NRZouter/native, reflecting thefact that the inner belt trees in this study had higher LAIthan that expected for native trees, with only 4 exceptionswhere the trees appear to have been poorly adapted tothose sites. A low NRZouter/native indicates that the treesdo not provide much additional deep drainage controlover the area that the trees occupy as they are performingmuch like the native vegetation and are surviving onrainfall alone.
For Eucalyptus spp., Ellis et al. (1999, 2001) foundthe NRZ inferred from soil chloride profiles ranged from25 to 60 m compared with a predicted NRZ of 10–60 m.Robinson et al. (2002) found that the measured soil waterdepletion for 5 sites planted to mallee Eucalypts rangedfrom 7 to 12 m (2.4–5 H) compared with the predictedNRZ of 8–15 m (2–7 H). This provides some confidencein the predicted NRZ based on leaf area as used inthis study.
Table 3. No-recharge-zone (NRZ) estimated from the edge tree effect and predicted LAI of the nativevegetation
Site Average LAI Predicted LAI NRZouter/inner NRZouter/native NRZouter/inner NRZouter/native
(m2/m2) (m2/m2) (m) (m) (H) (H)Outer Inner Native
1 2.8 0.6 0.60 17.3 16.6 3.3 3.22 3.7 2.6 0.60 3.8 22.7 0.6 3.93 2.6 0.6 0.60 14.2 15.5 2.0 2.24 4.9 1.7 0.60 9.5 30.4 1.5 4.95 2.7 A 0.60 A 14.2 3.06 3.8 2.5 0.60 4.8 26.5 0.6 3.27 3.5 4.8 0.60 0.8 18.4 0.2 4.98 1.3 0.5 0.55 9.3 8.5 1.4 1.39 2.3 0.4 0.55 24.9 16.4 3.8 2.5
10 4.2 1.8 0.70 3.7 11.0 0.7 2.011 4.4 A 0.70 A 24.7 3.612 2.8 1.6 0.90 1.8 3.9 0.3 0.613 4.0 1.7 0.90 2.7 6.0 0.4 0.914 3.3 2.1 0.90 3.6 11.0 0.5 1.515 4.7 1.9 0.90 7.1 16.7 1.1 2.616 3.8 B 0.90 B 24.3 3.217 1.4 0.2 1.00 24.4 2.0 1.1 0.118 0.4 0.2 1.00 5.3 C 0.6 C
19 6.1 6.2 1.10 1.2 10.0 0.1 0.920 5.8 7.8 1.10 0.6 9.4 0.1 1.021 0.4 0.5 1.10 0.8 C 0.1 C
AThe tree belt had only 2 rows (no inner row).BInner trees were 2 years younger than outer trees.CLAIouter < LAInative.
Influence of environmental and farming systemcharacteristics on the NRZ and NYZ
In this study we have assumed uniform soil and chemicalproperties across the paddock and under the trees. However,it is likely that there are some differences in soil type,fertility, depth to rock, and weed management across thepaddock. Some of the variation in yield, both across thepaddock and within replicates, may be caused by thesefactors. Therefore more replicates are required to determinerelationships between site and system features. To overcomethe small number of sites and replicates, average NYZ for2 features were compared.
The NYZ was significantly lower when the crops wereprotected from winds from the south to north-west comparedwith the north to south-east (i.e. crop yields in lee of treebelts were higher). Crops next to trees planted on water-gaining sites or adjacent to younger trees (<10 years) alsohad a significantly lower NYZ (Table 4). Due to the highlyvariable yield response, site and system characteristics werenot always significantly related to differences in the NYZusing ANOVA statistics.
However, there were differences in the relative yield in thecompetition zone (0–16 m) in response to site (hydrology,soil type, orientation, and region) and system (tree species)characteristics (Table 4). Most of the influence on the crop
Deep drainage control and yield Australian Journal of Agricultural Research 1019
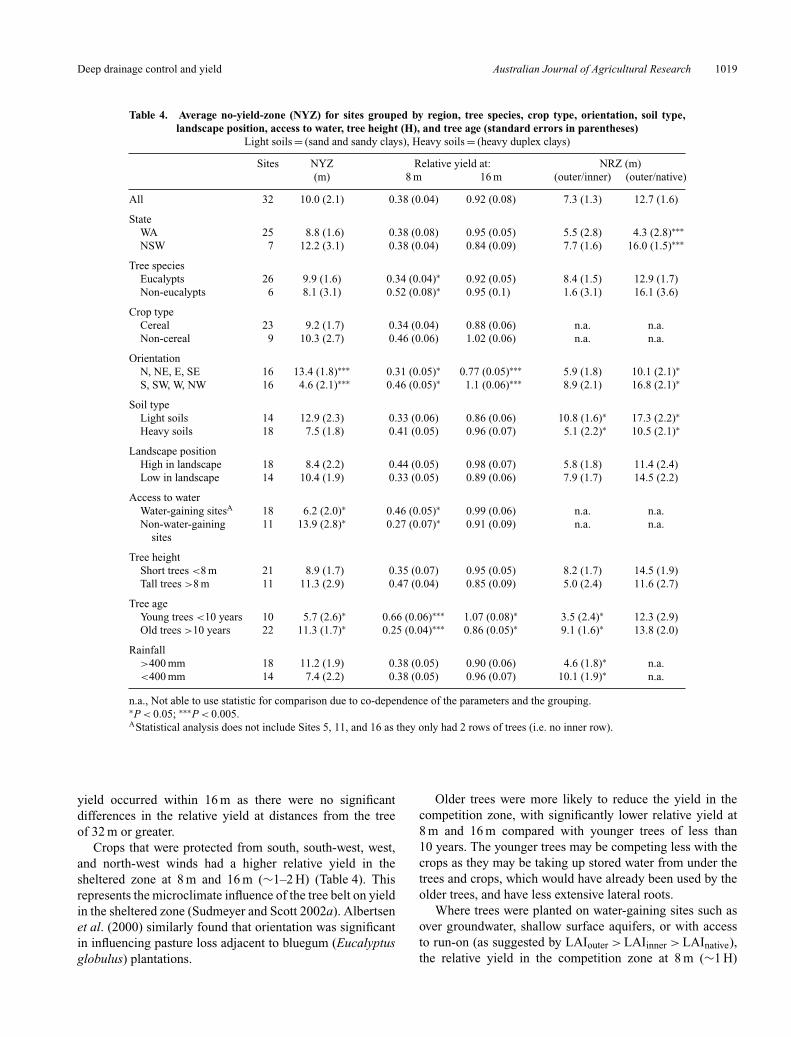
Table 4. Average no-yield-zone (NYZ) for sites grouped by region, tree species, crop type, orientation, soil type,landscape position, access to water, tree height (H), and tree age (standard errors in parentheses)
Light soils = (sand and sandy clays), Heavy soils = (heavy duplex clays)
Sites NYZ Relative yield at: NRZ (m)(m) 8 m 16 m (outer/inner) (outer/native)
All 32 10.0 (2.1) 0.38 (0.04) 0.92 (0.08) 7.3 (1.3) 12.7 (1.6)
StateWA 25 8.8 (1.6) 0.38 (0.08) 0.95 (0.05) 5.5 (2.8) 4.3 (2.8)∗∗∗
NSW 7 12.2 (3.1) 0.38 (0.04) 0.84 (0.09) 7.7 (1.6) 16.0 (1.5)∗∗∗
Tree speciesEucalypts 26 9.9 (1.6) 0.34 (0.04)∗ 0.92 (0.05) 8.4 (1.5) 12.9 (1.7)Non-eucalypts 6 8.1 (3.1) 0.52 (0.08)∗ 0.95 (0.1) 1.6 (3.1) 16.1 (3.6)
Crop typeCereal 23 9.2 (1.7) 0.34 (0.04) 0.88 (0.06) n.a. n.a.Non-cereal 9 10.3 (2.7) 0.46 (0.06) 1.02 (0.06) n.a. n.a.
OrientationN, NE, E, SE 16 13.4 (1.8)∗∗∗ 0.31 (0.05)∗ 0.77 (0.05)∗∗∗ 5.9 (1.8) 10.1 (2.1)∗
S, SW, W, NW 16 4.6 (2.1)∗∗∗ 0.46 (0.05)∗ 1.1 (0.06)∗∗∗ 8.9 (2.1) 16.8 (2.1)∗
Soil typeLight soils 14 12.9 (2.3) 0.33 (0.06) 0.86 (0.06) 10.8 (1.6)∗ 17.3 (2.2)∗
Heavy soils 18 7.5 (1.8) 0.41 (0.05) 0.96 (0.07) 5.1 (2.2)∗ 10.5 (2.1)∗
Landscape positionHigh in landscape 18 8.4 (2.2) 0.44 (0.05) 0.98 (0.07) 5.8 (1.8) 11.4 (2.4)Low in landscape 14 10.4 (1.9) 0.33 (0.05) 0.89 (0.06) 7.9 (1.7) 14.5 (2.2)
Access to waterWater-gaining sitesA 18 6.2 (2.0)∗ 0.46 (0.05)∗ 0.99 (0.06) n.a. n.a.Non-water-gaining 11 13.9 (2.8)∗ 0.27 (0.07)∗ 0.91 (0.09) n.a. n.a.
sites
Tree heightShort trees <8 m 21 8.9 (1.7) 0.35 (0.07) 0.95 (0.05) 8.2 (1.7) 14.5 (1.9)Tall trees >8 m 11 11.3 (2.9) 0.47 (0.04) 0.85 (0.09) 5.0 (2.4) 11.6 (2.7)
Tree ageYoung trees <10 years 10 5.7 (2.6)∗ 0.66 (0.06)∗∗∗ 1.07 (0.08)∗ 3.5 (2.4)∗ 12.3 (2.9)Old trees >10 years 22 11.3 (1.7)∗ 0.25 (0.04)∗∗∗ 0.86 (0.05)∗ 9.1 (1.6)∗ 13.8 (2.0)
Rainfall>400 mm 18 11.2 (1.9) 0.38 (0.05) 0.90 (0.06) 4.6 (1.8)∗ n.a.<400 mm 14 7.4 (2.2) 0.38 (0.05) 0.96 (0.07) 10.1 (1.9)∗ n.a.
n.a., Not able to use statistic for comparison due to co-dependence of the parameters and the grouping.∗P < 0.05; ∗∗∗P < 0.005.AStatistical analysis does not include Sites 5, 11, and 16 as they only had 2 rows of trees (i.e. no inner row).
yield occurred within 16 m as there were no significantdifferences in the relative yield at distances from the treeof 32 m or greater.
Crops that were protected from south, south-west, west,and north-west winds had a higher relative yield in thesheltered zone at 8 m and 16 m (∼1–2 H) (Table 4). Thisrepresents the microclimate influence of the tree belt on yieldin the sheltered zone (Sudmeyer and Scott 2002a). Albertsenet al. (2000) similarly found that orientation was significantin influencing pasture loss adjacent to bluegum (Eucalyptusglobulus) plantations.
Older trees were more likely to reduce the yield in thecompetition zone, with significantly lower relative yield at8 m and 16 m compared with younger trees of less than10 years. The younger trees may be competing less with thecrops as they may be taking up stored water from under thetrees and crops, which would have already been used by theolder trees, and have less extensive lateral roots.
Where trees were planted on water-gaining sites such asover groundwater, shallow surface aquifers, or with accessto run-on (as suggested by LAIouter > LAIinner > LAInative),the relative yield in the competition zone at 8 m (∼1 H)
1020 Australian Journal of Agricultural Research Y. M. Oliver et al.
was significantly higher than at sites that were not classifiedas water gaining (Table 4). Three sites were excludedfrom this analysis as they did not have inner tree rows(Sites 5, 11, and 16).
The relative yield at 8 m was lower for eucalypt than fornon-eucalypt species (Table 4), which may indicate greatercompetition for resources by eucalypts, but although this wasstatistically significant there were only a small number ofsites with non-eucalypts. Sudmeyer et al. (2002) suggestedthat P. pinaster, P. radiata, and E. globulus might havesimilar potential to compete with crops, given that the lateralextent of their roots was found to be similar on a duplexsoil, with all 3 having their greatest root density within0.5 m of the soil surface where crop and pasture rootsare concentrated.
The yield benefit of shelter reported for non-cerealssuch as lupins, peas, and canola in the Northern Hemisphereliterature (Kort 1988; Brandle et al. 1992) was not observedat 8 or 16 m from the trees for the non-cereal crops inthis study. This may reflect the absence of deleteriousclimatic events to which these crops are more sensitivethan cereals at critical stages of growth in either year ofthe study.
The effect of season on the NYZ was evident at 11 sitesmeasured in both 2001 and 2002. The NYZ was widerin 2002 than in 2001 for 8 of these sites (7, 8, 12, 13,14, 16 18, and 19), reflecting lower rainfall in 2002 andgreater potential for competition between the trees andcrops for available water (Ssekabembe et al. 1994; Joseet al. 2000).
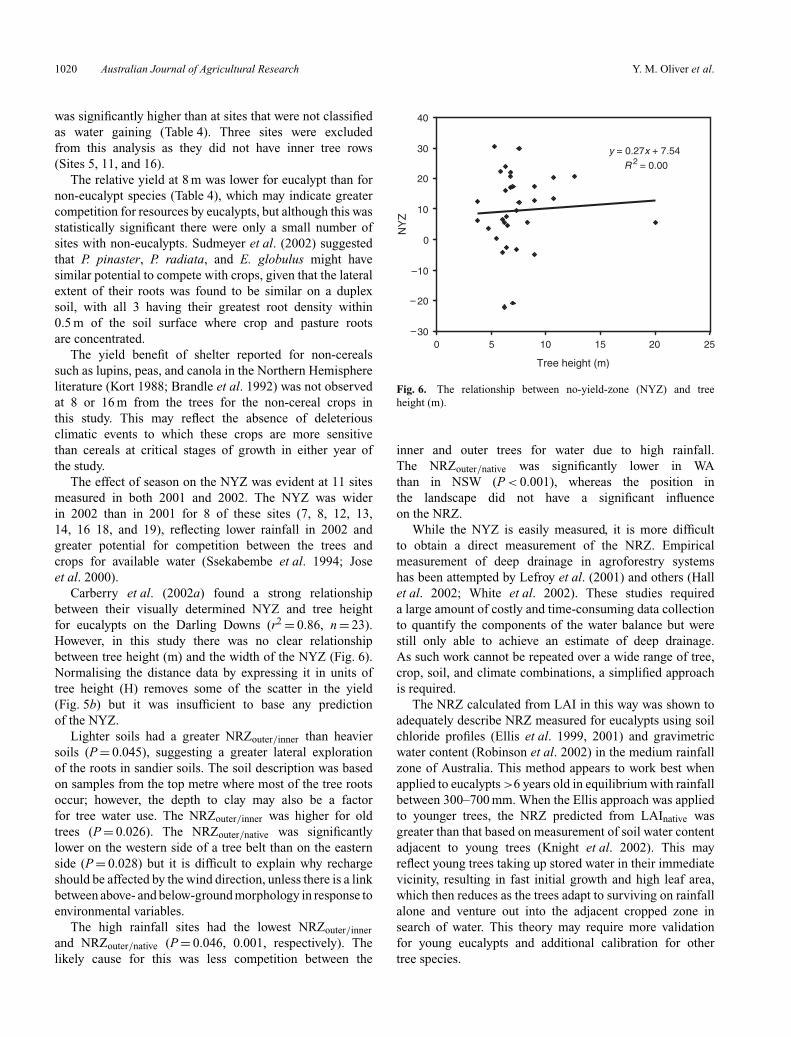
Carberry et al. (2002a) found a strong relationshipbetween their visually determined NYZ and tree heightfor eucalypts on the Darling Downs (r2 = 0.86, n = 23).However, in this study there was no clear relationshipbetween tree height (m) and the width of the NYZ (Fig. 6).Normalising the distance data by expressing it in units oftree height (H) removes some of the scatter in the yield(Fig. 5b) but it was insufficient to base any predictionof the NYZ.
Lighter soils had a greater NRZouter/inner than heaviersoils (P = 0.045), suggesting a greater lateral explorationof the roots in sandier soils. The soil description was basedon samples from the top metre where most of the tree rootsoccur; however, the depth to clay may also be a factorfor tree water use. The NRZouter/inner was higher for oldtrees (P = 0.026). The NRZouter/native was significantlylower on the western side of a tree belt than on the easternside (P = 0.028) but it is difficult to explain why rechargeshould be affected by the wind direction, unless there is a linkbetween above- and below-ground morphology in response toenvironmental variables.
The high rainfall sites had the lowest NRZouter/innerand NRZouter/native (P = 0.046, 0.001, respectively). Thelikely cause for this was less competition between the
y = 0.27x + 7.54
R 2 = 0.00
30
20
10
0
10
20
30
40
0 5 10 15 20 25
Tree height (m)
NY
Z
–
–
–
Fig. 6. The relationship between no-yield-zone (NYZ) and treeheight (m).
inner and outer trees for water due to high rainfall.The NRZouter/native was significantly lower in WAthan in NSW (P < 0.001), whereas the position inthe landscape did not have a significant influenceon the NRZ.
While the NYZ is easily measured, it is more difficultto obtain a direct measurement of the NRZ. Empiricalmeasurement of deep drainage in agroforestry systemshas been attempted by Lefroy et al. (2001) and others (Hallet al. 2002; White et al. 2002). These studies requireda large amount of costly and time-consuming data collectionto quantify the components of the water balance but werestill only able to achieve an estimate of deep drainage.As such work cannot be repeated over a wide range of tree,crop, soil, and climate combinations, a simplified approachis required.
The NRZ calculated from LAI in this way was shown toadequately describe NRZ measured for eucalypts using soilchloride profiles (Ellis et al. 1999, 2001) and gravimetricwater content (Robinson et al. 2002) in the medium rainfallzone of Australia. This method appears to work best whenapplied to eucalypts >6 years old in equilibrium with rainfallbetween 300–700 mm. When the Ellis approach was appliedto younger trees, the NRZ predicted from LAInative wasgreater than that based on measurement of soil water contentadjacent to young trees (Knight et al. 2002). This mayreflect young trees taking up stored water in their immediatevicinity, resulting in fast initial growth and high leaf area,which then reduces as the trees adapt to surviving on rainfallalone and venture out into the adjacent cropped zone insearch of water. This theory may require more validationfor young eucalypts and additional calibration for othertree species.
Deep drainage control and yield Australian Journal of Agricultural Research 1021
Given the difficulty of measuring LAI, this study examinedsurrogate measures that could be used to make a more rapidprediction of NRZ. However, no relationship was foundbetween the diameter at breast height and LAI or the ratioof the outer and inner diameter at breast height and the ratioof the outer and inner LAI. Similarly, tree basal area, whichis simply measured and often found to be a good predictorof leaf area within a species, was a poor predictor of leafarea across the wide range of species involved in this study,suggesting that the search for simply measured integrals ofsystem functioning still has some way to go.
In summary, the site and system features most stronglycorrelated with reduced competition or yield enhancementas reflected by a greater relative yield in the sheltered zone
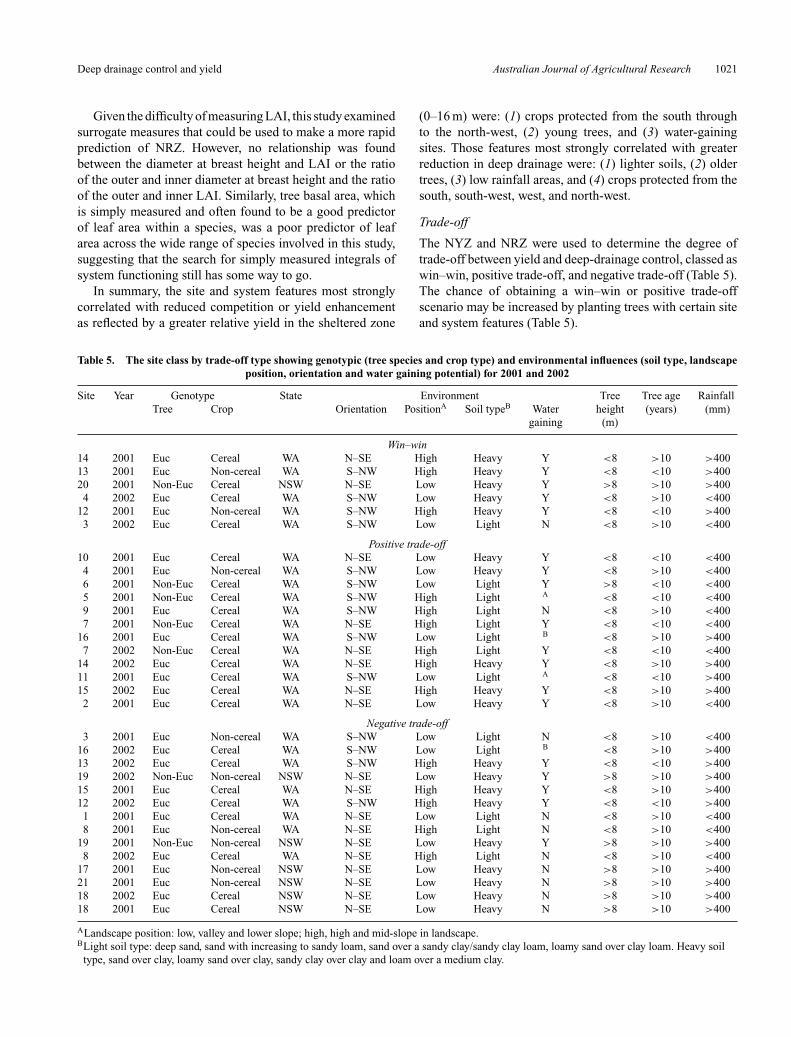
Table 5. The site class by trade-off type showing genotypic (tree species and crop type) and environmental influences (soil type, landscapeposition, orientation and water gaining potential) for 2001 and 2002
Site Year Genotype State Environment Tree Tree age RainfallTree Crop Orientation PositionA Soil typeB Water height (years) (mm)
gaining (m)
Win–win14 2001 Euc Cereal WA N–SE High Heavy Y <8 >10 >40013 2001 Euc Non-cereal WA S–NW High Heavy Y <8 <10 >40020 2001 Non-Euc Cereal NSW N–SE Low Heavy Y >8 >10 >400
4 2002 Euc Cereal WA S–NW Low Heavy Y <8 >10 <40012 2001 Euc Non-cereal WA S–NW High Heavy Y <8 <10 >400
3 2002 Euc Cereal WA S–NW Low Light N <8 >10 <400
Positive trade-off10 2001 Euc Cereal WA N–SE Low Heavy Y <8 <10 <400
4 2001 Euc Non-cereal WA S–NW Low Heavy Y <8 >10 <4006 2001 Non-Euc Cereal WA S–NW Low Light Y >8 <10 <4005 2001 Non-Euc Cereal WA S–NW High Light A <8 <10 <4009 2001 Euc Cereal WA S–NW High Light N <8 >10 <4007 2001 Non-Euc Cereal WA N–SE High Light Y <8 <10 <400
16 2001 Euc Cereal WA S–NW Low Light B <8 >10 >4007 2002 Non-Euc Cereal WA N–SE High Light Y <8 <10 <400
14 2002 Euc Cereal WA N–SE High Heavy Y <8 >10 >40011 2001 Euc Cereal WA S–NW Low Light A <8 <10 >40015 2002 Euc Cereal WA N–SE High Heavy Y <8 >10 >400
2 2001 Euc Cereal WA N–SE Low Heavy Y <8 >10 <400
Negative trade-off3 2001 Euc Non-cereal WA S–NW Low Light N <8 >10 <400
16 2002 Euc Cereal WA S–NW Low Light B <8 >10 >40013 2002 Euc Cereal WA S–NW High Heavy Y <8 <10 >40019 2002 Non-Euc Non-cereal NSW N–SE Low Heavy Y >8 >10 >40015 2001 Euc Cereal WA N–SE High Heavy Y <8 >10 >40012 2002 Euc Cereal WA S–NW High Heavy Y <8 <10 >400
1 2001 Euc Cereal WA N–SE Low Light N <8 >10 <4008 2001 Euc Non-cereal WA N–SE High Light N <8 >10 <400
19 2001 Non-Euc Non-cereal NSW N–SE Low Heavy Y >8 >10 >4008 2002 Euc Cereal WA N–SE High Light N <8 >10 <400
17 2001 Euc Non-cereal NSW N–SE Low Heavy N >8 >10 >40021 2001 Euc Non-cereal NSW N–SE Low Heavy N >8 >10 >40018 2002 Euc Cereal NSW N–SE Low Heavy N >8 >10 >40018 2001 Euc Cereal NSW N–SE Low Heavy N >8 >10 >400
ALandscape position: low, valley and lower slope; high, high and mid-slope in landscape.BLight soil type: deep sand, sand with increasing to sandy loam, sand over a sandy clay/sandy clay loam, loamy sand over clay loam. Heavy soil
type, sand over clay, loamy sand over clay, sandy clay over clay and loam over a medium clay.
(0–16 m) were: (1) crops protected from the south throughto the north-west, (2) young trees, and (3) water-gainingsites. Those features most strongly correlated with greaterreduction in deep drainage were: (1) lighter soils, (2) oldertrees, (3) low rainfall areas, and (4) crops protected from thesouth, south-west, west, and north-west.
Trade-off
The NYZ and NRZ were used to determine the degree oftrade-off between yield and deep-drainage control, classed aswin–win, positive trade-off, and negative trade-off (Table 5).The chance of obtaining a win–win or positive trade-offscenario may be increased by planting trees with certain siteand system features (Table 5).
1022 Australian Journal of Agricultural Research Y. M. Oliver et al.
The win–win scenario occurs when the tree-cropcombination produces a yield enhancement; however,this does not guarantee improved deep-drainage control.This occurred at 6 sites, with a significant effect on deepdrainage estimated to be likely only at 3 of these 6. Alleyfarming would be the most favourable strategy at thesesites in terms of crop production, whereas the effect onthe management of deep drainage will vary, depending onenvironmental and genotypic factors. For win–win scenariosthe common traits were water-gaining sites, trees <8 m tall,trees older than 10 years, and heavy soils.
The positive trade-off scenario occurs where the area ofland over which trees reduce crop yield is less than the areaover which they reduce drainage, i.e. NYZ < NRZ. At 12of the 32 sites where this occurred, alley cropping may bea viable strategy for water management and crop production.More sites were in positive trade-off with the followinggrouped features: in 2001 than in 2002, with cereals thanwith non-cereal, in WA than in NSW, on light soils thanon heavier soils, on water-gaining sites, with trees <8 mtall than with trees >8 m tall, and rainfall <400 mm thanrainfall >400 mm.
The negative trade-off scenario occurs when the area ofyield loss is greater than the area over which deep drainageis reduced, i.e. NYZ > NRZ. At the 14 of the 32 sites wherethis occurred, segregated use of trees in block plantations ismore likely to be the optimal strategy for water managementand crop production. Features common to these sites werenon-water-gaining sites and older trees.
The NRZ and NYZ, however, reflect effects of trees thatare valued quite differently. Whereas the effect of trees oncrop yield is fairly easily determined, it is very difficultto place a value on their role in managing deep drainage.Apart from a few case studies in NSW and Victoria testingpayment for ecosystem services (MBI Working Group 2002;Stoneham et al. 2002), landholders are not rewarded formanaging deep drainage. Although the NRZ and NYZexpress the relative influence of trees on crops and soil water,landholders making decisions about agroforestry will beinfluenced to a far greater extent by the absolute impact oftrees on their income.
Opportunity cost
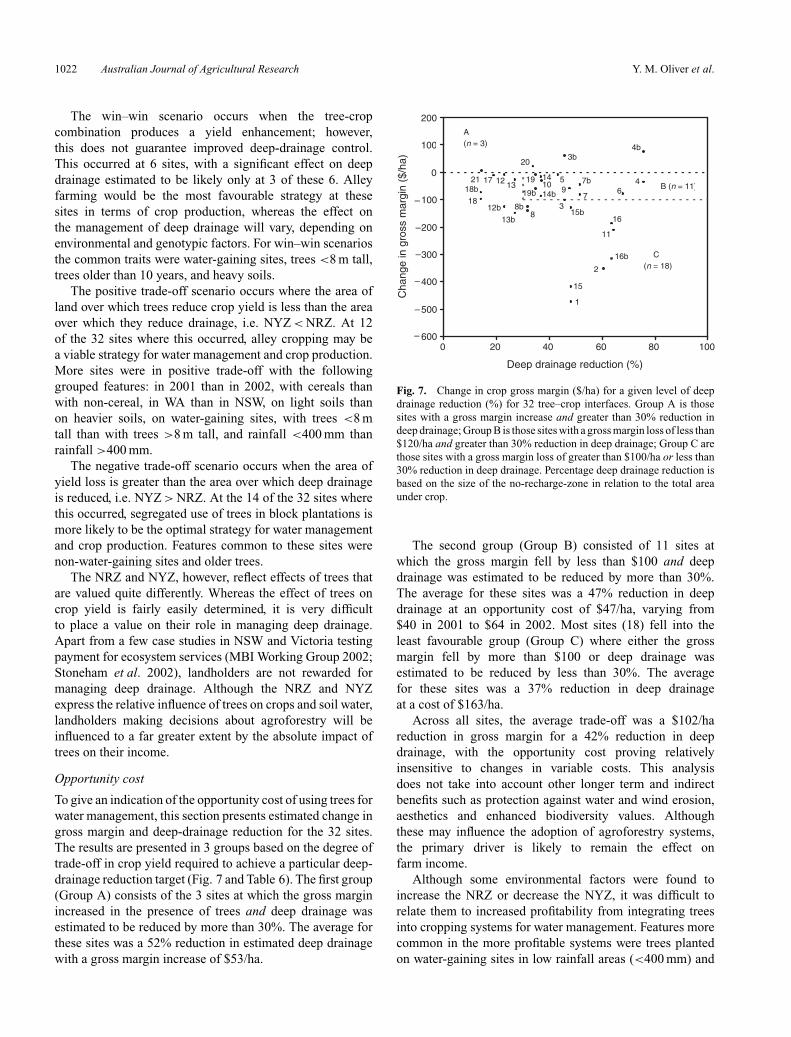
To give an indication of the opportunity cost of using trees forwater management, this section presents estimated change ingross margin and deep-drainage reduction for the 32 sites.The results are presented in 3 groups based on the degree oftrade-off in crop yield required to achieve a particular deep-drainage reduction target (Fig. 7 and Table 6). The first group(Group A) consists of the 3 sites at which the gross marginincreased in the presence of trees and deep drainage wasestimated to be reduced by more than 30%. The average forthese sites was a 52% reduction in estimated deep drainagewith a gross margin increase of $53/ha.
3b 20
19 514 10 47b
9 19b 6714b
21 1217 13 18b
18 38b12b 15b8
13b 16
11
16b
2
15
1
4b
600
500
400
300
–200
100
0
100
200
0 20 40 60 80 100
Deep drainage reduction (%)
Cha
nge
in g
ross
mar
gin
($/h
a)
A (n = 3)
B (n = 11)
C (n = 18)
–
–
–
–
–
Fig. 7. Change in crop gross margin ($/ha) for a given level of deepdrainage reduction (%) for 32 tree–crop interfaces. Group A is thosesites with a gross margin increase and greater than 30% reduction indeep drainage; Group B is those sites with a gross margin loss of less than$120/ha and greater than 30% reduction in deep drainage; Group C arethose sites with a gross margin loss of greater than $100/ha or less than30% reduction in deep drainage. Percentage deep drainage reduction isbased on the size of the no-recharge-zone in relation to the total areaunder crop.
The second group (Group B) consisted of 11 sites atwhich the gross margin fell by less than $100 and deepdrainage was estimated to be reduced by more than 30%.The average for these sites was a 47% reduction in deepdrainage at an opportunity cost of $47/ha, varying from$40 in 2001 to $64 in 2002. Most sites (18) fell into theleast favourable group (Group C) where either the grossmargin fell by more than $100 or deep drainage wasestimated to be reduced by less than 30%. The averagefor these sites was a 37% reduction in deep drainageat a cost of $163/ha.
Across all sites, the average trade-off was a $102/hareduction in gross margin for a 42% reduction in deepdrainage, with the opportunity cost proving relativelyinsensitive to changes in variable costs. This analysisdoes not take into account other longer term and indirectbenefits such as protection against water and wind erosion,aesthetics and enhanced biodiversity values. Althoughthese may influence the adoption of agroforestry systems,the primary driver is likely to remain the effect onfarm income.
Although some environmental factors were found toincrease the NRZ or decrease the NYZ, it was difficult torelate them to increased profitability from integrating treesinto cropping systems for water management. Features morecommon in the more profitable systems were trees plantedon water-gaining sites in low rainfall areas (<400 mm) and
Deep drainage control and yield Australian Journal of Agricultural Research 1023
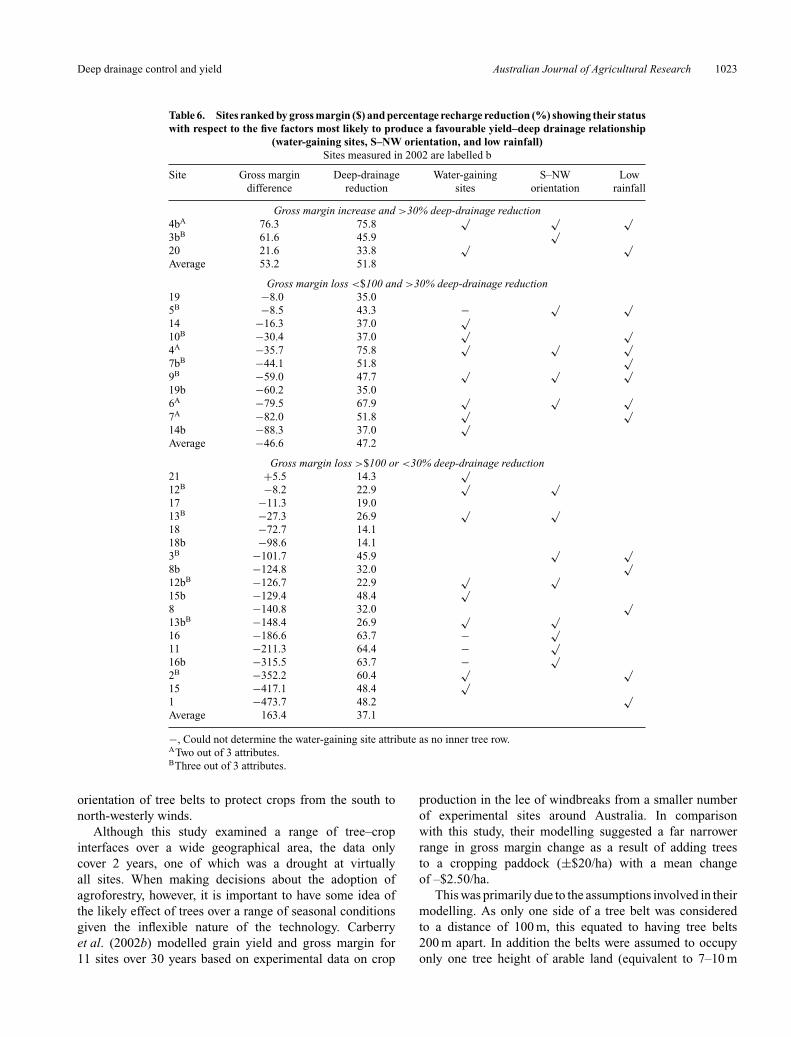
Table 6. Sites ranked by gross margin ($) and percentage recharge reduction (%) showing their statuswith respect to the five factors most likely to produce a favourable yield–deep drainage relationship
(water-gaining sites, S–NW orientation, and low rainfall)Sites measured in 2002 are labelled b
Site Gross margin Deep-drainage Water-gaining S–NW Lowdifference reduction sites orientation rainfall
Gross margin increase and >30% deep-drainage reduction4bA 76.3 75.8
√ √ √3bB 61.6 45.9
√20 21.6 33.8
√ √Average 53.2 51.8
Gross margin loss <$100 and >30% deep-drainage reduction19 −8.0 35.05B −8.5 43.3 − √ √14 −16.3 37.0
√10B −30.4 37.0
√ √4A −35.7 75.8
√ √ √7bB −44.1 51.8
√9B −59.0 47.7
√ √ √19b −60.2 35.06A −79.5 67.9
√ √ √7A −82.0 51.8
√ √14b −88.3 37.0
√Average −46.6 47.2
Gross margin loss >$100 or <30% deep-drainage reduction21 +5.5 14.3
√12B −8.2 22.9
√ √17 −11.3 19.013B −27.3 26.9
√ √18 −72.7 14.118b −98.6 14.13B −101.7 45.9
√ √8b −124.8 32.0
√12bB −126.7 22.9
√ √15b −129.4 48.4
√8 −140.8 32.0
√13bB −148.4 26.9
√ √16 −186.6 63.7 − √11 −211.3 64.4 − √16b −315.5 63.7 − √2B −352.2 60.4
√ √15 −417.1 48.4
√1 −473.7 48.2
√Average 163.4 37.1
−, Could not determine the water-gaining site attribute as no inner tree row.ATwo out of 3 attributes.BThree out of 3 attributes.
orientation of tree belts to protect crops from the south tonorth-westerly winds.
Although this study examined a range of tree–cropinterfaces over a wide geographical area, the data onlycover 2 years, one of which was a drought at virtuallyall sites. When making decisions about the adoption ofagroforestry, however, it is important to have some idea ofthe likely effect of trees over a range of seasonal conditionsgiven the inflexible nature of the technology. Carberryet al. (2002b) modelled grain yield and gross margin for11 sites over 30 years based on experimental data on crop
production in the lee of windbreaks from a smaller numberof experimental sites around Australia. In comparisonwith this study, their modelling suggested a far narrowerrange in gross margin change as a result of adding treesto a cropping paddock (±$20/ha) with a mean changeof –$2.50/ha.
This was primarily due to the assumptions involved in theirmodelling. As only one side of a tree belt was consideredto a distance of 100 m, this equated to having tree belts200 m apart. In addition the belts were assumed to occupyonly one tree height of arable land (equivalent to 7–10 m
1024 Australian Journal of Agricultural Research Y. M. Oliver et al.
for our sites, compared with 15 m used in our economicanalysis). Competition was also set at 20% yield loss inthe first 3.5 H (compared with 40% yield loss extendingover a larger distance in this study), and yield gain set at4.6% at 5 H for all sites in all years (compared with a mean2% yield loss in this study). These assumptions result in morefavourable crop yield and a smaller hydrological effect due tothe wider spacing between belts.
Variability
As the relatively small sample size and limited replicationmay have lead to some outlying data points, the data werere-analysed with some outliers removed. Relative yields of<0.5 at 32 m (5 H) were set to 0.5 as yield reductions ofgreater then 50% were considered unlikely to be causedby the presence of trees. This affected 4 sites (Sites 1,6, 16b, and 21), but had only a marginal effect on theirNYZ and gross margin difference and did not affect theirtrade-off class.
Relative yields greater than 1.5 were reset to 1.5, as yieldenhancement of >50% in the sheltered zone (16–32 m) wasalso considered unlikely to be related to the influence oftrees. This reduced the yield enhancement at 5 sites (Sites 3b,4b, 12, 14, and 20) but these sites still had a net yield gain,indicated by negative NYZs; however, these were reducedby 50–80%. These sites still fell in the win–win trade-offclass (Table 5) but their gross margins were reduced. Thegross margin for 3 sites in Group A (gross margin increaseand >30% deep-drainage reduction) was smaller with anaverage of $14.6/ha compared with $53.2/ha. Removingthese outliers reduced yield enhancement, resulting ina narrower range in gross margin improvements fromtree–crop systems.
In summary, when outlying data points were removed, theeconomic analysis showed that of the 32 tree–crop interfacesstudied, the win–win situation of a gross margin increase anda reduction in deep drainage still occurred at only 3 sites,with a gross margin increase ranging from $1 to 16/ha.At a further 11 sites, a better than 30% reduction in deepdrainage was achieved at a cost of a gross margin loss ofunder $100/ha, with an average gross margin loss of $49/ha.Most sites (18) there was an average of 37% reductionin deep drainage at the cost of a gross margin loss ofover $162/ha.
Seasonal conditions had a strong influence on thecomplementarity between water management and yield, withsome sites being in positive trade-off in one year and negativetrade-off in the other. As agroforestry systems are long livedand therefore relatively inflexible to management, modellingwould be required to produce a probabilistic prediction oftrade-off over time. Removing outlying data points had verylittle effect on the average NYZ for sites grouped by sitesor system features (Table 4). The combination of factorsfound to be most strongly correlated with profitable tree–crop
systems, positive trade-off scenario and win–win trade-offscenario were: (1) protection of crops from the south, south-west, west, or north-west; (2) water gaining sites (access toperched watertables or run-on water); and (3) lower rainfall(<400 mm).
Conclusions
Competition was found to be the norm for the 32 tree–cropinterfaces studied, with an average 7.4% yield loss equivalentto 9.5 m of land lost to production. Although some yieldenhancement in the sheltered zone was measured at 22 ofthe sites, a net yield gain occurred at only 6 sites.
Trees were able to protect on average 12.7 m of croppedland from deep drainage but this ranged from a very smallpredicted lateral influence on deep drainage (0.6 m) tohighly effective deep drainage control (30 m). The differencebetween the LAIouter, LAIinner, and LAInative provided insightinto the potential of water-gaining sites, which may influencethe NYZ and NRZ.
In short, in water-limited environments, competitionappears to rule and the trees tend to win. Where treesare of equal or higher value than the crops, this does notpresent a problem. However, at present, commercial productsfrom trees grown in cropping environments are largelyabsent and fixed investment in trees involves a significantopportunity cost. This study suggests that locating treeswith consideration for hydrology and aspect can offset thisopportunity cost.
Acknowledgments
This project was a collaboration between the Joint VentureAgroforestry Project (JVAP) and the Grains Researchand Development Corporation (GRDC). JVAP is fundedby three R&D Corporations — RIRDC, LWRRDC, andFWPRDC – and managed by RIRDC.
The authors acknowledge the generous assistanceprovided by the participating landholders: Laurie andJenny Pitman, Kevin and Julie Ling, Richard andChantal Guiness, Tim, Margaret and Robert Clayton, Gordonand Cameron McDougall, Peter and Wendy Bessell-Brown,Ian Cooley, Greg Parker, John and Fiona Johnson, Bill andClemmence Matchett, Tony and Kerry Richens, and Ann andBernard Hart.
We thank David Waugh (University of Western Australia)for his assistance with the data collection in WA, andAlan Reid (CSIRO Sustainable Ecosystems, Canberra) forhis assistance with data collection in NSW.
References
Albertsen T, Eckersley P, Blennerhassett S, Moore R, Hingston R(2000) Bluegum timber belt design for alley farming. RIRDCpublication No. 00/154.
Andrew AH, Noble IR, Lange RT (1979) A non-destructive methodof estimating the weight of forage shrubs. Australian RangelandJournal 1, 777–782.
Deep drainage control and yield Australian Journal of Agricultural Research 1025
Bicknell D (1991) The role of trees in providing shelter andcontrolling erosion in the dry temperate southern agricultural area ofWestern Australia. In ‘The Role of Trees in Sustainable Agriculture:A National Conference’. pp. 21–39. (Rural Industries Research andDevelopment Corporation: Canberra, ACT)
Bird PR (1998) Tree windbreaks and shelter effects to pasturein temperate grazing systems. Agroforestry Systems 41, 35–54.doi: 10.1023/A:1006092104201
Brandle JR, Johnson BB, Akeson T (1992) Field windbreaks: are theyeconomical? Journal of Production Agriculture 5, 393–398.
Burke S (1991) The effect of shelterbelts on crop yields atRutherglen Victoria. In ‘The role of trees in sustainable agriculture:A national conference’. pp. 89–99. (Rural Industries Research andDevelopment Corporation: Canberra, ACT)
Cannell MGR, VanNoordwijk M, Ong CK (1996) The centralagroforestry hypothesis: The trees must acquire resources that thecrop would not otherwise acquire. Agroforestry Systems 34, 27–31.doi: 10.1007/BF00129630
Carberry P, Hith N, Poulton P, Brennan L (2002a) Quantifying thetradeoff between tree and crop productivity on farms. RIRDCPublications, Joint Venture Agroforestry Program, No. 02/02.
Carberry PS, Meinke H, Poulton PL, Hargreaves JNG, Snell AJ,Sudmeyer RA (2002b) Modelling crop growth and yield under theenvironmental changes induced by windbreaks. 2. Simulation ofpotential benefits at selected sites in Australia. Australian Journalof Experimental Agriculture 42, 887–900. doi: 10.1071/EA02020
Cleugh HA (1998) Effect of windbreaks on airflow, microclimateand crop yields. Agroforestry Systems 41, 55–84.doi: 10.1023/A:1006019805109
Cleugh HA, Prinsley R, Bird PR, Brooks SJ, Carberry PS, et al.(2002) The Australian National Windbreak Program: overview andsummary of results. Australian Journal of Experimental Agriculture42, 649–664. doi: 10.1071/EA02003
Ellis T, Bessard Y, Brophy J (2001) Estimating recharge from alleyfarms: applying the ENOR model within the Murray Darling Basin.Technical Report 2001/04, CSIRO Land and Water, Canberra.
Ellis TW, Hatton TJ, Nuberg IK (1999) A simple method forestimating recharge from low rainfall agroforestry systems.In ‘Envirowater99, 2nd Inter-Regional Conference on EnvionmentalWater’. (Eds A Musey, L Santo Pereira, M Frisch) (PressesPloytechnique et Universitaires Romandes: Laussane, France)
Gee GW, Bauder JW (1979) Particle size analysis by hydrometer:A simple test for routine textural analysis and sensitivity test ofmeasurement parameters. Soil Science Society of America Journal43, 1004–1007.
Gregory PJ (1996) Approaches to modelling the uptake of water andnutrients in agroforestry systems. Agroforestry Systems 34, 51–65.doi: 10.1007/BF00129632
Hall DJM, Sudmeyer RA, Mclernon CK, Short RJ (2002)Characterisation of a windbreak system on the south coastof Western Australia. 3. Soil water and hydrology.Australian Journal of Experimental Agriculture 42, 729–738.doi: 10.1071/EA02009
Jonsson K, Fidjeland L, Maghemebe JA, Hogberg P (1988) The verticaldistribution of fine roots and 5 tree species and maize in Morogoro,Tanzania. Agroforestry Systems 6, 63–69.
Jose S, Gillespie AR, Seifert JR, Biehle DJ (2000) Definingcompetition vectors in a temperate alley cropping system in the mid-western USA. 2. Competition for water. Agroforestry Systems 48,41–59. doi: 10.1023/A:1006289322392
Knight A, Blott K, Portelli M, Hignett C (2002) Use of treeand shrub belts to control leakage in three dryland croppingenvironments. Australian Journal of Agricultural Research 53,571–586. doi: 10.1071/AR01089
Kort J (1988) Benefits of windbreaks to field and foragecrops. Agriculture Ecosystems and Environment 22–23, 165–190.doi: 10.1016/0167-8809(88)90017-5
Lefroy EC, Stirzaker RJ (1999) Agroforestry for water management inthe cropping zone of southern Australia. Agroforestry Systems 45,277–302. doi: 10.1023/A:1006241503888
Lefroy EC, Stirzaker RJ, Pate JS (2001) The influence of tagasaste(Chamaecytisus proliferus Link.) trees on the water balance of analley cropping system on deep sand in south-western Australia.Australian Journal of Agricultural Research 52, 235–246.doi: 10.1071/AR00035
Lynch JJ, Donnelly JB (1980) Changes in pasture and animalproduction resulting from the use of windbreaks. AustralianJournal of Agricultural Research 31, 967–979. doi: 10.1071/AR9800967
Marshall JK (1967) The effect of shelter on the productivity ofgrasslands and field crops. Field Crop Abstracts 20, 1–14.
MBI Working Group (2002) ‘Investigating new approaches –a review of natural resource management pilots and programsin Australia that use market-based instruments.’ National ActionPlan for Salinity and Water Quality (ISBN 0734752636,http://www.napswq.gov.au/mbi/download.html)
Miller AW, Pallardy SG (2001) Resource competition across thecrop–tree interface in a maize-silver maple temperate alleycropping stand in Missouri. Agroforestry Systems 53, 247–259.doi: 10.1023/A:1013327510748
Nuberg IK, Mylius SJ (2002) Effect of shelter on the yield and wateruse of wheat. Australian Journal of Experimental Agriculture 42,773–780. doi: 10.1071/EA02013
Nuberg IK, Mylius SJ, Edwards JM, Davey C (2002) Windbreakresearch in a South Australian cropping system. AustralianJournal of Experimental Agriculture 42, 781–795. doi: 10.1071/EA02014
Ong CK, Corlett JE, Singh RP, Black CR (1991) Above andbelow-ground interactions in agroforestry systems.Forest Ecology and Management 45, 45–57. doi: 10.1016/0378-1127(91)90205-A
Ong CK, Leakey RRB (1999) Why tree–crop interactions inagroforestry appear at odds with tree–grass interactionsin tropical savannahs. Agroforestry Systems 45, 109–129.doi: 10.1023/A:1006243032538
Robinson N, Harper RJ, Smettem KRJ, Archibald R, Stilwell A,Oliver YM (2002) Recharge reduction on degraded agricultural soilswith agroforestry systems. In ‘17th World Congress of Soil Science’.(CD-ROM, ISSS: Bangkok, Thailand)
Sanchez PA (1995) Science in agroforestry. Agroforestry Systems 30,5–55. doi: 10.1007/BF00708912
Ssekabembe CK, Henderlong PR, Larson M (1994) Soil moisturerelations at the tree/crop interface in black locust alleys. AgroforestrySystems 25, 135–140. doi: 10.1007/BF00705673
Stirzaker RJ, Cook FJ, Knight JH (1999) Where to planttrees on cropping land for control of dryland salinity: someapproximate solutions. Agricultural Water Management 39,115–133. doi: 10.1016/S0378-3774(98)00074-2
Stirzaker RJ, Lefroy EC, Ellis TW (2002) An index for quantifying thetrade-off between drainage and productivity in tree–crop mixtures.Agricultural Water Management 53, 187–199. doi: 10.1016/S0378-3774(01)00164-0
Stoneham G, Chaudhri V, Ha A, Strappazzon L (2002) Auctionsfor conservation contracts: and empirical examination ofVictoria’s BushTender Trial. In ‘46th Annual Conference ofthe Australian Agricultural and Resource Economics Society’.(Australian Agricultural and Resource Economics Society:Armidale, NSW)
1026 Australian Journal of Agricultural Research Y. M. Oliver et al.
Sudmeyer RA, Hall DJM, Eastham J, Adams MA (2002) The tree–cropinterface: the effects of root pruning in south-western Australia.Australian Journal of Experimental Agriculture 42, 763–772.doi: 10.1071/EA02012
Sudmeyer RA, Scott PR (2002a) Characterisation of a windbreaksystem on the south coast of Western Australia. 1. Microclimate andwind erosion. Australian Journal of Experimental Agriculture 42,703–715. doi: 10.1071/EA02007
Sudmeyer RA, Scott PR (2002b) Characterisation of a windbreaksystem on the south coast of Western Australia. 2. Crop growth.Australian Journal of Experimental Agriculture 42, 717–727.doi: 10.1071/EA02008
Sun D, Dickinson GR (1994) A case study of shelterbelt effecton potato (Solanum tuberosum) yield on the Atheron Tablelandsin tropical north Australia. Agroforestry Systems 25, 141–151.doi: 10.1007/BF00705674
White DA, Dunin FX, Turner NC, Ward BH, Galbraith JH (2002)Water use by contour planted belts of trees comprising of fourEucalyptus species. Agricultural Water Management 53, 133–152.doi: 10.1016/S0378-3774(01)00161-5
Manuscript received 14 September 2004, accepted 11 July 2005
http://www.publish.csiro.au/journals/ajar