Growth and grazing rates of bacteria groups with different apparent DNA content in the Gulf of...
13
RESEARCH ARTICLE F. J. Jochem P. J. Lavrentyev M. R. First Growth and grazing rates of bacteria groups with different apparent DNA content in the Gulf of Mexico Received: 25 November 2003 / Accepted: 25 April 2004 / Published online: 30 June 2004 ȑ Springer-Verlag 2004 Abstract Growth rates and grazing losses of bacterio- plankton were assessed by serial dilution experiments in surface waters in the Mississippi River plume, the northern Gulf of Mexico, a Texas coastal lagoon (La- guna Madre), southeast Gulf of Mexico surface water, and the chlorophyll subsurface maximum layer in the southeast Gulf of Mexico. Bacteria were quantified by flow cytometry after DNA staining with SYBR Green, which allowed for discrimination of growth and grazing rates of four bacteria subpopulations distinguished by their apparent DNA content and cell size (light scatter signal). Total bacteria growth rates (0.2–0.9 day À1 ) were mostly balanced by grazing losses, resulting in net growth rates of À0.18 to 0.45 day À1 . Growth rates of DNA subpopulations varied within experiments, some- times substantially. In most, but not all, experiments, the largest bacteria with highest DNA content exhibited the highest growth rates, but a relationship between DNA content and growth rates or grazing losses was absent. Small bacteria with the lowest DNA content showed positive growth rates in most experiments, sometimes higher than growth rates of bacteria containing more DNA, and were grazed upon actively. Low-DNA bac- teria were not inactive and were an integral part of the microbial food web. Introduction Bacteria play a key role in planktonic marine microbial food webs. They constitute an important share of plankton biomass, and their activity impacts ecosystem metabolism and function. Bacteria are a major compo- nent in aquatic carbon cycling and other biogeochemical processes (Ducklow 2000). A contemporary challenge in microbial ecology is to understand the functional role of phylogenetically or otherwise defined bacterial popula- tions in natural ecosystems. Marine bacterioplankton studies have improved with the development of new techniques. Culture-indepen- dent molecular tools now allow assessment of bacterial diversity of heterogeneous, natural populations, a task previously hindered by the minor number of cultivable marine bacteria (Giovannoni and Rappe´ 2000). The introduction of flow cytometry into the analysis of planktonic bacteria (Li et al. 1995; Marie et al. 1997) made bacteria counts faster, easier, and more precise (by higher number of counted cells; Venrick 1978) and provided feasibility for experiments involving a high number of counting samples to be processed. Good correlation between cytometric and microscopic bacteria counts has been shown (e.g. Marie et al. 1997; Yanada et al. 2000; Jochem 2001; Vaque´ et al. 2001). With the introduction of cytometric bacteria counts, which rely on DNA staining, it became obvious that bacterioplankton communities are composed of groups with different apparent DNA content (Li et al. 1995; Marie et al. 1997). Depending on the system under study, two to four bacteria groups distinguished by their combination of DNA content and cell size (light scatter signal) could be differentiated (Gasol and del Giorgio 2000 and references therein). Whereas coastal and eutrophic samples tend to have two groups, up to nine DNA clusters have been distinguished in coastal Medi- terranean waters (Troussellier et al. 1999). The ecological significance of bacteria groups with different DNA content has been set into the context of Communicated by O. Kinne, Oldendorf/Luhe F. J. Jochem (&) Marine Biology Program, Florida International University, 3000 NE 151 Street, North Miami, FL 33181, USA E-mail: [email protected] Fax: +1-305-919-5896 P. J. Lavrentyev Department of Biology, University of Akron, Akron, OH 44325, USA M. R. First Department of Marine Sciences, University of Georgia, Athens, GA 30606, USA Marine Biology (2004) 145: 1213–1225 DOI 10.1007/s00227-004-1406-7
-
Upload
independent -
Category
Documents
-
view
9 -
download
0
Transcript of Growth and grazing rates of bacteria groups with different apparent DNA content in the Gulf of...

RESEARCH ARTICLE
F. J. Jochem Æ P. J. Lavrentyev Æ M. R. First
Growth and grazing rates of bacteria groups with differentapparent DNA content in the Gulf of Mexico
Received: 25 November 2003 / Accepted: 25 April 2004 / Published online: 30 June 2004� Springer-Verlag 2004
Abstract Growth rates and grazing losses of bacterio-plankton were assessed by serial dilution experiments insurface waters in the Mississippi River plume, thenorthern Gulf of Mexico, a Texas coastal lagoon (La-guna Madre), southeast Gulf of Mexico surface water,and the chlorophyll subsurface maximum layer in thesoutheast Gulf of Mexico. Bacteria were quantified byflow cytometry after DNA staining with SYBR Green,which allowed for discrimination of growth and grazingrates of four bacteria subpopulations distinguished bytheir apparent DNA content and cell size (light scattersignal). Total bacteria growth rates (0.2–0.9 day�1) weremostly balanced by grazing losses, resulting in netgrowth rates of �0.18 to 0.45 day�1. Growth rates ofDNA subpopulations varied within experiments, some-times substantially. In most, but not all, experiments, thelargest bacteria with highest DNA content exhibited thehighest growth rates, but a relationship between DNAcontent and growth rates or grazing losses was absent.Small bacteria with the lowest DNA content showedpositive growth rates in most experiments, sometimeshigher than growth rates of bacteria containing moreDNA, and were grazed upon actively. Low-DNA bac-teria were not inactive and were an integral part of themicrobial food web.
Introduction
Bacteria play a key role in planktonic marine microbialfood webs. They constitute an important share ofplankton biomass, and their activity impacts ecosystemmetabolism and function. Bacteria are a major compo-nent in aquatic carbon cycling and other biogeochemicalprocesses (Ducklow 2000). A contemporary challenge inmicrobial ecology is to understand the functional role ofphylogenetically or otherwise defined bacterial popula-tions in natural ecosystems.
Marine bacterioplankton studies have improved withthe development of new techniques. Culture-indepen-dent molecular tools now allow assessment of bacterialdiversity of heterogeneous, natural populations, a taskpreviously hindered by the minor number of cultivablemarine bacteria (Giovannoni and Rappe 2000). Theintroduction of flow cytometry into the analysis ofplanktonic bacteria (Li et al. 1995; Marie et al. 1997)made bacteria counts faster, easier, and more precise (byhigher number of counted cells; Venrick 1978) andprovided feasibility for experiments involving a highnumber of counting samples to be processed. Goodcorrelation between cytometric and microscopic bacteriacounts has been shown (e.g. Marie et al. 1997; Yanadaet al. 2000; Jochem 2001; Vaque et al. 2001).
With the introduction of cytometric bacteria counts,which rely on DNA staining, it became obvious thatbacterioplankton communities are composed of groupswith different apparent DNA content (Li et al. 1995;Marie et al. 1997). Depending on the system understudy, two to four bacteria groups distinguished by theircombination of DNA content and cell size (light scattersignal) could be differentiated (Gasol and del Giorgio2000 and references therein). Whereas coastal andeutrophic samples tend to have two groups, up to nineDNA clusters have been distinguished in coastal Medi-terranean waters (Troussellier et al. 1999).
The ecological significance of bacteria groups withdifferent DNA content has been set into the context of
Communicated by O. Kinne, Oldendorf/Luhe
F. J. Jochem (&)Marine Biology Program, Florida International University,3000 NE 151 Street, North Miami, FL 33181, USAE-mail: [email protected]: +1-305-919-5896
P. J. LavrentyevDepartment of Biology, University of Akron,Akron, OH 44325, USA
M. R. FirstDepartment of Marine Sciences, University of Georgia,Athens, GA 30606, USA
Marine Biology (2004) 145: 1213–1225DOI 10.1007/s00227-004-1406-7

bacterial cellular activity in the oceans. Although theactual value may depend on the technique applied, onlya variable but small fraction of planktonic bacteria(from as low as 2% to >90%, but usually <50%) ap-pears to be metabolically active (Smith and del Giorgio2003). Based on micro- and mesocosm studies thatexhibited high growth rates of bacteria with high DNAcontent, particularly under grazer removal and substrateaddition (Gasol et al. 1995; Yanada et al. 2000; Vaqueet al. 2001; Jacquet et al. 2002), it was concluded thathigh-DNA bacteria represent the metabolically activefraction of bacterioplankton, whereas low-DNA bacte-ria were considered inactive or dead (Gasol and delGiorgio 2000). This interpretation is supported by lowercell-specific substrate uptake rates in low-DNA bacteria(Jellett et al. 1996; Lebaron et al. 2002) and a closercorrelation of total bacterial production to high-DNAbacteria abundance than to total bacteria (Vaque et al.2001). The ratio of high- to low-DNA bacteria wassuggested as an ‘‘active cell index’’ of bacterioplankton(Jellett et al. 1996). However, recent studies have re-vealed that low-DNA bacteria are not inactive (Gregoriet al. 2001; Zubkov et al. 2001) and may exhibit meta-bolic activities and growth rates similar to high-DNAbacteria (Zubkov et al. 2001).
In the northern Gulf of Mexico and the MississippiRiver plume (Louisiana shelf), four bacteria DNAgroups corresponding to previously described groupswere found (Jochem 2001). The aim of this study was toassess bacterial growth rates and grazing losses in theMississippi River plume, the northern Gulf of Mexico, aTexas coastal lagoon, and the southeast Gulf of Mexico.Growth rates and grazing losses of the four DNAgroups were established to reveal the heterogeneity ofbacterial growth rates within bacterioplankton commu-nities, assess if low-DNA bacteria can be considered
inactive cells, and evaluate the role of DNA groups inthe microbial food web.
Materials and methods
Growth rates and grazing losses of bacteria were esti-mated from serial dilution experiments (Landry andHassett 1982) performed with surface samples in theMississippi River plume (stations MRP; 20–29 May2000), northern Gulf of Mexico (GoM; 18 June 2001),lower Laguna Madre (LLM; 28 June 2001), southeastGulf of Mexico (stations 1–5; 2–7 May 2002), andchlorophyll subsurface maximum layer in the southeastGulf of Mexico (stations A–D; 2–5 August 2002; Fig. 1).
Water samples were taken by CTD-mounted, metal-free Niskin water bottles and diluted (1.0, 0.8, 0.6, 0.3,0.15 fractions) with sample water previously filteredthrough 0.2-lm 47-mm polycarbonate filters(<250 mbar). In the Mississippi River plume, dilutionswere incubated in 100-ml polystyrene culture flasks(Corning Costar Corp., Cambridge, Mass., USA) sub-merged in a seawater-containing deck incubator withblue-shaded Plexiglas walls to simulate the sunlightspectrum and cooled to ambient water temperature by amicroprocessor-controlled Neslab RTE bath/circulatorcooler (Neslab Instruments, Newington, N.H., USA).For GoM and LLM experiments, 500-ml polycarbonatebottles were used. Experiments in the southeast Gulf ofMexico were incubated in 100-ml polycarbonate bottlesplaced in a seawater-cooled deck incubator with ambientlight intensity simulated by black mosquito net. Exper-iments in the southeast Gulf were amended with f/20nutrients, those in the northeast Gulf and LagunaMadre with 4 lmol l�1 NH4Cl. All dilutions were per-formed in triplicate. Ten-milliliter subsamples were ta-
Fig. 1 Sampling stations in theGulf of Mexico. GoM northernGulf of Mexico, LLM lowerLaguna Madre, MRPMississippi River plume, 1–5southeast Gulf of Mexicostations 1–5, A–D southeastGulf of Mexico stations A–D
1214

ken prior to incubation and after 24 h, fixed with 1%(final concentration) formaldehyde, and either stored at4�C in the dark for up to 2 weeks (MRP, GoM, LLM)or frozen in liquid nitrogen and stored at –20�C(southeast Gulf of Mexico) until analysis.
Bacteria were quantified by flow cytometry afterDNA staining (Marie et al. 1997; Jochem 2001). Onemilliliter of sample was incubated for 30 min at 37�Cwith 0.1 g l�1 RNAse (1:1 mix of RNAse A and B)before staining with SYBR Green I (10�5 dilution ofcommercial stock; Molecular Probes, Eugene, Ore.,USA) in the presence of 30 mM potassium citrate. After30 min of staining, samples were analyzed on a BectonDickinson (San Jose, Calif., USA) FACSort flow cy-tometer at a sample flow rate of 0.2 ll s�1. Measuredsample volume was estimated from measurement time(50–300 s) based on repeated weight calibration of flowrates.
SYBR DNA fluorescence was detected in both thegreen FL1 (535±15 nm) and the red FL3 (>650 nm)fluorescence channels. Autofluorescence from cyano-bacteria never inferred with SYBR Green fluorescencesignals in the FL3 channel because chlorophyll fluores-cence signals were always substantially higher thanSYBR Green signals in this channel, and cyanobacteriawere clearly separated from bacterial clusters. Side-anglelight scatter (SSC) served as a proxy for bacterial cellsize (Servais et al. 1999; Troussellier et al. 1999). Allsignals were recorded on a 4-decade log scale. Data wereanalyzed by WinMDI version 2.7 (Joseph Trotter,Scripps Research Institute, La Jolla, Calif.; freeware).DNA clusters of heterotrophic bacteria were counted bylogical gating from both FL1 versus FL3 and SSC versusFL1 histograms, with gate borders set at the minima infrequency distributions of DNA fluorescence and lightscatter and kept constant throughout experiment anal-ysis (Fig. 2). Growth and grazing rates of bacteria wereestimated from linear regressions of apparent growthrates (ln [Nt/N0]·1/t with N0 and Nt as the initial andfinal abundance, respectively, and t=1 day) versussample dilution.
Results
Table 1 summarizes locations, hydrographic conditions,phytoplankton chlorophyll concentrations, and bacteriaabundances at the sampled stations. Both bacteria andphytoplankton abundance were highest (1.2–1.5·106bacteria ml�1; ca. 30 lg Chl. a l�1) at low and mid-salinity stations in the Mississippi River plume. Dis-solved inorganic nitrogen concentrations(NH4
++NO3�+NO2
�) decreased from 53 lM at sta-tion MRP2 (8.5&) to 18 lM at station MRP7 (23.5&)and were 0.27 lM at the two full-salinity stations (Jo-chem 2001). High bacteria biomass and production inthe Mississippi River plume has been related to riverineimport of labile dissolved organic matter (Chin-Leo andBenner 1992). High bacterial abundance also occurred in
the lower Laguna Madre (LLM), a shallow, coastal la-goon where NH4
+ dominates inorganic nitrogen andphytoplankton often is restricted to the Texas BrownTide pelagophyte Aureoumbra lagunensis and the coc-coid cyanobacterium Synechococcus spp. All other sta-tions exhibited low bacteria abundance (2–4·105 ml�1)and phytoplankton biomass (<0.5 lg Chl. a l�1) typicalfor oligotrophic Gulf of Mexico waters. Except forLLM, bacteria abundance was correlated with phyto-plankton abundance (r2=0.95, P<0.0001) as describedin other marine systems (Gasol and Duarte 2000).
Fig. 2 Flow-cytometric signature of bacterioplankton in thenortheast Gulf of Mexico. FL1 and FL3 (green and redfluorescence) both represent SYBR Green DNA fluorescence;side-angle light scatter is used as a proxy of cell size. Prochloro-coccus are clearly separated from bacteria
1215

In all samples, four clusters of bacteria were dis-tinguished by their apparent DNA content and cell size(light scatter; Fig. 2) as previously described for theMississippi River plume and the northern Gulf ofMexico (Jochem 2001). Group 1 is assigned to bacteriawith low light scatter (cell size) and lowest DNA con-tent. Group 2 bacteria exhibited similar light scatter togroup 1 but a higher DNA content. While group 3bacteria, clearly distinguished from group 2 by theirDNA fluorescence, exhibited similar light scatter sig-nals to groups 1 and 2 bacteria in the Mississippi Riverplume, northwest Gulf of Mexico, and Laguna Madre,light scatter of group 3 was higher than for groups 1and 2 in southeast Gulf samples. Group 4 bacteriarepresent cells with the highest light scatter and DNAsignals. In the southeast Gulf samples, light scatter ofgroup 4 cells was even higher, reaching light scattersignals similar to (the clearly distinguished) Prochloro-coccus spp.
Small, low-DNA bacteria (group 1) were the mostabundant bacteria in all Gulf of Mexico samples(39.8±11.5%; mean±SD). Their share was higher inthe northern Gulf (GoM and MRP stations;51.4±8.2%; Table 2, Fig. 3) than in the southeast Gulf(33.4±7.8%). In the southeast Gulf, no significant
difference in group 1 shares was evident between surface(stations 1–5) and subsurface (stations A–D; Table 2,Fig. 3) samples. In all Gulf samples, groups 2 and 3exhibited similar shares to each other and among moststations (25.4±3.0% and 27.2±7.0%, respectively).Group 4 bacteria shares also were similar among allGulf stations but only half to two-thirds of group 2 and3 shares (14.0±2.3%; Table 2). Lower Laguna Madre(LLM) exhibited a different composition of bacterio-plankton, which may reflect different environmentalconditions. Group 3 bacteria dominated the community(67.7%), and groups 1, 2, and 4 contributed 15.8, 11.8,and 4.6%, respectively (Table 2, Fig. 3).
Total bacterioplankton exhibited highest growthrates in the chlorophyll subsurface maximum in thesoutheast Gulf of Mexico (0.75±0.11 day�1). Growthrates in surface waters of the southeast Gulf (stations 1–5) were 0.51±0.18 day�1, 0.42 day�1 in the northernGulf (GoM), 0.55 day�1 in Laguna Madre, and 0.2–0.7day�1 in the Mississippi River plume (Fig. 4). Growthrates of individual DNA groups fell both above andbelow the growth rate for total bacterioplankton in eachexperiment. Although all four DNA groups were presentin all samples, not all groups computed significant serialdilution regressions in some experiments.
Table 1 Station locations and key environmental parameters
Station Date Latitude Longitude Sampledepth
Waterdepth
Temp.�C
Salinity&
Chlorophyll alg l�1
Totalbacteria
(m) (m) 103 ml�1
Mississippi River plume, May 2000MRP2 20 May 28�53.89¢N 89�26.04¢W 2 13 24.1 8.5 31.00 1561MRP3 22 May 28�28.50¢N 89�51.20¢W 0 168 24.1 33.6 3.65 608MRP7 27 May 28�52.79¢N 89�23.62¢W 2 8 26.5 23.5 29.20 1261MRP9 29 May 28�04.04¢N 89�11.80¢W 0 1140 27.7 33.4 1.84 339
Coastal Texas samples, June 2001LLM 28 June 26�23.20¢N 97�20.20¢W 2 33.0 28.2 0.40 1202GoM 18 June 26�48.00¢N 96�50.00¢W 8 29.0 33.0 0.20 299
SE Gulf of Mexico, Florida Strait, May 20021 2 May 24�50.92¢N 83�21.14¢W 0 65 26.8 36.2 0.07 4192 3 May 24�40.90¢N 85�34.06¢W 0 3780 27.6 36.3 0.10 4153 5 May 24�48.39¢N 83�31.42¢W 0 65 27.4 36.2 0.08 3834 6 May 24�07.81¢N 84�05.87¢W 0 2200 27.8 36.0 0.05 2325 7 May 24�16.85¢N 82�06.89¢W 0 244 27.2 36.4 0.11 415
SE Gulf of Mexico, Florida Strait, August 2002a
A 2 August 24�05.15¢N 81�06.64¢W 90 1025 26.5 36.5 0.22 199B 3 August 23�55.76¢N 83�23.96¢W 66 1043 22.7 36.5 0.24 385C 4 August 24�23.29¢N 82�20.76¢W 26 65 22.1 36.5 0.52 298D 5 August 24�07.67¢N 81�13.01¢W 59 980 26.5 36.4 0.23 312
a All samples taken from depth of chlorophyll maximum
Table 2 Bacterioplankton composition by DNA subpopulations in different regions of the Gulf of Mexico (percent contribution to totalbacteria abundance ± SD)
Region Group 1 Group 2 Group 3 Group 4 Number
Mississippi River plume 51.4±8.2 15.2±1.5 25.0±4.2 8.5±3.3 4Northern Gulf (GoM) 51.0 20.8 16.7 11.5 1Laguna Madre (LLM) 15.8 11.8 67.7 4.6 1SE Gulf of Mexico, surface 34.9±9.7 25.5±2.1 25.3±9.2 14.3±3.0 5SE Gulf of Mexico, subsurface 31.5±4.9 25.3±4.3 29.6±1.9 13.6±1.4 4
1216

In most experiments in the Mississippi River plume,GoM, Laguna Madre and the subsurface chlorophyllmaximum in the southeast Gulf of Mexico, group 4bacteria with the highest DNA content exhibited thehighest growth rates, mostly but not always followed bygroup 3 bacteria (Fig. 4) In surface waters of thesoutheast Gulf of Mexico, this trend was less obvious,and sometimes group 3 bacteria had higher growth ratesthan group 4 bacteria. Some experiments revealedgroup 2 bacteria having a higher growth rate than themore DNA containing group 3 bacteria (stations 2, C,MRP3, MRP9) or even group 4 bacteria (stations 3, 4).Group 1 bacteria exhibited the lowest growth ratesamong all subpopulations in 7 of 11 experiments wherethis subpopulation computed valid serial dilution re-sults. In 3 experiments, group 1 bacteria had highergrowth rates than group 2 or 3 bacteria. In the fourthexperiment (station 5), only two of the four DNA
groups computed significant serial dilution regressions;however, since the growth rates of both populations,including group 1 bacteria, were higher than the totalpopulation growth rate, the missing (not-computed)groups must have had a growth rate lower than the totaland, thus, a lower than group 1 growth rate. In 7 of the11 experiments, group 1 bacteria exhibited a positivegrowth rate.
Grazing losses of the total bacterioplankton amoun-ted to 0.36±0.06 day�1 in the Mississippi River plume,0.37 day�1 in Laguna Madre, 0.45 day�1 at GoM, and0.47±0.06 day�1 in the subsurface layer of the southeastGulf of Mexico. Total bacteria grazing losses in thesurface layer of the southeast Gulf of Mexico varied,ranging from 0.16 to 0.69 day�1 (Fig. 5). Concomitantwith highest growth rates, grazing rates were highest inthe subsurface chlorophyll maximum in the southeastGulf of Mexico. Total bacterioplankton grazing losses
Fig. 3 Composition ofbacterioplankton by DNAgroups
Fig. 4 Gross growth rates (perday) of total bacterioplankton(bars) and DNA groups(symbols). Some groups did notcompute valid serial dilutionresults in some experiments
1217

were related to total population growth rates (r2=0.30,P=0.03, n=15).
Grazing losses of DNA groups varied from unde-tectable to 1.66 day�1. In most experiments in thesoutheast Gulf of Mexico (surface and chlorophyllsubsurface maximum waters), group 4 bacteria experi-enced the lowest grazing loss (<0.2 day�1) among DNAgroups (Fig. 5). In contrast, group 4 bacteria experi-enced high grazing losses of 0.3–1.27 day�1 in thenorthern Gulf of Mexico (GoM, MRP) and LagunaMadre. In half of the experiments in which group 1bacteria computed valid serial dilution results, thisgroup experienced the highest loss rates among DNAgroups, and in all but one experiment, group 1 bacteriaexperienced a significant grazing loss. Loss rates ofDNA groups were not related to either growth rates orinitial abundance of DNA groups (regression analysis,P>0.05; data not shown).
For most experiments, total bacterioplankton growthwas balanced by loss rates, resulting in net growth ratesof –0.18 to 0.45 day�1 (Fig. 6). Net growth rates ofDNA groups differed substantially and tended to behighest for group 4 bacteria in most experiments. Thechlorophyll subsurface maximum layer experiments inthe southeast Gulf of Mexico exhibited the clearesttrend: group 1 bacteria showed negative net growthrates (–0.6 to –1.3 day�1), which were related to lowgrowth rates rather than high grazing losses. In contrast,highest net growth rates of group 4 bacteria (1.2–1.5day�1) were related to low mortality rates. Groups 2 and3 had net growth rates similar to each other that re-flected close balance between growth and mortalityrates. Negative net growth rates for group 1 bacteriaalso were found at three of four Mississippi River plumestations, GoM, and one of the southeast Gulf surfacestations. These low net growth rates also were related to
Fig. 5 Grazing rates (per day)of total bacterioplankton (bars)and DNA groups (symbols).Some groups did not computevalid serial dilution results insome experiments
Fig. 6 Net growth rates(growth rate – grazing rate; perday) of total bacterioplankton(bars) and DNA groups(symbols). Some groups did notcompute valid serial dilutionresults in some experiments
1218

low growth and significant mortality rates, particularlyat MRP3 and MRP7 where group 1 bacteria experi-enced the highest grazing pressure among all DNAgroups. Groups 2 and 3 bacteria exhibited net growthrates between groups 1 and 4, but net growth rates ofgroup 3 bacteria were not generally higher than those ofgroup 2 bacteria.
Discussion
Cytometric analysis of bacterioplankton revealed theoccurrence of bacteria groups distinguished by apparentDNA content and cell size. Although the number ofclearly separated clusters seems to depend on the systemunder study, three to four subpopulations were usuallyrecorded in offshore waters (Li et al. 1995; Marie et al.1997; Jochem 2001; Zubkov et al. 2001; this study). Itmight be disputed whether observed differences in DNAfluorescence reflect different groups of bacteria or dif-ferent stain penetration due to dye characteristics andphysiological state of the populations (Li et al. 1995).Similar bacteria DNA types could, however, be distin-guished by a variety of DNA dyes, including a suite ofnew cyanine dyes as well as DAPI, and from a variety ofmarine and freshwater systems ranging from oligo-trophic high-mountain lakes to eutrophic reservoirs andfrom estuaries to open oceans (Gasol and del Giorgio2000). The presence of varying shares of bacteria char-acterized by their different DNA content seems to be aubiquitous, natural phenomenon with ecological mean-ing rather than a preparation artifact (Marie et al. 1997).
Not all clusters may be present at all times or sta-tions. For example, Marie et al. (1997) found two of thethree clusters described by Li et al. (1995), and a thirdcluster not described by the latter authors. Jochem(2001) did not find a particular cluster described by Liet al. (1995) and Marie et al. (1997) but did find anadditional cluster not described by either. One clusterdescribed by Marie et al. (1997), but not Li et al. (1995),was separated into two distinct clusters by Jochem(2001). Based on the occurrence of at least two clustersin all cytometric analyses of bacterioplankton, theseclusters were termed ‘‘low-DNA’’ and ‘‘high-DNA’’bacteria (Gasol and del Giorgio 2000). Among the fourclusters presented in this study, groups 1 and 2 wouldfall into the low-DNA and groups 3 and 4 into the high-DNA categories.
The recurrent presence of four DNA groups at allstudy sites might present a surprising peculiarity of theGulf of Mexico, and the number of discernible DNAgroups may vary with environment. Samples from theGulf Stream region off the Florida coast prepared by thesame protocol exhibited only three DNA groups butsamples from central Florida Bay exhibited seven groups(F.J. Jochem, unpublished data). More importantly,comparisons with other studies must be performed withcaution since protocols with and without RNAse treat-ment prior to DNA staining were applied. DNA dyes
used to assess the role of low- and high-DNA bacteria(SYBR Green I and II, PicoGreen, SYTO-13, To-Pro;Molecular Probes, Eugene, Ore.) stain both DNA andRNA (Haugland 2001). Studies reporting only two dis-tinct bacterial cluster did not report use of RNAse (e.g.Gasol et al. 1999; Servais et al. 1999; Yanada et al. 2000;Vaque et al. 2001; Lebaron et al. 2002). Studies report-ing more than two DNA groups, however, appliedRNAse prior to staining (Li et al. 1995; Marie et al.1997; Troussellier et al. 1999; Jochem 2001; Zubkovet al. 2001; this study). The –RNAse/+RNAse fluores-cence ratio in cultured bacteria of 1.89 to 5.48, with thehighest ratios during exponential growth and the lowestratio during stationary phase (calculated from Table 1of Troussellier et al. 1999) corresponds to higher cellularRNA concentrations and RNA/DNA ratios in faster-growing bacteria (Kemp et al. 1993; Kerkhof and Ward1993) and the RNA/DNA ratio of 1.8 reported in slow-growing bacteria (Kato 1994). In studies withoutRNAse treatment, fluorescence from RNA-dye com-plexes might obstruct differences in the true cellularDNA content. Therefore, these studies should refer tolow- and high-nucleic-acid cells rather than low- andhigh-DNA cells (Lebaron et al. 2002), and the physio-logical and ecological significance of low-/high-nucleic-acid cells might differ from low-/high-DNA cells.
In all but the Laguna Madre experiments, low-DNAgroup 1 bacteria were the most abundant cluster, fol-lowed by group 2 and 3 bacteria with similar shares (25–30%) and the highest DNA group 4 bacteria with<15% of total bacteria abundance. Laguna Madrediffered by group 3 bacteria contributing 68% of totalbacteria. Group 1 bacteria are better adapted to oligo-trophic conditions and exhibit decreasing shares towardthe coast and riverine nutrient input (Li et al. 1995;Casotti et al. 2000). Although their dominance in theoligotrophic Gulf of Mexico waters complies with thesereports, decreasing trends toward the river mouth in theMississippi River plume were absent (Jochem 2001).Group 3 bacteria, in contrast, become dominant incoastal waters with riverine input (Casotti et al. 2000)and were the dominant fraction in the English Channel(Marie et al. 1997). Laguna Madre experienceslow water exchange with the Gulf of Mexico (residencetime >1 year; Shormann 1992). While high evaporationand low precipitation often cause hypersaline conditions(Armstrong 1987), strong rain events can lower salinity.Salinity at LLM during this study was 28.2&, arelatively low value for the lagoon pointing toward re-cent freshwater runoffs, confirmed by cumulative rain-fall data for adjacent Baffin Bay (Conrad BlucherInstitute, Texas A&M University, Corpus Christi,Texas; http://dco.cbi.tamucc.edu).
Although serial dilution experiments have inherentproblems related to whether the underlying assumptions(Landry and Hassett 1982) are met, a question not al-ways straightforward to assess (Vaque et al. 1994), theyrepresent the most feasible technique to address micro-bial in situ growth and grazing rates. One primary
1219
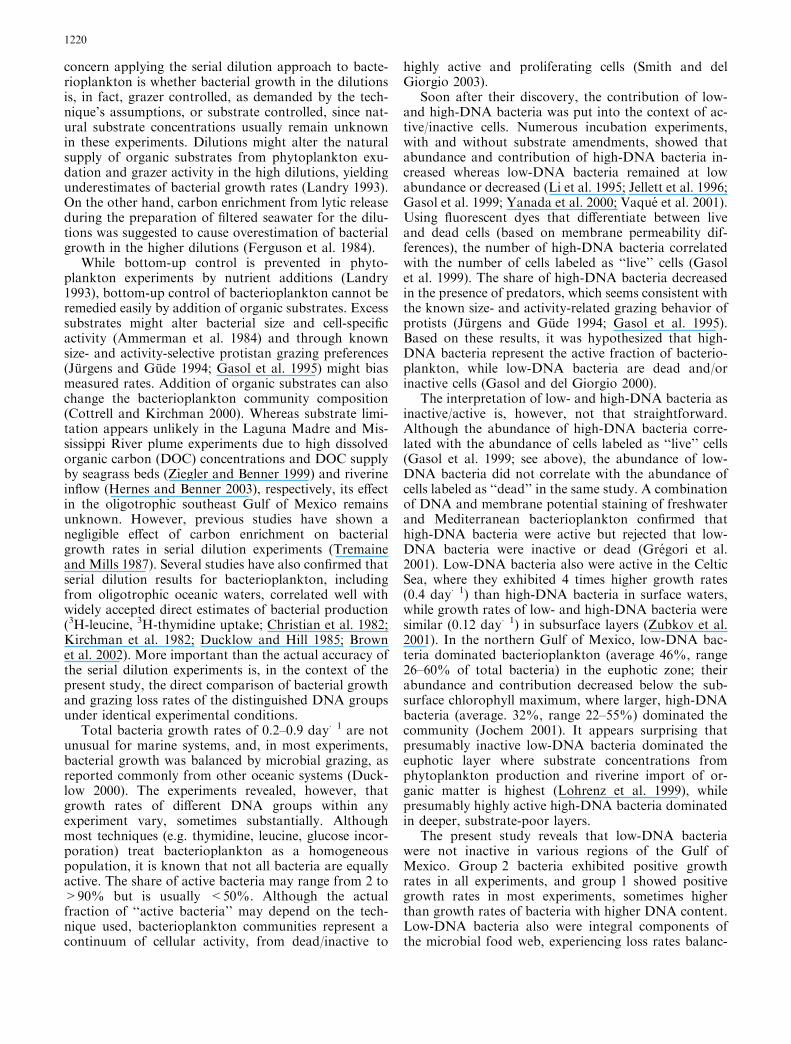
concern applying the serial dilution approach to bacte-rioplankton is whether bacterial growth in the dilutionsis, in fact, grazer controlled, as demanded by the tech-nique’s assumptions, or substrate controlled, since nat-ural substrate concentrations usually remain unknownin these experiments. Dilutions might alter the naturalsupply of organic substrates from phytoplankton exu-dation and grazer activity in the high dilutions, yieldingunderestimates of bacterial growth rates (Landry 1993).On the other hand, carbon enrichment from lytic releaseduring the preparation of filtered seawater for the dilu-tions was suggested to cause overestimation of bacterialgrowth in the higher dilutions (Ferguson et al. 1984).
While bottom-up control is prevented in phyto-plankton experiments by nutrient additions (Landry1993), bottom-up control of bacterioplankton cannot beremedied easily by addition of organic substrates. Excesssubstrates might alter bacterial size and cell-specificactivity (Ammerman et al. 1984) and through knownsize- and activity-selective protistan grazing preferences(Jurgens and Gude 1994; Gasol et al. 1995) might biasmeasured rates. Addition of organic substrates can alsochange the bacterioplankton community composition(Cottrell and Kirchman 2000). Whereas substrate limi-tation appears unlikely in the Laguna Madre and Mis-sissippi River plume experiments due to high dissolvedorganic carbon (DOC) concentrations and DOC supplyby seagrass beds (Ziegler and Benner 1999) and riverineinflow (Hernes and Benner 2003), respectively, its effectin the oligotrophic southeast Gulf of Mexico remainsunknown. However, previous studies have shown anegligible effect of carbon enrichment on bacterialgrowth rates in serial dilution experiments (Tremaineand Mills 1987). Several studies have also confirmed thatserial dilution results for bacterioplankton, includingfrom oligotrophic oceanic waters, correlated well withwidely accepted direct estimates of bacterial production(3H-leucine, 3H-thymidine uptake; Christian et al. 1982;Kirchman et al. 1982; Ducklow and Hill 1985; Brownet al. 2002). More important than the actual accuracy ofthe serial dilution experiments is, in the context of thepresent study, the direct comparison of bacterial growthand grazing loss rates of the distinguished DNA groupsunder identical experimental conditions.
Total bacteria growth rates of 0.2–0.9 day�1 are notunusual for marine systems, and, in most experiments,bacterial growth was balanced by microbial grazing, asreported commonly from other oceanic systems (Duck-low 2000). The experiments revealed, however, thatgrowth rates of different DNA groups within anyexperiment vary, sometimes substantially. Althoughmost techniques (e.g. thymidine, leucine, glucose incor-poration) treat bacterioplankton as a homogeneouspopulation, it is known that not all bacteria are equallyactive. The share of active bacteria may range from 2 to>90% but is usually <50%. Although the actualfraction of ‘‘active bacteria’’ may depend on the tech-nique used, bacterioplankton communities represent acontinuum of cellular activity, from dead/inactive to
highly active and proliferating cells (Smith and delGiorgio 2003).
Soon after their discovery, the contribution of low-and high-DNA bacteria was put into the context of ac-tive/inactive cells. Numerous incubation experiments,with and without substrate amendments, showed thatabundance and contribution of high-DNA bacteria in-creased whereas low-DNA bacteria remained at lowabundance or decreased (Li et al. 1995; Jellett et al. 1996;Gasol et al. 1999; Yanada et al. 2000; Vaque et al. 2001).Using fluorescent dyes that differentiate between liveand dead cells (based on membrane permeability dif-ferences), the number of high-DNA bacteria correlatedwith the number of cells labeled as ‘‘live’’ cells (Gasolet al. 1999). The share of high-DNA bacteria decreasedin the presence of predators, which seems consistent withthe known size- and activity-related grazing behavior ofprotists (Jurgens and Gude 1994; Gasol et al. 1995).Based on these results, it was hypothesized that high-DNA bacteria represent the active fraction of bacterio-plankton, while low-DNA bacteria are dead and/orinactive cells (Gasol and del Giorgio 2000).
The interpretation of low- and high-DNA bacteria asinactive/active is, however, not that straightforward.Although the abundance of high-DNA bacteria corre-lated with the abundance of cells labeled as ‘‘live’’ cells(Gasol et al. 1999; see above), the abundance of low-DNA bacteria did not correlate with the abundance ofcells labeled as ‘‘dead’’ in the same study. A combinationof DNA and membrane potential staining of freshwaterand Mediterranean bacterioplankton confirmed thathigh-DNA bacteria were active but rejected that low-DNA bacteria were inactive or dead (Gregori et al.2001). Low-DNA bacteria also were active in the CelticSea, where they exhibited 4 times higher growth rates(0.4 day�1) than high-DNA bacteria in surface waters,while growth rates of low- and high-DNA bacteria weresimilar (0.12 day�1) in subsurface layers (Zubkov et al.2001). In the northern Gulf of Mexico, low-DNA bac-teria dominated bacterioplankton (average 46%, range26–60% of total bacteria) in the euphotic zone; theirabundance and contribution decreased below the sub-surface chlorophyll maximum, where larger, high-DNAbacteria (average. 32%, range 22–55%) dominated thecommunity (Jochem 2001). It appears surprising thatpresumably inactive low-DNA bacteria dominated theeuphotic layer where substrate concentrations fromphytoplankton production and riverine import of or-ganic matter is highest (Lohrenz et al. 1999), whilepresumably highly active high-DNA bacteria dominatedin deeper, substrate-poor layers.
The present study reveals that low-DNA bacteriawere not inactive in various regions of the Gulf ofMexico. Group 2 bacteria exhibited positive growthrates in all experiments, and group 1 showed positivegrowth rates in most experiments, sometimes higherthan growth rates of bacteria with higher DNA content.Low-DNA bacteria also were integral components ofthe microbial food web, experiencing loss rates balanc-
1220

ing population growth. Loss rates of group 1 weresometimes higher than those of high-DNA bacteria,indicating that protistan grazers did not discriminateagainst low-DNA bacteria.
Protistan grazing is, however, not the only microbialprocess affecting bacterial populations. Viral attack hasbeen discussed recently as another major impact onbacterioplankton communities. While some studies re-vealed that viral attack had a minor effect compared toprotistan grazing activity (e.g. Bettarel et al. 2003; Choiet al. 2003), other studies revealed a major populationcontrol by viral lysis (e.g. Furhman and Noble 1995;Steward et al. 1996; Fisher and Velimirov 2002). Effectsof viral attack appear to be more significant in eutrophicwaters (Weinbauer and Peduzzi 1995). Originally de-signed to assess prey (bacterial, algal) loss rates relatedto protistan grazing activity, serial dilution experimentscannot distinguish prey population losses from viralinfection and protistan grazing activity. Thus, the ulti-mate role of virus attack must remain unknown for thepresent study, as for most similar studies. Some cautionmust, therefore, be applied in interpreting presented lossrates as pure protistan grazing, but in any case, protistangrazing or viral lysis, results demonstrate that low-DNAbacteria are subjected to biological loss processes asmuch as bacteria with higher DNA content. Taking viralattack into account would further sustain the notionthat low-DNA bacteria are not inactive or dead cellssince viruses preferably attack metabolically activebacteria, as reflected by the correlation of viral to bac-terial abundances and production (e.g. Weinbauer andPeduzzi 1995; Steward et al. 1996).
Whereas total bacterioplankton loss rates were re-lated to total bacterioplankton growth rates, those ofDNA groups were not. Grazing impact on DNA groupsmight be affected by grazer population composition. Inthe northern Gulf (MRP, GoM, LLM), group 4 bacteriawere grazed more strongly (0.58±0.40 day�1) relative togrowth rates and abundance than in the southeast Gulf(0.15±0.04 day�1), although they did not represent alarge proportion of total bacteria abundance (they mayhave with respect to total biomass, though). Both GoMand LLM exhibited low concentrations of heterotrophicnanoflagellates (HNF), and micro-grazers were domi-nated by oligotrich ciliates (P.J. Lavrentyev, unpub-lished data). These ciliates may be better equipped tograze on large cells than HNF, or they may graze less onsmall cells because of physiological constraints.
The reasons for the negative growth rates of group 1bacteria in the chlorophyll subsurface layer of thesoutheast Gulf of Mexico remain unknown. Negativegrowth rates may indicate that these small, low-DNAbacteria were indeed inactive, senescent, or subject toviral attack. They also may have been outcompeted byother bacteria groups in the subsurface layers. Thepredominance of group 1 bacteria in the surface layercorresponds to their higher surface area to volume ratio,which makes small bacteria better competitors for lim-ited resources in oligotrophic surface layers (Button
1998). This competitive advantage may be lost in thesubsurface chlorophyll maximum layer, which exhibitshigher resource concentrations, both nutrients and per-haps DOC from phytoplankton production. Sincegroup 1 bacteria contributed about a third of totalbacteria abundance and were exposed to active grazing(loss rates of 0.03–0.73 day�1), it is likely that they hadpositive growth rates prior to the study period to havesustained their share of the bacterioplankton commu-nity.
The interpretation of DNA clusters as active andinactive cells has been supported by substrate uptakeexperiments. Bacterial production, measured by thymi-dine or leucine uptake, correlated closer to high-DNAbacteria abundance than to total bacteria, and high-DNA bacteria accounted for the majority of substrateuptake (Jellett et al. 1996; Servais et al. 1999; Vaqueet al. 2001). Incubation with 3H-thymidine or leucineand subsequent cell sorting by flow cytometry revealed5–10 times higher cell-specific substrate uptake rates inhigh-DNA bacteria compared to low-DNA bacteria(Jellett et al. 1996; Servais et al. 1999; Lebaron et al.2001). It was concluded that high-DNA bacteria repre-sent the metabolically and biogeochemically activefraction of bacterioplankton, and the percent of high-DNA bacteria was suggested as an ‘‘active cell index’’ towhich, rather than total bacteria abundance, biogeo-chemical process measurements should be related (Jellettet al. 1996; Gasol et al. 1999; Lebaron et al. 2001; Vaqueet al. 2001).
Since larger, high-DNA bacteria contain about 5times more DNA (Jellett et al. 1996) and protein (Zub-kov et al. 2001) compared to smaller, low-DNA bacte-ria, high-DNA bacteria also need to double 5 times moreDNA and protein for a single cell division. Thus, toattain similar growth rates (doubling rates), cell-specificactivity of high-DNA bacteria must be substantiallyhigher than that of low-DNA bacteria. Higher cell-spe-cific activity does not, therefore, imply that low-DNAbacteria are less active or inactive, and in this contextactivities should be related to DNA groups’ biomassrather than abundance. In fact, high-DNA bacteria insubsurface layers of the Celtic Sea exhibited higher cell-specific methionine uptake rates, but biomass-specificuptake rates were not higher in high-DNA cells. Insurface layers, both cell- and biomass-specific uptakerates of high-DNA bacteria were lower than those oflow-DNA bacteria, disproving low-DNA bacteria to beinactive (Zubkov et al. 2001).
Relating biogeochemical process measurements tohigh-DNA bacteria rather than to total bacteria may bea misleading conclusion. While high-DNA bacteria maycontribute more to total bacterial production/activity,smaller and/or slower-growing bacteria still can mediatesignificant biogeochemical processes. Certain bacteriagroups, such as Planctomycetales (DeLong et al. 1993)or nitrifying bacteria (Ward 1986; Fenchel et al. 1998),are known for slow growth rates. Nevertheless, nitrify-ing bacteria are biogeochemically important in the
1221

Mississippi River plume and can contribute substantiallyto total bacterial production (Pakulski et al. 2000). Thebetter correlation of high-DNA bacteria to total bacte-rial production is not surprising and is an effect of cellsize, not growth rate or activity. Since larger bacterianeed to exhibit higher cell-specific activities to attainsimilar growth rates to smaller bacteria, larger cells musthave a greater proportional contribution to total com-munity activity.
This concept is demonstrated by an example usingdata from station 4. Group 1 bacteria were about 3times as abundant as group 4 bacteria (95.8 vs 33.8·103cells ml�1) and exhibited a similar growth rate (0.57day�1) compared to group 4 (0.54 day�1) and totalbacteria (0.54 day�1). Bacteria cells were not sized in thesoutheast Gulf of Mexico, but assuming bacteria sizescomparable to the northern Gulf of Mexico, cell vol-umes of group 1, group 4, and average volume of bac-teria would amount to 0.014, 0.26, and 0.04 lm3,respectively (Jochem 2001). The average bacterial cellvolume of 0.04 lm3 corresponds to average bacteria cellvolumes reported from various oceanic systems (Duck-low 2000 and references therein). Converting bacteriacell volume and abundance into bacterial carbon bio-mass [picograms carbon per cell =0.12· volume0.7; de-rived by Norland (1993) from data of Simon and Azam(1989)] results in 0.57, 1.58, and 2.93 lg C l�1 forgroup 1, group 4, and total bacteria, respectively. Theresulting ratio of cellular carbon biomass of group 1 and4 bacteria (6.0 and 46.7 fg C cell�1) of 7.8 correspondsto the protein and biomass ratios between low- andhigh-DNA bacteria reported previously (Zubkov et al.2001; Lebaron et al. 2002). Average cellular biomass of12.6 fg C cell�1 lies within the published range (Ducklow2000).
Based on the model of exponential growth, grossproduction can be derived from initial biomass andgrowth rate by P=B0·el–B0 and amounts to 0.44, 1.13,and 2.10 lg C l�1 day�1 for group 1, group 4, and totalbacteria, respectively. While these values are not in-tended to represent in situ bacterial production, theyallow comparison of the relative contribution of DNAgroups to total production. Although group 4 bacteriaaccounted for only 15% of total bacteria in this exper-iment, they contributed 54% to both total bacterialcarbon biomass and production. In turn, group 1 bac-teria, representing 41% of total cells, contributed only21% of total bacterial production. The difference in cell-specific production (33.4 fg C cell�1 day�1 for high-DNA bacteria and 4.6 fg C cell�1 day�1 for low-DNAbacteria; ratio 7.3) corresponds to a difference of 7.6 incell-specific leucine uptake between small, low-DNAbacteria and high-DNA bacteria as reported by Lebaronet al. (2002). However, the biomass-specific production(P/B=0.7) did not differ among low-DNA, high-DNA(groups 1, 4), and total bacteria.
The interpretation of the presented results assumesthat DNA groups are more or less discrete, and indi-vidual bacterial cells do not switch from one group to
another by DNA replication or DNA reduction uponcell division (e.g. from one chromosomal set, 1N, to twochromosomal sets, 2N, or vice versa). Distances in DNAfluorescence peaks between DNA groups of about three-fold appear too far to move individual cells from oneDNA group to the next by DNA replication (1N to 2N).While some bacteria seem to remain in either 1N or 2Nstates independent of growth conditions, other speciesmay produce multiple sets of chromosomes (up to 6N;Lebaron and Joux 1994; Akerlund et al. 1995) thatmight move them among distinguished DNA groups.However, polyploid status in bacteria seems to dependon high-growth, high-substrate conditions (Akerlundet al. 1995). These conditions are unlikely to beencountered in an oligotrophic natural environmentsuch as the Gulf of Mexico, as supported by moderateoverall and group-specific gross growth rates in thisstudy. Furthermore, under conditions of polyploidy, 1Nand 2N cells remain the majority of the populations(Lebaron and Joux 1994; Akerlund et al. 1995), and ahigh degree of polyploidy among a natural, mixedpopulation of bacteria with inherently different species-specific DNA content (e.g. Schut et al. 1993) wouldproduce a continuous spectrum of cellular DNA fluo-rescence, which would prevent clear distinction of DNAgroups as documented for all experiments in the Gulf ofMexico.
On the other hand, starvation has been suggested toreadjust bacterial DNA content to 1N, or lower than 1Nby DNA loss by leakage and/or degradation (Hoodet al. 1986; Hoff 1989), which might move bacteria froma higher- to a lower-DNA group and, thereby, produceenhanced apparent growth rates in low-DNA groups.More recent studies revealed, however, that polyploidcells produced under high substrate conditions remainedin polyploid status under prolonged starvation (Thorsenet al. 1992; Lebaron and Joux 1994), and starvation-induced reduction in DNA fluorescence occurred onlyafter much longer incubation periods (several weeks)than experienced in the here-presented growth experi-ments (Lebaron and Joux 1994). Since DNA degrada-tion or leakage would present a continuous process, itwould, again, produce a continuous DNA fluorescencespectrum rather than distinct DNA group peaks. It ap-pears unlikely, therefore, that positive growth rates ofgroup 1 bacteria resulted from starvation of group 2bacteria. Isolation of oligotrophic bacteria by low sub-strate dilution techniques also revealed that these cellspossess a much lower (0.3–1 fg DNA cell�1) DNAcontent than the average bacteria population (>4 fgDNA cell�1; Schut et al. 1993). Low-DNA bacteria aremore likely to present a natural, living component ofmarine bacterioplankton that may escape traditionalculture attempts and are, therefore, little characterizedphysiologically and phylogenetically.
While cell cycles of individual species cannot be fol-lowed in natural, mixed populations due to lack ofappropriate methodology, and changes of individualbacterial cells from one DNA group to another by
1222

changes in ploidy cannot be excluded definitely, the littlephylogenetic information available on bacteria DNAclusters (Eilers et al. 2000; Fuchs et al. 2000; Zubkovet al. 2001, 2002) is surprisingly consistent: large, high-protein and high-DNA bacteria were dominated byRoseobacter and c-proteobacteria, whereas low-protein,high-DNA bacteria were largely composed of membersof the Cytophaga/Flavobacter clade, and small, low-DNA bacteria by SAR86. Another group of small bac-teria is the uncultivable SAR11 cluster of a-proteobac-teria (Rappe et al. 2002), and members of the genusPseudoalteromonas of the c-proteobacteria are knownfor their large genome size (Lanoil et al. 1996). Flowsorting showed that high-DNA bacteria comprised avariety of large, curved, and S-shaped cells typical for c-proteobacteria such as Vibrio spp., whereas low-DNAbacteria were small cocci (Jochem 2001; Jacquet et al.2002). Although bacteria size and shape can change withgrowth phase and nutritional conditions, the flow-sort-ing results combined with phylogenetic studies suggestthat DNA groups might comprise different consortia ofbacteria. The phylogenetic composition of DNA groupsmight, however, change with time and location.
Experiments that lend the foundation for the active/inactive interpretation of bacterial DNA clusters in-volved long-term incubations (micro-, mesocosm) run-ning for several days (Gasol et al. 1999; Lebaron et al.1999; Troussellier et al. 1999; Vaque et al. 2001). Sub-stantial changes in bacteria community compositionoccur in incubations after as little as 20 h, favoring thegrowth of Roseobacter relatives of the a-proteobacteria,and c-proteobacteria, while other a-proteobacteria,members of the Cytophaga/Flavobacter clade, anduncultured SAR86 bacteria decrease in abundance(Eilers et al. 2000; Fuchs et al. 2000; Massana et al.2001). Long incubation experiments may be biased byselectively favoring certain groups of bacteria such asRoseobacter and c-proteobacteria, which are similar tothe few cultivable species of marine bacteria and have ahigh DNA content.
In contrast to long-term micro- and mesocosmexperiments, this study addressed DNA-population-specific growth rates in relatively short incubations.Low-DNA bacteria in various regions of the Gulf ofMexico were growing actively, sometimes at rates simi-lar to or higher than those of high-DNA bacteria. Low-DNA bacteria were an integral part of the microbialfood web, showing loss rates similar to high-DNAbacteria. Conclusive clarification of whether cytometricDNA clusters of bacterioplankton host different bacte-rial consortia, if single species can shift between high-and low-DNA status, and which environmental andpopulation dynamics regulate such switches remains inneed of studies with high specificity and sensitivity.Combining cytometric flow sorting with molecular toolsto assess bacterial diversity and identity may be apromising venue (e.g. Carlson et al. 2002). Consider-ation also has to be given to the protocol assessing DNAgroups, that is, with or without RNAse treatment.
Protocols without RNAse treatment might reflect thetotal nucleic acid content rather than the DNA contentof cells. With RNA being about 5 times more abundantthan DNA in fast-growing cells, a closer correspondencebetween high-nucleic-acid cells and bacterial productionmight be expected. As to the role of low-DNA bacteria(protocols with RNAse), however, this and other studiessuggest that the interpretation of low-DNA versus high-DNA bacteria clusters as inactive and active cells mightbe oversimplified.
Acknowledgements We thank Ron Benner and John Lamkin forinviting FJJ to participate in the Mississippi River plume andsoutheast Gulf of Mexico cruises, respectively, and the captains andcrews of R.V. ‘‘Longhorn’’ and ‘‘Gordon Gunter’’ for their hos-pitality and assistance at sea. Nutrient data from the MississippiRiver plume by Mark McCarthy, and chlorophyll data by KimWilliams and CTD data by Elisabeth Johns and Ryan Smith fromthe southeast Gulf of Mexico are greatly appreciated. We aregrateful to Mark McCarthy for editorial help. Work in the Mis-sissippi River plume was supported by the Nancy and Perry BassEndowment to the University of Texas Marine Science Institute. ADean of the College of Arts and Sciences at FIU summer researchgrant supported work in the southeast Gulf of Mexico.
References
Akerlund T, Nordstrom K, Bernander R (1995) Analysis of cellsize and DNA content in exponentially growing and stationaryphase batch cultures of Escherichia coli. J Bacteriol 177:6791–6797
Ammerman JW, Fuhrman JA, Hagstrom A, Azam F (1984) Bac-terioplankton growth in seawater I. Growth kinetics and cel-lular characteristics in seawater cultures. Mar Ecol Prog Ser18:31–39
Armstrong NE (1987) The ecology of open-bay bottoms of Texas:a community profile. US Fish Wildl Serv Biol Rep 85(7.12)
Bettarel Y, Amblard C, Sime-Ngando T, Carrias JF, Sargos D,Garabetian F, Lavandier P (2003) Viral lysis, flagellate grazingpotential, and bacterial production in Lake Pavin. Microb Ecol45:119–127
Brown SL, Landry MR, Christensen S, Garrison D, Gowing MM,Bidigare RR, Campbell L (2002) Microbial communitydynamics and taxon-specific phytoplankton production in theArabian Sea during the 1995 monsoon seasons. Deep Sea Res II49:2345–2376
Button DK (1998) Nutrient uptake by microorganisms accordingto kinetic parameters from theory as related to cytoarchitecture.Microbiol Mol Biol Rev 62:636–645
Carlson GA, Giovannoni SJ, Hansell DA, Goldberg SJ, Parsons R,Otero MP, Vergin K, Wheeler BR (2002) Effect of nutrientamendments on bacterioplankton production, communitystructure, and DOC utilization in the northwestern SargassoSea. Aquat Microb Ecol 30:19–36
Casotti R, Brunet C, Aronne B, D’Alcala MR (2000) Mesoscalefeatures of phytoplankton and planktonic bacteria in a coastalarea as induced by external water masses. Mar Ecol Prog Ser195:15–27
Chin-Leo G, Benner R (1992) Enhanced bacterioplankton pro-duction and respiration at intermediate salinities in the Mis-sissippi River plume. Mar Ecol Prog Ser 87:87–103
Choi DH, Hwang CY, Cho BC (2003) Comparison of virus- andbacterivory-induced bacterial mortality in the eutrophic MasanBay, Korea. Aquat Microb Ecol 30:117–125
Christian RR, Hanson RB, Newell SY (1982) Comparison ofmethods for measurement of bacterial growth rates in mixedbatch cultures. Appl Environ Microbiol 43:1160–1165
1223

Cottrell MT, Kirchman DL (2000) Natural assemblage of marineproteobacteria and members of the Cytophaga-Flavobactercluster consuming low- and high-molecular-weight dissolvedorganic matter. Appl Environ Microbiol 66:1692–1697
DeLong EF, Franks DG, Alldredge AL (1993) Phylogeneticdiversity of aggregate-attached vs. free-living marine bacterialassemblages. Limnol Oceanogr 38:924–934
Ducklow H (2000) Bacterial production and biomass in the oceans.In: Kirchman DL (ed) Microbial ecology of the oceans. Wiley-Liss, New York, pp 85–120
Ducklow HW, Hill SM (1985) The growth of heterotrophic bac-teria in the surface waters of warm core rings. Limnol Oceanogr30:239–259
Eilers H, Pernthaler J, Amann R (2000) Succession of pelagicmarine bacteria during enrichment: a close look at cultivation-induced shifts. Appl Environ Microbiol 66:4634–4640
Fenchel T, King GM, Blackburn TH (1998) Bacterial biogeo-chemistry. Academic Press, San Diego, Calif.
Ferguson RL, Buckley EN, Palumbo AV (1984) Response ofmarine bacterioplankton to differential filtration and confine-ment. Appl Environ Microbiol 47:49–55
Fisher UR, Velimirov B (2002) High control of bacterial produc-tion by viruses in a eutrophic oxbow lake. Aquat Microb Ecol27:1–12
Fuchs BM, Zubkov MV, Sahm K, Burkill PH, Amann R (2000)Changes of community composition during dilution cultures ofmarine bacterioplankton as assessed by flow cytometric andmolecular biological techniques. Environ Microbiol 2:191–201
Furhman JA, Noble RT (1995) Viruses and protists cause similarbacterial mortality in coastal seawater. Limnol Oceanogr40:1236–1242
Gasol JM, del Giorgio PA (2000) Using flow cytometry for countingnatural planktonic bacteria and understanding the structure ofplanktonic bacterial communities. Sci Mar 64:197–224
Gasol JM, Duarte CM (2000) Comparative analyses in aquaticmicrobial ecology: how far do they go? FEMS Microbiol Ecol31:99–106
Gasol JM, del Giorgio PA, Massana R, Duarte CM (1995) Activeversus inactive bacteria: size-dependence in a coastal marineplankton community. Mar Ecol Prog Ser 128:91–97
Gasol JM, Zweifel U, Peters F, Fuhrman JA, Hagstrom A (1999)Significance of size and nucleic acid content heterogeneity asmeasured by flow cytometry in natural planktonic bacteria.Appl Environ Microbiol 65:4475–4483
Giovannoni S, Rappe M (2000) Evolution, diversity, and molecularecology of marine prokaryotes. In: Kirchman DL (ed) Micro-bial ecology of the oceans. Wiley-Liss, New York, pp 47–84
Gregori G, Citterio S, Ghiani A, Labra M, Sgorbati S, Brown S,Denis M (2001) Resolution of viable and membrane-compro-mised bacteria in freshwater and marine waters based on ana-lytical flow cytometry and nucleic acid double staining. ApplEnviron Microbiol 67:4662–4670
Haugland RP (2001) Handbook of fluorescent probes and researchproducts, 8th edn. ( CD-ROM) Molecular Probes, Eugene, Ore.
Hernes PJ, Benner R (2003) Photochemical and microbial degra-dation of dissolved lignin phenols: implications for the fate ofterrigenous DOM in marine environments. J Geophys ResOceans 108(C9) 3291. DOI 10.1029/2002JC001421
Hoff KA (1989) Survival of Vibrio anguillarum and Vibrio sal-monicida at different salinities. Appl Environ Microbiol55:1775–1786
Hood MA, Guckert JB, White DC, Deck F (1986) Effect ofnutrient depravation on lipid, carbohydrate, DNA, RNA, andprotein levels in Vibrio cholerae. Appl Environ Microbiol52:788–793
Jacquet S, Havskum H, Thingstad TF, Vaulot D (2002) Effect ofinorganic and organic nutrient addition on a coastal microbialcommunity (Isefjord, Denmark). Mar Ecol Prog Ser 228:3–14
Jellett JF, Li WKW, Dickie PM, Boraie A, Kepkay PE (1996)Metabolic activity of bacterioplankton communities assessed byflow cytometry and single carbon substrate utilization. MarEcol Prog Ser 136:213–225
Jochem FJ (2001) Morphology and DNA content of bacterio-plankton in the northern Gulf of Mexico: analysis by epifluo-rescence microscopy and flow cytometry. Aquat Microb Ecol25:179–194
Jurgens K, Gude H (1994) The potential importance of grazing-resistant bacteria in planktonic systems. Mar Ecol Prog Ser112:169–188
Kato K (1994) Planktonic bacterial DNA and RNA synthesis fromalgal extracellular products in a eutrophic lake. FEMS Micro-biol Ecol 15:291–298
Kemp PF, Lee S, LaRoche J (1993) Estimating the growth rate ofslowly growing marine bacteria from RNA content. ApplEnviron Microbiol 59:2594–2601
Kerkhof L, Ward BB (1993) Comparison of nucleic acid hybrid-ization and fluorometry for measurement of the relationshipbetween RNA/DNA ratio and growth rate in a marine bacte-rium. Appl Environ Microbiol 59:1303–1309
Kirchman DL, Ducklow H, Mitchell R (1982) Estimates of bac-terial growth from changes in uptake rates and biomass. ApplEnviron Microbiol 44:1296–1307
Landry MR (1993) Estimating rates of growth and grazingmortality of phytoplankton by the dilution method. In: KempPF, Sherr BF, Sherr EB, Cole JJ (eds) Handbook of methodsin aquatic microbial ecology. Lewis, Boca Raton, Fla., pp715–722
Landry MR, Hassett RP (1982) Estimating the grazing impact ofmarine microzooplankton. Mar Biol 67:283–288
Lanoil BD, Ciufettii LM, Giovannoni SJ (1996) Pseudoalteromonashaloplanktis has a complex genome structure composed of twoseparate genetic units. Genome Res 6:1160–1169
Lebaron P, Joux F (1994) Flow cytometric analysis of the cellularDNA content of Salmonella typhimurium and Alteromonashaloplanktis during starvation and recovery in seawater. ApplEnviron Microbiol 60:4345–4350
Lebaron P, Servais P, Troussellier M, Courties C, Vives-Rego J,Muyzer G, Bernard L, Guindulain T, Schafer H, StackebrandtE (1999) Changes in bacterial community structure in seawatermesocosms differing in their nutrient status. Aquat Microb Ecol19:255–267
Lebaron P, Servais P, Agogue H, Courties C, Joux F (2001)Does the high nucleic acid content of individual bacterialcells allow us to discriminate between active cells and inactivecells in aquatic systems? Appl Environ Microbiol 67:1775–1782
Lebaron P, Servais P, Baudoux AC, Bourrain M, Courties C,Parthuisot N (2002) Variations of bacterial-specific activity withcell size and nucleic acid content assessed by flow cytometry.Aquat Microb Ecol 28:131–140
Li WKW, Jellett JF, Dickie PM (1995) DNA distributions inplanktonic bacteria stained with TOTO or TO-PRO. LimnolOceanogr 40:1485–1495
Lohrenz SE, Fahnenstiel GL, Redalje DG, Lang GA, Dagg MJ,Whitledge TE, Dortch Q (1999) Nutrients, irradiance andmixing as factors regulating primary production in coastalwaters impacted by the Mississippi River plume. Cont Shelf Res19:1113–1141
Marie D, Partensky F, Jacquet S, Vaulot D (1997) Enumerationand cell cycle analysis of natural populations of marine pico-plankton by flow cytometry using the nucleic acid stain SYBRGreen I. Appl Environ Microbiol 63:186–193
Massana R, Pedros-Alio C, Casamayor EO, Gasol JM (2001)Changes in marine bacterioplankton phylogenetic compositionduring incubations designed to measure biogeochemically sig-nificant processes. Limnol Oceanogr 46:1181–1188
Norland S (1993) The relationship between biomass and volume ofbacteria. In: Kemp PF, Sherr BF, Sherr EB, Cole JJ (eds)Handbook of methods in aquatic microbial ecology. Lewis,Boca Raton, Fla., pp 303–307
Pakulski JD, Benner R, Whitledge T, Amon R, Eadie B, CifuentesL, Ammerman J, Stockwell D (2000) Microbial metabolism andnutrient cycling in the Mississippi and Atchafalaya Riverplumes. Estuar Coast Shelf Sci 50:173–184
1224

Rappe MS, Connon SA, Vergin KL, Giovannoni SJ (2002) Culti-vation of the ubiquitous SAR11 marine bacterioplankton clade.Nature 418:630–633
Schut F, de Vries EJ, Gottschal JC, Robertson BR, Harder W,Prins RA, Button DK (1993) Isolation of typical marine bac-teria by dilution culture: growth, maintenance, and character-istics of isolates under laboratory conditions. Appl EnvironMicrobiol 59:2150–2160
Servais P, Courties C, Lebaron P, Trousselier M (1999) Couplingbacterial activity measurements with cell sorting by flowcytometry. Microb Ecol 38:180–189
Shormann DE (1992) The effects of freshwater inflow andhydrography on the distribution of Brown Tide in South Texas.Master’s thesis, Department of Marine Sciences, University ofTexas at Austin
Simon M, Azam F (1989) Protein content and protein synthesisrates of planktonic marine bacteria. Mar Ecol Prog Ser 51:201–213
Smith EM, del Giorgio PA (2003) Low fractions of active bacteria innatural aquatic communities? Aquat Microb Ecol 31:203–208
Steward GF, Smith DC, Azam F (1996) Abundance and produc-tion of bacteria and viruses in the Bering and Chukchi Seas.Mar Ecol Prog Ser 131:287–300
Thorsen BK, Enger A, Norland S, Hoff KA (1992) Long-termstarvation survival of Yersinia ruckeri at different salinitiesstudied by microscopical and flow cytometric methods. ApplEnviron Microbiol 58:1624–1628
Tremaine SC, Mills AL (1987) Tests of critical assumptions of thedilution method for estimating bacterivory by microeucaryotes.Appl Environ Microbiol 53:2914–2921
Troussellier M, Courties C, Lebaron P, Servais P (1999) Flow cy-tometric discrimination of bacterial populations in seawaterbased on SYTO 13 staining of nucleic acids. FEMS MicrobiolEcol 29:319–330
Vaque D, Gasol JM, Marrase C (1994) Grazing rates on bacteria:the significance of methodology and ecological factors. MarEcol Prog Ser 109:263–274
Vaque D, Casamayor EO, Gasol JM (2001) Dynamics of wholecommunity bacterial production and grazing losses in seawaterincubations as related to the changes in the proportions ofbacteria with different DNA content. Aquat Microb Ecol25:163–177
Venrick EL (1978) How many cells to count? In: Sournia A (ed)Phytoplankton manual. Monographs on oceanographic meth-odology 6. UNESCO, Paris, pp 167–180
Ward BB (1986) Nitrification in marine environments. In: Proser JI(ed) Nitrification. IRL Press, Oxford, pp 157–184
Weinbauer MG, Peduzzi P (1995) Significance of viruses versusheterotrophic nanoflagellates for controlling bacterial abun-dance in the northern Adriatic Sea. J Plankton Res 17:1851–1856
Yanada M, Yokokawa T, Lee CW, Tanaka H, Kudo I, Maita Y(2000) Seasonal variation of two different heterotrophic bacte-rial assemblages in subarctic coastal seawater. Mar Ecol ProgSer 204:289–292
Ziegler S, Benner R (1999) Dissolved organic carbon cycling in asubtropical seagrass-dominated lagoon. Mar Ecol Prog Ser180:149–160
Zubkov MV, Fuchs BM, Burkill PH, Amann R (2001) Comparisonof cellular and biomass specific activities of dominant bacte-rioplankton groups in stratified waters of the Celtic Sea. ApplEnviron Microbiol 67:5210–5218
Zubkov MV, Fuchs BM, Taran GA, Burkill PH, Amann R (2002)Mesoscale distribution of dominant bacterioplankton groups inthe northern North Sea in early summer. Aquat Microb Ecol29:135–144
1225