Acoustic Wave (TSM) Biosensors: Weighing Bacteria
44
12 Acoustic Wave (TSM) Biosensors: Weighing Bacteria Eric Olsen, Arnold Vainrub and Vitaly Vodyanoy Abstract This chapter is focused on the development and use of acoustic wave biosensor platforms for the detection of bacteria, specifically those based on the thickness shear mode (TSM) resonator. We demon- strated the mechanical and electrical implications of bacterial positioning at the solid-liquid interface of a TSM biosensor and presented a model of the TSM with bacteria attached operating as coupled oscillators. The experiments and model provide an understanding of the nature of the signals produced by acoustic wave devices when they are used for testing bacteria. The paradox of “negative mass” could be a real threat to the interpretation of experimental results related to the detection of bacteria. The knowledge of the true nature of “negative mass” linked to the strength of bacteria attachment will contribute significantly to our understanding of the results of “weighing bacteria.” The results of this work can be used for bacterial detection and control of processes of bacterial settlement, bacterial colonization, biofilm formation, and bacterial infection in which bacterial attachment plays a role. 1. Introduction Rapid, specific, sensitive detection and enumeration methods for microbial pathogens have long been a subject of research. This is especially true in the area of food-related illness prevention, where it’s estimated that over three million deaths occur annually worldwide at a cost of $6.5–34.9 billion (Buzby and Roberts 1997) due to the consumption of food products contam- inated with bacteria, bacterial toxins, or viruses (Foodborne Diseases 1997). The perceived need for instantaneous detection of pathogenic biological agents in both simple and complex matrices has increased tremendously based on the advent of sensor technologies capable of detecting macromolecules in near instantaneous or real time. To this end, specific, selective miniaturized biosensor assays that combine reliability, speed, and portability while reducing sample size and assay costs are needed to replace conventional identification techniques. Thousands of papers have been published describing a myriad of engineering approaches for microbial biodetection since 1962, when Clark and Lyons (1962) first published their essay on a reusable enzymatic electrode. These approaches are sometimes broadly categorized into optical, calorimetric, biological-biochemical, electrochemical, and acoustic wave-mass change methods. Of these, optical methods (e.g., SPR) and acoustic wave-mass change methods appear Eric Olsen • Clinical Investigation Facility, David Grant USAF Medical Center, Travis Air Base, CA. Arnold Vainrub • Department of Anatomy, Physiology, and Pharmacology, Auburn University. Vitaly Vodyanoy • Department of Anatomy, Physiology, and Pharmacology, Auburn, AL. M. Zourob et al. (eds.), Principles of Bacterial Detection: Biosensors, Recognition Receptors and Microsystems, © Springer Science+Business Media, LLC 2008 253
Transcript of Acoustic Wave (TSM) Biosensors: Weighing Bacteria

12Acoustic Wave (TSM) Biosensors: WeighingBacteria
Eric Olsen, Arnold Vainrub and Vitaly Vodyanoy
Abstract
This chapter is focused on the development and use of acoustic wave biosensor platforms for thedetection of bacteria, specifically those based on the thickness shear mode (TSM) resonator. We demon-strated the mechanical and electrical implications of bacterial positioning at the solid-liquid interface of aTSM biosensor and presented a model of the TSM with bacteria attached operating as coupled oscillators.The experiments and model provide an understanding of the nature of the signals produced by acousticwave devices when they are used for testing bacteria. The paradox of “negative mass” could be a realthreat to the interpretation of experimental results related to the detection of bacteria. The knowledge of thetrue nature of “negative mass” linked to the strength of bacteria attachment will contribute significantly toour understanding of the results of “weighing bacteria.” The results of this work can be used for bacterialdetection and control of processes of bacterial settlement, bacterial colonization, biofilm formation, andbacterial infection in which bacterial attachment plays a role.
1. Introduction
Rapid, specific, sensitive detection and enumeration methods for microbial pathogenshave long been a subject of research. This is especially true in the area of food-related illnessprevention, where it’s estimated that over three million deaths occur annually worldwide at a costof $6.5–34.9 billion (Buzby and Roberts 1997) due to the consumption of food products contam-inated with bacteria, bacterial toxins, or viruses (Foodborne Diseases 1997). The perceivedneed for instantaneous detection of pathogenic biological agents in both simple and complexmatrices has increased tremendously based on the advent of sensor technologies capable ofdetecting macromolecules in near instantaneous or real time. To this end, specific, selectiveminiaturized biosensor assays that combine reliability, speed, and portability while reducingsample size and assay costs are needed to replace conventional identification techniques.
Thousands of papers have been published describing a myriad of engineering approachesfor microbial biodetection since 1962, when Clark and Lyons (1962) first published their essayon a reusable enzymatic electrode. These approaches are sometimes broadly categorized intooptical, calorimetric, biological-biochemical, electrochemical, and acoustic wave-mass changemethods. Of these, optical methods (e.g., SPR) and acoustic wave-mass change methods appear
Eric Olsen • Clinical Investigation Facility, David Grant USAF Medical Center, Travis AirBase, CA. Arnold Vainrub • Department of Anatomy, Physiology, and Pharmacology, Auburn University.Vitaly Vodyanoy • Department of Anatomy, Physiology, and Pharmacology, Auburn, AL.
M. Zourob et al. (eds.), Principles of Bacterial Detection: Biosensors, Recognition Receptors and Microsystems,© Springer Science+Business Media, LLC 2008
253
vodyavi
Inserted Text
, AL
vodyavi
Inserted Text
University

254 Eric Olsen et al.
to suitably combine speed, sensitivity, and portability for future development of rapid biosensorsfor microbial analyses (O’Sullivan and Guilbault 1999; Janshoff, Galla, and Steinem 2000;Skládal 2003).
The term “biosensor” is used rather broadly these days. As defined here, acoustic wavebiosensors consist of two main components: a biological receptor that possesses affinityfor an analyte of interest, and a piezoelectric transducer to convert the chemical signal ofsample-receptor coupling to an amplified signal output that provides qualitative or quantitativeassessment of their interaction. Acoustic waves in piezoelectric substrates (e.g., quartz) usedas sensor platforms are based on mechanical waves created by an applied electric field. Thesewaves propagate through the substrate and are then transformed back to an electric field formeasurement. These discoveries have helped lead to the development of a wide range ofacoustic wave devices (Morgan 2000) for applications including sensing of bacterial cells insolution.
In this chapter we will focus on the development and use of acoustic wave biosensorplatforms for the detection of bacteria, specifically those based on the thickness shear mode(TSM) resonator. We also discuss the mechanical and electrical implications of bacterialpositioning at the solid-liquid interface of a TSM biosensor, and present a model of the TSMwith bacteria attached operating as coupled oscillators.
2. Historical Perspective, Theory and Background
2.1. Piezoelectricity and Acoustic Waves
Biosensors based on acoustic waves are rooted in numerous fundamental concepts,including the discovery of piezoelectricity by Pierre and Paul-Jacques Curie in 1880 (Curieand Curie 1880), the theory of acoustic waves as predicted by Lord Rayleigh in his 1885analysis of surface waves in solids (Rayleigh 1885), and Augustus Love’s work on acousticwaves published in 1911 (Love 1911), which included a description of shear surface waveshaving motion perpendicular to the sagittal plane. Subsequently, surface elastic waves werefirst measured in piezoelectric transducers in the 1940s and 1950s (Victorov 1967), and in 1965White and Voltmer (1965) experimentally demonstrated direct piezoelectric coupling to surfaceelastic waves using an interdigital electrode transducer (IDT) on a piezoelectric plate.
Piezoelectricity refers to the generation of electrical charges in response to an appliedmechanical stress. The converse is also true; application of a suitable electric field to a piezo-electric material (substrate) creates a mechanical stress, or as the name implies “conversepiezoelectricity.” While there are many different types of acoustic wave devices, all use theconverse piezoelectric effect to produce acoustic waves. These waves propagate through asubstrate, and are then transformed back to an electric field for measurement. This intercon-nection between piezoelectricity and acoustic waves has led to the development of a wide rangeof acoustic wave device applications.
2.2. Acoustic Wave Devices
The use of acoustic wave devices in electronics can be traced back more than 80 years(Morgan 2000; Gizeli 2002) and today includes timing and frequency control for applicationsthat require extreme precision and stability such as mobile phones, satellite communications, andradio transmitters. Several of the emerging applications for these devices in the medical sciences(biological and chemical sensors) and industrial and commercial applications (vapor, humidity,temperature, and mass sensors) may eventually equal the demand of the telecommunicationsmarket.

Acoustic Wave (TSM) Biosensors: Weighing Bacteria 255
Acoustic devices are generally described by way of their wave distribution, either throughor on the surface of the piezoelectric substrate. Basically, acoustic waves differ in velocities anddirections of particle movement within the substrate. Depending on the material and boundaryconditions there can be different variants. Fig. 12.1 shows the configuration of typical acoustic
Figure 12.1. Schematic diagram showing various views of two bulk wave devices (TS and TF), two surface wavedevices (SA and ST), and two plate wave devices (FPW and SH-APM). Wave motions are indicated by light arrowsshowing particle displacement directions and larger bold arrows showing wave propagation direction. (Grate andFrye 1996; © John Wiley & Sons Limited; reproduced with permission).

256 Eric Olsen et al.
wave devices. Transverse or shear waves have particle displacements that are normal to thedirection of wave propagation and which can be polarized so that the particle displacementsare either parallel or normal to the sensing surface. Shear horizontal wave motion signifiestransverse displacements polarized parallel to the sensing surface; shear vertical motion indicatestransverse displacements normal to the surface. Some properties of selected acoustic wavedevices, including TSM, transverse shear mode (i.e., QCM, quartz crystal microbalance); SAW,surface acoustic wave; STW, surface transverse wave; SH-APM, shear horizontal acoustic platemode; FPW, flexural plate wave; and TRAW, thin rod acoustic wave, are shown in Table 12.1(Rickert et al. 1999). A wave propagating through the substrate is called a bulk wave. Themost frequently used bulk acoustic wave devices are the TSM resonator and the SH-APM.A wave propagated on the surface of a substrate is known as a surface wave. The most broadly
Table 12.1. Comparison of selected acoustic wave sensors (Rickert et al. 1999. © John Wiley & SonsLimited. Reproduced with permission)
Type Wave type
Parameterdeter-miningthe resonancefrequency
Typicalfrequencya
(MHz)
Typical examplewith: materialresonance frequency(MHz) thickness d
of substrate ��m�
wavelength ���m�Mediumof preferential use
TSM Volume, Thickness d 5–30 Quartz Gas, liquid(QCM) horizontal 6
270540
SAW Surface, Spacing 30–500 Quartz Gasvertical of interdigital 158
electrodes 76020
STW Surface, Spacing 30–500 Quartz Liquid gasb
horizontal of interdigital 250electrodes 500
20Love- Surface, Spacing 80–300 Quartz Liquid gasmode horizontal of interdigital 110
electrodes 500and thickness d 40of wave guidinglayer
SH- Plate, Thickness d 25–200 Quartz Liquid gasb
APM Horizontal and spacing 101of interdigital 203electrodes 50
FPW Plate, Thickness d 2–7 Zinc oxide Gas liquidc
vertical and spacing 5.5of interdigital 3.5electrodes 100
TRAW Volume, Frequency of 0.5–8 Aud Liquid gasb
longitudinal coupling 1.95piezoelectric 50transducer
aMaterial and wave velocity influence the resonance frequency in all cases.bPreliminarily designed for application in liquids, but applications in gas are possible.cPossible as wave velocity is less than compressional velocity of sound in liquid.dThe transducer itself is not piezoelectric, but acoustic waves travel through it.
Acoustic Wave (TSM) Biosensors: Weighing Bacteria 257
used surface wave devices are the SAW and shear-horizontal surface acoustic wave (SH-SAW)sensors, also recognized as the surface transverse wave (STW) sensor. The waves are guidedby reflection from multiple surfaces. Typical representatives of plate wave devices are FPWand APM.
All acoustic wave devices are sensitive to perturbations of many different physical param-eters. The change in the properties of the pathway over which the acoustic wave propagateswill result in a change in output signal. While all acoustic wave devices will function in gasesor vacuum, only a few operate efficiently in liquids. Whether an acoustic wave device canoperate in liquid is determined by the direction of the particle displacement at the surface ofthe device. TSM, SH-APM, and SH-SAW devices all generate waves that propagate primarilyin a shear horizontal motion. A shear horizontal wave does not radiate appreciable energy intoliquid, allowing functionality without excessive attenuation. Conversely, SAW devices utilizingRayleigh waves have a substantial surface-normal displacement that radiates compression wavesinto the liquid and thus cannot be employed in the liquid phase (Grate and Frye 1996). Anexception to this rule occurs for devices using waves that propagate at a velocity lower thanthat of sound in liquid. Therefore, such modes do not couple to compressional waves in liquidand are thus relatively unattenuated (Ballantine et al. 1997).
3. Tsm Biosensors
Acoustic wave devices such as the TSM are essentially highly sensitive analyticalbalances, capable of discriminating extremely small mass deposition events. This makes themexcellent analytical tools for the study of specific molecular interactions at the solid-liquidinterface in air, and under vacuum or aqueous conditions (Bunde, Jarvi, and Rosentreter 1998;Cavicacute, Hayward, and Thompson 1999; Ivnitski et al. 1999; O’Sullivan and Guilbault 1999;Kaspar et al. 2000; Stadler, Mondon, and Ziegler 2003; Yakhno et al. 2007).
The TSM resonator may be better known as the quartz crystal microbalance (QCM),because its natural resonant properties are based on the piezoelectric properties of resonatorsprepared normally from quartz. The QCM usually consists of a thin, round AT- or BT-cut (angular orientation in relation to internal crystallography) quartz crystal wafer with twometallic electrodes (e.g., gold, silver, or palladium) deposited uniformly onto both sides of thequartz (Grate and Frye 1996). The quartz substrate can have varying dimensions and resonantfrequencies, the most common being 100 kHz and 1, 2, 4, 5, 8, and 10 MHz (Scherz 2000).In itself it comprises an oscillatory circuit that can be modeled as an extended Butterworth-van Dyke equivalent circuit depending upon load conditions (Fig. 12.2) (Janshoff, Steinem,and Wegener 2004). The piezoelectric properties of the quartz result in deformation of thecrystal when an electrical potential is created across the electrodes, which in turn induces atransverse, standing wave of resonance oscillation in the quartz at a fundamental frequency(Babacan et al. 2000). AT-cut crystals displace the oscillation parallel to the resonator surfaceand are utilized predominantly in liquids, due to their temperature stability. Any changes inthe resonance frequency of the crystal are usually attributed to the effect of added mass dueto binding at the active (overlapping) area of the electrodes. Theoretical modeling of theTSM response to mass accumulation has been demonstrated under various loading conditions,including ideal mass layers (thin layers of Au and SiO2), a semi-infinite fluid (glycerol in water),and a viscoelastic layer represented by thin layers of oil (Martin, Granstaff, and Frye 1991;Bandey et al. 1999).
According to theory (Sauerbrey 1959), when a mass, m, binds at the surface of the sensor,a corresponding proportional decrease of the resonator’s oscillation frequency occurs, the totalquantity of which can be solved for using Sauerbrey’s (1959) equation as follows, provided
vodyavi
Inserted Text
Replace Tsm with TSM

258 Eric Olsen et al.
Figure 12.2. Extended equivalent circuits derived from Butterworth-van Dyke circuit for different load conditions:(a) unperturbed quartz plate; (b) rigid mass; (c) Newtonian liquid; (d) combination of rigid mass and Newtonian liquid;(e) thick viscoelastic layer; and (f) thin viscoelastic body and Newtonian liquid (adapted from Janshoff, Steinem, andWegener 2004; with kind permission of Springer Science and Business Media).
that the mass creates a rigid, uniform film that does not slip and has the same acousto-elasticproperties as quartz:
�f = −Cf��m� (12.1)
where �f is the observed change in frequency (Hz) of the resonator under oscillation atits fundamental frequency due to mass loading, Cf = sensitivity factor of the resonator inHz/ng/cm2, and �m = change in mass per unit area in g/cm2.

Acoustic Wave (TSM) Biosensors: Weighing Bacteria 259
Traditionally, the TSM has served as a mass-sensitive monitor for commercial applica-tions such as thin-film deposition under vacuum, and electroless and electroplating processes.Sauerbrey’s (1959) calculations were originally described for depositions under vacuumconditions but his theory has been extended to liquid application, as proof in conceptdevelopment of sensors for biological analysis have increased dramatically in the pastdecade.
Acoustic wave biosensors in general have been the subject of intense research sincethe first analytical application reported by King (1964). As a solitary mass-sensitive trans-ducer the device is non-specific. However, when the electrode is coated with a high affinityreceptor or biorecognition component through a reliable deposition process, sample couplingbetween the receptor and its complementary analyte at the sensor surface can be attributedto a mass change (Rickert et al. 1999) that can be converted to a signal output, amplified,and processed to provide specific, sensitive qualitative or quantitative measurement of theirinteraction. Thus, a biosensor is the spatial unity of a physical transducer and a comple-mentary biological recognition component such as an antibody, bacteriophage, DNA, orenzyme.
For more in-depth information regarding theory, the reader can consult numerous excellentreferences including Janshoff and Steinem (2001), and Ballantine et al. (1997).
3.1. Detection of Microorganisms
Improved characterization and modeling (Martin, Granstaff, and Frye 1991; Bandeyet al. 1999) of TSM responses and functionality under liquid loading conditions have hasteneddevelopment of rapid bacterial biosensors, because for the most part bacteria are naturally foundunder liquid conditions. There are numerous proposed applications, including use in the foodindustry (Leonard et al. 2003), water and environmental monitoring (Kurosawa et al. 2006),pharmaceutical sciences (Pavey 2002), bio-threat defense (Ivnitski et al. 1999; Petrenko andVodyanoy 2003), and clinical diagnostics (Lazcka, Campo, and Munoz 2007).
The specificity of any TSM sensor is wholly dependent upon a complementary, immobi-lized bioreceptor. Bioreceptors for whole cell analysis generally correspond to some outsideportion of the cell wall such as proteins, or possibly lipopolysaccharides or some other cellwall-associated structure (Sorokulova et al. 2005). Direct application for the detection ofwhole bacterial cells includes food pathogens such as Salmonella spp., Escherichia coli, andListeria monocytogenes; as well as other human pathogens such as Chlamydia trachomatis,Vibrio cholerae, Staphylococcus aureus, Pseudomonas aeruginosa, Mycobacterium tubercu-losis, Fransicella tularensis, Legionella, and Bacillus anthracis spores. A comprehensive listof selectively identified or quantitated bacterial organisms (e.g., biofilm formation in selectiveculturing media) using acoustic wave devices is given in Table 12.2. Also, acoustic wavebiosensors have been used for the direct detection of other microorganisms including human,plant, and bacterial viruses such as coronavirus (Zuo et al. 2004), tobacco mosaic virus (Dickertet al. 2004), dengue virus (Su et al. 2003), hepatitis A and B (Konig and Gratzel 1995), rotavirusand adenovirus (Konig and Gratzel 1993), cymbidium mosaic potexvirus and odontoglossumringspot tobamovirus (Eun et al. 2002), and M-13 phage (Uttenthaler et al. 2001); yeast(Muramatsu et al. 1986; Hayden and Dickert 2001; Hayden, Bindeus, and Dickert 2003); andeven algae (Nakanishi et al. 1996).
Acoustic wave biosensors have also been used for indirect detection of microor-ganisms through the detection of corresponding: DNA from E. coli O157:H7 (Deisingh andThompson 2001; Mo et al. 2002; Mao et al. 2006), hepatitis A virus (Zhou et al. 2002),and human papilloma virus (Wang et al. 2002); specific bacterial protein products for E. coli(Nanduri et al. 2007); antigenic proteins from dengue virus (Wu et al. 2005; Tai et al. 2006);

260 Eric Olsen et al.
Table 12.2. Acoustic wave (AWD) biosensors developed for bacterial detection
Bacterium AWD Receptor LLOD Reference
Bacillus subtilis PM NS – (Ishimori, Karube, and Suzuki 1981)Bacillus thringiensis spores SHSAW Ab 1764 spores (Branch and Brozik 2004)Chlamydia trachomatis TSM Ab 260 ng/mL (Ben-Dov, Willner, and Zisman, 1997)Escherichia coli TSM NS – (Zhang et al. 2002)Escherichia coli TSM NS 10 cells/ml (He et al. 1994)Escherichia coli TSM NS – (Otto, Elwing, and Hermansson, 1999)Escherichia coli TSM NS – (Zhao, Zhu and He, 2005)Escherichia coli TSM SIP unknown (Dickert et al. 2003)Escherichia coli SSBW Ab 400 cells/ml (Deobagkar et al. 2005)Escherichia coli TSM NS – (He and Zhou, 2007)Escherichia coli SHSAW Ab 106 cells/ml (Moll et al. 2007)Escherichia coli SHSAW Ab ∼ 109 cells/ml (Berkenpas, Millard and
Pereira da Cunha 2006)Escherichia coli SHSAW Ab 105 −106 cells/ml (Howe and Harding 2000)Escherichia coli TSM Ab 103 cells/ml (Su and Li 2004)Escherichia coli TSM Ab 1.7 ×10⁵ cells/ml (Kim, Rand, and Letcher 2003)Escherichia coli FPW Ab 3.0 ×10⁵ cells/ml (Pyun et al. 1998)Fransicella tularensis (Ft) TSM Ft antigen 5 ×·106 cells/ml (Pohanka and Skládal 2005)Klebsiella sp. PM NS – (Ishimori, Karube, and Suzuki, 1981)Legionella SHSAW Ab 106 cells/ml (Howe and Harding 2000)Listeria monocytogenes TSM Ab 1.0 ×10⁷ cells/ml (Vaughan, O’Sullivan,
and Guilbault, 2001)Milk bacteria∗ TSM NS – (Chang et al. 2006)Mixed bacteria∗∗ TSM NS – (He et al. 2006)Mycobacterium tuberculosis TSM Ab 105 cells/ml (He and Zhang 2002)Mycobacterium tuberculosis TSM NS 2 ×10³ cells/ml (He et al. 2003)Proteus spp. TSM NS – (Yao et al. 1998)Proteus vulgaris TSM NS 120 cells/ml (Tan et al. 1997)Proteus vulgaris TSM NS 340 cells/ml (Deng et al. 1997)Proteus vulgaris TSM NS – (Bao et al. 1996b)Pseudomonas aeruginosa TSM NS 3.3 ×10⁵ cells cm−2 (Niven et al. 1993)Pseudomonas aeruginosa TSM NS 60-100 cells/ml (Zhao, Zhu and He 2005)Pseudomonas aeruginosa TSM Ab 1.3 ×10⁷ cells/ml (Kim, Park, and Kim 2004)Pseudomonas aeruginosa TSM NS – (Reipa, Almeida, and Cole, 2006)Salmonella sp. TSM Ab 3.2 ×10⁶ cells/ml (Park, Kim and Kim 2000)Salmonella serotypes A,B,D TSM Ab 105 cells/ml (Wong et al. 2002)Salmonella typhimurium TSM Ab 103 cells/ml (Bailey et al. 2002)Salmonella typhimurium TSM Ab 100 cells/ml (Olsen et al. 2003)Salmonella typhimurium TSM Phage 0 cells/ml (Olsen et al. 2006)Salmonella typhimurium TSM Ab 100 cells/ml (Pathirana et al. 2000)Salmonella typhimurium TSM Phage 100 cells/ml (Olsen et al. 2007)Salmonella typhimurium TSM Ab 1.5 ×10⁹ cells/ml (Babacan et al. 2000)Salmonella typhimurium TSM Ab 107 cells/ml (Babacan et al. 2000)Salmonella typhimurium TSM Ab 5.3 ×10⁵ cells/ml (Ye, Letcher, and Rand 1997)Salmonella typhimurium TSM Ab 105 cells/ml (Prusak-Sochaczewski and Luong 1990)Salmonella typhimurium TSM Ab 105 −106 cells/ml (Su and Li 2005)Salmonella typhimurium TSM Ab 100 cells/ml (Kim, Rand, and Letcher 2003)Salmonella typhimurium TSM Ab 9.9 ·105 cells/ml (Park and Kim 1998)Salmonella paratyphi A TSM Ab 170 cells/ml (Fung and Wong 2001)Salmonella paratyphi A TSM Ab 105 cells/ml (Si et al. 1997)Salmonella enteriditis TSM Ab 1.0 ×10⁵ cells/ml (Si et al. 2001)Salmonella enteriditis TSM Ab 1.0 ×10⁵ cells/ml (Ying-Sing, Shi-Hui,
and De-Rong, 2000)
vodyavi
Cross-Out
vodyavi
Cross-Out
vodyavi
Cross-Out
vodyavi
Cross-Out
vodyavi
Cross-Out
vodyavi
Cross-Out
vodyavi
Inserted Text
remove "dot"
vodyavi
Cross-Out
vodyavi
Inserted Text
should be "sp"
vodyavi
Cross-Out
vodyavi
Replacement Text
Replace "." with "x"

Acoustic Wave (TSM) Biosensors: Weighing Bacteria 261
Table 12.2. (Continued)
Bacterium AWD Receptor LLOD Reference
Staphylococcus aureus TSM Ab 5 ×10⁵ cells/ml (Le et al. 1995)Staphylococcus epidermidis TSM Fibronectin 100 cells/ml (Pavey et al. 2001)Staphylococcus epidermidis TSM NS 100 cells/ml (Bao et al. 1996a)Streptococcus mutans TSM NS – (Kreth et al. 2004)Vibrio cholerae TSM Ab 4 ×10⁴ cells/ml (Carter et al. 1995)
Ab = corresponding antibody; NS = not selective (e.g. for biofilm monitoring) or some other means of selectivity (e.g. specific culturemedia) was used other than attached bioreceptor; PM = piezoelectric membranes; SIP = surface imprinted polymer layer; SSBW =surface skimming bulk wave; ∗ = non-specific detection of bacterial growth in milk; ∗∗ = non-specific detection of bacterial growth inblood culture bottles.
antibodies from bacteria including Helicobacter pylori (Su and Li 2001), Treponema palladium(Aizawa et al. 2001), Salmonella enteritidis (Su et al. 2001), Francisella tularensis (Pohanka andSkládal 2005), and Staphylococcus epidermidis (Pavey et al. 1999), the helminth Schistosomajaponicum (Wu et al. 1999, 2006), and African swine fever virus (Uttenthaler, Kolinger, andDrost 1998); and bacterial toxins from E. coli including LT (Spangler et al. 2001), Stx (Uzawaet al. 2002), and an unidentified endotoxin (Qu et al. 1998), and Staphylococcus includingSEB and C2 toxins (Harteveld, Nieuwenhuizen, and Wils 1997; Gao, Tao, and Li 1998; Linand Tsai 2003). Additionally, new innovations such as gas chromatography coupled to SAWtechnology have been used for indirect detection of Klebsiella pneumoniae, Pseudomonasaeruginosa, Escherichia coli, and two Candida albicans yeast strains (Casalinuovo et al. 2005).Ion chromatography combined with TSM has been used to monitor Lactobacillus fermentationthrough lactic acid production (Zhang et al. 2001).
As shown in Table 12.2, the overwhelming majority of acoustic wave biosensors describedin the literature for direct detection of whole bacterial cells is based on the TSM platform,with the most frequently targeted organism being Salmonella, specifically S. typhimurium.Salmonella is a leading etiology of foodborne illness and death in the U.S. (Mead et al. 1999).
Prominent acoustic wave sensors for Salmonella include those of Prusak-Sochaczewskiand Luong (1990), who reported the first QCM assay for Salmonella with an assay time of 50–60 s, a lower detection limit of 105 cells/ml, and 0.5–5 hour incubation period, depending on theconcentration of the microbial suspension; Park and Kim (1998), whose thiolated immunosensorpossessed an assay time of 30–90 minutes, a lower detection limit of 9�9 × 10⁵ cells/ml, anda detection range up to 1�8 × 10⁸ cells/ml; Ye, Letcher, and Rand (1997), whose linear (R =0.942) biosensor assay for S. typhimurium had a 25 min response time, a lower detection limit of5�3×10⁵ CFU/ml, and a range up to 1�2×10⁹ CFU/ml; Pathirana et al. (2000), who developedan antibody-based TSM sensor to detect Salmonella typhimurium in poultry that possessedrapid analytical response times of 79 ± 20 seconds, linear (R > 0�98, p < 0�01) dose-responseover 5 decades (102 to 107 cells/ml) of bacterial concentration, sensitivity of 18±5 mV/decadeof S. typhimurium concentration, and a detection range of 350 ± 150 to 1010 cells/ml; and thesensors of Babacan et al. (2000, 2002), Park, Kim and Kim (2000), Su and Li (2005), and Kim,Rand, and Letcher (2003).
3.2. Measurement in Liquid
TSM functionality in liquids is complex. Influences from numerous non-gravimetriccontributions include liquid viscosity and density (Bandey et al. 1999); surface free energy(Thompson et al. 1991); roughness, surface charge density, and water content of biomolecules
262 Eric Olsen et al.
(Janshoff and Steinem 2001); pressure and temperature (Niven et al. 1993); and the viscoelas-ticity and interfacial effects (Lucklum 2005) of thin films deposited in the form of bioreceptors.Therefore, the use of Sauerbrey’s (1959) equation to strictly quantitate mass deposited tothe solid-liquid interface under liquid conditions is controversial. Sauerbrey’s equation wasdeveloped based on the oscillation of TSM in vacuum and only applies to thin, uniform, rigidmasses attached tightly to the crystal. Thus, frequency response under liquid conditions cannotsolely be attributed to mass deposition (Gizeli 2002; Lucklum 2005). For example, TSM sensorsexposed to relatively large protein and polysaccharide molecules in solution have also beenshown to give responses that did not correlate with mass changes at the solid-liquid interface(Ghafouri and Thompson 1999). The authors ascribed this phenomenon to viscoelastic andacoustic coupling at the interface. One could expect especially complicated interfacial propertieswhen the TSM sensor is exposed to larger biological entities such as bacterial cells. Electrome-chanical forces created by live and moving organisms may contribute to the apparent massof binding bacteria. Additionally, factors such as nutrition, growth, differentiation, chemicalsignaling, and mutagenic exposure may also factor in controlling the physiological state ofbinding bacteria. A bacterial cell (e.g., E. coli) can possess a mass of approximately 665 fg,making it one million times heavier than a typical (150 kD) antibody molecule (Neidhardt 1987)used as a bioreceptor. Bacteria carry out or are involved with various movements includingflagellation, Brownian motion, chemotaxis, swimming behavior, adaptation, and other cellphenomena (Alberts et al. 1994). Bacterial binding on sensor surfaces may also depend on thepresence of fimbriae (Otto, Elwing, and Hermansson 1999), flagella (Sorokulova et al. 2005),or other surface-associated adhesion factors, as well as the ability of single cells to associateand form colonies. Bacterial interaction with a biosensor may also be highly dependant uponenvironmental conditions (Olsen et al. 2003).
Notwithstanding, the ability to function in liquid environments conducive to bacterialgrowth and the fact that mass can be sensitively and specifically differentiated as a molecularrecognition/binding event at the solid-liquid interface are two good reasons the TSM is beingdeveloped as a rapid detection tool. Normally, the TSM sensor is enclosed within a cell intowhich fluids are injected (“flow injection analysis”) or flowed via a peristaltic pump. Numerousexamples are available by reviewing the references in Table 12.2. While “closed systems” areprevalent and rather simple in operation, solutions can also be simply applied by pipette directlyto the surface of the TSM, or what can be contrasted as an “open system,” where fluids aredirectly applied to the sensor surface (Olsen et al. 2003, 2006). Systems have also been devisedfor air-borne sample-to-liquid transfer (Frisk et al. 2006) to facilitate acquisition of airbornethreat agents such as Bacillus anthracis spores.
3.3. Tsm Biosensor Characteristics
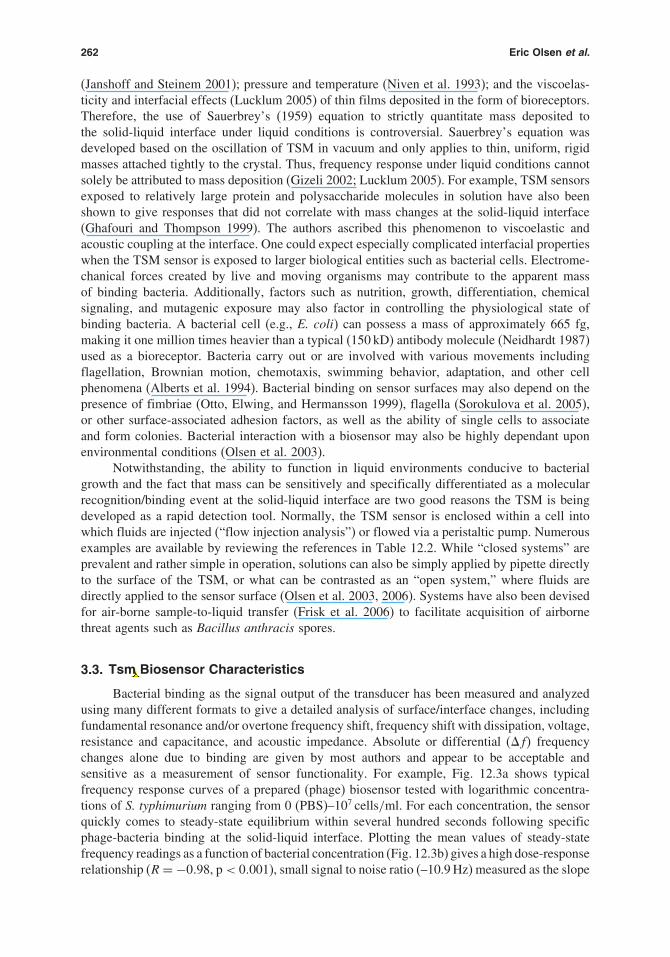
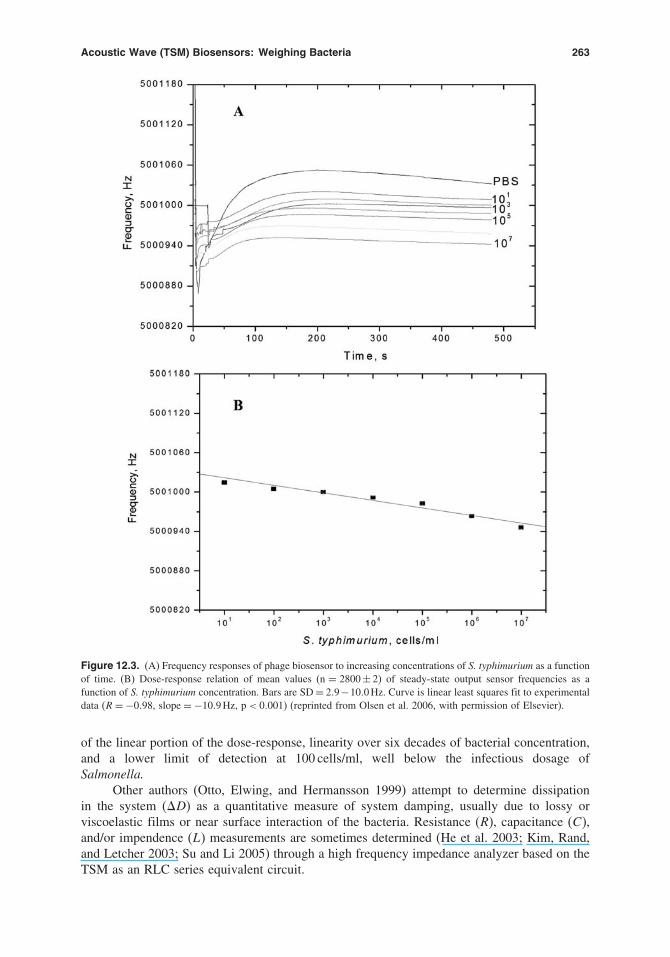
Bacterial binding as the signal output of the transducer has been measured and analyzedusing many different formats to give a detailed analysis of surface/interface changes, includingfundamental resonance and/or overtone frequency shift, frequency shift with dissipation, voltage,resistance and capacitance, and acoustic impedance. Absolute or differential (�f� frequencychanges alone due to binding are given by most authors and appear to be acceptable andsensitive as a measurement of sensor functionality. For example, Fig. 12.3a shows typicalfrequency response curves of a prepared (phage) biosensor tested with logarithmic concentra-tions of S. typhimurium ranging from 0 (PBS)–107 cells/ml. For each concentration, the sensorquickly comes to steady-state equilibrium within several hundred seconds following specificphage-bacteria binding at the solid-liquid interface. Plotting the mean values of steady-statefrequency readings as a function of bacterial concentration (Fig. 12.3b) gives a high dose-responserelationship (R = −0�98, p < 0�001), small signal to noise ratio (–10.9 Hz) measured as the slope
vodyavi
Cross-Out
vodyavi
Replacement Text
TSM
Acoustic Wave (TSM) Biosensors: Weighing Bacteria 263
Figure 12.3. (A) Frequency responses of phage biosensor to increasing concentrations of S. typhimurium as a functionof time. (B) Dose-response relation of mean values (n = 2800 ± 2) of steady-state output sensor frequencies as afunction of S. typhimurium concentration. Bars are SD = 2�9−10�0 Hz. Curve is linear least squares fit to experimentaldata (R = −0�98, slope = −10�9 Hz, p < 0�001) (reprinted from Olsen et al. 2006, with permission of Elsevier).
of the linear portion of the dose-response, linearity over six decades of bacterial concentration,and a lower limit of detection at 100 cells/ml, well below the infectious dosage ofSalmonella.
Other authors (Otto, Elwing, and Hermansson 1999) attempt to determine dissipationin the system (�D) as a quantitative measure of system damping, usually due to lossy orviscoelastic films or near surface interaction of the bacteria. Resistance (R), capacitance (C),and/or impendence (L) measurements are sometimes determined (He et al. 2003; Kim, Rand,and Letcher 2003; Su and Li 2005) through a high frequency impedance analyzer based on theTSM as an RLC series equivalent circuit.

264 Eric Olsen et al.
There are many other characteristics of TSM platforms that require consideration whendeveloping and testing biosensors, including:
• Specificity: the strength of the interaction between a molecular probe (e.g., antibody)and an antigen (target analyte) as estimated by the dissociation constant Kd. The smallerthe Kd the higher the specificity of binding. The free energy of dissociation (�Gd) ofa ligand-receptor complex is related to its equilibrium dissociation constant Kd by theequation:
�Gd = −kT ln�Kd/K0�� (12.2)
where k is a Boltzmann constant and T is a temperature in �K. The equation refers to astandard reference state where all chemical species are 1 M (i.e., K0 ∼ 0�6 molecules/nm3)and attributes a free energy of zero to a complex with a dissociation constant of 1 M (Chothiaand Janin 1975).
• Binding selectivity: is defined by a selectivity coefficient (K). Binding selectivity can beestimated from dose responses of a biosensor to different analytes (e.g., bacteria). The signalresponse V as a function of the primary analyte (e.g., bacteria) concentration (C) can berepresented by the following empirical equation:
V = A+S log C� (12.3)
where C is the primary analyte concentration, A is the constant, and S is the slope of thedose response dependence, defined as the sensitivity of the sensor (Pathirana et al. 1996).
The selectivity coefficient for any other analyte to the primary analyte (e.g., bacteria)(K) can be determined from the signal responses at different concentrations using a methodsimilar to the matched potential method (Pathirana et al. 1996; Umezawa 1996). The selec-tivity coefficient is defined as the concentration ratio (R) of primary to interfering species[��Cp�/��Ci�], which gives the same response change at the same condition. Using thedefinition of the selectivity coefficient and Eq. 12.2, the following is derived:
R = Cp/Ci� (12.4)
K = R = Si/Sp� when �Cp approaches zero� (12.5)
where Sp and Si are slopes of signal responses to primary and interfering species (otherbacteria), respectively.
• Sensitivity: The change of the biosensor’s output signal when the analyte content (totalquantity or concentration) changes by one unit. For non-linear sensors, the sensitivity dependson the analyte level and is given by the slope of the sensor’s output curve versus the analytecontent.
• Detection threshold. The ability of the biosensor to discriminate an analyte (e.g., bacteria)from background at the lowest quantity of analyte in the testing solution.
• Dynamic or Working Range: The range of the analyte content over which the sensor canperform qualitative or quantitative detection.
• Linear range: That part of the dynamic range where the sensor’s output is a linear functionof the analyte content.

Acoustic Wave (TSM) Biosensors: Weighing Bacteria 265
• Saturation: The level at which the sensor no longer functions correctly. For biosensors, thisis usually the point where the bioreceptor has been saturated with analyte and reaches a peaksignal.
• Response Time: The amount of time required to detect the analyte as given by the signaloutput.
• Accuracy: Closeness of the sensor measurement result to the actual quantity of cells insolution. Actual quantity of cells (usually stated in reports as cells/ml) is found from traditionalplate culture of the organism. Optical counting methods are also possible (Olsen 2000).
• Stability: The ability of the sensor signal to give a constant, steady output signal whenmeasuring a steady input, such as a load of cells.
3.4. Commercial TSM Microbalances
Traditionally, the TSM has served as a mass-sensitive monitor in commercial applicationssuch as thickness monitoring and deposition rate control for thin films under vacuum, and forelectroless and electroplating processes (Krause 1993). The functionality of the TSM underliquid conditions has increasingly driven adaptation to the development of extremely sensitivebiosensors in the past decade. Total QCM systems are relatively inexpensive and simple inoperation, requiring for the most part only the resonator crystal, external oscillatory circuit, andfrequency counter. Many of the systems described in the literature for sensor developments arepieced together or custom built and may additionally include impedance analyzers, thermostaticjacketing for temperature control, and pump or flow injection equipment. With the advent ofthe Internet, numerous commercial QCM products including crystal resonators and holders,frequency monitors, flow cells, and even entire systems are now easily available throughoutthe world, making entry into this field reasonable in terms of cost and availability. A recentreview of the Internet yielded numerous larger manufacturers and suppliers of complete QCMsystems (Table 12.3).
One such commercially available microbalance produced by Maxtek Inc. can be usedfor both biosensor preparation and testing and consists of a 50 cm sensor probe connected bya tri-axial cable to a precalibrated plating monitor (Fig. 12.4). This system is often used inelectroplating processes within vats, necessitating the long probe and open face exposed tosolution. The plating monitor has a frequency resolution of 0.03 Hz and mass resolution of0�375 ng/cm2 at 5 MHz. TSM transducers are precleaned AT-cut plano-plano quartz liquid-plating resonators possessing a 5 MHz nominal resonant frequency. Resonators (2.54 cmdiameter, 333 �m thickness) have gold plated electrodes evaporated onto titanium adhesionlayers on both the top and bottom (Fig. 12.5). The electrodes are polished to an average surfaceroughness of approximately 50 Å. This minimizes liquid entrapment within the pores at thecrystal surface, reducing the creation of apparent mass loadings under liquid measurement condi-tions. Also, resonators are pretested to assure conformance to critical accuracy specificationsrequired for reproducibility, and rate and thickness measurements (PM-740 series operationand service manual 1996). Both the bioreceptor, during sensor preparation (Fig. 12.6a), andthe analyte, during sensor testing, can be directly applied to the surface of the sensor bypipette (Fig. 12.7). Absolute frequency readings from the sensor are transferred to a PC directlyfrom the plating monitor or via a multimeter, in which case voltage readings can be captured(Pathirana et al. 2000). The sensor probe, attached to the stand, and all necessary compo-nents of the experiment can be contained at room temperature within an Atmosbag™ glovedisolation chamber (Sigma-Aldrich, Milwaukee, WI) inflated with inert nitrogen gas duringbioreceptor deposition studies to prevent possible contamination of the resonator by particulatematter.

266 Eric Olsen et al.
Table 12.3. Selected commercially available QCM systems
Company Internet URL (http://) QCM products
Maxtek, Inc. www.maxtekinc.com RQCM, crystals andholders oscillators,flow/liquid cells, thin-filmmonitors/controllers
Q-Sense www.q-sense.com E4 QCM-D, D300; EQCM,crystals
Universal Sensors, Inc. intel.ucc.ie/sensors/universal PZ-105, crystals, flow cellsSeiko EG&G speed.sii.co.jp/pub/segg/hp QCM934, QCA922Princeton AppliedResearch
www.princetonappliedresearch.com QCM922, EQCM
ICM, Inc. www.qcmsystems.com/index.html crystals, oscillators, flowcells
QCM Research www.qcmresearch.com CQCM, TQCM, Mark 21QCM Thin-filmcontrollers
Tectra www.tectra.de/qmb.htm MTM-10 thin filmmonitors/controllers
KSV Instruments, LTD www.ksvltd.com QCM-Z500, crystals,EQCM flow cells, pumps,temp control unit,spin-coater/holder
SRS www.thinksrs.com QCM-100, QCM-200,EQCM, crystals andholders, oscillatorsthin-film controllers, flowcells
Masscal www.masscal.com G1 QCMFaraday Labs www.faradaylabs.com QCMInitium, Inc. www.initium2000.com Affinix QSigma Instruments www.sig-inst.com Q-pod, SQM-160, crystals,
thickness/rate monitorsTangidyne www.tangidyne.com Optical crystals and holdersTechnochip www.technobiochip.com �Libra QCM, EQCM,
“Electronic Nose”
In addition to some of the previously mentioned TSM characteristics, some additionalfactors to consider before purchasing commercially available equipment include cost, resolution,reproducibility, reliability, ruggedness, analytical range, speed, noise, cost, power requirements,space limitations, availability, technical servicing/maintenance, life expectancy, data capturecapabilities, ease of use, and other analytical capabilities and adaptabilities such as useunder differing temperatures, pressures, or other environmental conditions, and adapt-ability to peripheral devices such as voltmeters, PC, peristaltic pumps, and thermostaticjacketing.
Like all other sensory devices, the TSM as a sensor platform has its advantages anddrawbacks. In addition to addressing necessary characteristics of TSM biosensors such as speed,accuracy, precision, sensitivity, and specificity, several other factors should be considered,including incubation time of analyte, numerous steps including application of analyte andwashing and drying, regeneration of the sensor surface if reusability is a factor, and total costof assay to include resonators, reagents, bioreceptors, etc.

Acoustic Wave (TSM) Biosensors: Weighing Bacteria 267
Figure 12.4. QCM platform for deposition and biosensor measurements. A plating monitor was connected to a sensorprobe that was horizontally clamped to a lattice stand then tilted 10� transverse to the stand. The sensor probe andstand were positioned atop a marble slab to reduce extraneous environmental vibrations.
3.5. Immobilization of Probes onto Sensor Surface
A major drawback to the TSM as a sensor is its non-specificity. Anything that can andwill attach to it under liquid loading conditions can be recognized as a molecular binding event.Therefore, application of bioreceptors is necessary in order to affect specificity towards theanalyte of choice (bacteria, bacteria components, toxins, or complementary DNA, etc.). Thesensing properties of a sensor depend on the physical-chemical environment of antibody andantigen-antibody complex, which are in turn determined by antibody immobilization techniques(Ahluwalia et al. 1992; Storri, Santoni, and Mascini 1998). While the TSM can be very quick inits measurement, building the sensor with bioreceptors can be a tedious, multi-step process thatcan take numerous hours or even days. Additionally, and possibly the greatest consideration,
Figure 12.5. Maxtek sensor probe and associated components: (1) housing for external oscillatory circuit electricalcontacts; (2) crystal holder cavity with o-ring (black) installed. The gold index pins that contact the reverse electrodeof the resonator are clearly visible; (3) teflon resonator retainer ring; (4) threaded retainer ring cover; (5) sensingelectrode of polished, 5 MHz AT-cut thickness shear mode quartz resonator; (6) contact electrode of quartz resonator.The “active area” of the resonator is that central portion of the sensing electrode that overlaps the contact electrode(≈ 34�19 mm2).
268 Eric Olsen et al.
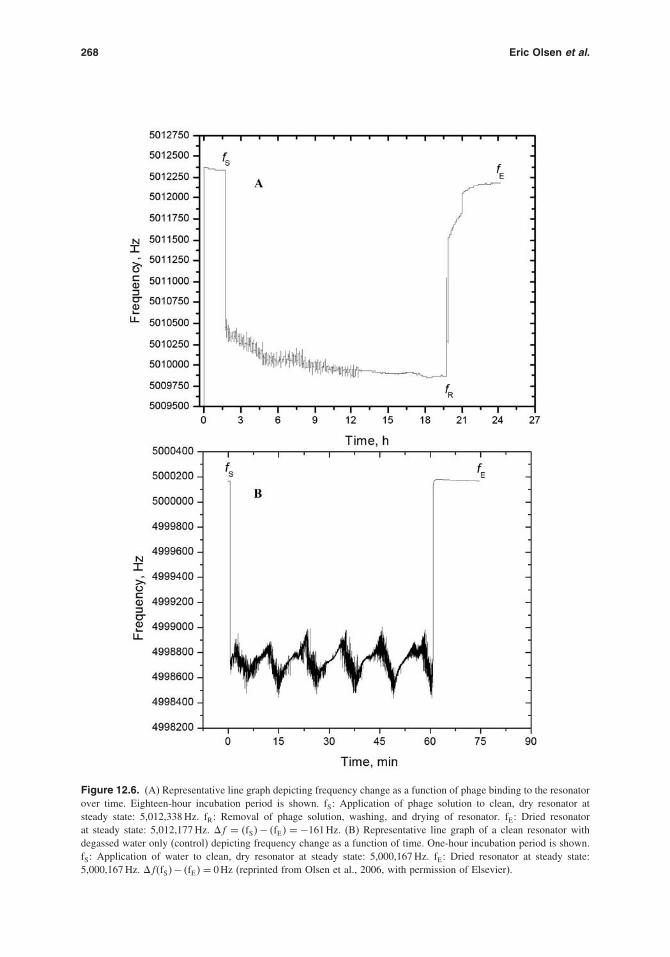
Figure 12.6. (A) Representative line graph depicting frequency change as a function of phage binding to the resonatorover time. Eighteen-hour incubation period is shown. fS: Application of phage solution to clean, dry resonator atsteady state: 5,012,338 Hz. fR: Removal of phage solution, washing, and drying of resonator. fE: Dried resonatorat steady state: 5,012,177 Hz. �f = �fS� − �fE� = −161 Hz. (B) Representative line graph of a clean resonator withdegassed water only (control) depicting frequency change as a function of time. One-hour incubation period is shown.fS: Application of water to clean, dry resonator at steady state: 5,000,167 Hz. fE: Dried resonator at steady state:5,000,167 Hz. �f�fS�− �fE� = 0 Hz (reprinted from Olsen et al., 2006, with permission of Elsevier).
Acoustic Wave (TSM) Biosensors: Weighing Bacteria 269
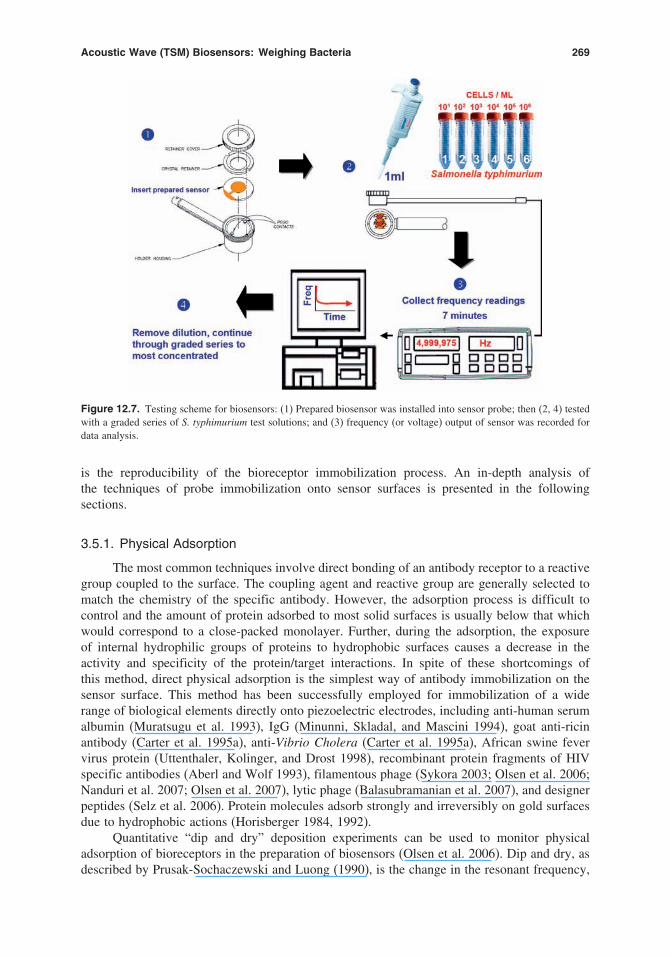
Figure 12.7. Testing scheme for biosensors: (1) Prepared biosensor was installed into sensor probe; then (2, 4) testedwith a graded series of S. typhimurium test solutions; and (3) frequency (or voltage) output of sensor was recorded fordata analysis.
is the reproducibility of the bioreceptor immobilization process. An in-depth analysis ofthe techniques of probe immobilization onto sensor surfaces is presented in the followingsections.
3.5.1. Physical Adsorption
The most common techniques involve direct bonding of an antibody receptor to a reactivegroup coupled to the surface. The coupling agent and reactive group are generally selected tomatch the chemistry of the specific antibody. However, the adsorption process is difficult tocontrol and the amount of protein adsorbed to most solid surfaces is usually below that whichwould correspond to a close-packed monolayer. Further, during the adsorption, the exposureof internal hydrophilic groups of proteins to hydrophobic surfaces causes a decrease in theactivity and specificity of the protein/target interactions. In spite of these shortcomings ofthis method, direct physical adsorption is the simplest way of antibody immobilization on thesensor surface. This method has been successfully employed for immobilization of a widerange of biological elements directly onto piezoelectric electrodes, including anti-human serumalbumin (Muratsugu et al. 1993), IgG (Minunni, Skladal, and Mascini 1994), goat anti-ricinantibody (Carter et al. 1995a), anti-Vibrio Cholera (Carter et al. 1995a), African swine fevervirus protein (Uttenthaler, Kolinger, and Drost 1998), recombinant protein fragments of HIVspecific antibodies (Aberl and Wolf 1993), filamentous phage (Sykora 2003; Olsen et al. 2006;Nanduri et al. 2007; Olsen et al. 2007), lytic phage (Balasubramanian et al. 2007), and designerpeptides (Selz et al. 2006). Protein molecules adsorb strongly and irreversibly on gold surfacesdue to hydrophobic actions (Horisberger 1984, 1992).
Quantitative “dip and dry” deposition experiments can be used to monitor physicaladsorption of bioreceptors in the preparation of biosensors (Olsen et al. 2006). Dip and dry, asdescribed by Prusak-Sochaczewski and Luong (1990), is the change in the resonant frequency,

270 Eric Olsen et al.
Table 12.4. Quantity of filamentous phage physically adsorbed to resonators as a function of time
Incubation (min) –�f �Hz� �m �ng�d Phage adsorbed (virions)e
20 45a 795 1.80 ×10¹⁰
40 60b 1065 2.41 ×10¹⁰
60 92c 1625 3.68 ×10¹⁰
1080 136 2402 5.45 ×10¹⁰
1440 163 2880 6.50 ×10¹⁰
aMean average of 5 experiments, SD = 31.1 Hz.bMean average of 3 experiments, SD = 46.5 Hz.cMean average of 4 experiments, SD = 59.2 Hz.dAdsorbed phage mass as determined by Sauerbrey equation, �f = (0.0566)(�m).eQuantity of phage deposited to the active area (34.19 mm2) of the upper sensing electrode as calculated from �m/m , where the massof a single virion (m) is 2.66 ×10⁷ dal / 6.023 ×10²³ dal = 44.1 ×10⁻⁹ ng.
�f , of a dry TSM resonator prior to and after mass deposition. Using Sauerbrey’s (1959)equation, the physical adsorption of phage as a function of time can be determined. For example,Fig. 12.6a shows steady-state oscillation of a dry, clean resonator prior to the application of1 ml of diluted stock phage E2 in suspension (6�7×10¹⁰ virions/ml) (fS), followed by an 18 hincubation period at room temperature, removal (fR) of the phage suspension and washing withdegassed water, and finally drying, with a subsequent return to steady-state resonance (fE). Theresulting frequency change, �f , measured as a decrease, fS −fE, was –161 Hz, indicating thatphage adsorbed to the resonator. This can be contrasted to a control (Fig. 12.6b) consisting ofa clean TSM resonator tested with degassed water only, which indicated no frequency change(fS − fE = 0 Hz). Resonance frequency changes due to phage adsorption were determined forperiods up to 24 h (1440 min) (Table 12.4). When the quantity of adsorbed phage is graphedas a function of time the majority of phage appeared to adsorb within the first few hours afterdeposition was started (Olsen et al. 2006). The quantity of phage in virions can be calculatedfrom the total adsorbed biomass, �m, by estimating the mass of a single recombinant fd-tetphage at 2�66×107 daltons, based on 4000 pVIII outer coat proteins, each containing 55 aminoacids with a total molecular weight of 2�35 × 107 (Kouzmitcheva 2005), and DNA with amolecular weight of 3�04×106 (Petrenko 2004). As shown in Table 12.4, the total number ofphage particles deposited to the TSM resonator ranged from 1�8×10¹⁰ −6�5×10¹⁰ virions as afunction of exposure time (20 min –24 h, respectively) to phage in solution. Phage deposition tothe TSM was confirmed in real time by fluorescence microscopy for a period of two consecutivehours and characterized by strong, non-reversible binding under aqueous conditions (Olsenet al. 2006).
3.5.2. Other Coupling Methods
To overcome disadvantages of a direct physical adsorption method, a rangeof immobilization methods have been suggested, including lipid bilayer entrapment(Ramsden 1997a, 1997b, 1998, 1999, 2001), thiol/disulfide exchange, aldehyde and biotin-avidin coupling (Mittler-Neher et al. 1995), photo-immobilization to photolinker-polymer-precoated surfaces (Gao et al. 1994), molecular imprinted polymer layers (Dickert et al. 2003;Dickert, Lieberzeit, and Hayden 2003; Dickert et al. 2004), and site-specific immobilization ofstreptavidin (Tiefenauer et al. 1997).
3.5.3. Combined Langmuir-Blodgett/Molecular Assembling Method
A more advanced approach for the immobilization of antibodies for the immunosensorcoatings is through the combined Langmuir-Blodgett (LB)/molecular assembling method
Acoustic Wave (TSM) Biosensors: Weighing Bacteria 271
(Samoylov et al. 2002a, 2002b). The method includes LB deposition (Petty 1991; Pathiranaet al. 1992; Barraud et al. 1993; Pathirana 1993; Vodyanoy 1994; Bykov 1996; Pathirana et al. 1996;Sukhorukov et al. 1996; Pathirana, Neely, and Vodyanoy 1998; Olsen 2000; Pathirana et al. 2000;Olsen et al. 2003; Petrenko, Vodyanoy, and Sykora 2004; Olsen 2005; Olsen et al. 2007) of abiotinylated monolayer onto a sensor surface and non-LB, molecular self-assembling of a probelayer using biotin/streptavidin coupling (Furch et al. 1996; Volker and Siegmund 1997).
The combined LB/molecular assembling method has been demonstrated withbiosensors based on phage display-derived peptides as biorecognition molecules (Samoylovet al. 2002a, 2002b). Schematic design of the peptide sensor is shown in Fig. 12.8a. Monolayers
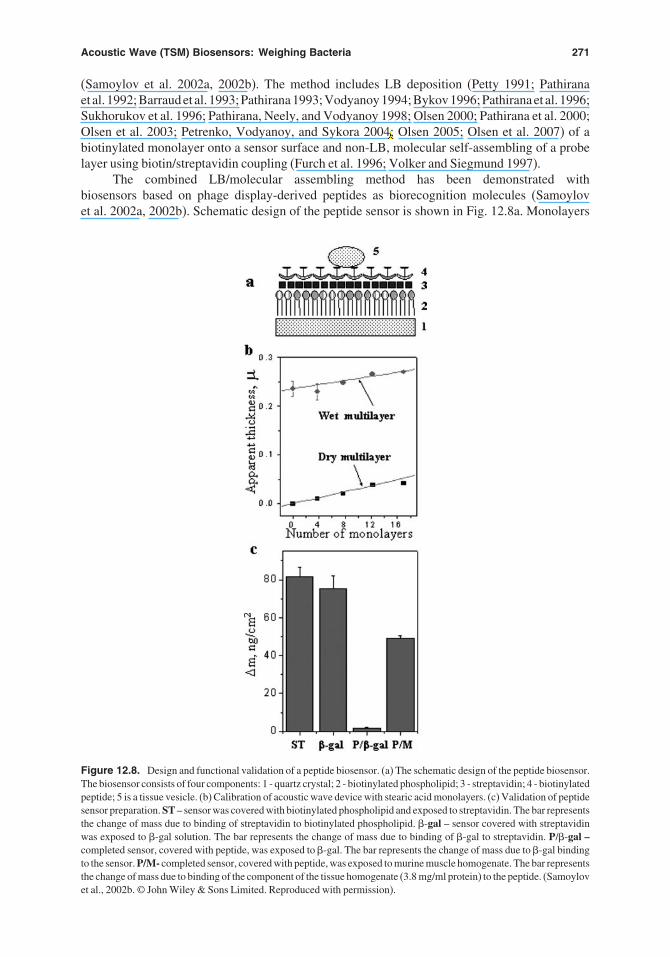
Figure 12.8. Design and functional validation of a peptide biosensor. (a) The schematic design of the peptide biosensor.The biosensor consists of four components: 1 - quartz crystal; 2 - biotinylated phospholipid; 3 - streptavidin; 4 - biotinylatedpeptide; 5 is a tissue vesicle. (b) Calibration of acoustic wave device with stearic acid monolayers. (c) Validation of peptidesensor preparation. ST – sensor was covered with biotinylated phospholipid and exposed to streptavidin. The bar representsthe change of mass due to binding of streptavidin to biotinylated phospholipid. -gal – sensor covered with streptavidinwas exposed to -gal solution. The bar represents the change of mass due to binding of -gal to streptavidin. P/-gal –completed sensor, covered with peptide, was exposed to -gal. The bar represents the change of mass due to -gal bindingto the sensor. P/M- completed sensor, covered with peptide, was exposed to murine muscle homogenate. The bar representsthe change of mass due to binding of the component of the tissue homogenate (3.8 mg/ml protein) to the peptide. (Samoylovet al., 2002b. © John Wiley & Sons Limited. Reproduced with permission).
vodyavi
Cross-Out
vodyavi
Replacement Text
7

272 Eric Olsen et al.
Figure 12.9. Langmuir-Blodgett (LB) monolayers. First, a monolayer is formed on a subphase surface and compressedto a desired surface pressure. A solid substrate is then moved through the monolayer vertically, so that it is dippedinto and withdrawn completely out of subphase. The first monolayer is transferred to the substrate like a carpet withthe tail groups toward the substrate surface during the downward movement of the substrate through the condensedmonolayer. A monolayer is transferred to the substrate both when it is raised through and when it is lowered into thesubphase through a compressed monolayer (reprinted from Yilma et al. 2007, with permission of Elsevier).
containing phospholipid, N-(biotinoyl)-1,2-dihexadecanoyl-sn-glycero-3-phosphoethanolamine(2), were transferred onto the gold surface of an acoustic wave sensor (1) using the Langmuir–Blodgett technique. Multilayers were obtained by successive dipping of the sensors through themonomolecular film deposited at a water-air interface (Fig. 12.9). Biotinylated peptide (4) wascoupled with the phospholipid via streptavidin intermediates (3) by molecular self-assembly.Measurements of binding of target vesicles were carried out using a PM-700 Maxtek platingmonitor with a frequency resolution of 0.5 Hz at 5 MHz. The device was calibrated with stearicacid monolayers. The deposition of increasing numbers of stearic acid monolayers on the surfaceof acoustic wave crystal resulted in linear increase of the mass (Fig 12.8b). The deposition of asingle monolayer of stearic acid on the crystal resulted in additional mass of 2�6×10⁻⁷g cm−2.This agrees well with the theoretical estimate based on the molecular area of stearic monolayer inthe condensed state (Davies and Rideal 1963). Binding of streptavidin to biotinylated phospho-lipid is an important step in immobilization because concentration and orientation of streptavidinmolecules determine the properties of a bound molecular probe. The change of mass due tostreptavidin binding normally reached 80 ng cm−2, or 8 × 10¹¹ molecules cm−2 (Fig. 12.8c—ST). When the samples were exposed to 500 nM biotinylated -gal for 2 h the apparent masschange was at the level of 80 ng cm−2, or 3�4 × 10¹¹ molecules cm−2 (Fig. 12.8c—-gal). Thecompleted biosensor, covered with the biotinylated peptide, no longer bound biotinylated -gal(Fig. 12.8c—P/ -gal), but strongly bound target vesicles (Fig. 12.8c—P/M).
The combined LB/molecular assembling method was also exercised in the immobilizationof filamentous phage onto the surface of thickness shear mode (TSM) quartz sensors (Petrenkoet al. 2005; Olsen et al. 2006, 2007). Monolayers containing biotinylated phospholipid were trans-ferred onto the gold surface of the sensor using the Langmuir-Blodgett technique (Fig. 12.9).Biotinylated phage was coupled with the phospholipid via streptavidin intermediates by molecularself-assembling. The dissociation constant of 0.6 nM found by this method compares well with onefound for antibodies isolated from a phage display library (Vaughan et al. 1996).
Acoustic Wave (TSM) Biosensors: Weighing Bacteria 273
3.5.4. Solvent-Free Purified Monolayers
An important aspect of sensor preparation is defining the conditions under whichmonolayers prepared with bioreceptors can be successfully formed on a liquid/gas interfaceand then optimized in terms of sensitivity, reliability, and useful lifetime. Although someeffects of pH, ionic strength, and oriented coupling on the immunosensor performance havebeen examined (Barraud et al. 1993; Ahmad and Ahmad 1996), detailed information about theinfluence of physical, chemical, and molecular environments on the antigen-antibody systemremains largely unknown.
Traditional methods for forming LB films (Gaines 1966) require dissolution of monolayerforming compounds into a volatile organic solvent. As a separate phase, the organic solventfunctions to prevent dissolution of the monolayer components in the aqueous phase. Whenthe mixture is spread onto an aqueous subphase solution at the air-liquid interface, the solventevaporates, leaving a monolayer at the interface. Unfortunately, the organic solvent oftendamages the monolayer components and leaves an undesirable residue (Sykora, Neely, andVodyanoy 2004). LB films formed from such monolayers may also possess unacceptable levelsof nonspecific binding (Ahluwalia et al. 1992), which is non-saturable and hampers quantitativemeasurement of specific binding. These problems can be solved using methods of monolayerformation that don’t require use of an organic solvent (Trurnit 1960; Sobotka and Trurnit 1961;Pattus, Desnuelle, and Verger 1978; Pattus and Rothen 1981; Pattus et al. 1981) and have beendemonstrated by immobilizing polyvalent somatic O antibodies specific for most Salmonellaserovars onto gold electrodes of TSM resonators using the LB method (Pathirana et al. 2000).
Many features of antibody immobilization originate from the very nature of the antibodyitself. Typical antibodies are Y-shaped molecules (2 Fab plus Fc immunoglobulin structure)with two antigen binding sites located on the variable region of the Fab fragments. All classesof antibody produced by B lymphocytes can be made in a membrane-bound form and ina soluble secreted form (Alberts et al. 1994). The two forms differ only in their carboxylterminals; the membrane-bound form has a hydrophobic tail (Fc) that anchors it in the lipidbilayer of the B cell membrane, whereas the secreted form has a hydrophilic tail, which allowsit to escape from the cell. Of these, only the form with a hydrophobic tail is capable ofbeing held by the monolayers. Thus, it is uniquely qualified for use in the Langmuir-Blodgetttechnique. This form also renders it suitable for proper alignment and orientation in sensormembranes.
Antibodies derived from immunized animals in the form of antisera or purified proteinpreparations can be present in both membrane-bound and soluble form and may containimpurities. Organic solvents used as a spreading carrier in LB monolayer preparation may dragthese impurities and both forms of antibodies into the monolayer. Furthermore, these methodsmay produce monolayers with high densities of antibodies but also with residuals of organicsolvent, impurities, and entrapped hydrophilic antibodies that destabilize the monolayer andmodulate antigen-antibody interactions. A monolayer with no solvent can be formed on theair-liquid interface by allowing the spreading solution to run down an inclined wetted planarsurface that is partially submersed into subphase (Fig. 12.10) (Pathirana et al. 2000). Membranevesicles (natural components of serum, or the artificial lipid vesicles) are positioned on a wetslide at the edge of a positive meniscus of liquid, at the liquid-air interface. The hydrophobicantibodies are bound to the vesicular membrane; hydrophilic antibodies and some impuritiesare suspended inside the vesicle. When surface forces rupture the vesicle, it splits into amonolayer and purification occurs. Membrane-bound antibodies are left bound to the newlycreated monolayer, but soluble antibodies and impurities dissipate into the subphase beneath themonolayer. Only membrane-bound antibodies surrounded by compatible lipids are left whenthe monolayer is compressed and transferred onto a sensor surface. Alternatively, probes can beconjugated with vesicles by covalent binding (Betageri et al. 1993). Lipid vesicles containingwhole antibodies or Fab fragments can also be constructed. Large, unilamellar liposomes

274 Eric Olsen et al.
Figure 12.10. Monolayer formation from lipid vesicles. Surface forces rupture the vesicle, splitting it into a monolayer.The monolayer, with the membrane-bound molecules, is then compressed and transferred onto the sensor surface(reprinted from Pathirana et al. 2000, with permission of Elsevier).
are prepared from synthetic L-�(1,2-dipalmitoyl-sn-glycero-3-phosphocholine) (DPPC) andmaleimido phenyl butyrate phosphatidylethanolamine (MPB-PE). Monoclonal antibodies (orFabs) with specificity for S. typhimurium or E. coli O157:H7 are modified by the heterobifunc-tional reagent N-Succinimydyl-3(2-pyridyldithio)propionate (SPDP) in the presence of dicetylphosphate and dithiothreitol (DTT) and conjugated to liposomes. The liposomes, containingspecific antibodies, are then converted into monolayers and deposited on the sensor surface bythe LB method (unpublished results).
3.5.5. Immobilization of Monolayers of Phage Coat Proteins
3.5.5.1. Phages As a Recognition Probe
A large number of bio-assays and biosensors depend on highly specialized, sensitive, andselective antibodies as recognition reagents (Goodchild et al. 2006). While antibodies frequentlyhave the desired sensitivity and selectivity, their use is limited by many factors. For example,the binding properties of antibodies may be lost due to unfavorable environmental conditions(Olsen et al. 2003). This factor can be especially important in dealing with environmentalapplications, where organic solvents must be used for extraction of compounds (Ahmad andAhmad 1996). Also, production of polyclonal antibodies requires a process that is very time-and labor-intensive, and can produce a variable product. Production of monoclonal antibodiesis often even more difficult and expensive. These limitations can be addressed in part by usingbacteriophage or their coat proteins as recognition elements for biosensors (Goldman et al. 2000;Petrenko et al. 2005; Nanduri et al. 2007). Both lytic and filamentous phages present reachlibraries to identify proteins interacting with molecular targets. In phage display, the phagefilament serves as the framework for random peptides that are fused to the N-terminus of everycopy of the major phage coat protein. These random peptides form the “active site” of thelandscape phage and comprise up to 25% by weight of the particle and up to 50% of its surfacearea (an extraordinarily high fraction compared with natural proteins, including antibodies)(Nanduri et al. 2007). A large mixture of such phages, displaying up to a billion different guestpeptides, is called a “landscape library.” From this library, phages can be affinity selected forspecificity to a certain antigen, thus functionally mimicking antibodies. These phages can beefficiently and conveniently produced and are secreted from the cell nearly free of intracellular
Acoustic Wave (TSM) Biosensors: Weighing Bacteria 275
components in a yield of about 20 mg/ml (Nanduri et al. 2007). The purification procedureis simple and does not differ dramatically from one clone to another. The surface density ofthe phage binding peptides is 300–400 m2/g, comparable to the best known absorbents andcatalysts (Nanduri et al. 2007), and with thousands of potential binding sites per particle,creates a multivalency. Other advantages of phages over antibodies include the extraordinaryrobustness of the phage particle. It is resistant to heat (up to 70 �C), many organic solvents (suchas acetonitrile), urea (up to 6M), acid, alkali, and many other stresses (Nanduri et al. 2007).Purified phages can be stored indefinitely at moderate temperatures without losing infectivity(Nanduri et al. 2007). Thus, phages may be viable as substitute antibodies in many applicationssuch as biosensors, affinity sorbents, hemostatics, etc. Numerous examples of uses of both lyticand filamentous phages as probes for biological detection in biosensors have been reportedin the literature (Chin et al. 1996; Ramirez et al. 1999; Goldman et al. 2000, 2002; Auneret al. 2003; Olsen et al. 2003; Sayler, Ripp, and Applegate 2003; Ozen et al. 2004; Petrenko,Vodyanoy, and Sykora 2004; Tabacco, Qian, and Russo 2004; Chen et al. 2005; Nanduri 2005;Petrenko et al. 2005; Sorokulova et al. 2005; Wu et al. 2005; Lakshmanan et al. 2006; Olsenet al. 2006; Balasubramanian et al. 2007; Nanduri et al. 2007).
3.5.5.2. Phage Coat Technology
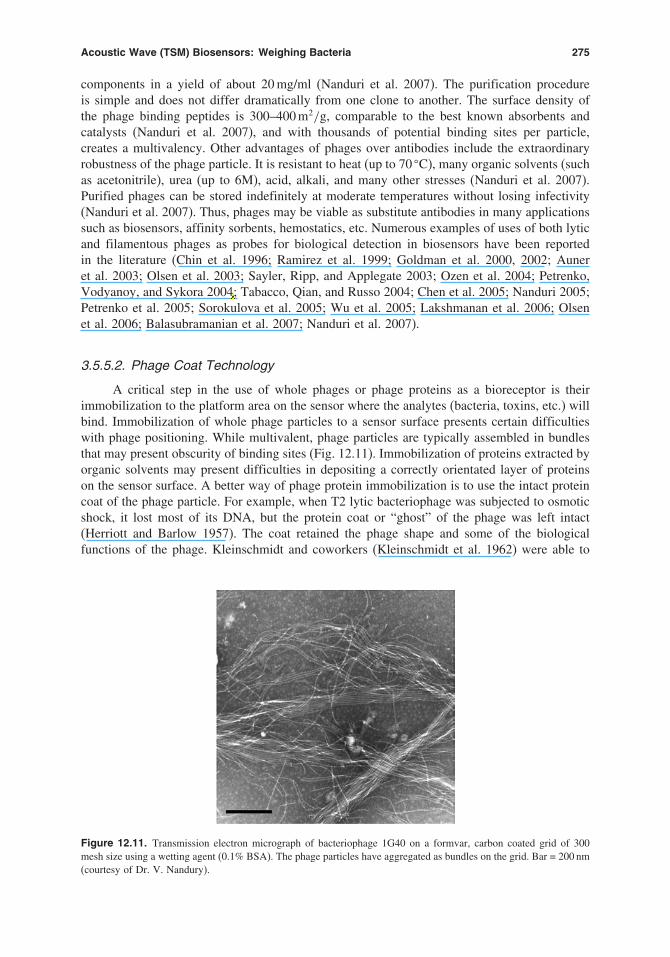
A critical step in the use of whole phages or phage proteins as a bioreceptor is theirimmobilization to the platform area on the sensor where the analytes (bacteria, toxins, etc.) willbind. Immobilization of whole phage particles to a sensor surface presents certain difficultieswith phage positioning. While multivalent, phage particles are typically assembled in bundlesthat may present obscurity of binding sites (Fig. 12.11). Immobilization of proteins extracted byorganic solvents may present difficulties in depositing a correctly orientated layer of proteinson the sensor surface. A better way of phage protein immobilization is to use the intact proteincoat of the phage particle. For example, when T2 lytic bacteriophage was subjected to osmoticshock, it lost most of its DNA, but the protein coat or “ghost” of the phage was left intact(Herriott and Barlow 1957). The coat retained the phage shape and some of the biologicalfunctions of the phage. Kleinschmidt and coworkers (Kleinschmidt et al. 1962) were able to
Figure 12.11. Transmission electron micrograph of bacteriophage 1G40 on a formvar, carbon coated grid of 300mesh size using a wetting agent (0.1% BSA). The phage particles have aggregated as bundles on the grid. Bar = 200 nm(courtesy of Dr. V. Nandury).
vodyavi
Cross-Out
vodyavi
Replacement Text
7

276 Eric Olsen et al.
convert T2 coat particles into protein monolayers by allowing the water suspension of coatparticles to run down a wet glass rod glass surface that was partially submersed into subphase(similar to that shown in Fig. 12.10) (Trurnit 1960; Sobotka and Trurnit 1961; Pattus, Desnuelle,and Verger 1978; Pattus and Rothen 1981; Pathirana et al. 2000).
Monolayers made of the phage coats transferred to solid substrates were first described byKleinschmidt et al. (1962). A similar approach was applied to obtain monolayers of filamentousphages. Griffith and coworkers (Griffith, Manning, and Dunn 1981; Petrenko, Vodyanoy,and Sykora 2004; Olsen 2005) demonstrated that filamentous bacteriophages transformed intohollow spherical particles upon exposure to a chloroform-water interface. These particles couldthen be converted into monolayers and deposited onto solid substrate by the LB method(Sykora 2003; Olsen 2005). Thus, the technology of phage coat immobilization consists ofthree major steps: phages are first converted into spheroids, monolayers are formed from thespheroids, and finally the monolayers are deposited onto the sensor surface by the LB method.
Phage coat monolayers made of coats of lytic and filamentous phages have been immobi-lized onto biosensor surfaces. When a suspension of filamentous phage protein streptavidinbinder, 7b1, (Petrenko and Smith 2000) was vortexed with an equal volume of chloroform andthe aqueous phase was examined by electron microscopy, spherical particles termed “spheroids”were observed along with other semicircular particles that may be intermediates in the filamentto spheroid conversion (Griffith, Manning, and Dunn 1981).
Chloroform transforms the infectious phage filaments into non-infective hollow spheres.This drastically alters the surface architecture of the phage. As well, the �-helix content of pVIIIdecreases from 90% to 50–60% (Griffith, Manning, and Dunn 1981; Roberts and Dunker 1993).Spheroids are formed when the coat proteins contract into vesicle-like structures and two-thirdsof the phage DNA is extruded (Griffith, Manning, and Dunn 1981). An electron micrograph ofthis is shown in Fig. 12.12 (Petrenko, Vodyanoy, and Sykora 2004). Similar hollow spheroidscan be obtained by the same method from phage f8–1 that bind Salmonella typhimurium(Olsen 2005). Olsen formed LB monolayers from the spheroid suspension using a wetted glassrod that was partially submersed into the subphase (Trurnit 1960; Sobotka and Trurnit 1961;Kleinschmidt et al. 1962; Pattus and Rothen 1981; Pathirana et al. 2000; Petrenko, Vodyanoy,and Sykora 2004; Olsen 2005). After the vesicle slid down the glass rod and reached theair-water interface, surface forces ruptured the vesicle and split it into a monolayer.
Compression of an LB monolayer prepared from a spheroid suspension yields a pressure(�)-area (A) isotherm (Fig. 12.13) (Sykora 2003). The curve is biphasic, having a small “kink”
Figure 12.12. Electron micrographs of 7b1 filamentous bacteriophage following chloroform treatment. Sample wasstained with 2% phosphotungistic acid. Spherical particles are called “spheroids.” Mag., 302,500x (A) and 195,300x(B) (Olsen et al. 2007; reproduced by permission of The Electrochemical Society).
vodyavi
Cross-Out
vodyavi
Replacement Text
7
vodyavi
Cross-Out
vodyavi
Replacement Text
7
vodyavi
Cross-Out
vodyavi
Replacement Text
7
Acoustic Wave (TSM) Biosensors: Weighing Bacteria 277
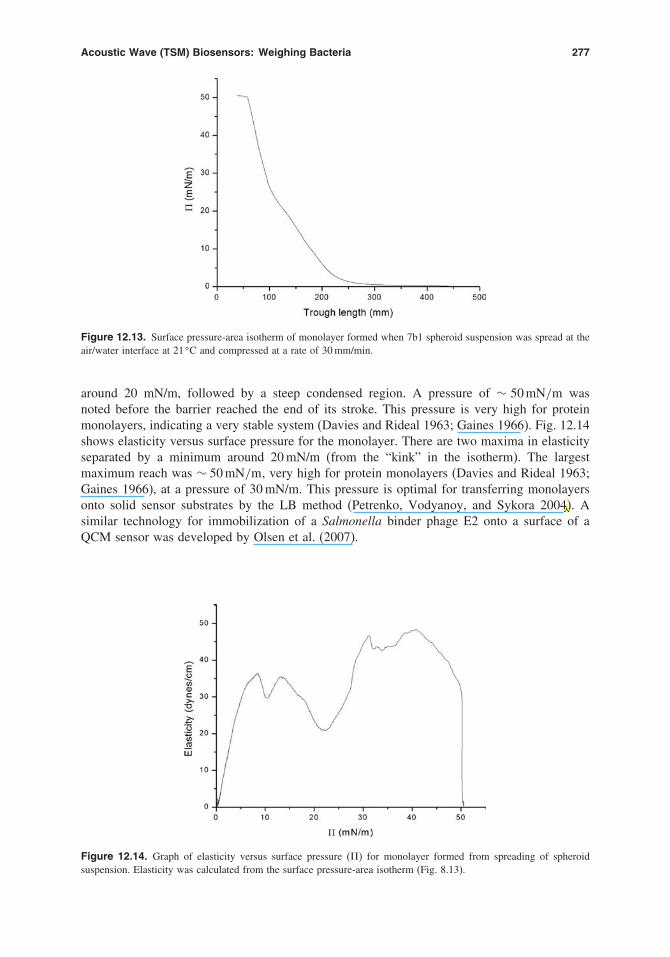
Figure 12.13. Surface pressure-area isotherm of monolayer formed when 7b1 spheroid suspension was spread at theair/water interface at 21 �C and compressed at a rate of 30 mm/min.
around 20 mN/m, followed by a steep condensed region. A pressure of ∼ 50 mN/m wasnoted before the barrier reached the end of its stroke. This pressure is very high for proteinmonolayers, indicating a very stable system (Davies and Rideal 1963; Gaines 1966). Fig. 12.14shows elasticity versus surface pressure for the monolayer. There are two maxima in elasticityseparated by a minimum around 20 mN/m (from the “kink” in the isotherm). The largestmaximum reach was ∼ 50 mN/m, very high for protein monolayers (Davies and Rideal 1963;Gaines 1966), at a pressure of 30 mN/m. This pressure is optimal for transferring monolayersonto solid sensor substrates by the LB method (Petrenko, Vodyanoy, and Sykora 2004). Asimilar technology for immobilization of a Salmonella binder phage E2 onto a surface of aQCM sensor was developed by Olsen et al. (2007).
Figure 12.14. Graph of elasticity versus surface pressure (�) for monolayer formed from spreading of spheroidsuspension. Elasticity was calculated from the surface pressure-area isotherm (Fig. 8.13).
vodyavi
Cross-Out
vodyavi
Replacement Text
7

278 Eric Olsen et al.
3.5.5.3. Phage Coat Protein Structure
The amino acid sequence of the pVIII coat protein from phage 7b1 with the foreignoctapeptide insert is shown in Fig. 12.15. Conformation of the pVIII binding peptide at boththe air/water interface and on the sensor surface can be elucidated based on the amino acidsequence. The octapeptide insert consisting of residues number 2 through 9 is located at theN-terminal region. Based on the amino acid sequence, the peptide is expected to have three �-helical regions according to both the Garnier-Robson (Garnier, Osguthorpe, and Robson 1978)and Chou-Fasman (Chou and Fasman 1974) calculation methods, as shown in Fig. 12.16. Thecentral region of the peptide is hydrophobic, while the N-terminal and C-terminal regions aresomewhat hydrophilic. This hydrophobic region is the part of the peptide that spans the bacterialcell membrane during assembly (Bashtovyy et al. 2001; Houbiers et al. 2001; Branch andBrozik 2004; Houbiers and Hemminga 2004; Aisenbrey et al. 2006). Most of the amphipathicand flexible regions of the peptides correspond with the hydrophilic regions of the peptide.According to calculations of the antigenic index, the most probable antigen-binding region lieson the N-terminus, which is the region where the octapeptide insert is located.
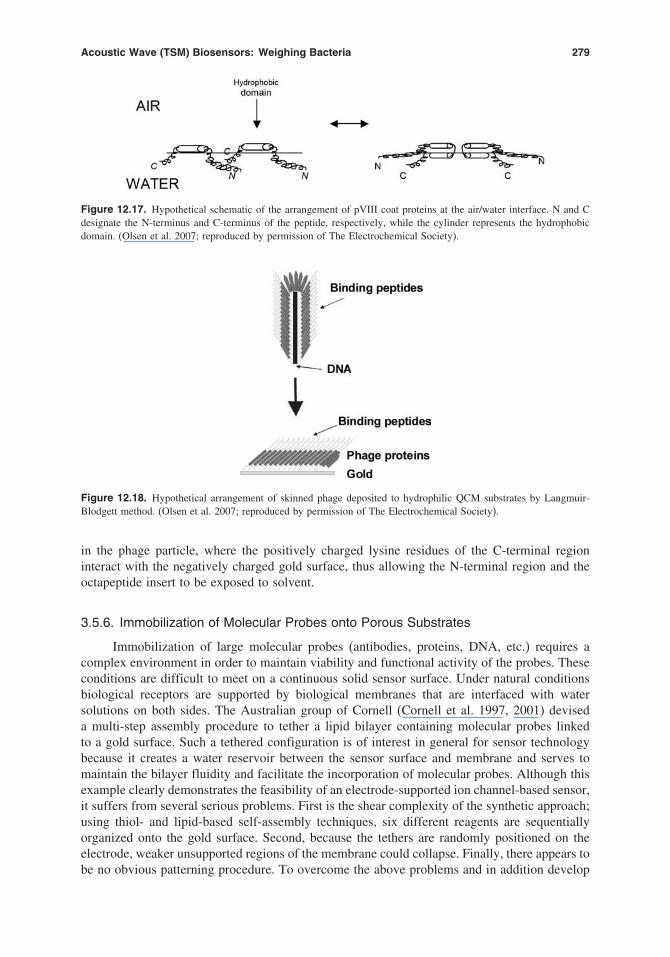
A hypothetical arrangement of the pVIII coat proteins at the air/water interface is shownin Fig. 12.17. Here, the hydrophilic N-terminal and C-terminal �-helices interact with the waterphase while the central hydrophobic region remains at the interface. A hypothetical arrangementof these peptides on the sensor surface is subsequently shown in Fig. 12.18 (Bashtovyyet al. 2001; Houbiers et al. 2001; Houbiers and Hemminga 2004; Im and Brooks 2004; Aisenbreyet al. 2006). Here the peptides are suggested to be arranged in a conformation similar to that
Figure 12.15. Amino acid sequence of 7b1 filamentous bacteriophage pVIII coat protein. The foreign octapeptideinsert, VPEGAFSS (underlined region 1), is located between residues 1 and 10 at the N-terminal portion (N) of theprotein. The hydrophobic region of the protein is underlined. C designates the C-terminus of the peptide.
Figure 12.16. DNASTAR analysis of pVIII phage coat protein: (A) �-helical regions (Garnier-Robson method);(B) �-helical regions (Chou-Fasman method); (C) hydrophilicity plot; (D) �-helical amphipathic regions; (E) -sheetamphipathic regions; (F) flexible regions; (G) antigenic index. (Olsen et al. 2007; reproduced by permission of TheElectrochemical Society).
Acoustic Wave (TSM) Biosensors: Weighing Bacteria 279
Figure 12.17. Hypothetical schematic of the arrangement of pVIII coat proteins at the air/water interface. N and Cdesignate the N-terminus and C-terminus of the peptide, respectively, while the cylinder represents the hydrophobicdomain. (Olsen et al. 2007; reproduced by permission of The Electrochemical Society).
Figure 12.18. Hypothetical arrangement of skinned phage deposited to hydrophilic QCM substrates by Langmuir-Blodgett method. (Olsen et al. 2007; reproduced by permission of The Electrochemical Society).
in the phage particle, where the positively charged lysine residues of the C-terminal regioninteract with the negatively charged gold surface, thus allowing the N-terminal region and theoctapeptide insert to be exposed to solvent.
3.5.6. Immobilization of Molecular Probes onto Porous Substrates
Immobilization of large molecular probes (antibodies, proteins, DNA, etc.) requires acomplex environment in order to maintain viability and functional activity of the probes. Theseconditions are difficult to meet on a continuous solid sensor surface. Under natural conditionsbiological receptors are supported by biological membranes that are interfaced with watersolutions on both sides. The Australian group of Cornell (Cornell et al. 1997, 2001) deviseda multi-step assembly procedure to tether a lipid bilayer containing molecular probes linkedto a gold surface. Such a tethered configuration is of interest in general for sensor technologybecause it creates a water reservoir between the sensor surface and membrane and serves tomaintain the bilayer fluidity and facilitate the incorporation of molecular probes. Although thisexample clearly demonstrates the feasibility of an electrode-supported ion channel-based sensor,it suffers from several serious problems. First is the shear complexity of the synthetic approach;using thiol- and lipid-based self-assembly techniques, six different reagents are sequentiallyorganized onto the gold surface. Second, because the tethers are randomly positioned on theelectrode, weaker unsupported regions of the membrane could collapse. Finally, there appears tobe no obvious patterning procedure. To overcome the above problems and in addition develop

280 Eric Olsen et al.
qualitatively new functionalities, thin porous substrates of silica have been developed (Fanet al. 2000; Jiang et al. 2006; Nishiyama et al. 2006; Xomeritakis et al. 2007). These filmscan be used as a new type of support for molecular probes in biosensors (Thust et al. 1999;Bessueille et al. 2005; Gawrisch et al. 2005; Yun et al. 2005; Dai, Baker, and Bruening 2006;Song et al. 2006). In our laboratory we have immobilized the antimycotic agent amphotericinB onto the porous silicon surface and observed ion currents associated with ion conductance ofamphotericin B ion channels connected to internal and external reservoirs of liquids separatedby a membrane (Yilma et al. 2007a, 2007b).
4. Problem of “Negative Mass”
The thickness shear mode quartz crystal resonator (QCM) is often considered a mass-sensitive sensor. During the sensing process, it’s expected that the response (frequency change,�f ) of the sensor is directly related to any additional mass that adheres to the resonator, usuallyresulting in a resonance frequency decrease ��f < 0�. Sauerbrey (1959) demonstrated this forthin, rigid layers (like metal film). For mass m the frequency decrease is
�f = −f0
�m
Mq
�
where, f0 is the resonance frequency and Mq is the mass of a quartz oscillator. However,use of QCM for in situ bacteria and cell detection in fluids has revealed more complexsensor responses. For example, the observed value of �fI differs from that predicted bySauerbrey’s (1959) relation, and the signal is often small (Thompson et al. 1991; Voinova,Jonson, and Kasemo 2002).
Observed deviations from Sauerbrey’s (1959) predicted mass theory have been notedduring sensor testing under liquid conditions using both antibodies (Olsen et al. 2003) andphages (Olsen et al. 2006) as bioreceptors. The most peculiar results show that under certainconditions there is an appearance of a negative apparent mass; i.e., with increasing bacterialconcentration there can be a dose-dependent decrease of the apparent mass. It is possible thatthe bacterial microenvironment and location of the antigen on the surface of a bacterium candetermine the value and sign of the analytical signal generated by the acoustic wave device(Olsen et al. 2003). Bacterial positioning and binding may be very important at the solid/liquidinterface of the sensor and factors such as viscoelasticity, shear forces and damping. Forexample, in our studies using Salmonella and E. coli antibodies as receptors (Olsen et al. 2003),when attachment between bacteria and bacteria-specific somatic O antibodies at the solid-liquid interface of a TSM resonator was rigid and strong, the sensor’s output was directlyproportional to the logarithmic concentration of free bacteria in suspension, and the sensor’sbehavior could be described as that predicted by mass theory (�f < 0) (Fig. 12.19a). Conversely,flexible binding observed for bacteria attached by flagella to immobilized flagellar H antibodiesresulted in inversely proportional sensor signals ��f > 0� (Fig. 12.19b). This premise wasaffirmed by studying the responses of environmentally aged sensors. Sensor responses andbinding efficiency, confirmed by dark-field microscopy, decreased as the duration of sensorenvironmental aging under differing conditions of temperature increased (Fig. 12.20).
Viscoelastic properties of the bacterial layer attached to the surface are anticipated to bedifferent depending on the mechanism of binding—somatic or flagellar. Also, the viscous shearand viscous drag forces of the attached bacteria are very different. Clearly, bacteria rigidlyor flexibly attached (Fig. 12.21) take different roles in the oscillation of the whole system.When binding is rigid, bacteria oscillate in unison with the sensor and therefore contribute tothe effective oscillating mass of the system. This is shown by the increase of the apparent
vodyavi
Cross-Out
vodyavi
Inserted Text
Delete "I"

Acoustic Wave (TSM) Biosensors: Weighing Bacteria 281
Figure 12.19. Dose responses for rigid and flexible positioning of bacteria on biosensor: (A) Salmonella and E. colidose responses to sensor prepared with somatic O Salmonella antibodies; (B) Salmonella and E. coli dose responsesto sensor fabricated with flagellar H-type E. coli antibodies. Curves are sigmoid fit to experimental data. Straight linesare the linear least squares fit. Bars are SD (reprinted from Olsen et al. 2003, with permission of Elsevier).
mass when bacterial binding concentration is increased. Conversely, in the case of flexibleattachment, the oscillation of the bacteria may be not in phase with the oscillation of the sensor,resulting in a decrease in the apparent mass even when concentration of binding bacteria isincreased. Additionally, we propose that the electrically charged bacterium on the surface ofan acoustic wave sensor is not only engaged in the mechanical oscillations of the crystal butalso directly interacts with the electric field driving the sensor crystal. This field drives thepiezoelectric quartz crystal and at the same time creates an electrophoretic force applied to theelectrically charged bacterium. The piezoelectric and electrophoretic forces can be of differentvalues and directions, depending on the positioning of bacteria by the O antigen (Fig. 12.21a—firm positioning) or the H antigen (Fig. 12.21a—flexible attachment), and their combinationmay contribute to the change of the apparent mass of the bacteria as measured by the acousticwave device. Obstruction of antibodies by the buildup of a biofilm during aging may causedecreased accessibility to bacterial targets (Fig. 12.21a—weak binding).
In contrast with Sauerbrey’s (1959) observations for a thin, firmly attached film, thisseeming contradiction of normal mass loading theory is consistent with the observations of
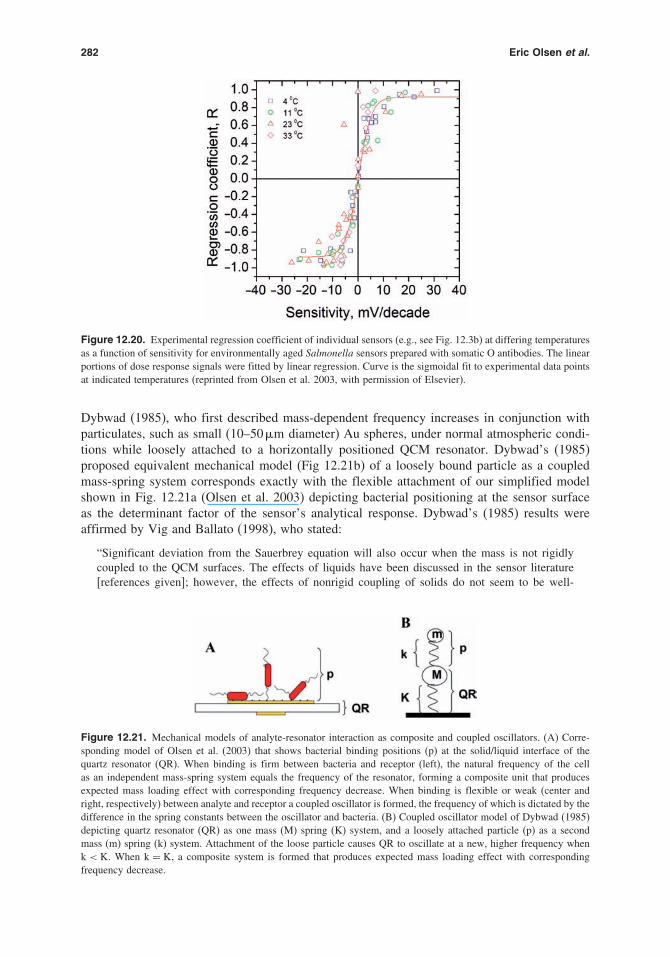
282 Eric Olsen et al.
Figure 12.20. Experimental regression coefficient of individual sensors (e.g., see Fig. 12.3b) at differing temperaturesas a function of sensitivity for environmentally aged Salmonella sensors prepared with somatic O antibodies. The linearportions of dose response signals were fitted by linear regression. Curve is the sigmoidal fit to experimental data pointsat indicated temperatures (reprinted from Olsen et al. 2003, with permission of Elsevier).
Dybwad (1985), who first described mass-dependent frequency increases in conjunction withparticulates, such as small (10–50 �m diameter) Au spheres, under normal atmospheric condi-tions while loosely attached to a horizontally positioned QCM resonator. Dybwad’s (1985)proposed equivalent mechanical model (Fig 12.21b) of a loosely bound particle as a coupledmass-spring system corresponds exactly with the flexible attachment of our simplified modelshown in Fig. 12.21a (Olsen et al. 2003) depicting bacterial positioning at the sensor surfaceas the determinant factor of the sensor’s analytical response. Dybwad’s (1985) results wereaffirmed by Vig and Ballato (1998), who stated:
“Significant deviation from the Sauerbrey equation will also occur when the mass is not rigidlycoupled to the QCM surfaces. The effects of liquids have been discussed in the sensor literature[references given]; however, the effects of nonrigid coupling of solids do not seem to be well-
Figure 12.21. Mechanical models of analyte-resonator interaction as composite and coupled oscillators. (A) Corre-sponding model of Olsen et al. (2003) that shows bacterial binding positions (p) at the solid/liquid interface of thequartz resonator (QR). When binding is firm between bacteria and receptor (left), the natural frequency of the cellas an independent mass-spring system equals the frequency of the resonator, forming a composite unit that producesexpected mass loading effect with corresponding frequency decrease. When binding is flexible or weak (center andright, respectively) between analyte and receptor a coupled oscillator is formed, the frequency of which is dictated by thedifference in the spring constants between the oscillator and bacteria. (B) Coupled oscillator model of Dybwad (1985)depicting quartz resonator (QR) as one mass (M) spring (K) system, and a loosely attached particle (p) as a secondmass (m) spring (k) system. Attachment of the loose particle causes QR to oscillate at a new, higher frequency whenk < K. When k = K, a composite system is formed that produces expected mass loading effect with correspondingfrequency decrease.

Acoustic Wave (TSM) Biosensors: Weighing Bacteria 283
known. For example, when a particle is placed on an electrode of a QCM, the Sauerbrey equationpredicts a decrease in the frequency of the QCM, but the frequency actually increases. When theparticle on the resonator is modeled as a coupled oscillator, the model correctly predicts a frequencyincrease [as verified by Dybwad (1985)].”
This type of behavior has been documented in the literature on several occasions. Berg,Johannsmann, and Ruths (2002) used a single asperity contact to show that frequency shiftsassociated with a quartz resonator operating in shear mode increased linearly with increasingcontact radius. Borovsky et al. (2001) used a nanoindenter probe in conjunction with a QCMto elicit positive frequency shifts characteristic of the contact stiffness. Sorial and Lec (2004)experienced size-dependent frequency increases with polystyrene spheres using a QCM underaqueous conditions. Otto et al. (1999) observed diminished, �f < 0, response for weaker bacteriaattachment using an E. Coli QCM sensor. Other documented reports of negative apparent massusing QCM-based platforms include Hayden et al. (2003) and Dickert et al. (2003), in responseto loose binding of bacterial cells in yeast imprinted layers; Dickert et al. (2004), due toloose binding of non-specific compounds to tobacco mosaic virus imprinted polymers; Marxeret al. (2003), who attributed frequency increases to alterations in cytosolic viscosity of adsorbedepithelial cells; Thompson, Arthur, and Dhaliwal (1986), due to immunochemical interactionsresulting in decreased acoustic transmission at the liquid/solid interface; and Pereira de Jesus,Naves, and Lucia do Lago (2002), as a result of polymeric film stiffness in the determination ofboron. More recently, Lucklum (2005) described non-gravimetric contributions of viscoelasticfilms at the solid/liquid interface, resulting in positive frequency shifts. He clearly showed thattypical elastic and energy dissipation properties are as important to frequency response, bothpositive and negative, as the layer’s mass and therefore in many cases the added mass cannot bedetermined simply from the QCM response alone. The author correctly notes that the traditionalname “quartz crystal microbalance (QCM)” as a technique is misleading.
Collectively, these reports support our hypothesis that positive frequency shifts can beobserved under certain conditions as a result of viscoelastic changes at the solid/liquid interfacefrom surface films, bioreceptor layers, and bacterial attachment. We contend that the continuousmodel of the viscoelastic layer is not directly applicable to the bacterial sensing. This isa consideration for researchers in terms of the importance of bacterial attachment schemes(bioreceptors) that result in high-affinity and multiple binding valences. In the next section,we present a coupled oscillators model that explicitly accounts for discrete events of bacteriaattachment in terms of the elastic constant and the dissipation of the bond between bacteria andthe sensor surface. This model is in agreement with our previous model (Olsen et al. 2003),since the parameters of an LRC series equivalent circuit model of the QCM are perfectlyanalogous to a damped harmonic oscillator system (Table 12.5).
Table 12.5. Analogous parameters between a mechanical spring-mass system and LRC series circuit
System
Harmonic Oscillator Unit LRC Circuit Unit
Displacement x Charge qVelocity v Current lForce F Voltage VMass m Inductance LDamping constant b Resistance RSpring constant k Capacitance−1 1/CNatural frequency o = (k/m)1/2 Natural frequency o = (1/C)1/2

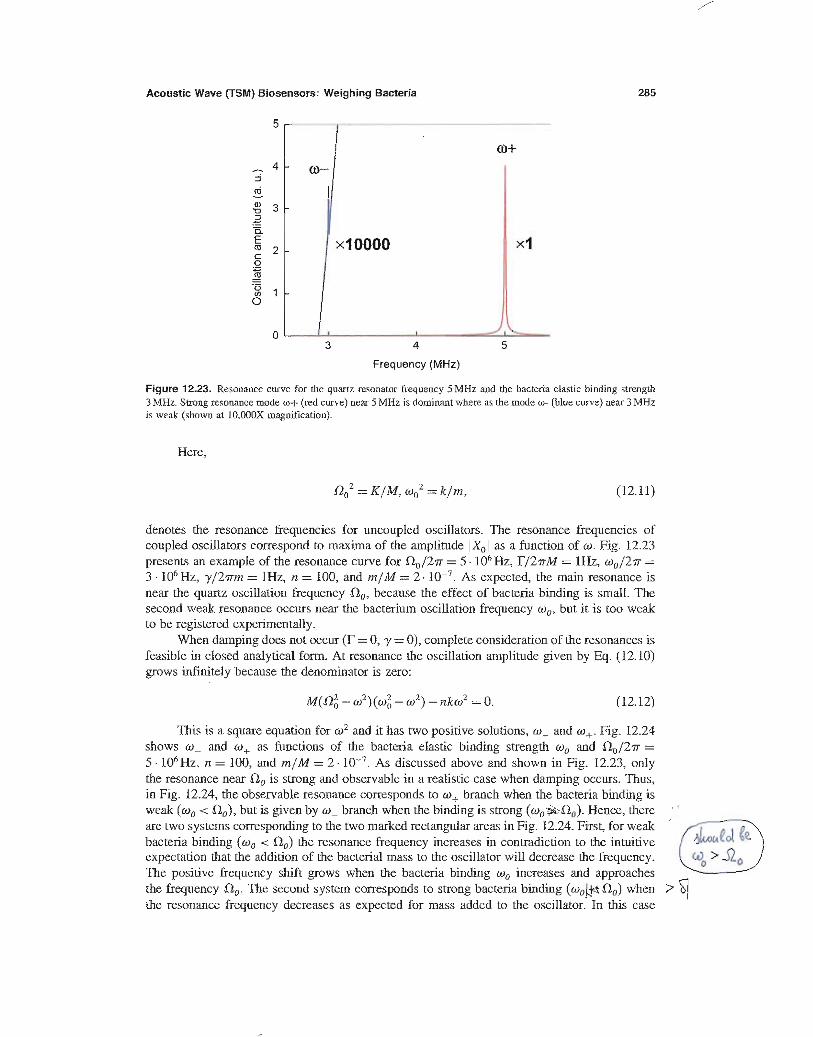

286 Eric Olsen et al.
Figure 12.24. Frequency of two resonance modes + and - as a function of the elastic binding strength of thebacteria. Each mode is strong only in the binding range denoted by the corresponding rectangle box. The mode becomesweak and finally unobservable when its frequency departs from the resonance frequency of 5 MHz.
the frequency shift becomes smaller when bacteria binding �0 increases. These results arealso valid in the realistic case of non-zero damping (�/2�M = �/2�M = 1 Hz), as shown inFig. 12.25. Again the resonance frequency shift is positive for weak and negative for strongbacterial elastic binding.
The different behavior for weak and strong bacterial attachment can be understood fromthe bacterial oscillator equations of motion. We evaluate Eq. (12.9) at the frequency �0
xi0 = X0(1− �2
0
�20
)2
+ �2�20
k2
(1− �2
0
�20
− i��0
k
)� (12.13)
Figure 12.25. Resonance curves for different bacteria elastic binding strengths at 0 (no binding), 2, 3, 10, and100 MHz, as noted. Notice that the shift of resonance frequency changes from negative to positive as the bindingdecreases below the resonance frequency of 5 MHz.

Acoustic Wave (TSM) Biosensors: Weighing Bacteria 287
The relative phase of xi0 with respect to X0 in Eq. (12.13) is the phase of the multiply
(1− �2
0
�20
− i��0
k
)� (12.14)
For weak attachment (�0 < �0), the real part of this complex number is negative. Thismeans that for small � the bacteria and quartz surface oscillate with the phase shift close to180�, i.e., anti-phase. Hence, the bacterial oscillator pushes the quartz oscillator towards theequilibrium position (Fig. 12.25). This increases the restoring force and thus also increasesthe resonance frequency of the quartz oscillator. In the case of strong bacteria attachment(�0 > �0), the bacterial and quartz oscillators move approximately in the same phase and thefrequency decreases. Therefore, the model of coupled oscillators clearly reveals the mechanismof the apparent “negative mass” effect.
To discuss the performance and rational design of the bacterial sensor we calculated thefrequency response as a function of the number of attached bacteria. Fig. 12.26 shows theresults for different strengths of the elastic attachment bond. The output signal (frequency shift)is considerably stronger for strong attachment. This suggests using a strong attachment methodto achieve a low bacteria detection threshold. Importantly, a substantial linear range of detectionoccurs that is especially broad for weak attachment. This allows finding the number of attachedbacteria by calibration measurement of only the initial slope of the response curve. Additionally,we modeled the effect of inhomogeneous bacterial binding strength. Fig. 12.27 shows that fortwo types of binding sites with 2 and 10 MHz attachment strength, the response of a 5 MHzsensor crucially depends on the distribution of bacteria between the sites. In particular, at about0.8/0.2 distribution, the signal is very small and thus a false negative result will be measured.This underlines the importance of using the bioreceptors with a narrow distribution of strongbinding strengths.
Figure 12.26. Resonance frequency as a function of the number of bacteria attached for different elastic bindingstrengths at 0, 2, 3, 10, and 100 MHz, as indicated. Notable is substantial linear dynamic range increasing for weakerattachment.

288 Eric Olsen et al.
Figure 12.27. The effect of inhomogeneous bacterial binding strength on sensor. The response of a 5 MHz sensorcrucially depends on distribution of bacteria between the two types of binding sites with 2 and 10 MHz attachmentstrength. In particular, at about 0.8/0.2 distribution, the signal is very small and thus a false negative result will bemeasured.
6. Conclusions
Even though acoustic wave technologies such as the TSM are not new, their adaptation tobiological analysis has flourished mainly in the past decade. Most likely the next ten years willsee an even larger contingent of researchers developing biosensors based on these platformsas affordability, access, sensitivity, and technical understanding increase. The most remarkableproperty of acoustic wave devices is their relative simplicity. The number of different devicesadapted to work in the biological/medical environment is likely to expand in the future. Itis therefore vital to establish a good understanding of the nature of the signals produced byacoustic wave devices when they are used for testing bacteria. The paradox of “negative mass”is a real threat to the interpretation of experimental results related to the detection of bacteria.Knowledge of the true nature of “negative mass” linked to the strength of bacteria attachmentwill contribute significantly to our understanding of the results of “weighing bacteria.” Wehope it may stimulate increased interest in the technology and motivate new experiments witha variety of microorganisms. The impact of these studies may extend beyond an appreciationof bacterial detection. One may now begin to conceive of strategies for the study and controlof processes of bacterial settlement, bacterial colonization, biofilm formation, and bacterialinfection in which bacterial attachment plays a role.
Acknowledgments
Our work was supported by grants from Sigma Xi Grants-in-Aid of Research (10040088),DARPA (MDA972–00–1-0011), ARO/DARPA (DAAD 19–01–10454), NIH (R21 AI055645),USDA (99–34394–7546), and Aetos Technologies Inc. We are grateful to Dr. Bryan Chin forsupport and dialogue, and Oleg Pustovyy for technical assistance. The views expressed in thisarticle are those of the authors, and do not reflect the official policy or position of the UnitedStates Air Force, Department of Defense, or the U.S. Government.

Acoustic Wave (TSM) Biosensors: Weighing Bacteria 289
References
Aberl F and Wolf H (1993) Present trends in immunosensors. LaborPraxis 70–74, 76–77Ahluwalia A, Derossi D, Ristori C, Schirone A and Serra G (1992) A comparative study of protein immobilization
techniques for optical immunosensors. Biosens. Bioelectron. 7:207–214Ahmad A and Ahmad S (1996) Solvent effect on antibody antigen interaction. Environ. Res. 5:29–36Aisenbrey C, Harzer U, Bauer-Manz G, Bar G, Chotimah INH, Bertani P, Sizun C, Kuhn A and Bechinger B (2006)
Proton-decoupled 15N and 31P solid-state NMR investigations of the Pf3 coat protein in oriented phospholipidbilayers. FEBS Journal 273:817–828
Aizawa H, Kurosawa S, Tanaka M, Yoshimoto M, Miyake J and Tanaka H (2001) Rapid diagnosis of Treponemapallidum in serum using latex piezoelectric immunoassay. Anal. Chim. Acta 437:167–169
Alberts B, Bray D, Lewis J, Raff M, Roberts K and Watson JD (1994) Molecular biology of the cell, 3rd ed. NewYork: Garland Publishing
Auner GW, Shreve G, Ying H, Newaz G, Hughes C and Xu J (2003) Dual-mode acoustic wave biosensors microarrays.Proc. SPIE Int. Soc. Opt. Eng. 5119:129–139
Babacan S, Pivarnik P, Letcher S., and Rand, A.G. 2000. Evaluation of antibody immobilization methods for piezo-electric biosensor application. Biosens. Bioelectron. 15:615–621
Babacan, S., Pivarnik, P, Letcher S and Rand AG (2002) Piezoelectric flow injector analysis biosensor for the detectionof Salmonella typhimurium. J. Food Sci. 61: 314–320
Bailey CA, Fiebor B, Yen W, Vodyanoy V, Cernosek RW and Chin BA (2002) Thickness shear mode (TSM) resonatorsused for biosensing. Proc. SPIE Int. Soc. Opt. Eng. 4575:138–149
Balasubramanian S, Sorokulova IB, Vodyanoy VJ and Simonian AL (2007) Lytic phage as a specific and selective probefor detection of Staphylococcus aureus—A surface plasmon resonance spectroscopic study. Biosens. Bioelectron.22:948–955
Ballantine DS, White RM, Martin SJ, Ricco AJ, Zellers ET, Frye GC, Wohltjen H, Levy M and Stern R (1997)Acoustic Wave Sensors: Theory, Design, & Physico-Chemical Applications. Academic Press, San Diego
Bandey HL, Martin SJ, Cernosek RW and Hillman AR (1999) Modeling the responses of thickness-shear moderesonators under various loading conditions. Anal. Chem. 71:2205–2214
Bao L, Deng L, Nie L, Yao S and Wei W (1996a) Determination of microorganisms with a quartz crystal microbalancesensor. Anal. Chim. Acta 319:97–101
Bao L, Deng L, Nie L, Yao S and Wei W (1996b) A rapid method for determination of Proteus vulgaris with apiezoelectric quartz crystal sensor coated with a thin liquid film. Biosens. Bioelectron. 11:1193–1198
Barraud A, Perrot H, Billard V, Martelet C and Therasse J (1993) Study of immunoglobulin G thin layers obtained bythe Langmuir-Blodgett method: application to immunosensors. Biosens. Bioelectron. 8:39–48
Bashtovyy D, Marsh D, Hemminga MA and Pali T (2001) Constrained modeling of spin-labeled major coat proteinmutants from M13 bacteriophage in a phospholipid bilayer. Protein Sci. 10:979–987
Ben-Dov I, Willner I and Zisman E (1997) Piezoelectric immunosensors for urine specimens of Chlamydia trachomatisemploying quartz crystal microbalance microgravimetric analyses. Anal. Chem. 69:3506–3512
Berg S, Johannsmann D and Ruths M (2002) Frequency response of quartz crystal shear-resonator during an adhesive,elastic contact in a surface forces apparatus. J. Appl. Phys. 92:6905–6910
Berkenpas E, Millard P and Pereira da Cunha M (2006) Detection of Escherichia coli O157:H7 with langasite pureshear horizontal surface acoustic wave sensors. Biosens. Bioelectron. 21:2255–2262
Bessueille F, Dugas V, Vikulov V, Cloarec JP, Souteyrand E and Martin JR (2005) Assessment of porous siliconsubstrate for well-characterized sensitive DNA chip implement. Biosens. Bioelectron. 21: 908–916
Betageri GV, Black CD, Szebeni J, Wahl LM and Weinstein JN (1993) Fc-receptor-mediated targeting of antibody-bearing liposomes containing dideoxycytidine triphosphate to human monocyte/macrophages. J. Pharm. Pharamcol.45:48–53
Borovskya B, Krim J, Syed Asif S and Wahl K (2001) Measuring nanomechanical properties of a dynamic contactusing an indenter probe and quartz crystal microbalance. J. Appl. Phys. 90:6391–6396
Branch DW and Brozik SM (2004) Low-level detection of a Bacillus anthracis simulant using love-wave biosensorson 36� YX LiTaO3. Biosens. Bioelectron. 19:849–859
Bunde RL, Jarvi EJ and Rosentreter JJ (1998) Piezoelectric quartz crystal biosensors. Talanta 46:1223–1236Buzby JC and Roberts T (1997) Economic costs and trade impacts of microbial food-borne illness. World Health Stat.
Q. 50:57–66Bykov VA (1996) Langmuir-Blodgett films and nanotechnology. Biosens. Bioelectron. 11:923–932Carter RM, Jacobs MB, Lubrano GJ and Guilbault GG (1995a) Piezoelectric detection of ricin and affinity-purified
goat anti-ricin antibody. Anal. Lett. 28:1379–1386Carter RM, Mekalanos JJ, Jacobs MB, Lubrano GJ and Guilbault GG (1995b) Quartz crystal microbalance detection
of Vibrio cholerae O139 serotype. J. Immunol. Methods 187:121–125Casalinuovo I, Di Pierro D, Bruno E, Di Francesco P and Coletta M (2005) Experimental use of a new surface acoustic
wave sensor for the rapid identification of bacteria and yeasts. Lett. Appl. Microbiol. 42:24–29

290 Eric Olsen et al.
Cavicacute BA, Hayward GL and Thompson M (1999) Acoustic waves and the study of biochemical macromoleculesand cells at the sensor-liquid interface. Analyst 124:1405–1420
Chang K-S, Jang H-D, Lee C-F, Lee Y-G, Yuan C-J and Lee S-H (2006) Series quartz crystal sensor for remotebacteria population monitoring in raw milk via the Internet. Biosens. Bioelectron. 21:1581–1590
Chen M, Liu M, Yu L, Cai G, Chen Q, Wu R, Wang F, Zhang B, Jiang T and Fu W (2005) Construction of a novelpeptide nucleic acid piezoelectric gene sensor microarray detection system. J. Nanosci. Nanotechnol. 5:1266–1272
Chin RC, Salazar N, Mayo MW, Villavicencio V, Taylor RB, Chambers JP and Valdes JJ (1996) Development of abacteriophage displayed peptide library and biosensor. Proc. SPIE Int. Soc. Opt. Eng. 2680:16–26
Chothia C and Janin J (1975) Principles of protein-protein recognition. Nature 256:705–708Chou PY and Fasman GD (1974) Prediction of protein conformation. Biochemistry 13:222–245Clark LCJ and Lyons C (1962) Electrode systems for continuous monitoring in cardiovascular surgery. Ann. N. Y.
Acad. Sci. 102:29–45Cornell BA, Braach-Maksvytis VL, King LG, Osman PD, Raguse B, Wieczorek L and Pace RJ (1997) A biosensor
that uses ion-channel switches. Nature 387:580–583Cornell BA, Krishna G, Osman PD, Pace RD and Wieczorek L (2001) Tethered-bilayer lipid membranes as a support
for membrane-active peptides. Biochem. Soc. Trans. 29:613–617Curie J and Curie P (1880) Ann. de Chim. et Phys. 91:294Dai J, Baker GL and Bruening ML (2006) Use of porous membranes modified with polyelectrolyte multilayers as
substrates for protein arrays with low nonspecific adsorption. Anal. Chem. 78:135–140Davies LT and Rideal EK (1963) Interfacial Phenomena. Academic Press, New YorkDeisingh A and Thompson M (2001) Sequences of E. coli O157:H7 detected by a PCR-acoustic wave sensor combi-
nation. Analyst 126:2153–2158Deng L, Tan, H, Xu Y, Nie L and Yao S (1997) On-line rapid detection of urease-producing bacteria with a novel
bulk acoustic wave ammonia sensor. Enzyme Microb. Technol. 21:258–264Deobagkar DD, Limaye V, Sinha S and Yadava RDS (2005) Acoustic wave immunosensing of Escherichia coli in
water. Sens. Actuators B 104:85–89Dickert F, Hayden O, Lieberzeit P, Palfinger C, Pickert D, Wolff U and Scholl G (2003) Borderline applications of
QCM-devices: synthetic antibodies for analytes in both nm- and um-dimensions. Sens. Actuators B 95:20–24Dickert FL, Hayden O, Bindeus R, Mann K, Blaas D and Waigmann E (2004) Bioimprinted QCM sensors for virus
detection–screening of plant sap. Anal. Bioanal. Chem. 378:1929–1934Dickert FL, Lieberzeit P and Hayden O (2003) Sensor strategies for microorganism detection–from physical principles
to imprinting procedures. Anal. Bioanal. Chem. 377:540–549Dybwad G (1985) A sensitive new method for the determination of adhesive bonding between a particle and a substrate.
J. Appl. Phys. 58:2789–2790Eun A, Huang L, Chew F, Li S and Wong S (2002) Detection of two orchid viruses using quartz crystal microbalance
(QCM) immunosensors. J. Virol. Methods 99:71–79Fan H, Lu Y, Stump A, Reed ST, Baer T, Schunk R, Perez-Luna V, Lopez GP and Brinker CJ (2000) Rapid prototyping
of patterned functional nanostructures. Nature 405:56–60World Health Organization (1997) Foodborne diseases—possibly 350 times more frequent than reported. Need publi-
cation data here – also move this to correct alphabetical position in list.Frisk T, Ronnholm D, van der Wijngaart W and Stemme G (2006) A micromachined interface for airborne sample-to-
liquid transfer and its application in a biosensor system. Lab. Chip 6:1504–1509Fung YS and Wong YY (2001) Self-assembled monolayers as the coating in a quartz piezoelectric crystal immunosensor
to detect Salmonella in aqueous solution. Anal. Chem. 73: 5302–5309Furch M, Ueberfeld J, Hartmann A, Bock D and Seeger S (1996) Ultrathin oligonucleotide layers for fluorescence
based DNA-sensors. Proc. SPIE Int. Soc. Opt. Eng. 2928:220–226Gaines GLJ (1966) Insoluble Monolayers at Liquid-gas Interfaces. Interscience, New YorkGao H, Kislig E, Oranth N and Sigrist H (1994) Photolinker-polymer-mediated immobilization of monoclonal
antibodies, F(ab’)2 and F(ab’) fragments. Biotechnol. Appl. Biochem. 20:251–263Gao Z, Tao G and Li G (1998) Research on detection of type C2 staphylococcus enterotoxin in food with piezoelectric
immunosensors. Wei Sheng Yan Jiu 27:122–124Garnier J, Osguthorpe DJ and Robson B (1978) Analysis of the accuracy and implications of simple methods for
predicting the secondary structure of globular proteins. J. Mol. Biol. 120:97–120Gawrisch K, Gaede HC, Luckett KM, Polozov IV and Yeliseev A (2005) Solid-supported
membranes inside porous substrates and their use in biosensors, WIPO Patent WO/2005/069004http://www.wipo.int/pctdb/en/ia.jsp?IA=US2005/ 000069&LANGUAGE=EN (accessed April 11, 2007)
Ghafouri S and Thompson M (1999) Interfacial properties of biotin conjugate avidin complexes studied by acousticwave sensor. Langmuir 15:564–572
Gizeli E (2002) Biomolecular Sensors. Taylor & Francis, Inc., New York, pp 176–206Goldman ER, Pazirandeh MP, Charles PT, Balighian E.D and Anderson GP (2002) Selection of phage displayed
peptides for the detection of 2,4,6-trinitrotoluene in seawater. Anal. Chim. Acta 457:13–19

Acoustic Wave (TSM) Biosensors: Weighing Bacteria 291
Goldman ER, Pazirandeh MP, Mauro JM, King KD, Frey JC and Anderson GP (2000) Phage-displayed peptides asbiosensor reagents. J. Mol. Recognit. 13:382–387
Goodchild S, Love T, Hopkins N and Mayers C (2006) Engineering antibodies for biosensor technologies. Adv. Appl.Microbiol. 58:185–226
Grate JW and Frye GC (1996) Acoustic wave sensors. Sens. Update 2:37–83Griffith J, Manning M and Dunn K (1981) Filamentous bacteriophage contract into hollow spherical particles upon
exposure to a chloroform-water interface. Cell 23:747–753Harteveld JLN, Nieuwenhuizen MS and Wils ERJ (1997) Detection of staphylococcal enterotoxin B employing a
piezoelectric crystal immunosensor. Biosens. Bioelectron. 12:661–667Hayden O, Bindeus R and Dickert FL (2003) Combining atomic force microscope and quartz crystal microbalance
studies for cell detection. Meas. Sci. Technol. 14: 1876–1881Hayden O and Dickert FL (2001) Selective microorganism detection with cell surface imprinted polymers. Adv. Mater.
13:1480–1483He F, Geng Q, Zhu W, Nie L, Yao S and Meifeng C (1994) Rapid detection of Escherichia coli using a separated
electrode piezoelectric crystal sensor. Anal. Chim. Acta 289:313–319He F and Zhang L (2002) Rapid diagnosis of M. tuberculosis using a piezoelectric immunosensor. Anal. Sci. 18:397–401He F, Zhang X, Zhou J and Liu Z (2006) A new MSPQC system for rapid detection of pathogens in clinical samples.
J. Microbiol. Methods 66:56–62He F, Zhao J, Zhang L and Su X (2003) A rapid method for determining Mycobacterium tuberculosis based on a bulk
acoustic wave impedance biosensor. Talanta 59:935–941He F and Zhou J (2007) A new antimicrobial susceptibility testing method of Escherichia coli against ampicillin by
MSPQC. J. Microbiol. Methods 68:563–567Herriott RM and Barlow JL (1957) The protein coats or “ghosts” of Escherichia coli phage T2. Preparation, assay, and
some chemical properties. J. Gen. Physiol. 40:809–825Horisberger M (1984) Electron-opaque markers: a review. In: Polak JM and Varndell IM (eds) Immunolabelling for
Electron Microscopy. Elsevier, AmsterdamHorisberger M (1992) Colloidal gold and its application in cell biology. Int. Rev. Cytol. 136:227–87Houbiers MC and Hemminga MA (2004) Protein-lipid interactions of bacteriophage M13 gene 9 minor coat protein.
Mol. Membr. Biol. 21:351–359Houbiers MC, Wolfs CJAM, Spruijt RB, Bollen YJM, Hemminga MA and Goormaghtigh E (2001) Conformation and
orientation of the gene 9 minor coat protein of bacteriophage M13 in phospholipid bilayers. Biochim. Biophys.Acta Biomembr. 1511:224–235
Howe E and Harding G (2000) A comparison of protocols for the optimisation of detection of bacteria using a surfaceacoustic wave (SAW) biosensor. Biosens. Bioelectron. 15:641–649
Im W and Brooks CL (2004) De novo folding of membrane proteins: an exploration of the structure and NMRproperties of the fd coat protein. J. Mol. Biol. 337:513–519
Ishimori Y, Karube I and Suzuki IS (1981) Determination of microbial populations with piezoelectric membranes.Appl. Environ. Microbiol. 42:632–637
Ivnitski D, Abdel-Hamid I, Atanasov P and Wilkins E (1999) Biosensors for detection of pathogenic bacteria. Biosens.Bioelectron. 14:599–624
Janshoff A, Galla HJ and Steinem C (2000) Piezoelectric mass-sensing devices as biosensors-an alternative to opticalbiosensors? Angew. Chem. Int. Ed. Engl. 39:4004–4032
Janshoff A and Steinem C (2001) Quartz crystal microbalance for bioanalytical applications. Sens. Update 9:313–354Janshoff A, Steinem C and Wegener J (2004) Noninvasive Electrical Sensor Devices to Monitor Living Cells Online.
Ultrathin Electrochemical Chemo- and Biosensors. Springer, New YorkJiang Y-B, Liu N, Gerung H, Cecchi JL and Brinker CJ (2006) Nanometer-thick conformal pore sealing of self-
assembled mesoporous silica by plasma-assisted atomic layer deposition. J. Am. Chem. Soc. 128:11018–11019Kaspar M, Stadler H, Weiss T and Ziegler C (2000) Thickness shear mode resonators (“mass sensitive devices”) in
bioanalysis. Fresenius J. Anal. Chem. 366:602–610Kim G-H, Rand AG and Letcher SV (2003) Impedance characterization of a piezoelectric immunosensor part II:
Salmonella typhimurium detection using magnetic enhancement. Biosens. Bioelectron. 18:91–99Kim N and Park I-S (2003) Application of a flow-type antibody sensor to the detection of Escherichia coli in various
foods. Biosens. Bioelectron. 18:1101–1107Kim N, Park I-S and Kim D-K (2004) Characteristics of a label-free piezoelectric immunosensor detecting Pseudomonas
aeruginosa. Sens. Actuators B 100:432–438King WH (1964) Piezoelectric sorption detector. Anal. Chem. 36:1735–1739Kleinschmidt AK, Lang D, Jacherts D and Zahn RK (1962) Preparation and length measurements of the total deoxyri-
bonucleic acid (DNA) content of T2 bacteriophages. Biochim. Biophys. Acta 61:875–864Konig B and Gratzel M (1993) Detection of viruses and bacteria with piezoelectric immunosensors. Anal. Lett.
26:1567–1585

292 Eric Olsen et al.
Konig B and Gratzel M (1995) A piezoelectric immunosensor for hepatitis viruses. Anal. Chim. Acta 309:19–25Kouzmitcheva G (2005) Personal communication.Krause R (1993) Process control for Ni/Au plating with QCM technology. Circuitree 6:10–12Kreth J, Hagerman E, Tam K, Merritt J, Wong D, Wu B, Myung N, Shi W and Qi F (2004) Quantitative analyses of
Streptococcus mutans biofilms with quartz crystal microbalance, microjet impingement and confocal microscopy.Biofilms 1:277–284
Kurosawa S, Park J, Aizawa H, Wakida S, Tao H and Ishihara K (2006) Quartz crystal microbalance immunosensorsfor environmental monitoring. Biosens. Bioelectron. 22:473–481
Lakshmanan RS, Hu J, Guntupalli R, Wan J, Huang S, Yang H, Petrenko VA, Barbaree JM and Chin BA (2006)Detection of Salmonella typhimurium using phage based magnetostrictive sensor. Proc. SPIE Int. Soc. Opt. Eng.6218:62180Z
Lazcka O, Campo FJD and Munoz FX (2007) Pathogen detection: A perspective of traditional methods and biosensors.Biosens. Bioelectron. 22:1205–1217
Le D, He F-J, Jiang TJ, Nie L and Yao S (1995) A goat-anti-human IgG modified piezoimmunosensor for Staphylo-coccus aureus detection. J. Microbiol. Methods 23:229–234
Leonard P, Hearty S, Brennan J, Dunne L, Quinn J, Chakraborty T and O’Kennedy R (2003) Advances in biosensorsfor detection of pathogens in food and water. Enzyme Microb. Technol. 32:3–13
Lin H-C and Tsai W-C (2003) Piezoelectric crystal immunosensor for the detection of staphylococcal enterotoxin B.Biosens. Bioelectron. 18:1479–1483
Love AEH (1911) Some problems of geodynamics. Cambridge: CambridgeLucklum R (2005) Non-gravimetric contributions to QCR sensor response. Analyst 130:1465–1473Mao X, Yang L, Su X-L and Li Y (2006) A nanoparticle amplification based quartz crystal microbalance DNA sensor
for detection of Escherichia coli O157:H7. Biosens. Bioelectron. 21:1178–1185Martin SJ, Granstaff VE and Frye GC (1991) Characterization of quartz crystal microbalance with simultaneous mass
and liquid loading. Anal. Chem. 63:2272–2281Marxer C, Coen M, Greber T, Greber U and Schlapbach L (2003) Cell spreading on quartz crystal microbalance elicits
positive frequency shifts indicative of viscosity changes. Anal. Bioanal. Chem. 377:578–586Mead P, Slutsker L, Dietz V, McCaig L, Bresee J, Shapiro C, Griffin P and Tauxe RV (1999) Food-related illness and
death in the United States. Emerg. Infect. Dis. 5:607–625Minunni M, Skladal P and Mascini M (1994) A piezoelectric quartz crystal biosensor as a direct affinity sensor. Anal.
Lett. 27:1475–1487Mittler-Neher S, Spinke J, Liley M, Nelles G, Weisser M, Back R, Wenz G and Knoll W (1995) Spectroscopic and
surface-analytical characterization of self-assembled layers on Au. Biosens. Bioelectron. 10:903–916Mo X-T, Zhou Y-P, Lei H and Deng L (2002) Microbalance-DNA probe method for the detection of specific bacteria
in water. Enzyme Microb. Technol. 30:583–589Moll N, Pascal E, Dinh DH, Pillot J-P, Bennetau B, Rebiere D, Moynet D, Mas Y, Mossalayi D, Pistre J and
Dejous C (2007) A Love wave immunosensor for whole E. coli bacteria detection using an innovative two-stepimmobilisation approach. Biosens. Bioelectron. 22:2145–2150
Morgan DP (2000) A history of surface acoustic wave devices. Int. J. High Speed Electron. Syst. 10:553–602Muramatsu H, Kajiwara K, Tamiya E, Karube I (1986) Piezoelectric immunosensor for the detection of Candida
albicans microbes. Anal. Chim. Acta 188:257–261Muratsugu M, Ohta F, Miya Y, Hosokawa T, Kurosawa S, Kamo N and Ikeda H (1993) Quartz crystal microbalance
for the detection of microgram quantities of human serum albumin: relationship between the frequency changeand the mass of protein adsorbed. Anal. Chem. 65:2933–2937
Nakanishi K, Karube I, Hiroshi S, Uchida A and Ishida Y (1996) Detection of the red tide-causing plankton Chattonellamarina using a piezoelectric immunosensor. Anal. Chim. Acta 325:73–80
Nanduri V (2005) Phage at the air-liquid interface for the fabrication of biosensors. Doctoral Dissertation.graduate.auburn.edu/auetd Auburn University, Alabama
Nanduri V, Sorokulova IB, Samoylov AM, Simonian AL, Petrenko VA, Vodyanoy V (2007) Phage as a molecularrecognition element in biosensors immobilized by physical adsorption. Biosens. Bioelectron. 22:986–992
Neidhardt FC (1987) Escherichia coli and Salmonella. American Society For Microbiology, Washington, D.C.Nishiyama Y, Tanaka S, Hillhouse HW, Nishiyama N, Egashira Y and Ueyama K (2006) Synthesis of ordered
mesoporous zirconium phosphate films by spin coating and vapor treatments. Langmuir 22:9469–9472Niven D, Chambers J, Anderson T and White D (1993) Long-term, on-line monitoring of microbial biofilms using a
quartz crystal microbalance. Anal. Chem. 65:65–69O’Sullivan CK and Guilbault GG (1999) Commercial quartz crystal microbalances—theory and applications. Biosens.
Bioelectron. 14:663–670Olsen EV (2000) Functional durability of a quartz crystal microbalance sensor for the rapid detection of Salmonella
in liquids from poultry packaging. Masters Thesis. http://graduate.auburn.edu/auetd Auburn University, Alabama(accessed April 10, 2007)
Acoustic Wave (TSM) Biosensors: Weighing Bacteria 293
Olsen EV (2005) Phage-coupled piezoelectric biodetector for Salmonella typhimurium. Doctoral Dissertation.http://graduate.auburn.edu/auetd Auburn University, Alabama (accessed April 10, 2007)
Olsen EV, Pathirana ST, Samoylov AM, Barbaree JM, Chin BA, Neely WC and Vodyanoy V (2003) Specific andselective biosensor for Salmonella and its detection in the environment. J. Microbiol. Methods 53:273–285
Olsen EV, Sorokulova IB, Petrenko VA, Chen IH, Barbaree JM and Vodyanoy VJ (2006) Affinity-selected filamentousbacteriophage as a probe for acoustic wave biodetectors of Salmonella typhimurium. Biosens. Bioelectron.21:1434–1442
Olsen EV, Sykora JC, Sorokulova IB, Chen I-H, Neely WC, Barbaree JM, Petrenko VA and Vodyanoy VJ (2007)Phage fusion proteins as bioselective receptors for piezoelectric sensors. Electrochem. Soc. Trans. 2:9–25
Otto K, Elwing H and Hermansson M (1999) Effect of ionic strength on initial interactions of Escherichia coli withsurfaces, studied on-line by a novel quartz crystal microbalance technique. J. Bacteriol. 181:5210–5218
Ozen A, Montgomery K, Jegier P, Patterson S, Daumer KA, Ripp SA, Garland JL and Sayler GS (2004) Developmentof bacteriophage-based bioluminescent bioreporters for monitoring of microbial pathogens. Proc. SPIE Int. Soc.Opt. Eng. 5270:58–68
Park I-S and Kim N (1998) Thiolated Salmonella antibody immobilization onto the gold surface of piezoelectric quartzcrystal. Biosens. Bioelectron. 13:1091–1097
Park I-S, Kim W-Y and Kim N (2000) Operational characteristics of an antibody-immobilized QCM system detectingSalmonella spp. Biosens. Bioelectron. 15:167–172
Pathirana S, Myers LJ, Vodyanoy V and Neely WC (1996) Assembly of cadmium stearate and valinomycin moleculesassists complexing of K+ in mixed Langmuir-Blodgett films. Supramol. Sci. 2:149–154
Pathirana S, Neely WC, Myers LJ and Vodyanoy V (1992) Interaction of valinomycin and stearic acid in monolayers.Langmuir 8:1984–1987
Pathirana S, Neely WC and Vodyanoy V (1998) Condensing and expanding the effects of the odorants (+)- and(−)-carvone on phospholipid monolayers. Langmuir 14:679–682
Pathirana ST (1993) Interaction of valinomycin and stearic acid in monolayers at the air/water interface. DoctoralDissertation. Auburn University, Alabama
Pathirana ST, Barbaree J, Chin BA, Hartell MG, Neely WC and Vodyanoy V (2000) Rapid and sensitive biosensor forSalmonella. Biosens. Bioelectron. 15:135–141
Pattus F, Desnuelle P and Verger R (1978) Spreading of liposomes at the air/water interface. Biochim. Biophys. Acta507:62–70
Pattus F and Rothen C (1981) Lipid-protein interactions in monolayers at the air-water interface. In: Azzi A, BrodbeckU, Zahler P (eds) Membrane Proteins. Springer-Verlag, Berlin pp 229–240
Pattus F, Rothen C, Streit M and Zahler P (1981) Further studies on the spreading of biomembranes at the air/waterinterface. Structure, composition, enzymatic activities of human erythrocyte and sarcoplasmic reticulum membranefilms. Biochim. Biophys. Acta Biomembr. 647:29–39
Pavey KD (2002) Quartz crystal analytical sensors: the future of label-free, real-time diagnostics? Expert Rev. Mol.Diag. 2:173–186
Pavey KD, Ali Z, Olliff CJ and Paul F 1999. Application of the quartz crystal microbalance to the monitoring ofStaphylococcus epidermidis antigen-antibody agglutination. J. Pharm. Biomed. Anal. 20:241–245
Pavey KD, Barnes L, Hanlon G, Olliff C, Ali Z and Paul F (2001) A rapid, non-destructive method for the determinationof Staphylococcus epidermidis adhesion to surfaces using quartz crystal resonant sensor technology. Lett. Appl.Microbiol. 33:344–348
Pereira de Jesus D, Naves C and Lucia do Lago C (2002) Determination of boron by using a quartz crystal resonatorcoated with N-Methyl-D-glucamine-modified poly(epichlorohydrin). Anal. Chem. 74:3274–3280
Petrenko VA (2004) Personal communication.Petrenko VA and Smith GP (2000) Phages from landscape libraries as substitute antibodies. Protein Eng. 13:589–592Petrenko VA, Sorokulova IB, Chin BA, Barbaree JM, Vodyanoy VJ, Chen IH and Samoylov AM (2005) Biospecific
peptide probes against Salmonella isolated from phage display libraries, and their diagnostic and drug deliveryuses. US Patent Application 20050137136, filed Apr 29, 2004
Petrenko VA and Vodyanoy VJ (2003) Phage display for detection of biological threat agents. J. Microbiol. Methods53:253–262
Petrenko VA, Vodyanoy VJ and Sykora JC (2004) Methods of forming monolayers of phage-derived products anduses thereof. US Patent Application 20070072308, filed Nov 27, 2006
Petty MC (1991) Application of multilayer films to molecular sensors: some examples of bioengineering at themolecular level. J. Biomed. Eng. 13:209–214
PM-740 Series Operation and Service Manual. (1996) Maxtek, Inc., Sante Fe Springs, CaliforniaPohanka M and Skládal P (2005) Piezoelectric immunosensor for Francisella tularensis detection using immunoglobulin
M in a limiting dilution. Anal. Lett. 38:411–422Prusak-Sochaczewski E and Luong JHT (1990) Development of a piezoelectric immunosensor for the detection of
Salmonella typhimurium. Enzyme and Microb. Technol. 12:173–177
vodyavi
Cross-Out
vodyavi
Replacement Text
2007
vodyavi
Cross-Out
vodyavi
Replacement Text
#7,267,993

294 Eric Olsen et al.
Pyun JC, Beutel H, Meyer JU and Ruf HH (1998) Development of a biosensor for E. coli based on a flexural platewave (FPW) transducer. Biosens. Bioelectron 13:839–845
Qu X, Bao L, Su X and Wei W (1998) Rapid detection of Escherichia coliform with a bulk acoustic wave sensor basedon the gelation of Tachypleus amebocyte lysate. Talanta 47:285–290
Ramirez E, Mas JM, Carbonell X, Aviles FX and Villaverde A (1999) Detection of molecular interactions by using anew peptide-displaying bacteriophage. Biosensor. Biochem. Biophys. Res. Commun. 262:801–805
Ramsden JJ (1997a) Dynamics of protein adsorption at the solid/liquid interface. Recent Res. Dev. Phys. Chem.1:133–142
Ramsden JJ (1997b) Protein adsorption at the solid/liquid interface. Conference on Colloid Chemistry: In MemoriamAladar Buzagh, Proceedings, 7th, Eger, Hung., Sept. 23–26, 1996, 148–151
Ramsden JJ (1998) Biomimetic protein immobilization using lipid bilayers. Biosens. Bioelectronics 13:593–598Ramsden JJ (1999) On protein-lipid membrane interactions. Colloids Surfaces B Biointerfaces 14:77–81Ramsden JJ (2001) Multiple interactions in protein-membrane binding. NATO Science Series, 335:244–269. IOS Press,
AmsterdamRayleigh L (1885) On waves propagating along the plane surface of an elastic solid. Proc. London Math. Soc. 17:4–11Reipa V, Almeida J and Cole KD (2006) Long-term monitoring of biofilm growth and disinfection using a quartz
crystal microbalance and reflectance measurements. J. Microbiol. Methods 66:449–459Rickert J, Gopel W, Hayward GL, Cavic BA and Thompson M (1999) Biosensors based on acoustic wave devices.
Sens. Update 5:105–139Roberts LM and Dunker AK (1993) Structural changes accompanying chloroform-induced contraction of the
filamentous phage fd. Biochemistry 32:10479–10488Samoylov AM, Samoylova TI, Hartell MG, Pathirana ST, Smith BF and Vodyanoy V (2002a) Recognition of cell-
specific binding of phage display derived peptides using an acoustic wave sensor. Biomol. Eng. 18:269–272Samoylov AM, Samoylova TI, Pathirana ST, Globa LP and Vodyanoy VJ (2002b) Peptide biosensor for recognition
of cross-species cell surface markers. J. Mol. Recognit. 15:197–203Sauerbrey GZZ (1959) Use of quartz vibrator for weighing thin films on a microbalance. Z. Phys. 155:206–212Sayler GS, Ripp SA, Applegate BM (2003) Bioluminescent biosensor device. US Patent Application 20030027241,
filed July 20, 2001Scherz P (2000) Oscillators and Timers. McGraw-Hill, Inc., New YorkSelz KA, Samoylova TI, Samoylov AM, Vodyanoy VJ and Mandell AJ (2006) Designing allosteric peptide ligands
targeting a globular protein. Biopolymers 85:38–59Si S, Lia X, Fungb Y and Zhub D (2001) Rapid detection of Salmonella enteritidis by piezoelectric immunosensor.
Microchem. J. 68:21–27Si S, Ren F, Cheng W and Yao S (1997) Preparation of a piezoelectric immunosensor for the detection of Salmonella
paratyphi A by immobilization of antibodies on electropolymerized films. Fresenius J. Anal. Chem. 357:1101–1105Skládal P (2003) Piezoelectric quartz crystal sensors applied for bioanalytical assays and characterization of affinity
interactions. J. Braz. Chem. Soc. 14:491–502Sobotka H and Trurnit HJ (1961) Need title of their article here. In: Alexander P, Block RJ (eds) Analytical Methods
of Protein Chemistry. Pergamon Press, Oxford, UK, pp 212–243Song M-J, Yun D-H, Jin J-H, Min N-K and Hong S-I (2006) Comparison of effective working electrode areas on
planar and porous silicon substrates for cholesterol biosensor. Jpn. J. Appl. Phys. 45:7197–7202Sorial J and Lec R (2004) A piezoelectric interfacial phenomena biosensor. Masters Thesis.
http://dspace.library.drexel.edu/handle/1860/82 Drexel University, Pennsylvania (accessed April 10, 2007)Sorokulova IB, Olsen EV, Chen IH, Fiebor B, Barbaree JM, Vodyanoy VJ, Chin BA and Petrenko VA (2005)
Landscape phage probes for Salmonella typhimurium. J. Microbiol. Methods 63:55–72Spangler BD, Wilkinson EA, Murphy JT and Tyler BJ (2001) Comparison of the Spreeta®surface plasmon resonance
sensor and a quartz crystal microbalance for detection of Escherichia coli heat-labile enterotoxin. Anal. Chim.Acta 444:149–161
Stadler H, Mondon M and Ziegler C (2003) Protein adsorption on surfaces: dynamic contact angle (DCA) andquartz-crystal microbalance (QCM) measurements. Anal. Bioanal. Chem 375:53–61
Storri S, Santoni T and Mascini M (1998) A piezoelectric biosensor for DNA hybridisation detection. Anal. Lett.31:1795–1808
Su C-C, Wu T-Z, Chen L-K, Yang H-H and Tai D-F (2003) Development of immunochips for the detection of dengueviral antigens. Anal. Chim. Acta 479:117–123
Su X-L and Li SFY (2001) Serological determination of Helicobacter pylori infection using sandwiched and enzymat-ically amplified piezoelectric biosensor. Anal. Chim. Acta 429:27–36
Su X-L and Li Y (2004) A self-assembled monolayer-based piezoelectric immunosensor for rapid detection ofEscherichia coli O157:H7. Biosens. Bioelectron. 19:563–574
Su X-L and Li Y (2005) A QCM immunosensor for Salmonella detection with simultaneous measurements of resonantfrequency and motional resistance. Biosens. Bioelectron. 21:840–848
Acoustic Wave (TSM) Biosensors: Weighing Bacteria 295
Su X, Low S, Kwang J, Chew VHT and Li SFY (2001) Piezoelectric quartz crystal based veterinary diagnosis forSalmonella enteritidis infection in chicken and egg. Sens. Actuators B 75:29–35
Sukhorukov GB, Montrel MM, Petrov AI, Shabarchina LI and Sukhorukov BI (1996) Multilayer films containingimmobilized nucleic acids. Their structure and possibilities in biosensor applications. Biosens. Bioelectron.11:913–922
Sykora JC (2003) Monolayers of biomolecules for recognition and transduction in biosensors. Doctoral Dissertation.Auburn University, Al. http://graduate.auburn.edu/auetd (accessed April 10, 2007)
Sykora JC, Neely WC and Vodyanoy V (2004) Solvent effects on amphotericin B monolayers. J. Colloid InterfaceSci. 269:499–502
Tabacco MB, Qian X and Russo J (2004) Fluorescent virus probes for identification of bacteria. US Patent Application20040191859, filed Mar 24, 2003
Tai D, Lin C, Wu T, Huang J and Shu P (2006) Artificial receptors in serologic tests for the early diagnosis of denguevirus infection. Clin. Chem. 58:1486–1491
Tan H, Deng L, Nie L and Yao S (1997) Detection and analysis of the growth characteristics of Proteus vulgaris witha bulk acoustic wave ammonia sensor. Analyst 122:179–184
Thompson M, Arthur C and Dhaliwal G (1986) Liquid-phase piezoelectric and acoustic transmission studies ofinterfacial immunochemistry. Anal. Chem. 58:1206–1209
Thompson M, Kiplingt A, Duncan-Hewitt W, Rajakovic L and Cavic-Vlasak B (1991) Thickness-shear-mode acousticwave sensors in the liquid phase: a review. Analyst 116:881–890
Thust M, Schoning MJ, Schroth P, Malkoc U, Dicker CI, Steffen A, Kordos P and Luth H (1999) Enzyme immobilizationon planar and porous silicon substrates for biosensor applications. J. Mol. Catal. B: Enzym. 7:77–83
Tiefenauer LX, Kossek S, Padeste C and Thiebaud P (1997) Towards amperometric immunosensor devices. Biosens.Bioelectron. 12:213–223
Trurnit HJ (1960) The spreading of protein monolayers. J. Colloid Sci. 15:1–13Umezawa Y (1996) CRC handbook of ion-selective electrodes: selectivity coefficients. CRC Press, Boca Raton, FloridaUttenthaler E, Kolinger C and Drost S (1998) Quartz crystal biosensor for detection of the African Swine Fever disease.
Anal. Chim. Acta 362:91–100Uttenthaler E, Schraml M, Mandel J and Drost S (2001) Ultrasensitive quartz crystal microbalance sensors for detection
of M13-Phages in liquids. Biosens. Bioelectronics 16:735–743Uzawa H, Kamiya S, Minoura N, Dohi H, Nishida Y, Taguchi K, Yokoyama S, Mori H, Shimizu T and Kobayashi K
(2002) A quartz crystal microbalance method for rapid detection and differentiation of shiga toxins by applying amonoalkyl globobioside as the toxin ligand. Biomacromolecules 3:411–414
Vaughan RD, O’Sullivan CK and Guilbault GG (2001) Development of a quartz crystal microbalance (QCM)immunosensor for the detection of Listeria monocytogenes. Enzyme Microb. Technol. 29:635–638
Vaughan TJ, Williams AJ, Pritchard K, Osbourn JK, Pope AR, Earnshaw JC, McCafferty J, Hodits RA, Wilton J andJohnson KS (1996) Human antibodies with sub-nanomolar affinities isolated from a large non-immunized phagedisplay library. Nature Biotechnol. 14:309–314
Victorov IA (1967) Rayleigh and Lamb Waves—physical theory and applications. Plenum Press, New YorkVig J and Ballato A (1998) Comments about the effects of non-uniform mass loading on a quartz crystal microbalance.
IEEE Trans. Ultrason. Ferroelectrics Freq. Contr. 45:1123–1124Vodyanoy V (1994) Functional reconstitution of mammalian olfactory receptor. Report. ARO-27364.10-LSVoinova MV, Jonson M and Kasemo B (2002) “Missing mass” effect in biosensor’s QCM applications. Biosens.
Bioelectron. 17:835–841Volker M and Siegmund HU (1997) Forster energy transfer in ultrathin polymer layers as a basis for biosensors. EXS
80:175–191Wang J, Fu W, Liu M, Wang Y, Xue Q, Huang J and Zhu Q (2002) Multichannel piezoelectric genesensor for the
detection of human papilloma virus. Chinese Med. J. (Engl) 115:439–442White RM and Voltmer FW (1965) Direct piezoelectric coupling to surface elastic waves. Appl. Phys. Lett. 7:314–316Wong YY, Ng SP, Ng MH, Si SH, Yao SZ and Fung YS (2002) Immunosensor for the differentiation and detection
of Salmonella species based on a quartz crystal microbalance. Biosens. Bioelectron. 17:676–684Wu T-Z, Su C-C, Chen L-K, Yang H-H, Tai D-F and Peng K-C (2005) Piezoelectric immunochip for the detection of
dengue fever in viremia phase. Biosens. Bioelectron. 21:689–695Wu Z-Y, Shen G-L, Li Z-Q, Wang S-P and Yu R-Q (1999) A direct immunoassay for Schistosoma japonium antibody
(SjAb) in serum by piezoelectric body acoustic wave sensor. Anal. Chim. Acta 398:57–63Wu Z, Wu J, Wang S, Shen G and Yu R (2006) An amplified mass piezoelectric immunosensor for Schistosoma
japonicum. Biosens. Bioelectron. 22:207–212Xomeritakis G, Liu NG, Chen Z, Jiang YB, Koehn R, Johnson PE, Tsai CY, Shah PB, Khalil S, Singh S and Brinker
CJ (2007) Anodic alumina supported dual-layer microporous silica membranes. J. Membr. Sci. 287:157–161Yakhno T, Sanin A, Pelyushenko A, Kazakov V, Shaposhnikova O, Chernov A, Yakhno V, Vacca C, Falcione F and
Johnson B (2007) Uncoated quartz resonator as a universal biosensor. Biosens. Bioelectron. 22:2127–2131

296 Eric Olsen et al.
Yao S, Tan H, Zhang H, Su X and Wei W (1998) Bulk acoustic wave bacterial growth sensor applied to analysis ofantimicrobial properties of tea. Biotechnol. Prog. 14:639–644
Ye J, Letcher S and Rand AG (1997) Piezoelectric biosensor for the detection of Salmonella typhimurium. J. FoodSci. 62:1067–1071, 1086
Yilma S, Cannon-Sykora J, Samoylov A, Lo T, Liu N, Brinker CJ, Neely WC and Vodyanoy V (2007a)Large-conductance cholesterol-amphotericin B channels in reconstituted lipid bilayers. Biosens. Bioelectron.22:1359–1367
Yilma S, Liu N, Samoylov A, Lo T, Brinker CJ and Vodyanoy V (2007b) Amphotericin B channels in phospholipidmembrane-coated nanoporous silicon surfaces: implications for photovoltaic driving of ions across membranes.Biosens. Bioelectron. 22:1605–1611
Ying-Sing F, Shi-Hui S and De-Rong Z (2000) Piezoelectric crystal for sensing bacteria by immobilizing antibodieson divinylsulphone activated poly-m-aminophenol film. Talanta 51:151–158
Yun D-H, Song M-J, Hong S-I, Kang M-S and Min N-K (2005) Highly sensitive and renewable amperometric ureasensor based on self-assembled monolayer using porous silicon substrate. J. Kor. Phys. Soc. 47:S445–S449
Zhang J, Xie Y, Dai X, Wei W (2001) Monitoring of Lactobacillus fermentation process by using ion chromatographywith a series piezoelectric quartz crystal detector. J. Microbiol. Methods 44:105–111
Zhang S, Wei W, Zhang J, Mao Y and Liu S (2002) Effect of static magnetic field on growth of Escherichia coli andrelative response model of series piezoelectric quartz crystal. Analyst 127:373–377
Zhao J, Zhu W and He F (2005) Rapidly determining E. coli and P. aeruginosa by an eight channels bulk acousticwave impedance physical biosensor. Sens. Actuators B 107: 271–276
Zhou X, Liu L, Hu M, Wang L and Hu J (2002) Detection of hepatitis B virus by piezoelectric biosensor. J. Pharmaceut.Biomed. Anal. 27:341–345
Zuo B, Li S, Guo Z, Zhang J and Chen C (2004) Piezoelectric immunosensor for SARS-associated coronavirus insputum. Anal. Chem. 76:3536–3540