Government of Kerala - Report No. 5 of the year 2021 - CAG
233
Government of Kerala Report No. 5 of the year 2021 STATE FINANCES AUDIT REPORT OF THE COMPTROLLER AND AUDITOR GENERAL OF INDIA for the year ended March 2020
-
Upload
khangminh22 -
Category
Documents
-
view
0 -
download
0
Transcript of Government of Kerala - Report No. 5 of the year 2021 - CAG
© COMPTROLLER ANDAUDITOR GENERAL OF INDIA
https://cag.gov.in
Prin
ted
at S
t. J
osep
h’s
Pres
s, T
vm
Governm
ent of Kerala - R
eport No. 5 of the year 2021
Government of KeralaReport No. 5 of the year 2021
STATE FINANCES AUDIT REPORT OF
THE COMPTROLLERAND AUDITOR GENERAL OF INDIA
for the year ended March 2020
https://cag.gov.in/ag2/kerala/en
https://cag.gov.in
STATE FINANCES AUDIT REPORT OF
THE COMPTROLLER AND AUDITOR GENERAL OF INDIA
for the year ended 31 March 2020
Government of Kerala Report No. 5 of 2021
Presented to the Legislature on 11 November 2021

i
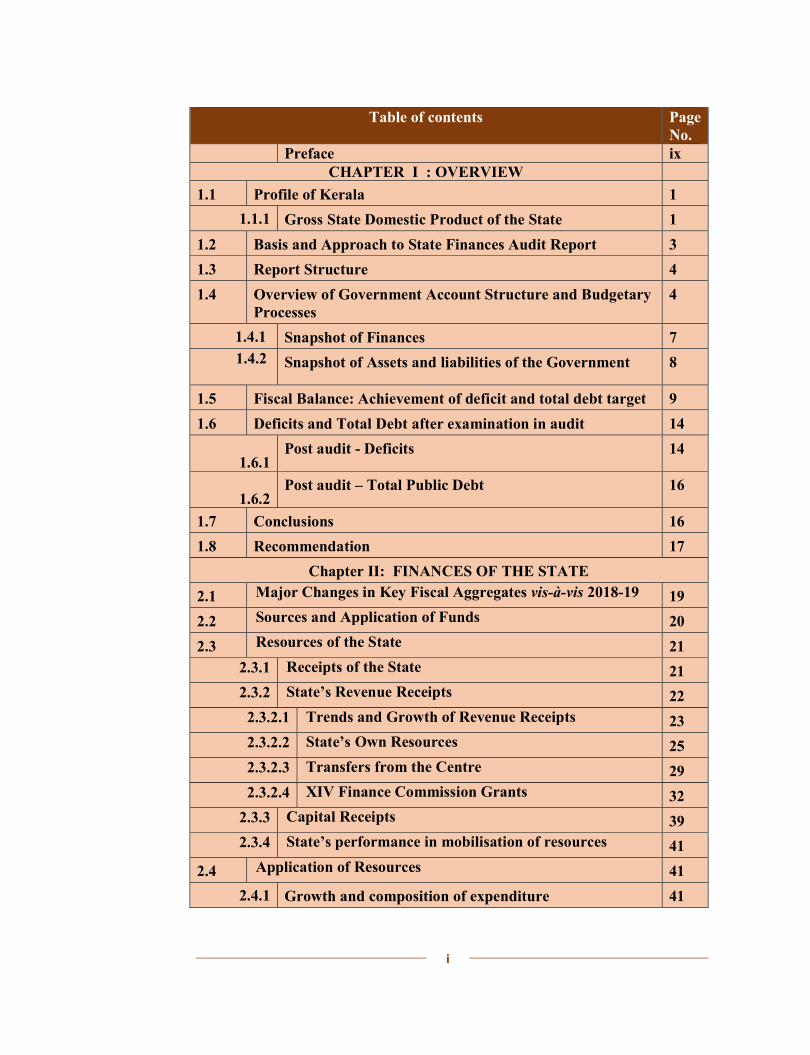
Table of contents Page No.
Preface ix CHAPTER I : OVERVIEW
1.1 Profile of Kerala 1 1.1.1 Gross State Domestic Product of the State 1
1.2 Basis and Approach to State Finances Audit Report 3 1.3 Report Structure 4 1.4 Overview of Government Account Structure and Budgetary
Processes 4
1.4.1 Snapshot of Finances 7 1.4.2
Snapshot of Assets and liabilities of the Government 8
1.5 Fiscal Balance: Achievement of deficit and total debt target 9 1.6 Deficits and Total Debt after examination in audit 14
1.6.1
Post audit - Deficits 14
1.6.2
Post audit – Total Public Debt 16
1.7 Conclusions 16 1.8 Recommendation 17
Chapter II: FINANCES OF THE STATE 2.1 Major Changes in Key Fiscal Aggregates vis-à-vis 2018-19 19 2.2 Sources and Application of Funds 20 2.3 Resources of the State 21
2.3.1 Receipts of the State 21 2.3.2 State’s Revenue Receipts 22
2.3.2.1 Trends and Growth of Revenue Receipts 23 2.3.2.2 State’s Own Resources 25 2.3.2.3 Transfers from the Centre 29 2.3.2.4 XIV Finance Commission Grants 32
2.3.3 Capital Receipts 39 2.3.4 State’s performance in mobilisation of resources 41
2.4 Application of Resources 41 2.4.1 Growth and composition of expenditure 41
State Finances Audit Report for the year ended 31 March 2020
ii
Table of contents Page No.
2.4.2 Revenue Expenditure 44 2.4.2.1 Major Changes in Revenue Expenditure 45 2.4.2.2 Committed Expenditure 47 2.4.2.3 Undischarged liabilities in National Pension System 49 2.4.2.4 Subsidies 50
2.4.2.5 Financial assistance to Local Bodies and Other Institutions
50
2.4.3 Capital Expenditure 51 2.4.3.1 Major Changes in Capital Expenditure 52 2.4.3.2 Quality of Capital Expenditure 52
2.4.3.3 Investments in Government Companies/Corporations and budgetary support
57
2.4.4 Expenditure Priorities 62 2.4.5 Object head wise expenditure 63
2.5 Public Account 64 2.5.1 Net Balances in Public Account Balances 64 2.5.2 Reserve Funds 65
2.5.2.1 Consolidated Sinking Fund 66 2.5.2.2 State Disaster Response Fund 66 2.5.2.3 Guarantee Redemption Fund 67
2.5.2.4 Non discharge of interest liability on Reserve Funds and Deposits
68
2.6 Debt Management 68 2.6.1 Debt Profile: Components 69 2.6.2 Off-budget borrowings 75 2.6.3 Debt Profile: Maturity and Repayment 80
2.7 Debt Sustainability Analysis (DSA) 81 2.7.1 Utilisation of borrowed funds 84 2.7.2 Status of guarantees- Contingent liabilities 85 2.7.3 Management of Cash Balance 86
2.8 Conclusions 89 2.9 Recommendations 90
Table of contents
iii
Table of contents Page No.
CHAPTER III : BUDGETARY MANAGEMENT 3.1 Budget Process 93
3.1.1 Summary of total provisions, actual disbursements and savings/excess during financial year
95
3.1.2 Charged and Voted disbursements 95 3.2 Appropriation Accounts 96 3.3 Comments on integrity of budgetary and accounting process 97
3.3.1 Expenditure incurred without authority of law 97
3.3.2 Transfers not mandated by the Appropriation Act/Detailed Demands for Grants (into Public Account/ Bank Accounts)
98
3.3.3 Misclassification of capital expenditure as revenue expenditure and charged expenditure as voted expenditure and vice versa
99
3.3.3.1 Other misclassification 100
3.3.4 Unnecessary or excessive supplementary demand for grants
101
3.3.5 Excess, Unnecessary or insufficient re-appropriation 104
3.3.6 Unspent amount and surrendered appropriations and/or Large Savings/ Surrenders
105
3.3.7 Excess expenditure and its regularisation 108
3.3.7.1 Excess expenditure relating to Financial Year 2019-20
108
3.3.7.2 Persistent excesses in certain Grants 110
3.3.7.3 Regularisation of excess expenditure of previous financial years
111
3.3.8 Grant-in-aid for creation of capital assets 111 3.4 Comments on transparency of budgetary and Accounting
process 112
3.4.1 Lumpsum budgetary provisions 112 3.5 Comments on effectiveness of budgetary and accounting
process 114
3.5.1 Budget projection and gap between expectation and actual
114
3.5.2 Supplementary budget and opportunity cost 116
State Finances Audit Report for the year ended 31 March 2020
iv
Table of contents Page No.
3.5.3 Major policy pronouncements in budget and their actual funding for ensuring implementation
118
3.5.4 Financial power being flouted –in relation to re-appropriation
118
3.5.5 Rush of expenditure 119 3.5.6 Review of selected grants 121
3.6 Good Practices 127 3.7 Recommendations 127
CHAPTER IV: QUALITY OF ACCOUNTS AND FINANCIAL REPORTING PRACTICES
4.1 Funds outside Consolidated Fund or Public Account of the State
129
4.1.1 Non Remittance of levies into the Consolidated Fund of the State
129
4.1.1.1 Building and Other Constructions Workers’ Welfare Cess
129
4.1.1.2 Contributions to District Mineral Foundation Trust 130 4.1.1.3 Funds of regulators outside Government accounts 131
4.2 Non-inclusion of clear cut liabilities incurred during the financial year
132
4.3 Non discharge of liability in respect of interest towards interest bearing deposits
133
4.4 Funds transferred to State Implementing Agencies outside the State budget
133
4.5 Deposit of Local Funds 135 4.6 Delay in submission of Utilisation Certificates 136
4.6.1 Recording of Grantee Institution as “Others” 137 4.7 Abstract Contingent bills 137 4.8 Personal Deposit Accounts 138
4.8.1 Inoperative and non-reconciled PD Accounts 138 4.8.2 Operation of Treasury Savings Bank Accounts 139
4.9 Indiscriminate use of Minor head 800 143 4.10 Outstanding balance under major Suspense and DDR heads 146 4.11 Non-reconciliation of Departmental figures 148
Table of contents
v
Table of contents Page No.
4.12 Reconciliation of Cash Balances 149 4.13 Compliance with Accounting Standards 150 4.14 Submission of Accounts/Separate Audit Reports of
Autonomous Bodies 151
4.14.1 Cases of Adverse opinion 153
4.14.2 Non entrustment of Autonomous Bodies/Authorities to Audit
154
4.15 Departmental Commercial Undertakings 154 4.16 Non-submission of details of grants / loans given to bodies
and authorities 155
4.17 Timeliness and Quality of Accounts 156 4.18 Misappropriations, losses, thefts, etc. 156 4.19 Follow up action on State Finances Audit Report 157 4.20 Conclusions 157 4.21 Recommendations 158
State Finances Audit Report for the year ended 31 March 2020
vi
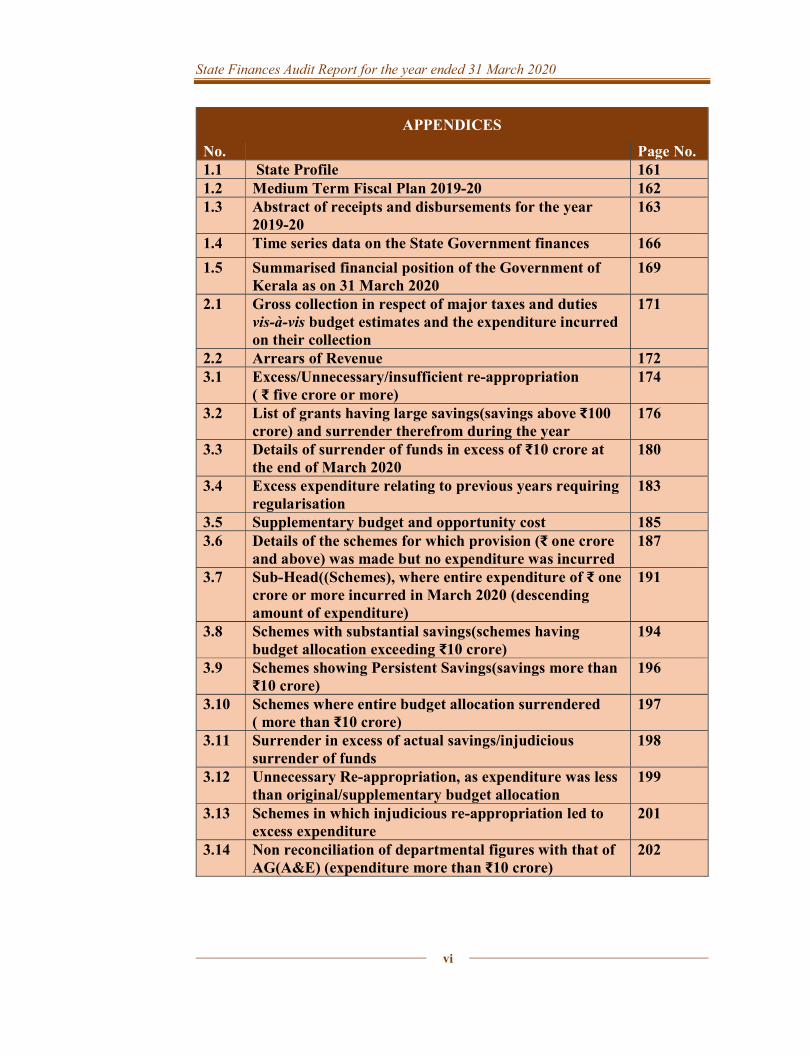
APPENDICES
No. Page No. 1.1 State Profile 161 1.2 Medium Term Fiscal Plan 2019-20 162 1.3 Abstract of receipts and disbursements for the year
2019-20 163
1.4 Time series data on the State Government finances 166 1.5 Summarised financial position of the Government of
Kerala as on 31 March 2020 169
2.1 Gross collection in respect of major taxes and duties vis-à-vis budget estimates and the expenditure incurred on their collection
171
2.2 Arrears of Revenue 172 3.1 Excess/Unnecessary/insufficient re-appropriation
( ₹ five crore or more) 174
3.2 List of grants having large savings(savings above ₹100 crore) and surrender therefrom during the year
176
3.3 Details of surrender of funds in excess of ₹10 crore at the end of March 2020
180
3.4 Excess expenditure relating to previous years requiring regularisation
183
3.5 Supplementary budget and opportunity cost 185 3.6 Details of the schemes for which provision (₹ one crore
and above) was made but no expenditure was incurred 187
3.7 Sub-Head((Schemes), where entire expenditure of ₹ one crore or more incurred in March 2020 (descending amount of expenditure)
191
3.8 Schemes with substantial savings(schemes having budget allocation exceeding ₹10 crore)
194
3.9 Schemes showing Persistent Savings(savings more than ₹10 crore)
196
3.10 Schemes where entire budget allocation surrendered ( more than ₹10 crore)
197
3.11 Surrender in excess of actual savings/injudicious surrender of funds
198
3.12 Unnecessary Re-appropriation, as expenditure was less than original/supplementary budget allocation
199
3.13 Schemes in which injudicious re-appropriation led to excess expenditure
201
3.14 Non reconciliation of departmental figures with that of AG(A&E) (expenditure more than ₹10 crore)
202
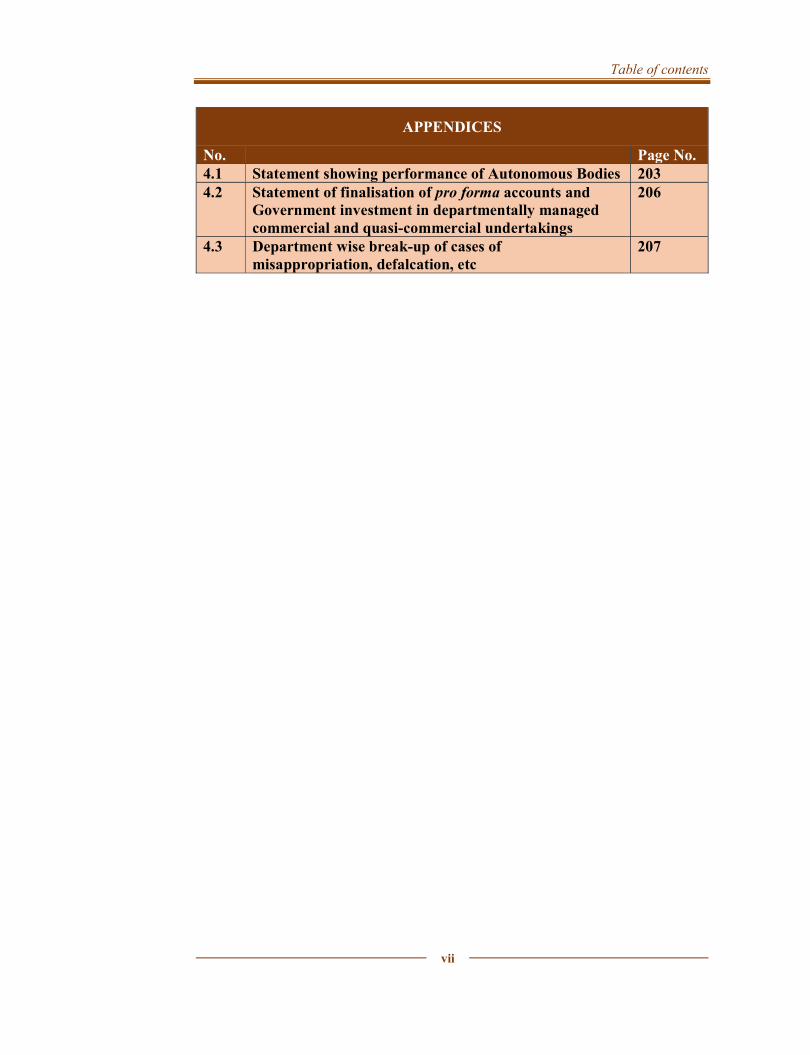
Table of contents
vii
APPENDICES
No. Page No. 4.1 Statement showing performance of Autonomous Bodies 203 4.2 Statement of finalisation of pro forma accounts and
Government investment in departmentally managed commercial and quasi-commercial undertakings
206
4.3 Department wise break-up of cases of misappropriation, defalcation, etc
207

ix
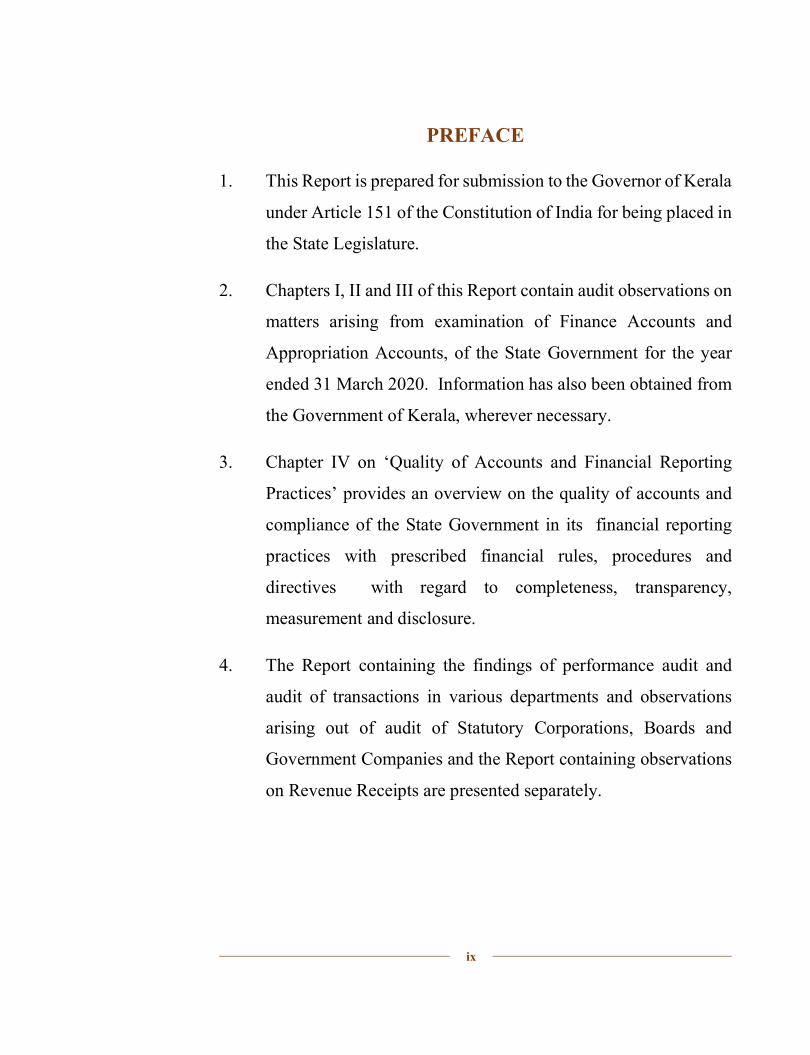
PREFACE
1. This Report is prepared for submission to the Governor of Kerala
under Article 151 of the Constitution of India for being placed in
the State Legislature.
2. Chapters I, II and III of this Report contain audit observations on
matters arising from examination of Finance Accounts and
Appropriation Accounts, of the State Government for the year
ended 31 March 2020. Information has also been obtained from
the Government of Kerala, wherever necessary.
3. Chapter IV on ‘Quality of Accounts and Financial Reporting
Practices’ provides an overview on the quality of accounts and
compliance of the State Government in its financial reporting
practices with prescribed financial rules, procedures and
directives with regard to completeness, transparency,
measurement and disclosure.
4. The Report containing the findings of performance audit and
audit of transactions in various departments and observations
arising out of audit of Statutory Corporations, Boards and
Government Companies and the Report containing observations
on Revenue Receipts are presented separately.

CHAPTER I OVERVIEW
CHAPTER I OVERVIEW

CHAPTER I OVERVIEW
1
CHAPTER I OVERVIEW
1.1 Profile of Kerala The State is located at the southern end of the country, sharing borders with Tamil Nadu and Karnataka. Geographical area-wise, Kerala is ranked 22nd in the country with an area of 38,863 sq.km. The State has a population of 3.54 crore (14 in the country) and is ranked as the fifth1 most densely populated State with a density of 860 persons per sq.km. The decadal growth rate of population was 5.57 per cent (3.35 crore in 2011 to 3.54 crore in 2020), which is the second lowest2 among Indian states. The literacy rate of Kerala (94 per cent) is the highest3 among the Indian states. The Gross State Domestic Product (GSDP) in 2019-20 of the State at current prices was ₹8,54,689 crore. The General data relating to the State is given in Appendix 1.1. 1.1.1 Gross State Domestic Product of Kerala Gross State Domestic Product (GSDP) is the value of all the goods and services produced within the boundaries of the State in a given period of time. Growth of GSDP is an important indicator of the State’s economy, as it denotes the extent of changes in the level of economic development of the State over a period. Though the growth rate of GSDP of Kerala declined from 11.41 per cent in 2018-19 to 9.34 per cent in 2019-20, it was higher as compared to the growth rate of National GDP during the year. State’s GSDP and its growth rate as well as National GDP and growth rate for the period from 2015-16 to 2019-20 are shown in Table 1.1. Table 1.1: Trends in GSDP compared to GDP (at current prices)
(₹ in crore) Year 2015-16 2016-17 2017-18 2018-19 2019-20 National GDP (2011-12 Series) 13771874
15391669 17098304 18971237 20339849
Growth rate of GDP over previous year (in per cent)
10.46 11.76 11.09 10.95 7.21
State’s GSDP (2011-12 Series) 561994 634886 701577 781653 854689
Growth rate of GSDP over previous year (in per cent)
9.64 12.97 10.50 11.41 9.34
Source: Ministry of Statistics and Programme Implementation website as on 31.07.2020
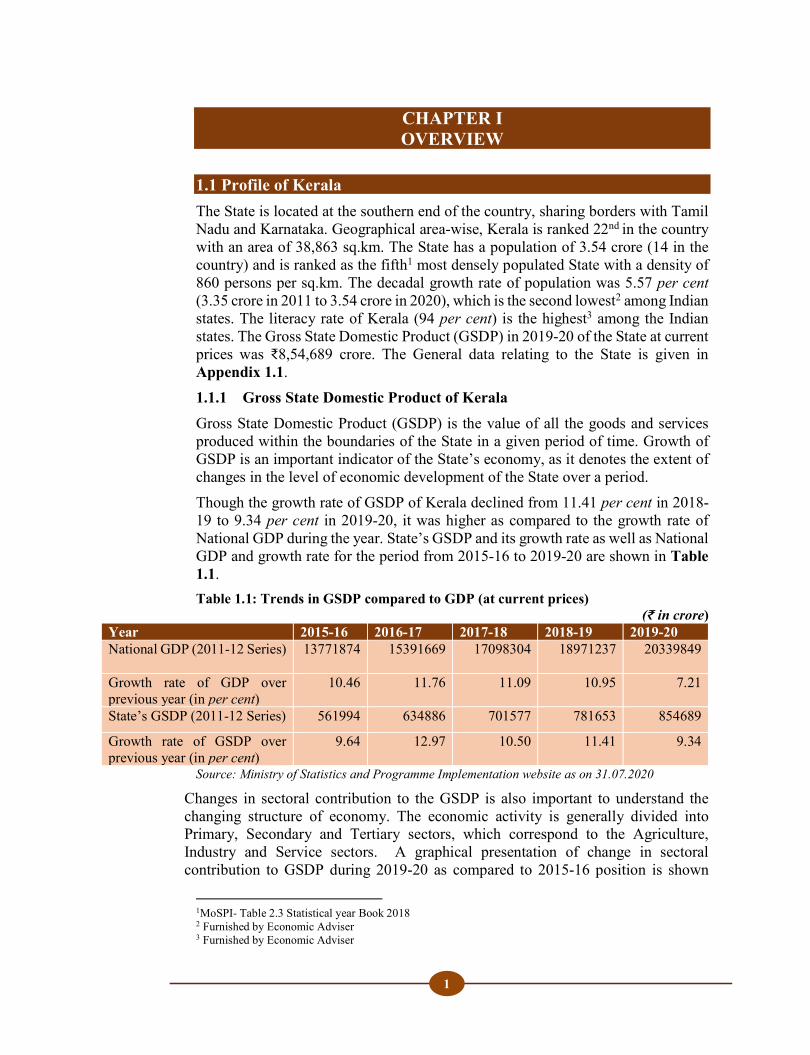
Changes in sectoral contribution to the GSDP is also important to understand the changing structure of economy. The economic activity is generally divided into Primary, Secondary and Tertiary sectors, which correspond to the Agriculture, Industry and Service sectors. A graphical presentation of change in sectoral contribution to GSDP during 2019-20 as compared to 2015-16 position is shown
1MoSPI- Table 2.3 Statistical year Book 2018 2 Furnished by Economic Adviser 3 Furnished by Economic Adviser
State Finances Audit Report for the year ended 31 March 2020
2
below in Chart 1.1
Source: Department of Economics and Statistics, Kerala
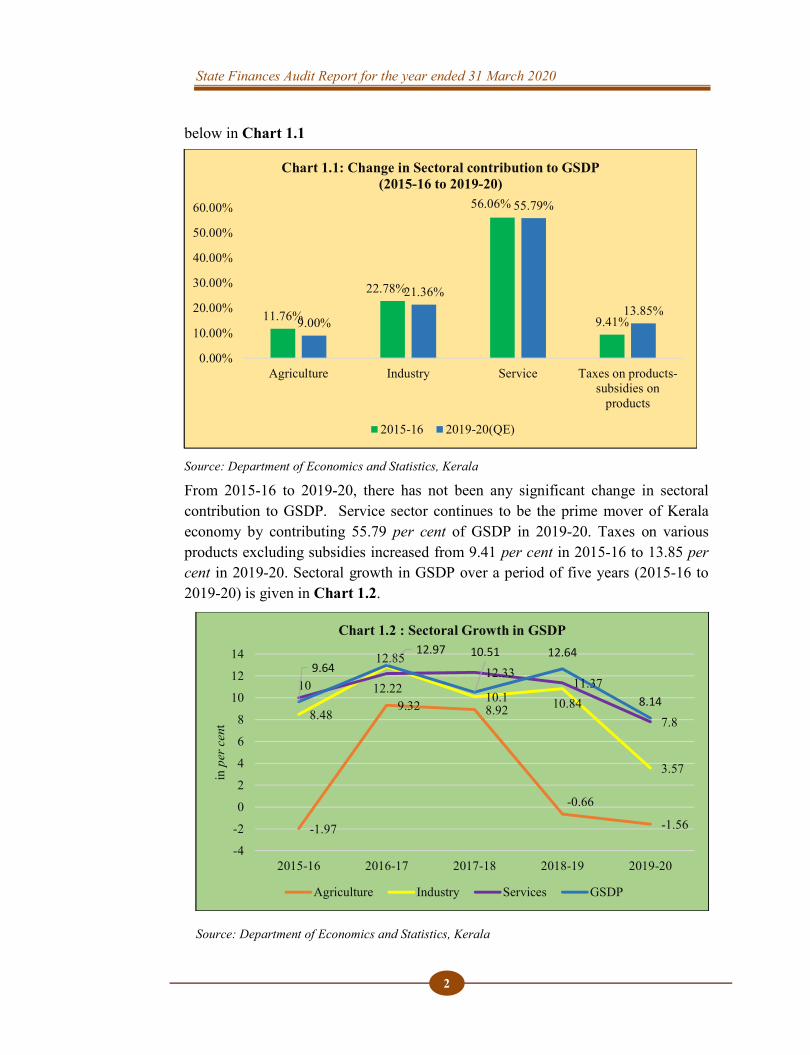
From 2015-16 to 2019-20, there has not been any significant change in sectoral contribution to GSDP. Service sector continues to be the prime mover of Kerala economy by contributing 55.79 per cent of GSDP in 2019-20. Taxes on various products excluding subsidies increased from 9.41 per cent in 2015-16 to 13.85 per cent in 2019-20. Sectoral growth in GSDP over a period of five years (2015-16 to 2019-20) is given in Chart 1.2.
Source: Department of Economics and Statistics, Kerala
11.76%
22.78%
56.06%
9.41%9.00%
21.36%
55.79%
13.85%
0.00%
10.00%
20.00%
30.00%
40.00%
50.00%
60.00%
Agriculture Industry Service Taxes on products-subsidies on
products
Chart 1.1: Change in Sectoral contribution to GSDP(2015-16 to 2019-20)
2015-16 2019-20(QE)
-1.97
9.32 8.92
-0.66
-1.56
8.48
12.85
10.1 10.84
3.57
10 12.2212.33
11.37
7.8
9.6412.97 10.51 12.64
8.14
-4
-2
0
2
4
6
8
10
12
14
2015-16 2016-17 2017-18 2018-19 2019-20
in p
er c
ent
Chart 1.2 : Sectoral Growth in GSDP
Agriculture Industry Services GSDP
Chapter I - Overview
3
The above chart shows that all sectors have registered lower growth rates compared to previous years. The Agriculture sector has been contracting for the last two years and Chart 1.1 shows that its contribution to GSDP has also declined from 11.76 per cent in 2015-16 to nine per cent in 2019-20.
1.2 Basis and Approach to State Finances Audit Report In terms of Article 151 (2) of the Constitution of India, the reports of the Comptroller and Auditor General of India (CAG) relating to the accounts of a State are to be submitted to the Governor of the State, who shall cause them to be laid before the Legislature of the State. The State Finances Audit Report (SFAR) is prepared and submitted under Article 151 (2) of the Constitution of India. Accountant General (Accounts & Entitlements) prepares the Finance Accounts and Appropriation Accounts of the State annually, from the vouchers, challans and initial and subsidiary accounts rendered by the treasuries, offices and departments responsible for keeping of such accounts functioning under the control of the State Government, and the statements received from the Reserve Bank of India. These accounts are audited independently by the Accountant General (Audit), and certified by the CAG. Finance Accounts and Appropriation Accounts of the State constitute the core data for this report. Other sources include the following:
Budget of the State: for assessing the fiscal parameters and allocative priorities vis-à-vis projections, as well as for evaluating the effectiveness of its implementation and compliance with the relevant rules and prescribed procedures;
Results of audit carried out by the Offices of the Accountants General (Audit I & II);
Other data with Departmental Authorities and Treasuries (accounting as well as MIS);
GSDP data and other State related statistics; and
Various audit reports of the CAG of India. The analysis is also carried out in the context of recommendations of the XIV Finance Commission (FC), State Financial Responsibility and Budget Management Act, best practices and guidelines of the Government of India. A meeting is held with State Finance Department, wherein the audit approach is explained and the draft report is forwarded to the State Government for comments. Replies of the Government, where received, are incorporated in this Report at appropriate places.
State Finances Audit Report for the year ended 31 March 2020
4
1.3 Report Structure The SFAR is structured into the following four Chapters:
Chapter - I Overview This Chapter describes the basis and approach to the Report and the underlying data, provides an overview of structure of Government accounts, budgetary processes, macro-fiscal analysis of key indices and State’s fiscal position including the deficits/ surplus.
Chapter - II Finances of the State This chapter provides a broad perspective of the finances of the State, analyses the critical changes in major fiscal aggregates relative to the previous year, overall trends during the period from 2015-16 to 2019-20, debt profile of the State and key Public Account transactions, based on the Finance Accounts of the State.
Chapter - III Budgetary Management This chapter is based on the Appropriation Accounts of the State and reviews the appropriations and allocative priorities of the State Government and reports on deviations from Constitutional provisions relating to budgetary management.
Chapter - IV Quality of Accounts & Financial Reporting Practices This chapter comments on the quality of accounts rendered by various authorities of the State Government and issues of non-compliance with prescribed financial rules and regulations by various departmental officials of the State Government.
1.4 Overview of Government Account Structure and Budgetary Processes The Accounts of the State Government are kept in three parts:
1. Consolidated Fund of the State {Article 266 (1) of the Constitution of India} This Fund comprises all revenues received by the State Government, all loans raised by the State Government (market loans, bonds, loans from the Central Government, loans from Financial Institutions, Special Securities issued to National Small Savings Fund, etc.), Ways and Means advances extended by the Reserve Bank of India and all moneys received by the State Government in repayment of loans. No moneys can be appropriated from this Fund except in accordance with law and for the purposes and in the manner provided by the Constitution of India. Certain categories of expenditure (e.g., salaries of Constitutional authorities, loan repayments etc.), constitute a charge on the Consolidated Fund of the State (Charged expenditure) and are not
Chapter I - Overview
5
subject to vote by the Legislature. All other expenditure (Voted expenditure) is voted by the Legislature.
2. Contingency Fund of the State {Article 267 (2) of the Constitution of India} This Fund is in the nature of an imprest which is established by the State Legislature by law, and is placed at the disposal of the Governor to enable advances to be made for meeting unforeseen expenditure pending authorisation of such expenditure by the State Legislature. The fund is recouped by debiting the expenditure to the concerned functional major head relating to the Consolidated Fund of the State.
3. Public Accounts of the State {Article 266 (2) of the Constitution of India} Apart from above, all other public moneys received by or on behalf of the Government, where the Government acts as a banker or trustee, are credited to the Public Account. The Public Account includes repayables like Small Savings and Provident Funds, Deposits (bearing interest and not bearing interest), Advances, Reserve Funds (bearing interest and not bearing interest), Remittances and Suspense heads (both of which are transitory heads, pending final booking). The net cash balance available with the Government is also included under the Public Account. The Public Account is not subject to the vote of the Legislature.
Annual financial Statement, a statement of estimated receipts and expenditures of the Government in respect of every financial year constitutes the main budget document. The budget must distinguish expenditure on the revenue account from other expenditures. Revenue Receipts consists of tax revenue, non-tax revenue, share of Union Taxes/ Duties, and grants from Government of India. Revenue Expenditure consists of all those expenditures of the Government which do not result in creation of physical or financial assets. It relates to those expenses incurred for the normal functioning of the Government departments and various services, interest payments on debt incurred by the Government, and grants given to various institutions (even though some of the grants may be meant for creation of assets). The Capital Receipts consist of:
Debt receipts: Market Loans, Bonds, Loans from financial institutions, Net transaction under Ways and Means Advances, Loans and Advances from Central Government, etc.;
Non-debt receipts: Proceeds from disinvestment, Recoveries of loans and advances;
State Finances Audit Report for the year ended 31 March 2020
6
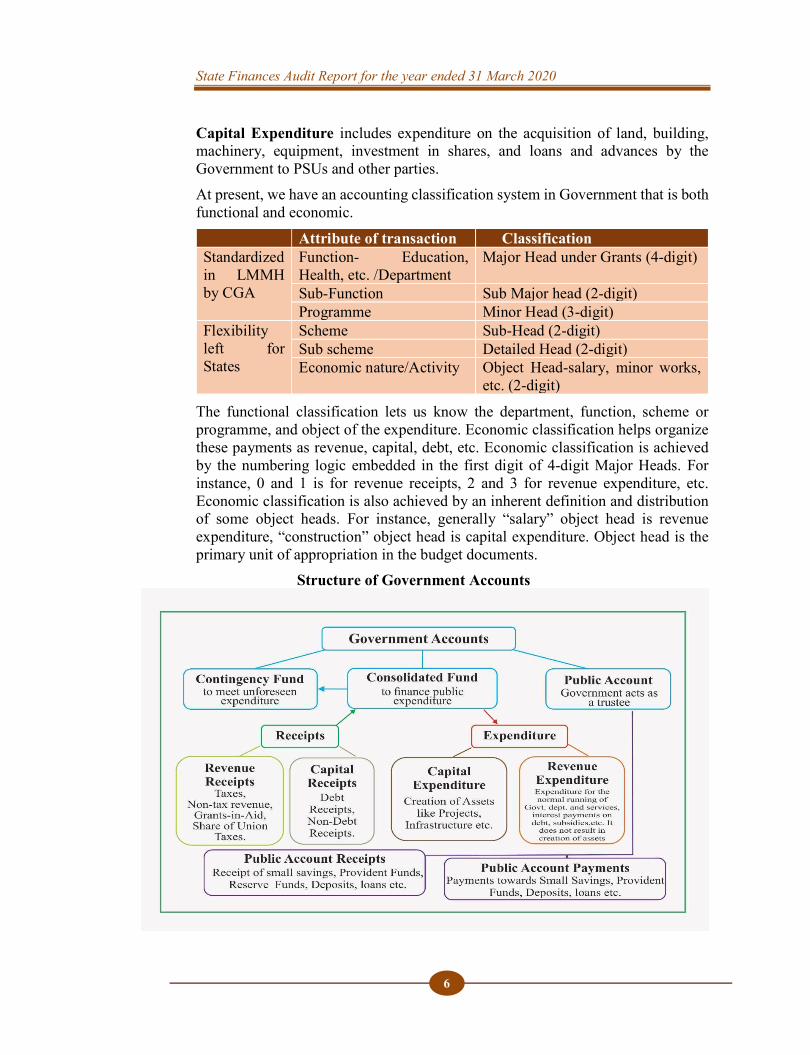
Capital Expenditure includes expenditure on the acquisition of land, building, machinery, equipment, investment in shares, and loans and advances by the Government to PSUs and other parties. At present, we have an accounting classification system in Government that is both functional and economic.
Attribute of transaction Classification Standardized in LMMH by CGA
Function- Education, Health, etc. /Department
Major Head under Grants (4-digit)
Sub-Function Sub Major head (2-digit) Programme Minor Head (3-digit)
Flexibility left for States
Scheme Sub-Head (2-digit) Sub scheme Detailed Head (2-digit) Economic nature/Activity Object Head-salary, minor works,
etc. (2-digit)
The functional classification lets us know the department, function, scheme or programme, and object of the expenditure. Economic classification helps organize these payments as revenue, capital, debt, etc. Economic classification is achieved by the numbering logic embedded in the first digit of 4-digit Major Heads. For instance, 0 and 1 is for revenue receipts, 2 and 3 for revenue expenditure, etc. Economic classification is also achieved by an inherent definition and distribution of some object heads. For instance, generally “salary” object head is revenue expenditure, “construction” object head is capital expenditure. Object head is the primary unit of appropriation in the budget documents. Structure of Government Accounts
Chapter I - Overview
7
Budgetary Processes In terms of Article 202 of the Constitution of India, the Governor of a State shall cause to be laid before the State Legislature, a statement of the estimated receipts and expenditure of the State for a financial year, in the form of an Annual Financial Statement. In terms of Article 203, the statement is submitted to the State Legislature in the form of Demands for Grants/ Appropriations and after approval of these, the Appropriation Bill is passed by the Legislature under Article 204 to provide for appropriation of the required money out of the Consolidated Fund. The State Budget Manual details the budget formulation process and guides the State Government in preparing its budgetary estimates and monitoring its expenditure activities. Results of audit scrutiny of budget and implementation of other budgetary initiatives of the State Government are detailed in Chapter III of this Report. Appendix 1.3 provides details of receipts and disbursement as well as the overall fiscal position during the current year.
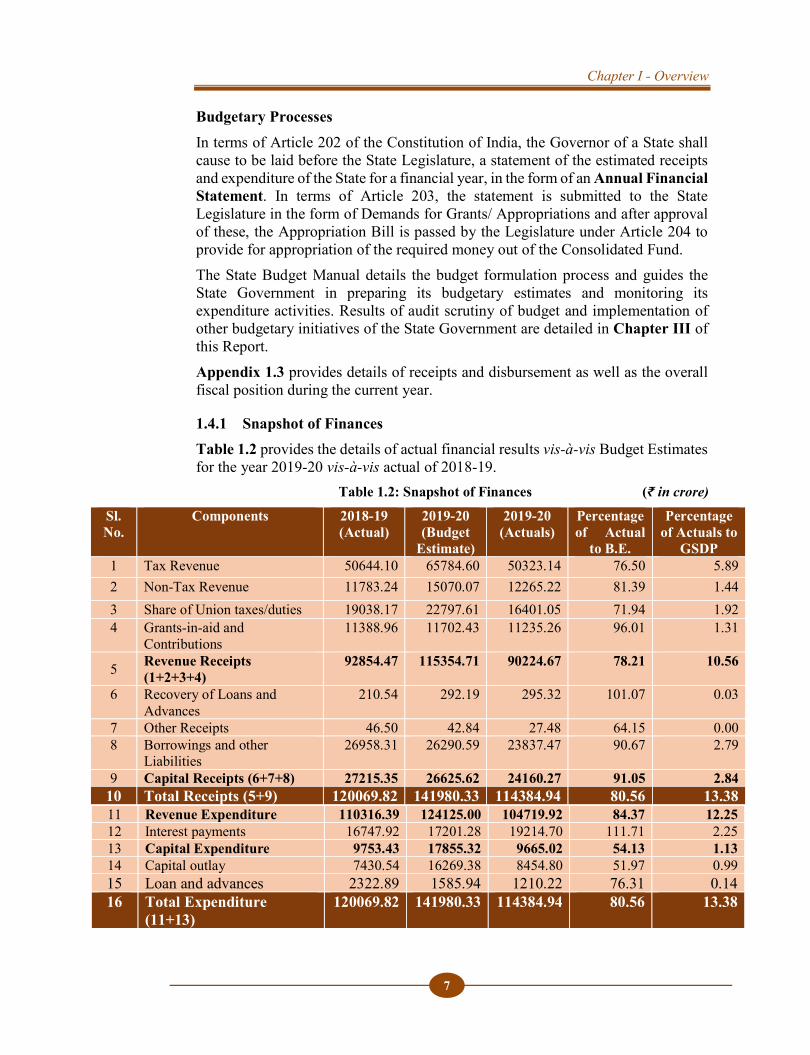
1.4.1 Snapshot of Finances Table 1.2 provides the details of actual financial results vis-à-vis Budget Estimates for the year 2019-20 vis-à-vis actual of 2018-19.
Table 1.2: Snapshot of Finances (₹ in crore)
11 Revenue Expenditure 110316.39 124125.00 104719.92 84.37 12.25 12 Interest payments 16747.92 17201.28 19214.70 111.71 2.25 13 Capital Expenditure 9753.43 17855.32 9665.02 54.13 1.13 14 Capital outlay 7430.54 16269.38 8454.80 51.97 0.99 15 Loan and advances 2322.89 1585.94 1210.22 76.31 0.14 16 Total Expenditure
(11+13) 120069.82 141980.33 114384.94 80.56 13.38
Sl. No.
Components 2018-19 (Actual)
2019-20 (Budget
Estimate)
2019-20 (Actuals)
Percentage of Actual
to B.E.
Percentage of Actuals to
GSDP 1 Tax Revenue 50644.10 65784.60 50323.14 76.50 5.89 2 Non-Tax Revenue 11783.24 15070.07 12265.22 81.39 1.44 3 Share of Union taxes/duties 19038.17 22797.61 16401.05 71.94 1.92 4 Grants-in-aid and
Contributions 11388.96 11702.43 11235.26 96.01 1.31
5 Revenue Receipts (1+2+3+4)
92854.47 115354.71 90224.67 78.21 10.56
6 Recovery of Loans and Advances
210.54 292.19 295.32 101.07 0.03
7 Other Receipts 46.50 42.84 27.48 64.15 0.00 8 Borrowings and other
Liabilities 26958.31 26290.59 23837.47 90.67 2.79
9 Capital Receipts (6+7+8) 27215.35 26625.62 24160.27 91.05 2.84 10 Total Receipts (5+9) 120069.82 141980.33 114384.94 80.56 13.38
State Finances Audit Report for the year ended 31 March 2020
8
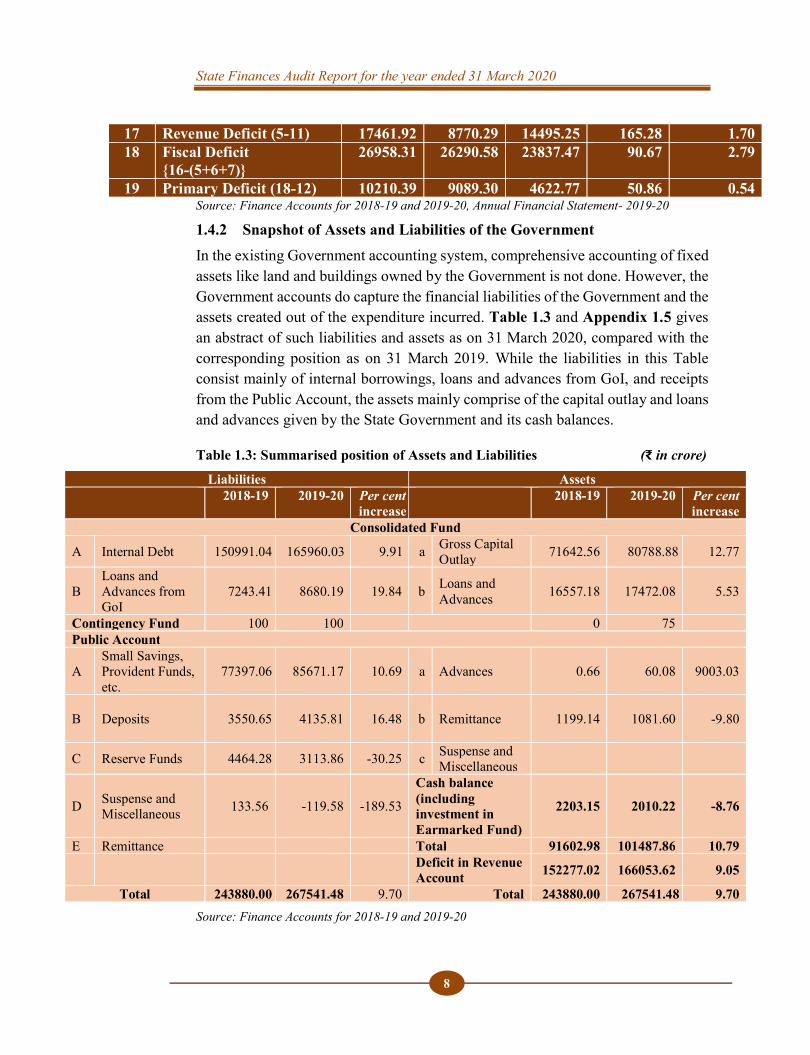
17 Revenue Deficit (5-11) 17461.92 8770.29 14495.25 165.28 1.70 18 Fiscal Deficit
{16-(5+6+7)} 26958.31 26290.58 23837.47 90.67 2.79
19 Primary Deficit (18-12) 10210.39 9089.30 4622.77 50.86 0.54 Source: Finance Accounts for 2018-19 and 2019-20, Annual Financial Statement- 2019-20
1.4.2 Snapshot of Assets and Liabilities of the Government In the existing Government accounting system, comprehensive accounting of fixed assets like land and buildings owned by the Government is not done. However, the Government accounts do capture the financial liabilities of the Government and the assets created out of the expenditure incurred. Table 1.3 and Appendix 1.5 gives an abstract of such liabilities and assets as on 31 March 2020, compared with the corresponding position as on 31 March 2019. While the liabilities in this Table consist mainly of internal borrowings, loans and advances from GoI, and receipts from the Public Account, the assets mainly comprise of the capital outlay and loans and advances given by the State Government and its cash balances.
Table 1.3: Summarised position of Assets and Liabilities (₹ in crore)
Liabilities Assets 2018-19 2019-20 Per cent
increase 2018-19 2019-20 Per cent
increase Consolidated Fund
A Internal Debt 150991.04 165960.03 9.91 a Gross Capital Outlay 71642.56 80788.88 12.77
B Loans and Advances from GoI
7243.41 8680.19 19.84 b Loans and Advances 16557.18 17472.08 5.53
Contingency Fund 100 100 0 75 Public Account
A Small Savings, Provident Funds, etc.
77397.06 85671.17 10.69 a Advances 0.66 60.08 9003.03
B Deposits
3550.65 4135.81 16.48 b Remittance 1199.14 1081.60 -9.80
C Reserve Funds 4464.28 3113.86 -30.25 c Suspense and Miscellaneous
D Suspense and Miscellaneous 133.56 -119.58 -189.53
Cash balance (including investment in Earmarked Fund)
2203.15 2010.22 -8.76
E Remittance Total 91602.98 101487.86 10.79
Deficit in Revenue Account 152277.02 166053.62 9.05
Total 243880.00 267541.48 9.70 Total 243880.00 267541.48 9.70 Source: Finance Accounts for 2018-19 and 2019-20
Chapter I - Overview
9
1.5 Fiscal Balance: Achievement of deficit and total debt target When a Government spends more than it collects by way of revenue, it incurs a deficit. There are various measures that capture Government deficit.
Revenue Deficit/ Surplus (Revenue Expenditure – Revenue Receipts)
Refers to the difference between revenue expenditure and revenue receipts. When the Government incurs a revenue deficit, it implies that the
Government is dissaving and is using up the savings of the other sectors of the economy to finance a part of its consumption expenditure.
Fiscal Deficit/ Surplus (Total expenditure – (Revenue receipts + Non-debt creating capital receipts))
It is the difference between the Revenue Receipts plus Non-debt Capital Receipts (NDCR) and the total expenditure. FD is reflective of the total borrowing requirements of Government. Fiscal deficit is the difference between the Government’s total
expenditure and its total receipts excluding borrowing. Non-debt creating capital receipts are those receipts, which are
not borrowings, and, therefore, do not give rise to debt. Examples are recovery of loans and the proceeds from the sale of PSUs.
The fiscal deficit will have to be financed through borrowing. Thus, it indicates the total borrowing requirements of the Government from all sources.
Governments usually run fiscal deficits and borrow funds for capital/ assets formation or for creation of economic and social infrastructure, so that assets created through borrowings could pay for themselves by generating an income stream. Thus, it is desirable to fully utilize borrowed funds for the creation of capital assets and to use revenue receipts for the repayment of principal and interest.
Primary Deficit/ Surplus (Gross fiscal deficit – Net Interest liabilities)
Refers to the fiscal deficit minus the interest payments. Net interest liabilities consist of interest payments minus interest
receipts by the Government on net domestic lending. The borrowing requirement of the Government includes interest
obligations on accumulated debt. To obtain an estimate of borrowing because of current expenditures exceeding revenues, we need to calculate the primary deficit.
The trends, nature, magnitude and the manner of financing these deficits and also the assessment of actual levels of revenue and fiscal deficits vis-à-vis targets set under the Kerala Fiscal Responsibility Act for the financial year 2019-20 are detailed below. The trend of deficits over the period 2015-16 to 2019-20 are presented in Appendix 1.4.
State Finances Audit Report for the year ended 31 March 2020
10
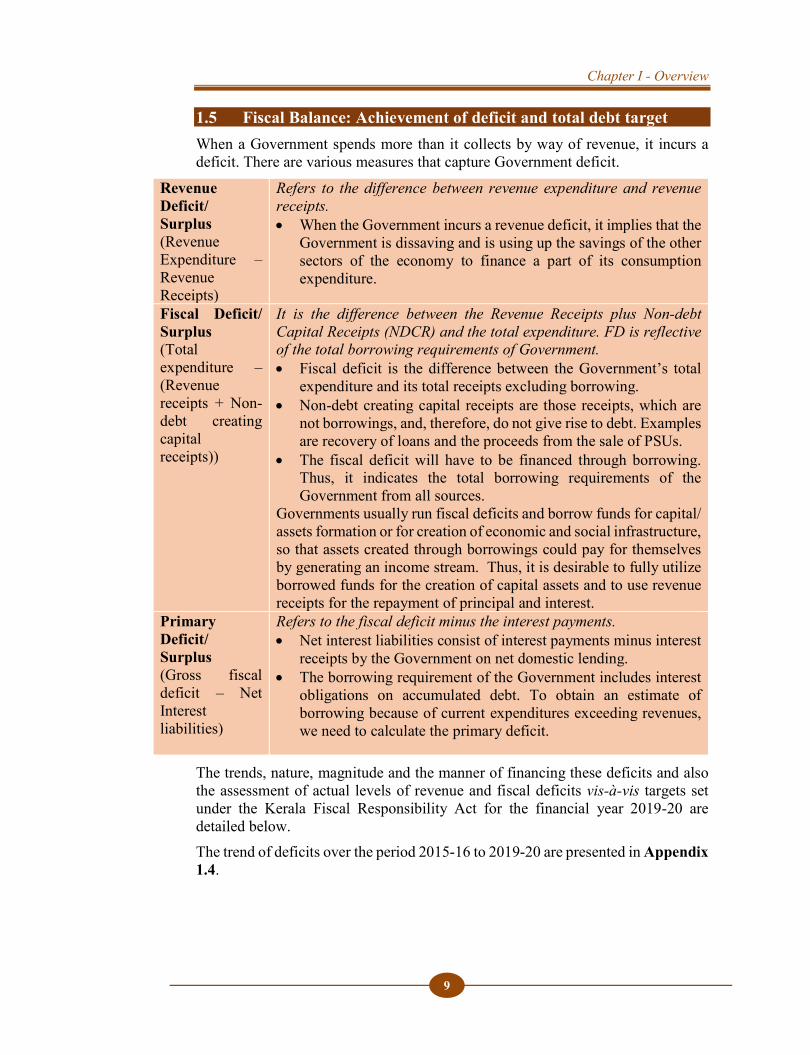
Chart 1.3 presents the trends in deficit indicators over the period 2015-16 to 2019-20
The revenue deficit and fiscal deficit of the State increased steadily during 2015-16 to 2018-19.
Revenue Deficit of the state in 2019-20 decreased over the previous year by ₹2,967 crore. Though there was a decrease in revenue receipts by ₹2,629 crore, a decrease in revenue deficit was achieved by reduction in revenue expenditure of ₹5,596 crore.
Fiscal Deficit of 2019-20 also decreased by ₹3,121 crore in comparison to previous year.
Primary deficit decreased from ₹10,210 crore in 2018-19 to ₹4,623 crore in 2019-20 due to decrease in fiscal deficit and increase in interest payments (by ₹2,466 crore) during the year.
Manner of financing deficits
Deficits must be financed by borrowings, which lead to Government debt. The concepts of deficits and debt are closely related. Deficits can be thought of as a flow which add to the stock of debt. If the Government continues to borrow year after year, it leads to the accumulation of debt and the Government must pay more and more by way of interest. These interest payments themselves contribute to the debt. Fiscal liabilities of the State comprises of Consolidated Fund liabilities and Public Account liabilities. Details for the year 2019-20 are given in Table 1.4 below:
-9657
-15484 -16928 -17462-14495
-17818
-26448 -26838 -26958-23837
-6707
-14331-11718
-10210
-4623
-30000
-25000
-20000
-15000
-10000
-5000
0
5000
10000
2015-16 2016-17 2017-18 2018-19 2019-20
(₹ in
cro
re)
Chart 1.3 : Trends in deficit parameters
Revenue Deficit Fiscal Deficit Primary Deficit
Chapter I - Overview
11
Table 1.4: Fiscal liabilities of the State
Fiscal liabilities Amount in crores Total Consolidated Fund liabilities of which, Market loans
Loans from the GoI Other Loans
₹1,74,640.00 ₹1,42,336.00
₹8,680.00 ₹ 23,624.00
Total Public Account liabilities of which, Small Savings, PF etc.
Interest bearing obligations. Non-interest-bearing obligations like Deposits
and other earmarked funds
₹90,722.00 ₹85,671.00
₹636.00 ₹4,415.00
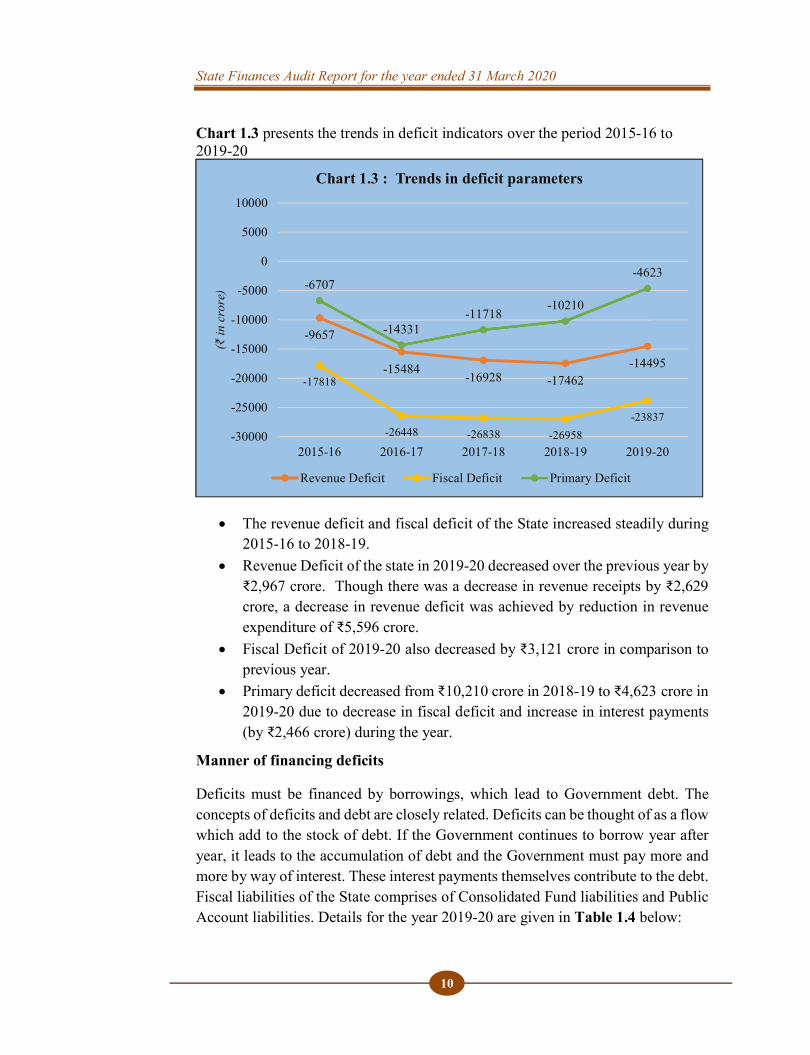
The trends of fiscal liabilities during the last five years are presented in Chart 1.4.
The overall fiscal liabilities of the State increased from ₹1,60,539 crore in 2015-16 to ₹2,65,362 crore in 2019-20, thus recording an increase of 65 per cent during the five year period. During 2019-20, the growth rate of fiscal liabilities was 9.8 per cent and it was the lowest during the five-year period.
102.5 118.27 135.5 150.99 165.967.247.61
7.487.24
8.6850.81
63.8971.53
83.3890.72
160.55189.77
214.51241.61 265.36
28.57 29.89 30.58 30.91 31.0529.67
0.00
5.00
10.00
15.00
20.00
25.00
30.00
35.00
50
100
150
200
250
300
350
400
2015-16 2016-17 2017-18 2018-19 2019-20
Fisc
al L
iabi
litie
s (in
thou
sand
cro
re)
Chart 1.4 : Trends in Fiscal Liabilites and GSDP
Internal Debt Loans from Central Government
Public Account Liabilities Total outstanding liabilities
Total outstanding liabilities to GSDP ratio Target
State Finances Audit Report for the year ended 31 March 2020
12
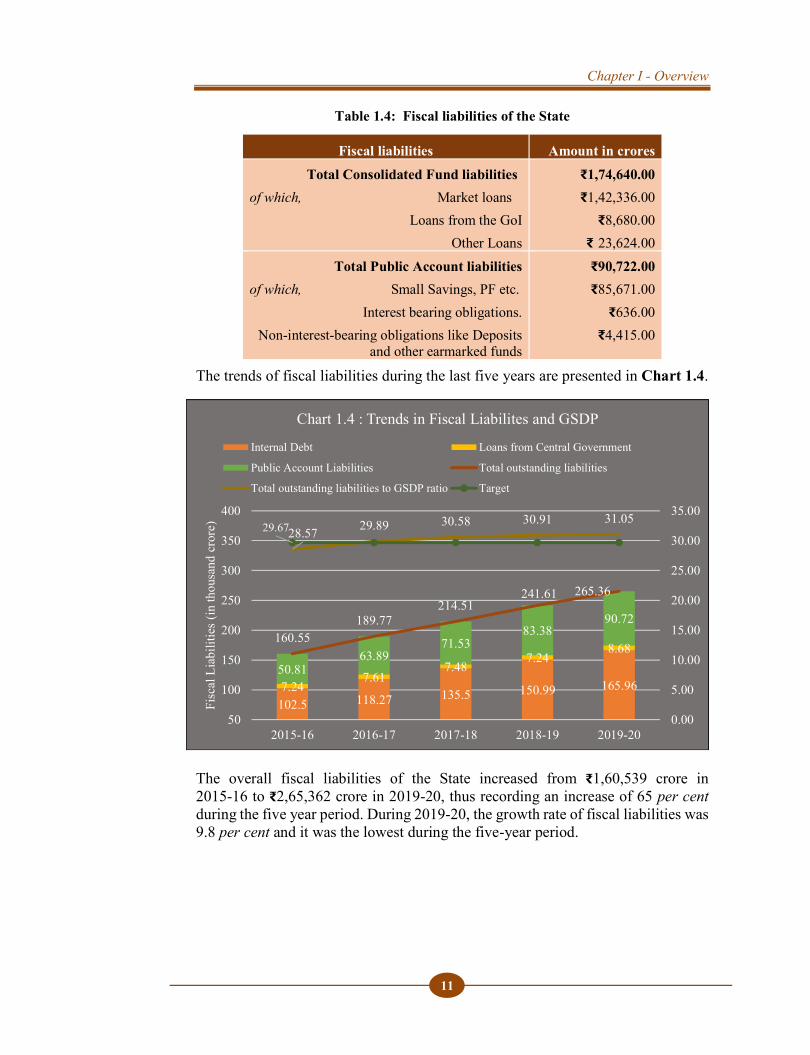
Chart 1.5 presents the trends in deficit indicators relative to GSDP.
From the above, it can be seen that the ratio of revenue deficit, fiscal deficit, and primary deficit to GSDP showed an improvement in 2019-20 as compared to the previous year. However, the post audit deficit figures are higher as explained in Para 1.6.
Achievement of fiscal targets
As per the recommendations of the XIV FC, the State Government amended the Kerala Fiscal Responsibility Act by enacting the Kerala Fiscal Responsibility (Amendment) Act, 2018 on 31 March 2018 with revised fiscal targets for the Finance Commission period. According to the Act, the Government shall eliminate revenue deficit completely during the period from 2017-18 to 2019-20 and shall maintain the fiscal deficit to 3 per cent of GSDP during the same period. Major fiscal variables as targeted in the Kerala Fiscal Responsibility (Amendment) Act, 2018 along with actual thereof are given in Table 1.5.
-1.7
-2.4 -2.4 -2.2-1.7
-3.2
-4.2-3.8
-3.5
-2.8
-1.2
-2.3
-1.7-1.3
-0.5
-4.5-4
-3.5-3
-2.5-2
-1.5-1
-0.50
2015-16 2016-17 2017-18 2018-19 2019-20
(In
perc
enta
ge to
GSD
P)
Chart 1.5 : Trends in deficit indicators relative to GSDP
RD/GSDP FD/GSDP PD/GSDP
Chapter I - Overview
13
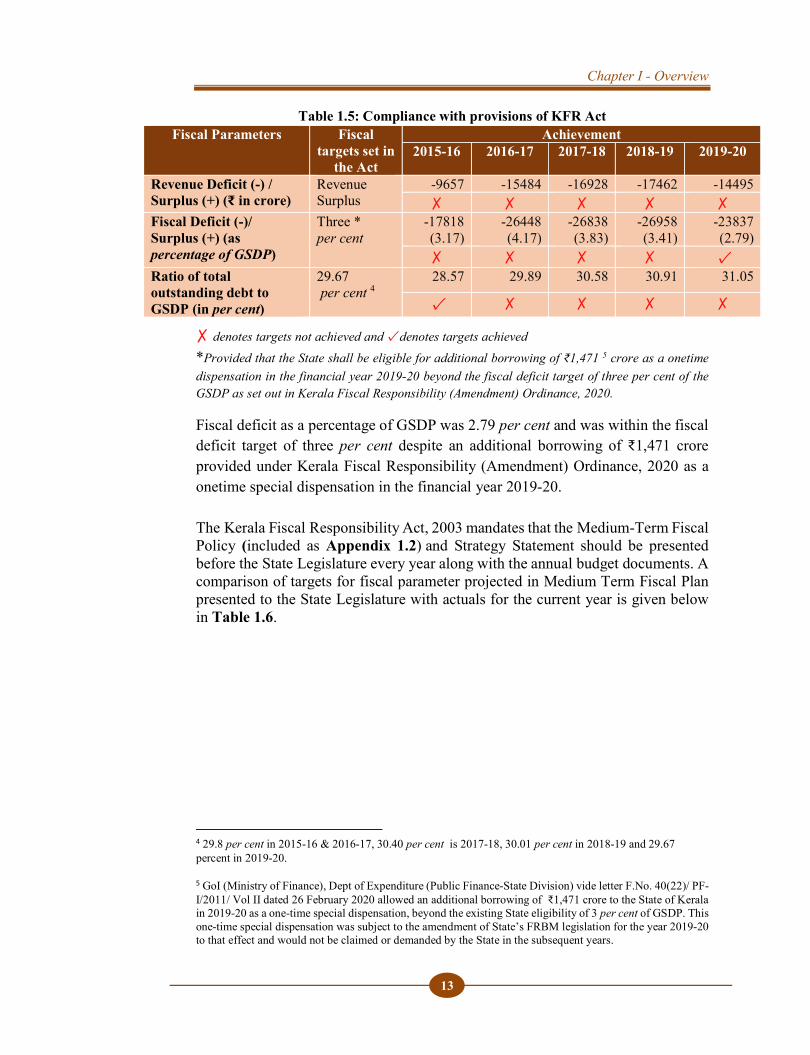
Table 1.5: Compliance with provisions of KFR Act
✗ denotes targets not achieved and ✓ denotes targets achieved *Provided that the State shall be eligible for additional borrowing of ₹1,471 5 crore as a onetime dispensation in the financial year 2019-20 beyond the fiscal deficit target of three per cent of the GSDP as set out in Kerala Fiscal Responsibility (Amendment) Ordinance, 2020.
Fiscal deficit as a percentage of GSDP was 2.79 per cent and was within the fiscal deficit target of three per cent despite an additional borrowing of ₹1,471 crore provided under Kerala Fiscal Responsibility (Amendment) Ordinance, 2020 as a onetime special dispensation in the financial year 2019-20. The Kerala Fiscal Responsibility Act, 2003 mandates that the Medium-Term Fiscal Policy (included as Appendix 1.2) and Strategy Statement should be presented before the State Legislature every year along with the annual budget documents. A comparison of targets for fiscal parameter projected in Medium Term Fiscal Plan presented to the State Legislature with actuals for the current year is given below in Table 1.6.
4 29.8 per cent in 2015-16 & 2016-17, 30.40 per cent is 2017-18, 30.01 per cent in 2018-19 and 29.67 percent in 2019-20.
5 GoI (Ministry of Finance), Dept of Expenditure (Public Finance-State Division) vide letter F.No. 40(22)/ PF-I/2011/ Vol II dated 26 February 2020 allowed an additional borrowing of ₹1,471 crore to the State of Kerala in 2019-20 as a one-time special dispensation, beyond the existing State eligibility of 3 per cent of GSDP. This one-time special dispensation was subject to the amendment of State’s FRBM legislation for the year 2019-20 to that effect and would not be claimed or demanded by the State in the subsequent years.
Fiscal Parameters Fiscal targets set in
the Act
Achievement 2015-16 2016-17 2017-18 2018-19 2019-20
Revenue Deficit (-) / Surplus (+) (₹ in crore)
Revenue Surplus
-9657 -15484 -16928 -17462 -14495 ✗ ✗ ✗ ✗ ✗
Fiscal Deficit (-)/ Surplus (+) (as percentage of GSDP)
Three * per cent
-17818 (3.17)
-26448 (4.17)
-26838 (3.83)
-26958 (3.41)
-23837 (2.79)
✗ ✗ ✗ ✗ ✓ Ratio of total outstanding debt to GSDP (in per cent)
29.67 per cent 4
28.57 29.89 30.58 30.91 31.05
✓ ✗ ✗ ✗ ✗
State Finances Audit Report for the year ended 31 March 2020
14
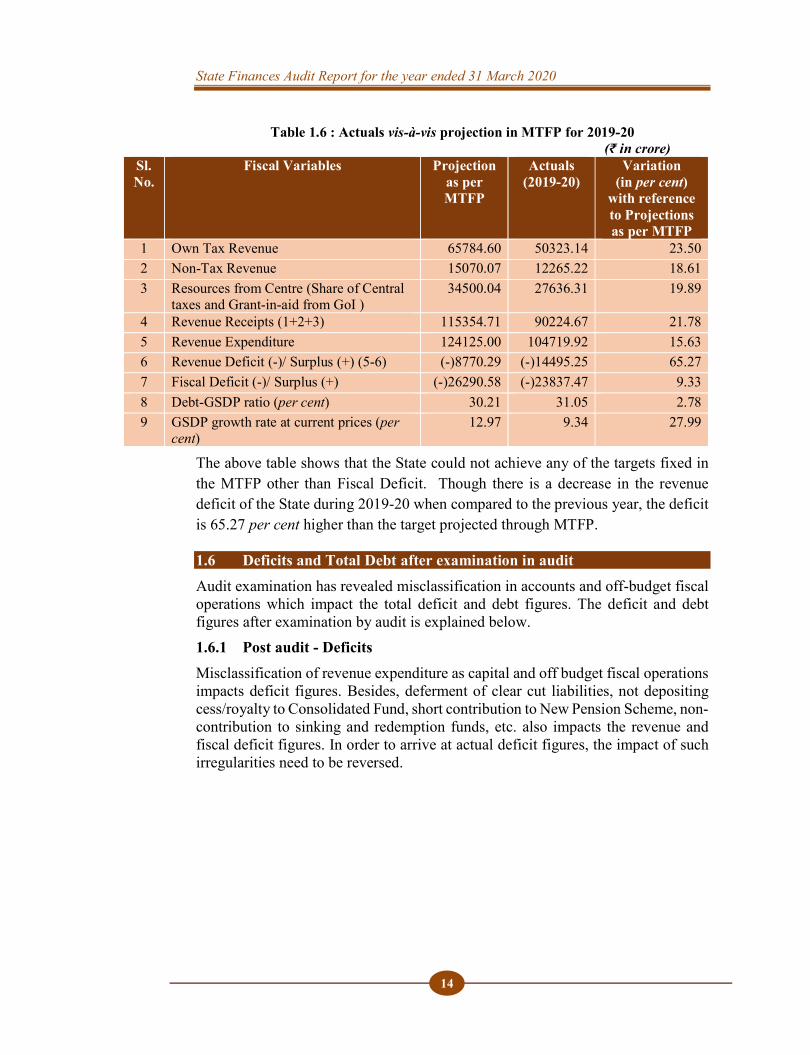
Table 1.6 : Actuals vis-à-vis projection in MTFP for 2019-20 (₹ in crore)
The above table shows that the State could not achieve any of the targets fixed in the MTFP other than Fiscal Deficit. Though there is a decrease in the revenue deficit of the State during 2019-20 when compared to the previous year, the deficit is 65.27 per cent higher than the target projected through MTFP.
1.6 Deficits and Total Debt after examination in audit Audit examination has revealed misclassification in accounts and off-budget fiscal operations which impact the total deficit and debt figures. The deficit and debt figures after examination by audit is explained below. 1.6.1 Post audit - Deficits Misclassification of revenue expenditure as capital and off budget fiscal operations impacts deficit figures. Besides, deferment of clear cut liabilities, not depositing cess/royalty to Consolidated Fund, short contribution to New Pension Scheme, non-contribution to sinking and redemption funds, etc. also impacts the revenue and fiscal deficit figures. In order to arrive at actual deficit figures, the impact of such irregularities need to be reversed.
Sl. No.
Fiscal Variables Projection as per MTFP
Actuals (2019-20)
Variation (in per cent)
with reference to Projections as per MTFP
1 Own Tax Revenue 65784.60 50323.14 23.50 2 Non-Tax Revenue 15070.07 12265.22 18.61 3 Resources from Centre (Share of Central
taxes and Grant-in-aid from GoI ) 34500.04 27636.31 19.89
4 Revenue Receipts (1+2+3) 115354.71 90224.67 21.78 5 Revenue Expenditure 124125.00 104719.92 15.63 6 Revenue Deficit (-)/ Surplus (+) (5-6) (-)8770.29 (-)14495.25 65.27 7 Fiscal Deficit (-)/ Surplus (+) (-)26290.58 (-)23837.47 9.33 8 Debt-GSDP ratio (per cent) 30.21 31.05 2.78 9 GSDP growth rate at current prices (per
cent) 12.97 9.34 27.99
Chapter I - Overview
15
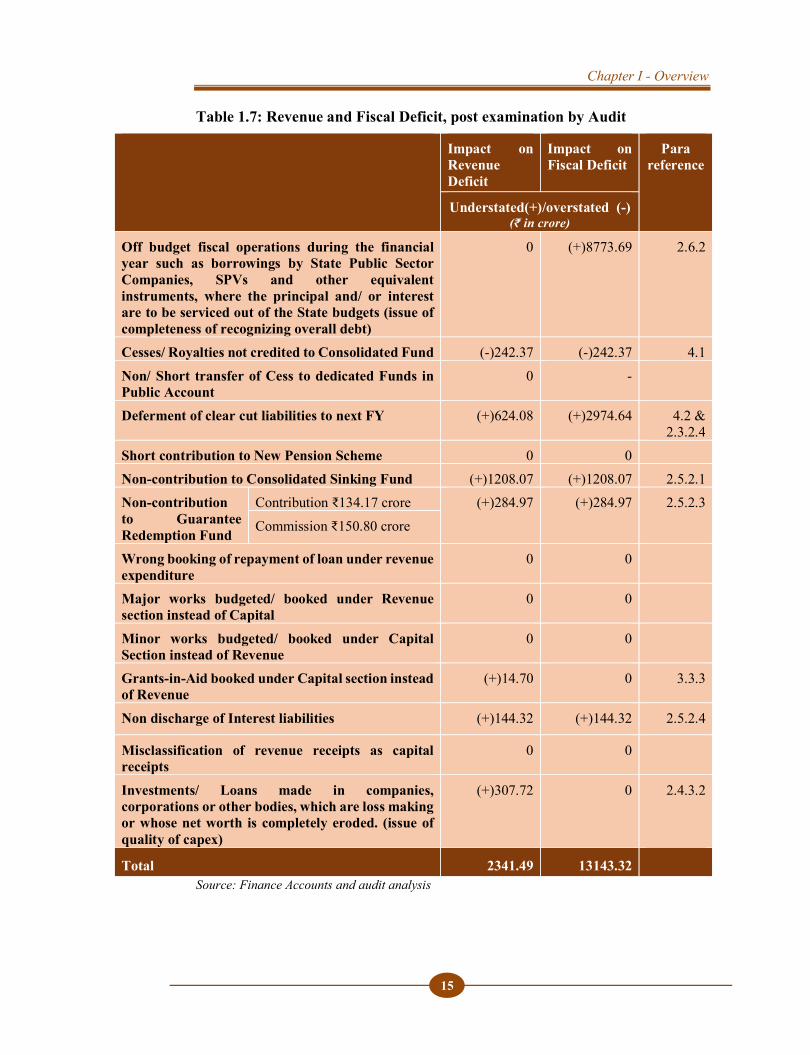
Table 1.7: Revenue and Fiscal Deficit, post examination by Audit
Impact on Revenue Deficit
Impact on Fiscal Deficit
Para reference
Understated(+)/overstated (-) (₹ in crore)
Off budget fiscal operations during the financial year such as borrowings by State Public Sector Companies, SPVs and other equivalent instruments, where the principal and/ or interest are to be serviced out of the State budgets (issue of completeness of recognizing overall debt)
0 (+)8773.69 2.6.2
Cesses/ Royalties not credited to Consolidated Fund (-)242.37 (-)242.37 4.1 Non/ Short transfer of Cess to dedicated Funds in Public Account
0 -
Deferment of clear cut liabilities to next FY (+)624.08 (+)2974.64 4.2 & 2.3.2.4
Short contribution to New Pension Scheme 0 0 Non-contribution to Consolidated Sinking Fund (+)1208.07 (+)1208.07 2.5.2.1 Non-contribution to Guarantee Redemption Fund
Contribution ₹134.17 crore (+)284.97 (+)284.97 2.5.2.3 Commission ₹150.80 crore
Wrong booking of repayment of loan under revenue expenditure
0 0
Major works budgeted/ booked under Revenue section instead of Capital
0 0
Minor works budgeted/ booked under Capital Section instead of Revenue
0 0
Grants-in-Aid booked under Capital section instead of Revenue
(+)14.70 0 3.3.3
Non discharge of Interest liabilities (+)144.32 (+)144.32 2.5.2.4
Misclassification of revenue receipts as capital receipts
0 0
Investments/ Loans made in companies, corporations or other bodies, which are loss making or whose net worth is completely eroded. (issue of quality of capex)
(+)307.72 0 2.4.3.2
Total 2341.49 13143.32 Source: Finance Accounts and audit analysis
State Finances Audit Report for the year ended 31 March 2020
16
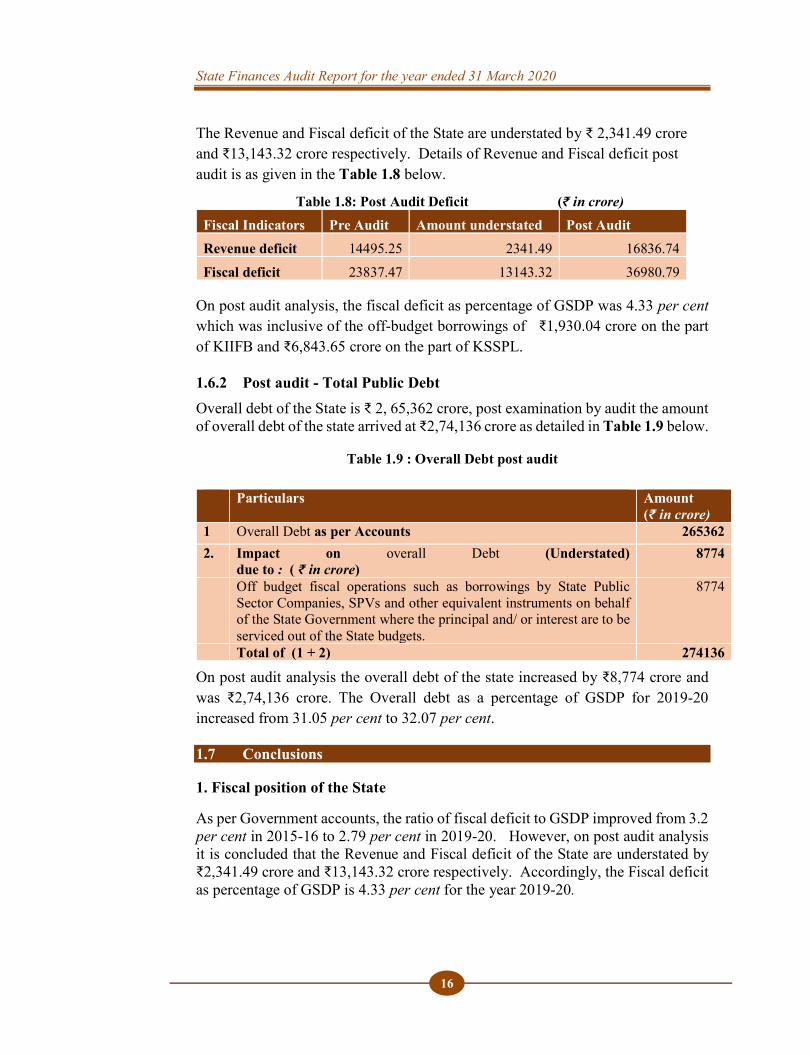
The Revenue and Fiscal deficit of the State are understated by ₹ 2,341.49 crore and ₹13,143.32 crore respectively. Details of Revenue and Fiscal deficit post audit is as given in the Table 1.8 below.
Table 1.8: Post Audit Deficit (₹ in crore) Fiscal Indicators Pre Audit Amount understated Post Audit Revenue deficit 14495.25 2341.49 16836.74 Fiscal deficit 23837.47 13143.32 36980.79
On post audit analysis, the fiscal deficit as percentage of GSDP was 4.33 per cent which was inclusive of the off-budget borrowings of ₹1,930.04 crore on the part of KIIFB and ₹6,843.65 crore on the part of KSSPL.
1.6.2 Post audit - Total Public Debt Overall debt of the State is ₹ 2, 65,362 crore, post examination by audit the amount of overall debt of the state arrived at ₹2,74,136 crore as detailed in Table 1.9 below.
Table 1.9 : Overall Debt post audit
On post audit analysis the overall debt of the state increased by ₹8,774 crore and was ₹2,74,136 crore. The Overall debt as a percentage of GSDP for 2019-20 increased from 31.05 per cent to 32.07 per cent.
1.7 Conclusions
1. Fiscal position of the State
As per Government accounts, the ratio of fiscal deficit to GSDP improved from 3.2 per cent in 2015-16 to 2.79 per cent in 2019-20. However, on post audit analysis it is concluded that the Revenue and Fiscal deficit of the State are understated by ₹2,341.49 crore and ₹13,143.32 crore respectively. Accordingly, the Fiscal deficit as percentage of GSDP is 4.33 per cent for the year 2019-20.
Particulars Amount (₹ in crore)
1 Overall Debt as per Accounts 265362 2. Impact on overall Debt (Understated)
due to : ( ₹ in crore) 8774
Off budget fiscal operations such as borrowings by State Public Sector Companies, SPVs and other equivalent instruments on behalf of the State Government where the principal and/ or interest are to be serviced out of the State budgets.
8774
Total of (1 + 2) 274136
Chapter I - Overview
17
The State did not achieve any of the targets fixed in its Medium Term Fiscal Plan or the Kerala Fiscal Responsibility Act during 2019-20. As per the recommendation of the XIV FC, fiscal deficit to GSDP ratio was to be anchored at 3 per cent but it was 4.33 per cent during 2019-20.
2. Overall Debt
The overall debt of the State including off budget borrowings is ₹2,74,136 crore. If the Government continues to borrow year after year, it leads to the accumulation of debt and the Government has to pay more and more by way of interest. These interest payments themselves contribute to the debt. Increase in debt over the years not only reduces the capital formation and growth but also acts as a burden on future generations.
1.8 Recommendation The State Government needs to control the revenue and fiscal deficits so as to achieve the targets fixed in the Kerala Fiscal Responsibility Act.

CHAPTER II
FINANCES OF THE STATE
CHAPTER II
FINANCES OF THE STATE

CHAPTER I OVERVIEW
19
CHAPTER II FINANCES OF THE STATE
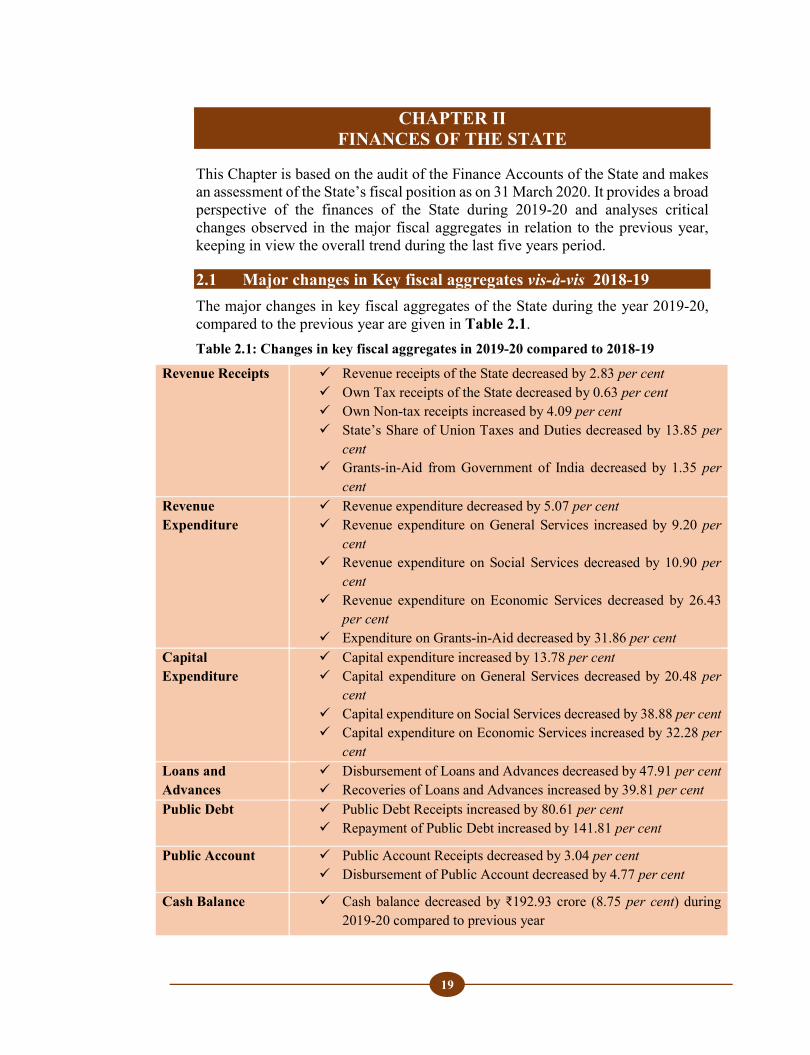
This Chapter is based on the audit of the Finance Accounts of the State and makes an assessment of the State’s fiscal position as on 31 March 2020. It provides a broad perspective of the finances of the State during 2019-20 and analyses critical changes observed in the major fiscal aggregates in relation to the previous year, keeping in view the overall trend during the last five years period.
2.1 Major changes in Key fiscal aggregates vis-à-vis 2018-19 The major changes in key fiscal aggregates of the State during the year 2019-20, compared to the previous year are given in Table 2.1. Table 2.1: Changes in key fiscal aggregates in 2019-20 compared to 2018-19
Revenue Receipts Revenue receipts of the State decreased by 2.83 per cent Own Tax receipts of the State decreased by 0.63 per cent Own Non-tax receipts increased by 4.09 per cent State’s Share of Union Taxes and Duties decreased by 13.85 per
cent Grants-in-Aid from Government of India decreased by 1.35 per
cent Revenue Expenditure
Revenue expenditure decreased by 5.07 per cent Revenue expenditure on General Services increased by 9.20 per
cent Revenue expenditure on Social Services decreased by 10.90 per
cent Revenue expenditure on Economic Services decreased by 26.43
per cent Expenditure on Grants-in-Aid decreased by 31.86 per cent
Capital Expenditure
Capital expenditure increased by 13.78 per cent Capital expenditure on General Services decreased by 20.48 per
cent Capital expenditure on Social Services decreased by 38.88 per cent Capital expenditure on Economic Services increased by 32.28 per
cent Loans and Advances
Disbursement of Loans and Advances decreased by 47.91 per cent Recoveries of Loans and Advances increased by 39.81 per cent
Public Debt Public Debt Receipts increased by 80.61 per cent Repayment of Public Debt increased by 141.81 per cent
Public Account Public Account Receipts decreased by 3.04 per cent Disbursement of Public Account decreased by 4.77 per cent
Cash Balance Cash balance decreased by ₹192.93 crore (8.75 per cent) during 2019-20 compared to previous year
State Finances Audit Report for the year ended 31 March 2020
20
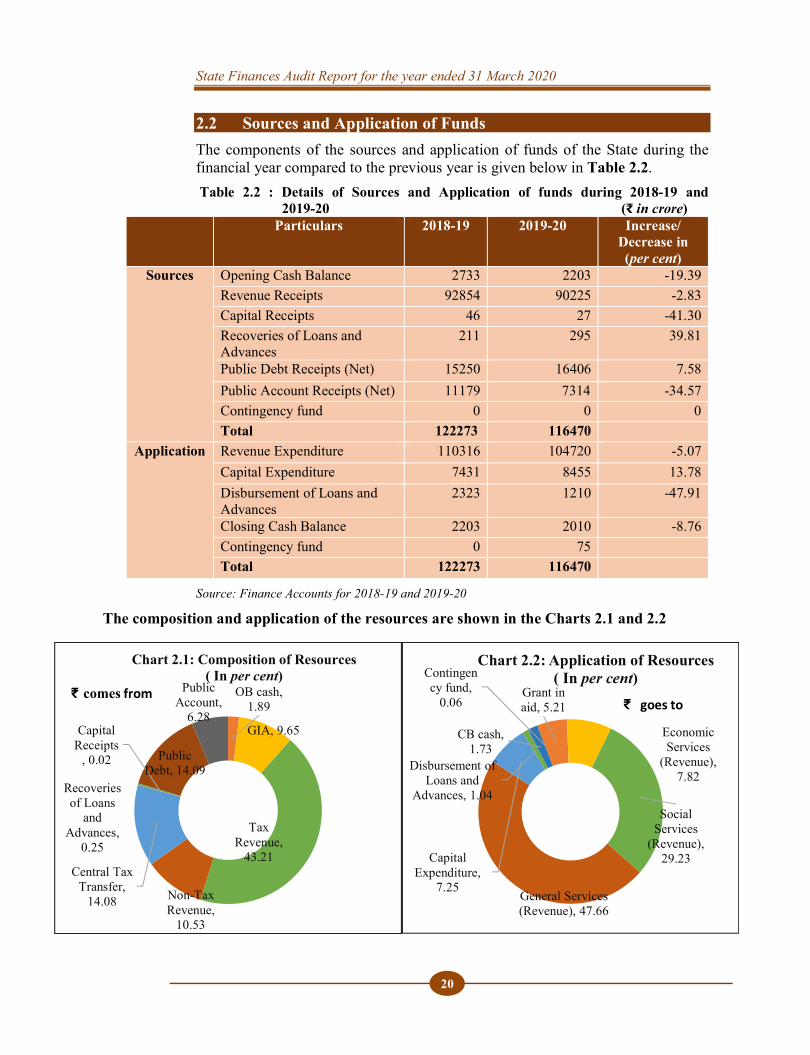
2.2 Sources and Application of Funds The components of the sources and application of funds of the State during the financial year compared to the previous year is given below in Table 2.2. Table 2.2 : Details of Sources and Application of funds during 2018-19 and 2019-20 (₹ in crore)
Particulars 2018-19 2019-20 Increase/ Decrease in (per cent)
Sources Opening Cash Balance 2733 2203 -19.39 Revenue Receipts 92854 90225 -2.83 Capital Receipts 46 27 -41.30 Recoveries of Loans and Advances
211 295 39.81
Public Debt Receipts (Net) 15250 16406 7.58 Public Account Receipts (Net) 11179 7314 -34.57 Contingency fund 0 0 0 Total 122273 116470
Application Revenue Expenditure 110316 104720 -5.07 Capital Expenditure 7431 8455 13.78 Disbursement of Loans and Advances
2323 1210 -47.91
Closing Cash Balance 2203 2010 -8.76 Contingency fund 0 75 Total 122273 116470
Source: Finance Accounts for 2018-19 and 2019-20
The composition and application of the resources are shown in the Charts 2.1 and 2.2
OB cash, 1.89
GIA, 9.65
Tax Revenue,
43.21
Non-Tax Revenue,
10.53
Central Tax Transfer,
14.08
Recoveries of Loans
and Advances,
0.25
Capital Receipts
, 0.02 Public Debt, 14.09
Public Account,
6.28
Chart 2.1: Composition of Resources ( In per cent)
₹ comes from Grant in aid, 5.21
Economic Services
(Revenue), 7.82
Social Services
(Revenue), 29.23
General Services (Revenue), 47.66
Capital Expenditure,
7.25
Disbursement of Loans and
Advances, 1.04
CB cash, 1.73
Contingency fund,
0.06
Chart 2.2: Application of Resources( In per cent)
₹ goes to
Chapter II – Finances of the State
21
2.3 Resources of the State The resources of the State are described below:
1. Revenue receipts consist of tax revenue, non-tax revenue, State’s share of Union taxes and duties and grants-in-aid from the Government of India (GoI).
2. Capital receipts comprise miscellaneous capital receipts such as proceeds from disinvestments, recoveries of loans and advances, debt receipts from internal sources (market loans, borrowings from financial institutions/commercial banks) and loans and advances from GoI. Both revenue and capital receipts form part of the Consolidated Fund of the State.
3. Net Public Accounts receipts: There are receipts and disbursements in respect of certain transactions such as small savings, provident fund, reserve funds, deposits, suspense, remittances, etc. which do not form part of the Consolidated Fund. These are kept in the Public Account set up under Article 266 (2) of the Constitution and are not subject to vote by the State Legislature. Here, the Government acts as a banker. The balance after disbursements is the fund available with the Government for use.
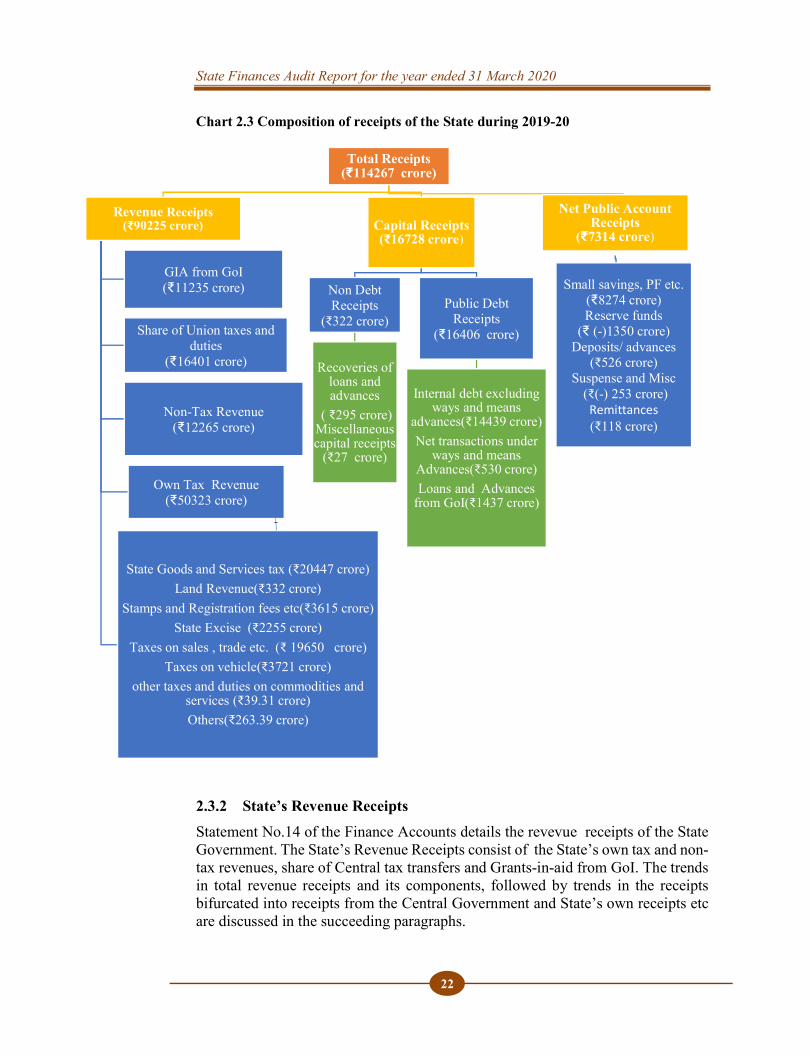
2.3.1 Receipts of the State The composition of the overall receipts of the Government is given in Chart 2.3 below. Besides, the Capital and Revenue Receipts, funds available in the Public Account (net of disbursement made from it) are also utilised by the Government to finance its deficit.
State Finances Audit Report for the year ended 31 March 2020
22
Chart 2.3 Composition of receipts of the State during 2019-20
2.3.2 State’s Revenue Receipts Statement No.14 of the Finance Accounts details the revevue receipts of the State Government. The State’s Revenue Receipts consist of the State’s own tax and non-tax revenues, share of Central tax transfers and Grants-in-aid from GoI. The trends in total revenue receipts and its components, followed by trends in the receipts bifurcated into receipts from the Central Government and State’s own receipts etc are discussed in the succeeding paragraphs.
Total Receipts (₹114267 crore)
Net Public Account Receipts
(₹7314 crore)
Small savings, PF etc. (₹8274 crore)Reserve funds
(₹ (-)1350 crore)Deposits/ advances
(₹526 crore)Suspense and Misc
(₹(-) 253 crore)Remittances (₹118 crore)
Capital Receipts(₹16728 crore)
Public Debt Receipts
(₹16406 crore)
Internal debt excluding ways and means
advances(₹14439 crore)Net transactions under
ways and means Advances(₹530 crore)Loans and Advances
from GoI(₹1437 crore)
Non Debt Receipts
(₹322 crore)
Recoveries of loans and advances
( ₹295 crore) Miscellaneous capital receipts
(₹27 crore)
Revenue Receipts(₹90225 crore)
GIA from GoI(₹11235 crore)
Share of Union taxes and duties
(₹16401 crore)
Non-Tax Revenue(₹12265 crore)
Own Tax Revenue (₹50323 crore)
State Goods and Services tax (₹20447 crore)Land Revenue(₹332 crore)
Stamps and Registration fees etc(₹3615 crore)State Excise (₹2255 crore)
Taxes on sales , trade etc. (₹ 19650 crore)Taxes on vehicle(₹3721 crore)
other taxes and duties on commodities and services (₹39.31 crore)Others(₹263.39 crore)
Chapter II – Finances of the State
23
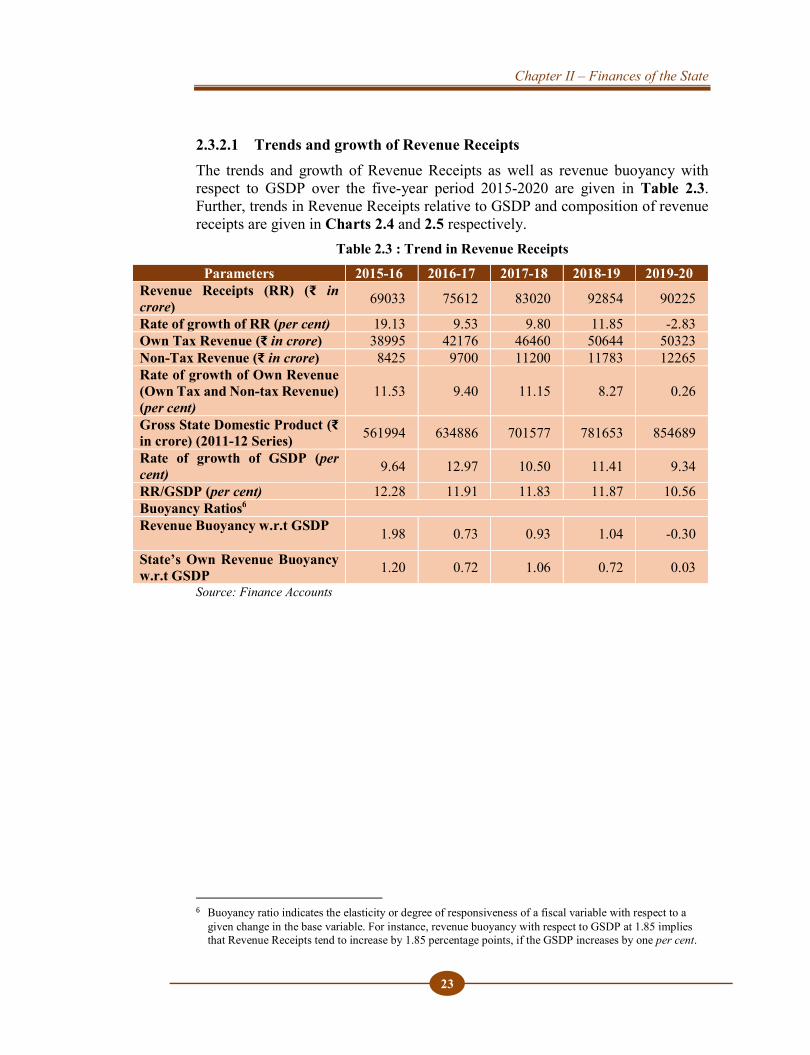
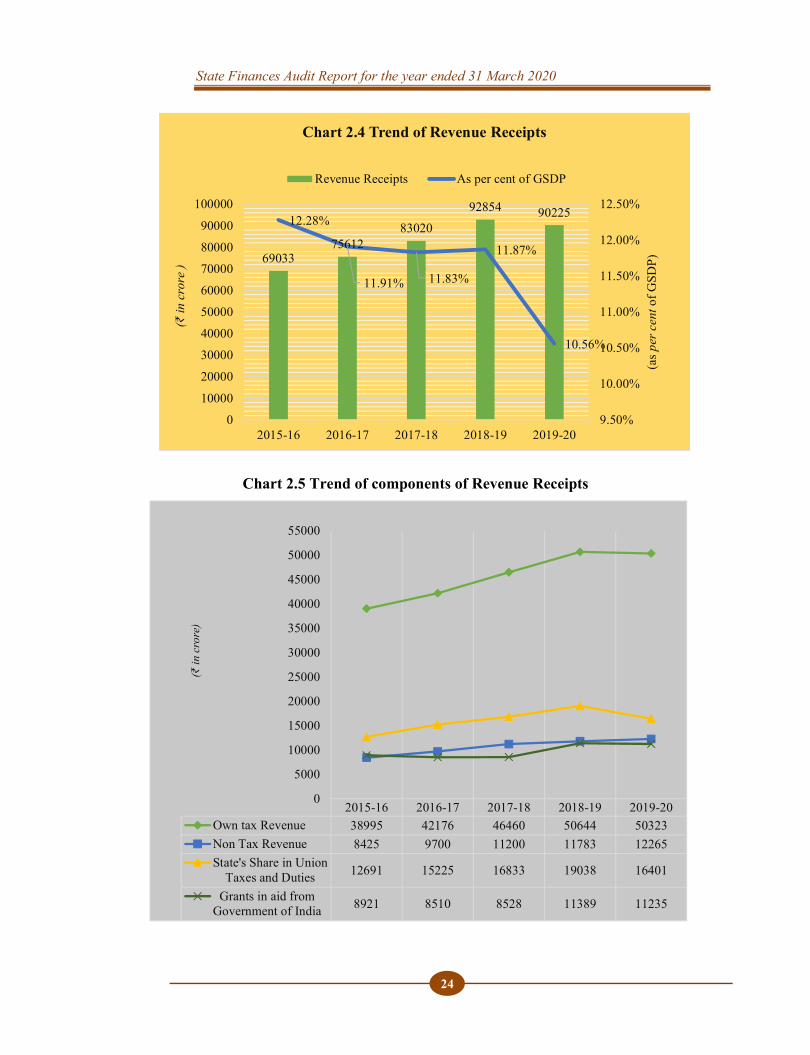
2.3.2.1 Trends and growth of Revenue Receipts The trends and growth of Revenue Receipts as well as revenue buoyancy with respect to GSDP over the five-year period 2015-2020 are given in Table 2.3. Further, trends in Revenue Receipts relative to GSDP and composition of revenue receipts are given in Charts 2.4 and 2.5 respectively.
Table 2.3 : Trend in Revenue Receipts
Parameters 2015-16 2016-17 2017-18 2018-19 2019-20 Revenue Receipts (RR) (₹ in crore) 69033 75612 83020 92854 90225
Rate of growth of RR (per cent) 19.13 9.53 9.80 11.85 -2.83 Own Tax Revenue (₹ in crore) 38995 42176 46460 50644 50323 Non-Tax Revenue (₹ in crore) 8425 9700 11200 11783 12265 Rate of growth of Own Revenue (Own Tax and Non-tax Revenue) (per cent)
11.53
9.40
11.15
8.27
0.26
Gross State Domestic Product (₹ in crore) (2011-12 Series) 561994 634886 701577 781653 854689
Rate of growth of GSDP (per cent) 9.64 12.97 10.50 11.41 9.34
RR/GSDP (per cent) 12.28 11.91 11.83 11.87 10.56 Buoyancy Ratios6 Revenue Buoyancy w.r.t GSDP 1.98 0.73 0.93 1.04 -0.30
State’s Own Revenue Buoyancy w.r.t GSDP 1.20 0.72 1.06 0.72 0.03
Source: Finance Accounts
6 Buoyancy ratio indicates the elasticity or degree of responsiveness of a fiscal variable with respect to a
given change in the base variable. For instance, revenue buoyancy with respect to GSDP at 1.85 implies that Revenue Receipts tend to increase by 1.85 percentage points, if the GSDP increases by one per cent.
State Finances Audit Report for the year ended 31 March 2020
24
Chart 2.5 Trend of components of Revenue Receipts
6903375612
8302092854 9022512.28%
11.91% 11.83%
11.87%
10.56%
9.50%
10.00%
10.50%
11.00%
11.50%
12.00%
12.50%
2015-16 2016-17 2017-18 2018-19 2019-200
10000
20000
30000
40000
50000
60000
70000
80000
90000
100000
(as p
er c
ent o
f GSD
P)
(₹ in
cro
re )
Chart 2.4 Trend of Revenue Receipts
Revenue Receipts As per cent of GSDP
2015-16 2016-17 2017-18 2018-19 2019-20Own tax Revenue 38995 42176 46460 50644 50323Non Tax Revenue 8425 9700 11200 11783 12265State's Share in Union
Taxes and Duties 12691 15225 16833 19038 16401
Grants in aid fromGovernment of India 8921 8510 8528 11389 11235
0
5000
10000
15000
20000
25000
30000
35000
40000
45000
50000
55000
(₹ in
cro
re)
Chapter II – Finances of the State
25
General trends relating to Revenue Receipts of the State are as follows:
The Revenue Receipts of the State decreased by 2.83 per cent from ₹92,854 crore in 2018-19 to ₹90,225 crore in 2019-20. This was mainly due to decrease in share of union taxes and duties assigned to the State by 13.85 per cent (₹2,637 crore) from ₹19,038 crore in 2018-19 to ₹16,401 crore in 2019-2020.
The rate of growth of Revenue Receipts is in negative for the first time in five year period from 2015 to 2020.
State’s own resources contributed to 69 per cent of the Revenue Receipts during 2019-20, while Union Taxes and Grant-in- Aid together contributed 31 per cent. However the rate of growth of Own Revenue of the State during the year showed a meagre growth of 0.26 per cent and is the lowest in the five year period from 2015-16 to 2019-20.
The Buoyancy of Revenue receipts with GSDP decreased during 2019-20 compared to the previous year and was recorded at -0.30 per cent, indicating less than optimum growth in revenue receipts when compared to the growth in GSDP.
Buoyancy of own tax revenue with GSDP was less than one (0.03 per cent) during the year indicating low growth rate of own tax revenue when compared to the growth in GSDP.
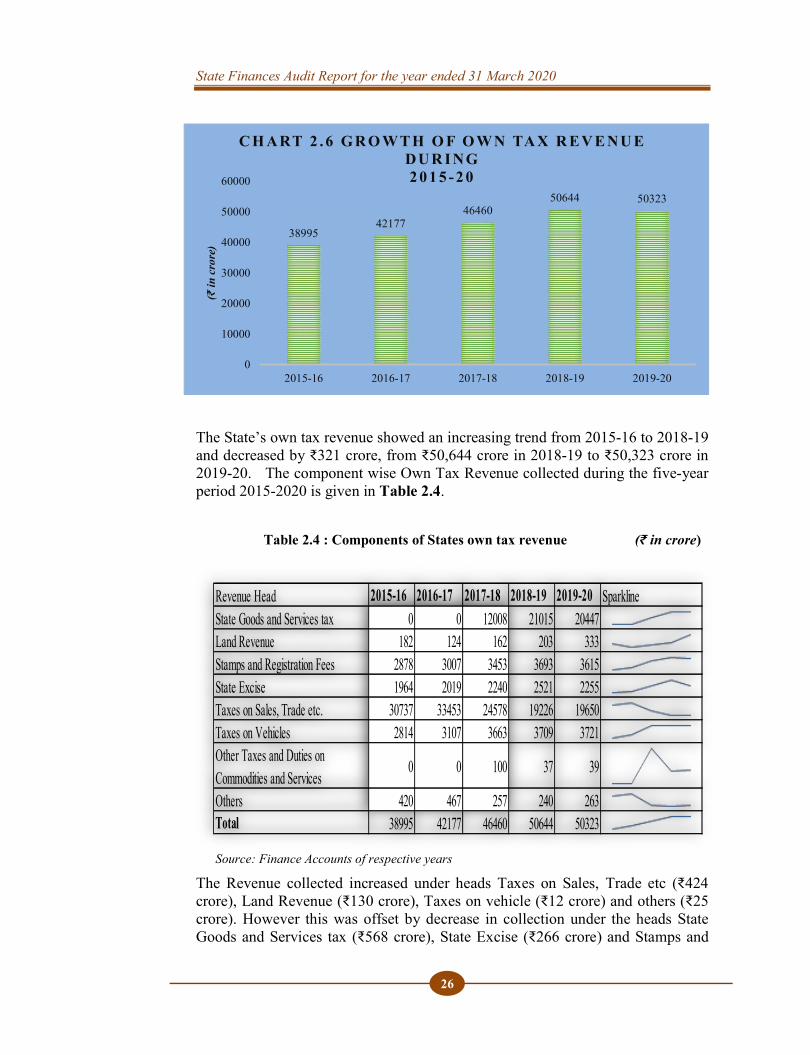
2.3.2.2 State’s Own Resources State’s share in Central taxes is determined on the basis of recommendations of the Finance Commission. Grants-in-aid from Central Government are determined by the quantum of collection of Central tax receipts and anticipated Central assistance for schemes. State’s performance in mobilisation of additional resources should be assessed in terms of its own resources comprising revenue from its own tax and non-tax sources. Own Tax Revenue Own tax revenue of the State consist of State GST, State Excise, Taxes on Vehicles, Stamp duty and Registration fees, Land Revenue, Taxes on Goods and Passengers etc. The details of Own Tax Revenue of the State during the five-year period 2015-20 is given in Chart 2.6 below.
State Finances Audit Report for the year ended 31 March 2020
26
The State’s own tax revenue showed an increasing trend from 2015-16 to 2018-19 and decreased by ₹321 crore, from ₹50,644 crore in 2018-19 to ₹50,323 crore in 2019-20. The component wise Own Tax Revenue collected during the five-year period 2015-2020 is given in Table 2.4.
Table 2.4 : Components of States own tax revenue (₹ in crore)
Source: Finance Accounts of respective years The Revenue collected increased under heads Taxes on Sales, Trade etc (₹424 crore), Land Revenue (₹130 crore), Taxes on vehicle (₹12 crore) and others (₹25 crore). However this was offset by decrease in collection under the heads State Goods and Services tax (₹568 crore), State Excise (₹266 crore) and Stamps and
Revenue Head 2015-16 2016-17 2017-18 2018-19 2019-20 SparklineState Goods and Services tax 0 0 12008 21015 20447Land Revenue 182 124 162 203 333Stamps and Registration Fees 2878 3007 3453 3693 3615State Excise 1964 2019 2240 2521 2255Taxes on Sales, Trade etc. 30737 33453 24578 19226 19650Taxes on Vehicles 2814 3107 3663 3709 3721Other Taxes and Duties on Commodities and Services
0 0 100 37 39
Others 420 467 257 240 263Total 38995 42177 46460 50644 50323
3899542177
4646050644 50323
0
10000
20000
30000
40000
50000
60000
2015-16 2016-17 2017-18 2018-19 2019-20
(₹ in
cro
re)
C H ART 2 . 6 GR O W TH O F O W N TA X R EV E N U E DU R I NG 2 0 1 5 - 2 0
Chapter II – Finances of the State
27
Registration Fees (₹78 crore). The tax collection of four major revenue sources of the State compared all India average, during the last five years, is given in Appendix 2.1. State Goods and Service Tax (SGST) Kerala implemented GST with effect from 01 July 2017. GST is levied on intra-State supply of goods or services (except alcohol for human consumption and five specified petroleum products7) and its components are shared by the Centre (CGST) and the State (SGST). Further, IGST is levied and collected by the Central Government on inter-State supply of goods and services. The IGST so collected is apportioned between the Centre and the concerned State where the goods and services are consumed.
The GoI enacted the Goods and Services Tax (Compensation to States) Act, 2017 to compensate the States on account of loss of revenue which may arise due to implementation of the GST for a period of five years. The compensation was to be given by considering the base figure of revenue of a State for the year 2015-16, escalated by 14 per cent per annum for the next five years commencing from 01 July 2017.
For the State of Kerala, the base year (2015-16) revenue to be subsumed by the GST regime was fixed by GoI at ₹16,821.37 crore. Thus, the projected revenue for Kerala worked out to ₹28,410.62 crore for the period 2019-20.
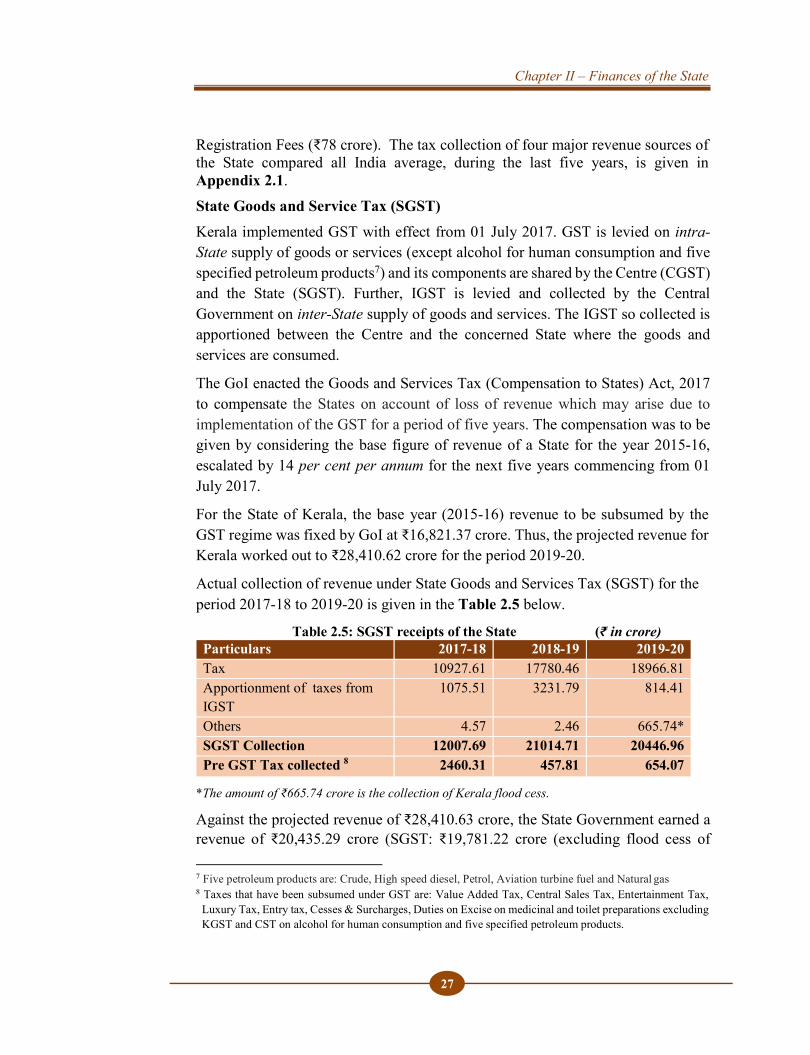
Actual collection of revenue under State Goods and Services Tax (SGST) for the period 2017-18 to 2019-20 is given in the Table 2.5 below.
Table 2.5: SGST receipts of the State (₹ in crore) Particulars 2017-18 2018-19 2019-20 Tax 10927.61 17780.46 18966.81 Apportionment of taxes from IGST
1075.51 3231.79 814.41
Others 4.57 2.46 665.74* SGST Collection 12007.69 21014.71 20446.96 Pre GST Tax collected 8 2460.31 457.81 654.07
*The amount of ₹665.74 crore is the collection of Kerala flood cess.
Against the projected revenue of ₹28,410.63 crore, the State Government earned a revenue of ₹20,435.29 crore (SGST: ₹19,781.22 crore (excluding flood cess of 7 Five petroleum products are: Crude, High speed diesel, Petrol, Aviation turbine fuel and Natural gas
8 Taxes that have been subsumed under GST are: Value Added Tax, Central Sales Tax, Entertainment Tax, Luxury Tax, Entry tax, Cesses & Surcharges, Duties on Excise on medicinal and toilet preparations excluding KGST and CST on alcohol for human consumption and five specified petroleum products.
State Finances Audit Report for the year ended 31 March 2020
28
₹665.74 crore) plus subsumed Pre GST Tax: ₹654.07crore) during 2019-20 and therefore, entitled to a compensation of ₹7,975.34 crore.
The State Government received ₹5,575.04 crore as compensation till March 2020. Thus the total revenue under GST during the year was ₹26,010.33 crore (excluding flood cess ₹665.74 crore), which worked out to a growth of 4.37 per cent as against the projected growth of 14 per cent, requiring higher amount of compensation from the Government of India.
Besides the State received ₹4,654.19 crore as its share of net proceeds assigned to the State under Central Goods and Services Tax and no amount was received towards Integrated Goods and Services Tax. Analysis of arrears of revenue The arrears of revenue as on 31 March 2020 on some principal heads of revenue amounted to ₹3,584.87 crore of which ₹562.88 crore was outstanding for more than five years, as detailed in Appendix 2.2. Information called for from Forest, Labour, Port, SGST, Stationery, Transport and Land Revenue Departments were not furnished. Non-reporting untimely reporting of arrears to the Revenue Department, improper follow up by the departments in realising the arrears were the main reason for outstanding arrears of revenue.
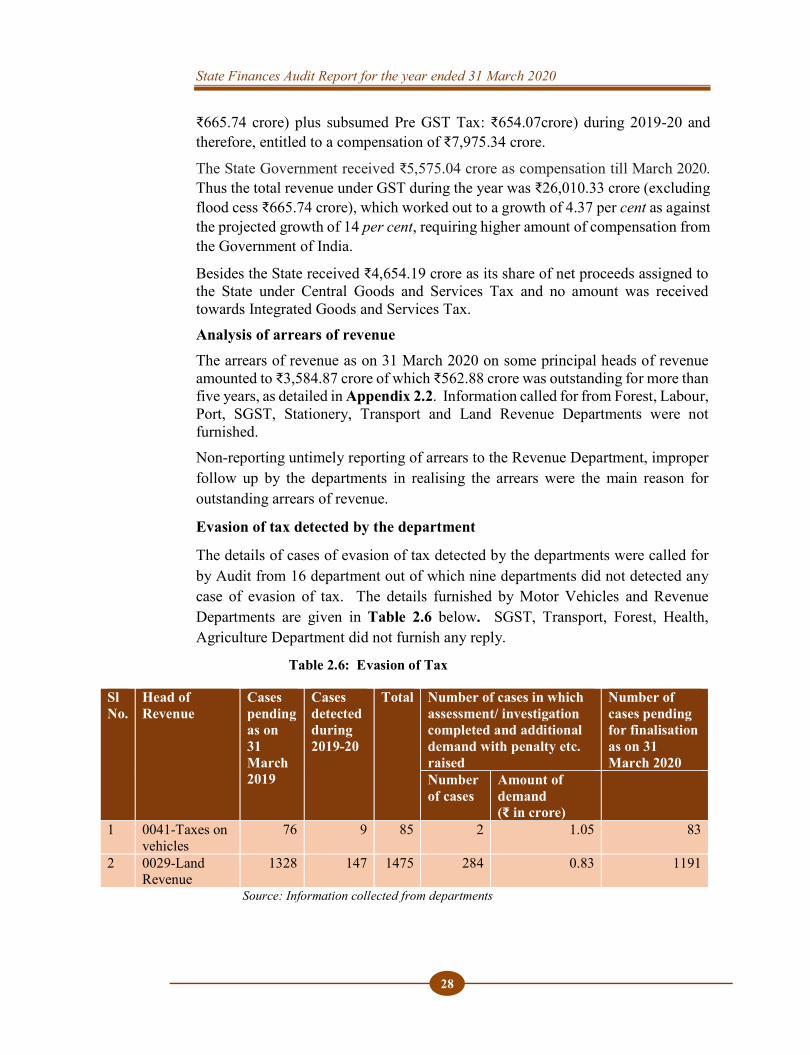
Evasion of tax detected by the department
The details of cases of evasion of tax detected by the departments were called for by Audit from 16 department out of which nine departments did not detected any case of evasion of tax. The details furnished by Motor Vehicles and Revenue Departments are given in Table 2.6 below. SGST, Transport, Forest, Health, Agriculture Department did not furnish any reply.
Table 2.6: Evasion of Tax
Sl No.
Head of Revenue
Cases pending as on 31 March 2019
Cases detected during 2019-20
Total Number of cases in which assessment/ investigation completed and additional demand with penalty etc. raised
Number of cases pending for finalisation as on 31 March 2020
Number of cases
Amount of demand (₹ in crore)
1 0041-Taxes on vehicles
76 9 85 2 1.05 83
2 0029-Land Revenue
1328 147 1475 284 0.83 1191
Source: Information collected from departments
Chapter II – Finances of the State
29
Non Tax Revenue Non-Tax revenue consists of interest receipts, dividends and profits, mining receipts, departmental receipts, etc. Table 2.7: Components of non-tax revenue (₹ in crore)
Source: Finance Accounts of respective years
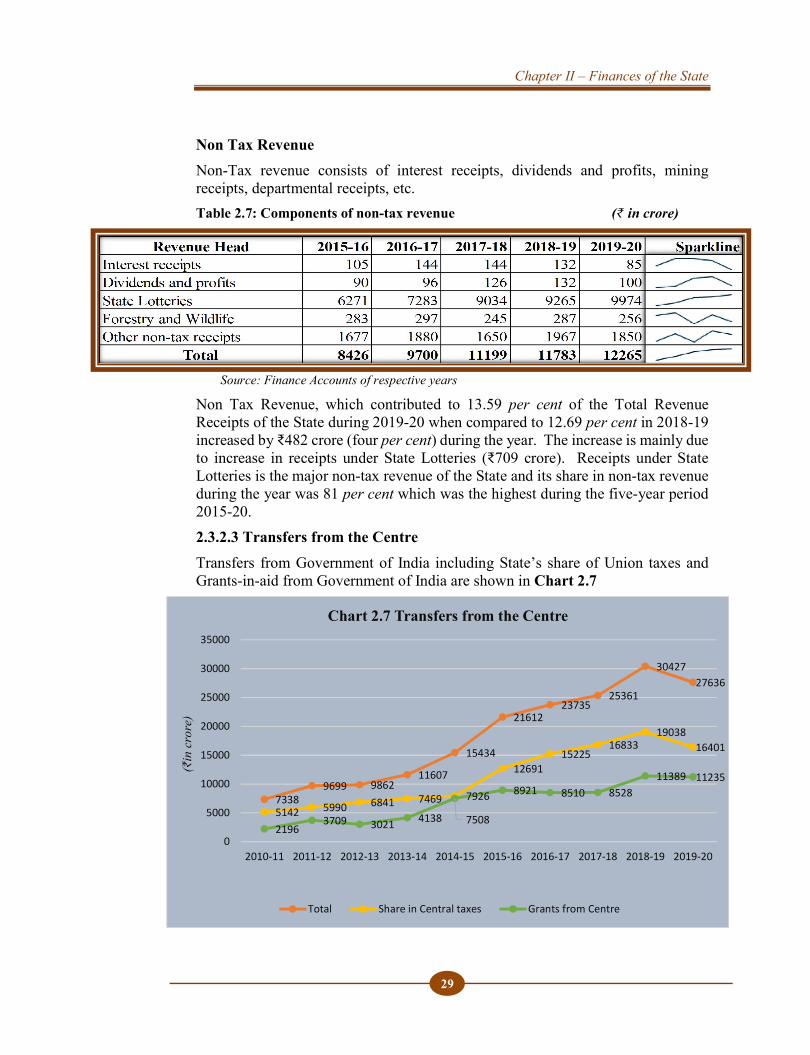
Non Tax Revenue, which contributed to 13.59 per cent of the Total Revenue Receipts of the State during 2019-20 when compared to 12.69 per cent in 2018-19 increased by ₹482 crore (four per cent) during the year. The increase is mainly due to increase in receipts under State Lotteries (₹709 crore). Receipts under State Lotteries is the major non-tax revenue of the State and its share in non-tax revenue during the year was 81 per cent which was the highest during the five-year period 2015-20. 2.3.2.3 Transfers from the Centre Transfers from Government of India including State’s share of Union taxes and Grants-in-aid from Government of India are shown in Chart 2.7
Revenue Head 2015-16 2016-17 2017-18 2018-19 2019-20 SparklineInterest receipts 105 144 144 132 85Dividends and profits 90 96 126 132 100State Lotteries 6271 7283 9034 9265 9974Forestry and Wildlife 283 297 245 287 256Other non-tax receipts 1677 1880 1650 1967 1850
Total 8426 9700 11199 11783 12265
73389699 9862
11607
15434
2161223735
25361
3042727636
5142 5990 6841 7469 7926
1269115225
1683319038
16401
21963709 3021 4138 7508
8921 8510 852811389 11235
0
5000
10000
15000
20000
25000
30000
35000
2010-11 2011-12 2012-13 2013-14 2014-15 2015-16 2016-17 2017-18 2018-19 2019-20
(₹in
cro
re)
Chart 2.7 Transfers from the Centre
Total Share in Central taxes Grants from Centre
State Finances Audit Report for the year ended 31 March 2020
30
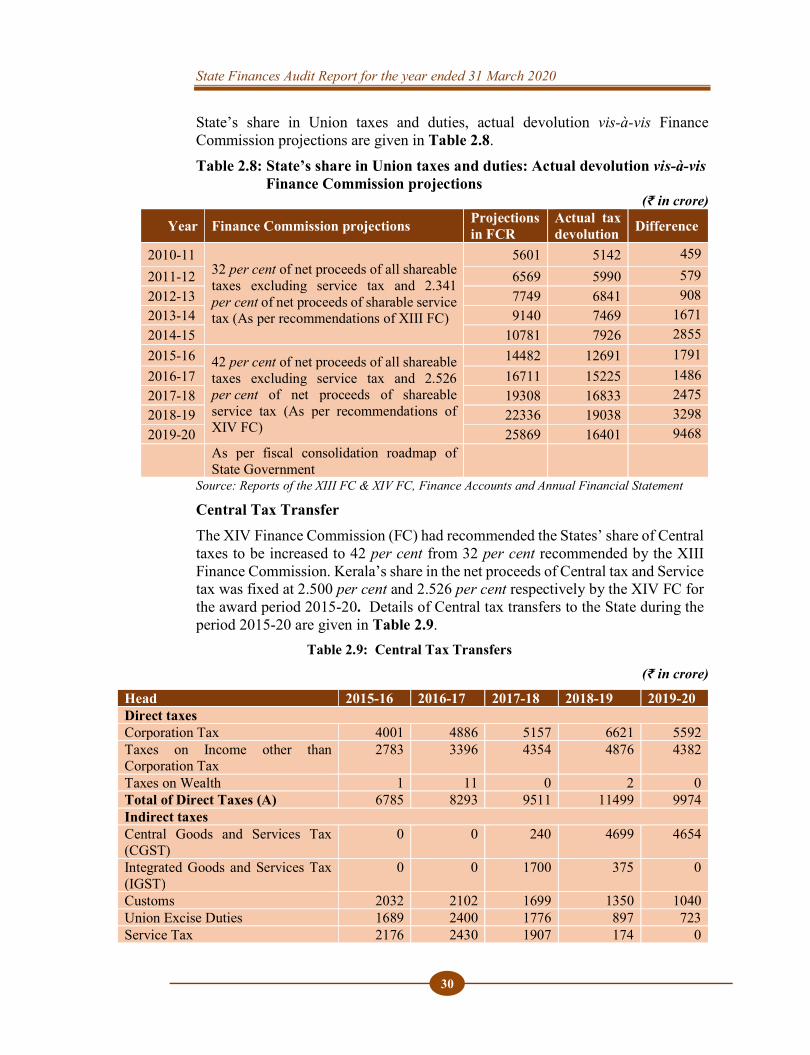
State’s share in Union taxes and duties, actual devolution vis-à-vis Finance Commission projections are given in Table 2.8. Table 2.8: State’s share in Union taxes and duties: Actual devolution vis-à-vis Finance Commission projections
(₹ in crore)
Source: Reports of the XIII FC & XIV FC, Finance Accounts and Annual Financial Statement
Central Tax Transfer The XIV Finance Commission (FC) had recommended the States’ share of Central taxes to be increased to 42 per cent from 32 per cent recommended by the XIII Finance Commission. Kerala’s share in the net proceeds of Central tax and Service tax was fixed at 2.500 per cent and 2.526 per cent respectively by the XIV FC for the award period 2015-20. Details of Central tax transfers to the State during the period 2015-20 are given in Table 2.9.
Table 2.9: Central Tax Transfers
(₹ in crore)
Head 2015-16 2016-17 2017-18 2018-19 2019-20 Direct taxes Corporation Tax 4001 4886 5157 6621 5592 Taxes on Income other than Corporation Tax
2783 3396 4354 4876 4382
Taxes on Wealth 1 11 0 2 0 Total of Direct Taxes (A) 6785 8293 9511 11499 9974 Indirect taxes Central Goods and Services Tax (CGST)
0 0 240 4699 4654
Integrated Goods and Services Tax (IGST)
0 0 1700 375 0
Customs 2032 2102 1699 1350 1040 Union Excise Duties 1689 2400 1776 897 723 Service Tax 2176 2430 1907 174 0
Year Finance Commission projections Projections in FCR
Actual tax devolution Difference
2010-11 32 per cent of net proceeds of all shareable taxes excluding service tax and 2.341 per cent of net proceeds of sharable service tax (As per recommendations of XIII FC)
5601 5142 459 2011-12 6569 5990 579 2012-13 7749 6841 908 2013-14 9140 7469 1671 2014-15 10781 7926 2855 2015-16 42 per cent of net proceeds of all shareable
taxes excluding service tax and 2.526 per cent of net proceeds of shareable service tax (As per recommendations of XIV FC)
14482 12691 1791 2016-17 16711 15225 1486 2017-18 19308 16833 2475 2018-19 22336 19038 3298 2019-20 25869 16401 9468
As per fiscal consolidation roadmap of State Government
Chapter II – Finances of the State
31
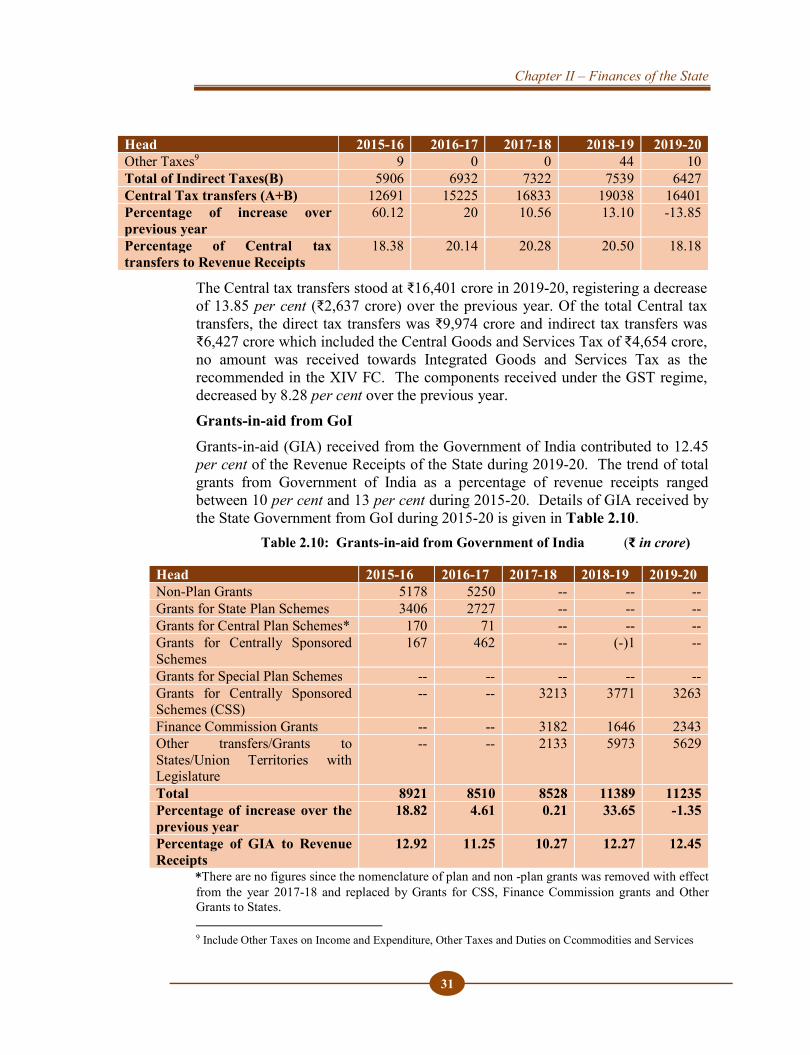
Head 2015-16 2016-17 2017-18 2018-19 2019-20 Other Taxes9 9 0 0 44 10 Total of Indirect Taxes(B) 5906 6932 7322 7539 6427 Central Tax transfers (A+B) 12691 15225 16833 19038 16401 Percentage of increase over previous year
60.12 20 10.56 13.10 -13.85
Percentage of Central tax transfers to Revenue Receipts
18.38 20.14 20.28 20.50 18.18
The Central tax transfers stood at ₹16,401 crore in 2019-20, registering a decrease of 13.85 per cent (₹2,637 crore) over the previous year. Of the total Central tax transfers, the direct tax transfers was ₹9,974 crore and indirect tax transfers was ₹6,427 crore which included the Central Goods and Services Tax of ₹4,654 crore, no amount was received towards Integrated Goods and Services Tax as the recommended in the XIV FC. The components received under the GST regime, decreased by 8.28 per cent over the previous year. Grants-in-aid from GoI Grants-in-aid (GIA) received from the Government of India contributed to 12.45 per cent of the Revenue Receipts of the State during 2019-20. The trend of total grants from Government of India as a percentage of revenue receipts ranged between 10 per cent and 13 per cent during 2015-20. Details of GIA received by the State Government from GoI during 2015-20 is given in Table 2.10.
Table 2.10: Grants-in-aid from Government of India (₹ in crore)
*There are no figures since the nomenclature of plan and non -plan grants was removed with effect from the year 2017-18 and replaced by Grants for CSS, Finance Commission grants and Other Grants to States. 9 Include Other Taxes on Income and Expenditure, Other Taxes and Duties on Ccommodities and Services
Head 2015-16 2016-17 2017-18 2018-19 2019-20 Non-Plan Grants 5178 5250 -- -- -- Grants for State Plan Schemes 3406 2727 -- -- -- Grants for Central Plan Schemes* 170 71 -- -- -- Grants for Centrally Sponsored Schemes
167 462 -- (-)1 --
Grants for Special Plan Schemes -- -- -- -- -- Grants for Centrally Sponsored Schemes (CSS)
-- -- 3213 3771 3263
Finance Commission Grants -- -- 3182 1646 2343 Other transfers/Grants to States/Union Territories with Legislature
-- -- 2133 5973 5629
Total 8921 8510 8528 11389 11235 Percentage of increase over the previous year
18.82 4.61 0.21 33.65 -1.35
Percentage of GIA to Revenue Receipts
12.92 11.25 10.27 12.27 12.45
State Finances Audit Report for the year ended 31 March 2020
32
During the year 2019-20, Finance Commission grants increased by ₹697 crore and the grants under Centrally Sponsored Scheme and Other transfers decreased by ₹507 crore and ₹344 crore respectively. The increase in the Finance commission grants was offset by the decrease in the other grants and hence the Central assistance received during the year 2019-2020 in the form of Grant in aid decreased by ₹154 core when compared to the previous year.
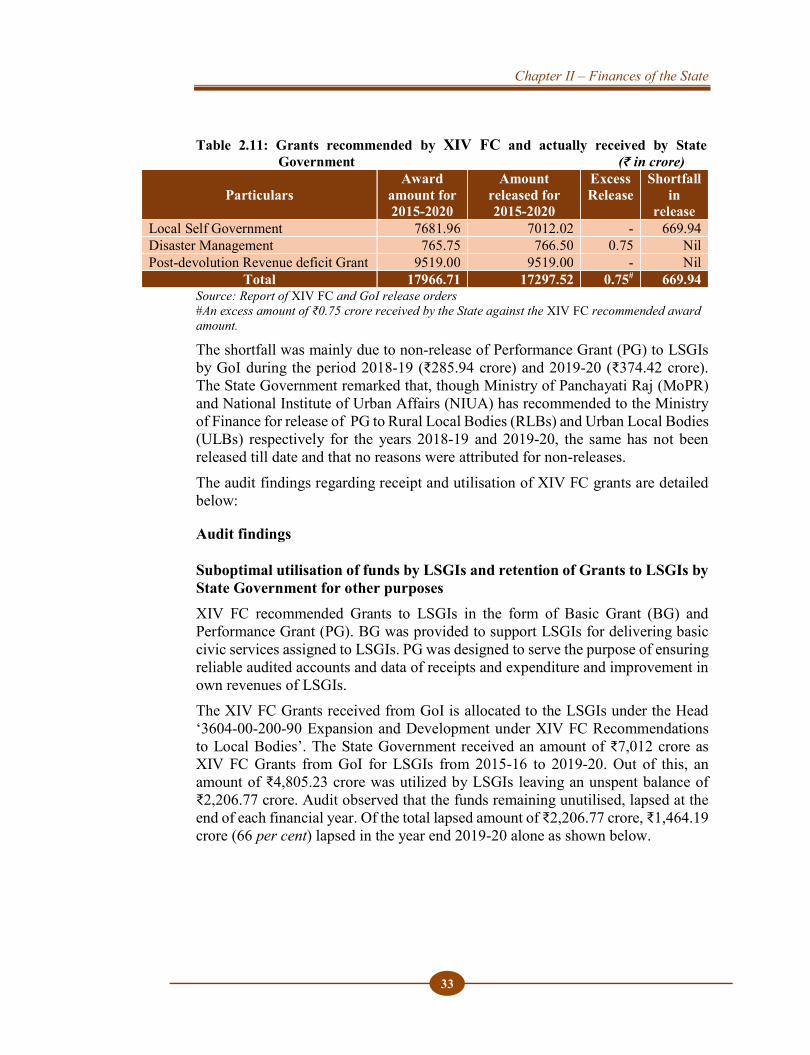
2.3.2.4 XIV Finance Commission Grants Receipt and utilisation of XIV Finance Commission Grants during the award period (2015-2020) The XIV Finance Commission (hereinafter referred in this report as XIV FC) was constituted by the President of India under Article 280 of the Constitution of India to make recommendations on, i) the distribution of net proceeds of taxes between the Union and the States, ii) the Principles which should govern the Grants-in-aid of the revenues of the States and iii) the measures needed to augment the Consolidated Fund of the State to supplement the resources of Local Self Government Institutions (LSGIs). The XIV FC had recommended Grants-in-aid amounting to ₹17,966.71 crore for three purposes viz., Local Bodies, Disaster Management and Post-devolution Revenue Deficit during the award period 2015-2020. A study was conducted to examine the receipt and utilisation of XIV FC Grants for the award period 2015-16 to 2019-20 and to ascertain whether:
The stipulated Grants have been released by Government of India (GoI). The Grants received have been utilised in full and for the intended purposes.
Audit test checked relevant records in Government Secretariat, Directorate of Panchayats, Directorate of Urban Affairs, District Collectorate Thiruvananthapuram, O/o Chief Engineer, Irrigation and Administration, Directorate of Animal Husbandry during the course of audit. With a view to assess whether the LSGI Grants was utilised for the intended purpose, five LSGIs10 comprising one Corporation, two Municipalities and two Grama Panchayats (GP), on the basis of maximum XIV FC Grants received during the award period, were selected from Thiruvananthapuram and Kollam districts for detailed study. Audit methodology included scrutiny of basic records, registers, files, e-files, issue of audit enquiries, etc. Grants recommended by XIV FC and funds received by State Government are shown in Table 2.11.
10 Thiruvanathapuram Municipal Corporation, Kollam Municipal Corporation, Neyyattinkara Municipality,
Nedumangad Municipality, Karunagappally Municipality, Punalur Municipality, Parassala Grama Panchayat(GP), Peringamala GP, Kulathupuzha GP, Chithara GP.
Chapter II – Finances of the State
33
Table 2.11: Grants recommended by XIV FC and actually received by State Government (₹ in crore)
Particulars Award
amount for 2015-2020
Amount released for 2015-2020
Excess Release
Shortfall in
release Local Self Government 7681.96 7012.02 - 669.94 Disaster Management 765.75 766.50 0.75 Nil Post-devolution Revenue deficit Grant 9519.00 9519.00 - Nil
Total 17966.71 17297.52 0.75# 669.94 Source: Report of XIV FC and GoI release orders #An excess amount of ₹0.75 crore received by the State against the XIV FC recommended award amount.
The shortfall was mainly due to non-release of Performance Grant (PG) to LSGIs by GoI during the period 2018-19 (₹285.94 crore) and 2019-20 (₹374.42 crore). The State Government remarked that, though Ministry of Panchayati Raj (MoPR) and National Institute of Urban Affairs (NIUA) has recommended to the Ministry of Finance for release of PG to Rural Local Bodies (RLBs) and Urban Local Bodies (ULBs) respectively for the years 2018-19 and 2019-20, the same has not been released till date and that no reasons were attributed for non-releases. The audit findings regarding receipt and utilisation of XIV FC grants are detailed below:
Audit findings
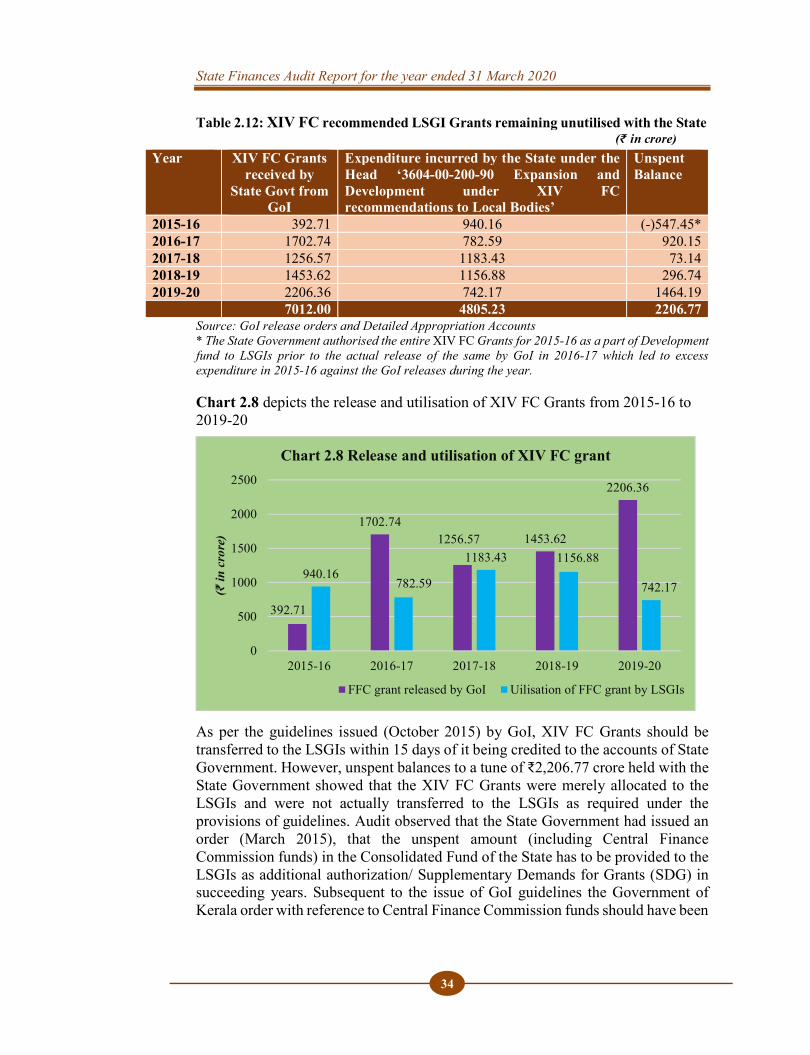
Suboptimal utilisation of funds by LSGIs and retention of Grants to LSGIs by State Government for other purposes XIV FC recommended Grants to LSGIs in the form of Basic Grant (BG) and Performance Grant (PG). BG was provided to support LSGIs for delivering basic civic services assigned to LSGIs. PG was designed to serve the purpose of ensuring reliable audited accounts and data of receipts and expenditure and improvement in own revenues of LSGIs. The XIV FC Grants received from GoI is allocated to the LSGIs under the Head ‘3604-00-200-90 Expansion and Development under XIV FC Recommendations to Local Bodies’. The State Government received an amount of ₹7,012 crore as XIV FC Grants from GoI for LSGIs from 2015-16 to 2019-20. Out of this, an amount of ₹4,805.23 crore was utilized by LSGIs leaving an unspent balance of ₹2,206.77 crore. Audit observed that the funds remaining unutilised, lapsed at the end of each financial year. Of the total lapsed amount of ₹2,206.77 crore, ₹1,464.19 crore (66 per cent) lapsed in the year end 2019-20 alone as shown below.
State Finances Audit Report for the year ended 31 March 2020
34
Table 2.12: XIV FC recommended LSGI Grants remaining unutilised with the State (₹ in crore)
Source: GoI release orders and Detailed Appropriation Accounts * The State Government authorised the entire XIV FC Grants for 2015-16 as a part of Development fund to LSGIs prior to the actual release of the same by GoI in 2016-17 which led to excess expenditure in 2015-16 against the GoI releases during the year.
Chart 2.8 depicts the release and utilisation of XIV FC Grants from 2015-16 to 2019-20
As per the guidelines issued (October 2015) by GoI, XIV FC Grants should be transferred to the LSGIs within 15 days of it being credited to the accounts of State Government. However, unspent balances to a tune of ₹2,206.77 crore held with the State Government showed that the XIV FC Grants were merely allocated to the LSGIs and were not actually transferred to the LSGIs as required under the provisions of guidelines. Audit observed that the State Government had issued an order (March 2015), that the unspent amount (including Central Finance Commission funds) in the Consolidated Fund of the State has to be provided to the LSGIs as additional authorization/ Supplementary Demands for Grants (SDG) in succeeding years. Subsequent to the issue of GoI guidelines the Government of Kerala order with reference to Central Finance Commission funds should have been
392.71
1702.741256.57 1453.62
2206.36
940.16782.59
1183.43 1156.88
742.17
0
500
1000
1500
2000
2500
2015-16 2016-17 2017-18 2018-19 2019-20
(₹ in
cro
re)
Chart 2.8 Release and utilisation of XIV FC grant
FFC grant released by GoI Uilisation of FFC grant by LSGIs
Year XIV FC Grants received by
State Govt from GoI
Expenditure incurred by the State under the Head ‘3604-00-200-90 Expansion and Development under XIV FC recommendations to Local Bodies’
Unspent Balance
2015-16 392.71 940.16 (-)547.45* 2016-17 1702.74 782.59 920.15 2017-18 1256.57 1183.43 73.14 2018-19 1453.62 1156.88 296.74 2019-20 2206.36 742.17 1464.19 7012.00 4805.23 2206.77
Chapter II – Finances of the State
35
withdrawn. The practice of informing GoI that the XIV FC funds has been released to LSGIs though it has not been actually transferred, needs to be reviewed. The State Government replied (October 2020) that the unspent balances of XIV FC Grants were not reauthorized under SDG as the LSGIs failed to utilise even the budget provision of the respective years. The reply is not tenable as retention of GoI Grants by State Government is highly irregular and will defeat the purpose and intent of Local Bodies Grants as envisaged by XIV FC. In response to the audit query on poor utilisation of XIV FC Grants by LSGIs, the test checked LSGIs replied that the funds allocated to them were subject to restrictions/ regulations on treasury transactions imposed by the State Government which barred them from using the XIV FC Grants completely within the financial year even though the bills were submitted to treasury in time. In 2019-20, 16,947 bills relating to XIV FC Grants, amounting to ₹624.08 crore which were submitted in treasury by LSGIs of Kerala between November 2019 to March 2020, were not passed. LSGIs also stated that the delay in drawing funds from Treasury for payment to contractors for completed projects has adversely affected the ongoing projects undertaken by the same contractors. The regulations on treasury transactions put in force by the State Government as pointed out by the selected LSGIs during 2019-20 are detailed below:
In April 2019, the State Government imposed treasury restrictions on payment above ₹ five lakh and necessitated mandatory ways and mean (WAMS) clearance on such payment. The limit on WAMS clearance was enhanced from ₹ five lakh to ₹ one crore in May 2019.
In June 2019, the State Government decided to clear the bills of various Government department only after getting requisite instructions from the Finance Department.
In October 2019, the limit on WAMS clearance was reduced to ₹10 lakh and any amount above this limit required mandatory W&M clearance from Finance Department.
In February 2020, the State Government decided to clear the bills/ cheques of various departments from treasury only upto ₹50,000/- till further orders.
In March 2020, the State Government issued orders that all bills submitted after 27th of March 2020 would be placed under treasury queue and would be cleared in the succeeding year.
XIV FC Grants received from GoI was intended to timely flow to the LSGIs enabling them to plan and execute the work better. Hence, the restrictions/ regulations imposed on treasury transactions at regular intervals should not have been applied for XIV FC grants for LSGIs. Even though, XIV FC Grants for LSGIs to a tune of ₹2,206.77 crore was retained by the State Government, the cash balance in the treasuries at the end of the year
State Finances Audit Report for the year ended 31 March 2020
36
2019-20 was only ₹36.18 crore. Thus, it is apparent that the unspent balances in the XIV FC Grants were utilised by the State Government for other purposes.
Irregular placing of LSGI bills in treasury queue The Bills submitted at treasuries at the end of March every year were shifted to treasury queue as per the orders (March 2018, March 2019 and March 2020) issued by the State Government every year. The queued bills are intended to be cleared in the subsequent financial year. As per the data furnished by Information Kerala Mission11 (IKM), State Government had kept LSGI Bills related to XIV FC Grants amounting to ₹944.63 crore under the treasury queue during the period 2017-18 to 2019-20 which included ₹624.08 crore (66.07 per cent) in 2019-20 alone. Test check conducted by Audit on 10 LSGIs revealed that the bills submitted in treasury from November 2019 onwards were placed under treasury queue, despite having unspent balances of XIV FC Grants amounting to ₹2,206.77 crore with the State Government. Keeping LSGI Bills under Treasury queue system as early as in November has deprived the LSGIs from timely utilisation of XIV FC Grants. The amount released as XIV FC Grants for LSGI’s should not have been placed under treasury queue, since there was sufficient balance and XIV FC Grant should have been used only for the purpose for which it was given to State Government.
Delayed receipt of XIV FC Grants by LSGIs
The State Government allocates XIV FC Grants to LSGIs by issuing relevant orders within the prescribed time limit of 15 days on receipt of the same from GoI and furnishes Utilisation Certificate (UC) to GoI. However, the actual receipt of XIV FC Grants by the LSGIs materialise only when the bills submitted by the LSGIs are cleared at treasury for payment. Audit scrutiny of records for the period 2017-18 to 2019-20 in 10 test checked LSGIs revealed that the bills submitted at treasury for payment which were kept under treasury queue were passed in the succeeding year using the LSGI funds for that year. It was observed that there was a delay ranging from two to 12 months in passing the bills from the date of submission of the bill in the treasury to the date of passing of the bill therein. These delayed receipts of XIV FC Grants by LSGIs are in contravention to the instructions contained in guidelines issued by GoI which stipulates that the States should release the XIV FC Grants to the LSGIs within 15 days on receipt of the same from GoI.
LSGI (Queue) Bills pertaining to XIV FC period passed from XV FC Grants The LSGI bills which were kept under treasury queue by the State Government were passed in the succeeding year using the LSGI funds for that year. Audit in test checked LSGIs revealed that 1128 queued bills amounting to ₹104.41 crore for the year 2019-20 were passed in the year 2020-21 by debiting the Head of Account 11 Information Kerala Mission (IKM), an autonomous institution under Local Self Government Department, Government of Kerala, setup with a mandate to strengthen the local self-governance through Information and Communication Technological applications.

Chapter II – Finances of the State
37
‘3604-00-200-85-XV Expansion and Development under XV FC Recommendations’. Meeting the expenditure pertaining to XIV FC period from XV FC Grants despite having unspent balances of ₹2,206.77 crore during the XIV FC period is not in order.
Reduction in release of XIV FC recommended Performance Grant to LSGIs The XIV FC recommended that 10 per cent of the allocated amount be released to Rural Local Bodies (RLBs) as Performance Grant (PG) on fulfillment of two eligibility conditions, namely submission of audited accounts relating to the year not earlier than two years preceding the year in which the RLBs seek to claim PG and increase in Own Source Revenue (OSR) over the preceding year as reflected in the audited accounts. After disbursement of PG to the eligible RLBs, the undisbursed amount, if any, should be distributed on equitable basis among all the eligible RLBs. Out of 941 RLBs 827 fulfilled the eligibility conditions recommended by XIV FC and received the eligible share of PG from GoI for the year 2016-17. However, for claiming the PG of 2017-18, only 170 RLBs could fulfill the required eligibility conditions as 771 RLBs failed to increase their own source revenue over the previous year. As per the guidelines, after disbursement of PG to the eligible RLBs, the undisbursed amount was to be distributed on equitable basis among all the eligible RLBs. Ministry of Panchayati Raj (MoPR), GoI in January 2019 imposed an additional condition in which the eligible RLBs are entitled to receive PG up to a maximum of five times the Basic Grant allocated during the year of claim. Consequently, PG of 2017-18 related to 771 ineligible RLBs could not be distributed further to eligible RLBs. As such, the PG claimed by the State for RLBs was limited to ₹79.58 crore as against the award amount of ₹89.16 crore recommended by XIV FC. Thus, the failure of RLBs to increase their own source revenue over the preceding year in audited accounts of 2015-16 for claiming PG for the year 2017-18 curtailed the share of PG due to the State by ₹9.58 crore. The State Government replied that the decline in collection of property tax arrears in 2017-18 as compared to 2016-17 had resulted in drop in the own source revenue. The reply is not tenable since the arrears occurred due to lapse on the part of LSGIs in timely collection of revenue.
Excess expenditure incurred by State due to delay in transfer of Basic Grant to LSGI As per the guidelines issued (October 2015) by GoI, XIV FC Grants should be transferred to the LSGIs within 15 days of it being credited to the account of State Government. Any delay will require the State Government, to release the amount to LSGIs, with interest, at bank rate of RBI, for the number of days of delay from the own funds of State Government.
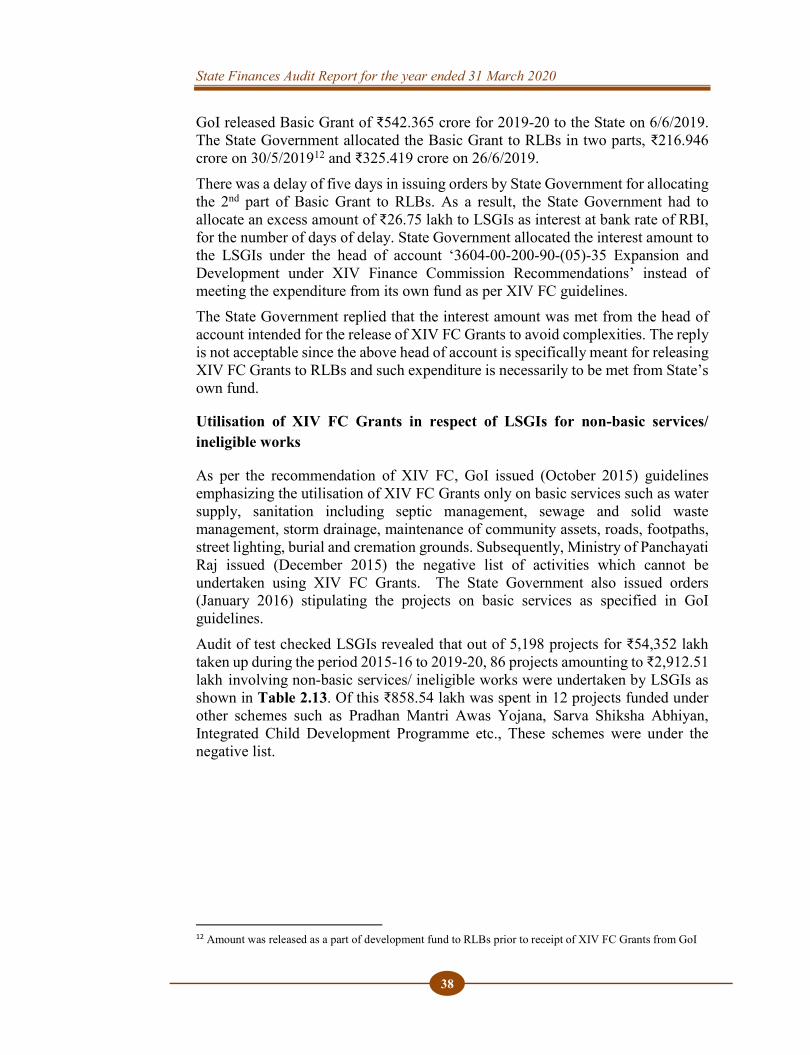
State Finances Audit Report for the year ended 31 March 2020
38
GoI released Basic Grant of ₹542.365 crore for 2019-20 to the State on 6/6/2019. The State Government allocated the Basic Grant to RLBs in two parts, ₹216.946 crore on 30/5/201912 and ₹325.419 crore on 26/6/2019. There was a delay of five days in issuing orders by State Government for allocating the 2nd part of Basic Grant to RLBs. As a result, the State Government had to allocate an excess amount of ₹26.75 lakh to LSGIs as interest at bank rate of RBI, for the number of days of delay. State Government allocated the interest amount to the LSGIs under the head of account ‘3604-00-200-90-(05)-35 Expansion and Development under XIV Finance Commission Recommendations’ instead of meeting the expenditure from its own fund as per XIV FC guidelines. The State Government replied that the interest amount was met from the head of account intended for the release of XIV FC Grants to avoid complexities. The reply is not acceptable since the above head of account is specifically meant for releasing XIV FC Grants to RLBs and such expenditure is necessarily to be met from State’s own fund.
Utilisation of XIV FC Grants in respect of LSGIs for non-basic services/ ineligible works
As per the recommendation of XIV FC, GoI issued (October 2015) guidelines emphasizing the utilisation of XIV FC Grants only on basic services such as water supply, sanitation including septic management, sewage and solid waste management, storm drainage, maintenance of community assets, roads, footpaths, street lighting, burial and cremation grounds. Subsequently, Ministry of Panchayati Raj issued (December 2015) the negative list of activities which cannot be undertaken using XIV FC Grants. The State Government also issued orders (January 2016) stipulating the projects on basic services as specified in GoI guidelines. Audit of test checked LSGIs revealed that out of 5,198 projects for ₹54,352 lakh taken up during the period 2015-16 to 2019-20, 86 projects amounting to ₹2,912.51 lakh involving non-basic services/ ineligible works were undertaken by LSGIs as shown in Table 2.13. Of this ₹858.54 lakh was spent in 12 projects funded under other schemes such as Pradhan Mantri Awas Yojana, Sarva Shiksha Abhiyan, Integrated Child Development Programme etc., These schemes were under the negative list.
12 Amount was released as a part of development fund to RLBs prior to receipt of XIV FC Grants from GoI
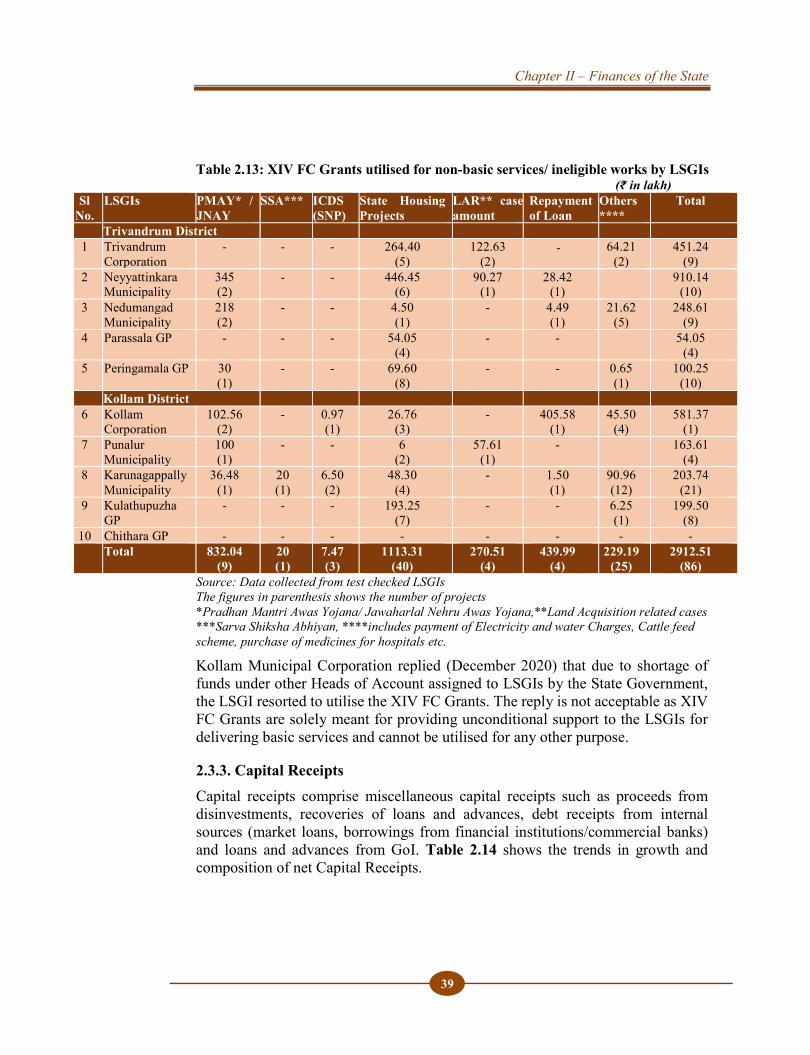
Chapter II – Finances of the State
39
Table 2.13: XIV FC Grants utilised for non-basic services/ ineligible works by LSGIs (₹ in lakh)
Sl No.
LSGIs PMAY* / JNAY
SSA*** ICDS (SNP)
State Housing Projects
LAR** case amount
Repayment of Loan
Others****
Total
Trivandrum District 1 Trivandrum
Corporation - - - 264.40
(5) 122.63
(2) 64.21
(2) 451.24
(9) 2 Neyyattinkara
Municipality 345 (2)
- - 446.45 (6)
90.27 (1)
28.42 (1)
910.14 (10)
3 Nedumangad Municipality
218 (2)
- - 4.50 (1)
- 4.49 (1)
21.62 (5)
248.61 (9)
4 Parassala GP - - - 54.05 (4)
- - 54.05 (4)
5 Peringamala GP 30 (1)
- - 69.60 (8)
- - 0.65 (1)
100.25 (10)
Kollam District 6 Kollam
Corporation 102.56
(2) - 0.97
(1) 26.76
(3) - 405.58
(1) 45.50
(4) 581.37
(1) 7 Punalur
Municipality 100 (1)
- - 6 (2)
57.61 (1)
- 163.61 (4)
8 Karunagappally Municipality
36.48 (1)
20 (1)
6.50 (2)
48.30 (4)
- 1.50 (1)
90.96 (12)
203.74 (21)
9 Kulathupuzha GP
- - - 193.25 (7)
- - 6.25 (1)
199.50 (8)
10 Chithara GP - - - - - - - - Total 832.04
(9) 20 (1)
7.47 (3)
1113.31 (40)
270.51 (4)
439.99 (4)
229.19 (25)
2912.51 (86)
Source: Data collected from test checked LSGIs The figures in parenthesis shows the number of projects *Pradhan Mantri Awas Yojana/ Jawaharlal Nehru Awas Yojana,**Land Acquisition related cases***Sarva Shiksha Abhiyan, ****includes payment of Electricity and water Charges, Cattle feed scheme, purchase of medicines for hospitals etc.
Kollam Municipal Corporation replied (December 2020) that due to shortage of funds under other Heads of Account assigned to LSGIs by the State Government, the LSGI resorted to utilise the XIV FC Grants. The reply is not acceptable as XIV FC Grants are solely meant for providing unconditional support to the LSGIs for delivering basic services and cannot be utilised for any other purpose.
2.3.3. Capital Receipts Capital receipts comprise miscellaneous capital receipts such as proceeds from disinvestments, recoveries of loans and advances, debt receipts from internal sources (market loans, borrowings from financial institutions/commercial banks) and loans and advances from GoI. Table 2.14 shows the trends in growth and composition of net Capital Receipts.
-
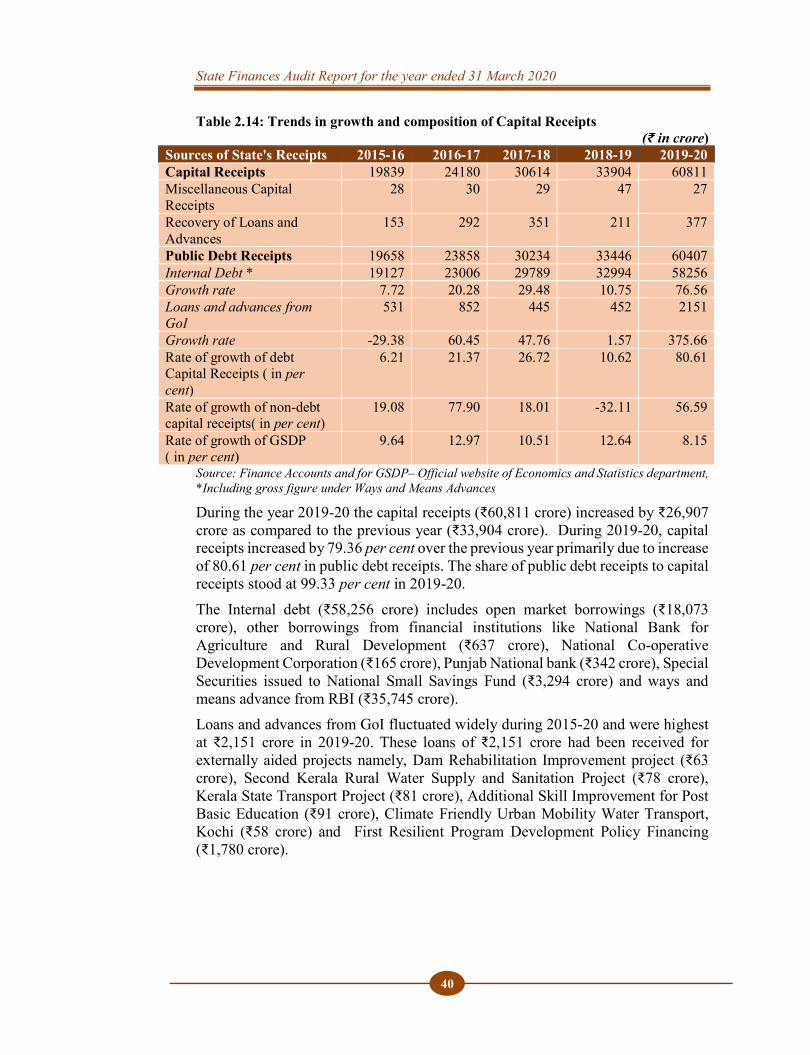
State Finances Audit Report for the year ended 31 March 2020
40
Table 2.14: Trends in growth and composition of Capital Receipts (₹ in crore)
Sources of State's Receipts 2015-16 2016-17 2017-18 2018-19 2019-20 Capital Receipts 19839 24180 30614 33904 60811 Miscellaneous Capital Receipts
28 30 29 47 27
Recovery of Loans and Advances
153 292 351 211 377
Public Debt Receipts 19658 23858 30234 33446 60407 Internal Debt * 19127 23006 29789 32994 58256 Growth rate 7.72 20.28 29.48 10.75 76.56 Loans and advances from GoI
531 852 445 452 2151
Growth rate -29.38 60.45 47.76 1.57 375.66 Rate of growth of debt Capital Receipts ( in per cent)
6.21 21.37 26.72 10.62 80.61
Rate of growth of non-debt capital receipts( in per cent)
19.08 77.90 18.01 -32.11 56.59
Rate of growth of GSDP ( in per cent)
9.64 12.97 10.51 12.64 8.15
Source: Finance Accounts and for GSDP– Official website of Economics and Statistics department, *Including gross figure under Ways and Means Advances
During the year 2019-20 the capital receipts (₹60,811 crore) increased by ₹26,907 crore as compared to the previous year (₹33,904 crore). During 2019-20, capital receipts increased by 79.36 per cent over the previous year primarily due to increase of 80.61 per cent in public debt receipts. The share of public debt receipts to capital receipts stood at 99.33 per cent in 2019-20. The Internal debt (₹58,256 crore) includes open market borrowings (₹18,073 crore), other borrowings from financial institutions like National Bank for Agriculture and Rural Development (₹637 crore), National Co-operative Development Corporation (₹165 crore), Punjab National bank (₹342 crore), Special Securities issued to National Small Savings Fund (₹3,294 crore) and ways and means advance from RBI (₹35,745 crore). Loans and advances from GoI fluctuated widely during 2015-20 and were highest at ₹2,151 crore in 2019-20. These loans of ₹2,151 crore had been received for externally aided projects namely, Dam Rehabilitation Improvement project (₹63 crore), Second Kerala Rural Water Supply and Sanitation Project (₹78 crore), Kerala State Transport Project (₹81 crore), Additional Skill Improvement for Post Basic Education (₹91 crore), Climate Friendly Urban Mobility Water Transport, Kochi (₹58 crore) and First Resilient Program Development Policy Financing (₹1,780 crore).

Chapter II – Finances of the State
41
2.3.4 State’s performance in mobilisation of resources As the State’s share in central taxes and grants-in -aid is determined on the basis of recommendations of the Finance Commission, the State’s performance in mobilisation of resources is assessed in term of its own resources comprising own tax and non-tax sources. The State’s actual tax and non-tax revenue for the year 2019-20 vis-à-vis assessments made by XIV FC and Budget Estimate are presented in Table 2.15 below.
Table 2.15 : Tax and Non-Tax receipts vis-à-vis projections (₹ in crore)
Source: Finance Accounts of respective years The actual tax revenue of the State in 2019-20 stood significantly lower than the projections made in the XIV FC, and Budget estimates. The actual tax revenue was lower than budget estimates due to less collection of State Goods and Service Tax (₹8,564 crore), Taxes on Sales, Trade, etc. (₹4,298 crore), Taxes on Vehicles (₹999 crore) and Stamps and registration fees (₹872 crore) and State Excise (₹728 crore). Actual non-tax revenue was lower than the budget estimates but higher than XIV FC projections.
2.4 Application of resources The State Government is vested with the responsibility of incurring expenditure within the framework of fiscal responsibility legislations, while at the same time ensuring that the ongoing fiscal correction and consolidation process of the State is not at the cost of expenditure directed towards development of capital infrastructure and social sector. 2.4.1 Growth and Composition of expenditure Capital Expenditure: All charges for the first construction of a project as well as charges for intermediate maintenance until the project is commissioned and charges for such further additions and improvements as may be sanctioned under the rules made by competent authority shall be classified as Capital expenditure.
Revenue Expenditure: Charges on maintenance, repair, upkeep and working expenses, which are required to maintain the assets in a running order as also all other expenses incurred for the day to day running of the organisation, including
FC Projections
Budget Estimates
Actual Percentage variation of actual over Budget Estimates
FC Projections
Own Tax Revenue 78865 65785 50323 (-)23.50 (-)36.19 Non Tax Revenue 10601 15070 12265 (-)18.61 15.70 Total 89466 80855 62588 (-)22.59 (-)30.04
State Finances Audit Report for the year ended 31 March 2020
42
establishment and administrative expenses shall be classified as revenue expenditure.
The trends in total expenditure (aggregate of revenue, capital and loans and advances expenditure) and various components of total expenditure-Plan and Non-Plan revenue expenditure, committed expenditure such as salaries and wages, interest payments, pension payments and subsidies, financial assistance to local bodies, etc., are discussed in the succeeding paragraphs. Overall expenditure and its components along with their percentage of GSDP are given in the Table 2.16. Table 2.16 Total expenditure and its composition (₹ in crore)
Parameters 2015-16 2016-17 2017-18 2018-19 2019-20 Total Expenditure (TE) 87032 102382 110238 120070 114385 Revenue Expenditure (RE) 78690 91096 99948 110316 104720 Capital Expenditure (CE) 7500 10126 8749 7431 8455 Loans and Advances 842 1160 1541 2323 1210 GSDP 561994 634886 701577 781653 854689 As a percentage of GSDP TE/GSDP 15.49 16.13 15.71 15.36 13.38 RE/GSDP 14.00 14.35 14.25 14.11 12.25 CE/GSDP 1.33 1.59 1.25 0.95 0.99 Loans and advances/GSDP 0.15 0.18 0.22 0.30 0.14
Source: Finance Accounts of respective years
The total expenditure of the State increased by 31.43 per cent from ₹87,032 crore in 2015-16 to ₹1,14,385 crore in 2019-20. During the year, it decreased by 4.73 per cent over the previous year mainly due to decrease in revenue expenditure. As a percentage of GSDP, the total expenditure remained in the range 15 per cent to 16 per cent during 2015-16 to 2018-19 and decreased to 13.38 per cent during 2019-20.
In terms of activities, the total expenditure is composed of expenditure on General Services including Interest Payments, Social Services, Economic Services and Others. Relative share of these components in the Total Expenditure of ₹1,14,385 crore during 2019-20 is given in Table 2.17. Table 2.17 : Relative share of various sectors of expenditure (in per cent)
Parameters 2015-16 2016-17 2017-18 2018-19 2019-20 General Services 41.76 40.44 41.54 42.50 48.66 Social Services 32.91 34.24 33.82 33.31 30.72 Economic Services 19.88 18.83 16.71 14.85 14.26 Others(Grants to Local Bodies and Loans and Advances)
5.45 6.49 7.93 9.34 6.36
Source: Finance Accounts of respective years
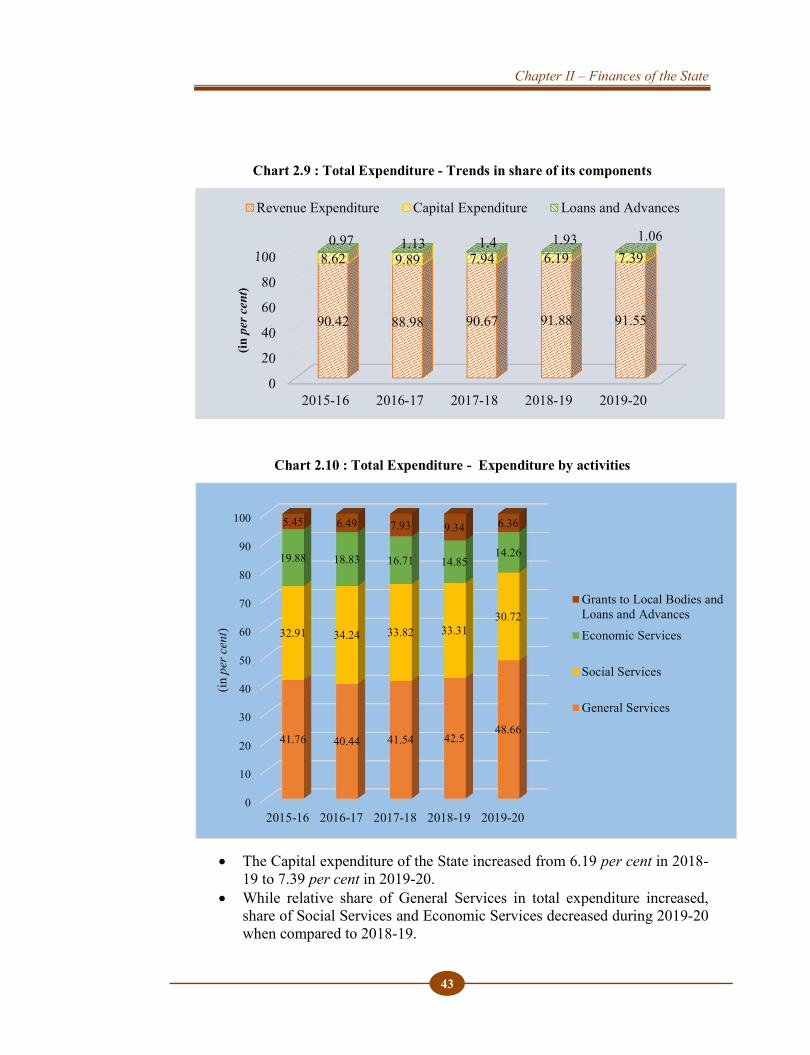
Chapter II – Finances of the State
43
Chart 2.9 : Total Expenditure - Trends in share of its components
Chart 2.10 : Total Expenditure - Expenditure by activities
The Capital expenditure of the State increased from 6.19 per cent in 2018-19 to 7.39 per cent in 2019-20.
While relative share of General Services in total expenditure increased, share of Social Services and Economic Services decreased during 2019-20 when compared to 2018-19.
2015-16 2016-17 2017-18 2018-19 2019-20
90.42 88.98 90.67 91.88 91.55
8.62 9.89 7.94 6.19 7.390.97 1.13 1.4 1.93 1.06
(in p
er c
ent)
Revenue Expenditure Capital Expenditure Loans and Advances
0
10
20
30
40
50
60
70
80
90
100
2015-16 2016-17 2017-18 2018-19 2019-20
41.76 40.44 41.54 42.548.66
32.91 34.24 33.82 33.3130.72
19.88 18.83 16.71 14.8514.26
5.45 6.49 7.93 9.34 6.36
(in p
er c
ent)
Grants to Local Bodies andLoans and AdvancesEconomic Services
Social Services
General Services
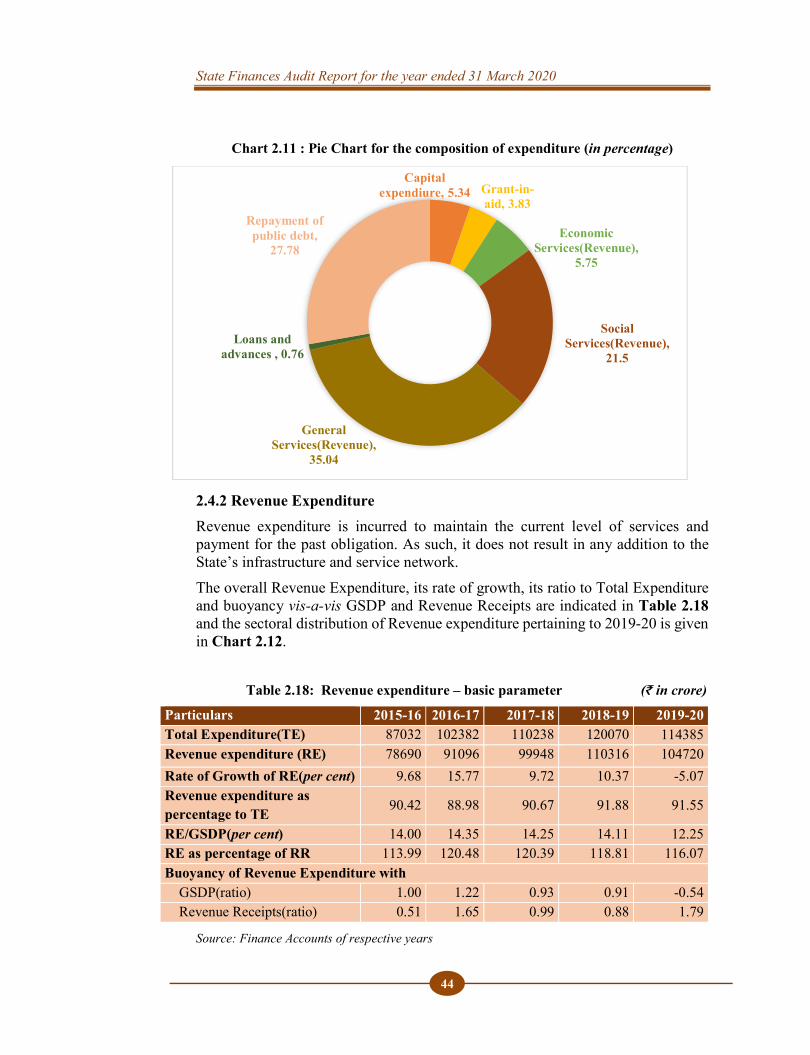
State Finances Audit Report for the year ended 31 March 2020
44
Chart 2.11 : Pie Chart for the composition of expenditure (in percentage)
2.4.2 Revenue Expenditure Revenue expenditure is incurred to maintain the current level of services and payment for the past obligation. As such, it does not result in any addition to the State’s infrastructure and service network. The overall Revenue Expenditure, its rate of growth, its ratio to Total Expenditure and buoyancy vis-a-vis GSDP and Revenue Receipts are indicated in Table 2.18 and the sectoral distribution of Revenue expenditure pertaining to 2019-20 is given in Chart 2.12.
Table 2.18: Revenue expenditure – basic parameter (₹ in crore)
Particulars 2015-16 2016-17 2017-18 2018-19 2019-20 Total Expenditure(TE) 87032 102382 110238 120070 114385 Revenue expenditure (RE) 78690 91096 99948 110316 104720 Rate of Growth of RE(per cent) 9.68 15.77 9.72 10.37 -5.07 Revenue expenditure as percentage to TE 90.42 88.98 90.67 91.88 91.55
RE/GSDP(per cent) 14.00 14.35 14.25 14.11 12.25 RE as percentage of RR 113.99 120.48 120.39 118.81 116.07 Buoyancy of Revenue Expenditure with
GSDP(ratio) 1.00 1.22 0.93 0.91 -0.54 Revenue Receipts(ratio) 0.51 1.65 0.99 0.88 1.79
Source: Finance Accounts of respective years
Capital expendiure, 5.34 Grant-in-
aid, 3.83
Economic Services(Revenue),
5.75
Social Services(Revenue),
21.5
General Services(Revenue),
35.04
Loans and advances , 0.76
Repayment of public debt,
27.78
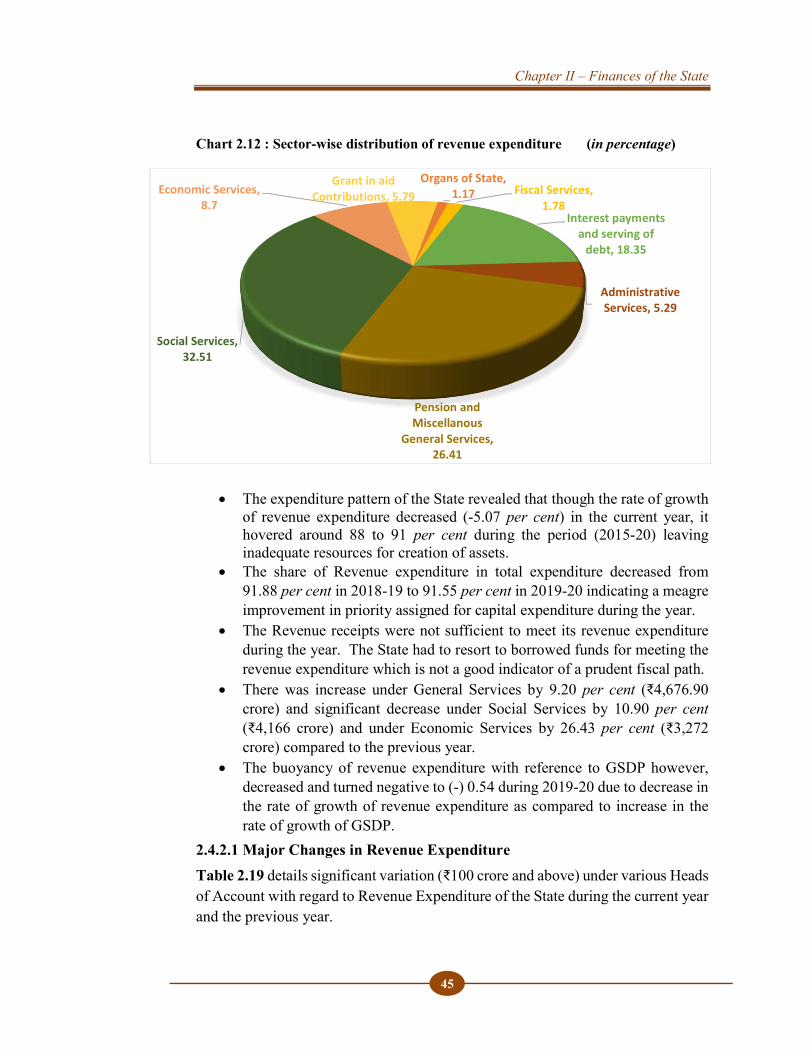
Chapter II – Finances of the State
45
Chart 2.12 : Sector-wise distribution of revenue expenditure (in percentage)
The expenditure pattern of the State revealed that though the rate of growth of revenue expenditure decreased (-5.07 per cent) in the current year, it hovered around 88 to 91 per cent during the period (2015-20) leaving inadequate resources for creation of assets.
The share of Revenue expenditure in total expenditure decreased from 91.88 per cent in 2018-19 to 91.55 per cent in 2019-20 indicating a meagre improvement in priority assigned for capital expenditure during the year.
The Revenue receipts were not sufficient to meet its revenue expenditure during the year. The State had to resort to borrowed funds for meeting the revenue expenditure which is not a good indicator of a prudent fiscal path.
There was increase under General Services by 9.20 per cent (₹4,676.90 crore) and significant decrease under Social Services by 10.90 per cent (₹4,166 crore) and under Economic Services by 26.43 per cent (₹3,272 crore) compared to the previous year.
The buoyancy of revenue expenditure with reference to GSDP however, decreased and turned negative to (-) 0.54 during 2019-20 due to decrease in the rate of growth of revenue expenditure as compared to increase in the rate of growth of GSDP.
2.4.2.1 Major Changes in Revenue Expenditure Table 2.19 details significant variation (₹100 crore and above) under various Heads of Account with regard to Revenue Expenditure of the State during the current year and the previous year.
Organs of State, 1.17 Fiscal Services,
1.78Interest payments
and serving of debt, 18.35
Administrative Services, 5.29
Pension and Miscellanous
General Services, 26.41
Social Services, 32.51
Economic Services, 8.7
Grant in aid Contributions, 5.79
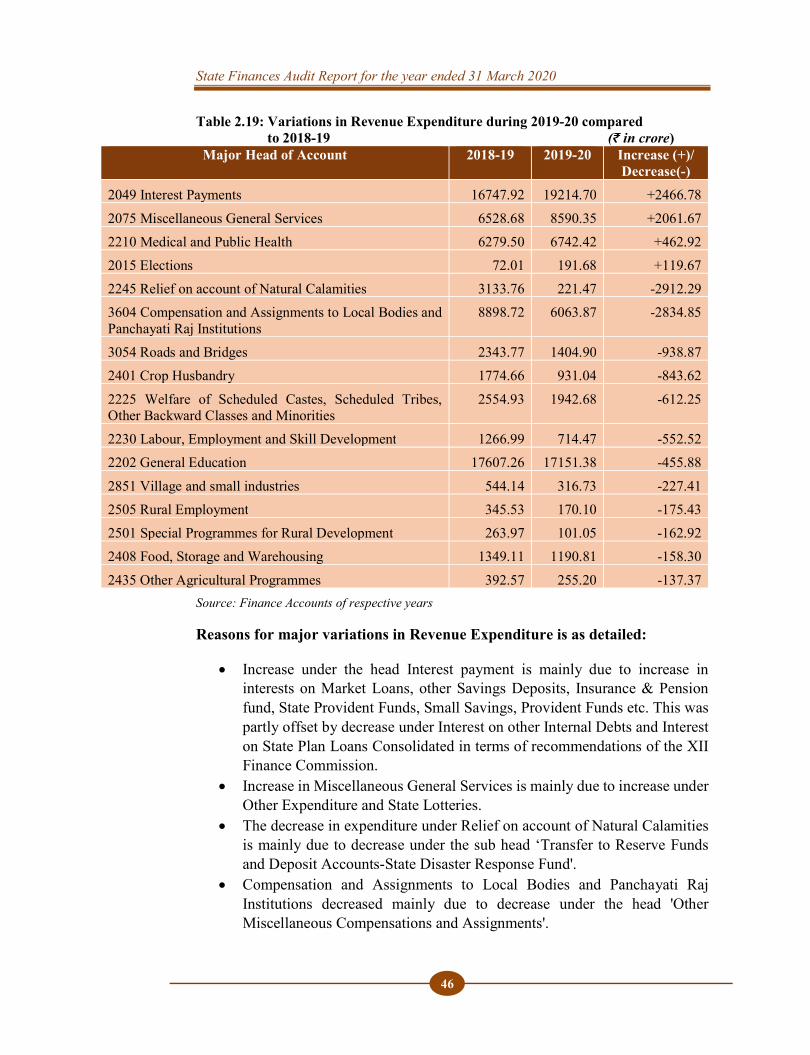
State Finances Audit Report for the year ended 31 March 2020
46
Table 2.19: Variations in Revenue Expenditure during 2019-20 compared to 2018-19 (₹ in crore) Major Head of Account 2018-19 2019-20 Increase (+)/
Decrease(-) 2049 Interest Payments 16747.92 19214.70 +2466.78 2075 Miscellaneous General Services 6528.68 8590.35 +2061.67 2210 Medical and Public Health 6279.50 6742.42 +462.92 2015 Elections 72.01 191.68 +119.67 2245 Relief on account of Natural Calamities 3133.76 221.47 -2912.29 3604 Compensation and Assignments to Local Bodies and Panchayati Raj Institutions
8898.72 6063.87 -2834.85
3054 Roads and Bridges 2343.77 1404.90 -938.87 2401 Crop Husbandry 1774.66 931.04 -843.62 2225 Welfare of Scheduled Castes, Scheduled Tribes, Other Backward Classes and Minorities
2554.93 1942.68 -612.25
2230 Labour, Employment and Skill Development 1266.99 714.47 -552.52 2202 General Education 17607.26 17151.38 -455.88 2851 Village and small industries 544.14 316.73 -227.41 2505 Rural Employment 345.53 170.10 -175.43 2501 Special Programmes for Rural Development 263.97 101.05 -162.92 2408 Food, Storage and Warehousing 1349.11 1190.81 -158.30 2435 Other Agricultural Programmes 392.57 255.20 -137.37
Source: Finance Accounts of respective years
Reasons for major variations in Revenue Expenditure is as detailed:
Increase under the head Interest payment is mainly due to increase in interests on Market Loans, other Savings Deposits, Insurance & Pension fund, State Provident Funds, Small Savings, Provident Funds etc. This was partly offset by decrease under Interest on other Internal Debts and Interest on State Plan Loans Consolidated in terms of recommendations of the XII Finance Commission.
Increase in Miscellaneous General Services is mainly due to increase under Other Expenditure and State Lotteries.
The decrease in expenditure under Relief on account of Natural Calamities is mainly due to decrease under the sub head ‘Transfer to Reserve Funds and Deposit Accounts-State Disaster Response Fund'.
Compensation and Assignments to Local Bodies and Panchayati Raj Institutions decreased mainly due to decrease under the head 'Other Miscellaneous Compensations and Assignments'.
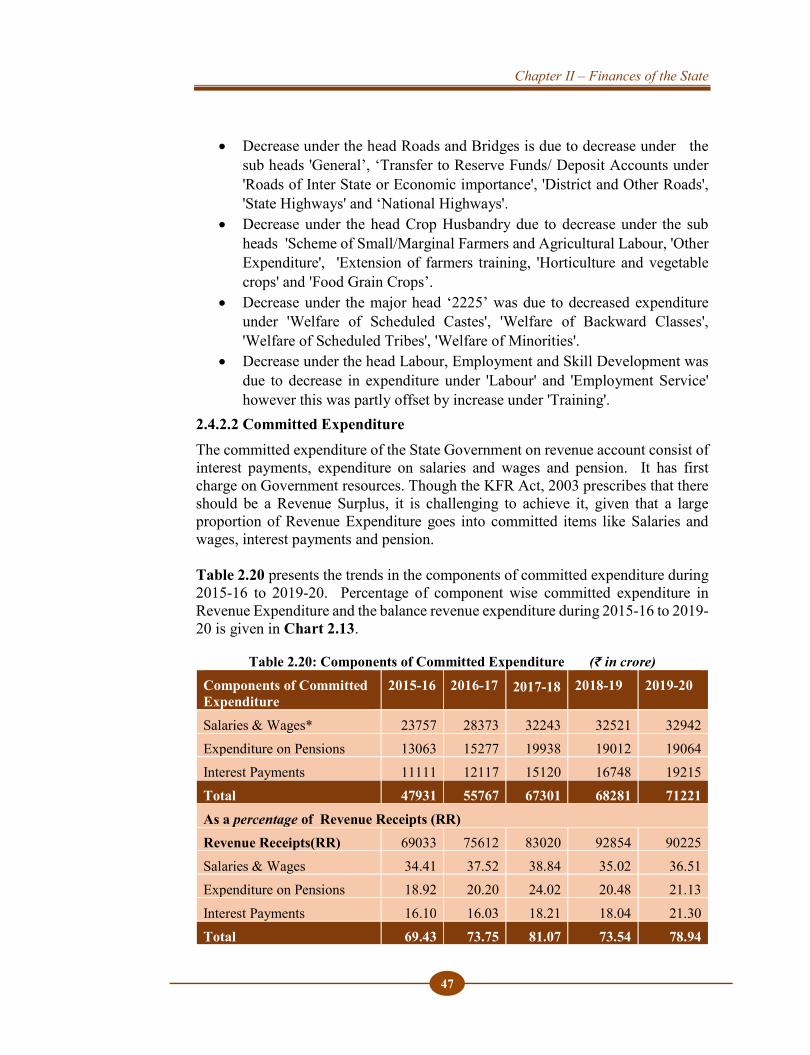
Chapter II – Finances of the State
47
Decrease under the head Roads and Bridges is due to decrease under the sub heads 'General’, ‘Transfer to Reserve Funds/ Deposit Accounts under 'Roads of Inter State or Economic importance', 'District and Other Roads', 'State Highways' and ‘National Highways'.
Decrease under the head Crop Husbandry due to decrease under the sub heads 'Scheme of Small/Marginal Farmers and Agricultural Labour, 'Other Expenditure', 'Extension of farmers training, 'Horticulture and vegetable crops' and 'Food Grain Crops’.
Decrease under the major head ‘2225’ was due to decreased expenditure under 'Welfare of Scheduled Castes', 'Welfare of Backward Classes', 'Welfare of Scheduled Tribes', 'Welfare of Minorities'.
Decrease under the head Labour, Employment and Skill Development was due to decrease in expenditure under 'Labour' and 'Employment Service' however this was partly offset by increase under 'Training'.
2.4.2.2 Committed Expenditure The committed expenditure of the State Government on revenue account consist of interest payments, expenditure on salaries and wages and pension. It has first charge on Government resources. Though the KFR Act, 2003 prescribes that there should be a Revenue Surplus, it is challenging to achieve it, given that a large proportion of Revenue Expenditure goes into committed items like Salaries and wages, interest payments and pension. Table 2.20 presents the trends in the components of committed expenditure during 2015-16 to 2019-20. Percentage of component wise committed expenditure in Revenue Expenditure and the balance revenue expenditure during 2015-16 to 2019-20 is given in Chart 2.13.
Table 2.20: Components of Committed Expenditure (₹ in crore) Components of Committed Expenditure
2015-16 2016-17 2017-18 2018-19 2019-20
Salaries & Wages* 23757 28373 32243 32521 32942 Expenditure on Pensions 13063 15277 19938 19012 19064 Interest Payments 11111 12117 15120 16748 19215 Total 47931 55767 67301 68281 71221 As a percentage of Revenue Receipts (RR) Revenue Receipts(RR) 69033 75612 83020 92854 90225 Salaries & Wages 34.41 37.52 38.84 35.02 36.51 Expenditure on Pensions 18.92 20.20 24.02 20.48 21.13 Interest Payments 16.10 16.03 18.21 18.04 21.30 Total 69.43 73.75 81.07 73.54 78.94
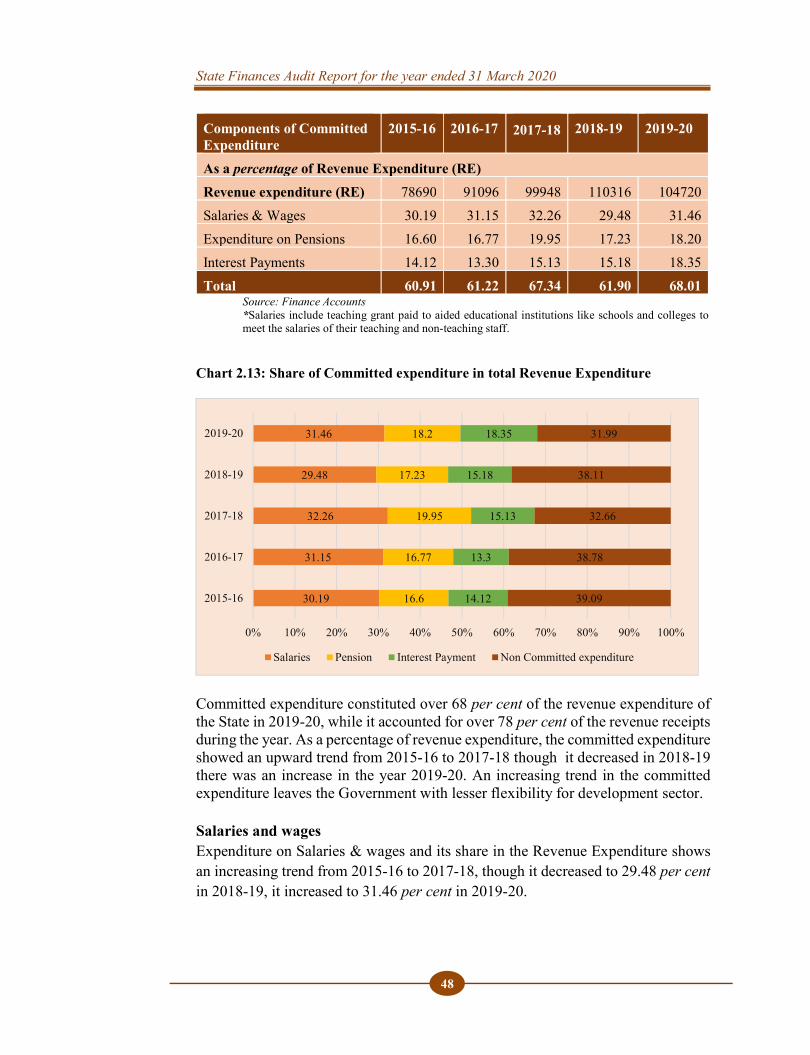
State Finances Audit Report for the year ended 31 March 2020
48
Components of Committed Expenditure
2015-16 2016-17 2017-18 2018-19 2019-20
As a percentage of Revenue Expenditure (RE) Revenue expenditure (RE) 78690 91096 99948 110316 104720 Salaries & Wages 30.19 31.15 32.26 29.48 31.46 Expenditure on Pensions 16.60 16.77 19.95 17.23 18.20 Interest Payments 14.12 13.30 15.13 15.18 18.35 Total 60.91 61.22 67.34 61.90 68.01
Source: Finance Accounts *Salaries include teaching grant paid to aided educational institutions like schools and colleges to meet the salaries of their teaching and non-teaching staff.
Chart 2.13: Share of Committed expenditure in total Revenue Expenditure
Committed expenditure constituted over 68 per cent of the revenue expenditure of the State in 2019-20, while it accounted for over 78 per cent of the revenue receipts during the year. As a percentage of revenue expenditure, the committed expenditure showed an upward trend from 2015-16 to 2017-18 though it decreased in 2018-19 there was an increase in the year 2019-20. An increasing trend in the committed expenditure leaves the Government with lesser flexibility for development sector. Salaries and wages Expenditure on Salaries & wages and its share in the Revenue Expenditure shows an increasing trend from 2015-16 to 2017-18, though it decreased to 29.48 per cent in 2018-19, it increased to 31.46 per cent in 2019-20.
30.19
31.15
32.26
29.48
31.46
16.6
16.77
19.95
17.23
18.2
14.12
13.3
15.13
15.18
18.35
39.09
38.78
32.66
38.11
31.99
0% 10% 20% 30% 40% 50% 60% 70% 80% 90% 100%
2015-16
2016-17
2017-18
2018-19
2019-20
Salaries Pension Interest Payment Non Committed expenditure
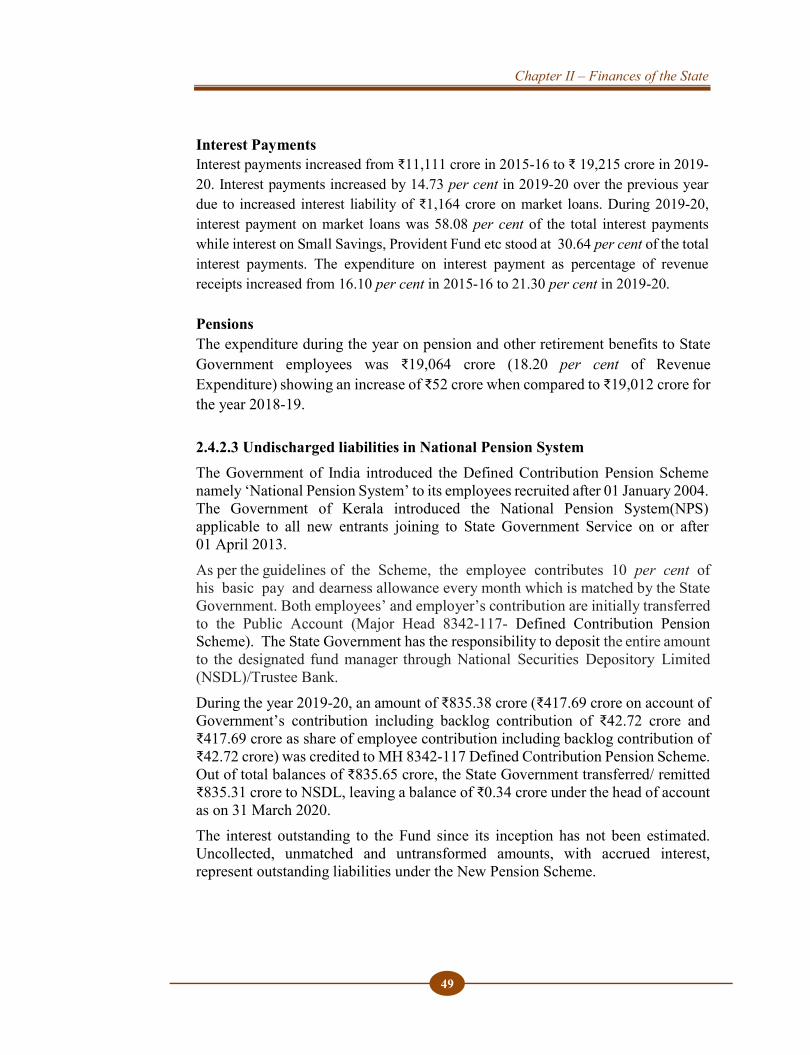
Chapter II – Finances of the State
49
Interest Payments Interest payments increased from ₹11,111 crore in 2015-16 to ₹ 19,215 crore in 2019-20. Interest payments increased by 14.73 per cent in 2019-20 over the previous year due to increased interest liability of ₹1,164 crore on market loans. During 2019-20, interest payment on market loans was 58.08 per cent of the total interest payments while interest on Small Savings, Provident Fund etc stood at 30.64 per cent of the total interest payments. The expenditure on interest payment as percentage of revenue receipts increased from 16.10 per cent in 2015-16 to 21.30 per cent in 2019-20. Pensions The expenditure during the year on pension and other retirement benefits to State Government employees was ₹19,064 crore (18.20 per cent of Revenue Expenditure) showing an increase of ₹52 crore when compared to ₹19,012 crore for the year 2018-19. 2.4.2.3 Undischarged liabilities in National Pension System The Government of India introduced the Defined Contribution Pension Scheme namely ‘National Pension System’ to its employees recruited after 01 January 2004. The Government of Kerala introduced the National Pension System(NPS) applicable to all new entrants joining to State Government Service on or after 01 April 2013. As per the guidelines of the Scheme, the employee contributes 10 per cent of his basic pay and dearness allowance every month which is matched by the State Government. Both employees’ and employer’s contribution are initially transferred to the Public Account (Major Head 8342-117- Defined Contribution Pension Scheme). The State Government has the responsibility to deposit the entire amount to the designated fund manager through National Securities Depository Limited (NSDL)/Trustee Bank. During the year 2019-20, an amount of ₹835.38 crore (₹417.69 crore on account of Government’s contribution including backlog contribution of ₹42.72 crore and ₹417.69 crore as share of employee contribution including backlog contribution of ₹42.72 crore) was credited to MH 8342-117 Defined Contribution Pension Scheme. Out of total balances of ₹835.65 crore, the State Government transferred/ remitted ₹835.31 crore to NSDL, leaving a balance of ₹0.34 crore under the head of account as on 31 March 2020. The interest outstanding to the Fund since its inception has not been estimated. Uncollected, unmatched and untransformed amounts, with accrued interest, represent outstanding liabilities under the New Pension Scheme.
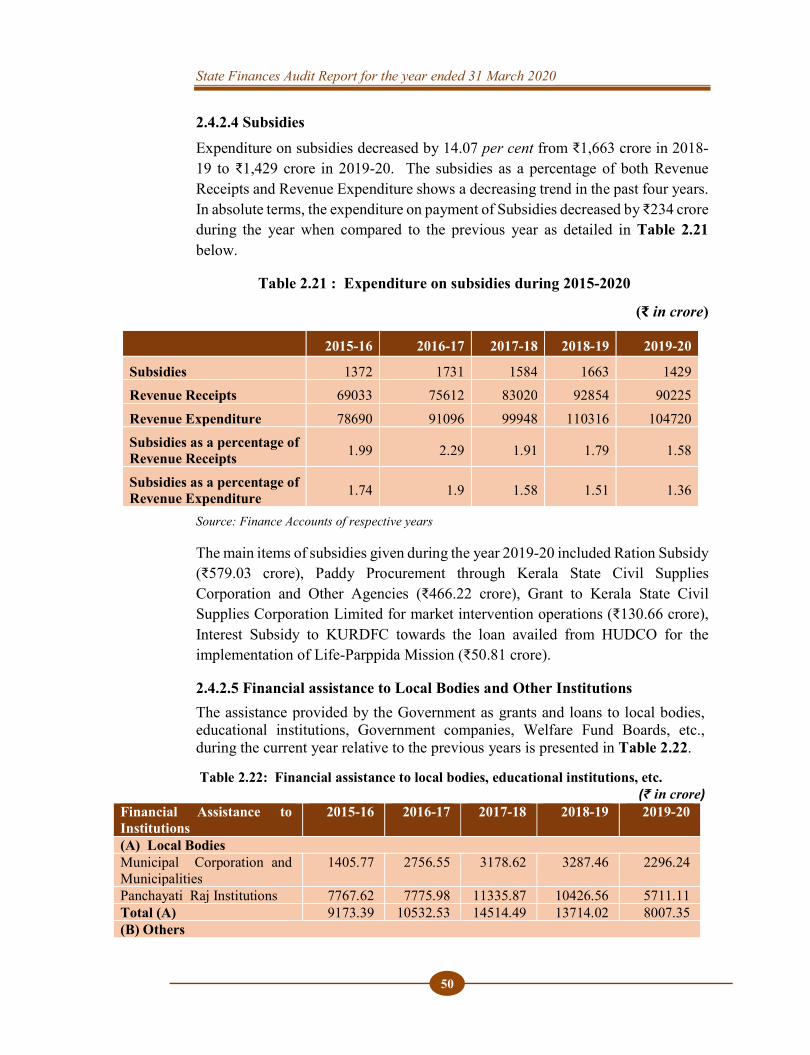
State Finances Audit Report for the year ended 31 March 2020
50
2.4.2.4 Subsidies Expenditure on subsidies decreased by 14.07 per cent from ₹1,663 crore in 2018-19 to ₹1,429 crore in 2019-20. The subsidies as a percentage of both Revenue Receipts and Revenue Expenditure shows a decreasing trend in the past four years. In absolute terms, the expenditure on payment of Subsidies decreased by ₹234 crore during the year when compared to the previous year as detailed in Table 2.21 below.
Table 2.21 : Expenditure on subsidies during 2015-2020
(₹ in crore)
2015-16 2016-17 2017-18 2018-19 2019-20
Subsidies 1372 1731 1584 1663 1429 Revenue Receipts 69033 75612 83020 92854 90225 Revenue Expenditure 78690 91096 99948 110316 104720 Subsidies as a percentage of Revenue Receipts 1.99 2.29 1.91 1.79 1.58
Subsidies as a percentage of Revenue Expenditure 1.74 1.9 1.58 1.51 1.36
Source: Finance Accounts of respective years
The main items of subsidies given during the year 2019-20 included Ration Subsidy (₹579.03 crore), Paddy Procurement through Kerala State Civil Supplies Corporation and Other Agencies (₹466.22 crore), Grant to Kerala State Civil Supplies Corporation Limited for market intervention operations (₹130.66 crore), Interest Subsidy to KURDFC towards the loan availed from HUDCO for the implementation of Life-Parppida Mission (₹50.81 crore).
2.4.2.5 Financial assistance to Local Bodies and Other Institutions The assistance provided by the Government as grants and loans to local bodies, educational institutions, Government companies, Welfare Fund Boards, etc., during the current year relative to the previous years is presented in Table 2.22.
Table 2.22: Financial assistance to local bodies, educational institutions, etc. (₹ in crore)
Financial Assistance to Institutions
2015-16 2016-17 2017-18 2018-19 2019-20
(A) Local Bodies Municipal Corporation and Municipalities
1405.77 2756.55 3178.62 3287.46 2296.24
Panchayati Raj Institutions 7767.62 7775.98 11335.87 10426.56 5711.11 Total (A) 9173.39 10532.53 14514.49 13714.02 8007.35 (B) Others
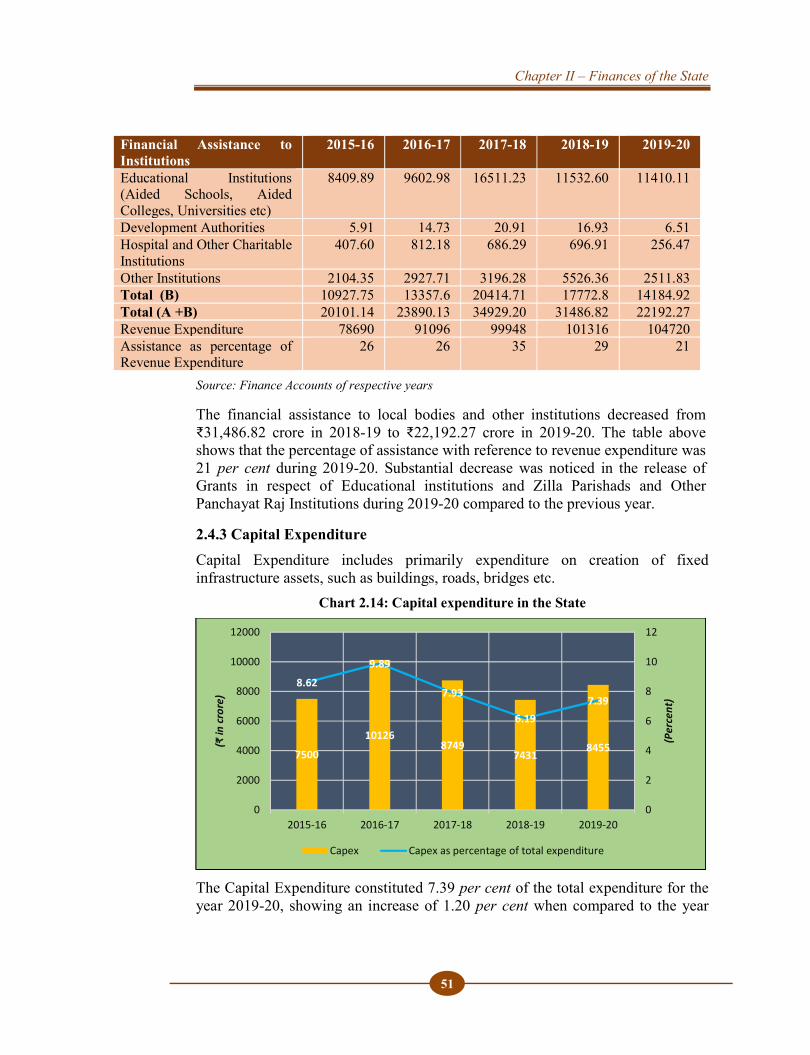
Chapter II – Finances of the State
51
Financial Assistance to Institutions
2015-16 2016-17 2017-18 2018-19 2019-20
Educational Institutions (Aided Schools, Aided Colleges, Universities etc)
8409.89 9602.98 16511.23 11532.60 11410.11
Development Authorities 5.91 14.73 20.91 16.93 6.51 Hospital and Other Charitable Institutions
407.60 812.18 686.29 696.91 256.47
Other Institutions 2104.35 2927.71 3196.28 5526.36 2511.83 Total (B) 10927.75 13357.6 20414.71 17772.8 14184.92 Total (A +B) 20101.14 23890.13 34929.20 31486.82 22192.27 Revenue Expenditure 78690 91096 99948 101316 104720 Assistance as percentage of Revenue Expenditure
26 26 35 29 21
Source: Finance Accounts of respective years
The financial assistance to local bodies and other institutions decreased from ₹31,486.82 crore in 2018-19 to ₹22,192.27 crore in 2019-20. The table above shows that the percentage of assistance with reference to revenue expenditure was 21 per cent during 2019-20. Substantial decrease was noticed in the release of Grants in respect of Educational institutions and Zilla Parishads and Other Panchayat Raj Institutions during 2019-20 compared to the previous year.
2.4.3 Capital Expenditure Capital Expenditure includes primarily expenditure on creation of fixed infrastructure assets, such as buildings, roads, bridges etc.
Chart 2.14: Capital expenditure in the State
The Capital Expenditure constituted 7.39 per cent of the total expenditure for the year 2019-20, showing an increase of 1.20 per cent when compared to the year
7500
101268749
74318455
8.62
9.89
7.93
6.197.39
0
2000
4000
6000
8000
10000
12000
2015-16 2016-17 2017-18 2018-19 2019-200
2
4
6
8
10
12
(₹ in
cro
re)
(Per
cent
)
Capex Capex as percentage of total expenditure
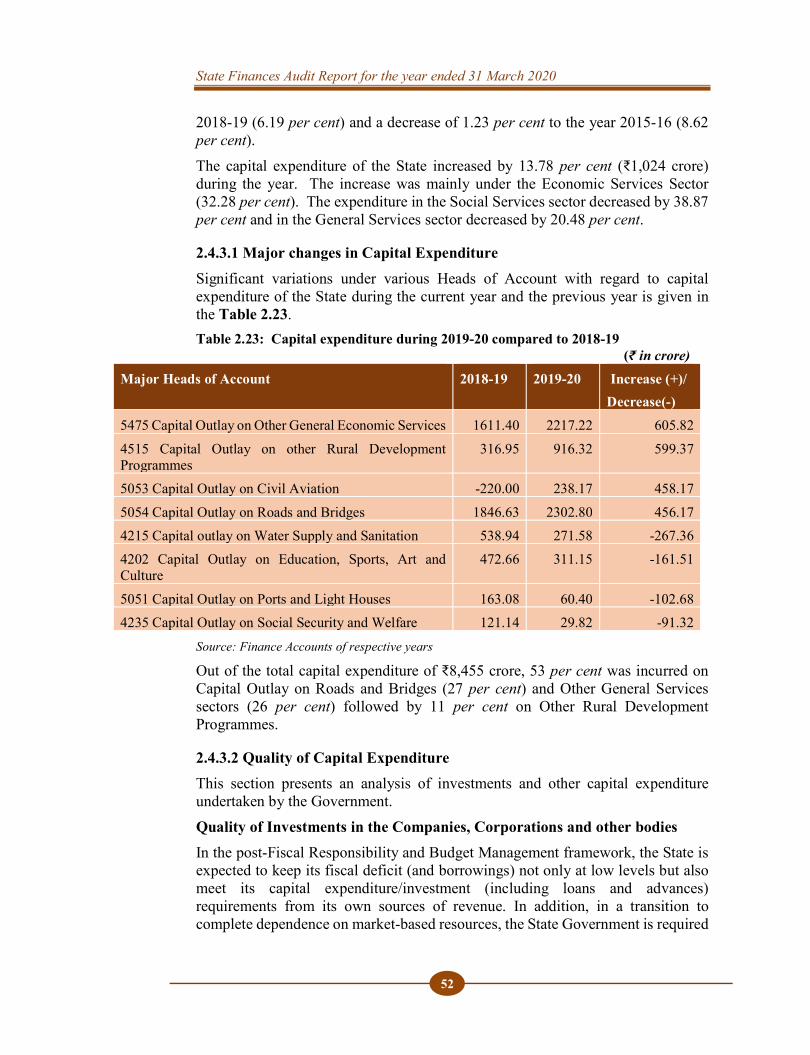
State Finances Audit Report for the year ended 31 March 2020
52
2018-19 (6.19 per cent) and a decrease of 1.23 per cent to the year 2015-16 (8.62 per cent). The capital expenditure of the State increased by 13.78 per cent (₹1,024 crore) during the year. The increase was mainly under the Economic Services Sector (32.28 per cent). The expenditure in the Social Services sector decreased by 38.87 per cent and in the General Services sector decreased by 20.48 per cent.
2.4.3.1 Major changes in Capital Expenditure Significant variations under various Heads of Account with regard to capital expenditure of the State during the current year and the previous year is given in the Table 2.23. Table 2.23: Capital expenditure during 2019-20 compared to 2018-19
(₹ in crore) Major Heads of Account 2018-19 2019-20 Increase (+)/
Decrease(-) 5475 Capital Outlay on Other General Economic Services 1611.40 2217.22 605.82 4515 Capital Outlay on other Rural Development Programmes
316.95 916.32 599.37
5053 Capital Outlay on Civil Aviation -220.00 238.17 458.17 5054 Capital Outlay on Roads and Bridges 1846.63 2302.80 456.17 4215 Capital outlay on Water Supply and Sanitation 538.94 271.58 -267.36 4202 Capital Outlay on Education, Sports, Art and Culture
472.66 311.15 -161.51
5051 Capital Outlay on Ports and Light Houses 163.08 60.40 -102.68 4235 Capital Outlay on Social Security and Welfare 121.14 29.82 -91.32
Source: Finance Accounts of respective years Out of the total capital expenditure of ₹8,455 crore, 53 per cent was incurred on Capital Outlay on Roads and Bridges (27 per cent) and Other General Services sectors (26 per cent) followed by 11 per cent on Other Rural Development Programmes.
2.4.3.2 Quality of Capital Expenditure This section presents an analysis of investments and other capital expenditure undertaken by the Government. Quality of Investments in the Companies, Corporations and other bodies In the post-Fiscal Responsibility and Budget Management framework, the State is expected to keep its fiscal deficit (and borrowings) not only at low levels but also meet its capital expenditure/investment (including loans and advances) requirements from its own sources of revenue. In addition, in a transition to complete dependence on market-based resources, the State Government is required
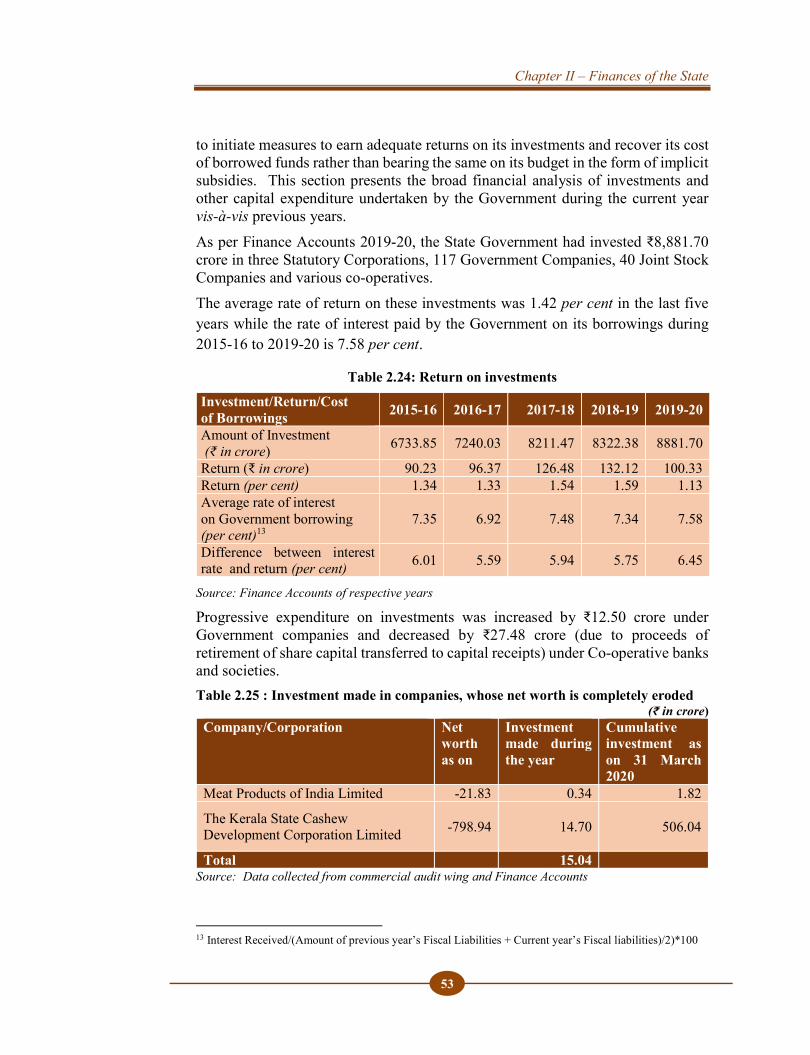
Chapter II – Finances of the State
53
to initiate measures to earn adequate returns on its investments and recover its cost of borrowed funds rather than bearing the same on its budget in the form of implicit subsidies. This section presents the broad financial analysis of investments and other capital expenditure undertaken by the Government during the current year vis-à-vis previous years. As per Finance Accounts 2019-20, the State Government had invested ₹8,881.70 crore in three Statutory Corporations, 117 Government Companies, 40 Joint Stock Companies and various co-operatives. The average rate of return on these investments was 1.42 per cent in the last five years while the rate of interest paid by the Government on its borrowings during 2015-16 to 2019-20 is 7.58 per cent.
Table 2.24: Return on investments
Investment/Return/Cost of Borrowings 2015-16 2016-17 2017-18 2018-19 2019-20
Amount of Investment (₹ in crore) 6733.85 7240.03 8211.47 8322.38 8881.70
Return (₹ in crore) 90.23 96.37 126.48 132.12 100.33 Return (per cent) 1.34 1.33 1.54 1.59 1.13 Average rate of interest on Government borrowing (per cent)13
7.35 6.92 7.48 7.34 7.58
Difference between interest rate and return (per cent) 6.01 5.59 5.94 5.75 6.45
Source: Finance Accounts of respective years
Progressive expenditure on investments was increased by ₹12.50 crore under Government companies and decreased by ₹27.48 crore (due to proceeds of retirement of share capital transferred to capital receipts) under Co-operative banks and societies. Table 2.25 : Investment made in companies, whose net worth is completely eroded
(₹ in crore) Company/Corporation Net
worth as on
Investment made during the year
Cumulative investment as on 31 March 2020
Meat Products of India Limited -21.83 0.34 1.82
The Kerala State Cashew Development Corporation Limited -798.94 14.70
506.04
Total 15.04
Source: Data collected from commercial audit wing and Finance Accounts
13 Interest Received/(Amount of previous year’s Fiscal Liabilities + Current year’s Fiscal liabilities)/2)*100

State Finances Audit Report for the year ended 31 March 2020
54
During 2019-20, State Government invested ₹110 crore in Statutory Corporation, ₹145.60 crore in Government Companies, ₹238.16 crore in Joint Stock Company and ₹55.53 crore in Co-operative Banks and Societies. Nine out of 18 Government Companies in which an amount of ₹292.68 crore was invested during the year are loss making. The total investment of the Government upto 31 March 2020 in these nine loss making Companies is ₹2,276.53 crore. Details of investments made in loss making companies is given in Table 2.26 below.
Table 2.26: Investments made in loss making companies (₹ in crore)
Source: Data collected from commercial audit wing and Finance Accounts
If the State Government keeps on making investments in loss making government companies there are no chances of return on investment. Investment made in Companies which are loss making and those where net worth is completely eroded, affect quality of capital expenditure.
Irregular booking of investment made by the Government The State Government released ₹15 crore to Indian Institute of Information Technology -Kerala, (IIIT-K) for the construction of building and infrastructure development of permanent campus. The fund was released with an instruction to IIIT-K, to issue share certificate to the State Government for the whole up-to date paid up capital. The amount drawn as additional authorisation was booked under the head of account 4859-02-004-97 - Research and Development instead of 4859-
Corporations/Companies Loss after tax and interest
Year of accounts
Investment made during 2019-20
Cumulative investment as on 31.03.2020
Kerala Tourism Development Corporation limited 7.35 2014-15 4.58 117.6 The Kerala State Development Corporation for Scheduled Caste and Scheduled Tribes Limited 6.21 2017-18 21.40 192.58 The Kerala State Film Development Corporation Limited 0.63 2015-16 2.00 55.38 Kerala Shipping and Inland Navigation Corporation Limited 1.15 2017-18 3.00 66.67 Kerala State Development Corporation for the Welfare of Christian Converts from Scheduled Castes and the Recommended Communities limited 0.35 2012-13 7.00 67.05 Meat Products of India Limited 3.75 2016-17 0.34 1.82 Vision Varkala Infrastructure Development Corporation Limited 0.35 2017-18 1.50 12.23 Kannur International Airport Limited 0.52 2015-16 238.16 1257.16 The Kerala State Cashew Development Corporation Limited 0.35 2017-18 14.70 506.04 Total 292.68 2276.53
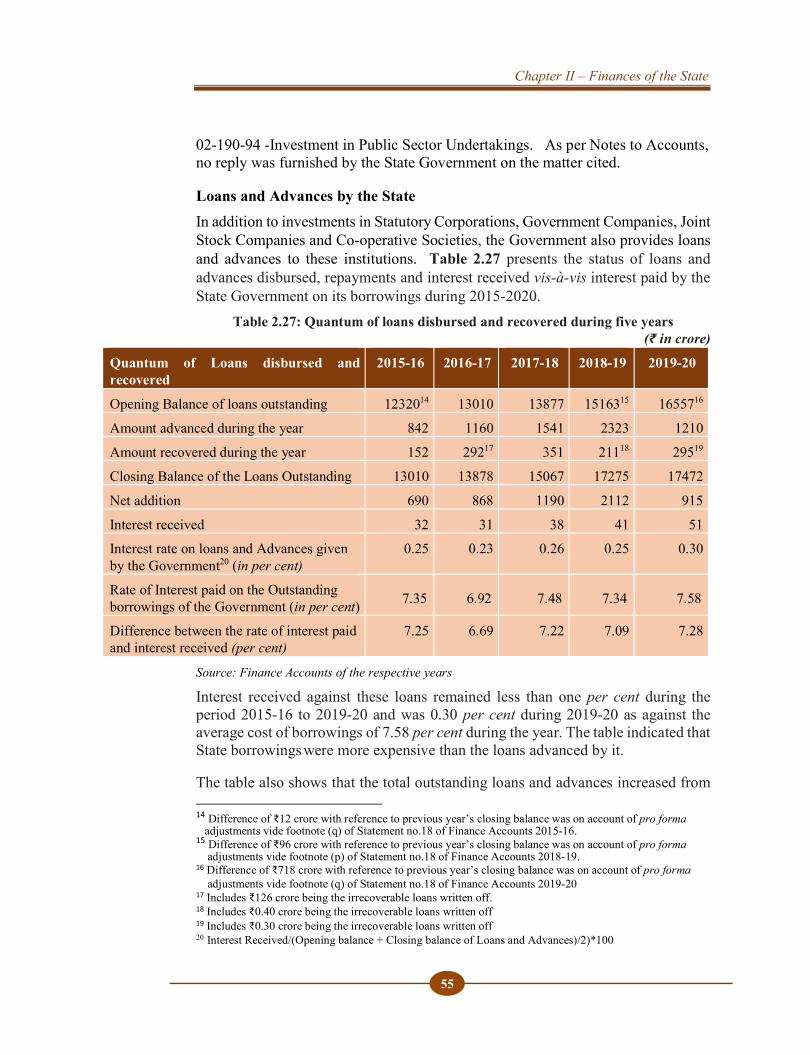
Chapter II – Finances of the State
55
02-190-94 -Investment in Public Sector Undertakings. As per Notes to Accounts, no reply was furnished by the State Government on the matter cited.
Loans and Advances by the State In addition to investments in Statutory Corporations, Government Companies, Joint Stock Companies and Co-operative Societies, the Government also provides loans and advances to these institutions. Table 2.27 presents the status of loans and advances disbursed, repayments and interest received vis-à-vis interest paid by the State Government on its borrowings during 2015-2020.
Table 2.27: Quantum of loans disbursed and recovered during five years (₹ in crore)
Source: Finance Accounts of the respective years Interest received against these loans remained less than one per cent during the period 2015-16 to 2019-20 and was 0.30 per cent during 2019-20 as against the average cost of borrowings of 7.58 per cent during the year. The table indicated that State borrowings were more expensive than the loans advanced by it.
The table also shows that the total outstanding loans and advances increased from 14 Difference of ₹12 crore with reference to previous year’s closing balance was on account of pro forma adjustments vide footnote (q) of Statement no.18 of Finance Accounts 2015-16. 15 Difference of ₹96 crore with reference to previous year’s closing balance was on account of pro forma adjustments vide footnote (p) of Statement no.18 of Finance Accounts 2018-19. 16 Difference of ₹718 crore with reference to previous year’s closing balance was on account of pro forma adjustments vide footnote (q) of Statement no.18 of Finance Accounts 2019-20 17 Includes ₹126 crore being the irrecoverable loans written off. 18 Includes ₹0.40 crore being the irrecoverable loans written off 19 Includes ₹0.30 crore being the irrecoverable loans written off 20 Interest Received/(Opening balance + Closing balance of Loans and Advances)/2)*100
Quantum of Loans disbursed and recovered
2015-16 2016-17 2017-18 2018-19 2019-20
Opening Balance of loans outstanding 1232014 13010 13877 1516315 1655716
Amount advanced during the year 842 1160 1541 2323 1210
Amount recovered during the year 152 29217 351 21118 29519
Closing Balance of the Loans Outstanding 13010 13878 15067 17275 17472
Net addition 690 868 1190 2112 915
Interest received 32 31 38 41 51
Interest rate on loans and Advances given by the Government20 (in per cent)
0.25 0.23 0.26 0.25 0.30
Rate of Interest paid on the Outstanding borrowings of the Government (in per cent) 7.35 6.92 7.48 7.34 7.58
Difference between the rate of interest paid and interest received (per cent)
7.25 6.69 7.22 7.09 7.28
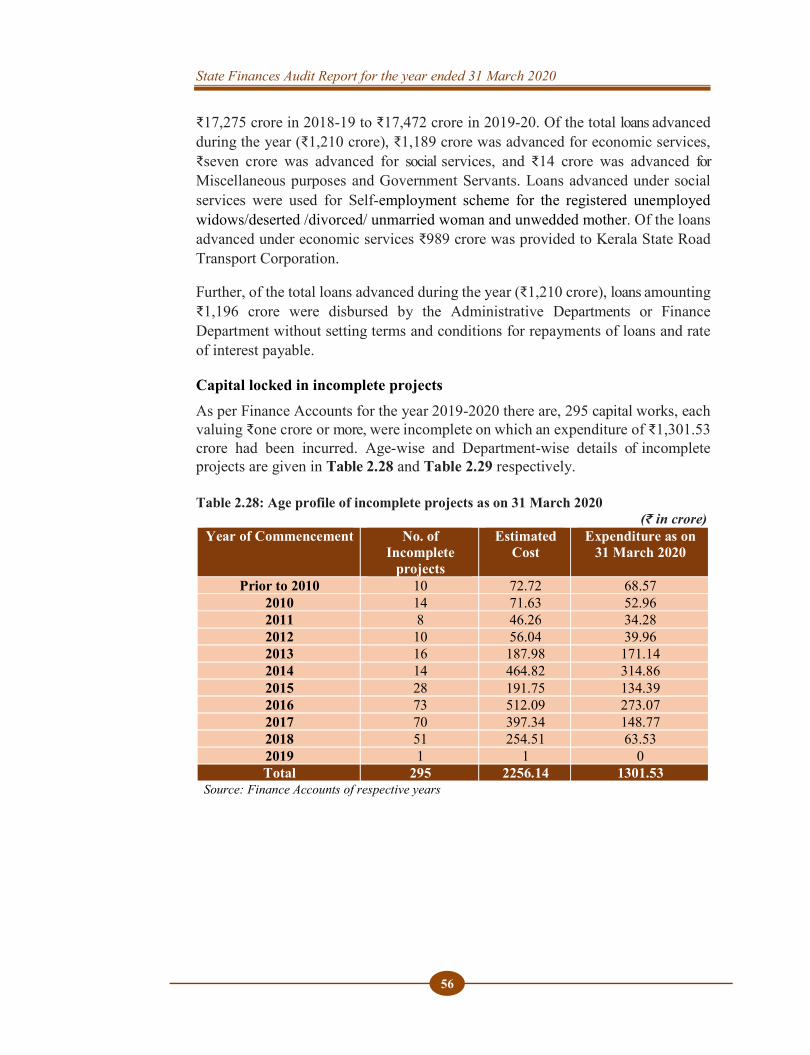
State Finances Audit Report for the year ended 31 March 2020
56
₹17,275 crore in 2018-19 to ₹17,472 crore in 2019-20. Of the total loans advanced during the year (₹1,210 crore), ₹1,189 crore was advanced for economic services, ₹seven crore was advanced for social services, and ₹14 crore was advanced for Miscellaneous purposes and Government Servants. Loans advanced under social services were used for Self-employment scheme for the registered unemployed widows/deserted /divorced/ unmarried woman and unwedded mother. Of the loans advanced under economic services ₹989 crore was provided to Kerala State Road Transport Corporation.
Further, of the total loans advanced during the year (₹1,210 crore), loans amounting ₹1,196 crore were disbursed by the Administrative Departments or Finance Department without setting terms and conditions for repayments of loans and rate of interest payable.
Capital locked in incomplete projects As per Finance Accounts for the year 2019-2020 there are, 295 capital works, each valuing ₹one crore or more, were incomplete on which an expenditure of ₹1,301.53 crore had been incurred. Age-wise and Department-wise details of incomplete projects are given in Table 2.28 and Table 2.29 respectively. Table 2.28: Age profile of incomplete projects as on 31 March 2020
(₹ in crore) Year of Commencement No. of
Incomplete projects
Estimated Cost
Expenditure as on 31 March 2020
Prior to 2010 10 72.72 68.57 2010 14 71.63 52.96 2011 8 46.26 34.28 2012 10 56.04 39.96 2013 16 187.98 171.14 2014 14 464.82 314.86 2015 28 191.75 134.39 2016 73 512.09 273.07 2017 70 397.34 148.77 2018 51 254.51 63.53 2019 1 1 0 Total 295 2256.14 1301.53
Source: Finance Accounts of respective years
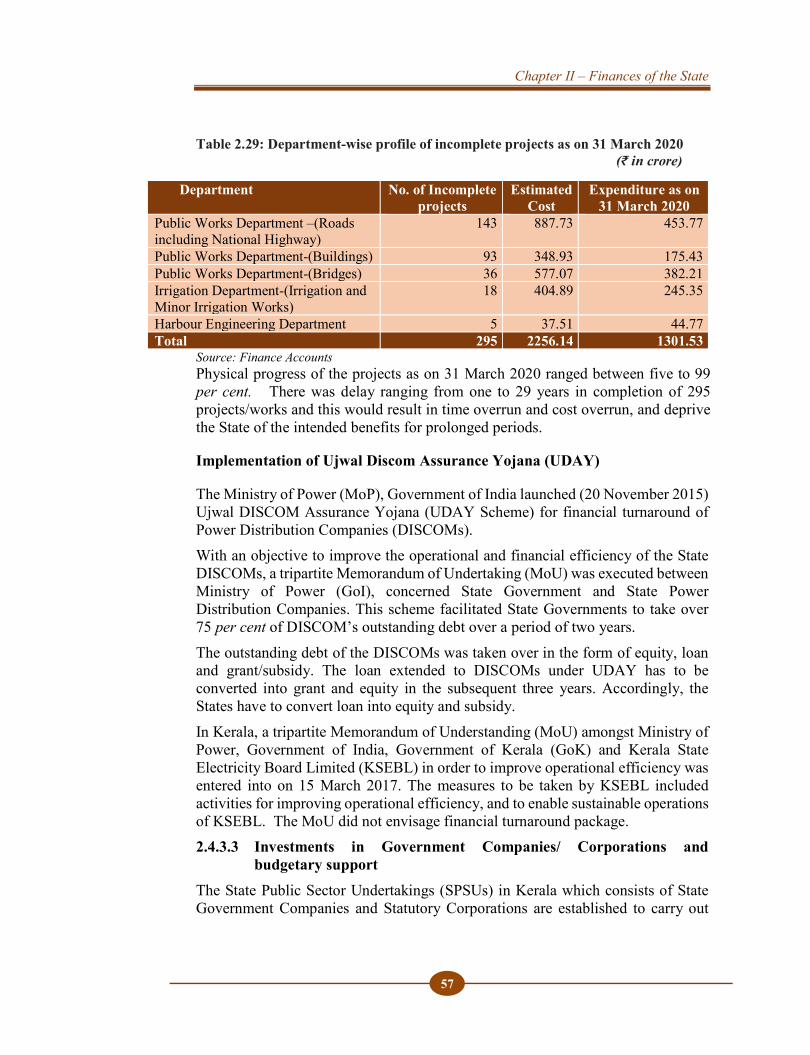
Chapter II – Finances of the State
57
Table 2.29: Department-wise profile of incomplete projects as on 31 March 2020 (₹ in crore)
Source: Finance Accounts Physical progress of the projects as on 31 March 2020 ranged between five to 99 per cent. There was delay ranging from one to 29 years in completion of 295 projects/works and this would result in time overrun and cost overrun, and deprive the State of the intended benefits for prolonged periods.
Implementation of Ujwal Discom Assurance Yojana (UDAY)
The Ministry of Power (MoP), Government of India launched (20 November 2015) Ujwal DISCOM Assurance Yojana (UDAY Scheme) for financial turnaround of Power Distribution Companies (DISCOMs). With an objective to improve the operational and financial efficiency of the State DISCOMs, a tripartite Memorandum of Undertaking (MoU) was executed between Ministry of Power (GoI), concerned State Government and State Power Distribution Companies. This scheme facilitated State Governments to take over 75 per cent of DISCOM’s outstanding debt over a period of two years. The outstanding debt of the DISCOMs was taken over in the form of equity, loan and grant/subsidy. The loan extended to DISCOMs under UDAY has to be converted into grant and equity in the subsequent three years. Accordingly, the States have to convert loan into equity and subsidy. In Kerala, a tripartite Memorandum of Understanding (MoU) amongst Ministry of Power, Government of India, Government of Kerala (GoK) and Kerala State Electricity Board Limited (KSEBL) in order to improve operational efficiency was entered into on 15 March 2017. The measures to be taken by KSEBL included activities for improving operational efficiency, and to enable sustainable operations of KSEBL. The MoU did not envisage financial turnaround package. 2.4.3.3 Investments in Government Companies/ Corporations and
budgetary support The State Public Sector Undertakings (SPSUs) in Kerala which consists of State Government Companies and Statutory Corporations are established to carry out
Department No. of Incomplete projects
Estimated Cost
Expenditure as on 31 March 2020
Public Works Department –(Roads including National Highway)
143 887.73 453.77
Public Works Department-(Buildings) 93 348.93 175.43 Public Works Department-(Bridges) 36 577.07 382.21 Irrigation Department-(Irrigation and Minor Irrigation Works)
18 404.89 245.35
Harbour Engineering Department 5 37.51 44.77 Total 295 2256.14 1301.53
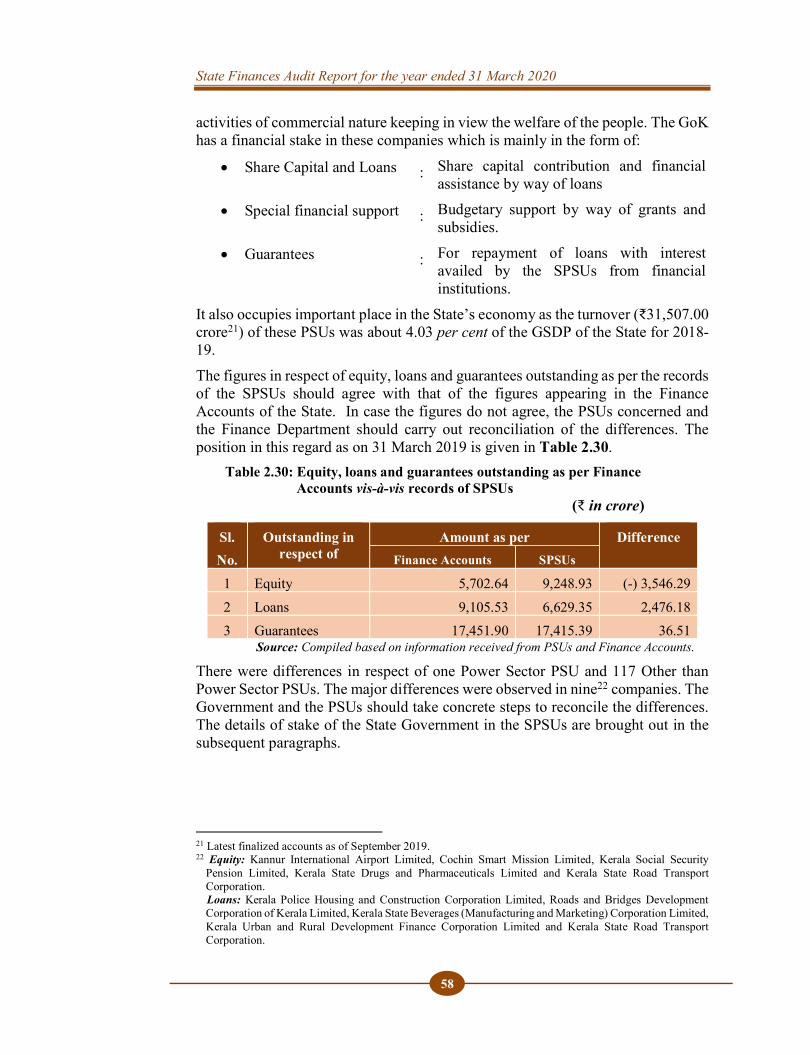
State Finances Audit Report for the year ended 31 March 2020
58
activities of commercial nature keeping in view the welfare of the people. The GoK has a financial stake in these companies which is mainly in the form of:
Share Capital and Loans : Share capital contribution and financial assistance by way of loans
Special financial support : Budgetary support by way of grants and subsidies.
Guarantees : For repayment of loans with interest availed by the SPSUs from financial institutions.
It also occupies important place in the State’s economy as the turnover (₹31,507.00 crore21) of these PSUs was about 4.03 per cent of the GSDP of the State for 2018-19. The figures in respect of equity, loans and guarantees outstanding as per the records of the SPSUs should agree with that of the figures appearing in the Finance Accounts of the State. In case the figures do not agree, the PSUs concerned and the Finance Department should carry out reconciliation of the differences. The position in this regard as on 31 March 2019 is given in Table 2.30.
Table 2.30: Equity, loans and guarantees outstanding as per Finance Accounts vis-à-vis records of SPSUs
(₹ in crore)
Sl. No.
Outstanding in respect of
Amount as per Difference Finance Accounts SPSUs
1 Equity 5,702.64 9,248.93 (-) 3,546.29 2 Loans 9,105.53 6,629.35 2,476.18 3 Guarantees 17,451.90 17,415.39 36.51
Source: Compiled based on information received from PSUs and Finance Accounts.
There were differences in respect of one Power Sector PSU and 117 Other than Power Sector PSUs. The major differences were observed in nine22 companies. The Government and the PSUs should take concrete steps to reconcile the differences. The details of stake of the State Government in the SPSUs are brought out in the subsequent paragraphs.
21 Latest finalized accounts as of September 2019. 22 Equity: Kannur International Airport Limited, Cochin Smart Mission Limited, Kerala Social Security
Pension Limited, Kerala State Drugs and Pharmaceuticals Limited and Kerala State Road Transport Corporation. Loans: Kerala Police Housing and Construction Corporation Limited, Roads and Bridges Development Corporation of Kerala Limited, Kerala State Beverages (Manufacturing and Marketing) Corporation Limited, Kerala Urban and Rural Development Finance Corporation Limited and Kerala State Road Transport Corporation.
Chapter II – Finances of the State
59
(i) Share Capital in the SPSUs As per the Report of the C&AG of India on PSUs for the year ended 2019, there are 14023 PSUs in the State under the audit jurisdiction of the C&AG. The State Government invested ₹38,428.09 crore in these PSUs as at the end of March 2019 as furnished by PSUs in their latest finalized accounts. However, as per the Finance Accounts, there are 110 Government Companies and Statutory Corporations where the Government has invested ₹14,808.17 crore as at the end of 2018-19. In addition to the investments, during 2018-19, the State Government has given grants/ subsidies amounting to ₹1,305.34 crore to 32 PSUs. (ii) Disinvestment/ Closure of SPSUs There was no disinvestment, restructuring and privatisation by the State Government during the year 2018-19. Further, out of 16 non-working PSUs, liquidation process was initiated in respect of four PSUs. (iii) Returns from Government Companies/ Corporations During 2014-15 to 2018-19, the number of PSUs which earned profits ranged between 45 and 55, out of which only seven to 20 PSUs had declared dividend. During 2018-19, against the profit of ₹581.11 crore earned by these entities, ₹12.11 crore was paid by them as dividend. The dividend payment as percentage of paid up capital was very nominal and was 0.13 per cent during 2018-19. The profitability of a PSU is traditionally assessed through return on investment24, return on equity25 and return on capital employed26.
The return on the State Government funds infused in the three Power Sector PSUs in the State ranged between (-) 8.78 per cent and 4.11 per cent during 2014-15 to 2016-17 which reduced to (-) 52.55 per cent in 2017-18 and to (-) 51.57 per cent in 2018-19.
The return on equity in the three Power Sector PSUs was 3.66 per cent in the year 2014-15 and in respect of years from 2015-16 to 2018-19, the return on equity could not be worked out as net income was negative for these years. On the other hand, the return on the capital employed ranged between 0.65 per cent and 9.55 per cent during the period 2014-15 to 2018-19.
All the PSUs other than the Power Sector had negative return on investment which ranged between (-) 25.62 per cent and (-) 11.28 per cent during 2014-15 to 2018-19.
23 Statutory Corporations - 4, non-working Government Companies - 16, working Government Companies - 120. 24 Measures the profit or loss made in a fixed year relating to the amount of money invested in the form of equity and long term loans and is expressed as a percentage of profit to total investment. 25 Measure of performance calculated by dividing net profit by shareholder’s funds. 26 Financial ratio that measures the company’s profitability and the efficiency with which its capital is used and
is calculated by dividing the company’s earnings before interest and taxes by capital employed.

State Finances Audit Report for the year ended 31 March 2020
60
Similarly, the return on equity in the PSUs other than Power Sector was negative as the PSUs incurred losses in all the five years.
The return on capital employed of the PSUs other than Power Sector ranged between 4.08 per cent and 7.56 per cent during the period 2014-15 to 2018-19.
(iv) Loss incurred by the Government Companies/ Corporations During 2018-19, 59 working PSUs incurred loss of ₹3,656.97 crore. Out of this, one Power Sector PSU incurred an overall loss of ₹1,860.42 crore. In respect of the balance loss, the major contributor was Kerala State Road Transport Corporation (₹1,431.29 crore). (v) Erosion of capital in SPSUs Net worth is a measure of what an entity is worth to the owners. A negative net worth indicates that the entire investment by the owners has been wiped out by accumulated losses. As at the end of 2018-19, capital worth ₹5,580.12 crore of 55 PSUs was eroded. While the overall net worth of three Power Sector PSUs was positive during 2014-15 to 2016-17 and was negative during 2017-18 and 2018-19, the net worth of one PSU (₹1,472.08 crore) was eroded. Similarly, the overall net worth of PSUs other than Power Sector was positive in all the years during 2014-15 to 2018-19. However, the net worth of 54 PSUs (₹6,561.12 crore) was eroded as at 31 March 2019. (vi) Analysis of long term loans Assessment of the ability of the SPSUs to service the debt owned by them to the Government, banks and other financial institutions through Interest coverage ratio and Debt Turnover ratio revealed the following:
As at 31 March 2019, out of the three Power Sector PSUs, all three had interest burden. Of these, one had interest coverage ratio of less than one.
The debt-turnover ratio of three Power Sector PSUs had not improved as the compounded annual growth rate of turnover was less than that of debt during 2014-15 to 2018-19.
As at 31 March 2019, 40 out of 62 PSUs had interest coverage ratio of less than one, indicating that these PSUs could not generate sufficient revenues to meet expenses on interest.
The debt-turnover ratio of working PSUs of other than Power Sector had not improved as the compounded annual growth rate of turnover was less than that of debt during 2014-15 to 2018-19.
(vii) Accountability framework and submission of accounts by PSUs and its audit
The process of audit of Government Companies are governed by respective provisions of Section 619 of the Companies Act, 1956 and Sections 139 and 143 of
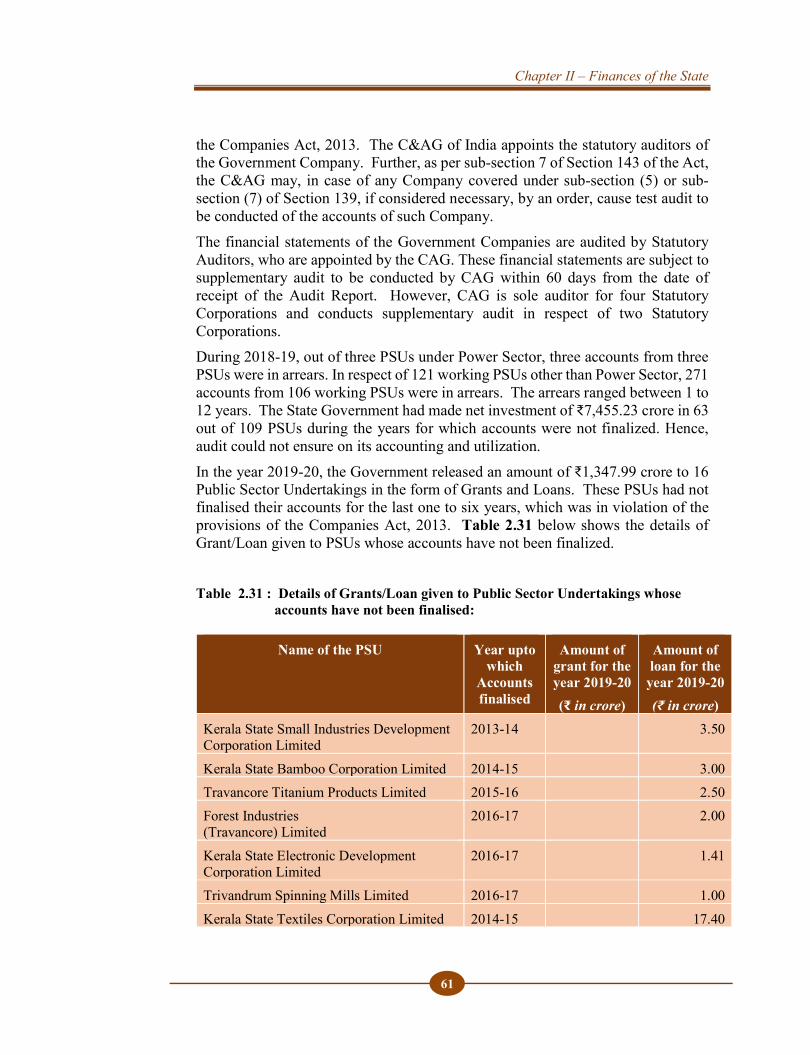
Chapter II – Finances of the State
61
the Companies Act, 2013. The C&AG of India appoints the statutory auditors of the Government Company. Further, as per sub-section 7 of Section 143 of the Act, the C&AG may, in case of any Company covered under sub-section (5) or sub-section (7) of Section 139, if considered necessary, by an order, cause test audit to be conducted of the accounts of such Company. The financial statements of the Government Companies are audited by Statutory Auditors, who are appointed by the CAG. These financial statements are subject to supplementary audit to be conducted by CAG within 60 days from the date of receipt of the Audit Report. However, CAG is sole auditor for four Statutory Corporations and conducts supplementary audit in respect of two Statutory Corporations. During 2018-19, out of three PSUs under Power Sector, three accounts from three PSUs were in arrears. In respect of 121 working PSUs other than Power Sector, 271 accounts from 106 working PSUs were in arrears. The arrears ranged between 1 to 12 years. The State Government had made net investment of ₹7,455.23 crore in 63 out of 109 PSUs during the years for which accounts were not finalized. Hence, audit could not ensure on its accounting and utilization. In the year 2019-20, the Government released an amount of ₹1,347.99 crore to 16 Public Sector Undertakings in the form of Grants and Loans. These PSUs had not finalised their accounts for the last one to six years, which was in violation of the provisions of the Companies Act, 2013. Table 2.31 below shows the details of Grant/Loan given to PSUs whose accounts have not been finalized. Table 2.31 : Details of Grants/Loan given to Public Sector Undertakings whose accounts have not been finalised:
Name of the PSU Year upto which
Accounts finalised
Amount of grant for the year 2019-20 (₹ in crore)
Amount of loan for the
year 2019-20 (₹ in crore)
Kerala State Small Industries Development Corporation Limited
2013-14 3.50
Kerala State Bamboo Corporation Limited 2014-15 3.00 Travancore Titanium Products Limited 2015-16 2.50 Forest Industries (Travancore) Limited
2016-17 2.00
Kerala State Electronic Development Corporation Limited
2016-17 1.41
Trivandrum Spinning Mills Limited 2016-17 1.00 Kerala State Textiles Corporation Limited 2014-15 17.40
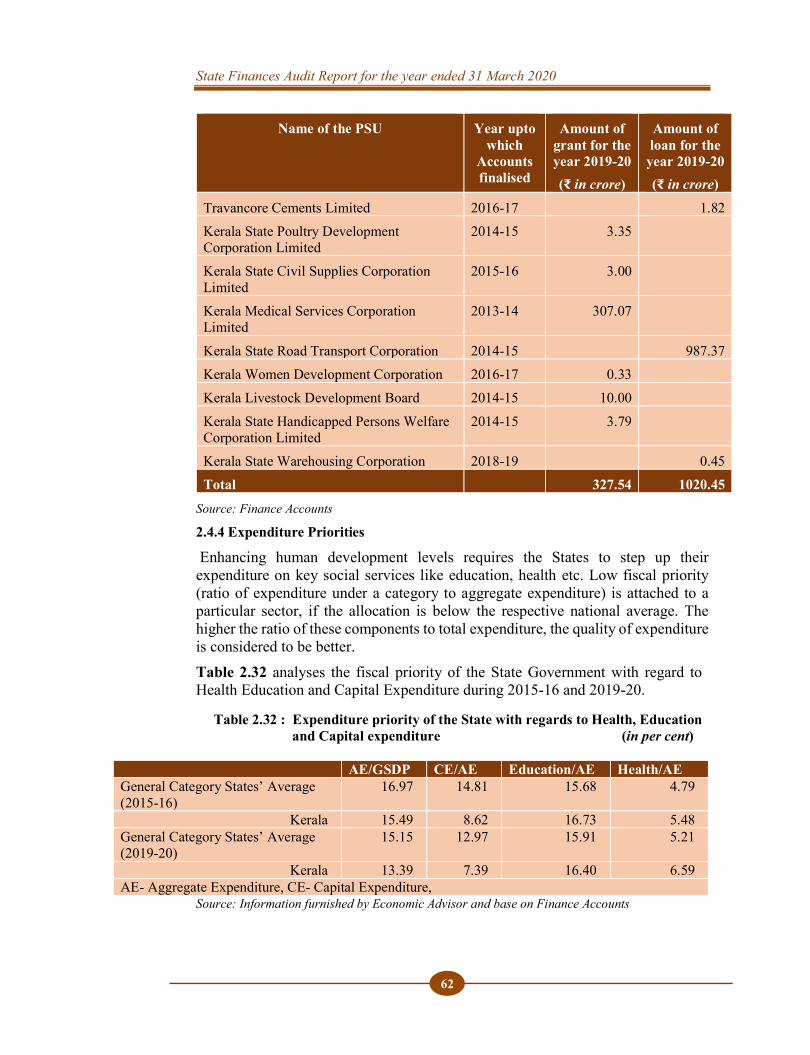
State Finances Audit Report for the year ended 31 March 2020
62
Name of the PSU Year upto which
Accounts finalised
Amount of grant for the year 2019-20 (₹ in crore)
Amount of loan for the
year 2019-20 (₹ in crore)
Travancore Cements Limited 2016-17 1.82 Kerala State Poultry Development Corporation Limited
2014-15 3.35
Kerala State Civil Supplies Corporation Limited
2015-16 3.00
Kerala Medical Services Corporation Limited
2013-14 307.07
Kerala State Road Transport Corporation 2014-15 987.37 Kerala Women Development Corporation 2016-17 0.33 Kerala Livestock Development Board 2014-15 10.00 Kerala State Handicapped Persons Welfare Corporation Limited
2014-15 3.79
Kerala State Warehousing Corporation 2018-19 0.45 Total 327.54 1020.45
Source: Finance Accounts
2.4.4 Expenditure Priorities
Enhancing human development levels requires the States to step up their expenditure on key social services like education, health etc. Low fiscal priority (ratio of expenditure under a category to aggregate expenditure) is attached to a particular sector, if the allocation is below the respective national average. The higher the ratio of these components to total expenditure, the quality of expenditure is considered to be better. Table 2.32 analyses the fiscal priority of the State Government with regard to Health Education and Capital Expenditure during 2015-16 and 2019-20.
Table 2.32 : Expenditure priority of the State with regards to Health, Education and Capital expenditure (in per cent)
AE/GSDP CE/AE Education/AE Health/AE General Category States’ Average (2015-16)
16.97 14.81 15.68 4.79
Kerala 15.49 8.62 16.73 5.48 General Category States’ Average (2019-20)
15.15 12.97 15.91 5.21
Kerala 13.39 7.39 16.40 6.59 AE- Aggregate Expenditure, CE- Capital Expenditure,
Source: Information furnished by Economic Advisor and base on Finance Accounts
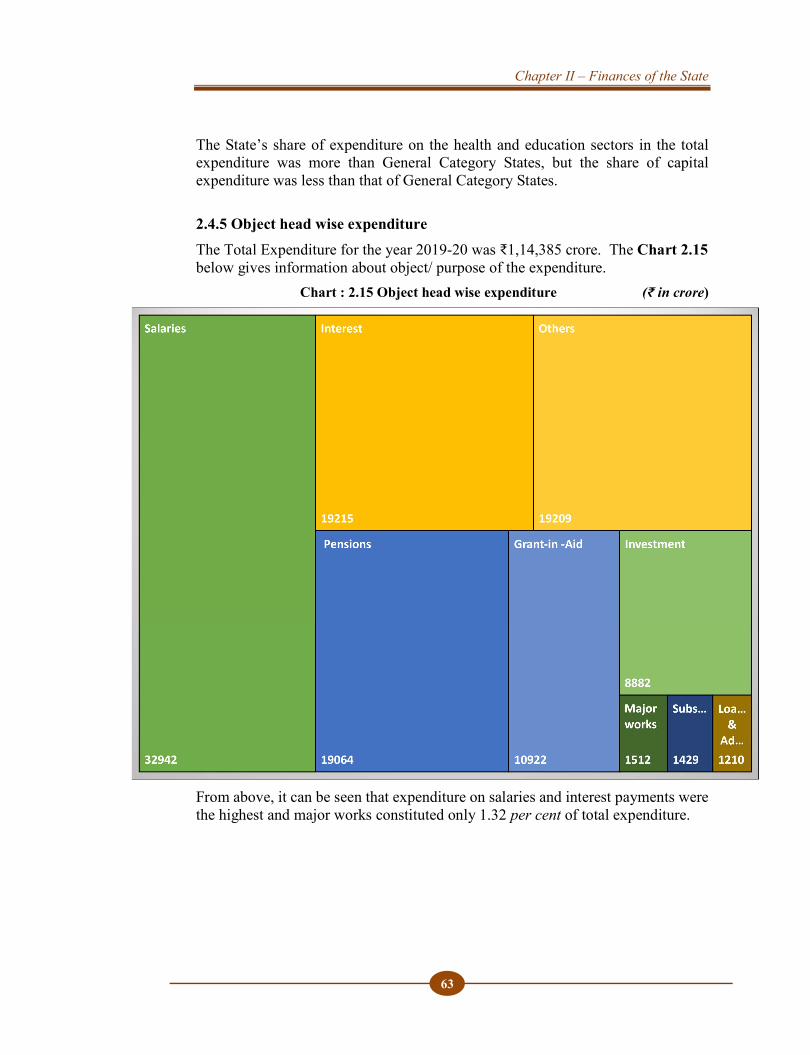
Chapter II – Finances of the State
63
The State’s share of expenditure on the health and education sectors in the total expenditure was more than General Category States, but the share of capital expenditure was less than that of General Category States. 2.4.5 Object head wise expenditure The Total Expenditure for the year 2019-20 was ₹1,14,385 crore. The Chart 2.15 below gives information about object/ purpose of the expenditure.
Chart : 2.15 Object head wise expenditure (₹ in crore)
From above, it can be seen that expenditure on salaries and interest payments were the highest and major works constituted only 1.32 per cent of total expenditure.
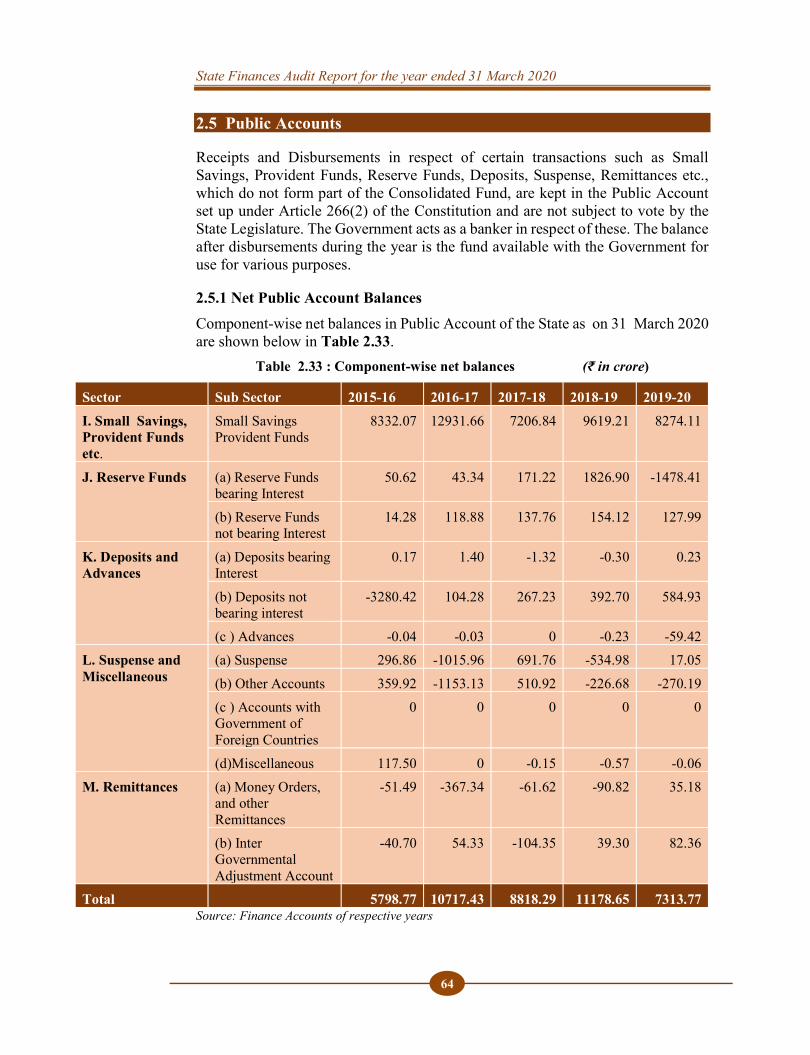
State Finances Audit Report for the year ended 31 March 2020
64
2.5 Public Accounts
Receipts and Disbursements in respect of certain transactions such as Small Savings, Provident Funds, Reserve Funds, Deposits, Suspense, Remittances etc., which do not form part of the Consolidated Fund, are kept in the Public Account set up under Article 266(2) of the Constitution and are not subject to vote by the State Legislature. The Government acts as a banker in respect of these. The balance after disbursements during the year is the fund available with the Government for use for various purposes.
2.5.1 Net Public Account Balances Component-wise net balances in Public Account of the State as on 31 March 2020 are shown below in Table 2.33.
Table 2.33 : Component-wise net balances (₹ in crore)
Sector Sub Sector 2015-16 2016-17 2017-18 2018-19 2019-20 I. Small Savings, Provident Funds etc.
Small Savings Provident Funds
8332.07 12931.66 7206.84 9619.21 8274.11
J. Reserve Funds (a) Reserve Funds bearing Interest
50.62 43.34 171.22 1826.90 -1478.41
(b) Reserve Funds not bearing Interest
14.28 118.88 137.76 154.12 127.99
K. Deposits and Advances
(a) Deposits bearing Interest
0.17 1.40 -1.32 -0.30 0.23
(b) Deposits not bearing interest
-3280.42 104.28 267.23 392.70 584.93
(c ) Advances -0.04 -0.03 0 -0.23 -59.42 L. Suspense and Miscellaneous
(a) Suspense 296.86 -1015.96 691.76 -534.98 17.05 (b) Other Accounts 359.92 -1153.13 510.92 -226.68 -270.19 (c ) Accounts with Government of Foreign Countries
0 0 0 0 0
(d)Miscellaneous 117.50 0 -0.15 -0.57 -0.06 M. Remittances (a) Money Orders,
and other Remittances
-51.49 -367.34 -61.62 -90.82 35.18
(b) Inter Governmental Adjustment Account
-40.70 54.33 -104.35 39.30 82.36
Total 5798.77 10717.43 8818.29 11178.65 7313.77 Source: Finance Accounts of respective years
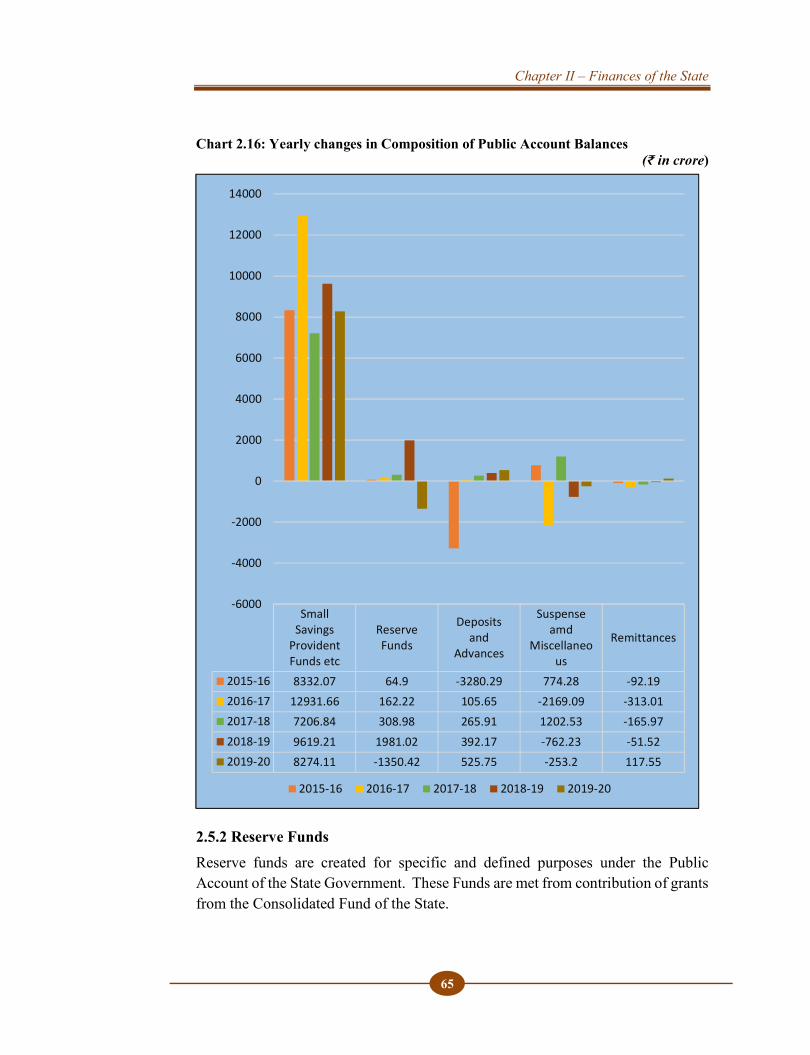
Chapter II – Finances of the State
65
Chart 2.16: Yearly changes in Composition of Public Account Balances (₹ in crore)
2.5.2 Reserve Funds Reserve funds are created for specific and defined purposes under the Public Account of the State Government. These Funds are met from contribution of grants from the Consolidated Fund of the State.
SmallSavings
ProvidentFunds etc
ReserveFunds
Depositsand
Advances
Suspenseamd
Miscellaneous
Remittances
2015-16 8332.07 64.9 -3280.29 774.28 -92.192016-17 12931.66 162.22 105.65 -2169.09 -313.012017-18 7206.84 308.98 265.91 1202.53 -165.972018-19 9619.21 1981.02 392.17 -762.23 -51.522019-20 8274.11 -1350.42 525.75 -253.2 117.55
-6000
-4000
-2000
0
2000
4000
6000
8000
10000
12000
14000
2015-16 2016-17 2017-18 2018-19 2019-20
State Finances Audit Report for the year ended 31 March 2020
66
As on 31 March 2020, the State Government had 16 Reserve Funds with balances amounting to ₹3,113.86 crore. Out of these, two Reserve Funds (₹635.57 crore) are interest bearing, and 14 Reserve Funds (₹2,478.29 crore) are non-interest bearing. Five out of the 14 non-interest bearing funds had nil balance and are inoperative.
Details of Significant Reserve funds are given below:
2.5.2.1 Consolidated Sinking Fund In line with the recommendations of the XII Finance Commission the State Government set up Consolidated Sinking Fund (CSF) with effect from the financial year 2007-2008, according to which the Fund was to be utilised as an amortisation fund for redemption of all outstanding liabilities of the Government commencing from the financial year 2012-13. The Fund was to be credited with contributions from revenue at the prescribed rate and interest accrued on investments made out of the Fund. Only the interest accrued and credited in the Fund was to be utilised for redemption of the outstanding liabilities of the Government. As per paragraph 5 of revised model scheme for the constitution and administration of the Consolidated Sinking Fund of Kerala, the rate of contribution to the Consolidated Sinking Fund was 0.50 per cent of the outstanding liabilities at the end of the previous year.
Against a requirement of ₹1,208.07 crore (0.50 per cent of the outstanding liabilities of ₹2,41,614.51 crore as on 01 April 2019), the State Government did not contribute any amount to the Fund during the year. The State Government has not made any contribution to the Fund since 2012-13.
The State Government stated that (as per Notes to Accounts) as it is continuously running in revenue deficit, the contribution to Consolidated Sinking Fund (CSF) can materialise only from borrowed funds. Government also stated that the yield on Consolidated Sinking Fund investment as against the cost of borrowings would give a negative carry and hence it is not prudent to contribute to CSF, given the high cost of borrowings. However, audit observed that non-contribution to the Consolidated Sinking Fund has reduced the reserve fund for future amortization of loan liability.
At the beginning of the year, ₹2,018.54 crore was available and with the interest received on the investment (₹166.77 crore), the outstanding balance at the end of the year was ₹2,185.31 crore. The outstanding balance is invested in GoI Securities as per the recommendations of the XII Finance Commission.
2.5.2.2 State Disaster Response Fund Government of India (GoI) replaced the erstwhile Calamity Relief Fund with the State Disaster Response Fund (SDRF) with effect from 1 April 2010. In terms of the guidelines of the Fund, the Centre and States are required to contribute to the
Chapter II – Finances of the State
67
Fund in the certain proportion. The contributions are to be transferred to the Public Account to Major Head-8121. Expenditure during the year is incurred by operating Major Head -2245. The State Governments are required to pay interest to the SDRF at the rate applicable to overdrafts under overdraft Regulation Guidelines of the RBI. The interest is to be credited on a half yearly basis. The accretions to the SDRF together with the income earned on the investment of SDRF are to be invested in Central Government dated Securities, auctioned Treasury Bills and other interest earning deposits with Scheduled Commercial Banks. The SDRF is to be used only for meeting the expenditure for providing immediate relief to the victims of a disaster and the provision for disaster preparedness, restoration, reconstruction and mitigation should not be a part of SDRF. Such expenditure has to be built into the normal budgetary heads/ State Plan Funds, etc. The size of the Fund for Kerala for the year 2019-20 was ₹225 crore, 75 per cent (₹168.75 crore) of which was to be contributed by the Central Government and 25 per cent (₹56.25 crore) by the State Government.
During the year, an amount of ₹249.27 crore was credited to the Fund (Central share of ₹136.65 crore after adjusting excess amount of ₹32.10 crore which was released in 2018-19, ₹88.35 crore of State share and ₹24.27 crore on account of interest on uninvested balances for the years 2015-16 to 2017-18).
After setting off the expenditure for disaster relief operations to the extent of ₹1,811.64 crore, the balance in SDRF as on 31 March 2020 is ₹551.61 crore.
According to the guidelines issued by the Government of India, the accretions to SDRF are to be invested in GoI securities/ Treasury Bills/ interest earning deposits with scheduled commercial Banks by the State Executive Committee constituted for the management of the fund. However, this was not done till date.
2.5.2.3 Guarantee Redemption Fund As per recommendations of the XII Finance Commission, the State Government is required to constitute ‘Guarantee Redemption Fund’ for meeting the payment obligations arising out of the guarantees issued by the Government in respect of bonds issued and other borrowings by the State Public Sector Undertakings or other Bodies and invoked by the beneficiaries. The accumulations in the Fund are to be utilised only towards payment of the guarantees issued by the Government and not paid by the institutions on whose behalf guarantee was issued. However, Government of Kerala has not established Guarantee Redemption Fund. The Fund is to be operated outside the State Government account and administered by the Reserve Bank of India. Under the guidelines, the State Government is required to make minimum annual contribution of 0.50 per cent of outstanding guarantee at the beginning of the year. The amount to be contributed by the State Government in the Fund during the year is ₹134.17 crore.

State Finances Audit Report for the year ended 31 March 2020
68
In terms of the Kerala Ceiling on Government Guarantees Act, 2003 the guarantee commission received annually are to be transferred to the Public Account and these contributions shall form the corpus of the Guarantee Redemption Fund (GRF) under Public Account of the State. As the State Government has not constituted GRF as per para 6 of the Kerala Ceiling on Government Guarantees Act, 2003 and RBI guidelines, Guarantee commission amounting to ₹1,250.59 crore collected during 2003-04 to 2019-20 (this includes ₹150.80 crore for the year 2019-20) had not been credited to the Fund but treated as non-tax revenue and used for meeting the revenue expenditure of Government. Non-crediting of guarantee commission collected to the GRF resulted in understatement of revenue expenditure to that extent. State Government replied (April 2021) that fund rules for constitution of Guarantee Redemption Fund is in the final stages and would be notified shortly. As and when the Guarantee Redemption Fund is constituted, immediate action will be taken to credit the commission in the fund. 2.5.2.4 Non discharge of Interest liability on Reserve Funds and Deposits The interest liabilities in respect of Reserve Funds bearing interest and Deposits bearing interest under sectors J and K respectively of the Public Accounts are annual liabilities that the State Government is required to discharge. An amount of ₹24.27 crore was adjusted during the year towards the arrears of interest payable by Government on the uninvested balances for the earlier years from 2015-16 to 2017-18 under State Disaster Response Fund (SDRF). However, the State Government has not made any Budget provision/ adjustments of ₹144.32 crore for interest on the uninvested SDRF amount (as per interest rate applicable to overdraft) during the year 2019-20. Consequent to the non-provision/non-payment of interest, Revenue Expenditure was understated by ₹144.32 crore. The State Government replied (April 2021) that the interest portion of ₹171.85 crore pertaining to the uninvested balances of SDRF for the years 2018-19 and 2019-20 has been transferred to the SDRF by placing it in the Supplementary Demands for Grants(SDG) of January 2021. However the fact remains that the Revenue Expenditure was understated by ₹144.32 crore during the year 2019-20.
2.6 Debt Management Debt management is the process of establishing and executing a strategy for managing the Government’s debt in order to raise the required amount of funding, achieve its risk and cost objectives, and to meet any other sovereign debt management goals that the Government may have set through enactment or any other annual budget announcements.
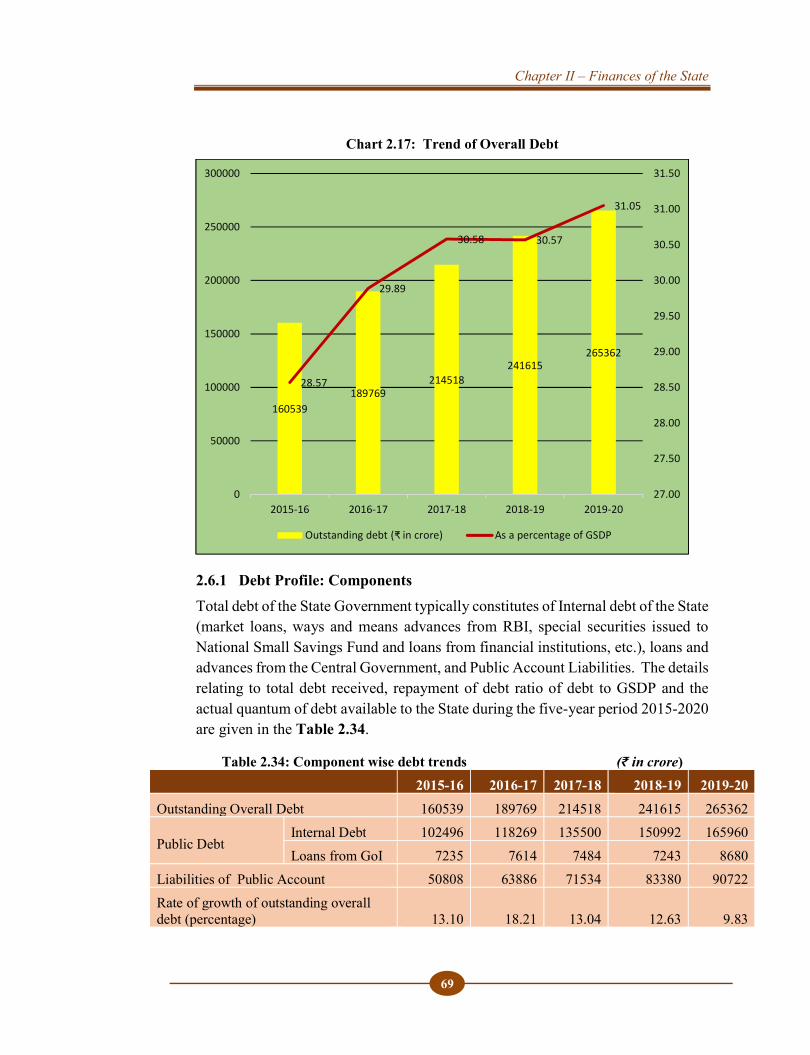
Chapter II – Finances of the State
69
Chart 2.17: Trend of Overall Debt
2.6.1 Debt Profile: Components Total debt of the State Government typically constitutes of Internal debt of the State (market loans, ways and means advances from RBI, special securities issued to National Small Savings Fund and loans from financial institutions, etc.), loans and advances from the Central Government, and Public Account Liabilities. The details relating to total debt received, repayment of debt ratio of debt to GSDP and the actual quantum of debt available to the State during the five-year period 2015-2020 are given in the Table 2.34.
Table 2.34: Component wise debt trends (₹ in crore) 2015-16 2016-17 2017-18 2018-19 2019-20
Outstanding Overall Debt 160539 189769 214518 241615 265362
Public Debt Internal Debt 102496 118269 135500 150992 165960 Loans from GoI 7235 7614 7484 7243 8680
Liabilities of Public Account 50808 63886 71534 83380 90722 Rate of growth of outstanding overall debt (percentage) 13.10 18.21 13.04 12.63 9.83
160539189769
214518241615
265362
28.57
29.89
30.58 30.57
31.05
27.00
27.50
28.00
28.50
29.00
29.50
30.00
30.50
31.00
31.50
0
50000
100000
150000
200000
250000
300000
2015-16 2016-17 2017-18 2018-19 2019-20
Outstanding debt (₹ in crore) As a percentage of GSDP
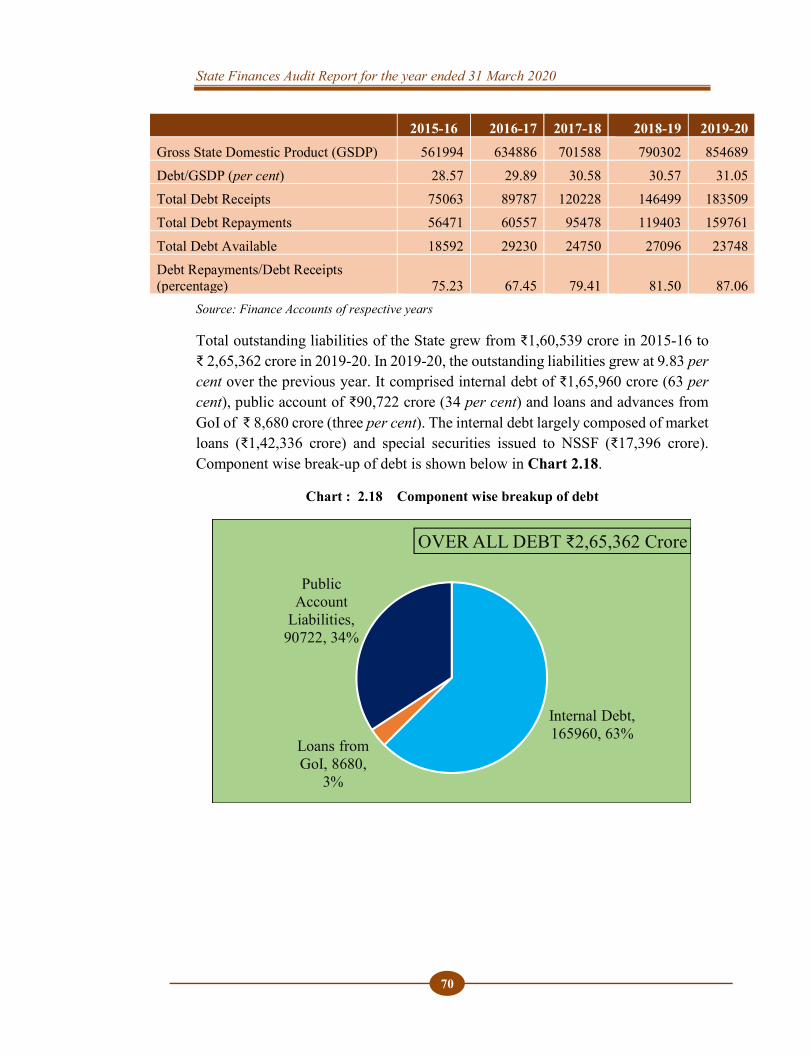
State Finances Audit Report for the year ended 31 March 2020
70
2015-16 2016-17 2017-18 2018-19 2019-20 Gross State Domestic Product (GSDP) 561994 634886 701588 790302 854689 Debt/GSDP (per cent) 28.57 29.89 30.58 30.57 31.05 Total Debt Receipts 75063 89787 120228 146499 183509 Total Debt Repayments 56471 60557 95478 119403 159761 Total Debt Available 18592 29230 24750 27096 23748 Debt Repayments/Debt Receipts (percentage) 75.23 67.45 79.41 81.50 87.06
Source: Finance Accounts of respective years
Total outstanding liabilities of the State grew from ₹1,60,539 crore in 2015-16 to ₹ 2,65,362 crore in 2019-20. In 2019-20, the outstanding liabilities grew at 9.83 per cent over the previous year. It comprised internal debt of ₹1,65,960 crore (63 per cent), public account of ₹90,722 crore (34 per cent) and loans and advances from GoI of ₹ 8,680 crore (three per cent). The internal debt largely composed of market loans (₹1,42,336 crore) and special securities issued to NSSF (₹17,396 crore). Component wise break-up of debt is shown below in Chart 2.18.
Chart : 2.18 Component wise breakup of debt
Internal Debt, 165960, 63%
Loans from GoI, 8680,
3%
Public Account
Liabilities, 90722, 34%
OVER ALL DEBT ₹2,65,362 Crore
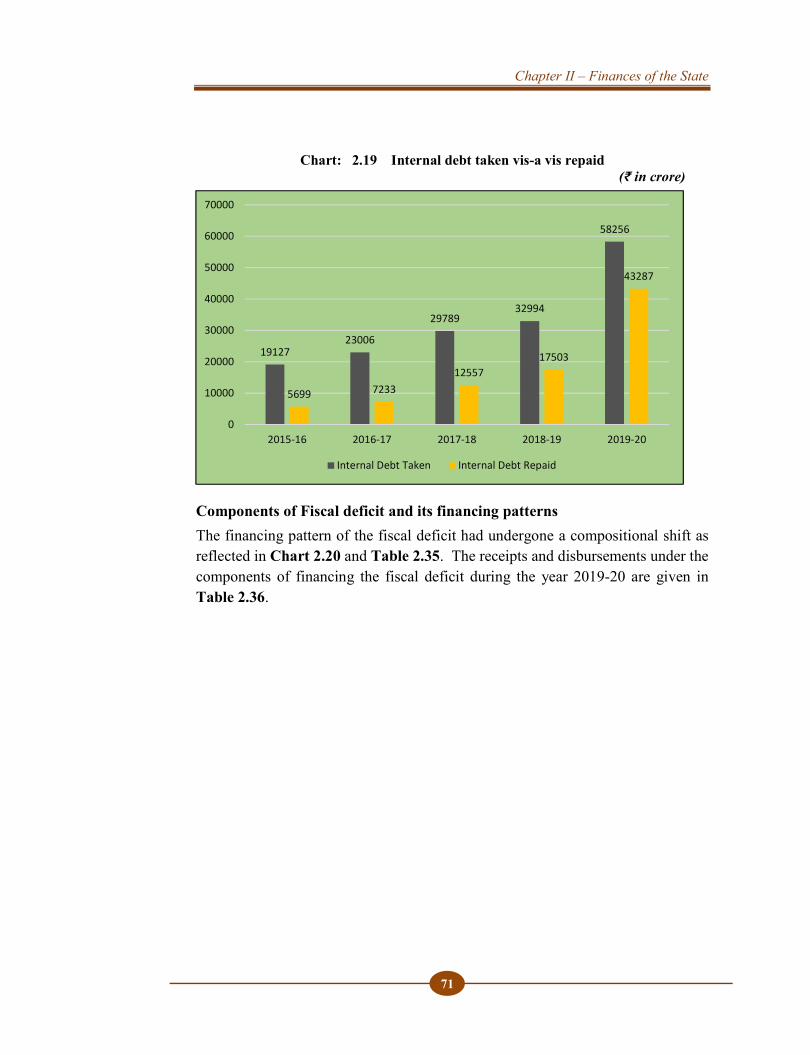
Chapter II – Finances of the State
71
Chart: 2.19 Internal debt taken vis-a vis repaid
(₹ in crore)
Components of Fiscal deficit and its financing patterns The financing pattern of the fiscal deficit had undergone a compositional shift as reflected in Chart 2.20 and Table 2.35. The receipts and disbursements under the components of financing the fiscal deficit during the year 2019-20 are given in Table 2.36.
1912723006
2978932994
58256
5699 723312557
17503
43287
0
10000
20000
30000
40000
50000
60000
70000
2015-16 2016-17 2017-18 2018-19 2019-20
Internal Debt Taken Internal Debt Repaid
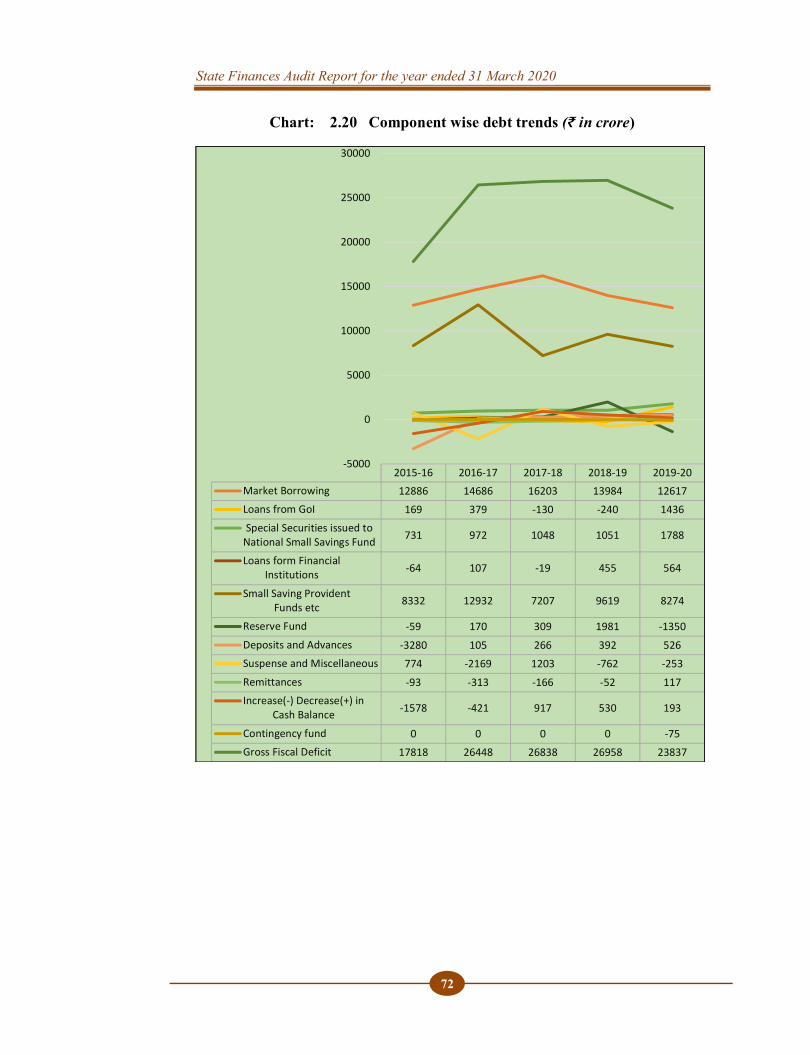
State Finances Audit Report for the year ended 31 March 2020
72
Chart: 2.20 Component wise debt trends (₹ in crore)
2015-16 2016-17 2017-18 2018-19 2019-20Market Borrowing 12886 14686 16203 13984 12617Loans from GoI 169 379 -130 -240 1436Special Securities issued to
National Small Savings Fund 731 972 1048 1051 1788
Loans form FinancialInstitutions -64 107 -19 455 564
Small Saving ProvidentFunds etc 8332 12932 7207 9619 8274
Reserve Fund -59 170 309 1981 -1350Deposits and Advances -3280 105 266 392 526Suspense and Miscellaneous 774 -2169 1203 -762 -253Remittances -93 -313 -166 -52 117Increase(-) Decrease(+) in
Cash Balance -1578 -421 917 530 193
Contingency fund 0 0 0 0 -75Gross Fiscal Deficit 17818 26448 26838 26958 23837
-5000
0
5000
10000
15000
20000
25000
30000
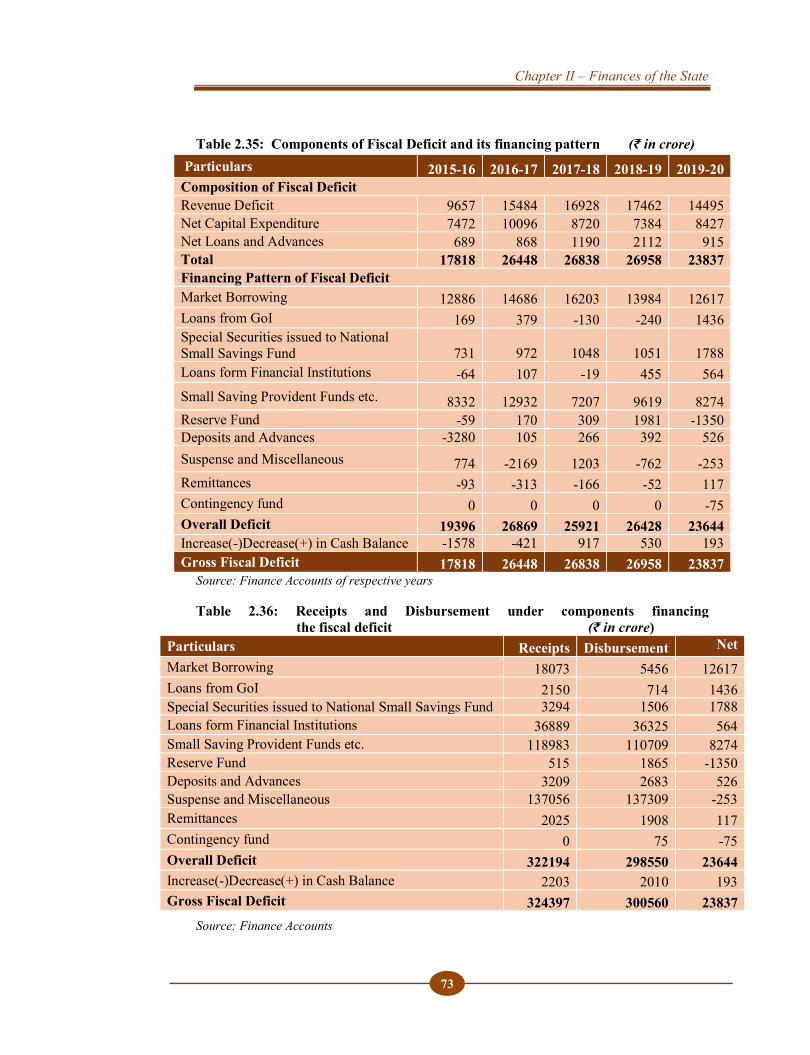
Chapter II – Finances of the State
73
Table 2.35: Components of Fiscal Deficit and its financing pattern (₹ in crore) Particulars 2015-16 2016-17 2017-18 2018-19 2019-20 Composition of Fiscal Deficit Revenue Deficit 9657 15484 16928 17462 14495 Net Capital Expenditure 7472 10096 8720 7384 8427 Net Loans and Advances 689 868 1190 2112 915 Total 17818 26448 26838 26958 23837 Financing Pattern of Fiscal Deficit Market Borrowing 12886 14686 16203 13984 12617 Loans from GoI 169 379 -130 -240 1436 Special Securities issued to National Small Savings Fund 731 972 1048 1051 1788 Loans form Financial Institutions -64 107 -19 455 564 Small Saving Provident Funds etc. 8332 12932 7207 9619 8274 Reserve Fund -59 170 309 1981 -1350 Deposits and Advances -3280 105 266 392 526 Suspense and Miscellaneous 774 -2169 1203 -762 -253 Remittances -93 -313 -166 -52 117 Contingency fund 0 0 0 0 -75 Overall Deficit 19396 26869 25921 26428 23644 Increase(-)Decrease(+) in Cash Balance -1578 -421 917 530 193 Gross Fiscal Deficit 17818 26448 26838 26958 23837
Source: Finance Accounts of respective years Table 2.36: Receipts and Disbursement under components financing the fiscal deficit (₹ in crore)
Particulars Receipts Disbursement Net Market Borrowing 18073 5456 12617 Loans from GoI 2150 714 1436 Special Securities issued to National Small Savings Fund 3294 1506 1788 Loans form Financial Institutions 36889 36325 564 Small Saving Provident Funds etc. 118983 110709 8274 Reserve Fund 515 1865 -1350 Deposits and Advances 3209 2683 526 Suspense and Miscellaneous 137056 137309 -253 Remittances 2025 1908 117 Contingency fund 0 75 -75 Overall Deficit 322194 298550 23644 Increase(-)Decrease(+) in Cash Balance 2203 2010 193 Gross Fiscal Deficit 324397 300560 23837
Source: Finance Accounts
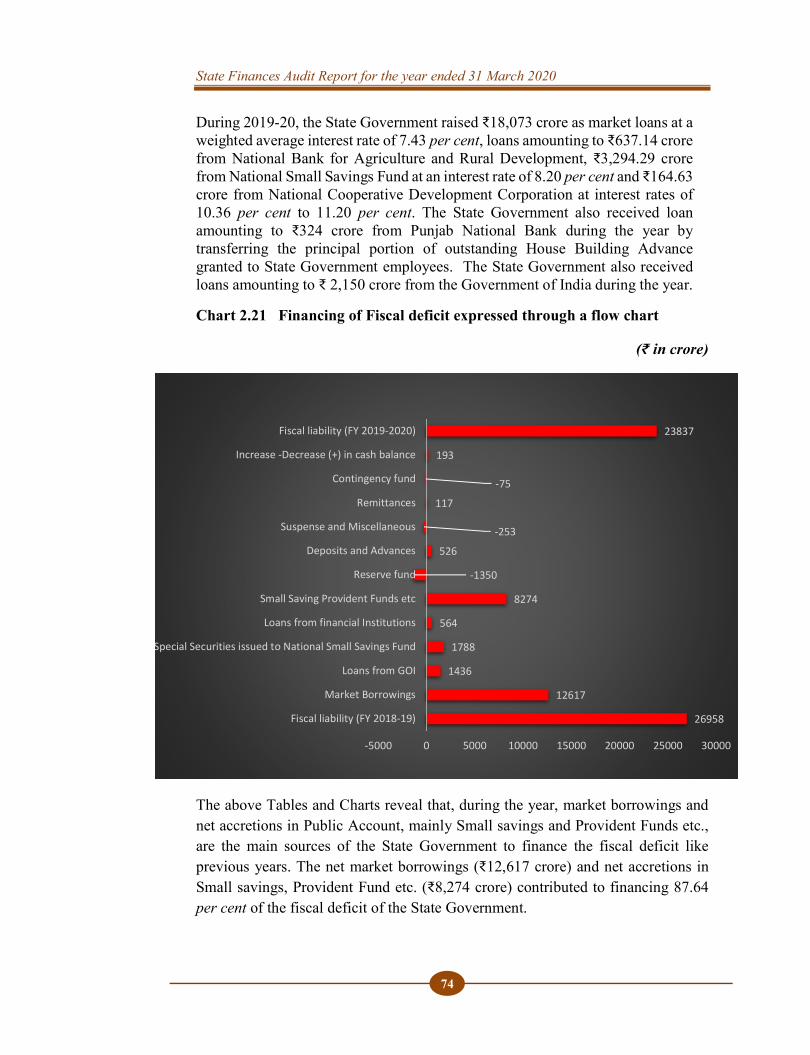
State Finances Audit Report for the year ended 31 March 2020
74
During 2019-20, the State Government raised ₹18,073 crore as market loans at a weighted average interest rate of 7.43 per cent, loans amounting to ₹637.14 crore from National Bank for Agriculture and Rural Development, ₹3,294.29 crore from National Small Savings Fund at an interest rate of 8.20 per cent and ₹164.63 crore from National Cooperative Development Corporation at interest rates of 10.36 per cent to 11.20 per cent. The State Government also received loan amounting to ₹324 crore from Punjab National Bank during the year by transferring the principal portion of outstanding House Building Advance granted to State Government employees. The State Government also received loans amounting to ₹ 2,150 crore from the Government of India during the year.
Chart 2.21 Financing of Fiscal deficit expressed through a flow chart
(₹ in crore)
The above Tables and Charts reveal that, during the year, market borrowings and net accretions in Public Account, mainly Small savings and Provident Funds etc., are the main sources of the State Government to finance the fiscal deficit like previous years. The net market borrowings (₹12,617 crore) and net accretions in Small savings, Provident Fund etc. (₹8,274 crore) contributed to financing 87.64 per cent of the fiscal deficit of the State Government.
26958
12617
1436
1788
564
8274
-1350
526
-253
117
-75
193
23837
-5000 0 5000 10000 15000 20000 25000 30000
Fiscal liability (FY 2018-19)
Market Borrowings
Loans from GOI
Special Securities issued to National Small Savings Fund
Loans from financial Institutions
Small Saving Provident Funds etc
Reserve fund
Deposits and Advances
Suspense and Miscellaneous
Remittances
Contingency fund
Increase -Decrease (+) in cash balance
Fiscal liability (FY 2019-2020)
Chapter II – Finances of the State
75
2.6.2 Off-budget borrowings The borrowings of the State Government are governed by Article 293(1) of the Constitution of India, under which the State Governments can borrow money within the territory of India upon security of the Consolidated Fund of the State. The limits on such borrowings are regulated under Article 293(3) of the Constitution of India under which the State must obtain prior consent of the Government of India (GoI) to raise any loan. The State Government is, therefore, required to furnish to GoI, the financial statements showing the estimates of receipts and repayments of all sources of borrowings including open market borrowings, other liabilities arising out of Public Account transfers, etc. based on which the GoI gives the consent for raising loans and fixes the borrowing ceiling for the State Government. GoI had fixed Net Borrowing of the State for 2019-20 in line with the recommendations of Finance Commission at three per cent of the estimated GSDP in April 2019. Thereafter, in February 2020, GoI allowed an additional borrowing of ₹1,471 crore in 2019-20 to the State as onetime special dispensation, beyond the State’s eligibility of three per cent of estimated GSDP.
Off-budget borrowing refers to use of those financial resources by the State Government for meeting expenditure requirements in a particular year or years, which are not reflected in the budget for that year or those years, for seeking grant/ appropriation. Hence, these off-budget borrowings remain outside Legislative control. They are financed through State Government owned or controlled public sector enterprises or departmental commercial undertakings, which raise the resources through market borrowings on behalf of the State Government. However, the State Government has to repay and service the debt from its budget.
Audit noticed instances where the State Government of Kerala resorted to off-budget borrowing through statutory body/ State Government Company viz. Kerala Infrastructure Investment Fund Board (KIIFB) and Kerala Social Security Pension Limited (KSSPL) amounting to ₹1,930.04 crore and ₹6,843.65 crore respectively for financing its capital as well as revenue spending during the year 2019-20. These two entities borrow funds for financing various Government Schemes and Government projects, the expenditure on which are not disclosed in the budget or in the Finance Accounts of the State. In terms of revenue spending, off-budget borrowing was used for financing social security pension schemes including welfare pensions through borrowings by KSSPL. In terms of capital spending, off-budget borrowing was used for financing critical and large infrastructure projects in the State through borrowings by KIIFB.

State Finances Audit Report for the year ended 31 March 2020
76
Off-budget borrowing for capital spending being resorted through KIIFB The Kerala Infrastructure Investment Fund Board (KIIFB) is a statutory body constituted (November 1999) and controlled by the State Government under the Kerala Infrastructure Investment Fund (KIIF)Act, 1999 to manage the Kerala Infrastructure Investment fund with the objective of providing investment for critical and large infrastructure projects in Kerala. Every year the State Government sets apart petroleum cess and a share of Motor Vehicle Tax (MVT) collected to KIIFB through regular budget provision under capital account. As per section 8 of the KIIF (Amendment) Act, 2016, the share of MVT to be paid is 10 per cent for the first year (2016-17) and increased by 10 per cent every year up to 50 per cent of the tax in the fifth year. The State Government has set apart ₹5,572.85 crore to KIIFB as petroleum cess and share of MVT till 2019-20 as shown in the Table 2.37 given below.
Table 2.37: Details of funds received from State Government. (₹ in crore)
Head of account 2016-17 2017-18 2018-19 2019-20 Total 5475-00-115-97- Share of KIIFB from cess on petrol and diesel
448.10 421.19 501.82 550.00 1921.11
5475-00-115-98- Share of KIIFB from Motor Vehicle Tax
281.43 621.45 1098.86 1650.00 3651.74
Grand Total 729.53 1042.64 1600.68 2200.00 5572.85 Source: Details furnished by KIIFB
In addition to petroleum cess and share of Motor Vehicle Tax, the State Government had also provided additional funds as Corpus fund under Major Infrastructure Development Projects and Technical Assistance Fund as shown in Table 2.38 given below. Table 2.38 : Details of additional funds received from State Government. (₹ in crore)
Head of account 2015-16 2016-17 2017-18 2018-19 2019-20 Total 3475-00-800-96 Technical Assistance Fund
- - 58.25 15.89 - 74.14
5475-00-800-92 Major Infrastructure Development Projects
873.85 1624.56 - - - 2498.41
Grand Total 873.85 1624.56 58.25 15.89 - 2572.55 Source: Details furnished by KIIFB KIIFB had incurred an expenditure of ₹5,014.17 crore for various Government approved infrastructure projects till 2019-20, which are not disclosed in the budget
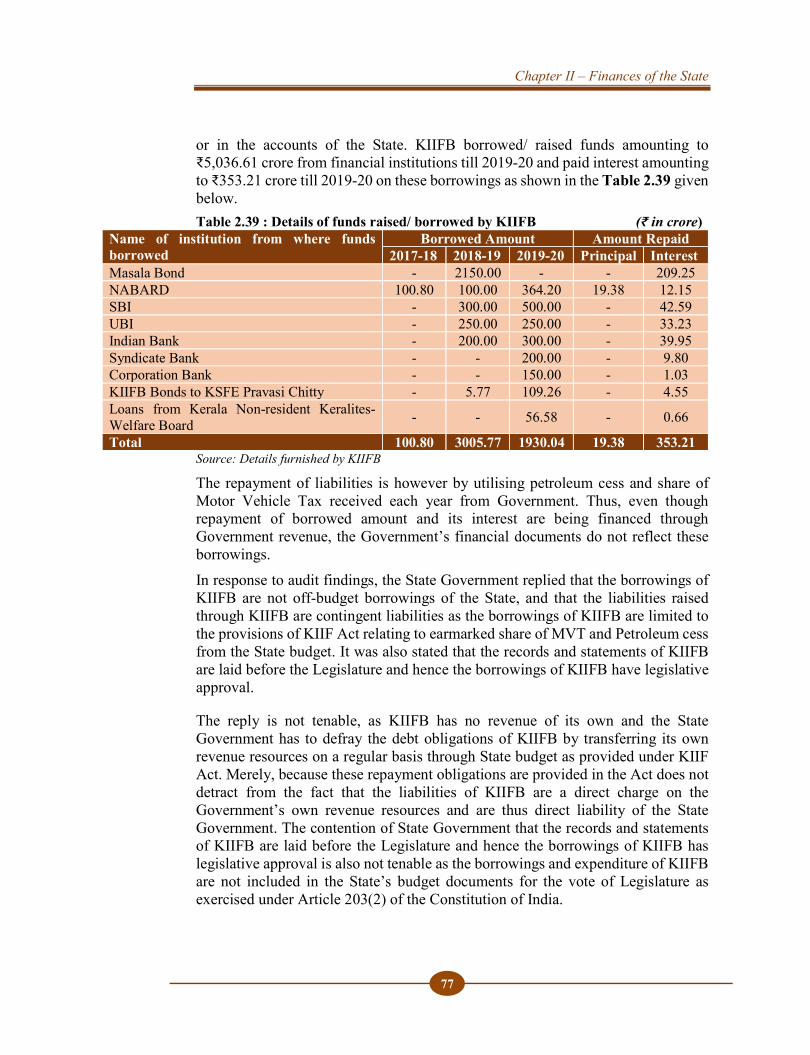
Chapter II – Finances of the State
77
or in the accounts of the State. KIIFB borrowed/ raised funds amounting to ₹5,036.61 crore from financial institutions till 2019-20 and paid interest amounting to ₹353.21 crore till 2019-20 on these borrowings as shown in the Table 2.39 given below. Table 2.39 : Details of funds raised/ borrowed by KIIFB (₹ in crore)
Name of institution from where funds borrowed
Borrowed Amount Amount Repaid 2017-18 2018-19 2019-20 Principal Interest
Masala Bond - 2150.00 - - 209.25 NABARD 100.80 100.00 364.20 19.38 12.15 SBI - 300.00 500.00 - 42.59 UBI - 250.00 250.00 - 33.23 Indian Bank - 200.00 300.00 - 39.95 Syndicate Bank - - 200.00 - 9.80 Corporation Bank - - 150.00 - 1.03 KIIFB Bonds to KSFE Pravasi Chitty - 5.77 109.26 - 4.55 Loans from Kerala Non-resident Keralites-Welfare Board - - 56.58 - 0.66
Total 100.80 3005.77 1930.04 19.38 353.21 Source: Details furnished by KIIFB
The repayment of liabilities is however by utilising petroleum cess and share of Motor Vehicle Tax received each year from Government. Thus, even though repayment of borrowed amount and its interest are being financed through Government revenue, the Government’s financial documents do not reflect these borrowings. In response to audit findings, the State Government replied that the borrowings of KIIFB are not off-budget borrowings of the State, and that the liabilities raised through KIIFB are contingent liabilities as the borrowings of KIIFB are limited to the provisions of KIIF Act relating to earmarked share of MVT and Petroleum cess from the State budget. It was also stated that the records and statements of KIIFB are laid before the Legislature and hence the borrowings of KIIFB have legislative approval.
The reply is not tenable, as KIIFB has no revenue of its own and the State Government has to defray the debt obligations of KIIFB by transferring its own revenue resources on a regular basis through State budget as provided under KIIF Act. Merely, because these repayment obligations are provided in the Act does not detract from the fact that the liabilities of KIIFB are a direct charge on the Government’s own revenue resources and are thus direct liability of the State Government. The contention of State Government that the records and statements of KIIFB are laid before the Legislature and hence the borrowings of KIIFB has legislative approval is also not tenable as the borrowings and expenditure of KIIFB are not included in the State’s budget documents for the vote of Legislature as exercised under Article 203(2) of the Constitution of India.
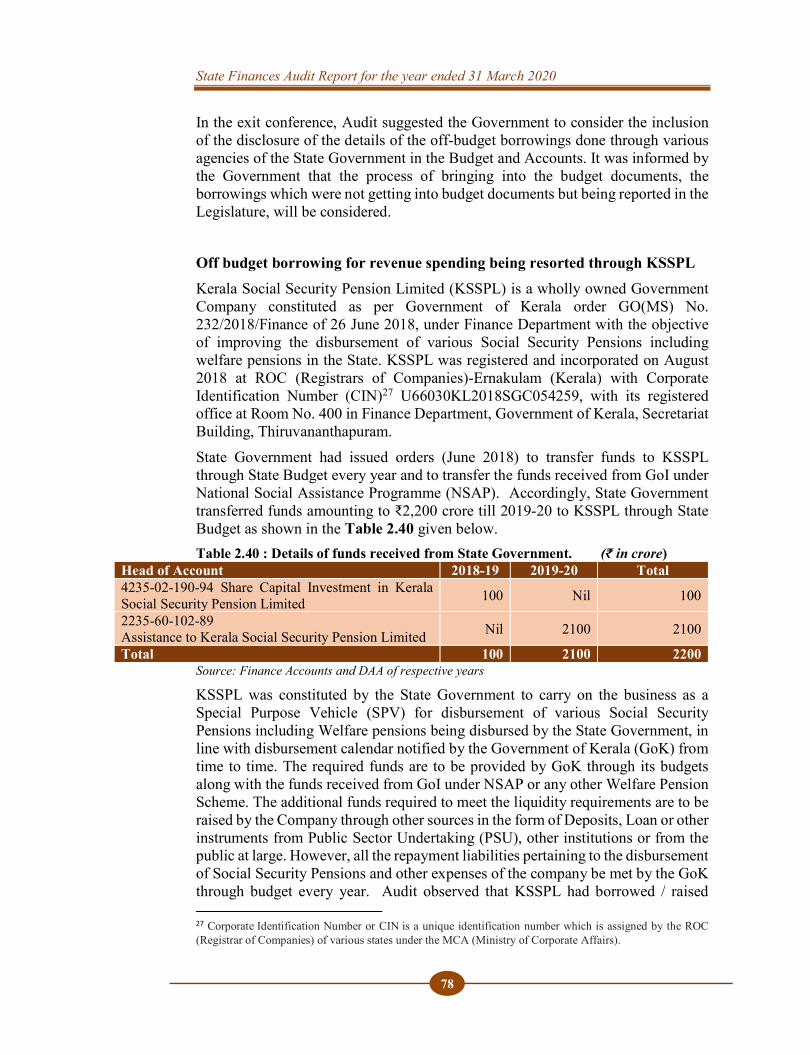
State Finances Audit Report for the year ended 31 March 2020
78
In the exit conference, Audit suggested the Government to consider the inclusion of the disclosure of the details of the off-budget borrowings done through various agencies of the State Government in the Budget and Accounts. It was informed by the Government that the process of bringing into the budget documents, the borrowings which were not getting into budget documents but being reported in the Legislature, will be considered.
Off budget borrowing for revenue spending being resorted through KSSPL Kerala Social Security Pension Limited (KSSPL) is a wholly owned Government Company constituted as per Government of Kerala order GO(MS) No. 232/2018/Finance of 26 June 2018, under Finance Department with the objective of improving the disbursement of various Social Security Pensions including welfare pensions in the State. KSSPL was registered and incorporated on August 2018 at ROC (Registrars of Companies)-Ernakulam (Kerala) with Corporate Identification Number (CIN)27 U66030KL2018SGC054259, with its registered office at Room No. 400 in Finance Department, Government of Kerala, Secretariat Building, Thiruvananthapuram. State Government had issued orders (June 2018) to transfer funds to KSSPL through State Budget every year and to transfer the funds received from GoI under National Social Assistance Programme (NSAP). Accordingly, State Government transferred funds amounting to ₹2,200 crore till 2019-20 to KSSPL through State Budget as shown in the Table 2.40 given below. Table 2.40 : Details of funds received from State Government. (₹ in crore)
Head of Account 2018-19 2019-20 Total 4235-02-190-94 Share Capital Investment in Kerala Social Security Pension Limited 100 Nil 100
2235-60-102-89 Assistance to Kerala Social Security Pension Limited Nil 2100 2100
Total 100 2100 2200 Source: Finance Accounts and DAA of respective years KSSPL was constituted by the State Government to carry on the business as a Special Purpose Vehicle (SPV) for disbursement of various Social Security Pensions including Welfare pensions being disbursed by the State Government, in line with disbursement calendar notified by the Government of Kerala (GoK) from time to time. The required funds are to be provided by GoK through its budgets along with the funds received from GoI under NSAP or any other Welfare Pension Scheme. The additional funds required to meet the liquidity requirements are to be raised by the Company through other sources in the form of Deposits, Loan or other instruments from Public Sector Undertaking (PSU), other institutions or from the public at large. However, all the repayment liabilities pertaining to the disbursement of Social Security Pensions and other expenses of the company be met by the GoK through budget every year. Audit observed that KSSPL had borrowed / raised 27 Corporate Identification Number or CIN is a unique identification number which is assigned by the ROC (Registrar of Companies) of various states under the MCA (Ministry of Corporate Affairs).
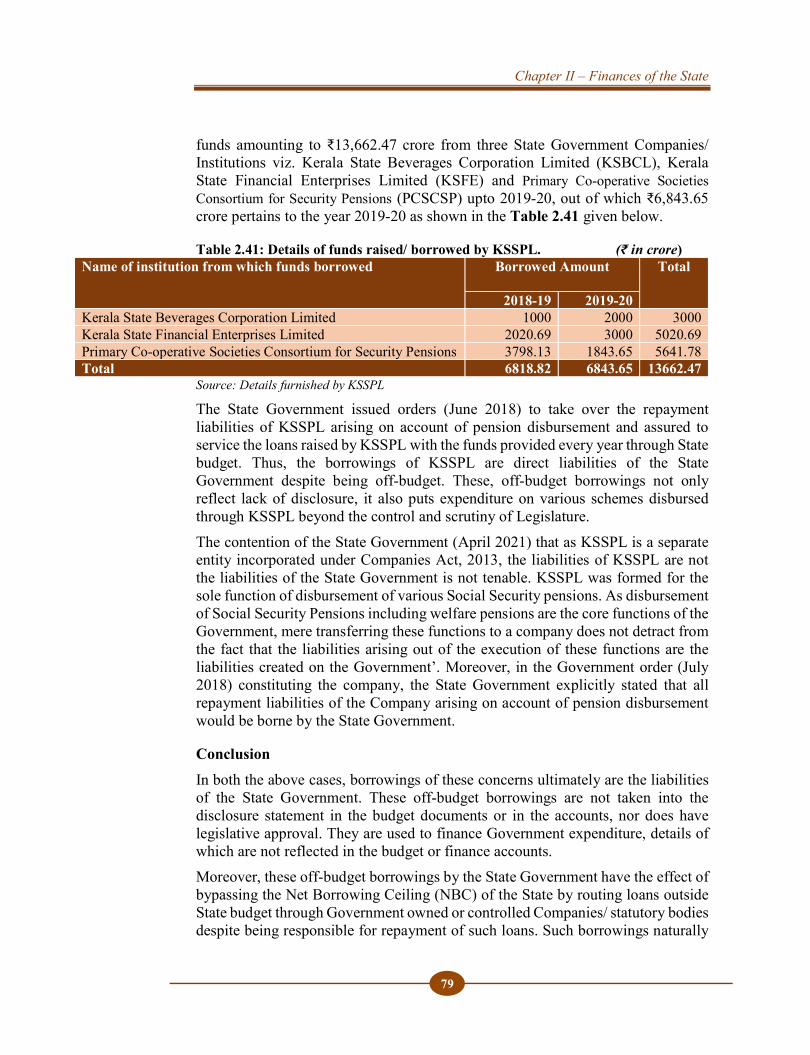
Chapter II – Finances of the State
79
funds amounting to ₹13,662.47 crore from three State Government Companies/ Institutions viz. Kerala State Beverages Corporation Limited (KSBCL), Kerala State Financial Enterprises Limited (KSFE) and Primary Co-operative Societies Consortium for Security Pensions (PCSCSP) upto 2019-20, out of which ₹6,843.65 crore pertains to the year 2019-20 as shown in the Table 2.41 given below. Table 2.41: Details of funds raised/ borrowed by KSSPL. (₹ in crore)
Name of institution from which funds borrowed Borrowed Amount Total
2018-19 2019-20 Kerala State Beverages Corporation Limited 1000 2000 3000 Kerala State Financial Enterprises Limited 2020.69 3000 5020.69 Primary Co-operative Societies Consortium for Security Pensions 3798.13 1843.65 5641.78 Total 6818.82 6843.65 13662.47
Source: Details furnished by KSSPL
The State Government issued orders (June 2018) to take over the repayment liabilities of KSSPL arising on account of pension disbursement and assured to service the loans raised by KSSPL with the funds provided every year through State budget. Thus, the borrowings of KSSPL are direct liabilities of the State Government despite being off-budget. These, off-budget borrowings not only reflect lack of disclosure, it also puts expenditure on various schemes disbursed through KSSPL beyond the control and scrutiny of Legislature. The contention of the State Government (April 2021) that as KSSPL is a separate entity incorporated under Companies Act, 2013, the liabilities of KSSPL are not the liabilities of the State Government is not tenable. KSSPL was formed for the sole function of disbursement of various Social Security pensions. As disbursement of Social Security Pensions including welfare pensions are the core functions of the Government, mere transferring these functions to a company does not detract from the fact that the liabilities arising out of the execution of these functions are the liabilities created on the Government’. Moreover, in the Government order (July 2018) constituting the company, the State Government explicitly stated that all repayment liabilities of the Company arising on account of pension disbursement would be borne by the State Government.
Conclusion In both the above cases, borrowings of these concerns ultimately are the liabilities of the State Government. These off-budget borrowings are not taken into the disclosure statement in the budget documents or in the accounts, nor does have legislative approval. They are used to finance Government expenditure, details of which are not reflected in the budget or finance accounts. Moreover, these off-budget borrowings by the State Government have the effect of bypassing the Net Borrowing Ceiling (NBC) of the State by routing loans outside State budget through Government owned or controlled Companies/ statutory bodies despite being responsible for repayment of such loans. Such borrowings naturally
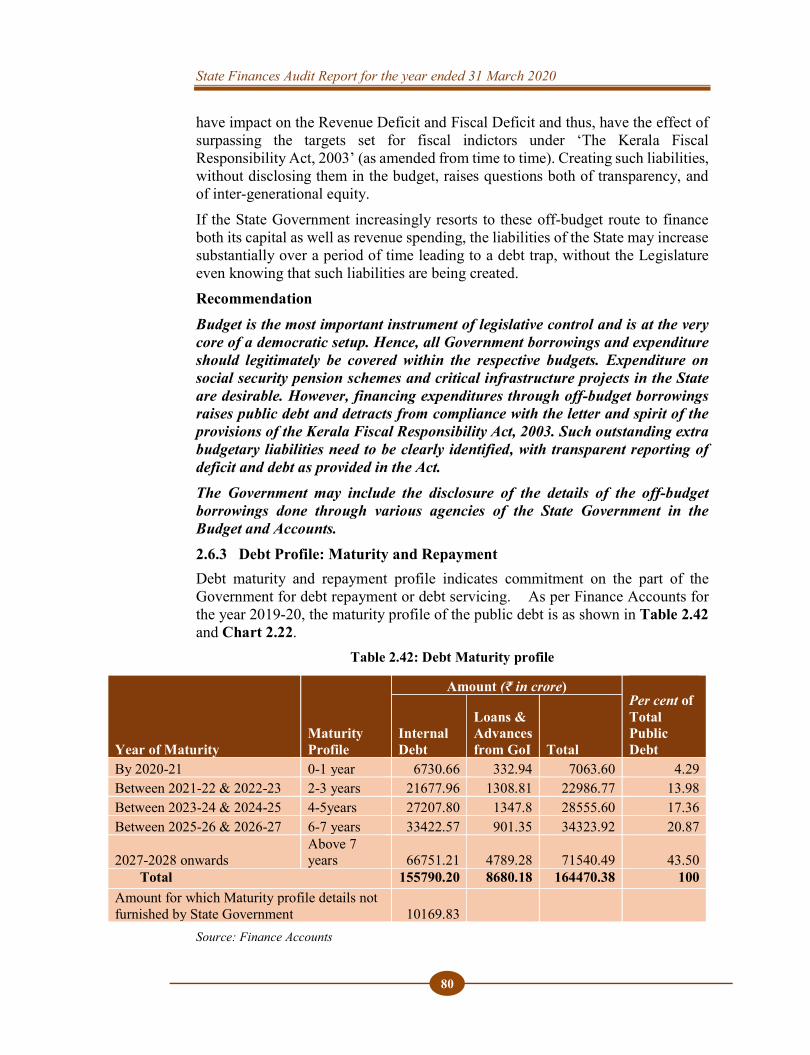
State Finances Audit Report for the year ended 31 March 2020
80
have impact on the Revenue Deficit and Fiscal Deficit and thus, have the effect of surpassing the targets set for fiscal indictors under ‘The Kerala Fiscal Responsibility Act, 2003’ (as amended from time to time). Creating such liabilities, without disclosing them in the budget, raises questions both of transparency, and of inter-generational equity. If the State Government increasingly resorts to these off-budget route to finance both its capital as well as revenue spending, the liabilities of the State may increase substantially over a period of time leading to a debt trap, without the Legislature even knowing that such liabilities are being created. Recommendation Budget is the most important instrument of legislative control and is at the very core of a democratic setup. Hence, all Government borrowings and expenditure should legitimately be covered within the respective budgets. Expenditure on social security pension schemes and critical infrastructure projects in the State are desirable. However, financing expenditures through off-budget borrowings raises public debt and detracts from compliance with the letter and spirit of the provisions of the Kerala Fiscal Responsibility Act, 2003. Such outstanding extra budgetary liabilities need to be clearly identified, with transparent reporting of deficit and debt as provided in the Act. The Government may include the disclosure of the details of the off-budget borrowings done through various agencies of the State Government in the Budget and Accounts. 2.6.3 Debt Profile: Maturity and Repayment Debt maturity and repayment profile indicates commitment on the part of the Government for debt repayment or debt servicing. As per Finance Accounts for the year 2019-20, the maturity profile of the public debt is as shown in Table 2.42 and Chart 2.22.
Table 2.42: Debt Maturity profile
Year of Maturity Maturity Profile
Amount (₹ in crore) Per cent of Total Public Debt
Internal Debt
Loans & Advances from GoI Total
By 2020-21 0-1 year 6730.66 332.94 7063.60 4.29 Between 2021-22 & 2022-23 2-3 years 21677.96 1308.81 22986.77 13.98 Between 2023-24 & 2024-25 4-5years 27207.80 1347.8 28555.60 17.36 Between 2025-26 & 2026-27 6-7 years 33422.57 901.35 34323.92 20.87
2027-2028 onwards Above 7 years 66751.21 4789.28 71540.49 43.50
Total 155790.20 8680.18 164470.38 100 Amount for which Maturity profile details not furnished by State Government 10169.83
Source: Finance Accounts
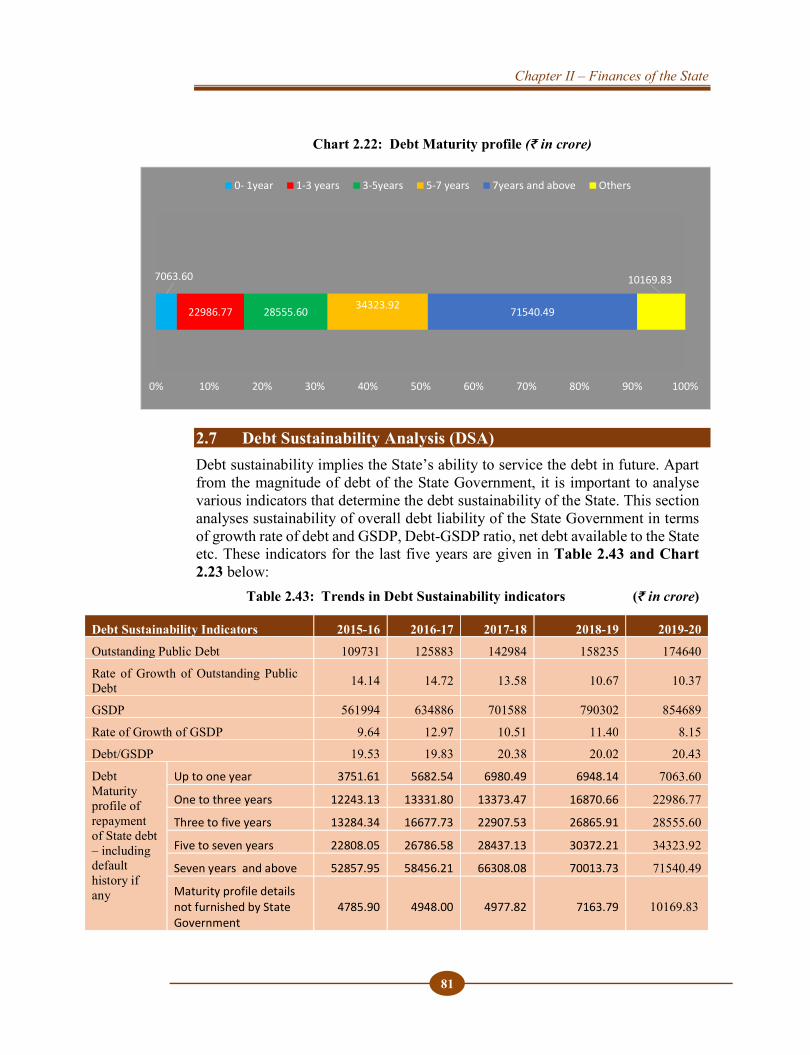
Chapter II – Finances of the State
81
Chart 2.22: Debt Maturity profile (₹ in crore)
2.7 Debt Sustainability Analysis (DSA) Debt sustainability implies the State’s ability to service the debt in future. Apart from the magnitude of debt of the State Government, it is important to analyse various indicators that determine the debt sustainability of the State. This section analyses sustainability of overall debt liability of the State Government in terms of growth rate of debt and GSDP, Debt-GSDP ratio, net debt available to the State etc. These indicators for the last five years are given in Table 2.43 and Chart 2.23 below: Table 2.43: Trends in Debt Sustainability indicators (₹ in crore)
Debt Sustainability Indicators 2015-16 2016-17 2017-18 2018-19 2019-20
Outstanding Public Debt 109731 125883 142984 158235 174640
Rate of Growth of Outstanding Public Debt 14.14 14.72 13.58 10.67 10.37
GSDP 561994 634886 701588 790302 854689
Rate of Growth of GSDP 9.64 12.97 10.51 11.40 8.15
Debt/GSDP 19.53 19.83 20.38 20.02 20.43
Debt Maturity profile of repayment of State debt – including default history if any
Up to one year 3751.61 5682.54 6980.49 6948.14 7063.60
One to three years 12243.13 13331.80 13373.47 16870.66 22986.77
Three to five years 13284.34 16677.73 22907.53 26865.91 28555.60
Five to seven years 22808.05 26786.58 28437.13 30372.21 34323.92
Seven years and above 52857.95 58456.21 66308.08 70013.73 71540.49
Maturity profile details not furnished by State Government
4785.90 4948.00 4977.82 7163.79 10169.83
7063.60
22986.77 28555.60 34323.92 71540.49
10169.83
0% 10% 20% 30% 40% 50% 60% 70% 80% 90% 100%
0- 1year 1-3 years 3-5years 5-7 years 7years and above Others
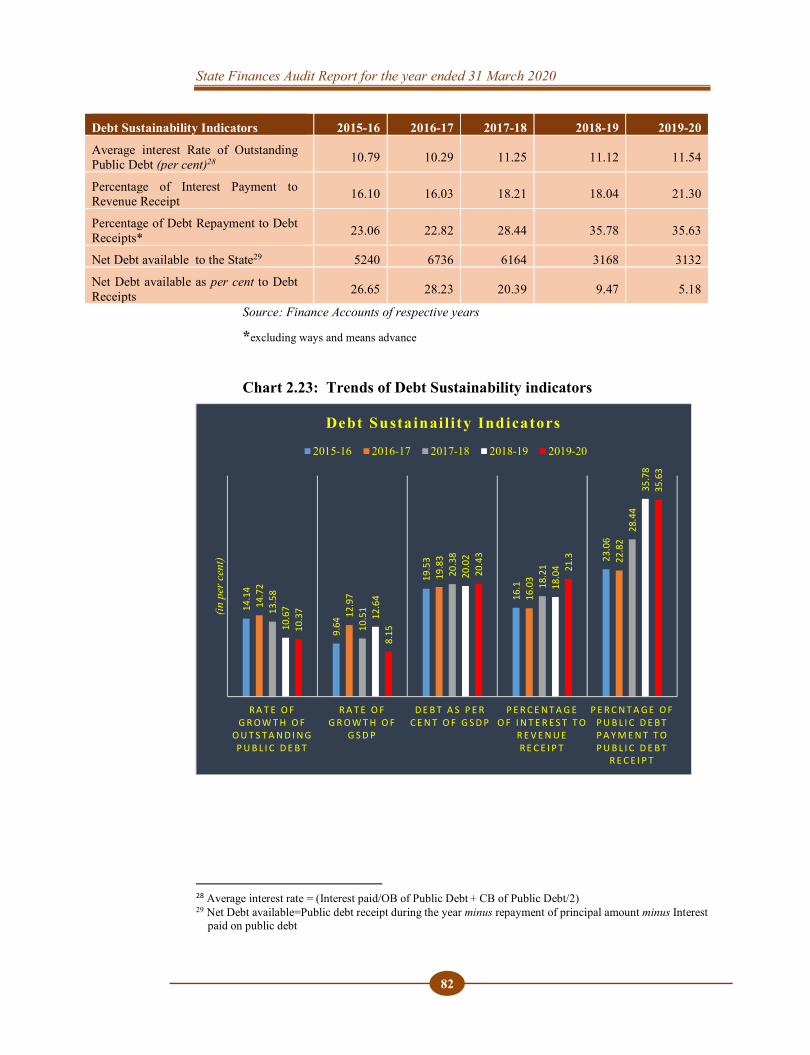
State Finances Audit Report for the year ended 31 March 2020
82
Debt Sustainability Indicators 2015-16 2016-17 2017-18 2018-19 2019-20
Average interest Rate of Outstanding Public Debt (per cent)28 10.79 10.29 11.25 11.12 11.54
Percentage of Interest Payment to Revenue Receipt 16.10 16.03 18.21 18.04 21.30
Percentage of Debt Repayment to Debt Receipts* 23.06 22.82 28.44 35.78 35.63
Net Debt available to the State29 5240 6736 6164 3168 3132
Net Debt available as per cent to Debt Receipts 26.65 28.23 20.39 9.47 5.18
Source: Finance Accounts of respective years *excluding ways and means advance
Chart 2.23: Trends of Debt Sustainability indicators
28 Average interest rate = (Interest paid/OB of Public Debt + CB of Public Debt/2) 29 Net Debt available=Public debt receipt during the year minus repayment of principal amount minus Interest
paid on public debt
14.1
4
9.64
19.5
3
16.1
23.0
6
14.7
2
12.9
7
19.8
3
16.0
3
22.8
2
13.5
8
10.5
1
20.3
8
18.2
1
28.4
4
10.6
7
12.6
4
20.0
2
18.0
4
35.7
8
10.3
7
8.15
20.4
3
21.3
35.6
3
R A T E O F G R O W T H O F
O U T S T A N D I N G P U B L I C D E B T
R A T E O F G R O W T H O F
G S D P
D E B T A S P E R C E N T O F G S D P
P E R C E N T A G E O F I N T E R E S T T O
R E V E N U E R E C E I P T
P E R C N T A G E O F P U B L I C D E B T P A Y M E N T T O P U B L I C D E B T
R E C E I P T
(in p
er c
ent)
Debt Susta inai l i ty Indicators
2015-16 2016-17 2017-18 2018-19 2019-20
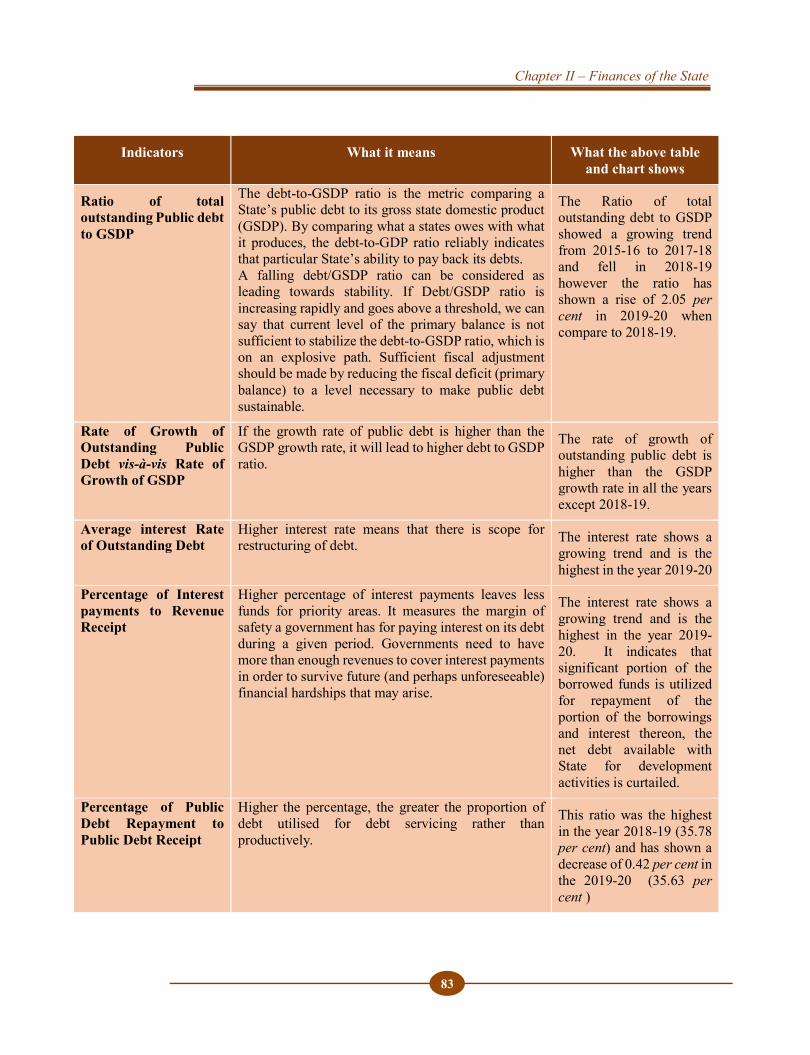
Chapter II – Finances of the State
83
Indicators What it means What the above table and chart shows
Ratio of total outstanding Public debt to GSDP
The debt-to-GSDP ratio is the metric comparing a State’s public debt to its gross state domestic product (GSDP). By comparing what a states owes with what it produces, the debt-to-GDP ratio reliably indicates that particular State’s ability to pay back its debts. A falling debt/GSDP ratio can be considered as leading towards stability. If Debt/GSDP ratio is increasing rapidly and goes above a threshold, we can say that current level of the primary balance is not sufficient to stabilize the debt-to-GSDP ratio, which is on an explosive path. Sufficient fiscal adjustment should be made by reducing the fiscal deficit (primary balance) to a level necessary to make public debt sustainable.
The Ratio of total outstanding debt to GSDP showed a growing trend from 2015-16 to 2017-18 and fell in 2018-19 however the ratio has shown a rise of 2.05 per cent in 2019-20 when compare to 2018-19.
Rate of Growth of Outstanding Public Debt vis-à-vis Rate of Growth of GSDP
If the growth rate of public debt is higher than the GSDP growth rate, it will lead to higher debt to GSDP ratio.
The rate of growth of outstanding public debt is higher than the GSDP growth rate in all the years except 2018-19.
Average interest Rate of Outstanding Debt
Higher interest rate means that there is scope for restructuring of debt. The interest rate shows a
growing trend and is the highest in the year 2019-20
Percentage of Interest payments to Revenue Receipt
Higher percentage of interest payments leaves less funds for priority areas. It measures the margin of safety a government has for paying interest on its debt during a given period. Governments need to have more than enough revenues to cover interest payments in order to survive future (and perhaps unforeseeable) financial hardships that may arise.
The interest rate shows a growing trend and is the highest in the year 2019-20. It indicates that significant portion of the borrowed funds is utilized for repayment of the portion of the borrowings and interest thereon, the net debt available with State for development activities is curtailed.
Percentage of Public Debt Repayment to Public Debt Receipt
Higher the percentage, the greater the proportion of debt utilised for debt servicing rather than productively.
This ratio was the highest in the year 2018-19 (35.78 per cent) and has shown a decrease of 0.42 per cent in the 2019-20 (35.63 per cent )
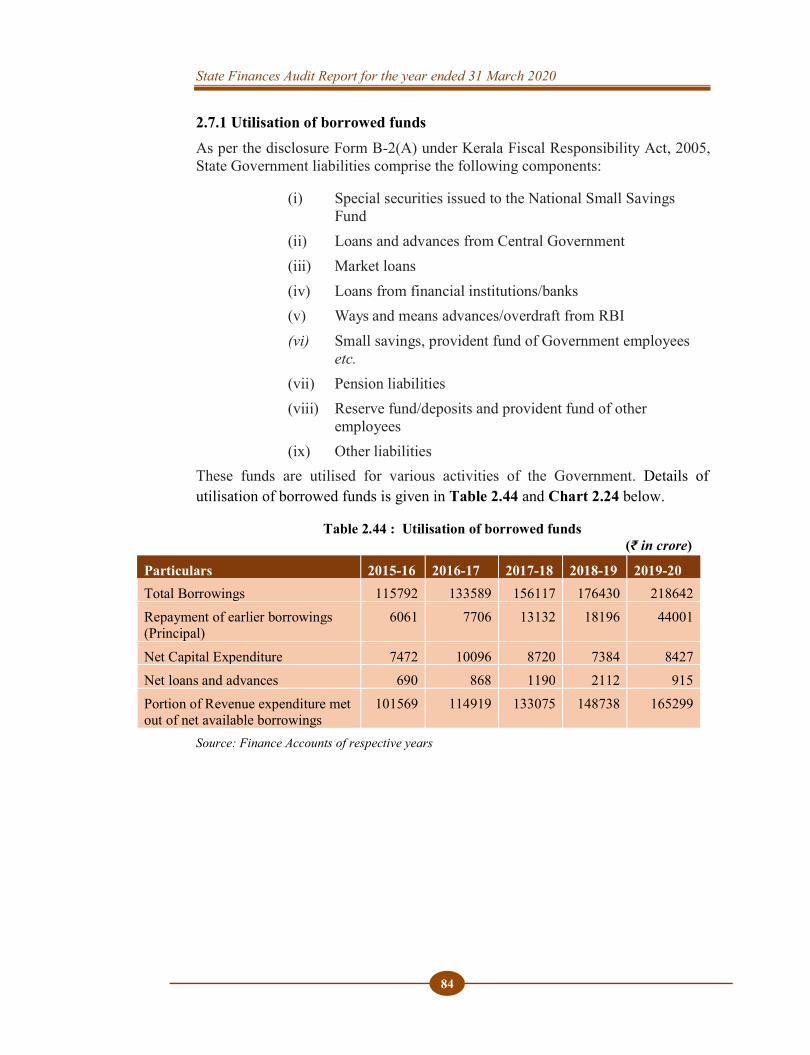
State Finances Audit Report for the year ended 31 March 2020
84
2.7.1 Utilisation of borrowed funds As per the disclosure Form B-2(A) under Kerala Fiscal Responsibility Act, 2005, State Government liabilities comprise the following components:
(i) Special securities issued to the National Small Savings Fund
(ii) Loans and advances from Central Government (iii) Market loans (iv) Loans from financial institutions/banks (v) Ways and means advances/overdraft from RBI (vi) Small savings, provident fund of Government employees
etc. (vii) Pension liabilities (viii) Reserve fund/deposits and provident fund of other
employees (ix) Other liabilities
These funds are utilised for various activities of the Government. Details of utilisation of borrowed funds is given in Table 2.44 and Chart 2.24 below.
Table 2.44 : Utilisation of borrowed funds (₹ in crore)
Particulars 2015-16 2016-17 2017-18 2018-19 2019-20 Total Borrowings 115792 133589 156117 176430 218642 Repayment of earlier borrowings (Principal)
6061 7706 13132 18196 44001
Net Capital Expenditure 7472 10096 8720 7384 8427 Net loans and advances 690 868 1190 2112 915 Portion of Revenue expenditure met out of net available borrowings
101569 114919 133075 148738 165299
Source: Finance Accounts of respective years
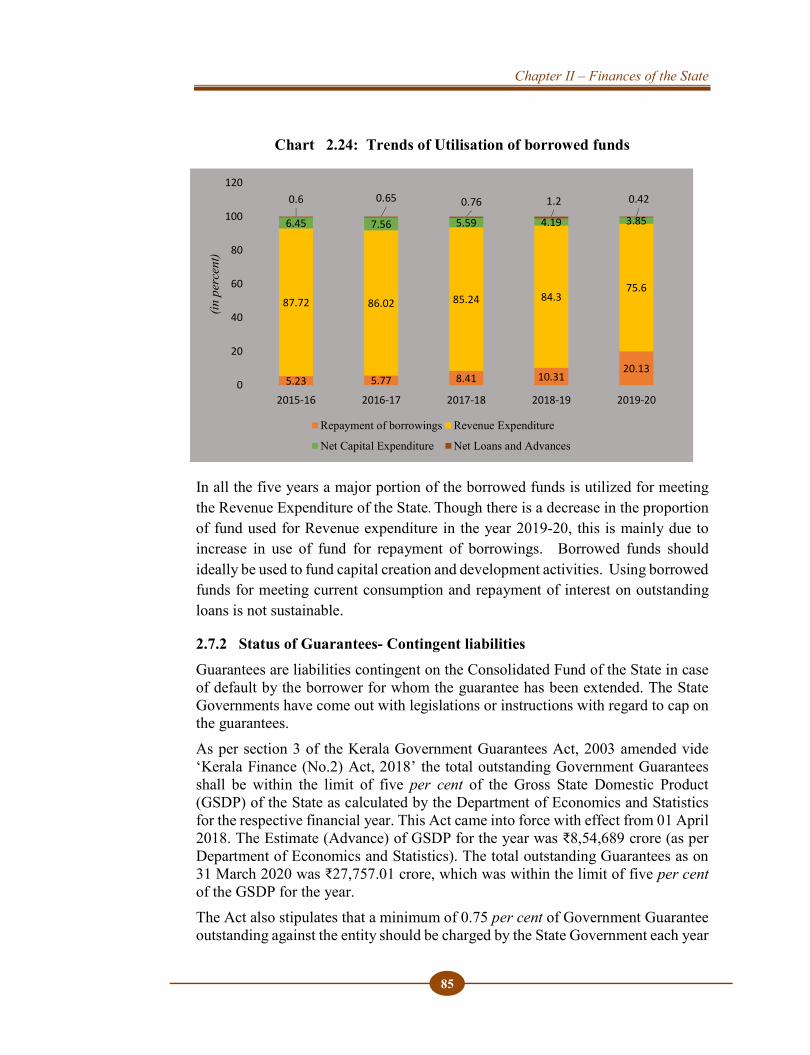
Chapter II – Finances of the State
85
Chart 2.24: Trends of Utilisation of borrowed funds
In all the five years a major portion of the borrowed funds is utilized for meeting the Revenue Expenditure of the State. Though there is a decrease in the proportion of fund used for Revenue expenditure in the year 2019-20, this is mainly due to increase in use of fund for repayment of borrowings. Borrowed funds should ideally be used to fund capital creation and development activities. Using borrowed funds for meeting current consumption and repayment of interest on outstanding loans is not sustainable.
2.7.2 Status of Guarantees- Contingent liabilities Guarantees are liabilities contingent on the Consolidated Fund of the State in case of default by the borrower for whom the guarantee has been extended. The State Governments have come out with legislations or instructions with regard to cap on the guarantees. As per section 3 of the Kerala Government Guarantees Act, 2003 amended vide ‘Kerala Finance (No.2) Act, 2018’ the total outstanding Government Guarantees shall be within the limit of five per cent of the Gross State Domestic Product (GSDP) of the State as calculated by the Department of Economics and Statistics for the respective financial year. This Act came into force with effect from 01 April 2018. The Estimate (Advance) of GSDP for the year was ₹8,54,689 crore (as per Department of Economics and Statistics). The total outstanding Guarantees as on 31 March 2020 was ₹27,757.01 crore, which was within the limit of five per cent of the GSDP for the year. The Act also stipulates that a minimum of 0.75 per cent of Government Guarantee outstanding against the entity should be charged by the State Government each year
5.23 5.77 8.41 10.3120.13
87.72 86.02 85.24 84.375.6
6.45 7.56 5.59 4.19 3.85
0.6 0.65 0.76 1.2 0.42
0
20
40
60
80
100
120
2015-16 2016-17 2017-18 2018-19 2019-20
(in p
erce
nt)
Repayment of borrowings Revenue Expenditure
Net Capital Expenditure Net Loans and Advances
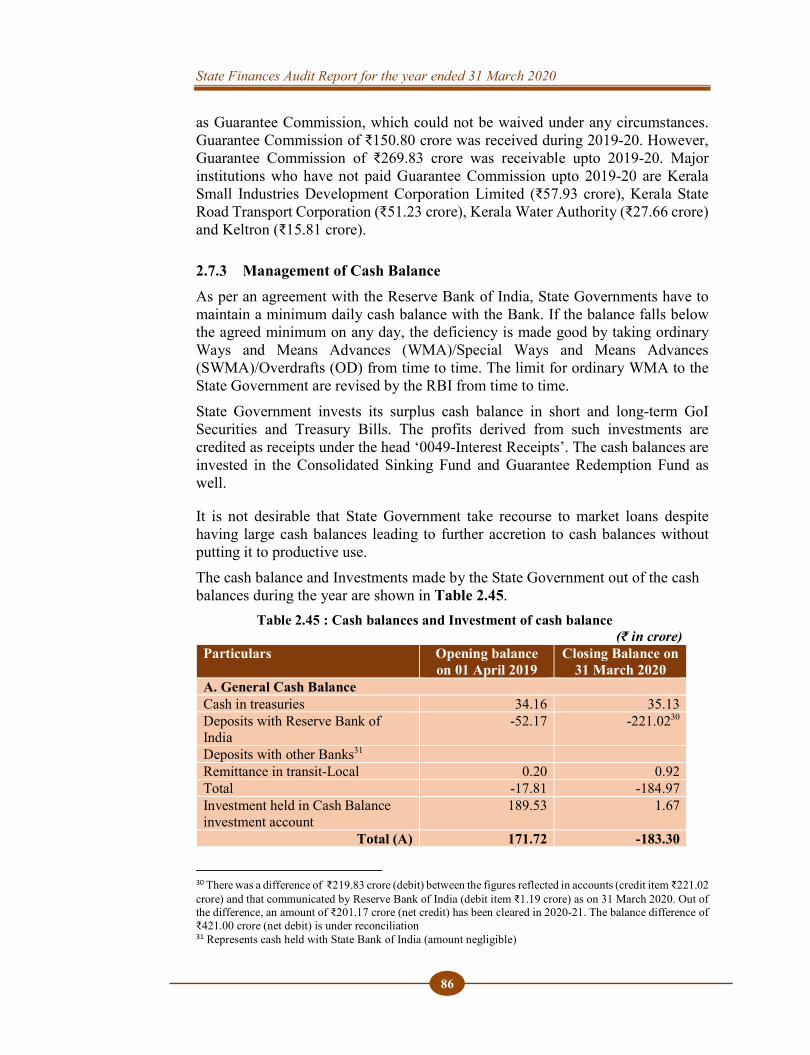
State Finances Audit Report for the year ended 31 March 2020
86
as Guarantee Commission, which could not be waived under any circumstances. Guarantee Commission of ₹150.80 crore was received during 2019-20. However, Guarantee Commission of ₹269.83 crore was receivable upto 2019-20. Major institutions who have not paid Guarantee Commission upto 2019-20 are Kerala Small Industries Development Corporation Limited (₹57.93 crore), Kerala State Road Transport Corporation (₹51.23 crore), Kerala Water Authority (₹27.66 crore) and Keltron (₹15.81 crore).
2.7.3 Management of Cash Balance As per an agreement with the Reserve Bank of India, State Governments have to maintain a minimum daily cash balance with the Bank. If the balance falls below the agreed minimum on any day, the deficiency is made good by taking ordinary Ways and Means Advances (WMA)/Special Ways and Means Advances (SWMA)/Overdrafts (OD) from time to time. The limit for ordinary WMA to the State Government are revised by the RBI from time to time. State Government invests its surplus cash balance in short and long-term GoI Securities and Treasury Bills. The profits derived from such investments are credited as receipts under the head ‘0049-Interest Receipts’. The cash balances are invested in the Consolidated Sinking Fund and Guarantee Redemption Fund as well.
It is not desirable that State Government take recourse to market loans despite having large cash balances leading to further accretion to cash balances without putting it to productive use. The cash balance and Investments made by the State Government out of the cash balances during the year are shown in Table 2.45. Table 2.45 : Cash balances and Investment of cash balance (₹ in crore)
Particulars Opening balance on 01 April 2019
Closing Balance on 31 March 2020
A. General Cash Balance Cash in treasuries 34.16 35.13 Deposits with Reserve Bank of India
-52.17 -221.0230
Deposits with other Banks31 Remittance in transit-Local 0.20 0.92 Total -17.81 -184.97 Investment held in Cash Balance investment account
189.53 1.67
Total (A) 171.72 -183.30
30 There was a difference of ₹219.83 crore (debit) between the figures reflected in accounts (credit item ₹221.02 crore) and that communicated by Reserve Bank of India (debit item ₹1.19 crore) as on 31 March 2020. Out of the difference, an amount of ₹201.17 crore (net credit) has been cleared in 2020-21. The balance difference of ₹421.00 crore (net debit) is under reconciliation 31 Represents cash held with State Bank of India (amount negligible)
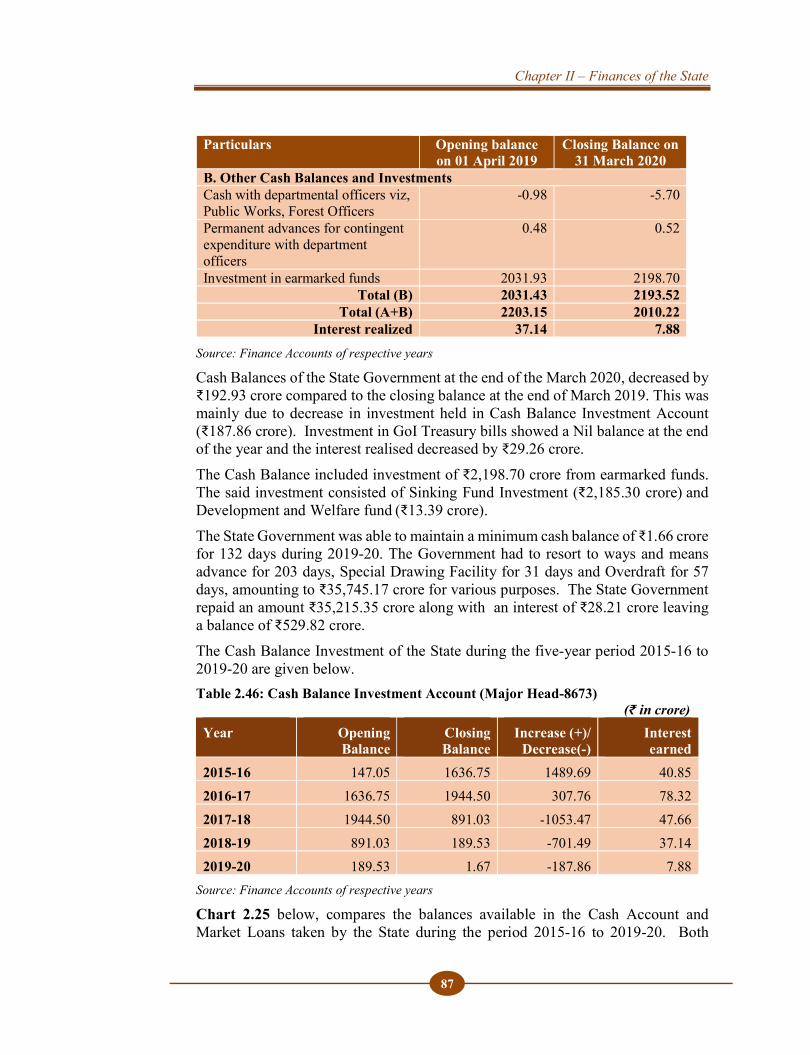
Chapter II – Finances of the State
87
Particulars Opening balance on 01 April 2019
Closing Balance on 31 March 2020
B. Other Cash Balances and Investments Cash with departmental officers viz, Public Works, Forest Officers
-0.98 -5.70
Permanent advances for contingent expenditure with department officers
0.48 0.52
Investment in earmarked funds 2031.93 2198.70 Total (B) 2031.43 2193.52
Total (A+B) 2203.15 2010.22 Interest realized 37.14 7.88
Source: Finance Accounts of respective years
Cash Balances of the State Government at the end of the March 2020, decreased by ₹192.93 crore compared to the closing balance at the end of March 2019. This was mainly due to decrease in investment held in Cash Balance Investment Account (₹187.86 crore). Investment in GoI Treasury bills showed a Nil balance at the end of the year and the interest realised decreased by ₹29.26 crore. The Cash Balance included investment of ₹2,198.70 crore from earmarked funds. The said investment consisted of Sinking Fund Investment (₹2,185.30 crore) and Development and Welfare fund (₹13.39 crore). The State Government was able to maintain a minimum cash balance of ₹1.66 crore for 132 days during 2019-20. The Government had to resort to ways and means advance for 203 days, Special Drawing Facility for 31 days and Overdraft for 57 days, amounting to ₹35,745.17 crore for various purposes. The State Government repaid an amount ₹35,215.35 crore along with an interest of ₹28.21 crore leaving a balance of ₹529.82 crore. The Cash Balance Investment of the State during the five-year period 2015-16 to 2019-20 are given below. Table 2.46: Cash Balance Investment Account (Major Head-8673)
(₹ in crore) Year Opening
Balance Closing Balance
Increase (+)/ Decrease(-)
Interest earned
2015-16 147.05 1636.75 1489.69 40.85 2016-17 1636.75 1944.50 307.76 78.32 2017-18 1944.50 891.03 -1053.47 47.66 2018-19 891.03 189.53 -701.49 37.14 2019-20 189.53 1.67 -187.86 7.88
Source: Finance Accounts of respective years
Chart 2.25 below, compares the balances available in the Cash Account and Market Loans taken by the State during the period 2015-16 to 2019-20. Both
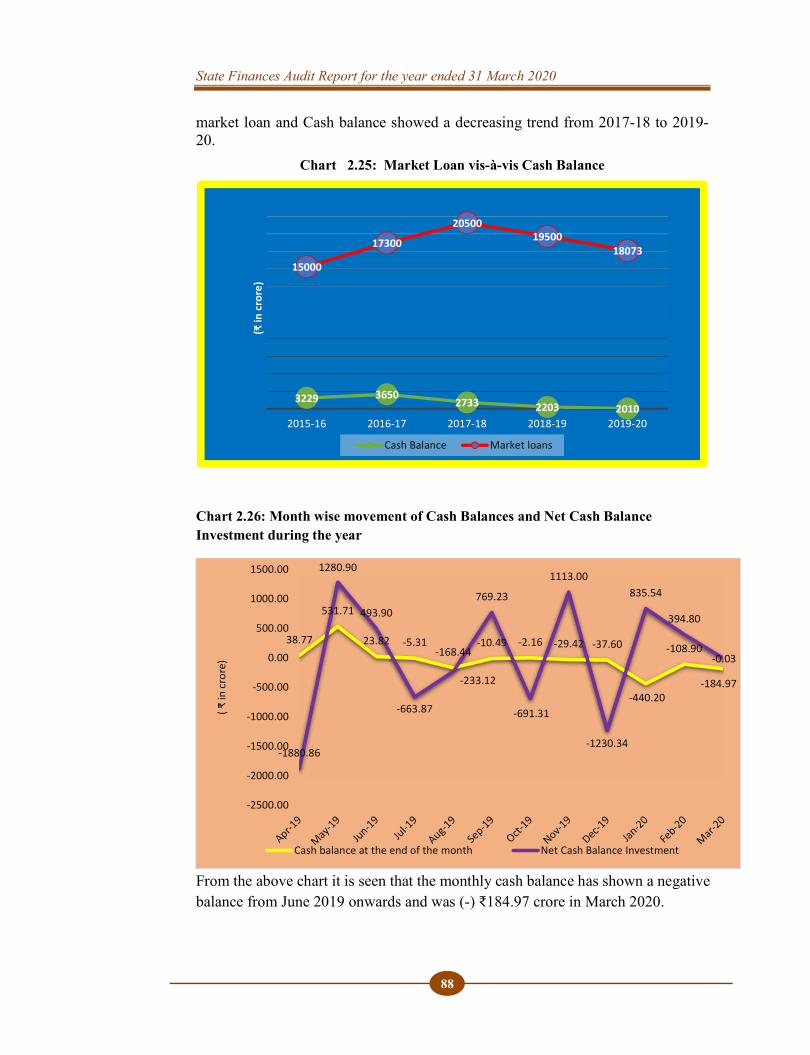
State Finances Audit Report for the year ended 31 March 2020
88
market loan and Cash balance showed a decreasing trend from 2017-18 to 2019-20.
Chart 2.25: Market Loan vis-à-vis Cash Balance
Chart 2.26: Month wise movement of Cash Balances and Net Cash Balance Investment during the year
From the above chart it is seen that the monthly cash balance has shown a negative balance from June 2019 onwards and was (-) ₹184.97 crore in March 2020.
3229 36502733 2203 2010
15000
17300
2050019500
18073
2015-16 2016-17 2017-18 2018-19 2019-20
(₹ in
cro
re)
Cash Balance Market loans
38.77
531.71
23.82 -5.31-168.44
-10.49 -2.16 -29.42 -37.60
-440.20
-108.90
-184.97
-1880.86
1280.90
493.90
-663.87
-233.12
769.23
-691.31
1113.00
-1230.34
835.54
394.80
-0.03
-2500.00
-2000.00
-1500.00
-1000.00
-500.00
0.00
500.00
1000.00
1500.00
( ₹ in
cro
re)
Cash balance at the end of the month Net Cash Balance Investment

Chapter II – Finances of the State
89
2.8 Conclusions
1. Revenue resources
Revenue receipts of the State increased from ₹69,033 crore in 2015-16 to ₹90,225 crore in 2019-20, recording a growth of 31 per cent during the last five years. The State’s own tax revenue, being the main source of revenue in revenue receipts increased by only 29 per cent during the period and its share in revenue receipts also remained at 56 per cent in 2015-16 and 2019-20 indicating no growth of tax revenue during the period.
2. Revenue Expenditure
Revenue Expenditure of the State increased from ₹78,690 crore in 2015-16 to ₹1,04,720 crore in 2019-20 recording a growth of 33 per cent during the five-year period. Revenue expenditure as a percentage of total expenditure ranged between 89 to 92 per cent during the period showing predominance of revenue expenditure in total expenditure. Share of committed expenditure in revenue expenditure was 68 per cent during 2019-20 and it consumed 79 per cent of the revenue receipts during the year. Interest payments consumed 21 per cent of revenue receipts during 2019-20 and is a matter of concern for the State Government.
3. Quality of expenditure
Capital Expenditure of the State increased from ₹7,500 crore in 2015-16 to ₹8,455 crore in 2019-20 recording a meagre growth of 12 per cent during the five year period showing low priority of the Government towards capital expenditure. The State’s share of expenditure on the health and education sectors in the total expenditure was more than General Category States, but the share of capital expenditure was less than that of General Category States. Though the State Government invested ₹8,881.70 crore in Statutory Corporations, Government Companies, Joint Stock Companies and Co-operatives, average return on these investments was 1.39 per cent in the last five years while the Government paid an average interest rate of 7.33 per cent on its borrowings during 2015-16 to 2019-20. The interest receipt on loans and advances given by State Government was 0.30 per cent during 2019-20 against the average cost of borrowing of 7.58 per cent. During the year the Government invested ₹292.68 crore in loss making institutions and ₹15.04 crore in institution whose net worth is completely eroded.
State Finances Audit Report for the year ended 31 March 2020
90
4. Reserve Funds and liabilities
The Consolidated Sinking Fund was constituted with the aim to amortize the outstanding liabilities of the Government, but the Government did not contribute to the fund during 2019-20. Similarly, the Government has to constitute a Guarantee Redemption Fund for crediting guarantee commission collected for meeting future liabilities arising out of guarantees given by the Government. The Guarantee Redemption Fund has not been constituted so far and guarantee commission of ₹1,250.59 crore collected during 2003-04 to 2019-20 was not credited to the Fund. The State Disaster Response Fund (SDRF) had an accumulated balance of ₹551.61 crore by the end of March 2020. As per the guidelines issued by GoI, accretions to SDRF have to be invested in GoI Securities/Treasury Bills by the State Executive Committee constituted for the management of the fund. However, this was not done.
5. Debt Management Open market Loans had a major share (54 per cent) in the total fiscal liabilities of the State. The net debt available with the State for development activities was only ₹3,132 crore (5.18 per cent of public debt receipts) during 2019-20.
6. Debt Sustainability
The ratio of Debt to GSDP of the State increased from 20.02 per cent in 2018-19 to 20.43 per cent in 2019-20. Similarly, the ratio of interest payments to total revenue receipts of the State increased from 18.04 per cent in 2018-19 to 21.3 per cent in 2019-20.
2.9 Recommendations
1. The Government needs to address the growth of its own tax revenue and take measures to improve the same.
2. The State needs to improve its capital expenditure to augment its growth and
development. The government may review the investment made in loss making institutions and introduce a methodology to revive such institution.
Chapter II – Finances of the State
91
3. The government need to take necessary steps to constitute a Guarantee Redemption Fund and also invest the accretions in the SDRF in GoI Securities/ Treasury bills.
4. The State Government should closely monitor the debt sustainability of the
State and make earnest efforts to maintain a healthy debt-GSDP ratio and also ensure that the incremental interest burden is adequately covered.

CHAPTER III
BUDGETARY
MANAGEMENT
CHAPTER III
BUDGETARY
MANAGEMENT

CHAPTER III
BUDGETARY
MANAGEMENT
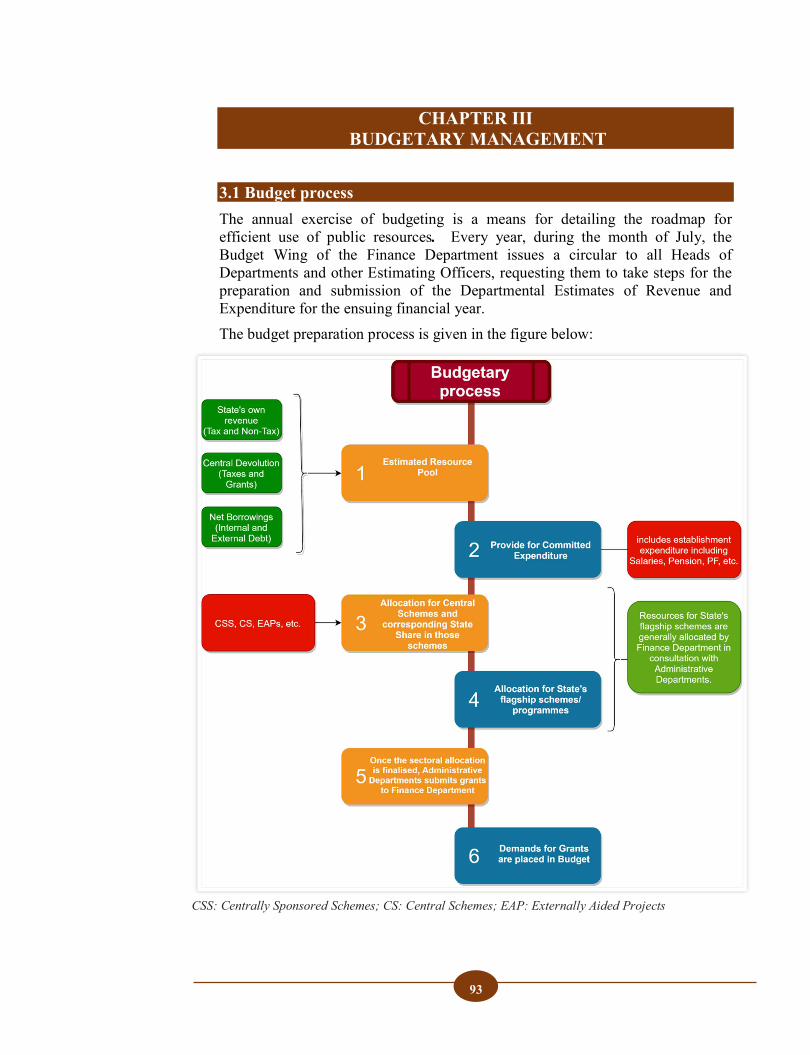
93
CHAPTER III BUDGETARY MANAGEMENT
3.1 Budget process The annual exercise of budgeting is a means for detailing the roadmap for efficient use of public resources. Every year, during the month of July, the Budget Wing of the Finance Department issues a circular to all Heads of Departments and other Estimating Officers, requesting them to take steps for the preparation and submission of the Departmental Estimates of Revenue and Expenditure for the ensuing financial year. The budget preparation process is given in the figure below:
CSS: Centrally Sponsored Schemes; CS: Central Schemes; EAP: Externally Aided Projects
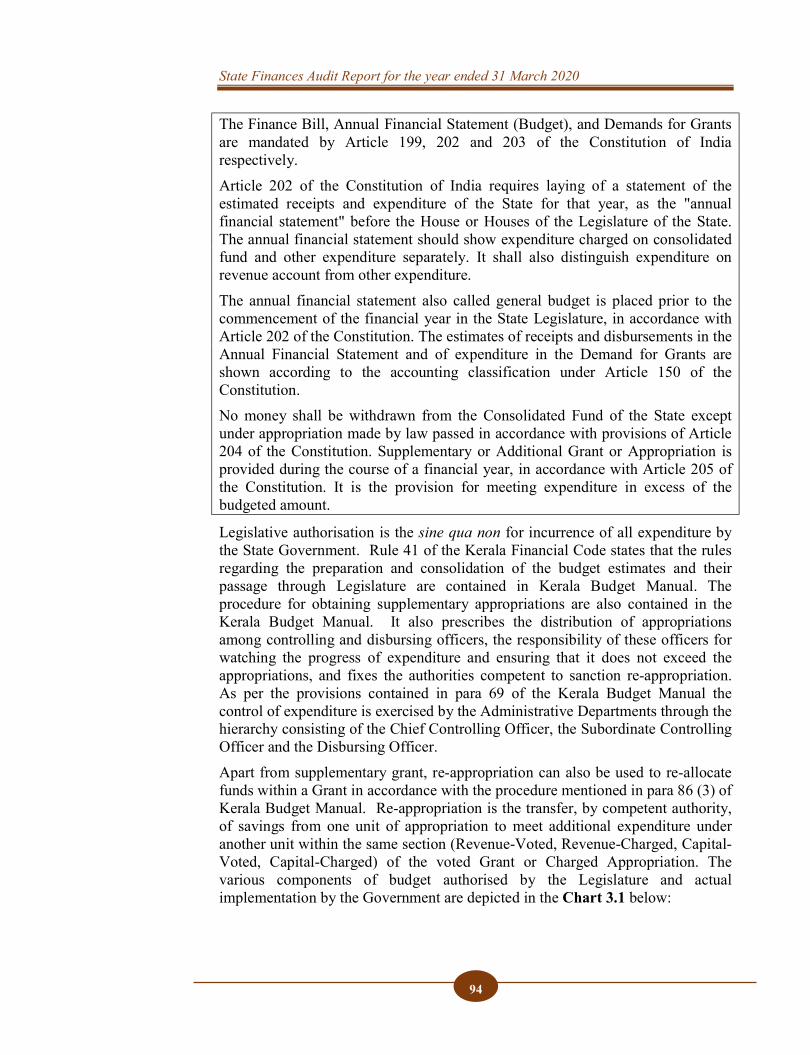
State Finances Audit Report for the year ended 31 March 2020
94
The Finance Bill, Annual Financial Statement (Budget), and Demands for Grants are mandated by Article 199, 202 and 203 of the Constitution of India respectively. Article 202 of the Constitution of India requires laying of a statement of the estimated receipts and expenditure of the State for that year, as the "annual financial statement" before the House or Houses of the Legislature of the State. The annual financial statement should show expenditure charged on consolidated fund and other expenditure separately. It shall also distinguish expenditure on revenue account from other expenditure. The annual financial statement also called general budget is placed prior to the commencement of the financial year in the State Legislature, in accordance with Article 202 of the Constitution. The estimates of receipts and disbursements in the Annual Financial Statement and of expenditure in the Demand for Grants are shown according to the accounting classification under Article 150 of the Constitution. No money shall be withdrawn from the Consolidated Fund of the State except under appropriation made by law passed in accordance with provisions of Article 204 of the Constitution. Supplementary or Additional Grant or Appropriation is provided during the course of a financial year, in accordance with Article 205 of the Constitution. It is the provision for meeting expenditure in excess of the budgeted amount.
Legislative authorisation is the sine qua non for incurrence of all expenditure by the State Government. Rule 41 of the Kerala Financial Code states that the rules regarding the preparation and consolidation of the budget estimates and their passage through Legislature are contained in Kerala Budget Manual. The procedure for obtaining supplementary appropriations are also contained in the Kerala Budget Manual. It also prescribes the distribution of appropriations among controlling and disbursing officers, the responsibility of these officers for watching the progress of expenditure and ensuring that it does not exceed the appropriations, and fixes the authorities competent to sanction re-appropriation. As per the provisions contained in para 69 of the Kerala Budget Manual the control of expenditure is exercised by the Administrative Departments through the hierarchy consisting of the Chief Controlling Officer, the Subordinate Controlling Officer and the Disbursing Officer. Apart from supplementary grant, re-appropriation can also be used to re-allocate funds within a Grant in accordance with the procedure mentioned in para 86 (3) of Kerala Budget Manual. Re-appropriation is the transfer, by competent authority, of savings from one unit of appropriation to meet additional expenditure under another unit within the same section (Revenue-Voted, Revenue-Charged, Capital-Voted, Capital-Charged) of the voted Grant or Charged Appropriation. The various components of budget authorised by the Legislature and actual implementation by the Government are depicted in the Chart 3.1 below:
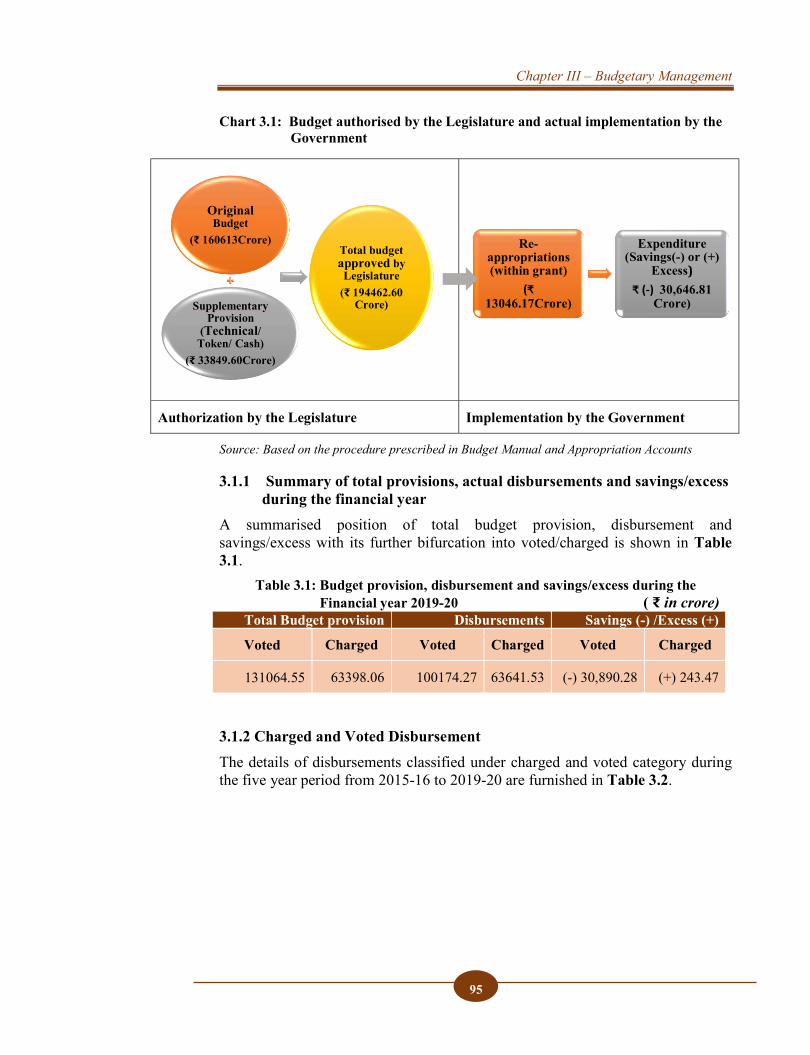
Chapter III – Budgetary Management
95
Chart 3.1: Budget authorised by the Legislature and actual implementation by the Government
Source: Based on the procedure prescribed in Budget Manual and Appropriation Accounts
3.1.1 Summary of total provisions, actual disbursements and savings/excess during the financial year A summarised position of total budget provision, disbursement and savings/excess with its further bifurcation into voted/charged is shown in Table 3.1.
Table 3.1: Budget provision, disbursement and savings/excess during the Financial year 2019-20 ( ₹ in crore)
Total Budget provision Disbursements Savings (-) /Excess (+)
Voted Charged Voted Charged Voted Charged
131064.55 63398.06 100174.27 63641.53 (-) 30,890.28 (+) 243.47
3.1.2 Charged and Voted Disbursement The details of disbursements classified under charged and voted category during the five year period from 2015-16 to 2019-20 are furnished in Table 3.2.
Authorization by the Legislature Implementation by the Government
OriginalBudget
(₹ 160613Crore)
SupplementaryProvision
(Technical/ Token/ Cash)
(₹ 33849.60Crore)
Total budget approved by Legislature
(₹ 194462.60 Crore)
Re-appropriations (within grant)
(₹ 13046.17Crore)
Expenditure (Savings(-) or (+)
Excess)₹ (-) 30,646.81
Crore)

State Finances Audit Report for the year ended 31 March 2020
96
Table 3.2: Charged and voted disbursements during the five year period from 2015-16 to 2019-20
(₹in crore) Year Disbursement Saving(-)/Excess (+)
Voted Charged Voted Charged 2015-16 76771.04 17606.13 (-) 15628.36 (-) 8885.26 2016-17 91365.15 20232.56 (-) 13518.40 (-) 6941.89 2017-18 104528.12 28928.84 (-) 11 946.04 (+) 521.08 2018-19 108023.70 35697.89 (-) 20927.47 (+) 4274.17 2019-20 100174.27 63641.53 (-) 30890.28 (+) 243.47
The overall savings of ₹30646.81crore in 2019-20 was the result of savings of ₹30890.28 crore in 43 grants and 22 appropriations under revenue section and 29 grants and seven appropriations under the Capital section, offset by excess of ₹328.73 crore in one grant and one appropriation under the revenue section and one appropriation under Capital section. The overall savings increased by 5.38 per cent from 10.38 per cent in the last year to 15.76 per cent in 2019-20.
3.2 Appropriation Accounts Appropriation Accounts are accounts of the expenditure of the Government for each financial year, compared with the amounts of grants voted and appropriations charged for different purposes as specified in the schedules appended to the Appropriation Act passed under Article 204 and 205 of the Constitution of India. Appropriation Accounts are on Gross basis. These Accounts depict the original budget provision, supplementary grants, surrenders and re-appropriations distinctly and indicate actual capital and revenue expenditure on various specified services vis-à-vis those authorised by the Appropriation Act in respect of both Charged and voted items of budget. Appropriation Accounts thus facilitate understanding of utilisation of funds, the management of finances and monitoring of budgetary provisions and are, therefore, complementary to the Finance Accounts.
Audit of appropriations by the CAG seeks to ascertain whether the expenditure actually incurred under various grants is in accordance with the authorisation given under the Appropriation Act and that the expenditure required to be charged under the provisions of the Constitution (Article 202) is so charged. It also ascertains whether the expenditure incurred is in conformity with the laws, relevant rules, regulations and instructions.
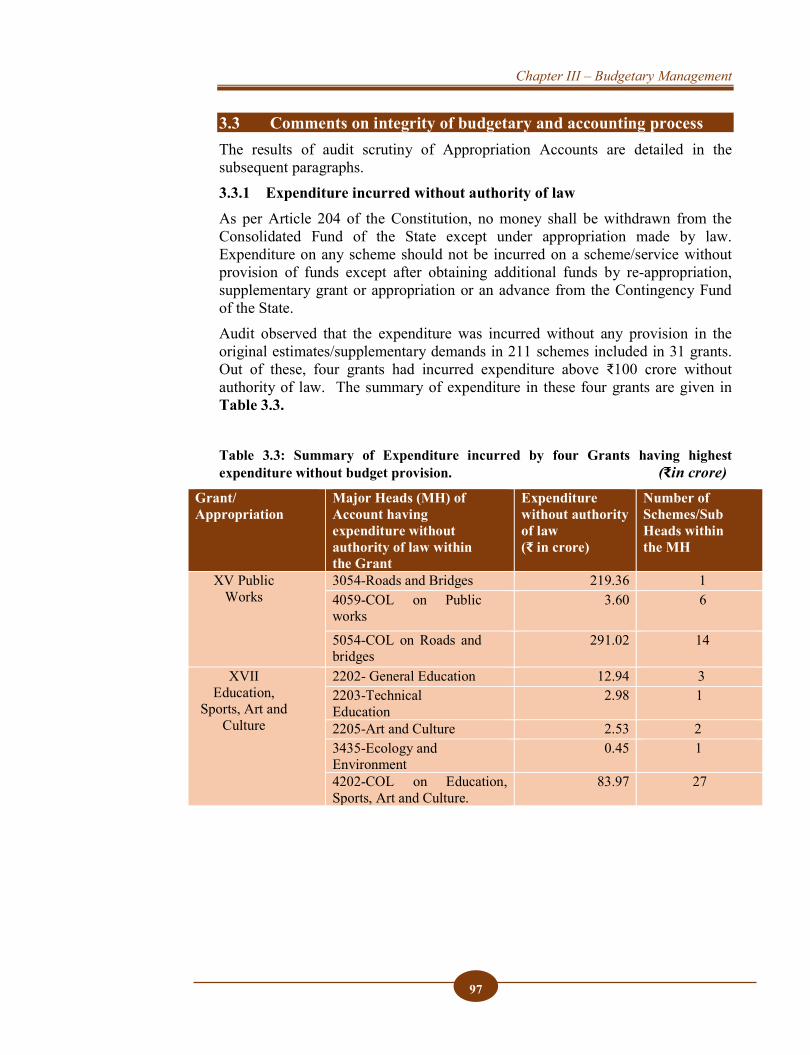
Chapter III – Budgetary Management
97
3.3 Comments on integrity of budgetary and accounting process The results of audit scrutiny of Appropriation Accounts are detailed in the subsequent paragraphs. 3.3.1 Expenditure incurred without authority of law As per Article 204 of the Constitution, no money shall be withdrawn from the Consolidated Fund of the State except under appropriation made by law. Expenditure on any scheme should not be incurred on a scheme/service without provision of funds except after obtaining additional funds by re-appropriation, supplementary grant or appropriation or an advance from the Contingency Fund of the State. Audit observed that the expenditure was incurred without any provision in the original estimates/supplementary demands in 211 schemes included in 31 grants. Out of these, four grants had incurred expenditure above ₹100 crore without authority of law. The summary of expenditure in these four grants are given in Table 3.3. Table 3.3: Summary of Expenditure incurred by four Grants having highest expenditure without budget provision. (₹in crore)
Grant/ Appropriation
Major Heads (MH) of Account having expenditure without authority of law within the Grant
Expenditure without authority of law (₹ in crore)
Number of Schemes/Sub Heads within the MH
XV Public Works
3054-Roads and Bridges 219.36 1 4059-COL on Public works
3.60 6
5054-COL on Roads and bridges
291.02 14
XVII Education,
Sports, Art and Culture
2202- General Education 12.94 3 2203-Technical Education
2.98 1
2205-Art and Culture 2.53 2 3435-Ecology and Environment
0.45 1
4202-COL on Education, Sports, Art and Culture.
83.97 27
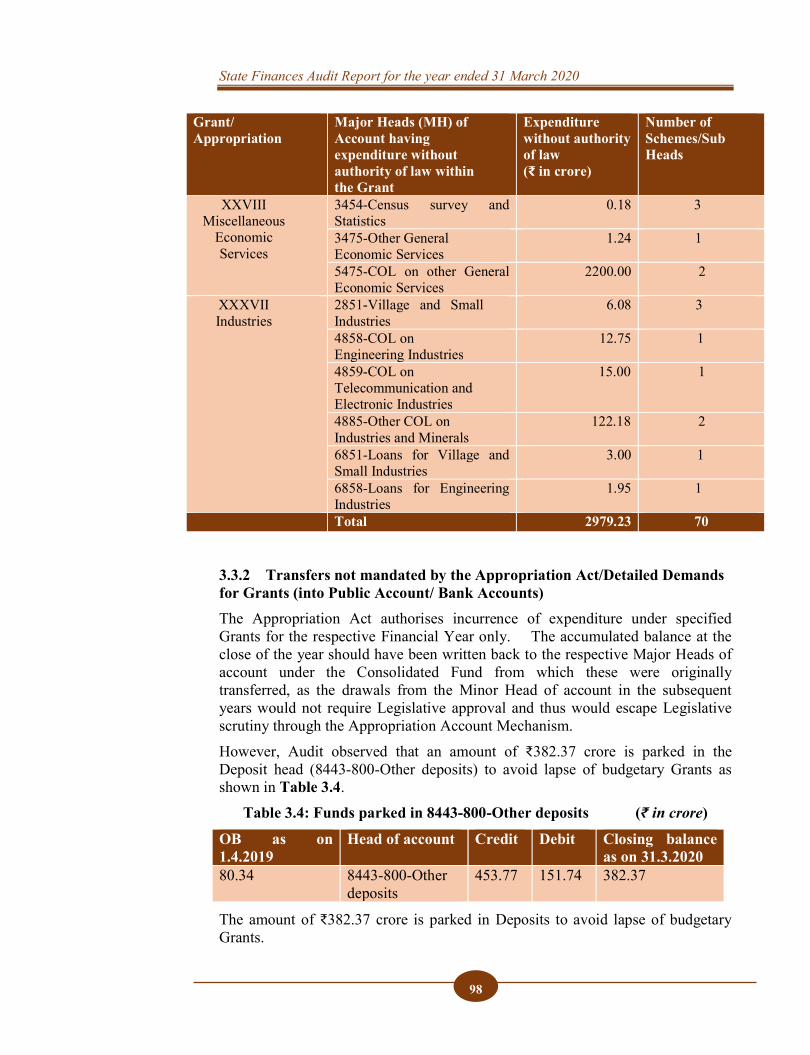
State Finances Audit Report for the year ended 31 March 2020
98
Grant/ Appropriation
Major Heads (MH) of Account having expenditure without authority of law within the Grant
Expenditure without authority of law (₹ in crore)
Number of Schemes/Sub Heads
XXVIII Miscellaneous
Economic Services
3454-Census survey and Statistics
0.18 3
3475-Other General Economic Services
1.24 1
5475-COL on other General Economic Services
2200.00 2
XXXVII Industries
2851-Village and Small Industries
6.08 3
4858-COL on Engineering Industries
12.75 1
4859-COL on Telecommunication and Electronic Industries
15.00 1
4885-Other COL on Industries and Minerals
122.18 2
6851-Loans for Village and Small Industries
3.00 1
6858-Loans for Engineering Industries
1.95 1
Total 2979.23 70
3.3.2 Transfers not mandated by the Appropriation Act/Detailed Demands for Grants (into Public Account/ Bank Accounts) The Appropriation Act authorises incurrence of expenditure under specified Grants for the respective Financial Year only. The accumulated balance at the close of the year should have been written back to the respective Major Heads of account under the Consolidated Fund from which these were originally transferred, as the drawals from the Minor Head of account in the subsequent years would not require Legislative approval and thus would escape Legislative scrutiny through the Appropriation Account Mechanism. However, Audit observed that an amount of ₹382.37 crore is parked in the Deposit head (8443-800-Other deposits) to avoid lapse of budgetary Grants as shown in Table 3.4.
Table 3.4: Funds parked in 8443-800-Other deposits (₹ in crore)
OB as on 1.4.2019
Head of account
Credit Debit Closing balance as on 31.3.2020
80.34 8443-800-Other deposits
453.77 151.74 382.37
The amount of ₹382.37 crore is parked in Deposits to avoid lapse of budgetary Grants.

Chapter III – Budgetary Management
99
Further scrutiny of transactions under the Major head 8443 Civil Deposits -800 Other deposits revealed that the amount parked in Minor Head 800 under Major Head 8443 pertains mainly to deposits by Kerala Medical Services Corporation Ltd (KMSCL). An amount of ₹374.39 crore was outstanding as closing balance as on 31.3.2020 under the head of account 8443-00-800-94-Purchase of Equipment through KMSCL. Details are given in Table 3.5 below. Table 3.5: Deposit of Kerala Medical Services Corporation Ltd. (₹ in crore)
OB as on 1.4.2019
Amount credited to the head 8443-00-800-94 during 2019-20
Expenditure during the year 2019-20
Closing balance as on 31.3.2020
72.79 452.39 150.79 374.39
The reasons for the huge amount credited to the deposit head in excess of actual requirement and non-utilisation of the funds out of the amount credited to the deposit head and the balance outstanding during 2019-20 to the tune of ₹374.39 crore were sought from Government. However, no reply has been received.
3.3.3 Misclassification of capital expenditure as revenue expenditure and charged expenditure as voted expenditure and vice versa.
Misclassification of expenditures and receipts has a great impact on the integrity of the financial statements. Article 202 of the Constitution prescribes that, in respect of every financial year, a statement of the estimated receipts and expenditure of the State for that year, called the "annual financial statement" (or the "budget"), is to be laid before House or Houses of the State Legislature. The estimates of expenditure are classified under ‘charged’ (such expenditure as is not to be submitted to the vote of the Legislative Assembly under the provisions of the Constitution) and ‘voted’ items of expenditure separately. Annual Financial Statement distinguishes expenditure on revenue account from other expenditure as explained in Chapter II. State financial rules categorize the primary units of appropriation. There are specific object heads meant for obtaining provision for acquisition of Capital Assets and other Capital Expenditure. These object heads pertaining to booking of expenditure of capital nature should correspond with capital major heads only. Classification of expenditure of revenue nature as capital expenditure or vice-versa, results in understatement/overstatement of revenue expenditure and revenue surplus/deficit, respectively. The misclassification of the above nature observed in audit during the year 2019-20 is detailed as follows:
State Finances Audit Report for the year ended 31 March 2020
100
Misclassification of Revenue expenditure as Capital expenditure It is observed that an amount of ₹14.70 crore was debited to the Head of account 4860-60-190-94 (V) (P). The amount was utilised for disbursement of gratuity to the workers of Kerala State Cashew Development Corporation (KSCDC). Booking of assistance given to KSCDC as Capital expenditure instead of revenue expenditure is inconsistent with the principles laid down in Indian Government Accounting Standards (IGAS) 2 which prescribes principles of accounting and classification of Grants-in-aid in the Financial Statements of the Government both as a Grantor and as a Grantee. This misclassification has resulted in overstatement of investment by ₹14.70 crore.
Misclassification of charged expenditure as voted expenditure As per Article 202 of the Constitution, any sums required to satisfy any judgement, decree or award of any court or arbitral tribunal shall be the expenditure charged to the Consolidated fund of the State. However, it is observed in audit that an amount of ₹0.28 crore debited to the head of account 5054-01-337-92 (V) (P) being the amount required to comply with the direction of the Hon’ble High Court of Kerala which should have been classified as charged, was misclassified as voted expenditure. The misclassification has led to the violation of the provisions of Article 202 of the Constitution. Similar misclassification was also noticed in Grant XXXVII Industries under the head of account 4851-800-99-Plan Voted (₹0.06 crore) 3.3.3.1 Other Misclassifications
Misclassification of Capital expenditure under loan head of account Under Legislative Assembly Constituency Asset Development Scheme (LAC ADS) ₹ five crore has been allocated to each MLA during the financial year for undertaking capital works to improve infrastructural facilities. Provisions have been made under various capital heads of account for this scheme since 2012-13. However, during 2019-20, budget provision of ₹8.49 crore provided under the capital head 5055-00-190-95 LAC ADS has been re-appropriated to the loan head 7055-00-190-94-Project under Legislative Assembly Constituency Asset Development Scheme and ₹1.61 crore was incurred for infrastructure development. Expenditure of capital nature should have been booked under the Capital head against which provision has been made.
Misclassification of Investment as Capital Expenditure Government of Kerala incurred ₹15.00 crore from the head of account 4859-02-004-97 Indian Institute of Information Technology-Kerala, Pala (IIIT-K, Pala) for the construction of building and infrastructure development of permanent campus at Pala. As the expenditure is in the nature of investment the amount should have been booked under investment head under 4859-02-190-94 Indian
Chapter III – Budgetary Management
101
Institute of Information Technology – Kerala, Pala and not under the minor head 004 – Research and Development. 3.3.4 Unnecessary or excessive Supplementary Demand for Grants
There were savings against total budget provision at the end of the financial year for 37 grants/appropriations for which Supplementary budget was obtained. Out of these, 22 grants/appropriations had obtained supplementary Demand for Grants unnecessarily as either the final expenditure did not come even up to the level of original Grants or no expenditure was incurred even after obtaining Supplementary Demand for Grants (Table 3.6). For the remaining 15 Grants, the sum of Original and Supplementary provision obtained was in excess of actual expenditure. Out of these 15 Grants, nine grants which obtained Supplementary provision of more than ₹ 50 lakh are shown in Table 3.7.
Table 3.6: Details of cases where supplementary provision proved unnecessary (₹ in crore)
Sl. No.
Name of the Grant Original Supplementary Actual expenditure
Saving out of Provisions
Revenue (Voted)
1 II-Heads of States, Ministers and Headquarters Staff
740.84 1.91 524.59 218.16
2 III-Administration of Justice 787.69 10.99 760.75 37.93
As per Article 205 of the Constitution, a Supplementary or Additional Grant or Appropriation over the provision made by the Appropriation Act for the year can be made during the current financial year but not after the expiry of the current financial year as is necessary to meet-
i. Expenditure on Schemes of New Expenditure to be taken up within the current financial year.
ii. Inadequacy of provision. iii. Fresh expenditure but not technically “Schemes of New Expenditure.” iv. Omissions of provision.
When such additional expenditure is found to be inevitable and there is no possibility of effecting savings within the Grant to cover the excess by Re-Appropriation, the Secretary in the Department concerned proposes to the Finance Department for Supplementary or Additional Grant or Appropriation.
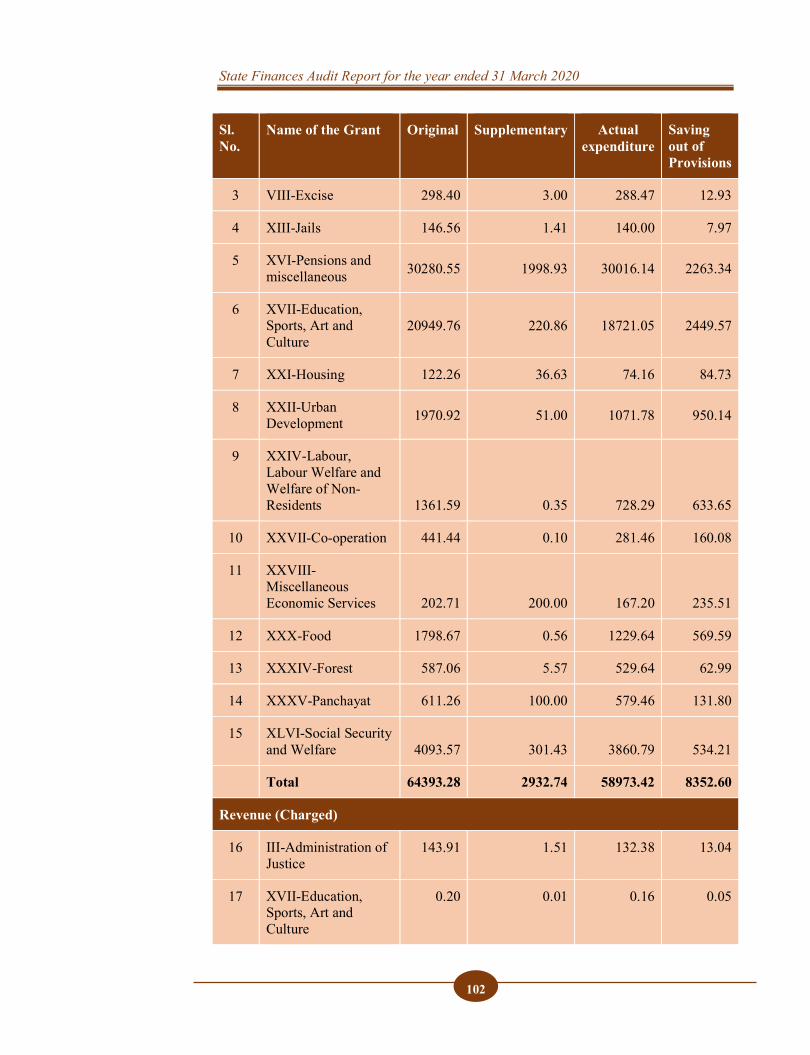
State Finances Audit Report for the year ended 31 March 2020
102
Sl. No.
Name of the Grant Original Supplementary Actual expenditure
Saving out of Provisions
3 VIII-Excise 298.40 3.00 288.47 12.93
4 XIII-Jails 146.56 1.41 140.00 7.97
5 XVI-Pensions and miscellaneous 30280.55 1998.93 30016.14 2263.34
6 XVII-Education, Sports, Art and Culture
20949.76 220.86 18721.05 2449.57
7 XXI-Housing 122.26 36.63 74.16 84.73
8 XXII-Urban Development 1970.92 51.00 1071.78 950.14
9 XXIV-Labour, Labour Welfare and Welfare of Non-Residents 1361.59 0.35 728.29 633.65
10 XXVII-Co-operation 441.44 0.10 281.46 160.08
11 XXVIII-Miscellaneous Economic Services 202.71 200.00 167.20 235.51
12 XXX-Food 1798.67 0.56 1229.64 569.59
13 XXXIV-Forest 587.06 5.57 529.64 62.99
14 XXXV-Panchayat 611.26 100.00 579.46 131.80
15 XLVI-Social Security and Welfare 4093.57 301.43 3860.79 534.21
Total 64393.28 2932.74 58973.42 8352.60
Revenue (Charged)
16 III-Administration of Justice
143.91 1.51 132.38 13.04
17 XVII-Education, Sports, Art and Culture
0.20 0.01 0.16 0.05
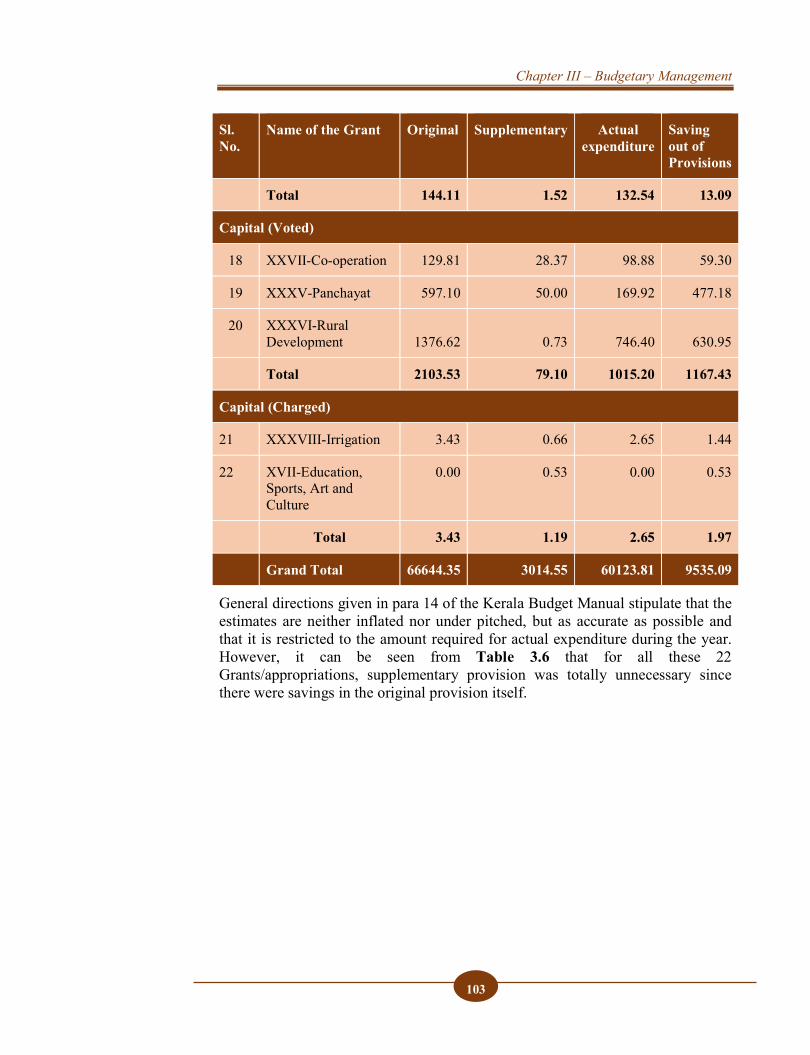
Chapter III – Budgetary Management
103
Sl. No.
Name of the Grant Original Supplementary Actual expenditure
Saving out of Provisions
Total 144.11 1.52 132.54 13.09
Capital (Voted)
18 XXVII-Co-operation 129.81 28.37 98.88 59.30
19 XXXV-Panchayat 597.10 50.00 169.92 477.18
20 XXXVI-Rural Development 1376.62 0.73 746.40 630.95
Total 2103.53 79.10 1015.20 1167.43
Capital (Charged)
21 XXXVIII-Irrigation 3.43 0.66 2.65 1.44
22 XVII-Education, Sports, Art and Culture
0.00 0.53 0.00 0.53
Total 3.43 1.19 2.65 1.97
Grand Total 66644.35 3014.55 60123.81 9535.09
General directions given in para 14 of the Kerala Budget Manual stipulate that the estimates are neither inflated nor under pitched, but as accurate as possible and that it is restricted to the amount required for actual expenditure during the year. However, it can be seen from Table 3.6 that for all these 22 Grants/appropriations, supplementary provision was totally unnecessary since there were savings in the original provision itself.
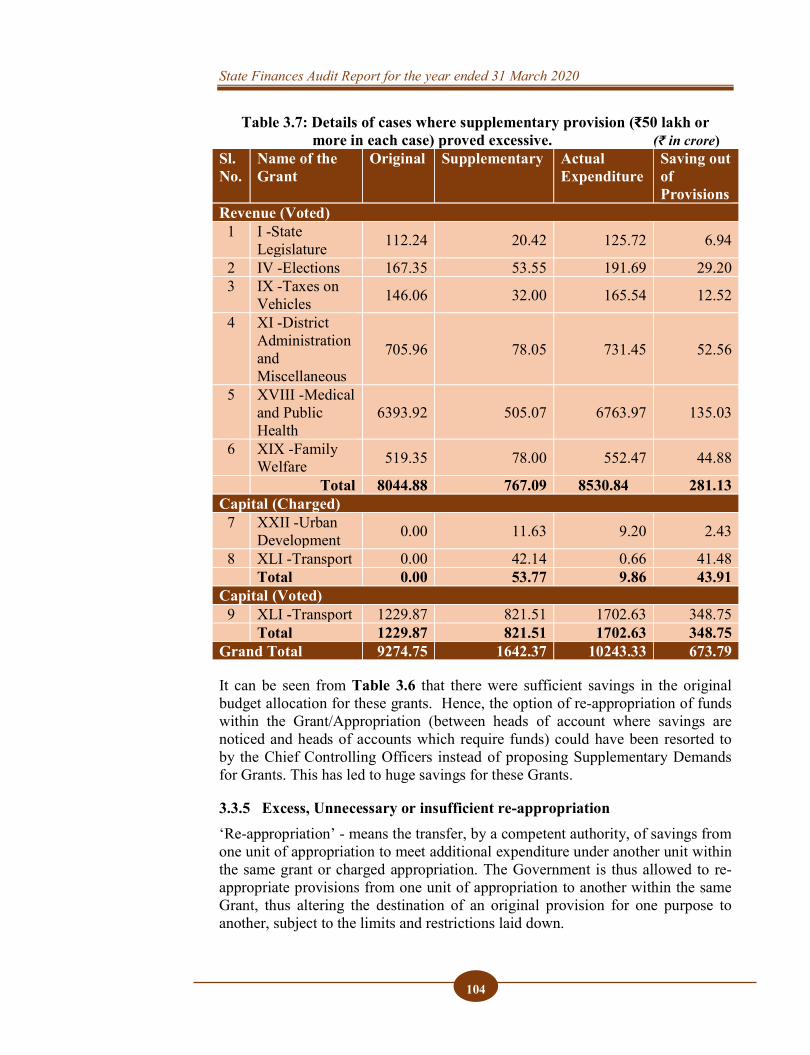
State Finances Audit Report for the year ended 31 March 2020
104
Table 3.7: Details of cases where supplementary provision (₹50 lakh or more in each case) proved excessive. (₹ in crore) Sl. No.
Name of the Grant
Original Supplementary Actual Expenditure
Saving out of Provisions
Revenue (Voted) 1 I -State
Legislature 112.24 20.42 125.72 6.94
2 IV -Elections 167.35 53.55 191.69 29.20 3 IX -Taxes on
Vehicles 146.06 32.00 165.54 12.52
4 XI -District Administration and Miscellaneous
705.96 78.05 731.45 52.56
5 XVIII -Medical and Public Health
6393.92 505.07 6763.97 135.03
6 XIX -Family Welfare 519.35 78.00 552.47 44.88
Total 8044.88 767.09 8530.84 281.13 Capital (Charged)
7 XXII -Urban Development 0.00 11.63 9.20 2.43
8 XLI -Transport 0.00 42.14 0.66 41.48 Total 0.00 53.77 9.86 43.91
Capital (Voted) 9 XLI -Transport 1229.87 821.51 1702.63 348.75 Total 1229.87 821.51 1702.63 348.75
Grand Total 9274.75 1642.37 10243.33 673.79
It can be seen from Table 3.6 that there were sufficient savings in the original budget allocation for these grants. Hence, the option of re-appropriation of funds within the Grant/Appropriation (between heads of account where savings are noticed and heads of accounts which require funds) could have been resorted to by the Chief Controlling Officers instead of proposing Supplementary Demands for Grants. This has led to huge savings for these Grants.
3.3.5 Excess, Unnecessary or insufficient re-appropriation ‘Re-appropriation’ - means the transfer, by a competent authority, of savings from one unit of appropriation to meet additional expenditure under another unit within the same grant or charged appropriation. The Government is thus allowed to re-appropriate provisions from one unit of appropriation to another within the same Grant, thus altering the destination of an original provision for one purpose to another, subject to the limits and restrictions laid down.
Chapter III – Budgetary Management
105
Appropriation Accounts for the year 2019-20, disclosed insufficient re-appropriations in one scheme each of one Grant and one appropriation. It was also observed that amount of re-appropriations ordered in 12 schemes included under seven grants was in excess of the actual requirement as the expenditure under these schemes either did not come up to the level of original/supplementary provision or the augmentation of funds through re-appropriation is in excess of actual requirement. The details of re-appropriation exceeding ₹ five crore are furnished in Appendix 3.1. Paragraph 86 (3) of Kerala Budget Manual stipulates that the authority sanctioning re-appropriations should satisfy itself that the reasons given in the sanctions are full, frank and forthright and are not in vague terms such as ‘based on actual requirement’, ‘based on trend of expenditure’, ‘expenditure is less than that was anticipated’ etc., as they have to be incorporated in the Appropriation accounts which are examined by the Public Accounts Committee of Legislature. However, a test check of re-appropriation orders relating to 10 Grants issued by Finance Department revealed that in respect of 1026 out of 1377 items, (74.51 per cent) the reasons given for withdrawal of provision or augmentation of provision in the re-appropriation orders were of general nature like ‘expenditure is less than anticipated’, ‘reduced provision is sufficient to meet the expenditure’ etc. which indicated the non-compliance of the provisions of Kerala Budget Manual and inadequate expenditure control mechanism.
3.3.6 Unspent amount and surrendered appropriations and/ or large savings/ surrenders
The golden rule for all Estimating Officers should be to provide in the budget for everything that can be foreseen and to provide only as much as is necessary. The Administrative and Finance Departments should, in checking the estimates, apply unrelentingly the proven and well-tried check of average of previous actuals with known or reasonably foreseeable facts which may modify that average. When the need for surrender manifests itself, the Controlling Officers should carefully estimate the amounts that they can surrender. The aim should be to surrender as much as they can so as to keep the expenditure just within the modified Grant. Budgetary allocations based on unrealistic proposals, poor expenditure monitoring mechanism, weak scheme implementation capacities/ weak internal controls promote release of funds towards the end of the financial year, and increase the propensity of the Departments to retain huge balances outside the Government account in Bank Accounts. Excessive savings also deprives other Departments of the funds which they could have utilized. Audit observed that in 35 grants (each having savings exceeding ₹100 crore) budget allocation amounting to ₹29,618.68 crore remained unutilised in Revenue and Capital Sections. Out of this, an amount of ₹27,730.32 crore (93.62 per cent) was surrendered as detailed in Appendix 3.2.
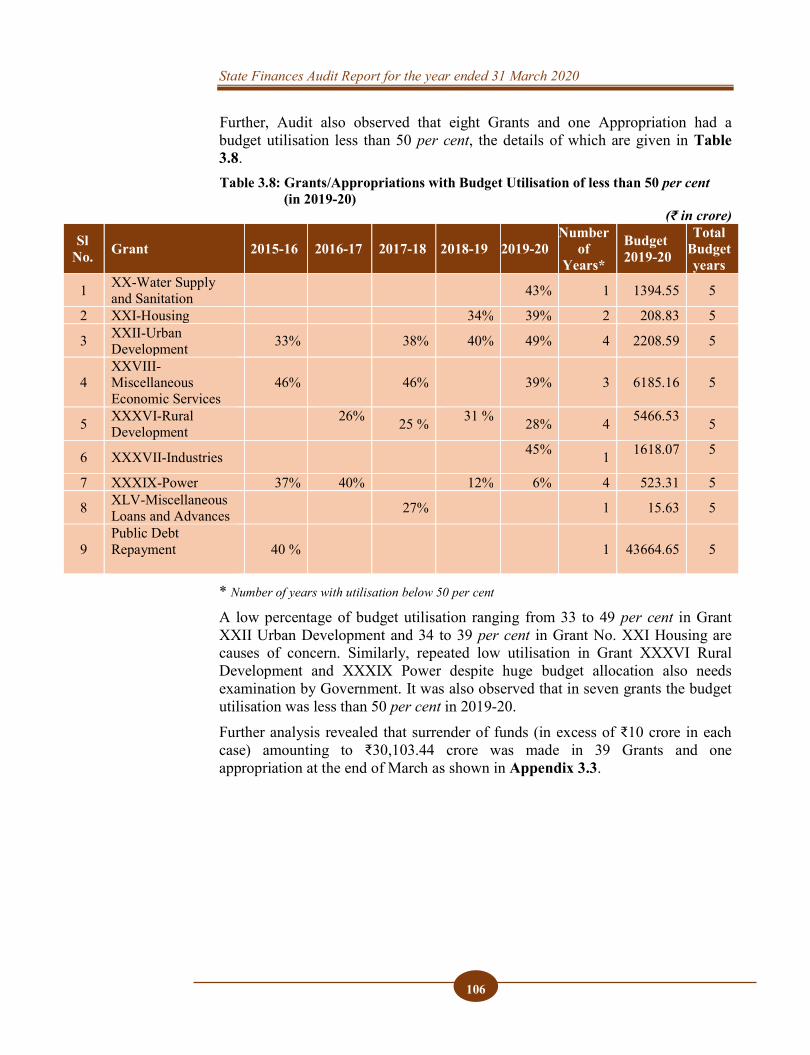
State Finances Audit Report for the year ended 31 March 2020
106
Further, Audit also observed that eight Grants and one Appropriation had a budget utilisation less than 50 per cent, the details of which are given in Table 3.8. Table 3.8: Grants/Appropriations with Budget Utilisation of less than 50 per cent (in 2019-20)
(₹ in crore)
Sl No. Grant 2015-16 2016-17 2017-18 2018-19 2019-20
Number of
Years*
Budget 2019-20
Total Budget years
1 XX-Water Supply and Sanitation 43% 1 1394.55 5
2 XXI-Housing 34% 39% 2 208.83 5
3 XXII-Urban Development 33% 38% 40% 49% 4 2208.59 5
4 XXVIII-Miscellaneous Economic Services
46% 46% 39% 3 6185.16 5
5 XXXVI-Rural Development 26%
25 % 31 % 28% 4 5466.53
5
6 XXXVII-Industries 45% 1 1618.07
5
7 XXXIX-Power 37% 40% 12% 6% 4 523.31 5
8 XLV-Miscellaneous Loans and Advances 27% 1 15.63 5
9 Public Debt Repayment
40 % 1 43664.65 5
* Number of years with utilisation below 50 per cent
A low percentage of budget utilisation ranging from 33 to 49 per cent in Grant XXII Urban Development and 34 to 39 per cent in Grant No. XXI Housing are causes of concern. Similarly, repeated low utilisation in Grant XXXVI Rural Development and XXXIX Power despite huge budget allocation also needs examination by Government. It was also observed that in seven grants the budget utilisation was less than 50 per cent in 2019-20. Further analysis revealed that surrender of funds (in excess of ₹10 crore in each case) amounting to ₹30,103.44 crore was made in 39 Grants and one appropriation at the end of March as shown in Appendix 3.3.
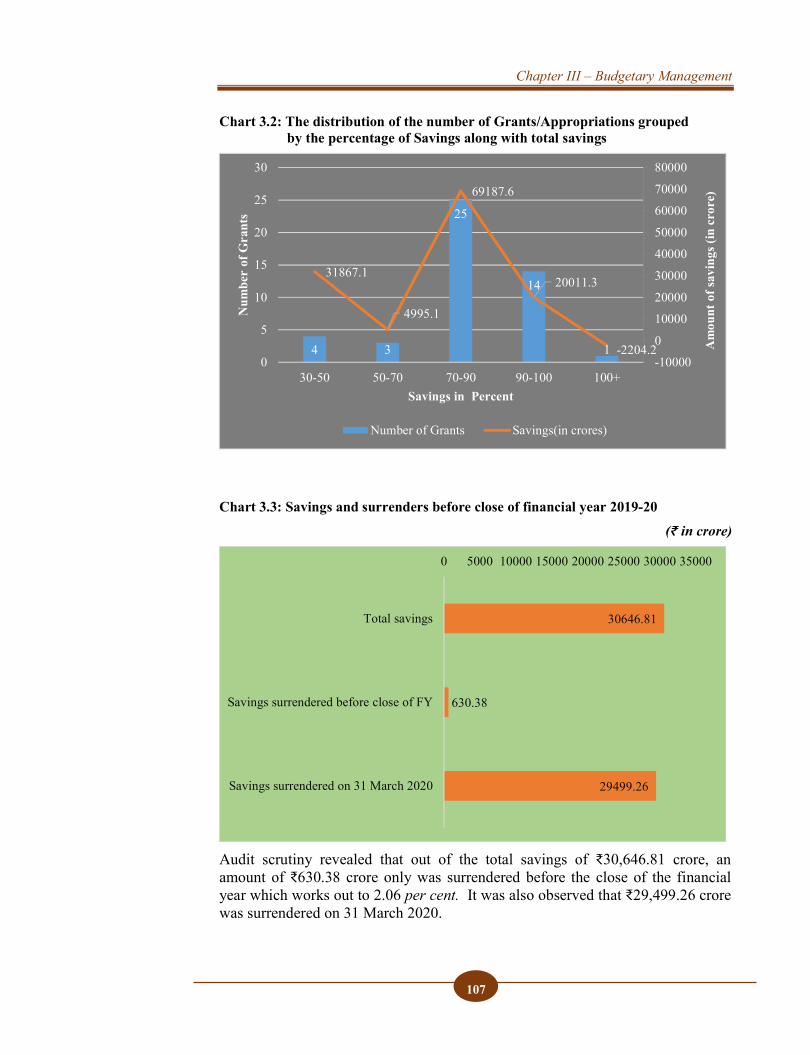
Chapter III – Budgetary Management
107
Chart 3.2: The distribution of the number of Grants/Appropriations grouped by the percentage of Savings along with total savings
Chart 3.3: Savings and surrenders before close of financial year 2019-20
(₹ in crore)
Audit scrutiny revealed that out of the total savings of ₹30,646.81 crore, an amount of ₹630.38 crore only was surrendered before the close of the financial year which works out to 2.06 per cent. It was also observed that ₹29,499.26 crore was surrendered on 31 March 2020.
4 3
25
14
1
31867.1
4995.1
69187.6
20011.3
-2204.2-10000
0
10000
20000
30000
40000
50000
60000
70000
80000
0
5
10
15
20
25
30
30-50 50-70 70-90 90-100 100+
Am
ount
of s
avin
gs (i
n cr
ore)
Num
ber
of G
rant
s
Savings in Percent
Number of Grants Savings(in crores)
29499.26
630.38
30646.81
0 5000 10000 15000 20000 25000 30000 35000
Savings surrendered on 31 March 2020
Savings surrendered before close of FY
Total savings

State Finances Audit Report for the year ended 31 March 2020
108
Chart 3.4: Budget Utilisation during 2015-16 to 2019-20
Audit observed that budget utilisation ranged from 79.4 per cent in 2015-16 to 84.2 per cent in 2019-20. The highest percentage of utilisation was recorded in 2017-18 (92.1 per cent). The percentage of budget utilisation declined from 92.1 per cent in 2017-18 to 89.6 per cent in 2018-19 and finally to 84.2 per cent in 2019-20.
3.3.7 Excess expenditure and its regularisation Article 205(1) (b) of the Constitution provides that if any money has been spent on any service during a financial year in excess of the amount granted for that service and for that year, the Governor shall cause to be presented to the Legislative Assembly of the State, a demand for such excess. This implies that, it is mandatory for a State Government to get excesses over grants/appropriations regularised by the State Legislature for the financial year. Although no time limit for regularisation of excess expenditure has been prescribed under the Article, the regularisation of excess expenditure is done after the completion of discussion of the Appropriation Accounts by the Public Accounts Committee. Failure to do so is in contravention of constitutional provisions and defeats the objective of ensuring accountability by the Legislature of the executive over utilisation of public money.
3.3.7.1 Excess expenditure relating to financial year 2019-20 Excess expenditure over the provision for the year is not only in contravention of the provisions requiring Legislative sanction but also indicative of bad planning, which could be avoided by keeping track of expenditure progression with budget made for the purpose. Cases of excess expenditure over the provision of the financial year are examined.
118891 132058 144882 16037519446379.4
84.5
92.1
89.6
84.2
70
75
80
85
90
95
0
50,000
1,00,000
1,50,000
2,00,000
2,50,000
2015-16 2016-17 2017-18 2018-19 2019-20
Bud
get U
tilisa
tion
(%)
Bud
get A
lloca
tion(
cror
e)
Budget(O+S)(crore) Budget Utilisation(%)
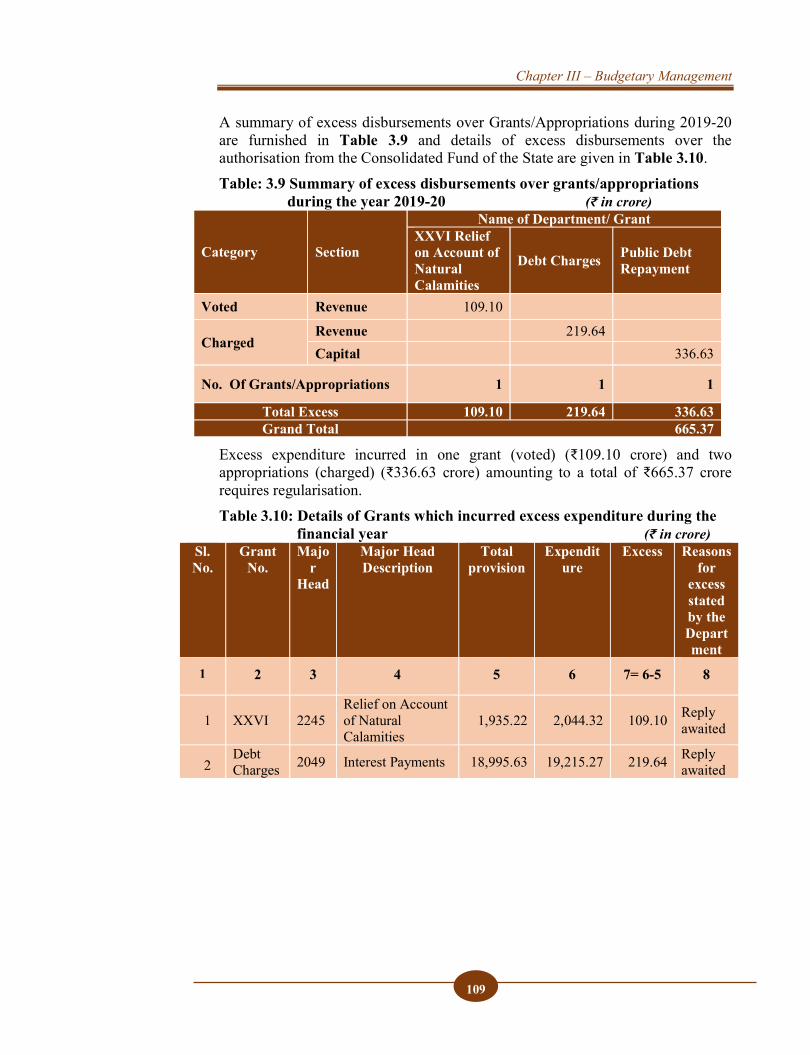
Chapter III – Budgetary Management
109
A summary of excess disbursements over Grants/Appropriations during 2019-20 are furnished in Table 3.9 and details of excess disbursements over the authorisation from the Consolidated Fund of the State are given in Table 3.10. Table: 3.9 Summary of excess disbursements over grants/appropriations
during the year 2019-20 (₹ in crore)
Category Section
Name of Department/ Grant XXVI Relief on Account of Natural Calamities
Debt Charges Public Debt Repayment
Voted Revenue 109.10
Charged Revenue 219.64 Capital 336.63
No. Of Grants/Appropriations 1 1 1
Total Excess 109.10 219.64 336.63 Grand Total 665.37
Excess expenditure incurred in one grant (voted) (₹109.10 crore) and two appropriations (charged) (₹336.63 crore) amounting to a total of ₹665.37 crore requires regularisation. Table 3.10: Details of Grants which incurred excess expenditure during the
financial year (₹ in crore) Sl. No.
Grant No.
Major
Head
Major Head Description
Total provision
Expenditure
Excess Reasons for
excess stated by the Department
1 2 3 4 5 6 7= 6-5 8
1 XXVI 2245 Relief on Account of Natural Calamities
1,935.22 2,044.32 109.10 Reply awaited
2 Debt Charges 2049 Interest Payments 18,995.63 19,215.27 219.64 Reply
awaited
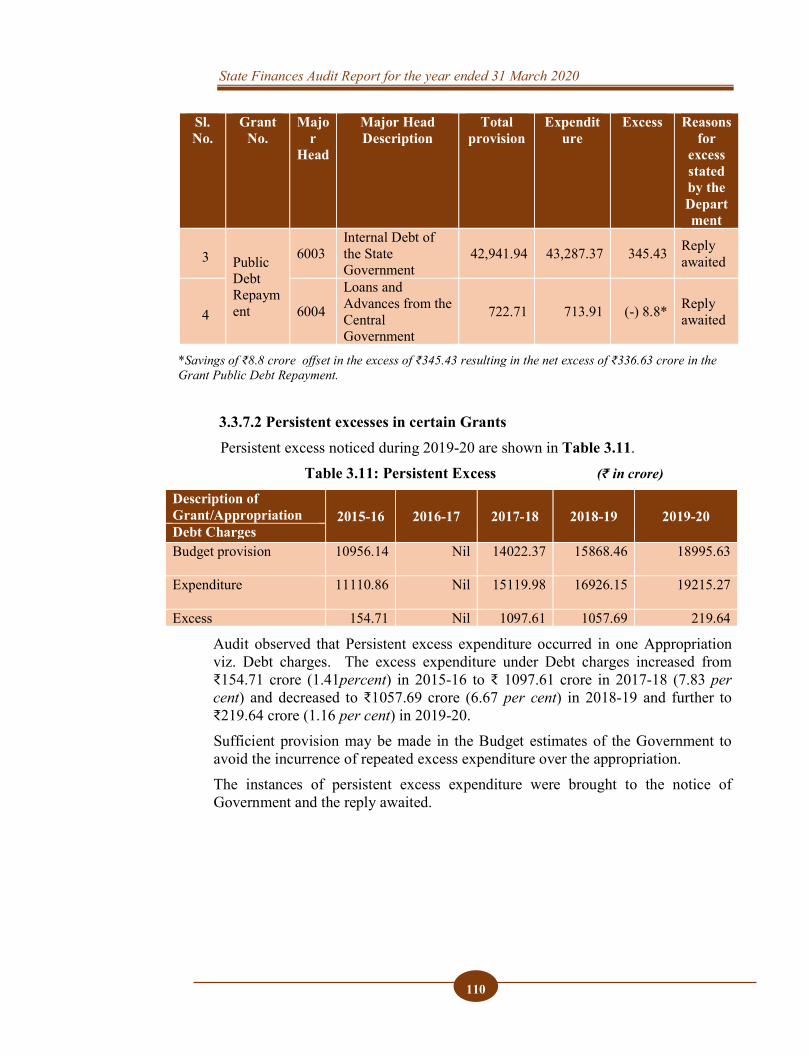
State Finances Audit Report for the year ended 31 March 2020
110
Sl. No.
Grant No.
Major
Head
Major Head Description
Total provision
Expenditure
Excess Reasons for
excess stated by the Department
3 PublicDebt Repayment
6003 Internal Debt of the State Government
42,941.94 43,287.37 345.43 Reply awaited
4 6004
Loans and Advances from the Central Government
722.71 713.91 (-) 8.8* Reply awaited
*Savings of ₹8.8 crore offset in the excess of ₹345.43 resulting in the net excess of ₹336.63 crore in theGrant Public Debt Repayment.
3.3.7.2 Persistent excesses in certain Grants Persistent excess noticed during 2019-20 are shown in Table 3.11.
Table 3.11: Persistent Excess (₹ in crore)
Description of Grant/Appropriation 2015-16 2016-17 2017-18 2018-19 2019-20 Debt Charges Budget provision 10956.14 Nil 14022.37 15868.46 18995.63
Expenditure 11110.86 Nil 15119.98 16926.15 19215.27
Excess 154.71 Nil 1097.61 1057.69 219.64
Audit observed that Persistent excess expenditure occurred in one Appropriation viz. Debt charges. The excess expenditure under Debt charges increased from ₹154.71 crore (1.41percent) in 2015-16 to ₹ 1097.61 crore in 2017-18 (7.83 per cent) and decreased to ₹1057.69 crore (6.67 per cent) in 2018-19 and further to ₹219.64 crore (1.16 per cent) in 2019-20. Sufficient provision may be made in the Budget estimates of the Government to avoid the incurrence of repeated excess expenditure over the appropriation. The instances of persistent excess expenditure were brought to the notice of Government and the reply awaited.
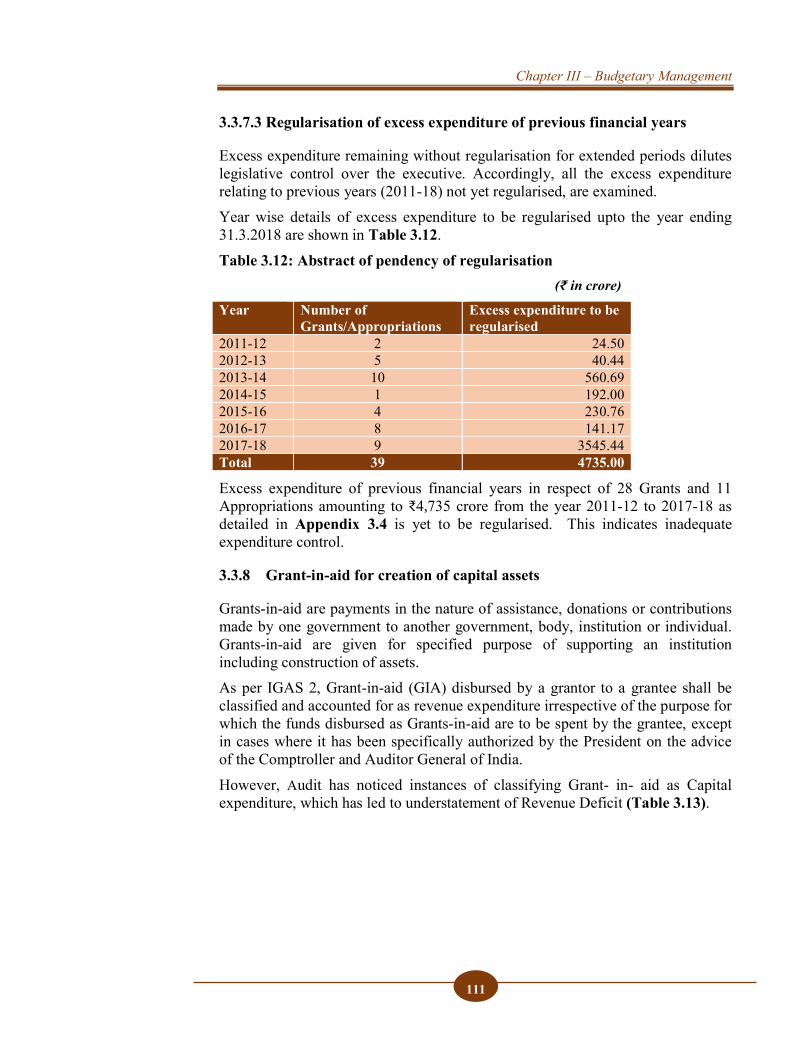
Chapter III – Budgetary Management
111
3.3.7.3 Regularisation of excess expenditure of previous financial years
Excess expenditure remaining without regularisation for extended periods dilutes legislative control over the executive. Accordingly, all the excess expenditure relating to previous years (2011-18) not yet regularised, are examined. Year wise details of excess expenditure to be regularised upto the year ending 31.3.2018 are shown in Table 3.12. Table 3.12: Abstract of pendency of regularisation
(₹ in crore)
Year Number of Grants/Appropriations
Excess expenditure to be regularised
2011-12 2 24.50 2012-13 5 40.44 2013-14 10 560.69 2014-15 1 192.00 2015-16 4 230.76 2016-17 8 141.17 2017-18 9 3545.44 Total 39 4735.00
Excess expenditure of previous financial years in respect of 28 Grants and 11 Appropriations amounting to ₹4,735 crore from the year 2011-12 to 2017-18 as detailed in Appendix 3.4 is yet to be regularised. This indicates inadequate expenditure control.
3.3.8 Grant-in-aid for creation of capital assets
Grants-in-aid are payments in the nature of assistance, donations or contributions made by one government to another government, body, institution or individual. Grants-in-aid are given for specified purpose of supporting an institution including construction of assets. As per IGAS 2, Grant-in-aid (GIA) disbursed by a grantor to a grantee shall be classified and accounted for as revenue expenditure irrespective of the purpose for which the funds disbursed as Grants-in-aid are to be spent by the grantee, except in cases where it has been specifically authorized by the President on the advice of the Comptroller and Auditor General of India. However, Audit has noticed instances of classifying Grant- in- aid as Capital expenditure, which has led to understatement of Revenue Deficit (Table 3.13).
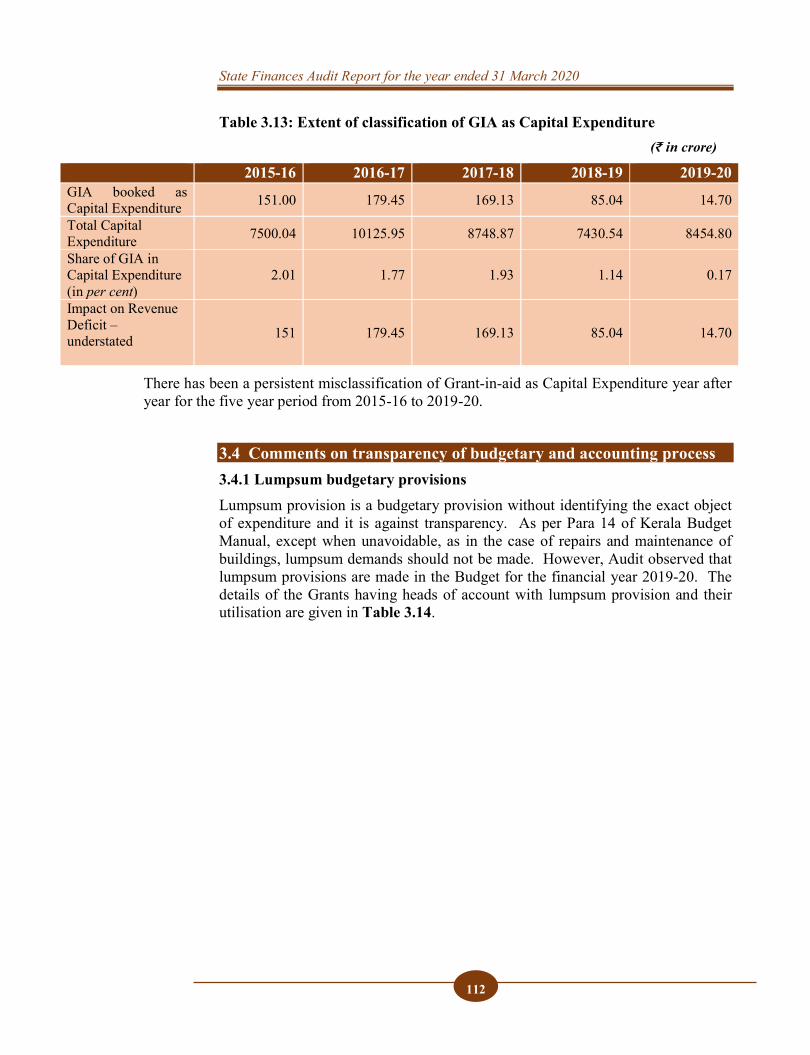
State Finances Audit Report for the year ended 31 March 2020
112
Table 3.13: Extent of classification of GIA as Capital Expenditure (₹ in crore)
2015-16 2016-17 2017-18 2018-19 2019-20 GIA booked as Capital Expenditure 151.00 179.45 169.13 85.04 14.70
Total Capital Expenditure 7500.04 10125.95 8748.87 7430.54 8454.80
Share of GIA in Capital Expenditure (in per cent)
2.01 1.77 1.93 1.14 0.17
Impact on Revenue Deficit – understated 151 179.45 169.13 85.04 14.70
There has been a persistent misclassification of Grant-in-aid as Capital Expenditure year after year for the five year period from 2015-16 to 2019-20.
3.4 Comments on transparency of budgetary and accounting process 3.4.1 Lumpsum budgetary provisions Lumpsum provision is a budgetary provision without identifying the exact object of expenditure and it is against transparency. As per Para 14 of Kerala Budget Manual, except when unavoidable, as in the case of repairs and maintenance of buildings, lumpsum demands should not be made. However, Audit observed that lumpsum provisions are made in the Budget for the financial year 2019-20. The details of the Grants having heads of account with lumpsum provision and their utilisation are given in Table 3.14.
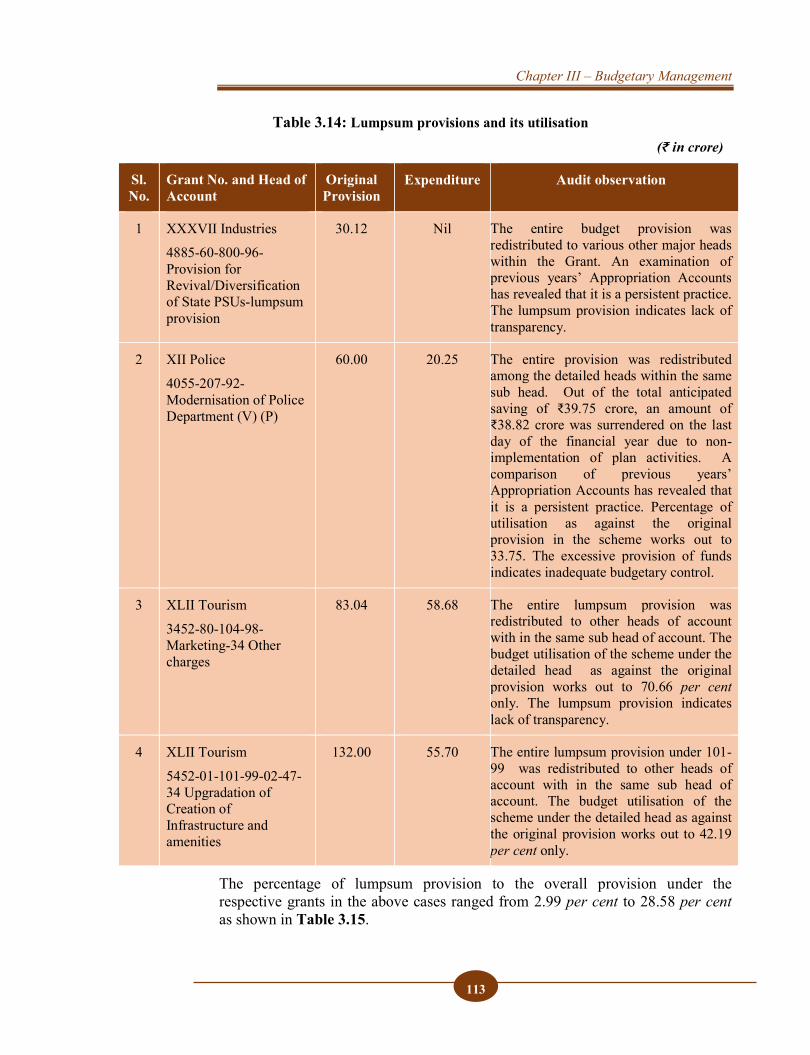
Chapter III – Budgetary Management
113
Table 3.14: Lumpsum provisions and its utilisation
(₹ in crore)
Sl. No.
Grant No. and Head of Account
Original Provision
Expenditure Audit observation
1 XXXVII Industries
4885-60-800-96-Provision for Revival/Diversification of State PSUs-lumpsum provision
30.12 Nil The entire budget provision was redistributed to various other major heads within the Grant. An examination of previous years’ Appropriation Accounts has revealed that it is a persistent practice. The lumpsum provision indicates lack of transparency.
2 XII Police
4055-207-92-Modernisation of Police Department (V) (P)
60.00 20.25 The entire provision was redistributed among the detailed heads within the same sub head. Out of the total anticipated saving of ₹39.75 crore, an amount of ₹38.82 crore was surrendered on the last day of the financial year due to non-implementation of plan activities. A comparison of previous years’ Appropriation Accounts has revealed that it is a persistent practice. Percentage of utilisation as against the original provision in the scheme works out to 33.75. The excessive provision of funds indicates inadequate budgetary control.
3 XLII Tourism
3452-80-104-98-Marketing-34 Other charges
83.04 58.68 The entire lumpsum provision was redistributed to other heads of account with in the same sub head of account. The budget utilisation of the scheme under the detailed head as against the original provision works out to 70.66 per cent only. The lumpsum provision indicates lack of transparency.
4 XLII Tourism
5452-01-101-99-02-47-34 Upgradation of Creation of Infrastructure and amenities
132.00 55.70 The entire lumpsum provision under 101-99 was redistributed to other heads of account with in the same sub head of account. The budget utilisation of the scheme under the detailed head as against the original provision works out to 42.19 per cent only.
The percentage of lumpsum provision to the overall provision under the respective grants in the above cases ranged from 2.99 per cent to 28.58 per cent as shown in Table 3.15.
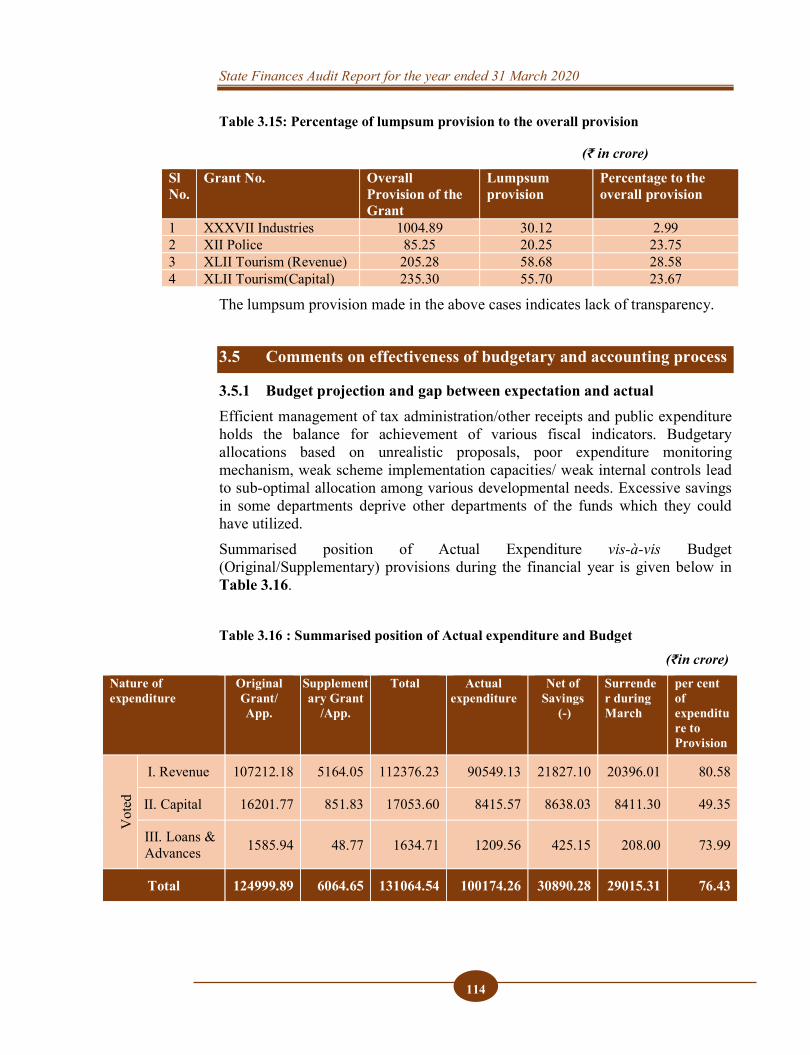
State Finances Audit Report for the year ended 31 March 2020
114
Table 3.15: Percentage of lumpsum provision to the overall provision
(₹ in crore)
Sl No.
Grant No. Overall Provision of the Grant
Lumpsum provision
Percentage to the overall provision
1 XXXVII Industries 1004.89 30.12 2.99 2 XII Police 85.25 20.25 23.75 3 XLII Tourism (Revenue) 205.28 58.68 28.58 4 XLII Tourism(Capital) 235.30 55.70 23.67
The lumpsum provision made in the above cases indicates lack of transparency.
3.5 Comments on effectiveness of budgetary and accounting process
3.5.1 Budget projection and gap between expectation and actual Efficient management of tax administration/other receipts and public expenditure holds the balance for achievement of various fiscal indicators. Budgetary allocations based on unrealistic proposals, poor expenditure monitoring mechanism, weak scheme implementation capacities/ weak internal controls lead to sub-optimal allocation among various developmental needs. Excessive savings in some departments deprive other departments of the funds which they could have utilized. Summarised position of Actual Expenditure vis-à-vis Budget (Original/Supplementary) provisions during the financial year is given below in Table 3.16.
Table 3.16 : Summarised position of Actual expenditure and Budget
(₹in crore) Nature of expenditure
Original Grant/ App.
Supplementary Grant
/App.
Total Actual expenditure
Net of Savings
(-)
Surrender during March
per cent of expenditure to Provision
Vot
ed
I. Revenue 107212.18 5164.05 112376.23 90549.13 21827.10 20396.01 80.58
II. Capital 16201.77 851.83 17053.60 8415.57 8638.03 8411.30 49.35
III. Loans &Advances 1585.94 48.77 1634.71 1209.56 425.15 208.00 73.99
Total 124999.89 6064.65 131064.54 100174.26 30890.28 29015.31 76.43
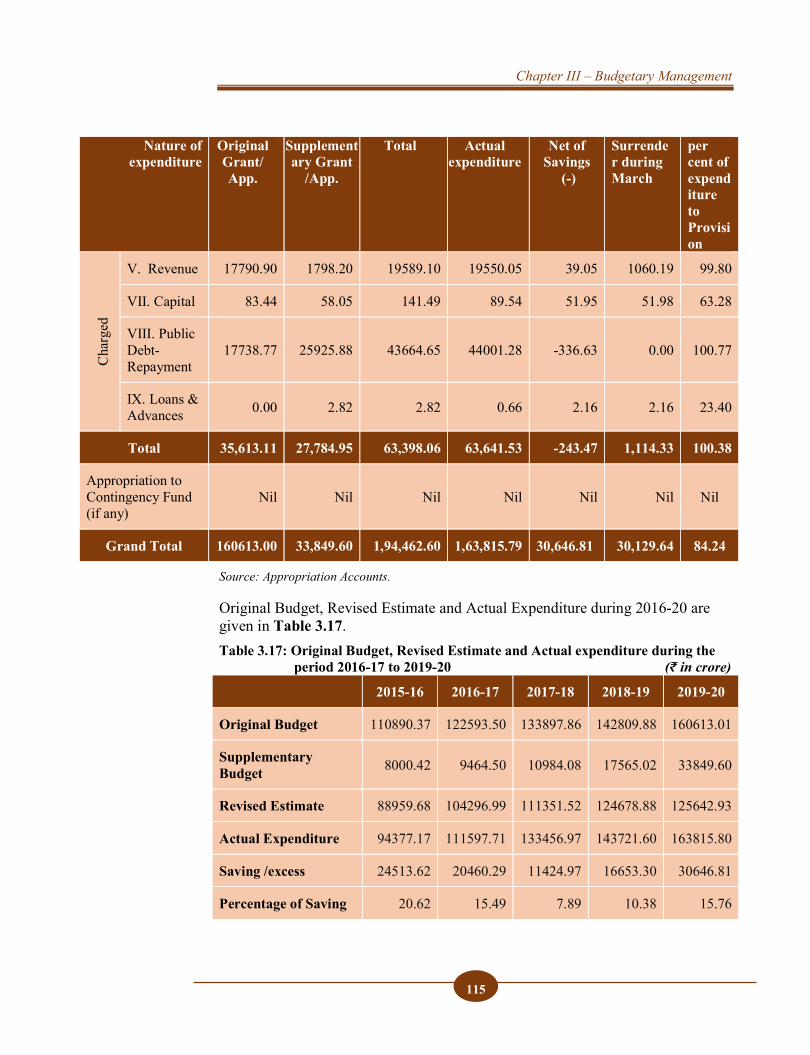
Chapter III – Budgetary Management
115
Source: Appropriation Accounts.
Original Budget, Revised Estimate and Actual Expenditure during 2016-20 are given in Table 3.17. Table 3.17: Original Budget, Revised Estimate and Actual expenditure during the period 2016-17 to 2019-20 (₹ in crore)
2015-16 2016-17 2017-18 2018-19 2019-20
Original Budget 110890.37 122593.50 133897.86 142809.88 160613.01
Supplementary Budget 8000.42 9464.50 10984.08 17565.02 33849.60
Revised Estimate 88959.68 104296.99 111351.52 124678.88 125642.93
Actual Expenditure 94377.17 111597.71 133456.97 143721.60 163815.80
Saving /excess 24513.62 20460.29 11424.97 16653.30 30646.81
Percentage of Saving 20.62 15.49 7.89 10.38 15.76
Nature of expenditure
Original Grant/ App.
Supplementary Grant
/App.
Total Actual expenditure
Net of Savings
(-)
Surrender during March
per cent of expenditure to Provision
Cha
rged
V. Revenue 17790.90 1798.20 19589.10 19550.05 39.05 1060.19 99.80
VII. Capital 83.44 58.05 141.49 89.54 51.95 51.98 63.28
VIII. Public Debt-Repayment
17738.77 25925.88 43664.65 44001.28 -336.63 0.00 100.77
IX. Loans & Advances 0.00 2.82 2.82 0.66 2.16 2.16 23.40
Total 35,613.11 27,784.95 63,398.06 63,641.53 -243.47 1,114.33 100.38
Appropriation to Contingency Fund (if any)
Nil Nil Nil Nil Nil Nil Nil
Grand Total 160613.00 33,849.60 1,94,462.60 1,63,815.79 30,646.81 30,129.64 84.24
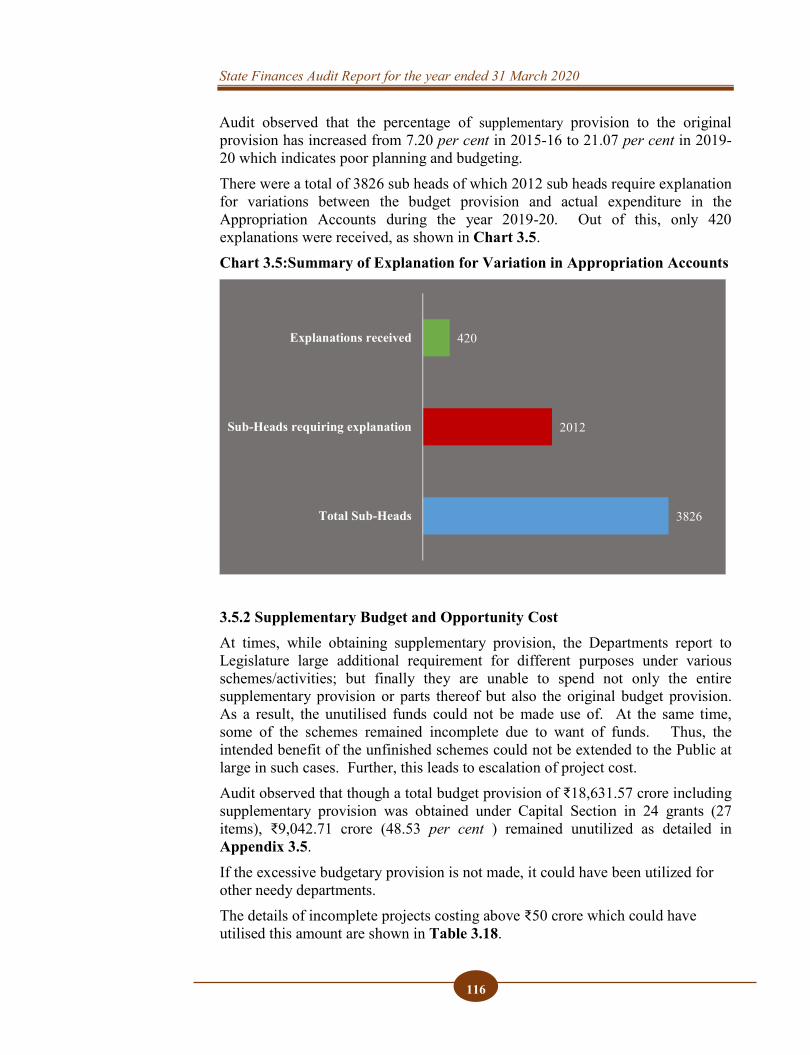
State Finances Audit Report for the year ended 31 March 2020
116
Audit observed that the percentage of supplementary provision to the original provision has increased from 7.20 per cent in 2015-16 to 21.07 per cent in 2019-20 which indicates poor planning and budgeting. There were a total of 3826 sub heads of which 2012 sub heads require explanation for variations between the budget provision and actual expenditure in the Appropriation Accounts during the year 2019-20. Out of this, only 420 explanations were received, as shown in Chart 3.5. Chart 3.5:Summary of Explanation for Variation in Appropriation Accounts
3.5.2 Supplementary Budget and Opportunity Cost At times, while obtaining supplementary provision, the Departments report to Legislature large additional requirement for different purposes under various schemes/activities; but finally they are unable to spend not only the entire supplementary provision or parts thereof but also the original budget provision. As a result, the unutilised funds could not be made use of. At the same time, some of the schemes remained incomplete due to want of funds. Thus, the intended benefit of the unfinished schemes could not be extended to the Public at large in such cases. Further, this leads to escalation of project cost. Audit observed that though a total budget provision of ₹18,631.57 crore including supplementary provision was obtained under Capital Section in 24 grants (27 items), ₹9,042.71 crore (48.53 per cent ) remained unutilized as detailed in Appendix 3.5. If the excessive budgetary provision is not made, it could have been utilized for other needy departments. The details of incomplete projects costing above ₹50 crore which could have utilised this amount are shown in Table 3.18.
3826
2012
420
Total Sub-Heads
Sub-Heads requiring explanation
Explanations received
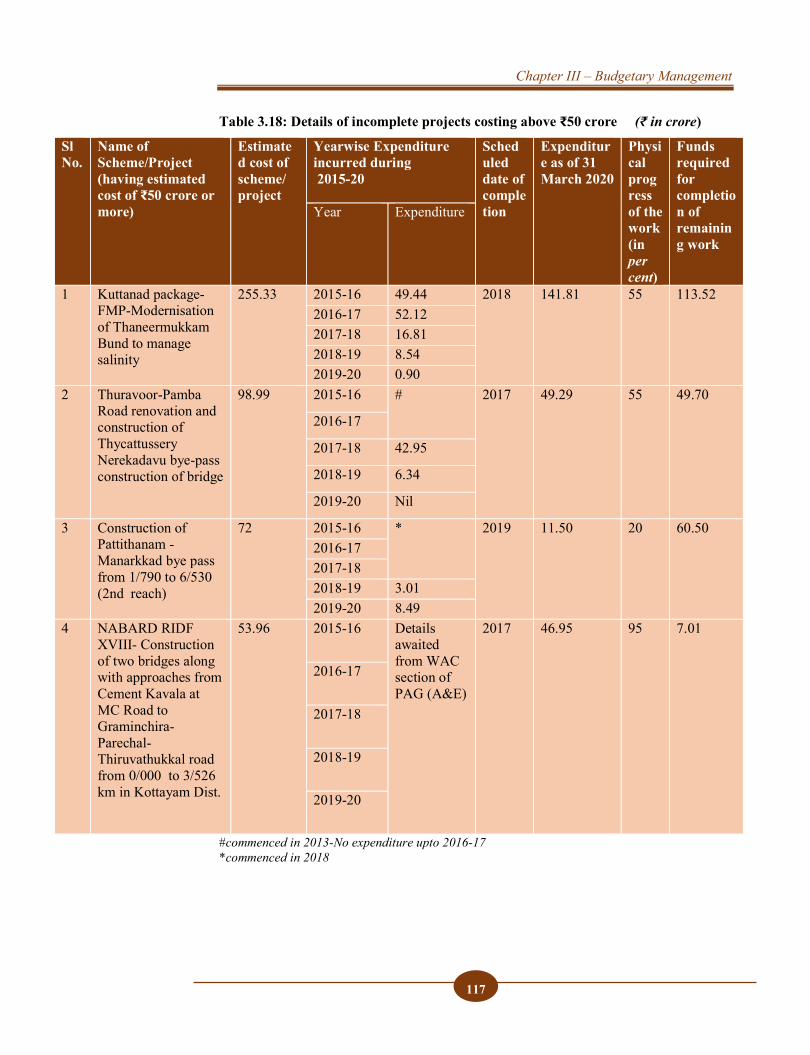
Chapter III – Budgetary Management
117
Table 3.18: Details of incomplete projects costing above ₹50 crore (₹ in crore)
Sl No.
Name of Scheme/Project (having estimated cost of ₹50 crore or more)
Estimated cost of scheme/ project
Yearwise Expenditure incurred during 2015-20
Scheduled date of completion
Expenditure as of 31 March 2020
Physical progress of the work (in per cent)
Funds required for completion of remaining work
Year Expenditure
1 Kuttanad package-FMP-Modernisation of Thaneermukkam Bund to manage salinity
255.33 2015-16 49.44 2018 141.81 55 113.52 2016-17 52.12 2017-18 16.81 2018-19 8.54 2019-20 0.90
2 Thuravoor-Pamba Road renovation and construction of Thycattussery Nerekadavu bye-pass construction of bridge
98.99 2015-16 #
2017 49.29 55 49.70
2016-17
2017-18 42.95
2018-19 6.34
2019-20 Nil
3 Construction of Pattithanam -Manarkkad bye pass from 1/790 to 6/530 (2nd reach)
72 2015-16 * 2019 11.50 20 60.50 2016-17 2017-18 2018-19 3.01 2019-20 8.49
4 NABARD RIDF XVIII- Construction of two bridges along with approaches from Cement Kavala at MC Road to Graminchira-Parechal-Thiruvathukkal road from 0/000 to 3/526 km in Kottayam Dist.
53.96 2015-16 Details awaited from WAC section of PAG (A&E)
2017 46.95 95 7.01
2016-17
2017-18
2018-19
2019-20
#commenced in 2013-No expenditure upto 2016-17 *commenced in 2018
State Finances Audit Report for the year ended 31 March 2020
118
3.5.3 Major policy pronouncements in budget and their actual funding for ensuring implementation
Several schemes for which provision was made in budget were not executed, and thus deprived the beneficiaries of intended benefits. Savings in such schemes deprives other Departments of the funds which they could have utilised. Audit observed that budget provision of ₹ one crore and above was made in 82 schemes included in 23 Grants but no expenditure was incurred in any of these schemes. These schemes were also not withdrawn in revised outlay. (Appendix 3.6).
3.5.4 Financial power being flouted -in relation to re-appropriation ‘Re-appropriation’ - means the transfer, by a competent authority, of savings from one unit of appropriation to another within the same Grant, thus altering the destination of an original provision for one purpose to another, subject to the limits and restrictions laid down. The provisions relating to re-appropriation will be laid down in individual State Budget Manuals. However, there are certain broad instructions that are universally applicable: 1. Limitation for Executive:
(i) No re-appropriation is permissible from Capital to Revenue & vice versa.(ii) No re-appropriation is permissible from Voted to Charged & vice versa.(iii) No re-appropriation is permissible from one Grant to another.However, based on the availability of savings in individual Grants,authorization of Legislature through Supplementary Grant can be obtained bythe Government during the course of the year for utilizing Savings in othersections of the Grants. These are generally referred to as technicalSupplementaries.
2. Generally, Finance Department has powers to sanction re-appropriation fromone Major, Minor or Sub Head to another; and Ministers of respectiveDepartments can sanction Re-appropriation between Heads subordinate toMinor Head, if this does not involve the undertaking of a recurring liability.
3. Permissible re-appropriations within the Grant or Appropriations of a yearcan be sanctioned at any time within the year but not after the expiry of theyear.
4. No re-appropriation shall be made for any purpose whatsoever fromSupplementary Grants voted by the Assembly for a definite purpose, so as toensure that a Supplementary Grant shall be used for the purpose for which itis voted.
5. In a case in which provision made in the Budget under a Sub Head isexpected to be exceeded, re-appropriation should ordinarily be postponed
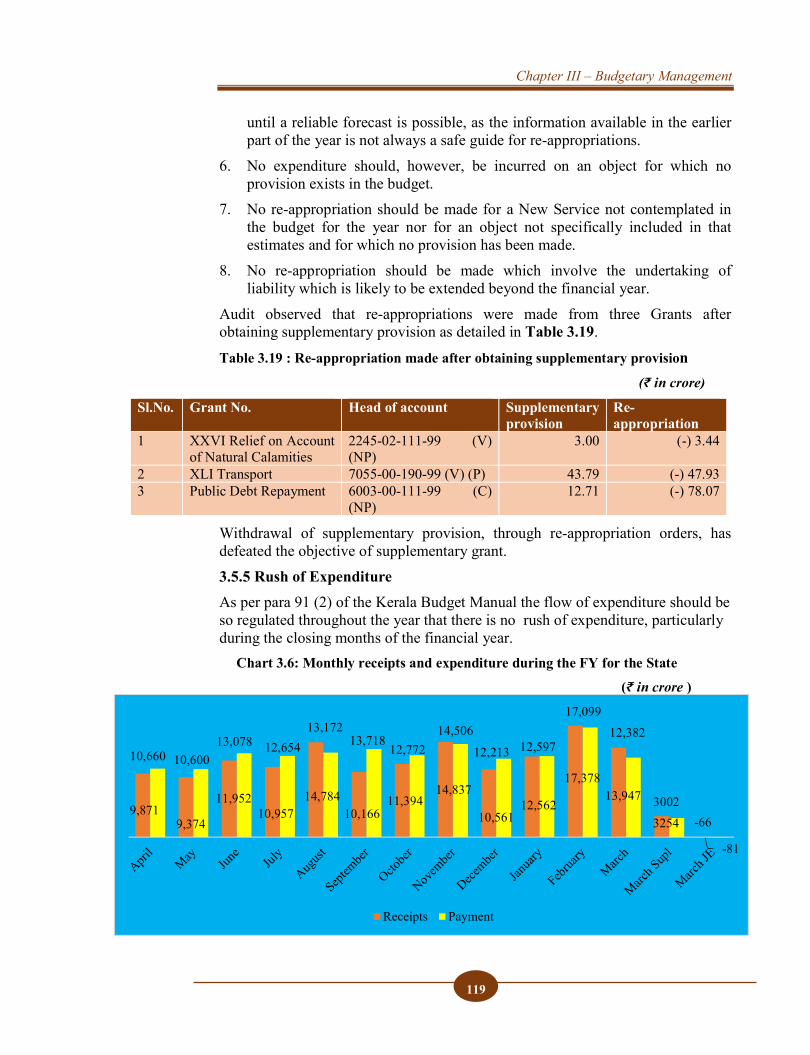
Chapter III – Budgetary Management
119
until a reliable forecast is possible, as the information available in the earlier part of the year is not always a safe guide for re-appropriations.
6. No expenditure should, however, be incurred on an object for which noprovision exists in the budget.
7. No re-appropriation should be made for a New Service not contemplated inthe budget for the year nor for an object not specifically included in thatestimates and for which no provision has been made.
8. No re-appropriation should be made which involve the undertaking ofliability which is likely to be extended beyond the financial year.
Audit observed that re-appropriations were made from three Grants after obtaining supplementary provision as detailed in Table 3.19.
Table 3.19 : Re-appropriation made after obtaining supplementary provision (₹ in crore)
Sl.No. Grant No. Head of account Supplementary provision
Re-appropriation
1 XXVI Relief on Account of Natural Calamities
2245-02-111-99 (V) (NP)
3.00 (-) 3.44
2 XLI Transport 7055-00-190-99 (V) (P) 43.79 (-) 47.93 3 Public Debt Repayment 6003-00-111-99 (C)
(NP) 12.71 (-) 78.07
Withdrawal of supplementary provision, through re-appropriation orders, has defeated the objective of supplementary grant. 3.5.5 Rush of Expenditure As per para 91 (2) of the Kerala Budget Manual the flow of expenditure should be so regulated throughout the year that there is no rush of expenditure, particularly during the closing months of the financial year.
Chart 3.6: Monthly receipts and expenditure during the FY for the State
(₹ in crore )
9,8719,374
11,95210,957
14,78410,166
11,39414,837
10,56112,562
17,37813,947
3254
-81
10,660 10,60013,078 12,654
13,17213,718
12,77214,506
12,213 12,597
17,09912,382
3002-66
Receipts Payment
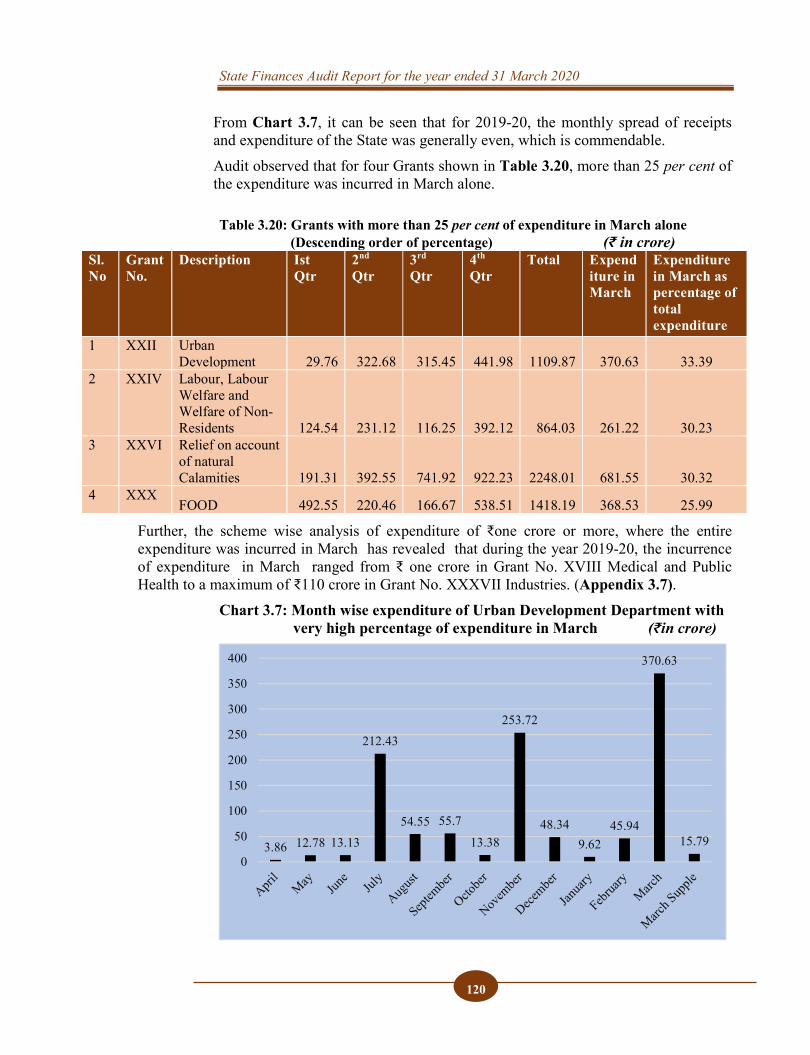
State Finances Audit Report for the year ended 31 March 2020
120
From Chart 3.7, it can be seen that for 2019-20, the monthly spread of receipts and expenditure of the State was generally even, which is commendable. Audit observed that for four Grants shown in Table 3.20, more than 25 per cent of the expenditure was incurred in March alone. Table 3.20: Grants with more than 25 per cent of expenditure in March alone (Descending order of percentage) (₹ in crore)
Sl. No
Grant No.
Description Ist Qtr
2nd Qtr
3rd Qtr
4th Qtr
Total Expenditure in March
Expenditure in March as percentage of total expenditure
1 XXII Urban Development 29.76 322.68 315.45 441.98 1109.87 370.63 33.39
2 XXIV Labour, Labour Welfare and Welfare of Non-Residents 124.54 231.12 116.25 392.12 864.03 261.22 30.23
3 XXVI Relief on account of natural Calamities 191.31 392.55 741.92 922.23 2248.01 681.55 30.32
4 XXX FOOD 492.55 220.46 166.67 538.51 1418.19 368.53 25.99
Further, the scheme wise analysis of expenditure of ₹one crore or more, where the entire expenditure was incurred in March has revealed that during the year 2019-20, the incurrence of expenditure in March ranged from ₹ one crore in Grant No. XVIII Medical and Public Health to a maximum of ₹110 crore in Grant No. XXXVII Industries. (Appendix 3.7).
Chart 3.7: Month wise expenditure of Urban Development Department with very high percentage of expenditure in March (₹in crore)
3.86 12.78 13.13
212.43
54.55 55.7
13.38
253.72
48.349.62
45.94
370.63
15.790
50
100
150
200
250
300
350
400
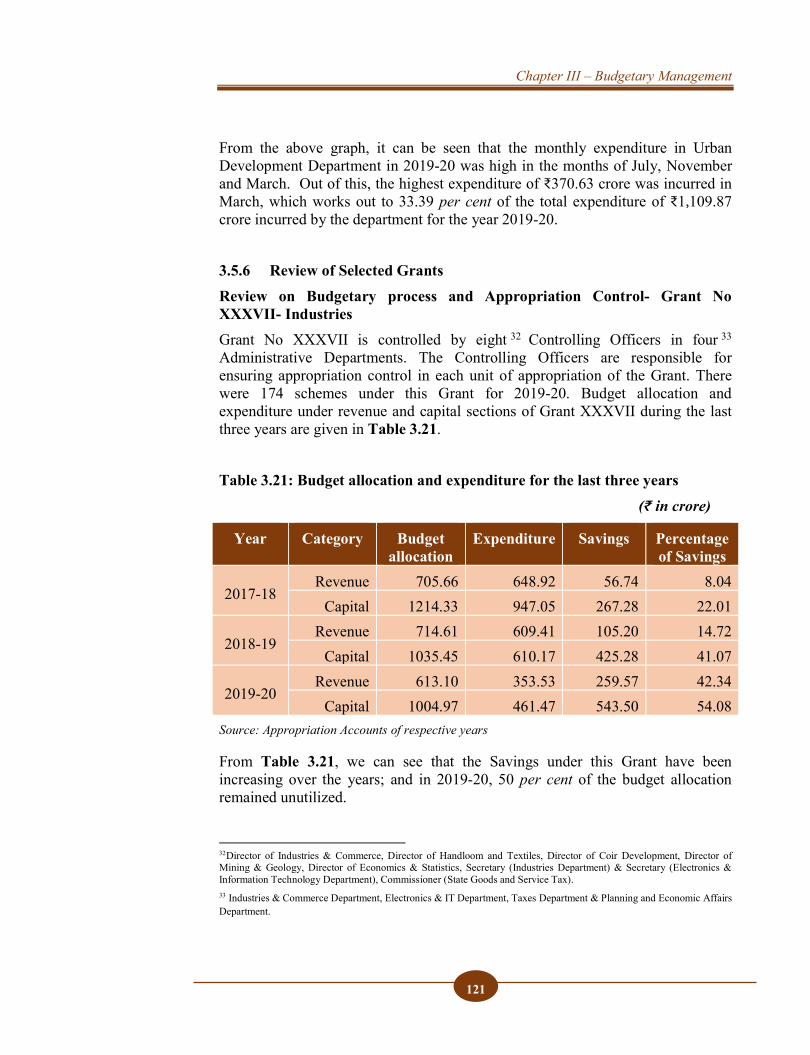
Chapter III – Budgetary Management
121
From the above graph, it can be seen that the monthly expenditure in Urban Development Department in 2019-20 was high in the months of July, November and March. Out of this, the highest expenditure of ₹370.63 crore was incurred in March, which works out to 33.39 per cent of the total expenditure of ₹1,109.87 crore incurred by the department for the year 2019-20.
3.5.6 Review of Selected Grants Review on Budgetary process and Appropriation Control- Grant No XXXVII- Industries Grant No XXXVII is controlled by eight 32 Controlling Officers in four 33 Administrative Departments. The Controlling Officers are responsible for ensuring appropriation control in each unit of appropriation of the Grant. There were 174 schemes under this Grant for 2019-20. Budget allocation and expenditure under revenue and capital sections of Grant XXXVII during the last three years are given in Table 3.21.
Table 3.21: Budget allocation and expenditure for the last three years (₹ in crore)
Year Category Budget allocation
Expenditure Savings Percentage of Savings
2017-18 Revenue 705.66 648.92 56.74 8.04
Capital 1214.33 947.05 267.28 22.01
2018-19 Revenue 714.61 609.41 105.20 14.72
Capital 1035.45 610.17 425.28 41.07
2019-20 Revenue 613.10 353.53 259.57 42.34
Capital 1004.97 461.47 543.50 54.08 Source: Appropriation Accounts of respective years
From Table 3.21, we can see that the Savings under this Grant have been increasing over the years; and in 2019-20, 50 per cent of the budget allocation remained unutilized.
32Director of Industries & Commerce, Director of Handloom and Textiles, Director of Coir Development, Director of Mining & Geology, Director of Economics & Statistics, Secretary (Industries Department) & Secretary (Electronics & Information Technology Department), Commissioner (State Goods and Service Tax). 33 Industries & Commerce Department, Electronics & IT Department, Taxes Department & Planning and Economic Affairs Department.
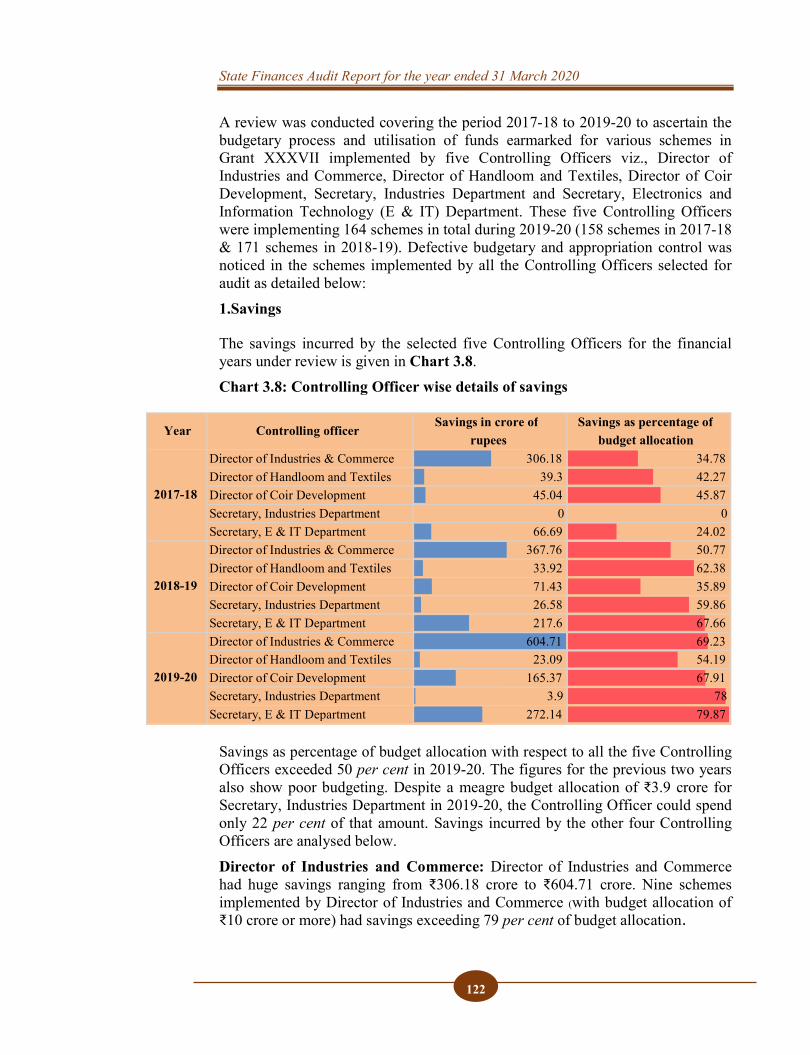
State Finances Audit Report for the year ended 31 March 2020
122
A review was conducted covering the period 2017-18 to 2019-20 to ascertain the budgetary process and utilisation of funds earmarked for various schemes in Grant XXXVII implemented by five Controlling Officers viz., Director of Industries and Commerce, Director of Handloom and Textiles, Director of Coir Development, Secretary, Industries Department and Secretary, Electronics and Information Technology (E & IT) Department. These five Controlling Officers were implementing 164 schemes in total during 2019-20 (158 schemes in 2017-18 & 171 schemes in 2018-19). Defective budgetary and appropriation control was noticed in the schemes implemented by all the Controlling Officers selected for audit as detailed below: 1.Savings
The savings incurred by the selected five Controlling Officers for the financial years under review is given in Chart 3.8. Chart 3.8: Controlling Officer wise details of savings
Savings as percentage of budget allocation with respect to all the five Controlling Officers exceeded 50 per cent in 2019-20. The figures for the previous two years also show poor budgeting. Despite a meagre budget allocation of ₹3.9 crore for Secretary, Industries Department in 2019-20, the Controlling Officer could spend only 22 per cent of that amount. Savings incurred by the other four Controlling Officers are analysed below. Director of Industries and Commerce: Director of Industries and Commerce had huge savings ranging from ₹306.18 crore to ₹604.71 crore. Nine schemes implemented by Director of Industries and Commerce (with budget allocation of ₹10 crore or more) had savings exceeding 79 per cent of budget allocation
Year Controlling officer Savings in crore of
rupeesSavings as percentage of
budget allocationDirector of Industries & Commerce 306.18 34.78Director of Handloom and Textiles 39.3 42.27Director of Coir Development 45.04 45.87Secretary, Industries Department 0 0Secretary, E & IT Department 66.69 24.02Director of Industries & Commerce 367.76 50.77Director of Handloom and Textiles 33.92 62.38Director of Coir Development 71.43 35.89Secretary, Industries Department 26.58 59.86Secretary, E & IT Department 217.6 67.66Director of Industries & Commerce 604.71 69.23Director of Handloom and Textiles 23.09 54.19Director of Coir Development 165.37 67.91Secretary, Industries Department 3.9 78Secretary, E & IT Department 272.14 79.87
2017-18
2018-19
2019-20
Chapter III – Budgetary Management
123
Non-utilisation of entire budget allocation is seen in the case of four schemes34 to be implemented by the Director. During the three year under review the entire budget provision for revival of state PSUs amounting to ₹186.41 crore remained unutilised, and despite non-utilisation, budget was provided year after year (Appendix 3.8). Four schemes implemented by Director of Industries and Commerce have been showing savings of ₹10 crore or more persistently every year during the three-year period under review (Appendix 3.9). Secretary, E & IT Department: Four schemes with budget allocation of ₹10 crore or more implemented by Secretary, E & IT Department had savings ranging from 77.37 per cent to 100 per cent of budget allocation. Despite meagre expenditure on Cyberpark in 2018-19, an amount of ₹21.69 crore was allocated in 2019-20, and the entire allocation remained unutilised during that year (Appendix 3.8). Two schemes implemented by Secretary, E & IT Department have been showing savings of ₹16 crore or more persistently every year during the three-year period under review. For one of these two schemes (Kerala State Information Technology Infrastructure Limited), the budget allocation was increased year after year, even though its yearly savings were significant (Appendix 3.9). Director of Coir Development & Director of Handloom and Textiles: When schemes with budget allocation of ₹10 crore or more was examined, audit saw that three schemes implemented by the Director of Coir Development showed immense savings compared to budget allocation ranging from 78.96 per cent to 100 per cent (Appendix 3.8). Out of these, one scheme (Regulated Mechanisation of Coir Industry) had persistent savings of ₹18 crore or more every year during the three year under review(Appendix 3.9). One scheme with budget allocation of ₹10 crore or more implemented by the Director of Handloom and Textiles also showed immense savings of 82.51 per cent of the budget allocation during 2018-19 (Appendix 3.8). Entire budget allocation surrendered: There were 52 schemes having budget allocation exceeding ₹10 crore implemented by the selected Controlling Officers during the three-year period. On a scrutiny of these 52 schemes, audit observed that for five schemes implemented by three 35 Controlling Officers the entire budget remained unutilised and was surrendered at the end of the respective financial year. The details are given in Appendix 3.10. Huge savings, persistent savings on the same scheme year after year and surrender of entire budget allocation in some cases indicate failure of the respective Controlling Officers and the Finance Department to realistically estimate the budgetary requirement based on current expenditure trends and projections for next year. The existing system of budget allocation may be re-evaluated so that the wide disparity in projection and actuals can be addressed.
34Only schemes with budget allocation of ₹10 crore or more are considered here. There were 52 schemes having budget allocation of ₹10 crore or more implemented by selected Controlling Officers during the three-year period. 35Director of Industries & Commerce (2 Schemes), Secretary/ Electronics & IT Department (2 Schemes) & Director of Coir Development (1 Scheme).
State Finances Audit Report for the year ended 31 March 2020
124
2. Surrender in excess of actual savings As per Paragraph 91 of the Kerala Budget Manual, the Administrative Departments should surrender all anticipated savings before the close of the financial year to the Finance Department as and when they are foreseen, unless they are required to meet excesses under other units of appropriation. During the financial year, if it is found that the budget grant cannot be utilised in full, then the funds in excess of requirements are to be surrendered by the disbursing officers. Subsequently, the Chief Controlling Officer has to remit back the savings of the Grant to the Finance Department. Due care must be taken to accurately assess the requirements for the remaining part of the year before making surrender proposals, to have optimal allocation of available funds between schemes. Audit examined the detailed Appropriation Accounts of last three years with respect to the five selected Controlling Officers. Audit found that excess surrender led to excess expenditure over and above budget allocation in the case of eight Schemes under Director of Industries and Commerce and two schemes under Secretary, Industries Department (Appendix 3.11). A major share of excess expenditure occurred under the head of account 6885-60-190-99 ‘Loans to Kerala Industrial Infrastructure Development Corporation (P)’ administered by Director of Industries and Commerce in 2017-18 wherein an amount of ₹54.38 crore was surrendered during the year end leading to excess expenditure of ₹28.08 crore under the scheme. These instances of injudicious surrender indicated inadequate appropriation checks exercised by departmental officers in the heads of account under their control. 3. Injudicious Re-appropriation Re-appropriation is transfer of funds within a Grant from one unit of appropriation, where savings are anticipated, to another unit where augmentation is needed. Audit analysis revealed that augmentation of budget allocation through re-appropriation was wholly unnecessary in 18 schemes under four36 Controlling Officers, as detailed in Appendix 3.12, since the final expenditure was less than the budget allocation (original and supplementary grant) provided under it. Sub heads where savings are greater than ₹ three crore are given in Table 3.22. 36Director of Industries & Commerce ( 12 Schemes), Director of Coir Development (3 Schemes) , Director of Handloom & Textiles (2 Schemes) & Secretary/Electronics and IT Department (1 Scheme)
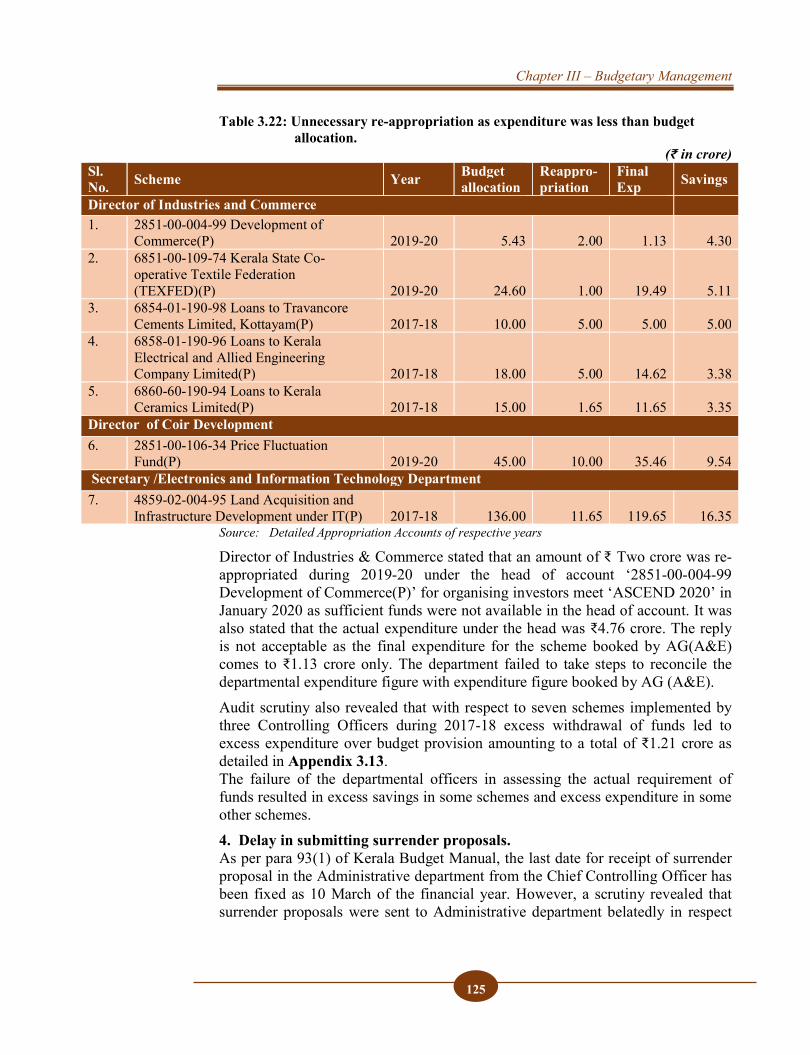
Chapter III – Budgetary Management
125
Table 3.22: Unnecessary re-appropriation as expenditure was less than budget allocation.
(₹ in crore) Sl. No. Scheme Year Budget
allocation Reappro-priation
Final Exp Savings
Director of Industries and Commerce 1. 2851-00-004-99 Development of
Commerce(P) 2019-20 5.43 2.00 1.13 4.30 2. 6851-00-109-74 Kerala State Co-
operative Textile Federation (TEXFED)(P) 2019-20 24.60 1.00 19.49 5.11
3. 6854-01-190-98 Loans to Travancore Cements Limited, Kottayam(P) 2017-18 10.00 5.00 5.00 5.00
4. 6858-01-190-96 Loans to Kerala Electrical and Allied Engineering Company Limited(P) 2017-18 18.00 5.00 14.62 3.38
5. 6860-60-190-94 Loans to Kerala Ceramics Limited(P) 2017-18 15.00 1.65 11.65 3.35
Director of Coir Development 6. 2851-00-106-34 Price Fluctuation
Fund(P) 2019-20 45.00 10.00 35.46 9.54 Secretary /Electronics and Information Technology Department 7. 4859-02-004-95 Land Acquisition and
Infrastructure Development under IT(P) 2017-18 136.00 11.65 119.65 16.35 Source: Detailed Appropriation Accounts of respective years
Director of Industries & Commerce stated that an amount of ₹ Two crore was re-appropriated during 2019-20 under the head of account ‘2851-00-004-99 Development of Commerce(P)’ for organising investors meet ‘ASCEND 2020’ in January 2020 as sufficient funds were not available in the head of account. It was also stated that the actual expenditure under the head was ₹4.76 crore. The reply is not acceptable as the final expenditure for the scheme booked by AG(A&E) comes to ₹1.13 crore only. The department failed to take steps to reconcile the departmental expenditure figure with expenditure figure booked by AG (A&E). Audit scrutiny also revealed that with respect to seven schemes implemented by three Controlling Officers during 2017-18 excess withdrawal of funds led to excess expenditure over budget provision amounting to a total of ₹1.21 crore as detailed in Appendix 3.13. The failure of the departmental officers in assessing the actual requirement of funds resulted in excess savings in some schemes and excess expenditure in some other schemes. 4. Delay in submitting surrender proposals. As per para 93(1) of Kerala Budget Manual, the last date for receipt of surrender proposal in the Administrative department from the Chief Controlling Officer has been fixed as 10 March of the financial year. However, a scrutiny revealed that surrender proposals were sent to Administrative department belatedly in respect
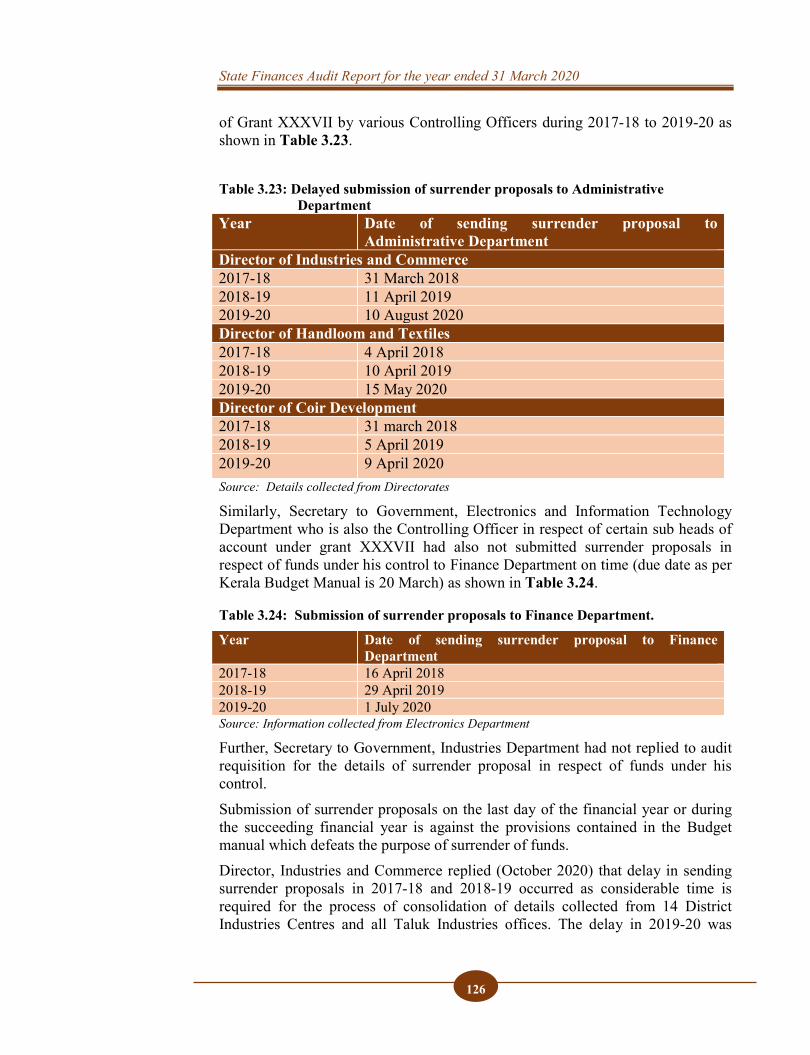
State Finances Audit Report for the year ended 31 March 2020
126
of Grant XXXVII by various Controlling Officers during 2017-18 to 2019-20 as shown in Table 3.23.
Table 3.23: Delayed submission of surrender proposals to Administrative Department
Year Date of sending surrender proposal to Administrative Department
Director of Industries and Commerce 2017-18 31 March 2018 2018-19 11 April 2019 2019-20 10 August 2020 Director of Handloom and Textiles 2017-18 4 April 2018 2018-19 10 April 2019 2019-20 15 May 2020 Director of Coir Development 2017-18 31 march 2018 2018-19 5 April 2019 2019-20 9 April 2020 Source: Details collected from Directorates
Similarly, Secretary to Government, Electronics and Information Technology Department who is also the Controlling Officer in respect of certain sub heads of account under grant XXXVII had also not submitted surrender proposals in respect of funds under his control to Finance Department on time (due date as per Kerala Budget Manual is 20 March) as shown in Table 3.24.
Table 3.24: Submission of surrender proposals to Finance Department.
Year Date of sending surrender proposal to Finance Department
2017-18 16 April 2018 2018-19 29 April 2019 2019-20 1 July 2020 Source: Information collected from Electronics Department
Further, Secretary to Government, Industries Department had not replied to audit requisition for the details of surrender proposal in respect of funds under his control. Submission of surrender proposals on the last day of the financial year or during the succeeding financial year is against the provisions contained in the Budget manual which defeats the purpose of surrender of funds. Director, Industries and Commerce replied (October 2020) that delay in sending surrender proposals in 2017-18 and 2018-19 occurred as considerable time is required for the process of consolidation of details collected from 14 District Industries Centres and all Taluk Industries offices. The delay in 2019-20 was
Chapter III – Budgetary Management
127
attributed to the Covid 19 pandemic related lockdown and restrictions from March. It was also stated that action would be taken to avoid delay in submitting surrender proposals in future. The reply is not convincing as the pandemic related lockdown was ordered only from 24 March 2020 onwards and as per the provisions of Kerala Budget Manual, the surrender proposals to the Administrative departments and Finance department had to be submitted on 10 and 20 March 2020, respectively. All Controlling Officers may begin the review and re-evaluation of budget for the ongoing year well in advance so that surrender proposals can be submitted well in time. 5. Non-reconciliation of departmental figures According to Paragraph 74 of Kerala Budget Manual, the expenditure recorded in the books of the Controlling Officer of the departments should be reconciled every month with that recorded in the books of the AG (A&E), Kerala to exercise control over expenditure, to keep it within the budget grants and to ensure accuracy of their accounts. There were 44 schemes implemented by the selected Controlling Officers having expenditure greater than ₹10 crore. Of these 44 schemes, there were wide variations between the expenditure booked in the books of the Controlling officers and the figures booked by AG (A&E) with respect to six schemes by two37 Controlling Officers Appendix 3.14. These variations had not been reconciled and rectified as stipulated in the Kerala Budget Manual. This was not only in violation of the provisions of Paragraph 74 of the Kerala Budget Manual, but also casts doubt about the correctness of the expenditure figures supplied by the departments. Controlling Officers may make sure that the expenditure figures are reconciled every month with AG (A&E). A robust system may be put in place for the same so that these lapses are not repeated.
3.6 Good Practices
It is observed that for 2019-20, the monthly spread of receipts and expenditure of the State was generally even, which is commendable.
3.7 Recommendations 1. Government should be more realistic in its budgetary assumptions and
ensure efficient control mechanisms to curtail savings/ excess expenditure. 2. Government should enforce its commitment to achieve its promised/intended
objectives for overall development of the State through improved execution, monitoring and financial management of schemes/projects.
3. Government needs to reconcile the differences in the amounts relating to its investment in the State PSUs with regard to equity, loans and guarantees shown in its accounts and the accounts of the concerned PSUs.
37Director of Industries & Commerce (4 Schemes), Director of Coir Development (2 Scheme)
State Finances Audit Report for the year ended 31 March 2020
128
4. The State Government may consider writing back balance under DepositAccounts to the respective Major/Minor Heads at the close of the year toensure legislative scrutiny.
5. Excess expenditure over grants approved by the Legislature are in violationof the will of the Legislature. It therefore, needs to be viewed seriously andregularized at the earliest.
6. Adopt good practices of Central Government, where Technical and TokenSupplementary are encouraged, with Cash Supplementary being the lastresort, after all options of utilizing the savings has been exhausted.
7. State Government needs to formulate a realistic budget based on reliableassumptions of the needs of the Departments and their capacity to utilise theallocated resources.
8. An appropriate control mechanism needs to be instituted by the Governmentto enforce proper implementation and monitoring of budget to ensure thatsavings are curtailed, large savings within the Grant/ Appropriation arecontrolled and anticipated savings are identified and surrendered within thespecified timeframe.
9. Controlling Officers need to be made aware of their responsibility to explainthe variation in expenditure from the allocation to facilitate proper analysisof budget and preparation of meaningful Appropriation Accounts.
CHAPTER IV QUALITY OF ACCOUNTS
AND FINANCIAL REPORTING
PRACTICES
CHAPTER IV QUALITY OF ACCOUNTS
AND FINANCIAL REPORTING
PRACTICES

CHAPTER IV QUALITY OF ACCOUNTS
AND FINANCIAL REPORTING
PRACTICES
129
CHAPTER IV QUALITY OF ACCOUNTS AND FINANCIAL REPORTING
PRACTICES
A sound internal financial reporting system with relevant and reliable information significantly contributes to efficient and effective governance by the State Government. Compliance with financial rules, procedures and directives as well as the timeliness and quality of reporting on the status of such compliance is, thus, one of the attributes of good governance. Reports on compliance and controls, if effective and operational, assist the Government in meeting its basic stewardship responsibilities, including strategic planning and decision-making.
Issues related to completeness of accounts
4.1 Funds outside Consolidated Fund or Public Account of the State Article 266 (1) of the Constitution of India, subject to the provisions of Article 267, provides that all revenues received by the Government of a State, all loans raised by that Government by the issue of treasury bills, loans or ways and means advances and all moneys received by that Government in repayment of loans shall form one consolidated fund to be entitled ‘the Consolidated Fund of the State’. Article 266 (2) provides that all other public moneys received by or on behalf of the Government of a State shall be credited to the public account of the State, as the case may be.
4.1.1 Non-remittance of levies into the Consolidated Fund of the State
4.1.1.1 The Building and Other Construction Workers’ Welfare Cess
The Building and Other Construction Workers’ Welfare Cess Act, 1996 provides for levy and collection of labour welfare cess at a rate of minimum one per cent on the cost of construction. Also, the provision of Rule 5 of The Building and Other Construction Workers’ Welfare Cess rules (1998) provided that the Cess collected is to be transferred to (Building and Other Construction Workers Welfare Board) the Board along with the form of challan prescribed (and in the head of account of the Board) under the accounting procedures of the State. Audit observed that no rules have been framed by the State Government of Kerala for accounting of Building and Other Construction Workers’ Welfare Cess. Neither a sub-head has been opened by the State Government under concerned revenue receipt Major Head (MH) for accounting of Cess collected nor a functional revenue expenditure head has been opened for transfer of the Cess amount to Building and Other Construction Worker’s Welfare Board by various Departments/ Agencies etc. The Cess amount collected is not routed through the Consolidated Fund of the State as required under Article 266 (1) of the Constitution of India and is instead being credited directly to Special Treasury Saving Bank (STSB) account of the Board/ Accounts in
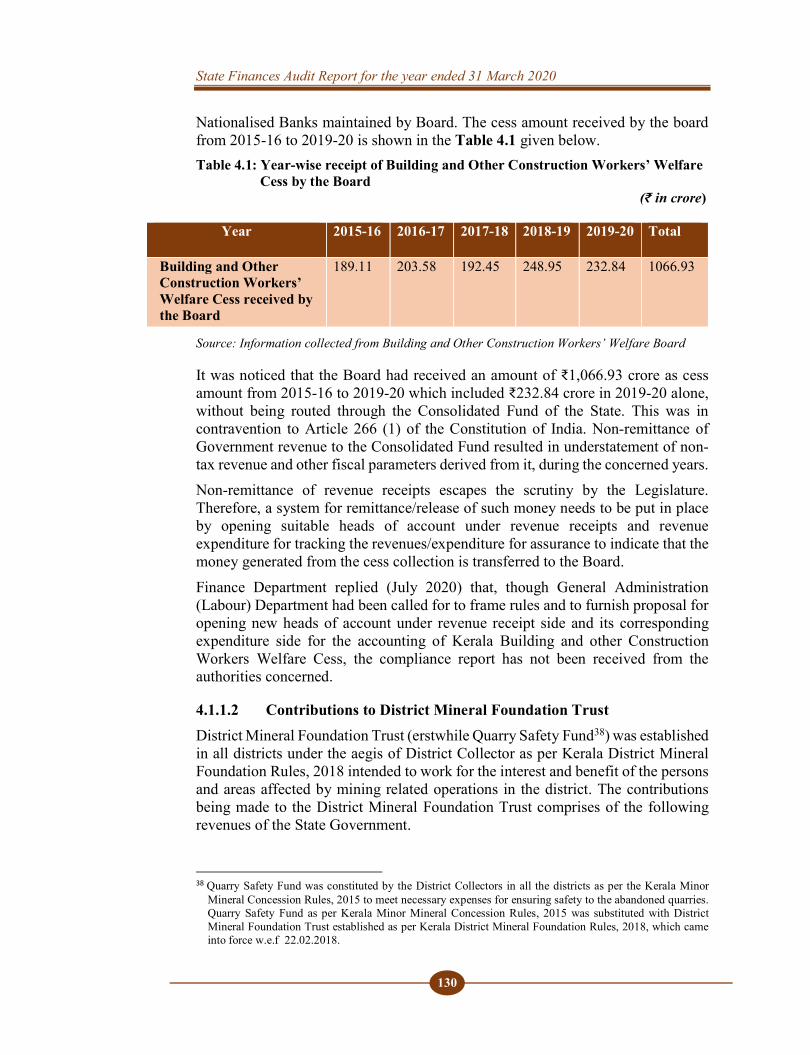
State Finances Audit Report for the year ended 31 March 2020
130
Nationalised Banks maintained by Board. The cess amount received by the board from 2015-16 to 2019-20 is shown in the Table 4.1 given below. Table 4.1: Year-wise receipt of Building and Other Construction Workers’ Welfare
Cess by the Board (₹ in crore)
Year 2015-16 2016-17 2017-18 2018-19 2019-20 Total
Building and Other Construction Workers’ Welfare Cess received by the Board
189.11 203.58 192.45 248.95 232.84 1066.93
Source: Information collected from Building and Other Construction Workers’ Welfare Board
It was noticed that the Board had received an amount of ₹1,066.93 crore as cess amount from 2015-16 to 2019-20 which included ₹232.84 crore in 2019-20 alone, without being routed through the Consolidated Fund of the State. This was in contravention to Article 266 (1) of the Constitution of India. Non-remittance of Government revenue to the Consolidated Fund resulted in understatement of non-tax revenue and other fiscal parameters derived from it, during the concerned years. Non-remittance of revenue receipts escapes the scrutiny by the Legislature. Therefore, a system for remittance/release of such money needs to be put in place by opening suitable heads of account under revenue receipts and revenue expenditure for tracking the revenues/expenditure for assurance to indicate that the money generated from the cess collection is transferred to the Board. Finance Department replied (July 2020) that, though General Administration (Labour) Department had been called for to frame rules and to furnish proposal for opening new heads of account under revenue receipt side and its corresponding expenditure side for the accounting of Kerala Building and other Construction Workers Welfare Cess, the compliance report has not been received from the authorities concerned.
4.1.1.2 Contributions to District Mineral Foundation Trust District Mineral Foundation Trust (erstwhile Quarry Safety Fund38) was established in all districts under the aegis of District Collector as per Kerala District Mineral Foundation Rules, 2018 intended to work for the interest and benefit of the persons and areas affected by mining related operations in the district. The contributions being made to the District Mineral Foundation Trust comprises of the following revenues of the State Government.
38 Quarry Safety Fund was constituted by the District Collectors in all the districts as per the Kerala Minor
Mineral Concession Rules, 2015 to meet necessary expenses for ensuring safety to the abandoned quarries. Quarry Safety Fund as per Kerala Minor Mineral Concession Rules, 2015 was substituted with District Mineral Foundation Trust established as per Kerala District Mineral Foundation Rules, 2018, which came into force w.e.f 22.02.2018.
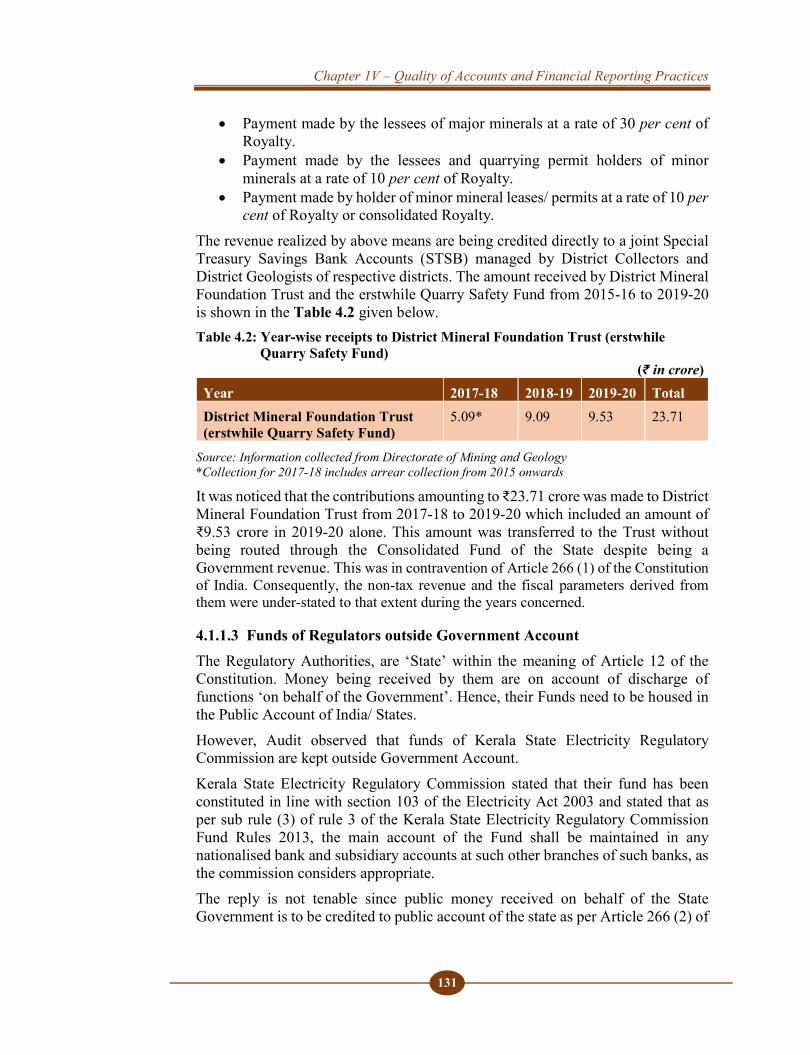
Chapter 1V – Quality of Accounts and Financial Reporting Practices
131
Payment made by the lessees of major minerals at a rate of 30 per cent of Royalty.
Payment made by the lessees and quarrying permit holders of minor minerals at a rate of 10 per cent of Royalty.
Payment made by holder of minor mineral leases/ permits at a rate of 10 per cent of Royalty or consolidated Royalty.
The revenue realized by above means are being credited directly to a joint Special Treasury Savings Bank Accounts (STSB) managed by District Collectors and District Geologists of respective districts. The amount received by District Mineral Foundation Trust and the erstwhile Quarry Safety Fund from 2015-16 to 2019-20 is shown in the Table 4.2 given below. Table 4.2: Year-wise receipts to District Mineral Foundation Trust (erstwhile
Quarry Safety Fund) (₹ in crore)
Year 2017-18 2018-19 2019-20 Total District Mineral Foundation Trust (erstwhile Quarry Safety Fund)
5.09* 9.09 9.53 23.71
Source: Information collected from Directorate of Mining and Geology *Collection for 2017-18 includes arrear collection from 2015 onwards It was noticed that the contributions amounting to ₹23.71 crore was made to District Mineral Foundation Trust from 2017-18 to 2019-20 which included an amount of ₹9.53 crore in 2019-20 alone. This amount was transferred to the Trust without being routed through the Consolidated Fund of the State despite being a Government revenue. This was in contravention of Article 266 (1) of the Constitution of India. Consequently, the non-tax revenue and the fiscal parameters derived from them were under-stated to that extent during the years concerned.
4.1.1.3 Funds of Regulators outside Government Account The Regulatory Authorities, are ‘State’ within the meaning of Article 12 of the Constitution. Money being received by them are on account of discharge of functions ‘on behalf of the Government’. Hence, their Funds need to be housed in the Public Account of India/ States. However, Audit observed that funds of Kerala State Electricity Regulatory Commission are kept outside Government Account. Kerala State Electricity Regulatory Commission stated that their fund has been constituted in line with section 103 of the Electricity Act 2003 and stated that as per sub rule (3) of rule 3 of the Kerala State Electricity Regulatory Commission Fund Rules 2013, the main account of the Fund shall be maintained in any nationalised bank and subsidiary accounts at such other branches of such banks, as the commission considers appropriate. The reply is not tenable since public money received on behalf of the State Government is to be credited to public account of the state as per Article 266 (2) of
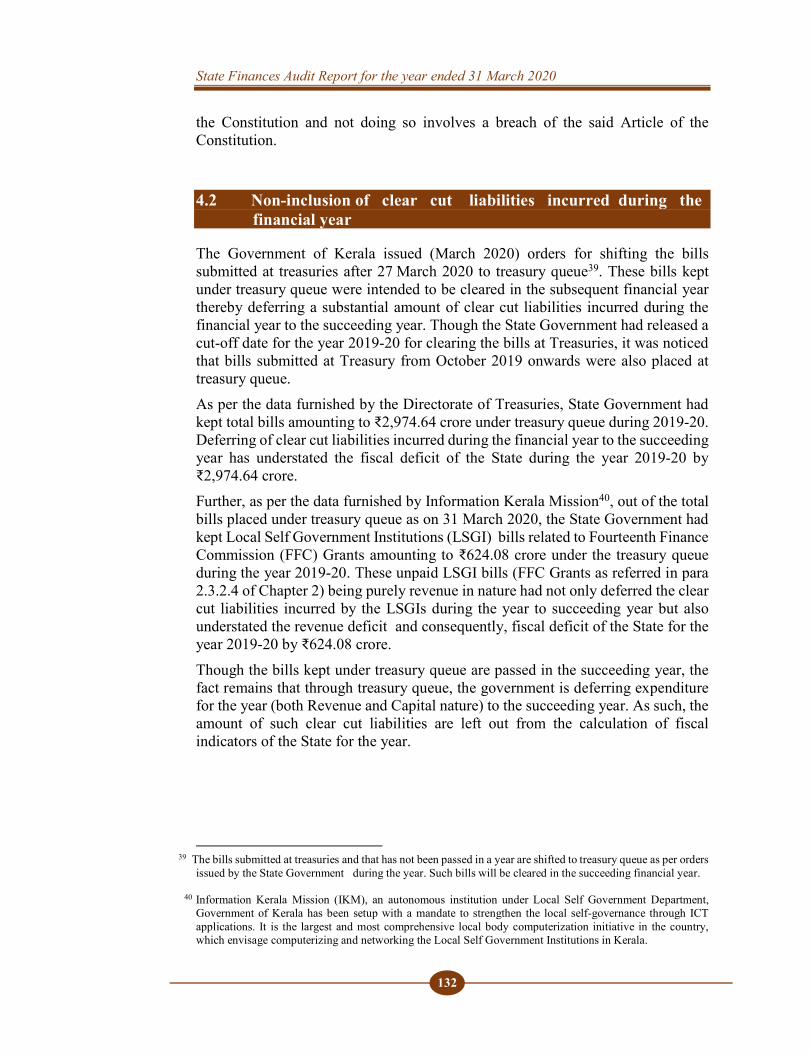
State Finances Audit Report for the year ended 31 March 2020
132
the Constitution and not doing so involves a breach of the said Article of the Constitution.
4.2 Non-inclusion of clear cut liabilities incurred during the financial year
The Government of Kerala issued (March 2020) orders for shifting the bills submitted at treasuries after 27 March 2020 to treasury queue39. These bills kept under treasury queue were intended to be cleared in the subsequent financial year thereby deferring a substantial amount of clear cut liabilities incurred during the financial year to the succeeding year. Though the State Government had released a cut-off date for the year 2019-20 for clearing the bills at Treasuries, it was noticed that bills submitted at Treasury from October 2019 onwards were also placed at treasury queue. As per the data furnished by the Directorate of Treasuries, State Government had kept total bills amounting to ₹2,974.64 crore under treasury queue during 2019-20. Deferring of clear cut liabilities incurred during the financial year to the succeeding year has understated the fiscal deficit of the State during the year 2019-20 by ₹2,974.64 crore. Further, as per the data furnished by Information Kerala Mission40, out of the total bills placed under treasury queue as on 31 March 2020, the State Government had kept Local Self Government Institutions (LSGI) bills related to Fourteenth Finance Commission (FFC) Grants amounting to ₹624.08 crore under the treasury queue during the year 2019-20. These unpaid LSGI bills (FFC Grants as referred in para 2.3.2.4 of Chapter 2) being purely revenue in nature had not only deferred the clear cut liabilities incurred by the LSGIs during the year to succeeding year but also understated the revenue deficit and consequently, fiscal deficit of the State for the year 2019-20 by ₹624.08 crore. Though the bills kept under treasury queue are passed in the succeeding year, the fact remains that through treasury queue, the government is deferring expenditure for the year (both Revenue and Capital nature) to the succeeding year. As such, the amount of such clear cut liabilities are left out from the calculation of fiscal indicators of the State for the year.
39 The bills submitted at treasuries and that has not been passed in a year are shifted to treasury queue as per orders
issued by the State Government during the year. Such bills will be cleared in the succeeding financial year.
40 Information Kerala Mission (IKM), an autonomous institution under Local Self Government Department, Government of Kerala has been setup with a mandate to strengthen the local self-governance through ICT applications. It is the largest and most comprehensive local body computerization initiative in the country, which envisage computerizing and networking the Local Self Government Institutions in Kerala.
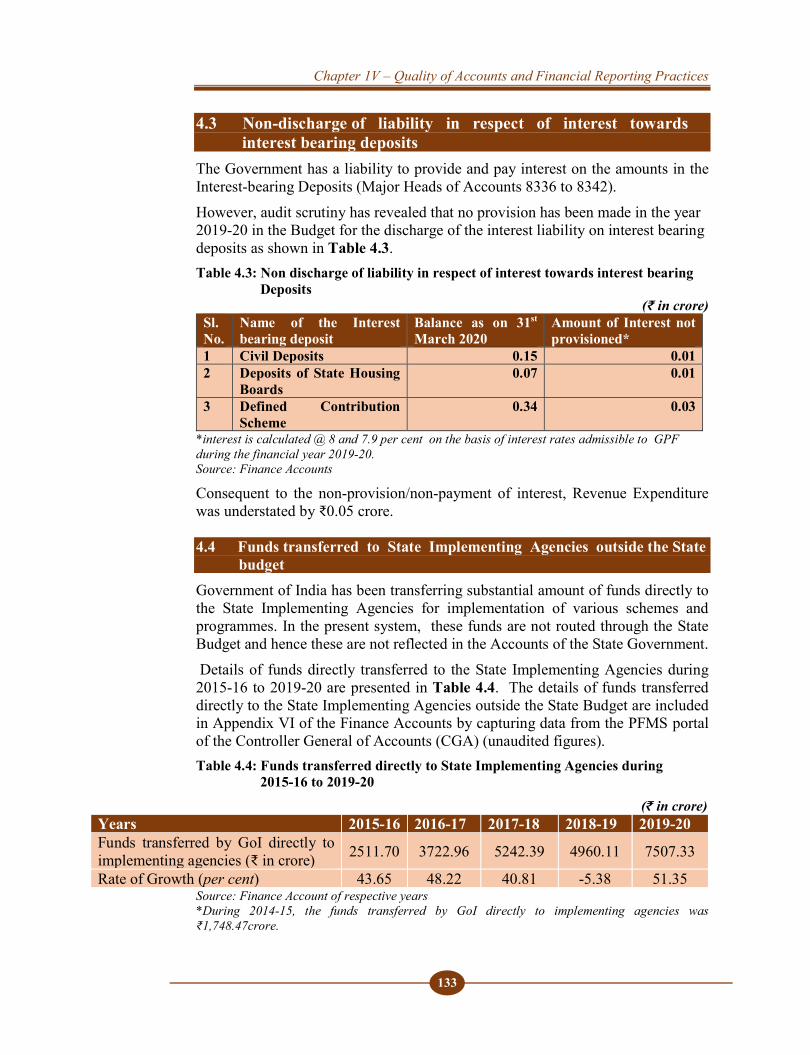
Chapter 1V – Quality of Accounts and Financial Reporting Practices
133
4.3 Non-discharge of liability in respect of interest towards interest bearing deposits The Government has a liability to provide and pay interest on the amounts in the Interest-bearing Deposits (Major Heads of Accounts 8336 to 8342). However, audit scrutiny has revealed that no provision has been made in the year 2019-20 in the Budget for the discharge of the interest liability on interest bearing deposits as shown in Table 4.3. Table 4.3: Non discharge of liability in respect of interest towards interest bearing Deposits
(₹ in crore) Sl. No.
Name of the Interest bearing deposit
Balance as on 31st March 2020
Amount of Interest not provisioned*
1 Civil Deposits 0.15 0.01 2 Deposits of State Housing
Boards 0.07 0.01
3 Defined Contribution Scheme
0.34 0.03
*interest is calculated @ 8 and 7.9 per cent on the basis of interest rates admissible to GPF during the financial year 2019-20. Source: Finance Accounts
Consequent to the non-provision/non-payment of interest, Revenue Expenditure was understated by ₹0.05 crore. 4.4 Funds transferred to State Implementing Agencies outside the State budget
Government of India has been transferring substantial amount of funds directly to the State Implementing Agencies for implementation of various schemes and programmes. In the present system, these funds are not routed through the State Budget and hence these are not reflected in the Accounts of the State Government. Details of funds directly transferred to the State Implementing Agencies during 2015-16 to 2019-20 are presented in Table 4.4. The details of funds transferred directly to the State Implementing Agencies outside the State Budget are included in Appendix VI of the Finance Accounts by capturing data from the PFMS portal of the Controller General of Accounts (CGA) (unaudited figures). Table 4.4: Funds transferred directly to State Implementing Agencies during 2015-16 to 2019-20
(₹ in crore) Years 2015-16 2016-17 2017-18 2018-19 2019-20 Funds transferred by GoI directly to implementing agencies (₹ in crore) 2511.70 3722.96 5242.39 4960.11 7507.33
Rate of Growth (per cent) 43.65 48.22 40.81 -5.38 51.35 Source: Finance Account of respective years *During 2014-15, the funds transferred by GoI directly to implementing agencies was ₹1,748.47crore.
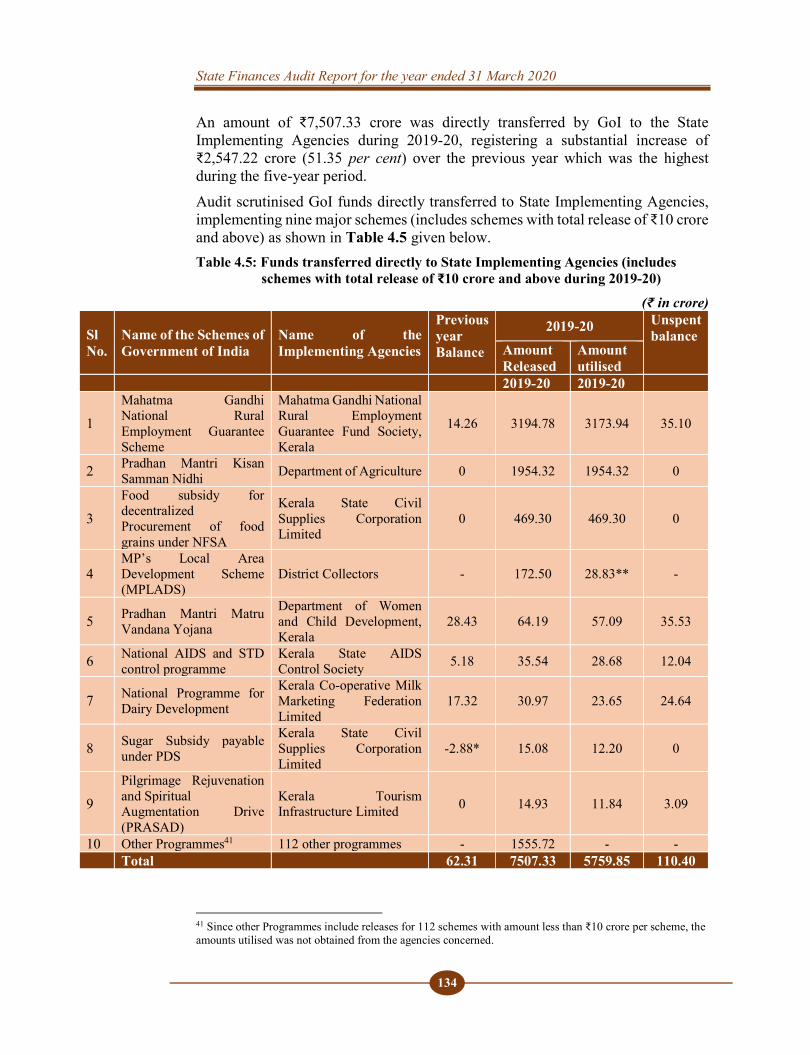
State Finances Audit Report for the year ended 31 March 2020
134
An amount of ₹7,507.33 crore was directly transferred by GoI to the State Implementing Agencies during 2019-20, registering a substantial increase of ₹2,547.22 crore (51.35 per cent) over the previous year which was the highest during the five-year period. Audit scrutinised GoI funds directly transferred to State Implementing Agencies, implementing nine major schemes (includes schemes with total release of ₹10 crore and above) as shown in Table 4.5 given below. Table 4.5: Funds transferred directly to State Implementing Agencies (includes
schemes with total release of ₹10 crore and above during 2019-20)
(₹ in crore)
Sl No.
Name of the Schemes of Government of India
Name of the Implementing Agencies
Previous year Balance
2019-20 Unspent balance
Amount Released
Amount utilised
2019-20 2019-20
1 Mahatma Gandhi National Rural Employment Guarantee Scheme
Mahatma Gandhi National Rural Employment Guarantee Fund Society, Kerala
14.26 3194.78 3173.94 35.10
2 Pradhan Mantri Kisan Samman Nidhi Department of Agriculture 0 1954.32 1954.32 0
3 Food subsidy for decentralized Procurement of food grains under NFSA
Kerala State Civil Supplies Corporation Limited
0 469.30 469.30 0
4 MP’s Local Area Development Scheme (MPLADS)
District Collectors - 172.50 28.83** -
5 Pradhan Mantri Matru Vandana Yojana
Department of Women and Child Development, Kerala
28.43 64.19 57.09 35.53
6 National AIDS and STD control programme
Kerala State AIDS Control Society 5.18 35.54 28.68 12.04
7 National Programme for Dairy Development
Kerala Co-operative Milk Marketing Federation Limited
17.32 30.97 23.65 24.64
8 Sugar Subsidy payable under PDS
Kerala State Civil Supplies Corporation Limited
-2.88* 15.08 12.20 0
9 Pilgrimage Rejuvenation and Spiritual Augmentation Drive (PRASAD)
Kerala Tourism Infrastructure Limited 0 14.93 11.84 3.09
10 Other Programmes41 112 other programmes - 1555.72 - - Total 62.31 7507.33 5759.85 110.40
41 Since other Programmes include releases for 112 schemes with amount less than ₹10 crore per scheme, the amounts utilised was not obtained from the agencies concerned.
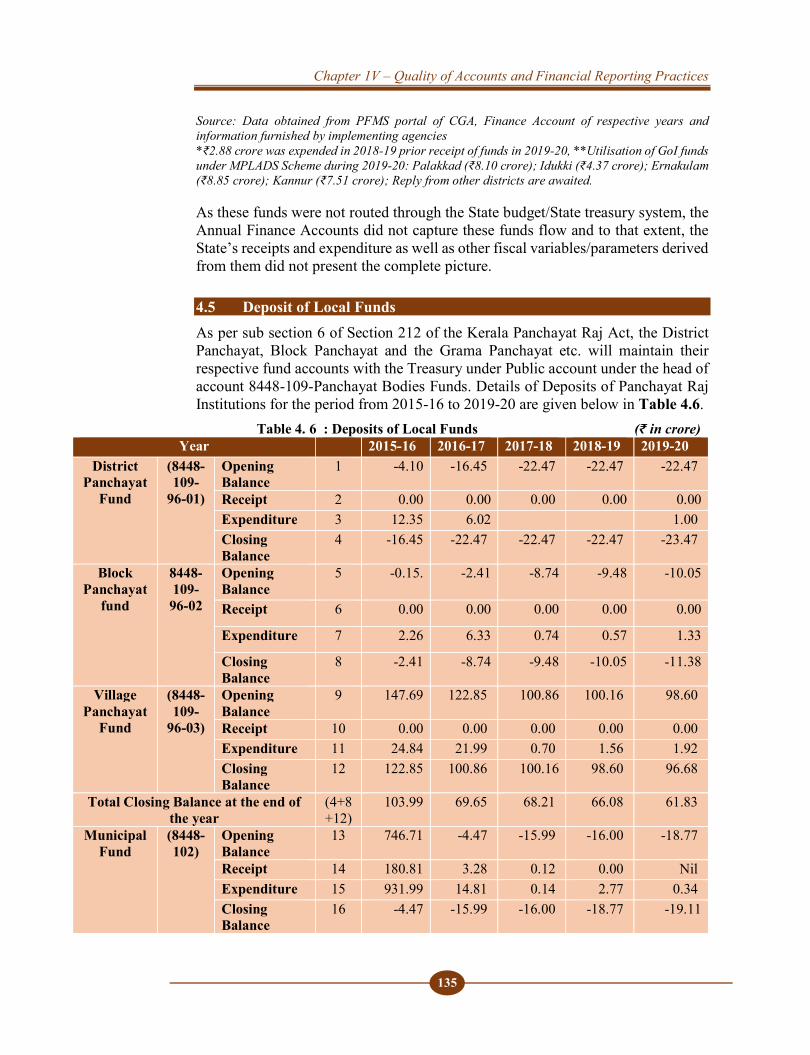
Chapter 1V – Quality of Accounts and Financial Reporting Practices
135
Source: Data obtained from PFMS portal of CGA, Finance Account of respective years and information furnished by implementing agencies *₹2.88 crore was expended in 2018-19 prior receipt of funds in 2019-20, **Utilisation of GoI funds under MPLADS Scheme during 2019-20: Palakkad (₹8.10 crore); Idukki (₹4.37 crore); Ernakulam (₹8.85 crore); Kannur (₹7.51 crore); Reply from other districts are awaited.
As these funds were not routed through the State budget/State treasury system, the Annual Finance Accounts did not capture these funds flow and to that extent, the State’s receipts and expenditure as well as other fiscal variables/parameters derived from them did not present the complete picture.
4.5 Deposit of Local Funds As per sub section 6 of Section 212 of the Kerala Panchayat Raj Act, the District Panchayat, Block Panchayat and the Grama Panchayat etc. will maintain their respective fund accounts with the Treasury under Public account under the head of account 8448-109-Panchayat Bodies Funds. Details of Deposits of Panchayat Raj Institutions for the period from 2015-16 to 2019-20 are given below in Table 4.6. Table 4. 6 : Deposits of Local Funds (₹ in crore)
Year 2015-16 2016-17 2017-18 2018-19 2019-20 District
Panchayat Fund
(8448-109-
96-01)
Opening Balance
1 -4.10 -16.45 -22.47 -22.47 -22.47
Receipt 2 0.00 0.00 0.00 0.00 0.00 Expenditure 3 12.35 6.02 1.00 Closing Balance
4 -16.45 -22.47 -22.47 -22.47 -23.47
Block Panchayat
fund
8448-109-96-02
Opening Balance
5 -0.15. -2.41 -8.74 -9.48 -10.05
Receipt 6 0.00 0.00 0.00 0.00 0.00
Expenditure 7 2.26 6.33 0.74 0.57 1.33
Closing Balance
8 -2.41 -8.74 -9.48 -10.05 -11.38
Village Panchayat
Fund
(8448-109-
96-03)
Opening Balance
9 147.69 122.85 100.86 100.16 98.60
Receipt 10 0.00 0.00 0.00 0.00 0.00 Expenditure 11 24.84 21.99 0.70 1.56 1.92 Closing Balance
12 122.85 100.86 100.16 98.60 96.68
Total Closing Balance at the end of the year
(4+8+12)
103.99 69.65 68.21 66.08 61.83
Municipal Fund
(8448-102)
Opening Balance
13 746.71 -4.47 -15.99 -16.00 -18.77
Receipt 14 180.81 3.28 0.12 0.00 Nil Expenditure 15 931.99 14.81 0.14 2.77 0.34 Closing Balance
16 -4.47 -15.99 -16.00 -18.77 -19.11
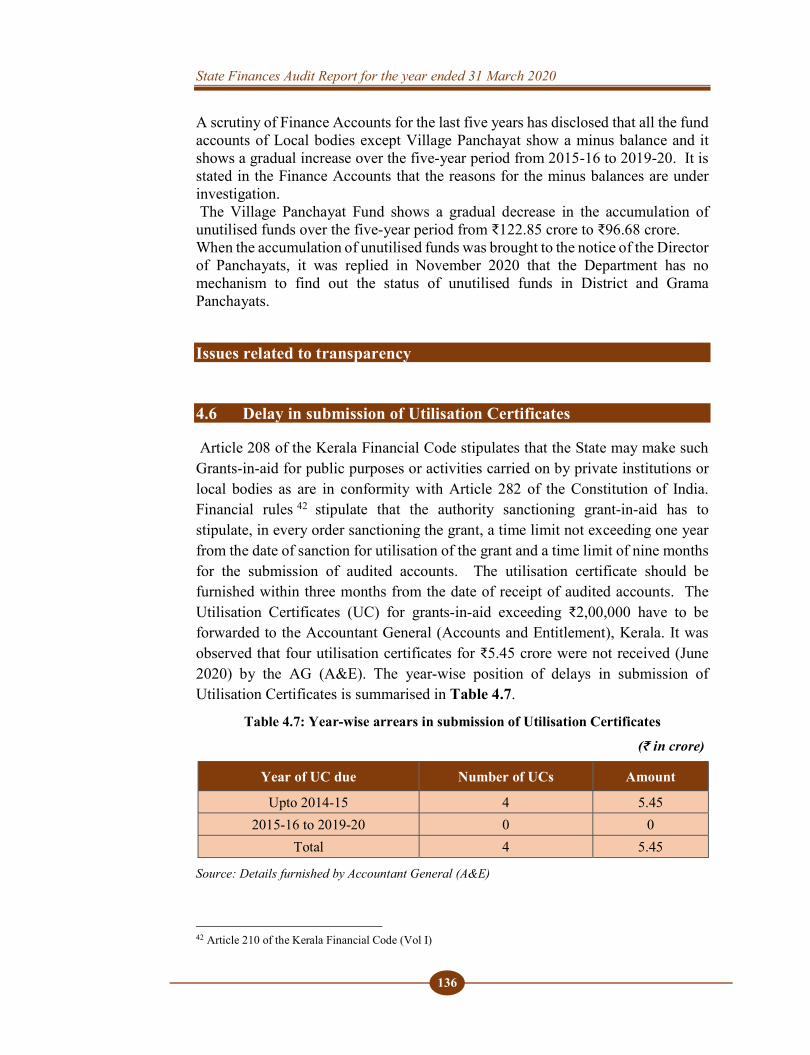
State Finances Audit Report for the year ended 31 March 2020
136
A scrutiny of Finance Accounts for the last five years has disclosed that all the fund accounts of Local bodies except Village Panchayat show a minus balance and it shows a gradual increase over the five-year period from 2015-16 to 2019-20. It is stated in the Finance Accounts that the reasons for the minus balances are under investigation. The Village Panchayat Fund shows a gradual decrease in the accumulation of unutilised funds over the five-year period from ₹122.85 crore to ₹96.68 crore. When the accumulation of unutilised funds was brought to the notice of the Director of Panchayats, it was replied in November 2020 that the Department has no mechanism to find out the status of unutilised funds in District and Grama Panchayats.
Issues related to transparency
4.6 Delay in submission of Utilisation Certificates
Article 208 of the Kerala Financial Code stipulates that the State may make such Grants-in-aid for public purposes or activities carried on by private institutions or local bodies as are in conformity with Article 282 of the Constitution of India. Financial rules 42 stipulate that the authority sanctioning grant-in-aid has to stipulate, in every order sanctioning the grant, a time limit not exceeding one year from the date of sanction for utilisation of the grant and a time limit of nine months for the submission of audited accounts. The utilisation certificate should be furnished within three months from the date of receipt of audited accounts. The Utilisation Certificates (UC) for grants-in-aid exceeding ₹2,00,000 have to be forwarded to the Accountant General (Accounts and Entitlement), Kerala. It was observed that four utilisation certificates for ₹5.45 crore were not received (June 2020) by the AG (A&E). The year-wise position of delays in submission of Utilisation Certificates is summarised in Table 4.7.
Table 4.7: Year-wise arrears in submission of Utilisation Certificates
(₹ in crore)
Year of UC due Number of UCs Amount
Upto 2014-15 4 5.45 2015-16 to 2019-20 0 0
Total 4 5.45
Source: Details furnished by Accountant General (A&E)
42 Article 210 of the Kerala Financial Code (Vol I)
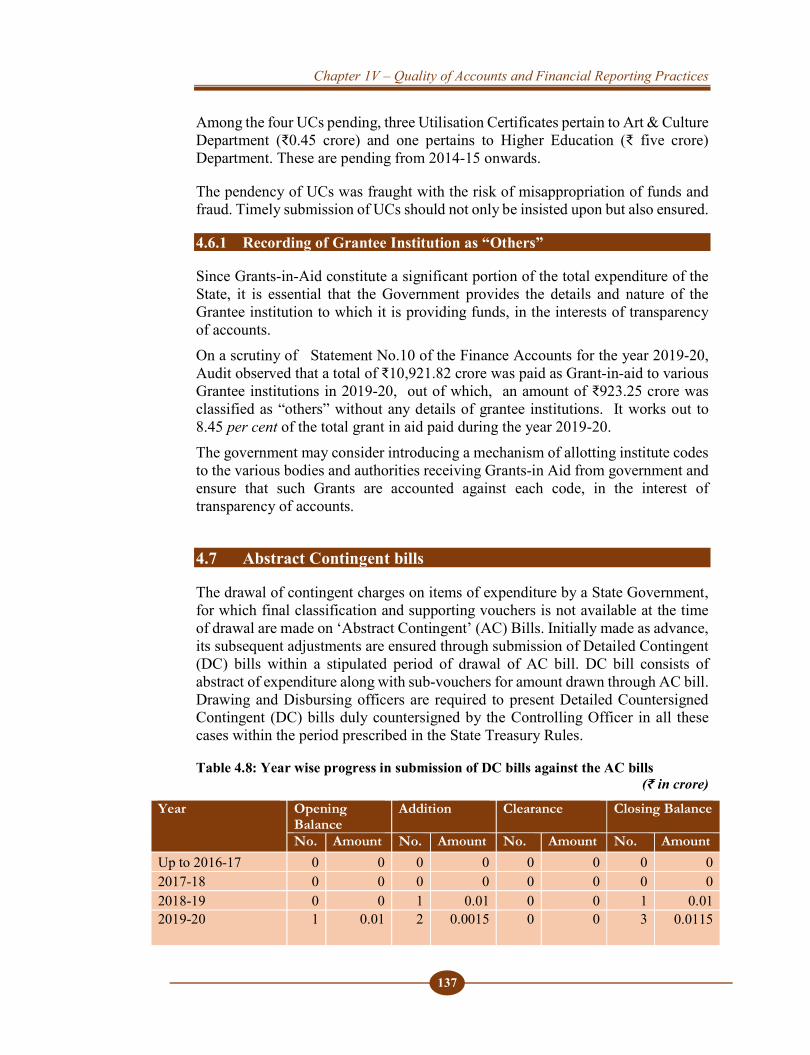
Chapter 1V – Quality of Accounts and Financial Reporting Practices
137
Among the four UCs pending, three Utilisation Certificates pertain to Art & Culture Department (₹0.45 crore) and one pertains to Higher Education (₹ five crore) Department. These are pending from 2014-15 onwards.
The pendency of UCs was fraught with the risk of misappropriation of funds and fraud. Timely submission of UCs should not only be insisted upon but also ensured.
4.6.1 Recording of Grantee Institution as “Others”
Since Grants-in-Aid constitute a significant portion of the total expenditure of the State, it is essential that the Government provides the details and nature of the Grantee institution to which it is providing funds, in the interests of transparency of accounts. On a scrutiny of Statement No.10 of the Finance Accounts for the year 2019-20, Audit observed that a total of ₹10,921.82 crore was paid as Grant-in-aid to various Grantee institutions in 2019-20, out of which, an amount of ₹923.25 crore was classified as “others” without any details of grantee institutions. It works out to 8.45 per cent of the total grant in aid paid during the year 2019-20. The government may consider introducing a mechanism of allotting institute codes to the various bodies and authorities receiving Grants-in Aid from government and ensure that such Grants are accounted against each code, in the interest of transparency of accounts.
4.7 Abstract Contingent bills
The drawal of contingent charges on items of expenditure by a State Government, for which final classification and supporting vouchers is not available at the time of drawal are made on ‘Abstract Contingent’ (AC) Bills. Initially made as advance, its subsequent adjustments are ensured through submission of Detailed Contingent (DC) bills within a stipulated period of drawal of AC bill. DC bill consists of abstract of expenditure along with sub-vouchers for amount drawn through AC bill. Drawing and Disbursing officers are required to present Detailed Countersigned Contingent (DC) bills duly countersigned by the Controlling Officer in all these cases within the period prescribed in the State Treasury Rules.
Table 4.8: Year wise progress in submission of DC bills against the AC bills (₹ in crore)
Year Opening Balance
Addition Clearance Closing Balance
No. Amount No. Amount No. Amount No. Amount Up to 2016-17 0 0 0 0 0 0 0 0 2017-18 0 0 0 0 0 0 0 0 2018-19 0 0 1 0.01 0 0 1 0.01 2019-20 1 0.01 2 0.0015 0 0 3 0.0115
State Finances Audit Report for the year ended 31 March 2020
138
As per Article 107 of Kerala Financial Code, the abstract contingent bill should be submitted to the Countersigning Authority not later than 10th of the succeeding month of drawal of advance and as per Article 108 of KFC, it should be forwarded to the Accountant General not later than 20th of the month. However, Audit observed that there was an inordinate delay ranging from one to two years in the submission of Detailed Contingent Bill duly countersigned by the Controlling officer as shown in Table 4.8. All the three abstract contingent bills amounting to ₹0.0115 crore pending clearance relate to Prison department. Out of the total pending DC Bills for an amount of ₹0.0115 crore, ₹0.01 crore was drawn for the purchase of Medicines and the remaining ₹0.0015 crore was drawn as fuel advance under the section of Revenue Expenditure. Non submission of detailed bill enhances the risk of misappropriation of Public money.
4.8 Personal Deposit Accounts Personal Deposit (PD) Accounts are in the nature of special banking accounts kept for certain classes of Deposits, which include transactions of a public or quasi-public nature for which it is not necessary to treat each disbursement as made against a particular receipt. PD accounts are, maintained in the nature of a bank account in the treasury. As per Art 282 (d) of Kerala Financial Code Vol-I, Chapter X, in cases of PD accounts that are opened by orders of the State Government for specific purposes, where, funds are transferred from the Consolidated Fund by booking the expenditure under Service heads, the administrators of these PD accounts should close these PD accounts at the end of the financial year and credit the unspent balances back to the Consolidated Fund under the concerned expenditure heads of accounts from where the amount initially transferred, unless such Personal Deposit accounts were created by Law or Rules having the force of Law. Further, the PD accounts which have been opened by transfer of funds other than from the Consolidated Fund, should be reviewed every year and the accounts which are in-operative for more than three complete financial years should be closed and balance lying in such accounts should be credited to Government accounts.
4.8.1 Inoperative and non-reconciled PD Accounts PD accounts are maintained under MH-8443-Civil Deposit-106-Personal Deposit and 8443 Civil Deposits -123- Deposits of Educational Institutions. The number of live PD Accounts under MH-8443-Civil Deposit-106-Personal Deposit was 1,233 as on 31 March 2020 and the aggregate balance in these PD accounts was ₹67.48 crore as per records of the Accountant General (A&E). However, as per information received from State Government, there were only 830 PD Accounts and the balance in these accounts amounted to ₹254.36 crore. The Director of Treasuries informed that the mismatch of figures of PD Accounts as
Chapter 1V – Quality of Accounts and Financial Reporting Practices
139
per the records of Accountant General and as per details furnished by Director of Treasuries was due to non-transfer of all PD Accounts data from Treasury Information System43 to Core Treasury Information System44. Treasury officials also stated that this discrepancy will be cleared after the closing of all the inoperative PD accounts. Under Major Head 8443-Civil Deposits -123- Deposits of Educational Institutions, the State Government is operating 6,648 PD accounts. As per details furnished by the Government, the balance in these accounts amounted to ₹277.03 crore. As per the Statement No.21 of the Finance Accounts, closing balance under Major Head 8443-Civil Deposits-123-Deposits of Educational Institutions was however ₹128.71 crore only. Further, out of these, 241 PD accounts with a balance of ₹1.11 crore are in-operative. Directorate of Treasuries informed the Accountant General (A&E) that amount pertaining to 8443-00-123 Deposit of Educational Institutions was misclassified under MH 8443-00-106 in many cases in the past several years. The reconciliation of PD accounts with the Administrators of deposit accounts is to be conducted by the treasuries concerned. The variations in the records maintained in the Treasury Department and the PAG (A&E) is due to lack of timely reconciliation. The treasury department also failed to identify all inoperative accounts and transfer the balance amount to government accounts, even from accounts which were identified as inoperative. Non-reconciliation of balances in PD accounts and not transferring the unspent balances lying in PD accounts to Consolidated Fund of State is fraught with risk of misuse of public funds, fraud and misappropriation.
4.8.2 Operation of Treasury Savings Bank Accounts
Introduction As per Rule 37 of Kerala Treasury Code, Treasury Savings Bank (TSB) Accounts are being maintained in the Treasuries. Kerala inherited the system of Treasury Savings Scheme from the erstwhile Travancore Administration. The objective of the Government in establishing Treasury Savings Bank Scheme was to provide a ready means for the deposit of savings and to encourage thrift. Subsequently, funds released for various purposes from the Consolidated Fund such as grants-in-aid, loans and investments to State PSUs & Statutory Corporations, funds for Centrally Sponsored Schemes, were also credited to the Special Treasury Savings Bank Account (STSB) temporarily for keeping the unspent balance for a specified period on the basis of various Government Orders.
43 Treasury Information System is an application for doing the transactions (Receipt and Payment) online in a Treasury and for the preparation of accounts. 44 After the introduction of IFMS, all transactions of Treasury are performed through a set of new Software namely Core-Treasury Information System.
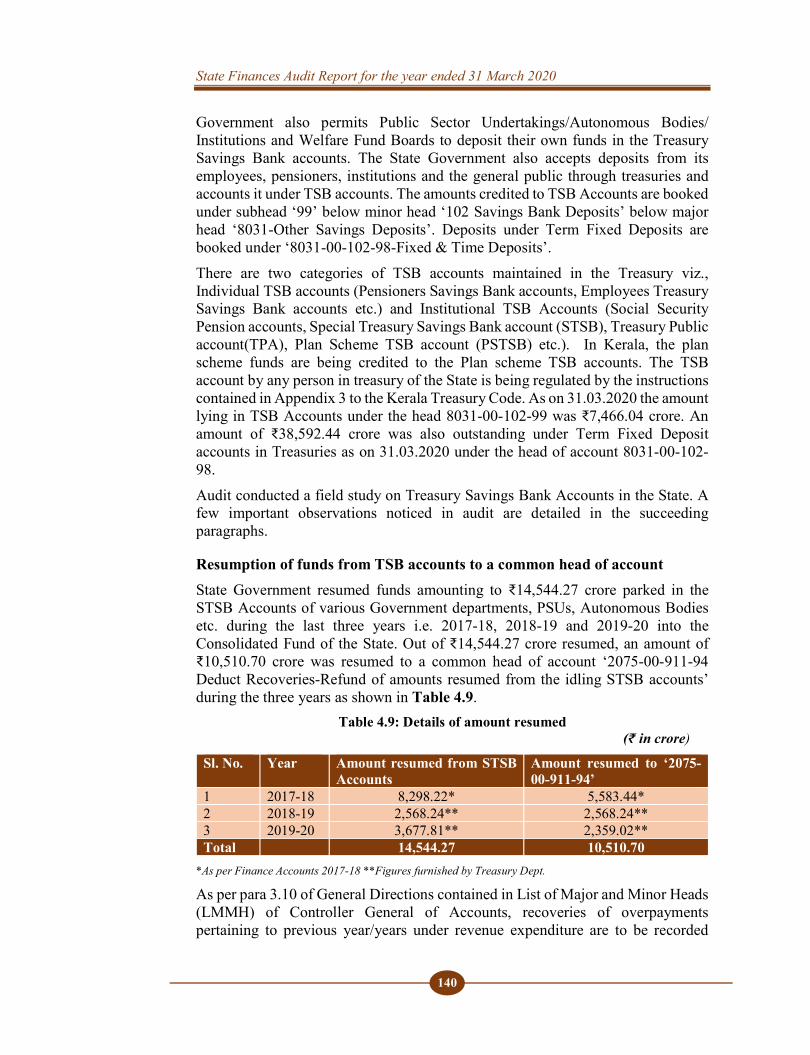
State Finances Audit Report for the year ended 31 March 2020
140
Government also permits Public Sector Undertakings/Autonomous Bodies/ Institutions and Welfare Fund Boards to deposit their own funds in the Treasury Savings Bank accounts. The State Government also accepts deposits from its employees, pensioners, institutions and the general public through treasuries and accounts it under TSB accounts. The amounts credited to TSB Accounts are booked under subhead ‘99’ below minor head ‘102 Savings Bank Deposits’ below major head ‘8031-Other Savings Deposits’. Deposits under Term Fixed Deposits are booked under ‘8031-00-102-98-Fixed & Time Deposits’. There are two categories of TSB accounts maintained in the Treasury viz., Individual TSB accounts (Pensioners Savings Bank accounts, Employees Treasury Savings Bank accounts etc.) and Institutional TSB Accounts (Social Security Pension accounts, Special Treasury Savings Bank account (STSB), Treasury Public account(TPA), Plan Scheme TSB account (PSTSB) etc.). In Kerala, the plan scheme funds are being credited to the Plan scheme TSB accounts. The TSB account by any person in treasury of the State is being regulated by the instructions contained in Appendix 3 to the Kerala Treasury Code. As on 31.03.2020 the amount lying in TSB Accounts under the head 8031-00-102-99 was ₹7,466.04 crore. An amount of ₹38,592.44 crore was also outstanding under Term Fixed Deposit accounts in Treasuries as on 31.03.2020 under the head of account 8031-00-102-98. Audit conducted a field study on Treasury Savings Bank Accounts in the State. A few important observations noticed in audit are detailed in the succeeding paragraphs.
Resumption of funds from TSB accounts to a common head of account State Government resumed funds amounting to ₹14,544.27 crore parked in the STSB Accounts of various Government departments, PSUs, Autonomous Bodies etc. during the last three years i.e. 2017-18, 2018-19 and 2019-20 into the Consolidated Fund of the State. Out of ₹14,544.27 crore resumed, an amount of ₹10,510.70 crore was resumed to a common head of account ‘2075-00-911-94 Deduct Recoveries-Refund of amounts resumed from the idling STSB accounts’ during the three years as shown in Table 4.9.
Table 4.9: Details of amount resumed (₹ in crore)
Sl. No. Year Amount resumed from STSB Accounts
Amount resumed to ‘2075-00-911-94’
1 2017-18 8,298.22* 5,583.44* 2 2018-19 2,568.24** 2,568.24** 3 2019-20 3,677.81** 2,359.02** Total 14,544.27 10,510.70
*As per Finance Accounts 2017-18 **Figures furnished by Treasury Dept.
As per para 3.10 of General Directions contained in List of Major and Minor Heads (LMMH) of Controller General of Accounts, recoveries of overpayments pertaining to previous year/years under revenue expenditure are to be recorded
Chapter 1V – Quality of Accounts and Financial Reporting Practices
141
under distinct minor head (Deduct Recoveries of Overpayments) below the concerned major/sub major head from where the expenditure was initially incurred. As per para 4.3 of the General Directions, in the case of Capital Expenditure, distinct subheads (Deduct- Receipts and Recoveries on Capital Account) are to be opened below the relevant minor heads under the various Capital major/sub major heads where the capital expenditure was initially incurred. Credit back of amounts originally debited under various Revenue, Capital and Loans heads of accounts to the common head of account 2075-00-911 is in violation of the General Directions contained in paras 3.10 and 4.3 of the List of Major and Minor Heads (LMMH) published by the Controller General of Accounts and will distort all key indicators of fiscal position of Government.
Refund of resumed funds Finance department released funds amounting to ₹4,927.26 crore45 resumed under ‘2075-00-911-94 - Deduct Recoveries-Refund of amounts resumed from the idling STSB accounts’ on 31 March of 2018-19 and 2019-20, to the STSB accounts concerned during the first week of April of the succeeding financial year without waiting for receipt of any proposal for refund from the institutions concerned. The release of entire funds which were resumed at the end of the financial year under ’2075-00-911’, during the beginning of the next financial year (1st week) itself without receipt of any proposal from the institutions concerned defeated the basic purpose of the resumption, viz. preventing inappropriate parking of funds, as the re-issued funds continued to be parked in the TSB Account. Government has resorted to resumption mainly for the purpose of reducing the public account liability at the year-end in order to increase the borrowing space of Government. Finance Department stated (February 2021) that funds resumed from STSB accounts having deposits from Non-plan fund are allotted during the next financial year without receipt of any proposal from the institutions concerned as the same is required in the next financial year for its smooth functioning. In case of PSTSB accounts, resumed funds are released in the next financial year only after receipt of proposals from the institutions. The reply from Finance Department is not acceptable due to the following reasons. Government had introduced PSTSB accounts for managing the release and utilisation of Plan fund for the Government departments and agencies from 2018-19 onwards. Prior to 2018-19, both Plan and Non-plan funds were being routed through STSB accounts. Hence the funds resumed from STSB accounts also included unutilized balance of Plan funds released up to 2017-18 period. Moreover, the State Government refunded the entire amount of ₹2,568.24 crore resumed during 2018-19 including ₹1,342.68 crore resumed from PSTSB accounts without receipt of any proposal from the institutions concerned.
45 ₹2,568.24 crore resumed in 2018-19 under 2075-00-911-94, ₹2,359.02 crore resumed in 2019-20 under 2075-
00-911-94, ₹11.43 lakh resumed in 2019-20 under 2408-01-101-98-33 (NP) &₹10 lakh resumed in 2019-20 under 3604-00-200-86-03-35 (NP).
State Finances Audit Report for the year ended 31 March 2020
142
Inoperative TSB accounts As per information furnished by the Director of Treasuries, Government money amounting to ₹2,502.30 crore was lying in 769 number of STSB accounts which have been lying inoperative for the last three financial years. Of this, an amount of ₹2,498.42 crore pertains to Kerala Infrastructure Investment Fund Board (KIIFB). KIIFB stated that these funds were provided by the State Government as corpus fund during 2015-16 & 2016-17 for facilitating external borrowings. Resumption of Government of India funds Audit scrutinized records relating to transactions in STSB/PTSB accounts maintained by eight46 institutions selected on random basis. Scrutiny revealed that State Government had resumed Government of India funds parked in STSB accounts of two47 institutions amounting to ₹14.48 crore into the Consolidated Fund of the State during 2017-18. Of these resumed GoI funds, an amount of ₹14 crore has not been refunded till date. Resumption of funds received from GoI for the implementation of Centrally Sponsored Schemes to the Consolidated Fund of the State is irregular.
Other observations
Departments/Agencies implementing more than one scheme are allowed to deposit funds relating to schemes into one Special TSB account. Over a period of time, it became difficult for the institutions themselves to trace the source of funds and they were being utilized for various purposes. Consequently, the details of funds amounting to ₹3.27 crore which were resumed by State Government on various occasions from such STSB Accounts are not readily available with three48 institutions. As the source of funds could not be traced, the details as to whether the amounts resumed were GoI funds or State Government funds, the purpose for which the resumed funds were originally credited to the STSB/PSTSB Accounts, the impact of resumption etc. could not be ascertained.
Government of India (GoI), Ministry of Tribal Affairs introduced a scheme of ‘Pre matric scholarship for Scheduled Tribes students studying in classes IX & X’ during the year 2012-13. As per the procedure for claiming the Central Assistance, the scholarship is to be paid out of the State budget against which reimbursement can be claimed from GoI. The Director drew ₹3.90 crore under the head of account ‘2225-02-277-37(Plan) -Pre matric scholarship for ST students studying in classes IX & X (100 % CSS) in 2014-15 (₹ one crore each on 26.02.2015 & 12.03.2015 and ₹1.90 crore on 27.3.2015) and credited the amount in ICICI Bank for distributing the scholarship as DBT to the ST students. Only a meagre amount of ₹1.09 lakh
46 Directorate of Fisheries; Directorate of ST development; Directorate of SC development; Directorate of Agriculture; State Mission Management Unit-AMRUT; RUSA; SSK and Kerala State Library Council 47 Director of Agriculture; State Mission Management Unit-Amrut. 48 Directorate of Fisheries (₹0.99 crore), Directorate of SC development (₹1.26 crore), Directorate of ST development (₹1.02 crore)
Chapter 1V – Quality of Accounts and Financial Reporting Practices
143
was given as scholarship under the scheme out of these funds during 2014-15. The unutilized amount along with the interest accrued in the bank account amounting to ₹4.16 crore was transferred to STSB Account No 701001140000118 of Director of ST Development with District Treasury in March 2017. However, the fund continued to remain unutilised in the STSB account and it was later resumed by State Government into the Consolidated Fund on 19 January 2018. An amount of ₹5.17 crore was resumed by the State Government from this STSB Account in January 2018 including the above unutilised amount of ₹4.16 crore. The failure of the department to implement the scheme in 2014-15 had deprived the benefits of the scheme to the intended beneficiaries. The Director, Scheduled Tribes Development Department replied that the funds could not be utilized as the bank account details of the students were not available. It was also stated that the State Government was already implementing another State scheme ‘Pre matric studies (2225-02-277-99 –NP)’ which also included component of scholarship to ST students for class 9 and 10. The reply is not acceptable due to the following reasons. As per the GoI guidelines for the scheme, States which are already giving scholarship to ST students from their own resources, would have to either continue to provide scholarship at the rate over and above the scholarship under the proposed Centrally Sponsored Scheme or if it chooses to reduce its own expenditure on its scheme because of the new scheme, such savings effected has to be utilised only on other educational programmes of ST students. However, department failed to comply with either of these conditions resulting in parking of ₹4.16 crore (including interest accrued) in the STSB account which was later resumed by the State Government.
Advice of Reserve Bank of India on TSB RBI advised the State Government on multiple occasions to phase out the Treasury Savings Bank Scheme in view of distortionary impact on the interest rate structure and distortion of fiscal discipline. However, the State Government has not taken any steps to phase out the Treasury Savings Bank Scheme till date.
4.9 Indiscriminate use of Minor head 800 Minor head 800 relating to Other Receipts and Other Expenditure is intended to be operated only when the appropriate minor head has not been provided in the accounts. Routine operation of minor head 800 is to be discouraged, since it renders the accounts opaque.
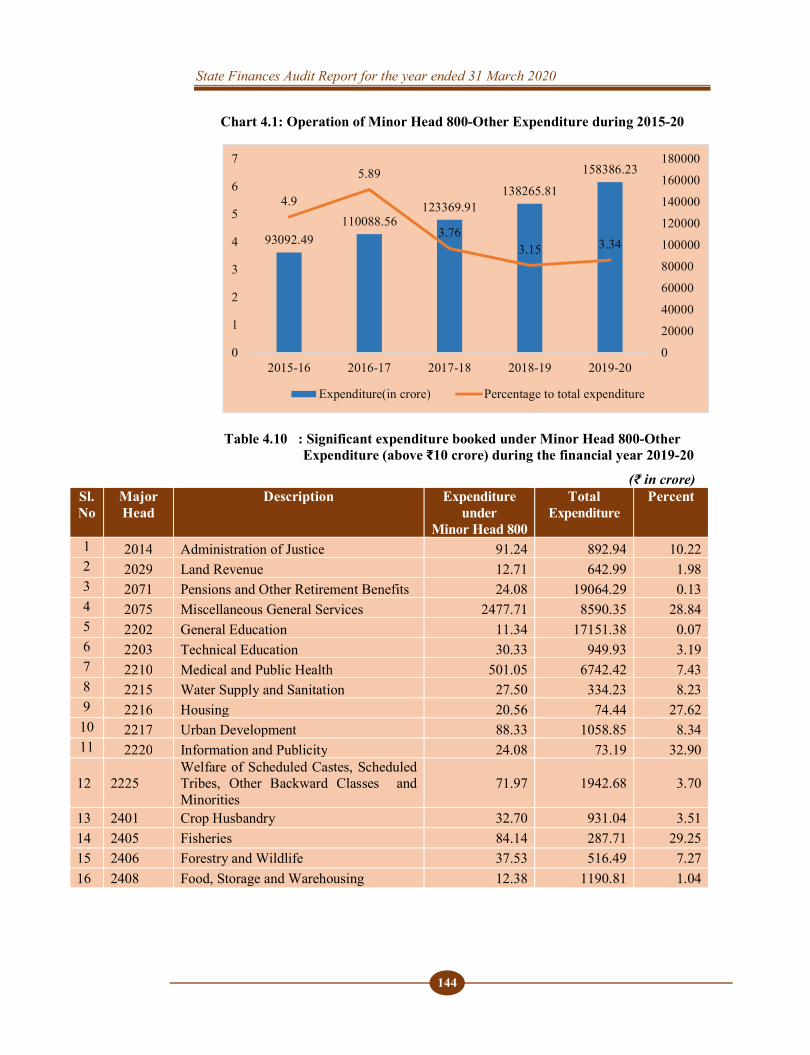
State Finances Audit Report for the year ended 31 March 2020
144
Chart 4.1: Operation of Minor Head 800-Other Expenditure during 2015-20
Table 4.10 : Significant expenditure booked under Minor Head 800-Other Expenditure (above ₹10 crore) during the financial year 2019-20
(₹ in crore)
93092.49110088.56
123369.91138265.81
158386.23
4.9
5.89
3.763.15 3.34
0
20000
40000
60000
80000
100000
120000
140000
160000
180000
0
1
2
3
4
5
6
7
2015-16 2016-17 2017-18 2018-19 2019-20
Expenditure(in crore) Percentage to total expenditure
Sl.No
Major Head
Description Expenditure under
Minor Head 800
Total Expenditure
Percent
1 2014 Administration of Justice 91.24 892.94 10.22 2 2029 Land Revenue 12.71 642.99 1.98 3 2071 Pensions and Other Retirement Benefits 24.08 19064.29 0.13 4 2075 Miscellaneous General Services 2477.71 8590.35 28.84 5 2202 General Education 11.34 17151.38 0.07 6 2203 Technical Education 30.33 949.93 3.19 7 2210 Medical and Public Health 501.05 6742.42 7.43 8 2215 Water Supply and Sanitation 27.50 334.23 8.23 9 2216 Housing 20.56 74.44 27.62 10 2217 Urban Development 88.33 1058.85 8.34 11 2220 Information and Publicity 24.08 73.19 32.90
12 2225 Welfare of Scheduled Castes, Scheduled Tribes, Other Backward Classes and Minorities
71.97 1942.68 3.70
13 2401 Crop Husbandry 32.70 931.04 3.51 14 2405 Fisheries 84.14 287.71 29.25 15 2406 Forestry and Wildlife 37.53 516.49 7.27 16 2408 Food, Storage and Warehousing 12.38 1190.81 1.04
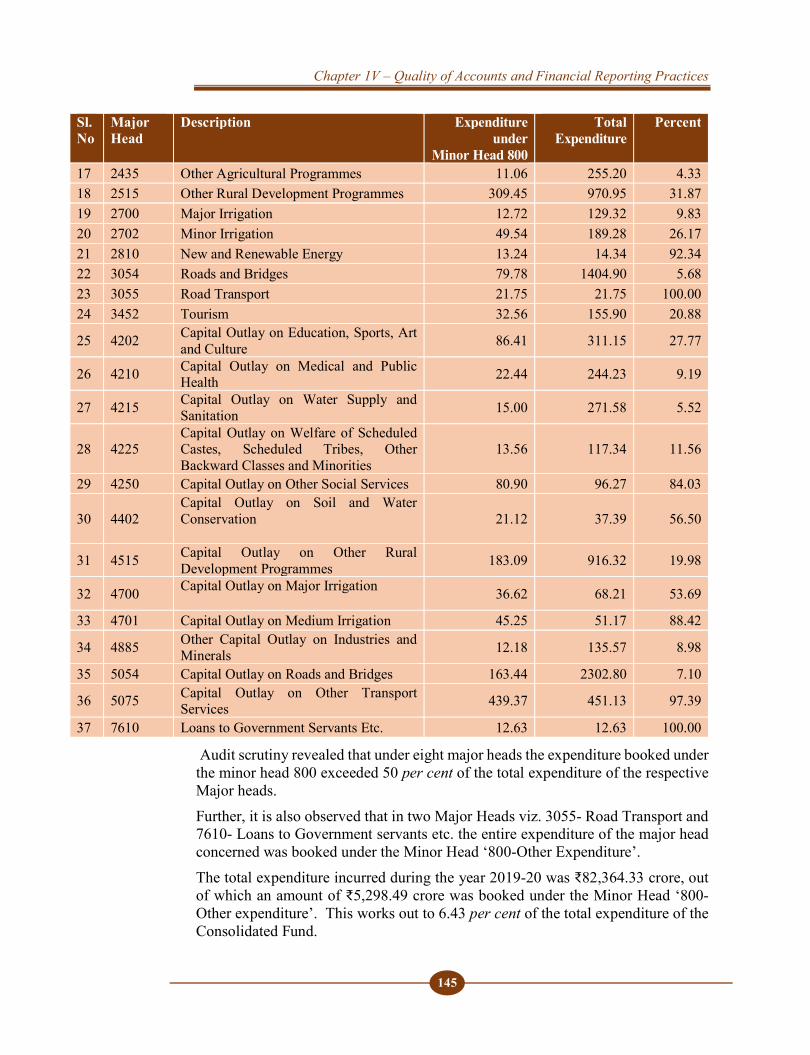
Chapter 1V – Quality of Accounts and Financial Reporting Practices
145
Audit scrutiny revealed that under eight major heads the expenditure booked under the minor head 800 exceeded 50 per cent of the total expenditure of the respective Major heads. Further, it is also observed that in two Major Heads viz. 3055- Road Transport and 7610- Loans to Government servants etc. the entire expenditure of the major head concerned was booked under the Minor Head ‘800-Other Expenditure’. The total expenditure incurred during the year 2019-20 was ₹82,364.33 crore, out of which an amount of ₹5,298.49 crore was booked under the Minor Head ‘800-Other expenditure’. This works out to 6.43 per cent of the total expenditure of the Consolidated Fund.
Sl.No
Major Head
Description Expenditure under
Minor Head 800
Total Expenditure
Percent
17 2435 Other Agricultural Programmes 11.06 255.20 4.33 18 2515 Other Rural Development Programmes 309.45 970.95 31.87 19 2700 Major Irrigation 12.72 129.32 9.83 20 2702 Minor Irrigation 49.54 189.28 26.17 21 2810 New and Renewable Energy 13.24 14.34 92.34 22 3054 Roads and Bridges 79.78 1404.90 5.68 23 3055 Road Transport 21.75 21.75 100.00 24 3452 Tourism 32.56 155.90 20.88
25 4202 Capital Outlay on Education, Sports, Art and Culture 86.41 311.15 27.77
26 4210 Capital Outlay on Medical and Public Health 22.44 244.23 9.19
27 4215 Capital Outlay on Water Supply and Sanitation 15.00 271.58 5.52
28 4225 Capital Outlay on Welfare of Scheduled Castes, Scheduled Tribes, Other Backward Classes and Minorities
13.56 117.34 11.56
29 4250 Capital Outlay on Other Social Services 80.90 96.27 84.03
30 4402 Capital Outlay on Soil and Water Conservation
21.12 37.39 56.50
31 4515 Capital Outlay on Other Rural Development Programmes 183.09 916.32 19.98
32 4700 Capital Outlay on Major Irrigation 36.62 68.21 53.69
33 4701 Capital Outlay on Medium Irrigation 45.25 51.17 88.42
34 4885 Other Capital Outlay on Industries and Minerals 12.18 135.57 8.98
35 5054 Capital Outlay on Roads and Bridges 163.44 2302.80 7.10
36 5075 Capital Outlay on Other Transport Services 439.37 451.13 97.39
37 7610 Loans to Government Servants Etc. 12.63 12.63 100.00
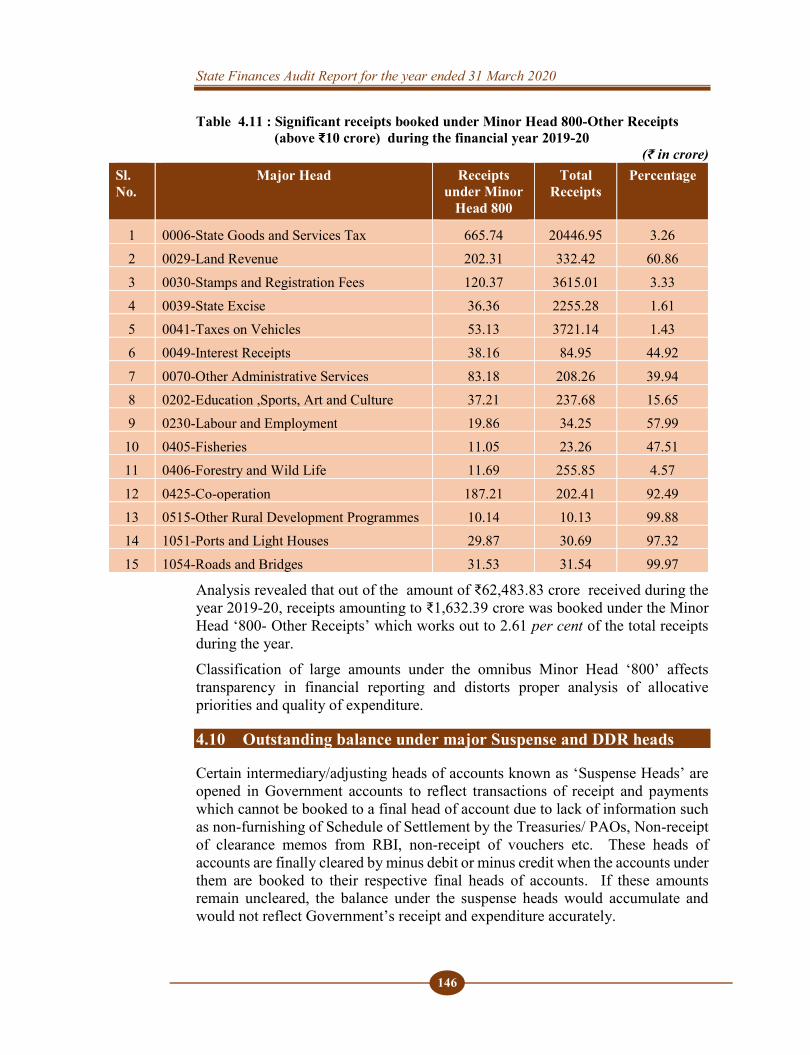
State Finances Audit Report for the year ended 31 March 2020
146
Table 4.11 : Significant receipts booked under Minor Head 800-Other Receipts (above ₹10 crore) during the financial year 2019-20
(₹ in crore) Sl. No.
Major Head Receipts under Minor
Head 800
Total Receipts
Percentage
1 0006-State Goods and Services Tax 665.74 20446.95 3.26 2 0029-Land Revenue 202.31 332.42 60.86 3 0030-Stamps and Registration Fees 120.37 3615.01 3.33 4 0039-State Excise 36.36 2255.28 1.61 5 0041-Taxes on Vehicles 53.13 3721.14 1.43 6 0049-Interest Receipts 38.16 84.95 44.92 7 0070-Other Administrative Services 83.18 208.26 39.94 8 0202-Education ,Sports, Art and Culture 37.21 237.68 15.65 9 0230-Labour and Employment 19.86 34.25 57.99
10 0405-Fisheries 11.05 23.26 47.51 11 0406-Forestry and Wild Life 11.69 255.85 4.57 12 0425-Co-operation 187.21 202.41 92.49 13 0515-Other Rural Development Programmes 10.14 10.13 99.88 14 1051-Ports and Light Houses 29.87 30.69 97.32 15 1054-Roads and Bridges 31.53 31.54 99.97
Analysis revealed that out of the amount of ₹62,483.83 crore received during the year 2019-20, receipts amounting to ₹1,632.39 crore was booked under the Minor Head ‘800- Other Receipts’ which works out to 2.61 per cent of the total receipts during the year. Classification of large amounts under the omnibus Minor Head ‘800’ affects transparency in financial reporting and distorts proper analysis of allocative priorities and quality of expenditure.
4.10 Outstanding balance under major Suspense and DDR heads
Certain intermediary/adjusting heads of accounts known as ‘Suspense Heads’ are opened in Government accounts to reflect transactions of receipt and payments which cannot be booked to a final head of account due to lack of information such as non-furnishing of Schedule of Settlement by the Treasuries/ PAOs, Non-receipt of clearance memos from RBI, non-receipt of vouchers etc. These heads of accounts are finally cleared by minus debit or minus credit when the accounts under them are booked to their respective final heads of accounts. If these amounts remain uncleared, the balance under the suspense heads would accumulate and would not reflect Government’s receipt and expenditure accurately.
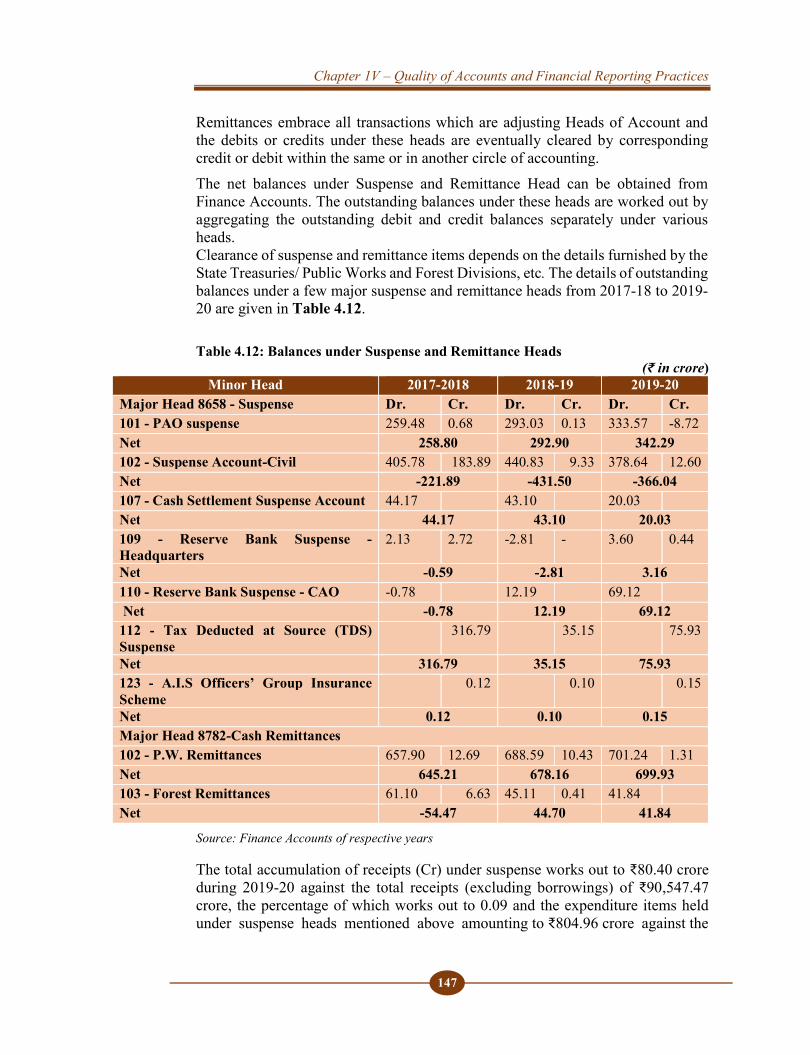
Chapter 1V – Quality of Accounts and Financial Reporting Practices
147
Remittances embrace all transactions which are adjusting Heads of Account and the debits or credits under these heads are eventually cleared by corresponding credit or debit within the same or in another circle of accounting. The net balances under Suspense and Remittance Head can be obtained from Finance Accounts. The outstanding balances under these heads are worked out by aggregating the outstanding debit and credit balances separately under various heads. Clearance of suspense and remittance items depends on the details furnished by the State Treasuries/ Public Works and Forest Divisions, etc. The details of outstanding balances under a few major suspense and remittance heads from 2017-18 to 2019-20 are given in Table 4.12.
Table 4.12: Balances under Suspense and Remittance Heads (₹ in crore)
Minor Head 2017-2018 2018-19 2019-20 Major Head 8658 - Suspense Dr. Cr. Dr. Cr. Dr. Cr. 101 - PAO suspense 259.48 0.68 293.03 0.13 333.57 -8.72 Net 258.80 292.90 342.29 102 - Suspense Account-Civil 405.78 183.89 440.83 9.33 378.64 12.60 Net -221.89 -431.50 -366.04 107 - Cash Settlement Suspense Account 44.17 43.10 20.03 Net 44.17 43.10 20.03 109 - Reserve Bank Suspense -Headquarters
2.13 2.72 -2.81 - 3.60 0.44
Net -0.59 -2.81 3.16 110 - Reserve Bank Suspense - CAO -0.78 12.19 69.12 Net -0.78 12.19 69.12 112 - Tax Deducted at Source (TDS) Suspense
316.79 35.15 75.93
Net 316.79 35.15 75.93 123 - A.I.S Officers’ Group Insurance Scheme
0.12 0.10 0.15
Net 0.12 0.10 0.15 Major Head 8782-Cash Remittances 102 - P.W. Remittances 657.90 12.69 688.59 10.43 701.24 1.31 Net 645.21 678.16 699.93 103 - Forest Remittances 61.10 6.63 45.11 0.41 41.84 Net -54.47 44.70 41.84
Source: Finance Accounts of respective years
The total accumulation of receipts (Cr) under suspense works out to ₹80.40 crore during 2019-20 against the total receipts (excluding borrowings) of ₹90,547.47 crore, the percentage of which works out to 0.09 and the expenditure items held under suspense heads mentioned above amounting to ₹804.96 crore against the

State Finances Audit Report for the year ended 31 March 2020
148
revenue and capital expenditure to the tune of ₹1,14,385 crore, the percentage of which works out to 0.70. Accumulations under suspense heads except Cash settlement suspense showed an increasing trend from the year 2017-18 to 2019-20. These accumulations affect the accuracy of the Government Accounts.
4.11 Non-reconciliation of Departmental figures To enable Controlling Officers of the Departments to exercise effective control over spending to keep it within the budget grants and to ensure accuracy of their accounts, Para 74 of the Kerala Budget Manual stipulates that receipts and expenditure during the financial year recorded in their books be reconciled by them every month with that recorded in the books of the Accountant General (A&E). Reconciliation and verification of figures is an important tool of financial management. Failure to exercise/adhere to the codal provisions and executive instructions in this regard not only results in misclassification and incorrect booking of receipts and expenditure in the accounts, but also defeats the very objective of budgetary process. Status of reconciliation done by the Controlling Officers (COs) for three years is given in Table 4.13.
Table 4.13: Status of Reconciliation of Receipts and Expenditure figures by Controlling Officers
Year Total No. of Controlling Officers
Fully Reconciled
Partially Reconciled
Not reconciled at all
Receipts
2017-18 70 65 5 Nil
2018-19 67 58 9 Nil
2019-20 65 65 Nil Nil
Expenditure
2017-18 215 184 18 13
2018-19 215 160 38 17
2019-20 207 150 38 19

Chapter 1V – Quality of Accounts and Financial Reporting Practices
149
Chart 4.2 : Status of reconciliation during the last three years
Audit scrutiny revealed that percentage of non- reconciliation of expenditure initially increased from 5.94 per cent in 2017-18 to 12.61 per cent in 2018-19 and then declined to 3.98 per cent in 2019-20. This indicates that the department and Office of the Accountant General (A&E) are giving adequate attention to reconciliation. Similarly, the percentage of non-reconciliation of receipts also showed a decline from 35.71 per cent in 2017-18 to 35.02 per cent in 2018-19 and then to 3.08 per cent in 2019-20.
4.12 Reconciliation of Cash Balances There should be no difference between the Cash Balance of the State as per the books of Accounts of the Accountant General (A&E), and the Cash Balance as reported by the Reserve Bank of India. However, a scrutiny of Finance Accounts for the year 2019-20 has revealed that the cash balance of the State of Kerala for the year ending March 2020 as per the books of Accountant General (A&E) was ₹221.02 crore (Credit) whereas the Cash balance reported by Reserve Bank of India was ₹1.19 (Debit). Thus, there is a difference of ₹219.83 crore (Debit). It is stated in the Finance Accounts that ₹201.17 crore (net credit) would be cleared in 2020-21 and the balance difference of ₹421.00 crore (net debit) is under investigation.
70277.69124466.51
65966.76
111779.46
67373.24
104939.91
45184.56
117076.34
42867.02
97681.32
65297.55
100764.67
0 20000 40000 60000 80000 100000 120000 140000
2017-18(Receipts)
2017-18(Expenditure)
2018-19(Receipts)
2018-19(Expenditure)
2019-20(Receipts)
2019-20(Expenditure)
Status of Reconciliation during the last three years ( ₹ in crore)
Reconciled Receipts/ Expenditure Total Receipts/ Expenditure
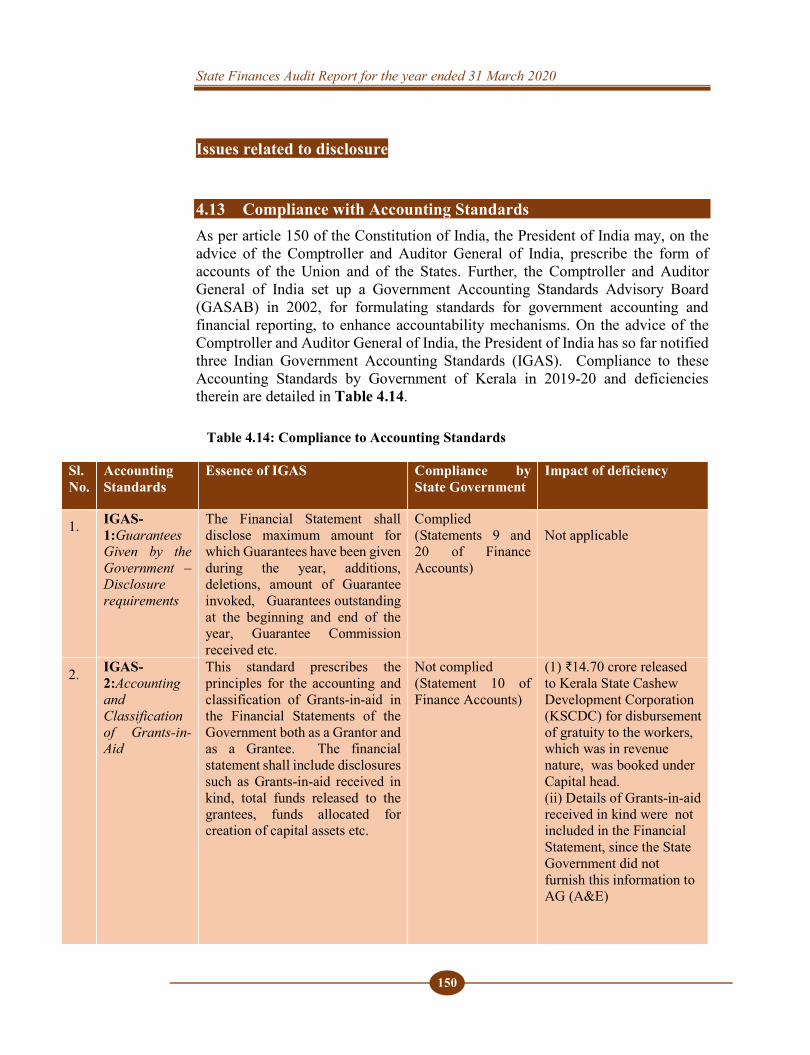
State Finances Audit Report for the year ended 31 March 2020
150
Issues related to disclosure
4.13 Compliance with Accounting Standards As per article 150 of the Constitution of India, the President of India may, on the advice of the Comptroller and Auditor General of India, prescribe the form of accounts of the Union and of the States. Further, the Comptroller and Auditor General of India set up a Government Accounting Standards Advisory Board (GASAB) in 2002, for formulating standards for government accounting and financial reporting, to enhance accountability mechanisms. On the advice of the Comptroller and Auditor General of India, the President of India has so far notified three Indian Government Accounting Standards (IGAS). Compliance to these Accounting Standards by Government of Kerala in 2019-20 and deficiencies therein are detailed in Table 4.14. Table 4.14: Compliance to Accounting Standards
Sl. No.
Accounting Standards
Essence of IGAS Compliance by State Government
Impact of deficiency
1. IGAS-1:Guarantees Given by the Government – Disclosure requirements
The Financial Statement shall disclose maximum amount for which Guarantees have been given during the year, additions, deletions, amount of Guarantee invoked, Guarantees outstanding at the beginning and end of the year, Guarantee Commission received etc.
Complied (Statements 9 and 20 of Finance Accounts)
Not applicable
2. IGAS-2:Accounting and Classification of Grants-in- Aid
This standard prescribes the principles for the accounting and classification of Grants-in-aid in the Financial Statements of the Government both as a Grantor and as a Grantee. The financial statement shall include disclosures such as Grants-in-aid received in kind, total funds released to the grantees, funds allocated for creation of capital assets etc.
Not complied (Statement 10 of Finance Accounts)
(1) ₹14.70 crore released to Kerala State Cashew Development Corporation (KSCDC) for disbursement of gratuity to the workers, which was in revenue nature, was booked under Capital head. (ii) Details of Grants-in-aid received in kind were not included in the Financial Statement, since the State Government did not furnish this information to AG (A&E)
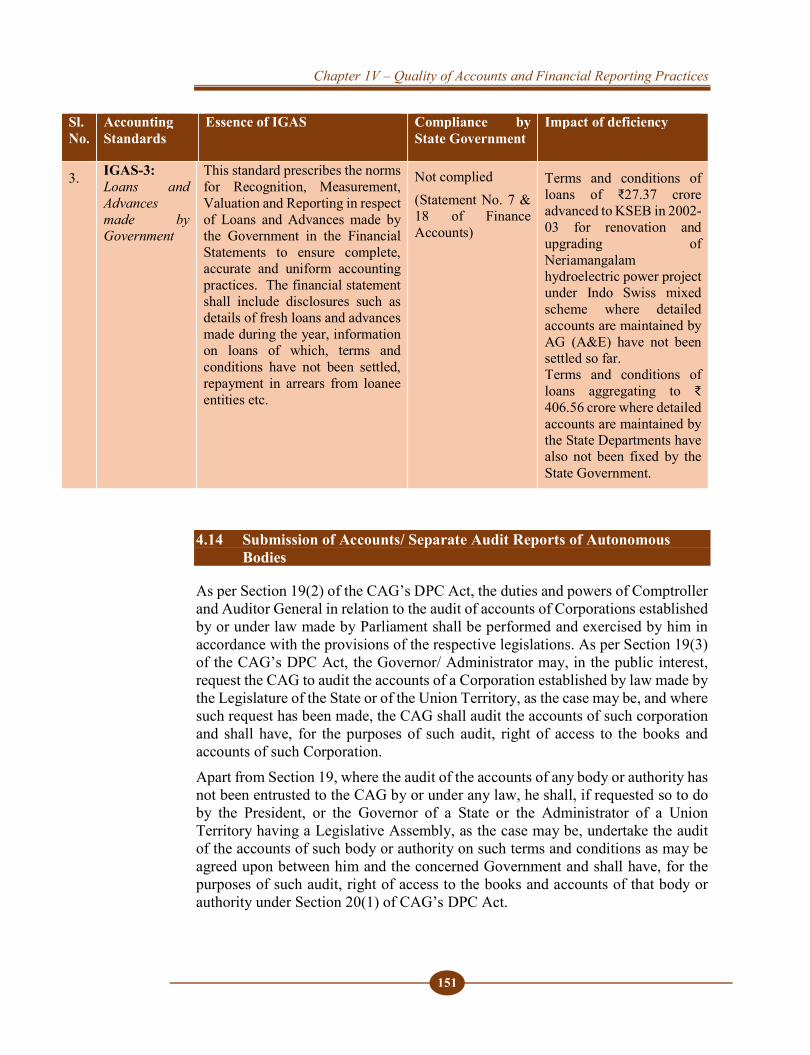
Chapter 1V – Quality of Accounts and Financial Reporting Practices
151
Sl. No.
Accounting Standards
Essence of IGAS Compliance by State Government
Impact of deficiency
3. IGAS-3: Loans and Advances made by Government
This standard prescribes the norms for Recognition, Measurement, Valuation and Reporting in respect of Loans and Advances made by the Government in the Financial Statements to ensure complete, accurate and uniform accounting practices. The financial statement shall include disclosures such as details of fresh loans and advances made during the year, information on loans of which, terms and conditions have not been settled, repayment in arrears from loanee entities etc.
Not complied (Statement No. 7 & 18 of Finance Accounts)
Terms and conditions of loans of ₹27.37 crore advanced to KSEB in 2002-03 for renovation and upgrading of Neriamangalam hydroelectric power project under Indo Swiss mixed scheme where detailed accounts are maintained by AG (A&E) have not been settled so far. Terms and conditions of loans aggregating to ₹ 406.56 crore where detailed accounts are maintained by the State Departments have also not been fixed by the State Government.
4.14 Submission of Accounts/ Separate Audit Reports of Autonomous Bodies
As per Section 19(2) of the CAG’s DPC Act, the duties and powers of Comptroller and Auditor General in relation to the audit of accounts of Corporations established by or under law made by Parliament shall be performed and exercised by him in accordance with the provisions of the respective legislations. As per Section 19(3) of the CAG’s DPC Act, the Governor/ Administrator may, in the public interest, request the CAG to audit the accounts of a Corporation established by law made by the Legislature of the State or of the Union Territory, as the case may be, and where such request has been made, the CAG shall audit the accounts of such corporation and shall have, for the purposes of such audit, right of access to the books and accounts of such Corporation. Apart from Section 19, where the audit of the accounts of any body or authority has not been entrusted to the CAG by or under any law, he shall, if requested so to do by the President, or the Governor of a State or the Administrator of a Union Territory having a Legislative Assembly, as the case may be, undertake the audit of the accounts of such body or authority on such terms and conditions as may be agreed upon between him and the concerned Government and shall have, for the purposes of such audit, right of access to the books and accounts of that body or authority under Section 20(1) of CAG’s DPC Act.
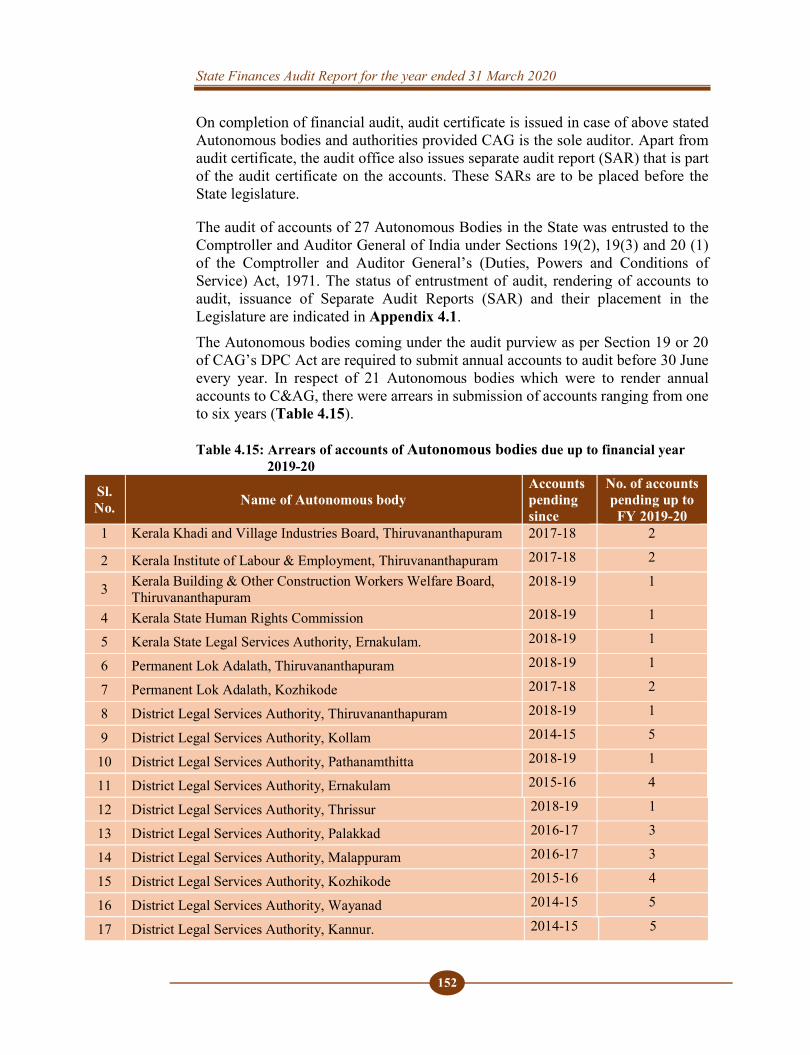
State Finances Audit Report for the year ended 31 March 2020
152
On completion of financial audit, audit certificate is issued in case of above stated Autonomous bodies and authorities provided CAG is the sole auditor. Apart from audit certificate, the audit office also issues separate audit report (SAR) that is part of the audit certificate on the accounts. These SARs are to be placed before the State legislature.
The audit of accounts of 27 Autonomous Bodies in the State was entrusted to the Comptroller and Auditor General of India under Sections 19(2), 19(3) and 20 (1) of the Comptroller and Auditor General’s (Duties, Powers and Conditions of Service) Act, 1971. The status of entrustment of audit, rendering of accounts to audit, issuance of Separate Audit Reports (SAR) and their placement in the Legislature are indicated in Appendix 4.1. The Autonomous bodies coming under the audit purview as per Section 19 or 20 of CAG’s DPC Act are required to submit annual accounts to audit before 30 June every year. In respect of 21 Autonomous bodies which were to render annual accounts to C&AG, there were arrears in submission of accounts ranging from one to six years (Table 4.15). Table 4.15: Arrears of accounts of Autonomous bodies due up to financial year 2019-20
Sl. No. Name of Autonomous body
Accounts pending since
No. of accounts pending up to FY 2019-20
1 Kerala Khadi and Village Industries Board, Thiruvananthapuram 2017-18 2
2 Kerala Institute of Labour & Employment, Thiruvananthapuram 2017-18 2
3 Kerala Building & Other Construction Workers Welfare Board, Thiruvananthapuram
2018-19 1
4 Kerala State Human Rights Commission 2018-19 1
5 Kerala State Legal Services Authority, Ernakulam. 2018-19 1
6 Permanent Lok Adalath, Thiruvananthapuram 2018-19 1
7 Permanent Lok Adalath, Kozhikode 2017-18 2
8 District Legal Services Authority, Thiruvananthapuram 2018-19 1
9 District Legal Services Authority, Kollam 2014-15 5
10 District Legal Services Authority, Pathanamthitta 2018-19 1
11 District Legal Services Authority, Ernakulam 2015-16 4
12 District Legal Services Authority, Thrissur 2018-19 1
13 District Legal Services Authority, Palakkad 2016-17 3
14 District Legal Services Authority, Malappuram 2016-17 3
15 District Legal Services Authority, Kozhikode 2015-16 4
16 District Legal Services Authority, Wayanad 2014-15 5
17 District Legal Services Authority, Kannur. 2014-15 5
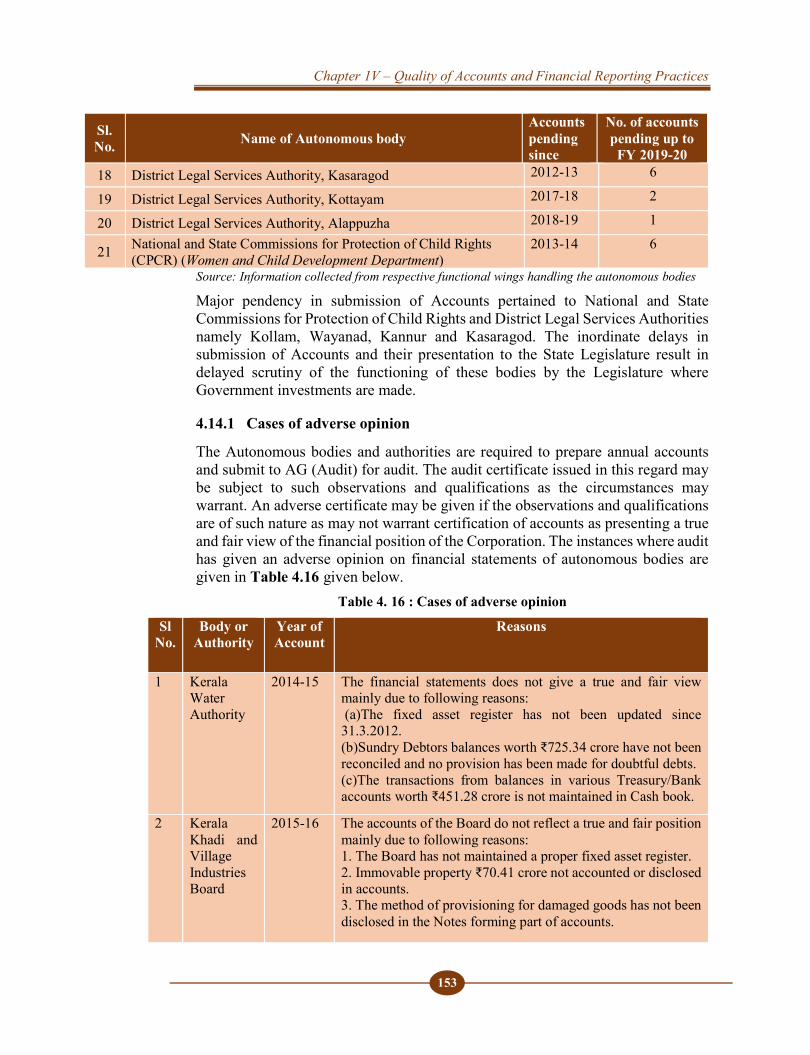
Chapter 1V – Quality of Accounts and Financial Reporting Practices
153
Sl. No. Name of Autonomous body
Accounts pending since
No. of accounts pending up to FY 2019-20
18 District Legal Services Authority, Kasaragod 2012-13 6
19 District Legal Services Authority, Kottayam 2017-18 2
20 District Legal Services Authority, Alappuzha 2018-19 1
21 National and State Commissions for Protection of Child Rights (CPCR) (Women and Child Development Department)
2013-14 6
Source: Information collected from respective functional wings handling the autonomous bodies
Major pendency in submission of Accounts pertained to National and State Commissions for Protection of Child Rights and District Legal Services Authorities namely Kollam, Wayanad, Kannur and Kasaragod. The inordinate delays in submission of Accounts and their presentation to the State Legislature result in delayed scrutiny of the functioning of these bodies by the Legislature where Government investments are made.
4.14.1 Cases of adverse opinion
The Autonomous bodies and authorities are required to prepare annual accounts and submit to AG (Audit) for audit. The audit certificate issued in this regard may be subject to such observations and qualifications as the circumstances may warrant. An adverse certificate may be given if the observations and qualifications are of such nature as may not warrant certification of accounts as presenting a true and fair view of the financial position of the Corporation. The instances where audit has given an adverse opinion on financial statements of autonomous bodies are given in Table 4.16 given below.
Table 4. 16 : Cases of adverse opinion
Sl No.
Body or Authority
Year of Account
Reasons
1 Kerala Water Authority
2014-15 The financial statements does not give a true and fair view mainly due to following reasons: (a)The fixed asset register has not been updated since 31.3.2012. (b)Sundry Debtors balances worth ₹725.34 crore have not been reconciled and no provision has been made for doubtful debts. (c)The transactions from balances in various Treasury/Bank accounts worth ₹451.28 crore is not maintained in Cash book.
2 Kerala Khadi and Village Industries Board
2015-16
The accounts of the Board do not reflect a true and fair position mainly due to following reasons: 1. The Board has not maintained a proper fixed asset register. 2. Immovable property ₹70.41 crore not accounted or disclosed in accounts. 3. The method of provisioning for damaged goods has not been disclosed in the Notes forming part of accounts.
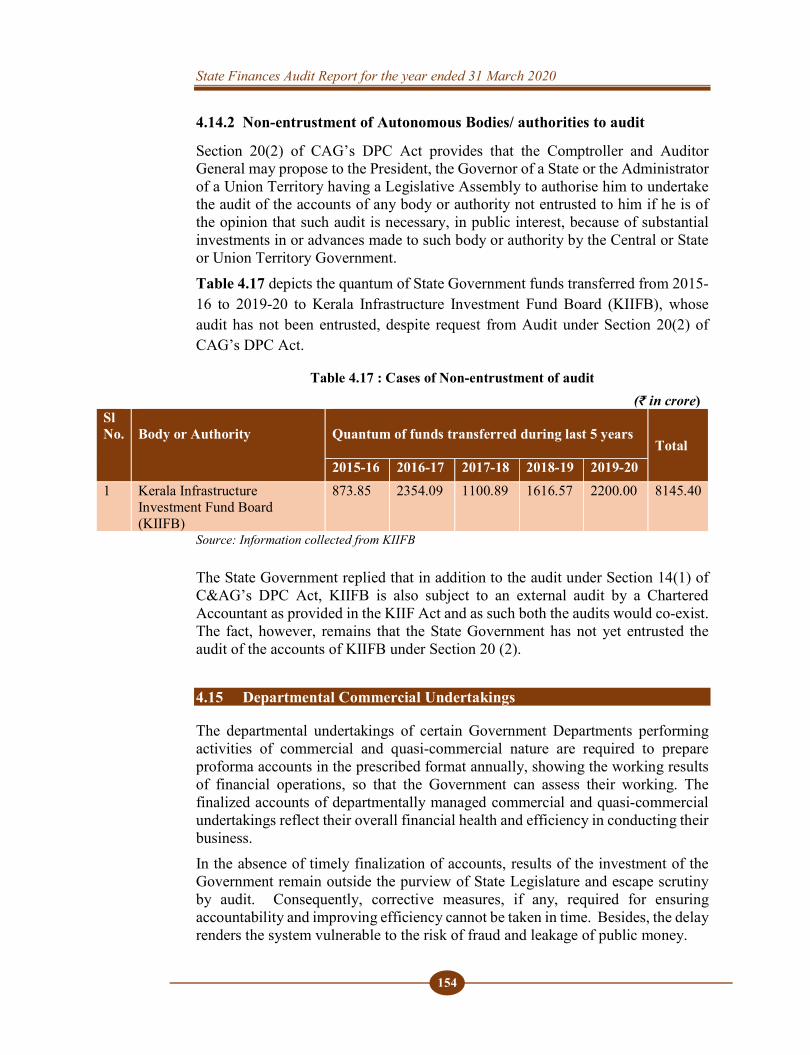
State Finances Audit Report for the year ended 31 March 2020
154
4.14.2 Non-entrustment of Autonomous Bodies/ authorities to audit
Section 20(2) of CAG’s DPC Act provides that the Comptroller and Auditor General may propose to the President, the Governor of a State or the Administrator of a Union Territory having a Legislative Assembly to authorise him to undertake the audit of the accounts of any body or authority not entrusted to him if he is of the opinion that such audit is necessary, in public interest, because of substantial investments in or advances made to such body or authority by the Central or State or Union Territory Government. Table 4.17 depicts the quantum of State Government funds transferred from 2015-16 to 2019-20 to Kerala Infrastructure Investment Fund Board (KIIFB), whose audit has not been entrusted, despite request from Audit under Section 20(2) of CAG’s DPC Act.
Table 4.17 : Cases of Non-entrustment of audit (₹ in crore)
Sl No.
Body or Authority
Quantum of funds transferred during last 5 years Total 2015-16 2016-17 2017-18 2018-19 2019-20
1 Kerala Infrastructure Investment Fund Board (KIIFB)
873.85 2354.09 1100.89 1616.57 2200.00 8145.40
Source: Information collected from KIIFB
The State Government replied that in addition to the audit under Section 14(1) of C&AG’s DPC Act, KIIFB is also subject to an external audit by a Chartered Accountant as provided in the KIIF Act and as such both the audits would co-exist. The fact, however, remains that the State Government has not yet entrusted the audit of the accounts of KIIFB under Section 20 (2).
4.15 Departmental Commercial Undertakings
The departmental undertakings of certain Government Departments performing activities of commercial and quasi-commercial nature are required to prepare proforma accounts in the prescribed format annually, showing the working results of financial operations, so that the Government can assess their working. The finalized accounts of departmentally managed commercial and quasi-commercial undertakings reflect their overall financial health and efficiency in conducting their business. In the absence of timely finalization of accounts, results of the investment of the Government remain outside the purview of State Legislature and escape scrutiny by audit. Consequently, corrective measures, if any, required for ensuring accountability and improving efficiency cannot be taken in time. Besides, the delay renders the system vulnerable to the risk of fraud and leakage of public money.
Chapter 1V – Quality of Accounts and Financial Reporting Practices
155
The Heads of Departments in the Government are to ensure that the departmental undertakings prepare such accounts and submit the same to the Accountant General (Audit) within a specified time frame. The department-wise position of arrears in preparation of pro forma accounts and investments made by the Government in respect of three such undertakings, are given in Appendix 4.2. Out of the three, two were running in loss (State Water Transport Department and Text Book Office). Accounts of Text Book Office were in arrears from 1987-88. The State Government decided (December 2008) to dispense with the preparation of pro forma accounts for the period from 1975-76 to 1986-87 in respect of State Text Book Office. Decision on preparation of pro forma accounts for the period from 1987-88 to 2003-04 was pending with the Government. In the absence of up-to-date accounts, the current financial status of the Text Book Office could not be ascertained.
4.16 Non-submission of details of grants/ loans given to bodies and authorities
Sections 14 and 15 of the Comptroller and Auditor General’s (CAG) (Duties, Powers and Conditions of Service) Act, 1971 (DPC Act) envisages audit of receipt and expenditure of institutions receiving Government grants, subject to conditions stipulated based on the quantum of the grants received. In order to identify the institutions / organisations which attract audit under Sections 14 and 15 of the Comptroller and Auditor General’s (Duties, Powers and Conditions of Service) Act 1971(C&AG’s DPC Act), the Government / HODs are required to furnish to Audit every year
detailed information about the financial assistance given to various institutions,
the purpose for which the assistance is granted, and total expenditure of the institutions.
Further, Regulation on Audit and Accounts, 2007 provides that Governments and Heads of departments which sanction grants and/ or loans to bodies or authorities shall furnish to the audit office by end of July every year a statement of such bodies and authorities to which grants and/ or loans aggregating ₹10 lakh or more were paid during the preceding year indicating (a) the amount of assistance; (b) the purpose for which the assistance was sanctioned; and (c) the total expenditure of the body or authority. Only three49 out of 44 departments had furnished the details of grants-in-aid given to various bodies and authorities during the preceding year 2018-19. In the absence of the information from remaining 41 departments, reasonable assurance could not be provided to the Legislature/Government about the manner in which the grants sanctioned / released by them had been utilised. This dilutes the legislative control over the Government expenditure system.
49 General Education Department; Higher Education Department; Cultural Affairs Department.
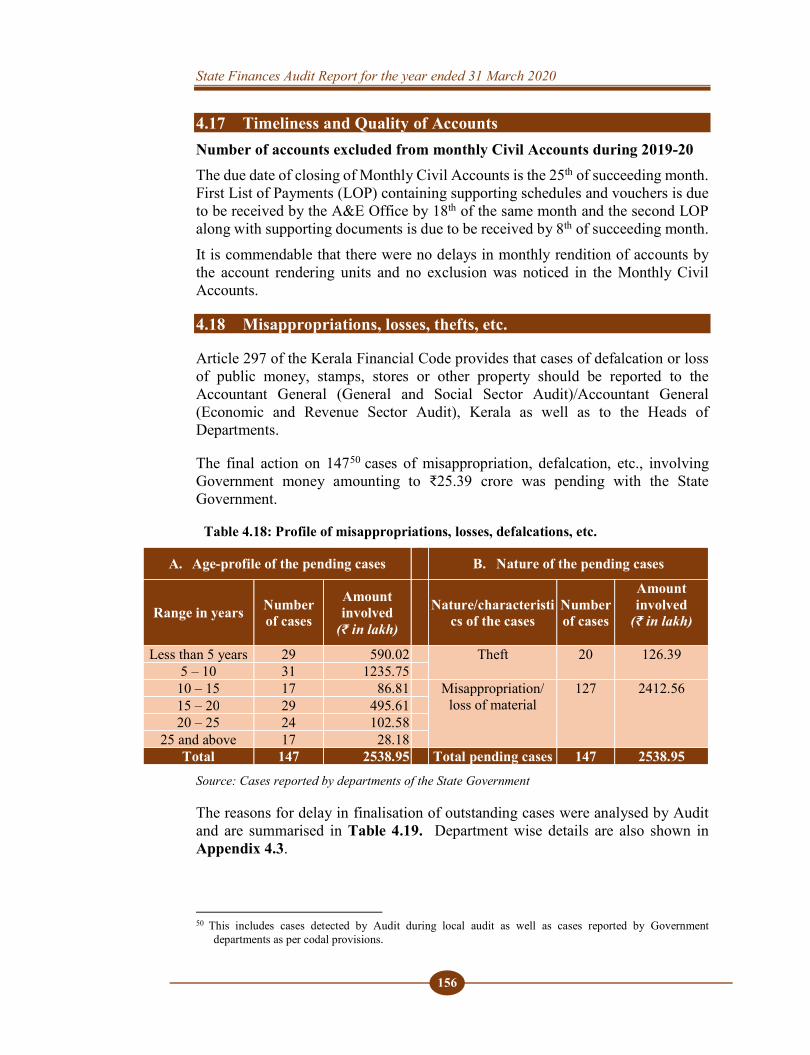
State Finances Audit Report for the year ended 31 March 2020
156
4.17 Timeliness and Quality of Accounts Number of accounts excluded from monthly Civil Accounts during 2019-20 The due date of closing of Monthly Civil Accounts is the 25th of succeeding month. First List of Payments (LOP) containing supporting schedules and vouchers is due to be received by the A&E Office by 18th of the same month and the second LOP along with supporting documents is due to be received by 8th of succeeding month. It is commendable that there were no delays in monthly rendition of accounts by the account rendering units and no exclusion was noticed in the Monthly Civil Accounts.
4.18 Misappropriations, losses, thefts, etc.
Article 297 of the Kerala Financial Code provides that cases of defalcation or loss of public money, stamps, stores or other property should be reported to the Accountant General (General and Social Sector Audit)/Accountant General (Economic and Revenue Sector Audit), Kerala as well as to the Heads of Departments.
The final action on 14750 cases of misappropriation, defalcation, etc., involving Government money amounting to ₹25.39 crore was pending with the State Government.
Table 4.18: Profile of misappropriations, losses, defalcations, etc.
A. Age-profile of the pending cases B. Nature of the pending cases
Range in years Number of cases
Amount involved
(₹ in lakh)
Nature/characteristi
cs of the cases Number of cases
Amount involved
(₹ in lakh)
Less than 5 years 29 590.02 Theft 20 126.39 5 – 10 31 1235.75
10 – 15 17 86.81 Misappropriation/ loss of material
127 2412.56 15 – 20 29 495.61 20 – 25 24 102.58
25 and above 17 28.18 Total 147 2538.95 Total pending cases 147 2538.95
Source: Cases reported by departments of the State Government
The reasons for delay in finalisation of outstanding cases were analysed by Audit and are summarised in Table 4.19. Department wise details are also shown in Appendix 4.3.
50 This includes cases detected by Audit during local audit as well as cases reported by Government
departments as per codal provisions.
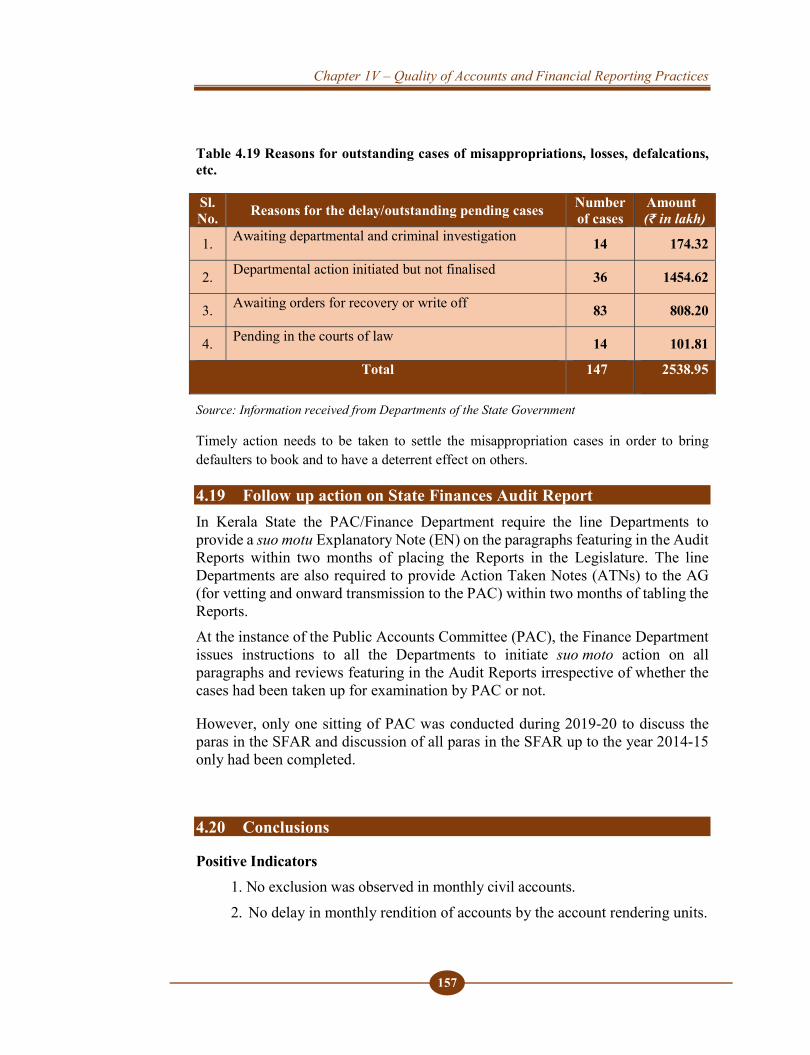
Chapter 1V – Quality of Accounts and Financial Reporting Practices
157
Table 4.19 Reasons for outstanding cases of misappropriations, losses, defalcations, etc.
Sl.No. Reasons for the delay/outstanding pending cases Number
of cases Amount (₹ in lakh)
1. Awaiting departmental and criminal investigation 14 174.32
2. Departmental action initiated but not finalised 36 1454.62
3. Awaiting orders for recovery or write off 83 808.20
4. Pending in the courts of law 14 101.81
Total 147 2538.95
Source: Information received from Departments of the State Government
Timely action needs to be taken to settle the misappropriation cases in order to bring defaulters to book and to have a deterrent effect on others.
4.19 Follow up action on State Finances Audit Report In Kerala State the PAC/Finance Department require the line Departments to provide a suo motu Explanatory Note (EN) on the paragraphs featuring in the Audit Reports within two months of placing the Reports in the Legislature. The line Departments are also required to provide Action Taken Notes (ATNs) to the AG (for vetting and onward transmission to the PAC) within two months of tabling the Reports. At the instance of the Public Accounts Committee (PAC), the Finance Department issues instructions to all the Departments to initiate suo moto action on all paragraphs and reviews featuring in the Audit Reports irrespective of whether the cases had been taken up for examination by PAC or not.
However, only one sitting of PAC was conducted during 2019-20 to discuss the paras in the SFAR and discussion of all paras in the SFAR up to the year 2014-15 only had been completed.
4.20 Conclusions
Positive Indicators 1. No exclusion was observed in monthly civil accounts. 2. No delay in monthly rendition of accounts by the account rendering units.
State Finances Audit Report for the year ended 31 March 2020
158
Negative Indicators 1. Persistent trend of cess/royalty/fund not being credited to Consolidated Fund
of the State. 2. Continuing cases of regulators maintaining ‘Fund’ outside Public Account
of the State (Funds of the Kerala State Electricity Regulatory Commission). 3. Increased tendency to postpone liabilities due, to the next financial year. 4. Increasing number of outstanding UCs. 5. Increasing arrears in respect of annual accounts of Autonomous bodies and
PSUs. 6. Increasing amount under Suspense Heads.
7. Non reconciliation with and accumulation of funds in Bank Accounts. 8. Classification of large amounts under the omnibus Minor Head ‘800’
affecting transparency in financial reporting and distorting proper analysis of allocative priorities and quality of expenditure.
4.21 Recommendations
1. The Government may bring all the funds lying outside the Consolidated Fund/ Public Accounts in breach of constitutional provisions, within the fold of Consolidated Fund/ Public Accounts.
2. Government should avoid deferring clear cut liabilities.
3. The Government may ensure timely submission of utilisation certificates by the departments in respect of the grants released for specific purposes.
4. The Finance Department may review all PD/STSB/PSTSB accounts to ensure that all amounts unnecessarily lying in these PD/STSB/PSTSB accounts are immediately remitted to the Consolidated Fund. Further, the Finance Department may reiterate the instructions contained in the financial rules and ensure that appropriate action is taken against departmental officers who fail to follow the rules.
5. Finance Department may consider evolving a system to expedite the process of compilation and submission of annual accounts by autonomous bodies and departmentally run undertakings in order to assess their financial position.
6. The Government may consider preparing a time bound framework for taking prompt action in cases of misappropriation, loss, theft, etc. and strengthening the internal control system to prevent recurrence of such cases.
Chapter 1V – Quality of Accounts and Financial Reporting Practices
159
7. The Finance Department may, in consultation with the Accountant General (A&E), conduct a comprehensive review of all items presently appearing under minor head 800 and ensure that all such receipts and expenditure are in future booked under the appropriate heads of account.
(K. P. ANAND) Thiruvananthapuram, Principal Accountant General The (Audit-II), Kerala
Countersigned
New Delhi, (GIRISH CHANDRA MURMU) The Comptroller and Auditor General of India
State Finances Audit Report for the year ended 31 March 2020
158
Negative Indicators 1. Persistent trend of cess/royalty/fund not being credited to Consolidated Fund
of the State. 2. Continuing cases of regulators maintaining ‘Fund’ outside Public Account
of the State (Funds of the Kerala State Electricity Regulatory Commission). 3. Increased tendency to postpone liabilities due, to the next financial year. 4. Increasing number of outstanding UCs. 5. Increasing arrears in respect of annual accounts of Autonomous bodies and
PSUs. 6. Increasing amount under Suspense Heads.
7. Non reconciliation with and accumulation of funds in Bank Accounts. 8. Classification of large amounts under the omnibus Minor Head ‘800’
affecting transparency in financial reporting and distorting proper analysis of allocative priorities and quality of expenditure.
4.21 Recommendations
1. The Government may bring all the funds lying outside the Consolidated Fund/ Public Accounts in breach of constitutional provisions, within the fold of Consolidated Fund/ Public Accounts.
2. Government should avoid deferring clear cut liabilities.
3. The Government may ensure timely submission of utilisation certificates by the departments in respect of the grants released for specific purposes.
4. The Finance Department may review all PD/STSB/PSTSB accounts to ensure that all amounts unnecessarily lying in these PD/STSB/PSTSB accounts are immediately remitted to the Consolidated Fund. Further, the Finance Department may reiterate the instructions contained in the financial rules and ensure that appropriate action is taken against departmental officers who fail to follow the rules.
5. Finance Department may consider evolving a system to expedite the process of compilation and submission of annual accounts by autonomous bodies and departmentally run undertakings in order to assess their financial position.
6. The Government may consider preparing a time bound framework for taking prompt action in cases of misappropriation, loss, theft, etc. and strengthening the internal control system to prevent recurrence of such cases.
16 September 2021
04 October 2021

APPENDICES
APPENDICES

APPENDICES
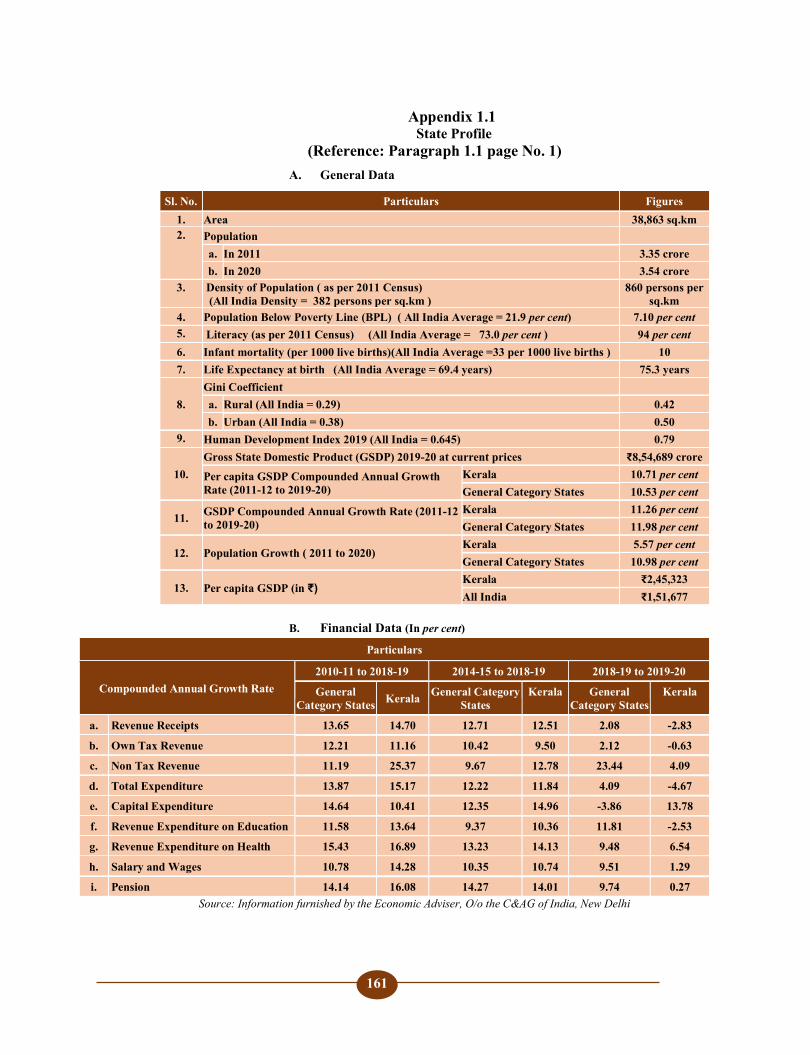
161
Appendix 1.1 State Profile
(Reference: Paragraph 1.1 page No. 1) A. General Data
Sl. No. Particulars Figures 1. Area 38,863 sq.km 2. Population
a. In 2011 3.35 crore b. In 2020 3.54 crore
3. Density of Population ( as per 2011 Census) (All India Density = 382 persons per sq.km )
860 persons per sq.km
4. Population Below Poverty Line (BPL) ( All India Average = 21.9 per cent) 7.10 per cent 5. Literacy (as per 2011 Census) (All India Average = 73.0 per cent ) 94 per cent 6. Infant mortality (per 1000 live births)(All India Average =33 per 1000 live births ) 10 7. Life Expectancy at birth (All India Average = 69.4 years) 75.3 years
8. Gini Coefficient a. Rural (All India = 0.29) 0.42 b. Urban (All India = 0.38) 0.50
9. Human Development Index 2019 (All India = 0.645) 0.79
10. Gross State Domestic Product (GSDP) 2019-20 at current prices ₹8,54,689 crore
Per capita GSDP Compounded Annual Growth Rate (2011-12 to 2019-20)
Kerala 10.71 per cent General Category States 10.53 per cent
11. GSDP Compounded Annual Growth Rate (2011-12 to 2019-20)
Kerala 11.26 per cent General Category States 11.98 per cent
12. Population Growth ( 2011 to 2020) Kerala 5.57 per cent General Category States 10.98 per cent
13. Per capita GSDP (in ₹) Kerala ₹2,45,323 All India ₹1,51,677
B. Financial Data (In per cent)
Particulars
Compounded Annual Growth Rate 2010-11 to 2018-19 2014-15 to 2018-19 2018-19 to 2019-20
General Category States Kerala General Category
States Kerala General
Category States Kerala
a. Revenue Receipts 13.65 14.70 12.71 12.51 2.08 -2.83
b. Own Tax Revenue 12.21 11.16 10.42 9.50 2.12 -0.63
c. Non Tax Revenue 11.19 25.37 9.67 12.78 23.44 4.09
d. Total Expenditure 13.87 15.17 12.22 11.84 4.09 -4.67
e. Capital Expenditure 14.64 10.41 12.35 14.96 -3.86 13.78
f. Revenue Expenditure on Education 11.58 13.64 9.37 10.36 11.81 -2.53
g. Revenue Expenditure on Health 15.43 16.89 13.23 14.13 9.48 6.54
h. Salary and Wages 10.78 14.28 10.35 10.74 9.51 1.29
i. Pension 14.14 16.08 14.27 14.01 9.74 0.27 Source: Information furnished by the Economic Adviser, O/o the C&AG of India, New Delhi
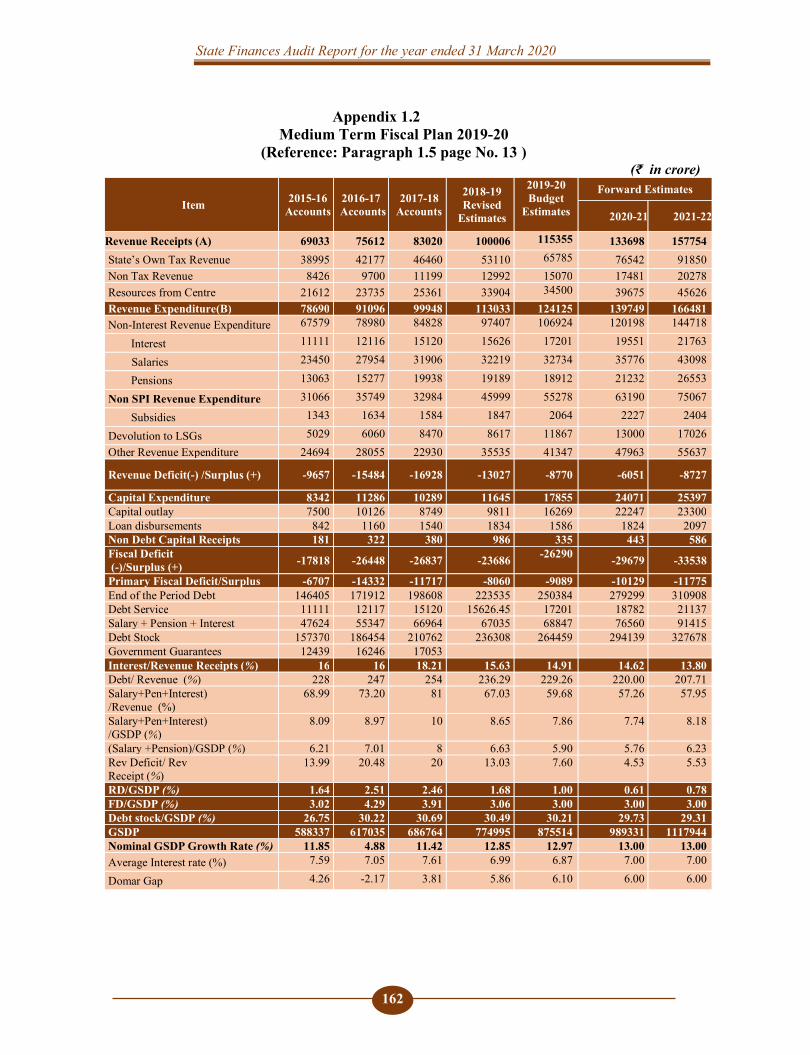
State Finances Audit Report for the year ended 31 March 2020
162
Appendix 1.2 Medium Term Fiscal Plan 2019-20
(Reference: Paragraph 1.5 page No. 13 ) (₹ in crore)
Item 2015-16 Accounts
2016-17 Accounts
2017-18 Accounts
2018-19 Revised
Estimates
2019-20 Budget
Estimates
Forward Estimates
2020-21 2021-22
Revenue Receipts (A) 69033 75612 83020 100006 115355 133698 157754 State’s Own Tax Revenue 38995 42177 46460 53110 65785 76542 91850 Non Tax Revenue 8426 9700 11199 12992 15070 17481 20278 Resources from Centre 21612 23735 25361 33904 34500 39675 45626 Revenue Expenditure(B) 78690 91096 99948 113033 124125 139749 166481 Non-Interest Revenue Expenditure 67579 78980 84828 97407 106924 120198 144718
Interest 11111 12116 15120 15626 17201 19551 21763
Salaries 23450 27954 31906 32219 32734 35776 43098
Pensions 13063 15277 19938 19189 18912 21232 26553
Non SPI Revenue Expenditure 31066 35749 32984 45999 55278 63190 75067
Subsidies 1343 1634 1584 1847 2064 2227 2404
Devolution to LSGs 5029 6060 8470 8617 11867 13000 17026 Other Revenue Expenditure 24694 28055 22930 35535 41347 47963 55637
Revenue Deficit(-) /Surplus (+) -9657 -15484 -16928 -13027 -8770 -6051 -8727
Capital Expenditure 8342 11286 10289 11645 17855 24071 25397 Capital outlay 7500 10126 8749 9811 16269 22247 23300 Loan disbursements 842 1160 1540 1834 1586 1824 2097 Non Debt Capital Receipts 181 322 380 986 335 443 586 Fiscal Deficit (-)/Surplus (+) -17818 -26448 -26837 -23686 -26290 -29679 -33538
Primary Fiscal Deficit/Surplus -6707 -14332 -11717 -8060 -9089 -10129 -11775 End of the Period Debt 146405 171912 198608 223535 250384 279299 310908 Debt Service 11111 12117 15120 15626.45 17201 18782 21137 Salary + Pension + Interest 47624 55347 66964 67035 68847 76560 91415 Debt Stock 157370 186454 210762 236308 264459 294139 327678 Government Guarantees 12439 16246 17053 Interest/Revenue Receipts (%) 16 16 18.21 15.63 14.91 14.62 13.80 Debt/ Revenue (%) 228 247 254 236.29 229.26 220.00 207.71 Salary+Pen+Interest) /Revenue (%)
68.99 73.20 81 67.03 59.68 57.26 57.95
Salary+Pen+Interest) /GSDP (%)
8.09 8.97 10 8.65 7.86 7.74 8.18
(Salary +Pension)/GSDP (%) 6.21 7.01 8 6.63 5.90 5.76 6.23 Rev Deficit/ Rev Receipt (%)
13.99 20.48 20 13.03 7.60 4.53 5.53
RD/GSDP (%) 1.64 2.51 2.46 1.68 1.00 0.61 0.78 FD/GSDP (%) 3.02 4.29 3.91 3.06 3.00 3.00 3.00 Debt stock/GSDP (%) 26.75 30.22 30.69 30.49 30.21 29.73 29.31 GSDP 588337 617035 686764 774995 875514 989331 1117944 Nominal GSDP Growth Rate (%) 11.85 4.88 11.42 12.85 12.97 13.00 13.00 Average Interest rate (%) 7.59 7.05 7.61 6.99 6.87 7.00 7.00
Domar Gap 4.26 -2.17 3.81 5.86 6.10 6.00 6.00
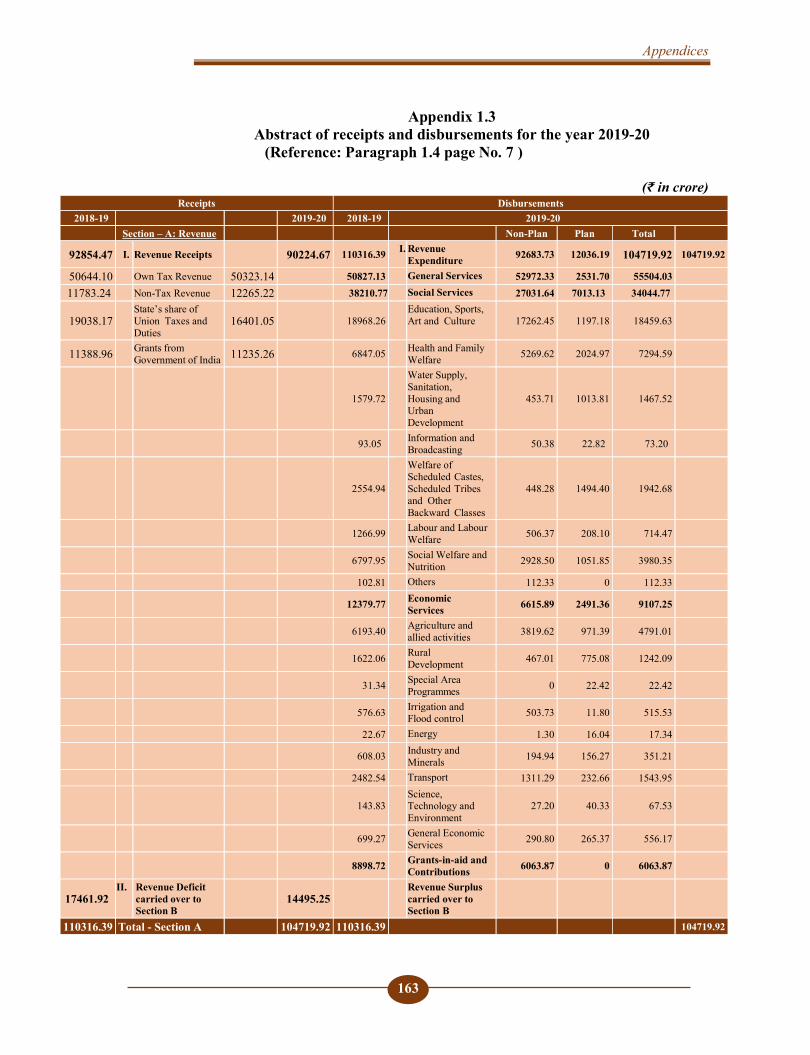
Appendices
163
Appendix 1.3 Abstract of receipts and disbursements for the year 2019-20
(Reference: Paragraph 1.4 page No. 7 )
(₹ in crore) Receipts Disbursements
2018-19 2019-20 2018-19 2019-20 Section – A: Revenue Non-Plan Plan Total
92854.47 I. Revenue Receipts 90224.67 110316.39 I. Revenue Expenditure 92683.73 12036.19 104719.92 104719.92
50644.10 Own Tax Revenue 50323.14 50827.13 General Services 52972.33 2531.70 55504.03 11783.24 Non-Tax Revenue 12265.22 38210.77 Social Services 27031.64 7013.13 34044.77
19038.17 State’s share of Union Taxes and Duties
16401.05 18968.26 Education, Sports, Art and Culture 17262.45 1197.18 18459.63
11388.96 Grants from Government of India 11235.26 6847.05 Health and Family
Welfare 5269.62 2024.97 7294.59
1579.72
Water Supply, Sanitation, Housing and Urban Development
453.71 1013.81 1467.52
93.05 Information and Broadcasting 50.38 22.82 73.20
2554.94
Welfare of Scheduled Castes, Scheduled Tribes and Other Backward Classes
448.28 1494.40 1942.68
1266.99 Labour and Labour Welfare 506.37 208.10 714.47
6797.95 Social Welfare and Nutrition 2928.50 1051.85 3980.35
102.81 Others 112.33 0 112.33
12379.77 Economic Services 6615.89 2491.36 9107.25
6193.40 Agriculture and allied activities 3819.62 971.39 4791.01
1622.06 Rural Development 467.01 775.08 1242.09
31.34 Special Area Programmes 0 22.42 22.42
576.63 Irrigation and Flood control 503.73 11.80 515.53
22.67 Energy 1.30 16.04 17.34
608.03 Industry and Minerals 194.94 156.27 351.21
2482.54 Transport 1311.29 232.66 1543.95
143.83 Science, Technology and Environment
27.20 40.33 67.53
699.27 General Economic Services 290.80 265.37 556.17
8898.72 Grants-in-aid and Contributions 6063.87 0 6063.87
17461.92 II. Revenue Deficit
carried over to Section B
14495.25 Revenue Surplus carried over to Section B
110316.39 Total - Section A 104719.92 110316.39 104719.92
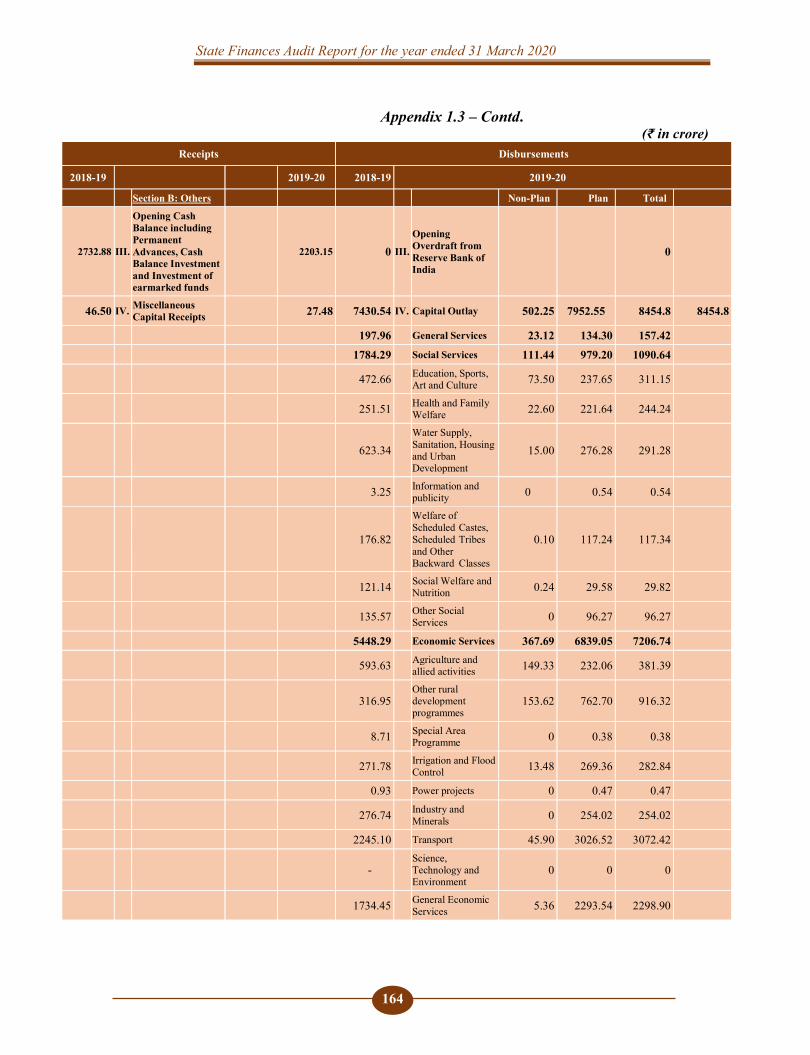
State Finances Audit Report for the year ended 31 March 2020
164
Appendix 1.3 – Contd. (₹ in crore)
Receipts Disbursements
2018-19 2019-20 2018-19 2019-20
Section B: Others Non-Plan Plan Total
2732.88 III.
Opening Cash Balance including Permanent Advances, Cash Balance Investment and Investment of earmarked funds
2203.15 0 III.
Opening Overdraft from Reserve Bank of India
0
46.50 IV. Miscellaneous Capital Receipts
27.48 7430.54 IV. Capital Outlay 502.25 7952.55 8454.8 8454.8
197.96 General Services 23.12 134.30 157.42
1784.29 Social Services 111.44 979.20 1090.64
472.66 Education, Sports, Art and Culture 73.50 237.65 311.15
251.51 Health and Family Welfare 22.60 221.64 244.24
623.34 Water Supply, Sanitation, Housing and Urban Development
15.00 276.28 291.28
3.25 Information and publicity 0 0.54 0.54
176.82
Welfare of Scheduled Castes, Scheduled Tribes and Other Backward Classes
0.10 117.24 117.34
121.14 Social Welfare and Nutrition 0.24 29.58 29.82
135.57 Other Social Services 0 96.27 96.27
5448.29 Economic Services 367.69 6839.05 7206.74
593.63 Agriculture and allied activities 149.33 232.06 381.39
316.95 Other rural development programmes
153.62 762.70 916.32
8.71 Special Area Programme 0 0.38 0.38
271.78 Irrigation and Flood Control 13.48 269.36 282.84
0.93 Power projects 0 0.47 0.47
276.74 Industry and Minerals 0 254.02 254.02
2245.10 Transport 45.90 3026.52 3072.42
- Science, Technology and Environment
0 0 0
1734.45 General Economic Services 5.36 2293.54 2298.90
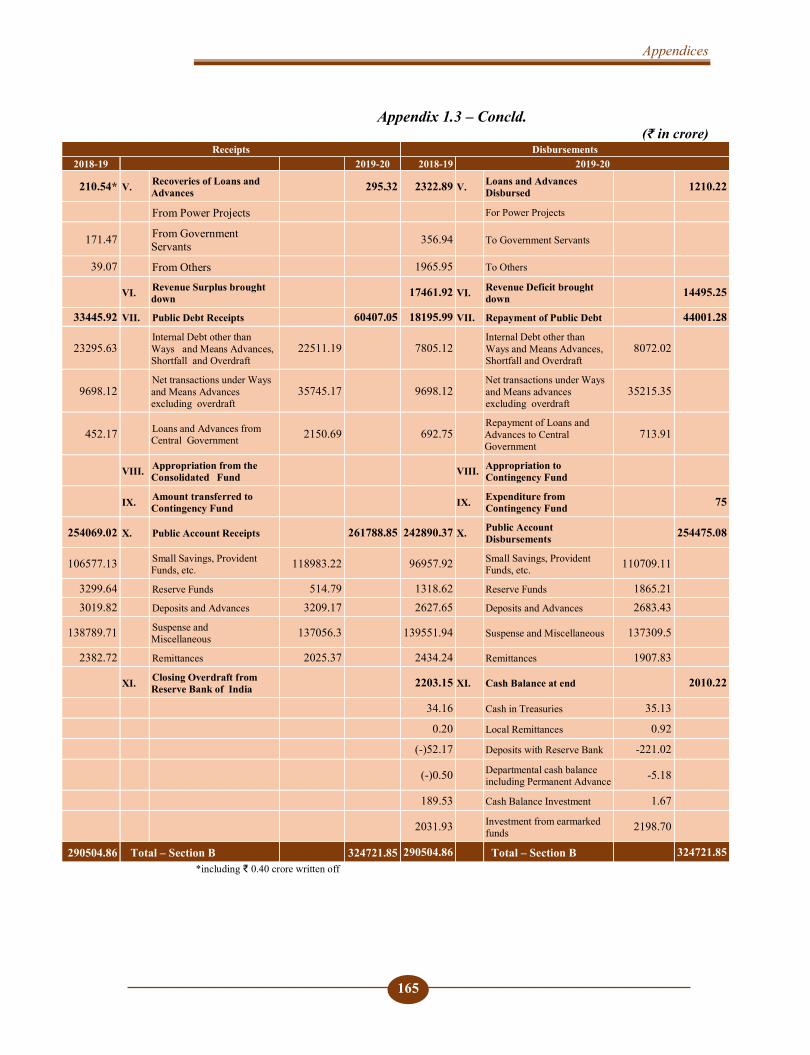
Appendices
165
Appendix 1.3 – Concld. (₹ in crore)
Receipts Disbursements 2018-19 2019-20 2018-19 2019-20
210.54* V. Recoveries of Loans and Advances 295.32 2322.89 V. Loans and Advances
Disbursed 1210.22
From Power Projects For Power Projects
171.47 From Government Servants 356.94 To Government Servants
39.07 From Others 1965.95 To Others
VI. Revenue Surplus brought down 17461.92 VI. Revenue Deficit brought
down 14495.25
33445.92 VII. Public Debt Receipts 60407.05 18195.99 VII. Repayment of Public Debt 44001.28
23295.63 Internal Debt other than Ways and Means Advances, Shortfall and Overdraft
22511.19 7805.12 Internal Debt other than Ways and Means Advances, Shortfall and Overdraft
8072.02
9698.12 Net transactions under Ways and Means Advances excluding overdraft
35745.17 9698.12 Net transactions under Ways and Means advances excluding overdraft
35215.35
452.17 Loans and Advances from Central Government 2150.69 692.75
Repayment of Loans and Advances to Central Government
713.91
VIII. Appropriation from the Consolidated Fund VIII. Appropriation to
Contingency Fund
IX. Amount transferred to Contingency Fund IX. Expenditure from
Contingency Fund 75
254069.02 X. Public Account Receipts 261788.85 242890.37 X. Public Account Disbursements 254475.08
106577.13 Small Savings, Provident Funds, etc. 118983.22 96957.92 Small Savings, Provident
Funds, etc. 110709.11
3299.64 Reserve Funds 514.79 1318.62 Reserve Funds 1865.21 3019.82 Deposits and Advances 3209.17 2627.65 Deposits and Advances 2683.43
138789.71 Suspense and Miscellaneous 137056.3 139551.94 Suspense and Miscellaneous 137309.5
2382.72 Remittances 2025.37 2434.24 Remittances 1907.83
XI. Closing Overdraft from Reserve Bank of India 2203.15 XI. Cash Balance at end 2010.22
34.16 Cash in Treasuries 35.13
0.20 Local Remittances 0.92
(-)52.17 Deposits with Reserve Bank -221.02
(-)0.50 Departmental cash balance including Permanent Advance -5.18
189.53 Cash Balance Investment 1.67
2031.93 Investment from earmarked funds 2198.70
290504.86 Total – Section B 324721.85 290504.86 Total – Section B 324721.85 *including ₹ 0.40 crore written off
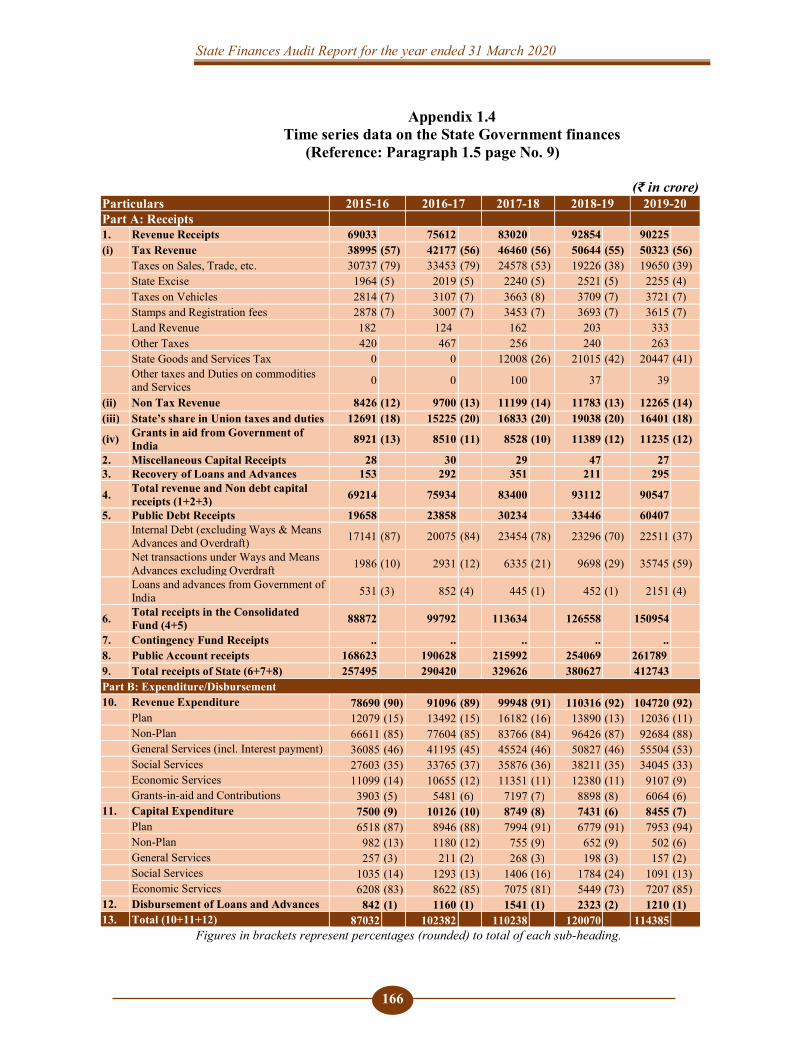
State Finances Audit Report for the year ended 31 March 2020
166
Appendix 1.4 Time series data on the State Government finances
(Reference: Paragraph 1.5 page No. 9)
(₹ in crore)
Figures in brackets represent percentages (rounded) to total of each sub-heading.
Particulars 2015-16 2016-17 2017-18 2018-19 2019-20 Part A: Receipts 1. Revenue Receipts 69033 75612 83020 92854 90225 (i) Tax Revenue 38995 (57) 42177 (56) 46460 (56) 50644 (55) 50323 (56) Taxes on Sales, Trade, etc. 30737 (79) 33453 (79) 24578 (53) 19226 (38) 19650 (39) State Excise 1964 (5) 2019 (5) 2240 (5) 2521 (5) 2255 (4) Taxes on Vehicles 2814 (7) 3107 (7) 3663 (8) 3709 (7) 3721 (7) Stamps and Registration fees 2878 (7) 3007 (7) 3453 (7) 3693 (7) 3615 (7) Land Revenue 182 124 162 203 333
Other Taxes 420 467 256 240 263 State Goods and Services Tax 0 0 12008 (26) 21015 (42) 20447 (41)
Other taxes and Duties on commodities and Services 0 0 100 37 39
(ii) Non Tax Revenue 8426 (12) 9700 (13) 11199 (14) 11783 (13) 12265 (14) (iii) State’s share in Union taxes and duties 12691 (18) 15225 (20) 16833 (20) 19038 (20) 16401 (18)
(iv) Grants in aid from Government of India 8921 (13) 8510 (11) 8528 (10) 11389 (12) 11235 (12)
2. Miscellaneous Capital Receipts 28 30 29 47 27 3. Recovery of Loans and Advances 153 292 351 211 295
4. Total revenue and Non debt capital receipts (1+2+3) 69214 75934 83400 93112 90547
5. Public Debt Receipts 19658 23858 30234 33446 60407
Internal Debt (excluding Ways & Means Advances and Overdraft) 17141 (87) 20075 (84) 23454 (78) 23296 (70) 22511 (37)
Net transactions under Ways and Means Advances excluding Overdraft 1986 (10) 2931 (12) 6335 (21) 9698 (29) 35745 (59)
Loans and advances from Government of India 531 (3) 852 (4) 445 (1) 452 (1) 2151 (4)
6. Total receipts in the Consolidated Fund (4+5) 88872 99792 113634 126558 150954
7. Contingency Fund Receipts .. .. .. .. .. 8. Public Account receipts 168623 190628 215992 254069 261789 9. Total receipts of State (6+7+8) 257495 290420 329626 380627 412743 Part B: Expenditure/Disbursement 10. Revenue Expenditure 78690 (90) 91096 (89) 99948 (91) 110316 (92) 104720 (92) Plan 12079 (15) 13492 (15) 16182 (16) 13890 (13) 12036 (11) Non-Plan 66611 (85) 77604 (85) 83766 (84) 96426 (87) 92684 (88) General Services (incl. Interest payment) 36085 (46) 41195 (45) 45524 (46) 50827 (46) 55504 (53) Social Services 27603 (35) 33765 (37) 35876 (36) 38211 (35) 34045 (33) Economic Services 11099 (14) 10655 (12) 11351 (11) 12380 (11) 9107 (9) Grants-in-aid and Contributions 3903 (5) 5481 (6) 7197 (7) 8898 (8) 6064 (6) 11. Capital Expenditure 7500 (9) 10126 (10) 8749 (8) 7431 (6) 8455 (7) Plan 6518 (87) 8946 (88) 7994 (91) 6779 (91) 7953 (94) Non-Plan 982 (13) 1180 (12) 755 (9) 652 (9) 502 (6) General Services 257 (3) 211 (2) 268 (3) 198 (3) 157 (2) Social Services 1035 (14) 1293 (13) 1406 (16) 1784 (24) 1091 (13) Economic Services 6208 (83) 8622 (85) 7075 (81) 5449 (73) 7207 (85) 12. Disbursement of Loans and Advances 842 (1) 1160 (1) 1541 (1) 2323 (2) 1210 (1) 13. Total (10+11+12) 87032 102382 110238 120070 114385
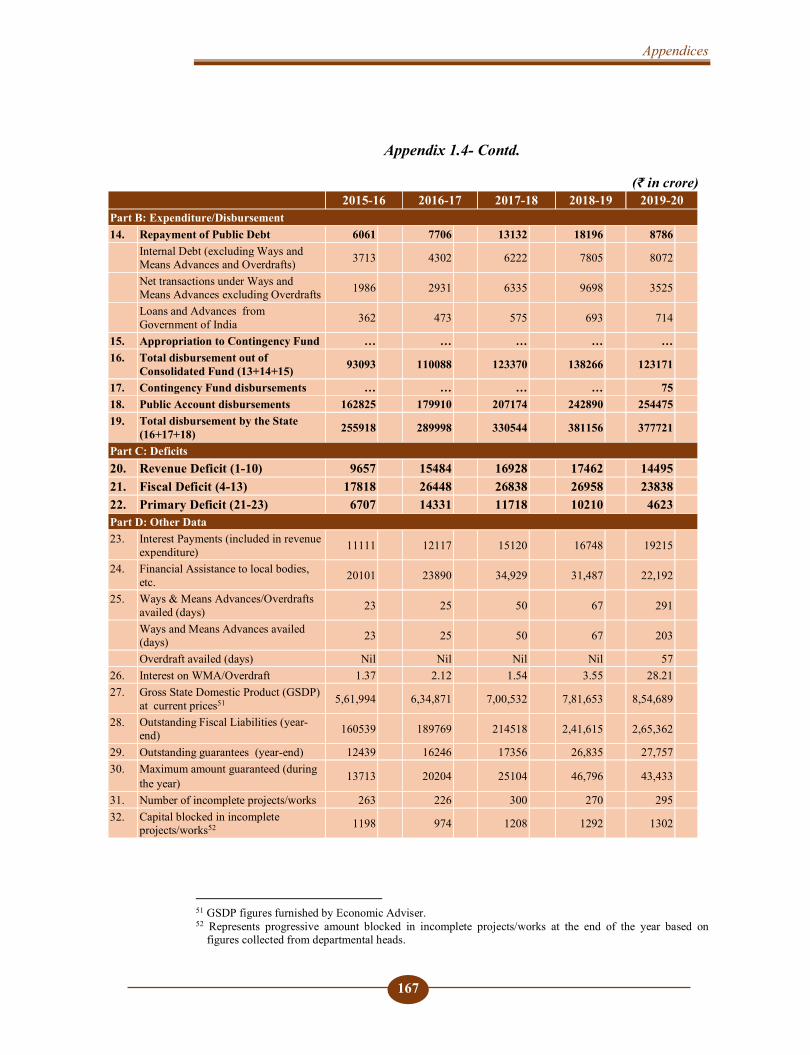
Appendices
167
Appendix 1.4- Contd.
(₹ in crore)
51 GSDP figures furnished by Economic Adviser. 52 Represents progressive amount blocked in incomplete projects/works at the end of the year based on
figures collected from departmental heads.
2015-16 2016-17 2017-18 2018-19 2019-20 Part B: Expenditure/Disbursement 14. Repayment of Public Debt 6061 7706 13132 18196 8786 Internal Debt (excluding Ways and
Means Advances and Overdrafts) 3713 4302 6222 7805 8072
Net transactions under Ways and Means Advances excluding Overdrafts 1986 2931 6335 9698 3525
Loans and Advances from Government of India 362 473 575 693 714
15. Appropriation to Contingency Fund … … … … … 16. Total disbursement out of
Consolidated Fund (13+14+15) 93093 110088 123370 138266 123171
17. Contingency Fund disbursements … … … … 75 18. Public Account disbursements 162825 179910 207174 242890 254475 19. Total disbursement by the State
(16+17+18) 255918 289998 330544 381156 377721
Part C: Deficits 20. Revenue Deficit (1-10) 9657 15484 16928 17462 14495 21. Fiscal Deficit (4-13) 17818 26448 26838 26958 23838 22. Primary Deficit (21-23) 6707 14331 11718 10210 4623 Part D: Other Data 23. Interest Payments (included in revenue
expenditure) 11111 12117 15120 16748 19215
24. Financial Assistance to local bodies, etc. 20101 23890 34,929 31,487 22,192
25. Ways & Means Advances/Overdrafts availed (days) 23 25 50 67 291
Ways and Means Advances availed (days) 23 25 50 67 203
Overdraft availed (days) Nil Nil Nil Nil 57 26. Interest on WMA/Overdraft 1.37 2.12 1.54 3.55 28.21 27. Gross State Domestic Product (GSDP)
at current prices51 5,61,994 6,34,871 7,00,532 7,81,653 8,54,689
28. Outstanding Fiscal Liabilities (year-end) 160539 189769 214518 2,41,615 2,65,362
29. Outstanding guarantees (year-end) 12439 16246 17356 26,835 27,757 30. Maximum amount guaranteed (during
the year) 13713 20204 25104 46,796 43,433
31. Number of incomplete projects/works 263 226 300 270 295 32. Capital blocked in incomplete
projects/works52 1198 974 1208 1292 1302
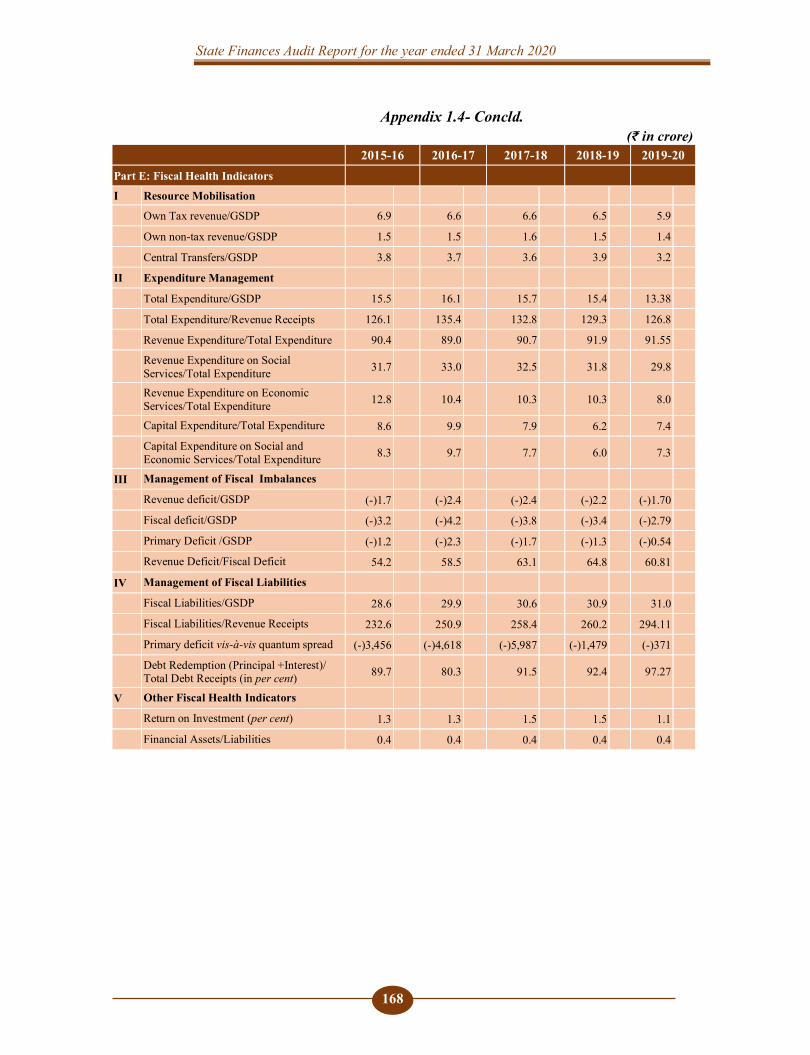
State Finances Audit Report for the year ended 31 March 2020
168
Appendix 1.4- Concld. (₹ in crore)
2015-16 2016-17 2017-18 2018-19 2019-20 Part E: Fiscal Health Indicators I Resource Mobilisation
Own Tax revenue/GSDP 6.9 6.6 6.6 6.5 5.9 Own non-tax revenue/GSDP 1.5 1.5 1.6 1.5 1.4 Central Transfers/GSDP 3.8 3.7 3.6 3.9 3.2 II Expenditure Management Total Expenditure/GSDP 15.5 16.1 15.7 15.4 13.38 Total Expenditure/Revenue Receipts 126.1 135.4 132.8 129.3 126.8 Revenue Expenditure/Total Expenditure 90.4 89.0 90.7 91.9 91.55
Revenue Expenditure on Social Services/Total Expenditure 31.7 33.0 32.5 31.8 29.8
Revenue Expenditure on Economic Services/Total Expenditure 12.8 10.4 10.3 10.3 8.0
Capital Expenditure/Total Expenditure 8.6 9.9 7.9 6.2 7.4
Capital Expenditure on Social and Economic Services/Total Expenditure 8.3 9.7 7.7 6.0 7.3
III Management of Fiscal Imbalances Revenue deficit/GSDP (-)1.7 (-)2.4 (-)2.4 (-)2.2 (-)1.70 Fiscal deficit/GSDP (-)3.2 (-)4.2 (-)3.8 (-)3.4 (-)2.79 Primary Deficit /GSDP (-)1.2 (-)2.3 (-)1.7 (-)1.3 (-)0.54 Revenue Deficit/Fiscal Deficit 54.2 58.5 63.1 64.8 60.81 IV Management of Fiscal Liabilities Fiscal Liabilities/GSDP 28.6 29.9 30.6 30.9 31.0 Fiscal Liabilities/Revenue Receipts 232.6 250.9 258.4 260.2 294.11 Primary deficit vis-à-vis quantum spread (-)3,456 (-)4,618 (-)5,987 (-)1,479 (-)371
Debt Redemption (Principal +Interest)/ Total Debt Receipts (in per cent) 89.7 80.3 91.5 92.4 97.27
V Other Fiscal Health Indicators Return on Investment (per cent) 1.3 1.3 1.5 1.5 1.1 Financial Assets/Liabilities 0.4 0.4 0.4 0.4 0.4
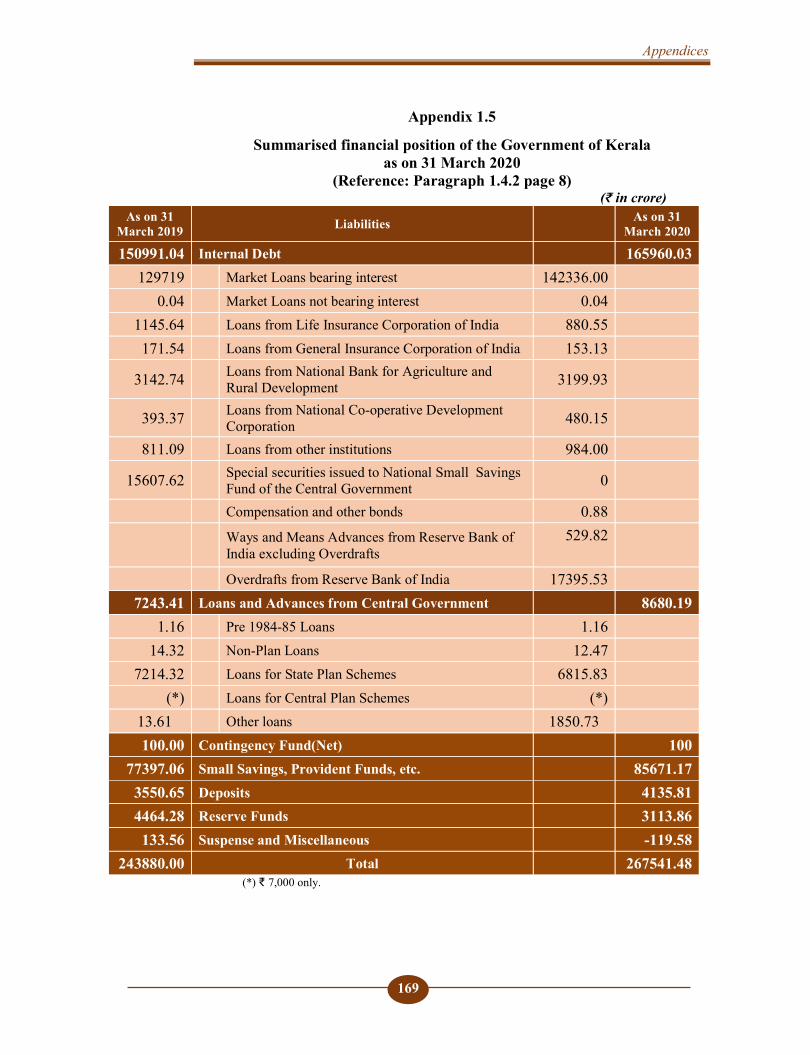
Appendices
169
Appendix 1.5
Summarised financial position of the Government of Kerala as on 31 March 2020
(Reference: Paragraph 1.4.2 page 8) (₹ in crore)
As on 31 March 2019 Liabilities As on 31
March 2020
150991.04 Internal Debt 165960.03 129719 Market Loans bearing interest 142336.00
0.04 Market Loans not bearing interest 0.04 1145.64 Loans from Life Insurance Corporation of India 880.55 171.54 Loans from General Insurance Corporation of India 153.13
3142.74 Loans from National Bank for Agriculture and Rural Development 3199.93
393.37 Loans from National Co-operative Development Corporation 480.15
811.09 Loans from other institutions 984.00
15607.62 Special securities issued to National Small Savings Fund of the Central Government 0
Compensation and other bonds 0.88
Ways and Means Advances from Reserve Bank of India excluding Overdrafts
529.82
Overdrafts from Reserve Bank of India 17395.53 7243.41 Loans and Advances from Central Government 8680.19
1.16 Pre 1984-85 Loans 1.16 14.32 Non-Plan Loans 12.47
7214.32 Loans for State Plan Schemes 6815.83 (*) Loans for Central Plan Schemes (*)
13.61 Other loans 1850.73 100.00 Contingency Fund(Net) 100
77397.06 Small Savings, Provident Funds, etc. 85671.17 3550.65 Deposits 4135.81 4464.28 Reserve Funds 3113.86 133.56 Suspense and Miscellaneous -119.58
243880.00 Total 267541.48 (*) ₹ 7,000 only.
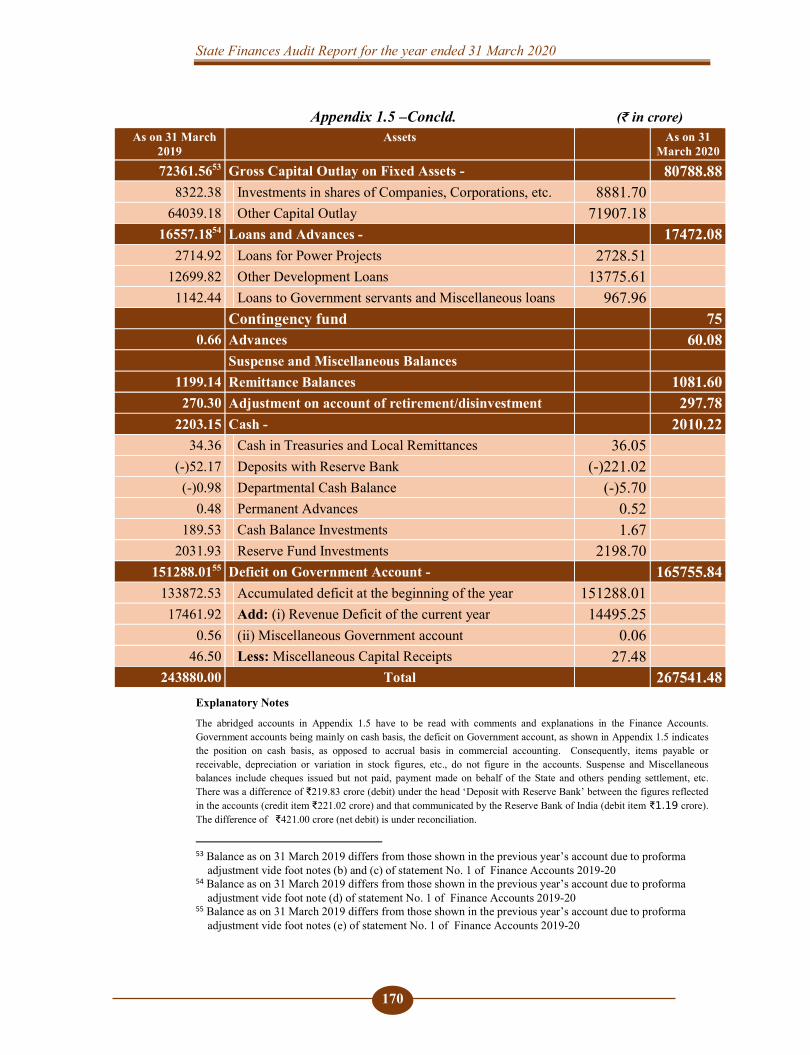
State Finances Audit Report for the year ended 31 March 2020
170
Appendix 1.5 –Concld. (₹ in crore) As on 31 March
2019 Assets As on 31
March 2020 72361.5653 Gross Capital Outlay on Fixed Assets - 80788.88
8322.38 Investments in shares of Companies, Corporations, etc. 8881.70 64039.18 Other Capital Outlay 71907.18
16557.1854 Loans and Advances - 17472.08 2714.92 Loans for Power Projects 2728.51
12699.82 Other Development Loans 13775.61 1142.44 Loans to Government servants and Miscellaneous loans 967.96
Contingency fund 75 0.66 Advances 60.08
Suspense and Miscellaneous Balances 1199.14 Remittance Balances 1081.60 270.30 Adjustment on account of retirement/disinvestment 297.78
2203.15 Cash - 2010.22 34.36 Cash in Treasuries and Local Remittances 36.05
(-)52.17 Deposits with Reserve Bank (-)221.02 (-)0.98 Departmental Cash Balance (-)5.70
0.48 Permanent Advances 0.52 189.53 Cash Balance Investments 1.67
2031.93 Reserve Fund Investments 2198.70 151288.0155 Deficit on Government Account - 165755.84
133872.53 Accumulated deficit at the beginning of the year 151288.01 17461.92 Add: (i) Revenue Deficit of the current year 14495.25
0.56 (ii) Miscellaneous Government account 0.06 46.50 Less: Miscellaneous Capital Receipts 27.48
243880.00 Total 267541.48 Explanatory Notes
The abridged accounts in Appendix 1.5 have to be read with comments and explanations in the Finance Accounts. Government accounts being mainly on cash basis, the deficit on Government account, as shown in Appendix 1.5 indicates the position on cash basis, as opposed to accrual basis in commercial accounting. Consequently, items payable or receivable, depreciation or variation in stock figures, etc., do not figure in the accounts. Suspense and Miscellaneous balances include cheques issued but not paid, payment made on behalf of the State and others pending settlement, etc. There was a difference of ₹219.83 crore (debit) under the head ‘Deposit with Reserve Bank’ between the figures reflected in the accounts (credit item ₹221.02 crore) and that communicated by the Reserve Bank of India (debit item ₹ crore). The difference of ₹421.00 crore (net debit) is under reconciliation.
53 Balance as on 31 March 2019 differs from those shown in the previous year’s account due to proforma
adjustment vide foot notes (b) and (c) of statement No. 1 of Finance Accounts 2019-20 54 Balance as on 31 March 2019 differs from those shown in the previous year’s account due to proforma
adjustment vide foot note (d) of statement No. 1 of Finance Accounts 2019-20 55 Balance as on 31 March 2019 differs from those shown in the previous year’s account due to proforma
adjustment vide foot notes (e) of statement No. 1 of Finance Accounts 2019-20
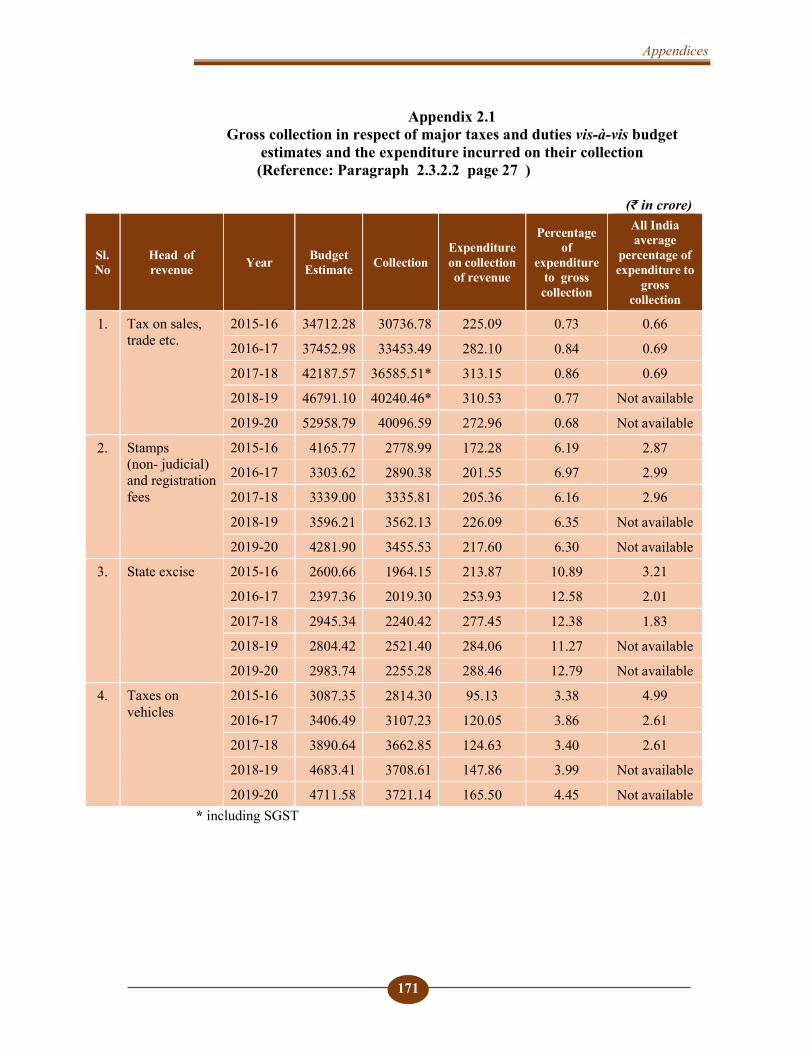
Appendices
171
Appendix 2.1 Gross collection in respect of major taxes and duties vis-à-vis budget
estimates and the expenditure incurred on their collection (Reference: Paragraph 2.3.2.2 page 27 )
(₹ in crore)
Sl. No
Head of revenue Year Budget
Estimate Collection Expenditure on collection of revenue
Percentage of
expenditure to gross collection
All India average
percentage of expenditure to
gross collection
1. Tax on sales, trade etc.
2015-16 34712.28 30736.78 225.09 0.73 0.66
2016-17 37452.98 33453.49 282.10 0.84 0.69
2017-18 42187.57 36585.51* 313.15 0.86 0.69
2018-19 46791.10 40240.46* 310.53 0.77 Not available
2019-20 52958.79 40096.59 272.96 0.68 Not available
2. Stamps (non- judicial) and registration fees
2015-16 4165.77 2778.99 172.28 6.19 2.87
2016-17 3303.62 2890.38 201.55 6.97 2.99
2017-18 3339.00 3335.81 205.36 6.16 2.96
2018-19 3596.21 3562.13 226.09 6.35 Not available
2019-20 4281.90 3455.53 217.60 6.30 Not available
3. State excise 2015-16 2600.66 1964.15 213.87 10.89 3.21
2016-17 2397.36 2019.30 253.93 12.58 2.01
2017-18 2945.34 2240.42 277.45 12.38 1.83
2018-19 2804.42 2521.40 284.06 11.27 Not available
2019-20 2983.74 2255.28 288.46 12.79 Not available
4. Taxes on vehicles
2015-16 3087.35 2814.30 95.13 3.38 4.99
2016-17 3406.49 3107.23 120.05 3.86 2.61
2017-18 3890.64 3662.85 124.63 3.40 2.61
2018-19 4683.41 3708.61 147.86 3.99 Not available
2019-20 4711.58 3721.14 165.50 4.45 Not available * including SGST
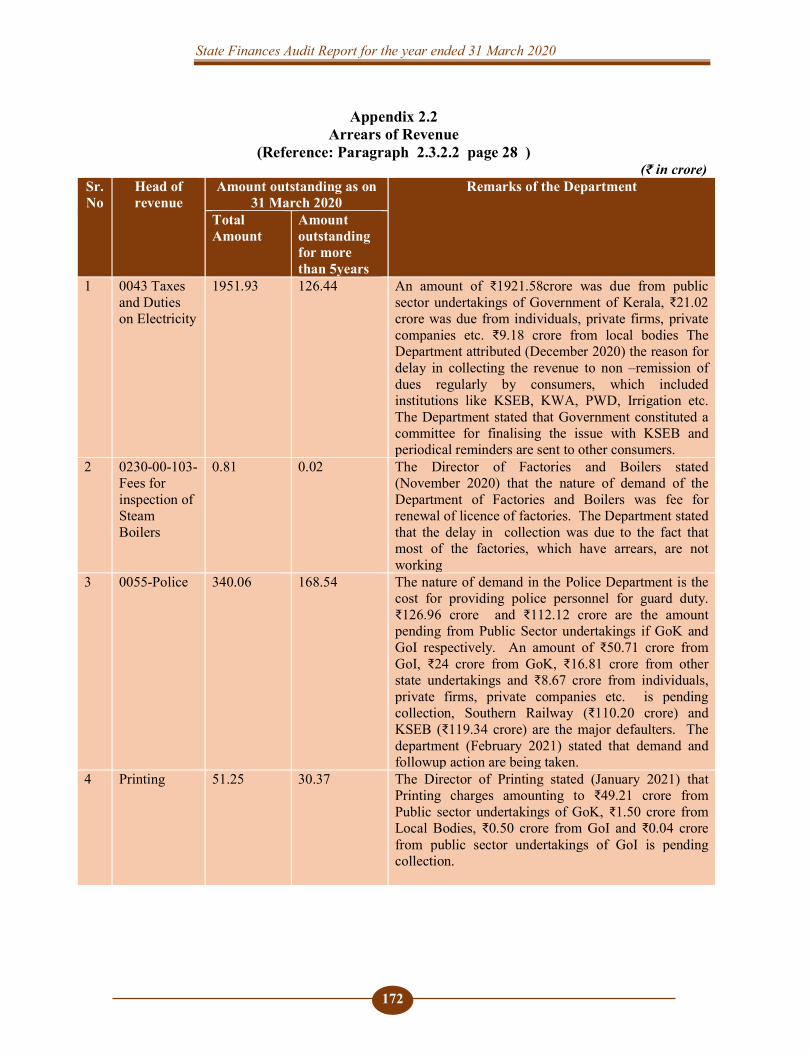
State Finances Audit Report for the year ended 31 March 2020
172
Appendix 2.2 Arrears of Revenue
(Reference: Paragraph 2.3.2.2 page 28 ) (₹ in crore)
Sr. No
Head of revenue
Amount outstanding as on 31 March 2020
Remarks of the Department
Total Amount
Amount outstanding for more than 5years
1 0043 Taxes and Duties on Electricity
1951.93 126.44 An amount of ₹1921.58crore was due from public sector undertakings of Government of Kerala, ₹21.02 crore was due from individuals, private firms, private companies etc. ₹9.18 crore from local bodies The Department attributed (December 2020) the reason for delay in collecting the revenue to non –remission of dues regularly by consumers, which included institutions like KSEB, KWA, PWD, Irrigation etc. The Department stated that Government constituted a committee for finalising the issue with KSEB and periodical reminders are sent to other consumers.
2 0230-00-103- Fees for inspection of Steam Boilers
0.81 0.02 The Director of Factories and Boilers stated (November 2020) that the nature of demand of the Department of Factories and Boilers was fee for renewal of licence of factories. The Department stated that the delay in collection was due to the fact that most of the factories, which have arrears, are not working
3 0055-Police 340.06 168.54 The nature of demand in the Police Department is the cost for providing police personnel for guard duty. ₹126.96 crore and ₹112.12 crore are the amount pending from Public Sector undertakings if GoK and GoI respectively. An amount of ₹50.71 crore from GoI, ₹24 crore from GoK, ₹16.81 crore from other state undertakings and ₹8.67 crore from individuals, private firms, private companies etc. is pending collection, Southern Railway (₹110.20 crore) and KSEB (₹119.34 crore) are the major defaulters. The department (February 2021) stated that demand and followup action are being taken.
4 Printing 51.25 30.37 The Director of Printing stated (January 2021) that Printing charges amounting to ₹49.21 crore from Public sector undertakings of GoK, ₹1.50 crore from Local Bodies, ₹0.50 crore from GoI and ₹0.04 crore from public sector undertakings of GoI is pending collection.

Appendices
173
Appendix 2.2- Concld.
(₹ in crore) Sr. No
Head of revenue
Amount outstanding as on 31 March 2020
Remarks of the Department
Total Amount
Amount outstanding for more than 5years
5 0030-Stamps and Registration fees
978.15 0 The Registration department stated (February 2021)that the revenue pending collection was towards undervaluation of documents and the Governement extended One time settlement scheme upto 31 March 2021.
6 0039-State Excise
262.37 237.51 The Excise Commissioner stated (January 2021) that abkari arrears in the Department are period from the year 1952 onwards. Out of the abkari arrears of ₹262.37 crore due from individuals, private firms, private companies etc., an amount of ₹253.26 crore is due from 342 defaulters from whom rupees one lakh or more is due. The Department attributed the reasons for delay in collection of revenue to pending revenue recovery action and stay by court.
7 0853-Non-Ferrous Mining and Metallurgical Industries
105.59 0.68 The Director of Mining and Geology stated (March 2021) stated that the main source of revenues are from royalty and other fees derived from the grant of mineral concessions and its regulation. The arrears of revenue pending collection are ₹0.59 crore from Co-operative Society, ₹0.36 from PSUs of GoK and ₹104.64 crore from individuals, private firms, private companies etc.
8 0070-60-110-Fees for Government Audit
85.09 Not furnished
The Director, Kerala State Audit Department stated (February 2021) that the arrears of revenue pending collection towards audit charges are ₹26.68 crore from Universities, ₹7.91 crore from Devaswom Boards, ₹8.41 crore from Temples, ₹22.01 crore from developmental authorities and Kerala State Housing Boards, ₹1.04 crore from tourism councils, ₹0.75 crore from sports council, ₹ 12.38 from welfare boards, ₹1.31 from cultural institutions and ₹3.48 crore from miscellaneous institutions. The Kerala State Audit department attributed the reasons for pendency to the lack of initiative from auditee institutions in remitting the audit charges. The Director stated that demand notices have been sent to auditee institutions and proposals have been submitted to the Government for realising the audit charges from the grants given to the auditee institutions.
3775.25 563.56
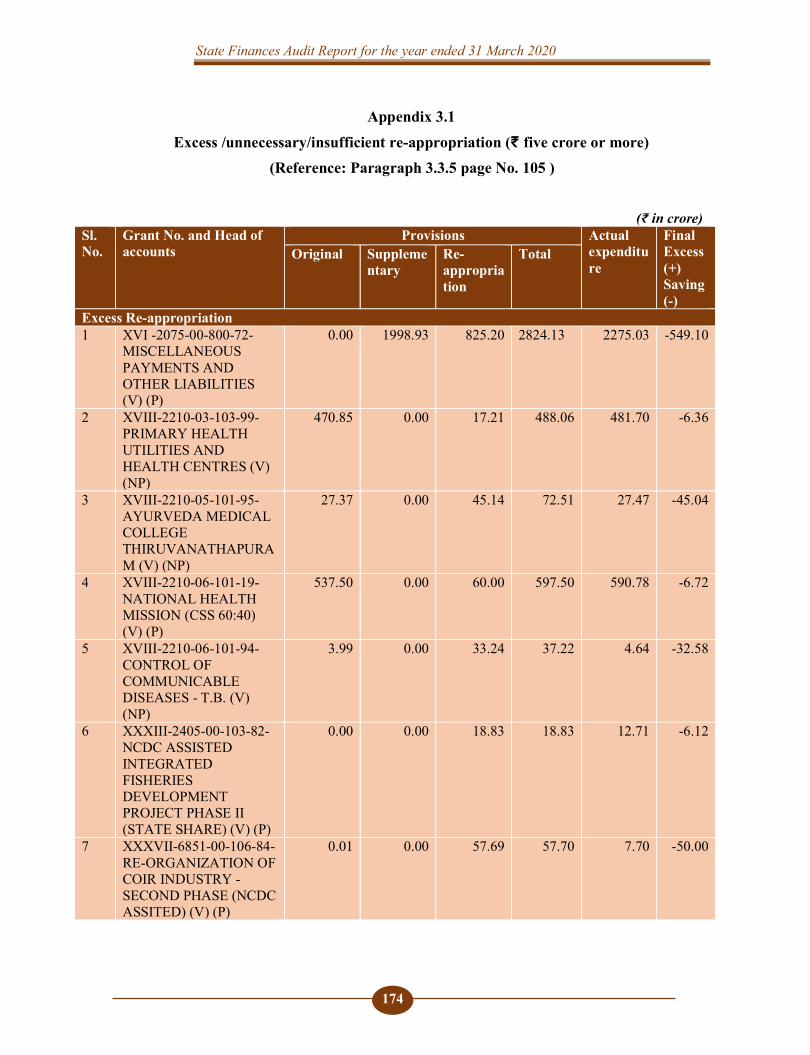
State Finances Audit Report for the year ended 31 March 2020
174
Appendix 3.1 Excess /unnecessary/insufficient re-appropriation (₹ five crore or more)
(Reference: Paragraph 3.3.5 page No. 105 )
(₹ in crore) Sl. No.
Grant No. and Head of accounts
Provisions Actual expenditure
Final Excess (+) Saving(-)
Original
Supplementary
Re-appropriation
Total
Excess Re-appropriation 1 XVI -2075-00-800-72-
MISCELLANEOUS PAYMENTS AND OTHER LIABILITIES (V) (P)
0.00 1998.93 825.20 2824.13 2275.03 -549.10
2 XVIII-2210-03-103-99-PRIMARY HEALTH UTILITIES AND HEALTH CENTRES (V) (NP)
470.85 0.00 17.21 488.06 481.70 -6.36
3 XVIII-2210-05-101-95-AYURVEDA MEDICAL COLLEGE THIRUVANATHAPURAM (V) (NP)
27.37 0.00 45.14 72.51 27.47 -45.04
4
XVIII-2210-06-101-19-NATIONAL HEALTH MISSION (CSS 60:40) (V) (P)
537.50 0.00 60.00 597.50 590.78 -6.72
5 XVIII-2210-06-101-94-CONTROL OF COMMUNICABLE DISEASES - T.B. (V) (NP)
3.99 0.00 33.24 37.22 4.64 -32.58
6 XXXIII-2405-00-103-82-NCDC ASSISTED INTEGRATED FISHERIES DEVELOPMENT PROJECT PHASE II (STATE SHARE) (V) (P)
0.00 0.00 18.83 18.83 12.71 -6.12
7 XXXVII-6851-00-106-84-RE-ORGANIZATION OF COIR INDUSTRY - SECOND PHASE (NCDC ASSITED) (V) (P)
0.01 0.00 57.69 57.70 7.70 -50.00

Appendices
175
Appendix 3.1- Concld. (₹ in crore)
Sl. No.
Grant No. and Head of accounts
Provisions Actual expenditure
Final Excess (+) Saving (-)
Original
Supplementary
Re-appropriation
Total
Unnecessary Re-appropriation 8 XV-3054-80-800-95-
ROAD SAFETY WORKS (V) (P)
7.25 0.00 0.82 8.07 1.73 -6.34
9 XVI-2075-00-800-09-REPAYMENT OF INTEREST SUBVENTION IN CONNECTION WITH HBA TAKE OVER BY PUNJAB NATIONAL BANK AND FEDERAL BANK (V) (NP)
0.00 0.00 6.46 6.46 0.00 -6.46
10 XVII-2202-01-102-95-DISTRIBUTION OF SCHOOL UNIFORMS IN GOVERNMENT/AIDED SCHOOLS (V) (P)
80.00 0.00 43.10 123.10 75.04 -48.06
11 XVIII-2210-80-190-99-GRANT-IN-AID TO KERALA MEDICAL SERVICES CORPORATION LIMITED (KMSCL) (V) (NP)
360.00 0.00 80.21 440.21 307.07 -133.14
12 XXIX-4402-00-203-95-DEVELOPMENT OF KOLE LANDS IN THRISSUR DISTRICT (NABARD ASSISTED) (V) (P)
20.00 0.00
5.51 25.51 12.29 -13.22
Insufficient Re-appropriation 13 XXVI-2245-02-122-99-
REPAIRS AND RESTORATION OF DAMAGED IRRIGATION AND FLOOD CONTROL WORKS (V) (NP)
0.33 150.00 188.26 338.59 455.47 116.88
14 PUBLIC DEBT REPAYMENT-6003-00-110-98-SPECIAL WAYS AND MEANS ADVANCES (C) (NP)
1000.00 3629.53 416.75 5046.28 5242.32 196.04
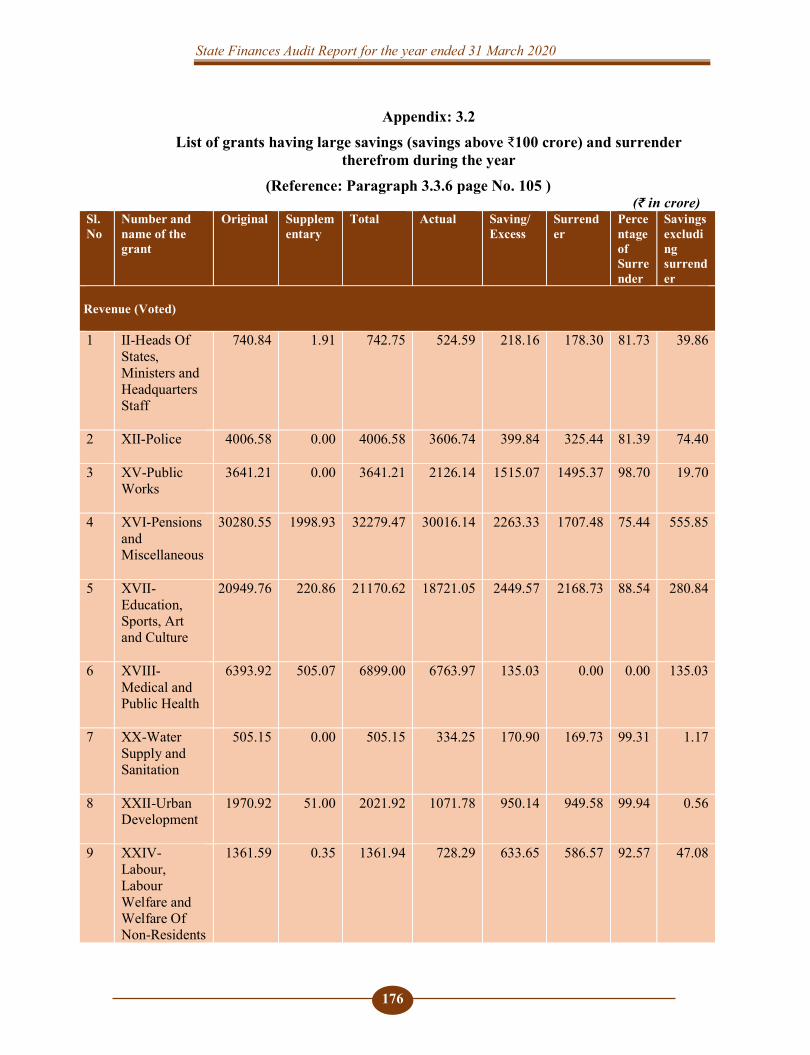
State Finances Audit Report for the year ended 31 March 2020
176
Appendix: 3.2 List of grants having large savings (savings above ₹100 crore) and surrender
therefrom during the year (Reference: Paragraph 3.3.6 page No. 105 )
(₹ in crore) Sl. No
Number and name of the grant
Original Supplementary
Total Actual Saving/ Excess
Surrender
Percentage of Surrender
Savings excluding surrender
Revenue (Voted)
1 II-Heads Of
States, Ministers and Headquarters Staff
740.84 1.91 742.75 524.59 218.16 178.30 81.73 39.86
2 XII-Police
4006.58 0.00 4006.58 3606.74 399.84 325.44 81.39 74.40
3 XV-Public Works
3641.21 0.00 3641.21 2126.14 1515.07 1495.37 98.70 19.70
4 XVI-Pensions and Miscellaneous
30280.55 1998.93 32279.47 30016.14 2263.33 1707.48 75.44 555.85
5 XVII-Education, Sports, Art and Culture
20949.76 220.86 21170.62 18721.05 2449.57 2168.73 88.54 280.84
6 XVIII-Medical and Public Health
6393.92 505.07 6899.00 6763.97 135.03 0.00 0.00 135.03
7 XX-Water Supply and Sanitation
505.15 0.00 505.15 334.25 170.90 169.73 99.31 1.17
8 XXII-Urban Development
1970.92 51.00 2021.92 1071.78 950.14 949.58 99.94 0.56
9 XXIV-Labour, Labour Welfare and Welfare Of Non-Residents
1361.59 0.35 1361.94 728.29 633.65 586.57 92.57 47.08
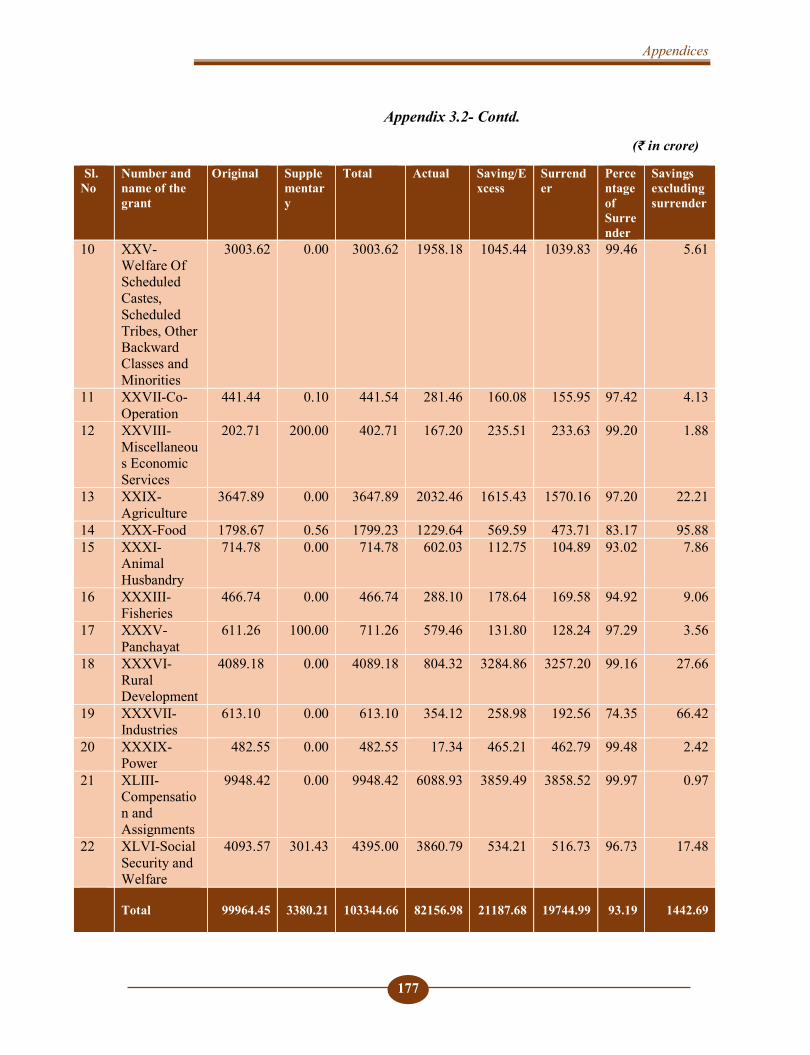
Appendices
177
Appendix 3.2- Contd.
(₹ in crore)
Sl. No
Number and name of the grant
Original Supplementary
Total Actual Saving/Excess
Surrender
Percentage of Surrender
Savings excluding surrender
10 XXV-Welfare Of Scheduled Castes, Scheduled Tribes, Other Backward Classes and Minorities
3003.62 0.00 3003.62 1958.18 1045.44 1039.83 99.46 5.61
11 XXVII-Co-Operation
441.44 0.10 441.54 281.46 160.08 155.95 97.42 4.13
12 XXVIII-Miscellaneous Economic Services
202.71 200.00 402.71 167.20 235.51 233.63 99.20 1.88
13 XXIX-Agriculture
3647.89 0.00 3647.89 2032.46 1615.43 1570.16 97.20 22.21
14 XXX-Food 1798.67 0.56 1799.23 1229.64 569.59 473.71 83.17 95.88 15 XXXI-
Animal Husbandry
714.78 0.00 714.78 602.03 112.75 104.89 93.02 7.86
16 XXXIII-Fisheries
466.74 0.00 466.74 288.10 178.64 169.58 94.92 9.06
17 XXXV-Panchayat
611.26 100.00 711.26 579.46 131.80 128.24 97.29 3.56
18 XXXVI-Rural Development
4089.18 0.00 4089.18 804.32 3284.86 3257.20 99.16 27.66
19 XXXVII-Industries
613.10 0.00 613.10 354.12 258.98 192.56 74.35 66.42
20 XXXIX-Power
482.55 0.00 482.55 17.34 465.21 462.79 99.48 2.42
21 XLIII-Compensation and Assignments
9948.42 0.00 9948.42 6088.93 3859.49 3858.52 99.97 0.97
22 XLVI-Social Security and Welfare
4093.57 301.43 4395.00 3860.79 534.21 516.73 96.73 17.48
Total
99964.45 3380.21 103344.66 82156.98 21187.68 19744.99 93.19 1442.69
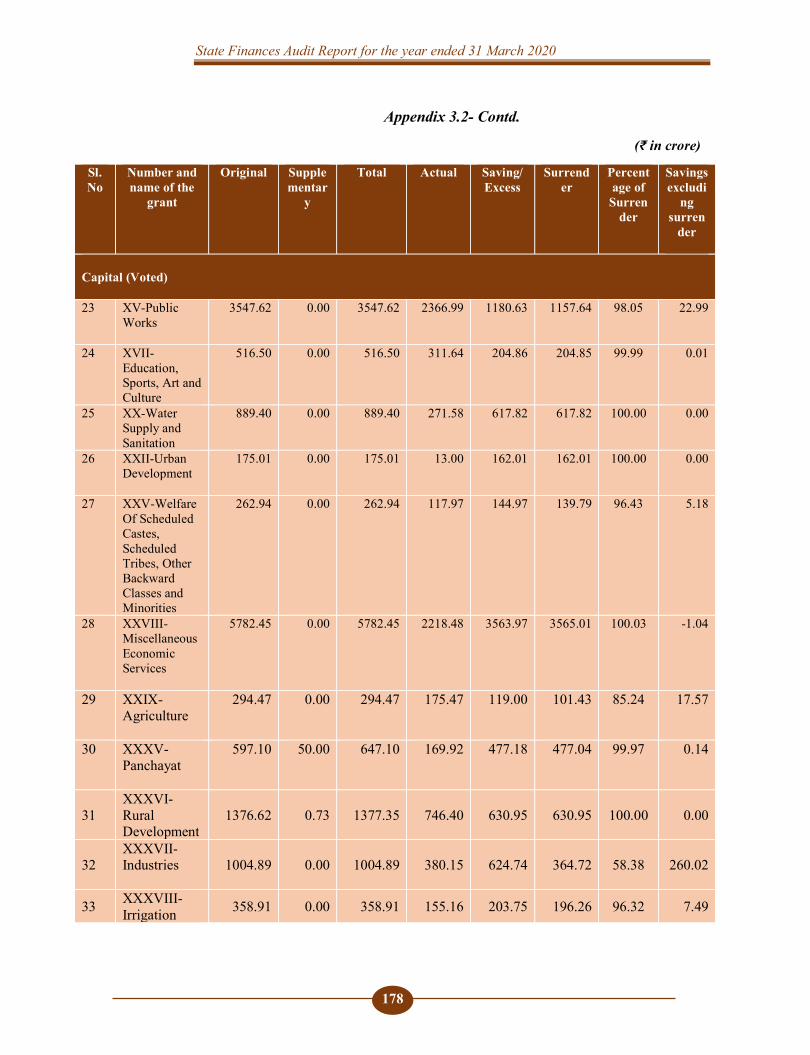
State Finances Audit Report for the year ended 31 March 2020
178
Appendix 3.2- Contd.
(₹ in crore)
Sl. No
Number and name of the
grant
Original Supplementar
y
Total Actual Saving/ Excess
Surrender
Percentage of Surren
der
Savings excludi
ng surren
der
Capital (Voted)
23 XV-Public
Works
3547.62 0.00 3547.62 2366.99 1180.63 1157.64 98.05 22.99
24 XVII-Education, Sports, Art and Culture
516.50 0.00 516.50 311.64 204.86 204.85 99.99 0.01
25 XX-Water Supply and Sanitation
889.40 0.00 889.40 271.58 617.82 617.82 100.00 0.00
26 XXII-Urban Development
175.01 0.00 175.01 13.00 162.01 162.01 100.00 0.00
27 XXV-Welfare Of Scheduled Castes, Scheduled Tribes, Other Backward Classes and Minorities
262.94 0.00 262.94 117.97 144.97 139.79 96.43 5.18
28 XXVIII-Miscellaneous Economic Services
5782.45 0.00 5782.45 2218.48 3563.97 3565.01 100.03 -1.04
29 XXIX-Agriculture
294.47 0.00 294.47 175.47 119.00 101.43 85.24 17.57
30 XXXV-Panchayat
597.10 50.00 647.10 169.92 477.18 477.04 99.97 0.14
31 XXXVI-Rural Development
1376.62 0.73 1377.35 746.40 630.95 630.95 100.00 0.00
32 XXXVII-Industries
1004.89 0.00 1004.89
380.15
624.74
364.72 58.38
260.02
33 XXXVIII-Irrigation 358.91 0.00 358.91 155.16 203.75 196.26 96.32 7.49
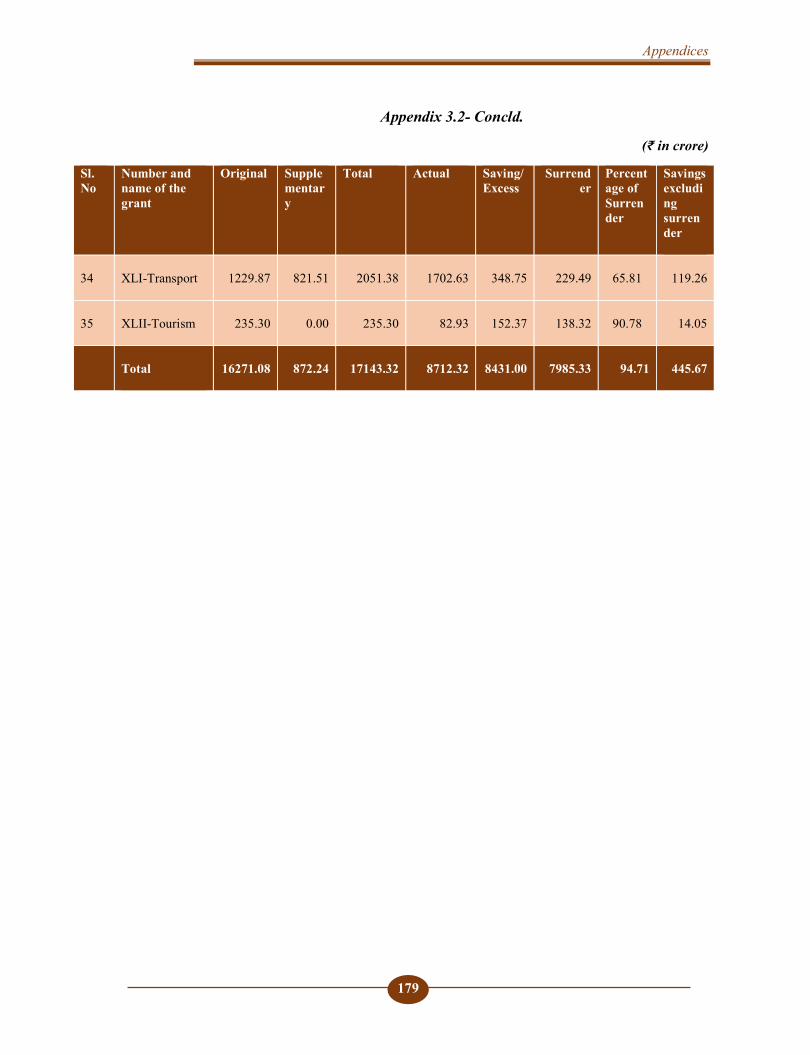
Appendices
179
Appendix 3.2- Concld.
(₹ in crore)
Sl. No
Number and name of the grant
Original Supplementary
Total Actual Saving/ Excess
Surrender
Percentage of Surrender
Savings excluding surrender
34 XLI-Transport
1229.87 821.51 2051.38 1702.63 348.75 229.49 65.81 119.26
35 XLII-Tourism
235.30 0.00 235.30 82.93 152.37 138.32 90.78 14.05
Total
16271.08 872.24 17143.32 8712.32 8431.00 7985.33 94.71 445.67
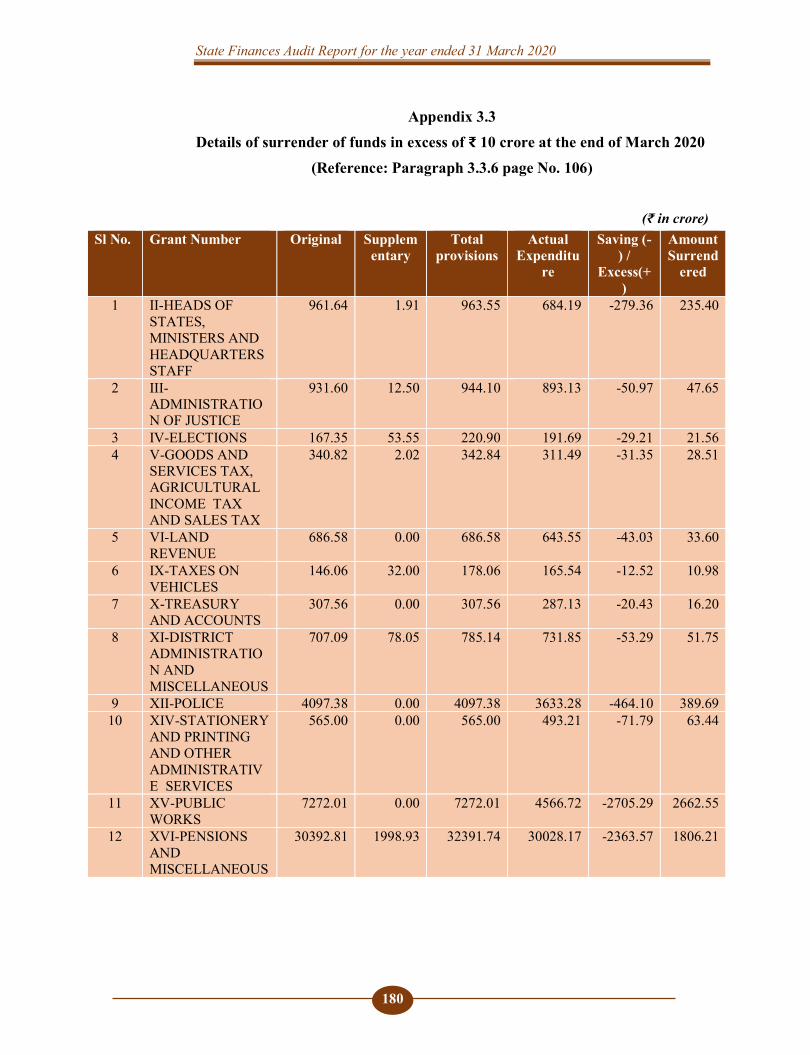
State Finances Audit Report for the year ended 31 March 2020
180
Appendix 3.3 Details of surrender of funds in excess of ₹ 10 crore at the end of March 2020
(Reference: Paragraph 3.3.6 page No. 106)
(₹ in crore) Sl No. Grant Number Original Supplem
entary Total
provisions Actual
Expenditure
Saving (-) /
Excess(+)
Amount Surrend
ered
1 II-HEADS OF STATES, MINISTERS AND HEADQUARTERS STAFF
961.64 1.91 963.55 684.19 -279.36 235.40
2 III-ADMINISTRATION OF JUSTICE
931.60 12.50 944.10 893.13 -50.97 47.65
3 IV-ELECTIONS 167.35 53.55 220.90 191.69 -29.21 21.56 4 V-GOODS AND
SERVICES TAX, AGRICULTURAL INCOME TAX AND SALES TAX
340.82 2.02 342.84 311.49 -31.35 28.51
5 VI-LAND REVENUE
686.58 0.00 686.58 643.55 -43.03 33.60
6 IX-TAXES ON VEHICLES
146.06 32.00 178.06 165.54 -12.52 10.98
7 X-TREASURY AND ACCOUNTS
307.56 0.00 307.56 287.13 -20.43 16.20
8 XI-DISTRICT ADMINISTRATION AND MISCELLANEOUS
707.09 78.05 785.14 731.85 -53.29 51.75
9 XII-POLICE 4097.38 0.00 4097.38 3633.28 -464.10 389.69 10 XIV-STATIONERY
AND PRINTING AND OTHER ADMINISTRATIVE SERVICES
565.00 0.00 565.00 493.21 -71.79 63.44
11 XV-PUBLIC WORKS
7272.01 0.00 7272.01 4566.72 -2705.29 2662.55
12 XVI-PENSIONS AND MISCELLANEOUS
30392.81 1998.93 32391.74 30028.17 -2363.57 1806.21
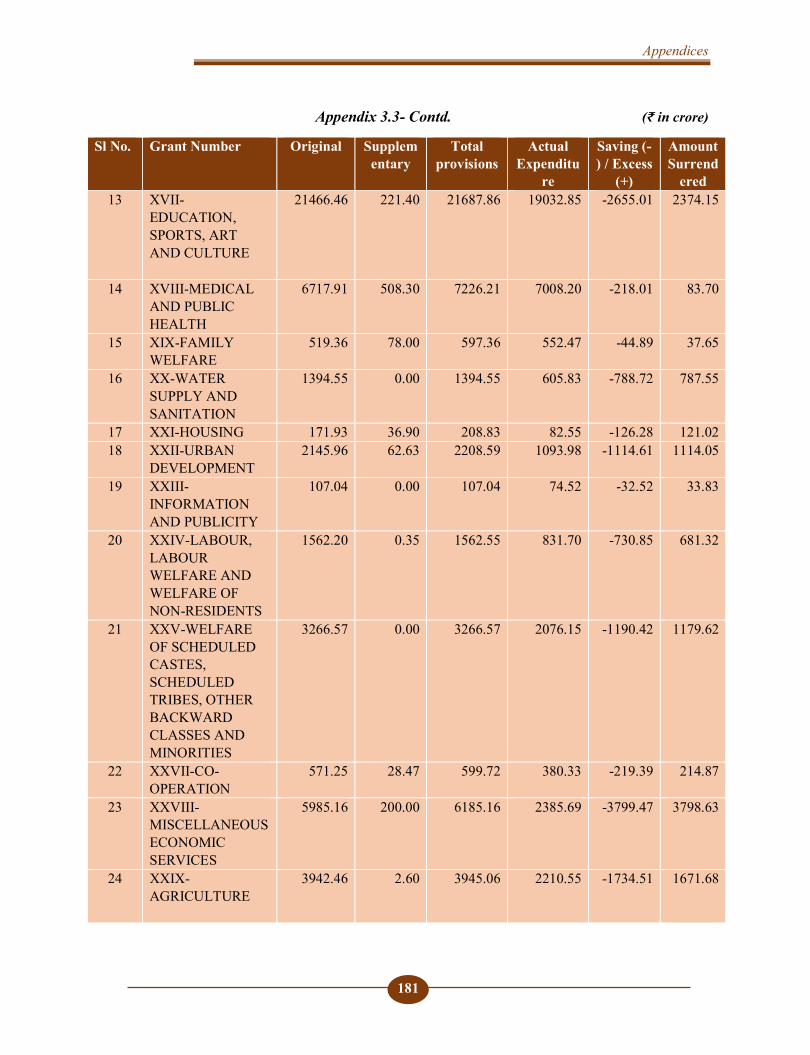
Appendices
181
Appendix 3.3- Contd. (₹ in crore)
Sl No. Grant Number Original Supplementary
Total provisions
Actual Expenditu
re
Saving (-) / Excess
(+)
Amount Surrend
ered 13 XVII-
EDUCATION, SPORTS, ART AND CULTURE
21466.46 221.40 21687.86 19032.85 -2655.01 2374.15
14 XVIII-MEDICAL AND PUBLIC HEALTH
6717.91 508.30 7226.21 7008.20 -218.01 83.70
15 XIX-FAMILY WELFARE
519.36 78.00 597.36 552.47 -44.89 37.65
16 XX-WATER SUPPLY AND SANITATION
1394.55 0.00 1394.55 605.83 -788.72 787.55
17 XXI-HOUSING 171.93 36.90 208.83 82.55 -126.28 121.02 18 XXII-URBAN
DEVELOPMENT 2145.96 62.63 2208.59 1093.98 -1114.61 1114.05
19 XXIII-INFORMATION AND PUBLICITY
107.04 0.00 107.04 74.52 -32.52 33.83
20 XXIV-LABOUR, LABOUR WELFARE AND WELFARE OF NON-RESIDENTS
1562.20 0.35 1562.55 831.70 -730.85 681.32
21 XXV-WELFARE OF SCHEDULED CASTES, SCHEDULED TRIBES, OTHER BACKWARD CLASSES AND MINORITIES
3266.57 0.00 3266.57 2076.15 -1190.42 1179.62
22 XXVII-CO-OPERATION
571.25 28.47 599.72 380.33 -219.39 214.87
23 XXVIII-MISCELLANEOUS ECONOMIC SERVICES
5985.16 200.00 6185.16 2385.69 -3799.47 3798.63
24 XXIX-AGRICULTURE
3942.46 2.60 3945.06 2210.55 -1734.51 1671.68
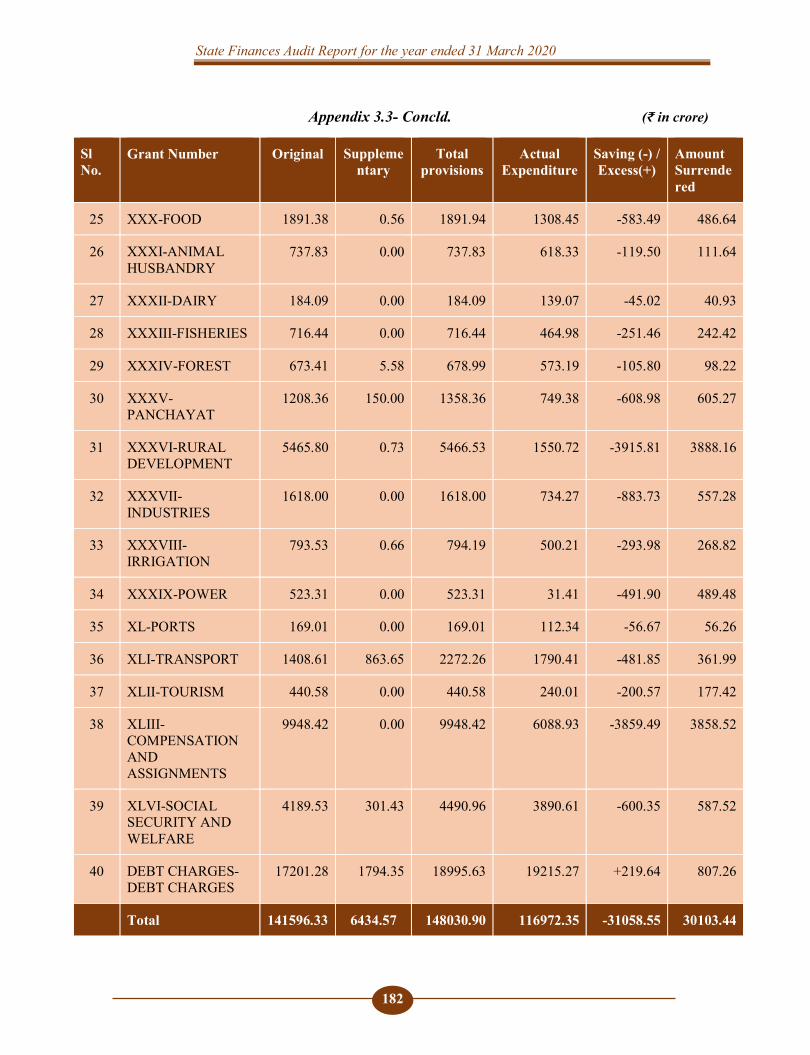
State Finances Audit Report for the year ended 31 March 2020
182
Appendix 3.3- Concld. (₹ in crore)
Sl No.
Grant Number Original Supplementary
Total provisions
Actual Expenditure
Saving (-) / Excess(+)
Amount Surrendered
25 XXX-FOOD 1891.38 0.56 1891.94 1308.45 -583.49 486.64
26 XXXI-ANIMAL HUSBANDRY
737.83 0.00 737.83 618.33 -119.50 111.64
27 XXXII-DAIRY 184.09 0.00 184.09 139.07 -45.02 40.93
28 XXXIII-FISHERIES 716.44 0.00 716.44 464.98 -251.46 242.42
29 XXXIV-FOREST 673.41 5.58 678.99 573.19 -105.80 98.22
30 XXXV-PANCHAYAT
1208.36 150.00 1358.36 749.38 -608.98 605.27
31 XXXVI-RURAL DEVELOPMENT
5465.80 0.73 5466.53 1550.72 -3915.81 3888.16
32 XXXVII-INDUSTRIES
1618.00 0.00 1618.00 734.27 -883.73 557.28
33 XXXVIII-IRRIGATION
793.53 0.66 794.19 500.21 -293.98 268.82
34 XXXIX-POWER 523.31 0.00 523.31 31.41 -491.90 489.48
35 XL-PORTS 169.01 0.00 169.01 112.34 -56.67 56.26
36 XLI-TRANSPORT 1408.61 863.65 2272.26 1790.41 -481.85 361.99
37 XLII-TOURISM 440.58 0.00 440.58 240.01 -200.57 177.42
38 XLIII-COMPENSATION AND ASSIGNMENTS
9948.42 0.00 9948.42 6088.93 -3859.49 3858.52
39 XLVI-SOCIAL SECURITY AND WELFARE
4189.53 301.43 4490.96 3890.61 -600.35 587.52
40 DEBT CHARGES-DEBT CHARGES
17201.28 1794.35 18995.63 19215.27 +219.64 807.26
Total 141596.33 6434.57 148030.90 116972.35 -31058.55 30103.44
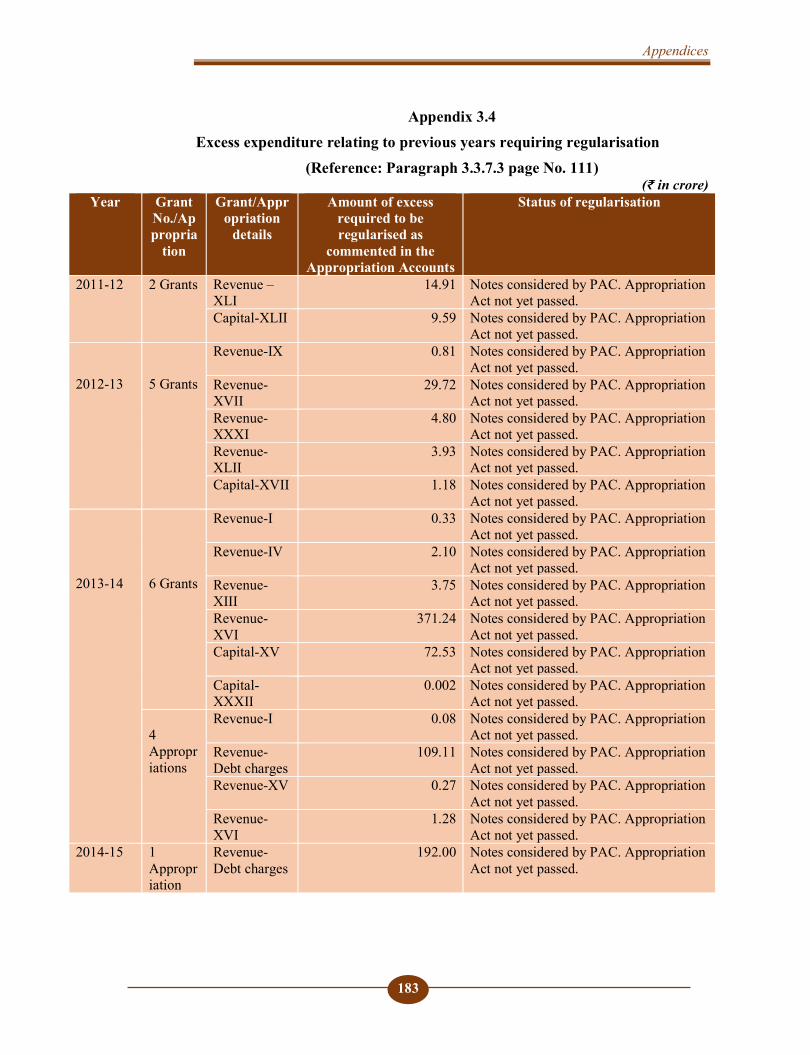
Appendices
183
Appendix 3.4 Excess expenditure relating to previous years requiring regularisation
(Reference: Paragraph 3.3.7.3 page No. 111) (₹ in crore)
Year Grant No./Appropria
tion
Grant/Appropriation
details
Amount of excess required to be regularised as
commented in the Appropriation Accounts
Status of regularisation
2011-12 2 Grants Revenue –XLI
14.91 Notes considered by PAC. Appropriation Act not yet passed.
Capital-XLII 9.59 Notes considered by PAC. Appropriation Act not yet passed.
2012-13
5 Grants
Revenue-IX 0.81 Notes considered by PAC. Appropriation Act not yet passed.
Revenue-XVII
29.72 Notes considered by PAC. Appropriation Act not yet passed.
Revenue-XXXI
4.80 Notes considered by PAC. Appropriation Act not yet passed.
Revenue-XLII
3.93 Notes considered by PAC. Appropriation Act not yet passed.
Capital-XVII 1.18 Notes considered by PAC. Appropriation Act not yet passed.
2013-14
6 Grants
Revenue-I 0.33 Notes considered by PAC. Appropriation Act not yet passed.
Revenue-IV 2.10 Notes considered by PAC. Appropriation Act not yet passed.
Revenue-XIII
3.75 Notes considered by PAC. Appropriation Act not yet passed.
Revenue-XVI
371.24 Notes considered by PAC. Appropriation Act not yet passed.
Capital-XV 72.53 Notes considered by PAC. Appropriation Act not yet passed.
Capital-XXXII
0.002 Notes considered by PAC. Appropriation Act not yet passed.
4 Appropriations
Revenue-I 0.08 Notes considered by PAC. Appropriation Act not yet passed.
Revenue-Debt charges
109.11 Notes considered by PAC. Appropriation Act not yet passed.
Revenue-XV 0.27 Notes considered by PAC. Appropriation Act not yet passed.
Revenue-XVI
1.28 Notes considered by PAC. Appropriation Act not yet passed.
2014-15 1 Appropriation
Revenue-Debt charges
192.00 Notes considered by PAC. Appropriation Act not yet passed.
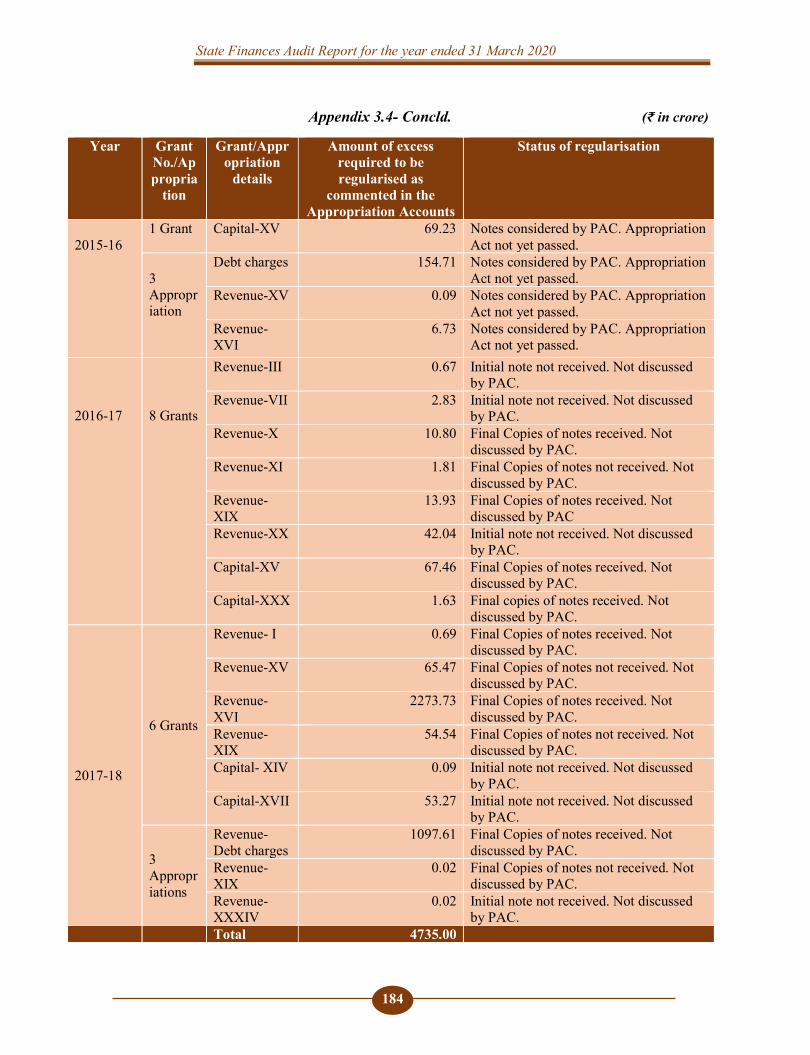
State Finances Audit Report for the year ended 31 March 2020
184
Appendix 3.4- Concld. (₹ in crore)
Year Grant No./Appropria
tion
Grant/Appropriation
details
Amount of excess required to be regularised as
commented in the Appropriation Accounts
Status of regularisation
2015-16
1 Grant Capital-XV 69.23 Notes considered by PAC. Appropriation Act not yet passed.
3 Appropriation
Debt charges 154.71 Notes considered by PAC. Appropriation Act not yet passed.
Revenue-XV 0.09 Notes considered by PAC. Appropriation Act not yet passed.
Revenue-XVI
6.73 Notes considered by PAC. Appropriation Act not yet passed.
2016-17
8 Grants
Revenue-III 0.67 Initial note not received. Not discussed by PAC.
Revenue-VII 2.83 Initial note not received. Not discussed by PAC.
Revenue-X 10.80 Final Copies of notes received. Not discussed by PAC.
Revenue-XI 1.81 Final Copies of notes not received. Not discussed by PAC.
Revenue-XIX
13.93 Final Copies of notes received. Not discussed by PAC
Revenue-XX 42.04 Initial note not received. Not discussed by PAC.
Capital-XV 67.46 Final Copies of notes received. Not discussed by PAC.
Capital-XXX 1.63 Final copies of notes received. Not discussed by PAC.
2017-18
6 Grants
Revenue- I 0.69 Final Copies of notes received. Not discussed by PAC.
Revenue-XV 65.47 Final Copies of notes not received. Not discussed by PAC.
Revenue- XVI
2273.73 Final Copies of notes received. Not discussed by PAC.
Revenue-XIX
54.54 Final Copies of notes not received. Not discussed by PAC.
Capital- XIV 0.09 Initial note not received. Not discussed by PAC.
Capital-XVII 53.27 Initial note not received. Not discussed by PAC.
3 Appropriations
Revenue-Debt charges
1097.61 Final Copies of notes received. Not discussed by PAC.
Revenue-XIX
0.02 Final Copies of notes not received. Not discussed by PAC.
Revenue-XXXIV
0.02 Initial note not received. Not discussed by PAC.
Total 4735.00
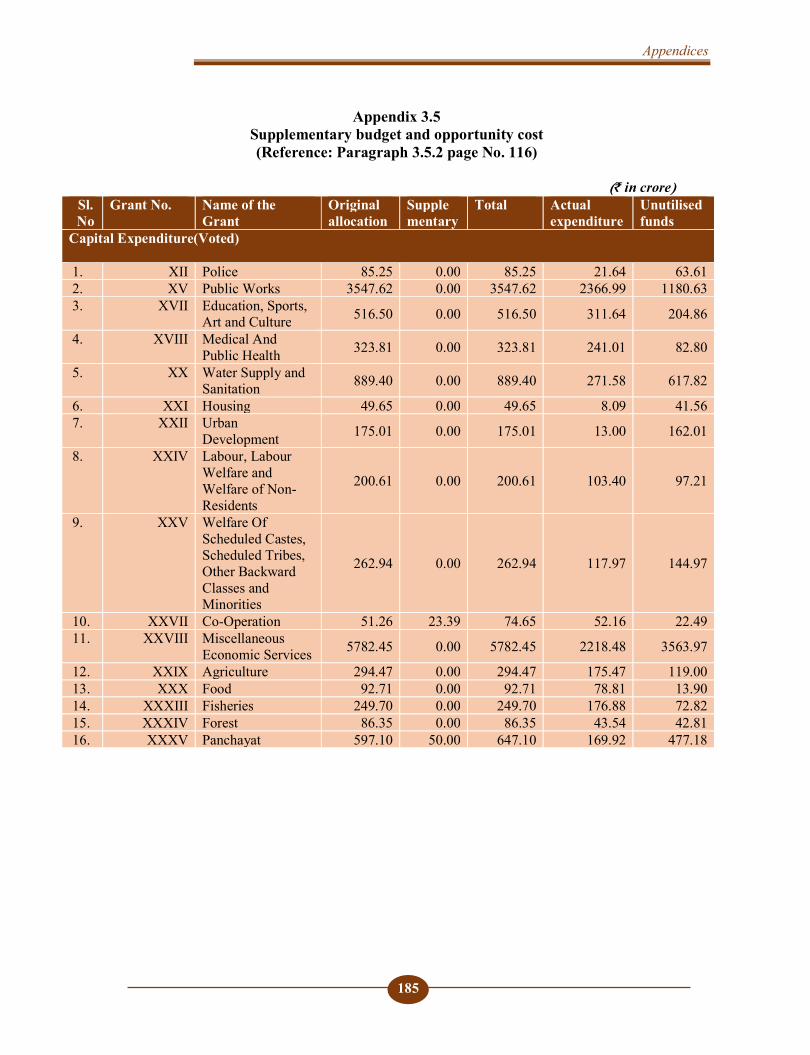
Appendices
185
Appendix 3.5 Supplementary budget and opportunity cost (Reference: Paragraph 3.5.2 page No. 116)
(₹ in crore)
Sl. No
Grant No. Name of the Grant
Original allocation
Supplementary
Total Actual expenditure
Unutilised funds
Capital Expenditure(Voted) 1. XII Police 85.25 0.00 85.25 21.64 63.61 2. XV Public Works 3547.62 0.00 3547.62 2366.99 1180.63 3. XVII Education, Sports,
Art and Culture 516.50 0.00 516.50 311.64 204.86
4. XVIII Medical And Public Health 323.81 0.00 323.81 241.01 82.80
5. XX Water Supply and Sanitation 889.40 0.00 889.40 271.58 617.82
6. XXI Housing 49.65 0.00 49.65 8.09 41.56 7. XXII Urban
Development 175.01 0.00 175.01 13.00 162.01
8. XXIV Labour, Labour Welfare and Welfare of Non-Residents
200.61 0.00 200.61 103.40 97.21
9. XXV Welfare Of Scheduled Castes, Scheduled Tribes, Other Backward Classes and Minorities
262.94 0.00 262.94 117.97 144.97
10. XXVII Co-Operation 51.26 23.39 74.65 52.16 22.49 11. XXVIII Miscellaneous
Economic Services 5782.45 0.00 5782.45 2218.48 3563.97
12. XXIX Agriculture 294.47 0.00 294.47 175.47 119.00 13. XXX Food 92.71 0.00 92.71 78.81 13.90 14. XXXIII Fisheries 249.70 0.00 249.70 176.88 72.82 15. XXXIV Forest 86.35 0.00 86.35 43.54 42.81 16. XXXV Panchayat 597.10 50.00 647.10 169.92 477.18

State Finances Audit Report for the year ended 31 March 2020
186
Appendix 3.5- Concld. (₹ in crore)
Sl . No
Grant No.
Name of the Grant
Original allocation
Supple mentary
Total Actual expenditure
Unutilised funds
17. XXXVI Rural Development 1376.62 0.73 1377.35 746.40 630.95 18. XXXVII Industries 587.72 0.00 587.72 255.51 332.21 19. XXXVIII Irrigation 358.91 0.00 358.91 155.16 203.75 20. XL Ports 105.28 0.00 105.28 60.41 44.87 21. XLI Transport 229.87 777.72 1007.59 709.23 298.36 22. XLII Tourism 235.30 0.00 235.30 82.93 152.37 23. XLVI Social Security and
Welfare 95.95 0.00 95.95 29.82 66.13
Total 16194.48 851.84 17046.32 8410.04 8636.28 Loans & Advances(Voted)
24 XXVII Co-operation 78.55 4.98 83.53 46.72 36.81 25 XXXVII Industries 417.17 0.00 417.17 124.64 292.53 26 XXXIX Power 40.76 0.00 40.76 14.06 26.70 27 XLI Transport 1000.00 43.79 1043.79 993.40 50.39
Total 1536.48 48.77 1585.25 1178.82 406.43
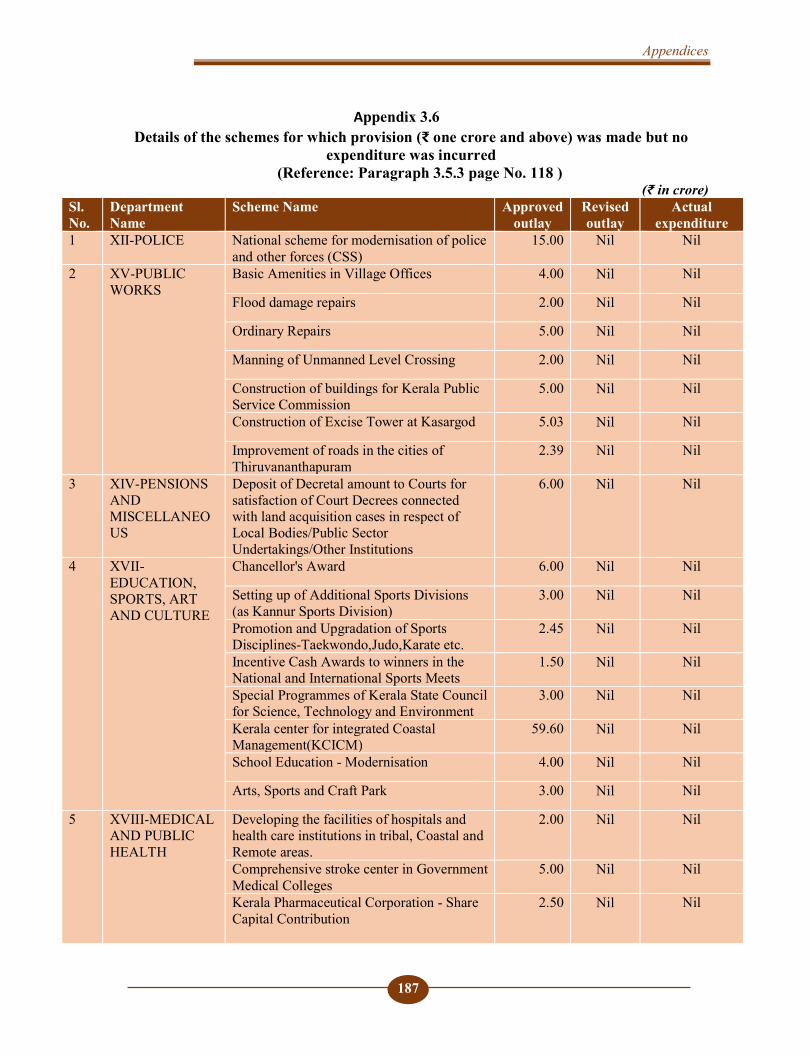
Appendices
187
Appendix 3.6 Details of the schemes for which provision (₹ one crore and above) was made but no
expenditure was incurred (Reference: Paragraph 3.5.3 page No. 118 )
(₹ in crore) Sl. No.
Department Name
Scheme Name Approved outlay
Revised outlay
Actual expenditure
1 XII-POLICE National scheme for modernisation of police and other forces (CSS)
15.00 Nil Nil
2 XV-PUBLIC WORKS
Basic Amenities in Village Offices 4.00 Nil Nil
Flood damage repairs 2.00 Nil Nil
Ordinary Repairs 5.00 Nil Nil
Manning of Unmanned Level Crossing 2.00 Nil Nil
Construction of buildings for Kerala Public Service Commission
5.00 Nil Nil
Construction of Excise Tower at Kasargod 5.03 Nil Nil
Improvement of roads in the cities of Thiruvananthapuram
2.39 Nil Nil
3 XIV-PENSIONS AND MISCELLANEOUS
Deposit of Decretal amount to Courts for satisfaction of Court Decrees connected with land acquisition cases in respect of Local Bodies/Public Sector Undertakings/Other Institutions
6.00 Nil Nil
4 XVII-EDUCATION, SPORTS, ART AND CULTURE
Chancellor's Award 6.00 Nil Nil
Setting up of Additional Sports Divisions (as Kannur Sports Division)
3.00 Nil Nil
Promotion and Upgradation of Sports Disciplines-Taekwondo,Judo,Karate etc.
2.45 Nil Nil
Incentive Cash Awards to winners in the National and International Sports Meets
1.50 Nil Nil
Special Programmes of Kerala State Council for Science, Technology and Environment
3.00 Nil Nil
Kerala center for integrated Coastal Management(KCICM)
59.60 Nil Nil
School Education - Modernisation 4.00 Nil Nil
Arts, Sports and Craft Park 3.00 Nil Nil
5 XVIII-MEDICAL AND PUBLIC HEALTH
Developing the facilities of hospitals and health care institutions in tribal, Coastal and Remote areas.
2.00 Nil Nil
Comprehensive stroke center in Government Medical Colleges
5.00 Nil Nil
Kerala Pharmaceutical Corporation - Share Capital Contribution
2.50 Nil Nil
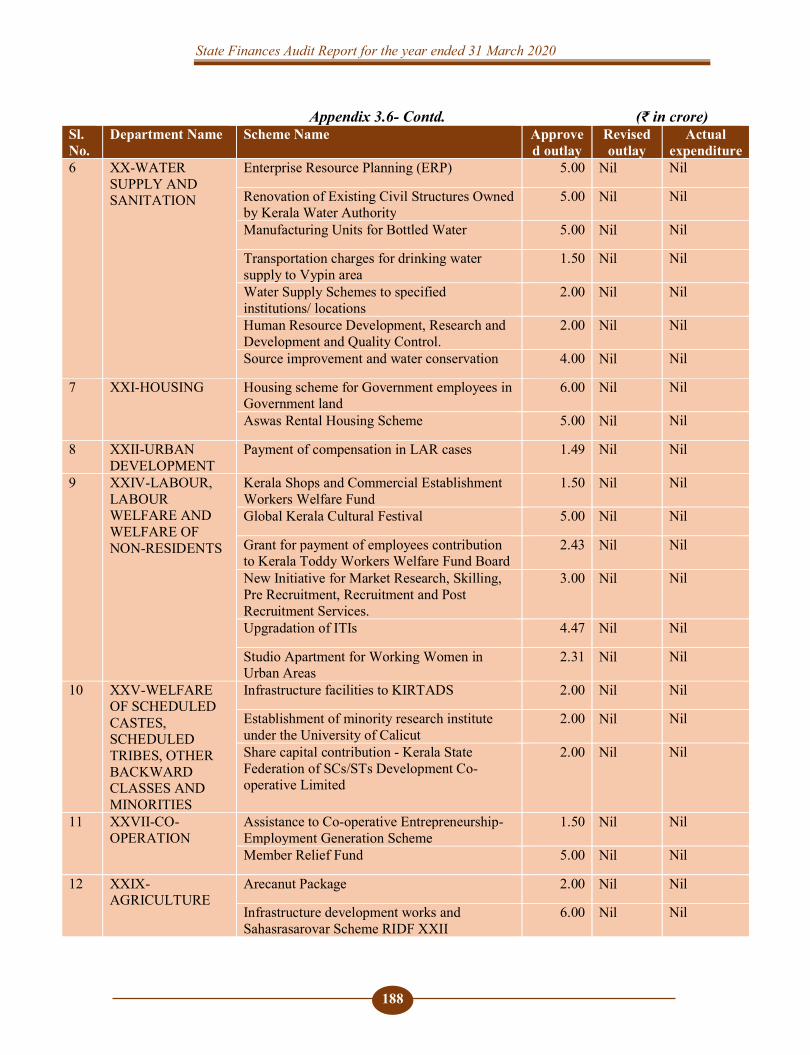
State Finances Audit Report for the year ended 31 March 2020
188
Appendix 3.6- Contd. (₹ in crore) Sl. No.
Department Name Scheme Name Approved outlay
Revised outlay
Actual expenditure
6 XX-WATER SUPPLY AND SANITATION
Enterprise Resource Planning (ERP) 5.00 Nil Nil
Renovation of Existing Civil Structures Owned by Kerala Water Authority
5.00 Nil Nil
Manufacturing Units for Bottled Water 5.00 Nil Nil
Transportation charges for drinking water supply to Vypin area
1.50 Nil Nil
Water Supply Schemes to specified institutions/ locations
2.00 Nil Nil
Human Resource Development, Research and Development and Quality Control.
2.00 Nil Nil
Source improvement and water conservation 4.00 Nil Nil
7 XXI-HOUSING Housing scheme for Government employees in Government land
6.00 Nil Nil
Aswas Rental Housing Scheme 5.00 Nil Nil
8 XXII-URBAN DEVELOPMENT
Payment of compensation in LAR cases 1.49 Nil Nil
9 XXIV-LABOUR, LABOUR WELFARE AND WELFARE OF NON-RESIDENTS
Kerala Shops and Commercial Establishment Workers Welfare Fund
1.50 Nil Nil
Global Kerala Cultural Festival 5.00 Nil Nil
Grant for payment of employees contribution to Kerala Toddy Workers Welfare Fund Board
2.43 Nil Nil
New Initiative for Market Research, Skilling, Pre Recruitment, Recruitment and Post Recruitment Services.
3.00 Nil Nil
Upgradation of ITIs 4.47 Nil Nil
Studio Apartment for Working Women in Urban Areas
2.31 Nil Nil
10 XXV-WELFARE OF SCHEDULED CASTES, SCHEDULED TRIBES, OTHER BACKWARD CLASSES AND MINORITIES
Infrastructure facilities to KIRTADS 2.00 Nil Nil
Establishment of minority research institute under the University of Calicut
2.00 Nil Nil
Share capital contribution - Kerala State Federation of SCs/STs Development Co-operative Limited
2.00 Nil Nil
11 XXVII-CO-OPERATION
Assistance to Co-operative Entrepreneurship-Employment Generation Scheme
1.50 Nil Nil
Member Relief Fund 5.00 Nil Nil
12 XXIX-AGRICULTURE
Arecanut Package 2.00 Nil Nil
Infrastructure development works and Sahasrasarovar Scheme RIDF XXII
6.00 Nil Nil
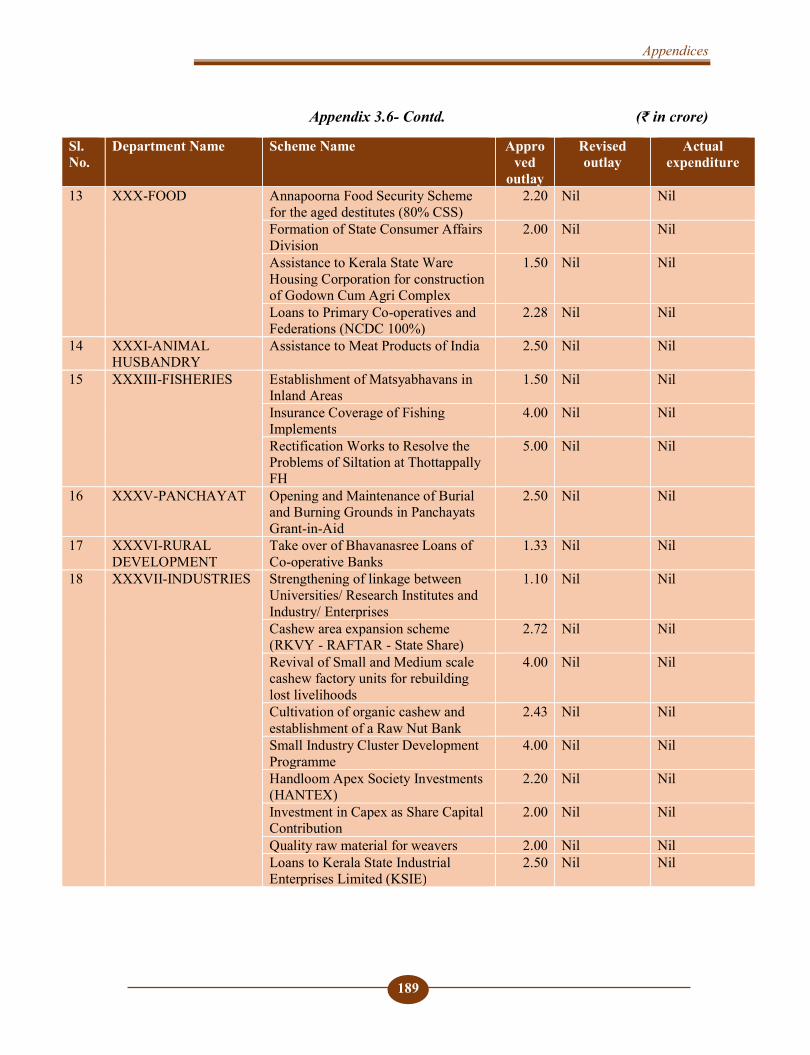
Appendices
189
Appendix 3.6- Contd. (₹ in crore)
Sl. No.
Department Name Scheme Name Approved
outlay
Revised outlay
Actual expenditure
13 XXX-FOOD Annapoorna Food Security Scheme for the aged destitutes (80% CSS)
2.20 Nil Nil
Formation of State Consumer Affairs Division
2.00 Nil Nil
Assistance to Kerala State Ware Housing Corporation for construction of Godown Cum Agri Complex
1.50 Nil Nil
Loans to Primary Co-operatives and Federations (NCDC 100%)
2.28 Nil Nil
14 XXXI-ANIMAL HUSBANDRY
Assistance to Meat Products of India 2.50 Nil Nil
15 XXXIII-FISHERIES Establishment of Matsyabhavans in Inland Areas
1.50 Nil Nil
Insurance Coverage of Fishing Implements
4.00 Nil Nil
Rectification Works to Resolve the Problems of Siltation at Thottappally FH
5.00 Nil Nil
16 XXXV-PANCHAYAT Opening and Maintenance of Burial and Burning Grounds in Panchayats Grant-in-Aid
2.50 Nil Nil
17 XXXVI-RURAL DEVELOPMENT
Take over of Bhavanasree Loans of Co-operative Banks
1.33 Nil Nil
18 XXXVII-INDUSTRIES Strengthening of linkage between Universities/ Research Institutes and Industry/ Enterprises
1.10 Nil Nil
Cashew area expansion scheme (RKVY - RAFTAR - State Share)
2.72 Nil Nil
Revival of Small and Medium scale cashew factory units for rebuilding lost livelihoods
4.00 Nil Nil
Cultivation of organic cashew and establishment of a Raw Nut Bank
2.43 Nil Nil
Small Industry Cluster Development Programme
4.00 Nil Nil
Handloom Apex Society Investments (HANTEX)
2.20 Nil Nil
Investment in Capex as Share Capital Contribution
2.00 Nil Nil
Quality raw material for weavers 2.00 Nil Nil Loans to Kerala State Industrial Enterprises Limited (KSIE)
2.50 Nil Nil
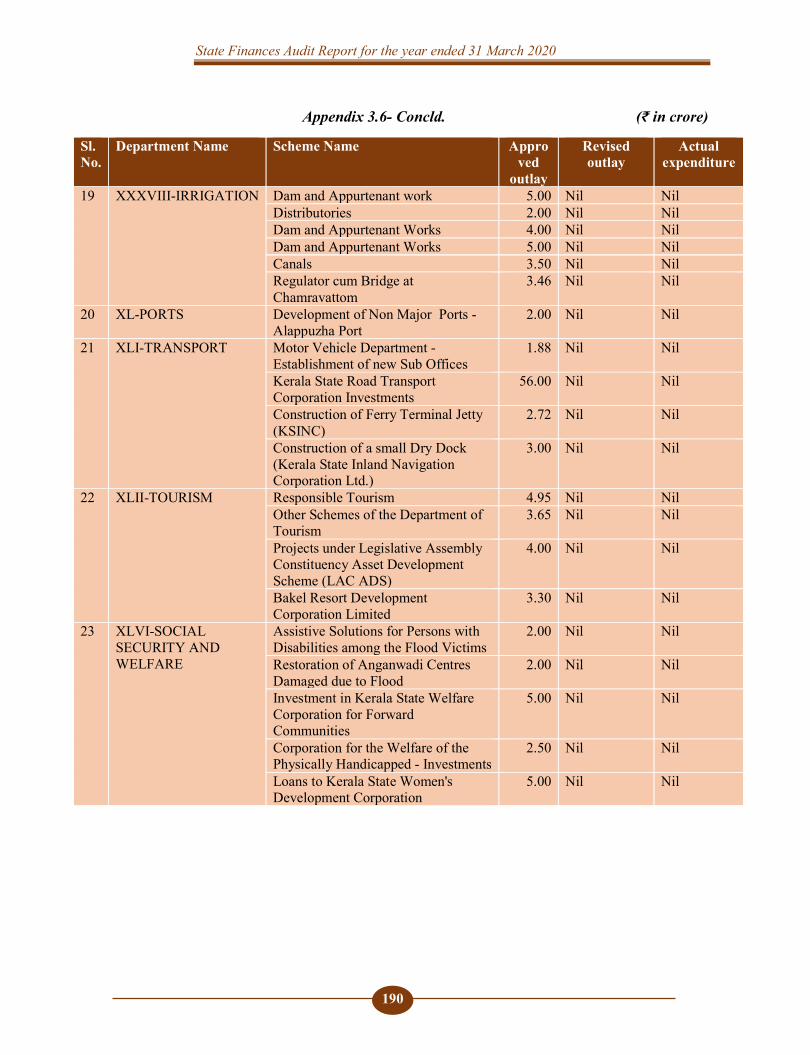
State Finances Audit Report for the year ended 31 March 2020
190
Appendix 3.6- Concld. (₹ in crore)
Sl. No.
Department Name Scheme Name Approved
outlay
Revised outlay
Actual expenditure
19 XXXVIII-IRRIGATION Dam and Appurtenant work 5.00 Nil Nil Distributories 2.00 Nil Nil Dam and Appurtenant Works 4.00 Nil Nil Dam and Appurtenant Works 5.00 Nil Nil Canals 3.50 Nil Nil Regulator cum Bridge at Chamravattom
3.46 Nil Nil
20 XL-PORTS Development of Non Major Ports - Alappuzha Port
2.00 Nil Nil
21 XLI-TRANSPORT Motor Vehicle Department - Establishment of new Sub Offices
1.88 Nil Nil
Kerala State Road Transport Corporation Investments
56.00 Nil Nil
Construction of Ferry Terminal Jetty (KSINC)
2.72 Nil Nil
Construction of a small Dry Dock (Kerala State Inland Navigation Corporation Ltd.)
3.00 Nil Nil
22 XLII-TOURISM Responsible Tourism 4.95 Nil Nil Other Schemes of the Department of Tourism
3.65 Nil Nil
Projects under Legislative Assembly Constituency Asset Development Scheme (LAC ADS)
4.00 Nil Nil
Bakel Resort Development Corporation Limited
3.30 Nil Nil
23 XLVI-SOCIAL SECURITY AND WELFARE
Assistive Solutions for Persons with Disabilities among the Flood Victims
2.00 Nil Nil
Restoration of Anganwadi Centres Damaged due to Flood
2.00 Nil Nil
Investment in Kerala State Welfare Corporation for Forward Communities
5.00 Nil Nil
Corporation for the Welfare of the Physically Handicapped - Investments
2.50 Nil Nil
Loans to Kerala State Women's Development Corporation
5.00 Nil Nil
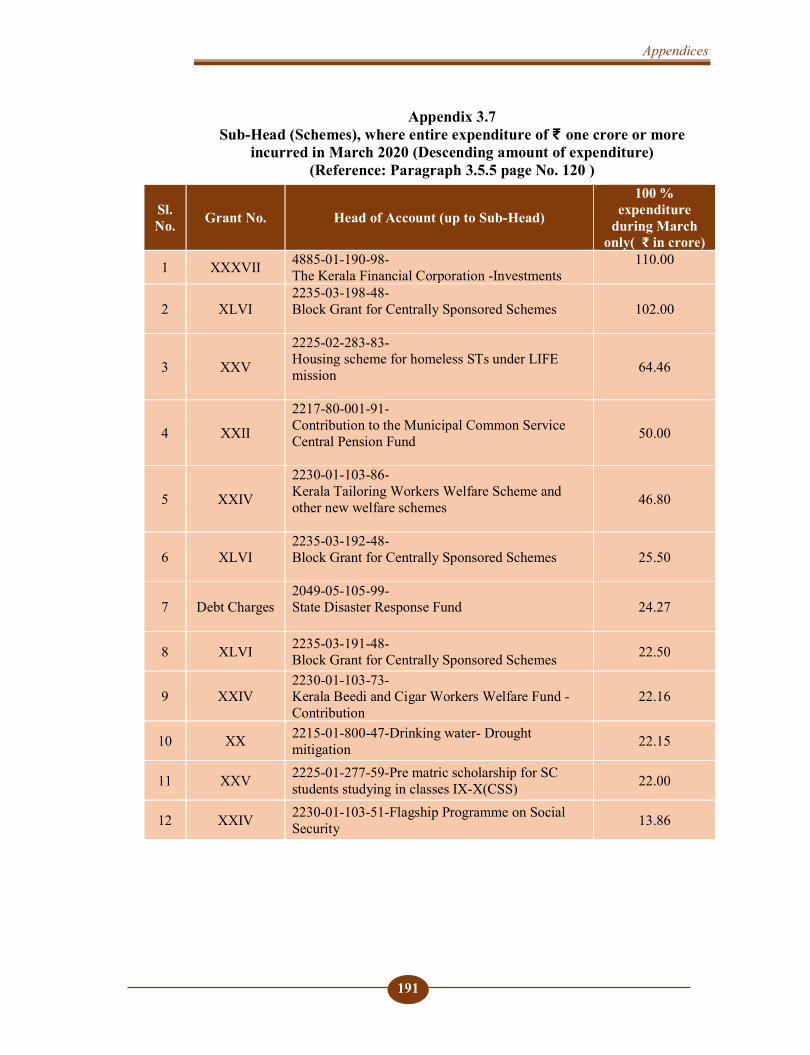
Appendices
191
Appendix 3.7 Sub-Head (Schemes), where entire expenditure of ₹ one crore or more
incurred in March 2020 (Descending amount of expenditure) (Reference: Paragraph 3.5.5 page No. 120 )
Sl. No. Grant No. Head of Account (up to Sub-Head)
100 % expenditure
during March only( ₹ in crore)
1 XXXVII 4885-01-190-98- The Kerala Financial Corporation -Investments
110.00
2 XLVI 2235-03-198-48- Block Grant for Centrally Sponsored Schemes
102.00
3 XXV
2225-02-283-83- Housing scheme for homeless STs under LIFE mission
64.46
4 XXII
2217-80-001-91- Contribution to the Municipal Common Service Central Pension Fund
50.00
5 XXIV
2230-01-103-86- Kerala Tailoring Workers Welfare Scheme and other new welfare schemes
46.80
6 XLVI 2235-03-192-48- Block Grant for Centrally Sponsored Schemes
25.50
7 Debt Charges 2049-05-105-99- State Disaster Response Fund
24.27
8 XLVI 2235-03-191-48- Block Grant for Centrally Sponsored Schemes 22.50
9 XXIV 2230-01-103-73- Kerala Beedi and Cigar Workers Welfare Fund - Contribution
22.16
10 XX 2215-01-800-47-Drinking water- Drought mitigation 22.15
11 XXV 2225-01-277-59-Pre matric scholarship for SC students studying in classes IX-X(CSS) 22.00
12 XXIV 2230-01-103-51-Flagship Programme on Social Security 13.86
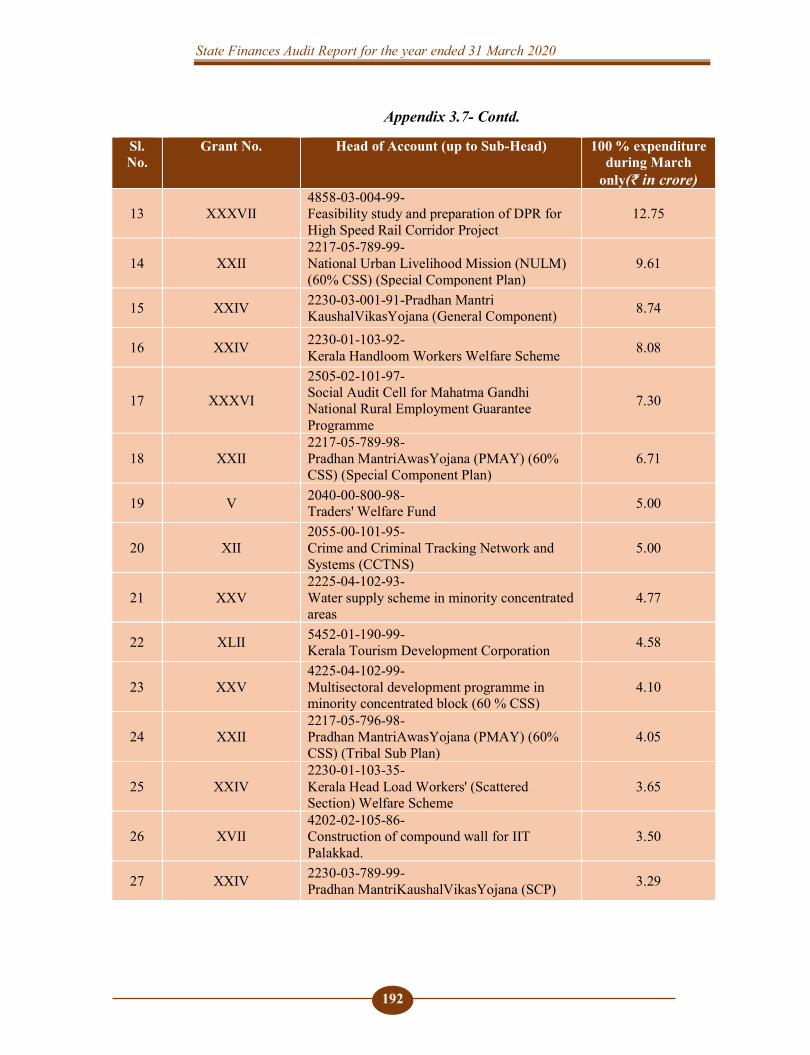
State Finances Audit Report for the year ended 31 March 2020
192
Appendix 3.7- Contd.
Sl. No.
Grant No. Head of Account (up to Sub-Head) 100 % expenditure during March
only(₹ in crore)
13 XXXVII 4858-03-004-99- Feasibility study and preparation of DPR for High Speed Rail Corridor Project
12.75
14 XXII 2217-05-789-99- National Urban Livelihood Mission (NULM) (60% CSS) (Special Component Plan)
9.61
15 XXIV 2230-03-001-91-Pradhan Mantri KaushalVikasYojana (General Component) 8.74
16 XXIV 2230-01-103-92- Kerala Handloom Workers Welfare Scheme 8.08
17 XXXVI
2505-02-101-97- Social Audit Cell for Mahatma Gandhi National Rural Employment Guarantee Programme
7.30
18 XXII 2217-05-789-98- Pradhan MantriAwasYojana (PMAY) (60% CSS) (Special Component Plan)
6.71
19 V 2040-00-800-98- Traders' Welfare Fund 5.00
20 XII 2055-00-101-95- Crime and Criminal Tracking Network and Systems (CCTNS)
5.00
21 XXV 2225-04-102-93- Water supply scheme in minority concentrated areas
4.77
22 XLII 5452-01-190-99- Kerala Tourism Development Corporation 4.58
23 XXV 4225-04-102-99- Multisectoral development programme in minority concentrated block (60 % CSS)
4.10
24 XXII 2217-05-796-98- Pradhan MantriAwasYojana (PMAY) (60% CSS) (Tribal Sub Plan)
4.05
25 XXIV 2230-01-103-35- Kerala Head Load Workers' (Scattered Section) Welfare Scheme
3.65
26 XVII 4202-02-105-86- Construction of compound wall for IIT Palakkad.
3.50
27 XXIV 2230-03-789-99- Pradhan MantriKaushalVikasYojana (SCP) 3.29

Appendices
193
Appendix 3.7- Concld.
Sl. No.
Grant No. Head of Account (up to Sub-Head) 100 % expenditure during March
only(₹ in crore)
28 XII 2055-00-001-88-Nationwide Emergency Response System (NERS) 3.10
29 XXIV
2230-03-101-57- Skill Strengthening for Industrial Value Enhancement (STRIVE) Programme (100% CSS)
2.64
30 XXI 4216-80-201-98- Working women's Hostel (60% CSS) 2.40
31 XXV
2225-04-277-94- Skill training reimbursement of fees to the minority BPL students studying in two years courses in ITC
2.00
32 XVII 2205-00-102-92- K.P.P.NambiarSmaraka Museum 2.00
33 XXIV 2230-03-796-99- Pradhan MantriKaushalVikasYojana (TSP) 1.97
34 XXII 2217-05-796-99- National Urban Livelihood Mission (NULM) (60% CSS) (Tribal Sub Plan)
1.84
35 XXIX 2401-00-789-90- Umbrella Scheme on KrishiUnnathiYojana and other CSS(SCP)
1.70
36 XXV
4225-03-190-97- Share capital contribution to Kerala State Pottery Manufacturing and Marketing Development Corporation
1.00
37 XVIII 2210-05-200-92- Cochin Cancer and Research Centre Ernakulam
1.00
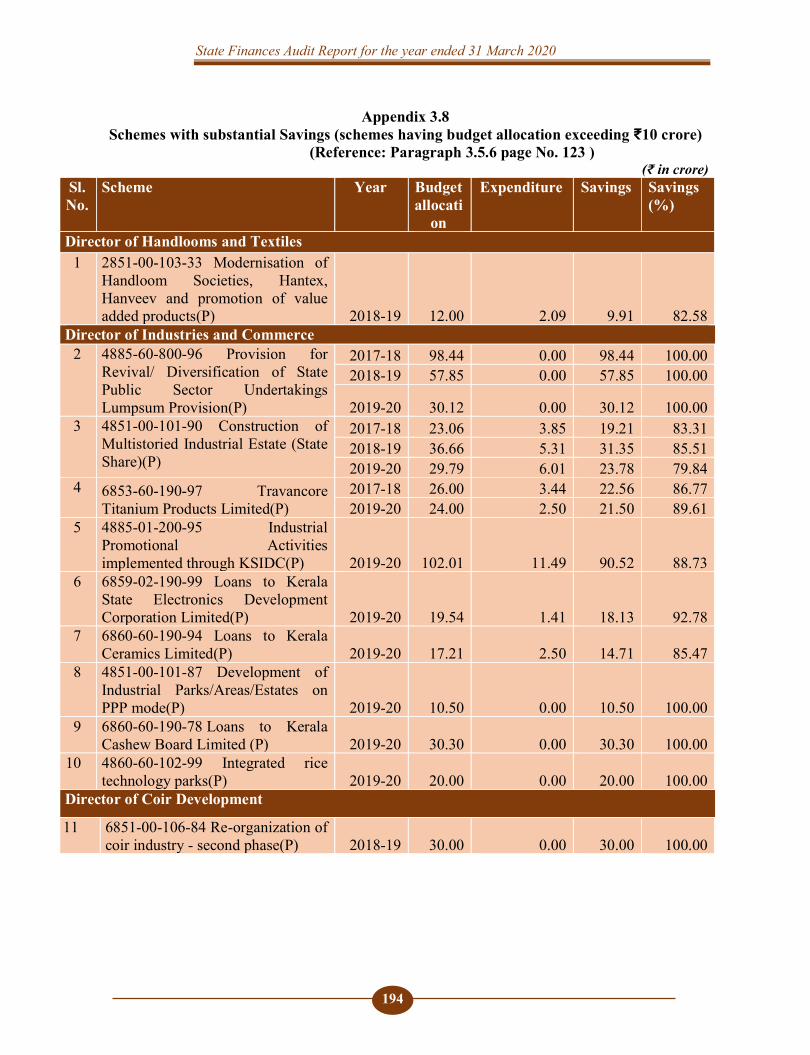
State Finances Audit Report for the year ended 31 March 2020
194
Appendix 3.8 Schemes with substantial Savings (schemes having budget allocation exceeding ₹10 crore)
(Reference: Paragraph 3.5.6 page No. 123 ) (₹ in crore)
Sl. No.
Scheme Year Budget allocati
on
Expenditure Savings Savings (%)
Director of Handlooms and Textiles 1 2851-00-103-33 Modernisation of
Handloom Societies, Hantex, Hanveev and promotion of value added products(P) 2018-19 12.00 2.09 9.91 82.58
Director of Industries and Commerce 2 4885-60-800-96 Provision for
Revival/ Diversification of State Public Sector Undertakings Lumpsum Provision(P)
2017-18 98.44 0.00 98.44 100.00 2018-19 57.85 0.00 57.85 100.00
2019-20 30.12 0.00 30.12 100.00 3 4851-00-101-90 Construction of
Multistoried Industrial Estate (State Share)(P)
2017-18 23.06 3.85 19.21 83.31 2018-19 36.66 5.31 31.35 85.51 2019-20 29.79 6.01 23.78 79.84
4 6853-60-190-97 Travancore Titanium Products Limited(P)
2017-18 26.00 3.44 22.56 86.77 2019-20 24.00 2.50 21.50 89.61
5 4885-01-200-95 Industrial Promotional Activities implemented through KSIDC(P) 2019-20 102.01 11.49 90.52 88.73
6 6859-02-190-99 Loans to Kerala State Electronics Development Corporation Limited(P) 2019-20 19.54 1.41 18.13 92.78
7 6860-60-190-94 Loans to Kerala Ceramics Limited(P) 2019-20 17.21 2.50 14.71 85.47
8 4851-00-101-87 Development of Industrial Parks/Areas/Estates on PPP mode(P) 2019-20 10.50 0.00 10.50 100.00
9 6860-60-190-78 Loans to Kerala Cashew Board Limited (P) 2019-20 30.30 0.00 30.30 100.00
10 4860-60-102-99 Integrated rice technology parks(P) 2019-20 20.00 0.00 20.00 100.00
Director of Coir Development
11 6851-00-106-84 Re-organization of coir industry - second phase(P) 2018-19 30.00 0.00 30.00 100.00
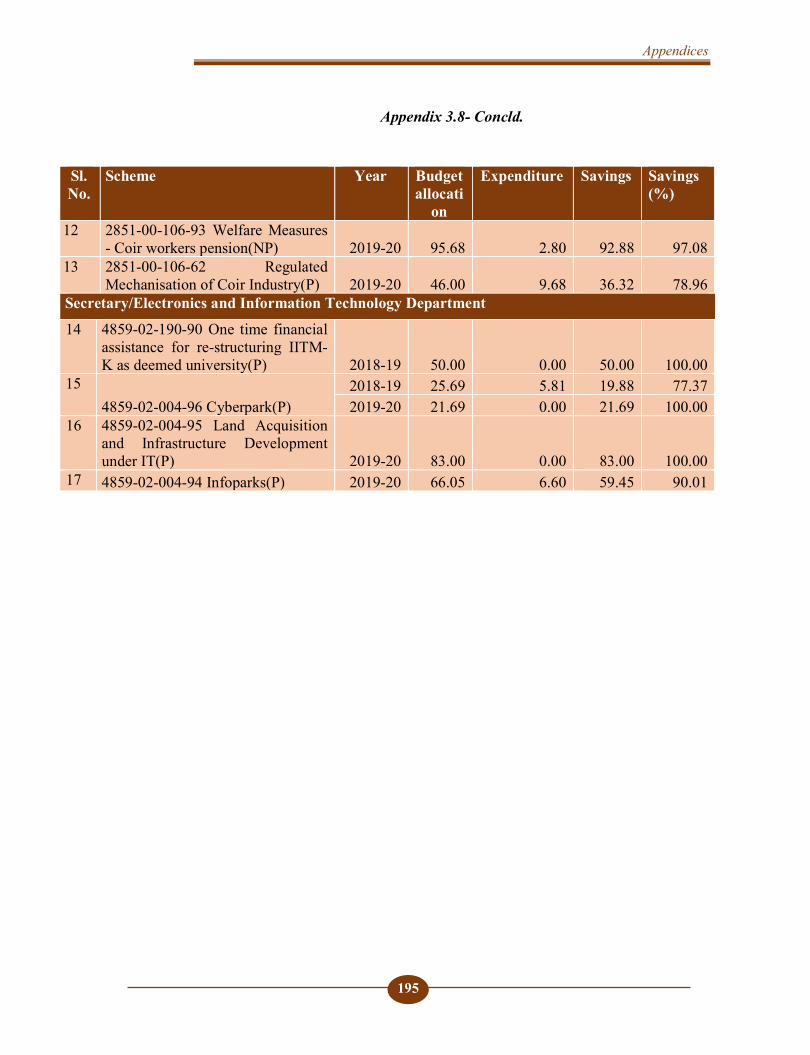
Appendices
195
Appendix 3.8- Concld.
Sl. No.
Scheme Year Budget allocati
on
Expenditure Savings Savings (%)
12 2851-00-106-93 Welfare Measures - Coir workers pension(NP) 2019-20 95.68 2.80 92.88 97.08
13 2851-00-106-62 Regulated Mechanisation of Coir Industry(P) 2019-20 46.00 9.68 36.32 78.96
Secretary/Electronics and Information Technology Department
14 4859-02-190-90 One time financial assistance for re-structuring IITM-K as deemed university(P) 2018-19 50.00 0.00 50.00 100.00
15 4859-02-004-96 Cyberpark(P)
2018-19 25.69 5.81 19.88 77.37 2019-20 21.69 0.00 21.69 100.00
16 4859-02-004-95 Land Acquisition and Infrastructure Development under IT(P) 2019-20 83.00 0.00 83.00 100.00
17 4859-02-004-94 Infoparks(P) 2019-20 66.05 6.60 59.45 90.01
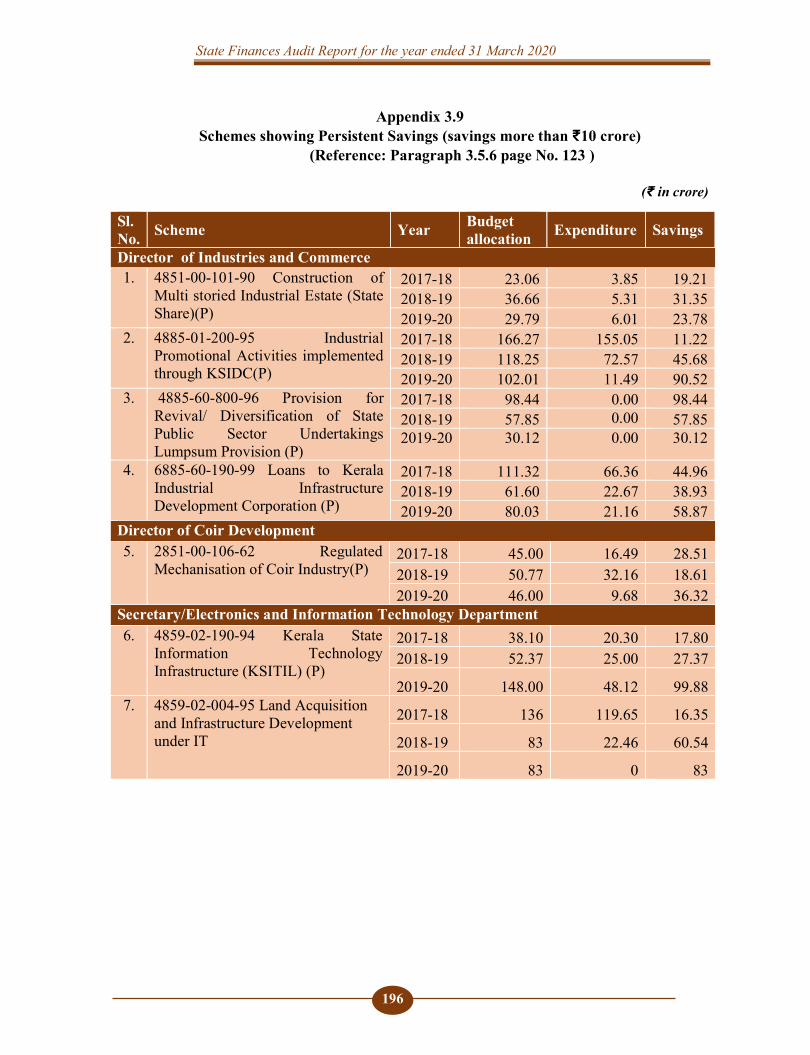
State Finances Audit Report for the year ended 31 March 2020
196
Appendix 3.9 Schemes showing Persistent Savings (savings more than ₹10 crore)
(Reference: Paragraph 3.5.6 page No. 123 )
(₹ in crore)
Sl. No. Scheme Year Budget
allocation Expenditure Savings
Director of Industries and Commerce 1. 4851-00-101-90 Construction of
Multi storied Industrial Estate (State Share)(P)
2017-18 23.06 3.85 19.21 2018-19 36.66 5.31 31.35 2019-20 29.79 6.01 23.78
2. 4885-01-200-95 Industrial Promotional Activities implemented through KSIDC(P)
2017-18 166.27 155.05 11.22 2018-19 118.25 72.57 45.68 2019-20 102.01 11.49 90.52
3. 4885-60-800-96 Provision for Revival/ Diversification of State Public Sector Undertakings Lumpsum Provision (P)
2017-18 98.44 0.00 98.44 2018-19 57.85 0.00 57.85 2019-20 30.12 0.00 30.12
4. 6885-60-190-99 Loans to Kerala Industrial Infrastructure Development Corporation (P)
2017-18 111.32 66.36 44.96 2018-19 61.60 22.67 38.93 2019-20 80.03 21.16 58.87
Director of Coir Development 5. 2851-00-106-62 Regulated
Mechanisation of Coir Industry(P) 2017-18 45.00 16.49 28.51 2018-19 50.77 32.16 18.61 2019-20 46.00 9.68 36.32
Secretary/Electronics and Information Technology Department 6. 4859-02-190-94 Kerala State
Information Technology Infrastructure (KSITIL) (P)
2017-18 38.10 20.30 17.80 2018-19 52.37 25.00 27.37
2019-20 148.00 48.12 99.88 7. 4859-02-004-95 Land Acquisition
and Infrastructure Development under IT
2017-18 136 119.65 16.35
2018-19 83 22.46 60.54
2019-20 83 0 83
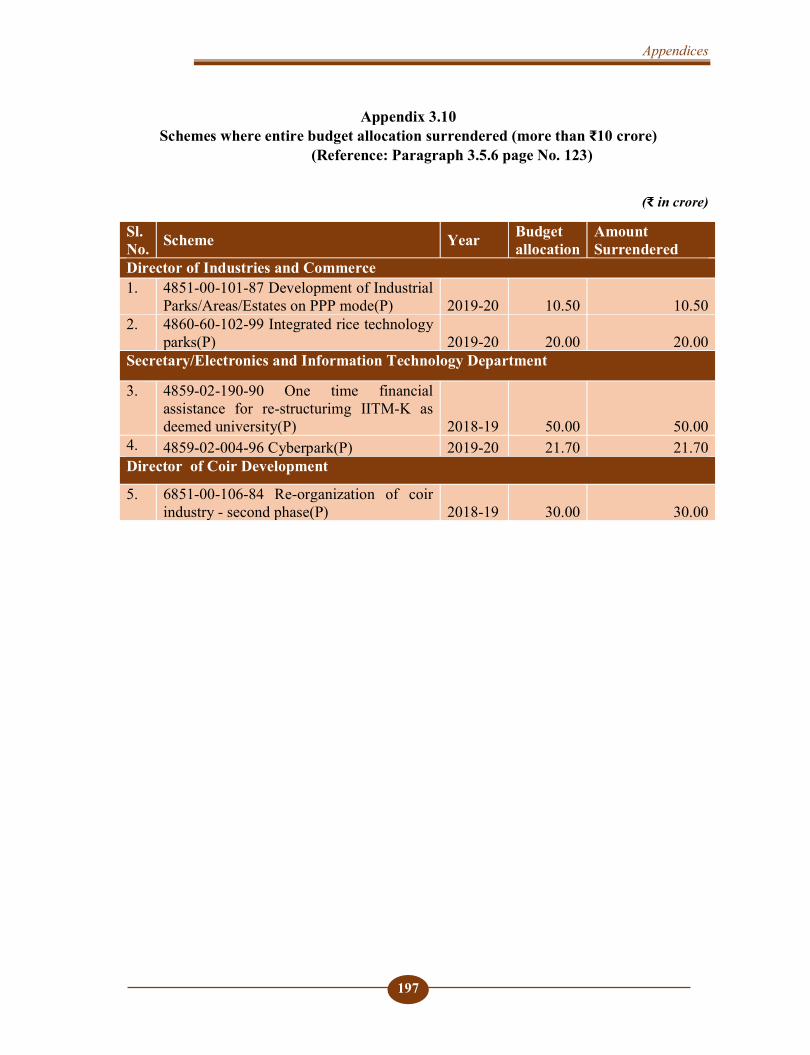
Appendices
197
Appendix 3.10 Schemes where entire budget allocation surrendered (more than ₹10 crore)
(Reference: Paragraph 3.5.6 page No. 123)
(₹ in crore)
Sl. No. Scheme Year Budget
allocation Amount Surrendered
Director of Industries and Commerce 1. 4851-00-101-87 Development of Industrial
Parks/Areas/Estates on PPP mode(P) 2019-20 10.50 10.50 2. 4860-60-102-99 Integrated rice technology
parks(P) 2019-20 20.00 20.00 Secretary/Electronics and Information Technology Department
3. 4859-02-190-90 One time financial assistance for re-structurimg IITM-K as deemed university(P) 2018-19 50.00 50.00
4. 4859-02-004-96 Cyberpark(P) 2019-20 21.70 21.70 Director of Coir Development
5. 6851-00-106-84 Re-organization of coir industry - second phase(P) 2018-19 30.00 30.00
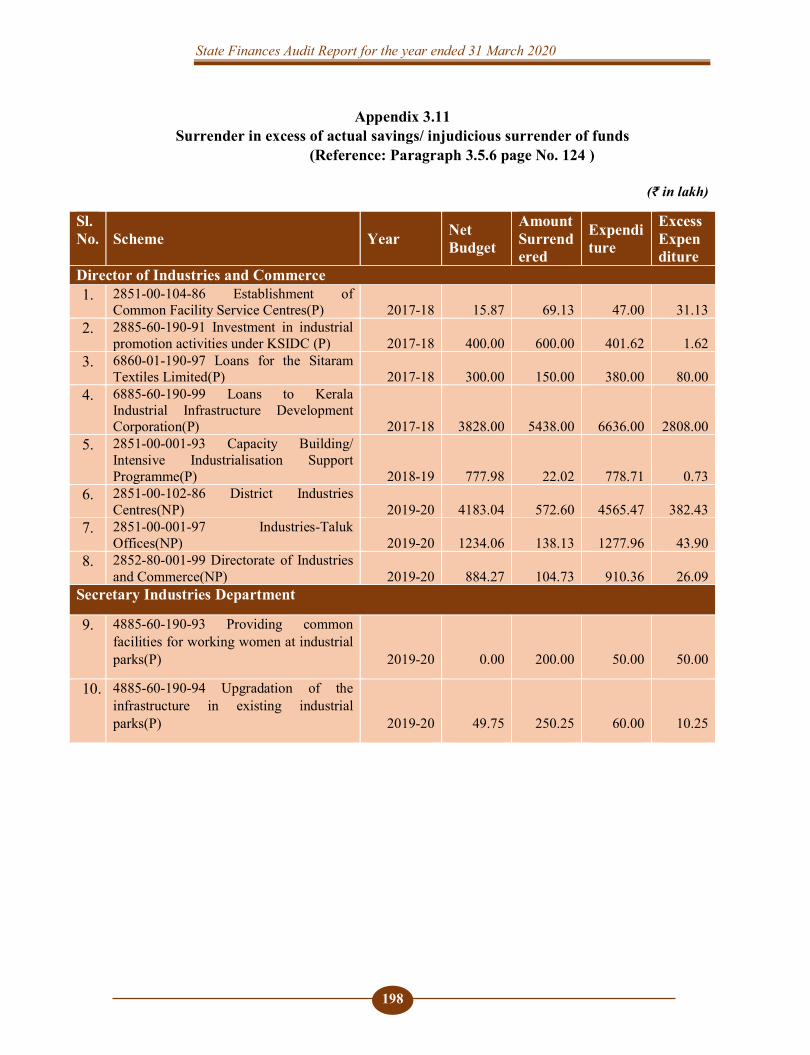
State Finances Audit Report for the year ended 31 March 2020
198
Appendix 3.11 Surrender in excess of actual savings/ injudicious surrender of funds
(Reference: Paragraph 3.5.6 page No. 124 )
(₹ in lakh)
Sl. No. Scheme Year Net
Budget
Amount Surrendered
Expenditure
Excess Expenditure
Director of Industries and Commerce 1. 2851-00-104-86 Establishment of
Common Facility Service Centres(P) 2017-18 15.87 69.13 47.00 31.13 2. 2885-60-190-91 Investment in industrial
promotion activities under KSIDC (P) 2017-18 400.00 600.00 401.62 1.62 3. 6860-01-190-97 Loans for the Sitaram
Textiles Limited(P) 2017-18 300.00 150.00 380.00 80.00 4. 6885-60-190-99 Loans to Kerala
Industrial Infrastructure Development Corporation(P) 2017-18 3828.00 5438.00 6636.00 2808.00
5. 2851-00-001-93 Capacity Building/ Intensive Industrialisation Support Programme(P) 2018-19 777.98 22.02 778.71 0.73
6. 2851-00-102-86 District Industries Centres(NP) 2019-20 4183.04 572.60 4565.47 382.43
7. 2851-00-001-97 Industries-Taluk Offices(NP) 2019-20 1234.06 138.13 1277.96 43.90
8. 2852-80-001-99 Directorate of Industries and Commerce(NP) 2019-20 884.27 104.73 910.36 26.09
Secretary Industries Department
9. 4885-60-190-93 Providing common facilities for working women at industrial parks(P) 2019-20 0.00 200.00 50.00 50.00
10. 4885-60-190-94 Upgradation of the infrastructure in existing industrial parks(P) 2019-20 49.75 250.25 60.00 10.25
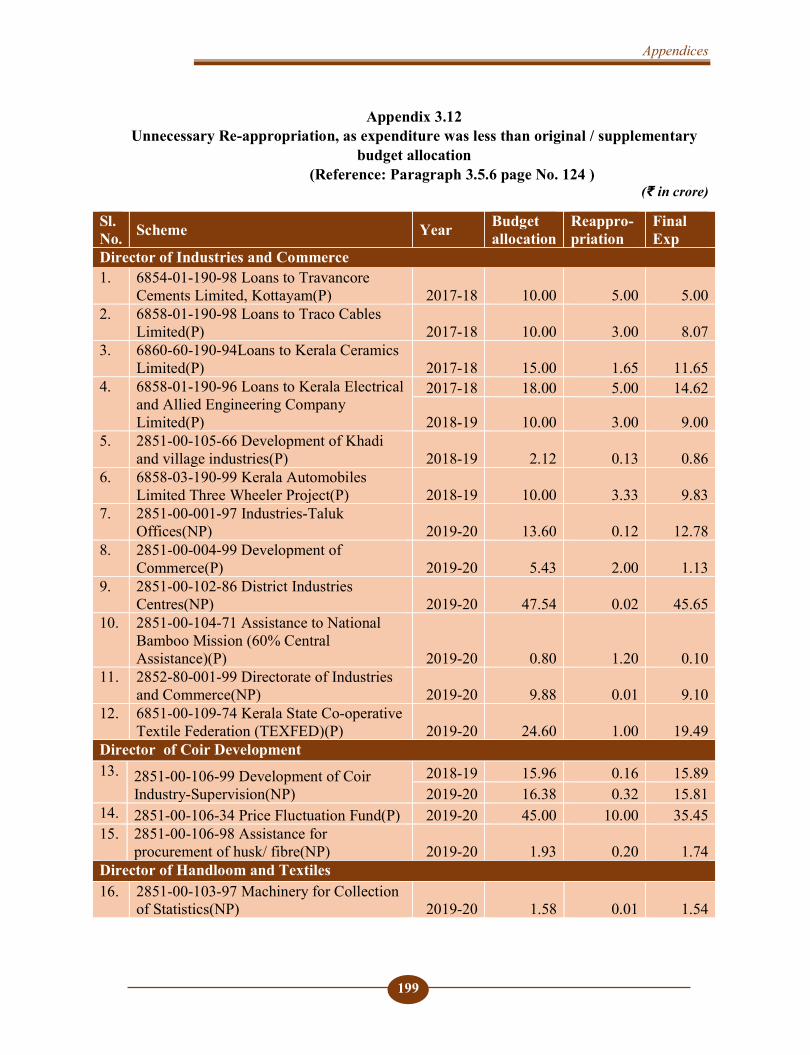
Appendices
199
Appendix 3.12 Unnecessary Re-appropriation, as expenditure was less than original / supplementary
budget allocation (Reference: Paragraph 3.5.6 page No. 124 )
(₹ in crore)
Sl. No. Scheme Year Budget
allocation Reappro-priation
Final Exp
Director of Industries and Commerce 1. 6854-01-190-98 Loans to Travancore
Cements Limited, Kottayam(P) 2017-18 10.00 5.00 5.00 2. 6858-01-190-98 Loans to Traco Cables
Limited(P) 2017-18 10.00 3.00 8.07 3. 6860-60-190-94Loans to Kerala Ceramics
Limited(P) 2017-18 15.00 1.65 11.65 4. 6858-01-190-96 Loans to Kerala Electrical
and Allied Engineering Company Limited(P)
2017-18 18.00 5.00 14.62
2018-19 10.00 3.00 9.00 5. 2851-00-105-66 Development of Khadi
and village industries(P) 2018-19 2.12 0.13 0.86 6. 6858-03-190-99 Kerala Automobiles
Limited Three Wheeler Project(P) 2018-19 10.00 3.33 9.83 7. 2851-00-001-97 Industries-Taluk
Offices(NP) 2019-20 13.60 0.12 12.78 8. 2851-00-004-99 Development of
Commerce(P) 2019-20 5.43 2.00 1.13 9. 2851-00-102-86 District Industries
Centres(NP) 2019-20 47.54 0.02 45.65 10. 2851-00-104-71 Assistance to National
Bamboo Mission (60% Central Assistance)(P) 2019-20 0.80 1.20 0.10
11. 2852-80-001-99 Directorate of Industries and Commerce(NP) 2019-20 9.88 0.01 9.10
12. 6851-00-109-74 Kerala State Co-operative Textile Federation (TEXFED)(P) 2019-20 24.60 1.00 19.49
Director of Coir Development 13. 2851-00-106-99 Development of Coir
Industry-Supervision(NP) 2018-19 15.96 0.16 15.89 2019-20 16.38 0.32 15.81
14. 2851-00-106-34 Price Fluctuation Fund(P) 2019-20 45.00 10.00 35.45 15. 2851-00-106-98 Assistance for
procurement of husk/ fibre(NP) 2019-20 1.93 0.20 1.74 Director of Handloom and Textiles 16. 2851-00-103-97 Machinery for Collection
of Statistics(NP) 2019-20 1.58 0.01 1.54
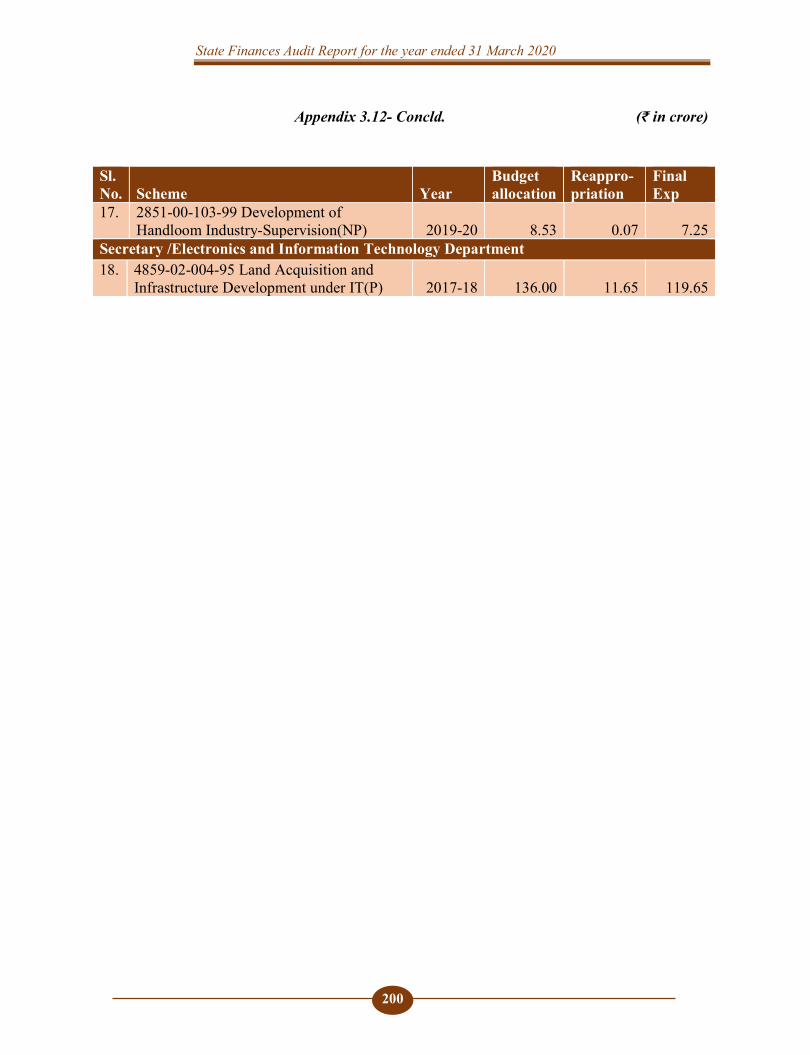
State Finances Audit Report for the year ended 31 March 2020
200
Appendix 3.12- Concld. (₹ in crore)
Sl. No. Scheme Year
Budget allocation
Reappro-priation
Final Exp
17. 2851-00-103-99 Development of Handloom Industry-Supervision(NP) 2019-20 8.53 0.07 7.25
Secretary /Electronics and Information Technology Department 18. 4859-02-004-95 Land Acquisition and
Infrastructure Development under IT(P) 2017-18 136.00 11.65 119.65
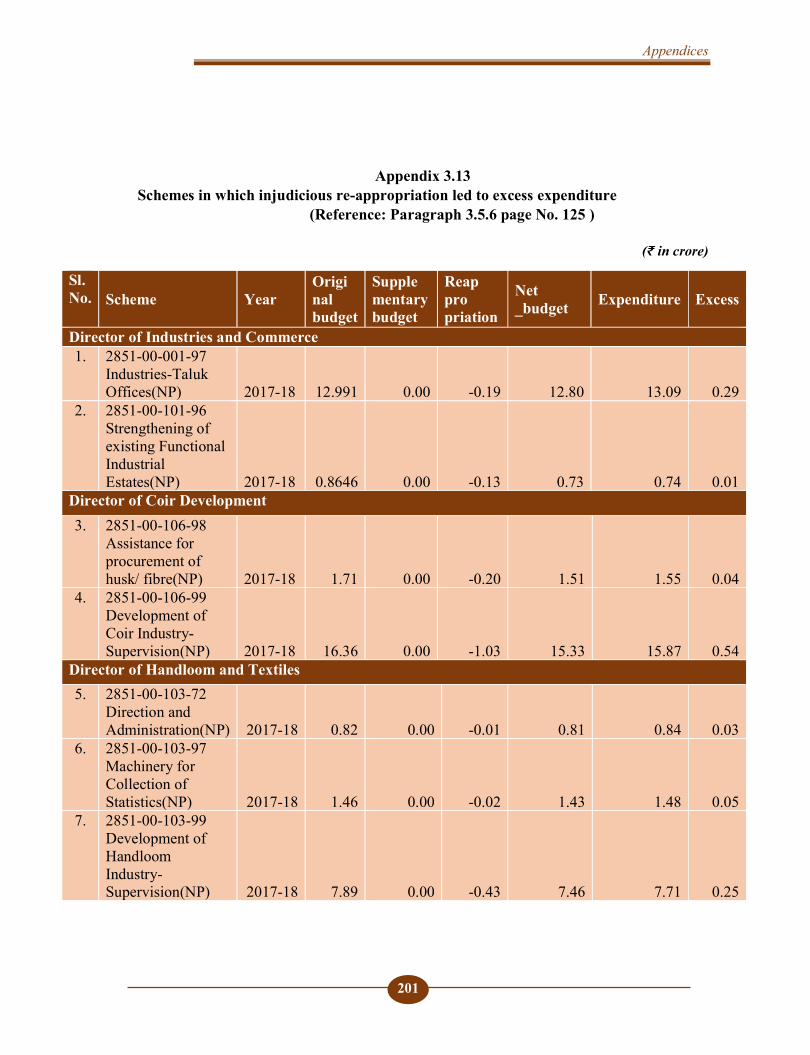
Appendices
201
Appendix 3.13 Schemes in which injudicious re-appropriation led to excess expenditure
(Reference: Paragraph 3.5.6 page No. 125 )
(₹ in crore)
Sl. No. Scheme Year
Origi nal budget
Supple mentary budget
Reap pro priation
Net _budget Expenditure Excess
Director of Industries and Commerce 1. 2851-00-001-97
Industries-Taluk Offices(NP) 2017-18 12.991 0.00 -0.19 12.80 13.09 0.29
2. 2851-00-101-96 Strengthening of existing Functional Industrial Estates(NP) 2017-18 0.8646 0.00 -0.13 0.73 0.74 0.01
Director of Coir Development 3. 2851-00-106-98
Assistance for procurement of husk/ fibre(NP) 2017-18 1.71 0.00 -0.20 1.51 1.55 0.04
4. 2851-00-106-99 Development of Coir Industry-Supervision(NP) 2017-18 16.36 0.00 -1.03 15.33 15.87 0.54
Director of Handloom and Textiles 5. 2851-00-103-72
Direction and Administration(NP) 2017-18 0.82 0.00 -0.01 0.81 0.84 0.03
6. 2851-00-103-97 Machinery for Collection of Statistics(NP) 2017-18 1.46 0.00 -0.02 1.43 1.48 0.05
7. 2851-00-103-99 Development of Handloom Industry-Supervision(NP) 2017-18 7.89 0.00 -0.43 7.46 7.71 0.25
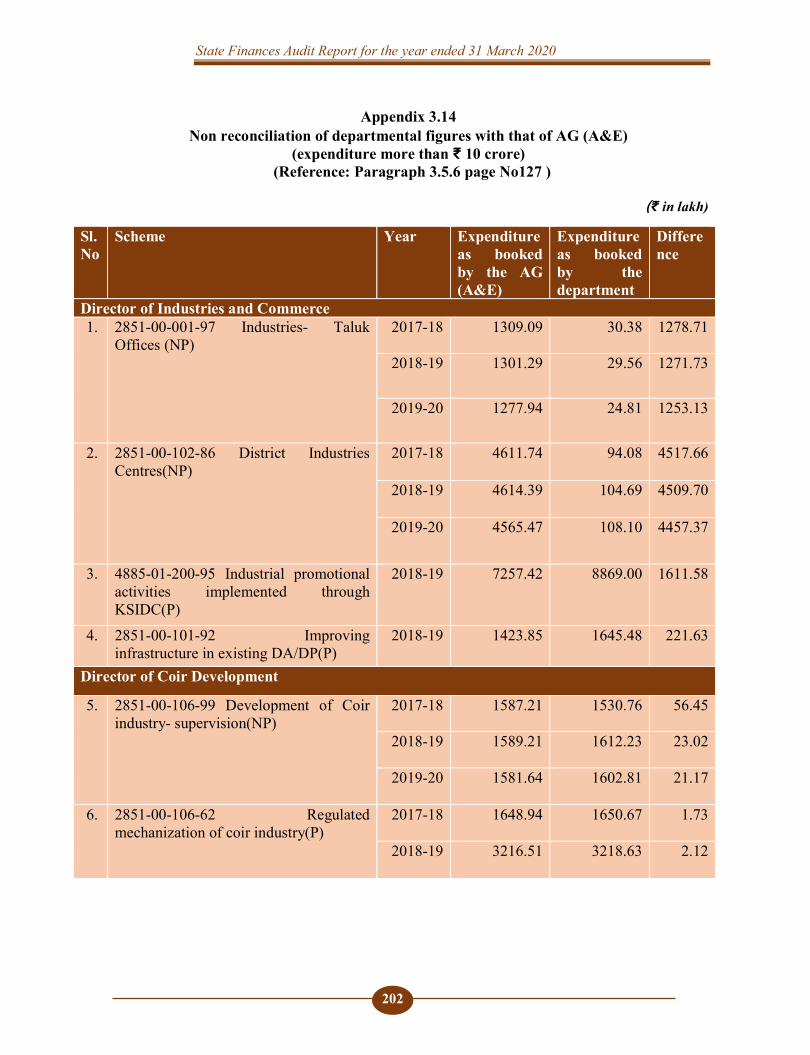
State Finances Audit Report for the year ended 31 March 2020
202
Appendix 3.14 Non reconciliation of departmental figures with that of AG (A&E)
(expenditure more than ₹ 10 crore) (Reference: Paragraph 3.5.6 page No127 )
₹ in lakh)
Sl.No
Scheme Year Expenditure as booked by the AG (A&E)
Expenditure as booked by the department
Difference
Director of Industries and Commerce 1. 2851-00-001-97 Industries- Taluk
Offices (NP) 2017-18 1309.09 30.38 1278.71
2018-19 1301.29 29.56 1271.73
2019-20 1277.94 24.81 1253.13
2. 2851-00-102-86 District Industries Centres(NP)
2017-18 4611.74 94.08 4517.66
2018-19 4614.39 104.69 4509.70
2019-20 4565.47 108.10 4457.37
3. 4885-01-200-95 Industrial promotional activities implemented through KSIDC(P)
2018-19 7257.42 8869.00 1611.58
4. 2851-00-101-92 Improving infrastructure in existing DA/DP(P)
2018-19 1423.85 1645.48 221.63
Director of Coir Development
5. 2851-00-106-99 Development of Coir industry- supervision(NP)
2017-18 1587.21 1530.76 56.45
2018-19 1589.21 1612.23 23.02
2019-20 1581.64 1602.81 21.17
6. 2851-00-106-62 Regulated mechanization of coir industry(P)
2017-18 1648.94 1650.67 1.73
2018-19 3216.51 3218.63 2.12

Appendices
203
Appendix 4.1
Statement showing performance of Autonomous Bodies (Reference: Paragraph 4.14; Page 152)
Sl. No.
Name of Autonomous body
Period of entrustment
Year up to which accounts were rendered
Period up to which separate audit report issued
Placement of SAR in the Legislature
Date of submission of accounts
Period of delay in submission of accounts
Year of Latest SAR
Date of Placement
1
Kerala Khadi and Village Industries Board, Thiruvananthapuram
Up to 2017-18 2016-17 2015-16 2015-16 05.11.2019 18.06.2020 36 months 18 days
2
Kerala Institute of Labour & Employment, Thiruvananthapuram
For five years from 2017-18 2017-18 2016-17 2014-15 30.11.2018 14.11.2018 4 months 14
days
3
Kerala State Commission for Backward classes, Thiruvananthapuram
From 2017-18 to 2021-22 2018-19 2017-18 2017-18 24.08.2020 03.02.2020 7 months 03
days
4
Kerala State Commission for Scheduled Castes and Scheduled Tribes
From 2009 onwards 2018-19 2016-17 2014-15 29.10.2019 22.12.2020 17 months
22 days
5
Kerala Building & Other Construction Workers Welfare Board, Thiruvananthapuram
1998-99 onwards
Act enacted by Parliament
2017-18 2016-17 2016-17 13.06.2019 19.06.2019 11 months 19 days
6 Kerala State Human Rights Commission
1998-99 onwards
Act enacted by Parliament
2017-18 2017-18 2015-16 30.11.2018 11.03.2020 20 months 11 days
7 Kerala State Legal Services Authority, Ernakulam.
1998-99 onwards
Act enacted by Parliament
2017-18 2017-18 2014-15 20.10.2016 01.01.2020 18 months
8 Permanent Lok Adalath, Thiruvananthapuram
1998-99 onwards
Act enacted by Parliament
2017-18 2017-18 2015-16 30.01.2018 31.05.2019 11 months
9 Permanent Lok Adalath, Ernakulam
1998-99 onwards
Act enacted by Parliament
2018-19 2017-18 2017-18 13.01.2021 01.01.2020 6 months
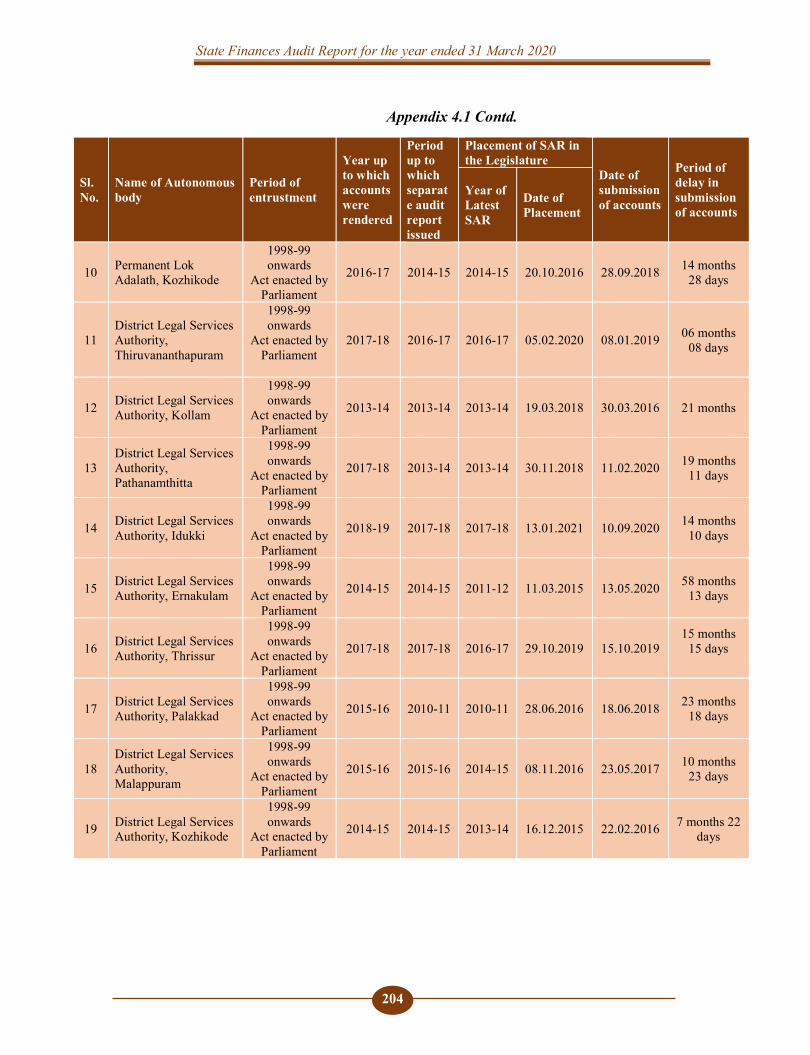
State Finances Audit Report for the year ended 31 March 2020
204
Appendix 4.1 Contd.
Sl. No.
Name of Autonomous body
Period of entrustment
Year up to which accounts were rendered
Period up to which separate audit report issued
Placement of SAR in the Legislature
Date of submission of accounts
Period of delay in submission of accounts
Year of Latest SAR
Date of Placement
10 Permanent Lok Adalath, Kozhikode
1998-99 onwards
Act enacted by Parliament
2016-17 2014-15 2014-15 20.10.2016 28.09.2018 14 months 28 days
11 District Legal Services Authority, Thiruvananthapuram
1998-99 onwards
Act enacted by Parliament
2017-18 2016-17 2016-17 05.02.2020 08.01.2019 06 months 08 days
12 District Legal Services Authority, Kollam
1998-99 onwards
Act enacted by Parliament
2013-14 2013-14 2013-14 19.03.2018 30.03.2016 21 months
13 District Legal Services Authority, Pathanamthitta
1998-99 onwards
Act enacted by Parliament
2017-18 2013-14 2013-14 30.11.2018 11.02.2020 19 months 11 days
14 District Legal Services Authority, Idukki
1998-99 onwards
Act enacted by Parliament
2018-19 2017-18 2017-18 13.01.2021 10.09.2020 14 months 10 days
15 District Legal Services Authority, Ernakulam
1998-99 onwards
Act enacted by Parliament
2014-15 2014-15 2011-12 11.03.2015 13.05.2020 58 months 13 days
16 District Legal Services Authority, Thrissur
1998-99 onwards
Act enacted by Parliament
2017-18 2017-18 2016-17 29.10.2019
15.10.2019
15 months 15 days
17 District Legal Services Authority, Palakkad
1998-99 onwards
Act enacted by Parliament
2015-16 2010-11 2010-11 28.06.2016 18.06.2018 23 months 18 days
18 District Legal Services Authority, Malappuram
1998-99 onwards
Act enacted by Parliament
2015-16 2015-16 2014-15 08.11.2016 23.05.2017 10 months 23 days
19 District Legal Services Authority, Kozhikode
1998-99 onwards
Act enacted by Parliament
2014-15 2014-15 2013-14 16.12.2015 22.02.2016 7 months 22 days
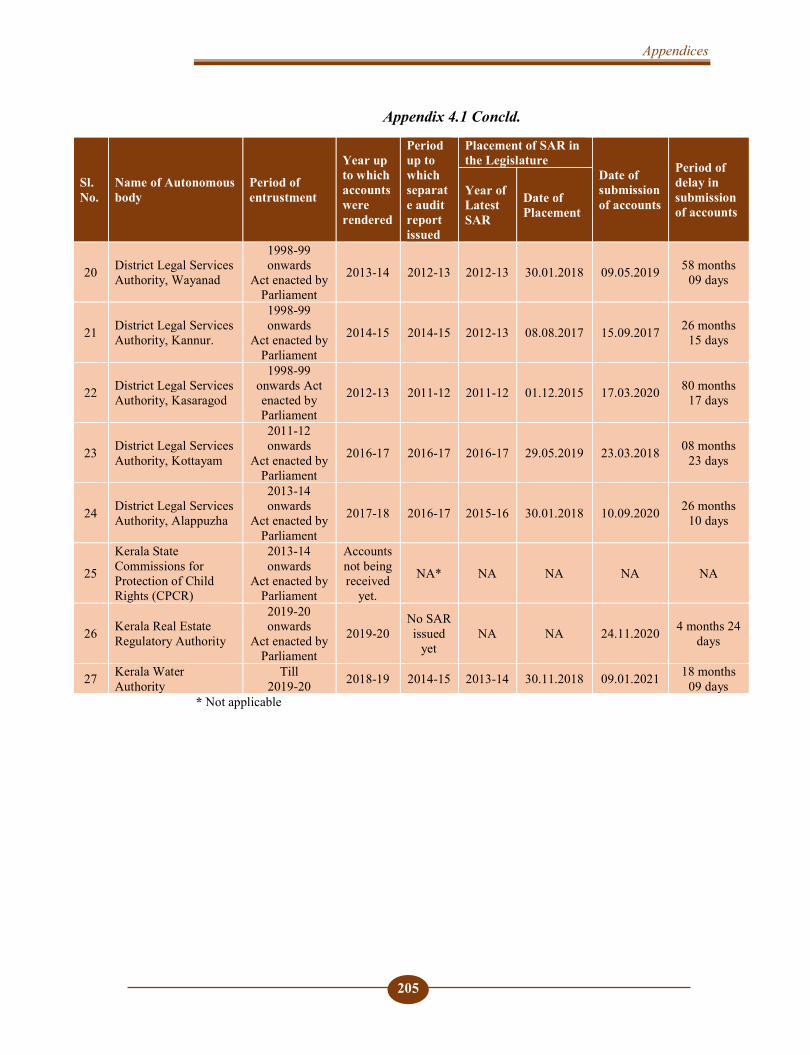
Appendices
205
Appendix 4.1 Concld.
Sl. No.
Name of Autonomous body
Period of entrustment
Year up to which accounts were rendered
Period up to which separate audit report issued
Placement of SAR in the Legislature
Date of submission of accounts
Period of delay in submission of accounts
Year of Latest SAR
Date of Placement
20 District Legal Services Authority, Wayanad
1998-99 onwards
Act enacted by Parliament
2013-14 2012-13 2012-13 30.01.2018 09.05.2019 58 months 09 days
21 District Legal Services Authority, Kannur.
1998-99 onwards
Act enacted by Parliament
2014-15 2014-15 2012-13 08.08.2017 15.09.2017 26 months 15 days
22 District Legal Services Authority, Kasaragod
1998-99 onwards Act enacted by Parliament
2012-13 2011-12 2011-12 01.12.2015 17.03.2020 80 months 17 days
23 District Legal Services Authority, Kottayam
2011-12 onwards
Act enacted by Parliament
2016-17 2016-17 2016-17 29.05.2019 23.03.2018 08 months 23 days
24 District Legal Services Authority, Alappuzha
2013-14 onwards
Act enacted by Parliament
2017-18 2016-17 2015-16 30.01.2018 10.09.2020 26 months 10 days
25
Kerala State Commissions for Protection of Child Rights (CPCR)
2013-14 onwards
Act enacted by Parliament
Accounts not being received
yet.
NA* NA NA NA NA
26 Kerala Real Estate Regulatory Authority
2019-20 onwards
Act enacted by Parliament
2019-20 No SAR issued
yet NA NA 24.11.2020 4 months 24
days
27 Kerala Water Authority
Till 2019-20 2018-19 2014-15 2013-14 30.11.2018 09.01.2021 18 months
09 days * Not applicable
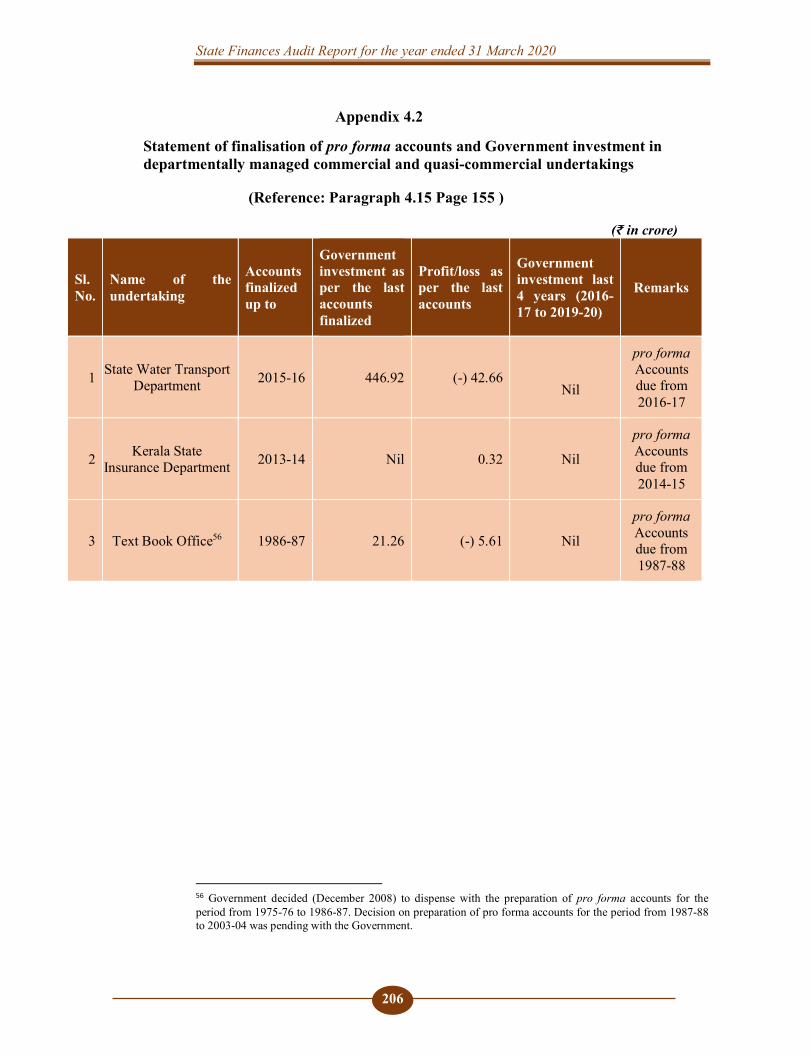
State Finances Audit Report for the year ended 31 March 2020
206
Appendix 4.2
Statement of finalisation of pro forma accounts and Government investment in departmentally managed commercial and quasi-commercial undertakings
(Reference: Paragraph 4.15 Page 155 )
(₹ in crore)
Sl. No.
Name of the undertaking
Accounts finalized up to
Government investment as per the last accounts finalized
Profit/loss as per the last accounts
Government investment last 4 years (2016-17 to 2019-20)
Remarks
1 State Water Transport Department 2015-16 446.92 (-) 42.66
Nil
pro forma Accounts due from 2016-17
2 Kerala State Insurance Department 2013-14 Nil 0.32 Nil
pro forma Accounts due from 2014-15
3 Text Book Office56 1986-87 21.26 (-) 5.61 Nil
pro forma Accounts due from 1987-88
56 Government decided (December 2008) to dispense with the preparation of pro forma accounts for the period from 1975-76 to 1986-87. Decision on preparation of pro forma accounts for the period from 1987-88 to 2003-04 was pending with the Government.
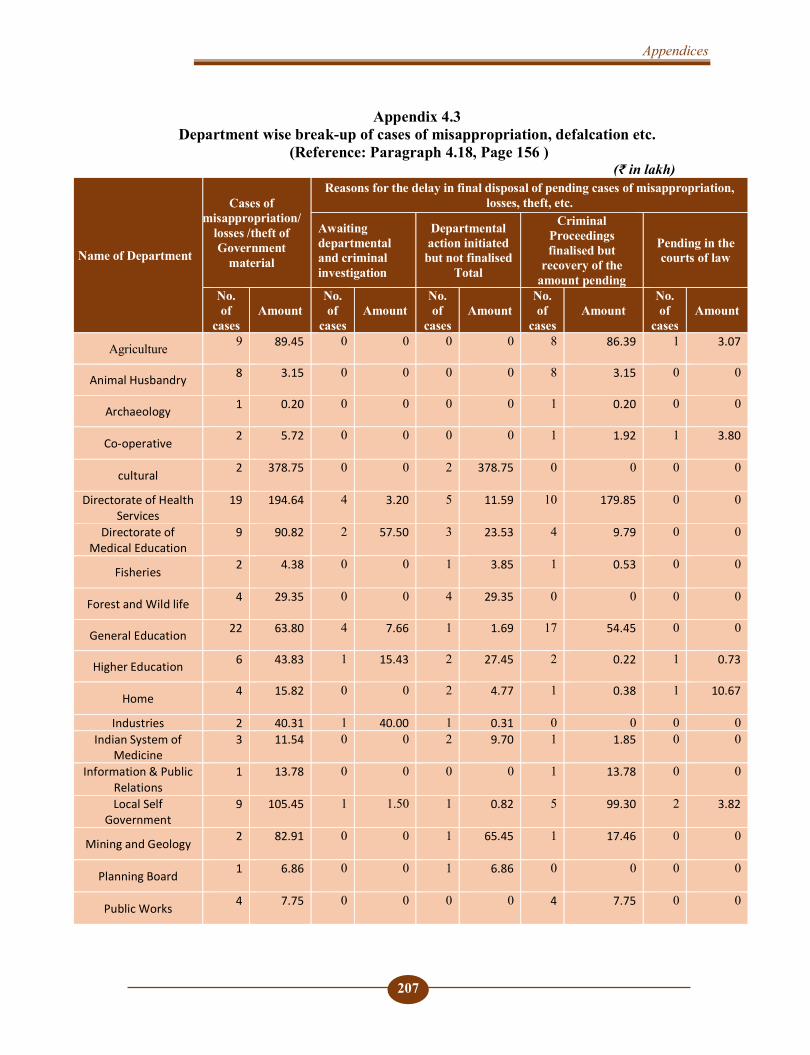
Appendices
207
Appendix 4.3 Department wise break-up of cases of misappropriation, defalcation etc.
(Reference: Paragraph 4.18, Page 156 ) (₹ in lakh)
Name of Department
Cases of misappropriation/
losses /theft of Government
material
Reasons for the delay in final disposal of pending cases of misappropriation, losses, theft, etc.
Awaiting departmental and criminal investigation
Departmental action initiated but not finalised
Total
Criminal Proceedings finalised but
recovery of the amount pending
Pending in the courts of law
No. of
cases Amount
No. of
cases Amount
No. of
cases Amount
No. of
cases Amount
No. of
cases Amount
Agriculture 9 89.45
0 0 0 0 8 86.39
1 3.07
Animal Husbandry 8 3.15 0 0 0 0 8 3.15
0 0
Archaeology 1 0.20 0 0 0 0 1 0.20
0 0
Co-operative 2 5.72
0 0 0 0 1 1.92
1 3.80
cultural 2 378.75
0 0 2 378.75
0 0 0 0
Directorate of Health Services
19 194.64
4 3.20
5 11.59
10 179.85
0 0
Directorate of Medical Education
9 90.82
2 57.50
3 23.53
4 9.79
0 0
Fisheries 2 4.38
0 0 1 3.85 1 0.53
0 0
Forest and Wild life 4 29.35 0 0 4 29.35
0 0 0 0
General Education 22 63.80 4 7.66 1 1.69
17 54.45
0 0
Higher Education 6 43.83 1 15.43
2 27.45
2 0.22
1 0.73
Home 4 15.82
0 0 2 4.77 1 0.38
1 10.67
Industries 2 40.31 1 40.00 1 0.31 0 0 0 0 Indian System of
Medicine 3 11.54 0 0 2 9.70 1 1.85 0 0
Information & Public Relations
1 13.78 0 0 0 0 1 13.78
0 0
Local Self Government
9 105.45
1 1.50 1 0.82
5 99.30
2 3.82
Mining and Geology 2 82.91
0 0 1 65.45
1 17.46
0 0
Planning Board 1 6.86
0 0 1 6.86
0 0 0 0
Public Works 4 7.75
0 0 0 0 4 7.75
0 0
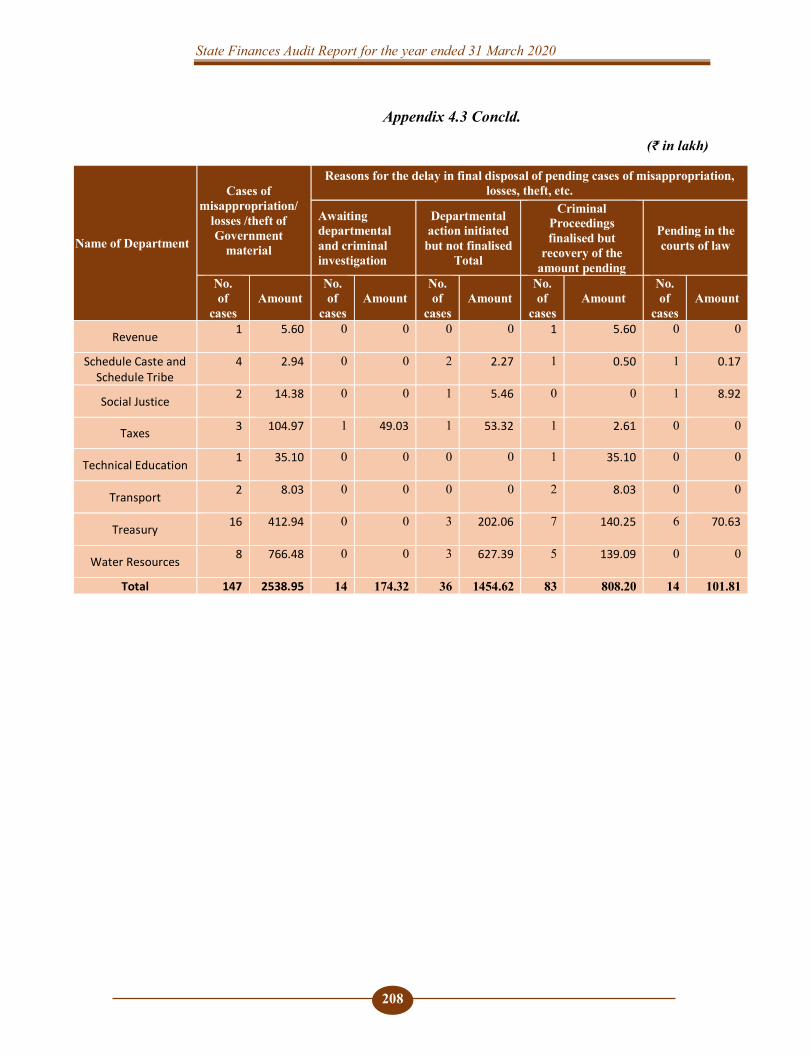
State Finances Audit Report for the year ended 31 March 2020
208
Appendix 4.3 Concld.
(₹ in lakh)
Name of Department
Cases of misappropriation/
losses /theft of Government
material
Reasons for the delay in final disposal of pending cases of misappropriation, losses, theft, etc.
Awaiting departmental and criminal investigation
Departmental action initiated but not finalised
Total
Criminal Proceedings finalised but
recovery of the amount pending
Pending in the courts of law
No. of
cases Amount
No. of
cases Amount
No. of
cases Amount
No. of
cases Amount
No. of
cases Amount
Revenue 1 5.60
0 0 0 0 1 5.60 0 0
Schedule Caste and Schedule Tribe
4 2.94 0 0 2 2.27
1 0.50 1 0.17
Social Justice 2 14.38
0 0 1 5.46
0 0 1 8.92
Taxes 3 104.97 1 49.03
1 53.32
1 2.61
0 0
Technical Education 1 35.10
0 0 0 0 1 35.10
0 0
Transport 2 8.03
0 0 0 0 2 8.03
0 0
Treasury 16 412.94
0 0 3 202.06
7 140.25
6 70.63
Water Resources 8 766.48
0 0 3 627.39
5 139.09
0 0
Total 147 2538.95 14 174.32 36 1454.62 83 808.20 14 101.81

© COMPTROLLER ANDAUDITOR GENERAL OF INDIA
https://cag.gov.in
Prin
ted
at S
t. J
osep
h’s
Pres
s, T
vm
Governm
ent of Kerala - R
eport No. 5 of the year 2021
Government of KeralaReport No. 5 of the year 2021
STATE FINANCES AUDIT REPORT OF
THE COMPTROLLERAND AUDITOR GENERAL OF INDIA
for the year ended March 2020
https://cag.gov.in/ag2/kerala/en