for the year ended 31 March 2019 - CAG
164
-
Upload
khangminh22 -
Category
Documents
-
view
3 -
download
0
Transcript of for the year ended 31 March 2019 - CAG

State Finances Audit Report of the
Comptroller and Auditor General of India
for the year ended 31 March 2019
Government of Jharkhand
Report No. 3 for the year 2020

Contents
i
Reference
Paragraph Page
No.
Preface - vii
Executive Summary - ix
CHAPTER 1: FINANCES OF THE STATE GOVERNMENT
Gross State Domestic Product (GSDP) 1.1 1
Summary of fiscal transactions in 2018-19 1.1.1 1
Review of the fiscal situation 1.1.2 4
Budget estimates and actuals 1.1.3 7
Resources of the State 1.2 8
Revenue Receipts 1.3 10
State’s Own Resources 1.3.1 11
Grants-in-aid from Government of India 1.3.2 13
Central Tax Transfers 1.3.3 13
Revenue arrears 1.3.4 14
Irregular deposit under Minor Head -913 1.3.5 14
Capital Receipts 1.4 15
Recoveries from loans and advances 1.4.1 15
Debt receipts from internal sources 1.4.2 16
Public accounts receipts 1.5 16
Application of resources 1.6 16
Capital Expenditure (CE) 1.6.1 17
Revenue Expenditure (RE) 1.6.2 17
Committed expenditure 1.6.3 17
Major programmes 1.6.4 19
Financial assistance 1.6.5 20
Quality of expenditure 1.7 22
Adequacy of public expenditure 1.7.1 22
Efficiency of expenditure use 1.7.2 23
Expenditure on selected Social and Economic Services 1.7.3 23
Financial analysis of Government expenditure and investments 1.8 24
Financial results of irrigation projects 1.8.1 24
Incomplete projects 1.8.2 24
Investment and returns 1.8.3 25
Loans and advances by State Government 1.8.4 26
Cash Balances and investment of Cash Balances 1.8.5 27
Assets and Liabilities 1.9 27
Growth and composition of Assets and Liabilities 1.9.1 27
Fiscal Liabilities 1.9.2 28
Sinking Fund 1.9.3 29
Contents
ii
Reference
Paragraph Page
No.
State Disaster Response Fund (SDRF) 1.9.4 29
Status of Guarantees – Contingent liabilities 1.9.5 30
1.10 Debt Management
Debt Profile 1.10.1 30
Debt Sustainability 1.10.2 31
Net availability of borrowed funds 1.10.3 33
CHAPTER 2: FINANCIAL MANAGEMENT AND BUDGETARY CONTROL
Introduction 2.1 34
Summary of Appropriation Accounts 2.2 34
Financial Accountability and Budget Management 2.3 36
Appropriations against allocative priorities 2.3.1 36
Anticipated savings not surrendered 2.3.2 38
Persistent savings 2.3.3 38
Advances from Contingency Fund 2.3.4 40
Excess over provisions in previous years requiring regularisation 2.3.5 41
Avoidable/excessive Supplementary Provision 2.3.6 41
Excessive/Insufficient re-appropriation of funds 2.3.7 42
Substantial surrender of funds 2.3.8 42
Rush of expenditure 2.4 42
Departmental figures not reconciled 2.5 42
Audit of budgetary process of Grant No. 26 – Labour,
Employment and Training Department 2.6 43
Introduction 2.6.1 43
Persistent savings 2.6.2 44
Delay in submission of Budget Estimates 2.6.3 44
Budget Estimates prepared without obtaining requirements from
Disbursing Officers (DOs).
2.6.4 44
Non-Preparation of Outcome and Gender Budget 2.6.5 45
Avoidable Supplementary provision 2.6.6 45
Non-utilisation of the entire budget provision 2.6.7 45
Surrender of fund on the last day of the financial year 2.6.8 47
Rush of expenditure 2.6.9 47
Non-reconciliation of departmental expenditure figures 2.6.10 48
Parking of fund in Deposit Accounts 2.6.11 48
Incomplete insurance coverage to Jharkhand Un-organised
Workers Social Security Scheme (JUWSSS) 2.6.12 49
Non- interlinking of Employment Exchange with National
Carrier Service (NCS) portals 2.6.13 49
Distribution of Blankets/Clothes to unknown/unidentified
beneficiaries 2.6.14 49
Non-maintenance of Cash Book and Bill book 2.6.15 50
Contents
iii
Reference
Paragraph Page
No.
Audit of budgetary process for Grant No. 18 – Food, Public
Distribution and Consumer Affairs Department 2.7 51
Introduction 2.7.1 51
Budgetary position of the Department during last four years 2.7.2 51
Provision for preparation of Budget Estimate not followed 2.7.3 52
Avoidable Supplementary provision 2.7.4 52
Surrender on the last day of the financial year 2.7.5 52
Rush of expenditure 2.7.6 52
Non-reconciliation of departmental expenditures 2.7.7 53
Surrender of entire budget provision 2.7.8 53
Non-submission of Outcome and Gender Budget 2.7.9 53
Non utilisation of Consumer Welfare Fund 2.7.10 53
Implementation of Schemes announced in the budget 2.7.11 54
CHAPTER 3: FINANCIAL REPORTING
Outstanding Utilisation Certificates against grants 3.1 55
Inflated Utilisation Certificates sent to the Government 3.1.1 56
Submission of accounts and audit of Authorities and grantee
institutions 3.2 56
Audit under Sections 14 and 15 of CAG’s (DPC) Act, 1971 3.2.1 56
Delay in submission of accounts of Public Sector Undertakings
(PSUs) 3.2.2 57
Dividend not declared by PSUs 3.2.3 58
Audit of funds drawn on Abstract Contingent (AC) bills 3.3 58
Delay in submission of DC bills 3.3.1 60
Reporting of cases on misappropriation, losses etc. 3.4 60
Funds drawn and kept in Personal Ledger (PL) Accounts 3.5 61
Labour Cess 3.6 62
Booking under minor head “800” 3.7 63
Important factors affecting accuracy of accounts 3.8 63
Impact on Revenue surplus and Fiscal deficit 3.9 64
Follow up on Audit Report on State Finances 3.10 64
Apportionment of balances on reorganisation of the State 3.11 65
Contents
iv
Appendix No. Description Page
No.
Appendix 1.1
Part-A Profile of Jharkhand 67
Appendix 1.1
Part-B Structure and Form of Government Accounts 68
Appendix 1.1
Part-C Layout of Finance Accounts 68
Appendix 1.2 Abstract of Receipts and Disbursements for the year
2018-19 69
Appendix 1.3 Time series data on the State Government finances 72
Appendix 1.4
Part-A
Details of functions of ULBs as per the 74th Constitutional
Amendment Act (Schedule XII) 75
Appendix 1.4
Part-B
Details of functions of PRIs as per the 73rd Constitutional
Amendment Act (Schedule XII) 76
Appendix 1.5 Summarised financial position of the Government of
Jharkhand as on 31 March 2019 77
Appendix 2.1
Statement of various grants/appropriations where savings
exceeded ` 10 crore in each case and also by 20 per cent or
more of the total provision
79
Appendix 2.2 Sub-head wise details where substantial savings (` 20 crore
and above) occurred during the year 2018-19 81
Appendix 2.3 Details of savings of ` one crore and above not surrendered 87
Appendix 2.4 Cases of surrender of funds in excess of ` 20 crore in March
2019 89
Appendix 2.5 Excess over provisions of previous years requiring
regularisation 93
Appendix 2.6 Cases where supplementary provision (` one crore or more in
each case) proved unnecessary 94
Appendix 2.7 Excess/insufficient re-appropriation of funds 96
Appendix 2.8 Results of review of 100 per cent Substantial Surrenders made
during the year 97
Appendix 2.9 Rush of expenditure at the end of the year 102
Appendix 2.10 List of Controlling Officers where expenditure remained un-
reconciled during 2018-19 104
Appendix 2.11 Avoidable Supplementary Provision 105
Appendix 2.12 Non-utilisation of entire budget provision 106
Appendix 2.13 Surrender of fund on the last day of the financial year 107
Appendix 2.14 Rush of expenditure 108
Appendix 2.15 Non-reconciliation of departmental expenditure figures 109
Appendix 2.16 Incomplete insurance cover to Jharkhand Un-organised
Workers Social Security Scheme 110
Appendix 2.17 Distribution of Blankets/Clothes to unknown/unidentified
beneficiaries 111
Appendix 2.18 Avoidable Supplementary Provision for the year 2018-19 112
Appendix 2.19 Details showing provision of excess fund 113
Appendix 2.20 Unit-wise amount surrender report on the last date of the
Financial Year 114
Appendix 2.21 Sub-head wise expenditure in the month of March 2019 115
Appendix 2.22 DDO-wise and scheme-wise rush of expenditure in the month
of March 2019 116
Contents
v
Appendix No. Description Page
No.
Appendix 2.23 Un-reconciled amount of DDO's Expenditure 117
Appendix 2.24 Surrender of whole budget in different heads 118
Appendix 2.25 Surrender of whole Budget Provision 119
Appendix 3.1 Utilisation certificates outstanding as on 31 March, 2019 121
Appendix 3.2 List of auditable units identified u/s 14 & 15 of CAG’s DPC
Act 122
Appendix 3.3 Details of Head-wise outstanding DC Bills 124
Appendix 3.4 District-wise outstanding DC Bills 125
Appendix 3.5 Details showing delay in submission of DC Bills by DDOs 126
Appendix 3.6 Delayed submission of DC Bills (selected districts under Grant
26) 127
Appendix 3.7 Fund kept in PL Accounts for more than three years 128
Appendix 3.8 Operation of Minor Head ‘800 – Other Expenditure’ (10 per
cent and above ) 129
Appendix 3.9 Operation of Minor Head ‘800 – Other Receipts’ (30 per cent
and above ) 130
Appendix 4.1 Glossary of terms, basis of calculations and acronyms used in
the Report 131

vii
PREFACE
This Report has been prepared for submission to the Governor of Jharkhand under
Article 151 of the Constitution.
This Report on the finances of the Government of Jharkhand (GoJ) intends to
assess the financial performance of the State during 2018-19 and to provide the
State Legislature with inputs based on audit analysis of financial data. The Report
attempts to analyse the financial performance against the targets envisaged by the
Jharkhand Fiscal Responsibility and Budget Management Act, 2007, the
Fourteenth Finance Commission (FFC) Report and the Budget Estimates of
2018-19. The Report is structured in three Chapters.
Chapter-1 is based on the audit of the Finance Accounts and makes an
assessment of the Jharkhand Government’s fiscal position as on 31 March 2019.
It provides an insight into trends in expenditure on interest payments, salaries and
wages, pensions, subsidies, repayment of debt and borrowing patterns.
Chapter-2 is based on the audit of the Appropriation Accounts and gives grant
wise description of appropriations and the manner in which the allocated
resources were managed by the service delivery departments.
Chapter-3 is an inventory of the Jharkhand Government’s compliance to various
reporting requirements and financial rules.
The Reports containing the findings of Performance Audits and audit of
transactions in various Departments and observations arising out of audit of
Statutory Corporations, Boards and Government Companies and the Report
containing observations on Revenue Receipts are presented separately.
The audit has been conducted in conformity with the Auditing Standards issued
by the Comptroller and Auditor General of India.


ix
Executive Summary
Fiscal situation of the State
Revenue receipts, revenue expenditure and capital expenditure, as a
percentage of Gross State Domestic Product (GSDP), has shown a decreasing
trend from 2016-17 onwards. Further, capital expenditure, as a percentage of
GSDP, has decreased significantly during 2018-19.
Paragraph 1.1.1
The State has not achieved revenue surplus and Fiscal Deficit to GSDP ratio
as targeted in the MTFP statement under FRBM Act. Moreover, normative
projection of FFC in respect of outstanding debt to GSDP ratio for the year
2018-19 was also not achieved.
The Fiscal Deficit (` 6,629 crore) was 2.16 per cent of GSDP against
recommended ceiling of 3.25 per cent by the FFC and 2.61 per cent targeted
under MTFP.
Paragraph 1.1.2
Primary Deficit of the State improved significantly from ` 7,271 crore in
2017-18 to ` 1,777 crore during 2018-19.
Paragraph 1.1.2.2
Resources mobilisation and application
Revenue receipts (` 56,152 crore) increased by ` 3,396 crore (6.44 per cent)
over the previous year (` 52,756 crore) which was lower than the budget
estimates (` 69,578 crore).
During 2018-19, Revenue expenditure (` 50,631 crore) decreased by
` 321 crore (0.6 per cent) over 2017-18 (` 50,952 crore). The budget estimates
of Revenue expenditure for the current year was ` 61,523 crore.
Capital expenditure (` 10,712 crore) decreased by ` 1,241 crore
(10.38 per cent) over 2017-18 (` 11,953 crore). The budget estimates of
Capital expenditure for the current year was ` 13,068 crore.
Recommendation: The Finance Department should rationalise the budget
preparation exercise, so that the persisting gap between the budget estimate
and actuals is bridged.
Paragraph 1.1.3, 1.2 & 1.6
Adequacy of Public Expenditure
The ratio of development expenditure, economic service expenditure and
capital expenditure to aggregate expenditure (AE) was significantly higher
than the average for the General Category States (GCS) during 2018-19.
However, Social Sector Expenditure along with expenditure on Education was
less than the average of GCS during the year.
Paragraph 1.7.1
Financial results of irrigation projects
The Thirteenth and Fourteenth Finance Commissions had prescribed cost
recovery rate on irrigation projects for assessing the commercial viability of
State Finances Audit Report for the year ended 31 March 2019
x
these projects. However, no irrigation scheme was declared as commercial by
the Government of Jharkhand.
During 2018-19, total capital outlay of ` 1,759.45 crore was provided to 11
irrigation projects and ` 1,480.90 crore was spent on working expenses and
maintenance charges on 23 projects. During 2018-19, ` 38.04 crore was
received as miscellaneous revenue from these projects.
Recommendation:
The State Government may initiate measures to declare irrigation projects as
commercial for cost recovery as per Finance Commissions recommendations.
Paragraph 1.8.1
Return on Investment
During 2014-19, the State Government incurred a notional loss of
` 109.53 crore on account of difference between the Government’s borrowing
cost and the return on investment on working PSUs.
Loans to Jharkhand State Electricity Board (JSEB) amounting to ` 7,222 crore
continue to be depicted in the Government accounts as receivable from the
Board, even though the Board was unbundled in January 2014 into separate
companies. Thus, the assets of the State was inflated to the extent of
` 7,222 crore.
Recommendation: The State Government should rationalise its investments
and loans advanced to various entities such that the return on investment and
loans at least matches the Government borrowing costs.
Paragraph 1.8.3 & 1.8.4
State Disaster Response Fund (SDRF)
The SDRF had a closing balance of ` 1,930.09 crore as on 31 March 2019. As
required under SDRF guidelines 2010, the State Government had invested
(2012-13) ` 400 crore from the balances under the fund.
During 2018-19, the State Government transferred the contribution from GoI
along with their share into public account with a delay of 11 days (` 210.50
crore) and 184 days (` 31.58 crore) after receipt of Central share, for which
the State Government was liable to pay an interest of ` 1.46 crore, which was
not paid.
Further, as per the guidelines, the Government was required to pay interest on
the uninvested balances at the rate of interest (8.25 per cent) payable on
overdrafts, which is to be added to the corpus of the fund itself. However, GoJ
had not paid any interest to SDRF since its creation, which works out to
` 535.83 crore at the applicable rates of interest for the period 2010-19. Of
this, unpaid interest for 2018-19 alone amounted to ` 94.96 crore. Such unpaid
interest since the operation of the Fund represents the unaccounted liabilities
of the State.
Recommendation: The State should ensure timely transfer of contribution
received from GoI along with its share into public account and also invest the
balances lying under the fund as per the SDRF guidelines.
Paragraph 1.9.4
Executive Summary
xi
Savings
Out of total saving of ` 20,224 crore, savings of ` 15,941 crore (79 per cent)
occurred in 29 cases relating to 27 grants. In these cases, savings exceeded
` 100 crore and was 20 per cent or more of the grant.
In 11 cases (10 departments), there were persistent savings of 10 per cent or
more of the total grants, during the last five years
Recommendations: Finance Department should prepare budget based on the
actual requirements from field units and ensure optimum utilisation of the
amount allocated. All anticipated savings should be surrendered on time so
that the funds can be utilised for other development purposes
Paragraph 2.3.1 &2.3.3
Advances from Contingency Fund
Advances amounting ` 69.72 crore were withdrawn on 40 occasions from the
Contingency Fund during 2018-19 out of which, an amount of ` 15.34 crore,
drawn on 13 occasions, was utilised for meeting expenditure which were
neither unforeseen nor of emergent nature.
Thus, the Contingency Fund was used by the State as an imprest account for
meeting non-contingent expenditure.
Recommendation: The State Government should ensure that no advances are
drawn from the Contingency Fund except to meet expenditure of emergent and
unforeseen nature.
Paragraph 2.3.4
Excess over provisions requiring regularisation
Excess expenditure of ` 3,015.37 crore over provisions for the years 2001-02
to 2017-18 was yet to be regularised by the State Legislature as required under
Article 205 of the Constitution of India.
Recommendation: The Finance Department should take immediate steps to
regularise the excess expenditure of ` 3,015.37 crore.
Paragraph 2.3.5
Rush of Expenditure
In 21 grants, expenditure of ` 6,342.48 crore (62.48 per cent) was incurred in
the last quarter of the year against the total expenditure of ` 10,151.23 crore.
Out of this, an expenditure of ` 3,691.90 crore (36.37 per cent of the total
expenditure) was incurred in the month of March 2019. Further, out of total
drawal in March, ` 35.15 crore was drawn through AC bills.
Recommendation: The State Government should ensure adherence of the
provisions of the Budget Manual by the Drawing and Disbursing Officers to
control rush of expenditure during the fag end of the financial year.
Paragraph 2.4
Outstanding Utilisation Certificates against grants
Utilisation certificates (UCs) of ` 53,379 crore against Grants-in-aid bills
drawn upto 2017-18 by different departments were outstanding as on
31 March 2019 which was indicative of failure of the departmental officers to
State Finances Audit Report for the year ended 31 March 2019
xii
comply with the rules and procedures to ensure timely utilization of the grants
for the intended purpose.
Recommendation: The Finance Department should prescribe a time frame
within which administrative departments releasing grants, collect UCs
pending for more than the time stipulated in the grant orders and also ensure
that till such time, administrative departments release no further grants to
defaulting grantees. The Government may initiate appropriate action against
the officers who defaulted in submission of UCs in time.
Paragraph 3.1
Delay in submission of Accounts of PSUs
The accounts of 24 working PSUs (69 accounts) and 03 non-working PSUs/
Corporations (three accounts) are in arrears ranging from one to nine years.
Further, it was noticed that the State Government had invested ` 41 crore in
share capital during 2018-19 in six PSUs of which three PSUs have not
finalised their accounts.
Recommendation: The Finance Department should review the cases of all
PSUs that are in arrears of accounts, ensure that the accounts are made
current within a reasonable period, and stop financial support in all cases
where accounts continue to be in arrears.
Paragraph 3.2.2
Outstanding Detailed Contingent bills
At the end of March 2019, Detailed Contingent bills for an amount of
` 5,479 crore were outstanding against ` 20,679 crore drawn on AC bills
during 2001-2019.
Further, out of ` 1,061 crore drawn on AC bill in 2018-19, ` 62 crore was
drawn in March 2019.
Audit of the funds drawn on AC bills during the period 2001-19 by the Food,
Public Distribution and Consumer Affairs Department and Labour,
Employment and Training Department revealed that ` 524 crore was drawn
through 1,410 AC bills during the period against which 827 DC bills
amounting to ` 208 crore were outstanding as on July 2019.
Recommendation: The Finance Department should ensure that all controlling
officers adjust in a time bound manner, all AC bills pending beyond the
prescribed period, and also ensure that AC bills are not drawn merely to
avoid lapse of budget.
Paragraph 3.3
Personal Ledger Accounts (PLAs)
As per Rule 174 of Jharkhand Treasury Code money should not be withdrawn
from Treasury unless it is required for immediate payment.
During 2018-19, ` 9,875.32 crore was added in the opening balance of
` 13,202.66 crore leading to accumulation of ` 23,077.98 crore in PLAs.
Further, ` 8,730.74 crore was spent during the year leaving a balance of
` 14,347.24 crore at the end of 2018-19 in the PLAs.
Recommendation: The Finance Department should review all PL accounts
and ensure that all amounts unnecessarily lying in these PL accounts are
Executive Summary
xiii
immediately remitted to the Consolidated Fund. Further, the Finance
Department is required to reiterate the instructions contained in the financial
rules and ensure that appropriate action is taken against departmental officers
who fail to follow the rules.
Paragraph 3.5
Labour Cess
As per the Finance Accounts, ` 473.48 crore was collected as cess from
contractors executing Government projects upto 2018-19. The cess collected
has not been transferred to the Labour Welfare Board (March 2019) inflating
the Revenue Surplus and understating the Fiscal Deficit of the State during the
relevant years and represent the unaccounted liabilities of the State.
Recommendation: The Finance Department should ensure transfer of Labour
Cess to the Labour Welfare Board as early as possible.
Paragraph 3.6
Booking under minor head ‘800’ Departments of GoJ routinely operated minor head 800 which is to be
operated only in rare circumstances. During 2018-19, ` 832.91 crore under
receipts and ` 1,161.38 crore under expenditure was booked under minor
heads 800 resulting in opaqueness of transactions.
Recommendation: The Finance Department should, in consultation with the
Principal Accountant General (A&E), conduct a comprehensive review of all
items presently appearing under minor head 800 and ensure that all such
receipts and expenditure are in future booked under the appropriate head of
account.
Paragraph 3.7
Impact on Revenue surplus and Fiscal deficit
Incorrect accounting of expenditure and revenue resulted in overstatement of
revenue surplus and understatement of fiscal deficit by ` 953.92. The
outstanding liabilities of the State was also understated by ` 953.92 crore.
Paragraph 3.9
Apportionment of balances as on reorganisation of the State
Balances amounting to ` 7,443.90 crore under Public Accounts heads along
with balance under Capital Section ` 11,935.23 crore and Loans and Advances
` 6,583.36 crore remained to be apportioned between the successor States
Bihar and Jharkhand, almost two decades after the reorganisation of the
erstwhile State of Bihar with effect from November 2000.
Recommendation: The State Government may expedite the apportionment of
Public Accounts balances, Capital Section balances and Loans and Advances
balances between the two successor States.
Paragraph 3.11


CHAPTER 1
FINANCES OF THE STATE GOVERNMENT
1
This chapter provides an audit perspective on the finances of the State
Government during 2018-19 and analyses changes in major fiscal aggregates
relative to 2017-18 keeping in view the overall trends during the preceding
five years.
The analysis is based on details contained in the Finance Accounts of the
Government of Jharkhand (GoJ). The profile of the State is given in
Appendix 1.1-Part A.
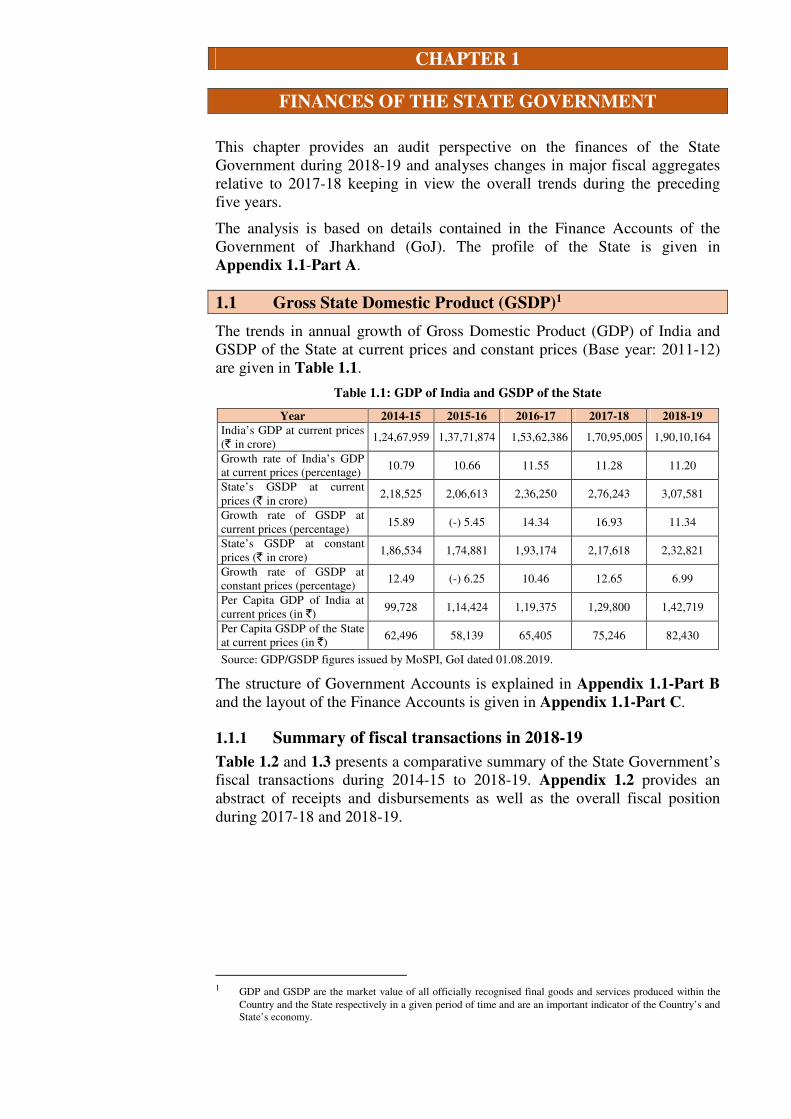
1.1 Gross State Domestic Product (GSDP)1
The trends in annual growth of Gross Domestic Product (GDP) of India and
GSDP of the State at current prices and constant prices (Base year: 2011-12)
are given in Table 1.1.
Table 1.1: GDP of India and GSDP of the State
Year 2014-15 2015-16 2016-17 2017-18 2018-19
India’s GDP at current prices
(` in crore) 1,24,67,959 1,37,71,874 1,53,62,386 1,70,95,005 1,90,10,164
Growth rate of India’s GDP
at current prices (percentage) 10.79 10.66 11.55 11.28 11.20
State’s GSDP at current
prices (` in crore) 2,18,525 2,06,613 2,36,250 2,76,243 3,07,581
Growth rate of GSDP at
current prices (percentage) 15.89 (-) 5.45 14.34 16.93 11.34
State’s GSDP at constant
prices (` in crore) 1,86,534 1,74,881 1,93,174 2,17,618 2,32,821
Growth rate of GSDP at
constant prices (percentage) 12.49 (-) 6.25 10.46 12.65 6.99
Per Capita GDP of India at
current prices (in `) 99,728 1,14,424 1,19,375 1,29,800 1,42,719
Per Capita GSDP of the State
at current prices (in `) 62,496 58,139 65,405 75,246 82,430
Source: GDP/GSDP figures issued by MoSPI, GoI dated 01.08.2019.
The structure of Government Accounts is explained in Appendix 1.1-Part B
and the layout of the Finance Accounts is given in Appendix 1.1-Part C.
1.1.1 Summary of fiscal transactions in 2018-19
Table 1.2 and 1.3 presents a comparative summary of the State Government’s
fiscal transactions during 2014-15 to 2018-19. Appendix 1.2 provides an
abstract of receipts and disbursements as well as the overall fiscal position
during 2017-18 and 2018-19.
1 GDP and GSDP are the market value of all officially recognised final goods and services produced within the
Country and the State respectively in a given period of time and are an important indicator of the Country’s and
State’s economy.

State Finances Audit Report for the year ended 31 March 2019
2
Table 1.2: Summary of receipts during 2014-19 (` in crore)
Particulars 2014-15 2015-16 2016-17 2017-18 2018-19
Percentage
increase/decrease in
2018-19 over 2017-18
Section-A: Revenue
Revenue Receipts (RR) 31,564.56 40,638.35 47,053.93 52,756.03 56,151.70 6.44
Own Tax revenue (OTR) 10,349.81 11,478.95 13,299.25 12,353.44 14,752.04 19.42
OTR/RR (per cent) 32.79 28.25 28.26 23.42 26.27 -
Non-Tax revenue (NTR) 4,335.06 5,853.01 5,351.42 7,846.67 8,257.98 5.24
NTR/RR (per cent) 13.73 14.40 11.37 14.87 14.71 -
Share of Union Taxes and Duties 9,487.01 15,968.75 19,141.92 21,143.63 23,906.16 13.07
Grants from Government of India 7,392.68 7,337.64 9,261.35 11,412.29 9,235.52 -19.07
Section –B: Capital and Others
Misc. Capital Receipts under capital
section 0.00 0.00 0.00 25.09 0.00 -100.00
Recoveries of Loans and Advances 33.06 31.06 38.46 42.41 47.57 12.17
Public Debt Receipts2 6,690.12 13,244.65 7,081.42 8,136.85 7,803.43 -4.10
Inter State Settlement (Net) 0.00 0.00 0.00 0.00 0.00
Transfers to Contingency Fund 0.00 0.00 0.00 0.00 0.00
Public Account Receipts3 20,189.17 29,036.72 22,051.8 27,833.30 25,409.79 -8.71
Opening Cash Balance 1,285.48 444.21 1,904.72 1,947.85 550.444 -71.74
Total 59,762.39 83,394.99 78,130.33 90,741.53 89,962.93 -0.86
Source: Finance Accounts of the Government of Jharkhand of the respective years
Table 1.3: Summary of disbursements during 2014-19 (` in crore)
Particulars 2014-15 2015-16 2016-17 2017-18 2018-19
Percentage
increase/decrease in
2018-19 over 2017-18
Section A: Revenue
Revenue Expenditure 31,794.90 36,552.83 45,089.04 50,952.07 50,630.73 -0.63
General Services 10,623.45 12,002.43 13,023.76 16,558.33 17,655.66 6.63
Social Services 11,915.34 14,843.81 18,557.37 19,574.97 18,786.03 -4.03
Economic Services 9,256.11 9,706.59 13,507.91 14,818.77 14,189.04 -4.25
Grants-in-aid and
Contributions
0.00 0.00 0.00 0.00 0.00
Section –B: Capital and Others
Capital Outlay 5,542.94 8,158.51 10,860.68 11,952.71 10,711.71 -10.38
Loans and Advances
disbursed
823.78 7,480.00 1,335.06 1,851.67 1,485.59
-19.77
Repayment of Public
Debt
1,879.88 2,245.93 2,077.88 2,949.50 3,060.1
3.75
Inter State Settlement
(Net)
0.00 0.00 0.00 0.00 0.00
-
Expenditure from
Contingency Fund
0.00 0.00 0.00 0.00 0.00
-
Public Account
Disbursements3
19,276.68 27,053.00 16,819.82 22,885.14 23,279.41
1.72
Closing Cash Balance 444.21 1,904.72 1,947.85 150.44 795.394 428.71
Total 59,762.39 83,394.99 78,130.33 90,741.53 89,962.93 -0.86
Source: Finance Accounts of the Government of Jharkhand of the respective years
2 Excluding net transactions under Ways and Means advances and overdraft 3 Figures do not include transactions under ‘Other Accounts’ i.e., Departmental Cash Balance,
Permanent Imprest and Cash Balance Investment in Public Accounts Receipts and Public Accounts
Disbursements 4 Opening and closing balance includes ` 400 crore invested from State Disaster Response Fund
during 2012-13 reported by the Finance Department, vide letter no. 554 dated 23.07.2019
Finances of the State Government
3
Increase/ decrease in fiscal operations during 2018-19 over the previous year
is given below:
• Revenue receipts increased by ` 3,395.67 crore (6.44 per cent) mainly
due to increase in receipts under SGST, State Excise and Land Revenue
and increase in Central Tax Transfers although grants-in-aid from GoI
decreased by ` 2,176.77 crore (19.01 per cent) as analysed in Para 1.3.
• Revenue expenditure decreased marginally by ` 321.34 crore
(0.63 per cent) while capital expenditure decreased by ` 1,241 crore
(10.38 per cent) mainly due to less expenditure on Transport, Irrigation
and Flood Control and Agriculture and Allied Activities. This is further
discussed in Para 1.6.1.
• Public debt receipts declined by ` 333.42 crore (4.10 per cent) while
repayment of public debt increased by ` 110.60 crore (3.75 per cent)
respectively.
• Public Account receipts decreased by ` 2,423.51 crore (8.71 per cent)
mainly due to decrease in deposits and advances while disbursements
increased by ` 394.27 crore (1.72 per cent).
• Cash balance increased by ` 644.95 crore (428.71 per cent) as discussed in
Para 1.8.5.
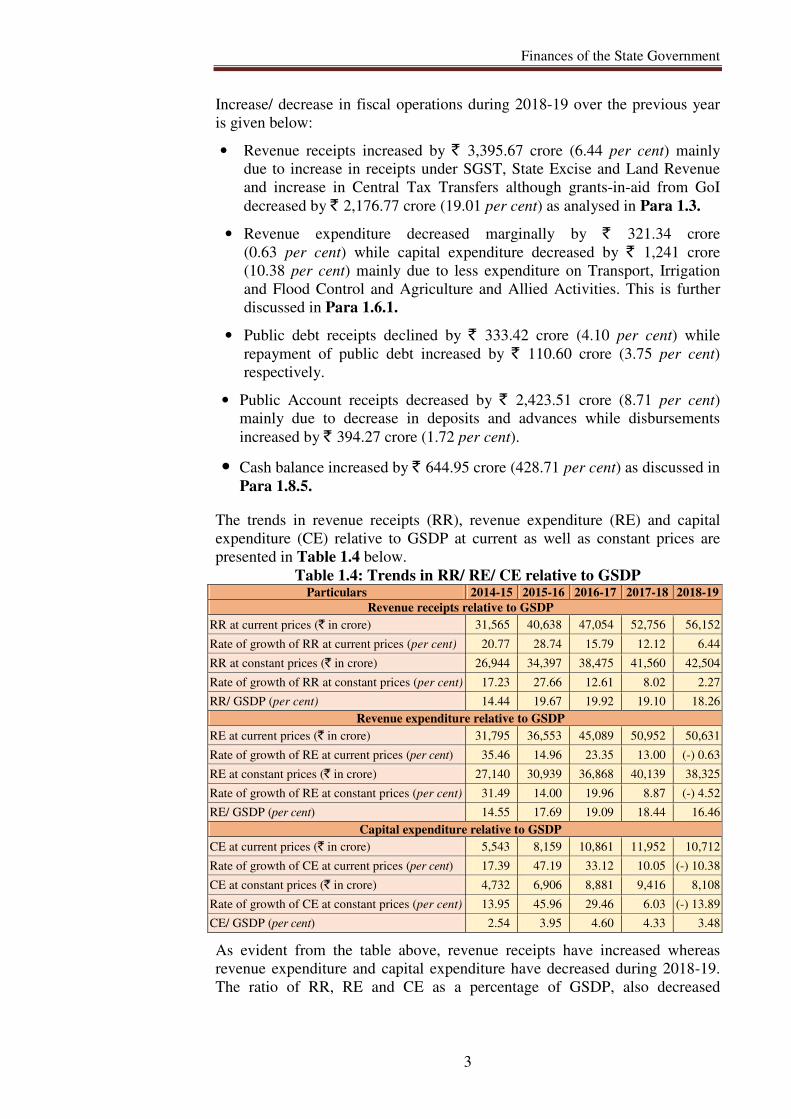
The trends in revenue receipts (RR), revenue expenditure (RE) and capital
expenditure (CE) relative to GSDP at current as well as constant prices are
presented in Table 1.4 below.
Table 1.4: Trends in RR/ RE/ CE relative to GSDP Particulars 2014-15 2015-16 2016-17 2017-18 2018-19
Revenue receipts relative to GSDP
RR at current prices (` in crore) 31,565 40,638 47,054 52,756 56,152
Rate of growth of RR at current prices (per cent) 20.77 28.74 15.79 12.12 6.44
RR at constant prices (` in crore) 26,944 34,397 38,475 41,560 42,504
Rate of growth of RR at constant prices (per cent) 17.23 27.66 12.61 8.02 2.27
RR/ GSDP (per cent) 14.44 19.67 19.92 19.10 18.26
Revenue expenditure relative to GSDP
RE at current prices (` in crore) 31,795 36,553 45,089 50,952 50,631
Rate of growth of RE at current prices (per cent) 35.46 14.96 23.35 13.00 (-) 0.63
RE at constant prices (` in crore) 27,140 30,939 36,868 40,139 38,325
Rate of growth of RE at constant prices (per cent) 31.49 14.00 19.96 8.87 (-) 4.52
RE/ GSDP (per cent) 14.55 17.69 19.09 18.44 16.46
Capital expenditure relative to GSDP
CE at current prices (` in crore) 5,543 8,159 10,861 11,952 10,712
Rate of growth of CE at current prices (per cent) 17.39 47.19 33.12 10.05 (-) 10.38
CE at constant prices (` in crore) 4,732 6,906 8,881 9,416 8,108
Rate of growth of CE at constant prices (per cent) 13.95 45.96 29.46 6.03 (-) 13.89
CE/ GSDP (per cent) 2.54 3.95 4.60 4.33 3.48
As evident from the table above, revenue receipts have increased whereas
revenue expenditure and capital expenditure have decreased during 2018-19.
The ratio of RR, RE and CE as a percentage of GSDP, also decreased
State Finances Audit Report for the year ended 31 March 2019
4
significantly during the current year. Further, there has been a steep and
consistent decrease in the rate of growth of capital formation since 2015-16.
1.1.2 Review of the fiscal situation
The performance of the State during 2018-19 under major variables provided
in the budget based on recommendations of the Fourteenth Finance
Commission (FFC) and targeted in the Medium Term Fiscal Policy (MTFP)
Statement placed in the legislature under Fiscal Responsibility and Budget
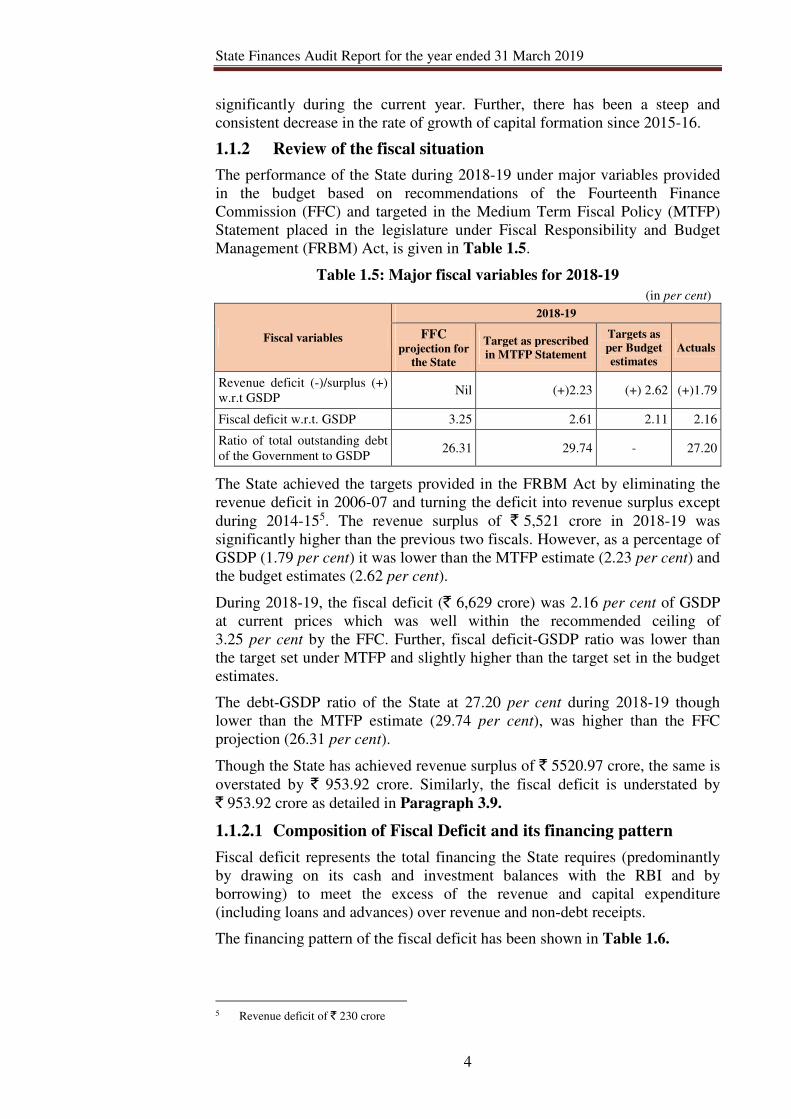
Management (FRBM) Act, is given in Table 1.5.
Table 1.5: Major fiscal variables for 2018-19
(in per cent)
Fiscal variables
2018-19
FFC projection for
the State
Target as prescribed
in MTFP Statement
Targets as
per Budget
estimates
Actuals
Revenue deficit (-)/surplus (+)
w.r.t GSDP Nil (+)2.23 (+) 2.62 (+)1.79
Fiscal deficit w.r.t. GSDP 3.25 2.61 2.11 2.16
Ratio of total outstanding debt
of the Government to GSDP 26.31 29.74 - 27.20
The State achieved the targets provided in the FRBM Act by eliminating the
revenue deficit in 2006-07 and turning the deficit into revenue surplus except
during 2014-155. The revenue surplus of ` 5,521 crore in 2018-19 was
significantly higher than the previous two fiscals. However, as a percentage of
GSDP (1.79 per cent) it was lower than the MTFP estimate (2.23 per cent) and
the budget estimates (2.62 per cent).
During 2018-19, the fiscal deficit (` 6,629 crore) was 2.16 per cent of GSDP
at current prices which was well within the recommended ceiling of
3.25 per cent by the FFC. Further, fiscal deficit-GSDP ratio was lower than
the target set under MTFP and slightly higher than the target set in the budget
estimates.
The debt-GSDP ratio of the State at 27.20 per cent during 2018-19 though
lower than the MTFP estimate (29.74 per cent), was higher than the FFC
projection (26.31 per cent).
Though the State has achieved revenue surplus of ` 5520.97 crore, the same is
overstated by ` 953.92 crore. Similarly, the fiscal deficit is understated by
` 953.92 crore as detailed in Paragraph 3.9.
1.1.2.1 Composition of Fiscal Deficit and its financing pattern
Fiscal deficit represents the total financing the State requires (predominantly
by drawing on its cash and investment balances with the RBI and by
borrowing) to meet the excess of the revenue and capital expenditure
(including loans and advances) over revenue and non-debt receipts.
The financing pattern of the fiscal deficit has been shown in Table 1.6.
5 Revenue deficit of ` 230 crore
Finances of the State Government
5
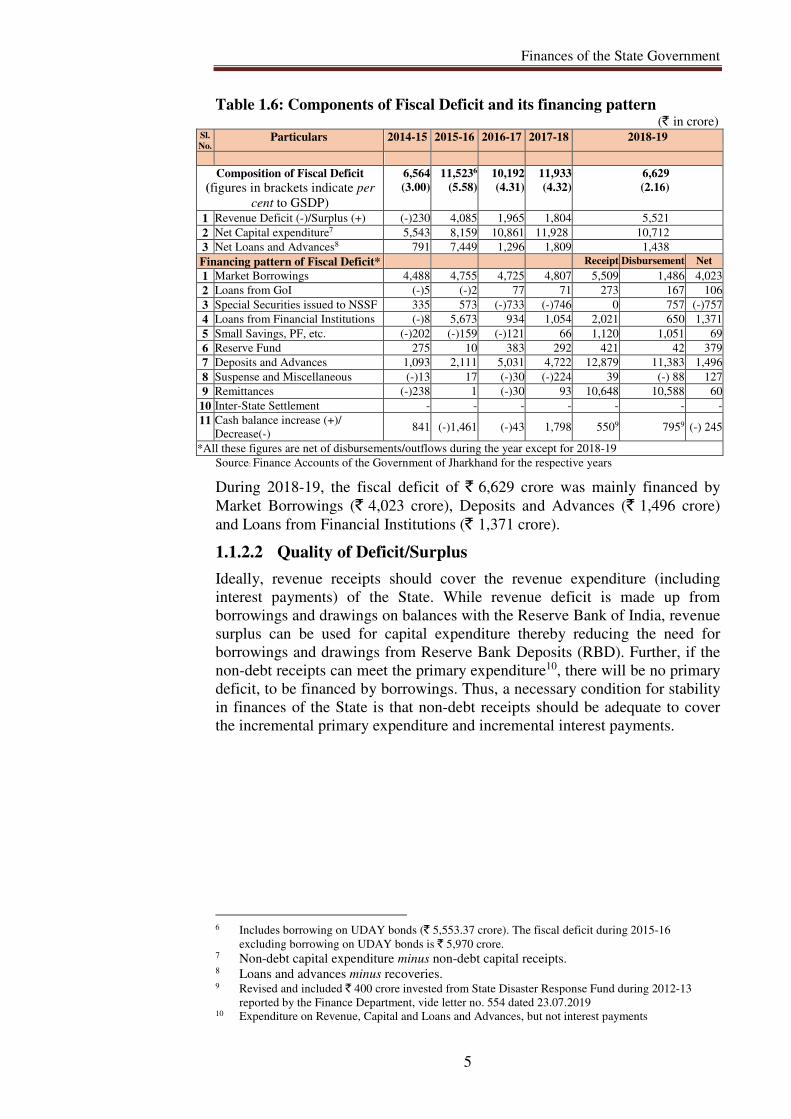
Table 1.6: Components of Fiscal Deficit and its financing pattern (` in crore)
Sl.
No. Particulars 2014-15 2015-16 2016-17 2017-18 2018-19
Composition of Fiscal Deficit
(figures in brackets indicate per
cent to GSDP)
6,564
(3.00)
11,5236
(5.58)
10,192
(4.31)
11,933
(4.32)
6,629
(2.16)
1 Revenue Deficit (-)/Surplus (+) (-)230 4,085 1,965 1,804 5,521
2 Net Capital expenditure7 5,543 8,159 10,861 11,928 10,712
3 Net Loans and Advances8 791 7,449 1,296 1,809 1,438
Financing pattern of Fiscal Deficit* Receipt Disbursement Net
1 Market Borrowings 4,488 4,755 4,725 4,807 5,509 1,486 4,023
2 Loans from GoI (-)5 (-)2 77 71 273 167 106
3 Special Securities issued to NSSF 335 573 (-)733 (-)746 0 757 (-)757
4 Loans from Financial Institutions (-)8 5,673 934 1,054 2,021 650 1,371
5 Small Savings, PF, etc. (-)202 (-)159 (-)121 66 1,120 1,051 69
6 Reserve Fund 275 10 383 292 421 42 379
7 Deposits and Advances 1,093 2,111 5,031 4,722 12,879 11,383 1,496
8 Suspense and Miscellaneous (-)13 17 (-)30 (-)224 39 (-) 88 127
9 Remittances (-)238 1 (-)30 93 10,648 10,588 60
10 Inter-State Settlement - - - - - - -
11 Cash balance increase (+)/
Decrease(-) 841 (-)1,461 (-)43 1,798 5509 7959 (-) 245
*All these figures are net of disbursements/outflows during the year except for 2018-19
Source: Finance Accounts of the Government of Jharkhand for the respective years
During 2018-19, the fiscal deficit of ` 6,629 crore was mainly financed by
Market Borrowings (` 4,023 crore), Deposits and Advances (` 1,496 crore)
and Loans from Financial Institutions (` 1,371 crore).
1.1.2.2 Quality of Deficit/Surplus
Ideally, revenue receipts should cover the revenue expenditure (including
interest payments) of the State. While revenue deficit is made up from
borrowings and drawings on balances with the Reserve Bank of India, revenue
surplus can be used for capital expenditure thereby reducing the need for
borrowings and drawings from Reserve Bank Deposits (RBD). Further, if the
non-debt receipts can meet the primary expenditure10, there will be no primary
deficit, to be financed by borrowings. Thus, a necessary condition for stability
in finances of the State is that non-debt receipts should be adequate to cover
the incremental primary expenditure and incremental interest payments.
6 Includes borrowing on UDAY bonds (` 5,553.37 crore). The fiscal deficit during 2015-16
excluding borrowing on UDAY bonds is ` 5,970 crore. 7 Non-debt capital expenditure minus non-debt capital receipts. 8 Loans and advances minus recoveries. 9 Revised and included ` 400 crore invested from State Disaster Response Fund during 2012-13
reported by the Finance Department, vide letter no. 554 dated 23.07.2019 10 Expenditure on Revenue, Capital and Loans and Advances, but not interest payments
State Finances Audit Report for the year ended 31 March 2019
6
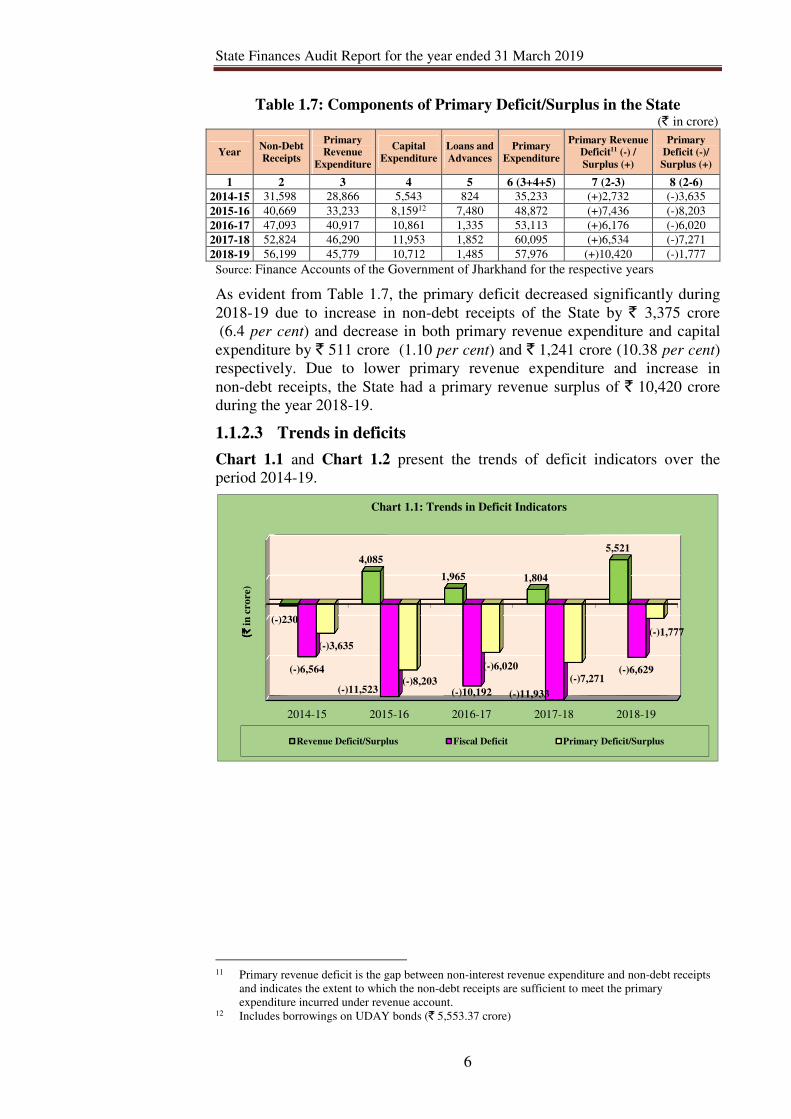
Table 1.7: Components of Primary Deficit/Surplus in the State (` in crore)
Year Non-Debt
Receipts
Primary
Revenue
Expenditure
Capital
Expenditure
Loans and
Advances
Primary
Expenditure
Primary Revenue
Deficit11 (-) /
Surplus (+)
Primary
Deficit (-)/
Surplus (+)
1 2 3 4 5 6 (3+4+5) 7 (2-3) 8 (2-6)
2014-15 31,598 28,866 5,543 824 35,233 (+)2,732 (-)3,635
2015-16 40,669 33,233 8,15912 7,480 48,872 (+)7,436 (-)8,203
2016-17 47,093 40,917 10,861 1,335 53,113 (+)6,176 (-)6,020
2017-18 52,824 46,290 11,953 1,852 60,095 (+)6,534 (-)7,271
2018-19 56,199 45,779 10,712 1,485 57,976 (+)10,420 (-)1,777
Source: Finance Accounts of the Government of Jharkhand for the respective years
As evident from Table 1.7, the primary deficit decreased significantly during
2018-19 due to increase in non-debt receipts of the State by ` 3,375 crore
(6.4 per cent) and decrease in both primary revenue expenditure and capital
expenditure by ` 511 crore (1.10 per cent) and ` 1,241 crore (10.38 per cent)
respectively. Due to lower primary revenue expenditure and increase in
non-debt receipts, the State had a primary revenue surplus of ` 10,420 crore
during the year 2018-19.
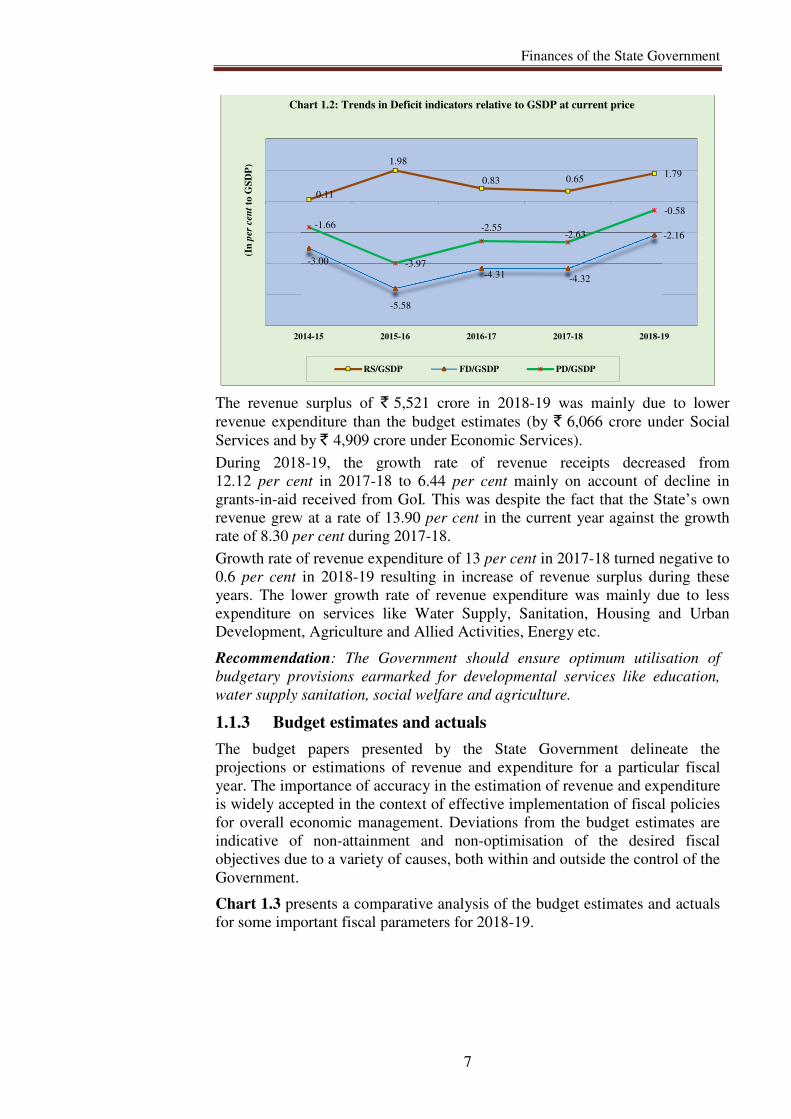
1.1.2.3 Trends in deficits
Chart 1.1 and Chart 1.2 present the trends of deficit indicators over the
period 2014-19.
11 Primary revenue deficit is the gap between non-interest revenue expenditure and non-debt receipts
and indicates the extent to which the non-debt receipts are sufficient to meet the primary
expenditure incurred under revenue account. 12 Includes borrowings on UDAY bonds (` 5,553.37 crore)
2014-15 2015-16 2016-17 2017-18 2018-19
(-)230
4,085
1,965 1,804
5,521
(-)6,564
(-)11,523 (-)10,192 (-)11,933
(-)6,629
(-)3,635
(-)8,203
(-)6,020
(-)7,271
(-)1,777(`(` (`(`in
cro
re)
Chart 1.1: Trends in Deficit Indicators
Revenue Deficit/Surplus Fiscal Deficit Primary Deficit/Surplus
Finances of the State Government
7
The revenue surplus of ` 5,521 crore in 2018-19 was mainly due to lower
revenue expenditure than the budget estimates (by ` 6,066 crore under Social
Services and by ` 4,909 crore under Economic Services).
During 2018-19, the growth rate of revenue receipts decreased from
12.12 per cent in 2017-18 to 6.44 per cent mainly on account of decline in
grants-in-aid received from GoI. This was despite the fact that the State’s own
revenue grew at a rate of 13.90 per cent in the current year against the growth
rate of 8.30 per cent during 2017-18.
Growth rate of revenue expenditure of 13 per cent in 2017-18 turned negative to
0.6 per cent in 2018-19 resulting in increase of revenue surplus during these
years. The lower growth rate of revenue expenditure was mainly due to less
expenditure on services like Water Supply, Sanitation, Housing and Urban
Development, Agriculture and Allied Activities, Energy etc.
Recommendation: The Government should ensure optimum utilisation of
budgetary provisions earmarked for developmental services like education,
water supply sanitation, social welfare and agriculture.
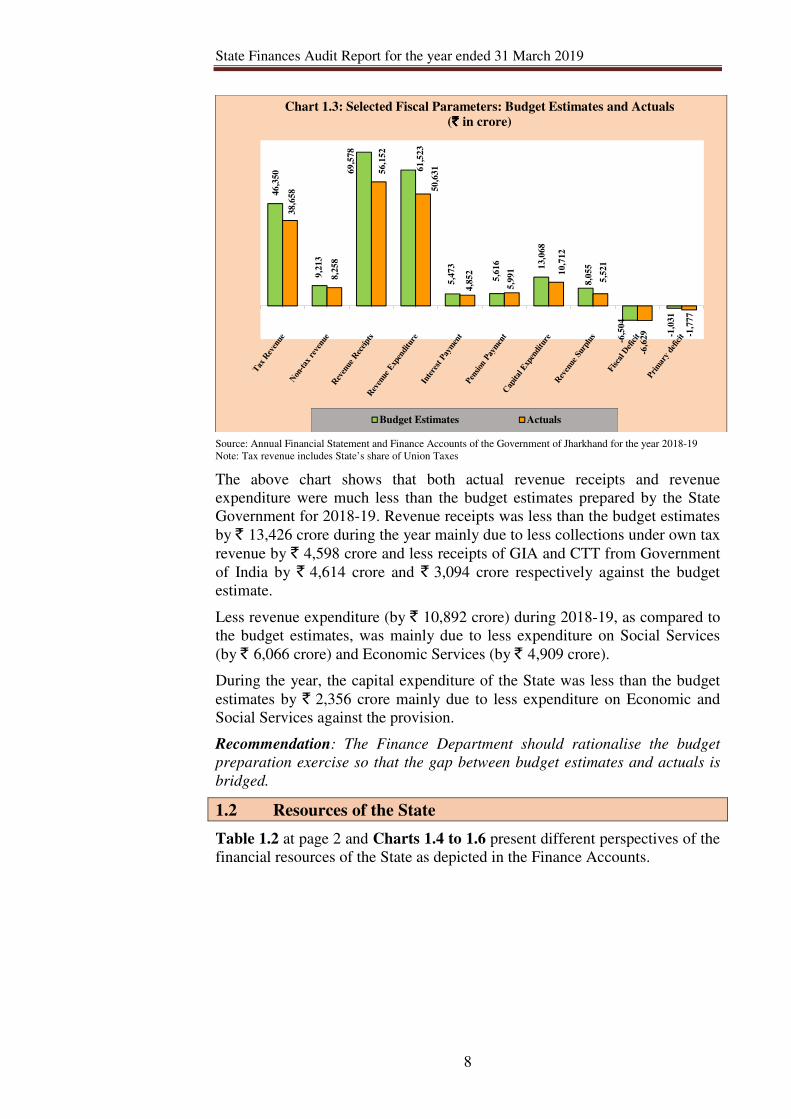
1.1.3 Budget estimates and actuals
The budget papers presented by the State Government delineate the
projections or estimations of revenue and expenditure for a particular fiscal
year. The importance of accuracy in the estimation of revenue and expenditure
is widely accepted in the context of effective implementation of fiscal policies
for overall economic management. Deviations from the budget estimates are
indicative of non-attainment and non-optimisation of the desired fiscal
objectives due to a variety of causes, both within and outside the control of the
Government.
Chart 1.3 presents a comparative analysis of the budget estimates and actuals
for some important fiscal parameters for 2018-19.
0.11
1.98
0.83 0.651.79
-3.00
-5.58
-4.31 -4.32
-2.16-1.66
-3.97
-2.55-2.63
-0.58
2014-15 2015-16 2016-17 2017-18 2018-19
(In
per
cen
tto
GS
DP
)
Chart 1.2: Trends in Deficit indicators relative to GSDP at current price
RS/GSDP FD/GSDP PD/GSDP
State Finances Audit Report for the year ended 31 March 2019
8
Source: Annual Financial Statement and Finance Accounts of the Government of Jharkhand for the year 2018-19
Note: Tax revenue includes State’s share of Union Taxes
The above chart shows that both actual revenue receipts and revenue
expenditure were much less than the budget estimates prepared by the State
Government for 2018-19. Revenue receipts was less than the budget estimates
by ` 13,426 crore during the year mainly due to less collections under own tax
revenue by ` 4,598 crore and less receipts of GIA and CTT from Government
of India by ` 4,614 crore and ` 3,094 crore respectively against the budget
estimate.
Less revenue expenditure (by ` 10,892 crore) during 2018-19, as compared to
the budget estimates, was mainly due to less expenditure on Social Services
(by ` 6,066 crore) and Economic Services (by ` 4,909 crore).
During the year, the capital expenditure of the State was less than the budget
estimates by ` 2,356 crore mainly due to less expenditure on Economic and
Social Services against the provision.
Recommendation: The Finance Department should rationalise the budget
preparation exercise so that the gap between budget estimates and actuals is
bridged.
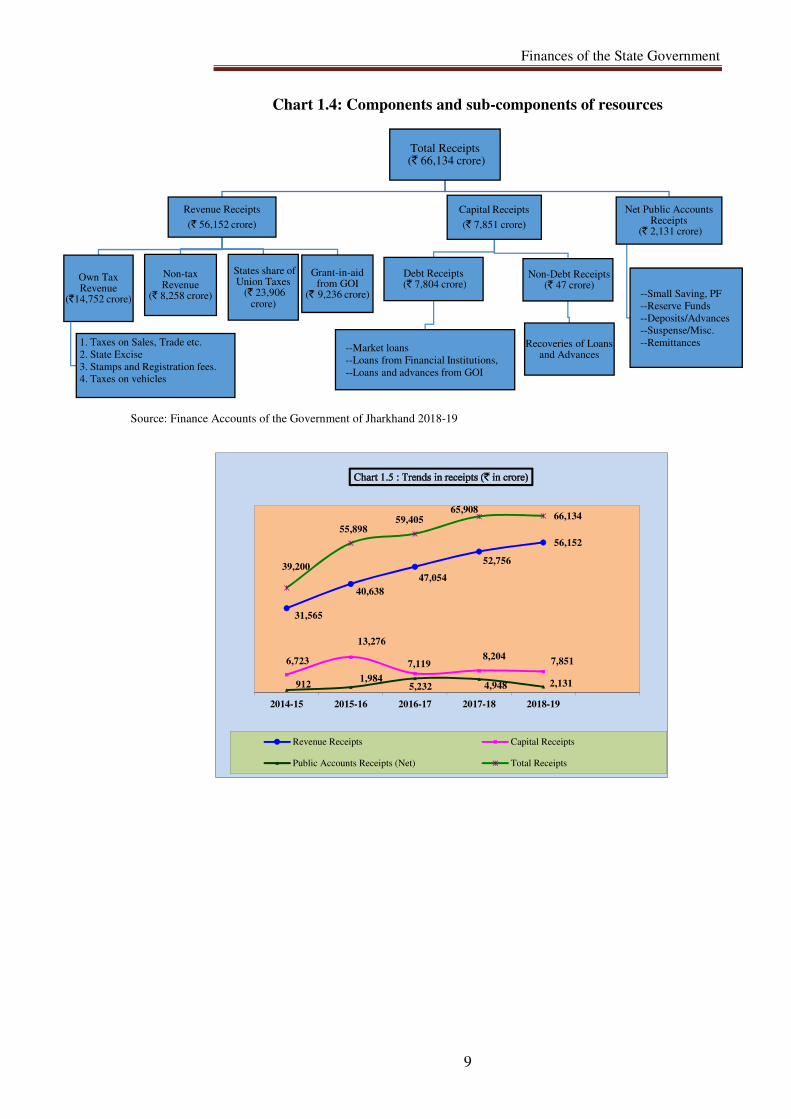
1.2 Resources of the State
Table 1.2 at page 2 and Charts 1.4 to 1.6 present different perspectives of the
financial resources of the State as depicted in the Finance Accounts.
46,3
50
9,2
13
69,5
78
61,5
23
5,4
73
5,6
16 13,0
68
8,0
55
-6,5
04
-1,0
31
38,6
58
8,2
58
56,1
52
50,6
31
4,8
52
5,9
91 10,7
12
5,5
21
-6,6
29 -1
,777
Chart 1.3: Selected Fiscal Parameters: Budget Estimates and Actuals
(` ` ` ` in crore)
Budget Estimates Actuals
Finances of the State Government
9
Chart 1.4: Components and sub-components of resources
Source: Finance Accounts of the Government of Jharkhand 2018-19
Total Receipts(` 66,134 crore)
Revenue Receipts
(` 56,152 crore)
Own Tax Revenue
(`14,752 crore)
1. Taxes on Sales, Trade etc.
2. State Excise
3. Stamps and Registration fees.
4. Taxes on vehicles
Non-tax Revenue
(` 8,258 crore)
States share of Union Taxes
(` 23,906 crore)
Grant-in-aid from GOI
(` 9,236 crore)
Capital Receipts
(` 7,851 crore)
Debt Receipts(` 7,804 crore)
--Market loans
--Loans from Financial Institutions,
--Loans and advances from GOI
Non-Debt Receipts(` 47 crore)
Recoveries of Loans and Advances
Net Public Accounts Receipts
(` 2,131 crore)
--Small Saving, PF
--Reserve Funds
--Deposits/Advances
--Suspense/Misc.
--Remittances
31,565
40,638
47,054
52,756
56,152
6,723
13,276
7,1198,204
7,851
9121,984
5,232 4,948 2,131
39,200
55,89859,405
65,90866,134
2014-15 2015-16 2016-17 2017-18 2018-19
Revenue Receipts Capital Receipts
Public Accounts Receipts (Net) Total Receipts
State Finances Audit Report for the year ended 31 March 2019
10
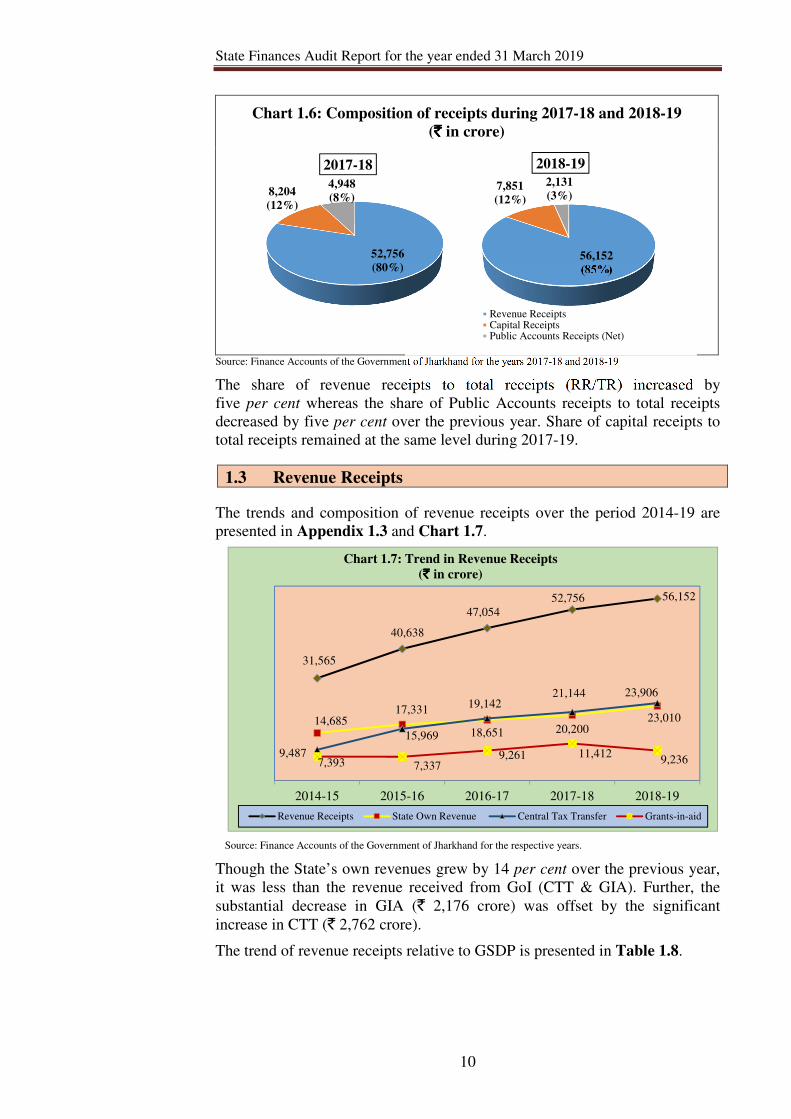
Chart 1.6: Composition of receipts during 2017-18 and 2018-19
(`̀̀̀ in crore)
Source: Finance Accounts of the Government of Jharkhand for the years 2017-18 and 2018-19
The share of revenue receipts to total receipts (RR/TR) increased by
five per cent whereas the share of Public Accounts receipts to total receipts
decreased by five per cent over the previous year. Share of capital receipts to
total receipts remained at the same level during 2017-19.
1.3 Revenue Receipts
The trends and composition of revenue receipts over the period 2014-19 are
presented in Appendix 1.3 and Chart 1.7.
Source: Finance Accounts of the Government of Jharkhand for the respective years.
Though the State’s own revenues grew by 14 per cent over the previous year,
it was less than the revenue received from GoI (CTT & GIA). Further, the
substantial decrease in GIA (` 2,176 crore) was offset by the significant
increase in CTT (` 2,762 crore).
The trend of revenue receipts relative to GSDP is presented in Table 1.8.
52,756
(80%)
8,204
(12%)
4,948
(8%)
2017-18
56,152
(85%)
7,851
(12%)
2,131
(3%)
2018-19
Revenue ReceiptsCapital ReceiptsPublic Accounts Receipts (Net)
31,565
40,638
47,054
52,756 56,152
14,68517,331
18,651 20,20023,010
9,487
15,969
19,14221,144 23,906
7,393 7,3379,261 11,412
9,236
2014-15 2015-16 2016-17 2017-18 2018-19
Chart 1.7: Trend in Revenue Receipts
(` ` ` ` in crore)
Revenue Receipts State Own Revenue Central Tax Transfer Grants-in-aid
Finances of the State Government
11
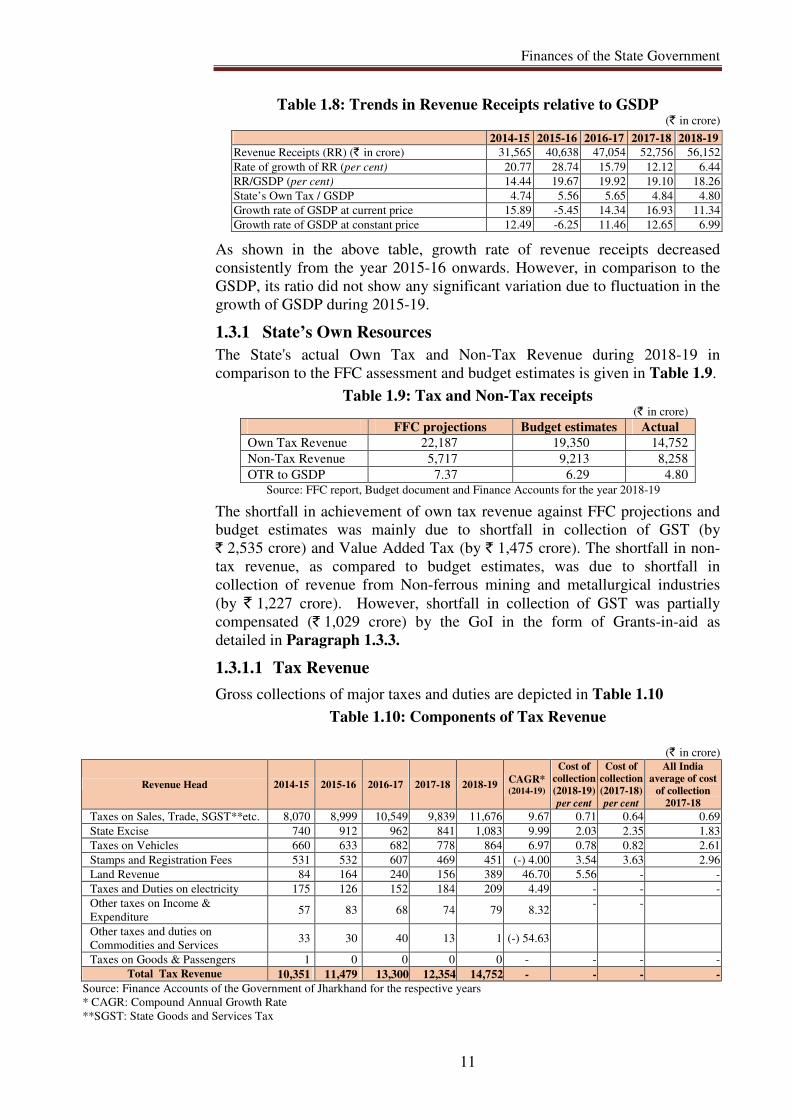
Table 1.8: Trends in Revenue Receipts relative to GSDP (` in crore)
As shown in the above table, growth rate of revenue receipts decreased
consistently from the year 2015-16 onwards. However, in comparison to the
GSDP, its ratio did not show any significant variation due to fluctuation in the
growth of GSDP during 2015-19.
1.3.1 State’s Own Resources
The State's actual Own Tax and Non-Tax Revenue during 2018-19 in
comparison to the FFC assessment and budget estimates is given in Table 1.9.
Table 1.9: Tax and Non-Tax receipts (` in crore)
FFC projections Budget estimates Actual
Own Tax Revenue 22,187 19,350 14,752
Non-Tax Revenue 5,717 9,213 8,258
OTR to GSDP 7.37 6.29 4.80 Source: FFC report, Budget document and Finance Accounts for the year 2018-19
The shortfall in achievement of own tax revenue against FFC projections and
budget estimates was mainly due to shortfall in collection of GST (by
` 2,535 crore) and Value Added Tax (by ` 1,475 crore). The shortfall in non-
tax revenue, as compared to budget estimates, was due to shortfall in
collection of revenue from Non-ferrous mining and metallurgical industries
(by ` 1,227 crore). However, shortfall in collection of GST was partially
compensated (` 1,029 crore) by the GoI in the form of Grants-in-aid as
detailed in Paragraph 1.3.3.
1.3.1.1 Tax Revenue
Gross collections of major taxes and duties are depicted in Table 1.10
Table 1.10: Components of Tax Revenue
2014-15 2015-16 2016-17 2017-18 2018-19
Revenue Receipts (RR) (` in crore) 31,565 40,638 47,054 52,756 56,152
Rate of growth of RR (per cent) 20.77 28.74 15.79 12.12 6.44
RR/GSDP (per cent) 14.44 19.67 19.92 19.10 18.26
State’s Own Tax / GSDP 4.74 5.56 5.65 4.84 4.80
Growth rate of GSDP at current price 15.89 -5.45 14.34 16.93 11.34
Growth rate of GSDP at constant price 12.49 -6.25 11.46 12.65 6.99
(` in crore)
Revenue Head 2014-15 2015-16 2016-17 2017-18 2018-19 CAGR* (2014-19)
Cost of
collection
(2018-19)
per cent
Cost of
collection
(2017-18)
per cent
All India
average of cost
of collection
2017-18
Taxes on Sales, Trade, SGST**etc. 8,070 8,999 10,549 9,839 11,676 9.67 0.71 0.64 0.69
State Excise 740 912 962 841 1,083 9.99 2.03 2.35 1.83
Taxes on Vehicles 660 633 682 778 864 6.97 0.78 0.82 2.61
Stamps and Registration Fees 531 532 607 469 451 (-) 4.00 3.54 3.63 2.96
Land Revenue 84 164 240 156 389 46.70 5.56 - -
Taxes and Duties on electricity 175 126 152 184 209 4.49 - - -
Other taxes on Income &
Expenditure 57 83 68 74 79 8.32
- -
Other taxes and duties on
Commodities and Services 33 30 40 13 1 (-) 54.63
Taxes on Goods & Passengers 1 0 0 0 0 - - - -
Total Tax Revenue 10,351 11,479 13,300 12,354 14,752 - - - -
Source: Finance Accounts of the Government of Jharkhand for the respective years
* CAGR: Compound Annual Growth Rate
**SGST: State Goods and Services Tax
State Finances Audit Report for the year ended 31 March 2019
12
The tax receipts of the State had increased by 19.42 per cent during 2018-19
in comparison to the negative growth of 7.11 per cent in the previous year.
Moreover, Government of India provided Grants-in-Aid of ` 1,029 crore to
the State as compensation for loss of revenue on account of implementation of
GST as detailed in Paragraph 1.3.3. State Excise receipts increased by
` 242 crore during the year 2018-19 due to increase in transportation duty of
liquor from godowns to retail stores. Receipts under Taxes on Vehicles
increased by ` 86 crore during 2018-19 mainly due to introduction of new tax
structure wherein Tractors, Trailers, Machinery equipped vehicles, Three
wheeler (Passenger) and Three wheeler (Goods) vehicles were brought under
the purview of one-time tax. Land revenue of the State increased significantly
by ` 233 crore13 during 2018-19 due to transfer of Government land to various
companies, institutions, authorities etc.
Cost of collection of own taxes
As depicted in Table 1.10, cost of collection of taxes in the State during
2018-19 decreased over the previous year in respect of all taxes except Sales
tax including GST. During 2018-19, the cost of collection of taxes in the State
was significantly high for Stamps and registration fees, State Excise and Taxes
on Sales & Trade including GST in comparison to the all-India average,
whereas it was lower in respect of Taxes on vehicles.
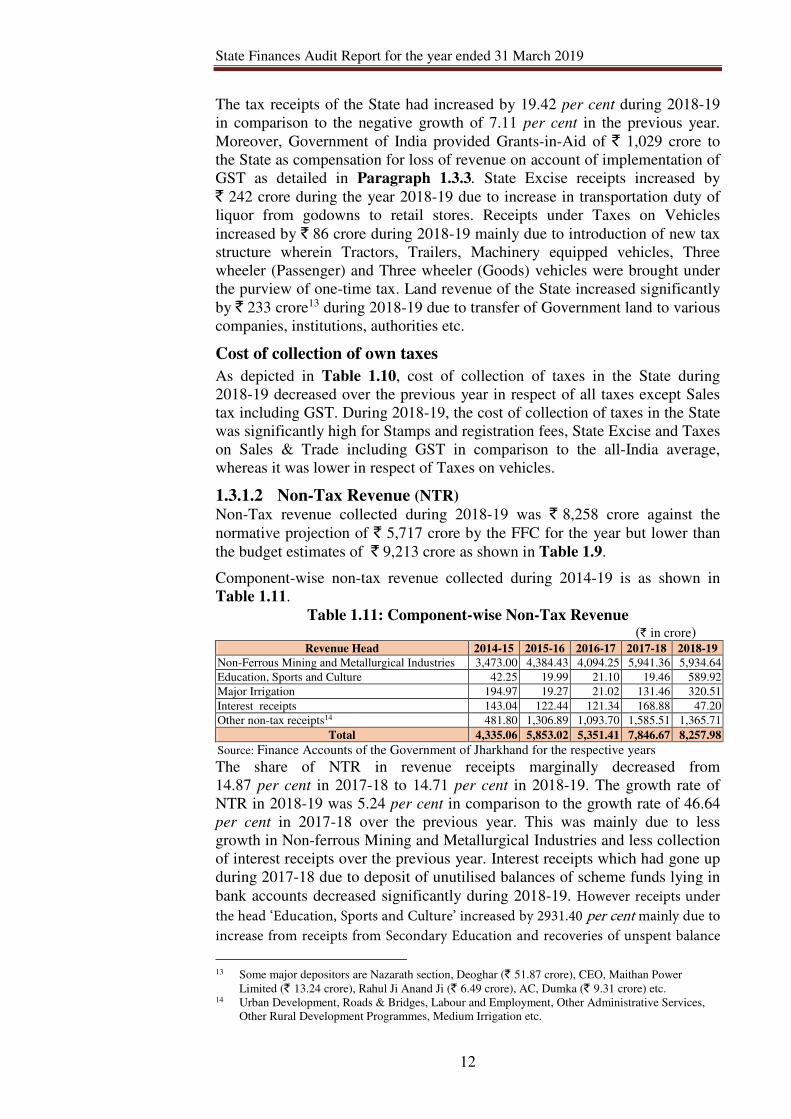
1.3.1.2 Non-Tax Revenue (NTR) Non-Tax revenue collected during 2018-19 was ` 8,258 crore against the
normative projection of ` 5,717 crore by the FFC for the year but lower than
the budget estimates of ` 9,213 crore as shown in Table 1.9.
Component-wise non-tax revenue collected during 2014-19 is as shown in
Table 1.11.
Table 1.11: Component-wise Non-Tax Revenue (` in crore)
Revenue Head 2014-15 2015-16 2016-17 2017-18 2018-19
Non-Ferrous Mining and Metallurgical Industries 3,473.00 4,384.43 4,094.25 5,941.36 5,934.64
Education, Sports and Culture 42.25 19.99 21.10 19.46 589.92
Major Irrigation 194.97 19.27 21.02 131.46 320.51
Interest receipts 143.04 122.44 121.34 168.88 47.20
Other non-tax receipts14 481.80 1,306.89 1,093.70 1,585.51 1,365.71
Total 4,335.06 5,853.02 5,351.41 7,846.67 8,257.98
Source: Finance Accounts of the Government of Jharkhand for the respective years
The share of NTR in revenue receipts marginally decreased from
14.87 per cent in 2017-18 to 14.71 per cent in 2018-19. The growth rate of
NTR in 2018-19 was 5.24 per cent in comparison to the growth rate of 46.64
per cent in 2017-18 over the previous year. This was mainly due to less
growth in Non-ferrous Mining and Metallurgical Industries and less collection
of interest receipts over the previous year. Interest receipts which had gone up
during 2017-18 due to deposit of unutilised balances of scheme funds lying in
bank accounts decreased significantly during 2018-19. However receipts under
the head ‘Education, Sports and Culture’ increased by 2931.40 per cent mainly due to
increase from receipts from Secondary Education and recoveries of unspent balance
13 Some major depositors are Nazarath section, Deoghar (` 51.87 crore), CEO, Maithan Power
Limited (` 13.24 crore), Rahul Ji Anand Ji (` 6.49 crore), AC, Dumka (` 9.31 crore) etc. 14 Urban Development, Roads & Bridges, Labour and Employment, Other Administrative Services,
Other Rural Development Programmes, Medium Irrigation etc.
Finances of the State Government
13
of grants-in-aid. Similarly, receipts from ‘Major irrigation’ increased by 143.08
per cent due to more receipts under recoveries of unspent balance of grants-in-aid.
The issue of irregular deposit of recoveries of unspent balance of grants-in-aid under
receipt head has been discussed in Paragraph 1.3.5Paragraph 1.3.5Paragraph 1.3.5Paragraph 1.3.5.
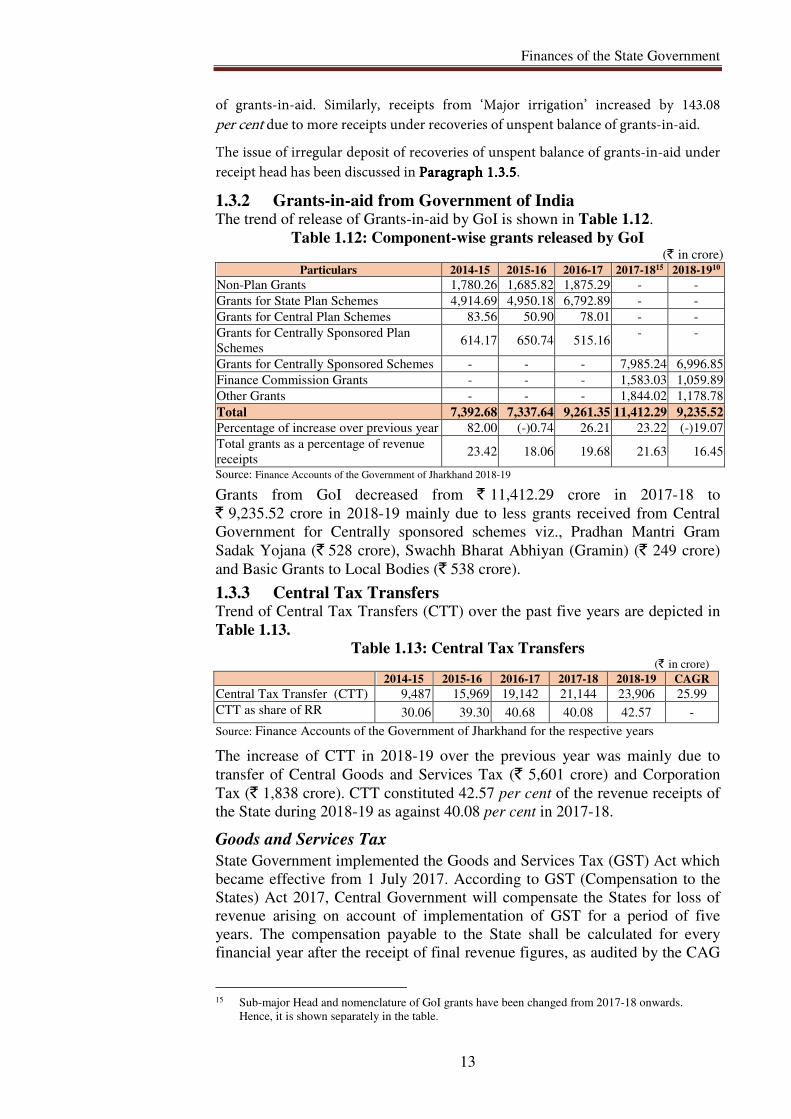
1.3.2 Grants-in-aid from Government of India The trend of release of Grants-in-aid by GoI is shown in Table 1.12.
Table 1.12: Component-wise grants released by GoI (` in crore)
Particulars 2014-15 2015-16 2016-17 2017-1815 2018-1910
Non-Plan Grants 1,780.26 1,685.82 1,875.29 - - Grants for State Plan Schemes 4,914.69 4,950.18 6,792.89 - - Grants for Central Plan Schemes 83.56 50.90 78.01 - - Grants for Centrally Sponsored Plan
Schemes 614.17 650.74 515.16
- -
Grants for Centrally Sponsored Schemes - - - 7,985.24 6,996.85
Finance Commission Grants - - - 1,583.03 1,059.89
Other Grants - - - 1,844.02 1,178.78
Total 7,392.68 7,337.64 9,261.35 11,412.29 9,235.52
Percentage of increase over previous year 82.00 (-)0.74 26.21 23.22 (-)19.07
Total grants as a percentage of revenue
receipts 23.42 18.06 19.68 21.63 16.45
Source: Finance Accounts of the Government of Jharkhand 2018-19
Grants from GoI decreased from ` 11,412.29 crore in 2017-18 to
` 9,235.52 crore in 2018-19 mainly due to less grants received from Central
Government for Centrally sponsored schemes viz., Pradhan Mantri Gram
Sadak Yojana (` 528 crore), Swachh Bharat Abhiyan (Gramin) (` 249 crore)
and Basic Grants to Local Bodies (` 538 crore).
1.3.3 Central Tax Transfers Trend of Central Tax Transfers (CTT) over the past five years are depicted in
Table 1.13.
Table 1.13: Central Tax Transfers (` in crore)
2014-15 2015-16 2016-17 2017-18 2018-19 CAGR
Central Tax Transfer (CTT) 9,487 15,969 19,142 21,144 23,906 25.99
CTT as share of RR 30.06 39.30 40.68 40.08 42.57 -
Source: Finance Accounts of the Government of Jharkhand for the respective years
The increase of CTT in 2018-19 over the previous year was mainly due to
transfer of Central Goods and Services Tax (` 5,601 crore) and Corporation
Tax (` 1,838 crore). CTT constituted 42.57 per cent of the revenue receipts of
the State during 2018-19 as against 40.08 per cent in 2017-18.
Goods and Services Tax
State Government implemented the Goods and Services Tax (GST) Act which
became effective from 1 July 2017. According to GST (Compensation to the
States) Act 2017, Central Government will compensate the States for loss of
revenue arising on account of implementation of GST for a period of five
years. The compensation payable to the State shall be calculated for every
financial year after the receipt of final revenue figures, as audited by the CAG
15 Sub-major Head and nomenclature of GoI grants have been changed from 2017-18 onwards.
Hence, it is shown separately in the table.
State Finances Audit Report for the year ended 31 March 2019
14
of India. A base year (2015-16) revenue figure of taxes subsumed under GST
was finalised under GST Act. In the case of Jharkhand, the revenue was
` 6,410.51 crore during the base year (2015-16). The projected revenue for
any year in a State shall be calculated by applying the projected growth rate
(14 per cent per annum) over the base year revenue of that State.
The projected revenue for the year 2018-19 in accordance with the base year
figure was ` 9,497.46 crore against which the revenue receipt of the State
Government under GST during 2018-19 was ` 8,157.62 crore16. The GoI
provided ` 1,029 crore as compensation during the year to protect the revenue
collection of the State. However, compensation amount pertaining to the
months of February and March 2019 was not provided during 2018-19. Hence,
against the projected revenue of ` 9,497.46 crore, the SGST/IGST collection
and compensation received was ` 9,186.62 crore leading to short receipt of
` 310.84 crore
Advance apportionment of IGST and its adjustment against GST
compensation The GOI is to apportion IGST to State Governments under section 17 of the
IGST Act, 2017. The State Tax Division, Ministry of Finance, Department of
Revenue (GoI) sanctioned (March 2019) provisional/advance settlement of
apportionment of ` 985.90 crore with the condition that the amount will be
settled from future payments of IGST.
With automation of the collection of GST having taken place, it is essential for
Audit to transition from sample checks to a comprehensive check of all
transactions, to fulfil the CAG’s Constitutional mandate of certifying the
Accounts. The required access to data is yet to be provided. Not having access
to the data pertaining to all GST transactions has come in the way of
comprehensively auditing the GST receipts. The accounts for the year 2018-19
are, therefore, certified on the basis of test audit, as was done when records
were manually maintained, as a one-time exception.
1.3.4 Revenue arrears
As on 31 March 2019, arrears in collection of revenue was ` 6,522.67 crore
(Commercial Tax Department and Land Revenue Department), of which
` 1,469.97 crore was outstanding for more than five years. Further, ` 1,802.90
crore was held up by the Courts and other appellate authorities. Information
regarding revenue arrears from other departments was not furnished (February
2020). The total revenue arrears as on 31 March 2019 constituted 28.35 per cent
of own resources of the State as against 31.47 per cent during 2017-18.
1.3.5 Irregular deposit under Minor Head-913
A total amount of ` 1,403.12 crore (unspent balances of Grants-in-aid and
unutilised scheme funds) has been deposited by the State Government under
Minor head ‘913-recovery of unspent balance of Grants-in-aid’ below 37
revenue receipt Major heads during the year 2018-19. Bifurcation of the
deposited amount into those pertaining to Centrally Sponsored Schemes and
State Schemes is not available. The deposited amount, not being actual
16 Includes SGST: ` 7171.72 crore and Provisional apportionment of IGST: ` 985.90 crore
Finances of the State Government
15
revenue, is included in the revenue receipts resulting in overstatement of
revenue surplus of the State Government to that extent.
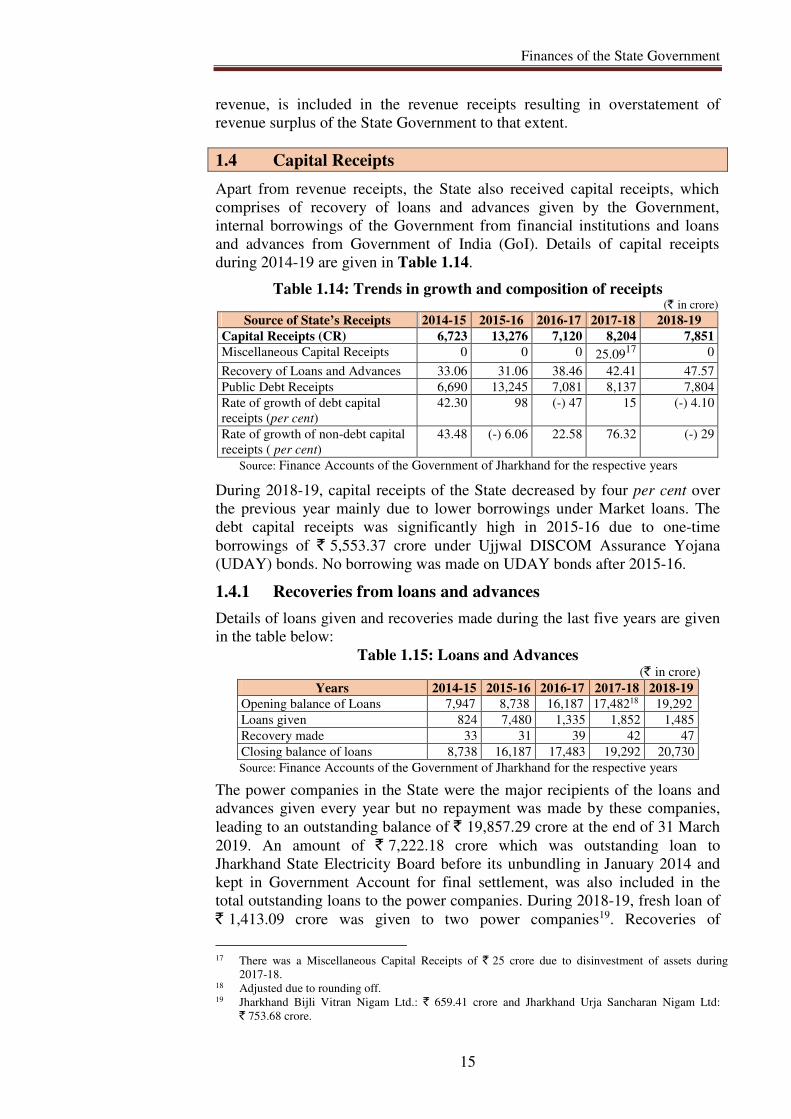
1.4 Capital Receipts
Apart from revenue receipts, the State also received capital receipts, which
comprises of recovery of loans and advances given by the Government,
internal borrowings of the Government from financial institutions and loans
and advances from Government of India (GoI). Details of capital receipts
during 2014-19 are given in Table 1.14.
Table 1.14: Trends in growth and composition of receipts (` in crore)
Source of State’s Receipts 2014-15 2015-16 2016-17 2017-18 2018-19
Capital Receipts (CR) 6,723 13,276 7,120 8,204 7,851
Miscellaneous Capital Receipts 0 0 0 25.0917
0
Recovery of Loans and Advances 33.06 31.06 38.46 42.41 47.57
Public Debt Receipts 6,690 13,245 7,081 8,137 7,804
Rate of growth of debt capital
receipts (per cent)
42.30 98 (-) 47 15 (-) 4.10
Rate of growth of non-debt capital
receipts ( per cent)
43.48 (-) 6.06 22.58 76.32 (-) 29
Source: Finance Accounts of the Government of Jharkhand for the respective years
During 2018-19, capital receipts of the State decreased by four per cent over
the previous year mainly due to lower borrowings under Market loans. The
debt capital receipts was significantly high in 2015-16 due to one-time
borrowings of ` 5,553.37 crore under Ujjwal DISCOM Assurance Yojana
(UDAY) bonds. No borrowing was made on UDAY bonds after 2015-16.
1.4.1 Recoveries from loans and advances
Details of loans given and recoveries made during the last five years are given
in the table below:
Table 1.15: Loans and Advances (` in crore)
Years 2014-15 2015-16 2016-17 2017-18 2018-19
Opening balance of Loans 7,947 8,738 16,187 17,48218 19,292
Loans given 824 7,480 1,335 1,852 1,485
Recovery made 33 31 39 42 47
Closing balance of loans 8,738 16,187 17,483 19,292 20,730
Source: Finance Accounts of the Government of Jharkhand for the respective years
The power companies in the State were the major recipients of the loans and
advances given every year but no repayment was made by these companies,
leading to an outstanding balance of ` 19,857.29 crore at the end of 31 March
2019. An amount of ` 7,222.18 crore which was outstanding loan to
Jharkhand State Electricity Board before its unbundling in January 2014 and
kept in Government Account for final settlement, was also included in the
total outstanding loans to the power companies. During 2018-19, fresh loan of
` 1,413.09 crore was given to two power companies19. Recoveries of
17 There was a Miscellaneous Capital Receipts of ` 25 crore due to disinvestment of assets during
2017-18. 18 Adjusted due to rounding off. 19 Jharkhand Bijli Vitran Nigam Ltd.: ` 659.41 crore and Jharkhand Urja Sancharan Nigam Ltd:
` 753.68 crore.
State Finances Audit Report for the year ended 31 March 2019
16
` 47 crore shown in the above table were mainly from the loans and advances
given to Government servants.
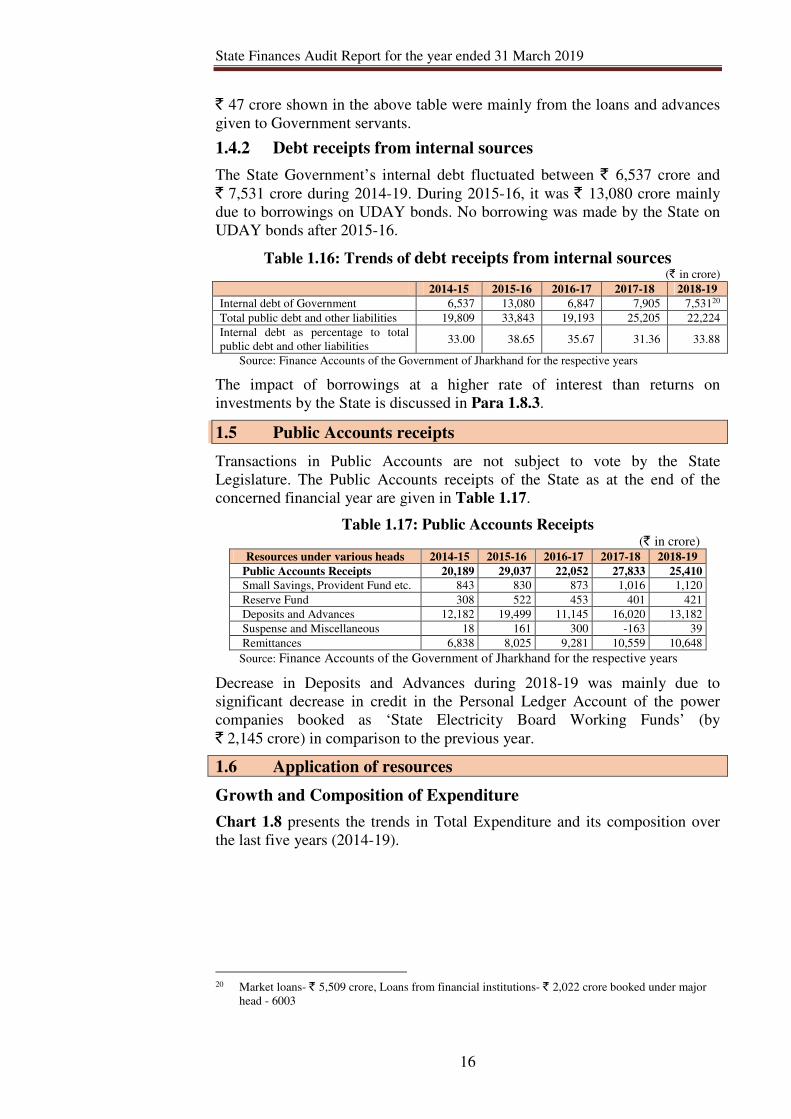
1.4.2 Debt receipts from internal sources
The State Government’s internal debt fluctuated between ` 6,537 crore and
` 7,531 crore during 2014-19. During 2015-16, it was ` 13,080 crore mainly
due to borrowings on UDAY bonds. No borrowing was made by the State on
UDAY bonds after 2015-16.
Table 1.16: Trends of debt receipts from internal sources (` in crore)
2014-15 2015-16 2016-17 2017-18 2018-19
Internal debt of Government 6,537 13,080 6,847 7,905 7,53120
Total public debt and other liabilities 19,809 33,843 19,193 25,205 22,224
Internal debt as percentage to total
public debt and other liabilities 33.00 38.65 35.67 31.36 33.88
Source: Finance Accounts of the Government of Jharkhand for the respective years
The impact of borrowings at a higher rate of interest than returns on
investments by the State is discussed in Para 1.8.3.
1.5 Public Accounts receipts
Transactions in Public Accounts are not subject to vote by the State
Legislature. The Public Accounts receipts of the State as at the end of the
concerned financial year are given in Table 1.17.
Table 1.17: Public Accounts Receipts (` in crore)
Resources under various heads 2014-15 2015-16 2016-17 2017-18 2018-19
Public Accounts Receipts 20,189 29,037 22,052 27,833 25,410
Small Savings, Provident Fund etc. 843 830 873 1,016 1,120
Reserve Fund 308 522 453 401 421
Deposits and Advances 12,182 19,499 11,145 16,020 13,182
Suspense and Miscellaneous 18 161 300 -163 39
Remittances 6,838 8,025 9,281 10,559 10,648
Source: Finance Accounts of the Government of Jharkhand for the respective years
Decrease in Deposits and Advances during 2018-19 was mainly due to
significant decrease in credit in the Personal Ledger Account of the power
companies booked as ‘State Electricity Board Working Funds’ (by
` 2,145 crore) in comparison to the previous year.
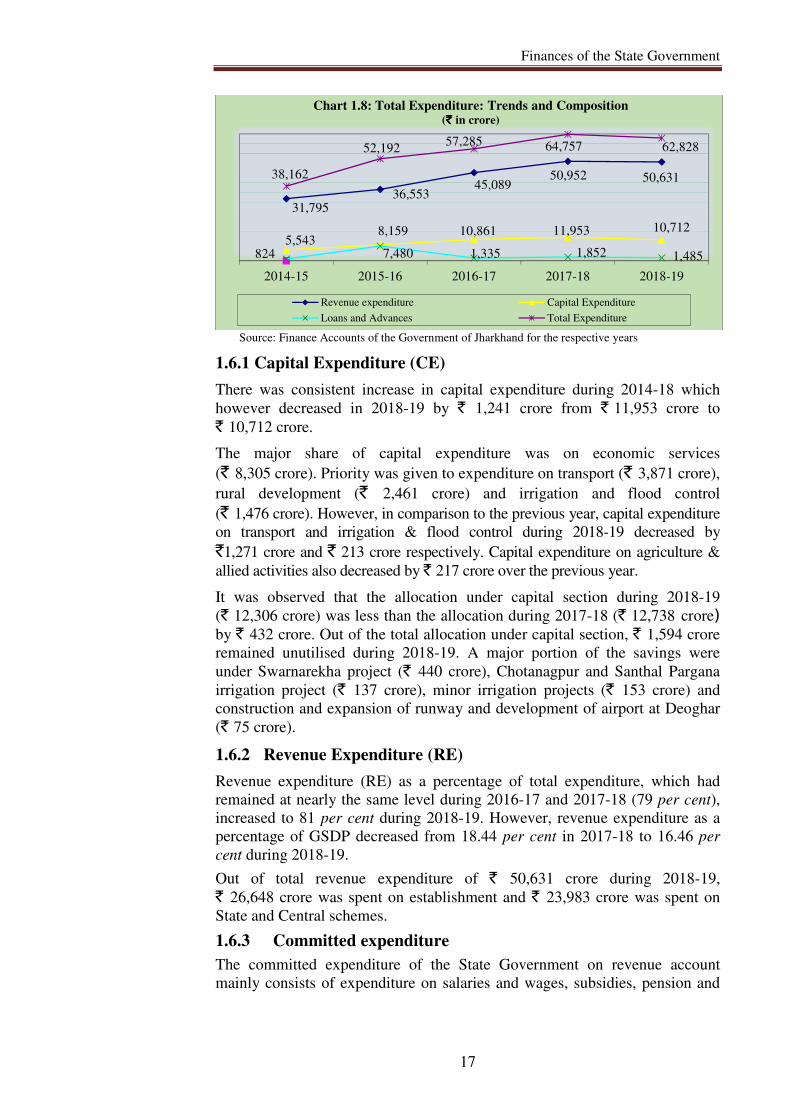
1.6 Application of resources
Growth and Composition of Expenditure
Chart 1.8 presents the trends in Total Expenditure and its composition over
the last five years (2014-19).
20 Market loans- ` 5,509 crore, Loans from financial institutions- ` 2,022 crore booked under major
head - 6003
Finances of the State Government
17
Source: Finance Accounts of the Government of Jharkhand for the respective years
1.6.1 Capital Expenditure (CE)
There was consistent increase in capital expenditure during 2014-18 which
however decreased in 2018-19 by ` 1,241 crore from ` 11,953 crore to
` 10,712 crore.
The major share of capital expenditure was on economic services
(` 8,305 crore). Priority was given to expenditure on transport (` 3,871 crore),
rural development (` 2,461 crore) and irrigation and flood control
(` 1,476 crore). However, in comparison to the previous year, capital expenditure
on transport and irrigation & flood control during 2018-19 decreased by
`1,271 crore and ` 213 crore respectively. Capital expenditure on agriculture &
allied activities also decreased by ` 217 crore over the previous year.
It was observed that the allocation under capital section during 2018-19
(` 12,306 crore) was less than the allocation during 2017-18 (` 12,738 crore)
by ` 432 crore. Out of the total allocation under capital section, ` 1,594 crore
remained unutilised during 2018-19. A major portion of the savings were
under Swarnarekha project (` 440 crore), Chotanagpur and Santhal Pargana
irrigation project (` 137 crore), minor irrigation projects (` 153 crore) and
construction and expansion of runway and development of airport at Deoghar
(` 75 crore).
1.6.2 Revenue Expenditure (RE)
Revenue expenditure (RE) as a percentage of total expenditure, which had
remained at nearly the same level during 2016-17 and 2017-18 (79 per cent),
increased to 81 per cent during 2018-19. However, revenue expenditure as a
percentage of GSDP decreased from 18.44 per cent in 2017-18 to 16.46 per
cent during 2018-19.
Out of total revenue expenditure of ` 50,631 crore during 2018-19,
` 26,648 crore was spent on establishment and ` 23,983 crore was spent on
State and Central schemes.
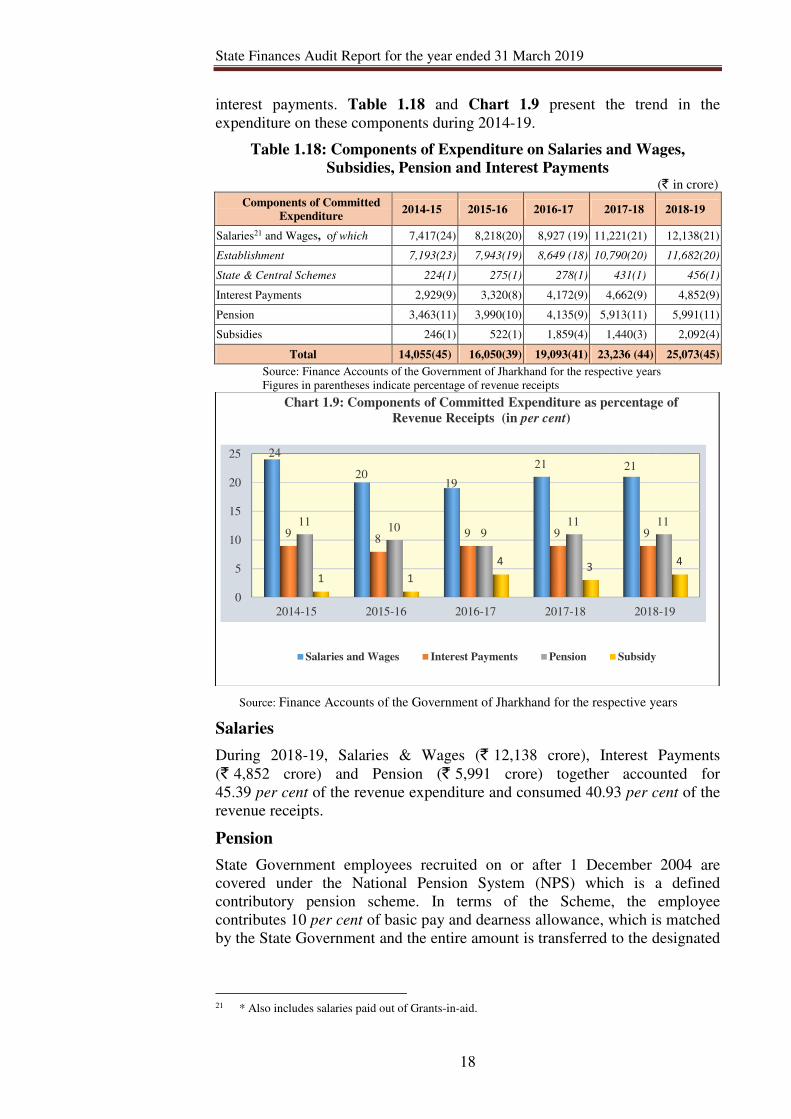
1.6.3 Committed expenditure
The committed expenditure of the State Government on revenue account
mainly consists of expenditure on salaries and wages, subsidies, pension and
31,79536,553
45,08950,952 50,631
5,5438,159 10,861 11,953 10,712
824 7,480 1,335 1,852 1,485
38,162
52,19257,285 64,757 62,828
2014-15 2015-16 2016-17 2017-18 2018-19
Chart 1.8: Total Expenditure: Trends and Composition (` ` ` ` in crore)
Revenue expenditure Capital Expenditure
Loans and Advances Total Expenditure
State Finances Audit Report for the year ended 31 March 2019
18
interest payments. Table 1.18 and Chart 1.9 present the trend in the
expenditure on these components during 2014-19.
Table 1.18: Components of Expenditure on Salaries and Wages,
Subsidies, Pension and Interest Payments (` in crore)
Components of Committed
Expenditure 2014-15 2015-16 2016-17 2017-18 2018-19
Salaries21 and Wages, of which 7,417(24) 8,218(20) 8,927 (19) 11,221(21) 12,138(21)
Establishment 7,193(23) 7,943(19) 8,649 (18) 10,790(20) 11,682(20)
State & Central Schemes 224(1) 275(1) 278(1) 431(1) 456(1)
Interest Payments 2,929(9) 3,320(8) 4,172(9) 4,662(9) 4,852(9)
Pension 3,463(11) 3,990(10) 4,135(9) 5,913(11) 5,991(11)
Subsidies 246(1) 522(1) 1,859(4) 1,440(3) 2,092(4)
Total 14,055(45) 16,050(39) 19,093(41) 23,236 (44) 25,073(45)
Source: Finance Accounts of the Government of Jharkhand for the respective years
Figures in parentheses indicate percentage of revenue receipts
Source: Finance Accounts of the Government of Jharkhand for the respective years
Salaries
During 2018-19, Salaries & Wages (` 12,138 crore), Interest Payments
(` 4,852 crore) and Pension (` 5,991 crore) together accounted for
45.39 per cent of the revenue expenditure and consumed 40.93 per cent of the
revenue receipts.
Pension
State Government employees recruited on or after 1 December 2004 are
covered under the National Pension System (NPS) which is a defined
contributory pension scheme. In terms of the Scheme, the employee
contributes 10 per cent of basic pay and dearness allowance, which is matched
by the State Government and the entire amount is transferred to the designated
21 * Also includes salaries paid out of Grants-in-aid.
0
5
10
15
20
25
2014-15 2015-16 2016-17 2017-18 2018-19
24
2019
21 21
98
9 9 911
109
11 11
1 1
43
4
Chart 1.9: Components of Committed Expenditure as percentage of
Revenue Receipts (in per cent)
Salaries and Wages Interest Payments Pension Subsidy
Finances of the State Government
19
fund manager through the National Securities Depository Limited (NSDL)/
Trustee Bank.
During 2018-19, employer’s contribution of ` 427.31 crore was transferred to
NSDL. The State Government transferred ` 426.55 crore against receipt of
` 425.66 crore as employees’ contribution to the designated fund manager
through NSDL during 2018-19. A balance of ` 12.64 crore remained in the
Public Account (Major Head 8342-117-Defined Contribution Pension
Scheme) at the end of 2018-19.
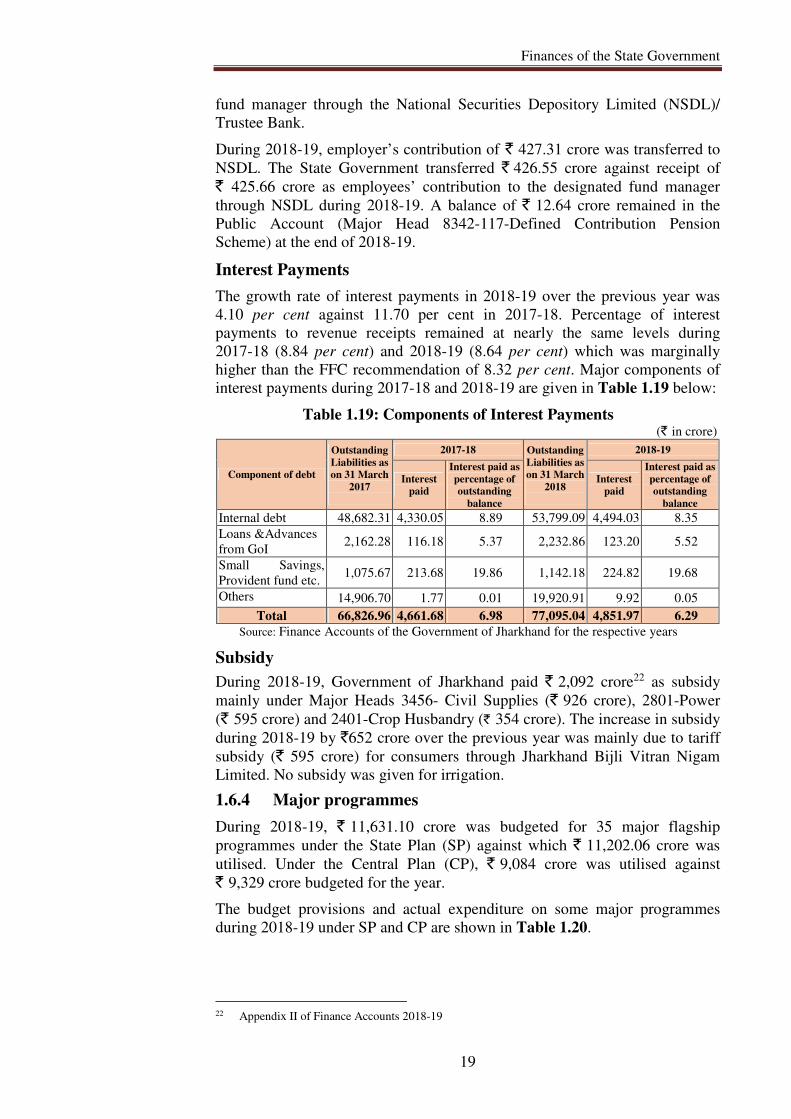
Interest Payments
The growth rate of interest payments in 2018-19 over the previous year was
4.10 per cent against 11.70 per cent in 2017-18. Percentage of interest
payments to revenue receipts remained at nearly the same levels during
2017-18 (8.84 per cent) and 2018-19 (8.64 per cent) which was marginally
higher than the FFC recommendation of 8.32 per cent. Major components of
interest payments during 2017-18 and 2018-19 are given in Table 1.19 below:
Table 1.19: Components of Interest Payments (` in crore)
Component of debt
Outstanding
Liabilities as
on 31 March
2017
2017-18 Outstanding
Liabilities as
on 31 March
2018
2018-19
Interest
paid
Interest paid as
percentage of
outstanding
balance
Interest
paid
Interest paid as
percentage of
outstanding
balance
Internal debt 48,682.31 4,330.05 8.89 53,799.09 4,494.03 8.35
Loans &Advances
from GoI 2,162.28 116.18 5.37 2,232.86 123.20 5.52
Small Savings,
Provident fund etc. 1,075.67 213.68 19.86 1,142.18 224.82 19.68
Others 14,906.70 1.77 0.01 19,920.91 9.92 0.05
Total 66,826.96 4,661.68 6.98 77,095.04 4,851.97 6.29
Source: Finance Accounts of the Government of Jharkhand for the respective years
Subsidy
During 2018-19, Government of Jharkhand paid ` 2,092 crore22 as subsidy
mainly under Major Heads 3456- Civil Supplies (` 926 crore), 2801-Power
(` 595 crore) and 2401-Crop Husbandry (` 354 crore). The increase in subsidy
during 2018-19 by `652 crore over the previous year was mainly due to tariff
subsidy (` 595 crore) for consumers through Jharkhand Bijli Vitran Nigam
Limited. No subsidy was given for irrigation.
1.6.4 Major programmes
During 2018-19, ` 11,631.10 crore was budgeted for 35 major flagship
programmes under the State Plan (SP) against which ` 11,202.06 crore was
utilised. Under the Central Plan (CP), ` 9,084 crore was utilised against
` 9,329 crore budgeted for the year.
The budget provisions and actual expenditure on some major programmes
during 2018-19 under SP and CP are shown in Table 1.20.
22 Appendix II of Finance Accounts 2018-19
State Finances Audit Report for the year ended 31 March 2019
20
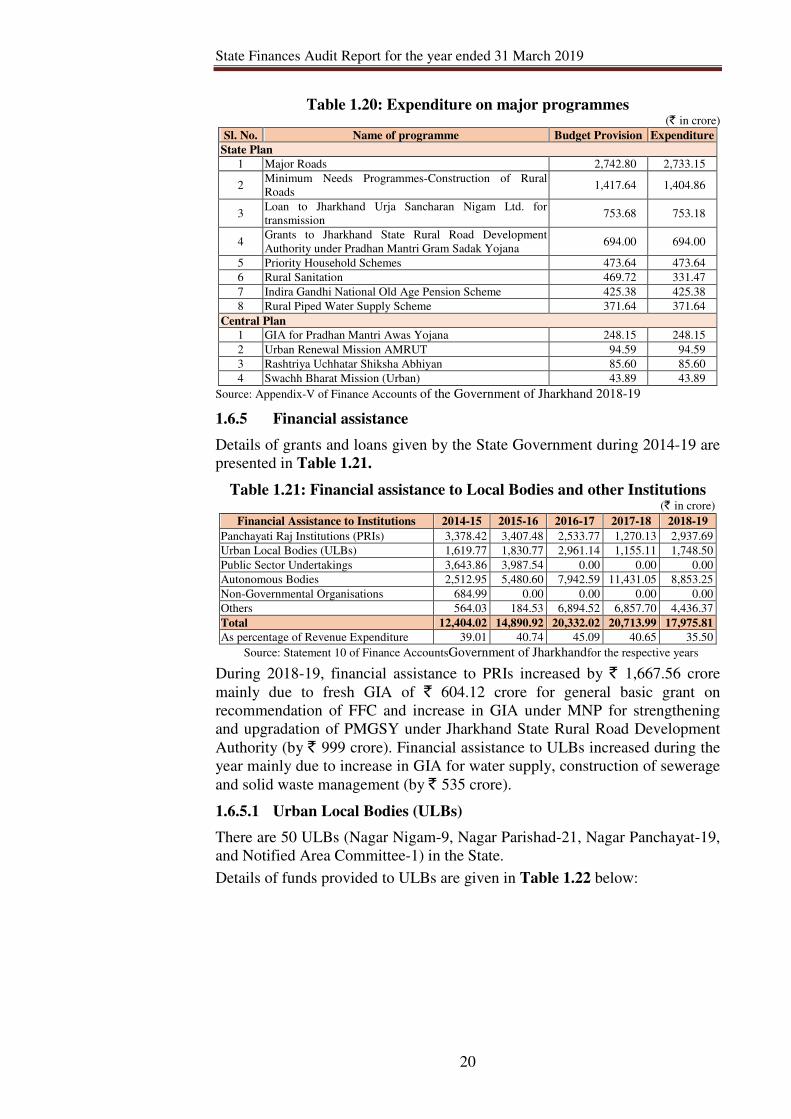
Table 1.20: Expenditure on major programmes (` in crore)
Sl. No. Name of programme Budget Provision Expenditure
State Plan
1 Major Roads 2,742.80 2,733.15
2 Minimum Needs Programmes-Construction of Rural
Roads 1,417.64 1,404.86
3 Loan to Jharkhand Urja Sancharan Nigam Ltd. for
transmission 753.68 753.18
4 Grants to Jharkhand State Rural Road Development
Authority under Pradhan Mantri Gram Sadak Yojana 694.00 694.00
5 Priority Household Schemes 473.64 473.64
6 Rural Sanitation 469.72 331.47
7 Indira Gandhi National Old Age Pension Scheme 425.38 425.38
8 Rural Piped Water Supply Scheme 371.64 371.64
Central Plan
1 GIA for Pradhan Mantri Awas Yojana 248.15 248.15
2 Urban Renewal Mission AMRUT 94.59 94.59
3 Rashtriya Uchhatar Shiksha Abhiyan 85.60 85.60
4 Swachh Bharat Mission (Urban) 43.89 43.89
Source: Appendix-V of Finance Accounts of the Government of Jharkhand 2018-19
1.6.5 Financial assistance
Details of grants and loans given by the State Government during 2014-19 are
presented in Table 1.21.
Table 1.21: Financial assistance to Local Bodies and other Institutions (` in crore)
Financial Assistance to Institutions 2014-15 2015-16 2016-17 2017-18 2018-19
Panchayati Raj Institutions (PRIs) 3,378.42 3,407.48 2,533.77 1,270.13 2,937.69
Urban Local Bodies (ULBs) 1,619.77 1,830.77 2,961.14 1,155.11 1,748.50
Public Sector Undertakings 3,643.86 3,987.54 0.00 0.00 0.00
Autonomous Bodies 2,512.95 5,480.60 7,942.59 11,431.05 8,853.25
Non-Governmental Organisations 684.99 0.00 0.00 0.00 0.00
Others 564.03 184.53 6,894.52 6,857.70 4,436.37
Total 12,404.02 14,890.92 20,332.02 20,713.99 17,975.81
As percentage of Revenue Expenditure 39.01 40.74 45.09 40.65 35.50
Source: Statement 10 of Finance AccountsGovernment of Jharkhandfor the respective years
During 2018-19, financial assistance to PRIs increased by ` 1,667.56 crore
mainly due to fresh GIA of ` 604.12 crore for general basic grant on
recommendation of FFC and increase in GIA under MNP for strengthening
and upgradation of PMGSY under Jharkhand State Rural Road Development
Authority (by ` 999 crore). Financial assistance to ULBs increased during the
year mainly due to increase in GIA for water supply, construction of sewerage
and solid waste management (by ` 535 crore).
1.6.5.1 Urban Local Bodies (ULBs)
There are 50 ULBs (Nagar Nigam-9, Nagar Parishad-21, Nagar Panchayat-19,
and Notified Area Committee-1) in the State.
Details of funds provided to ULBs are given in Table 1.22 below:
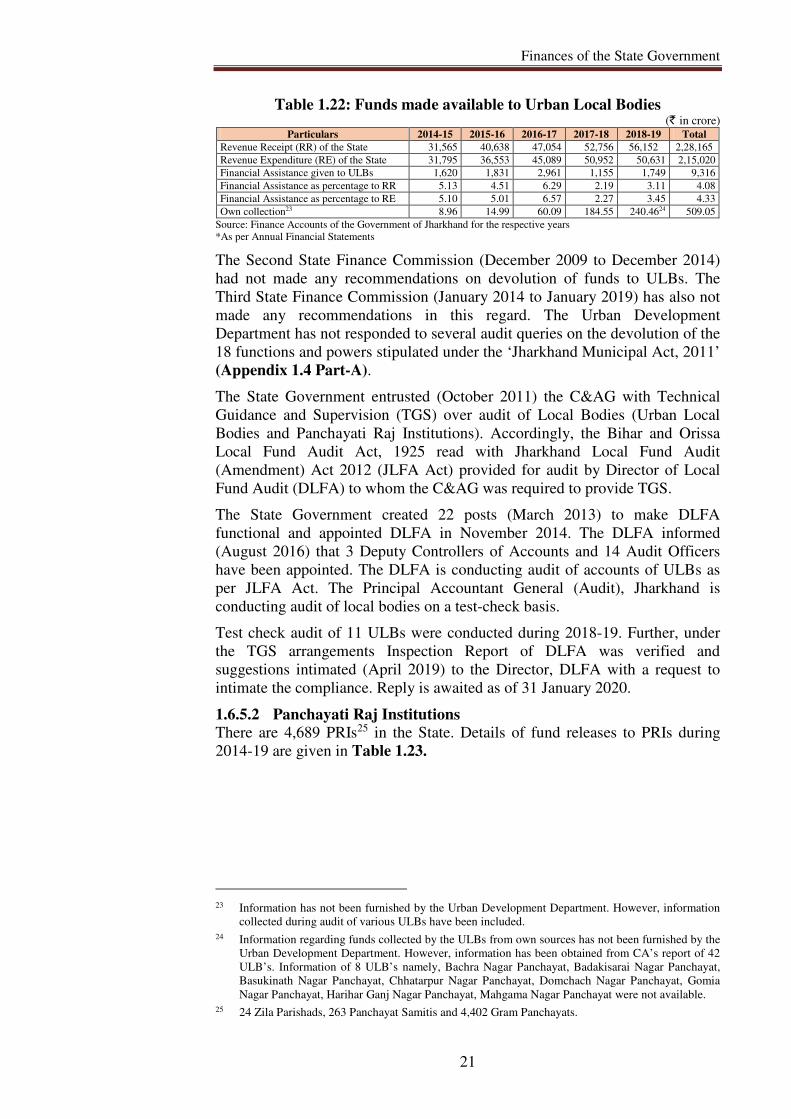
Finances of the State Government
21
Table 1.22: Funds made available to Urban Local Bodies (` in crore)
Particulars 2014-15 2015-16 2016-17 2017-18 2018-19 Total
Revenue Receipt (RR) of the State 31,565 40,638 47,054 52,756 56,152 2,28,165
Revenue Expenditure (RE) of the State 31,795 36,553 45,089 50,952 50,631 2,15,020
Financial Assistance given to ULBs 1,620 1,831 2,961 1,155 1,749 9,316
Financial Assistance as percentage to RR 5.13 4.51 6.29 2.19 3.11 4.08
Financial Assistance as percentage to RE 5.10 5.01 6.57 2.27 3.45 4.33
Own collection23 8.96 14.99 60.09 184.55 240.4624 509.05
Source: Finance Accounts of the Government of Jharkhand for the respective years
*As per Annual Financial Statements
The Second State Finance Commission (December 2009 to December 2014)
had not made any recommendations on devolution of funds to ULBs. The
Third State Finance Commission (January 2014 to January 2019) has also not
made any recommendations in this regard. The Urban Development
Department has not responded to several audit queries on the devolution of the
18 functions and powers stipulated under the ‘Jharkhand Municipal Act, 2011’
(Appendix 1.4 Part-A).
The State Government entrusted (October 2011) the C&AG with Technical
Guidance and Supervision (TGS) over audit of Local Bodies (Urban Local
Bodies and Panchayati Raj Institutions). Accordingly, the Bihar and Orissa
Local Fund Audit Act, 1925 read with Jharkhand Local Fund Audit
(Amendment) Act 2012 (JLFA Act) provided for audit by Director of Local
Fund Audit (DLFA) to whom the C&AG was required to provide TGS.
The State Government created 22 posts (March 2013) to make DLFA
functional and appointed DLFA in November 2014. The DLFA informed
(August 2016) that 3 Deputy Controllers of Accounts and 14 Audit Officers
have been appointed. The DLFA is conducting audit of accounts of ULBs as
per JLFA Act. The Principal Accountant General (Audit), Jharkhand is
conducting audit of local bodies on a test-check basis.
Test check audit of 11 ULBs were conducted during 2018-19. Further, under
the TGS arrangements Inspection Report of DLFA was verified and
suggestions intimated (April 2019) to the Director, DLFA with a request to
intimate the compliance. Reply is awaited as of 31 January 2020.
1.6.5.2 Panchayati Raj Institutions
There are 4,689 PRIs25 in the State. Details of fund releases to PRIs during
2014-19 are given in Table 1.23.
23 Information has not been furnished by the Urban Development Department. However, information
collected during audit of various ULBs have been included.
24 Information regarding funds collected by the ULBs from own sources has not been furnished by the
Urban Development Department. However, information has been obtained from CA’s report of 42
ULB’s. Information of 8 ULB’s namely, Bachra Nagar Panchayat, Badakisarai Nagar Panchayat,
Basukinath Nagar Panchayat, Chhatarpur Nagar Panchayat, Domchach Nagar Panchayat, Gomia
Nagar Panchayat, Harihar Ganj Nagar Panchayat, Mahgama Nagar Panchayat were not available.
25 24 Zila Parishads, 263 Panchayat Samitis and 4,402 Gram Panchayats.
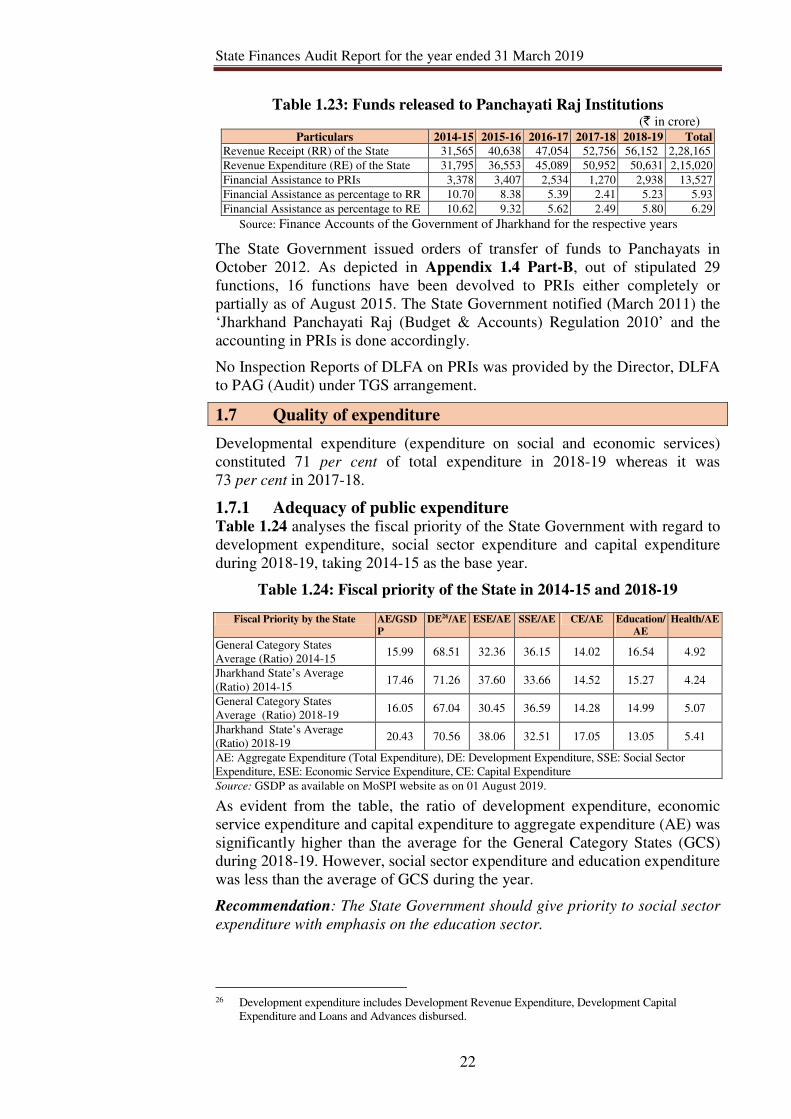
State Finances Audit Report for the year ended 31 March 2019
22
Table 1.23: Funds released to Panchayati Raj Institutions (` in crore)
Particulars 2014-15 2015-16 2016-17 2017-18 2018-19 Total
Revenue Receipt (RR) of the State 31,565 40,638 47,054 52,756 56,152 2,28,165
Revenue Expenditure (RE) of the State 31,795 36,553 45,089 50,952 50,631 2,15,020
Financial Assistance to PRIs 3,378 3,407 2,534 1,270 2,938 13,527
Financial Assistance as percentage to RR 10.70 8.38 5.39 2.41 5.23 5.93
Financial Assistance as percentage to RE 10.62 9.32 5.62 2.49 5.80 6.29
Source: Finance Accounts of the Government of Jharkhand for the respective years
The State Government issued orders of transfer of funds to Panchayats in
October 2012. As depicted in Appendix 1.4 Part-B, out of stipulated 29
functions, 16 functions have been devolved to PRIs either completely or
partially as of August 2015. The State Government notified (March 2011) the
‘Jharkhand Panchayati Raj (Budget & Accounts) Regulation 2010’ and the
accounting in PRIs is done accordingly.
No Inspection Reports of DLFA on PRIs was provided by the Director, DLFA
to PAG (Audit) under TGS arrangement.
1.7 Quality of expenditure
Developmental expenditure (expenditure on social and economic services)
constituted 71 per cent of total expenditure in 2018-19 whereas it was
73 per cent in 2017-18.
1.7.1 Adequacy of public expenditure Table 1.24 analyses the fiscal priority of the State Government with regard to
development expenditure, social sector expenditure and capital expenditure
during 2018-19, taking 2014-15 as the base year.
Table 1.24: Fiscal priority of the State in 2014-15 and 2018-19
Fiscal Priority by the State AE/GSD
P
DE26/AE ESE/AE SSE/AE CE/AE Education/
AE
Health/AE
General Category States
Average (Ratio) 2014-15 15.99 68.51 32.36 36.15 14.02 16.54 4.92
Jharkhand State’s Average
(Ratio) 2014-15 17.46 71.26 37.60 33.66 14.52 15.27 4.24
General Category States
Average (Ratio) 2018-19 16.05 67.04 30.45 36.59 14.28 14.99 5.07
Jharkhand State’s Average
(Ratio) 2018-19 20.43 70.56 38.06 32.51 17.05 13.05 5.41
AE: Aggregate Expenditure (Total Expenditure), DE: Development Expenditure, SSE: Social Sector
Expenditure, ESE: Economic Service Expenditure, CE: Capital Expenditure
Source: GSDP as available on MoSPI website as on 01 August 2019.
As evident from the table, the ratio of development expenditure, economic
service expenditure and capital expenditure to aggregate expenditure (AE) was
significantly higher than the average for the General Category States (GCS)
during 2018-19. However, social sector expenditure and education expenditure
was less than the average of GCS during the year.
Recommendation: The State Government should give priority to social sector
expenditure with emphasis on the education sector.
26 Development expenditure includes Development Revenue Expenditure, Development Capital
Expenditure and Loans and Advances disbursed.
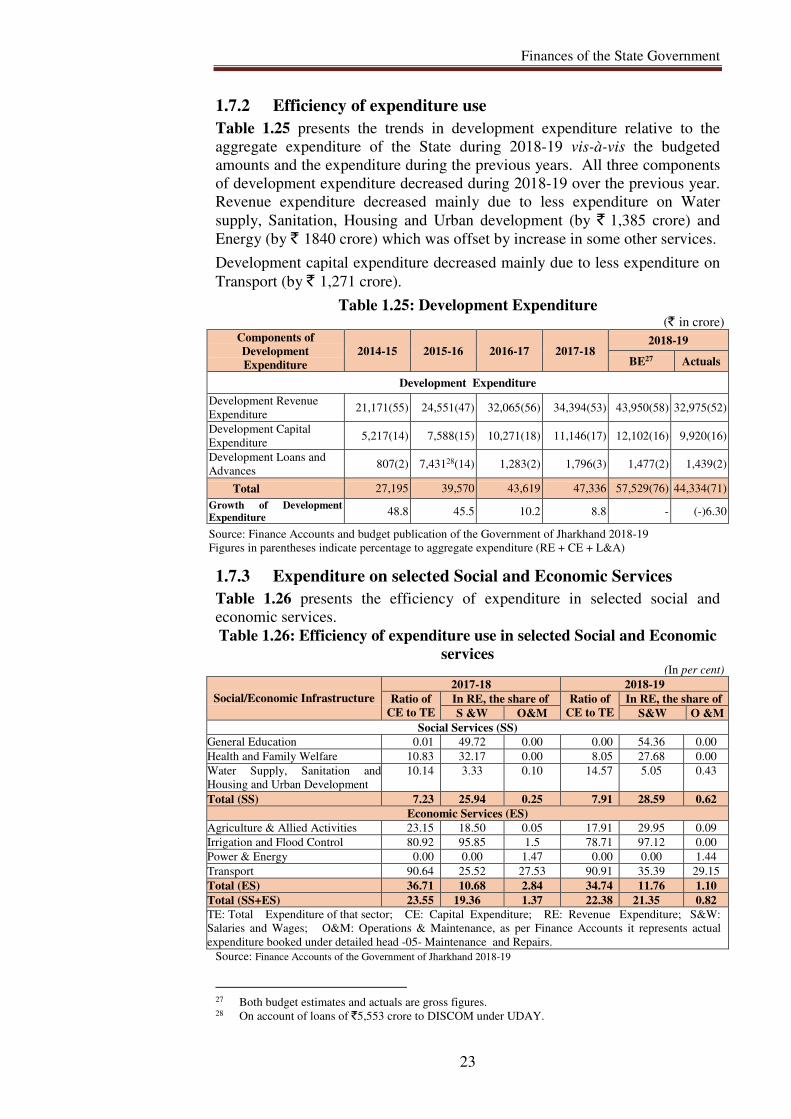
Finances of the State Government
23
1.7.2 Efficiency of expenditure use
Table 1.25 presents the trends in development expenditure relative to the
aggregate expenditure of the State during 2018-19 vis-à-vis the budgeted
amounts and the expenditure during the previous years. All three components
of development expenditure decreased during 2018-19 over the previous year.
Revenue expenditure decreased mainly due to less expenditure on Water
supply, Sanitation, Housing and Urban development (by ` 1,385 crore) and
Energy (by ` 1840 crore) which was offset by increase in some other services.
Development capital expenditure decreased mainly due to less expenditure on
Transport (by ` 1,271 crore).
Table 1.25: Development Expenditure (` in crore)
Components of
Development
Expenditure
2014-15 2015-16 2016-17 2017-18 2018-19
BE27 Actuals
Development Expenditure
Development Revenue
Expenditure 21,171(55) 24,551(47) 32,065(56) 34,394(53) 43,950(58) 32,975(52)
Development Capital
Expenditure 5,217(14) 7,588(15) 10,271(18) 11,146(17) 12,102(16) 9,920(16)
Development Loans and
Advances 807(2) 7,43128(14) 1,283(2) 1,796(3) 1,477(2) 1,439(2)
Total 27,195 39,570 43,619 47,336 57,529(76) 44,334(71)
Growth of Development
Expenditure 48.8 45.5 10.2 8.8 - (-)6.30
Source: Finance Accounts and budget publication of the Government of Jharkhand 2018-19
Figures in parentheses indicate percentage to aggregate expenditure (RE + CE + L&A)
1.7.3 Expenditure on selected Social and Economic Services
Table 1.26 presents the efficiency of expenditure in selected social and
economic services.
Table 1.26: Efficiency of expenditure use in selected Social and Economic
services (In per cent)
Social/Economic Infrastructure
2017-18 2018-19
Ratio of
CE to TE
In RE, the share of Ratio of
CE to TE
In RE, the share of
S &W O&M S&W O &M
Social Services (SS)
General Education 0.01 49.72 0.00 0.00 54.36 0.00
Health and Family Welfare 10.83 32.17 0.00 8.05 27.68 0.00
Water Supply, Sanitation and
Housing and Urban Development
10.14 3.33 0.10 14.57 5.05 0.43
Total (SS) 7.23 25.94 0.25 7.91 28.59 0.62
Economic Services (ES)
Agriculture & Allied Activities 23.15 18.50 0.05 17.91 29.95 0.09
Irrigation and Flood Control 80.92 95.85 1.5 78.71 97.12 0.00
Power & Energy 0.00 0.00 1.47 0.00 0.00 1.44
Transport 90.64 25.52 27.53 90.91 35.39 29.15
Total (ES) 36.71 10.68 2.84 34.74 11.76 1.10
Total (SS+ES) 23.55 19.36 1.37 22.38 21.35 0.82
TE: Total Expenditure of that sector; CE: Capital Expenditure; RE: Revenue Expenditure; S&W:
Salaries and Wages; O&M: Operations & Maintenance, as per Finance Accounts it represents actual
expenditure booked under detailed head -05- Maintenance and Repairs.
Source: Finance Accounts of the Government of Jharkhand 2018-19
27 Both budget estimates and actuals are gross figures. 28 On account of loans of `5,553 crore to DISCOM under UDAY.
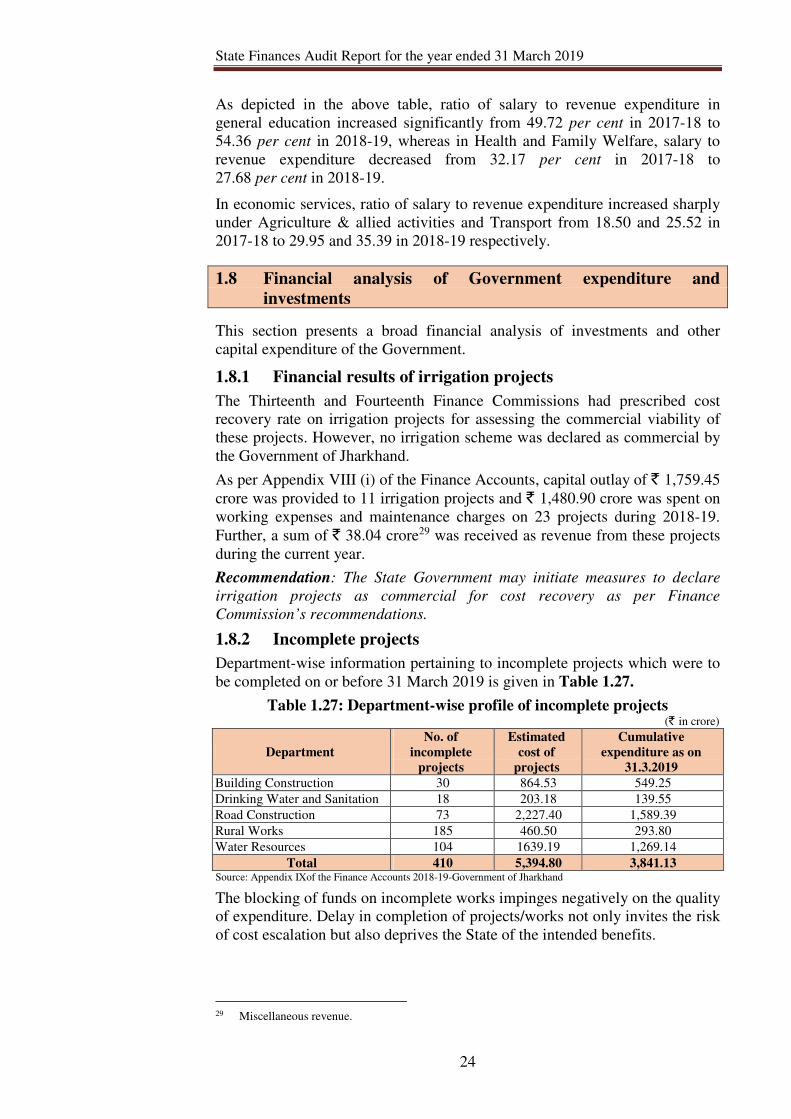
State Finances Audit Report for the year ended 31 March 2019
24
As depicted in the above table, ratio of salary to revenue expenditure in
general education increased significantly from 49.72 per cent in 2017-18 to
54.36 per cent in 2018-19, whereas in Health and Family Welfare, salary to
revenue expenditure decreased from 32.17 per cent in 2017-18 to
27.68 per cent in 2018-19.
In economic services, ratio of salary to revenue expenditure increased sharply
under Agriculture & allied activities and Transport from 18.50 and 25.52 in
2017-18 to 29.95 and 35.39 in 2018-19 respectively.
1.8 Financial analysis of Government expenditure and
investments
This section presents a broad financial analysis of investments and other
capital expenditure of the Government.
1.8.1 Financial results of irrigation projects
The Thirteenth and Fourteenth Finance Commissions had prescribed cost
recovery rate on irrigation projects for assessing the commercial viability of
these projects. However, no irrigation scheme was declared as commercial by
the Government of Jharkhand.
As per Appendix VIII (i) of the Finance Accounts, capital outlay of ` 1,759.45
crore was provided to 11 irrigation projects and ` 1,480.90 crore was spent on
working expenses and maintenance charges on 23 projects during 2018-19.
Further, a sum of ` 38.04 crore29 was received as revenue from these projects
during the current year.
Recommendation: The State Government may initiate measures to declare
irrigation projects as commercial for cost recovery as per Finance
Commission’s recommendations.
1.8.2 Incomplete projects
Department-wise information pertaining to incomplete projects which were to
be completed on or before 31 March 2019 is given in Table 1.27.
Table 1.27: Department-wise profile of incomplete projects (` in crore)
Department
No. of
incomplete
projects
Estimated
cost of
projects
Cumulative
expenditure as on
31.3.2019
Building Construction 30 864.53 549.25
Drinking Water and Sanitation 18 203.18 139.55
Road Construction 73 2,227.40 1,589.39
Rural Works 185 460.50 293.80
Water Resources 104 1639.19 1,269.14
Total 410 5,394.80 3,841.13 Source: Appendix IXof the Finance Accounts 2018-19-Government of Jharkhand
The blocking of funds on incomplete works impinges negatively on the quality
of expenditure. Delay in completion of projects/works not only invites the risk
of cost escalation but also deprives the State of the intended benefits.
29 Miscellaneous revenue.
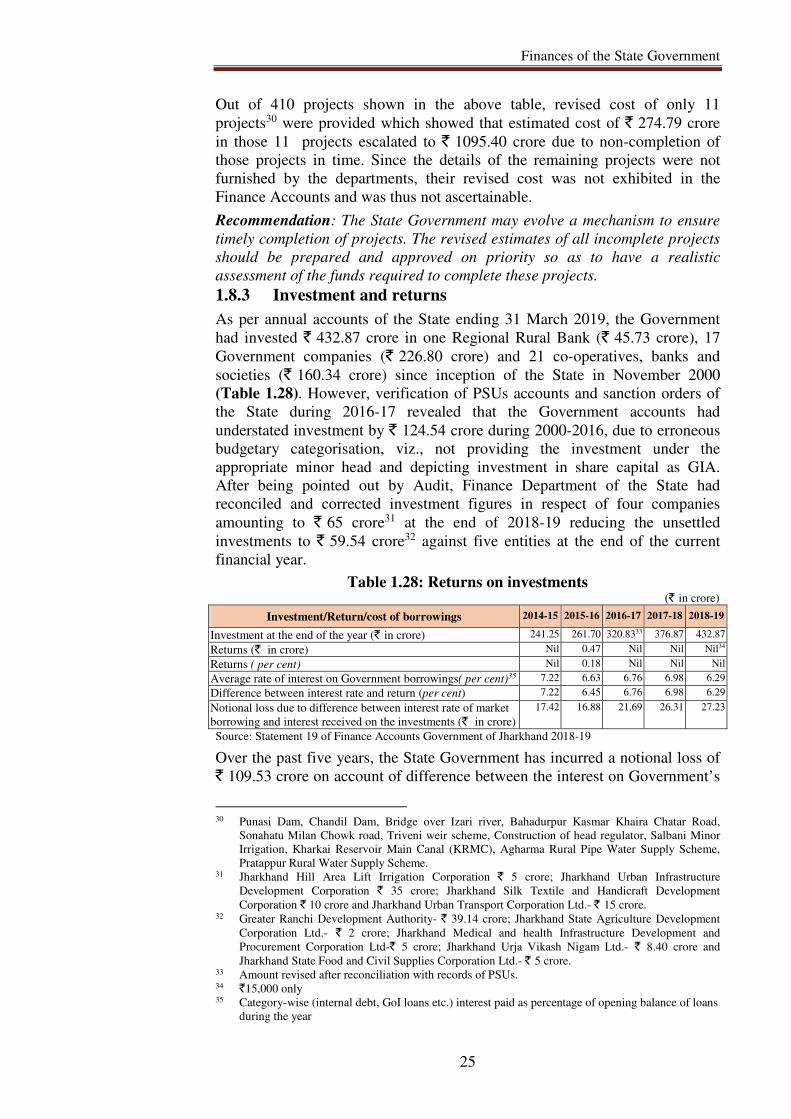
Finances of the State Government
25
Out of 410 projects shown in the above table, revised cost of only 11
projects30 were provided which showed that estimated cost of ` 274.79 crore
in those 11 projects escalated to ` 1095.40 crore due to non-completion of
those projects in time. Since the details of the remaining projects were not
furnished by the departments, their revised cost was not exhibited in the
Finance Accounts and was thus not ascertainable.
Recommendation: The State Government may evolve a mechanism to ensure
timely completion of projects. The revised estimates of all incomplete projects
should be prepared and approved on priority so as to have a realistic
assessment of the funds required to complete these projects.
1.8.3 Investment and returns
As per annual accounts of the State ending 31 March 2019, the Government
had invested ` 432.87 crore in one Regional Rural Bank (` 45.73 crore), 17
Government companies (` 226.80 crore) and 21 co-operatives, banks and
societies (` 160.34 crore) since inception of the State in November 2000
(Table 1.28). However, verification of PSUs accounts and sanction orders of
the State during 2016-17 revealed that the Government accounts had
understated investment by ` 124.54 crore during 2000-2016, due to erroneous
budgetary categorisation, viz., not providing the investment under the
appropriate minor head and depicting investment in share capital as GIA.
After being pointed out by Audit, Finance Department of the State had
reconciled and corrected investment figures in respect of four companies
amounting to ` 65 crore31 at the end of 2018-19 reducing the unsettled
investments to ` 59.54 crore32 against five entities at the end of the current
financial year.
Table 1.28: Returns on investments (` in crore)
Investment/Return/cost of borrowings 2014-15 2015-16 2016-17 2017-18 2018-19
Investment at the end of the year (` in crore) 241.25 261.70 320.8333 376.87 432.87
Returns (` in crore) Nil 0.47 Nil Nil Nil34
Returns ( per cent) Nil 0.18 Nil Nil Nil
Average rate of interest on Government borrowings( per cent)35 7.22 6.63 6.76 6.98 6.29
Difference between interest rate and return (per cent) 7.22 6.45 6.76 6.98 6.29
Notional loss due to difference between interest rate of market
borrowing and interest received on the investments (` in crore)
17.42 16.88 21.69 26.31 27.23
Source: Statement 19 of Finance Accounts Government of Jharkhand 2018-19
Over the past five years, the State Government has incurred a notional loss of
` 109.53 crore on account of difference between the interest on Government’s
30 Punasi Dam, Chandil Dam, Bridge over Izari river, Bahadurpur Kasmar Khaira Chatar Road,
Sonahatu Milan Chowk road, Triveni weir scheme, Construction of head regulator, Salbani Minor
Irrigation, Kharkai Reservoir Main Canal (KRMC), Agharma Rural Pipe Water Supply Scheme,
Pratappur Rural Water Supply Scheme. 31 Jharkhand Hill Area Lift Irrigation Corporation ` 5 crore; Jharkhand Urban Infrastructure
Development Corporation ` 35 crore; Jharkhand Silk Textile and Handicraft Development
Corporation ` 10 crore and Jharkhand Urban Transport Corporation Ltd.- ` 15 crore. 32 Greater Ranchi Development Authority- ` 39.14 crore; Jharkhand State Agriculture Development
Corporation Ltd.- ` 2 crore; Jharkhand Medical and health Infrastructure Development and
Procurement Corporation Ltd-` 5 crore; Jharkhand Urja Vikash Nigam Ltd.- ` 8.40 crore and
Jharkhand State Food and Civil Supplies Corporation Ltd.- ` 5 crore. 33 Amount revised after reconciliation with records of PSUs. 34 `15,000 only 35 Category-wise (internal debt, GoI loans etc.) interest paid as percentage of opening balance of loans
during the year
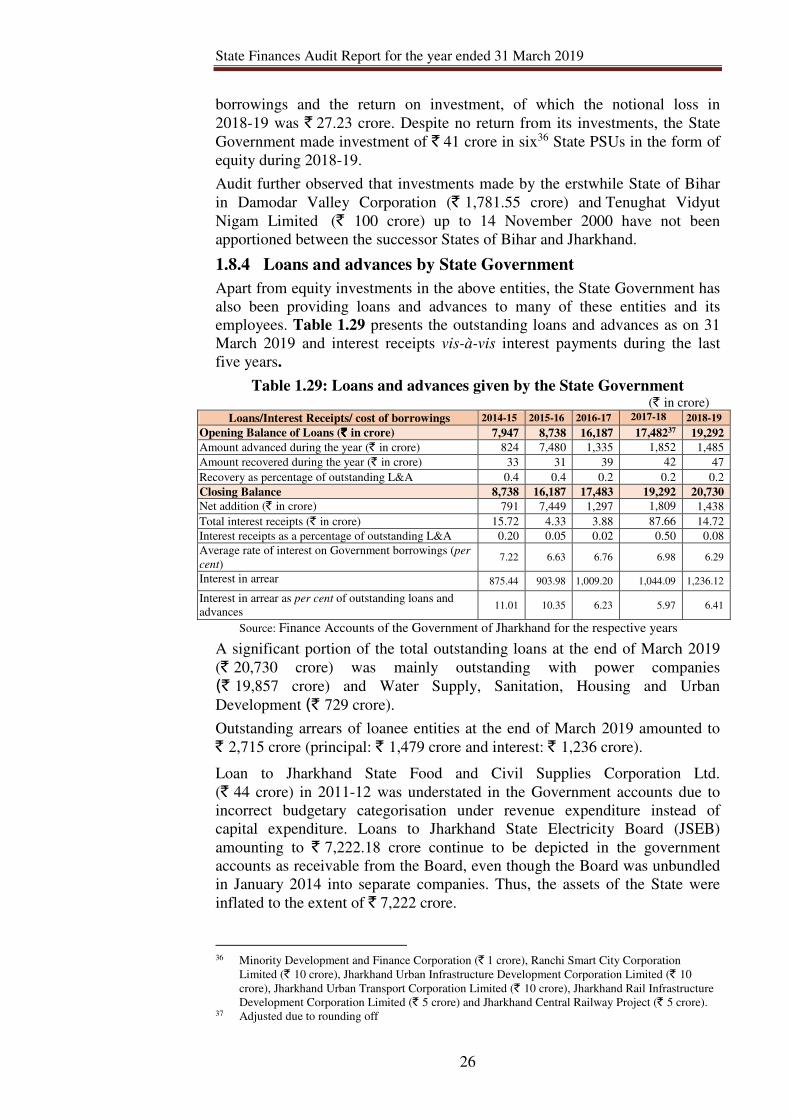
State Finances Audit Report for the year ended 31 March 2019
26
borrowings and the return on investment, of which the notional loss in
2018-19 was ` 27.23 crore. Despite no return from its investments, the State
Government made investment of ` 41 crore in six36 State PSUs in the form of
equity during 2018-19.
Audit further observed that investments made by the erstwhile State of Bihar
in Damodar Valley Corporation (` 1,781.55 crore) and Tenughat Vidyut
Nigam Limited (` 100 crore) up to 14 November 2000 have not been
apportioned between the successor States of Bihar and Jharkhand.
1.8.4 Loans and advances by State Government
Apart from equity investments in the above entities, the State Government has
also been providing loans and advances to many of these entities and its
employees. Table 1.29 presents the outstanding loans and advances as on 31
March 2019 and interest receipts vis-à-vis interest payments during the last
five years.
Table 1.29: Loans and advances given by the State Government (` in crore)
Loans/Interest Receipts/ cost of borrowings 2014-15 2015-16 2016-17 2017-18 2018-19
Opening Balance of Loans (`̀̀̀ in crore) 7,947 8,738 16,187 17,48237 19,292
Amount advanced during the year (` in crore) 824 7,480 1,335 1,852 1,485
Amount recovered during the year (` in crore) 33 31 39 42 47
Recovery as percentage of outstanding L&A 0.4 0.4 0.2 0.2 0.2
Closing Balance 8,738 16,187 17,483 19,292 20,730
Net addition (` in crore) 791 7,449 1,297 1,809 1,438
Total interest receipts (` in crore) 15.72 4.33 3.88 87.66 14.72
Interest receipts as a percentage of outstanding L&A 0.20 0.05 0.02 0.50 0.08
Average rate of interest on Government borrowings (per
cent) 7.22 6.63 6.76 6.98 6.29
Interest in arrear 875.44 903.98 1,009.20 1,044.09 1,236.12
Interest in arrear as per cent of outstanding loans and
advances 11.01 10.35 6.23 5.97 6.41
Source: Finance Accounts of the Government of Jharkhand for the respective years
A significant portion of the total outstanding loans at the end of March 2019
(` 20,730 crore) was mainly outstanding with power companies
(` 19,857 crore) and Water Supply, Sanitation, Housing and Urban
Development (` 729 crore).
Outstanding arrears of loanee entities at the end of March 2019 amounted to
` 2,715 crore (principal: ` 1,479 crore and interest: ` 1,236 crore).
Loan to Jharkhand State Food and Civil Supplies Corporation Ltd.
(` 44 crore) in 2011-12 was understated in the Government accounts due to
incorrect budgetary categorisation under revenue expenditure instead of
capital expenditure. Loans to Jharkhand State Electricity Board (JSEB)
amounting to ` 7,222.18 crore continue to be depicted in the government
accounts as receivable from the Board, even though the Board was unbundled
in January 2014 into separate companies. Thus, the assets of the State were
inflated to the extent of ` 7,222 crore.
36 Minority Development and Finance Corporation (` 1 crore), Ranchi Smart City Corporation
Limited (` 10 crore), Jharkhand Urban Infrastructure Development Corporation Limited (` 10
crore), Jharkhand Urban Transport Corporation Limited (` 10 crore), Jharkhand Rail Infrastructure
Development Corporation Limited (` 5 crore) and Jharkhand Central Railway Project (` 5 crore). 37 Adjusted due to rounding off
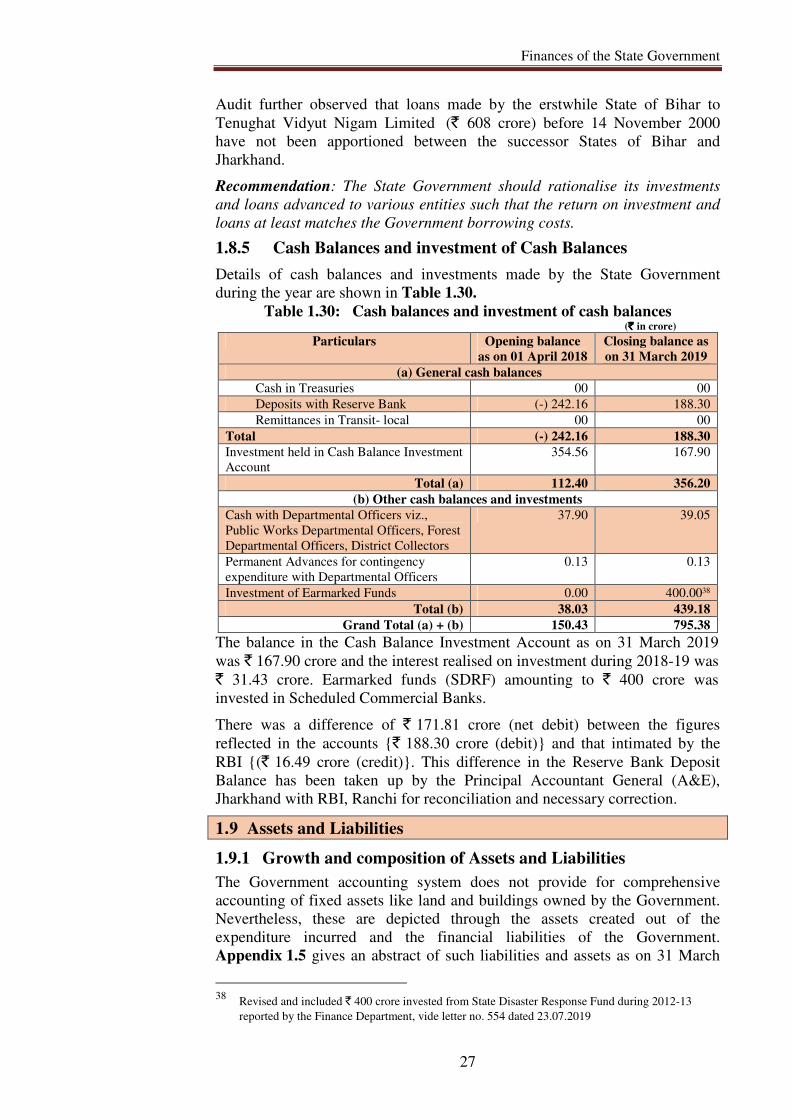
Finances of the State Government
27
Audit further observed that loans made by the erstwhile State of Bihar to
Tenughat Vidyut Nigam Limited (` 608 crore) before 14 November 2000
have not been apportioned between the successor States of Bihar and
Jharkhand.
Recommendation: The State Government should rationalise its investments
and loans advanced to various entities such that the return on investment and
loans at least matches the Government borrowing costs.
1.8.5 Cash Balances and investment of Cash Balances
Details of cash balances and investments made by the State Government
during the year are shown in Table 1.30.
Table 1.30: Cash balances and investment of cash balances (` ` ` ` in crore)
Particulars Opening balance
as on 01 April 2018
Closing balance as
on 31 March 2019
(a) General cash balances
Cash in Treasuries 00 00
Deposits with Reserve Bank (-) 242.16 188.30
Remittances in Transit- local 00 00
Total (-) 242.16 188.30
Investment held in Cash Balance Investment
Account
354.56 167.90
Total (a) 112.40 356.20
(b) Other cash balances and investments
Cash with Departmental Officers viz.,
Public Works Departmental Officers, Forest
Departmental Officers, District Collectors
37.90 39.05
Permanent Advances for contingency
expenditure with Departmental Officers
0.13 0.13
Investment of Earmarked Funds 0.00 400.0038
Total (b) 38.03 439.18
Grand Total (a) + (b) 150.43 795.38
The balance in the Cash Balance Investment Account as on 31 March 2019
was ` 167.90 crore and the interest realised on investment during 2018-19 was
` 31.43 crore. Earmarked funds (SDRF) amounting to ` 400 crore was
invested in Scheduled Commercial Banks.
There was a difference of ` 171.81 crore (net debit) between the figures
reflected in the accounts {` 188.30 crore (debit)} and that intimated by the
RBI {(` 16.49 crore (credit)}. This difference in the Reserve Bank Deposit
Balance has been taken up by the Principal Accountant General (A&E),
Jharkhand with RBI, Ranchi for reconciliation and necessary correction.
1.9 Assets and Liabilities
1.9.1 Growth and composition of Assets and Liabilities
The Government accounting system does not provide for comprehensive
accounting of fixed assets like land and buildings owned by the Government.
Nevertheless, these are depicted through the assets created out of the
expenditure incurred and the financial liabilities of the Government.
Appendix 1.5 gives an abstract of such liabilities and assets as on 31 March
38 Revised and included ` 400 crore invested from State Disaster Response Fund during 2012-13
reported by the Finance Department, vide letter no. 554 dated 23.07.2019
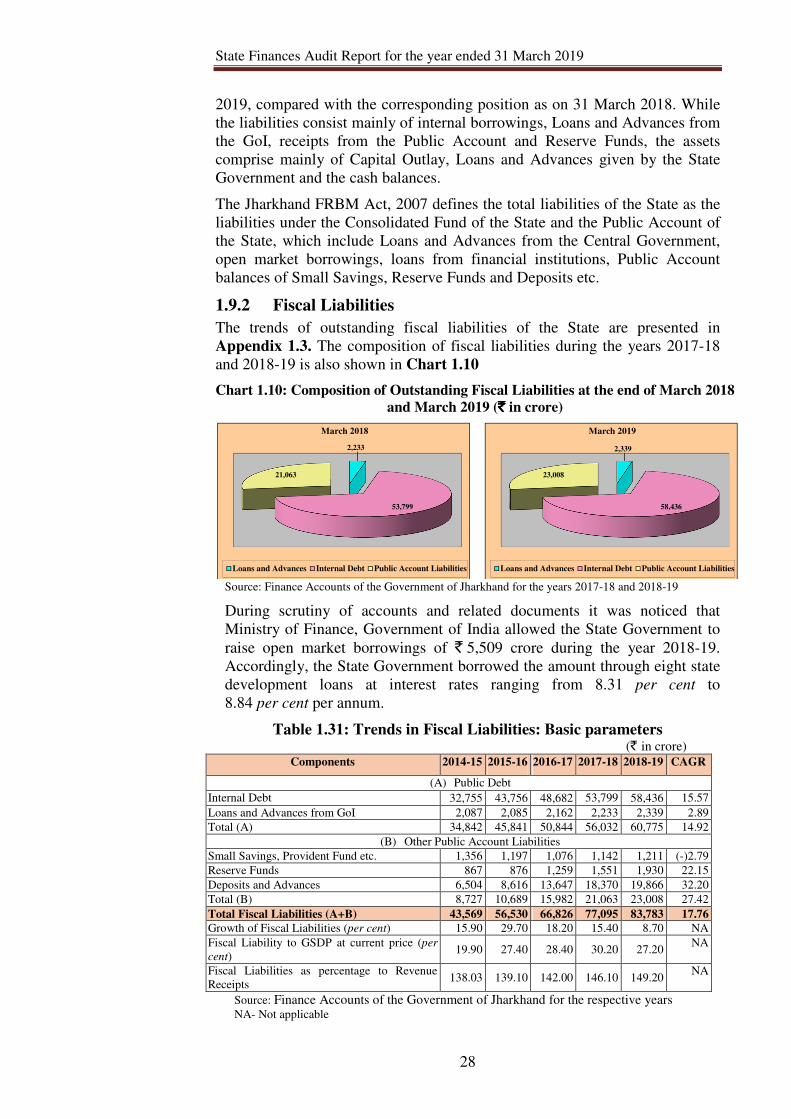
State Finances Audit Report for the year ended 31 March 2019
28
2019, compared with the corresponding position as on 31 March 2018. While
the liabilities consist mainly of internal borrowings, Loans and Advances from
the GoI, receipts from the Public Account and Reserve Funds, the assets
comprise mainly of Capital Outlay, Loans and Advances given by the State
Government and the cash balances.
The Jharkhand FRBM Act, 2007 defines the total liabilities of the State as the
liabilities under the Consolidated Fund of the State and the Public Account of
the State, which include Loans and Advances from the Central Government,
open market borrowings, loans from financial institutions, Public Account
balances of Small Savings, Reserve Funds and Deposits etc.
1.9.2 Fiscal Liabilities
The trends of outstanding fiscal liabilities of the State are presented in
Appendix 1.3. The composition of fiscal liabilities during the years 2017-18
and 2018-19 is also shown in Chart 1.10
Chart 1.10: Composition of Outstanding Fiscal Liabilities at the end of March 2018
and March 2019 (`̀̀̀ in crore)
Source: Finance Accounts of the Government of Jharkhand for the years 2017-18 and 2018-19
During scrutiny of accounts and related documents it was noticed that
Ministry of Finance, Government of India allowed the State Government to
raise open market borrowings of ` 5,509 crore during the year 2018-19.
Accordingly, the State Government borrowed the amount through eight state
development loans at interest rates ranging from 8.31 per cent to
8.84 per cent per annum.
Table 1.31: Trends in Fiscal Liabilities: Basic parameters (` in crore)
Components 2014-15 2015-16 2016-17 2017-18 2018-19 CAGR
(A) Public Debt
Internal Debt 32,755 43,756 48,682 53,799 58,436 15.57
Loans and Advances from GoI 2,087 2,085 2,162 2,233 2,339 2.89
Total (A) 34,842 45,841 50,844 56,032 60,775 14.92
(B) Other Public Account Liabilities
Small Savings, Provident Fund etc. 1,356 1,197 1,076 1,142 1,211 (-)2.79
Reserve Funds 867 876 1,259 1,551 1,930 22.15
Deposits and Advances 6,504 8,616 13,647 18,370 19,866 32.20
Total (B) 8,727 10,689 15,982 21,063 23,008 27.42
Total Fiscal Liabilities (A+B) 43,569 56,530 66,826 77,095 83,783 17.76
Growth of Fiscal Liabilities (per cent) 15.90 29.70 18.20 15.40 8.70 NA
Fiscal Liability to GSDP at current price (per
cent) 19.90 27.40 28.40 30.20 27.20
NA
Fiscal Liabilities as percentage to Revenue
Receipts 138.03 139.10 142.00 146.10 149.20
NA
Source: Finance Accounts of the Government of Jharkhand for the respective years
NA- Not applicable
2,233
53,799
21,063
March 2018
Loans and Advances Internal Debt Public Account Liabilities
2,339
58,436
23,008
March 2019
Loans and Advances Internal Debt Public Account Liabilities
Finances of the State Government
29
During the years 2014-15 to 2018-19, the total debt stock of the Government
increased from ` 43,569 crore (1 April 2015) to ` 83,783 crore (31 March
2019). Maturity profile of public debt is detailed in Table 1.32 under para
1.10.1.
The fiscal liabilities of undivided Bihar are yet to be apportioned between the
successor States.
Recommendation: The State should take steps to achieve the normative
projection of FFC in respect of fiscal parameters of the State.
1.9.3 Sinking Fund
Following the recommendations of the Twelfth Finance Commission, the State
has created a Consolidated Sinking Fund for amortisation of all loans
including loans from banks, liabilities on account of National Small Savings
Funds etc., during 2016-17. Further, a minimum annual contribution of
0.50 per cent of outstanding liabilities at the beginning of the year was
required to be transferred to the fund.
GoJ had an outstanding debt of ` 77,095 crore at the beginning of 2018-19, for
which a minimum amount of ` 385.48 crore was required to be transferred to
the Fund. Though GoJ made budget provision of ` 255 crore during the year,
the amount was not transferred to the Fund resulting in inflating the revenue
surplus and understating the fiscal deficit of the State as discussed in
Paragraph 3.9.
1.9.4 State Disaster Response Fund (SDRF)
As per Para 7 of SDRF guidelines 2015, the State Government is required to
transfer the contribution to the SDRF received from GoI along with its share
to Public Account head within 15 days of its receipt. Any delay will require
the State Government to release the amount with interest (bank rate of RBI)
for the number of days of delay.
It was noticed that during 2018-19, the State Government transferred the
contribution from GoI along with its share into Public Account with a delay of
11 days (` 210.50 crore) and 184 days (` 31.58 crore) after receipt of Central
share, for which the State Government was liable to pay interest of
` 1.46 crore, which was not paid.
As per Para 19 and 20 of SDRF guidelines 2015, the balances under the funds
should be invested by the State in (a) Central Government dated securities (b)
auctioned treasury bills and (c) interest earning deposits and certificates of
deposits with Scheduled Commercial Banks. The Finance Department of the
Government of Jharkhand, had informed39 (July 2019) that ` 400 crore was
invested in Scheduled Commercial Banks during the year 2012-13.
Further, as per the guidelines, the Government was required to pay interest on
the uninvested balances at the rate of interest (8.25 per cent) payable on
overdrafts, which is to be added to the corpus of the fund itself. However, GoJ
had not paid any interest to SDRF since its creation, which works out to
` 535.27 crore at the applicable rates of interest for the period 2011-19. Of
this, unpaid interest for 2018-19 alone amounted to ` 94.96 crore, resulting in
overstatement of revenue surplus and understatement of fiscal deficit for the
39 vide letter no. 554 dated 23 July 2019
State Finances Audit Report for the year ended 31 March 2019
30
year as discussed in Paragraph 3.9. Consequently, the uninvested balances of
` 1,930.09 crore in the Fund as on 31 March 2019 are only book entries and
do not represent actual cash balance. Such unpaid interest since the operation
of the Fund represent the unaccounted liabilities of the State.
Recommendation: The State should ensure timely transfer of contribution
received from GoI along with its share into public account and also invest the
balances lying under the fund as per the SDRF guidelines.
1.9.5 Status of Guarantees – Contingent liabilities
The Constitution of India provides that a State may borrow, within the
territory of India, upon the security of its Consolidated Fund, within such
limits, as may from time to time, be fixed by the Act of its Legislature and
give guarantees within such limits as may be fixed.
As per the recommendation of the Twelfth Finance Commission, the GoJ was
required to constitute a Guarantee Redemption Fund (GRF) with minimum
annual contribution of 0.50 per cent of outstanding guarantees at the beginning
of the year. However, the Fund has not been created.
1.10 Debt Management
1.10.1 Debt profile Apart from the magnitude of debt of the State Government, it is important to
analyse the various indicators that determine the debt sustainability40 of the
State. This section assesses the sustainability of debt of the State Government
in terms of debt stabilisation41; sufficiency of non-debt receipts42; net
availability of borrowed funds43; burden of interest payments (measured by
interest payments to revenue receipts ratio) and the maturity profile of State
Government securities.
Maturity profile of public debt is detailed in Table 1.32.
40 Debt sustainability is defined as the ability of the State to maintain a constant debt-GSDP ratio over
a period of time. It also embodies the concern about the ability to service its debt. Sustainability of
debt, therefore, also refers to sufficiency of liquid assets to meet current or committed obligations
and the capacity to keep a balance between costs of additional borrowings and returns from such
borrowings. It means that a rise in fiscal deficit should match the increase in capacity to service the
debt. 41 A necessary condition for stability states that if the rate of growth of the economy exceeds the
interest rate or the cost of public borrowings, the debt-GSDP ratio is likely to be stable provided the
primary balances are either zero or positive or are moderately negative. 42 Adequacy of incremental non-debt receipts of the State to cover the incremental interest liabilities
and incremental primary expenditure. Debt sustainability could be significantly facilitated if the
incremental non-debt receipts could meet the incremental interest burden and the incremental
primary expenditure. 43 Defined as the ratio of debt redemption (Principal + Interest Payments) to total debt receipts and
indicates the extent to which debt receipts are used in debt redemption indicating the net availability
of borrowed funds.
Finances of the State Government
31
Table 1.32: Maturity Profile of Public Debt (` in crore)
Maturity Year Internal
Debt
Loans and Advances
from GoI
Total Per cent
2019-20 2,614 194 2,808 4.62
2020-21 1,269 206 1,475 2.43
2021-22 2,579 217 2,796 4.60
2022-23 4,925 217 5,142 8.46
2023-24 4,275 222 4,497 7.40
2024-25 6,275 224 6,499 10.69
2025-26 6,579 194 6,773 11.14
2026-27 6,247 89 6,336 10.43
2027-28 2,062 88 2,150 3.54
2028-29 6,519 87 6,606 10.87
2029-30 onwards 7,647 598 8,245 13.56
Details of maturity
year not available 7,446 3 7,449 12.26
Total 58,437 2,339 60,776 100.00 Source: Finance Accounts 2018-19
The maturity profile of public debt revealed that the redemption pressure is
likely to rise from the year 2022-23 and reach a peak in the year 2025-26 due
to maturity of Jharkhand Government stock.
1.10.2 Debt Sustainability
Fiscal liabilities are considered sustainable if the Government is able to
service the stock of these liabilities over the foreseeable future and the
debt-GSDP ratio does not grow to unmanageable proportions. The Domar
model is one of the models for analysis of public debts, which lays down that
the debt-GDP ratio is likely to be stable if the rate of growth of the economy
exceeds the rate of interest on the debt. Table 1.33 provides the Domar
sustainability condition:
Table 1.33: Debt sustainability criteria under Domar model
g-r (g: real economic
growth rate; r: real
interest rate), called
Domar gap
s<0 (primary deficit) s>0 (primary surplus)
g-r > 0 (strong
economic growth)
Public debt as a percentage of GSDP
tends towards a stable value and is
therefore sustainable. Depending on the
stock of debt, it will either increase or
decrease in time to reach a stable level
greater than zero.
Public debt as a
percentage of GSDP
should converge to a
stable level less than
zero leading to public
savings.
g-r < 0 (slow
economic growth)
Public debt as a percentage of GSDP
will increase indefinitely, without
converging to a stable level
Undefined situation
Applying the DOMAR analysis to Jharkhand showed that fiscal liabilities
should converge to a stable level, as shown in the following Table 1.34.
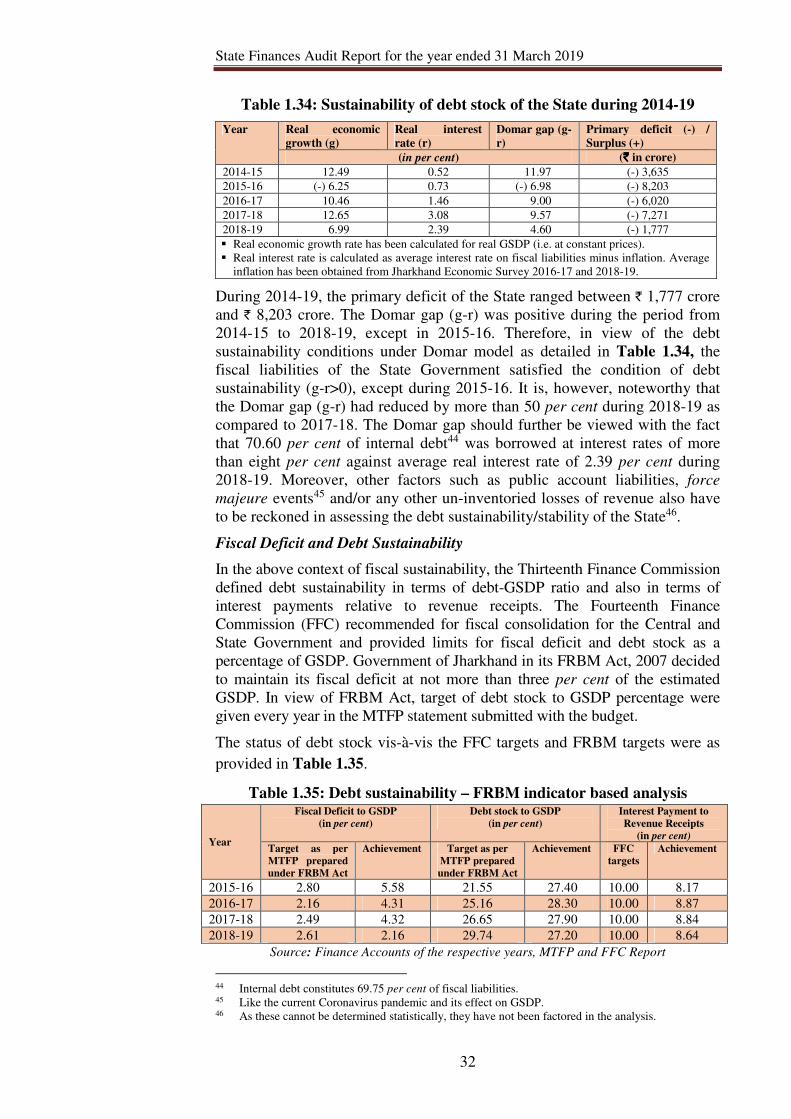
State Finances Audit Report for the year ended 31 March 2019
32
Table 1.34: Sustainability of debt stock of the State during 2014-19
Year Real economic
growth (g)
Real interest
rate (r)
Domar gap (g-
r)
Primary deficit (-) /
Surplus (+)
(in per cent) (`̀̀̀ in crore)
2014-15 12.49 0.52 11.97 (-) 3,635
2015-16 (-) 6.25 0.73 (-) 6.98 (-) 8,203
2016-17 10.46 1.46 9.00 (-) 6,020
2017-18 12.65 3.08 9.57 (-) 7,271
2018-19 6.99 2.39 4.60 (-) 1,777
� Real economic growth rate has been calculated for real GSDP (i.e. at constant prices).
� Real interest rate is calculated as average interest rate on fiscal liabilities minus inflation. Average
inflation has been obtained from Jharkhand Economic Survey 2016-17 and 2018-19.
During 2014-19, the primary deficit of the State ranged between ` 1,777 crore
and ` 8,203 crore. The Domar gap (g-r) was positive during the period from
2014-15 to 2018-19, except in 2015-16. Therefore, in view of the debt
sustainability conditions under Domar model as detailed in Table 1.34, the
fiscal liabilities of the State Government satisfied the condition of debt
sustainability (g-r>0), except during 2015-16. It is, however, noteworthy that
the Domar gap (g-r) had reduced by more than 50 per cent during 2018-19 as
compared to 2017-18. The Domar gap should further be viewed with the fact
that 70.60 per cent of internal debt44 was borrowed at interest rates of more
than eight per cent against average real interest rate of 2.39 per cent during
2018-19. Moreover, other factors such as public account liabilities, force
majeure events45 and/or any other un-inventoried losses of revenue also have
to be reckoned in assessing the debt sustainability/stability of the State46.
Fiscal Deficit and Debt Sustainability
In the above context of fiscal sustainability, the Thirteenth Finance Commission
defined debt sustainability in terms of debt-GSDP ratio and also in terms of
interest payments relative to revenue receipts. The Fourteenth Finance
Commission (FFC) recommended for fiscal consolidation for the Central and
State Government and provided limits for fiscal deficit and debt stock as a
percentage of GSDP. Government of Jharkhand in its FRBM Act, 2007 decided
to maintain its fiscal deficit at not more than three per cent of the estimated
GSDP. In view of FRBM Act, target of debt stock to GSDP percentage were
given every year in the MTFP statement submitted with the budget.
The status of debt stock vis-à-vis the FFC targets and FRBM targets were as
provided in Table 1.35.
Table 1.35: Debt sustainability – FRBM indicator based analysis
Year
Fiscal Deficit to GSDP
(in per cent)
Debt stock to GSDP
(in per cent)
Interest Payment to
Revenue Receipts
(in per cent)
Target as per
MTFP prepared
under FRBM Act
Achievement Target as per
MTFP prepared
under FRBM Act
Achievement FFC
targets
Achievement
2015-16 2.80 5.58 21.55 27.40 10.00 8.17
2016-17 2.16 4.31 25.16 28.30 10.00 8.87
2017-18 2.49 4.32 26.65 27.90 10.00 8.84
2018-19 2.61 2.16 29.74 27.20 10.00 8.64
Source: Finance Accounts of the respective years, MTFP and FFC Report
44 Internal debt constitutes 69.75 per cent of fiscal liabilities. 45 Like the current Coronavirus pandemic and its effect on GSDP. 46 As these cannot be determined statistically, they have not been factored in the analysis.
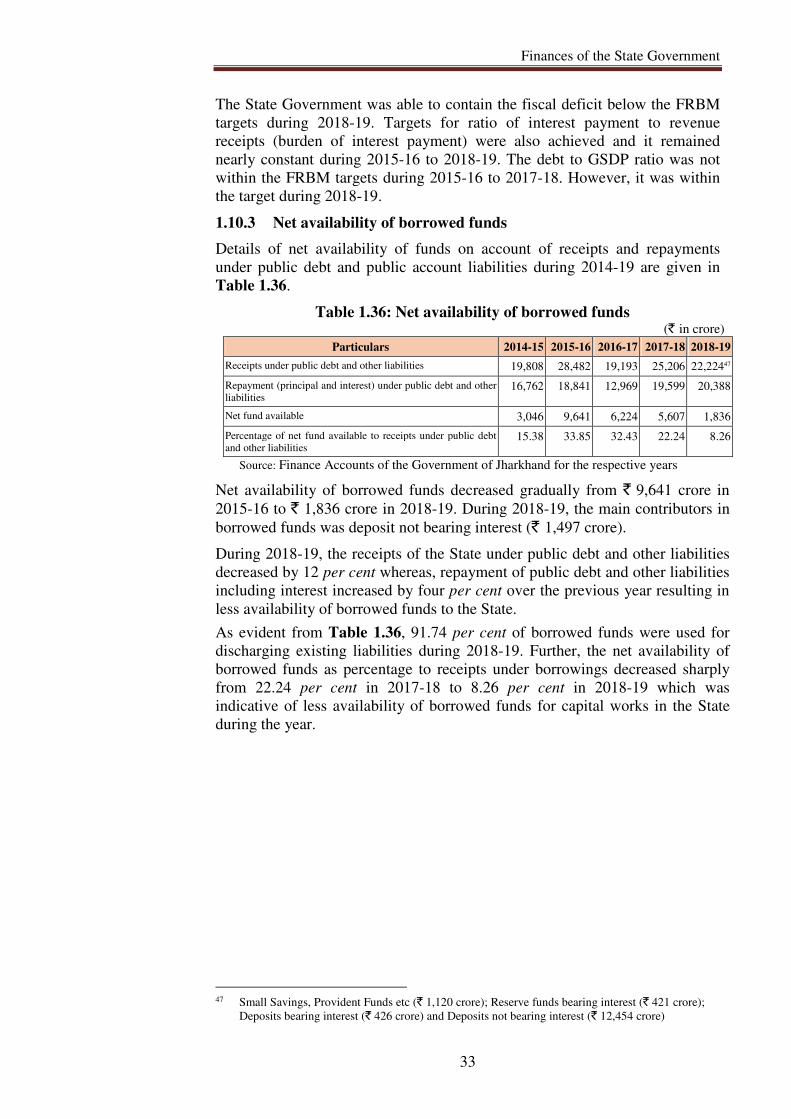
Finances of the State Government
33
The State Government was able to contain the fiscal deficit below the FRBM
targets during 2018-19. Targets for ratio of interest payment to revenue
receipts (burden of interest payment) were also achieved and it remained
nearly constant during 2015-16 to 2018-19. The debt to GSDP ratio was not
within the FRBM targets during 2015-16 to 2017-18. However, it was within
the target during 2018-19.
1.10.3 Net availability of borrowed funds
Details of net availability of funds on account of receipts and repayments
under public debt and public account liabilities during 2014-19 are given in
Table 1.36.
Table 1.36: Net availability of borrowed funds (` in crore)
Particulars 2014-15 2015-16 2016-17 2017-18 2018-19
Receipts under public debt and other liabilities 19,808 28,482 19,193 25,206 22,22447
Repayment (principal and interest) under public debt and other
liabilities 16,762 18,841 12,969 19,599 20,388
Net fund available 3,046 9,641 6,224 5,607 1,836
Percentage of net fund available to receipts under public debt
and other liabilities 15.38 33.85 32.43 22.24 8.26
Source: Finance Accounts of the Government of Jharkhand for the respective years
Net availability of borrowed funds decreased gradually from ` 9,641 crore in
2015-16 to ` 1,836 crore in 2018-19. During 2018-19, the main contributors in
borrowed funds was deposit not bearing interest (` 1,497 crore).
During 2018-19, the receipts of the State under public debt and other liabilities
decreased by 12 per cent whereas, repayment of public debt and other liabilities
including interest increased by four per cent over the previous year resulting in
less availability of borrowed funds to the State.
As evident from Table 1.36, 91.74 per cent of borrowed funds were used for
discharging existing liabilities during 2018-19. Further, the net availability of
borrowed funds as percentage to receipts under borrowings decreased sharply
from 22.24 per cent in 2017-18 to 8.26 per cent in 2018-19 which was
indicative of less availability of borrowed funds for capital works in the State
during the year.
47 Small Savings, Provident Funds etc (` 1,120 crore); Reserve funds bearing interest (` 421 crore);
Deposits bearing interest (` 426 crore) and Deposits not bearing interest (` 12,454 crore)


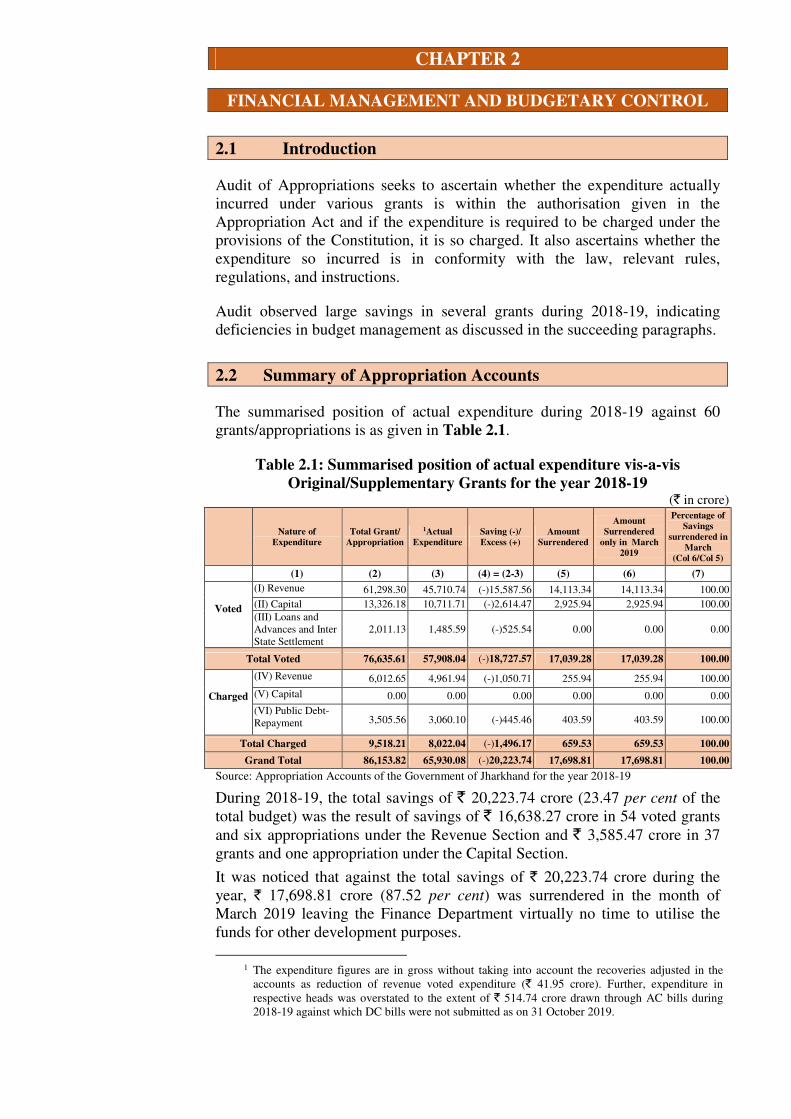
CHAPTER 2
FINANCIAL MANAGEMENT AND BUDGETARY CONTROL
2.1 Introduction
Audit of Appropriations seeks to ascertain whether the expenditure actually
incurred under various grants is within the authorisation given in the
Appropriation Act and if the expenditure is required to be charged under the
provisions of the Constitution, it is so charged. It also ascertains whether the
expenditure so incurred is in conformity with the law, relevant rules,
regulations, and instructions.
Audit observed large savings in several grants during 2018-19, indicating
deficiencies in budget management as discussed in the succeeding paragraphs.
2.2 Summary of Appropriation Accounts
The summarised position of actual expenditure during 2018-19 against 60
grants/appropriations is as given in Table 2.1.
Table 2.1: Summarised position of actual expenditure vis-a-vis
Original/Supplementary Grants for the year 2018-19 (` in crore)
Nature of
Expenditure
Total Grant/
Appropriation
1Actual
Expenditure
Saving (-)/
Excess (+)
Amount
Surrendered
Amount
Surrendered
only in March
2019
Percentage of
Savings
surrendered in
March
(Col 6/Col 5)
(1) (2) (3) (4) = (2-3) (5) (6) (7)
Voted
(I) Revenue 61,298.30 45,710.74 (-)15,587.56 14,113.34 14,113.34 100.00
(II) Capital 13,326.18 10,711.71 (-)2,614.47 2,925.94 2,925.94 100.00
(III) Loans and
Advances and Inter
State Settlement
2,011.13 1,485.59 (-)525.54 0.00 0.00 0.00
Total Voted 76,635.61 57,908.04 (-)18,727.57 17,039.28 17,039.28 100.00
Charged
(IV) Revenue 6,012.65 4,961.94 (-)1,050.71 255.94 255.94 100.00
(V) Capital 0.00 0.00 0.00 0.00 0.00 0.00
(VI) Public Debt-
Repayment 3,505.56 3,060.10 (-)445.46 403.59 403.59 100.00
Total Charged 9,518.21 8,022.04 (-)1,496.17 659.53 659.53 100.00
Grand Total 86,153.82 65,930.08 (-)20,223.74 17,698.81 17,698.81 100.00
Source: Appropriation Accounts of the Government of Jharkhand for the year 2018-19
During 2018-19, the total savings of ` 20,223.74 crore (23.47 per cent of the
total budget) was the result of savings of ` 16,638.27 crore in 54 voted grants
and six appropriations under the Revenue Section and ` 3,585.47 crore in 37
grants and one appropriation under the Capital Section.
It was noticed that against the total savings of ` 20,223.74 crore during the
year, ` 17,698.81 crore (87.52 per cent) was surrendered in the month of
March 2019 leaving the Finance Department virtually no time to utilise the
funds for other development purposes.
1 The expenditure figures are in gross without taking into account the recoveries adjusted in the
accounts as reduction of revenue voted expenditure (` 41.95 crore). Further, expenditure in
respective heads was overstated to the extent of ` 514.74 crore drawn through AC bills during
2018-19 against which DC bills were not submitted as on 31 October 2019.
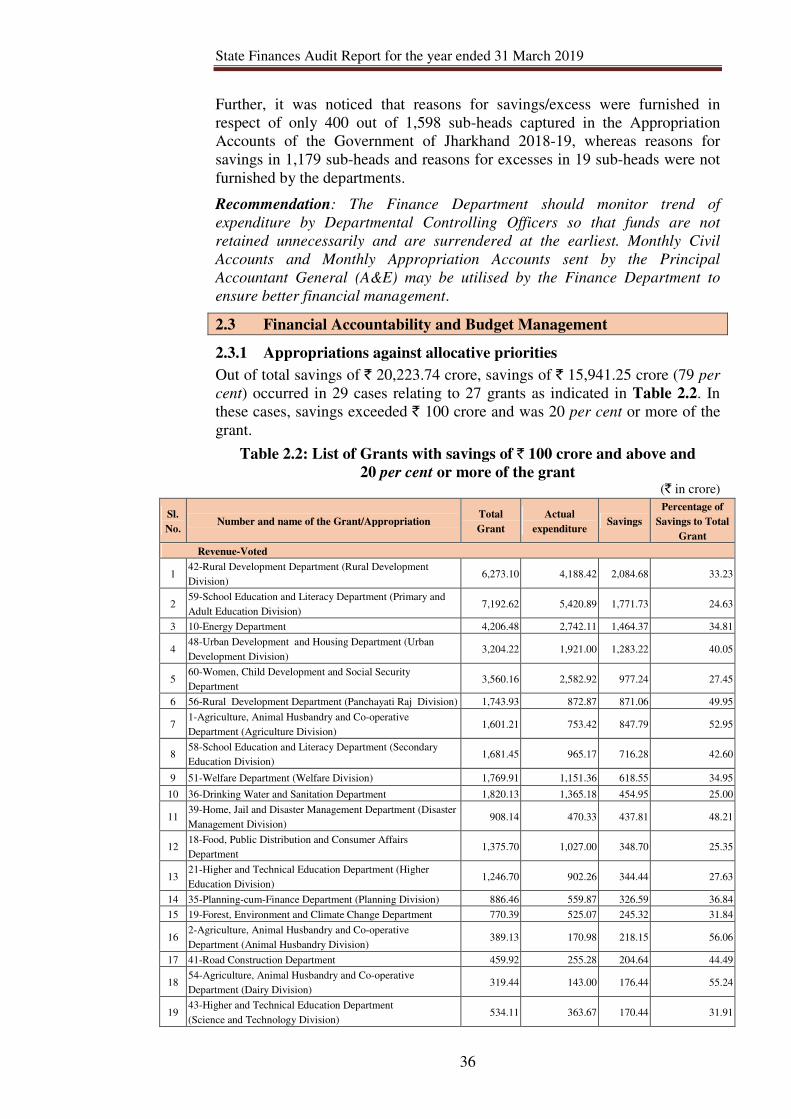
State Finances Audit Report for the year ended 31 March 2019
36
Further, it was noticed that reasons for savings/excess were furnished in
respect of only 400 out of 1,598 sub-heads captured in the Appropriation
Accounts of the Government of Jharkhand 2018-19, whereas reasons for
savings in 1,179 sub-heads and reasons for excesses in 19 sub-heads were not
furnished by the departments.
Recommendation: The Finance Department should monitor trend of
expenditure by Departmental Controlling Officers so that funds are not
retained unnecessarily and are surrendered at the earliest. Monthly Civil
Accounts and Monthly Appropriation Accounts sent by the Principal
Accountant General (A&E) may be utilised by the Finance Department to
ensure better financial management.
2.3 Financial Accountability and Budget Management
2.3.1 Appropriations against allocative priorities
Out of total savings of ` 20,223.74 crore, savings of ` 15,941.25 crore (79 per
cent) occurred in 29 cases relating to 27 grants as indicated in Table 2.2. In
these cases, savings exceeded ` 100 crore and was 20 per cent or more of the
grant.
Table 2.2: List of Grants with savings of ` 100 crore and above and
20 per cent or more of the grant (` in crore)
Sl.
No. Number and name of the Grant/Appropriation
Total
Grant
Actual
expenditure Savings
Percentage of
Savings to Total
Grant
Revenue-Voted
1 42-Rural Development Department (Rural Development
Division) 6,273.10 4,188.42 2,084.68 33.23
2 59-School Education and Literacy Department (Primary and
Adult Education Division) 7,192.62 5,420.89 1,771.73 24.63
3 10-Energy Department 4,206.48 2,742.11 1,464.37 34.81
4 48-Urban Development and Housing Department (Urban
Development Division) 3,204.22 1,921.00 1,283.22 40.05
5 60-Women, Child Development and Social Security
Department 3,560.16 2,582.92 977.24 27.45
6 56-Rural Development Department (Panchayati Raj Division) 1,743.93 872.87 871.06 49.95
7 1-Agriculture, Animal Husbandry and Co-operative
Department (Agriculture Division) 1,601.21 753.42 847.79 52.95
8 58-School Education and Literacy Department (Secondary
Education Division) 1,681.45 965.17 716.28 42.60
9 51-Welfare Department (Welfare Division) 1,769.91 1,151.36 618.55 34.95
10 36-Drinking Water and Sanitation Department 1,820.13 1,365.18 454.95 25.00
11 39-Home, Jail and Disaster Management Department (Disaster
Management Division) 908.14 470.33 437.81 48.21
12 18-Food, Public Distribution and Consumer Affairs
Department 1,375.70 1,027.00 348.70 25.35
13 21-Higher and Technical Education Department (Higher
Education Division) 1,246.70 902.26 344.44 27.63
14 35-Planning-cum-Finance Department (Planning Division) 886.46 559.87 326.59 36.84
15 19-Forest, Environment and Climate Change Department 770.39 525.07 245.32 31.84
16 2-Agriculture, Animal Husbandry and Co-operative
Department (Animal Husbandry Division) 389.13 170.98 218.15 56.06
17 41-Road Construction Department 459.92 255.28 204.64 44.49
18 54-Agriculture, Animal Husbandry and Co-operative
Department (Dairy Division) 319.44 143.00 176.44 55.24
19 43-Higher and Technical Education Department
(Science and Technology Division) 534.11 363.67 170.44 31.91
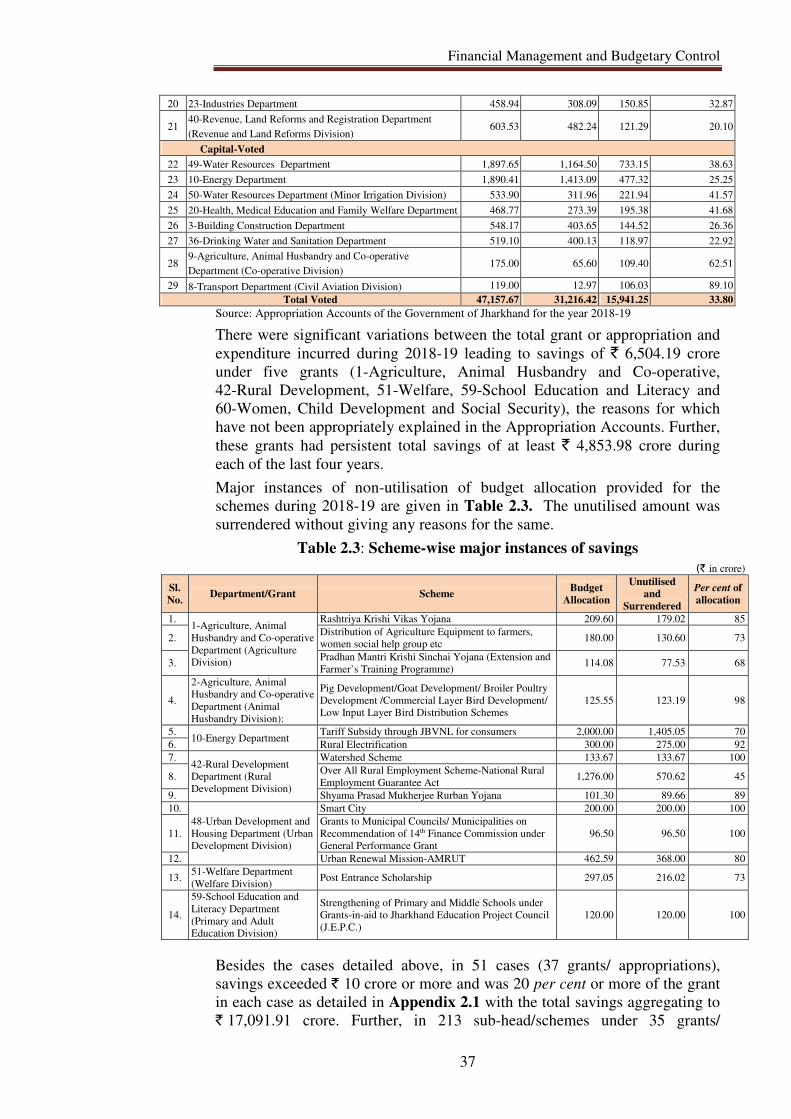
Financial Management and Budgetary Control
37
Source: Appropriation Accounts of the Government of Jharkhand for the year 2018-19
There were significant variations between the total grant or appropriation and
expenditure incurred during 2018-19 leading to savings of ` 6,504.19 crore
under five grants (1-Agriculture, Animal Husbandry and Co-operative,
42-Rural Development, 51-Welfare, 59-School Education and Literacy and
60-Women, Child Development and Social Security), the reasons for which
have not been appropriately explained in the Appropriation Accounts. Further,
these grants had persistent total savings of at least ` 4,853.98 crore during
each of the last four years.
Major instances of non-utilisation of budget allocation provided for the
schemes during 2018-19 are given in Table 2.3. The unutilised amount was
surrendered without giving any reasons for the same.
Table 2.3: Scheme-wise major instances of savings
(` in crore)
Sl.
No. Department/Grant Scheme
Budget
Allocation
Unutilised
and
Surrendered
Per cent of
allocation
1. 1-Agriculture, Animal
Husbandry and Co-operative
Department (Agriculture
Division)
Rashtriya Krishi Vikas Yojana 209.60 179.02 85
2. Distribution of Agriculture Equipment to farmers,
women social help group etc 180.00 130.60 73
3. Pradhan Mantri Krishi Sinchai Yojana (Extension and
Farmer’s Training Programme) 114.08 77.53 68
4.
2-Agriculture, Animal
Husbandry and Co-operative
Department (Animal
Husbandry Division):
Pig Development/Goat Development/ Broiler Poultry
Development /Commercial Layer Bird Development/
Low Input Layer Bird Distribution Schemes
125.55 123.19 98
5. 10-Energy Department
Tariff Subsidy through JBVNL for consumers 2,000.00 1,405.05 70
6. Rural Electrification 300.00 275.00 92
7. 42-Rural Development
Department (Rural
Development Division)
Watershed Scheme 133.67 133.67 100
8. Over All Rural Employment Scheme-National Rural
Employment Guarantee Act 1,276.00 570.62 45
9. Shyama Prasad Mukherjee Rurban Yojana 101.30 89.66 89
10. 48-Urban Development and
Housing Department (Urban
Development Division)
Smart City 200.00 200.00 100
11. Grants to Municipal Councils/ Municipalities on
Recommendation of 14th Finance Commission under
General Performance Grant
96.50 96.50 100
12. Urban Renewal Mission-AMRUT 462.59 368.00 80
13. 51-Welfare Department
(Welfare Division) Post Entrance Scholarship 297.05 216.02 73
14.
59-School Education and
Literacy Department
(Primary and Adult
Education Division)
Strengthening of Primary and Middle Schools under
Grants-in-aid to Jharkhand Education Project Council
(J.E.P.C.)
120.00 120.00 100
Besides the cases detailed above, in 51 cases (37 grants/ appropriations),
savings exceeded ` 10 crore or more and was 20 per cent or more of the grant
in each case as detailed in Appendix 2.1 with the total savings aggregating to
` 17,091.91 crore. Further, in 213 sub-head/schemes under 35 grants/
20 23-Industries Department 458.94 308.09 150.85 32.87
21 40-Revenue, Land Reforms and Registration Department
(Revenue and Land Reforms Division) 603.53 482.24 121.29 20.10
Capital-Voted
22 49-Water Resources Department 1,897.65 1,164.50 733.15 38.63
23 10-Energy Department 1,890.41 1,413.09 477.32 25.25
24 50-Water Resources Department (Minor Irrigation Division) 533.90 311.96 221.94 41.57
25 20-Health, Medical Education and Family Welfare Department 468.77 273.39 195.38 41.68
26 3-Building Construction Department 548.17 403.65 144.52 26.36
27 36-Drinking Water and Sanitation Department 519.10 400.13 118.97 22.92
28 9-Agriculture, Animal Husbandry and Co-operative
Department (Co-operative Division) 175.00 65.60 109.40 62.51
29 8-Transport Department (Civil Aviation Division) 119.00 12.97 106.03 89.10
Total Voted 47,157.67 31,216.42 15,941.25 33.80
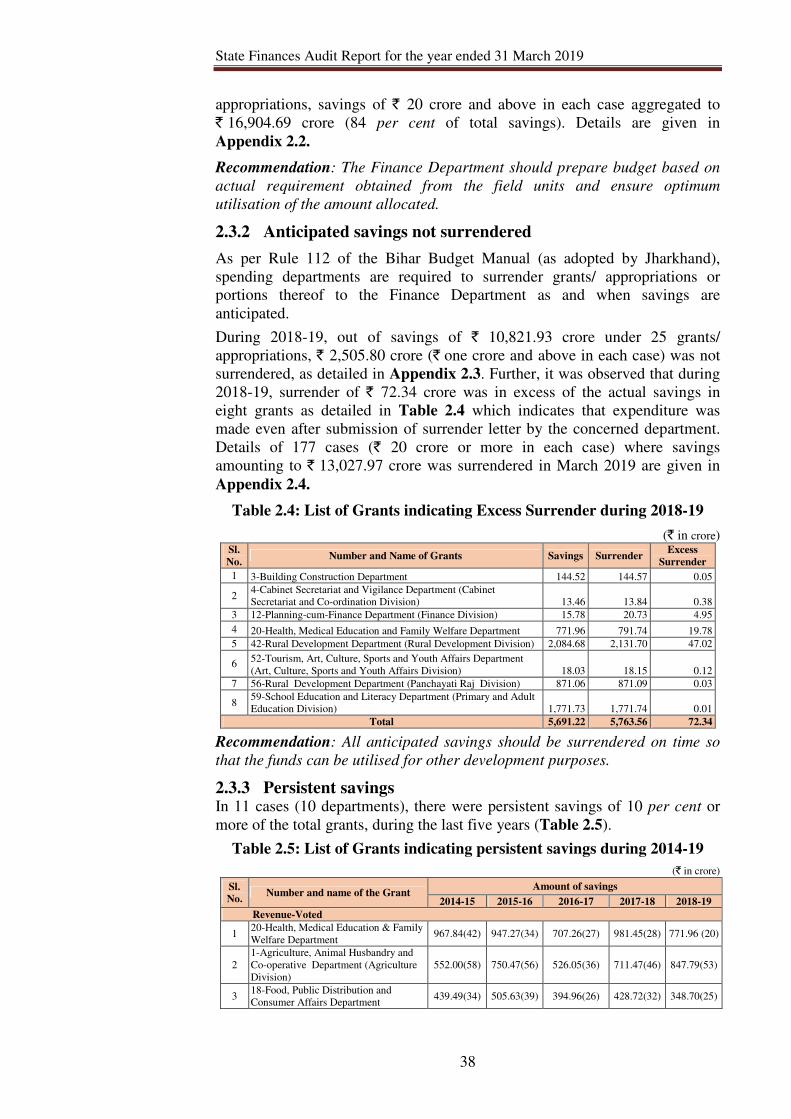
State Finances Audit Report for the year ended 31 March 2019
38
appropriations, savings of ` 20 crore and above in each case aggregated to
` 16,904.69 crore (84 per cent of total savings). Details are given in
Appendix 2.2.
Recommendation: The Finance Department should prepare budget based on
actual requirement obtained from the field units and ensure optimum
utilisation of the amount allocated.
2.3.2 Anticipated savings not surrendered
As per Rule 112 of the Bihar Budget Manual (as adopted by Jharkhand),
spending departments are required to surrender grants/ appropriations or
portions thereof to the Finance Department as and when savings are
anticipated.
During 2018-19, out of savings of ` 10,821.93 crore under 25 grants/
appropriations, ` 2,505.80 crore (` one crore and above in each case) was not
surrendered, as detailed in Appendix 2.3. Further, it was observed that during
2018-19, surrender of ` 72.34 crore was in excess of the actual savings in
eight grants as detailed in Table 2.4 which indicates that expenditure was
made even after submission of surrender letter by the concerned department.
Details of 177 cases (` 20 crore or more in each case) where savings
amounting to ` 13,027.97 crore was surrendered in March 2019 are given in
Appendix 2.4.
Table 2.4: List of Grants indicating Excess Surrender during 2018-19
(` in crore) Sl.
No. Number and Name of Grants Savings Surrender
Excess
Surrender
1 3-Building Construction Department 144.52 144.57 0.05
2 4-Cabinet Secretariat and Vigilance Department (Cabinet
Secretariat and Co-ordination Division) 13.46 13.84 0.38
3 12-Planning-cum-Finance Department (Finance Division) 15.78 20.73 4.95
4 20-Health, Medical Education and Family Welfare Department 771.96 791.74 19.78
5 42-Rural Development Department (Rural Development Division) 2,084.68 2,131.70 47.02
6 52-Tourism, Art, Culture, Sports and Youth Affairs Department
(Art, Culture, Sports and Youth Affairs Division) 18.03 18.15 0.12
7 56-Rural Development Department (Panchayati Raj Division) 871.06 871.09 0.03
8 59-School Education and Literacy Department (Primary and Adult
Education Division) 1,771.73 1,771.74 0.01
Total 5,691.22 5,763.56 72.34
Recommendation: All anticipated savings should be surrendered on time so
that the funds can be utilised for other development purposes.
2.3.3 Persistent savings In 11 cases (10 departments), there were persistent savings of 10 per cent or
more of the total grants, during the last five years (Table 2.5).
Table 2.5: List of Grants indicating persistent savings during 2014-19
(` in crore)
Sl.
No. Number and name of the Grant
Amount of savings
2014-15 2015-16 2016-17 2017-18 2018-19
Revenue-Voted
1 20-Health, Medical Education & Family
Welfare Department 967.84(42) 947.27(34) 707.26(27) 981.45(28) 771.96 (20)
2
1-Agriculture, Animal Husbandry and
Co-operative Department (Agriculture
Division)
552.00(58) 750.47(56) 526.05(36) 711.47(46) 847.79(53)
3 18-Food, Public Distribution and
Consumer Affairs Department 439.49(34) 505.63(39) 394.96(26) 428.72(32) 348.70(25)
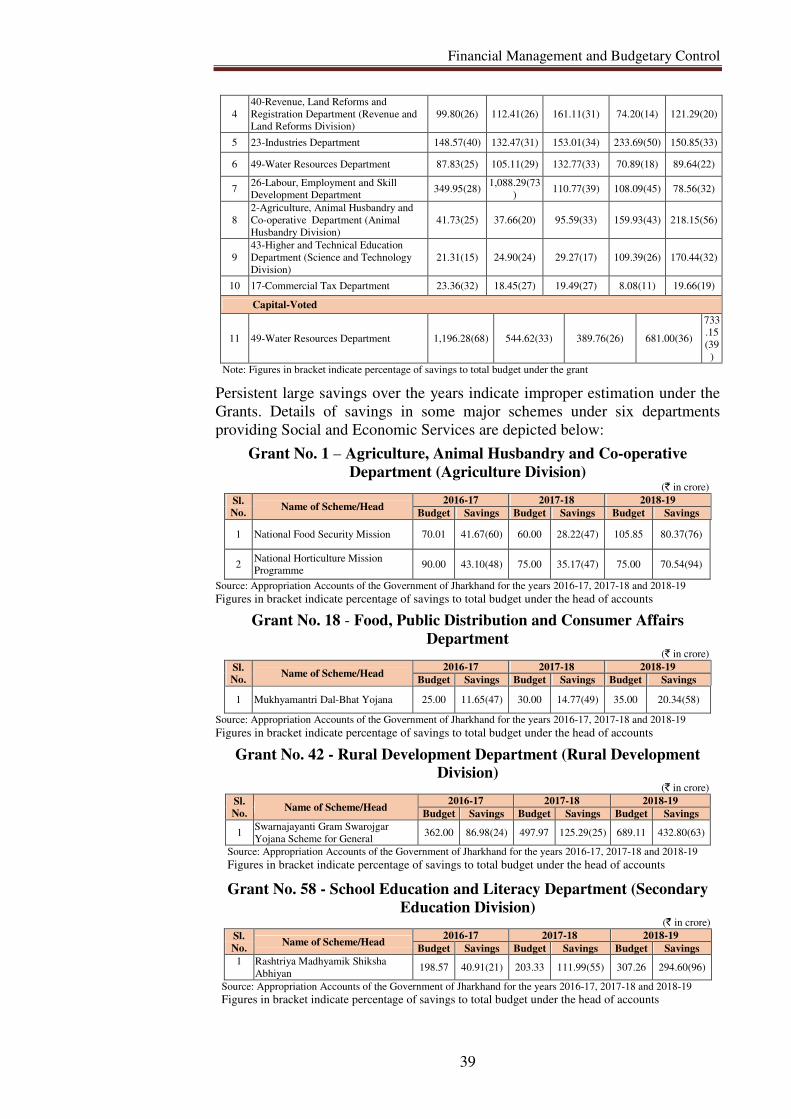
Financial Management and Budgetary Control
39
Persistent large savings over the years indicate improper estimation under the
Grants. Details of savings in some major schemes under six departments
providing Social and Economic Services are depicted below:
Grant No. 1 – Agriculture, Animal Husbandry and Co-operative
Department (Agriculture Division) (` in crore)
Sl.
No. Name of Scheme/Head
2016-17 2017-18 2018-19
Budget Savings Budget Savings Budget Savings
1 National Food Security Mission 70.01 41.67(60) 60.00 28.22(47) 105.85 80.37(76)
2 National Horticulture Mission
Programme 90.00 43.10(48) 75.00 35.17(47) 75.00 70.54(94)
Source: Appropriation Accounts of the Government of Jharkhand for the years 2016-17, 2017-18 and 2018-19
Figures in bracket indicate percentage of savings to total budget under the head of accounts
Grant No. 18 - Food, Public Distribution and Consumer Affairs
Department (` in crore)
Sl.
No. Name of Scheme/Head
2016-17 2017-18 2018-19
Budget Savings Budget Savings Budget Savings
1 Mukhyamantri Dal-Bhat Yojana 25.00 11.65(47) 30.00 14.77(49) 35.00 20.34(58)
Source: Appropriation Accounts of the Government of Jharkhand for the years 2016-17, 2017-18 and 2018-19
Figures in bracket indicate percentage of savings to total budget under the head of accounts
Grant No. 42 - Rural Development Department (Rural Development
Division) (` in crore)
Sl.
No. Name of Scheme/Head
2016-17 2017-18 2018-19
Budget Savings Budget Savings Budget Savings
1 Swarnajayanti Gram Swarojgar
Yojana Scheme for General 362.00 86.98(24) 497.97 125.29(25) 689.11 432.80(63)
Source: Appropriation Accounts of the Government of Jharkhand for the years 2016-17, 2017-18 and 2018-19
Figures in bracket indicate percentage of savings to total budget under the head of accounts
Grant No. 58 - School Education and Literacy Department (Secondary
Education Division) (` in crore)
Sl.
No. Name of Scheme/Head
2016-17 2017-18 2018-19
Budget Savings Budget Savings Budget Savings
1 Rashtriya Madhyamik Shiksha
Abhiyan 198.57 40.91(21) 203.33 111.99(55) 307.26 294.60(96)
Source: Appropriation Accounts of the Government of Jharkhand for the years 2016-17, 2017-18 and 2018-19 Figures in bracket indicate percentage of savings to total budget under the head of accounts
4
40-Revenue, Land Reforms and
Registration Department (Revenue and
Land Reforms Division)
99.80(26) 112.41(26) 161.11(31) 74.20(14) 121.29(20)
5 23-Industries Department 148.57(40) 132.47(31) 153.01(34) 233.69(50) 150.85(33)
6 49-Water Resources Department 87.83(25) 105.11(29) 132.77(33) 70.89(18) 89.64(22)
7 26-Labour, Employment and Skill
Development Department 349.95(28)
1,088.29(73
) 110.77(39) 108.09(45) 78.56(32)
8
2-Agriculture, Animal Husbandry and
Co-operative Department (Animal
Husbandry Division)
41.73(25) 37.66(20) 95.59(33) 159.93(43) 218.15(56)
9
43-Higher and Technical Education
Department (Science and Technology
Division)
21.31(15) 24.90(24) 29.27(17) 109.39(26) 170.44(32)
10 17-Commercial Tax Department 23.36(32) 18.45(27) 19.49(27) 8.08(11) 19.66(19)
Capital-Voted
11 49-Water Resources Department 1,196.28(68) 544.62(33) 389.76(26) 681.00(36)
733
.15
(39
)
Note: Figures in bracket indicate percentage of savings to total budget under the grant
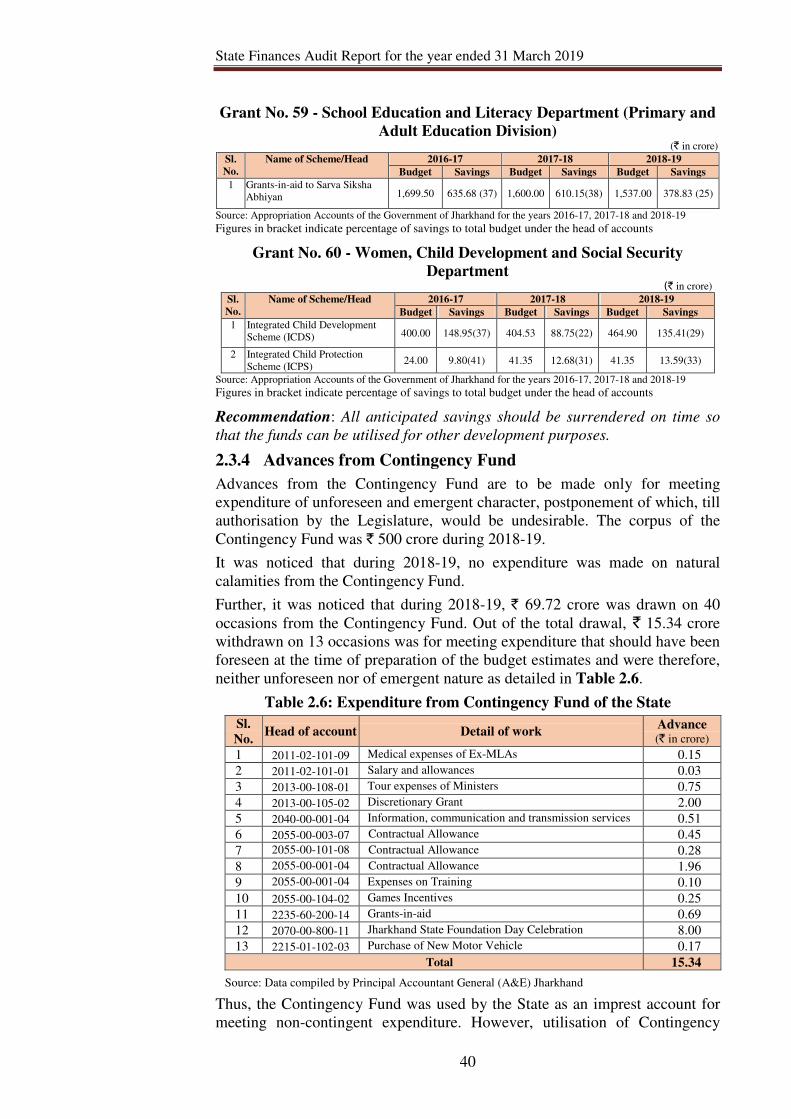
State Finances Audit Report for the year ended 31 March 2019
40
Grant No. 59 - School Education and Literacy Department (Primary and
Adult Education Division) (` in crore)
Sl.
No.
Name of Scheme/Head 2016-17 2017-18 2018-19
Budget Savings Budget Savings Budget Savings
1 Grants-in-aid to Sarva Siksha
Abhiyan 1,699.50 635.68 (37) 1,600.00 610.15(38) 1,537.00 378.83 (25)
Source: Appropriation Accounts of the Government of Jharkhand for the years 2016-17, 2017-18 and 2018-19
Figures in bracket indicate percentage of savings to total budget under the head of accounts
Grant No. 60 - Women, Child Development and Social Security
Department (` in crore)
Sl.
No.
Name of Scheme/Head 2016-17 2017-18 2018-19
Budget Savings Budget Savings Budget Savings
1 Integrated Child Development
Scheme (ICDS) 400.00 148.95(37) 404.53 88.75(22) 464.90 135.41(29)
2 Integrated Child Protection
Scheme (ICPS) 24.00 9.80(41) 41.35 12.68(31) 41.35 13.59(33)
Source: Appropriation Accounts of the Government of Jharkhand for the years 2016-17, 2017-18 and 2018-19 Figures in bracket indicate percentage of savings to total budget under the head of accounts
Recommendation: All anticipated savings should be surrendered on time so
that the funds can be utilised for other development purposes.
2.3.4 Advances from Contingency Fund
Advances from the Contingency Fund are to be made only for meeting
expenditure of unforeseen and emergent character, postponement of which, till
authorisation by the Legislature, would be undesirable. The corpus of the
Contingency Fund was ` 500 crore during 2018-19.
It was noticed that during 2018-19, no expenditure was made on natural
calamities from the Contingency Fund.
Further, it was noticed that during 2018-19, ` 69.72 crore was drawn on 40
occasions from the Contingency Fund. Out of the total drawal, ` 15.34 crore
withdrawn on 13 occasions was for meeting expenditure that should have been
foreseen at the time of preparation of the budget estimates and were therefore,
neither unforeseen nor of emergent nature as detailed in Table 2.6.
Table 2.6: Expenditure from Contingency Fund of the State
Sl.
No. Head of account Detail of work
Advance (` in crore)
1 2011-02-101-09 Medical expenses of Ex-MLAs 0.15
2 2011-02-101-01 Salary and allowances 0.03
3 2013-00-108-01 Tour expenses of Ministers 0.75
4 2013-00-105-02 Discretionary Grant 2.00
5 2040-00-001-04 Information, communication and transmission services 0.51
6 2055-00-003-07 Contractual Allowance 0.45
7 2055-00-101-08 Contractual Allowance 0.28
8 2055-00-001-04 Contractual Allowance 1.96
9 2055-00-001-04 Expenses on Training 0.10
10 2055-00-104-02 Games Incentives 0.25
11 2235-60-200-14 Grants-in-aid 0.69
12 2070-00-800-11 Jharkhand State Foundation Day Celebration 8.00
13 2215-01-102-03 Purchase of New Motor Vehicle 0.17
Total 15.34
Source: Data compiled by Principal Accountant General (A&E) Jharkhand
Thus, the Contingency Fund was used by the State as an imprest account for
meeting non-contingent expenditure. However, utilisation of Contingency
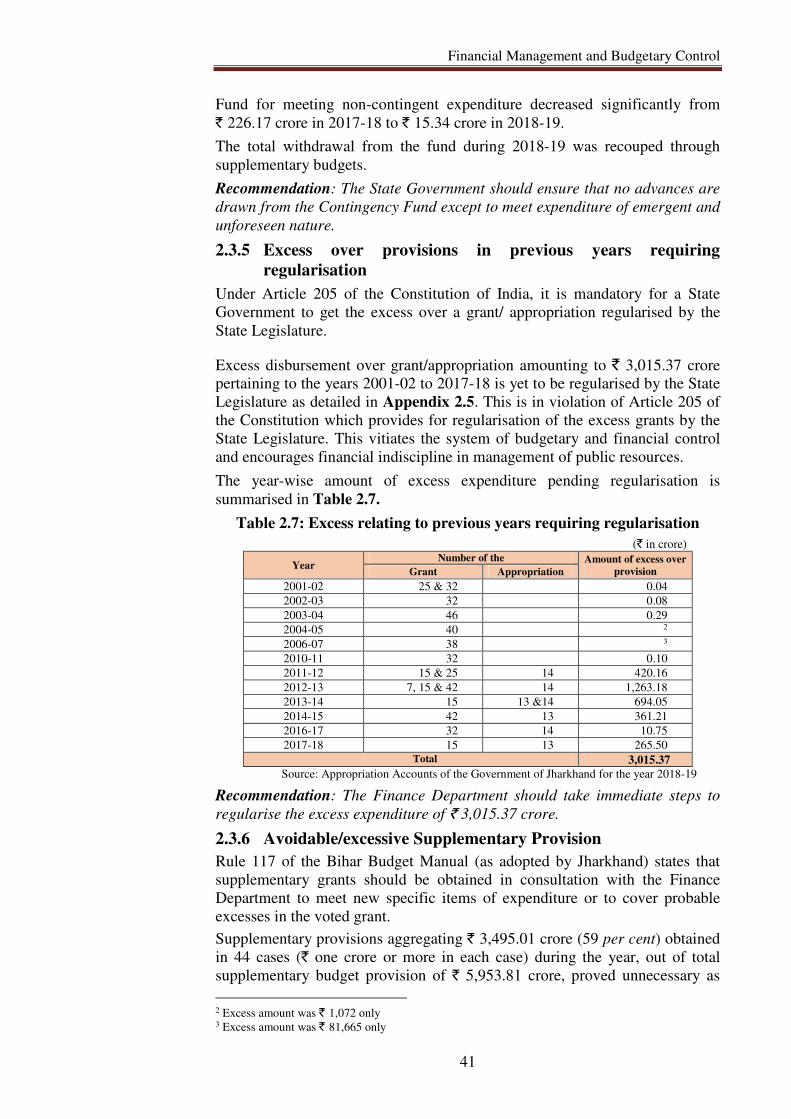
Financial Management and Budgetary Control
41
Fund for meeting non-contingent expenditure decreased significantly from
` 226.17 crore in 2017-18 to ` 15.34 crore in 2018-19.
The total withdrawal from the fund during 2018-19 was recouped through
supplementary budgets.
Recommendation: The State Government should ensure that no advances are
drawn from the Contingency Fund except to meet expenditure of emergent and
unforeseen nature.
2.3.5 Excess over provisions in previous years requiring
regularisation
Under Article 205 of the Constitution of India, it is mandatory for a State
Government to get the excess over a grant/ appropriation regularised by the
State Legislature.
Excess disbursement over grant/appropriation amounting to ` 3,015.37 crore
pertaining to the years 2001-02 to 2017-18 is yet to be regularised by the State
Legislature as detailed in Appendix 2.5. This is in violation of Article 205 of
the Constitution which provides for regularisation of the excess grants by the
State Legislature. This vitiates the system of budgetary and financial control
and encourages financial indiscipline in management of public resources.
The year-wise amount of excess expenditure pending regularisation is
summarised in Table 2.7.
Table 2.7: Excess relating to previous years requiring regularisation
(` in crore)
Year Number of the Amount of excess over
provision Grant Appropriation
2001-02 25 & 32 0.04
2002-03 32 0.08
2003-04 46 0.29
2004-05 40 2
2006-07 38 3
2010-11 32 0.10
2011-12 15 & 25 14 420.16
2012-13 7, 15 & 42 14 1,263.18
2013-14 15 13 &14 694.05
2014-15 42 13 361.21
2016-17 32 14 10.75
2017-18 15 13 265.50 Total 3,015.37
Source: Appropriation Accounts of the Government of Jharkhand for the year 2018-19
Recommendation: The Finance Department should take immediate steps to
regularise the excess expenditure of ` 3,015.37 crore.
2.3.6 Avoidable/excessive Supplementary Provision
Rule 117 of the Bihar Budget Manual (as adopted by Jharkhand) states that
supplementary grants should be obtained in consultation with the Finance
Department to meet new specific items of expenditure or to cover probable
excesses in the voted grant.
Supplementary provisions aggregating ` 3,495.01 crore (59 per cent) obtained
in 44 cases (` one crore or more in each case) during the year, out of total
supplementary budget provision of ` 5,953.81 crore, proved unnecessary as
2 Excess amount was ` 1,072 only 3 Excess amount was ` 81,665 only
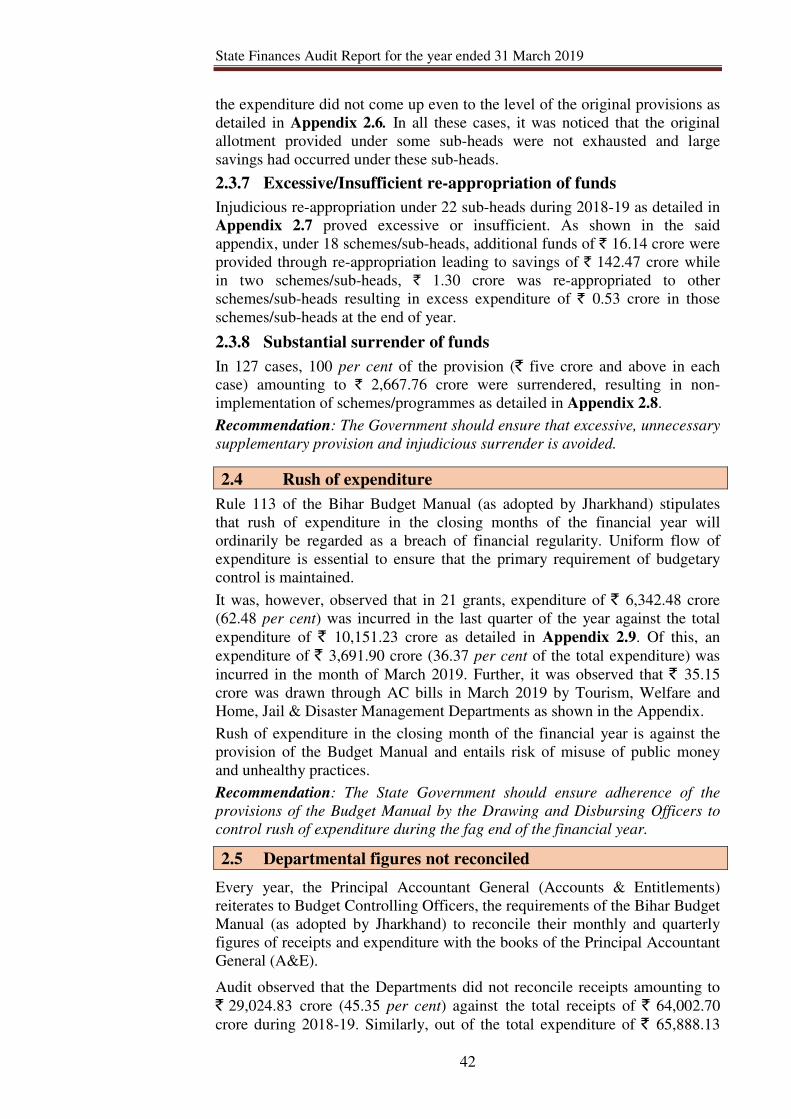
State Finances Audit Report for the year ended 31 March 2019
42
the expenditure did not come up even to the level of the original provisions as
detailed in Appendix 2.6. In all these cases, it was noticed that the original
allotment provided under some sub-heads were not exhausted and large
savings had occurred under these sub-heads.
2.3.7 Excessive/Insufficient re-appropriation of funds
Injudicious re-appropriation under 22 sub-heads during 2018-19 as detailed in
Appendix 2.7 proved excessive or insufficient. As shown in the said
appendix, under 18 schemes/sub-heads, additional funds of ` 16.14 crore were
provided through re-appropriation leading to savings of ` 142.47 crore while
in two schemes/sub-heads, ` 1.30 crore was re-appropriated to other
schemes/sub-heads resulting in excess expenditure of ` 0.53 crore in those
schemes/sub-heads at the end of year.
2.3.8 Substantial surrender of funds
In 127 cases, 100 per cent of the provision (` five crore and above in each
case) amounting to ` 2,667.76 crore were surrendered, resulting in non-
implementation of schemes/programmes as detailed in Appendix 2.8.
Recommendation: The Government should ensure that excessive, unnecessary
supplementary provision and injudicious surrender is avoided.
2.4 Rush of expenditure
Rule 113 of the Bihar Budget Manual (as adopted by Jharkhand) stipulates
that rush of expenditure in the closing months of the financial year will
ordinarily be regarded as a breach of financial regularity. Uniform flow of
expenditure is essential to ensure that the primary requirement of budgetary
control is maintained.
It was, however, observed that in 21 grants, expenditure of ` 6,342.48 crore
(62.48 per cent) was incurred in the last quarter of the year against the total
expenditure of ` 10,151.23 crore as detailed in Appendix 2.9. Of this, an
expenditure of ` 3,691.90 crore (36.37 per cent of the total expenditure) was
incurred in the month of March 2019. Further, it was observed that ` 35.15
crore was drawn through AC bills in March 2019 by Tourism, Welfare and
Home, Jail & Disaster Management Departments as shown in the Appendix.
Rush of expenditure in the closing month of the financial year is against the
provision of the Budget Manual and entails risk of misuse of public money
and unhealthy practices.
Recommendation: The State Government should ensure adherence of the
provisions of the Budget Manual by the Drawing and Disbursing Officers to
control rush of expenditure during the fag end of the financial year.
2.5 Departmental figures not reconciled
Every year, the Principal Accountant General (Accounts & Entitlements)
reiterates to Budget Controlling Officers, the requirements of the Bihar Budget
Manual (as adopted by Jharkhand) to reconcile their monthly and quarterly
figures of receipts and expenditure with the books of the Principal Accountant
General (A&E).
Audit observed that the Departments did not reconcile receipts amounting to
` 29,024.83 crore (45.35 per cent) against the total receipts of ` 64,002.70
crore during 2018-19. Similarly, out of the total expenditure of ` 65,888.13
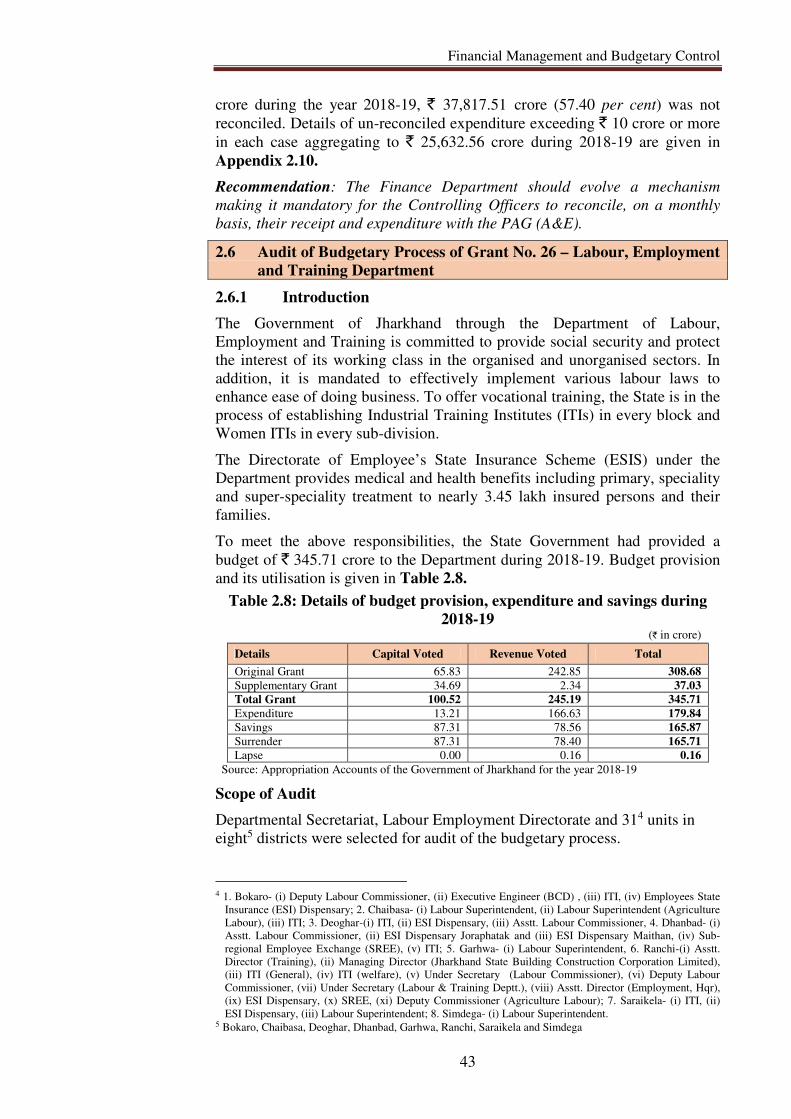
Financial Management and Budgetary Control
43
crore during the year 2018-19, ` 37,817.51 crore (57.40 per cent) was not
reconciled. Details of un-reconciled expenditure exceeding ` 10 crore or more
in each case aggregating to ` 25,632.56 crore during 2018-19 are given in
Appendix 2.10.
Recommendation: The Finance Department should evolve a mechanism
making it mandatory for the Controlling Officers to reconcile, on a monthly
basis, their receipt and expenditure with the PAG (A&E).
2.6 Audit of Budgetary Process of Grant No. 26 – Labour, Employment
and Training Department
2.6.1 Introduction
The Government of Jharkhand through the Department of Labour,
Employment and Training is committed to provide social security and protect
the interest of its working class in the organised and unorganised sectors. In
addition, it is mandated to effectively implement various labour laws to
enhance ease of doing business. To offer vocational training, the State is in the
process of establishing Industrial Training Institutes (ITIs) in every block and
Women ITIs in every sub-division.
The Directorate of Employee’s State Insurance Scheme (ESIS) under the
Department provides medical and health benefits including primary, speciality
and super-speciality treatment to nearly 3.45 lakh insured persons and their
families.
To meet the above responsibilities, the State Government had provided a
budget of ` 345.71 crore to the Department during 2018-19. Budget provision
and its utilisation is given in Table 2.8.
Table 2.8: Details of budget provision, expenditure and savings during
2018-19 (` in crore)
Details Capital Voted Revenue Voted Total
Original Grant 65.83 242.85 308.68
Supplementary Grant 34.69 2.34 37.03
Total Grant 100.52 245.19 345.71
Expenditure 13.21 166.63 179.84
Savings 87.31 78.56 165.87
Surrender 87.31 78.40 165.71
Lapse 0.00 0.16 0.16
Source: Appropriation Accounts of the Government of Jharkhand for the year 2018-19
Scope of Audit
Departmental Secretariat, Labour Employment Directorate and 314 units in
eight5 districts were selected for audit of the budgetary process.
4 1. Bokaro- (i) Deputy Labour Commissioner, (ii) Executive Engineer (BCD) , (iii) ITI, (iv) Employees State
Insurance (ESI) Dispensary; 2. Chaibasa- (i) Labour Superintendent, (ii) Labour Superintendent (Agriculture
Labour), (iii) ITI; 3. Deoghar-(i) ITI, (ii) ESI Dispensary, (iii) Asstt. Labour Commissioner, 4. Dhanbad- (i)
Asstt. Labour Commissioner, (ii) ESI Dispensary Joraphatak and (iii) ESI Dispensary Maithan, (iv) Sub-
regional Employee Exchange (SREE), (v) ITI; 5. Garhwa- (i) Labour Superintendent, 6. Ranchi-(i) Asstt.
Director (Training), (ii) Managing Director (Jharkhand State Building Construction Corporation Limited),
(iii) ITI (General), (iv) ITI (welfare), (v) Under Secretary (Labour Commissioner), (vi) Deputy Labour
Commissioner, (vii) Under Secretary (Labour & Training Deptt.), (viii) Asstt. Director (Employment, Hqr),
(ix) ESI Dispensary, (x) SREE, (xi) Deputy Commissioner (Agriculture Labour); 7. Saraikela- (i) ITI, (ii)
ESI Dispensary, (iii) Labour Superintendent; 8. Simdega- (i) Labour Superintendent. 5 Bokaro, Chaibasa, Deoghar, Dhanbad, Garhwa, Ranchi, Saraikela and Simdega
State Finances Audit Report for the year ended 31 March 2019
44
Audit findings
2.6.2 Persistent Savings
A study of the Department’s budget and expenditure trend for the last four
years (2015-19) revealed that the Department had persistent savings during the
period and the percentage of savings in comparison to the budget estimates
remained significantly high as detailed in Table 2.9.
Table 2.9: Trend of savings during last four years in Labour, Employment
and Training Department
(` in crore)
Years Original Supple-mentary
Total Actual
Expenditure Saving
Percentage of saving
2015-16
Revenue 1456.87 35.26 1492.13 403.84 1088.29
73.42 Capital 71.20 3.98 75.18 12.81 62.37
Total 1528.07 39.24 1567.31 416.65 1150.66
2016-17
Revenue 253.07 28.36 281.43 170.66 110.77
40.62 Capital 45.87 0.95 46.82 24.27 22.55
Total 298.94 29.31 328.25 194.93 133.32
2017-18
Revenue 229.41 12.28 241.69 133.60 108.09
47.61 Capital 70.22 9.21 79.43 34.62 44.81
Total 299.63 21.49 321.12 168.22 152.90
2018-19
Revenue 242.85 2.34 245.19 166.63 78.56
47.98 Capital 65.83 34.69 100.52 13.21 87.31
Total 308.68 37.03 345.71 179.84 165.87
Source: Appropriation Accounts 2015-19
As shown in the above table the Department had persistent savings ranging
between 41 per cent and 73 per cent during the last four years which indicated
non-completion of a number of schemes during the year.
2.6.3 Delay in submission of Budget Estimates
Rule 62 of Bihar Budget Manual (as adopted by Jharkhand) provides the
calendar for correct and timely preparation of the budget of the State. In
October 2017, the Finance Department (FD), GoJ revised the scheduled
common submission date from 01 October every year to 01 November for
estimates of Establishment Expenditure and 24 November for the General
Budget (State, Central and Centrally Sponsored Schemes).
Scrutiny of records of the Department revealed that the General Budget for the
year 2018-19 was submitted (23 January 2018) with a delay of 60 days to the
FD.
Delayed submission of Budget Estimates gave little time for scrutiny of
estimates by the Finance Department.
2.6.4 Budget Estimates prepared without obtaining requirements from
Disbursing Officers (DOs).
According to Rule 65 of Bihar Budget Manual (as adopted by Jharkhand)
(BM), the Controlling Officer (CO) should examine the budgets received from
the DOs to see that they are correct, that all details/explanations have been
given and the explanations given are adequate.
It was noticed during audit that provisions of BM were not followed and the
budget estimates for General Budget (State, Central and Centrally Sponsored
Schemes) were prepared at the Department level without obtaining/ assessing
the actual requirements from the DOs who are finally responsible to execute
the work and utilise the fund. In view of huge savings of ` 87.31 crore (87 per
Financial Management and Budgetary Control
45
cent) against the budget provision of ` 100.52 crore under capital section
during the year 2018-19 non-observance of provisions of BM was a serious
negligence.
2.6.5 Non-Preparation of Outcome and Gender Budget
As per instructions (October 2017) of Planning-cum-Finance Department,
GoJ, Outcome budget in Proforma-X was to be prepared separately for all the
Schemes executed under State schemes and Centrally Assisted State schemes
indicating primary targets and other quantifiable information of those
schemes. Proforma-Y was to be submitted indicating details of Gender Budget
along with amount required for schemes (where 30 per cent or more was to be
spent on schemes for welfare of women) and fundamental goals set for
qualitative reforms during 2018-19.
Scrutiny of records of the Department revealed that the above instructions
were not followed and the Outcome and Gender budget for the year 2018-19
were not prepared and submitted in the prescribed proforma. Thus, the result
of outcome budget of Central and State Schemes could not be assessed.
Further scrutiny revealed that during 2018-19, a sum of ` 13.30 crore was
provided under the Gender Budget for three schemes (Aam Aadmi Bima
Yojana, Jharkhand; Un-organised Workers Social Security Scheme and
Distribution of Blankets among BPL women) for welfare of women. However,
the records of expenditure on women specific works were not maintained in
the prescribed proforma. Thus, the achievement and outcome of Gender
budgeting could not be assessed.
2.6.6 Avoidable Supplementary Provision
As per comments below Rule 57 of Bihar Budget Manual (as adopted by
Jharkhand), the officer responsible for preparing estimates should be sure that
there is no provision for a greater sum than that which can be spent.
It was noticed that during 2018-19, out of 61 schemes (45 revenue and 16
capital), additional fund amounting to ` 37.03 crore was provided through
supplementary provisions to 14 schemes (10 revenue & four capital) in spite
of non-utilisation of the original provisions amounting to ` 33.80 crore as
detailed in Appendix 2.11.
2.6.7 Non-utilisation of entire budget provision
A few cases where Rule 57 of Bihar Budget Manual (as adopted by
Jharkhand) was not followed are detailed below.
(a) Under the scheme ‘Construction of ITIs and allied buildings’, Women ITIs
were to be established in all sub-divisions and General ITIs were to be
established in all blocks of Jharkhand, for which 105 backward blocks were
selected in the first phase. An amount of ` 25.61 crore was provided during
2018-19 under three6 heads of accounts for the work.
It was noticed that out of the allocation of ` 25.61 crore during 2018-19,
` eight crore was provided to Other Sub-plan (OSP) and ` 17.61 crore to
Tribal Area Sub-plan (TSP) and Special Component Plan for Scheduled
6 Capital section of Other Social Services viz., 4250-00-203-01 (` 8.00 crore), 4250-00-789-01 (` 5.00
crore) and 4250-00-796-01 (` 12.61 crore)
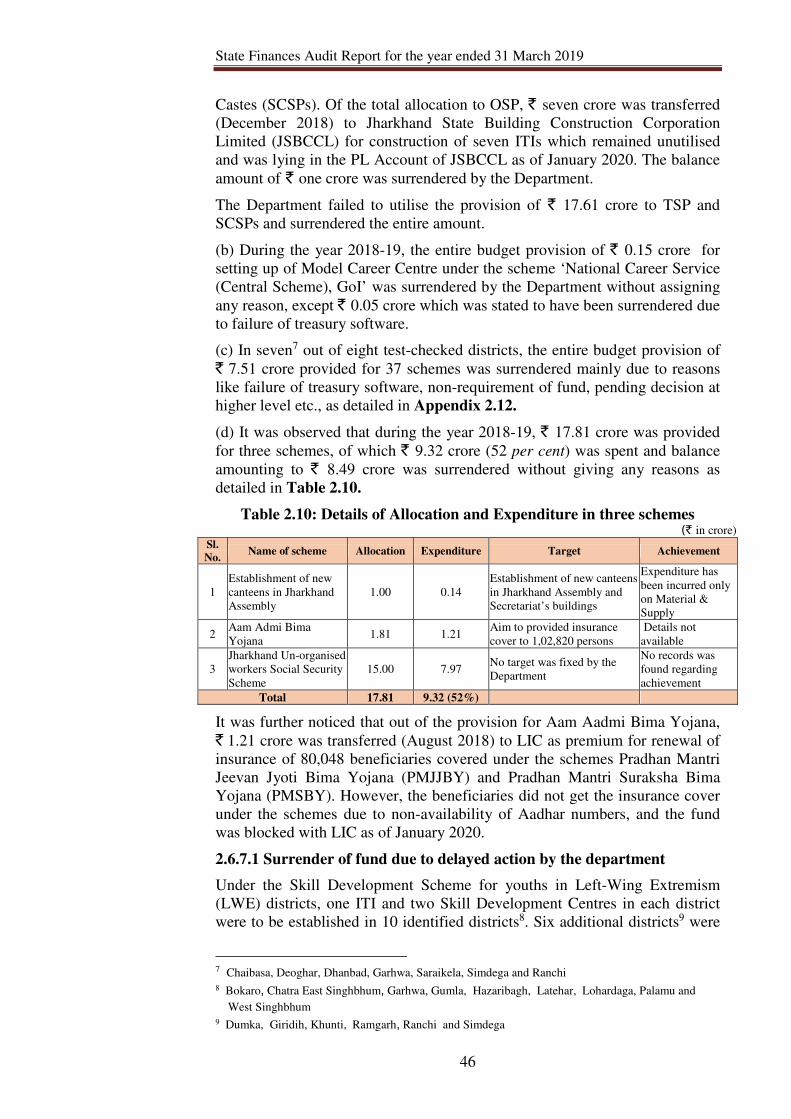
State Finances Audit Report for the year ended 31 March 2019
46
Castes (SCSPs). Of the total allocation to OSP, ` seven crore was transferred
(December 2018) to Jharkhand State Building Construction Corporation
Limited (JSBCCL) for construction of seven ITIs which remained unutilised
and was lying in the PL Account of JSBCCL as of January 2020. The balance
amount of ` one crore was surrendered by the Department.
The Department failed to utilise the provision of ` 17.61 crore to TSP and
SCSPs and surrendered the entire amount.
(b) During the year 2018-19, the entire budget provision of ` 0.15 crore for
setting up of Model Career Centre under the scheme ‘National Career Service
(Central Scheme), GoI’ was surrendered by the Department without assigning
any reason, except ` 0.05 crore which was stated to have been surrendered due
to failure of treasury software.
(c) In seven7 out of eight test-checked districts, the entire budget provision of
` 7.51 crore provided for 37 schemes was surrendered mainly due to reasons
like failure of treasury software, non-requirement of fund, pending decision at
higher level etc., as detailed in Appendix 2.12.
(d) It was observed that during the year 2018-19, ` 17.81 crore was provided
for three schemes, of which ` 9.32 crore (52 per cent) was spent and balance
amounting to ` 8.49 crore was surrendered without giving any reasons as
detailed in Table 2.10.
Table 2.10: Details of Allocation and Expenditure in three schemes (` in crore)
Sl.
No. Name of scheme Allocation Expenditure Target Achievement
1
Establishment of new
canteens in Jharkhand
Assembly
1.00 0.14
Establishment of new canteens
in Jharkhand Assembly and
Secretariat’s buildings
Expenditure has
been incurred only
on Material &
Supply
2 Aam Admi Bima
Yojana 1.81 1.21
Aim to provided insurance
cover to 1,02,820 persons
Details not
available
3
Jharkhand Un-organised
workers Social Security
Scheme
15.00 7.97 No target was fixed by the
Department
No records was
found regarding
achievement
Total 17.81 9.32 (52%)
It was further noticed that out of the provision for Aam Aadmi Bima Yojana,
` 1.21 crore was transferred (August 2018) to LIC as premium for renewal of
insurance of 80,048 beneficiaries covered under the schemes Pradhan Mantri
Jeevan Jyoti Bima Yojana (PMJJBY) and Pradhan Mantri Suraksha Bima
Yojana (PMSBY). However, the beneficiaries did not get the insurance cover
under the schemes due to non-availability of Aadhar numbers, and the fund
was blocked with LIC as of January 2020.
2.6.7.1 Surrender of fund due to delayed action by the department
Under the Skill Development Scheme for youths in Left-Wing Extremism
(LWE) districts, one ITI and two Skill Development Centres in each district
were to be established in 10 identified districts8. Six additional districts9 were
7 Chaibasa, Deoghar, Dhanbad, Garhwa, Saraikela, Simdega and Ranchi
8 Bokaro, Chatra East Singhbhum, Garhwa, Gumla, Hazaribagh, Latehar, Lohardaga, Palamu and
West Singhbhum
9 Dumka, Giridih, Khunti, Ramgarh, Ranchi and Simdega
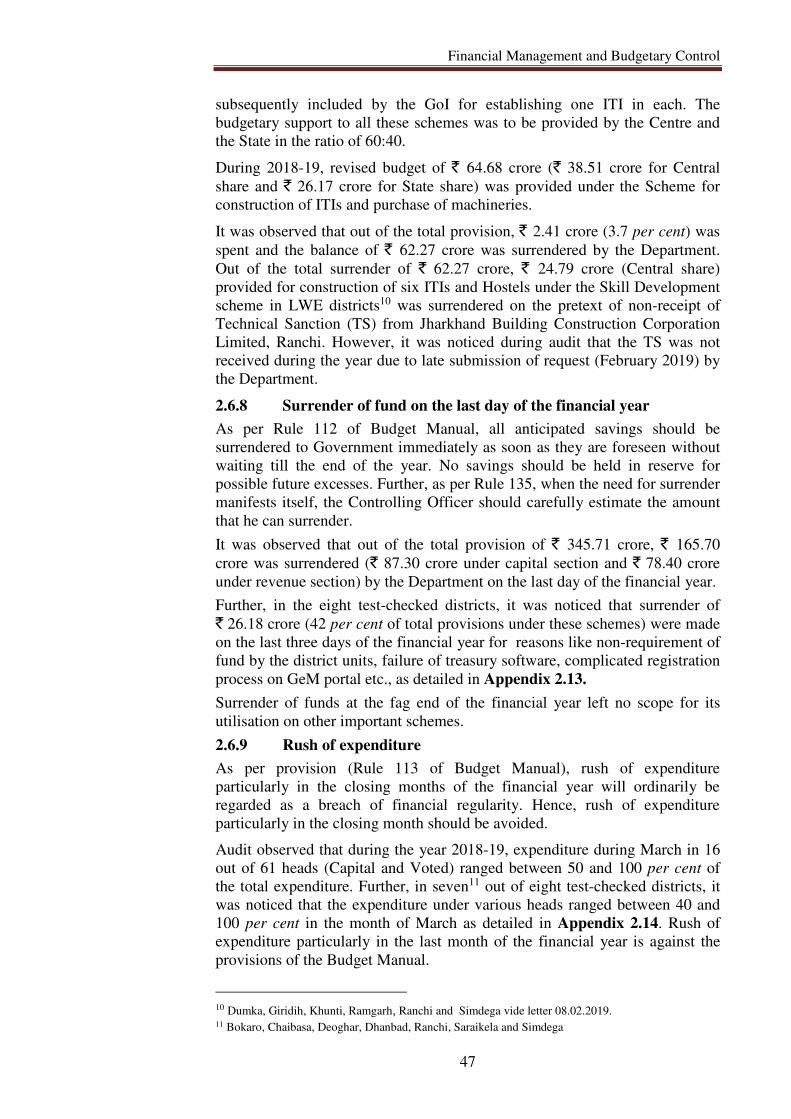
Financial Management and Budgetary Control
47
subsequently included by the GoI for establishing one ITI in each. The
budgetary support to all these schemes was to be provided by the Centre and
the State in the ratio of 60:40.
During 2018-19, revised budget of ` 64.68 crore (` 38.51 crore for Central
share and ` 26.17 crore for State share) was provided under the Scheme for
construction of ITIs and purchase of machineries.
It was observed that out of the total provision, ` 2.41 crore (3.7 per cent) was
spent and the balance of ` 62.27 crore was surrendered by the Department.
Out of the total surrender of ` 62.27 crore, ` 24.79 crore (Central share)
provided for construction of six ITIs and Hostels under the Skill Development
scheme in LWE districts10 was surrendered on the pretext of non-receipt of
Technical Sanction (TS) from Jharkhand Building Construction Corporation
Limited, Ranchi. However, it was noticed during audit that the TS was not
received during the year due to late submission of request (February 2019) by
the Department.
2.6.8 Surrender of fund on the last day of the financial year
As per Rule 112 of Budget Manual, all anticipated savings should be
surrendered to Government immediately as soon as they are foreseen without
waiting till the end of the year. No savings should be held in reserve for
possible future excesses. Further, as per Rule 135, when the need for surrender
manifests itself, the Controlling Officer should carefully estimate the amount
that he can surrender.
It was observed that out of the total provision of ` 345.71 crore, ` 165.70
crore was surrendered (` 87.30 crore under capital section and ` 78.40 crore
under revenue section) by the Department on the last day of the financial year.
Further, in the eight test-checked districts, it was noticed that surrender of
` 26.18 crore (42 per cent of total provisions under these schemes) were made
on the last three days of the financial year for reasons like non-requirement of
fund by the district units, failure of treasury software, complicated registration
process on GeM portal etc., as detailed in Appendix 2.13.
Surrender of funds at the fag end of the financial year left no scope for its
utilisation on other important schemes.
2.6.9 Rush of expenditure
As per provision (Rule 113 of Budget Manual), rush of expenditure
particularly in the closing months of the financial year will ordinarily be
regarded as a breach of financial regularity. Hence, rush of expenditure
particularly in the closing month should be avoided.
Audit observed that during the year 2018-19, expenditure during March in 16
out of 61 heads (Capital and Voted) ranged between 50 and 100 per cent of
the total expenditure. Further, in seven11 out of eight test-checked districts, it
was noticed that the expenditure under various heads ranged between 40 and
100 per cent in the month of March as detailed in Appendix 2.14. Rush of
expenditure particularly in the last month of the financial year is against the
provisions of the Budget Manual.
10 Dumka, Giridih, Khunti, Ramgarh, Ranchi and Simdega vide letter 08.02.2019. 11 Bokaro, Chaibasa, Deoghar, Dhanbad, Ranchi, Saraikela and Simdega
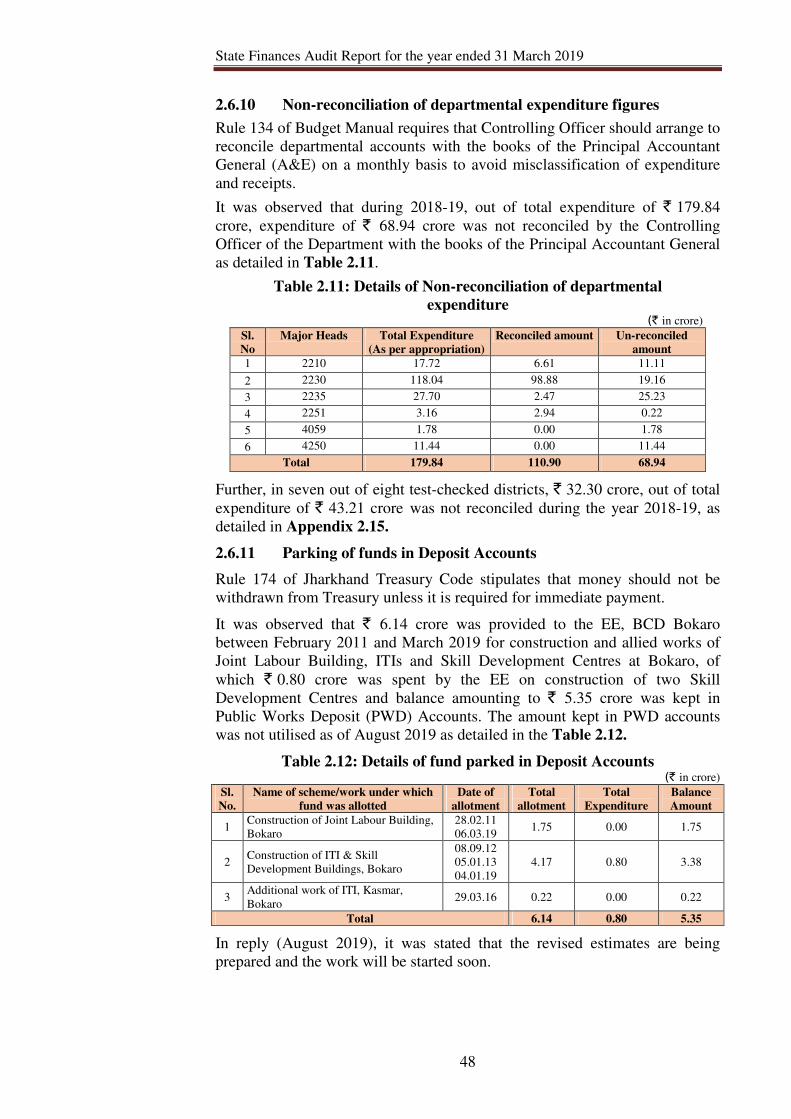
State Finances Audit Report for the year ended 31 March 2019
48
2.6.10 Non-reconciliation of departmental expenditure figures
Rule 134 of Budget Manual requires that Controlling Officer should arrange to
reconcile departmental accounts with the books of the Principal Accountant
General (A&E) on a monthly basis to avoid misclassification of expenditure
and receipts.
It was observed that during 2018-19, out of total expenditure of ` 179.84
crore, expenditure of ` 68.94 crore was not reconciled by the Controlling
Officer of the Department with the books of the Principal Accountant General
as detailed in Table 2.11.
Table 2.11: Details of Non-reconciliation of departmental
expenditure (` in crore)
Sl.
No
Major Heads Total Expenditure
(As per appropriation)
Reconciled amount Un-reconciled
amount
1 2210 17.72 6.61 11.11
2 2230 118.04 98.88 19.16
3 2235 27.70 2.47 25.23
4 2251 3.16 2.94 0.22
5 4059 1.78 0.00 1.78
6 4250 11.44 0.00 11.44
Total 179.84 110.90 68.94
Further, in seven out of eight test-checked districts, ` 32.30 crore, out of total
expenditure of ` 43.21 crore was not reconciled during the year 2018-19, as
detailed in Appendix 2.15.
2.6.11 Parking of funds in Deposit Accounts
Rule 174 of Jharkhand Treasury Code stipulates that money should not be
withdrawn from Treasury unless it is required for immediate payment.
It was observed that ` 6.14 crore was provided to the EE, BCD Bokaro
between February 2011 and March 2019 for construction and allied works of
Joint Labour Building, ITIs and Skill Development Centres at Bokaro, of
which ` 0.80 crore was spent by the EE on construction of two Skill
Development Centres and balance amounting to ` 5.35 crore was kept in
Public Works Deposit (PWD) Accounts. The amount kept in PWD accounts
was not utilised as of August 2019 as detailed in the Table 2.12.
Table 2.12: Details of fund parked in Deposit Accounts (` in crore)
Sl.
No.
Name of scheme/work under which
fund was allotted
Date of
allotment
Total
allotment
Total
Expenditure
Balance
Amount
1 Construction of Joint Labour Building,
Bokaro
28.02.11
06.03.19 1.75 0.00 1.75
2 Construction of ITI & Skill
Development Buildings, Bokaro
08.09.12
05.01.13
04.01.19
4.17 0.80 3.38
3 Additional work of ITI, Kasmar,
Bokaro 29.03.16 0.22 0.00 0.22
Total 6.14 0.80 5.35
In reply (August 2019), it was stated that the revised estimates are being
prepared and the work will be started soon.
Financial Management and Budgetary Control
49
2.6.12 Incomplete Insurance Coverage to Jharkhand Un-organised
Workers Social Security Scheme (JUWSSS)
An amount of ` 15 crore was sanctioned (July 2018) for JUWSSS during
2018-19, of which ` 3.50 crore was allotted to the eight test-checked districts.
Scrutiny of records of test-checked districts revealed that ` 2.11 crore was
spent on PMJJBY and PMSBY under JUWSSS and the balance of ` 1.39
crore was surrendered as detailed in Appendix 2.16.
Further, it was noticed that out of total number of registered (5,04,663) un-
organised workers for PMJJBY/PMSBY, only 1,12,562 workers (22 per cent)
were covered under the Scheme. Other workers were not covered due to
incomplete documents viz., Aadhar Number, Bank Details etc. Though
premium of ` 1.92 crore (` 171.00 each) for the 1,12,562 workers was
transferred between September 2018 to February 2019 to LIC by the
concerned Labour Officers, coverage of the beneficiaries under the Scheme
had not been confirmed by LIC as February 2020.
2.6.13 Non-interlinking of Employment Exchange with National Career
Service (NCS) portals
As per National Career Service-2016 guidelines issued by the Ministry of
Labour & Employment, all employment exchanges were to be interlinked with
the National Career Service (NCS) portal, so that all job fairs conducted under
the Scheme could be tracked/monitored by the State.
Scrutiny of records revealed that during 2017-18, ` 2.74 crore was released12
to the Directorate, Employment and Training, Government of Jharkhand for
the Scheme, of which ` 0.88 crore was spent by March 2018 and the balance
amounting to ` 1.86 crore was surrendered by the Department. Utilisation
Certificate for ` 0.88 crore was also submitted (May 2019) to GoI.
The amount surrendered during 2017-18 (` 1.86 crore) was reallocated during
2018-19, of which ` 0.14 crore was spent during the year. A proposal for
revalidation of the balance amount of ` 1.72 crore for utilisation during 2019-
20 forwarded (May 2019) to GoI has not been approved (January 2020). Thus,
the interlinking of employment exchange with National Career Service Portal
remained incomplete.
It was observed that in spite of availability of funds in two consecutive years,
the Department failed to link State employment exchange with the National
Career Service Portal which was required to provide latest information on job
opportunities to the unemployed youth of the State.
The Joint Director (Employment) stated that interlinking of employment
exchange portals with NCS portal is under process without specifying the
reasons for non-utilisation of fund for two consecutive years.
2.6.14 Distribution of blankets/clothes to unknown/unidentified
beneficiaries
As per Government’s decision blankets/clothes were to be distributed among
people below the poverty line (BPL), beggars, disabled and other destitute
persons. Accordingly, ` 30.64 crore (` 14.32 crore for Other Sub Plan,
12 10 February 2017: ` 2.05 crore and 12 April 2017: ` 0.69 crore
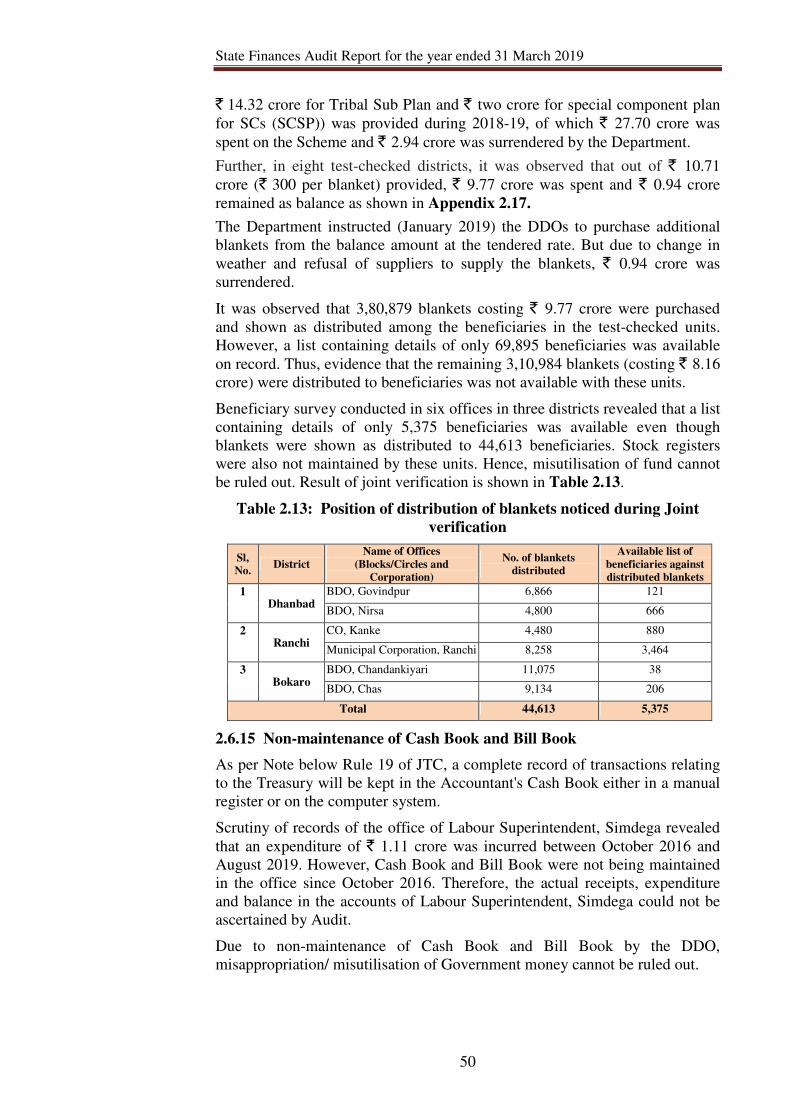
State Finances Audit Report for the year ended 31 March 2019
50
` 14.32 crore for Tribal Sub Plan and ` two crore for special component plan
for SCs (SCSP)) was provided during 2018-19, of which ` 27.70 crore was
spent on the Scheme and ` 2.94 crore was surrendered by the Department.
Further, in eight test-checked districts, it was observed that out of ` 10.71
crore (` 300 per blanket) provided, ` 9.77 crore was spent and ` 0.94 crore
remained as balance as shown in Appendix 2.17.
The Department instructed (January 2019) the DDOs to purchase additional
blankets from the balance amount at the tendered rate. But due to change in
weather and refusal of suppliers to supply the blankets, ` 0.94 crore was
surrendered.
It was observed that 3,80,879 blankets costing ` 9.77 crore were purchased
and shown as distributed among the beneficiaries in the test-checked units.
However, a list containing details of only 69,895 beneficiaries was available
on record. Thus, evidence that the remaining 3,10,984 blankets (costing ` 8.16
crore) were distributed to beneficiaries was not available with these units.
Beneficiary survey conducted in six offices in three districts revealed that a list
containing details of only 5,375 beneficiaries was available even though
blankets were shown as distributed to 44,613 beneficiaries. Stock registers
were also not maintained by these units. Hence, misutilisation of fund cannot
be ruled out. Result of joint verification is shown in Table 2.13.
Table 2.13: Position of distribution of blankets noticed during Joint
verification
Sl,
No. District
Name of Offices
(Blocks/Circles and
Corporation)
No. of blankets
distributed
Available list of
beneficiaries against
distributed blankets
1 Dhanbad
BDO, Govindpur 6,866 121
BDO, Nirsa 4,800 666
2 Ranchi
CO, Kanke 4,480 880
Municipal Corporation, Ranchi 8,258 3,464
3 Bokaro
BDO, Chandankiyari 11,075 38
BDO, Chas 9,134 206
Total 44,613 5,375
2.6.15 Non-maintenance of Cash Book and Bill Book
As per Note below Rule 19 of JTC, a complete record of transactions relating
to the Treasury will be kept in the Accountant's Cash Book either in a manual
register or on the computer system.
Scrutiny of records of the office of Labour Superintendent, Simdega revealed
that an expenditure of ` 1.11 crore was incurred between October 2016 and
August 2019. However, Cash Book and Bill Book were not being maintained
in the office since October 2016. Therefore, the actual receipts, expenditure
and balance in the accounts of Labour Superintendent, Simdega could not be
ascertained by Audit.
Due to non-maintenance of Cash Book and Bill Book by the DDO,
misappropriation/ misutilisation of Government money cannot be ruled out.
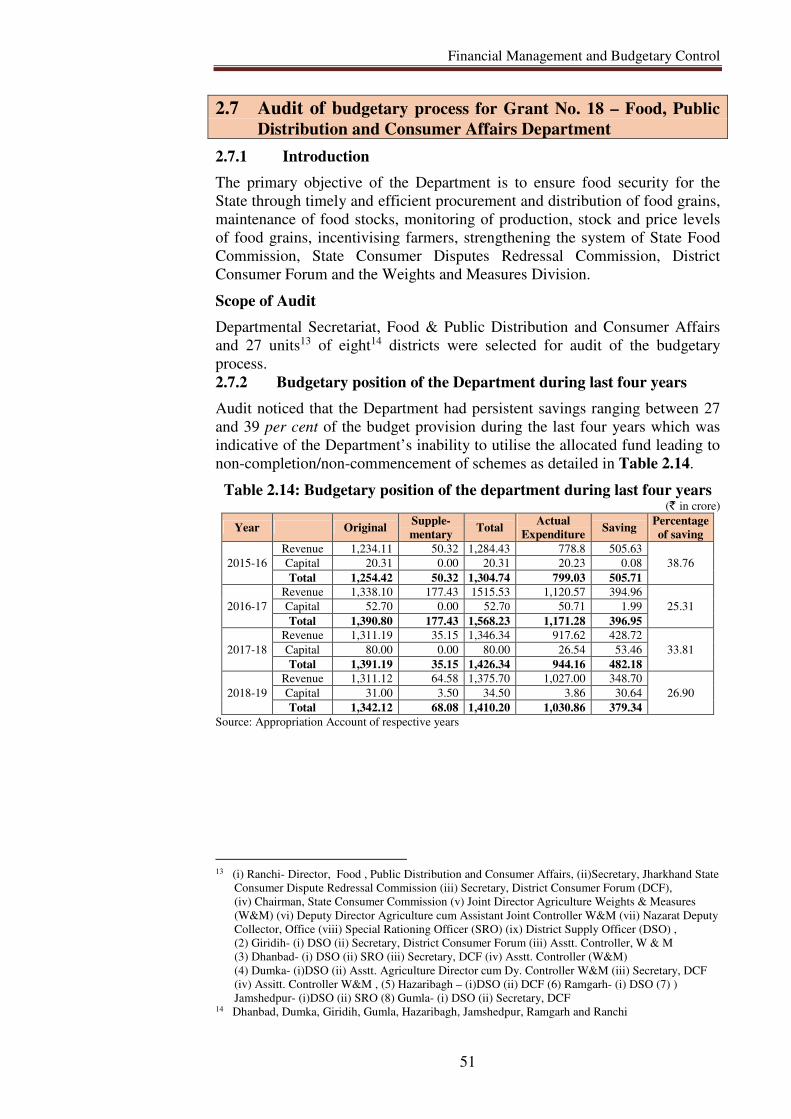
Financial Management and Budgetary Control
51
2.7 Audit of budgetary process for Grant No. 18 – Food, Public
Distribution and Consumer Affairs Department
2.7.1 Introduction
The primary objective of the Department is to ensure food security for the
State through timely and efficient procurement and distribution of food grains,
maintenance of food stocks, monitoring of production, stock and price levels
of food grains, incentivising farmers, strengthening the system of State Food
Commission, State Consumer Disputes Redressal Commission, District
Consumer Forum and the Weights and Measures Division.
Scope of Audit
Departmental Secretariat, Food & Public Distribution and Consumer Affairs
and 27 units13 of eight14 districts were selected for audit of the budgetary
process.
2.7.2 Budgetary position of the Department during last four years
Audit noticed that the Department had persistent savings ranging between 27
and 39 per cent of the budget provision during the last four years which was
indicative of the Department’s inability to utilise the allocated fund leading to
non-completion/non-commencement of schemes as detailed in Table 2.14.
Table 2.14: Budgetary position of the department during last four years (` in crore)
Year Original Supple-
mentary Total
Actual
Expenditure Saving
Percentage
of saving
2015-16
Revenue 1,234.11 50.32 1,284.43 778.8 505.63
38.76 Capital 20.31 0.00 20.31 20.23 0.08
Total 1,254.42 50.32 1,304.74 799.03 505.71
2016-17
Revenue 1,338.10 177.43 1515.53 1,120.57 394.96
25.31 Capital 52.70 0.00 52.70 50.71 1.99
Total 1,390.80 177.43 1,568.23 1,171.28 396.95
2017-18
Revenue 1,311.19 35.15 1,346.34 917.62 428.72
33.81 Capital 80.00 0.00 80.00 26.54 53.46
Total 1,391.19 35.15 1,426.34 944.16 482.18
2018-19
Revenue 1,311.12 64.58 1,375.70 1,027.00 348.70
26.90 Capital 31.00 3.50 34.50 3.86 30.64
Total 1,342.12 68.08 1,410.20 1,030.86 379.34
Source: Appropriation Account of respective years
13 (i) Ranchi- Director, Food , Public Distribution and Consumer Affairs, (ii)Secretary, Jharkhand State
Consumer Dispute Redressal Commission (iii) Secretary, District Consumer Forum (DCF),
(iv) Chairman, State Consumer Commission (v) Joint Director Agriculture Weights & Measures
(W&M) (vi) Deputy Director Agriculture cum Assistant Joint Controller W&M (vii) Nazarat Deputy
Collector, Office (viii) Special Rationing Officer (SRO) (ix) District Supply Officer (DSO) ,
(2) Giridih- (i) DSO (ii) Secretary, District Consumer Forum (iii) Asstt. Controller, W & M
(3) Dhanbad- (i) DSO (ii) SRO (iii) Secretary, DCF (iv) Asstt. Controller (W&M)
(4) Dumka- (i)DSO (ii) Asstt. Agriculture Director cum Dy. Controller W&M (iii) Secretary, DCF
(iv) Assitt. Controller W&M , (5) Hazaribagh – (i)DSO (ii) DCF (6) Ramgarh- (i) DSO (7) )
Jamshedpur- (i)DSO (ii) SRO (8) Gumla- (i) DSO (ii) Secretary, DCF 14 Dhanbad, Dumka, Giridih, Gumla, Hazaribagh, Jamshedpur, Ramgarh and Ranchi
State Finances Audit Report for the year ended 31 March 2019
52
2.7.3 Provision for preparation of Budget Estimate not
followed
Rule 62 of the Budget Manual provides the calendar for correct and timely
preparation of the budget of the State. In October 2017 the Finance
Department (FD), GoJ revised the scheduled common submission date from
01 October every year to 01 November for estimates of Establishment
Expenditure and 24 November for the General Budget (State, Central and
Centrally Sponsored Schemes).
2.7.4 Avoidable Supplementary Provision
As per comments below Rule 57 of Budget Manual, the officer responsible for
preparing the estimates should be sure that there is no provision for a greater
sum than that which can be spent.
It was noticed that during 2018-19, additional funds were provided for 15 out
of 75 schemes (revenue heads) through the supplementary budgets despite the
original provisions for those schemes remaining unutilised.
As shown in the Appendix 2.18, provision of additional fund of ` 17.93 crore
through supplementary budgets proved unnecessary as expenditure was only
` 55.27 crore against the original provision of ` 68.13 crore.
Further, in five test-checked District units15, it was observed that excess fund
of ` 7.39 crore was provided through supplementary budget which remained
unutilised at the end of the financial year as detailed in Appendix 2.19.
2.7.5 Surrender on the last day of the financial year
As per Rule 137 of the Budget Manual, no object is served by keeping back
savings, which should be surrendered. For this reason, appropriations which
are likely to remain unspent must be reported for surrender as early as
possible. If it is not done, other officers connected with the spending
department are deprived of funds which they could have utilised.
It was observed that out of the provision of ` 1,342.00 crore during 2018-19,
` 256.52 crore was surrendered by the Department on 31 March 2019, leaving
no scope for its utilisation on other schemes. In six test-checked districts units,
` 105.47 crore was surrendered on the last two days of the financial year as
detailed in Appendix 2.20.
2.7.6 Rush of expenditure
It was observed that the provisions of the Budget manual were not followed by
the Department and the expenditure during March 2019 ranged between 26
and 100 per cent of the total expenditure in 15 out of 75 heads of account
(Capital and Voted), as detailed in Appendix 2.21.
In four test-checked districts, it was noticed that the expenditure by these units
during March 2019 ranged between 34 to 100 per cent under various heads as
detailed in Appendix 2.22.
15 Dhanbad, Dumka, Giridih, Hazaribagh and Ramgarh
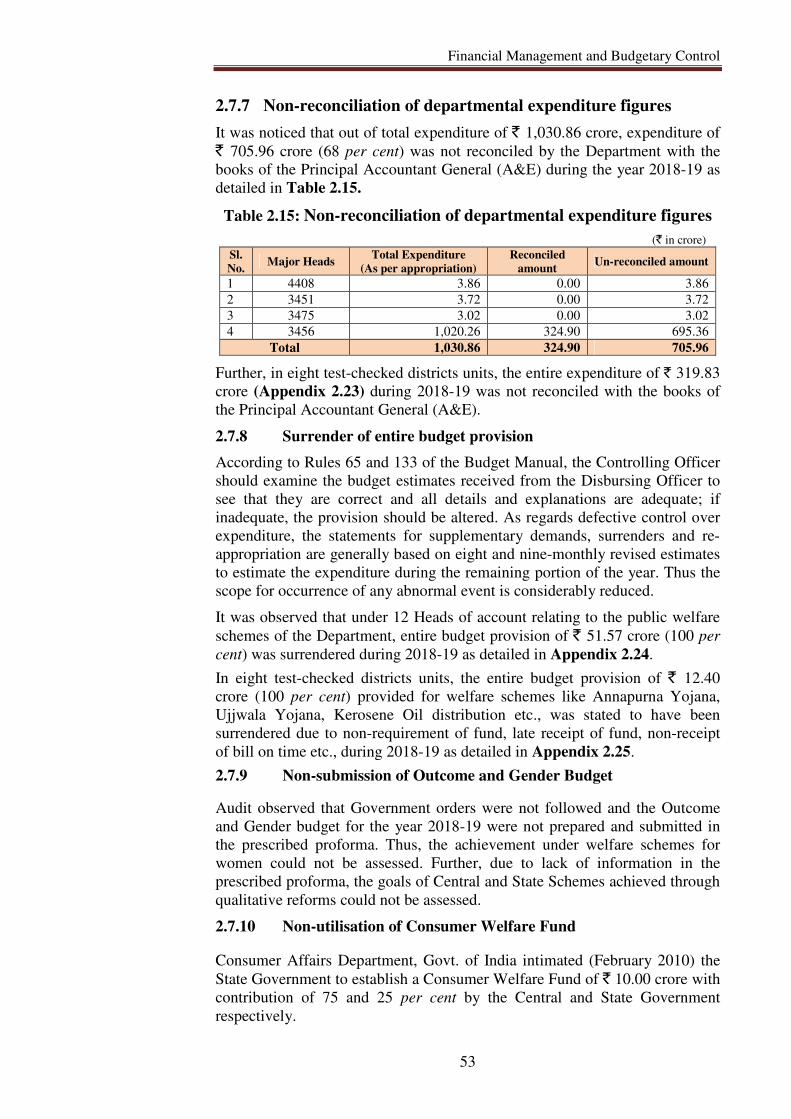
Financial Management and Budgetary Control
53
2.7.7 Non-reconciliation of departmental expenditure figures
It was noticed that out of total expenditure of ` 1,030.86 crore, expenditure of
` 705.96 crore (68 per cent) was not reconciled by the Department with the
books of the Principal Accountant General (A&E) during the year 2018-19 as
detailed in Table 2.15.
Table 2.15: Non-reconciliation of departmental expenditure figures
(` in crore) Sl.
No. Major Heads
Total Expenditure
(As per appropriation)
Reconciled
amount Un-reconciled amount
1 4408 3.86 0.00 3.86
2 3451 3.72 0.00 3.72
3 3475 3.02 0.00 3.02
4 3456 1,020.26 324.90 695.36
Total 1,030.86 324.90 705.96
Further, in eight test-checked districts units, the entire expenditure of ` 319.83
crore (Appendix 2.23) during 2018-19 was not reconciled with the books of
the Principal Accountant General (A&E).
2.7.8 Surrender of entire budget provision
According to Rules 65 and 133 of the Budget Manual, the Controlling Officer
should examine the budget estimates received from the Disbursing Officer to
see that they are correct and all details and explanations are adequate; if
inadequate, the provision should be altered. As regards defective control over
expenditure, the statements for supplementary demands, surrenders and re-
appropriation are generally based on eight and nine-monthly revised estimates
to estimate the expenditure during the remaining portion of the year. Thus the
scope for occurrence of any abnormal event is considerably reduced.
It was observed that under 12 Heads of account relating to the public welfare
schemes of the Department, entire budget provision of ` 51.57 crore (100 per
cent) was surrendered during 2018-19 as detailed in Appendix 2.24.
In eight test-checked districts units, the entire budget provision of ` 12.40
crore (100 per cent) provided for welfare schemes like Annapurna Yojana,
Ujjwala Yojana, Kerosene Oil distribution etc., was stated to have been
surrendered due to non-requirement of fund, late receipt of fund, non-receipt
of bill on time etc., during 2018-19 as detailed in Appendix 2.25.
2.7.9 Non-submission of Outcome and Gender Budget
Audit observed that Government orders were not followed and the Outcome
and Gender budget for the year 2018-19 were not prepared and submitted in
the prescribed proforma. Thus, the achievement under welfare schemes for
women could not be assessed. Further, due to lack of information in the
prescribed proforma, the goals of Central and State Schemes achieved through
qualitative reforms could not be assessed.
2.7.10 Non-utilisation of Consumer Welfare Fund
Consumer Affairs Department, Govt. of India intimated (February 2010) the
State Government to establish a Consumer Welfare Fund of ` 10.00 crore with
contribution of 75 and 25 per cent by the Central and State Government
respectively.
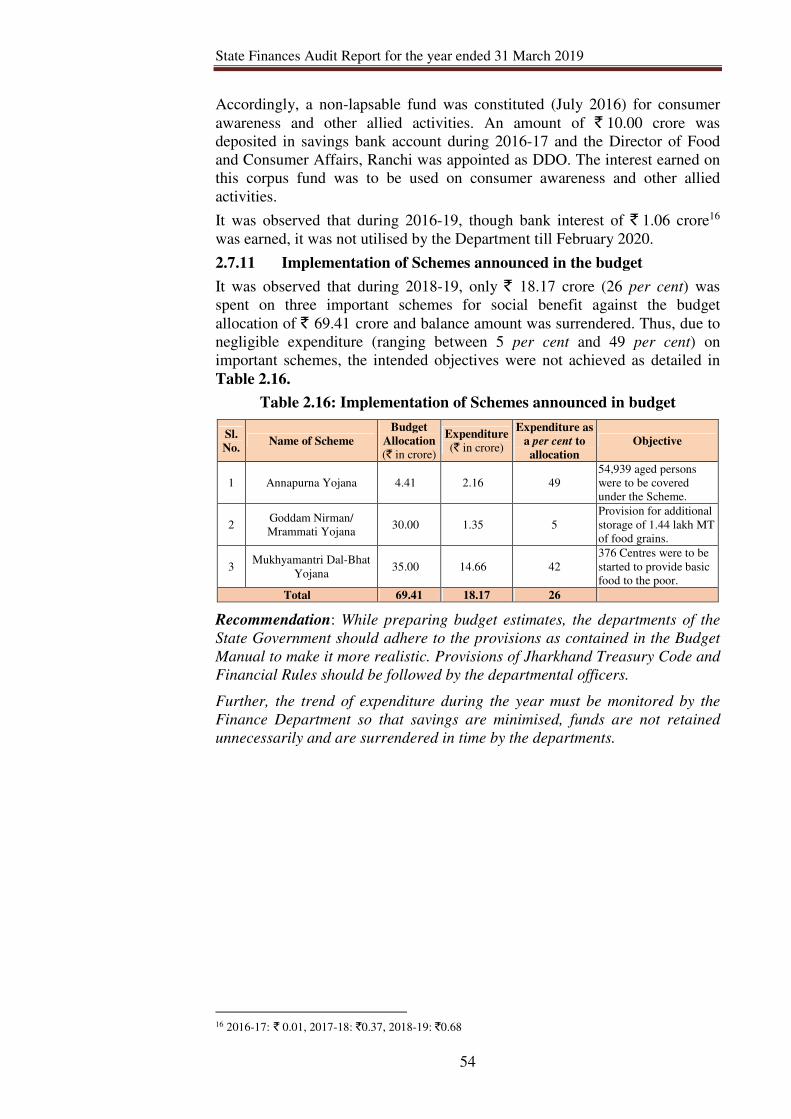
State Finances Audit Report for the year ended 31 March 2019
54
Accordingly, a non-lapsable fund was constituted (July 2016) for consumer
awareness and other allied activities. An amount of ` 10.00 crore was
deposited in savings bank account during 2016-17 and the Director of Food
and Consumer Affairs, Ranchi was appointed as DDO. The interest earned on
this corpus fund was to be used on consumer awareness and other allied
activities.
It was observed that during 2016-19, though bank interest of ` 1.06 crore16
was earned, it was not utilised by the Department till February 2020.
2.7.11 Implementation of Schemes announced in the budget
It was observed that during 2018-19, only ` 18.17 crore (26 per cent) was
spent on three important schemes for social benefit against the budget
allocation of ` 69.41 crore and balance amount was surrendered. Thus, due to
negligible expenditure (ranging between 5 per cent and 49 per cent) on
important schemes, the intended objectives were not achieved as detailed in
Table 2.16.
Table 2.16: Implementation of Schemes announced in budget
Sl.
No. Name of Scheme
Budget
Allocation
(` in crore)
Expenditure
(` in crore)
Expenditure as
a per cent to
allocation
Objective
1 Annapurna Yojana 4.41 2.16 49
54,939 aged persons
were to be covered
under the Scheme.
2 Goddam Nirman/
Mrammati Yojana 30.00 1.35 5
Provision for additional
storage of 1.44 lakh MT
of food grains.
3 Mukhyamantri Dal-Bhat
Yojana 35.00 14.66 42
376 Centres were to be
started to provide basic
food to the poor.
Total 69.41 18.17 26
Recommendation: While preparing budget estimates, the departments of the
State Government should adhere to the provisions as contained in the Budget
Manual to make it more realistic. Provisions of Jharkhand Treasury Code and
Financial Rules should be followed by the departmental officers.
Further, the trend of expenditure during the year must be monitored by the
Finance Department so that savings are minimised, funds are not retained
unnecessarily and are surrendered in time by the departments.
16 2016-17: ` 0.01, 2017-18: `0.37, 2018-19: `0.68

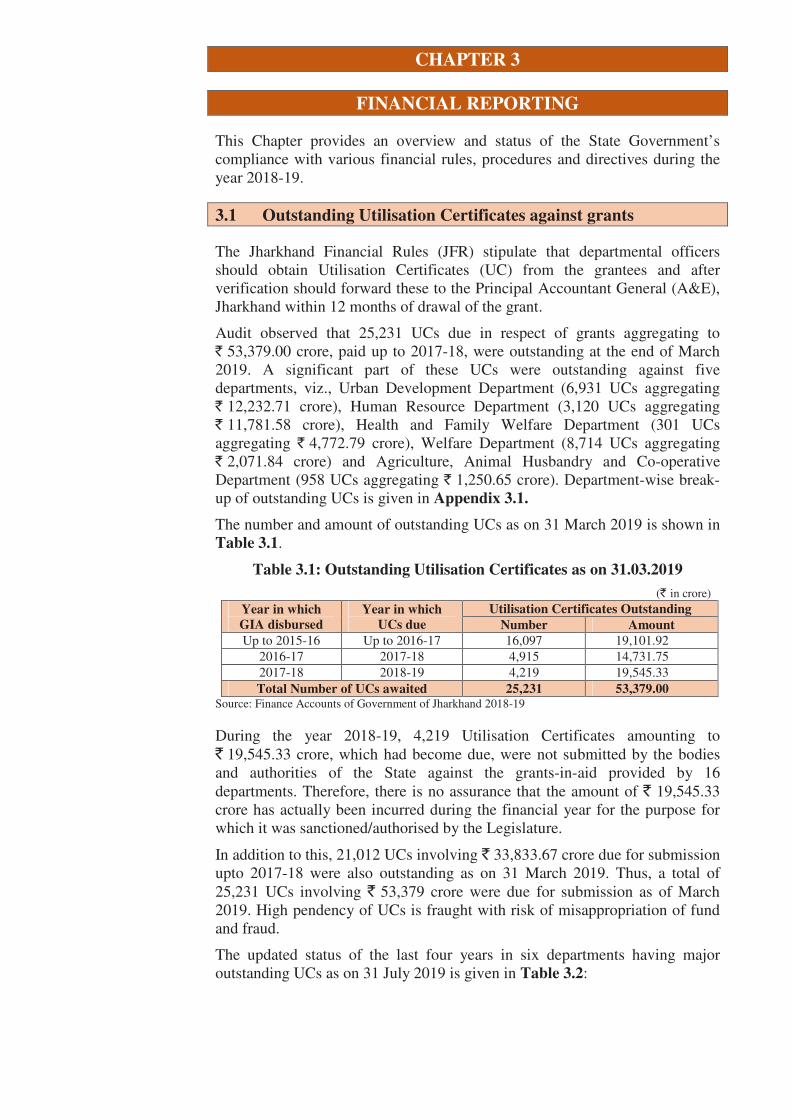
CHAPTER 3
FINANCIAL REPORTING
55
This Chapter provides an overview and status of the State Government’s
compliance with various financial rules, procedures and directives during the
year 2018-19.
3.1 Outstanding Utilisation Certificates against grants
The Jharkhand Financial Rules (JFR) stipulate that departmental officers
should obtain Utilisation Certificates (UC) from the grantees and after
verification should forward these to the Principal Accountant General (A&E),
Jharkhand within 12 months of drawal of the grant.
Audit observed that 25,231 UCs due in respect of grants aggregating to
` 53,379.00 crore, paid up to 2017-18, were outstanding at the end of March
2019. A significant part of these UCs were outstanding against five
departments, viz., Urban Development Department (6,931 UCs aggregating
` 12,232.71 crore), Human Resource Department (3,120 UCs aggregating
` 11,781.58 crore), Health and Family Welfare Department (301 UCs
aggregating ` 4,772.79 crore), Welfare Department (8,714 UCs aggregating
` 2,071.84 crore) and Agriculture, Animal Husbandry and Co-operative
Department (958 UCs aggregating ` 1,250.65 crore). Department-wise break-
up of outstanding UCs is given in Appendix 3.1.
The number and amount of outstanding UCs as on 31 March 2019 is shown in
Table 3.1.
Table 3.1: Outstanding Utilisation Certificates as on 31.03.2019
(` in crore)
Year in which
GIA disbursed
Year in which
UCs due
Utilisation Certificates Outstanding
Number Amount
Up to 2015-16 Up to 2016-17 16,097 19,101.92
2016-17 2017-18 4,915 14,731.75
2017-18 2018-19 4,219 19,545.33
Total Number of UCs awaited 25,231 53,379.00 Source: Finance Accounts of Government of Jharkhand 2018-19
During the year 2018-19, 4,219 Utilisation Certificates amounting to
` 19,545.33 crore, which had become due, were not submitted by the bodies
and authorities of the State against the grants-in-aid provided by 16
departments. Therefore, there is no assurance that the amount of ` 19,545.33
crore has actually been incurred during the financial year for the purpose for
which it was sanctioned/authorised by the Legislature.
In addition to this, 21,012 UCs involving ` 33,833.67 crore due for submission
upto 2017-18 were also outstanding as on 31 March 2019. Thus, a total of
25,231 UCs involving ` 53,379 crore were due for submission as of March
2019. High pendency of UCs is fraught with risk of misappropriation of fund
and fraud.
The updated status of the last four years in six departments having major
outstanding UCs as on 31 July 2019 is given in Table 3.2:
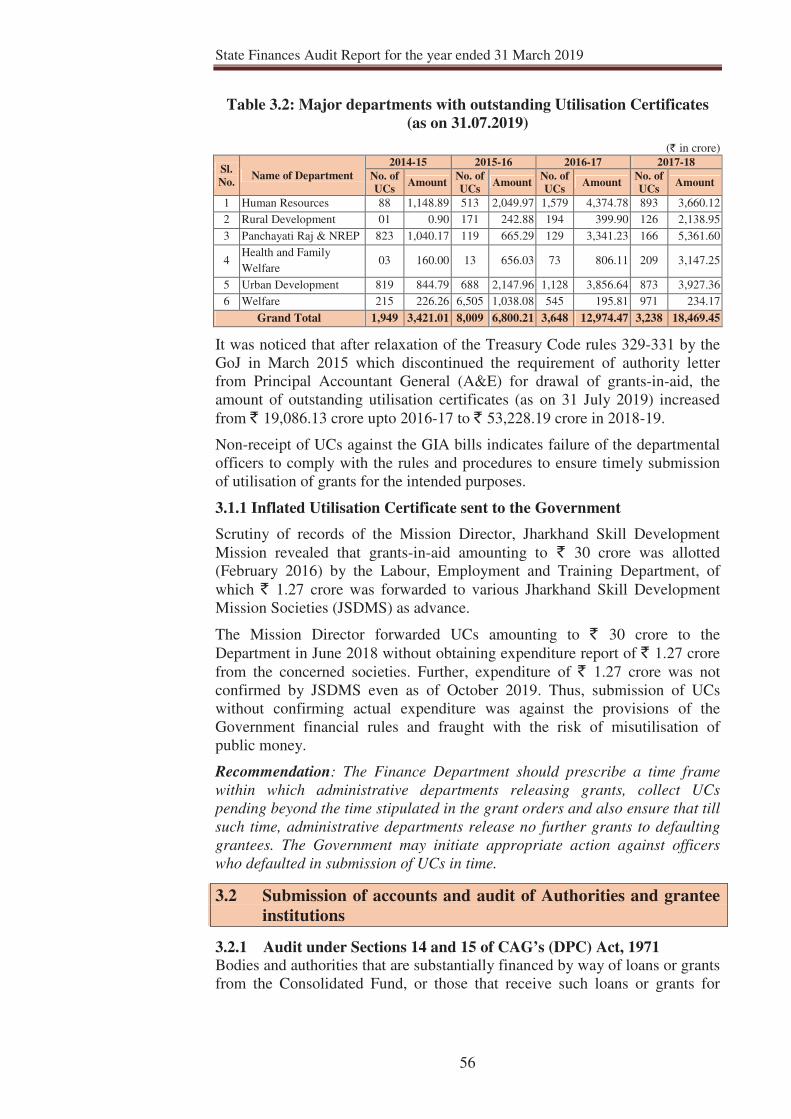
State Finances Audit Report for the year ended 31 March 2019
56
Table 3.2: Major departments with outstanding Utilisation Certificates
(as on 31.07.2019)
It was noticed that after relaxation of the Treasury Code rules 329-331 by the
GoJ in March 2015 which discontinued the requirement of authority letter
from Principal Accountant General (A&E) for drawal of grants-in-aid, the
amount of outstanding utilisation certificates (as on 31 July 2019) increased
from ` 19,086.13 crore upto 2016-17 to ` 53,228.19 crore in 2018-19.
Non-receipt of UCs against the GIA bills indicates failure of the departmental
officers to comply with the rules and procedures to ensure timely submission
of utilisation of grants for the intended purposes.
3.1.1 Inflated Utilisation Certificate sent to the Government
Scrutiny of records of the Mission Director, Jharkhand Skill Development
Mission revealed that grants-in-aid amounting to ` 30 crore was allotted
(February 2016) by the Labour, Employment and Training Department, of
which ` 1.27 crore was forwarded to various Jharkhand Skill Development
Mission Societies (JSDMS) as advance.
The Mission Director forwarded UCs amounting to ` 30 crore to the
Department in June 2018 without obtaining expenditure report of ` 1.27 crore
from the concerned societies. Further, expenditure of ` 1.27 crore was not
confirmed by JSDMS even as of October 2019. Thus, submission of UCs
without confirming actual expenditure was against the provisions of the
Government financial rules and fraught with the risk of misutilisation of
public money.
Recommendation: The Finance Department should prescribe a time frame
within which administrative departments releasing grants, collect UCs
pending beyond the time stipulated in the grant orders and also ensure that till
such time, administrative departments release no further grants to defaulting
grantees. The Government may initiate appropriate action against officers
who defaulted in submission of UCs in time.
3.2 Submission of accounts and audit of Authorities and grantee
institutions
3.2.1 Audit under Sections 14 and 15 of CAG’s (DPC) Act, 1971
Bodies and authorities that are substantially financed by way of loans or grants
from the Consolidated Fund, or those that receive such loans or grants for
(` in crore)
Sl.
No. Name of Department
2014-15 2015-16 2016-17 2017-18
No. of
UCs Amount
No. of
UCs Amount
No. of
UCs Amount
No. of
UCs Amount
1 Human Resources 88 1,148.89 513 2,049.97 1,579 4,374.78 893 3,660.12
2 Rural Development 01 0.90 171 242.88 194 399.90 126 2,138.95
3 Panchayati Raj & NREP 823 1,040.17 119 665.29 129 3,341.23 166 5,361.60
4 Health and Family
Welfare 03 160.00 13 656.03 73 806.11 209 3,147.25
5 Urban Development 819 844.79 688 2,147.96 1,128 3,856.64 873 3,927.36
6 Welfare 215 226.26 6,505 1,038.08 545 195.81 971 234.17
Grand Total 1,949 3,421.01 8,009 6,800.21 3,648 12,974.47 3,238 18,469.45
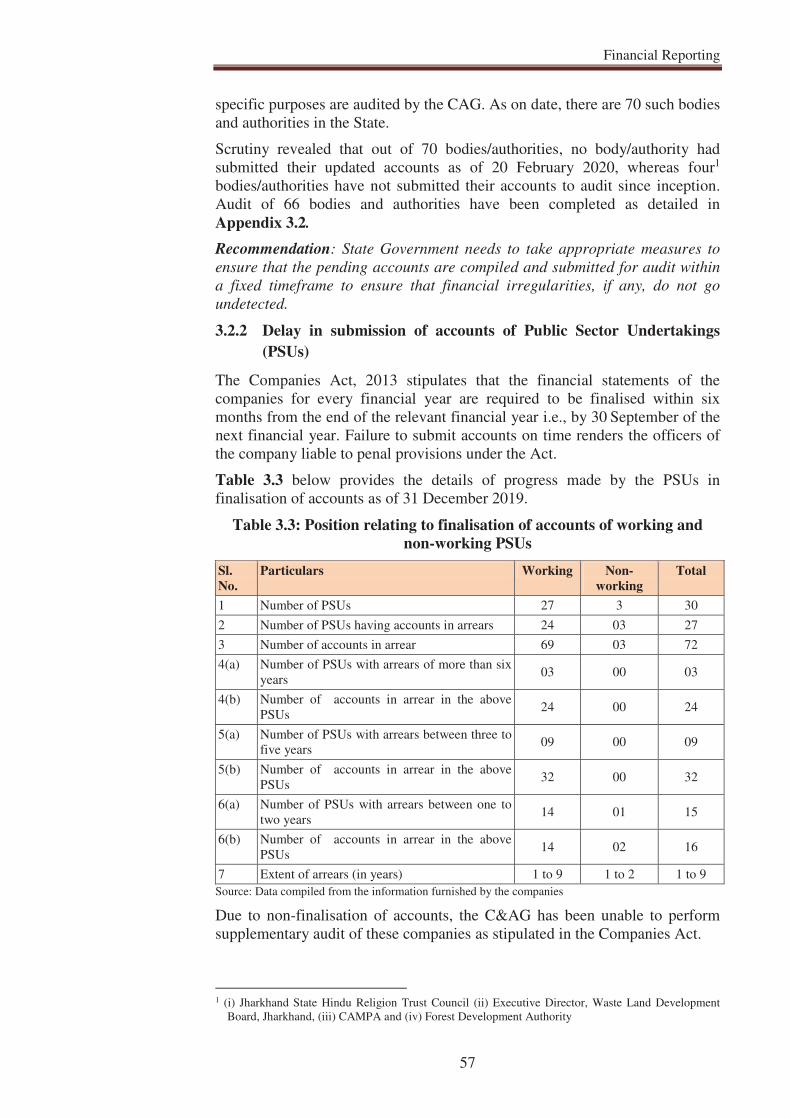
Financial Reporting
57
specific purposes are audited by the CAG. As on date, there are 70 such bodies
and authorities in the State.
Scrutiny revealed that out of 70 bodies/authorities, no body/authority had
submitted their updated accounts as of 20 February 2020, whereas four1
bodies/authorities have not submitted their accounts to audit since inception.
Audit of 66 bodies and authorities have been completed as detailed in
Appendix 3.2.
Recommendation: State Government needs to take appropriate measures to
ensure that the pending accounts are compiled and submitted for audit within
a fixed timeframe to ensure that financial irregularities, if any, do not go
undetected.
3.2.2 Delay in submission of accounts of Public Sector Undertakings
(PSUs)
The Companies Act, 2013 stipulates that the financial statements of the
companies for every financial year are required to be finalised within six
months from the end of the relevant financial year i.e., by 30 September of the
next financial year. Failure to submit accounts on time renders the officers of
the company liable to penal provisions under the Act.
Table 3.3 below provides the details of progress made by the PSUs in
finalisation of accounts as of 31 December 2019.
Table 3.3: Position relating to finalisation of accounts of working and
non-working PSUs
Sl.
No.
Particulars Working Non-
working
Total
1 Number of PSUs 27 3 30
2 Number of PSUs having accounts in arrears 24 03 27
3 Number of accounts in arrear 69 03 72
4(a) Number of PSUs with arrears of more than six
years 03 00 03
4(b) Number of accounts in arrear in the above
PSUs 24 00 24
5(a) Number of PSUs with arrears between three to
five years 09 00 09
5(b) Number of accounts in arrear in the above
PSUs 32 00 32
6(a) Number of PSUs with arrears between one to
two years 14 01 15
6(b) Number of accounts in arrear in the above
PSUs 14 02 16
7 Extent of arrears (in years) 1 to 9 1 to 2 1 to 9
Source: Data compiled from the information furnished by the companies
Due to non-finalisation of accounts, the C&AG has been unable to perform
supplementary audit of these companies as stipulated in the Companies Act.
1 (i) Jharkhand State Hindu Religion Trust Council (ii) Executive Director, Waste Land Development
Board, Jharkhand, (iii) CAMPA and (iv) Forest Development Authority
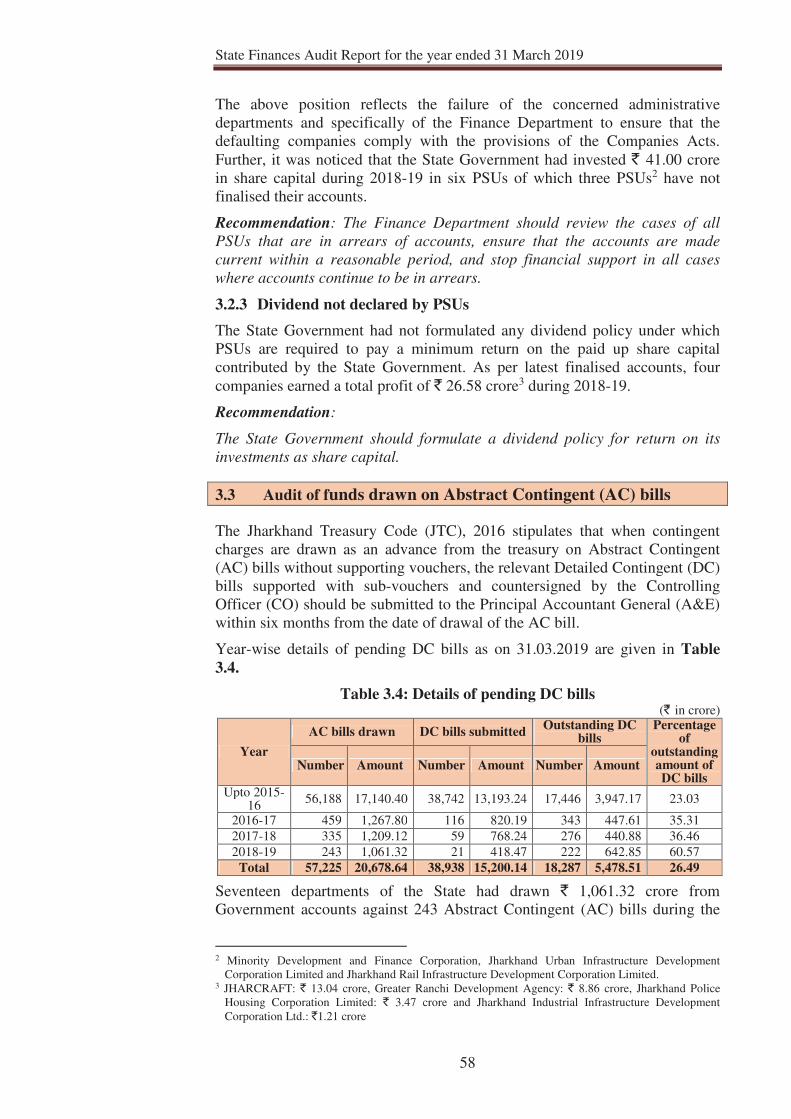
State Finances Audit Report for the year ended 31 March 2019
58
The above position reflects the failure of the concerned administrative
departments and specifically of the Finance Department to ensure that the
defaulting companies comply with the provisions of the Companies Acts.
Further, it was noticed that the State Government had invested ` 41.00 crore
in share capital during 2018-19 in six PSUs of which three PSUs2 have not
finalised their accounts.
Recommendation: The Finance Department should review the cases of all
PSUs that are in arrears of accounts, ensure that the accounts are made
current within a reasonable period, and stop financial support in all cases
where accounts continue to be in arrears.
3.2.3 Dividend not declared by PSUs
The State Government had not formulated any dividend policy under which
PSUs are required to pay a minimum return on the paid up share capital
contributed by the State Government. As per latest finalised accounts, four
companies earned a total profit of ` 26.58 crore3 during 2018-19.
Recommendation:
The State Government should formulate a dividend policy for return on its
investments as share capital.
3.3 Audit of funds drawn on Abstract Contingent (AC) bills
The Jharkhand Treasury Code (JTC), 2016 stipulates that when contingent
charges are drawn as an advance from the treasury on Abstract Contingent
(AC) bills without supporting vouchers, the relevant Detailed Contingent (DC)
bills supported with sub-vouchers and countersigned by the Controlling
Officer (CO) should be submitted to the Principal Accountant General (A&E)
within six months from the date of drawal of the AC bill.
Year-wise details of pending DC bills as on 31.03.2019 are given in Table
3.4.
Table 3.4: Details of pending DC bills (` in crore)
Year
AC bills drawn DC bills submitted Outstanding DC
bills Percentage
of outstanding amount of DC bills
Number Amount Number Amount Number Amount
Upto 2015-16
56,188 17,140.40 38,742 13,193.24 17,446 3,947.17 23.03
2016-17 459 1,267.80 116 820.19 343 447.61 35.31
2017-18 335 1,209.12 59 768.24 276 440.88 36.46
2018-19 243 1,061.32 21 418.47 222 642.85 60.57
Total 57,225 20,678.64 38,938 15,200.14 18,287 5,478.51 26.49
Seventeen departments of the State had drawn ` 1,061.32 crore from
Government accounts against 243 Abstract Contingent (AC) bills during the
2 Minority Development and Finance Corporation, Jharkhand Urban Infrastructure Development
Corporation Limited and Jharkhand Rail Infrastructure Development Corporation Limited. 3 JHARCRAFT: ` 13.04 crore, Greater Ranchi Development Agency: ` 8.86 crore, Jharkhand Police
Housing Corporation Limited: ` 3.47 crore and Jharkhand Industrial Infrastructure Development
Corporation Ltd.: `1.21 crore
Financial Reporting
59
financial year 2018-19 but did not submit 222 Detailed Contingent (DC) bills
amounting to ` 642.85 crore before the close of the financial year. Therefore,
there is no assurance that the amount of ` 642.85 crore has actually been
incurred during the financial year for the purpose for which it was
sanctioned/authorised by the Legislature. This is a possible overstatement of
expenditure in the year 2018-19.
In addition to this, 18,065 AC bills amounting to ` 4,836 crore drawn up to
2017-18 were also outstanding as on 31 March 2019. Advances drawn and not
accounted for increases the possibility of wastage/misappropriation/
malfeasance etc.
Out of ` 1,061 crore drawn on AC bills in 2018-19, ` 62 crore was drawn in
the month of March 2019. However, in comparison to the drawal in March
2018 (` 233 crore) the drawal in March 2019 decreased significantly.
Significant expenditure through AC bill in March 2019 indicates that the
drawal was primarily to exhaust the budget and reveals inadequate budgetary
control.
Departments with maximum amount of pending DC bills along with
comparative details are given in Table 3.5.
Table 3.5: Department-wise comparative details of outstanding DC bills
(` in crore)
Sl. No.
Name of Department
Outstanding amount of DC bills as on 28.06.2019
Total upto 2014-15
2015-16 2016-17 2017-18 2018-19
1 Rural Development Department (Rural Development Division)
606.63 124.29 120.72 212.30 304.66 1,368.60
2 Welfare Department (Welfare Division)
394.76 18.41 22.23 5.12 5.65 446.17
3 Women, Child Development and Social Security Department
450.04 83.72 0.00 0.00 0.45 534.21
4 Health, Medical Education and Family Welfare Department
446.49 66.94 15.65 5.14 20.47 554.69
5 Home, Jail and Disaster Management Department (Home Division)
95.76 25.47 29.65 56.56 175.70 383.14
Total 1,993.68 318.83 188.25 279.12 506.93 3,286.81
As shown in the above table in respect of Rural Development Department, the
outstanding DC bills increased significantly since 2017-18.
During scrutiny of records of two departments (Food, Public Distribution and
Consumer Affairs Department and Labour, Employment and Training
Department), it was observed that ` 524.03 crore was drawn on 1,410 AC
bills under seven Major heads, of which 827 DC bills amounting to ` 207.94
crore were outstanding as of July 2019 as detailed in Appendix 3.3.
Further, out of total outstanding amount of ` 207.94 crore, DC bills amounting
to ` 206.32 crore (99 per cent) were outstanding for more than two years.
During the years 2017-18 and 2018-19, the pendency of DC bills was 83 and
100 per cent respectively of the total drawal on AC bills.
Scrutiny of records of 17 units of test-checked districts revealed that ` 205.95
crore was drawn on 131 AC bills under three Major heads (2230, 3456 &
4059) during the period 2000-01 to 2018-19, of which an amount of ` 52.44
crore was outstanding as of 31 July 2019 as detailed in Appendix 3.4.
State Finances Audit Report for the year ended 31 March 2019
60
3.3.1 Delay in submission of DC bills
Rule 187 of Jharkhand Treasury Code provides that DC bills shall be sent to
the Accountant General (A&E) within six months following the month in
which the abstract bill was drawn from the treasury. No AC bill shall be
cashed after the end of this period unless DC bill has been submitted in
accordance with the rules.
During scrutiny of records of five test-checked districts under Grant No. 18 -
Food, Public Distribution and Consumer Affairs Department, it was noticed
that DC bills amounting to ` 60.67 crore against AC bills drawn during 2003-
04 to 2016-17 (Appendix 3.5) were submitted to Pr. Accountant General
(A&E) with delays ranging from 3 to 75 months.
Further, during scrutiny of the records of seven out of eight test-checked
district units of Labour, Employment and Training Department (Grant No.
26), it was noticed that 52 DC bills against the AC bills amounting to ` 21.23
crore drawn between 2001-02 and 2017-18, were submitted to the Principal
Accountant General (A&E) with delays up to 16 years and 08 months as
detailed in Appendix 3.6. No specific reason for delay was given by the
Department.
Drawal of funds on AC bills and non-submission of DC bills within the
prescribed time not only breaches financial discipline but also entails risk of
misappropriation of public money and unhealthy practices. Moreover, drawal
of funds on AC bills on the last day of the financial year is fraught with the
risk of mis-utilisation of public money.
Recommendation: The Finance Department should ensure that all controlling
officers adjust in a time bound manner, all AC bills pending beyond the
prescribed period, and also ensure that AC bills are not drawn merely to
avoid lapse of budget.
3.4 Reporting of cases on misappropriation, losses etc.
Rule 31 of the Jharkhand Financial Rules provides that loss of public money,
Government revenue, stores or other property by defalcation or otherwise
should be immediately reported by the office to the higher authority, Finance
Department as well as to the Accountant General (Audit), Jharkhand even
when such loss has been made good by the party responsible for it. Such
reports must be submitted as soon as a suspicion arises that there has been a
loss and these must not be delayed while enquiries are made.
Despite audit requisitions (03 December 2019), no information in this regard
has been received from the Finance Department (March 2020).
However, in response to Audit request during the previous years, the Finance
Department had directed the departments to provide the information who in
turn had instructed the DDOs to provide the same to Audit. This indicates that
the Finance Department has no information as required under Rule 31 to
monitor such cases. Thus, the Finance Department is not aware of the number
of such cases and its status at any point of time.
Recommendation: Finance Department should develop a mechanism so that
it can monitor cases of misappropriation, losses etc.
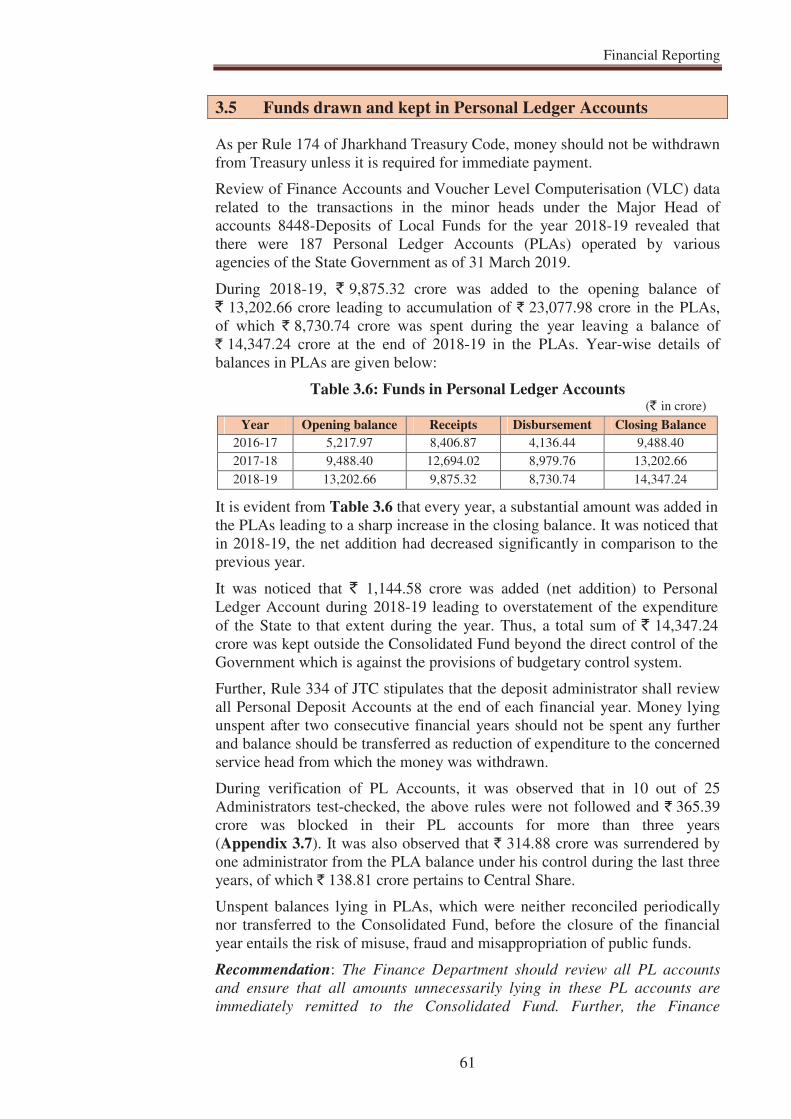
Financial Reporting
61
3.5 Funds drawn and kept in Personal Ledger Accounts
As per Rule 174 of Jharkhand Treasury Code, money should not be withdrawn
from Treasury unless it is required for immediate payment.
Review of Finance Accounts and Voucher Level Computerisation (VLC) data
related to the transactions in the minor heads under the Major Head of
accounts 8448-Deposits of Local Funds for the year 2018-19 revealed that
there were 187 Personal Ledger Accounts (PLAs) operated by various
agencies of the State Government as of 31 March 2019.
During 2018-19, ` 9,875.32 crore was added to the opening balance of
` 13,202.66 crore leading to accumulation of ` 23,077.98 crore in the PLAs,
of which ` 8,730.74 crore was spent during the year leaving a balance of
` 14,347.24 crore at the end of 2018-19 in the PLAs. Year-wise details of
balances in PLAs are given below:
Table 3.6: Funds in Personal Ledger Accounts (` in crore)
Year Opening balance Receipts Disbursement Closing Balance
2016-17 5,217.97 8,406.87 4,136.44 9,488.40
2017-18 9,488.40 12,694.02 8,979.76 13,202.66
2018-19 13,202.66 9,875.32 8,730.74 14,347.24
It is evident from Table 3.6 that every year, a substantial amount was added in
the PLAs leading to a sharp increase in the closing balance. It was noticed that
in 2018-19, the net addition had decreased significantly in comparison to the
previous year.
It was noticed that ` 1,144.58 crore was added (net addition) to Personal
Ledger Account during 2018-19 leading to overstatement of the expenditure
of the State to that extent during the year. Thus, a total sum of ` 14,347.24
crore was kept outside the Consolidated Fund beyond the direct control of the
Government which is against the provisions of budgetary control system.
Further, Rule 334 of JTC stipulates that the deposit administrator shall review
all Personal Deposit Accounts at the end of each financial year. Money lying
unspent after two consecutive financial years should not be spent any further
and balance should be transferred as reduction of expenditure to the concerned
service head from which the money was withdrawn.
During verification of PL Accounts, it was observed that in 10 out of 25
Administrators test-checked, the above rules were not followed and ` 365.39
crore was blocked in their PL accounts for more than three years
(Appendix 3.7). It was also observed that ` 314.88 crore was surrendered by
one administrator from the PLA balance under his control during the last three
years, of which ` 138.81 crore pertains to Central Share.
Unspent balances lying in PLAs, which were neither reconciled periodically
nor transferred to the Consolidated Fund, before the closure of the financial
year entails the risk of misuse, fraud and misappropriation of public funds.
Recommendation: The Finance Department should review all PL accounts
and ensure that all amounts unnecessarily lying in these PL accounts are
immediately remitted to the Consolidated Fund. Further, the Finance
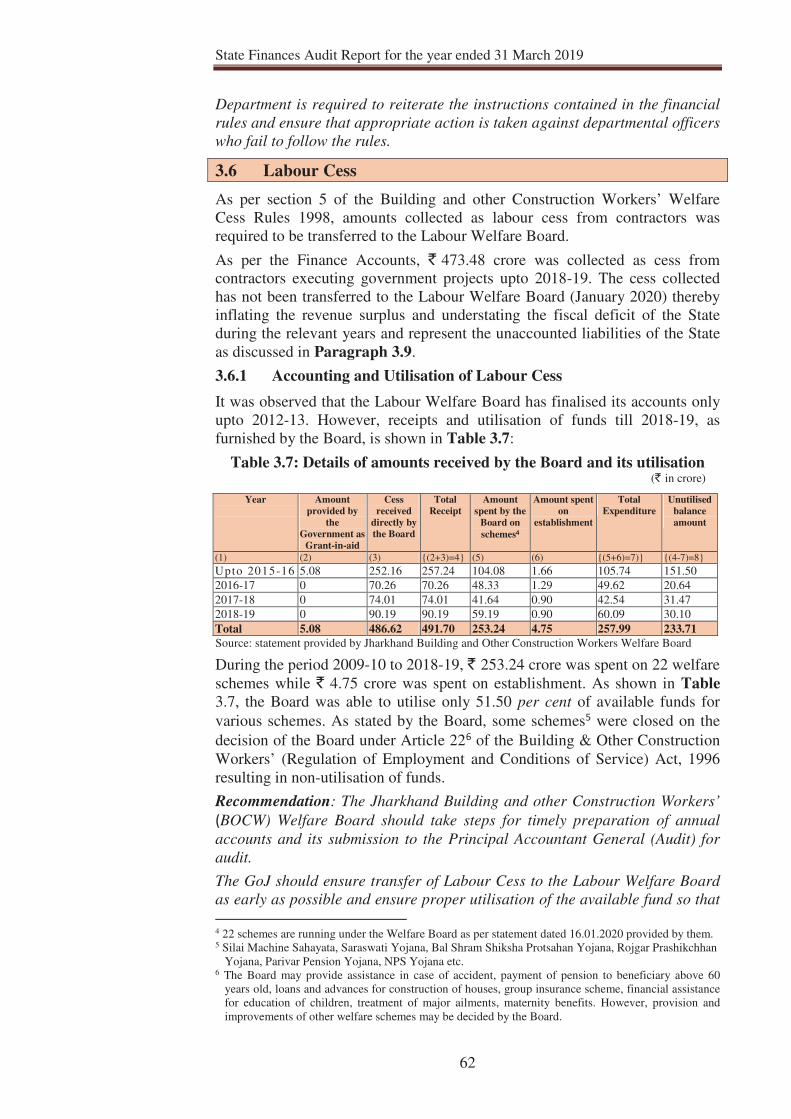
State Finances Audit Report for the year ended 31 March 2019
62
Department is required to reiterate the instructions contained in the financial
rules and ensure that appropriate action is taken against departmental officers
who fail to follow the rules.
3.6 Labour Cess
As per section 5 of the Building and other Construction Workers’ Welfare
Cess Rules 1998, amounts collected as labour cess from contractors was
required to be transferred to the Labour Welfare Board.
As per the Finance Accounts, ` 473.48 crore was collected as cess from
contractors executing government projects upto 2018-19. The cess collected
has not been transferred to the Labour Welfare Board (January 2020) thereby
inflating the revenue surplus and understating the fiscal deficit of the State
during the relevant years and represent the unaccounted liabilities of the State
as discussed in Paragraph 3.9.
3.6.1 Accounting and Utilisation of Labour Cess
It was observed that the Labour Welfare Board has finalised its accounts only
upto 2012-13. However, receipts and utilisation of funds till 2018-19, as
furnished by the Board, is shown in Table 3.7:
Table 3.7: Details of amounts received by the Board and its utilisation (` in crore)
Year
Amount
provided by
the
Government as
Grant-in-aid
Cess
received
directly by
the Board
Total
Receipt
Amount
spent by the
Board on
schemes4
Amount spent
on
establishment
Total
Expenditure
Unutilised
balance
amount
(1) (2) (3) {(2+3)=4} (5) (6) {(5+6)=7)} {(4-7)=8}
Upto 2015-16 5.08 252.16 257.24 104.08 1.66 105.74 151.50
2016-17 0 70.26 70.26 48.33 1.29 49.62 20.64
2017-18 0 74.01 74.01 41.64 0.90 42.54 31.47
2018-19 0 90.19 90.19 59.19 0.90 60.09 30.10
Total 5.08 486.62 491.70 253.24 4.75 257.99 233.71
Source: statement provided by Jharkhand Building and Other Construction Workers Welfare Board
During the period 2009-10 to 2018-19, ` 253.24 crore was spent on 22 welfare
schemes while ` 4.75 crore was spent on establishment. As shown in Table
3.7, the Board was able to utilise only 51.50 per cent of available funds for
various schemes. As stated by the Board, some schemes5 were closed on the
decision of the Board under Article 226 of the Building & Other Construction
Workers’ (Regulation of Employment and Conditions of Service) Act, 1996
resulting in non-utilisation of funds.
Recommendation: The Jharkhand Building and other Construction Workers’
(BOCW) Welfare Board should take steps for timely preparation of annual
accounts and its submission to the Principal Accountant General (Audit) for
audit.
The GoJ should ensure transfer of Labour Cess to the Labour Welfare Board
as early as possible and ensure proper utilisation of the available fund so that
4 22 schemes are running under the Welfare Board as per statement dated 16.01.2020 provided by them. 5 Silai Machine Sahayata, Saraswati Yojana, Bal Shram Shiksha Protsahan Yojana, Rojgar Prashikchhan
Yojana, Parivar Pension Yojana, NPS Yojana etc. 6 The Board may provide assistance in case of accident, payment of pension to beneficiary above 60
years old, loans and advances for construction of houses, group insurance scheme, financial assistance
for education of children, treatment of major ailments, maternity benefits. However, provision and
improvements of other welfare schemes may be decided by the Board.
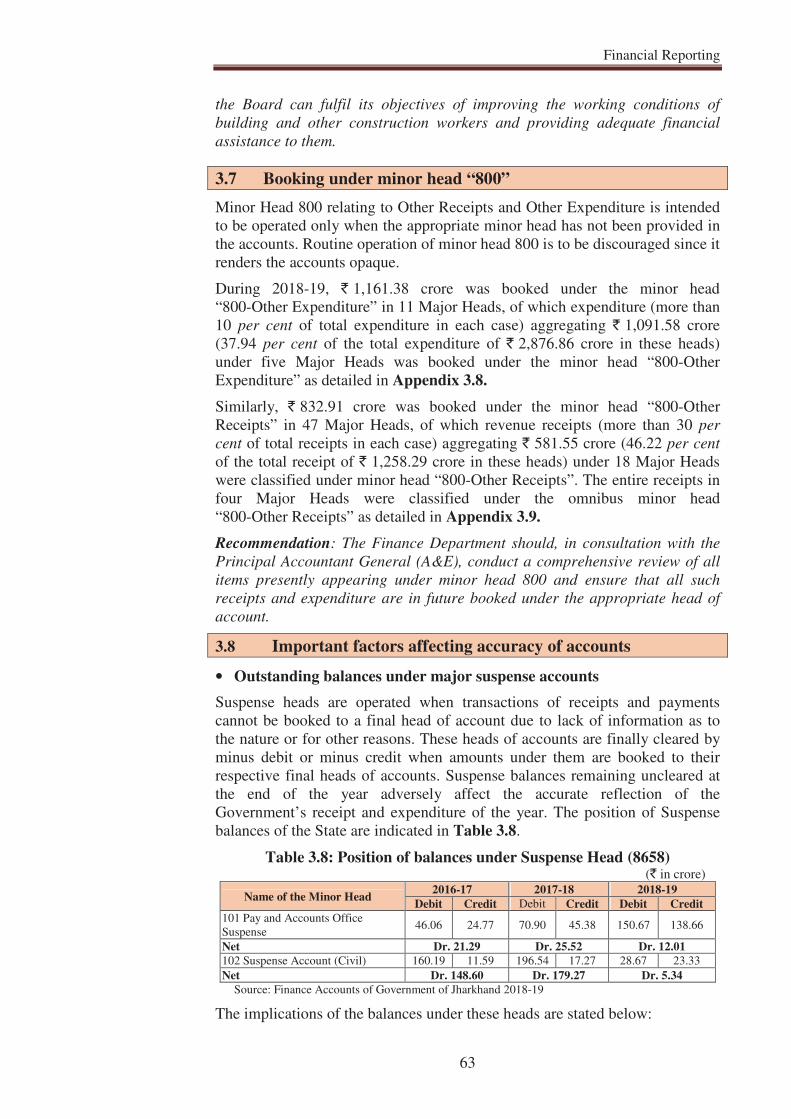
Financial Reporting
63
the Board can fulfil its objectives of improving the working conditions of
building and other construction workers and providing adequate financial
assistance to them.
3.7 Booking under minor head “800”
Minor Head 800 relating to Other Receipts and Other Expenditure is intended
to be operated only when the appropriate minor head has not been provided in
the accounts. Routine operation of minor head 800 is to be discouraged since it
renders the accounts opaque.
During 2018-19, ` 1,161.38 crore was booked under the minor head
“800-Other Expenditure” in 11 Major Heads, of which expenditure (more than
10 per cent of total expenditure in each case) aggregating ` 1,091.58 crore
(37.94 per cent of the total expenditure of ` 2,876.86 crore in these heads)
under five Major Heads was booked under the minor head “800-Other
Expenditure” as detailed in Appendix 3.8.
Similarly, ` 832.91 crore was booked under the minor head “800-Other
Receipts” in 47 Major Heads, of which revenue receipts (more than 30 per
cent of total receipts in each case) aggregating ` 581.55 crore (46.22 per cent
of the total receipt of ` 1,258.29 crore in these heads) under 18 Major Heads
were classified under minor head “800-Other Receipts”. The entire receipts in
four Major Heads were classified under the omnibus minor head
“800-Other Receipts” as detailed in Appendix 3.9.
Recommendation: The Finance Department should, in consultation with the
Principal Accountant General (A&E), conduct a comprehensive review of all
items presently appearing under minor head 800 and ensure that all such
receipts and expenditure are in future booked under the appropriate head of
account.
3.8 Important factors affecting accuracy of accounts
• Outstanding balances under major suspense accounts
Suspense heads are operated when transactions of receipts and payments
cannot be booked to a final head of account due to lack of information as to
the nature or for other reasons. These heads of accounts are finally cleared by
minus debit or minus credit when amounts under them are booked to their
respective final heads of accounts. Suspense balances remaining uncleared at
the end of the year adversely affect the accurate reflection of the
Government’s receipt and expenditure of the year. The position of Suspense
balances of the State are indicated in Table 3.8.
Table 3.8: Position of balances under Suspense Head (8658) (` in crore)
Name of the Minor Head 2016-17 2017-18 2018-19
Debit Credit Debit Credit Debit Credit
101 Pay and Accounts Office
Suspense 46.06 24.77 70.90 45.38 150.67 138.66
Net Dr. 21.29 Dr. 25.52 Dr. 12.01
102 Suspense Account (Civil) 160.19 11.59 196.54 17.27 28.67 23.33
Net Dr. 148.60 Dr. 179.27 Dr. 5.34
Source: Finance Accounts of Government of Jharkhand 2018-19
The implications of the balances under these heads are stated below:
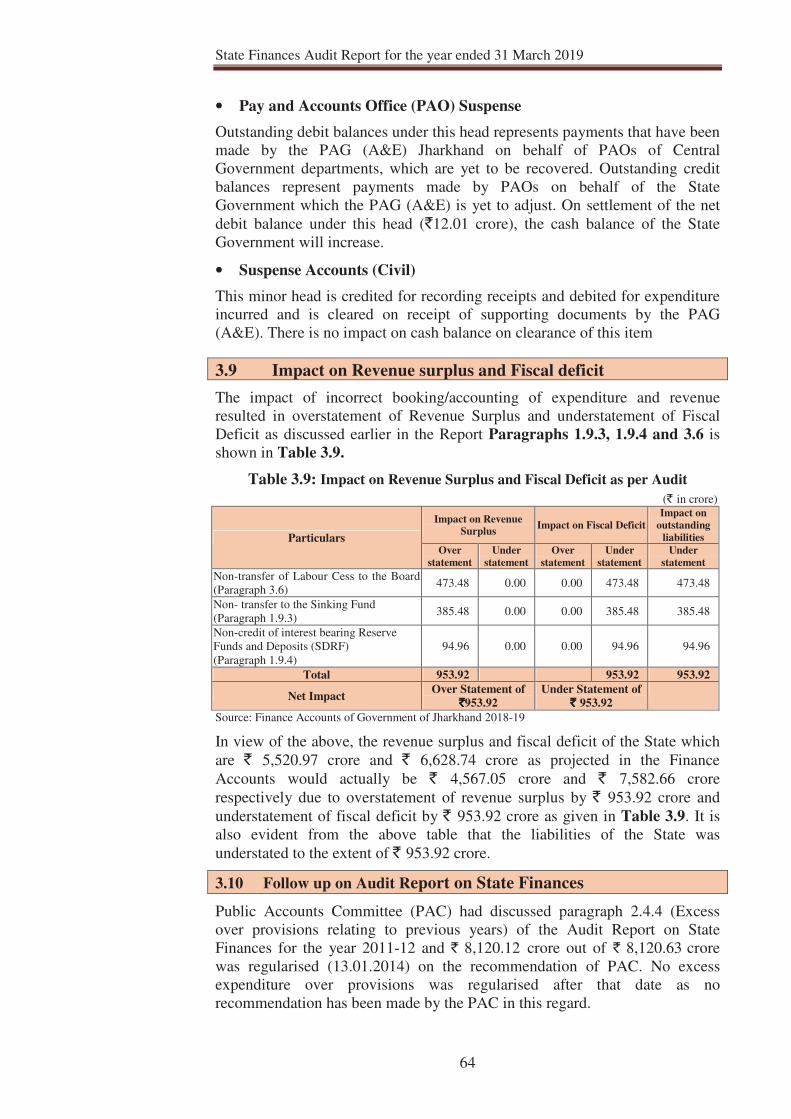
State Finances Audit Report for the year ended 31 March 2019
64
• Pay and Accounts Office (PAO) Suspense
Outstanding debit balances under this head represents payments that have been
made by the PAG (A&E) Jharkhand on behalf of PAOs of Central
Government departments, which are yet to be recovered. Outstanding credit
balances represent payments made by PAOs on behalf of the State
Government which the PAG (A&E) is yet to adjust. On settlement of the net
debit balance under this head (`12.01 crore), the cash balance of the State
Government will increase.
• Suspense Accounts (Civil)
This minor head is credited for recording receipts and debited for expenditure
incurred and is cleared on receipt of supporting documents by the PAG
(A&E). There is no impact on cash balance on clearance of this item
3.9 Impact on Revenue surplus and Fiscal deficit
The impact of incorrect booking/accounting of expenditure and revenue
resulted in overstatement of Revenue Surplus and understatement of Fiscal
Deficit as discussed earlier in the Report Paragraphs 1.9.3, 1.9.4 and 3.6 is
shown in Table 3.9.
Table 3.9: Impact on Revenue Surplus and Fiscal Deficit as per Audit
(` in crore)
Particulars
Impact on Revenue
Surplus Impact on Fiscal Deficit
Impact on
outstanding
liabilities
Over
statement
Under
statement
Over
statement
Under
statement
Under
statement
Non-transfer of Labour Cess to the Board
(Paragraph 3.6) 473.48 0.00 0.00 473.48 473.48
Non- transfer to the Sinking Fund
(Paragraph 1.9.3) 385.48 0.00 0.00 385.48 385.48
Non-credit of interest bearing Reserve
Funds and Deposits (SDRF)
(Paragraph 1.9.4)
94.96 0.00 0.00 94.96 94.96
Total 953.92 953.92 953.92
Net Impact Over Statement of
`̀̀̀953.92
Under Statement of
` ` ` ` 953.92
Source: Finance Accounts of Government of Jharkhand 2018-19
In view of the above, the revenue surplus and fiscal deficit of the State which
are ` 5,520.97 crore and ` 6,628.74 crore as projected in the Finance
Accounts would actually be ` 4,567.05 crore and ` 7,582.66 crore
respectively due to overstatement of revenue surplus by ` 953.92 crore and
understatement of fiscal deficit by ` 953.92 crore as given in Table 3.9. It is
also evident from the above table that the liabilities of the State was
understated to the extent of ` 953.92 crore.
3.10 Follow up on Audit Report on State Finances
Public Accounts Committee (PAC) had discussed paragraph 2.4.4 (Excess
over provisions relating to previous years) of the Audit Report on State
Finances for the year 2011-12 and ` 8,120.63 crore out of ` 8,120.12 crore
was regularised (13.01.2014) on the recommendation of PAC. No excess
expenditure over provisions was regularised after that date as no
recommendation has been made by the PAC in this regard.
Financial Reporting
65
3.11 Apportionment of balances on reorganisation of the State
Balances amounting to ` 7,443.90 crore under Public Account heads along
with balance under Capital Section (` 11,935.23 crore) and Loans and
Advances (` 6,583.36 crore) remained to be apportioned between the
successor States of Bihar and Jharkhand, almost two decades after the
reorganisation of the erstwhile State of Bihar with effect from November
2000. Government of Jharkhand made payment of ` 1,493.95 crore (` 557.13
crore during 2018-19) against ` 4,805.75 crore claimed by the Government of
Bihar in respect of pension liability. The State Government had filed a suit in
the Supreme Court of India in May 2012 challenging the claim of Government
of Bihar which is still sub judice.
Further, a list of 52 items was prepared which are yet to be apportioned
between the successor states as the matter is sub judice. The position of the
various pending court cases are not available with PAG (A&E).
Recommendation: The State Government may expedite the apportionment of
Public Accounts balances, Capital Account balances and Loans and Advances
balances between the two successor States.
Ranchi (INDU AGRAWAL)
The: Pr. Accountant General (Audit), Jharkhand
Countersigned
New Delhi (RAJIV MEHRISHI)
The: Comptroller and Auditor General of India


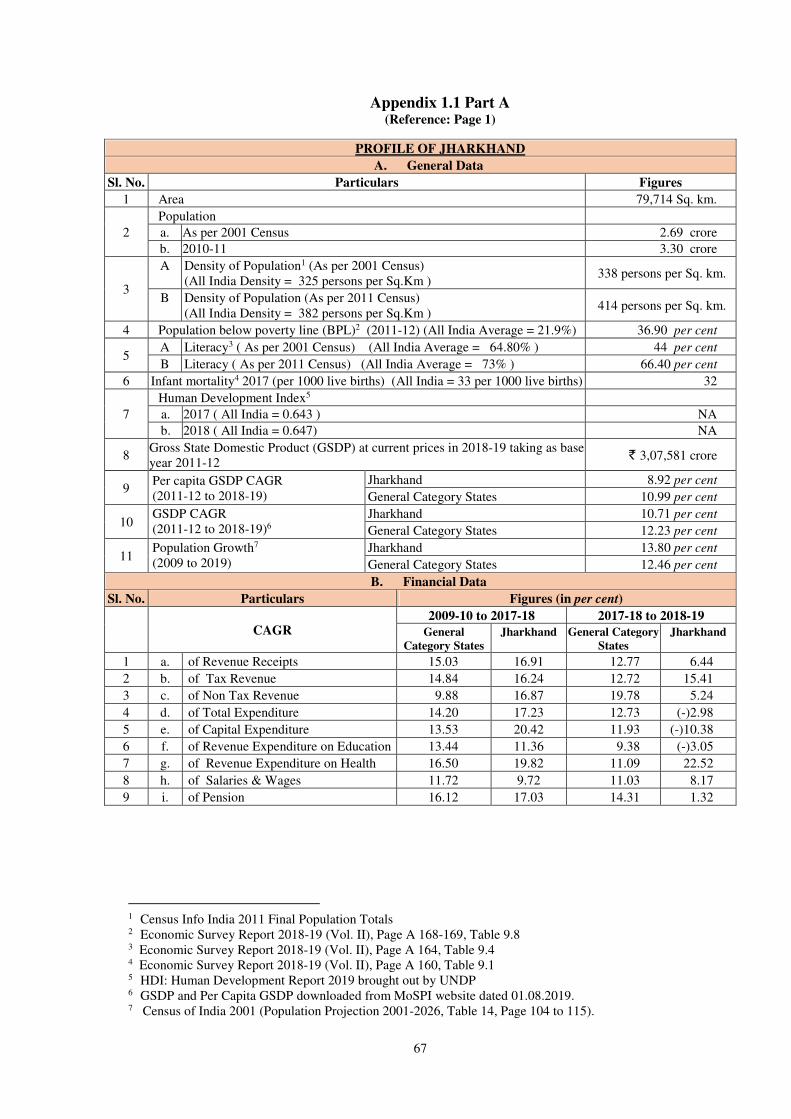
67
Appendix 1.1 Part A (Reference: Page 1)
PROFILE OF JHARKHAND
A. General Data
Sl. No. Particulars Figures
1 Area 79,714 Sq. km.
2
Population
a. As per 2001 Census 2.69 crore
b. 2010-11 3.30 crore
3
A Density of Population1 (As per 2001 Census)
(All India Density = 325 persons per Sq.Km ) 338 persons per Sq. km.
B Density of Population (As per 2011 Census)
(All India Density = 382 persons per Sq.Km ) 414 persons per Sq. km.
4 Population below poverty line (BPL)2 (2011-12) (All India Average = 21.9%) 36.90 per cent
5 A Literacy3 ( As per 2001 Census) (All India Average = 64.80% ) 44 per cent
B Literacy ( As per 2011 Census) (All India Average = 73% ) 66.40 per cent
6 Infant mortality4 2017 (per 1000 live births) (All India = 33 per 1000 live births) 32
7
Human Development Index5
a. 2017 ( All India = 0.643 ) NA
b. 2018 ( All India = 0.647) NA
8 Gross State Domestic Product (GSDP) at current prices in 2018-19 taking as base
year 2011-12 ` 3,07,581 crore
9 Per capita GSDP CAGR
(2011-12 to 2018-19)
Jharkhand 8.92 per cent
General Category States 10.99 per cent
10 GSDP CAGR
(2011-12 to 2018-19)6
Jharkhand 10.71 per cent
General Category States 12.23 per cent
11 Population Growth7
(2009 to 2019)
Jharkhand 13.80 per cent
General Category States 12.46 per cent
B. Financial Data
Sl. No. Particulars Figures (in per cent)
CAGR
2009-10 to 2017-18 2017-18 to 2018-19
General
Category States
Jharkhand General Category
States
Jharkhand
1 a. of Revenue Receipts 15.03 16.91 12.77 6.44
2 b. of Tax Revenue 14.84 16.24 12.72 15.41
3 c. of Non Tax Revenue 9.88 16.87 19.78 5.24
4 d. of Total Expenditure 14.20 17.23 12.73 (-)2.98
5 e. of Capital Expenditure 13.53 20.42 11.93 (-)10.38
6 f. of Revenue Expenditure on Education 13.44 11.36 9.38 (-)3.05
7 g. of Revenue Expenditure on Health 16.50 19.82 11.09 22.52
8 h. of Salaries & Wages 11.72 9.72 11.03 8.17
9 i. of Pension 16.12 17.03 14.31 1.32
1 Census Info India 2011 Final Population Totals 2 Economic Survey Report 2018-19 (Vol. II), Page A 168-169, Table 9.8 3 Economic Survey Report 2018-19 (Vol. II), Page A 164, Table 9.4 4 Economic Survey Report 2018-19 (Vol. II), Page A 160, Table 9.1 5 HDI: Human Development Report 2019 brought out by UNDP 6 GSDP and Per Capita GSDP downloaded from MoSPI website dated 01.08.2019. 7 Census of India 2001 (Population Projection 2001-2026, Table 14, Page 104 to 115).
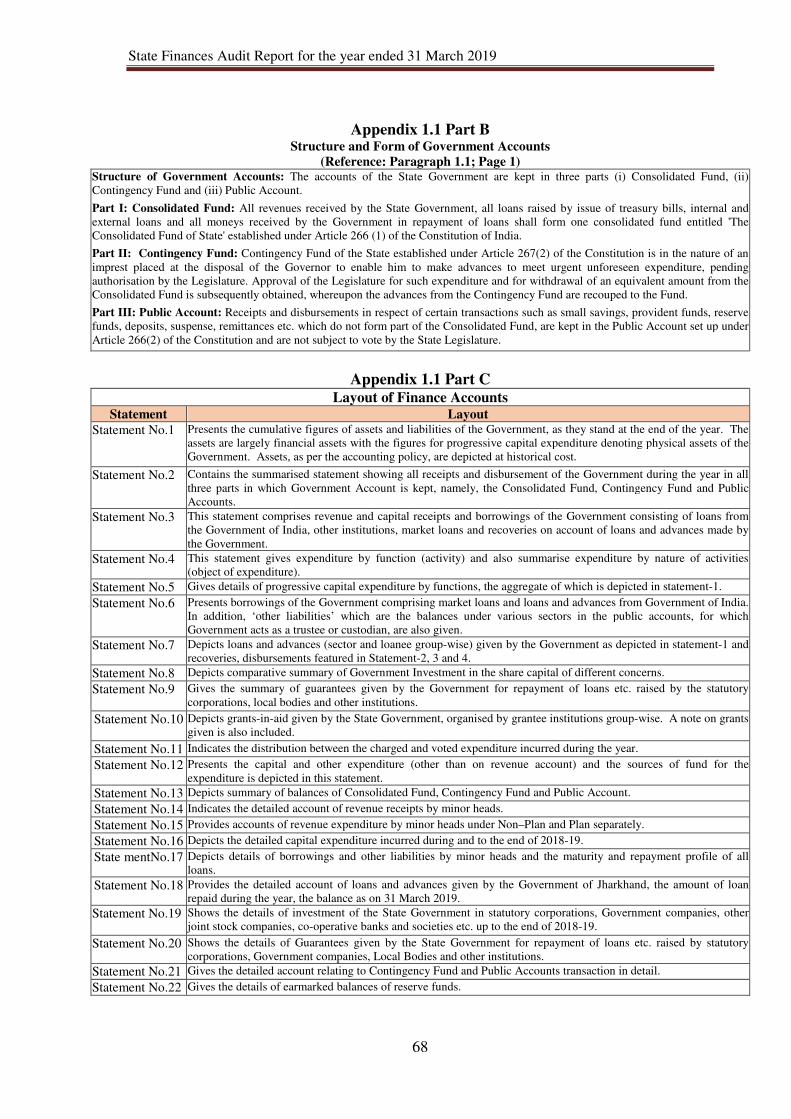
State Finances Audit Report for the year ended 31 March 2019
68
Appendix 1.1 Part B Structure and Form of Government Accounts
(Reference: Paragraph 1.1; Page 1) Structure of Government Accounts: The accounts of the State Government are kept in three parts (i) Consolidated Fund, (ii)
Contingency Fund and (iii) Public Account.
Part I: Consolidated Fund: All revenues received by the State Government, all loans raised by issue of treasury bills, internal and
external loans and all moneys received by the Government in repayment of loans shall form one consolidated fund entitled 'The
Consolidated Fund of State' established under Article 266 (1) of the Constitution of India.
Part II: Contingency Fund: Contingency Fund of the State established under Article 267(2) of the Constitution is in the nature of an
imprest placed at the disposal of the Governor to enable him to make advances to meet urgent unforeseen expenditure, pending
authorisation by the Legislature. Approval of the Legislature for such expenditure and for withdrawal of an equivalent amount from the
Consolidated Fund is subsequently obtained, whereupon the advances from the Contingency Fund are recouped to the Fund.
Part III: Public Account: Receipts and disbursements in respect of certain transactions such as small savings, provident funds, reserve
funds, deposits, suspense, remittances etc. which do not form part of the Consolidated Fund, are kept in the Public Account set up under
Article 266(2) of the Constitution and are not subject to vote by the State Legislature.
Appendix 1.1 Part C Layout of Finance Accounts
Statement Layout
Statement No.1 Presents the cumulative figures of assets and liabilities of the Government, as they stand at the end of the year. The
assets are largely financial assets with the figures for progressive capital expenditure denoting physical assets of the
Government. Assets, as per the accounting policy, are depicted at historical cost.
Statement No.2 Contains the summarised statement showing all receipts and disbursement of the Government during the year in all
three parts in which Government Account is kept, namely, the Consolidated Fund, Contingency Fund and Public
Accounts.
Statement No.3 This statement comprises revenue and capital receipts and borrowings of the Government consisting of loans from
the Government of India, other institutions, market loans and recoveries on account of loans and advances made by
the Government.
Statement No.4 This statement gives expenditure by function (activity) and also summarise expenditure by nature of activities
(object of expenditure).
Statement No.5 Gives details of progressive capital expenditure by functions, the aggregate of which is depicted in statement-1.
Statement No.6 Presents borrowings of the Government comprising market loans and loans and advances from Government of India.
In addition, ‘other liabilities’ which are the balances under various sectors in the public accounts, for which
Government acts as a trustee or custodian, are also given.
Statement No.7 Depicts loans and advances (sector and loanee group-wise) given by the Government as depicted in statement-1 and
recoveries, disbursements featured in Statement-2, 3 and 4.
Statement No.8 Depicts comparative summary of Government Investment in the share capital of different concerns.
Statement No.9 Gives the summary of guarantees given by the Government for repayment of loans etc. raised by the statutory
corporations, local bodies and other institutions.
Statement No.10 Depicts grants-in-aid given by the State Government, organised by grantee institutions group-wise. A note on grants
given is also included.
Statement No.11 Indicates the distribution between the charged and voted expenditure incurred during the year.
Statement No.12 Presents the capital and other expenditure (other than on revenue account) and the sources of fund for the
expenditure is depicted in this statement.
Statement No.13 Depicts summary of balances of Consolidated Fund, Contingency Fund and Public Account.
Statement No.14 Indicates the detailed account of revenue receipts by minor heads.
Statement No.15 Provides accounts of revenue expenditure by minor heads under Non–Plan and Plan separately.
Statement No.16 Depicts the detailed capital expenditure incurred during and to the end of 2018-19.
State mentNo.17 Depicts details of borrowings and other liabilities by minor heads and the maturity and repayment profile of all
loans.
Statement No.18 Provides the detailed account of loans and advances given by the Government of Jharkhand, the amount of loan
repaid during the year, the balance as on 31 March 2019.
Statement No.19 Shows the details of investment of the State Government in statutory corporations, Government companies, other
joint stock companies, co-operative banks and societies etc. up to the end of 2018-19.
Statement No.20 Shows the details of Guarantees given by the State Government for repayment of loans etc. raised by statutory
corporations, Government companies, Local Bodies and other institutions.
Statement No.21 Gives the detailed account relating to Contingency Fund and Public Accounts transaction in detail.
Statement No.22 Gives the details of earmarked balances of reserve funds.

Appendices
69
Appendix 1.2 Abstract of Receipts and Disbursements for the year 2018-19
(Reference: paragraph 1.1.1; Page 1)
(` in crore) Abstract of Receipts and Disbursements for the year 2018-19
Receipts Disbursements
2017-18
2018-19 2017-18
2018-19
Section-A: Revenue
Estt. State &
Central
Scheme
Total
52,756.03 I. Revenue
Receipts 56,151.70 50,952.07 I. Revenue
Expenditure 2,6647.59 23,983.14 50,630.73 50,630.73
12,353.44 Tax Revenue 14,752.07 16,558.33 General Services 16,984.42 671.24 17,655.66
19,574.97 Social Services 6,567.50 12,218.53 18,786.03
7,846.67 Non-tax Revenue 8,257.98 7,965.74 Education, Sports,
Art and Culture 4,839.19 3,004.83 7,844.02
2,548.72 Health and Family
Welfare 1,034.69 2,088.31 3,123.00
21,143.63 State’s share of
Union Taxes 23,906.13 4,683.77 Water supply,
Sanitation, Housing
and Urban
Development
296.44 3,002.65 3,299.09
1,583.03 Non-plan Grants Finance
Commission
Grants
1,059.89 185.66 Information and
Broadcasting 102.14 57.91 160.05
1,844.02 Grants for State
Plan Schemes Other Grants
to State
1,178.78 1,084.97 Welfare of
Scheduled Castes,
Scheduled Tribes
and Other
Backward Classes
155.45 991.00 1,146.45
7,985.24 Grants for
Central and
Centrally
Sponsored Plan
Schemes
Centrally
sponsored
schemes
6,996.85 110.90 Labour and Labour
Welfare 61.01 57.04 118.05
2,963.61 Social Welfare and
Nutrition 46.82 3,016.79 3,063.61
31.60 Others 31.76 0 31.76
14,818.77 Economic Services 3,095.67 11,093.37 14,189.04
2,016.85 Agriculture and
Allied Activities 638.53 1,150.97 1,789.50
6,044.87 Rural Development 535.04 6,896.59 7,431.63
0 Special Areas
Programmes 0 0 0
398.19 Irrigation and Flood
Control 393.33 6.09 399.42
4,530.12 Energy 1,094.95 1,595.27 2,690.22
264.83 Industry and
Minerals 67.96 276.59 344.55
530.93 Transport 257.85 129.00 386.85
0 Science,
Technology and
Environment
0 0 0
1,032.98 General Economic
Services 108.01 1,038.86 1,146.87
0 Grants-in-aid and
Contributions 0 0 0
50,952.07 Total 2,6647.59 23,983.14 50,630.73
0 II. Revenue
Deficit carried
over to Section
B
1,803.96 II. Revenue
Surplus Section B 5,520.97
52,756.03 Total 56,151.70 52,756.03 Total 56,151.70
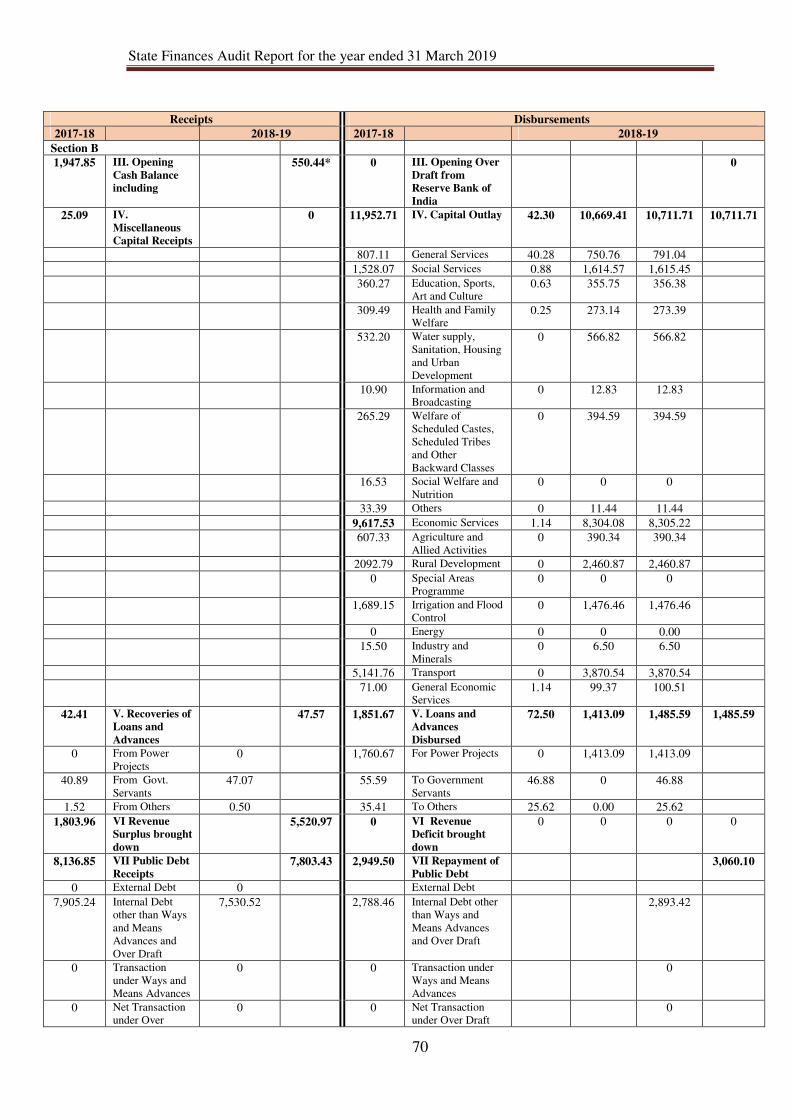
State Finances Audit Report for the year ended 31 March 2019
70
Receipts Disbursements
2017-18 2018-19 2017-18 2018-19
Section B
1,947.85 III. Opening
Cash Balance
including
550.44* 0 III. Opening Over
Draft from
Reserve Bank of
India
0
25.09 IV.
Miscellaneous
Capital Receipts
0 11,952.71 IV. Capital Outlay 42.30 10,669.41 10,711.71 10,711.71
807.11 General Services 40.28 750.76 791.04
1,528.07 Social Services 0.88 1,614.57 1,615.45
360.27 Education, Sports,
Art and Culture 0.63 355.75 356.38
309.49 Health and Family
Welfare 0.25 273.14 273.39
532.20 Water supply,
Sanitation, Housing
and Urban
Development
0 566.82 566.82
10.90 Information and
Broadcasting 0 12.83 12.83
265.29 Welfare of
Scheduled Castes,
Scheduled Tribes
and Other
Backward Classes
0 394.59 394.59
16.53 Social Welfare and
Nutrition 0 0 0
33.39 Others 0 11.44 11.44
9,617.53 Economic Services 1.14 8,304.08 8,305.22
607.33 Agriculture and
Allied Activities 0 390.34 390.34
2092.79 Rural Development 0 2,460.87 2,460.87
0 Special Areas
Programme 0 0 0
1,689.15 Irrigation and Flood
Control 0 1,476.46 1,476.46
0 Energy 0 0 0.00
15.50 Industry and
Minerals 0 6.50 6.50
5,141.76 Transport 0 3,870.54 3,870.54
71.00 General Economic
Services 1.14 99.37 100.51
42.41 V. Recoveries of
Loans and
Advances
47.57 1,851.67 V. Loans and
Advances
Disbursed
72.50 1,413.09 1,485.59 1,485.59
0 From Power
Projects 0 1,760.67 For Power Projects 0 1,413.09 1,413.09
40.89 From Govt.
Servants 47.07 55.59 To Government
Servants 46.88 0 46.88
1.52 From Others 0.50 35.41 To Others 25.62 0.00 25.62
1,803.96 VI Revenue
Surplus brought
down
5,520.97 0 VI Revenue
Deficit brought
down
0 0 0 0
8,136.85 VII Public Debt
Receipts 7,803.43 2,949.50 VII Repayment of
Public Debt 3,060.10
0 External Debt 0 External Debt
7,905.24 Internal Debt
other than Ways
and Means
Advances and
Over Draft
7,530.52 2,788.46 Internal Debt other
than Ways and
Means Advances
and Over Draft
2,893.42
0 Transaction
under Ways and
Means Advances
0 0 Transaction under
Ways and Means
Advances
0
0 Net Transaction
under Over 0 0 Net Transaction
under Over Draft 0
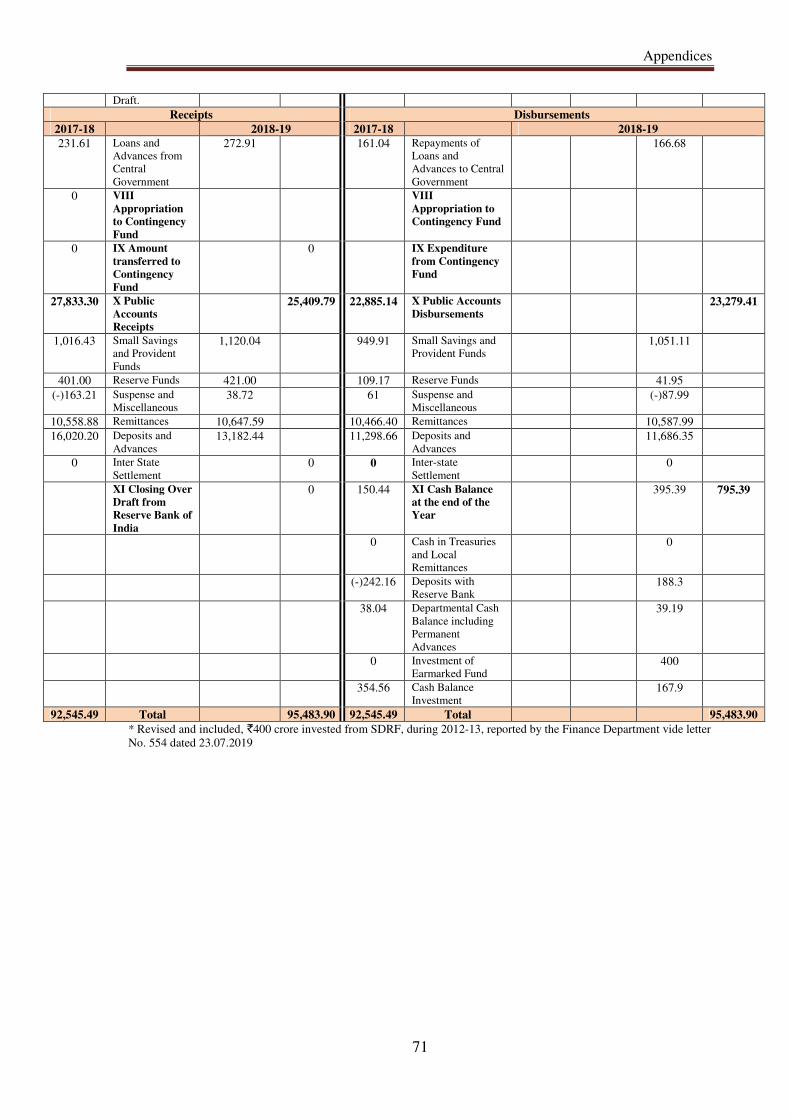
Appendices
71
Draft.
Receipts Disbursements
2017-18 2018-19 2017-18 2018-19
231.61 Loans and
Advances from
Central
Government
272.91 161.04 Repayments of
Loans and
Advances to Central
Government
166.68
0 VIII
Appropriation
to Contingency
Fund
VIII
Appropriation to
Contingency Fund
0 IX Amount
transferred to
Contingency
Fund
0 IX Expenditure
from Contingency
Fund
27,833.30 X Public
Accounts
Receipts
25,409.79 22,885.14 X Public Accounts
Disbursements 23,279.41
1,016.43 Small Savings
and Provident
Funds
1,120.04 949.91 Small Savings and
Provident Funds 1,051.11
401.00 Reserve Funds 421.00 109.17 Reserve Funds 41.95
(-)163.21 Suspense and
Miscellaneous 38.72 61 Suspense and
Miscellaneous (-)87.99
10,558.88 Remittances 10,647.59 10,466.40 Remittances 10,587.99
16,020.20 Deposits and
Advances 13,182.44 11,298.66 Deposits and
Advances 11,686.35
0 Inter State
Settlement 0 0 Inter-state
Settlement 0
XI Closing Over
Draft from
Reserve Bank of
India
0 150.44 XI Cash Balance
at the end of the
Year
395.39 795.39
0 Cash in Treasuries
and Local
Remittances
0
(-)242.16 Deposits with
Reserve Bank 188.3
38.04 Departmental Cash
Balance including
Permanent
Advances
39.19
0 Investment of
Earmarked Fund 400
354.56 Cash Balance
Investment 167.9
92,545.49 Total 95,483.90 92,545.49 Total 95,483.90
* Revised and included, `400 crore invested from SDRF, during 2012-13, reported by the Finance Department vide letter
No. 554 dated 23.07.2019
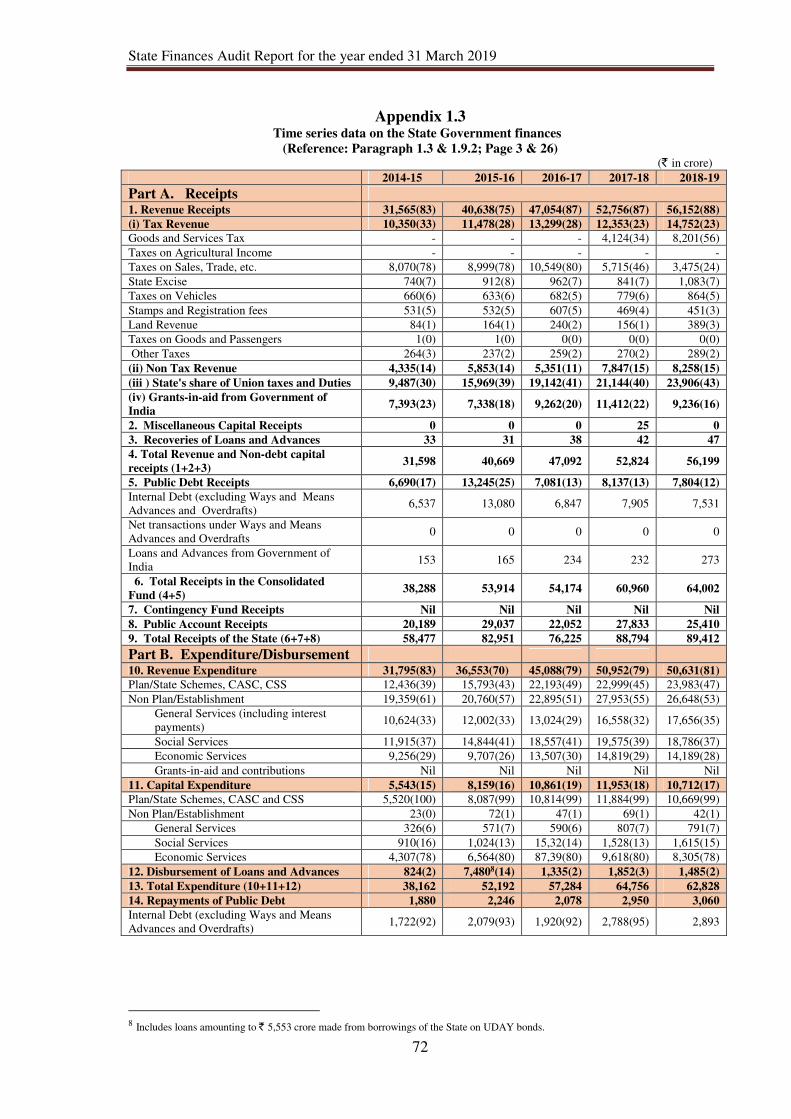
State Finances Audit Report for the year ended 31 March 2019
72
Appendix 1.3 Time series data on the State Government finances
(Reference: Paragraph 1.3 & 1.9.2; Page 3 & 26) (` in crore)
2014-15 2015-16 2016-17 2017-18 2018-19
Part A. Receipts
1. Revenue Receipts 31,565(83) 40,638(75) 47,054(87) 52,756(87) 56,152(88)
(i) Tax Revenue 10,350(33) 11,478(28) 13,299(28) 12,353(23) 14,752(23)
Goods and Services Tax - - - 4,124(34) 8,201(56)
Taxes on Agricultural Income - - - - -
Taxes on Sales, Trade, etc. 8,070(78) 8,999(78) 10,549(80) 5,715(46) 3,475(24)
State Excise 740(7) 912(8) 962(7) 841(7) 1,083(7)
Taxes on Vehicles 660(6) 633(6) 682(5) 779(6) 864(5)
Stamps and Registration fees 531(5) 532(5) 607(5) 469(4) 451(3)
Land Revenue 84(1) 164(1) 240(2) 156(1) 389(3)
Taxes on Goods and Passengers 1(0) 1(0) 0(0) 0(0) 0(0)
Other Taxes 264(3) 237(2) 259(2) 270(2) 289(2)
(ii) Non Tax Revenue 4,335(14) 5,853(14) 5,351(11) 7,847(15) 8,258(15)
(iii ) State's share of Union taxes and Duties 9,487(30) 15,969(39) 19,142(41) 21,144(40) 23,906(43)
(iv) Grants-in-aid from Government of
India 7,393(23) 7,338(18) 9,262(20) 11,412(22) 9,236(16)
2. Miscellaneous Capital Receipts 0 0 0 25 0
3. Recoveries of Loans and Advances 33 31 38 42 47
4. Total Revenue and Non-debt capital
receipts (1+2+3) 31,598 40,669 47,092 52,824 56,199
5. Public Debt Receipts 6,690(17) 13,245(25) 7,081(13) 8,137(13) 7,804(12)
Internal Debt (excluding Ways and Means
Advances and Overdrafts) 6,537 13,080 6,847 7,905 7,531
Net transactions under Ways and Means
Advances and Overdrafts 0 0 0 0 0
Loans and Advances from Government of
India 153 165 234 232 273
6. Total Receipts in the Consolidated
Fund (4+5) 38,288 53,914 54,174 60,960 64,002
7. Contingency Fund Receipts Nil Nil Nil Nil Nil
8. Public Account Receipts 20,189 29,037 22,052 27,833 25,410
9. Total Receipts of the State (6+7+8) 58,477 82,951 76,225 88,794 89,412
Part B. Expenditure/Disbursement
10. Revenue Expenditure 31,795(83) 36,553(70) 45,088(79) 50,952(79) 50,631(81)
Plan/State Schemes, CASC, CSS 12,436(39) 15,793(43) 22,193(49) 22,999(45) 23,983(47)
Non Plan/Establishment 19,359(61) 20,760(57) 22,895(51) 27,953(55) 26,648(53)
General Services (including interest
payments) 10,624(33) 12,002(33) 13,024(29) 16,558(32) 17,656(35)
Social Services 11,915(37) 14,844(41) 18,557(41) 19,575(39) 18,786(37)
Economic Services 9,256(29) 9,707(26) 13,507(30) 14,819(29) 14,189(28)
Grants-in-aid and contributions Nil Nil Nil Nil Nil
11. Capital Expenditure 5,543(15) 8,159(16) 10,861(19) 11,953(18) 10,712(17)
Plan/State Schemes, CASC and CSS 5,520(100) 8,087(99) 10,814(99) 11,884(99) 10,669(99)
Non Plan/Establishment 23(0) 72(1) 47(1) 69(1) 42(1)
General Services 326(6) 571(7) 590(6) 807(7) 791(7)
Social Services 910(16) 1,024(13) 15,32(14) 1,528(13) 1,615(15)
Economic Services 4,307(78) 6,564(80) 87,39(80) 9,618(80) 8,305(78)
12. Disbursement of Loans and Advances 824(2) 7,4808(14) 1,335(2) 1,852(3) 1,485(2)
13. Total Expenditure (10+11+12) 38,162 52,192 57,284 64,756 62,828
14. Repayments of Public Debt 1,880 2,246 2,078 2,950 3,060
Internal Debt (excluding Ways and Means
Advances and Overdrafts) 1,722(92) 2,079(93) 1,920(92) 2,788(95) 2,893
8 Includes loans amounting to ` 5,553 crore made from borrowings of the State on UDAY bonds.
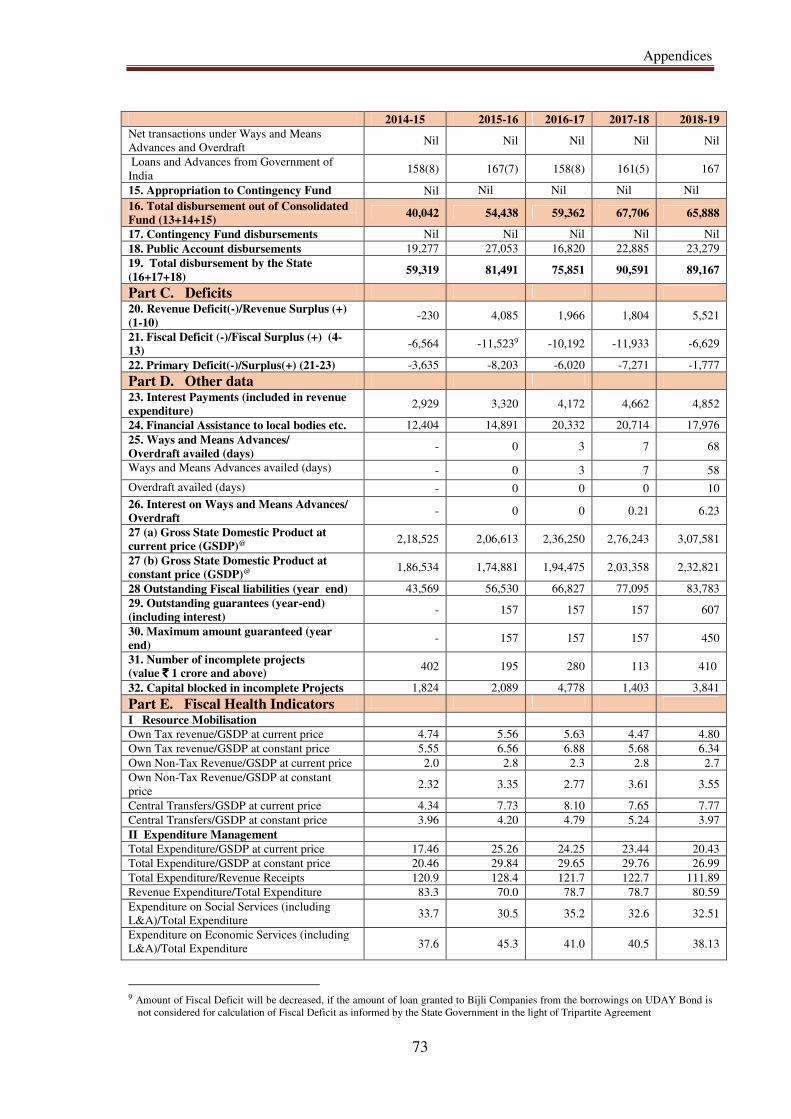
Appendices
73
2014-15 2015-16 2016-17 2017-18 2018-19
Net transactions under Ways and Means
Advances and Overdraft Nil Nil Nil Nil Nil
Loans and Advances from Government of
India 158(8) 167(7) 158(8) 161(5) 167
15. Appropriation to Contingency Fund Nil Nil Nil Nil Nil 16. Total disbursement out of Consolidated
Fund (13+14+15) 40,042 54,438 59,362 67,706 65,888
17. Contingency Fund disbursements Nil Nil Nil Nil Nil 18. Public Account disbursements 19,277 27,053 16,820 22,885 23,279
19. Total disbursement by the State
(16+17+18) 59,319 81,491 75,851 90,591 89,167
Part C. Deficits
20. Revenue Deficit(-)/Revenue Surplus (+)
(1-10) -230 4,085 1,966 1,804 5,521
21. Fiscal Deficit (-)/Fiscal Surplus (+) (4-
13) -6,564 -11,5239 -10,192 -11,933 -6,629
22. Primary Deficit(-)/Surplus(+) (21-23) -3,635 -8,203 -6,020 -7,271 -1,777
Part D. Other data
23. Interest Payments (included in revenue
expenditure) 2,929 3,320 4,172 4,662 4,852
24. Financial Assistance to local bodies etc. 12,404 14,891 20,332 20,714 17,976
25. Ways and Means Advances/
Overdraft availed (days) - 0 3 7 68
Ways and Means Advances availed (days) - 0 3 7 58
Overdraft availed (days) - 0 0 0 10
26. Interest on Ways and Means Advances/
Overdraft - 0 0 0.21 6.23
27 (a) Gross State Domestic Product at
current price (GSDP)@ 2,18,525 2,06,613 2,36,250 2,76,243 3,07,581
27 (b) Gross State Domestic Product at
constant price (GSDP)@ 1,86,534 1,74,881 1,94,475 2,03,358 2,32,821
28 Outstanding Fiscal liabilities (year end) 43,569 56,530 66,827 77,095 83,783
29. Outstanding guarantees (year-end)
(including interest) - 157 157 157 607
30. Maximum amount guaranteed (year
end) - 157 157 157 450
31. Number of incomplete projects
(value `̀̀̀ 1 crore and above) 402 195 280 113 410
32. Capital blocked in incomplete Projects 1,824 2,089 4,778 1,403 3,841
Part E. Fiscal Health Indicators
I Resource Mobilisation
Own Tax revenue/GSDP at current price 4.74 5.56 5.63 4.47 4.80
Own Tax revenue/GSDP at constant price 5.55 6.56 6.88 5.68 6.34
Own Non-Tax Revenue/GSDP at current price 2.0 2.8 2.3 2.8 2.7
Own Non-Tax Revenue/GSDP at constant
price 2.32 3.35 2.77 3.61 3.55
Central Transfers/GSDP at current price 4.34 7.73 8.10 7.65 7.77
Central Transfers/GSDP at constant price 3.96 4.20 4.79 5.24 3.97
II Expenditure Management
Total Expenditure/GSDP at current price 17.46 25.26 24.25 23.44 20.43
Total Expenditure/GSDP at constant price 20.46 29.84 29.65 29.76 26.99
Total Expenditure/Revenue Receipts 120.9 128.4 121.7 122.7 111.89
Revenue Expenditure/Total Expenditure 83.3 70.0 78.7 78.7 80.59
Expenditure on Social Services (including
L&A)/Total Expenditure 33.7 30.5 35.2 32.6 32.51
Expenditure on Economic Services (including
L&A)/Total Expenditure 37.6 45.3 41.0 40.5 38.13
9 Amount of Fiscal Deficit will be decreased, if the amount of loan granted to Bijli Companies from the borrowings on UDAY Bond is
not considered for calculation of Fiscal Deficit as informed by the State Government in the light of Tripartite Agreement
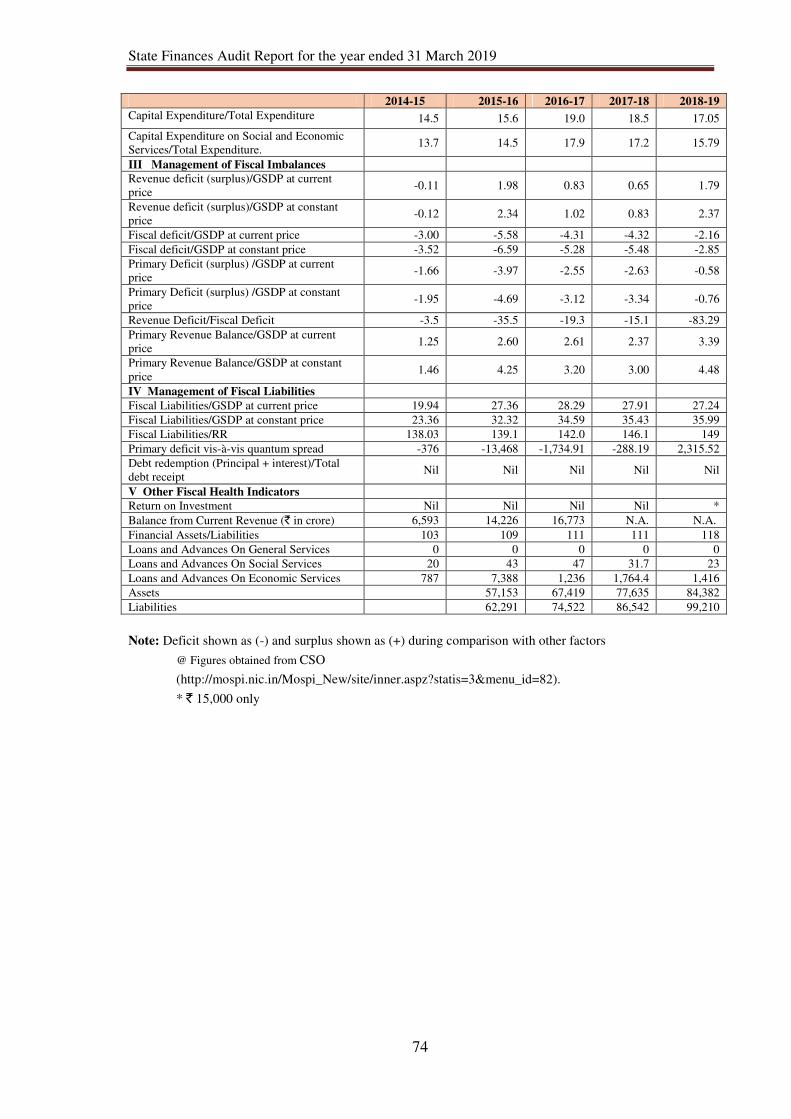
State Finances Audit Report for the year ended 31 March 2019
74
2014-15 2015-16 2016-17 2017-18 2018-19
Capital Expenditure/Total Expenditure 14.5 15.6 19.0 18.5 17.05
Capital Expenditure on Social and Economic
Services/Total Expenditure. 13.7 14.5 17.9 17.2 15.79
III Management of Fiscal Imbalances
Revenue deficit (surplus)/GSDP at current
price -0.11 1.98 0.83 0.65 1.79
Revenue deficit (surplus)/GSDP at constant
price -0.12 2.34 1.02 0.83 2.37
Fiscal deficit/GSDP at current price -3.00 -5.58 -4.31 -4.32 -2.16
Fiscal deficit/GSDP at constant price -3.52 -6.59 -5.28 -5.48 -2.85
Primary Deficit (surplus) /GSDP at current
price -1.66 -3.97 -2.55 -2.63 -0.58
Primary Deficit (surplus) /GSDP at constant
price -1.95 -4.69 -3.12 -3.34 -0.76
Revenue Deficit/Fiscal Deficit -3.5 -35.5 -19.3 -15.1 -83.29
Primary Revenue Balance/GSDP at current
price 1.25 2.60 2.61 2.37 3.39
Primary Revenue Balance/GSDP at constant
price 1.46 4.25 3.20 3.00 4.48
IV Management of Fiscal Liabilities
Fiscal Liabilities/GSDP at current price 19.94 27.36 28.29 27.91 27.24
Fiscal Liabilities/GSDP at constant price 23.36 32.32 34.59 35.43 35.99
Fiscal Liabilities/RR 138.03 139.1 142.0 146.1 149
Primary deficit vis-à-vis quantum spread -376 -13,468 -1,734.91 -288.19 2,315.52
Debt redemption (Principal + interest)/Total
debt receipt Nil Nil Nil Nil Nil
V Other Fiscal Health Indicators
Return on Investment Nil Nil Nil Nil *
Balance from Current Revenue (` in crore) 6,593 14,226 16,773 N.A. N.A.
Financial Assets/Liabilities 103 109 111 111 118
Loans and Advances On General Services 0 0 0 0 0
Loans and Advances On Social Services 20 43 47 31.7 23
Loans and Advances On Economic Services 787 7,388 1,236 1,764.4 1,416
Assets 57,153 67,419 77,635 84,382
Liabilities 62,291 74,522 86,542 99,210
Note: Deficit shown as (-) and surplus shown as (+) during comparison with other factors
@ Figures obtained from CSO
(http://mospi.nic.in/Mospi_New/site/inner.aspz?statis=3&menu_id=82).
* ` 15,000 only
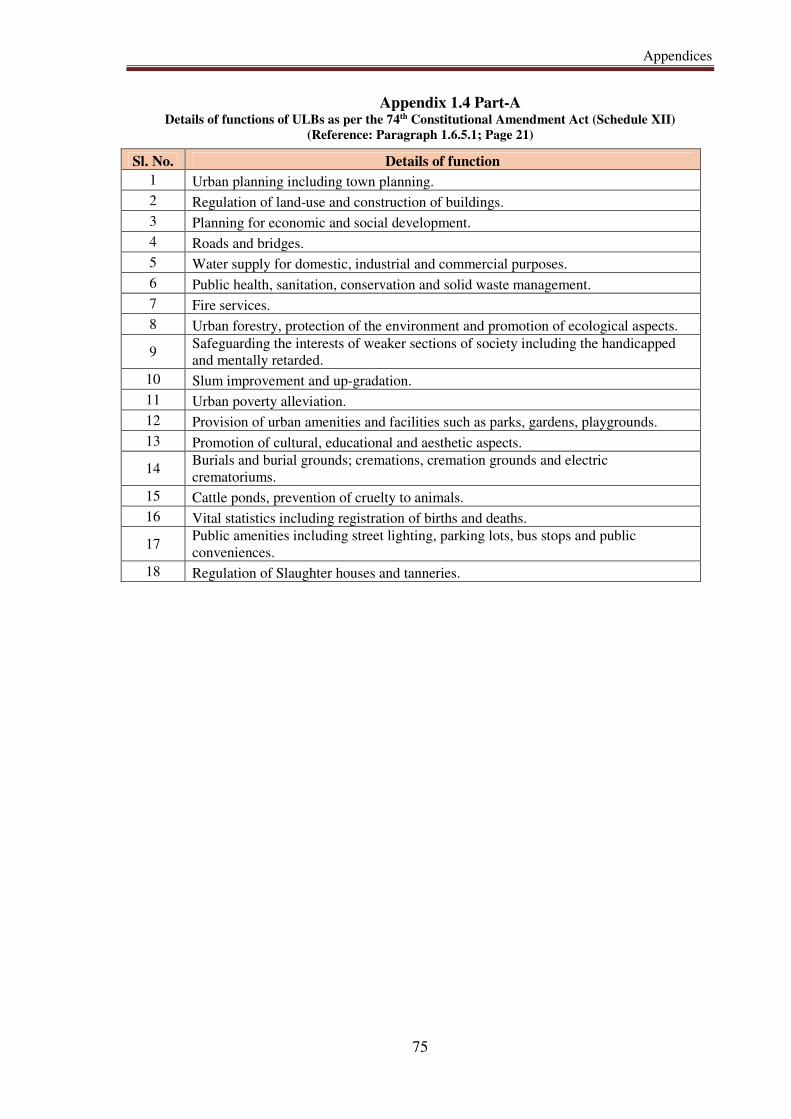
Appendices
75
Appendix 1.4 Part-A Details of functions of ULBs as per the 74th Constitutional Amendment Act (Schedule XII)
(Reference: Paragraph 1.6.5.1; Page 21)
Sl. No. Details of function
1 Urban planning including town planning.
2 Regulation of land-use and construction of buildings.
3 Planning for economic and social development.
4 Roads and bridges.
5 Water supply for domestic, industrial and commercial purposes.
6 Public health, sanitation, conservation and solid waste management.
7 Fire services.
8 Urban forestry, protection of the environment and promotion of ecological aspects.
9 Safeguarding the interests of weaker sections of society including the handicapped
and mentally retarded.
10 Slum improvement and up-gradation.
11 Urban poverty alleviation.
12 Provision of urban amenities and facilities such as parks, gardens, playgrounds.
13 Promotion of cultural, educational and aesthetic aspects.
14 Burials and burial grounds; cremations, cremation grounds and electric
crematoriums.
15 Cattle ponds, prevention of cruelty to animals.
16 Vital statistics including registration of births and deaths.
17 Public amenities including street lighting, parking lots, bus stops and public
conveniences.
18 Regulation of Slaughter houses and tanneries.
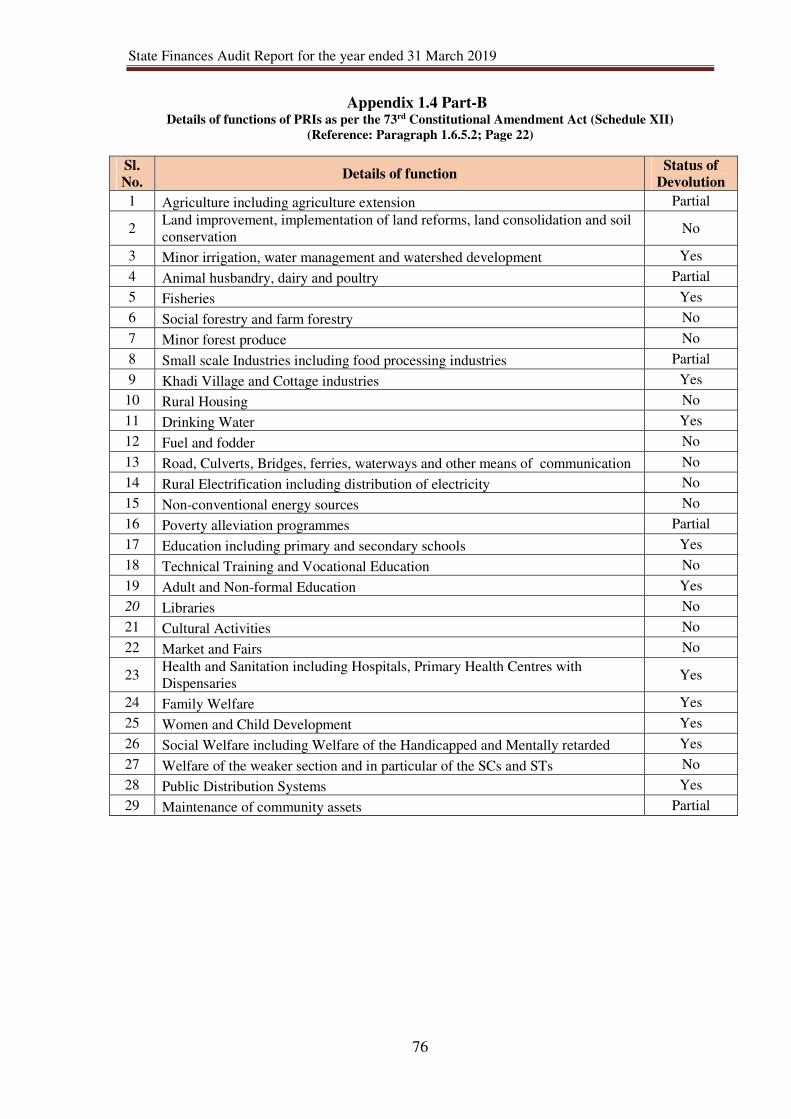
State Finances Audit Report for the year ended 31 March 2019
76
Appendix 1.4 Part-B Details of functions of PRIs as per the 73rd Constitutional Amendment Act (Schedule XII)
(Reference: Paragraph 1.6.5.2; Page 22)
Sl.
No. Details of function
Status of
Devolution
1 Agriculture including agriculture extension Partial
2 Land improvement, implementation of land reforms, land consolidation and soil
conservation No
3 Minor irrigation, water management and watershed development Yes
4 Animal husbandry, dairy and poultry Partial
5 Fisheries Yes
6 Social forestry and farm forestry No
7 Minor forest produce No
8 Small scale Industries including food processing industries Partial
9 Khadi Village and Cottage industries Yes
10 Rural Housing No
11 Drinking Water Yes
12 Fuel and fodder No
13 Road, Culverts, Bridges, ferries, waterways and other means of communication No
14 Rural Electrification including distribution of electricity No
15 Non-conventional energy sources No
16 Poverty alleviation programmes Partial
17 Education including primary and secondary schools Yes
18 Technical Training and Vocational Education No
19 Adult and Non-formal Education Yes
20 Libraries No
21 Cultural Activities No
22 Market and Fairs No
23 Health and Sanitation including Hospitals, Primary Health Centres with
Dispensaries Yes
24 Family Welfare Yes
25 Women and Child Development Yes
26 Social Welfare including Welfare of the Handicapped and Mentally retarded Yes
27 Welfare of the weaker section and in particular of the SCs and STs No
28 Public Distribution Systems Yes
29 Maintenance of community assets Partial
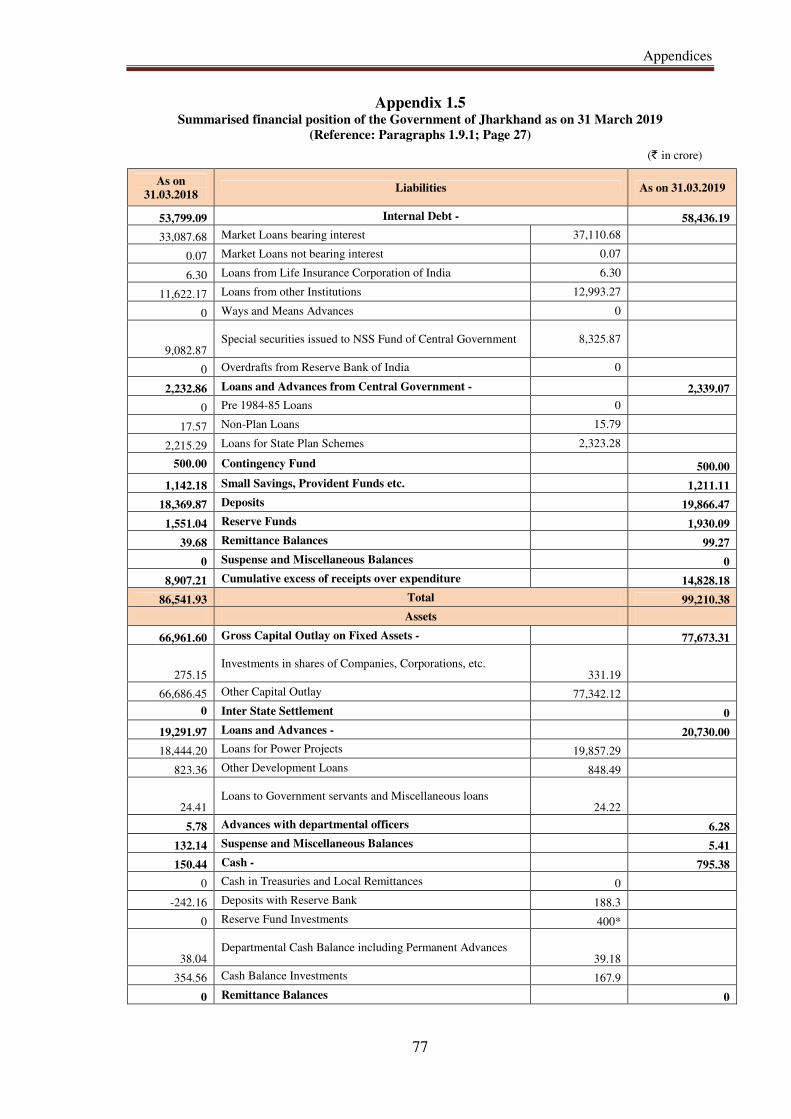
Appendices
77
Appendix 1.5 Summarised financial position of the Government of Jharkhand as on 31 March 2019
(Reference: Paragraphs 1.9.1; Page 27)
(` in crore)
As on
31.03.2018 Liabilities As on 31.03.2019
53,799.09 Internal Debt - 58,436.19
33,087.68 Market Loans bearing interest 37,110.68
0.07 Market Loans not bearing interest 0.07
6.30 Loans from Life Insurance Corporation of India 6.30
11,622.17 Loans from other Institutions 12,993.27
0 Ways and Means Advances 0
9,082.87 Special securities issued to NSS Fund of Central Government 8,325.87
0 Overdrafts from Reserve Bank of India 0
2,232.86 Loans and Advances from Central Government - 2,339.07
0 Pre 1984-85 Loans 0
17.57 Non-Plan Loans 15.79
2,215.29 Loans for State Plan Schemes 2,323.28
500.00 Contingency Fund 500.00
1,142.18 Small Savings, Provident Funds etc. 1,211.11
18,369.87 Deposits 19,866.47
1,551.04 Reserve Funds 1,930.09
39.68 Remittance Balances 99.27
0 Suspense and Miscellaneous Balances 0
8,907.21 Cumulative excess of receipts over expenditure 14,828.18
86,541.93 Total 99,210.38
Assets
66,961.60 Gross Capital Outlay on Fixed Assets - 77,673.31
275.15 Investments in shares of Companies, Corporations, etc.
331.19
66,686.45 Other Capital Outlay 77,342.12
0 Inter State Settlement 0
19,291.97 Loans and Advances - 20,730.00
18,444.20 Loans for Power Projects 19,857.29
823.36 Other Development Loans 848.49
24.41 Loans to Government servants and Miscellaneous loans
24.22
5.78 Advances with departmental officers 6.28
132.14 Suspense and Miscellaneous Balances 5.41
150.44 Cash - 795.38
0 Cash in Treasuries and Local Remittances 0
-242.16 Deposits with Reserve Bank 188.3
0 Reserve Fund Investments 400*
38.04 Departmental Cash Balance including Permanent Advances
39.18
354.56 Cash Balance Investments 167.9
0 Remittance Balances 0
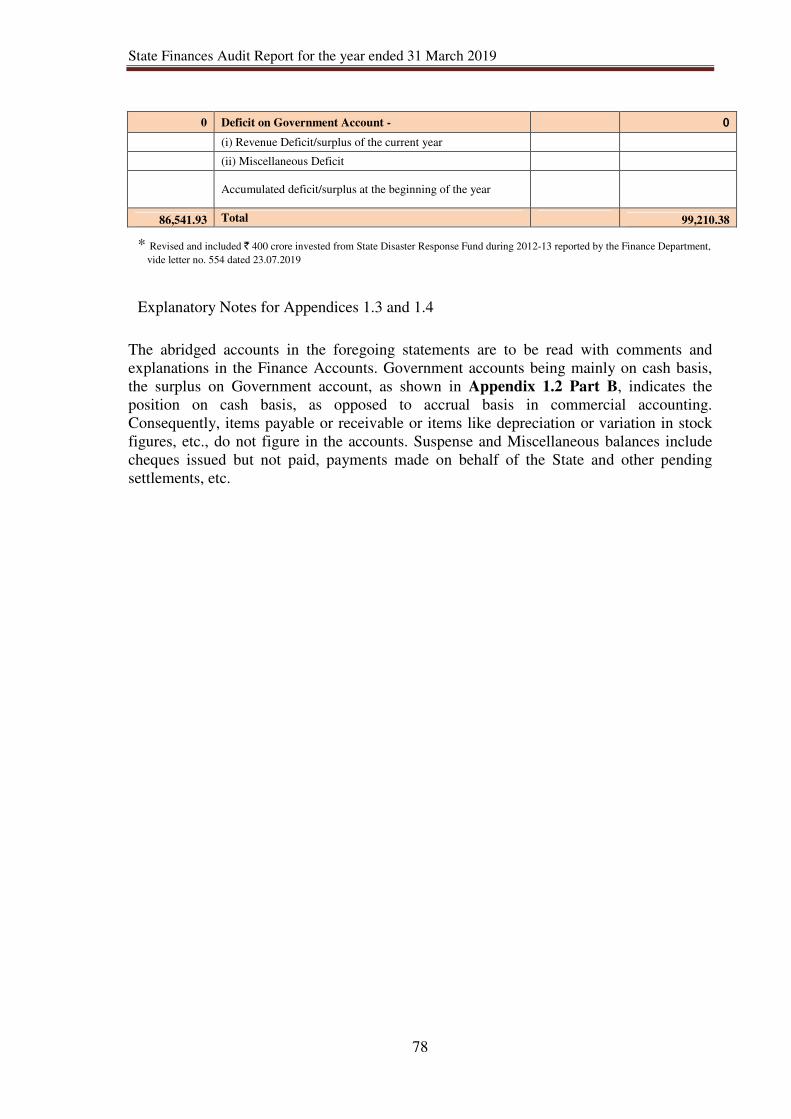
State Finances Audit Report for the year ended 31 March 2019
78
0 Deficit on Government Account - 0
(i) Revenue Deficit/surplus of the current year
(ii) Miscellaneous Deficit
Accumulated deficit/surplus at the beginning of the year
86,541.93 Total 99,210.38
* Revised and included ` 400 crore invested from State Disaster Response Fund during 2012-13 reported by the Finance Department,
vide letter no. 554 dated 23.07.2019
Explanatory Notes for Appendices 1.3 and 1.4
The abridged accounts in the foregoing statements are to be read with comments and
explanations in the Finance Accounts. Government accounts being mainly on cash basis,
the surplus on Government account, as shown in Appendix 1.2 Part B, indicates the
position on cash basis, as opposed to accrual basis in commercial accounting.
Consequently, items payable or receivable or items like depreciation or variation in stock
figures, etc., do not figure in the accounts. Suspense and Miscellaneous balances include
cheques issued but not paid, payments made on behalf of the State and other pending
settlements, etc.
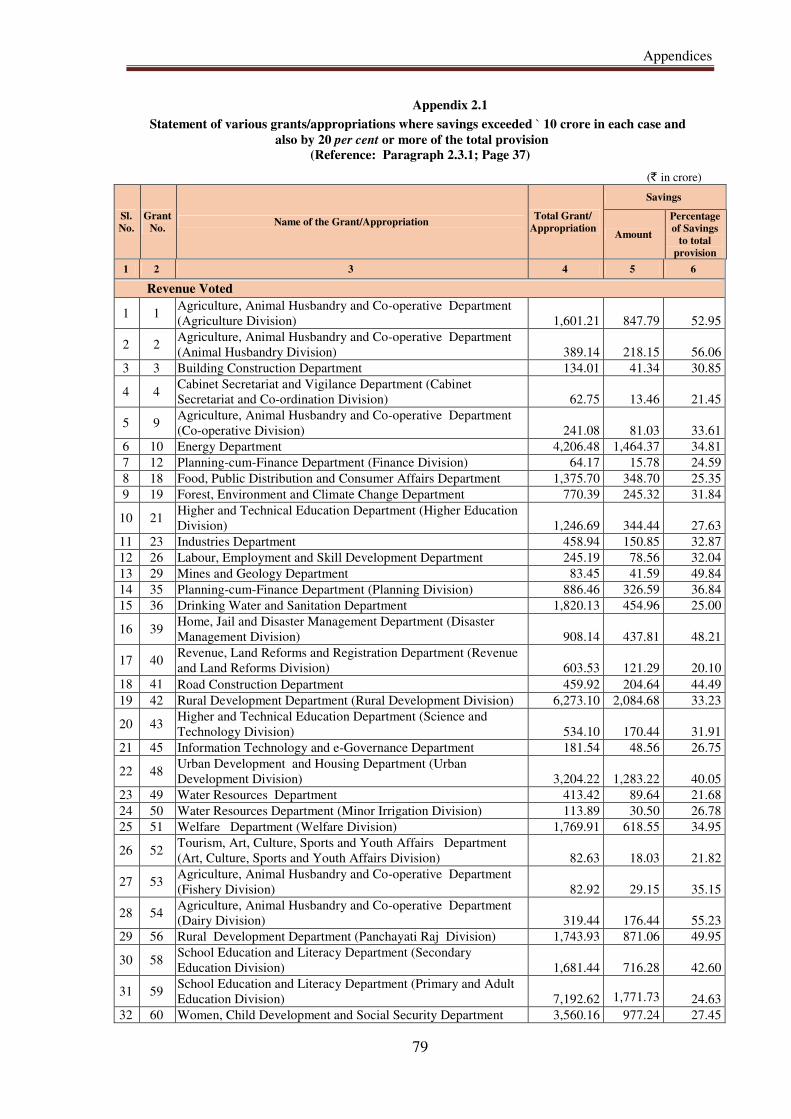
Appendices
79
Appendix 2.1
Statement of various grants/appropriations where savings exceeded ` 10 crore in each case and
also by 20 per cent or more of the total provision
(Reference: Paragraph 2.3.1; Page 37)
(` in crore)
Sl.
No.
Grant
No. Name of the Grant/Appropriation
Total Grant/
Appropriation
Savings
Amount
Percentage
of Savings
to total
provision
1 2 3 4 5 6
Revenue Voted
1 1 Agriculture, Animal Husbandry and Co-operative Department
(Agriculture Division) 1,601.21 847.79 52.95
2 2 Agriculture, Animal Husbandry and Co-operative Department
(Animal Husbandry Division) 389.14 218.15 56.06
3 3 Building Construction Department 134.01 41.34 30.85
4 4 Cabinet Secretariat and Vigilance Department (Cabinet
Secretariat and Co-ordination Division) 62.75 13.46 21.45
5 9 Agriculture, Animal Husbandry and Co-operative Department
(Co-operative Division) 241.08 81.03 33.61
6 10 Energy Department 4,206.48 1,464.37 34.81
7 12 Planning-cum-Finance Department (Finance Division) 64.17 15.78 24.59
8 18 Food, Public Distribution and Consumer Affairs Department 1,375.70 348.70 25.35
9 19 Forest, Environment and Climate Change Department 770.39 245.32 31.84
10 21 Higher and Technical Education Department (Higher Education
Division) 1,246.69 344.44 27.63
11 23 Industries Department 458.94 150.85 32.87
12 26 Labour, Employment and Skill Development Department 245.19 78.56 32.04
13 29 Mines and Geology Department 83.45 41.59 49.84
14 35 Planning-cum-Finance Department (Planning Division) 886.46 326.59 36.84
15 36 Drinking Water and Sanitation Department 1,820.13 454.96 25.00
16 39 Home, Jail and Disaster Management Department (Disaster
Management Division) 908.14 437.81 48.21
17 40 Revenue, Land Reforms and Registration Department (Revenue
and Land Reforms Division) 603.53 121.29 20.10
18 41 Road Construction Department 459.92 204.64 44.49
19 42 Rural Development Department (Rural Development Division) 6,273.10 2,084.68 33.23
20 43 Higher and Technical Education Department (Science and
Technology Division) 534.10 170.44 31.91
21 45 Information Technology and e-Governance Department 181.54 48.56 26.75
22 48 Urban Development and Housing Department (Urban
Development Division) 3,204.22 1,283.22 40.05
23 49 Water Resources Department 413.42 89.64 21.68
24 50 Water Resources Department (Minor Irrigation Division) 113.89 30.50 26.78
25 51 Welfare Department (Welfare Division) 1,769.91 618.55 34.95
26 52 Tourism, Art, Culture, Sports and Youth Affairs Department
(Art, Culture, Sports and Youth Affairs Division) 82.63 18.03 21.82
27 53 Agriculture, Animal Husbandry and Co-operative Department
(Fishery Division) 82.92 29.15 35.15
28 54 Agriculture, Animal Husbandry and Co-operative Department
(Dairy Division) 319.44 176.44 55.23
29 56 Rural Development Department (Panchayati Raj Division) 1,743.93 871.06 49.95
30 58 School Education and Literacy Department (Secondary
Education Division) 1,681.44 716.28 42.60
31 59 School Education and Literacy Department (Primary and Adult
Education Division) 7,192.62 1,771.73 24.63
32 60 Women, Child Development and Social Security Department 3,560.16 977.24 27.45
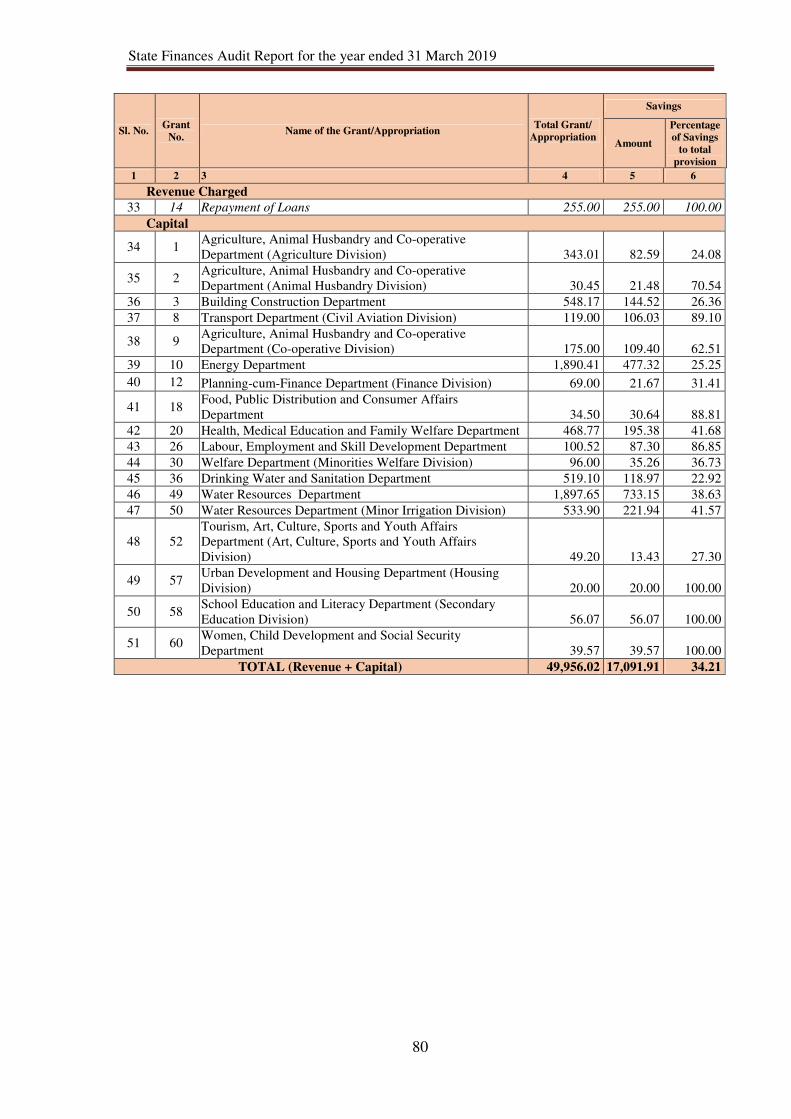
State Finances Audit Report for the year ended 31 March 2019
80
Sl. No. Grant
No. Name of the Grant/Appropriation
Total Grant/
Appropriation
Savings
Amount
Percentage
of Savings
to total
provision
1 2 3 4 5 6
Revenue Charged 33 14 Repayment of Loans 255.00 255.00 100.00
Capital
34 1 Agriculture, Animal Husbandry and Co-operative
Department (Agriculture Division) 343.01 82.59 24.08
35 2 Agriculture, Animal Husbandry and Co-operative
Department (Animal Husbandry Division) 30.45 21.48 70.54
36 3 Building Construction Department 548.17 144.52 26.36
37 8 Transport Department (Civil Aviation Division) 119.00 106.03 89.10
38 9 Agriculture, Animal Husbandry and Co-operative
Department (Co-operative Division) 175.00 109.40 62.51
39 10 Energy Department 1,890.41 477.32 25.25
40 12 Planning-cum-Finance Department (Finance Division) 69.00 21.67 31.41
41 18 Food, Public Distribution and Consumer Affairs
Department 34.50 30.64 88.81
42 20 Health, Medical Education and Family Welfare Department 468.77 195.38 41.68
43 26 Labour, Employment and Skill Development Department 100.52 87.30 86.85
44 30 Welfare Department (Minorities Welfare Division) 96.00 35.26 36.73
45 36 Drinking Water and Sanitation Department 519.10 118.97 22.92
46 49 Water Resources Department 1,897.65 733.15 38.63
47 50 Water Resources Department (Minor Irrigation Division) 533.90 221.94 41.57
48 52
Tourism, Art, Culture, Sports and Youth Affairs
Department (Art, Culture, Sports and Youth Affairs
Division) 49.20 13.43 27.30
49 57 Urban Development and Housing Department (Housing
Division) 20.00 20.00 100.00
50 58 School Education and Literacy Department (Secondary
Education Division) 56.07 56.07 100.00
51 60 Women, Child Development and Social Security
Department 39.57 39.57 100.00
TOTAL (Revenue + Capital) 49,956.02 17,091.91 34.21
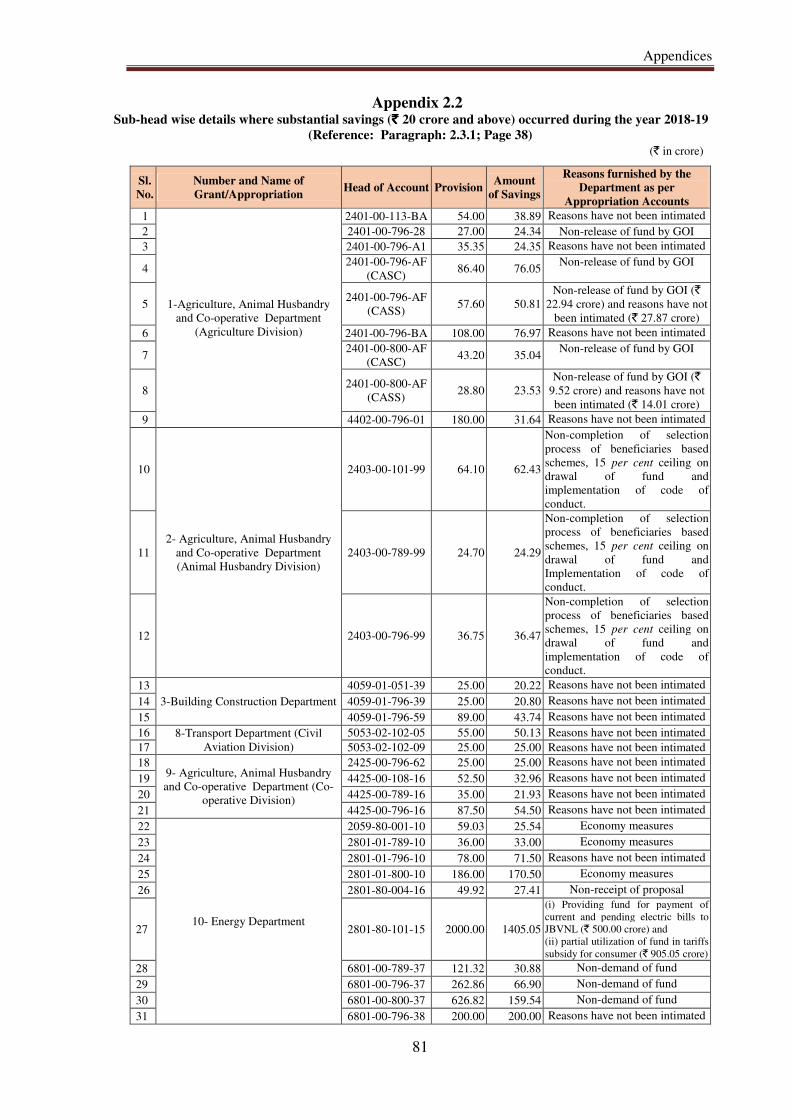
Appendices
81
Appendix 2.2 Sub-head wise details where substantial savings (` ` ` ` 20 crore and above) occurred during the year 2018-19
(Reference: Paragraph: 2.3.1; Page 38)
(` in crore)
Sl.
No.
Number and Name of
Grant/Appropriation Head of Account Provision
Amount
of Savings
Reasons furnished by the
Department as per
Appropriation Accounts
1
1-Agriculture, Animal Husbandry
and Co-operative Department
(Agriculture Division)
2401-00-113-BA 54.00 38.89 Reasons have not been intimated
2 2401-00-796-28 27.00 24.34 Non-release of fund by GOI 3 2401-00-796-A1 35.35 24.35 Reasons have not been intimated
4 2401-00-796-AF
(CASC) 86.40 76.05
Non-release of fund by GOI
5 2401-00-796-AF
(CASS) 57.60 50.81
Non-release of fund by GOI (`
22.94 crore) and reasons have not
been intimated (` 27.87 crore) 6 2401-00-796-BA 108.00 76.97 Reasons have not been intimated
7 2401-00-800-AF
(CASC) 43.20 35.04
Non-release of fund by GOI
8 2401-00-800-AF
(CASS) 28.80 23.53
Non-release of fund by GOI (`
9.52 crore) and reasons have not
been intimated (` 14.01 crore) 9 4402-00-796-01 180.00 31.64 Reasons have not been intimated
10
2- Agriculture, Animal Husbandry
and Co-operative Department
(Animal Husbandry Division)
2403-00-101-99 64.10 62.43
Non-completion of selection
process of beneficiaries based
schemes, 15 per cent ceiling on
drawal of fund and
implementation of code of
conduct.
11 2403-00-789-99 24.70 24.29
Non-completion of selection
process of beneficiaries based
schemes, 15 per cent ceiling on
drawal of fund and
Implementation of code of
conduct.
12 2403-00-796-99 36.75 36.47
Non-completion of selection
process of beneficiaries based
schemes, 15 per cent ceiling on
drawal of fund and
implementation of code of
conduct. 13
3-Building Construction Department
4059-01-051-39 25.00 20.22 Reasons have not been intimated 14 4059-01-796-39 25.00 20.80 Reasons have not been intimated 15 4059-01-796-59 89.00 43.74 Reasons have not been intimated 16 8-Transport Department (Civil
Aviation Division)
5053-02-102-05 55.00 50.13 Reasons have not been intimated 17 5053-02-102-09 25.00 25.00 Reasons have not been intimated 18
9- Agriculture, Animal Husbandry
and Co-operative Department (Co-
operative Division)
2425-00-796-62 25.00 25.00 Reasons have not been intimated 19 4425-00-108-16 52.50 32.96 Reasons have not been intimated 20 4425-00-789-16 35.00 21.93 Reasons have not been intimated 21 4425-00-796-16 87.50 54.50 Reasons have not been intimated 22
10- Energy Department
2059-80-001-10 59.03 25.54 Economy measures 23 2801-01-789-10 36.00 33.00 Economy measures 24 2801-01-796-10 78.00 71.50 Reasons have not been intimated 25 2801-01-800-10 186.00 170.50 Economy measures 26 2801-80-004-16 49.92 27.41 Non-receipt of proposal
27 2801-80-101-15 2000.00 1405.05
(i) Providing fund for payment of
current and pending electric bills to
JBVNL (` 500.00 crore) and
(ii) partial utilization of fund in tariffs
subsidy for consumer (` 905.05 crore) 28 6801-00-789-37 121.32 30.88 Non-demand of fund 29 6801-00-796-37 262.86 66.90 Non-demand of fund 30 6801-00-800-37 626.82 159.54 Non-demand of fund 31 6801-00-796-38 200.00 200.00 Reasons have not been intimated
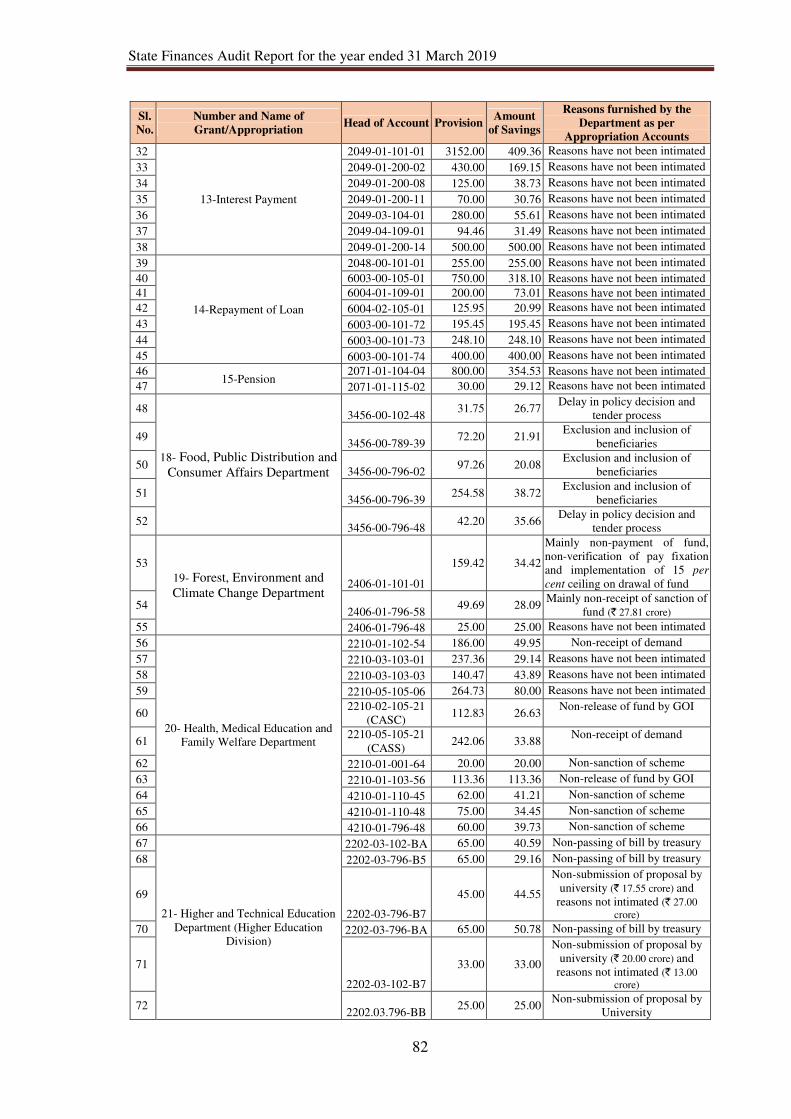
State Finances Audit Report for the year ended 31 March 2019
82
Sl.
No.
Number and Name of
Grant/Appropriation Head of Account Provision
Amount
of Savings
Reasons furnished by the
Department as per
Appropriation Accounts
32
13-Interest Payment
2049-01-101-01 3152.00 409.36 Reasons have not been intimated 33 2049-01-200-02 430.00 169.15 Reasons have not been intimated 34 2049-01-200-08 125.00 38.73 Reasons have not been intimated 35 2049-01-200-11 70.00 30.76 Reasons have not been intimated 36 2049-03-104-01 280.00 55.61 Reasons have not been intimated 37 2049-04-109-01 94.46 31.49 Reasons have not been intimated 38 2049-01-200-14 500.00 500.00 Reasons have not been intimated 39
14-Repayment of Loan
2048-00-101-01 255.00 255.00 Reasons have not been intimated 40 6003-00-105-01 750.00 318.10 Reasons have not been intimated 41 6004-01-109-01 200.00 73.01 Reasons have not been intimated 42 6004-02-105-01 125.95 20.99 Reasons have not been intimated 43 6003-00-101-72 195.45 195.45 Reasons have not been intimated 44 6003-00-101-73 248.10 248.10 Reasons have not been intimated 45 6003-00-101-74 400.00 400.00 Reasons have not been intimated 46
15-Pension 2071-01-104-04 800.00 354.53 Reasons have not been intimated
47 2071-01-115-02 30.00 29.12 Reasons have not been intimated
48
18- Food, Public Distribution and
Consumer Affairs Department
3456-00-102-48 31.75 26.77
Delay in policy decision and
tender process
49 3456-00-789-39
72.20 21.91 Exclusion and inclusion of
beneficiaries
50 3456-00-796-02
97.26 20.08 Exclusion and inclusion of
beneficiaries
51 3456-00-796-39
254.58 38.72 Exclusion and inclusion of
beneficiaries
52 3456-00-796-48
42.20 35.66 Delay in policy decision and
tender process
53
19- Forest, Environment and
Climate Change Department 2406-01-101-01
159.42 34.42
Mainly non-payment of fund,
non-verification of pay fixation
and implementation of 15 per
cent ceiling on drawal of fund
54 2406-01-796-58
49.69 28.09 Mainly non-receipt of sanction of
fund (` 27.81 crore) 55 2406-01-796-48 25.00 25.00 Reasons have not been intimated 56
20- Health, Medical Education and
Family Welfare Department
2210-01-102-54 186.00 49.95 Non-receipt of demand 57 2210-03-103-01 237.36 29.14 Reasons have not been intimated 58 2210-03-103-03 140.47 43.89 Reasons have not been intimated
59 2210-05-105-06 264.73 80.00 Reasons have not been intimated
60 2210-02-105-21
(CASC) 112.83 26.63
Non-release of fund by GOI
61 2210-05-105-21
(CASS) 242.06 33.88
Non-receipt of demand
62 2210-01-001-64 20.00 20.00 Non-sanction of scheme 63 2210-01-103-56 113.36 113.36 Non-release of fund by GOI 64 4210-01-110-45 62.00 41.21 Non-sanction of scheme 65 4210-01-110-48 75.00 34.45 Non-sanction of scheme 66 4210-01-796-48 60.00 39.73 Non-sanction of scheme 67
21- Higher and Technical Education
Department (Higher Education
Division)
2202-03-102-BA 65.00 40.59 Non-passing of bill by treasury 68 2202-03-796-B5 65.00 29.16 Non-passing of bill by treasury
69
2202-03-796-B7
45.00 44.55
Non-submission of proposal by
university (` 17.55 crore) and
reasons not intimated (` 27.00
crore) 70 2202-03-796-BA 65.00 50.78 Non-passing of bill by treasury
71
2202-03-102-B7
33.00 33.00
Non-submission of proposal by
university (` 20.00 crore) and
reasons not intimated (` 13.00
crore)
72 2202.03.796-BB
25.00 25.00 Non-submission of proposal by
University
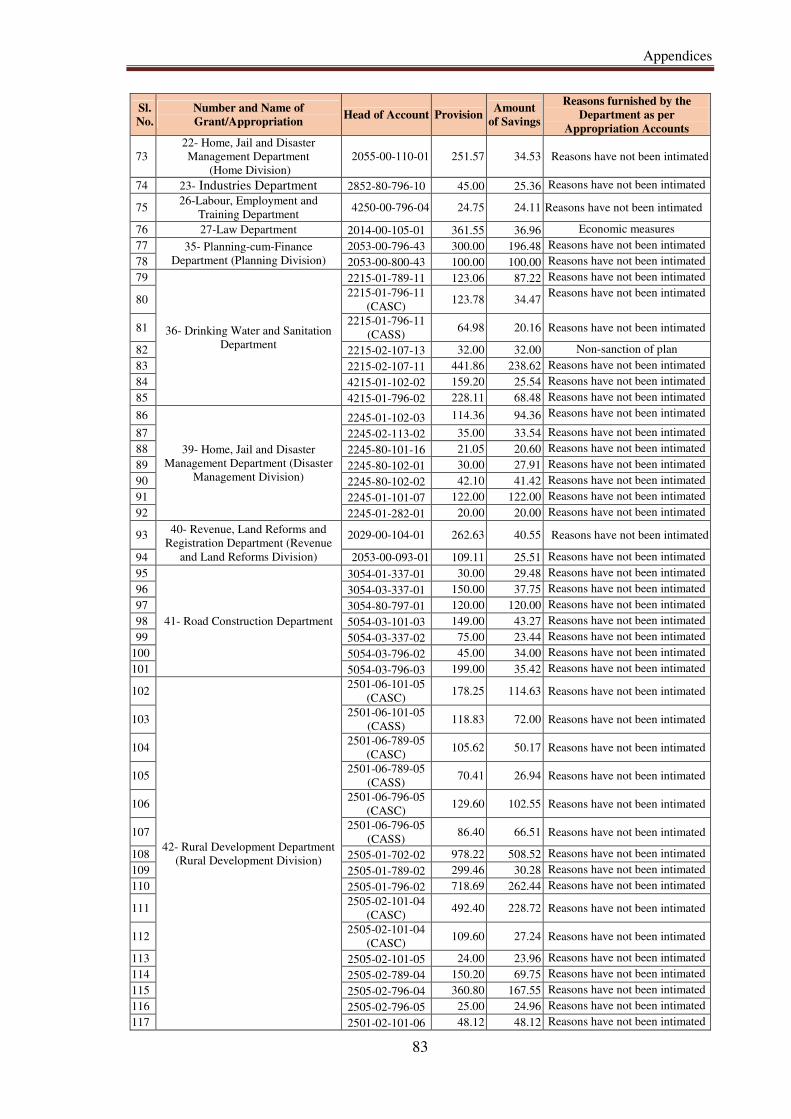
Appendices
83
Sl.
No.
Number and Name of
Grant/Appropriation Head of Account Provision
Amount
of Savings
Reasons furnished by the
Department as per
Appropriation Accounts
73
22- Home, Jail and Disaster
Management Department
(Home Division)
2055-00-110-01 251.57 34.53 Reasons have not been intimated
74 23- Industries Department 2852-80-796-10 45.00 25.36 Reasons have not been intimated
75 26-Labour, Employment and
Training Department 4250-00-796-04 24.75 24.11 Reasons have not been intimated
76 27-Law Department 2014-00-105-01 361.55 36.96 Economic measures
77 35- Planning-cum-Finance
Department (Planning Division)
2053-00-796-43 300.00 196.48 Reasons have not been intimated 78 2053-00-800-43 100.00 100.00 Reasons have not been intimated 79
36- Drinking Water and Sanitation
Department
2215-01-789-11 123.06 87.22 Reasons have not been intimated
80 2215-01-796-11
(CASC) 123.78 34.47
Reasons have not been intimated
81 2215-01-796-11
(CASS) 64.98 20.16 Reasons have not been intimated
82 2215-02-107-13 32.00 32.00 Non-sanction of plan 83 2215-02-107-11 441.86 238.62 Reasons have not been intimated 84 4215-01-102-02 159.20 25.54 Reasons have not been intimated 85 4215-01-796-02 228.11 68.48 Reasons have not been intimated
86
39- Home, Jail and Disaster
Management Department (Disaster
Management Division)
2245-01-102-03 114.36 94.36 Reasons have not been intimated
87 2245-02-113-02 35.00 33.54 Reasons have not been intimated 88 2245-80-101-16 21.05 20.60 Reasons have not been intimated 89 2245-80-102-01 30.00 27.91 Reasons have not been intimated 90 2245-80-102-02 42.10 41.42 Reasons have not been intimated 91 2245-01-101-07 122.00 122.00 Reasons have not been intimated 92 2245-01-282-01 20.00 20.00 Reasons have not been intimated
93 40- Revenue, Land Reforms and
Registration Department (Revenue
and Land Reforms Division)
2029-00-104-01 262.63 40.55 Reasons have not been intimated
94 2053-00-093-01 109.11 25.51 Reasons have not been intimated 95
41- Road Construction Department
3054-01-337-01 30.00 29.48 Reasons have not been intimated 96 3054-03-337-01 150.00 37.75 Reasons have not been intimated 97 3054-80-797-01 120.00 120.00 Reasons have not been intimated 98 5054-03-101-03 149.00 43.27 Reasons have not been intimated 99 5054-03-337-02 75.00 23.44 Reasons have not been intimated
100 5054-03-796-02 45.00 34.00 Reasons have not been intimated
101 5054-03-796-03 199.00 35.42 Reasons have not been intimated
102
42- Rural Development Department
(Rural Development Division)
2501-06-101-05
(CASC) 178.25 114.63 Reasons have not been intimated
103 2501-06-101-05
(CASS) 118.83 72.00 Reasons have not been intimated
104 2501-06-789-05
(CASC) 105.62 50.17 Reasons have not been intimated
105 2501-06-789-05
(CASS) 70.41 26.94 Reasons have not been intimated
106 2501-06-796-05
(CASC) 129.60 102.55 Reasons have not been intimated
107 2501-06-796-05
(CASS) 86.40 66.51 Reasons have not been intimated
108 2505-01-702-02 978.22 508.52 Reasons have not been intimated 109 2505-01-789-02 299.46 30.28 Reasons have not been intimated 110 2505-01-796-02 718.69 262.44 Reasons have not been intimated
111 2505-02-101-04
(CASC) 492.40 228.72 Reasons have not been intimated
112 2505-02-101-04
(CASC) 109.60 27.24 Reasons have not been intimated
113 2505-02-101-05 24.00 23.96 Reasons have not been intimated 114 2505-02-789-04 150.20 69.75 Reasons have not been intimated 115 2505-02-796-04 360.80 167.55 Reasons have not been intimated 116 2505-02-796-05 25.00 24.96 Reasons have not been intimated 117 2501-02-101-06 48.12 48.12 Reasons have not been intimated
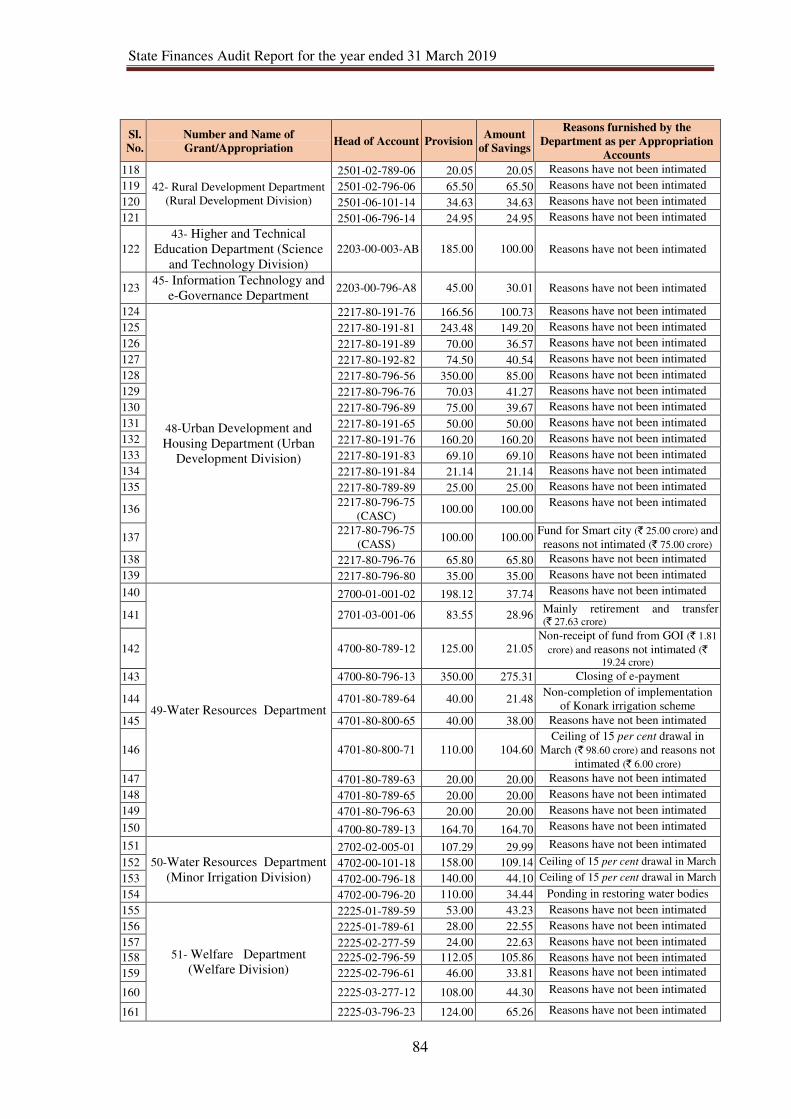
State Finances Audit Report for the year ended 31 March 2019
84
Sl.
No.
Number and Name of
Grant/Appropriation Head of Account Provision
Amount
of Savings
Reasons furnished by the
Department as per Appropriation
Accounts
118
42- Rural Development Department
(Rural Development Division)
2501-02-789-06 20.05 20.05 Reasons have not been intimated 119 2501-02-796-06 65.50 65.50 Reasons have not been intimated 120 2501-06-101-14 34.63 34.63 Reasons have not been intimated 121 2501-06-796-14 24.95 24.95 Reasons have not been intimated
122
43- Higher and Technical
Education Department (Science
and Technology Division)
2203-00-003-AB 185.00 100.00 Reasons have not been intimated
123 45- Information Technology and
e-Governance Department 2203-00-796-A8 45.00 30.01 Reasons have not been intimated
124
48-Urban Development and
Housing Department (Urban
Development Division)
2217-80-191-76 166.56 100.73 Reasons have not been intimated 125 2217-80-191-81 243.48 149.20 Reasons have not been intimated 126 2217-80-191-89 70.00 36.57 Reasons have not been intimated 127 2217-80-192-82 74.50 40.54 Reasons have not been intimated 128 2217-80-796-56 350.00 85.00 Reasons have not been intimated 129 2217-80-796-76 70.03 41.27 Reasons have not been intimated 130 2217-80-796-89 75.00 39.67 Reasons have not been intimated 131 2217-80-191-65 50.00 50.00 Reasons have not been intimated 132 2217-80-191-76 160.20 160.20 Reasons have not been intimated 133 2217-80-191-83 69.10 69.10 Reasons have not been intimated 134 2217-80-191-84 21.14 21.14 Reasons have not been intimated 135 2217-80-789-89 25.00 25.00 Reasons have not been intimated
136 2217-80-796-75
(CASC) 100.00 100.00
Reasons have not been intimated
137 2217-80-796-75
(CASS) 100.00 100.00
Fund for Smart city (` 25.00 crore) and
reasons not intimated (` 75.00 crore) 138 2217-80-796-76 65.80 65.80 Reasons have not been intimated 139 2217-80-796-80 35.00 35.00 Reasons have not been intimated 140
49-Water Resources Department
2700-01-001-02 198.12 37.74 Reasons have not been intimated
141 2701-03-001-06 83.55 28.96 Mainly retirement and transfer (` 27.63 crore)
142 4700-80-789-12 125.00 21.05 Non-receipt of fund from GOI (` 1.81
crore) and reasons not intimated (`
19.24 crore) 143 4700-80-796-13 350.00 275.31 Closing of e-payment
144 4701-80-789-64 40.00 21.48 Non-completion of implementation
of Konark irrigation scheme 145 4701-80-800-65 40.00 38.00 Reasons have not been intimated
146 4701-80-800-71 110.00 104.60
Ceiling of 15 per cent drawal in
March (` 98.60 crore) and reasons not
intimated (` 6.00 crore) 147 4701-80-789-63 20.00 20.00 Reasons have not been intimated 148 4701-80-789-65 20.00 20.00 Reasons have not been intimated 149 4701-80-796-63 20.00 20.00 Reasons have not been intimated 150 4700-80-789-13 164.70 164.70 Reasons have not been intimated
151
50-Water Resources Department
(Minor Irrigation Division)
2702-02-005-01 107.29 29.99 Reasons have not been intimated
152 4702-00-101-18 158.00 109.14 Ceiling of 15 per cent drawal in March
153 4702-00-796-18 140.00 44.10 Ceiling of 15 per cent drawal in March
154 4702-00-796-20 110.00 34.44 Ponding in restoring water bodies 155
51- Welfare Department
(Welfare Division)
2225-01-789-59 53.00 43.23 Reasons have not been intimated 156 2225-01-789-61 28.00 22.55 Reasons have not been intimated 157 2225-02-277-59 24.00 22.63 Reasons have not been intimated 158 2225-02-796-59 112.05 105.86 Reasons have not been intimated 159 2225-02-796-61 46.00 33.81 Reasons have not been intimated
160 2225-03-277-12 108.00 44.30 Reasons have not been intimated
161 2225-03-796-23 124.00 65.26 Reasons have not been intimated
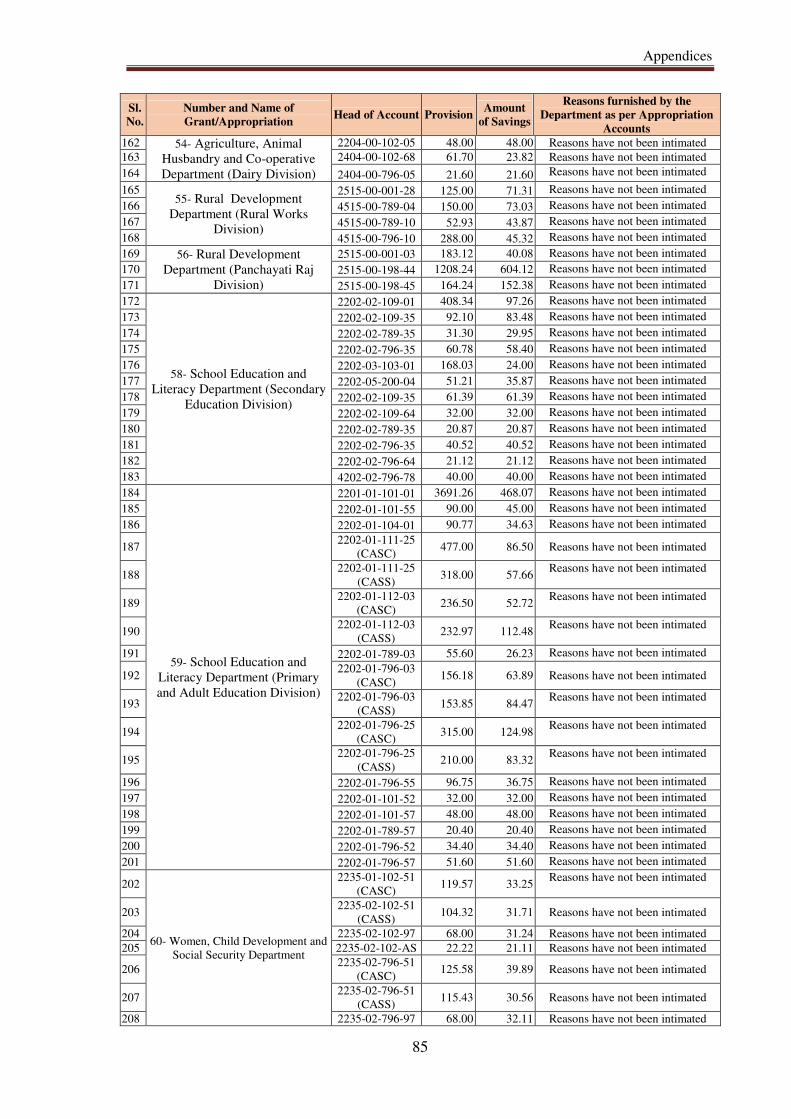
Appendices
85
Sl.
No.
Number and Name of
Grant/Appropriation Head of Account Provision
Amount
of Savings
Reasons furnished by the
Department as per Appropriation
Accounts
162 54- Agriculture, Animal
Husbandry and Co-operative
Department (Dairy Division)
2204-00-102-05 48.00 48.00 Reasons have not been intimated 163 2404-00-102-68 61.70 23.82 Reasons have not been intimated 164 2404-00-796-05 21.60 21.60 Reasons have not been intimated
165 55- Rural Development
Department (Rural Works
Division)
2515-00-001-28 125.00 71.31 Reasons have not been intimated 166 4515-00-789-04 150.00 73.03 Reasons have not been intimated 167 4515-00-789-10 52.93 43.87 Reasons have not been intimated 168 4515-00-796-10 288.00 45.32 Reasons have not been intimated 169 56- Rural Development
Department (Panchayati Raj
Division)
2515-00-001-03 183.12 40.08 Reasons have not been intimated 170 2515-00-198-44 1208.24 604.12 Reasons have not been intimated 171 2515-00-198-45 164.24 152.38 Reasons have not been intimated 172
58- School Education and
Literacy Department (Secondary
Education Division)
2202-02-109-01 408.34 97.26 Reasons have not been intimated 173 2202-02-109-35 92.10 83.48 Reasons have not been intimated 174 2202-02-789-35 31.30 29.95 Reasons have not been intimated 175 2202-02-796-35 60.78 58.40 Reasons have not been intimated 176 2202-03-103-01 168.03 24.00 Reasons have not been intimated 177 2202-05-200-04 51.21 35.87 Reasons have not been intimated 178 2202-02-109-35 61.39 61.39 Reasons have not been intimated 179 2202-02-109-64 32.00 32.00 Reasons have not been intimated 180 2202-02-789-35 20.87 20.87 Reasons have not been intimated 181 2202-02-796-35 40.52 40.52 Reasons have not been intimated 182 2202-02-796-64 21.12 21.12 Reasons have not been intimated 183 4202-02-796-78 40.00 40.00 Reasons have not been intimated 184
59- School Education and
Literacy Department (Primary
and Adult Education Division)
2201-01-101-01 3691.26 468.07 Reasons have not been intimated 185 2202-01-101-55 90.00 45.00 Reasons have not been intimated 186 2202-01-104-01 90.77 34.63 Reasons have not been intimated
187 2202-01-111-25
(CASC) 477.00 86.50 Reasons have not been intimated
188 2202-01-111-25
(CASS) 318.00 57.66
Reasons have not been intimated
189 2202-01-112-03
(CASC) 236.50 52.72
Reasons have not been intimated
190 2202-01-112-03
(CASS) 232.97 112.48
Reasons have not been intimated
191 2202-01-789-03 55.60 26.23 Reasons have not been intimated
192 2202-01-796-03
(CASC) 156.18 63.89 Reasons have not been intimated
193 2202-01-796-03
(CASS) 153.85 84.47
Reasons have not been intimated
194 2202-01-796-25
(CASC) 315.00 124.98
Reasons have not been intimated
195 2202-01-796-25
(CASS) 210.00 83.32
Reasons have not been intimated
196 2202-01-796-55 96.75 36.75 Reasons have not been intimated 197 2202-01-101-52 32.00 32.00 Reasons have not been intimated 198 2202-01-101-57 48.00 48.00 Reasons have not been intimated 199 2202-01-789-57 20.40 20.40 Reasons have not been intimated 200 2202-01-796-52 34.40 34.40 Reasons have not been intimated 201 2202-01-796-57 51.60 51.60 Reasons have not been intimated
202
60- Women, Child Development and
Social Security Department
2235-01-102-51
(CASC) 119.57 33.25
Reasons have not been intimated
203 2235-02-102-51
(CASS) 104.32 31.71 Reasons have not been intimated
204 2235-02-102-97 68.00 31.24 Reasons have not been intimated 205 2235-02-102-AS 22.22 21.11 Reasons have not been intimated
206 2235-02-796-51
(CASC) 125.58 39.89 Reasons have not been intimated
207 2235-02-796-51
(CASS) 115.43 30.56 Reasons have not been intimated
208 2235-02-796-97 68.00 32.11 Reasons have not been intimated
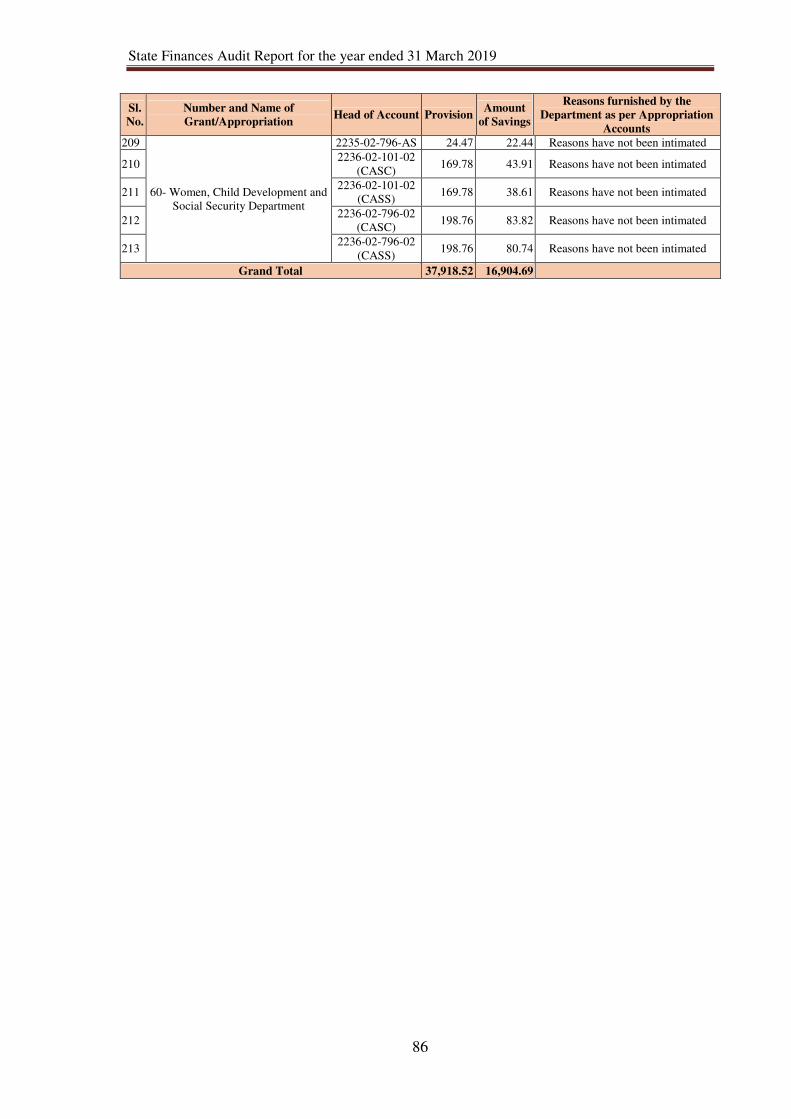
State Finances Audit Report for the year ended 31 March 2019
86
Sl.
No.
Number and Name of
Grant/Appropriation Head of Account Provision
Amount
of Savings
Reasons furnished by the
Department as per Appropriation
Accounts
209
60- Women, Child Development and
Social Security Department
2235-02-796-AS 24.47 22.44 Reasons have not been intimated
210 2236-02-101-02
(CASC) 169.78 43.91 Reasons have not been intimated
211 2236-02-101-02
(CASS) 169.78 38.61 Reasons have not been intimated
212 2236-02-796-02
(CASC) 198.76 83.82 Reasons have not been intimated
213 2236-02-796-02
(CASS) 198.76 80.74 Reasons have not been intimated
Grand Total 37,918.52 16,904.69
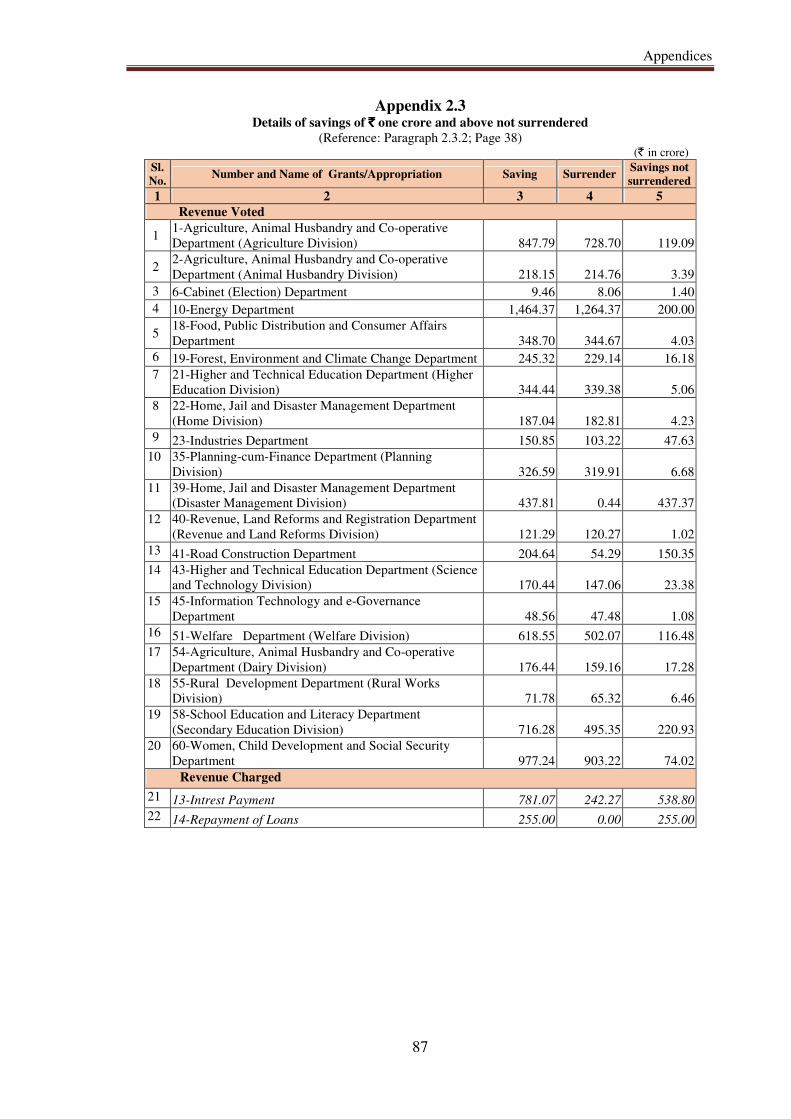
Appendices
87
Appendix 2.3 Details of savings of `̀̀̀ one crore and above not surrendered
(Reference: Paragraph 2.3.2; Page 38) (` in crore)
Sl.
No. Number and Name of Grants/Appropriation Saving Surrender
Savings not
surrendered
1 2 3 4 5
Revenue Voted
1 1-Agriculture, Animal Husbandry and Co-operative
Department (Agriculture Division) 847.79 728.70 119.09
2 2-Agriculture, Animal Husbandry and Co-operative
Department (Animal Husbandry Division) 218.15 214.76 3.39
3 6-Cabinet (Election) Department 9.46 8.06 1.40
4 10-Energy Department 1,464.37 1,264.37 200.00
5 18-Food, Public Distribution and Consumer Affairs
Department 348.70 344.67 4.03
6 19-Forest, Environment and Climate Change Department 245.32 229.14 16.18
7 21-Higher and Technical Education Department (Higher
Education Division) 344.44 339.38 5.06
8 22-Home, Jail and Disaster Management Department
(Home Division) 187.04 182.81 4.23
9 23-Industries Department 150.85 103.22 47.63
10 35-Planning-cum-Finance Department (Planning
Division) 326.59 319.91 6.68
11 39-Home, Jail and Disaster Management Department
(Disaster Management Division) 437.81 0.44 437.37
12 40-Revenue, Land Reforms and Registration Department
(Revenue and Land Reforms Division) 121.29 120.27 1.02
13 41-Road Construction Department 204.64 54.29 150.35
14 43-Higher and Technical Education Department (Science
and Technology Division) 170.44 147.06 23.38
15 45-Information Technology and e-Governance
Department 48.56 47.48 1.08
16 51-Welfare Department (Welfare Division) 618.55 502.07 116.48
17 54-Agriculture, Animal Husbandry and Co-operative
Department (Dairy Division) 176.44 159.16 17.28
18 55-Rural Development Department (Rural Works
Division) 71.78 65.32 6.46
19 58-School Education and Literacy Department
(Secondary Education Division) 716.28 495.35 220.93
20 60-Women, Child Development and Social Security
Department 977.24 903.22 74.02
Revenue Charged
21 13-Intrest Payment 781.07 242.27 538.80
22 14-Repayment of Loans 255.00 0.00 255.00
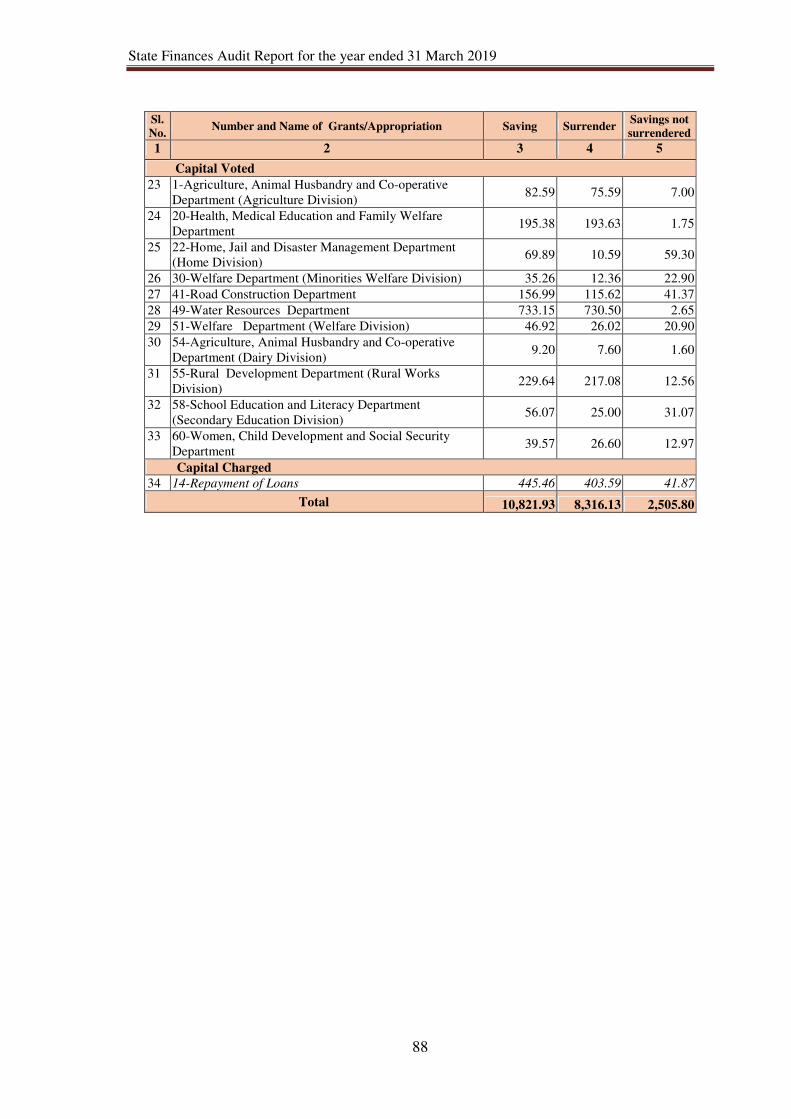
State Finances Audit Report for the year ended 31 March 2019
88
Sl.
No. Number and Name of Grants/Appropriation Saving Surrender
Savings not
surrendered
1 2 3 4 5
Capital Voted
23 1-Agriculture, Animal Husbandry and Co-operative
Department (Agriculture Division) 82.59 75.59 7.00
24 20-Health, Medical Education and Family Welfare
Department 195.38 193.63 1.75
25 22-Home, Jail and Disaster Management Department
(Home Division) 69.89 10.59 59.30
26 30-Welfare Department (Minorities Welfare Division) 35.26 12.36 22.90
27 41-Road Construction Department 156.99 115.62 41.37
28 49-Water Resources Department 733.15 730.50 2.65
29 51-Welfare Department (Welfare Division) 46.92 26.02 20.90
30 54-Agriculture, Animal Husbandry and Co-operative
Department (Dairy Division) 9.20 7.60 1.60
31 55-Rural Development Department (Rural Works
Division) 229.64 217.08 12.56
32 58-School Education and Literacy Department
(Secondary Education Division) 56.07 25.00 31.07
33 60-Women, Child Development and Social Security
Department 39.57 26.60 12.97
Capital Charged
34 14-Repayment of Loans 445.46 403.59 41.87
Total 10,821.93 8,316.13 2,505.80
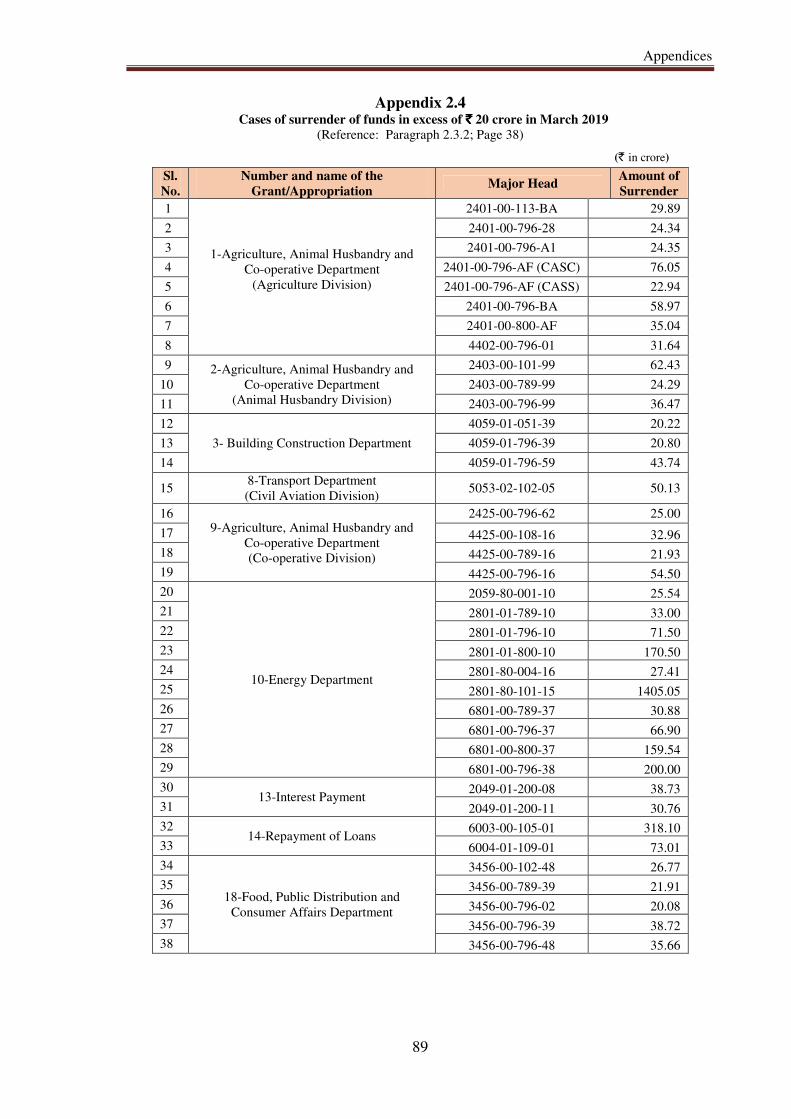
Appendices
89
Appendix 2.4 Cases of surrender of funds in excess of `̀̀̀ 20 crore in March 2019
(Reference: Paragraph 2.3.2; Page 38)
(` in crore)
Sl.
No.
Number and name of the
Grant/Appropriation Major Head
Amount of
Surrender
1
1-Agriculture, Animal Husbandry and
Co-operative Department
(Agriculture Division)
2401-00-113-BA 29.89
2 2401-00-796-28 24.34
3 2401-00-796-A1 24.35
4 2401-00-796-AF (CASC) 76.05
5 2401-00-796-AF (CASS) 22.94
6 2401-00-796-BA 58.97
7 2401-00-800-AF 35.04
8 4402-00-796-01 31.64
9 2-Agriculture, Animal Husbandry and
Co-operative Department
(Animal Husbandry Division)
2403-00-101-99 62.43
10 2403-00-789-99 24.29
11 2403-00-796-99 36.47
12
3- Building Construction Department
4059-01-051-39 20.22
13 4059-01-796-39 20.80
14 4059-01-796-59 43.74
15 8-Transport Department
(Civil Aviation Division) 5053-02-102-05 50.13
16 9-Agriculture, Animal Husbandry and
Co-operative Department
(Co-operative Division)
2425-00-796-62 25.00
17 4425-00-108-16 32.96
18 4425-00-789-16 21.93
19 4425-00-796-16 54.50
20
10-Energy Department
2059-80-001-10 25.54
21 2801-01-789-10 33.00
22 2801-01-796-10 71.50
23 2801-01-800-10 170.50
24 2801-80-004-16 27.41
25 2801-80-101-15 1405.05
26 6801-00-789-37 30.88
27 6801-00-796-37 66.90
28 6801-00-800-37 159.54
29 6801-00-796-38 200.00
30 13-Interest Payment
2049-01-200-08 38.73
31 2049-01-200-11 30.76
32 14-Repayment of Loans
6003-00-105-01 318.10
33 6004-01-109-01 73.01
34
18-Food, Public Distribution and
Consumer Affairs Department
3456-00-102-48 26.77
35 3456-00-789-39 21.91
36 3456-00-796-02 20.08
37 3456-00-796-39 38.72
38 3456-00-796-48 35.66
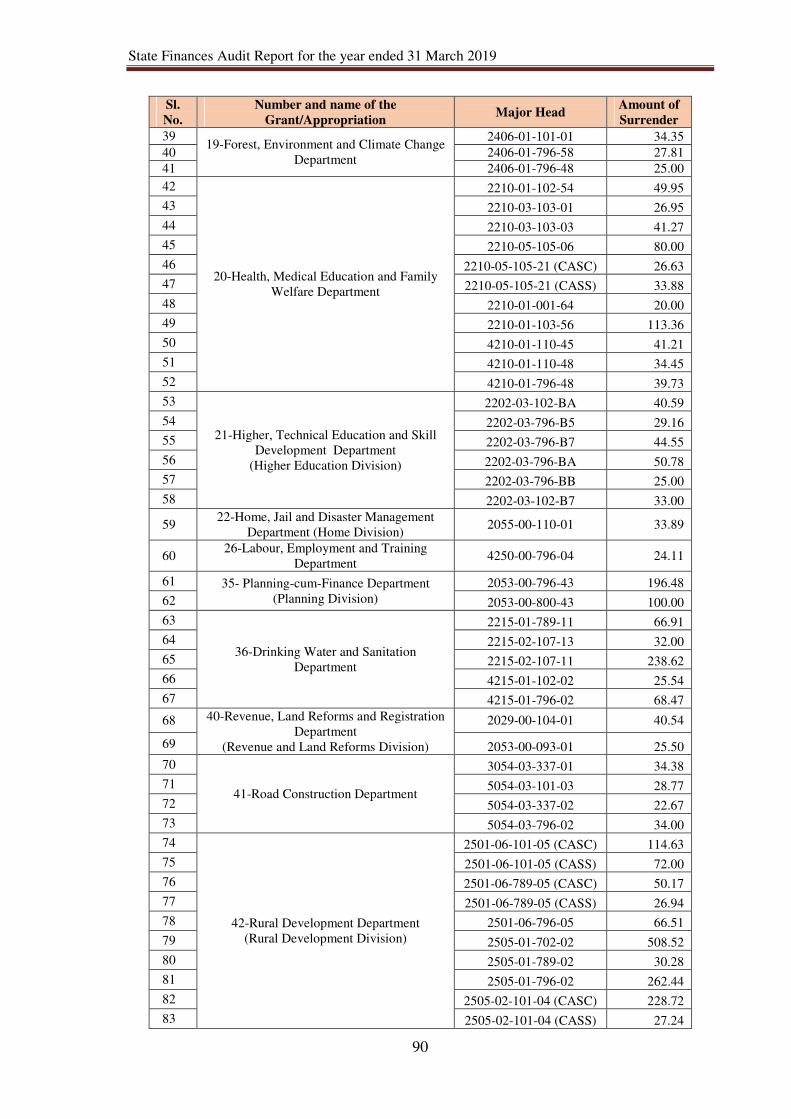
State Finances Audit Report for the year ended 31 March 2019
90
Sl.
No.
Number and name of the
Grant/Appropriation Major Head
Amount of
Surrender
39 19-Forest, Environment and Climate Change
Department
2406-01-101-01 34.35
40 2406-01-796-58 27.81
41 2406-01-796-48 25.00
42
20-Health, Medical Education and Family
Welfare Department
2210-01-102-54 49.95
43 2210-03-103-01 26.95
44 2210-03-103-03 41.27
45 2210-05-105-06 80.00
46 2210-05-105-21 (CASC) 26.63
47 2210-05-105-21 (CASS) 33.88
48 2210-01-001-64 20.00
49 2210-01-103-56 113.36
50 4210-01-110-45 41.21
51 4210-01-110-48 34.45
52 4210-01-796-48 39.73
53
21-Higher, Technical Education and Skill
Development Department
(Higher Education Division)
2202-03-102-BA 40.59
54 2202-03-796-B5 29.16
55 2202-03-796-B7 44.55
56 2202-03-796-BA 50.78
57 2202-03-796-BB 25.00
58 2202-03-102-B7 33.00
59 22-Home, Jail and Disaster Management
Department (Home Division) 2055-00-110-01 33.89
60 26-Labour, Employment and Training
Department 4250-00-796-04 24.11
61 35- Planning-cum-Finance Department
(Planning Division)
2053-00-796-43 196.48
62 2053-00-800-43 100.00
63
36-Drinking Water and Sanitation
Department
2215-01-789-11 66.91
64 2215-02-107-13 32.00
65 2215-02-107-11 238.62
66 4215-01-102-02 25.54
67 4215-01-796-02 68.47
68 40-Revenue, Land Reforms and Registration
Department
(Revenue and Land Reforms Division)
2029-00-104-01 40.54
69 2053-00-093-01 25.50
70
41-Road Construction Department
3054-03-337-01 34.38
71 5054-03-101-03 28.77
72 5054-03-337-02 22.67
73 5054-03-796-02 34.00
74
42-Rural Development Department
(Rural Development Division)
2501-06-101-05 (CASC) 114.63
75 2501-06-101-05 (CASS) 72.00
76 2501-06-789-05 (CASC) 50.17
77 2501-06-789-05 (CASS) 26.94
78 2501-06-796-05 66.51
79 2505-01-702-02 508.52
80 2505-01-789-02 30.28
81 2505-01-796-02 262.44
82 2505-02-101-04 (CASC) 228.72
83 2505-02-101-04 (CASS) 27.24
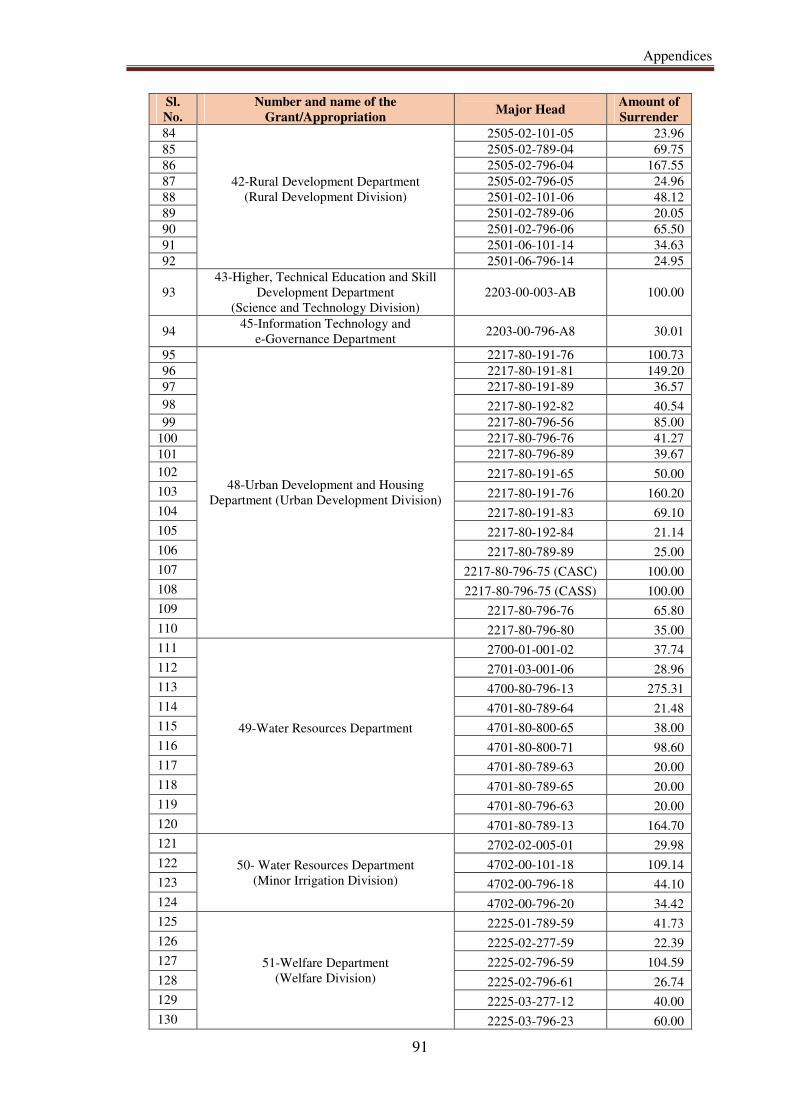
Appendices
91
Sl.
No.
Number and name of the
Grant/Appropriation Major Head
Amount of
Surrender
84
42-Rural Development Department
(Rural Development Division)
2505-02-101-05 23.96
85 2505-02-789-04 69.75
86 2505-02-796-04 167.55
87 2505-02-796-05 24.96
88 2501-02-101-06 48.12
89 2501-02-789-06 20.05
90 2501-02-796-06 65.50
91 2501-06-101-14 34.63
92 2501-06-796-14 24.95
93
43-Higher, Technical Education and Skill
Development Department
(Science and Technology Division)
2203-00-003-AB 100.00
94 45-Information Technology and
e-Governance Department 2203-00-796-A8 30.01
95
48-Urban Development and Housing
Department (Urban Development Division)
2217-80-191-76 100.73
96 2217-80-191-81 149.20
97 2217-80-191-89 36.57
98 2217-80-192-82 40.54
99 2217-80-796-56 85.00
100 2217-80-796-76 41.27
101 2217-80-796-89 39.67
102 2217-80-191-65 50.00
103 2217-80-191-76 160.20
104 2217-80-191-83 69.10
105 2217-80-192-84 21.14
106 2217-80-789-89 25.00
107 2217-80-796-75 (CASC) 100.00
108 2217-80-796-75 (CASS) 100.00
109 2217-80-796-76 65.80
110 2217-80-796-80 35.00
111
49-Water Resources Department
2700-01-001-02 37.74
112 2701-03-001-06 28.96
113 4700-80-796-13 275.31
114 4701-80-789-64 21.48
115 4701-80-800-65 38.00
116 4701-80-800-71 98.60
117 4701-80-789-63 20.00
118 4701-80-789-65 20.00
119 4701-80-796-63 20.00
120 4701-80-789-13 164.70
121
50- Water Resources Department
(Minor Irrigation Division)
2702-02-005-01 29.98
122 4702-00-101-18 109.14
123 4702-00-796-18 44.10
124 4702-00-796-20 34.42
125
51-Welfare Department
(Welfare Division)
2225-01-789-59 41.73
126 2225-02-277-59 22.39
127 2225-02-796-59 104.59
128 2225-02-796-61 26.74
129 2225-03-277-12 40.00
130 2225-03-796-23 60.00
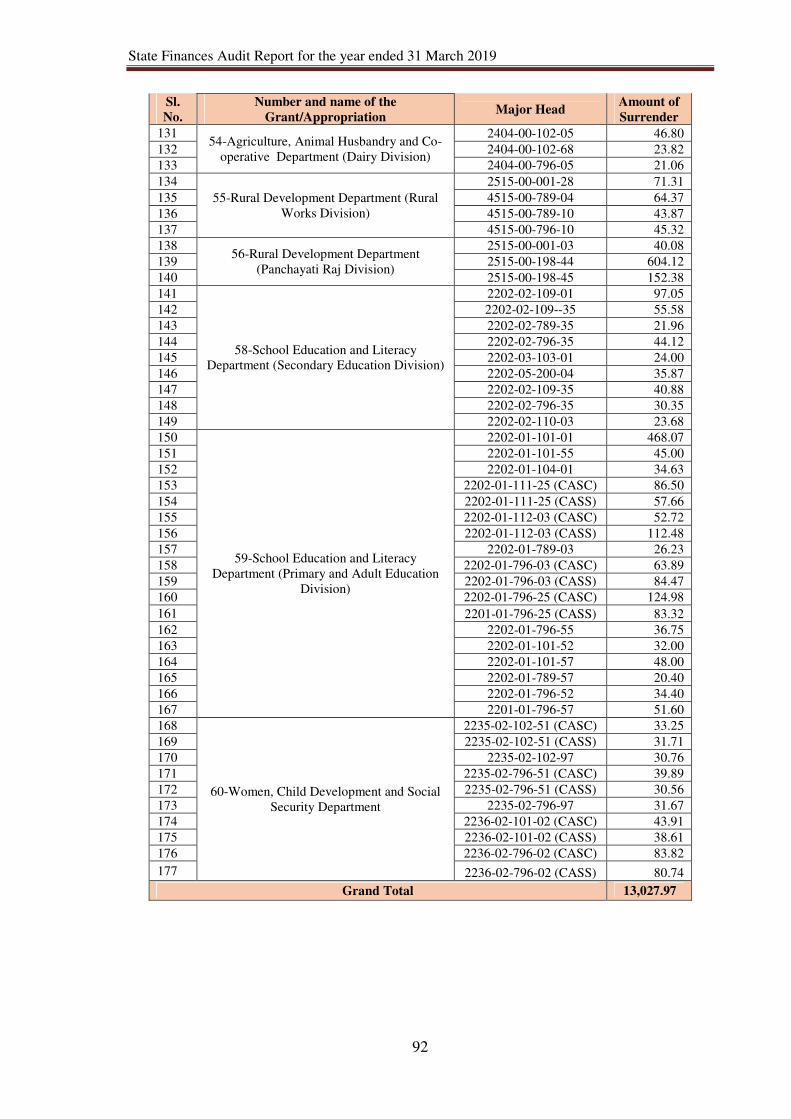
State Finances Audit Report for the year ended 31 March 2019
92
Sl.
No.
Number and name of the
Grant/Appropriation Major Head
Amount of
Surrender
131 54-Agriculture, Animal Husbandry and Co-
operative Department (Dairy Division)
2404-00-102-05 46.80
132 2404-00-102-68 23.82
133 2404-00-796-05 21.06
134
55-Rural Development Department (Rural
Works Division)
2515-00-001-28 71.31
135 4515-00-789-04 64.37
136 4515-00-789-10 43.87
137 4515-00-796-10 45.32
138 56-Rural Development Department
(Panchayati Raj Division)
2515-00-001-03 40.08
139 2515-00-198-44 604.12
140 2515-00-198-45 152.38
141
58-School Education and Literacy
Department (Secondary Education Division)
2202-02-109-01 97.05
142 2202-02-109--35 55.58
143 2202-02-789-35 21.96
144 2202-02-796-35 44.12
145 2202-03-103-01 24.00
146 2202-05-200-04 35.87
147 2202-02-109-35 40.88
148 2202-02-796-35 30.35
149 2202-02-110-03 23.68
150
59-School Education and Literacy
Department (Primary and Adult Education
Division)
2202-01-101-01 468.07
151 2202-01-101-55 45.00
152 2202-01-104-01 34.63
153 2202-01-111-25 (CASC) 86.50
154 2202-01-111-25 (CASS) 57.66
155 2202-01-112-03 (CASC) 52.72
156 2202-01-112-03 (CASS) 112.48
157 2202-01-789-03 26.23
158 2202-01-796-03 (CASC) 63.89
159 2202-01-796-03 (CASS) 84.47
160 2202-01-796-25 (CASC) 124.98
161 2201-01-796-25 (CASS) 83.32
162 2202-01-796-55 36.75
163 2202-01-101-52 32.00
164 2202-01-101-57 48.00
165 2202-01-789-57 20.40
166 2202-01-796-52 34.40
167 2201-01-796-57 51.60
168
60-Women, Child Development and Social
Security Department
2235-02-102-51 (CASC) 33.25
169 2235-02-102-51 (CASS) 31.71
170 2235-02-102-97 30.76
171 2235-02-796-51 (CASC) 39.89
172 2235-02-796-51 (CASS) 30.56
173 2235-02-796-97 31.67
174 2236-02-101-02 (CASC) 43.91
175 2236-02-101-02 (CASS) 38.61
176 2236-02-796-02 (CASC) 83.82
177 2236-02-796-02 (CASS) 80.74
Grand Total 13,027.97
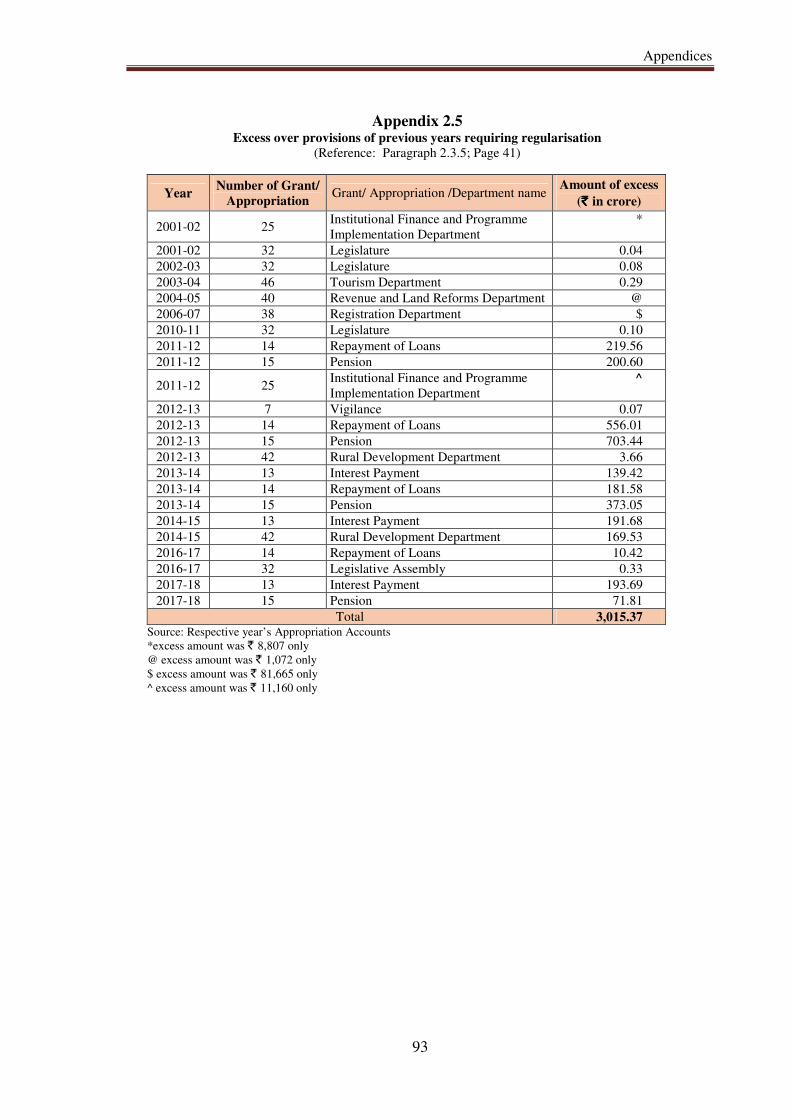
Appendices
93
Appendix 2.5 Excess over provisions of previous years requiring regularisation
(Reference: Paragraph 2.3.5; Page 41)
Year Number of Grant/
Appropriation Grant/ Appropriation /Department name
Amount of excess
(` ` ` ` in crore)
2001-02 25 Institutional Finance and Programme
Implementation Department
*
2001-02 32 Legislature 0.04
2002-03 32 Legislature 0.08
2003-04 46 Tourism Department 0.29
2004-05 40 Revenue and Land Reforms Department @
2006-07 38 Registration Department $
2010-11 32 Legislature 0.10
2011-12 14 Repayment of Loans 219.56
2011-12 15 Pension 200.60
2011-12 25 Institutional Finance and Programme
Implementation Department
^
2012-13 7 Vigilance 0.07
2012-13 14 Repayment of Loans 556.01
2012-13 15 Pension 703.44
2012-13 42 Rural Development Department 3.66
2013-14 13 Interest Payment 139.42
2013-14 14 Repayment of Loans 181.58
2013-14 15 Pension 373.05
2014-15 13 Interest Payment 191.68
2014-15 42 Rural Development Department 169.53
2016-17 14 Repayment of Loans 10.42
2016-17 32 Legislative Assembly 0.33
2017-18 13 Interest Payment 193.69
2017-18 15 Pension 71.81
Total 3,015.37 Source: Respective year’s Appropriation Accounts
*excess amount was ` 8,807 only
@ excess amount was ` 1,072 only
$ excess amount was ` 81,665 only
^ excess amount was ` 11,160 only
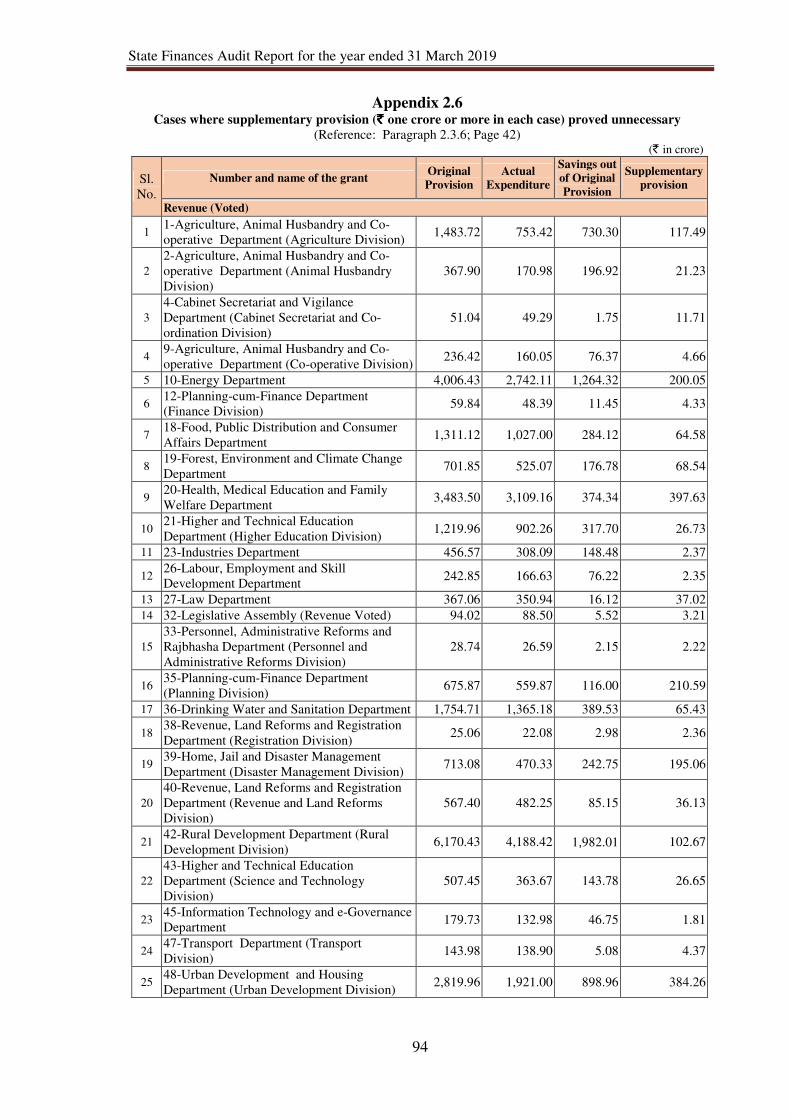
State Finances Audit Report for the year ended 31 March 2019
94
Appendix 2.6 Cases where supplementary provision (` ` ` ` one crore or more in each case) proved unnecessary
(Reference: Paragraph 2.3.6; Page 42) (` in crore)
Sl.
No.
Number and name of the grant Original
Provision
Actual
Expenditure
Savings out
of Original
Provision
Supplementary
provision
Revenue (Voted)
1 1-Agriculture, Animal Husbandry and Co-
operative Department (Agriculture Division) 1,483.72 753.42 730.30 117.49
2
2-Agriculture, Animal Husbandry and Co-
operative Department (Animal Husbandry
Division)
367.90 170.98 196.92 21.23
3
4-Cabinet Secretariat and Vigilance
Department (Cabinet Secretariat and Co-
ordination Division)
51.04 49.29 1.75 11.71
4 9-Agriculture, Animal Husbandry and Co-
operative Department (Co-operative Division) 236.42 160.05 76.37 4.66
5 10-Energy Department 4,006.43 2,742.11 1,264.32 200.05
6 12-Planning-cum-Finance Department
(Finance Division) 59.84 48.39 11.45 4.33
7 18-Food, Public Distribution and Consumer
Affairs Department 1,311.12 1,027.00 284.12 64.58
8 19-Forest, Environment and Climate Change
Department 701.85 525.07 176.78 68.54
9 20-Health, Medical Education and Family
Welfare Department 3,483.50 3,109.16 374.34 397.63
10 21-Higher and Technical Education
Department (Higher Education Division) 1,219.96 902.26 317.70 26.73
11 23-Industries Department 456.57 308.09 148.48 2.37
12 26-Labour, Employment and Skill
Development Department 242.85 166.63 76.22 2.35
13 27-Law Department 367.06 350.94 16.12 37.02
14 32-Legislative Assembly (Revenue Voted) 94.02 88.50 5.52 3.21
15
33-Personnel, Administrative Reforms and
Rajbhasha Department (Personnel and
Administrative Reforms Division)
28.74 26.59 2.15 2.22
16 35-Planning-cum-Finance Department
(Planning Division) 675.87 559.87 116.00 210.59
17 36-Drinking Water and Sanitation Department 1,754.71 1,365.18 389.53 65.43
18 38-Revenue, Land Reforms and Registration
Department (Registration Division) 25.06 22.08 2.98 2.36
19 39-Home, Jail and Disaster Management
Department (Disaster Management Division) 713.08 470.33 242.75 195.06
20
40-Revenue, Land Reforms and Registration
Department (Revenue and Land Reforms
Division)
567.40 482.25 85.15 36.13
21 42-Rural Development Department (Rural
Development Division) 6,170.43 4,188.42 1,982.01 102.67
22
43-Higher and Technical Education
Department (Science and Technology
Division)
507.45 363.67 143.78 26.65
23 45-Information Technology and e-Governance
Department 179.73 132.98 46.75 1.81
24 47-Transport Department (Transport
Division) 143.98 138.90 5.08 4.37
25 48-Urban Development and Housing
Department (Urban Development Division) 2,819.96 1,921.00 898.96 384.26
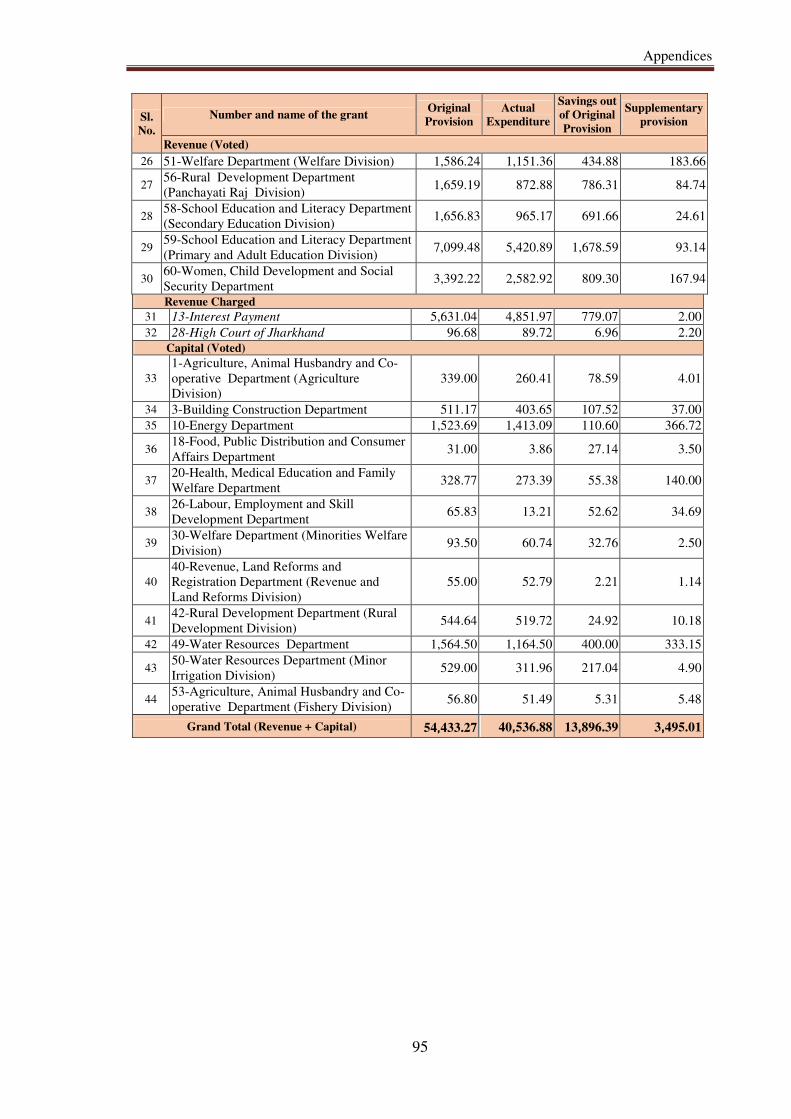
Appendices
95
Sl.
No.
Number and name of the grant Original
Provision
Actual
Expenditure
Savings out
of Original
Provision
Supplementary
provision
Revenue (Voted)
26 51-Welfare Department (Welfare Division) 1,586.24 1,151.36 434.88 183.66
27 56-Rural Development Department
(Panchayati Raj Division) 1,659.19 872.88 786.31 84.74
28 58-School Education and Literacy Department
(Secondary Education Division) 1,656.83 965.17 691.66 24.61
29 59-School Education and Literacy Department
(Primary and Adult Education Division) 7,099.48 5,420.89 1,678.59 93.14
30 60-Women, Child Development and Social
Security Department 3,392.22 2,582.92 809.30 167.94
Revenue Charged
31 13-Interest Payment 5,631.04 4,851.97 779.07 2.00
32 28-High Court of Jharkhand 96.68 89.72 6.96 2.20
Capital (Voted)
33
1-Agriculture, Animal Husbandry and Co-
operative Department (Agriculture
Division)
339.00 260.41 78.59 4.01
34 3-Building Construction Department 511.17 403.65 107.52 37.00
35 10-Energy Department 1,523.69 1,413.09 110.60 366.72
36 18-Food, Public Distribution and Consumer
Affairs Department 31.00 3.86 27.14 3.50
37 20-Health, Medical Education and Family
Welfare Department 328.77 273.39 55.38 140.00
38 26-Labour, Employment and Skill
Development Department 65.83 13.21 52.62 34.69
39 30-Welfare Department (Minorities Welfare
Division) 93.50 60.74 32.76 2.50
40
40-Revenue, Land Reforms and
Registration Department (Revenue and
Land Reforms Division)
55.00 52.79 2.21 1.14
41 42-Rural Development Department (Rural
Development Division) 544.64 519.72 24.92 10.18
42 49-Water Resources Department 1,564.50 1,164.50 400.00 333.15
43 50-Water Resources Department (Minor
Irrigation Division) 529.00 311.96 217.04 4.90
44 53-Agriculture, Animal Husbandry and Co-
operative Department (Fishery Division) 56.80 51.49 5.31 5.48
Grand Total (Revenue + Capital) 54,433.27 40,536.88 13,896.39 3,495.01
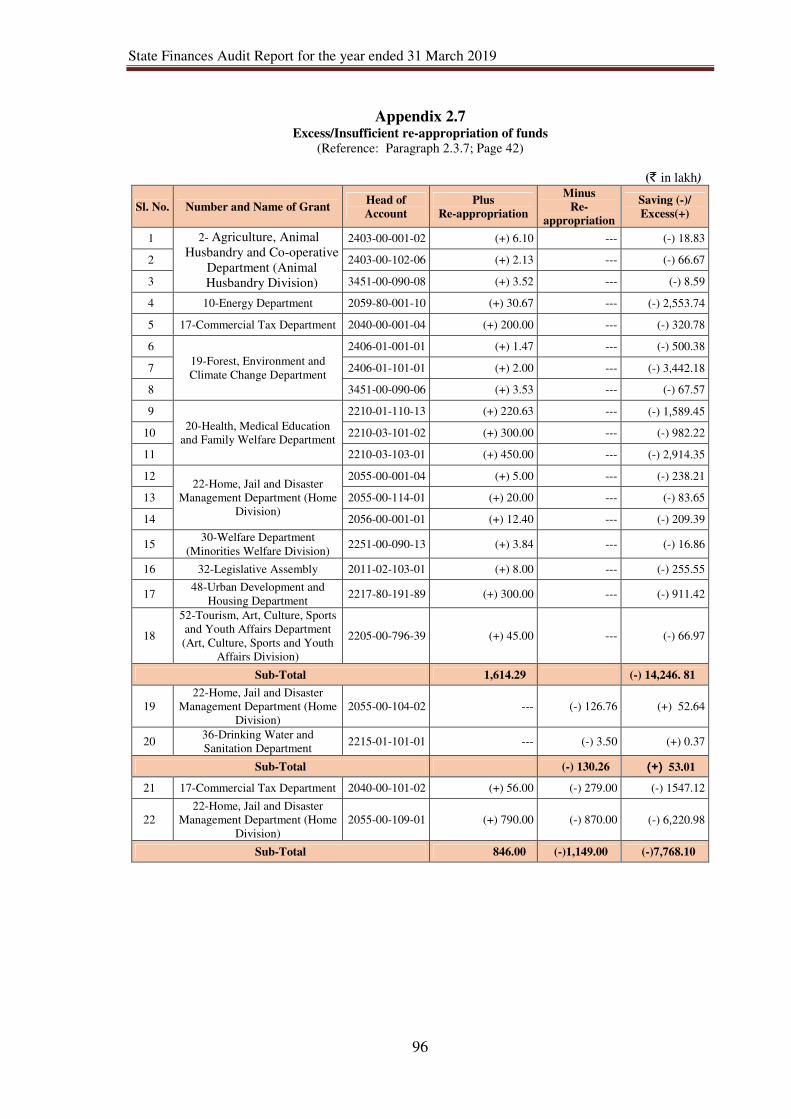
State Finances Audit Report for the year ended 31 March 2019
96
Appendix 2.7 Excess/Insufficient re-appropriation of funds
(Reference: Paragraph 2.3.7; Page 42)
(` in lakh)
Sl. No. Number and Name of Grant Head of
Account
Plus
Re-appropriation
Minus
Re-
appropriation
Saving (-)/
Excess(+)
1 2- Agriculture, Animal
Husbandry and Co-operative
Department (Animal
Husbandry Division)
2403-00-001-02 (+) 6.10 --- (-) 18.83
2 2403-00-102-06 (+) 2.13 --- (-) 66.67
3 3451-00-090-08 (+) 3.52 --- (-) 8.59
4 10-Energy Department 2059-80-001-10 (+) 30.67 --- (-) 2,553.74
5 17-Commercial Tax Department 2040-00-001-04 (+) 200.00 --- (-) 320.78
6
19-Forest, Environment and
Climate Change Department
2406-01-001-01 (+) 1.47 --- (-) 500.38
7 2406-01-101-01 (+) 2.00 --- (-) 3,442.18
8 3451-00-090-06 (+) 3.53 --- (-) 67.57
9
20-Health, Medical Education
and Family Welfare Department
2210-01-110-13 (+) 220.63 --- (-) 1,589.45
10 2210-03-101-02 (+) 300.00 --- (-) 982.22
11 2210-03-103-01 (+) 450.00 --- (-) 2,914.35
12 22-Home, Jail and Disaster
Management Department (Home
Division)
2055-00-001-04 (+) 5.00 --- (-) 238.21
13 2055-00-114-01 (+) 20.00 --- (-) 83.65
14 2056-00-001-01 (+) 12.40 --- (-) 209.39
15 30-Welfare Department
(Minorities Welfare Division) 2251-00-090-13 (+) 3.84 --- (-) 16.86
16 32-Legislative Assembly 2011-02-103-01 (+) 8.00 --- (-) 255.55
17 48-Urban Development and
Housing Department 2217-80-191-89 (+) 300.00 --- (-) 911.42
18
52-Tourism, Art, Culture, Sports
and Youth Affairs Department
(Art, Culture, Sports and Youth
Affairs Division)
2205-00-796-39 (+) 45.00 --- (-) 66.97
Sub-Total 1,614.29 (-) 14,246. 81
19 22-Home, Jail and Disaster
Management Department (Home
Division)
2055-00-104-02 --- (-) 126.76 (+) 52.64
20 36-Drinking Water and
Sanitation Department 2215-01-101-01 --- (-) 3.50 (+) 0.37
Sub-Total (-) 130.26 (+) 53.01
21 17-Commercial Tax Department 2040-00-101-02 (+) 56.00 (-) 279.00 (-) 1547.12
22 22-Home, Jail and Disaster
Management Department (Home
Division)
2055-00-109-01 (+) 790.00 (-) 870.00 (-) 6,220.98
Sub-Total 846.00 (-)1,149.00 (-)7,768.10
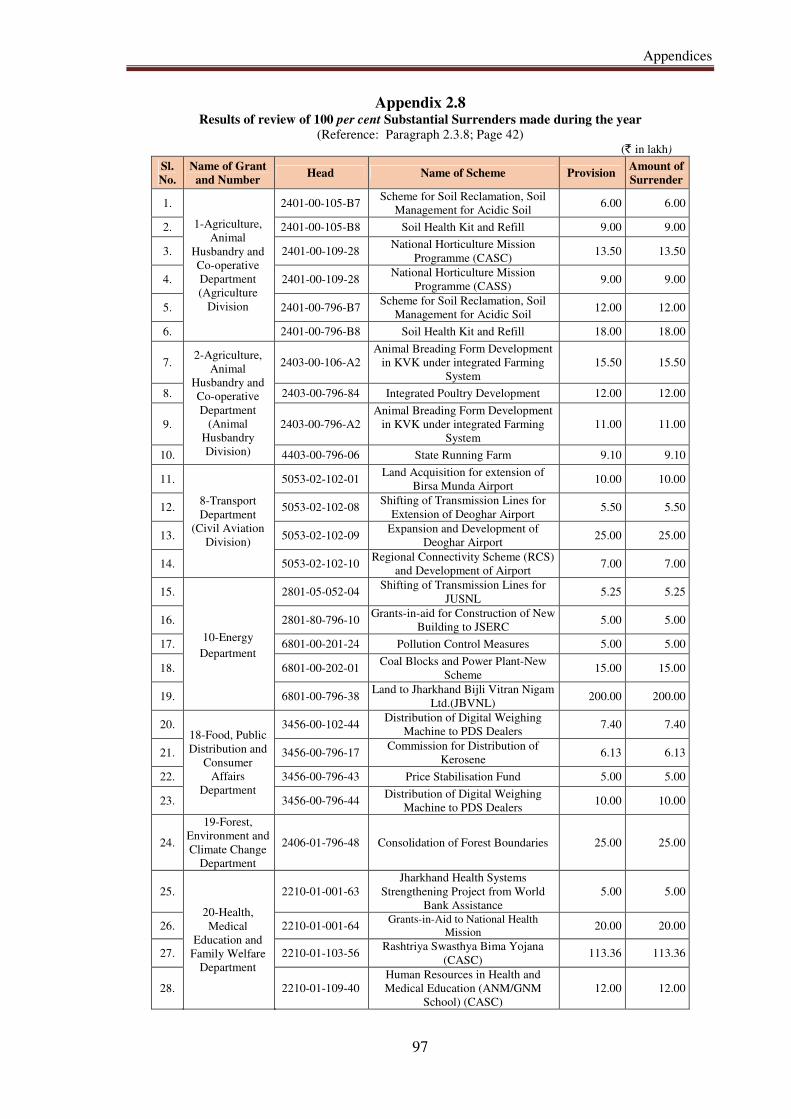
Appendices
97
Appendix 2.8 Results of review of 100 per cent Substantial Surrenders made during the year
(Reference: Paragraph 2.3.8; Page 42) (` in lakh)
Sl.
No.
Name of Grant
and Number Head Name of Scheme Provision
Amount of
Surrender
1.
1-Agriculture,
Animal
Husbandry and
Co-operative
Department
(Agriculture
Division
2401-00-105-B7 Scheme for Soil Reclamation, Soil
Management for Acidic Soil 6.00 6.00
2. 2401-00-105-B8 Soil Health Kit and Refill 9.00 9.00
3. 2401-00-109-28 National Horticulture Mission
Programme (CASC) 13.50 13.50
4. 2401-00-109-28 National Horticulture Mission
Programme (CASS) 9.00 9.00
5. 2401-00-796-B7 Scheme for Soil Reclamation, Soil
Management for Acidic Soil 12.00 12.00
6. 2401-00-796-B8 Soil Health Kit and Refill 18.00 18.00
7. 2-Agriculture,
Animal
Husbandry and
Co-operative
Department
(Animal
Husbandry
Division)
2403-00-106-A2
Animal Breading Form Development
in KVK under integrated Farming
System
15.50 15.50
8. 2403-00-796-84 Integrated Poultry Development 12.00 12.00
9. 2403-00-796-A2
Animal Breading Form Development
in KVK under integrated Farming
System
11.00 11.00
10. 4403-00-796-06 State Running Farm 9.10 9.10
11.
8-Transport
Department
(Civil Aviation
Division)
5053-02-102-01 Land Acquisition for extension of
Birsa Munda Airport 10.00 10.00
12. 5053-02-102-08 Shifting of Transmission Lines for
Extension of Deoghar Airport 5.50 5.50
13. 5053-02-102-09 Expansion and Development of
Deoghar Airport 25.00 25.00
14. 5053-02-102-10 Regional Connectivity Scheme (RCS)
and Development of Airport 7.00 7.00
15.
10-Energy
Department
2801-05-052-04 Shifting of Transmission Lines for
JUSNL 5.25 5.25
16. 2801-80-796-10 Grants-in-aid for Construction of New
Building to JSERC 5.00 5.00
17. 6801-00-201-24 Pollution Control Measures 5.00 5.00
18. 6801-00-202-01 Coal Blocks and Power Plant-New
Scheme 15.00 15.00
19. 6801-00-796-38 Land to Jharkhand Bijli Vitran Nigam
Ltd.(JBVNL) 200.00 200.00
20. 18-Food, Public
Distribution and
Consumer
Affairs
Department
3456-00-102-44 Distribution of Digital Weighing
Machine to PDS Dealers 7.40 7.40
21. 3456-00-796-17 Commission for Distribution of
Kerosene 6.13 6.13
22. 3456-00-796-43 Price Stabilisation Fund 5.00 5.00
23. 3456-00-796-44 Distribution of Digital Weighing
Machine to PDS Dealers 10.00 10.00
24.
19-Forest,
Environment and
Climate Change
Department
2406-01-796-48 Consolidation of Forest Boundaries 25.00 25.00
25.
20-Health,
Medical
Education and
Family Welfare
Department
2210-01-001-63
Jharkhand Health Systems
Strengthening Project from World
Bank Assistance
5.00 5.00
26. 2210-01-001-64 Grants-in-Aid to National Health
Mission 20.00 20.00
27. 2210-01-103-56 Rashtriya Swasthya Bima Yojana
(CASC) 113.36 113.36
28. 2210-01-109-40
Human Resources in Health and
Medical Education (ANM/GNM
School) (CASC)
12.00 12.00
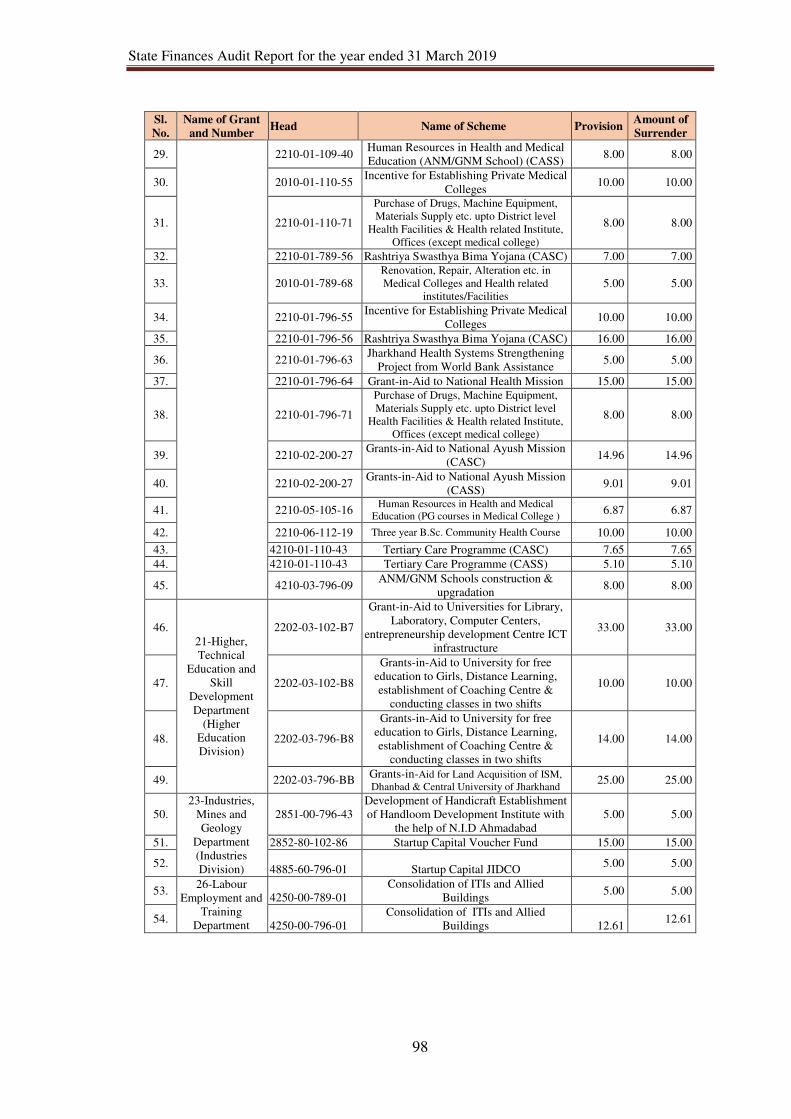
State Finances Audit Report for the year ended 31 March 2019
98
Sl.
No.
Name of Grant
and Number Head Name of Scheme Provision
Amount of
Surrender
29.
2210-01-109-40 Human Resources in Health and Medical
Education (ANM/GNM School) (CASS) 8.00 8.00
30. 2010-01-110-55 Incentive for Establishing Private Medical
Colleges 10.00 10.00
31. 2210-01-110-71
Purchase of Drugs, Machine Equipment,
Materials Supply etc. upto District level
Health Facilities & Health related Institute,
Offices (except medical college)
8.00 8.00
32. 2210-01-789-56 Rashtriya Swasthya Bima Yojana (CASC) 7.00 7.00
33. 2010-01-789-68 Renovation, Repair, Alteration etc. in
Medical Colleges and Health related
institutes/Facilities 5.00 5.00
34. 2210-01-796-55 Incentive for Establishing Private Medical
Colleges 10.00 10.00
35. 2210-01-796-56 Rashtriya Swasthya Bima Yojana (CASC) 16.00 16.00
36. 2210-01-796-63 Jharkhand Health Systems Strengthening
Project from World Bank Assistance 5.00 5.00
37. 2210-01-796-64 Grant-in-Aid to National Health Mission 15.00 15.00
38. 2210-01-796-71
Purchase of Drugs, Machine Equipment,
Materials Supply etc. upto District level
Health Facilities & Health related Institute,
Offices (except medical college)
8.00 8.00
39. 2210-02-200-27 Grants-in-Aid to National Ayush Mission
(CASC) 14.96 14.96
40. 2210-02-200-27 Grants-in-Aid to National Ayush Mission
(CASS) 9.01 9.01
41. 2210-05-105-16 Human Resources in Health and Medical
Education (PG courses in Medical College ) 6.87 6.87
42. 2210-06-112-19 Three year B.Sc. Community Health Course 10.00 10.00
43. 4210-01-110-43 Tertiary Care Programme (CASC) 7.65 7.65
44. 4210-01-110-43 Tertiary Care Programme (CASS) 5.10 5.10
45. 4210-03-796-09 ANM/GNM Schools construction &
upgradation 8.00 8.00
46.
21-Higher,
Technical
Education and
Skill
Development
Department
(Higher
Education
Division)
2202-03-102-B7
Grant-in-Aid to Universities for Library,
Laboratory, Computer Centers,
entrepreneurship development Centre ICT
infrastructure
33.00 33.00
47. 2202-03-102-B8
Grants-in-Aid to University for free
education to Girls, Distance Learning,
establishment of Coaching Centre &
conducting classes in two shifts
10.00 10.00
48. 2202-03-796-B8
Grants-in-Aid to University for free
education to Girls, Distance Learning,
establishment of Coaching Centre &
conducting classes in two shifts
14.00 14.00
49. 2202-03-796-BB Grants-in-Aid for Land Acquisition of ISM,
Dhanbad & Central University of Jharkhand 25.00 25.00
50.
23-Industries,
Mines and
Geology
Department
(Industries
Division)
2851-00-796-43
Development of Handicraft Establishment
of Handloom Development Institute with
the help of N.I.D Ahmadabad
5.00 5.00
51. 2852-80-102-86 Startup Capital Voucher Fund 15.00 15.00
52. 4885-60-796-01 Startup Capital JIDCO
5.00 5.00
53. 26-Labour
Employment and
Training
Department
4250-00-789-01
Consolidation of ITIs and Allied
Buildings 5.00 5.00
54. 4250-00-796-01
Consolidation of ITIs and Allied
Buildings 12.61 12.61
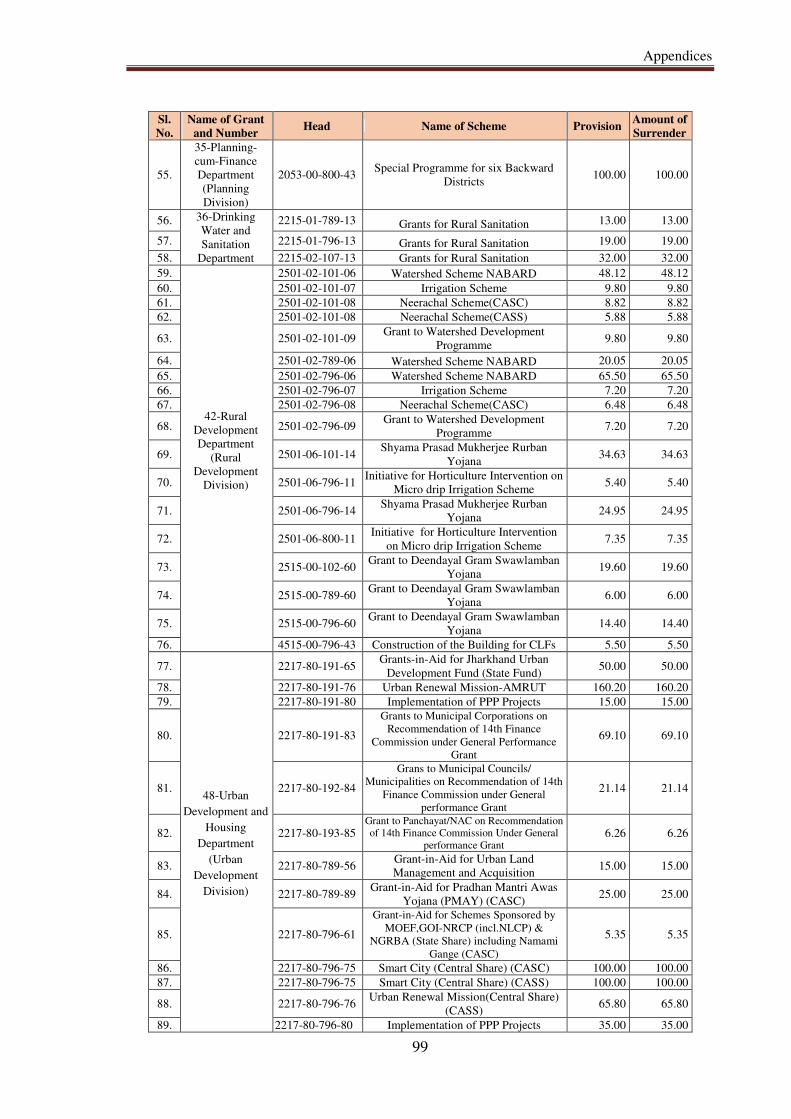
Appendices
99
Sl.
No.
Name of Grant
and Number Head Name of Scheme Provision
Amount of
Surrender
55.
35-Planning-
cum-Finance
Department
(Planning
Division)
2053-00-800-43 Special Programme for six Backward
Districts 100.00 100.00
56. 36-Drinking
Water and
Sanitation
Department
2215-01-789-13 Grants for Rural Sanitation 13.00 13.00
57. 2215-01-796-13 Grants for Rural Sanitation 19.00 19.00
58. 2215-02-107-13 Grants for Rural Sanitation 32.00 32.00
59.
42-Rural
Development
Department
(Rural
Development
Division)
2501-02-101-06 Watershed Scheme NABARD 48.12 48.12
60. 2501-02-101-07 Irrigation Scheme 9.80 9.80
61. 2501-02-101-08 Neerachal Scheme(CASC) 8.82 8.82
62. 2501-02-101-08 Neerachal Scheme(CASS) 5.88 5.88
63. 2501-02-101-09 Grant to Watershed Development
Programme 9.80 9.80
64. 2501-02-789-06 Watershed Scheme NABARD 20.05 20.05
65. 2501-02-796-06 Watershed Scheme NABARD 65.50 65.50
66. 2501-02-796-07 Irrigation Scheme 7.20 7.20
67. 2501-02-796-08 Neerachal Scheme(CASC) 6.48 6.48
68. 2501-02-796-09 Grant to Watershed Development
Programme 7.20 7.20
69. 2501-06-101-14 Shyama Prasad Mukherjee Rurban
Yojana 34.63 34.63
70. 2501-06-796-11 Initiative for Horticulture Intervention on
Micro drip Irrigation Scheme 5.40 5.40
71. 2501-06-796-14 Shyama Prasad Mukherjee Rurban
Yojana 24.95 24.95
72. 2501-06-800-11 Initiative for Horticulture Intervention
on Micro drip Irrigation Scheme 7.35 7.35
73. 2515-00-102-60 Grant to Deendayal Gram Swawlamban
Yojana 19.60 19.60
74. 2515-00-789-60 Grant to Deendayal Gram Swawlamban
Yojana 6.00 6.00
75. 2515-00-796-60 Grant to Deendayal Gram Swawlamban
Yojana 14.40 14.40
76. 4515-00-796-43 Construction of the Building for CLFs 5.50 5.50
77.
48-Urban
Development and
Housing
Department
(Urban
Development
Division)
2217-80-191-65 Grants-in-Aid for Jharkhand Urban
Development Fund (State Fund) 50.00 50.00
78. 2217-80-191-76 Urban Renewal Mission-AMRUT 160.20 160.20
79. 2217-80-191-80 Implementation of PPP Projects 15.00 15.00
80. 2217-80-191-83
Grants to Municipal Corporations on
Recommendation of 14th Finance
Commission under General Performance
Grant
69.10 69.10
81. 2217-80-192-84
Grans to Municipal Councils/
Municipalities on Recommendation of 14th
Finance Commission under General
performance Grant
21.14 21.14
82. 2217-80-193-85 Grant to Panchayat/NAC on Recommendation
of 14th Finance Commission Under General
performance Grant 6.26 6.26
83. 2217-80-789-56 Grant-in-Aid for Urban Land
Management and Acquisition 15.00 15.00
84. 2217-80-789-89 Grant-in-Aid for Pradhan Mantri Awas
Yojana (PMAY) (CASC) 25.00 25.00
85. 2217-80-796-61
Grant-in-Aid for Schemes Sponsored by
MOEF,GOI-NRCP (incl.NLCP) &
NGRBA (State Share) including Namami
Gange (CASC)
5.35 5.35
86. 2217-80-796-75 Smart City (Central Share) (CASC) 100.00 100.00
87. 2217-80-796-75 Smart City (Central Share) (CASS) 100.00 100.00
88. 2217-80-796-76 Urban Renewal Mission(Central Share)
(CASS) 65.80 65.80
89. 2217-80-796-80 Implementation of PPP Projects 35.00 35.00
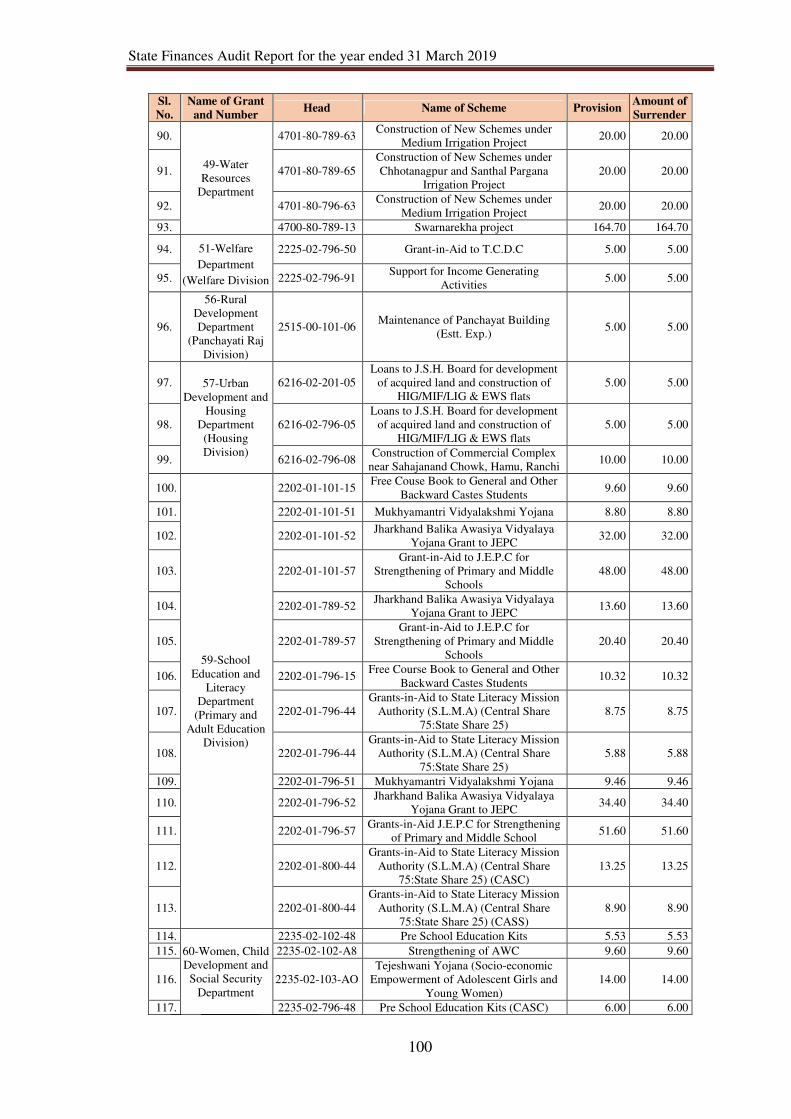
State Finances Audit Report for the year ended 31 March 2019
100
Sl.
No.
Name of Grant
and Number Head Name of Scheme Provision
Amount of
Surrender
90.
49-Water
Resources
Department
4701-80-789-63 Construction of New Schemes under
Medium Irrigation Project 20.00 20.00
91. 4701-80-789-65
Construction of New Schemes under
Chhotanagpur and Santhal Pargana
Irrigation Project
20.00 20.00
92. 4701-80-796-63 Construction of New Schemes under
Medium Irrigation Project 20.00 20.00
93. 4700-80-789-13 Swarnarekha project 164.70 164.70
94. 51-Welfare
Department
(Welfare Division
2225-02-796-50 Grant-in-Aid to T.C.D.C 5.00 5.00
95. 2225-02-796-91 Support for Income Generating
Activities 5.00 5.00
96.
56-Rural
Development
Department
(Panchayati Raj
Division)
2515-00-101-06 Maintenance of Panchayat Building
(Estt. Exp.) 5.00 5.00
97. 57-Urban
Development and
Housing
Department
(Housing
Division)
6216-02-201-05
Loans to J.S.H. Board for development
of acquired land and construction of
HIG/MIF/LIG & EWS flats
5.00 5.00
98. 6216-02-796-05
Loans to J.S.H. Board for development
of acquired land and construction of
HIG/MIF/LIG & EWS flats
5.00 5.00
99. 6216-02-796-08 Construction of Commercial Complex
near Sahajanand Chowk, Hamu, Ranchi 10.00 10.00
100.
59-School
Education and
Literacy
Department
(Primary and
Adult Education
Division)
2202-01-101-15 Free Couse Book to General and Other
Backward Castes Students 9.60 9.60
101. 2202-01-101-51 Mukhyamantri Vidyalakshmi Yojana 8.80 8.80
102. 2202-01-101-52 Jharkhand Balika Awasiya Vidyalaya
Yojana Grant to JEPC 32.00 32.00
103. 2202-01-101-57
Grant-in-Aid to J.E.P.C for
Strengthening of Primary and Middle
Schools
48.00 48.00
104. 2202-01-789-52 Jharkhand Balika Awasiya Vidyalaya
Yojana Grant to JEPC 13.60 13.60
105. 2202-01-789-57
Grant-in-Aid to J.E.P.C for
Strengthening of Primary and Middle
Schools
20.40 20.40
106. 2202-01-796-15 Free Course Book to General and Other
Backward Castes Students 10.32 10.32
107. 2202-01-796-44
Grants-in-Aid to State Literacy Mission
Authority (S.L.M.A) (Central Share
75:State Share 25)
8.75 8.75
108. 2202-01-796-44
Grants-in-Aid to State Literacy Mission
Authority (S.L.M.A) (Central Share
75:State Share 25)
5.88 5.88
109. 2202-01-796-51 Mukhyamantri Vidyalakshmi Yojana 9.46 9.46
110. 2202-01-796-52 Jharkhand Balika Awasiya Vidyalaya
Yojana Grant to JEPC 34.40 34.40
111. 2202-01-796-57 Grants-in-Aid J.E.P.C for Strengthening
of Primary and Middle School 51.60 51.60
112. 2202-01-800-44
Grants-in-Aid to State Literacy Mission
Authority (S.L.M.A) (Central Share
75:State Share 25) (CASC)
13.25 13.25
113. 2202-01-800-44
Grants-in-Aid to State Literacy Mission
Authority (S.L.M.A) (Central Share
75:State Share 25) (CASS)
8.90 8.90
114.
60-Women, Child
Development and
Social Security
Department
2235-02-102-48 Pre School Education Kits 5.53 5.53
115. 2235-02-102-A8 Strengthening of AWC 9.60 9.60
116. 2235-02-103-AO
Tejeshwani Yojana (Socio-economic
Empowerment of Adolescent Girls and
Young Women)
14.00 14.00
117. 2235-02-796-48 Pre School Education Kits (CASC) 6.00 6.00
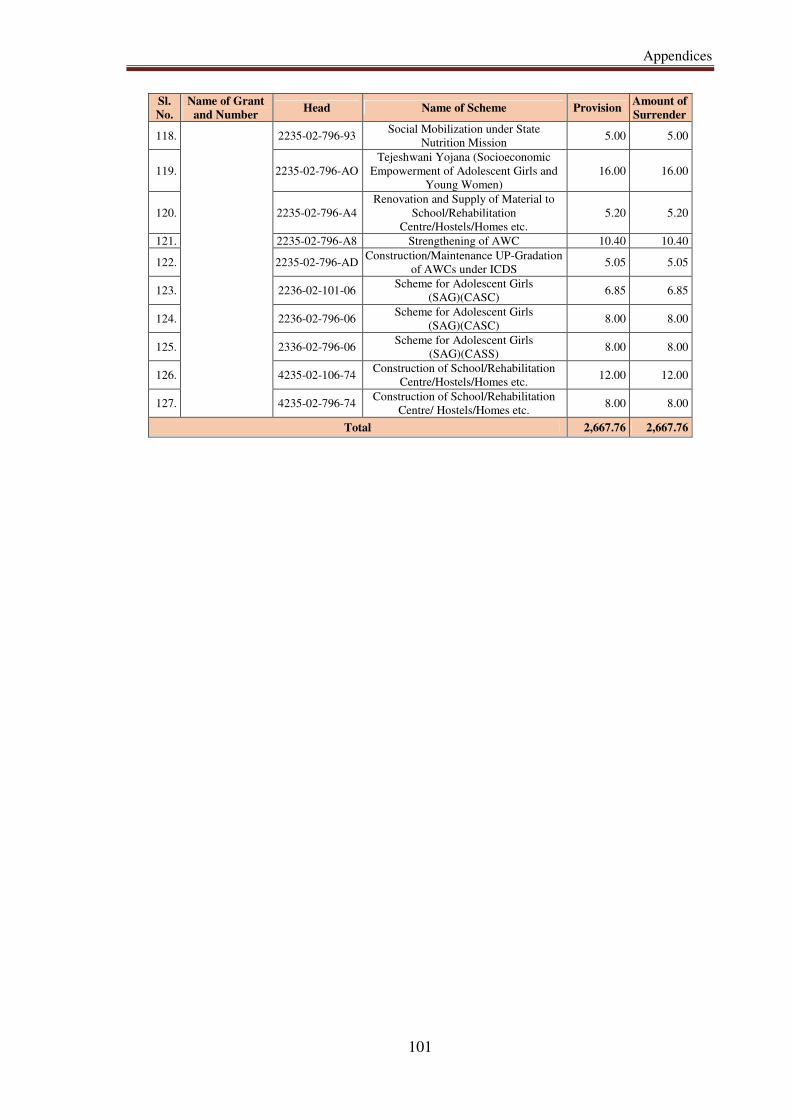
Appendices
101
Sl.
No.
Name of Grant
and Number Head Name of Scheme Provision
Amount of
Surrender
118.
2235-02-796-93 Social Mobilization under State
Nutrition Mission 5.00 5.00
119. 2235-02-796-AO
Tejeshwani Yojana (Socioeconomic
Empowerment of Adolescent Girls and
Young Women)
16.00 16.00
120. 2235-02-796-A4
Renovation and Supply of Material to
School/Rehabilitation
Centre/Hostels/Homes etc.
5.20 5.20
121. 2235-02-796-A8 Strengthening of AWC 10.40 10.40
122. 2235-02-796-AD Construction/Maintenance UP-Gradation
of AWCs under ICDS 5.05 5.05
123. 2236-02-101-06 Scheme for Adolescent Girls
(SAG)(CASC) 6.85 6.85
124. 2236-02-796-06 Scheme for Adolescent Girls
(SAG)(CASC) 8.00 8.00
125. 2336-02-796-06 Scheme for Adolescent Girls
(SAG)(CASS) 8.00 8.00
126. 4235-02-106-74 Construction of School/Rehabilitation
Centre/Hostels/Homes etc. 12.00 12.00
127. 4235-02-796-74 Construction of School/Rehabilitation
Centre/ Hostels/Homes etc. 8.00 8.00
Total 2,667.76 2,667.76
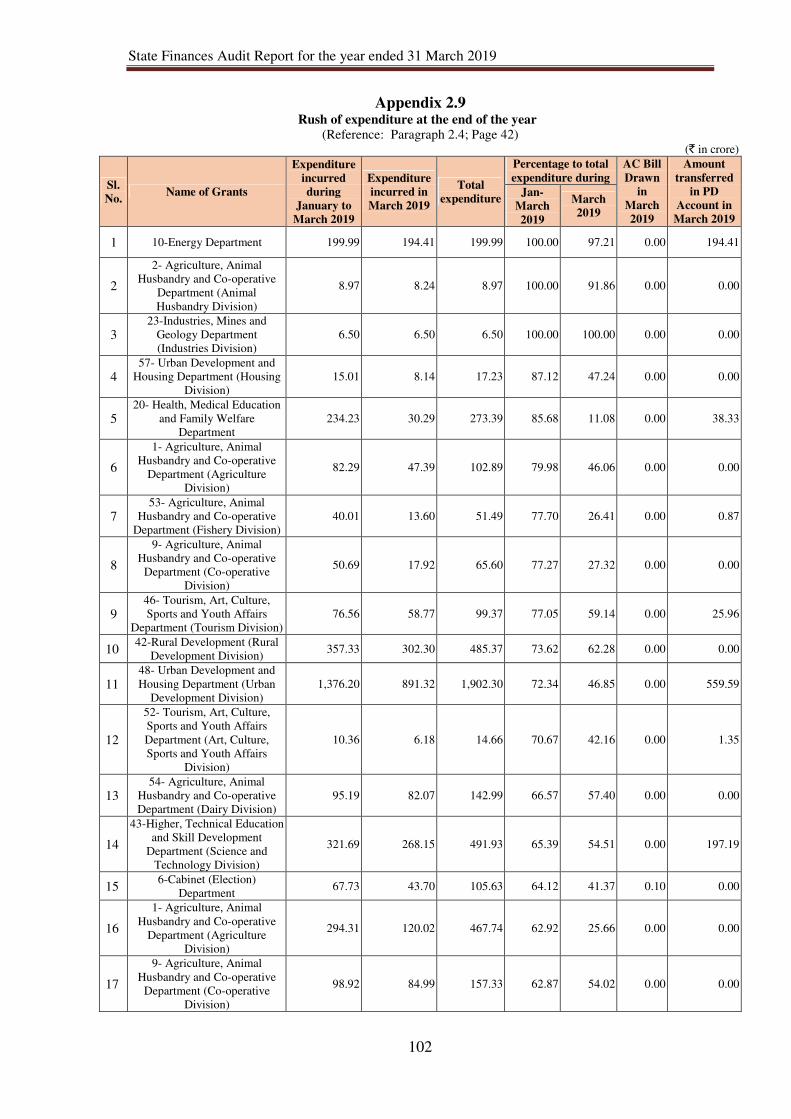
State Finances Audit Report for the year ended 31 March 2019
102
Appendix 2.9 Rush of expenditure at the end of the year
(Reference: Paragraph 2.4; Page 42) (` in crore)
Sl.
No. Name of Grants
Expenditure
incurred
during
January to
March 2019
Expenditure
incurred in
March 2019
Total
expenditure
Percentage to total
expenditure during
AC Bill
Drawn
in
March
2019
Amount
transferred
in PD
Account in
March 2019
Jan-
March
2019
March
2019
1 10-Energy Department 199.99 194.41 199.99 100.00 97.21 0.00 194.41
2
2- Agriculture, Animal
Husbandry and Co-operative
Department (Animal
Husbandry Division)
8.97 8.24 8.97 100.00 91.86 0.00 0.00
3
23-Industries, Mines and
Geology Department
(Industries Division)
6.50 6.50 6.50 100.00 100.00 0.00 0.00
4
57- Urban Development and
Housing Department (Housing
Division)
15.01 8.14 17.23 87.12 47.24 0.00 0.00
5
20- Health, Medical Education
and Family Welfare
Department
234.23 30.29 273.39 85.68 11.08 0.00 38.33
6
1- Agriculture, Animal
Husbandry and Co-operative
Department (Agriculture
Division)
82.29 47.39 102.89 79.98 46.06 0.00 0.00
7
53- Agriculture, Animal
Husbandry and Co-operative
Department (Fishery Division)
40.01 13.60 51.49 77.70 26.41 0.00 0.87
8
9- Agriculture, Animal
Husbandry and Co-operative
Department (Co-operative
Division)
50.69 17.92 65.60 77.27 27.32 0.00 0.00
9
46- Tourism, Art, Culture,
Sports and Youth Affairs
Department (Tourism Division)
76.56 58.77 99.37 77.05 59.14 0.00 25.96
10 42-Rural Development (Rural
Development Division) 357.33 302.30 485.37 73.62 62.28 0.00 0.00
11
48- Urban Development and
Housing Department (Urban
Development Division)
1,376.20 891.32 1,902.30 72.34 46.85 0.00 559.59
12
52- Tourism, Art, Culture,
Sports and Youth Affairs
Department (Art, Culture,
Sports and Youth Affairs
Division)
10.36 6.18 14.66 70.67 42.16 0.00 1.35
13
54- Agriculture, Animal
Husbandry and Co-operative
Department (Dairy Division)
95.19 82.07 142.99 66.57 57.40 0.00 0.00
14
43-Higher, Technical Education
and Skill Development
Department (Science and
Technology Division)
321.69 268.15 491.93 65.39 54.51 0.00 197.19
15 6-Cabinet (Election)
Department 67.73 43.70 105.63 64.12 41.37 0.10 0.00
16
1- Agriculture, Animal
Husbandry and Co-operative
Department (Agriculture
Division)
294.31 120.02 467.74 62.92 25.66 0.00 0.00
17
9- Agriculture, Animal
Husbandry and Co-operative
Department (Co-operative
Division)
98.92 84.99 157.33 62.87 54.02 0.00 0.00
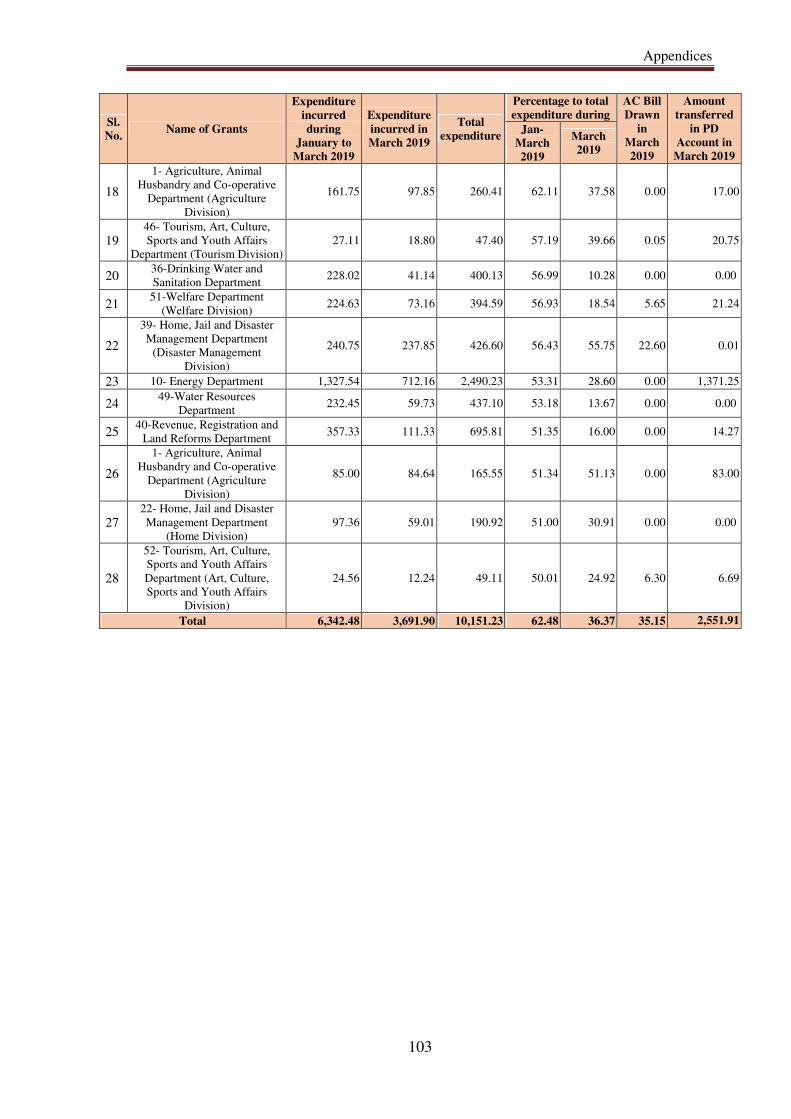
Appendices
103
Sl.
No. Name of Grants
Expenditure
incurred
during
January to
March 2019
Expenditure
incurred in
March 2019
Total
expenditure
Percentage to total
expenditure during
AC Bill
Drawn
in
March
2019
Amount
transferred
in PD
Account in
March 2019
Jan-
March
2019
March
2019
18
1- Agriculture, Animal
Husbandry and Co-operative
Department (Agriculture
Division)
161.75 97.85 260.41 62.11 37.58 0.00 17.00
19
46- Tourism, Art, Culture,
Sports and Youth Affairs
Department (Tourism Division)
27.11 18.80 47.40 57.19 39.66 0.05 20.75
20 36-Drinking Water and
Sanitation Department 228.02 41.14 400.13 56.99 10.28 0.00 0.00
21 51-Welfare Department
(Welfare Division) 224.63 73.16 394.59 56.93 18.54 5.65 21.24
22
39- Home, Jail and Disaster
Management Department
(Disaster Management
Division)
240.75 237.85 426.60 56.43 55.75 22.60 0.01
23 10- Energy Department 1,327.54 712.16 2,490.23 53.31 28.60 0.00 1,371.25
24 49-Water Resources
Department 232.45 59.73 437.10 53.18 13.67 0.00 0.00
25 40-Revenue, Registration and
Land Reforms Department 357.33 111.33 695.81 51.35 16.00 0.00 14.27
26
1- Agriculture, Animal
Husbandry and Co-operative
Department (Agriculture
Division)
85.00 84.64 165.55 51.34 51.13 0.00 83.00
27
22- Home, Jail and Disaster
Management Department
(Home Division)
97.36 59.01 190.92 51.00 30.91 0.00 0.00
28
52- Tourism, Art, Culture,
Sports and Youth Affairs
Department (Art, Culture,
Sports and Youth Affairs
Division)
24.56 12.24 49.11 50.01 24.92 6.30 6.69
Total 6,342.48 3,691.90 10,151.23 62.48 36.37 35.15 2,551.91
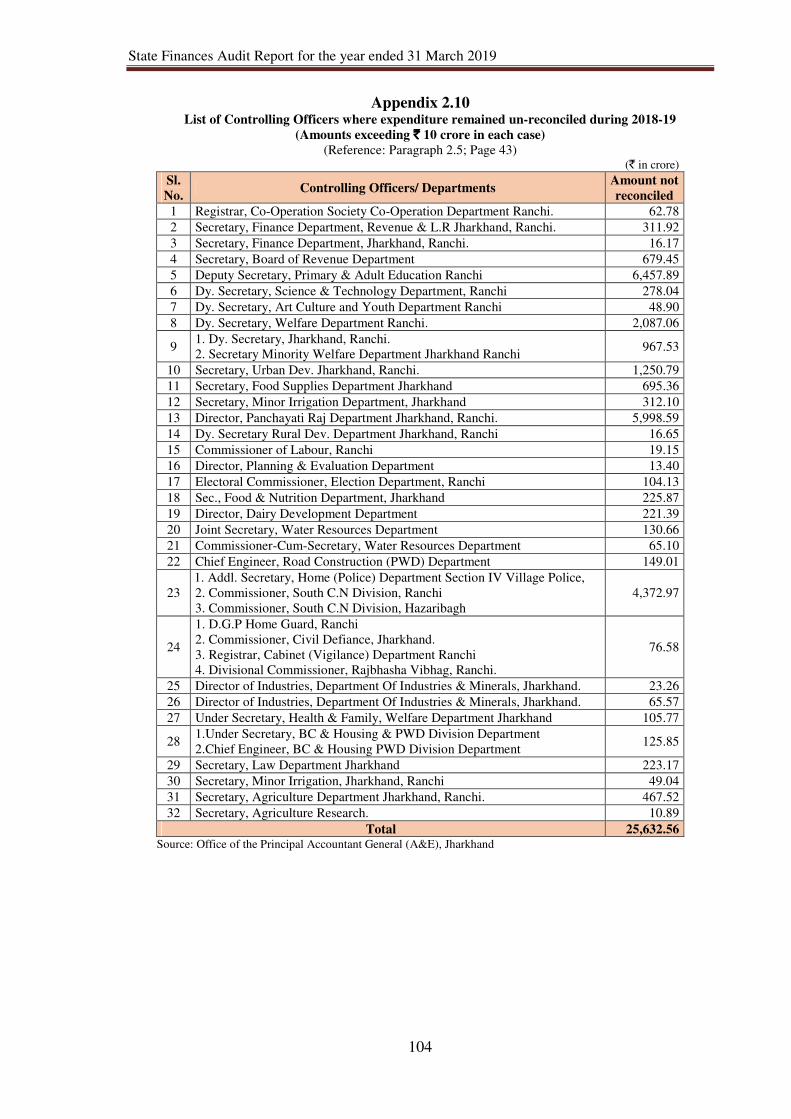
State Finances Audit Report for the year ended 31 March 2019
104
Appendix 2.10 List of Controlling Officers where expenditure remained un-reconciled during 2018-19
(Amounts exceeding `̀̀̀ 10 crore in each case)
(Reference: Paragraph 2.5; Page 43) (` in crore)
Sl.
No. Controlling Officers/ Departments
Amount not
reconciled
1 Registrar, Co-Operation Society Co-Operation Department Ranchi. 62.78
2 Secretary, Finance Department, Revenue & L.R Jharkhand, Ranchi. 311.92
3 Secretary, Finance Department, Jharkhand, Ranchi. 16.17
4 Secretary, Board of Revenue Department 679.45
5 Deputy Secretary, Primary & Adult Education Ranchi 6,457.89
6 Dy. Secretary, Science & Technology Department, Ranchi 278.04
7 Dy. Secretary, Art Culture and Youth Department Ranchi 48.90
8 Dy. Secretary, Welfare Department Ranchi. 2,087.06
9 1. Dy. Secretary, Jharkhand, Ranchi.
2. Secretary Minority Welfare Department Jharkhand Ranchi 967.53
10 Secretary, Urban Dev. Jharkhand, Ranchi. 1,250.79
11 Secretary, Food Supplies Department Jharkhand 695.36
12 Secretary, Minor Irrigation Department, Jharkhand 312.10
13 Director, Panchayati Raj Department Jharkhand, Ranchi. 5,998.59
14 Dy. Secretary Rural Dev. Department Jharkhand, Ranchi 16.65
15 Commissioner of Labour, Ranchi 19.15
16 Director, Planning & Evaluation Department 13.40
17 Electoral Commissioner, Election Department, Ranchi 104.13
18 Sec., Food & Nutrition Department, Jharkhand 225.87
19 Director, Dairy Development Department 221.39
20 Joint Secretary, Water Resources Department 130.66
21 Commissioner-Cum-Secretary, Water Resources Department 65.10
22 Chief Engineer, Road Construction (PWD) Department 149.01
23
1. Addl. Secretary, Home (Police) Department Section IV Village Police,
2. Commissioner, South C.N Division, Ranchi
3. Commissioner, South C.N Division, Hazaribagh
4,372.97
24
1. D.G.P Home Guard, Ranchi
2. Commissioner, Civil Defiance, Jharkhand.
3. Registrar, Cabinet (Vigilance) Department Ranchi
4. Divisional Commissioner, Rajbhasha Vibhag, Ranchi.
76.58
25 Director of Industries, Department Of Industries & Minerals, Jharkhand. 23.26
26 Director of Industries, Department Of Industries & Minerals, Jharkhand. 65.57
27 Under Secretary, Health & Family, Welfare Department Jharkhand 105.77
28 1.Under Secretary, BC & Housing & PWD Division Department
2.Chief Engineer, BC & Housing PWD Division Department 125.85
29 Secretary, Law Department Jharkhand 223.17
30 Secretary, Minor Irrigation, Jharkhand, Ranchi 49.04
31 Secretary, Agriculture Department Jharkhand, Ranchi. 467.52
32 Secretary, Agriculture Research. 10.89
Total 25,632.56 Source: Office of the Principal Accountant General (A&E), Jharkhand

Appendices
105
Appendix 2.11 Avoidable Supplementary Provision
(Reference: Paragraph 2.6.6; Page 45) (` in crore)
Sl.
No. Heads Sub-heads Original
Expenditure
during
2018-19
Savings
Supple-
mentary
Provision
1 2210-01-102-21 21-Employee State Insurance Scheme 18.17 17.72 0.45 0.03
2 2230-01-001-01 01-Labour Commissioner 4.69 3.36 1.33 0.23
3 2230-01-101-05 05-Labour Conciliation Board for
Industrial Disputes 3.44 2.80 0.64 0.05
4 2230-01-101-06 06-Enforcement & Administration of
Labour Laws 5.63 4.74 0.89 0.40
5 2230-01-101-07 07-Implementation of Minimum Wages
Act in Agriculture 8.89 7.50 1.39 0.26
6 2230-01-102-01 01-Inspector of Steam Boiler 0.71 0.68 0.03 0.20
7 2230-01-102-02 02-Inspector of Factories 6.17 5.49 0.68 0.95
8 2230-01-103-01 01-Education, Health & Entertainment 2.85 2.14 0.71 0.10
9 2230-03-003-05 05-Establishment of Headquarter 0.41 0.40 0.01 0.05
10 2251-00-090-08 08-Labour, Employment & Training
Department 3.02 2.93 0.09 0.07
11 4250-00-203-04 04-Scheme for Skilled Development of
Youth in LWE Districts 8.00 0.45 7.55 5.76
12 4250-00-203-04 04-Scheme for Skilled Development of
Youth in LWE Districts 4.00 0.30 3.70 5.51
13 4250-00-796-04 04-Scheme for Skilled Development of
Youth in LWE Districts 10.00 0.64 9.36 14.75
14 4250-00-796-04 04-Scheme for Skilled Development of
Youth in LWE Districts 8.00 1.03 6.97 8.67
Total 83.98 50.18 33.80 37.03
Source: Appropriation Accounts of the Government of Jharkhand for the year 2018-19
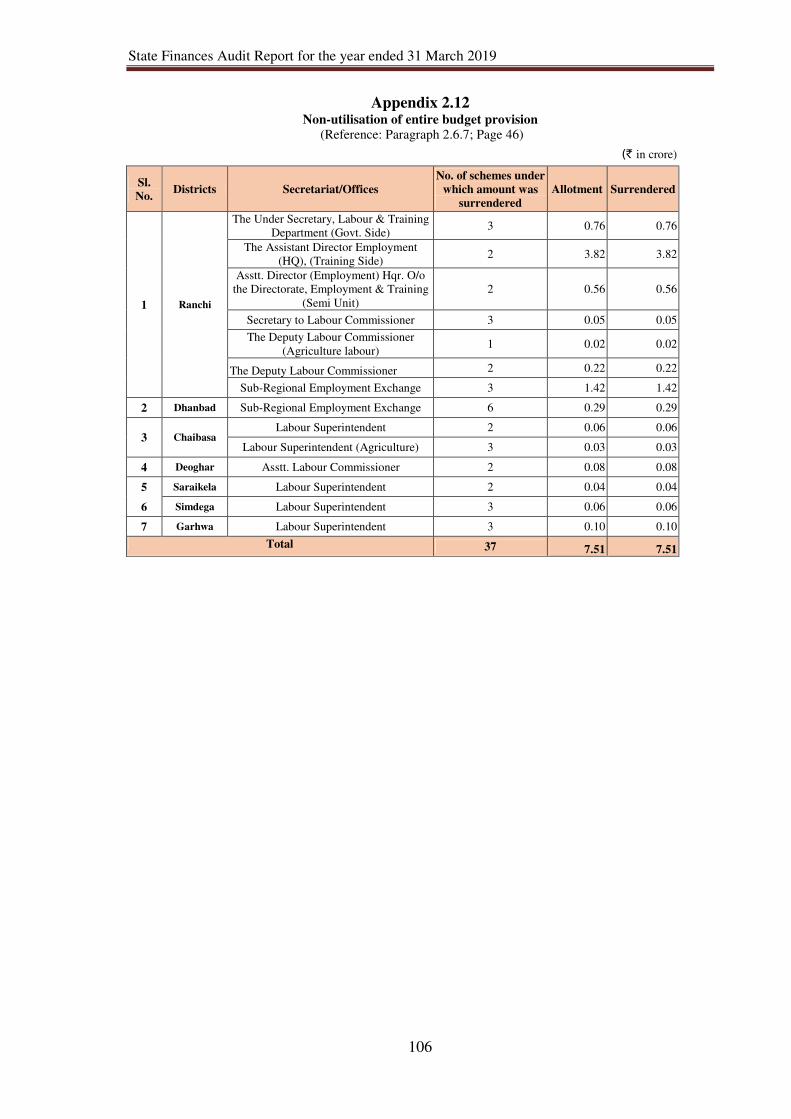
State Finances Audit Report for the year ended 31 March 2019
106
Appendix 2.12 Non-utilisation of entire budget provision
(Reference: Paragraph 2.6.7; Page 46)
(` in crore)
Sl.
No. Districts Secretariat/Offices
No. of schemes under
which amount was
surrendered
Allotment Surrendered
1 Ranchi
The Under Secretary, Labour & Training
Department (Govt. Side) 3 0.76 0.76
The Assistant Director Employment
(HQ), (Training Side) 2 3.82 3.82
Asstt. Director (Employment) Hqr. O/o
the Directorate, Employment & Training
(Semi Unit)
2 0.56 0.56
Secretary to Labour Commissioner 3 0.05 0.05
The Deputy Labour Commissioner
(Agriculture labour) 1 0.02 0.02
The Deputy Labour Commissioner 2 0.22 0.22
Sub-Regional Employment Exchange 3 1.42 1.42
2 Dhanbad Sub-Regional Employment Exchange 6 0.29 0.29
3 Chaibasa Labour Superintendent 2 0.06 0.06
Labour Superintendent (Agriculture) 3 0.03 0.03
4 Deoghar Asstt. Labour Commissioner 2 0.08 0.08
5 Saraikela Labour Superintendent 2 0.04 0.04
6 Simdega Labour Superintendent 3 0.06 0.06
7 Garhwa Labour Superintendent 3 0.10 0.10
Total 37 7.51 7.51
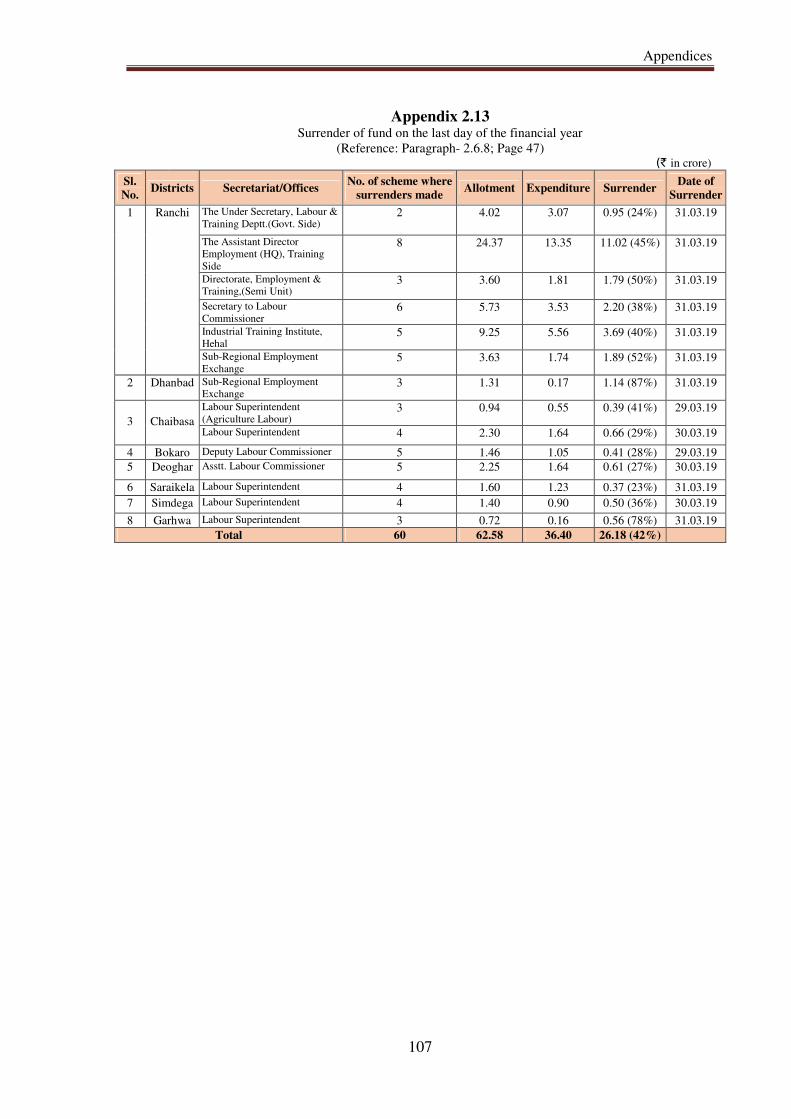
Appendices
107
Appendix 2.13 Surrender of fund on the last day of the financial year
(Reference: Paragraph- 2.6.8; Page 47) (` in crore)
Sl.
No. Districts Secretariat/Offices
No. of scheme where
surrenders made Allotment Expenditure Surrender
Date of
Surrender
1 Ranchi The Under Secretary, Labour &
Training Deptt.(Govt. Side) 2 4.02 3.07 0.95 (24%) 31.03.19
The Assistant Director
Employment (HQ), Training
Side
8 24.37 13.35 11.02 (45%) 31.03.19
Directorate, Employment &
Training,(Semi Unit) 3 3.60 1.81 1.79 (50%) 31.03.19
Secretary to Labour
Commissioner 6 5.73 3.53 2.20 (38%) 31.03.19
Industrial Training Institute,
Hehal 5 9.25 5.56 3.69 (40%) 31.03.19
Sub-Regional Employment
Exchange 5 3.63 1.74 1.89 (52%) 31.03.19
2 Dhanbad Sub-Regional Employment
Exchange 3 1.31 0.17 1.14 (87%) 31.03.19
3
Chaibasa
Labour Superintendent
(Agriculture Labour) 3 0.94 0.55 0.39 (41%) 29.03.19
Labour Superintendent 4 2.30 1.64 0.66 (29%) 30.03.19
4 Bokaro Deputy Labour Commissioner 5 1.46 1.05 0.41 (28%) 29.03.19
5 Deoghar Asstt. Labour Commissioner 5 2.25 1.64 0.61 (27%) 30.03.19
6 Saraikela Labour Superintendent 4 1.60 1.23 0.37 (23%) 31.03.19
7 Simdega Labour Superintendent 4 1.40 0.90 0.50 (36%) 30.03.19
8 Garhwa Labour Superintendent 3 0.72 0.16 0.56 (78%) 31.03.19
Total 60 62.58 36.40 26.18 (42%)
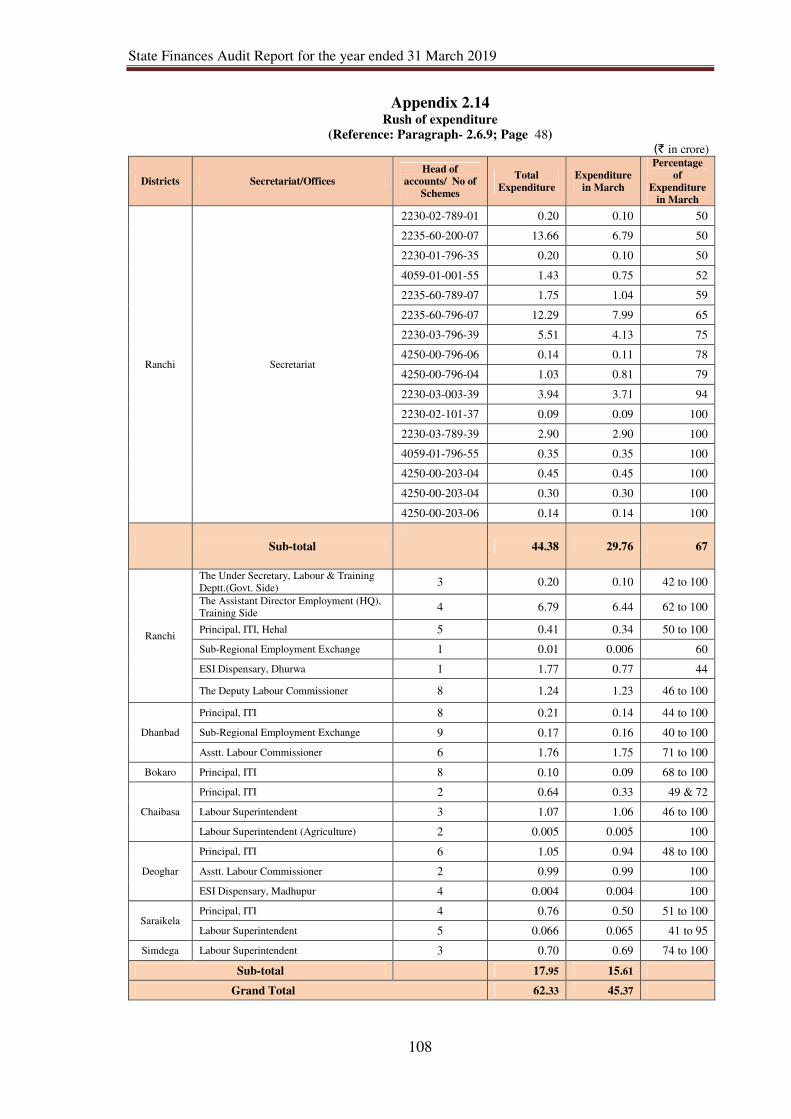
State Finances Audit Report for the year ended 31 March 2019
108
Appendix 2.14 Rush of expenditure
(Reference: Paragraph- 2.6.9; Page 48) (` in crore)
Districts Secretariat/Offices
Head of
accounts/ No of
Schemes
Total
Expenditure
Expenditure
in March
Percentage
of
Expenditure
in March
Ranchi Secretariat
2230-02-789-01 0.20 0.10 50
2235-60-200-07 13.66 6.79 50
2230-01-796-35 0.20 0.10 50
4059-01-001-55 1.43 0.75 52
2235-60-789-07 1.75 1.04 59
2235-60-796-07 12.29 7.99 65
2230-03-796-39 5.51 4.13 75
4250-00-796-06 0.14 0.11 78
4250-00-796-04 1.03 0.81 79
2230-03-003-39 3.94 3.71 94
2230-02-101-37 0.09 0.09 100
2230-03-789-39 2.90 2.90 100
4059-01-796-55 0.35 0.35 100
4250-00-203-04 0.45 0.45 100
4250-00-203-04 0.30 0.30 100
4250-00-203-06 0.14 0.14 100
Sub-total
44.38 29.76 67
Ranchi
The Under Secretary, Labour & Training
Deptt.(Govt. Side) 3 0.20 0.10 42 to 100
The Assistant Director Employment (HQ),
Training Side 4 6.79 6.44 62 to 100
Principal, ITI, Hehal 5 0.41 0.34 50 to 100
Sub-Regional Employment Exchange 1 0.01 0.006 60
ESI Dispensary, Dhurwa 1 1.77 0.77 44
The Deputy Labour Commissioner 8 1.24 1.23 46 to 100
Dhanbad
Principal, ITI 8 0.21 0.14 44 to 100
Sub-Regional Employment Exchange 9 0.17 0.16 40 to 100
Asstt. Labour Commissioner 6 1.76 1.75 71 to 100
Bokaro Principal, ITI 8 0.10 0.09 68 to 100
Chaibasa
Principal, ITI 2 0.64 0.33 49 & 72
Labour Superintendent 3 1.07 1.06 46 to 100
Labour Superintendent (Agriculture) 2 0.005 0.005 100
Deoghar
Principal, ITI 6 1.05 0.94 48 to 100
Asstt. Labour Commissioner 2 0.99 0.99 100
ESI Dispensary, Madhupur 4 0.004 0.004 100
Saraikela Principal, ITI 4 0.76 0.50 51 to 100
Labour Superintendent 5 0.066 0.065 41 to 95
Simdega Labour Superintendent 3 0.70 0.69 74 to 100
Sub-total
17.95 15.61
Grand Total 62.33 45.37
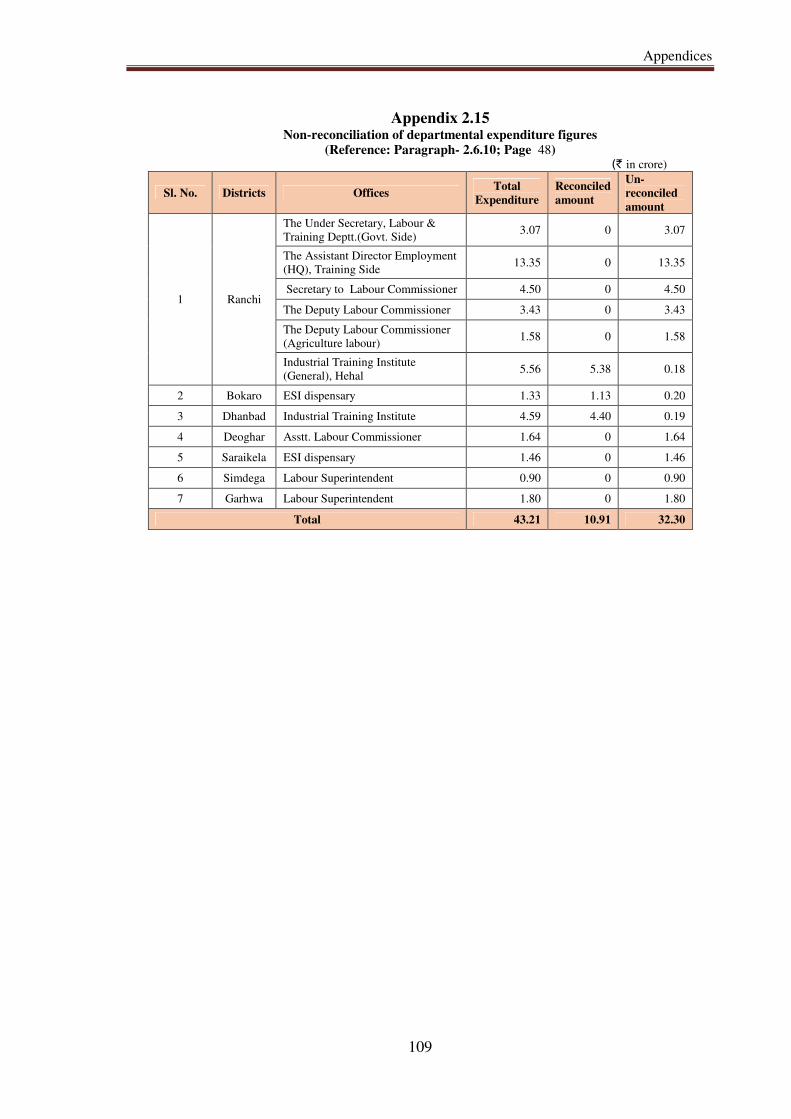
Appendices
109
Appendix 2.15 Non-reconciliation of departmental expenditure figures
(Reference: Paragraph- 2.6.10; Page 48) (` in crore)
Sl. No. Districts Offices Total
Expenditure
Reconciled
amount
Un-
reconciled
amount
1 Ranchi
The Under Secretary, Labour &
Training Deptt.(Govt. Side) 3.07 0 3.07
The Assistant Director Employment
(HQ), Training Side 13.35 0 13.35
Secretary to Labour Commissioner 4.50 0 4.50
The Deputy Labour Commissioner 3.43 0 3.43
The Deputy Labour Commissioner
(Agriculture labour) 1.58 0 1.58
Industrial Training Institute
(General), Hehal 5.56 5.38 0.18
2 Bokaro ESI dispensary 1.33 1.13 0.20
3 Dhanbad Industrial Training Institute 4.59 4.40 0.19
4 Deoghar Asstt. Labour Commissioner 1.64 0 1.64
5 Saraikela ESI dispensary 1.46 0 1.46
6 Simdega Labour Superintendent 0.90 0 0.90
7 Garhwa Labour Superintendent 1.80 0 1.80
Total 43.21 10.91 32.30
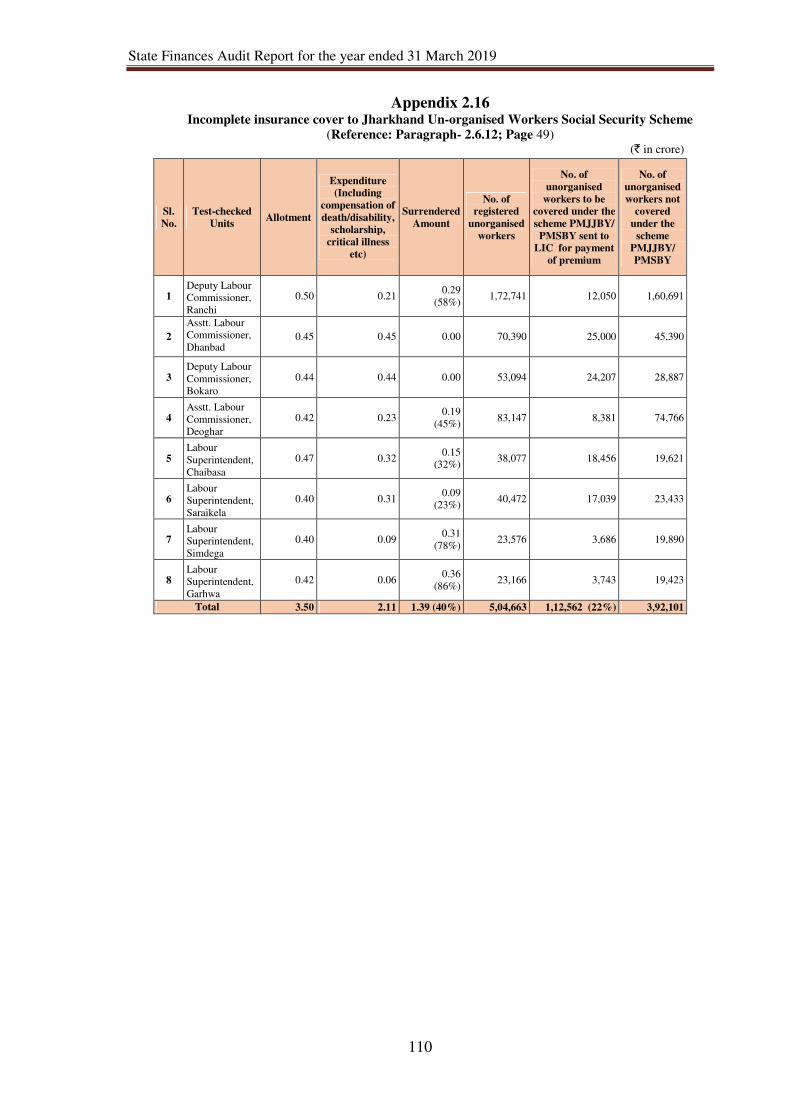
State Finances Audit Report for the year ended 31 March 2019
110
Appendix 2.16 Incomplete insurance cover to Jharkhand Un-organised Workers Social Security Scheme
(Reference: Paragraph- 2.6.12; Page 49) (` in crore)
Sl.
No.
Test-checked
Units Allotment
Expenditure
(Including
compensation of
death/disability,
scholarship,
critical illness
etc)
Surrendered
Amount
No. of
registered
unorganised
workers
No. of
unorganised
workers to be
covered under the
scheme PMJJBY/
PMSBY sent to
LIC for payment
of premium
No. of
unorganised
workers not
covered
under the
scheme
PMJJBY/
PMSBY
1 Deputy Labour
Commissioner,
Ranchi
0.50 0.21 0.29
(58%) 1,72,741 12,050 1,60,691
2
Asstt. Labour
Commissioner,
Dhanbad 0.45 0.45 0.00 70,390 25,000 45,390
3 Deputy Labour
Commissioner,
Bokaro
0.44 0.44 0.00 53,094 24,207 28,887
4 Asstt. Labour
Commissioner,
Deoghar
0.42 0.23 0.19
(45%) 83,147 8,381 74,766
5 Labour
Superintendent,
Chaibasa
0.47 0.32 0.15
(32%) 38,077 18,456 19,621
6 Labour
Superintendent,
Saraikela
0.40 0.31 0.09
(23%) 40,472 17,039 23,433
7 Labour
Superintendent,
Simdega
0.40 0.09 0.31
(78%) 23,576 3,686 19,890
8 Labour
Superintendent,
Garhwa
0.42 0.06 0.36
(86%) 23,166 3,743 19,423
Total 3.50 2.11 1.39 (40%) 5,04,663 1,12,562 (22%) 3,92,101
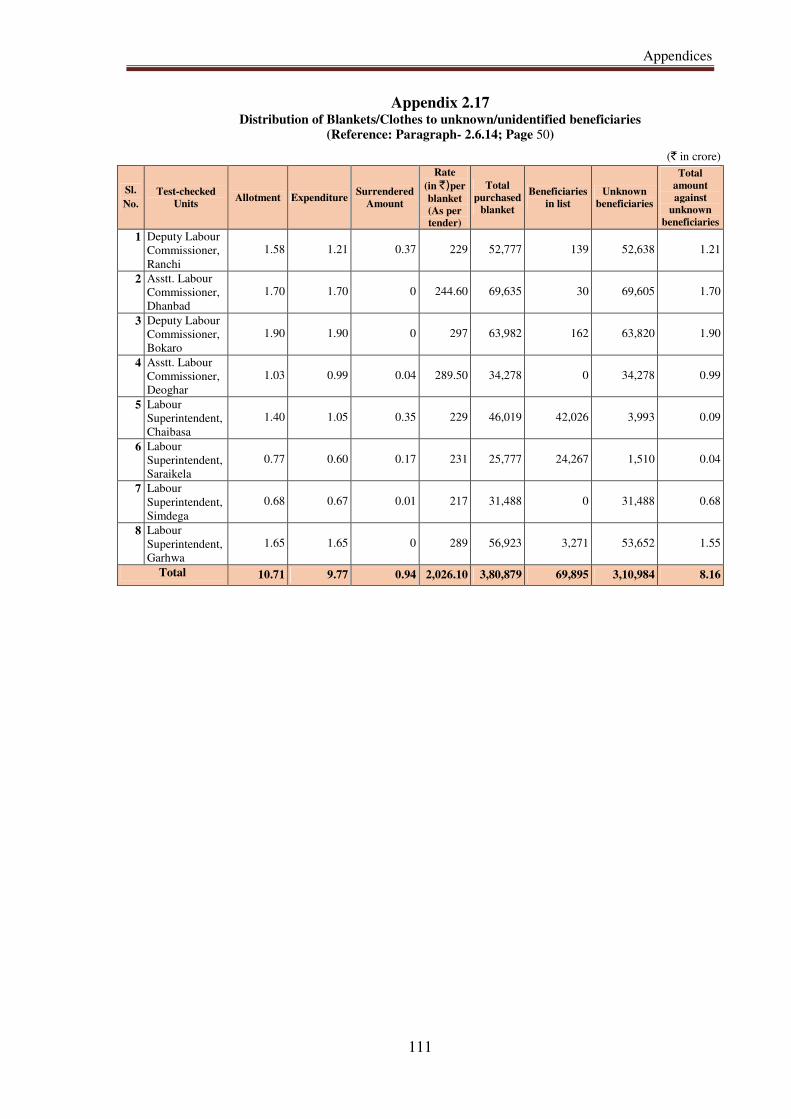
Appendices
111
Appendix 2.17 Distribution of Blankets/Clothes to unknown/unidentified beneficiaries
(Reference: Paragraph- 2.6.14; Page 50)
(` in crore)
Sl.
No.
Test-checked
Units Allotment Expenditure
Surrendered
Amount
Rate
(in `)per
blanket
(As per
tender)
Total
purchased
blanket
Beneficiaries
in list
Unknown
beneficiaries
Total
amount
against
unknown
beneficiaries
1 Deputy Labour
Commissioner,
Ranchi
1.58 1.21 0.37 229 52,777 139 52,638 1.21
2 Asstt. Labour
Commissioner,
Dhanbad
1.70 1.70 0 244.60 69,635 30 69,605 1.70
3 Deputy Labour
Commissioner,
Bokaro
1.90 1.90 0 297 63,982 162 63,820 1.90
4 Asstt. Labour
Commissioner,
Deoghar
1.03 0.99 0.04 289.50 34,278 0 34,278 0.99
5 Labour
Superintendent,
Chaibasa
1.40 1.05 0.35 229 46,019 42,026 3,993 0.09
6 Labour
Superintendent,
Saraikela
0.77 0.60 0.17 231 25,777 24,267 1,510 0.04
7 Labour
Superintendent,
Simdega
0.68 0.67 0.01 217 31,488 0 31,488 0.68
8 Labour
Superintendent,
Garhwa
1.65 1.65 0 289 56,923 3,271 53,652 1.55
Total 10.71 9.77 0.94 2,026.10 3,80,879 69,895 3,10,984 8.16
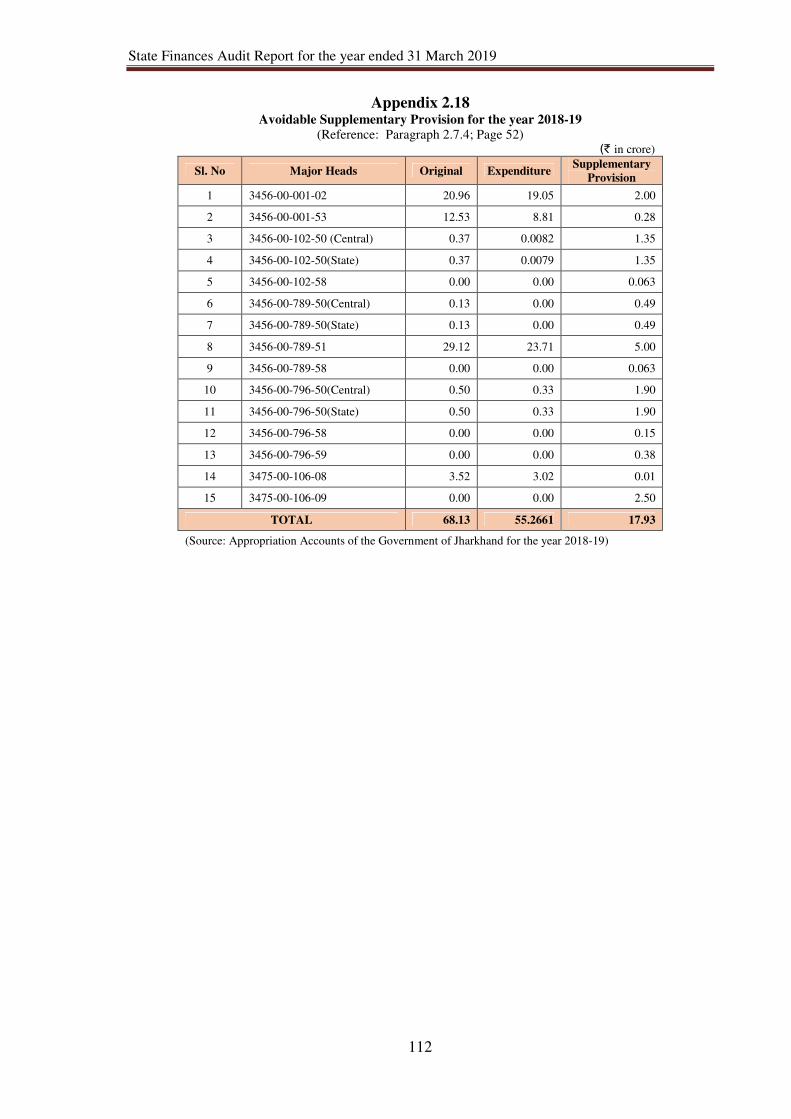
State Finances Audit Report for the year ended 31 March 2019
112
Appendix 2.18 Avoidable Supplementary Provision for the year 2018-19
(Reference: Paragraph 2.7.4; Page 52) (` in crore)
Sl. No Major Heads Original Expenditure Supplementary
Provision
1 3456-00-001-02 20.96 19.05 2.00
2 3456-00-001-53 12.53 8.81 0.28
3 3456-00-102-50 (Central) 0.37 0.0082 1.35
4 3456-00-102-50(State) 0.37 0.0079 1.35
5 3456-00-102-58 0.00 0.00 0.063
6 3456-00-789-50(Central) 0.13 0.00 0.49
7 3456-00-789-50(State) 0.13 0.00 0.49
8 3456-00-789-51 29.12 23.71 5.00
9 3456-00-789-58 0.00 0.00 0.063
10 3456-00-796-50(Central) 0.50 0.33 1.90
11 3456-00-796-50(State) 0.50 0.33 1.90
12 3456-00-796-58 0.00 0.00 0.15
13 3456-00-796-59 0.00 0.00 0.38
14 3475-00-106-08 3.52 3.02 0.01
15 3475-00-106-09 0.00 0.00 2.50
TOTAL 68.13 55.2661 17.93
(Source: Appropriation Accounts of the Government of Jharkhand for the year 2018-19)
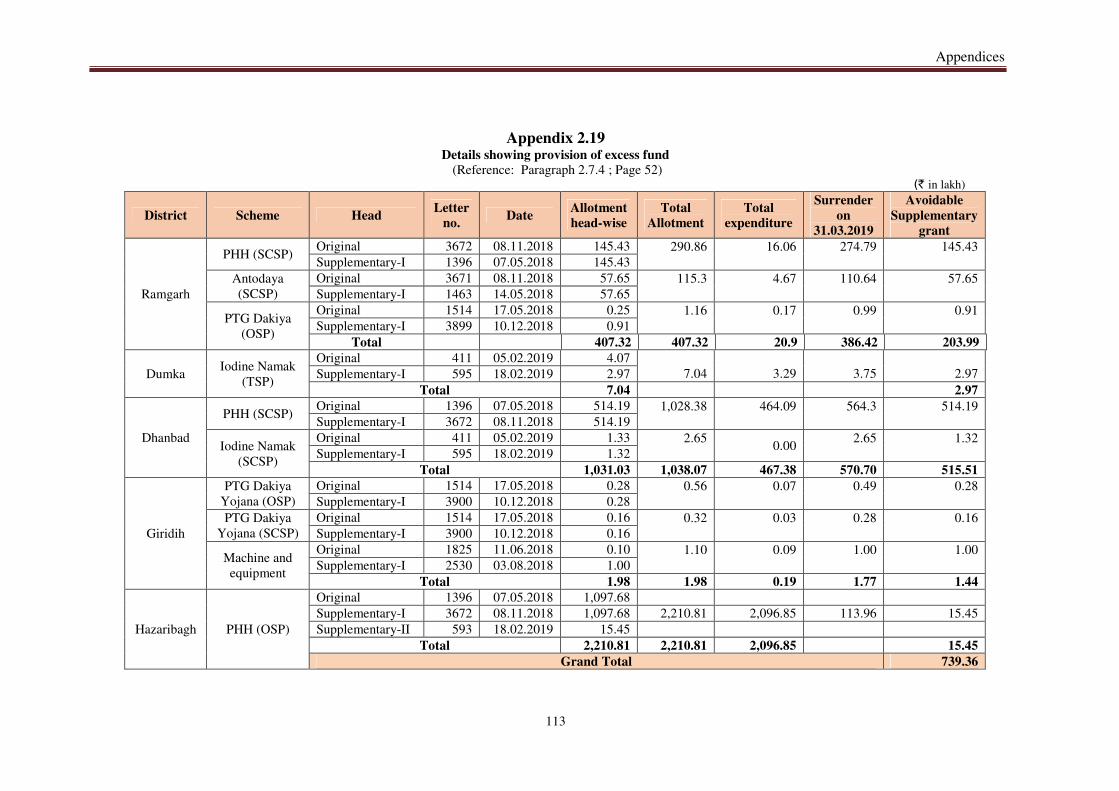
Appendices
113
Appendix 2.19 Details showing provision of excess fund
(Reference: Paragraph 2.7.4 ; Page 52) (` in lakh)
District Scheme Head Letter
no. Date
Allotment
head-wise
Total
Allotment
Total
expenditure
Surrender
on
31.03.2019
Avoidable
Supplementary
grant
Ramgarh
PHH (SCSP) Original 3672 08.11.2018 145.43 290.86
16.06
274.79
145.43
Supplementary-I 1396 07.05.2018 145.43
Antodaya
(SCSP)
Original 3671 08.11.2018 57.65 115.3
4.67
110.64
57.65
Supplementary-I 1463 14.05.2018 57.65
PTG Dakiya
(OSP)
Original 1514 17.05.2018 0.25 1.16
0.17
0.99
0.91
Supplementary-I 3899 10.12.2018 0.91
Total 407.32 407.32 20.9 386.42 203.99
Dumka Iodine Namak
(TSP)
Original 411 05.02.2019 4.07
7.04
3.29
3.75
2.97 Supplementary-I 595 18.02.2019 2.97
Total 7.04 2.97
Dhanbad
PHH (SCSP) Original 1396 07.05.2018 514.19 1,028.38
464.09
564.3
514.19
Supplementary-I 3672 08.11.2018 514.19
Iodine Namak
(SCSP)
Original 411 05.02.2019 1.33 2.65
0.00
2.65
1.32
Supplementary-I 595 18.02.2019 1.32
Total 1,031.03 1,038.07 467.38 570.70 515.51
Giridih
PTG Dakiya
Yojana (OSP)
Original 1514 17.05.2018 0.28 0.56
0.07
0.49
0.28
Supplementary-I 3900 10.12.2018 0.28
PTG Dakiya
Yojana (SCSP)
Original 1514 17.05.2018 0.16 0.32
0.03
0.28
0.16
Supplementary-I 3900 10.12.2018 0.16
Machine and
equipment
Original 1825 11.06.2018 0.10 1.10
0.09
1.00
1.00
Supplementary-I 2530 03.08.2018 1.00
Total 1.98 1.98 0.19 1.77 1.44
Hazaribagh PHH (OSP)
Original 1396 07.05.2018 1,097.68
Supplementary-I 3672 08.11.2018 1,097.68 2,210.81 2,096.85 113.96 15.45
Supplementary-II 593 18.02.2019 15.45
Total 2,210.81 2,210.81 2,096.85 15.45
Grand Total 739.36
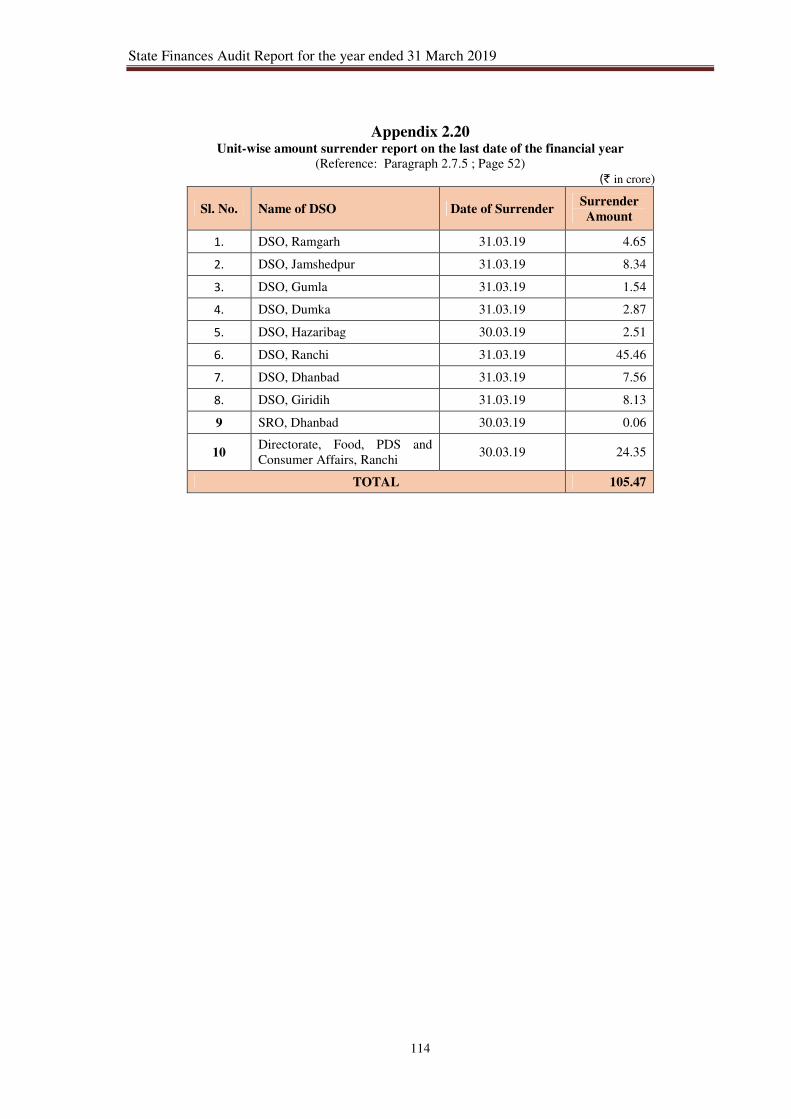
114
Appendix 2.20 Unit-wise amount surrender report on the last date of the financial year
(Reference: Paragraph 2.7.5 ; Page 52)
(` in crore)
Sl. No. Name of DSO Date of Surrender Surrender
Amount
1. DSO, Ramgarh 31.03.19 4.65
2. DSO, Jamshedpur 31.03.19 8.34
3. DSO, Gumla 31.03.19 1.54
4. DSO, Dumka 31.03.19 2.87
5. DSO, Hazaribag 30.03.19 2.51
6. DSO, Ranchi 31.03.19 45.46
7. DSO, Dhanbad 31.03.19 7.56
8. DSO, Giridih 31.03.19 8.13
9 SRO, Dhanbad 30.03.19 0.06
10 Directorate, Food, PDS and
Consumer Affairs, Ranchi 30.03.19 24.35
TOTAL 105.47
State Finances Audit Report for the year ended 31 March 2019
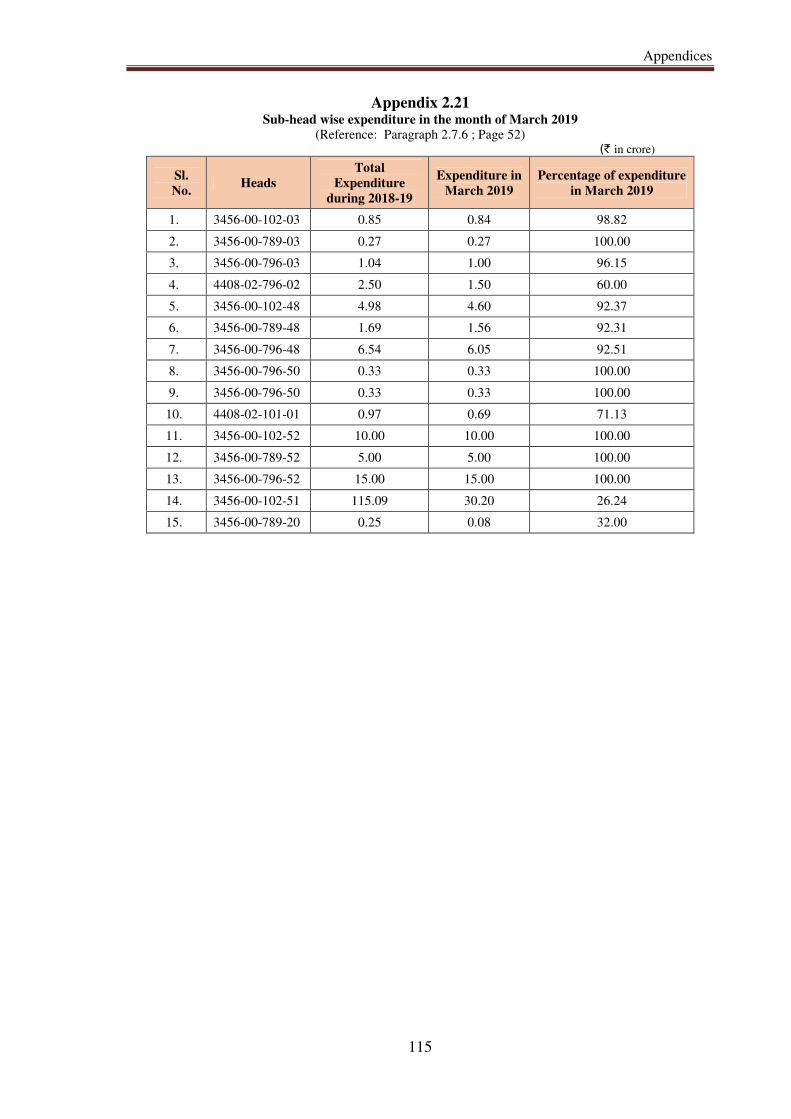
Appendices
115
Appendix 2.21 Sub-head wise expenditure in the month of March 2019
(Reference: Paragraph 2.7.6 ; Page 52) (` in crore)
Sl.
No. Heads
Total
Expenditure
during 2018-19
Expenditure in
March 2019
Percentage of expenditure
in March 2019
1. 3456-00-102-03 0.85 0.84 98.82
2. 3456-00-789-03 0.27 0.27 100.00
3. 3456-00-796-03 1.04 1.00 96.15
4. 4408-02-796-02 2.50 1.50 60.00
5. 3456-00-102-48 4.98 4.60 92.37
6. 3456-00-789-48 1.69 1.56 92.31
7. 3456-00-796-48 6.54 6.05 92.51
8. 3456-00-796-50 0.33 0.33 100.00
9. 3456-00-796-50 0.33 0.33 100.00
10. 4408-02-101-01 0.97 0.69 71.13
11. 3456-00-102-52 10.00 10.00 100.00
12. 3456-00-789-52 5.00 5.00 100.00
13. 3456-00-796-52 15.00 15.00 100.00
14. 3456-00-102-51 115.09 30.20 26.24
15. 3456-00-789-20 0.25 0.08 32.00
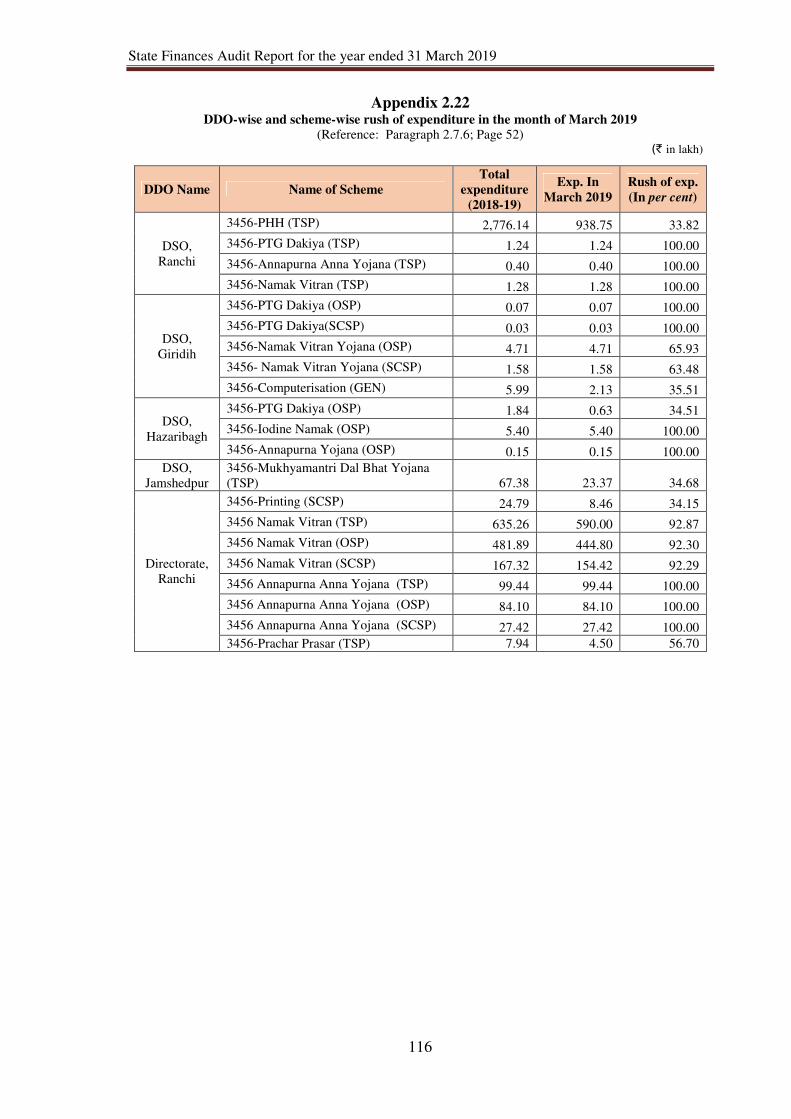
State Finances Audit Report for the year ended 31 March 2019
116
Appendix 2.22 DDO-wise and scheme-wise rush of expenditure in the month of March 2019
(Reference: Paragraph 2.7.6; Page 52)
(` in lakh)
DDO Name Name of Scheme
Total
expenditure
(2018-19)
Exp. In
March 2019
Rush of exp.
(In per cent)
DSO,
Ranchi
3456-PHH (TSP) 2,776.14 938.75 33.82
3456-PTG Dakiya (TSP) 1.24 1.24 100.00
3456-Annapurna Anna Yojana (TSP) 0.40 0.40 100.00
3456-Namak Vitran (TSP) 1.28 1.28 100.00
DSO,
Giridih
3456-PTG Dakiya (OSP) 0.07 0.07 100.00
3456-PTG Dakiya(SCSP) 0.03 0.03 100.00
3456-Namak Vitran Yojana (OSP) 4.71 4.71 65.93
3456- Namak Vitran Yojana (SCSP) 1.58 1.58 63.48
3456-Computerisation (GEN) 5.99 2.13 35.51
DSO,
Hazaribagh
3456-PTG Dakiya (OSP) 1.84 0.63 34.51
3456-Iodine Namak (OSP) 5.40 5.40 100.00
3456-Annapurna Yojana (OSP) 0.15 0.15 100.00
DSO,
Jamshedpur
3456-Mukhyamantri Dal Bhat Yojana
(TSP) 67.38 23.37 34.68
Directorate,
Ranchi
3456-Printing (SCSP) 24.79 8.46 34.15
3456 Namak Vitran (TSP) 635.26 590.00 92.87
3456 Namak Vitran (OSP) 481.89 444.80 92.30
3456 Namak Vitran (SCSP) 167.32 154.42 92.29
3456 Annapurna Anna Yojana (TSP) 99.44 99.44 100.00
3456 Annapurna Anna Yojana (OSP) 84.10 84.10 100.00
3456 Annapurna Anna Yojana (SCSP) 27.42 27.42 100.00
3456-Prachar Prasar (TSP) 7.94 4.50 56.70
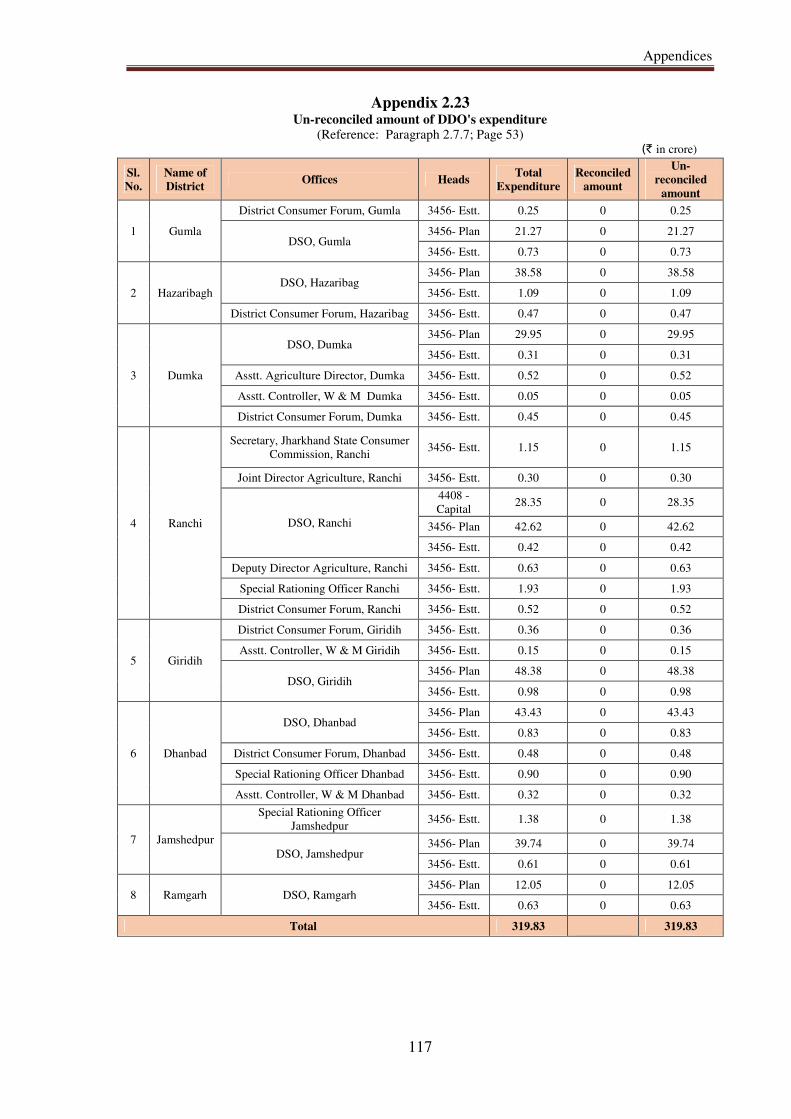
Appendices
117
Appendix 2.23 Un-reconciled amount of DDO's expenditure
(Reference: Paragraph 2.7.7; Page 53) (` in crore)
Sl.
No.
Name of
District Offices Heads
Total
Expenditure
Reconciled
amount
Un-
reconciled
amount
1 Gumla
District Consumer Forum, Gumla 3456- Estt. 0.25 0 0.25
DSO, Gumla 3456- Plan 21.27 0 21.27
3456- Estt. 0.73 0 0.73
2 Hazaribagh DSO, Hazaribag
3456- Plan 38.58 0 38.58
3456- Estt. 1.09 0 1.09
District Consumer Forum, Hazaribag 3456- Estt. 0.47 0 0.47
3 Dumka
DSO, Dumka 3456- Plan 29.95 0 29.95
3456- Estt. 0.31 0 0.31
Asstt. Agriculture Director, Dumka 3456- Estt. 0.52 0 0.52
Asstt. Controller, W & M Dumka 3456- Estt. 0.05 0 0.05
District Consumer Forum, Dumka 3456- Estt. 0.45 0 0.45
4 Ranchi
Secretary, Jharkhand State Consumer
Commission, Ranchi 3456- Estt. 1.15 0 1.15
Joint Director Agriculture, Ranchi 3456- Estt. 0.30 0 0.30
DSO, Ranchi
4408 -
Capital 28.35 0 28.35
3456- Plan 42.62 0 42.62
3456- Estt. 0.42 0 0.42
Deputy Director Agriculture, Ranchi 3456- Estt. 0.63 0 0.63
Special Rationing Officer Ranchi 3456- Estt. 1.93 0 1.93
District Consumer Forum, Ranchi 3456- Estt. 0.52 0 0.52
5 Giridih
District Consumer Forum, Giridih 3456- Estt. 0.36 0 0.36
Asstt. Controller, W & M Giridih 3456- Estt. 0.15 0 0.15
DSO, Giridih 3456- Plan 48.38 0 48.38
3456- Estt. 0.98 0 0.98
6 Dhanbad
DSO, Dhanbad 3456- Plan 43.43 0 43.43
3456- Estt. 0.83 0 0.83
District Consumer Forum, Dhanbad 3456- Estt. 0.48 0 0.48
Special Rationing Officer Dhanbad 3456- Estt. 0.90 0 0.90
Asstt. Controller, W & M Dhanbad 3456- Estt. 0.32 0 0.32
7 Jamshedpur
Special Rationing Officer
Jamshedpur 3456- Estt. 1.38 0 1.38
DSO, Jamshedpur 3456- Plan 39.74 0 39.74
3456- Estt. 0.61 0 0.61
8 Ramgarh DSO, Ramgarh 3456- Plan 12.05 0 12.05
3456- Estt. 0.63 0 0.63
Total 319.83
319.83
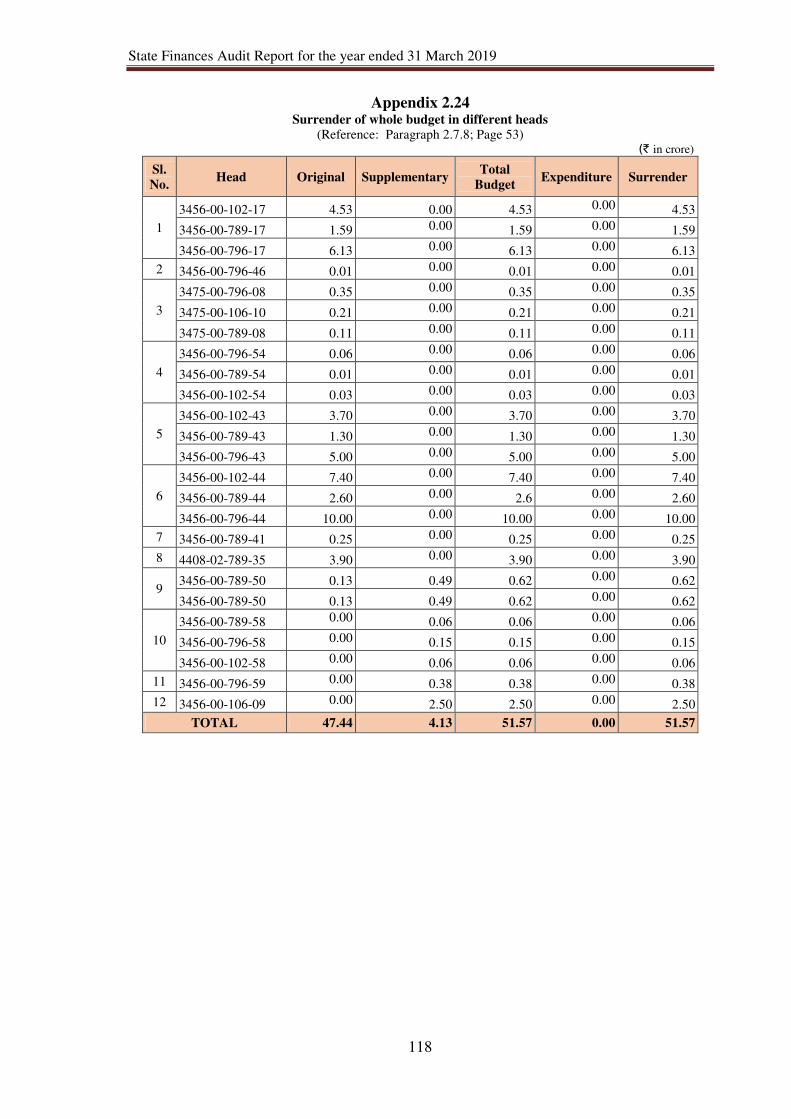
State Finances Audit Report for the year ended 31 March 2019
118
Appendix 2.24 Surrender of whole budget in different heads
(Reference: Paragraph 2.7.8; Page 53) (` in crore)
Sl.
No. Head Original Supplementary
Total
Budget Expenditure Surrender
1
3456-00-102-17 4.53 0.00 4.53 0.00 4.53
3456-00-789-17 1.59 0.00 1.59 0.00 1.59
3456-00-796-17 6.13 0.00 6.13 0.00 6.13
2 3456-00-796-46 0.01 0.00 0.01 0.00 0.01
3
3475-00-796-08 0.35 0.00 0.35 0.00 0.35
3475-00-106-10 0.21 0.00 0.21 0.00 0.21
3475-00-789-08 0.11 0.00 0.11 0.00 0.11
4
3456-00-796-54 0.06 0.00 0.06 0.00 0.06
3456-00-789-54 0.01 0.00 0.01 0.00 0.01
3456-00-102-54 0.03 0.00 0.03 0.00 0.03
5
3456-00-102-43 3.70 0.00 3.70 0.00 3.70
3456-00-789-43 1.30 0.00 1.30 0.00 1.30
3456-00-796-43 5.00 0.00 5.00 0.00 5.00
6
3456-00-102-44 7.40 0.00 7.40 0.00 7.40
3456-00-789-44 2.60 0.00 2.6 0.00 2.60
3456-00-796-44 10.00 0.00 10.00 0.00 10.00
7 3456-00-789-41 0.25 0.00 0.25 0.00 0.25
8 4408-02-789-35 3.90 0.00 3.90 0.00 3.90
9 3456-00-789-50 0.13 0.49 0.62 0.00 0.62
3456-00-789-50 0.13 0.49 0.62 0.00 0.62
10
3456-00-789-58 0.00 0.06 0.06 0.00 0.06
3456-00-796-58 0.00 0.15 0.15 0.00 0.15
3456-00-102-58 0.00 0.06 0.06 0.00 0.06
11 3456-00-796-59 0.00 0.38 0.38 0.00 0.38
12 3456-00-106-09 0.00 2.50 2.50 0.00 2.50
TOTAL 47.44 4.13 51.57 0.00 51.57
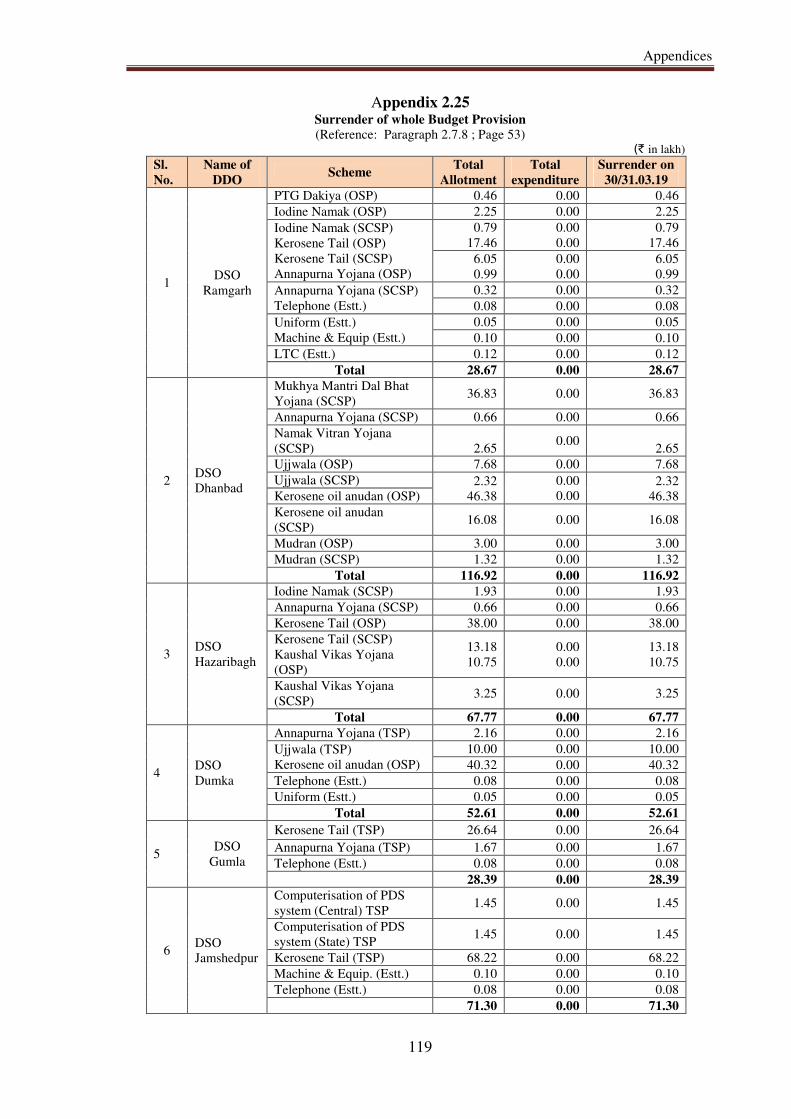
Appendices
119
Appendix 2.25 Surrender of whole Budget Provision
(Reference: Paragraph 2.7.8 ; Page 53)
(` in lakh)
Sl.
No.
Name of
DDO Scheme
Total
Allotment
Total
expenditure
Surrender on
30/31.03.19
1 DSO
Ramgarh
PTG Dakiya (OSP) 0.46 0.00 0.46
Iodine Namak (OSP) 2.25 0.00 2.25
Iodine Namak (SCSP)
Kerosene Tail (OSP)
Kerosene Tail (SCSP)
Annapurna Yojana (OSP)
0.79
17.46
0.00
0.00
0.79
17.46
6.05
0.99
0.00
0.00
6.05
0.99
Annapurna Yojana (SCSP)
Telephone (Estt.)
0.32 0.00 0.32
0.08 0.00 0.08
Uniform (Estt.)
Machine & Equip (Estt.)
0.05 0.00 0.05
0.10 0.00 0.10
LTC (Estt.) 0.12 0.00 0.12
Total 28.67 0.00 28.67
2 DSO
Dhanbad
Mukhya Mantri Dal Bhat
Yojana (SCSP) 36.83 0.00 36.83
Annapurna Yojana (SCSP) 0.66 0.00 0.66
Namak Vitran Yojana
(SCSP) 2.65 0.00
2.65
Ujjwala (OSP) 7.68 0.00 7.68
Ujjwala (SCSP) 2.32
46.38
0.00
0.00 2.32
46.38 Kerosene oil anudan (OSP)
Kerosene oil anudan
(SCSP) 16.08 0.00 16.08
Mudran (OSP) 3.00 0.00 3.00
Mudran (SCSP) 1.32 0.00 1.32
Total 116.92 0.00 116.92
3 DSO
Hazaribagh
Iodine Namak (SCSP) 1.93 0.00 1.93
Annapurna Yojana (SCSP) 0.66 0.00 0.66
Kerosene Tail (OSP) 38.00 0.00 38.00
Kerosene Tail (SCSP)
Kaushal Vikas Yojana
(OSP)
13.18
10.75
0.00
0.00
13.18
10.75
Kaushal Vikas Yojana
(SCSP) 3.25 0.00 3.25
Total 67.77 0.00 67.77
4 DSO
Dumka
Annapurna Yojana (TSP) 2.16 0.00 2.16
Ujjwala (TSP)
Kerosene oil anudan (OSP)
10.00 0.00 10.00
40.32 0.00 40.32
Telephone (Estt.) 0.08 0.00 0.08
Uniform (Estt.) 0.05 0.00 0.05
Total 52.61 0.00 52.61
5 DSO
Gumla
Kerosene Tail (TSP) 26.64 0.00 26.64
Annapurna Yojana (TSP) 1.67 0.00 1.67
Telephone (Estt.) 0.08 0.00 0.08
28.39 0.00 28.39
6 DSO
Jamshedpur
Computerisation of PDS
system (Central) TSP 1.45 0.00 1.45
Computerisation of PDS
system (State) TSP 1.45 0.00 1.45
Kerosene Tail (TSP) 68.22 0.00 68.22
Machine & Equip. (Estt.) 0.10 0.00 0.10
Telephone (Estt.) 0.08 0.00 0.08
71.30 0.00 71.30

State Finances Audit Report for the year ended 31 March 2019
120
Sl.
No.
Name of
DDO Scheme
Total
Allotment
Total
expenditure
Surrender on
30/31.03.19
7 DSO
Giridih
Annapurna Yojana (OSP) 2.83 0.00 2.83
Annapurna Yojana (SCSP) 0.92 0.00 0.92
Kaushal Vikas Prachar
Prasar Seminar (OSP) 13.05 0.00 13.05
Kaushal Vikas Prachar
Prasar Seminar (SCSP) 3.95 0.00 3.95
Kerosene Oil Anudan
(OSP) 48.25 0.00 48.25
Kerosene Oil Anudan
(SCSP) 16.73 0.00 16.73
Total 85.73 85.73
8 DSO
Ranchi
Nirwachan 1.00 0.00 1.00
Kerosene oil commission
(TSP) 733.38 0.00 733.38
Kaushal Vikas Yojana
(TSP) 16.00 0.00 16.00
Telephone (TSP.) 0.08 0.00 0.08
Uniform (TSP) 0.05 0.00 0.05
Mach. & Equip (TSP) 0.10 0.00 0.10
Total 750.61 0.00 750.61
9 Directorate
State Food Commission
(TSP) 3.75 0.00 37.50
Grand Total 1,239.50
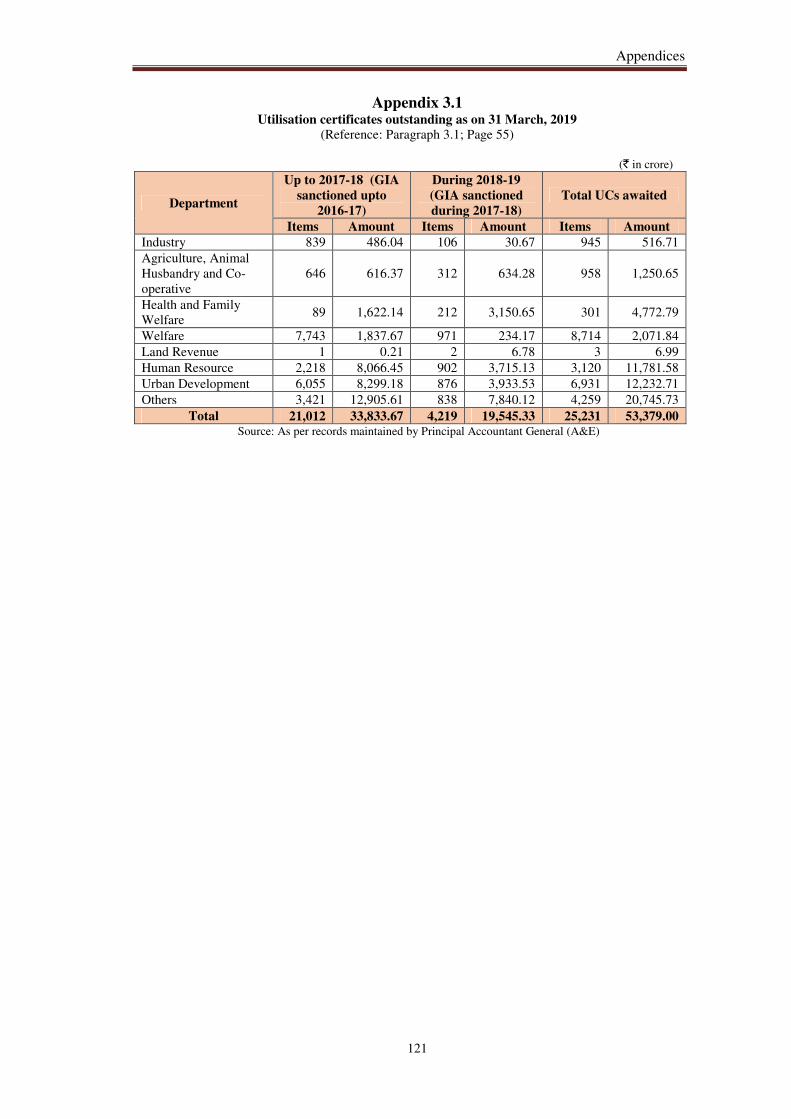
Appendices
121
Appendix 3.1 Utilisation certificates outstanding as on 31 March, 2019
(Reference: Paragraph 3.1; Page 55)
(` in crore)
Department
Up to 2017-18 (GIA
sanctioned upto
2016-17)
During 2018-19
(GIA sanctioned
during 2017-18)
Total UCs awaited
Items Amount Items Amount Items Amount
Industry 839 486.04 106 30.67 945 516.71
Agriculture, Animal
Husbandry and Co-
operative
646 616.37 312 634.28 958 1,250.65
Health and Family
Welfare 89 1,622.14 212 3,150.65 301 4,772.79
Welfare 7,743 1,837.67 971 234.17 8,714 2,071.84
Land Revenue 1 0.21 2 6.78 3 6.99
Human Resource 2,218 8,066.45 902 3,715.13 3,120 11,781.58
Urban Development 6,055 8,299.18 876 3,933.53 6,931 12,232.71
Others 3,421 12,905.61 838 7,840.12 4,259 20,745.73
Total 21,012 33,833.67 4,219 19,545.33 25,231 53,379.00 Source: As per records maintained by Principal Accountant General (A&E)
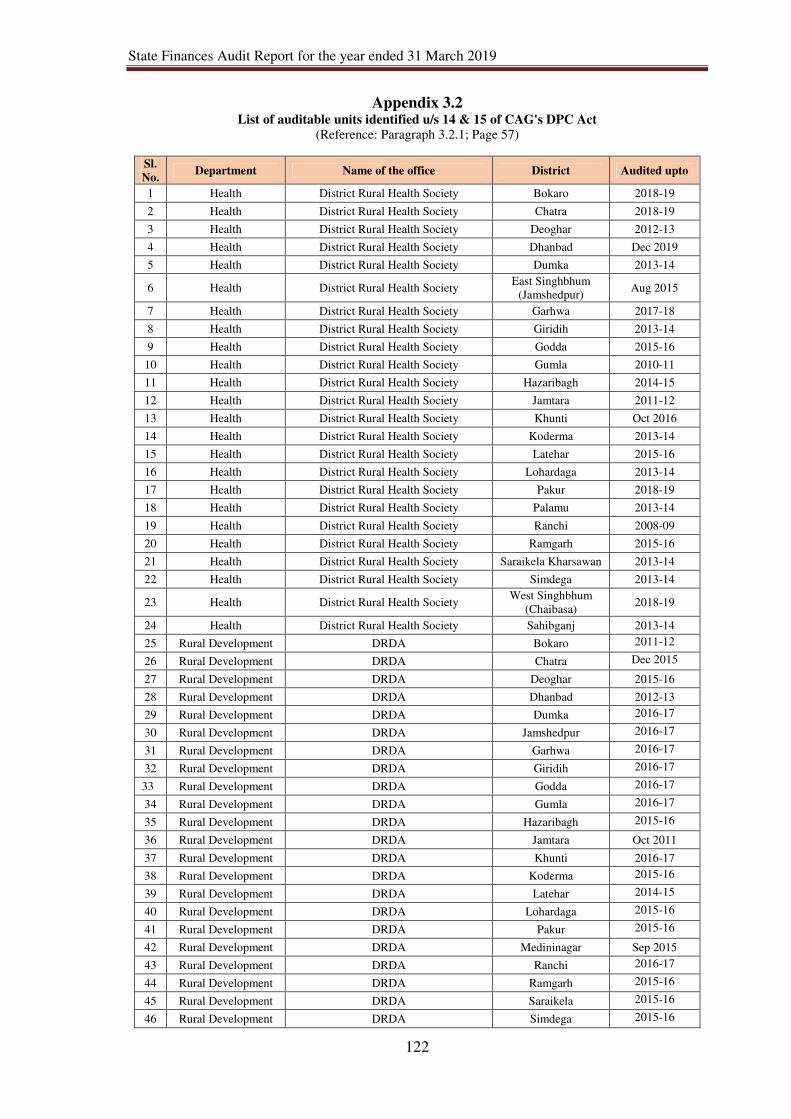
State Finances Audit Report for the year ended 31 March 2019
122
Appendix 3.2 List of auditable units identified u/s 14 & 15 of CAG's DPC Act
(Reference: Paragraph 3.2.1; Page 57)
Sl.
No. Department Name of the office District Audited upto
1 Health District Rural Health Society Bokaro 2018-19
2 Health District Rural Health Society Chatra 2018-19
3 Health District Rural Health Society Deoghar 2012-13
4 Health District Rural Health Society Dhanbad Dec 2019
5 Health District Rural Health Society Dumka 2013-14
6 Health District Rural Health Society East Singhbhum
(Jamshedpur) Aug 2015
7 Health District Rural Health Society Garhwa 2017-18
8 Health District Rural Health Society Giridih 2013-14
9 Health District Rural Health Society Godda 2015-16
10 Health District Rural Health Society Gumla 2010-11
11 Health District Rural Health Society Hazaribagh 2014-15
12 Health District Rural Health Society Jamtara 2011-12
13 Health District Rural Health Society Khunti Oct 2016
14 Health District Rural Health Society Koderma 2013-14
15 Health District Rural Health Society Latehar 2015-16
16 Health District Rural Health Society Lohardaga 2013-14
17 Health District Rural Health Society Pakur 2018-19
18 Health District Rural Health Society Palamu 2013-14
19 Health District Rural Health Society Ranchi 2008-09
20 Health District Rural Health Society Ramgarh 2015-16
21 Health District Rural Health Society Saraikela Kharsawan 2013-14
22 Health District Rural Health Society Simdega 2013-14
23 Health District Rural Health Society West Singhbhum
(Chaibasa) 2018-19
24 Health District Rural Health Society Sahibganj 2013-14
25 Rural Development DRDA Bokaro 2011-12
26 Rural Development DRDA Chatra Dec 2015
27 Rural Development DRDA Deoghar 2015-16
28 Rural Development DRDA Dhanbad 2012-13
29 Rural Development DRDA Dumka 2016-17
30 Rural Development DRDA Jamshedpur 2016-17
31 Rural Development DRDA Garhwa 2016-17
32 Rural Development DRDA Giridih 2016-17
33 Rural Development DRDA Godda 2016-17
34 Rural Development DRDA Gumla 2016-17
35 Rural Development DRDA Hazaribagh 2015-16
36 Rural Development DRDA Jamtara Oct 2011
37 Rural Development DRDA Khunti 2016-17
38 Rural Development DRDA Koderma 2015-16
39 Rural Development DRDA Latehar 2014-15
40 Rural Development DRDA Lohardaga 2015-16
41 Rural Development DRDA Pakur 2015-16
42 Rural Development DRDA Medininagar Sep 2015
43 Rural Development DRDA Ranchi 2016-17
44 Rural Development DRDA Ramgarh 2015-16
45 Rural Development DRDA Saraikela 2015-16
46 Rural Development DRDA Simdega 2015-16
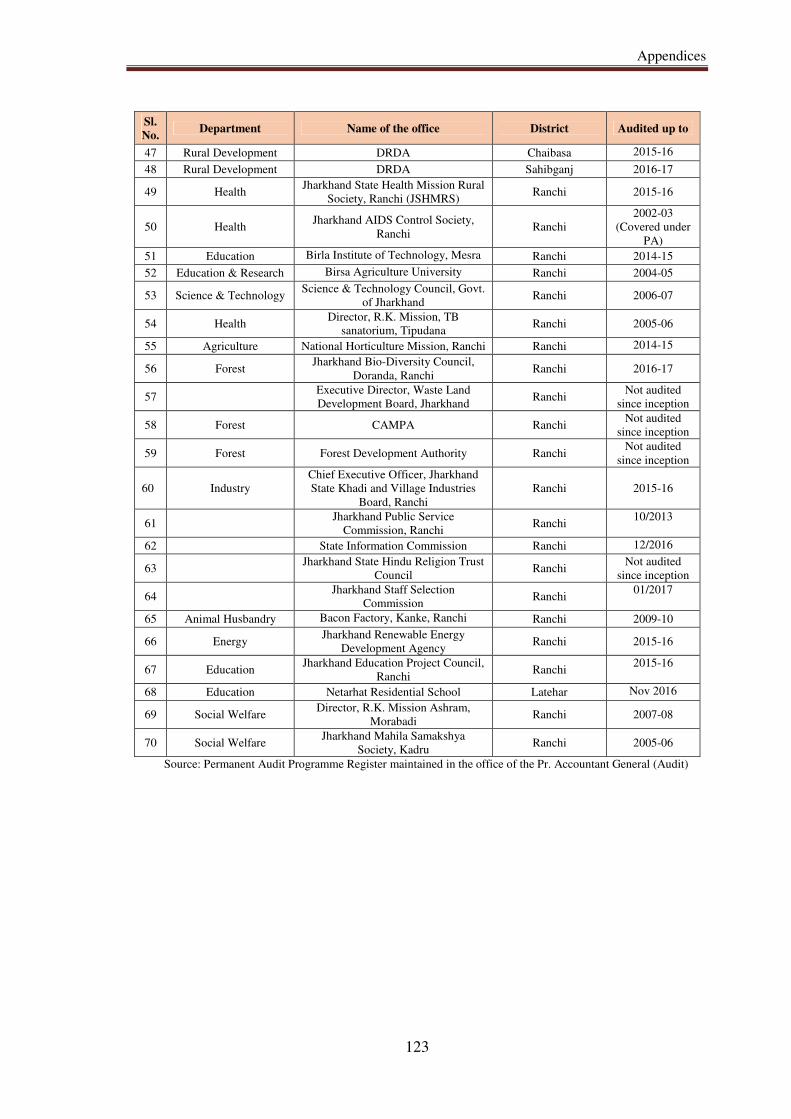
Appendices
123
Sl.
No. Department Name of the office District Audited up to
47 Rural Development DRDA Chaibasa 2015-16 48 Rural Development DRDA Sahibganj 2016-17
49 Health Jharkhand State Health Mission Rural
Society, Ranchi (JSHMRS) Ranchi 2015-16
50 Health Jharkhand AIDS Control Society,
Ranchi Ranchi
2002-03
(Covered under
PA) 51 Education Birla Institute of Technology, Mesra Ranchi 2014-15
52 Education & Research Birsa Agriculture University Ranchi 2004-05
53 Science & Technology Science & Technology Council, Govt.
of Jharkhand Ranchi 2006-07
54 Health Director, R.K. Mission, TB
sanatorium, Tipudana Ranchi 2005-06
55 Agriculture National Horticulture Mission, Ranchi Ranchi 2014-15
56 Forest Jharkhand Bio-Diversity Council,
Doranda, Ranchi Ranchi 2016-17
57 Executive Director, Waste Land
Development Board, Jharkhand Ranchi
Not audited
since inception
58 Forest CAMPA Ranchi Not audited
since inception
59 Forest Forest Development Authority Ranchi Not audited
since inception
60 Industry
Chief Executive Officer, Jharkhand
State Khadi and Village Industries
Board, Ranchi
Ranchi 2015-16
61 Jharkhand Public Service
Commission, Ranchi Ranchi
10/2013
62 State Information Commission Ranchi 12/2016
63 Jharkhand State Hindu Religion Trust
Council Ranchi
Not audited
since inception
64 Jharkhand Staff Selection
Commission Ranchi
01/2017
65 Animal Husbandry Bacon Factory, Kanke, Ranchi Ranchi 2009-10
66 Energy Jharkhand Renewable Energy
Development Agency Ranchi 2015-16
67 Education Jharkhand Education Project Council,
Ranchi Ranchi
2015-16
68 Education Netarhat Residential School Latehar Nov 2016
69 Social Welfare Director, R.K. Mission Ashram,
Morabadi Ranchi 2007-08
70 Social Welfare Jharkhand Mahila Samakshya
Society, Kadru Ranchi 2005-06
Source: Permanent Audit Programme Register maintained in the office of the Pr. Accountant General (Audit)
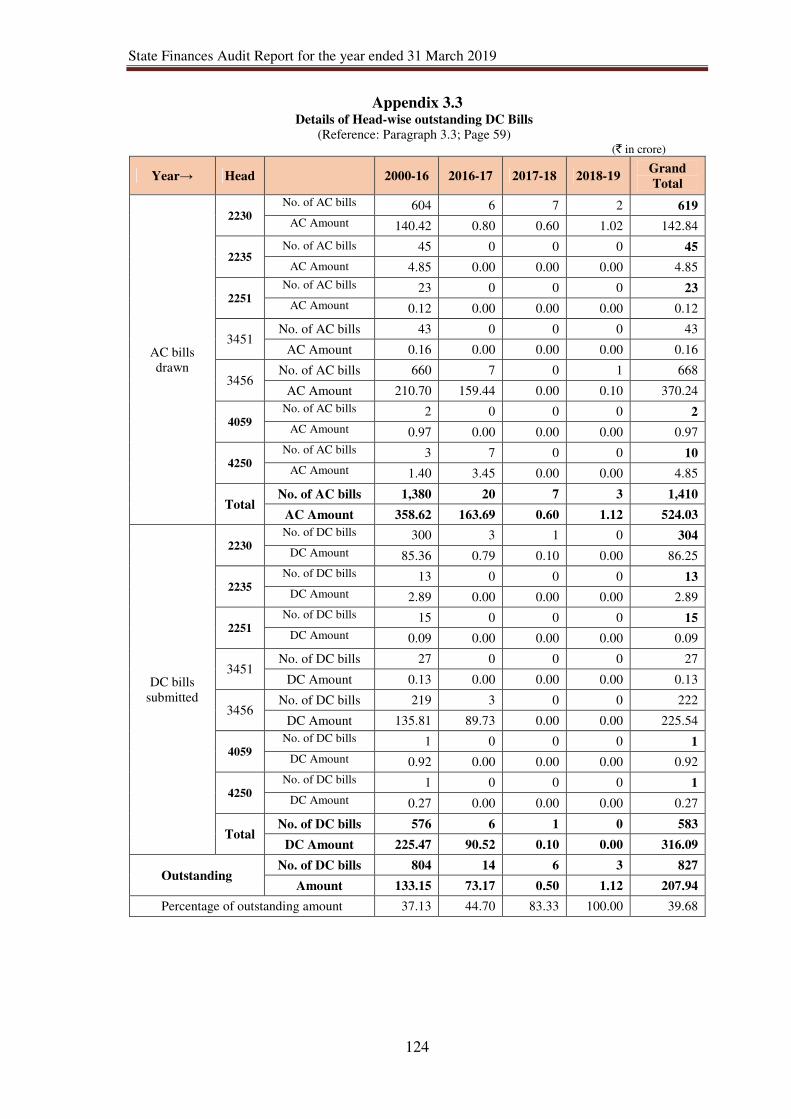
State Finances Audit Report for the year ended 31 March 2019
124
Appendix 3.3 Details of Head-wise outstanding DC Bills
(Reference: Paragraph 3.3; Page 59) (` in crore)
Year→ Head
2000-16 2016-17 2017-18 2018-19 Grand
Total
AC bills
drawn
2230
No. of AC bills 604 6 7 2 619
AC Amount 140.42 0.80 0.60 1.02 142.84
2235 No. of AC bills 45 0 0 0 45
AC Amount 4.85 0.00 0.00 0.00 4.85
2251
No. of AC bills 23 0 0 0 23
AC Amount 0.12 0.00 0.00 0.00 0.12
3451 No. of AC bills 43 0 0 0 43
AC Amount 0.16 0.00 0.00 0.00 0.16
3456 No. of AC bills 660 7 0 1 668
AC Amount 210.70 159.44 0.00 0.10 370.24
4059
No. of AC bills 2 0 0 0 2
AC Amount 0.97 0.00 0.00 0.00 0.97
4250
No. of AC bills 3 7 0 0 10
AC Amount 1.40 3.45 0.00 0.00 4.85
Total No. of AC bills 1,380 20 7 3 1,410
AC Amount 358.62 163.69 0.60 1.12 524.03
DC bills
submitted
2230
No. of DC bills 300 3 1 0 304
DC Amount 85.36 0.79 0.10 0.00 86.25
2235
No. of DC bills 13 0 0 0 13
DC Amount 2.89 0.00 0.00 0.00 2.89
2251
No. of DC bills 15 0 0 0 15
DC Amount 0.09 0.00 0.00 0.00 0.09
3451 No. of DC bills 27 0 0 0 27
DC Amount 0.13 0.00 0.00 0.00 0.13
3456 No. of DC bills 219 3 0 0 222
DC Amount 135.81 89.73 0.00 0.00 225.54
4059
No. of DC bills 1 0 0 0 1
DC Amount 0.92 0.00 0.00 0.00 0.92
4250
No. of DC bills 1 0 0 0 1
DC Amount 0.27 0.00 0.00 0.00 0.27
Total No. of DC bills 576 6 1 0 583
DC Amount 225.47 90.52 0.10 0.00 316.09
Outstanding No. of DC bills 804 14 6 3 827
Amount 133.15 73.17 0.50 1.12 207.94
Percentage of outstanding amount 37.13 44.70 83.33 100.00 39.68
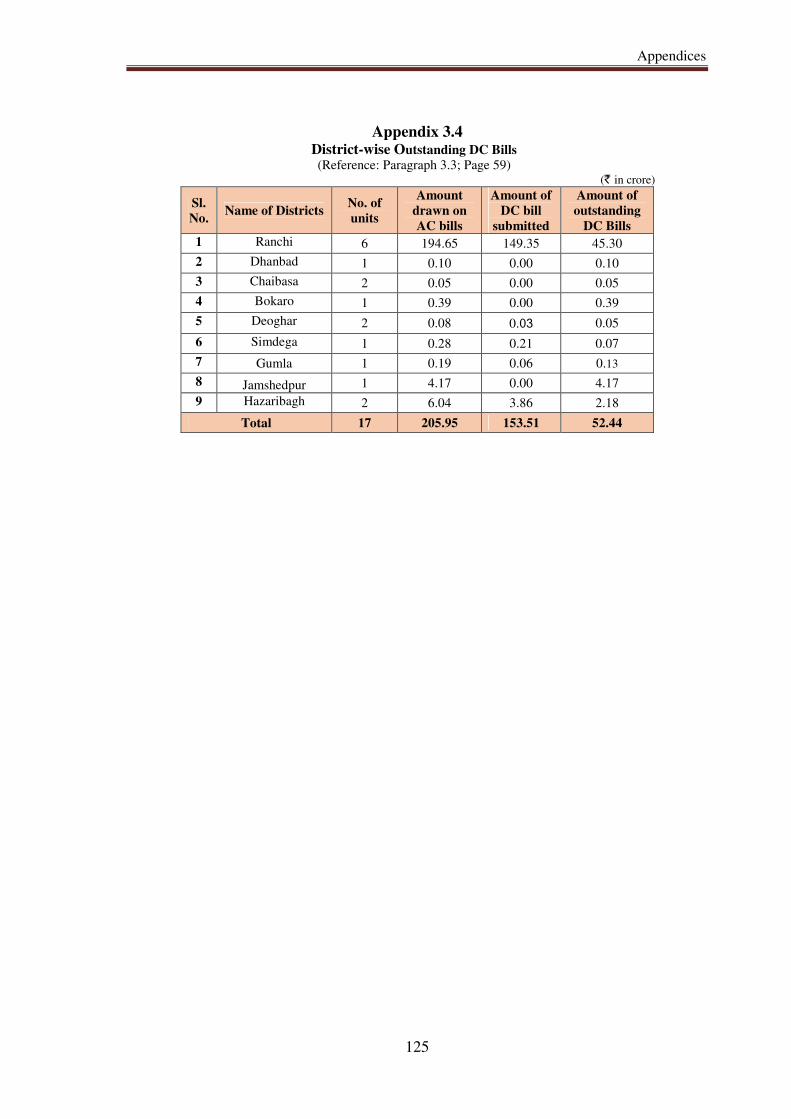
Appendices
125
Appendix 3.4 District-wise Outstanding DC Bills
(Reference: Paragraph 3.3; Page 59) (` in crore)
Sl.
No. Name of Districts
No. of
units
Amount
drawn on
AC bills
Amount of
DC bill
submitted
Amount of
outstanding
DC Bills
1 Ranchi 6 194.65 149.35 45.30
2 Dhanbad 1 0.10 0.00 0.10
3 Chaibasa 2 0.05 0.00 0.05
4 Bokaro 1 0.39 0.00 0.39
5 Deoghar 2 0.08 0.03 0.05
6 Simdega 1 0.28 0.21 0.07
7 Gumla 1 0.19 0.06 0.13
8 Jamshedpur 1 4.17 0.00 4.17
9 Hazaribagh 2 6.04 3.86 2.18
Total 17 205.95 153.51 52.44
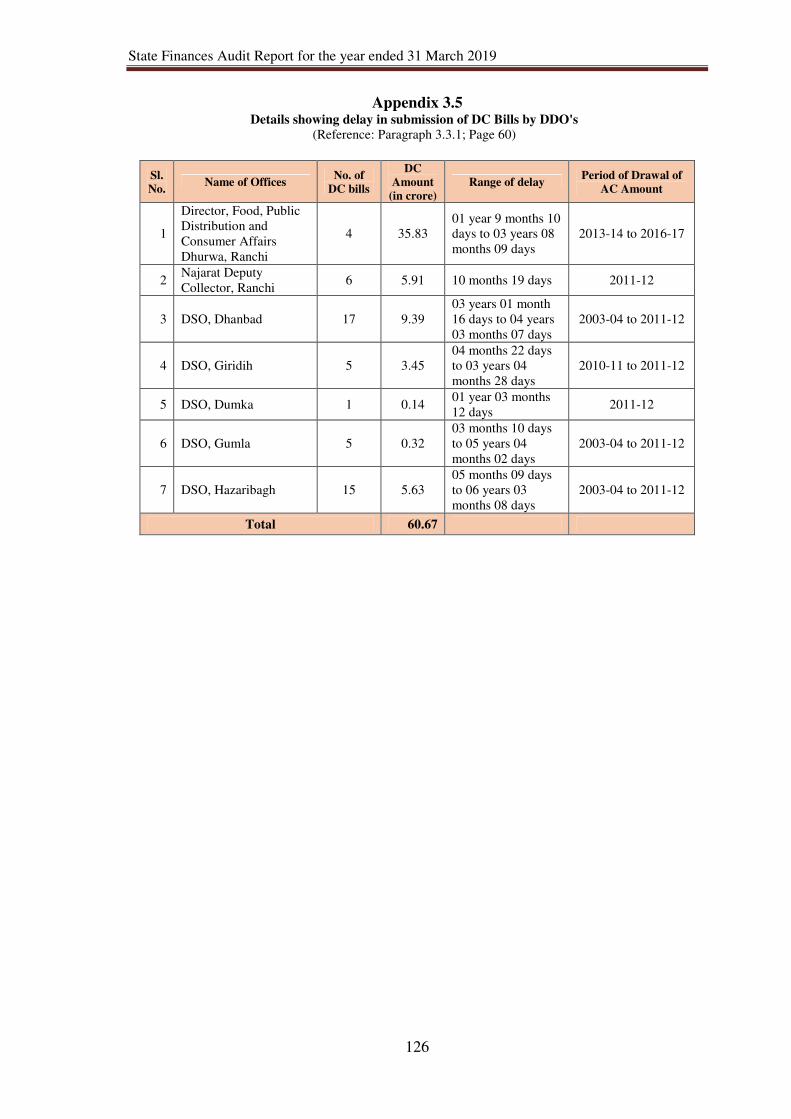
State Finances Audit Report for the year ended 31 March 2019
126
Appendix 3.5 Details showing delay in submission of DC Bills by DDO's
(Reference: Paragraph 3.3.1; Page 60)
Sl.
No. Name of Offices
No. of
DC bills
DC
Amount
(in crore)
Range of delay Period of Drawal of
AC Amount
1
Director, Food, Public
Distribution and
Consumer Affairs
Dhurwa, Ranchi
4 35.83
01 year 9 months 10
days to 03 years 08
months 09 days
2013-14 to 2016-17
2 Najarat Deputy
Collector, Ranchi 6 5.91 10 months 19 days 2011-12
3 DSO, Dhanbad 17 9.39
03 years 01 month
16 days to 04 years
03 months 07 days
2003-04 to 2011-12
4 DSO, Giridih 5 3.45
04 months 22 days
to 03 years 04
months 28 days
2010-11 to 2011-12
5 DSO, Dumka 1 0.14 01 year 03 months
12 days 2011-12
6 DSO, Gumla 5 0.32
03 months 10 days
to 05 years 04
months 02 days
2003-04 to 2011-12
7 DSO, Hazaribagh 15 5.63
05 months 09 days
to 06 years 03
months 08 days
2003-04 to 2011-12
Total 60.67
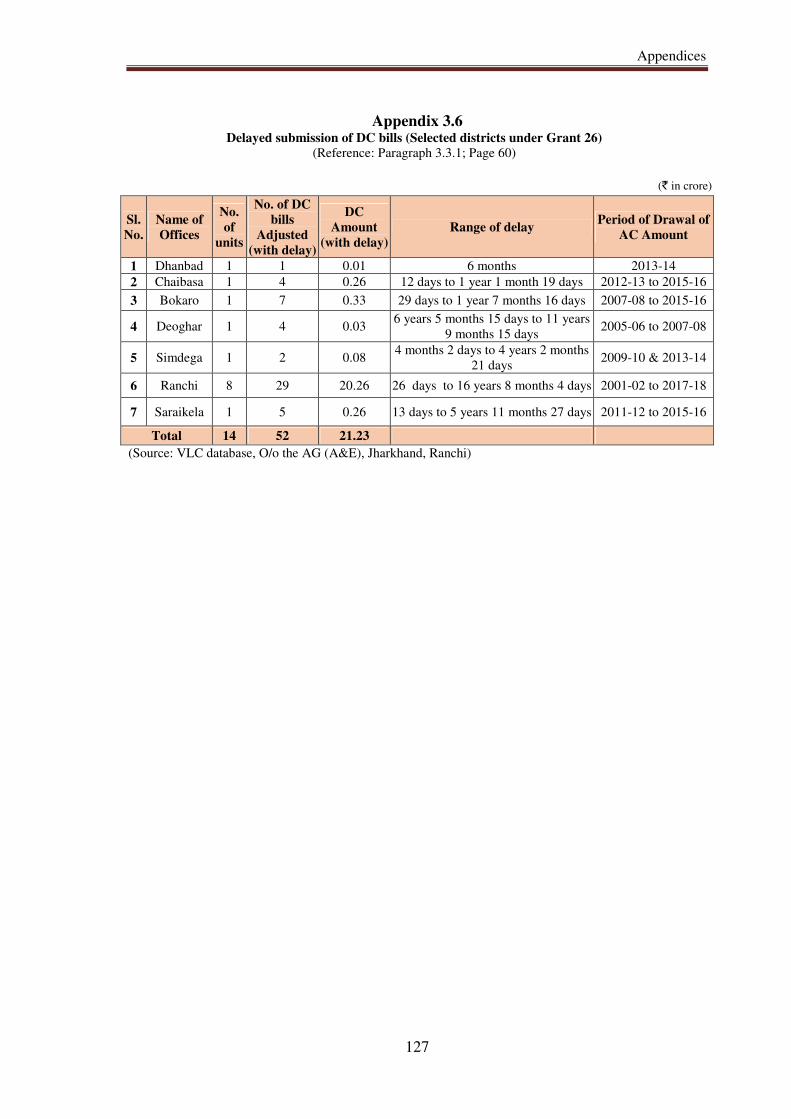
Appendices
127
Appendix 3.6 Delayed submission of DC bills (Selected districts under Grant 26)
(Reference: Paragraph 3.3.1; Page 60)
(` in crore)
Sl.
No.
Name of
Offices
No.
of
units
No. of DC
bills
Adjusted
(with delay)
DC
Amount
(with delay)
Range of delay Period of Drawal of
AC Amount
1 Dhanbad 1 1 0.01 6 months 2013-14
2 Chaibasa 1 4 0.26 12 days to 1 year 1 month 19 days 2012-13 to 2015-16
3 Bokaro 1 7 0.33 29 days to 1 year 7 months 16 days 2007-08 to 2015-16
4 Deoghar 1 4 0.03 6 years 5 months 15 days to 11 years
9 months 15 days 2005-06 to 2007-08
5 Simdega 1 2 0.08 4 months 2 days to 4 years 2 months
21 days 2009-10 & 2013-14
6 Ranchi 8 29 20.26 26 days to 16 years 8 months 4 days 2001-02 to 2017-18
7 Saraikela 1 5 0.26 13 days to 5 years 11 months 27 days 2011-12 to 2015-16
Total 14 52 21.23 (Source: VLC database, O/o the AG (A&E), Jharkhand, Ranchi)
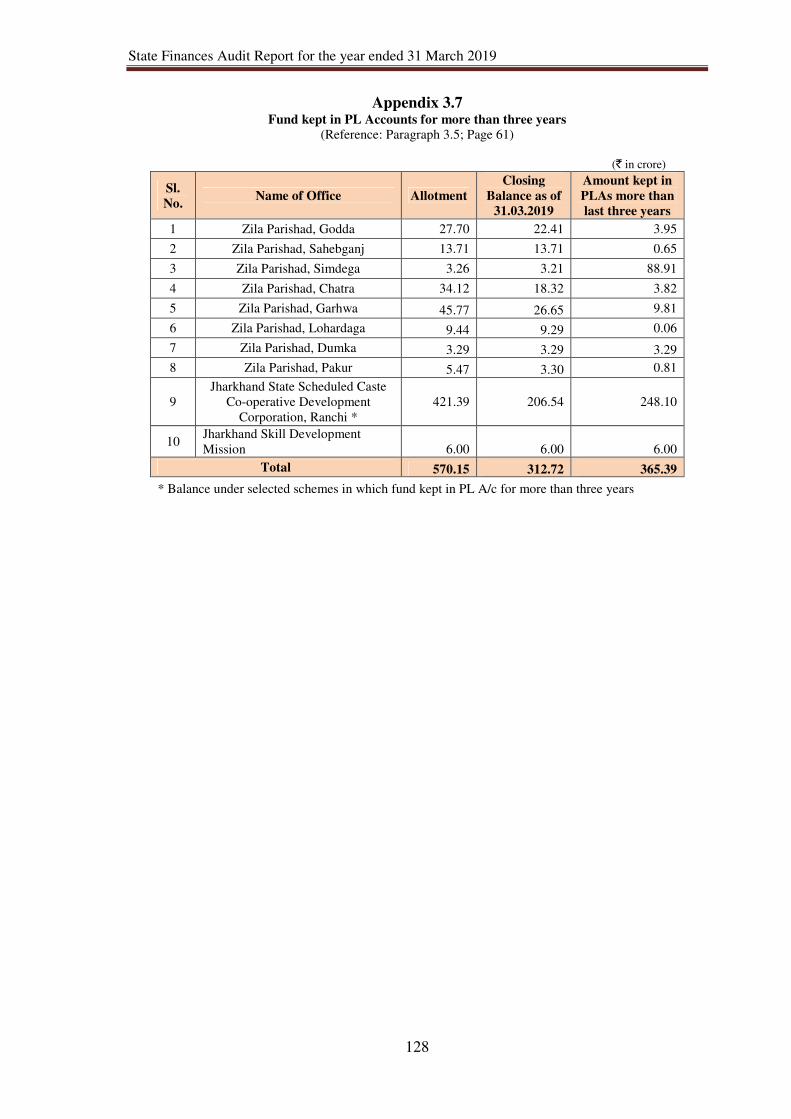
State Finances Audit Report for the year ended 31 March 2019
128
Appendix 3.7 Fund kept in PL Accounts for more than three years
(Reference: Paragraph 3.5; Page 61)
(` in crore)
Sl.
No. Name of Office Allotment
Closing
Balance as of
31.03.2019
Amount kept in
PLAs more than
last three years
1 Zila Parishad, Godda 27.70 22.41 3.95
2 Zila Parishad, Sahebganj 13.71 13.71 0.65
3 Zila Parishad, Simdega 3.26 3.21 88.91
4 Zila Parishad, Chatra 34.12 18.32 3.82
5 Zila Parishad, Garhwa 45.77 26.65 9.81
6 Zila Parishad, Lohardaga 9.44 9.29 0.06
7 Zila Parishad, Dumka 3.29 3.29 3.29
8 Zila Parishad, Pakur 5.47 3.30 0.81
9
Jharkhand State Scheduled Caste
Co-operative Development
Corporation, Ranchi *
421.39 206.54 248.10
10 Jharkhand Skill Development
Mission 6.00 6.00 6.00
Total 570.15 312.72 365.39
* Balance under selected schemes in which fund kept in PL A/c for more than three years
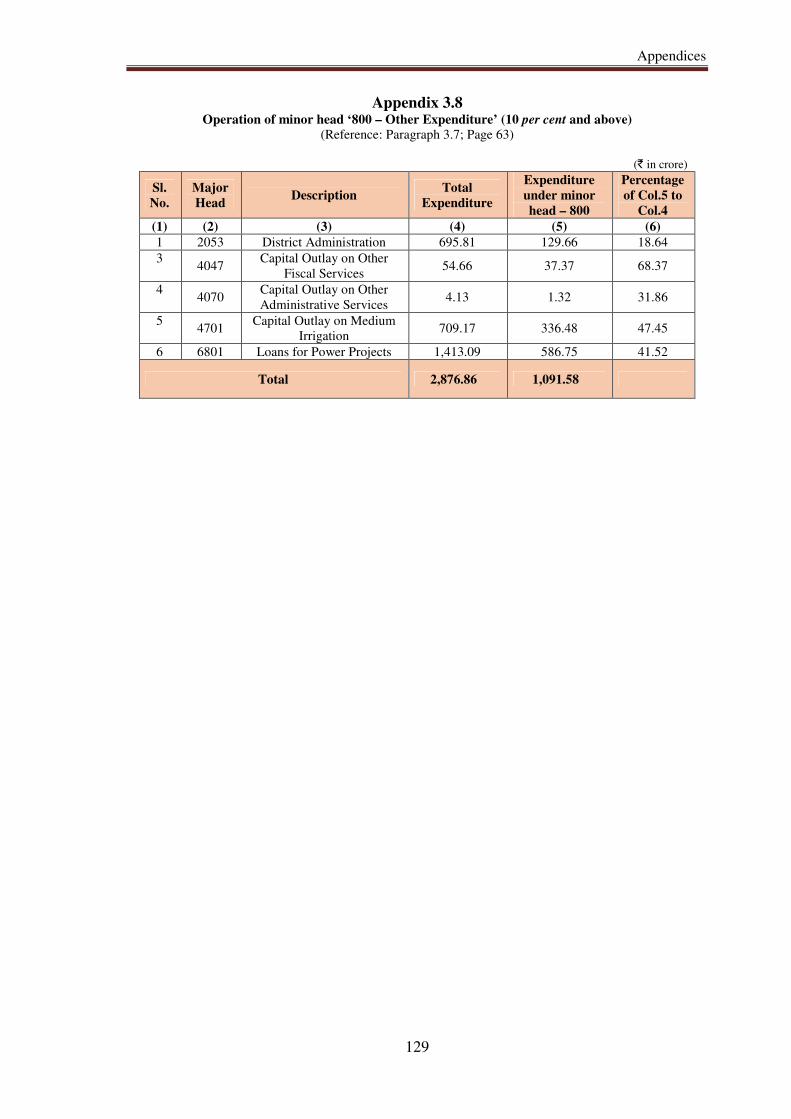
Appendices
129
Appendix 3.8 Operation of minor head ‘800 – Other Expenditure’ (10 per cent and above)
(Reference: Paragraph 3.7; Page 63)
(` in crore)
Sl.
No.
Major
Head Description
Total
Expenditure
Expenditure
under minor
head – 800
Percentage
of Col.5 to
Col.4
(1) (2) (3) (4) (5) (6)
1 2053 District Administration 695.81 129.66 18.64
3 4047
Capital Outlay on Other
Fiscal Services 54.66 37.37 68.37
4 4070
Capital Outlay on Other
Administrative Services 4.13 1.32 31.86
5 4701
Capital Outlay on Medium
Irrigation 709.17 336.48 47.45
6 6801 Loans for Power Projects 1,413.09 586.75 41.52
Total 2,876.86 1,091.58
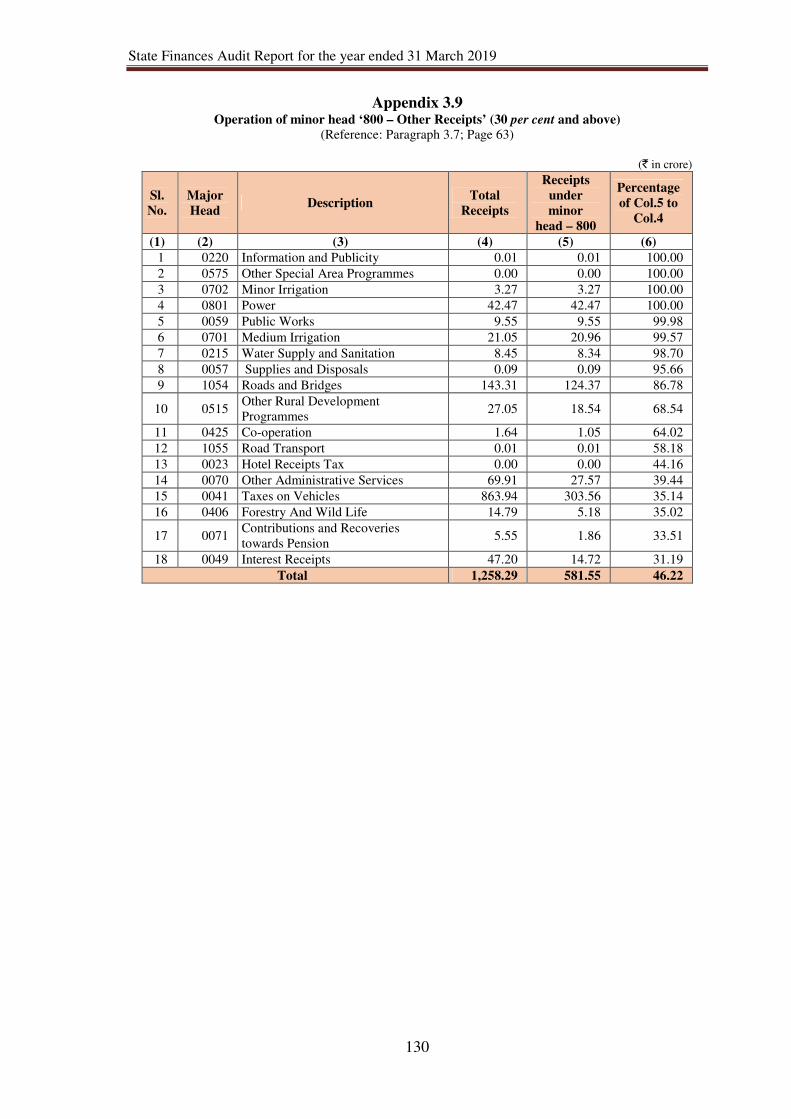
State Finances Audit Report for the year ended 31 March 2019
130
Appendix 3.9 Operation of minor head ‘800 – Other Receipts’ (30 per cent and above)
(Reference: Paragraph 3.7; Page 63)
(` in crore)
Sl.
No.
Major
Head Description
Total
Receipts
Receipts
under
minor
head – 800
Percentage
of Col.5 to
Col.4
(1) (2) (3) (4) (5) (6)
1 0220 Information and Publicity 0.01 0.01 100.00
2 0575 Other Special Area Programmes 0.00 0.00 100.00
3 0702 Minor Irrigation 3.27 3.27 100.00
4 0801 Power 42.47 42.47 100.00
5 0059 Public Works 9.55 9.55 99.98
6 0701 Medium Irrigation 21.05 20.96 99.57
7 0215 Water Supply and Sanitation 8.45 8.34 98.70
8 0057 Supplies and Disposals 0.09 0.09 95.66
9 1054 Roads and Bridges 143.31 124.37 86.78
10 0515 Other Rural Development
Programmes 27.05 18.54 68.54
11 0425 Co-operation 1.64 1.05 64.02
12 1055 Road Transport 0.01 0.01 58.18
13 0023 Hotel Receipts Tax 0.00 0.00 44.16
14 0070 Other Administrative Services 69.91 27.57 39.44
15 0041 Taxes on Vehicles 863.94 303.56 35.14
16 0406 Forestry And Wild Life 14.79 5.18 35.02
17 0071 Contributions and Recoveries
towards Pension 5.55 1.86 33.51
18 0049 Interest Receipts 47.20 14.72 31.19
Total 1,258.29 581.55 46.22
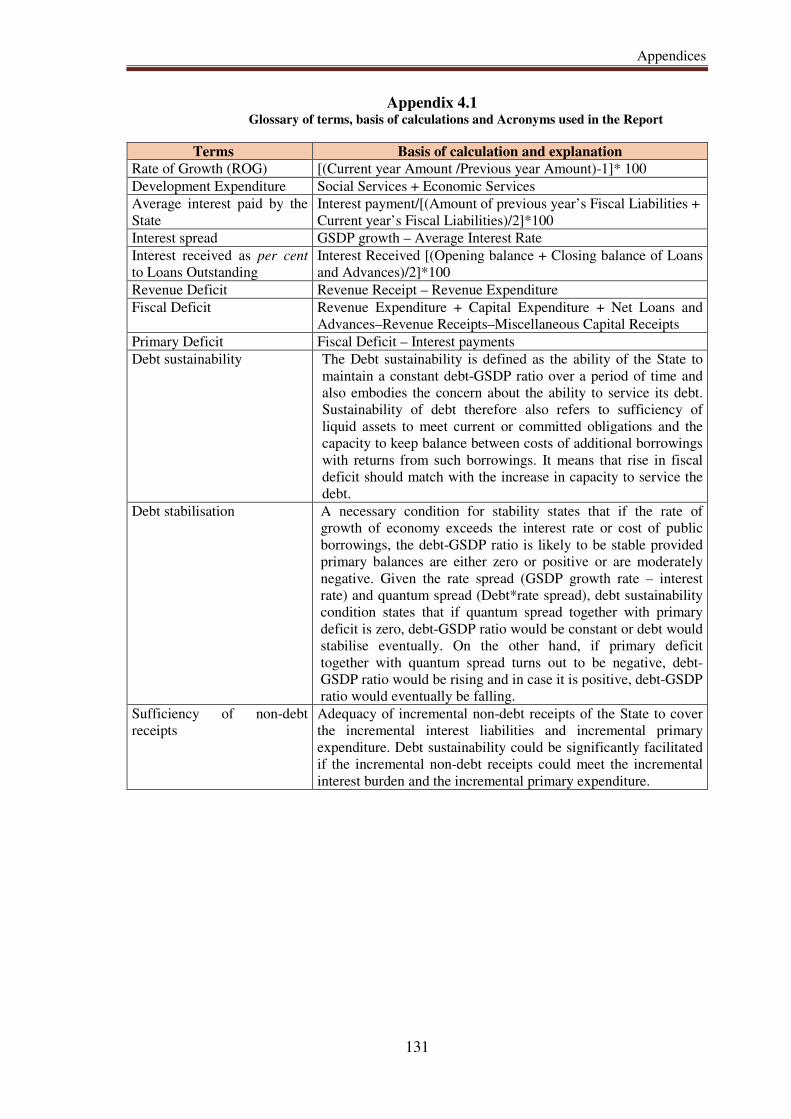
Appendices
131
Appendix 4.1 Glossary of terms, basis of calculations and Acronyms used in the Report
Terms Basis of calculation and explanation
Rate of Growth (ROG) [(Current year Amount /Previous year Amount)-1]* 100
Development Expenditure Social Services + Economic Services
Average interest paid by the
State
Interest payment/[(Amount of previous year’s Fiscal Liabilities +
Current year’s Fiscal Liabilities)/2]*100
Interest spread GSDP growth – Average Interest Rate
Interest received as per cent
to Loans Outstanding
Interest Received [(Opening balance + Closing balance of Loans
and Advances)/2]*100
Revenue Deficit Revenue Receipt – Revenue Expenditure
Fiscal Deficit Revenue Expenditure + Capital Expenditure + Net Loans and
Advances–Revenue Receipts–Miscellaneous Capital Receipts
Primary Deficit Fiscal Deficit – Interest payments
Debt sustainability The Debt sustainability is defined as the ability of the State to
maintain a constant debt-GSDP ratio over a period of time and
also embodies the concern about the ability to service its debt.
Sustainability of debt therefore also refers to sufficiency of
liquid assets to meet current or committed obligations and the
capacity to keep balance between costs of additional borrowings
with returns from such borrowings. It means that rise in fiscal
deficit should match with the increase in capacity to service the
debt.
Debt stabilisation A necessary condition for stability states that if the rate of
growth of economy exceeds the interest rate or cost of public
borrowings, the debt-GSDP ratio is likely to be stable provided
primary balances are either zero or positive or are moderately
negative. Given the rate spread (GSDP growth rate – interest
rate) and quantum spread (Debt*rate spread), debt sustainability
condition states that if quantum spread together with primary
deficit is zero, debt-GSDP ratio would be constant or debt would
stabilise eventually. On the other hand, if primary deficit
together with quantum spread turns out to be negative, debt-
GSDP ratio would be rising and in case it is positive, debt-GSDP
ratio would eventually be falling.
Sufficiency of non-debt
receipts
Adequacy of incremental non-debt receipts of the State to cover
the incremental interest liabilities and incremental primary
expenditure. Debt sustainability could be significantly facilitated
if the incremental non-debt receipts could meet the incremental
interest burden and the incremental primary expenditure.
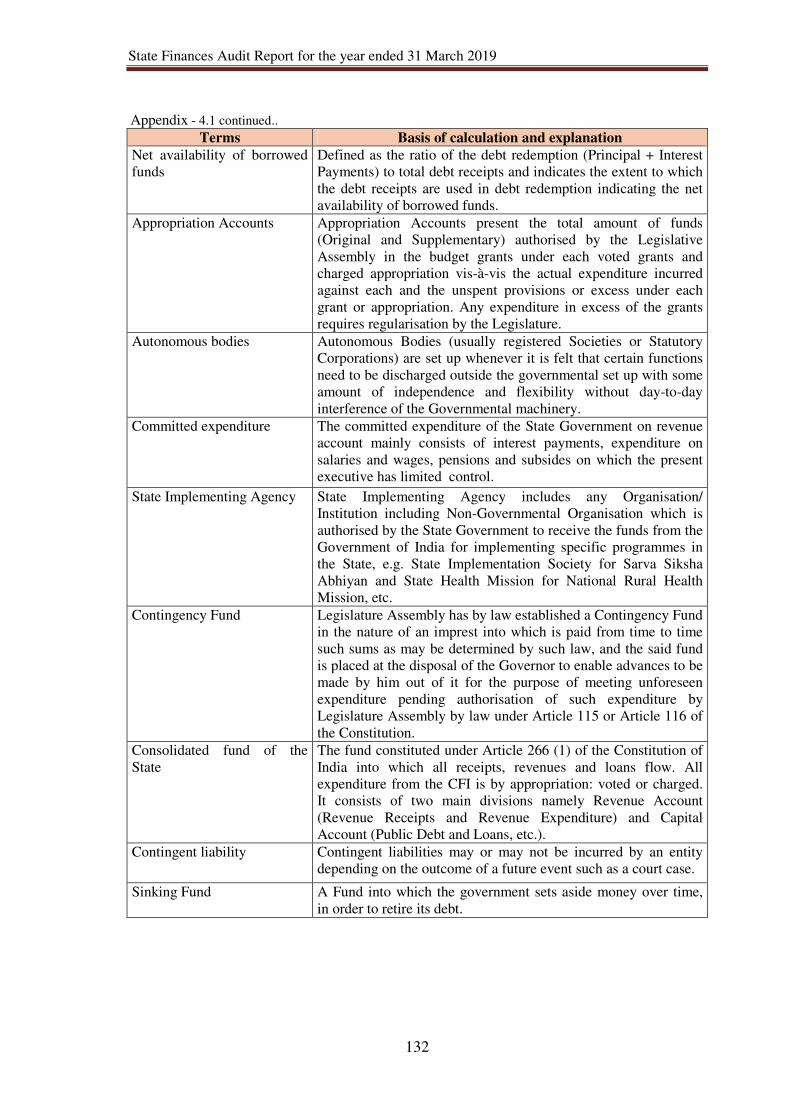
State Finances Audit Report for the year ended 31 March 2019
132
Appendix - 4.1 continued..
Terms Basis of calculation and explanation
Net availability of borrowed
funds
Defined as the ratio of the debt redemption (Principal + Interest
Payments) to total debt receipts and indicates the extent to which
the debt receipts are used in debt redemption indicating the net
availability of borrowed funds.
Appropriation Accounts Appropriation Accounts present the total amount of funds
(Original and Supplementary) authorised by the Legislative
Assembly in the budget grants under each voted grants and
charged appropriation vis-à-vis the actual expenditure incurred
against each and the unspent provisions or excess under each
grant or appropriation. Any expenditure in excess of the grants
requires regularisation by the Legislature.
Autonomous bodies Autonomous Bodies (usually registered Societies or Statutory
Corporations) are set up whenever it is felt that certain functions
need to be discharged outside the governmental set up with some
amount of independence and flexibility without day-to-day
interference of the Governmental machinery.
Committed expenditure The committed expenditure of the State Government on revenue
account mainly consists of interest payments, expenditure on
salaries and wages, pensions and subsides on which the present
executive has limited control.
State Implementing Agency State Implementing Agency includes any Organisation/
Institution including Non-Governmental Organisation which is
authorised by the State Government to receive the funds from the
Government of India for implementing specific programmes in
the State, e.g. State Implementation Society for Sarva Siksha
Abhiyan and State Health Mission for National Rural Health
Mission, etc.
Contingency Fund Legislature Assembly has by law established a Contingency Fund
in the nature of an imprest into which is paid from time to time
such sums as may be determined by such law, and the said fund
is placed at the disposal of the Governor to enable advances to be
made by him out of it for the purpose of meeting unforeseen
expenditure pending authorisation of such expenditure by
Legislature Assembly by law under Article 115 or Article 116 of
the Constitution.
Consolidated fund of the
State
The fund constituted under Article 266 (1) of the Constitution of
India into which all receipts, revenues and loans flow. All
expenditure from the CFI is by appropriation: voted or charged.
It consists of two main divisions namely Revenue Account
(Revenue Receipts and Revenue Expenditure) and Capital
Account (Public Debt and Loans, etc.).
Contingent liability Contingent liabilities may or may not be incurred by an entity
depending on the outcome of a future event such as a court case.
Sinking Fund A Fund into which the government sets aside money over time,
in order to retire its debt.
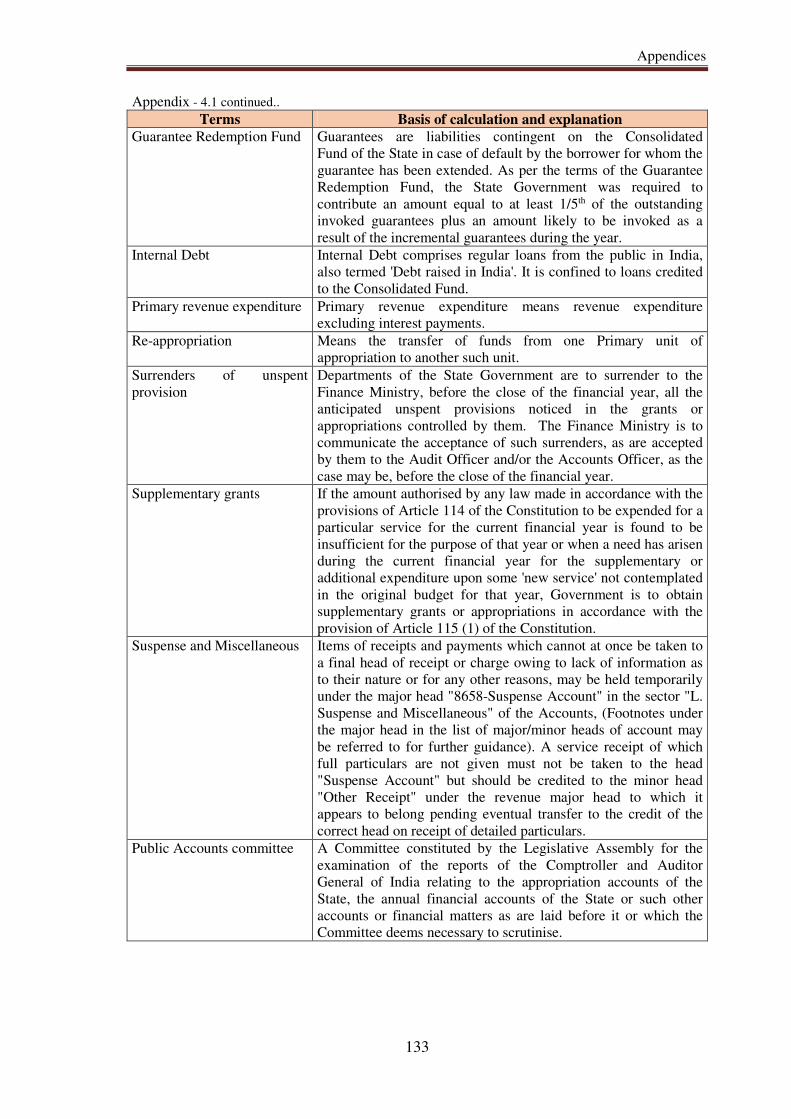
Appendices
133
Appendix - 4.1 continued.. Terms Basis of calculation and explanation
Guarantee Redemption Fund Guarantees are liabilities contingent on the Consolidated
Fund of the State in case of default by the borrower for whom the
guarantee has been extended. As per the terms of the Guarantee
Redemption Fund, the State Government was required to
contribute an amount equal to at least 1/5th of the outstanding
invoked guarantees plus an amount likely to be invoked as a
result of the incremental guarantees during the year.
Internal Debt Internal Debt comprises regular loans from the public in India,
also termed 'Debt raised in India'. It is confined to loans credited
to the Consolidated Fund.
Primary revenue expenditure Primary revenue expenditure means revenue expenditure
excluding interest payments.
Re-appropriation Means the transfer of funds from one Primary unit of
appropriation to another such unit.
Surrenders of unspent
provision
Departments of the State Government are to surrender to the
Finance Ministry, before the close of the financial year, all the
anticipated unspent provisions noticed in the grants or
appropriations controlled by them. The Finance Ministry is to
communicate the acceptance of such surrenders, as are accepted
by them to the Audit Officer and/or the Accounts Officer, as the
case may be, before the close of the financial year.
Supplementary grants If the amount authorised by any law made in accordance with the
provisions of Article 114 of the Constitution to be expended for a
particular service for the current financial year is found to be
insufficient for the purpose of that year or when a need has arisen
during the current financial year for the supplementary or
additional expenditure upon some 'new service' not contemplated
in the original budget for that year, Government is to obtain
supplementary grants or appropriations in accordance with the
provision of Article 115 (1) of the Constitution.
Suspense and Miscellaneous Items of receipts and payments which cannot at once be taken to
a final head of receipt or charge owing to lack of information as
to their nature or for any other reasons, may be held temporarily
under the major head "8658-Suspense Account" in the sector "L.
Suspense and Miscellaneous" of the Accounts, (Footnotes under
the major head in the list of major/minor heads of account may
be referred to for further guidance). A service receipt of which
full particulars are not given must not be taken to the head
"Suspense Account" but should be credited to the minor head
"Other Receipt" under the revenue major head to which it
appears to belong pending eventual transfer to the credit of the
correct head on receipt of detailed particulars.
Public Accounts committee A Committee constituted by the Legislative Assembly for the
examination of the reports of the Comptroller and Auditor
General of India relating to the appropriation accounts of the
State, the annual financial accounts of the State or such other
accounts or financial matters as are laid before it or which the
Committee deems necessary to scrutinise.
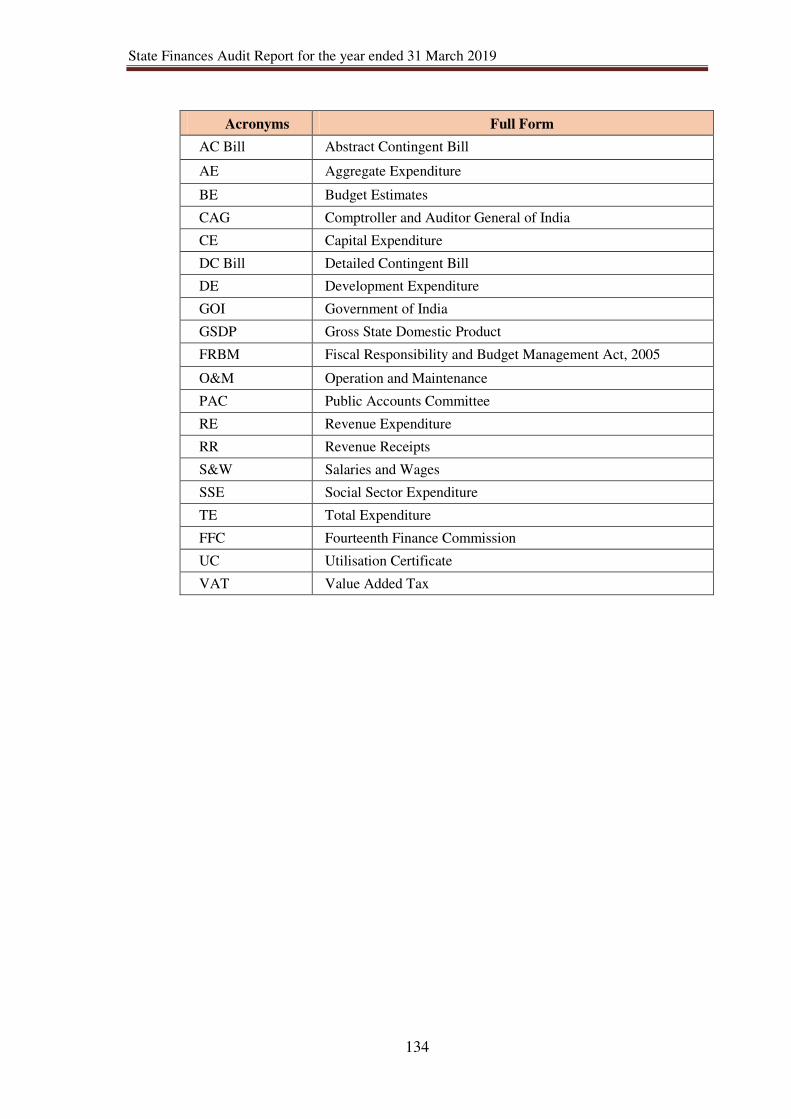
State Finances Audit Report for the year ended 31 March 2019
134
Acronyms Full Form
AC Bill Abstract Contingent Bill
AE Aggregate Expenditure
BE Budget Estimates
CAG Comptroller and Auditor General of India
CE Capital Expenditure
DC Bill Detailed Contingent Bill
DE Development Expenditure
GOI Government of India
GSDP Gross State Domestic Product
FRBM Fiscal Responsibility and Budget Management Act, 2005
O&M Operation and Maintenance
PAC Public Accounts Committee
RE Revenue Expenditure
RR Revenue Receipts
S&W Salaries and Wages
SSE Social Sector Expenditure
TE Total Expenditure
FFC Fourteenth Finance Commission
UC Utilisation Certificate
VAT Value Added Tax